i | Page - The Cross-Border Road Transport Agency
87
i | Page
-
Upload
khangminh22 -
Category
Documents
-
view
0 -
download
0
Transcript of i | Page - The Cross-Border Road Transport Agency

i | P a g e
i | P a g e
TABLE OF CONTENTS
TABLE OF CONTENTS ........................................................................................................ i
LIST OF TABLES ................................................................................................................. v
LIST OF FIGURES .............................................................................................................. vi
COUNTRY FACT SHEET ................................................................................................... vii
LIST OF ACRONYMS ....................................................................................................... viii
EXECUTIVE SUMMARY ...................................................................................................... x
1. INTRODUCTION AND BACKGROUND ........................................................................ 1
1.1. Introduction ..................................................................................................................................... 1 1.2. Background ..................................................................................................................................... 1 1.3. Objectives of the Report ............................................................................................................ 2 1.4. Methodology ................................................................................................................................... 2 1.5. Structure of the Report ............................................................................................................... 2
2. OVERVIEW OF TANZANIA........................................................................................... 4
2.1. Geography ....................................................................................................................................... 4
2.1.1. Land and location .................................................................................................................................... 4
2.1.2. Language and ethnic groups ............................................................................................................... 5
2.1.3. Relief and drainage ................................................................................................................................. 5
2.1.3.1. Mainland ..................................................................................................................................................... 5
2.2. Historical context .......................................................................................................................... 6
2.2.1. Constitutional setting .............................................................................................................................. 6
2.2.2. Social Context ........................................................................................................................................... 6
2.2.3. Political Context ....................................................................................................................................... 6
3. ECONOMIC OUTLOOK ................................................................................................ 7
3.1. Introduction ..................................................................................................................................... 7 3.2. Economic Structure and Indicators ...................................................................................... 7
3.2.1 Gross Domestic Product ....................................................................................................................... 7
3.2.2 Gross Domestic Product per capita ................................................................................................... 8
3.2.3 Comparison of GDP between Tanzania, Sub-Saharan Africa and South Africa ................ 8
3.2.4 Gross Domestic Product contribution by Sector ............................................................................ 9
3.3. Credit Rating ................................................................................................................................. 11 3.4. Monetary Policy ........................................................................................................................... 11
3.4.1. Inflation Rate ........................................................................................................................................... 11
3.4.2. Exchange Rate ....................................................................................................................................... 12
3.5. Trade Environment ..................................................................................................................... 13
3.5.1. Tanzania’s main exports destinations ............................................................................................. 13
3.5.2. Tanzania’s top export products ......................................................................................................... 13
3.5.3. Tanzania’s main imports origins ....................................................................................................... 14
3.5.4. Tanzania’s top import products ......................................................................................................... 14
3.5.5. Tanzania’s intra-EAC trade ................................................................................................................ 15
3.5.5.1. Tanzania's intra regional trade .......................................................................................................... 15
3.5.5.2. Intra-regional exports............................................................................................................................ 15
3.5.5.3. Tanzania Intra-regional imports ........................................................................................................ 16
3.5.5.4. Intra-regional trade balance ............................................................................................................... 16
3.5.6. Intra-East African Community Trade ............................................................................................... 17
3.5.6.1. Intra-EAC Merchandise Trade ........................................................................................................... 17
3.5.6.2. Total EAC Trade Trends ..................................................................................................................... 18
ii | P a g e
3.5.7. Tanzania Trade with South Africa .................................................................................................... 19
3.5.7.1. Tanzania’s exports to South Africa .................................................................................................. 19
3.5.7.2. Tanzania’s imports from South Africa ............................................................................................. 21
3.5.7.3. Tanzania’s trade balance with South Africa .................................................................................. 21
3.5.7.4. South Africa’s trade performance with SADC member states ................................................ 22
3.6. Business Environment ............................................................................................................. 24
3.6.1. Economic Freedom Index ................................................................................................................... 24
3.6.2. Ease of Doing Business ...................................................................................................................... 25
3.6.2.1. Ease of doing business in Tanzania ................................................................................................ 26
3.6.2.2. Ease of doing business in the EAC region .................................................................................... 27
3.6.3. Global Competitiveness Index ........................................................................................................... 28
3.6.4. Corruption Perceptions Index ............................................................................................................ 29
3.7. Regional Integration Index ...................................................................................................... 30
3.7.1. Overview of Tanzania’s regional integration scores ................................................................... 30
3.7.1.1. Trade integration .................................................................................................................................... 30
3.7.1.2. Regional infrastructure ......................................................................................................................... 32
3.7.1.3. Productive integration........................................................................................................................... 32
3.7.1.4. Free movement of people ................................................................................................................... 32
3.7.1.5. Financial and macroeconomic integration ..................................................................................... 33
3.7.2. Regional Integration Index overall in countries by Regional Economic Community ........ 33
3.7.2.1. East African Community (EAC) ......................................................................................................... 33
3.7.2.2. Southern African Development Community (SADC) ................................................................. 33
4. TRANSPORT ENVIRONMENT ................................................................................... 35
4.1. Overview ......................................................................................................................................... 35 4.2. Transport Infrastructure........................................................................................................... 35 4.3. Distance Matrix ............................................................................................................................ 35 4.4. Road Safety and Security ........................................................................................................ 36 4.5. Axle Load Limits, Weighbridges and Speed Limit ....................................................... 37
4.5.1. Axle Load Limits ..................................................................................................................................... 37
4.5.2. Weighbridges .......................................................................................................................................... 37
4.5.3. Road Speed limit.................................................................................................................................... 38
4.6. Road Class and Surface Conditions .................................................................................. 39
4.6.1. Bridges ...................................................................................................................................................... 39
4.6.2. International Corridors linking Tanzania ......................................................................................... 39
4.6.2.1. Central Corrior ........................................................................................................................................ 40
4.6.2.2. Northern Corridor ................................................................................................................................... 41
4.6.2.3. Dar-es-Salaam Corridor ...................................................................................................................... 42
4.6.3. Domestic Road Transport Corridors ................................................................................................ 43
4.6.3.1. Mtwara Corridor...................................................................................................................................... 43
4.6.3.2. Coastal Corridor ..................................................................................................................................... 43
4.6.3.3. Namanga Corridor ................................................................................................................................. 43
4.6.3.4. Sumbawanga Corridor ......................................................................................................................... 43
4.7. Fuel Prices in Tanzania ............................................................................................................ 44 4.8. Tanzania Cross-Border Road Transport Permits issued by the C-BRTA .......... 45 4.9. Regulatory Environment .......................................................................................................... 45
4.9.1.1. Challenges ............................................................................................................................................... 46
4.9.1.2. Opportunities ........................................................................................................................................... 46
4.10. Procedures for Establishing a business in Tanzania.................................................. 47
5. PASSENGER TRANSPORT IN TANZANIA ................................................................ 49
iii | P a g e
5.1. Public Transport in Tanzania ................................................................................................. 49 5.2. Cross-border Passenger Transport .................................................................................... 50
6. RAILWAY TRANSPORT IN TANZANIA...................................................................... 50
6.1. Introduction ................................................................................................................................... 50 6.2. Railway Network .......................................................................................................................... 50 6.3. Tanzania-Zambia Railway Authority ................................................................................... 51 6.4. Tanzania Railway Corporation .............................................................................................. 51 6.5. Passenger Rail-transport ......................................................................................................... 51
6.5.1. Express Trains ........................................................................................................................................ 52
6.5.2. Ordinary Trains ....................................................................................................................................... 52
6.5.3. Commuter Trains ................................................................................................................................... 52
6.5.4. Tourist and Special Trains .................................................................................................................. 52
6.6. Freight Rail-transport ................................................................................................................ 53
6.6.1. Regional Connections .......................................................................................................................... 53
6.6.2. Cargo Terminus...................................................................................................................................... 53
6.7. Railway Regional Developments.......................................................................................... 53
6.7.1. Tanzania and EAC regional railway projects ................................................................................ 53
6.7.2. CBU-TAZARA Academic Business Partnership .......................................................................... 54
7. AIR TRANSPORT IN TANZANIA ................................................................................ 54
7.1. Airports in Tanzania................................................................................................................... 54 7.2. Airports in Tanzania................................................................................................................... 54
7.2.1. Julius Nyerere International Airport ................................................................................................. 54
7.2.2. Kilimanjaro International Airport ........................................................................................................ 55
7.2.3. Other Domestic Airports ...................................................................................................................... 55
7.3. Key Regulators of the Civil Aviation Industry in Tanzania ....................................... 55
7.3.1. Tanzania Civil Aviation Authority ...................................................................................................... 55
7.3.2. Tanzania Airports Authority ................................................................................................................ 55
7.4. Airline Operators in Tanzania ................................................................................................ 55 7.5. Operating Airdromes (airports and airstrips) ................................................................. 56 7.6. Airline Operators in Tanzania ................................................................................................ 56
8. MARITIME TRANSPORT IN TANZANIA ..................................................................... 56
8.1. Introduction ................................................................................................................................... 56 8.2. Tanzania Ports Authority ......................................................................................................... 56 8.3. Seaports of Tanzania ................................................................................................................. 57
8.3.1 Dar-es-Salaam Port .............................................................................................................................. 57
8.3.2 Mbegani-Bagamoyo Port .................................................................................................................... 57
8.3.3 Tanga Port ............................................................................................................................................... 58
8.3.4 Mtwara Port ............................................................................................................................................. 58
8.3.5 Small Coastal Ports .............................................................................................................................. 58
8.3.6 Lake Ports ................................................................................................................................................ 58
9. BORDER POSTS OF TANZANIA ............................................................................... 59
9.1. Tanzania and Kenya................................................................................................................... 59
9.1.1. Holili, Tanzania | Taveta, Kenya ....................................................................................................... 59
9.2. Tanzania and Uganda ................................................................................................................ 60
9.2.1. Mutukula, Tanzania | Mutukula, Uganda........................................................................................ 60
9.3. Tanzania and Burundi ............................................................................................................... 61
9.3.1. Kabanga, Tanzania | Kobero, Burundi ............................................................................................ 61
9.4. Tanzania and Zambia ................................................................................................................ 62
9.4.1. Tunduma, Tanzania | Nakonde, Zambia ........................................................................................ 62
iv | P a g e
9.5. Tanzania and Mozambique ..................................................................................................... 63
9.5.1. Matchedje Border Post Crossing ...................................................................................................... 63
9.5.2. Namoto - Kilambo Ferry border post ............................................................................................... 63
9.5.3. Negomano / Mtambaswala (Unity Bridge) border post crossing ........................................... 63
9.6. Tanzania and Rwanda ............................................................................................................... 64
9.6.1. Rusumo border post ............................................................................................................................. 64
9.7. Tanzania and DRC ...................................................................................................................... 64 9.8. Tanzania and Malawi ................................................................................................................. 64
7.8.1. Kasumulu, Tanzania | Songwe, Malawi ......................................................................................... 64
9.8.1.1. Imports into Tanzania arriving from Malawi .................................................................................. 64
9.8.1.2. Exports from Tanzania ......................................................................................................................... 65
9.8.1.3. Goods Transiting Tanzania into Malawi ......................................................................................... 65
9.8.1.4. Goods Transiting Tanzania from Malawi ....................................................................................... 66
10. CHALLENGES AND OPPORTUNITIES IN TANZANIA .............................................. 66
10.1. Challenges ..................................................................................................................................... 66 10.2. Opportunities ................................................................................................................................ 67 10.2.1 Energy and Power generation ............................................................................................... 67 10.2.2 Infrastructure and Transportation ....................................................................................... 67 10.2.3 Mining .............................................................................................................................................. 68 10.2.4 Human Settlement ...................................................................................................................... 68 10.2.5 Logistics and Warehousing ................................................................................................... 68 10.2.6 Information and Communications Technology ............................................................. 69 10.2.7 Agriculture and Agribusiness ............................................................................................... 69 10.2.8 Tourism and Leisure.................................................................................................................. 70 10.2.9 Aviation ........................................................................................................................................... 70 10.2.10 Human resource development ...................................................................................... 71
11 CONCLUSION ............................................................................................................. 71
12 CONTACT DETAILS OF RELEVANT AUTHORITIES ................................................ 72
REFERENCES ................................................................................................................... 74
v | P a g e
LIST OF TABLES
Table 1: Tanzania Annual GDP (US$’billion) and GDP per capita (US$) .............................................................. 7
Table 2: Tanzania sovereign risk ratings ............................................................................................................. 11
Table 3: Tanzania’s main exports by country and continent, 2018 ....................................................................... 13
Table 4: Tanzania’s main imports by country, 2018 .............................................................................................. 14
Table 5: Tanzania’s top imports by category, 2018 ............................................................................................... 15
Table 6: Tanzania’s trade with EAC member states (US$’million) ........................................................................ 16
Table 7: East African Community’s intra-trade (US$’million) ................................................................................ 17
Table 8: East African Community’s total trade flows (US$’million) ........................................................................ 18
Table 9: Tanzania’s exports to South Africa (R’million) ......................................................................................... 20
Table 10: Tanzania’s imports from South Africa (R’million) .................................................................................. 21
Table 11: Tanzania’s trade balance with South Africa (R’million) ......................................................................... 22
Table 12: South Africa’s imports and exports (R’billion), 2014-2018..................................................................... 22
Table 13: Tanzania Economic Freedom Index .................................................................................................... 24
Table 14: Doing business 2020 Indicators ............................................................................................................ 25
Table 15: Ease of doing business index in the Tanzania ...................................................................................... 26
Table 16: Tanzania Corruption Perceptions Index ................................................................................................ 29
Table 17: Distance Matrix from Dar-es-Salaam to Major Towns (km)................................................................... 36
Table 18: Axle Load Limits of Tanzania ................................................................................................................ 37
Table 19: Tanzania’s Weigbridge Information ....................................................................................................... 38
Table 20: Classification of Roads .......................................................................................................................... 39
Table 21: Fuel prices per litre in Tanzania (US$) .................................................................................................. 44
Table 22: Steps to register a business in Tanzania .............................................................................................. 47
Table 23: Contact Details ...................................................................................................................................... 72

vi | P a g e
LIST OF FIGURES
Figure 1: Map of the Tanzania Regions ................................................................................................ 4
Figure 2: Tanzania’s Annual GDP and growth ................................................................................... 8
Figure 3: Comparison of GDP between Tanzania and South Africa (RSA) ........................... 8
Figure 4: Quarter 3 GDP growth rate in Tanzania, 2014-2019 ..................................................... 9
Figure 5: GDP by sector contribution in Tanzania, Quarter 3, 2019 ....................................... 11
Figure 6: Tanzania’s inflation rate ......................................................................................................... 12
Figure 7: Tanzania exchange rate ......................................................................................................... 12
Figure 8: Tanzania’s top exports by category, 2018 ..................................................................... 13
Figure 9: Tanzania’s intra-EAC trade flow, 2018 ............................................................................. 16
Figure 10: Tanzania’s exports to South Africa (R’million) ......................................................... 20
Figure 11: Tanzania’s imports from South Africa .......................................................................... 21
Figure 12: Tanzania’s trade balance with South Africa ............................................................... 22
Figure 13: Tanzania’s trade balance with South Africa ............................................................... 23
Figure 14: Tanzania Economic Freedom Index, 2015-2019 ...................................................... 24
Figure 15: Ease of doing business in the Tanzania, 2019 .......................................................... 26
Figure 16: Ease of doing business in the EAC Region, 2019 .................................................. 28
Figure 17: Global Competitiveness Index of Tanzania ............................................................... 28
Figure 18: Tanzania Corruption Perceptions Index ....................................................................... 29
Figure 19: Regional integration overall scores and ranking of Tanzania in the EAC ..... 30
Figure 20: Regional integration overall scores and ranking of Tanzania in the SADC . 31
Figure 21: Regional integration scores of the Tanzania in the SADC region .................... 34
Figure 22: Major corridors and roads network in Tanzania ....................................................... 43
Figure 24: Map of Tanzania rail network ............................................................................................ 50
Figure 26: Namanga one stop border post ....................................................................................... 60
vii | P a g e
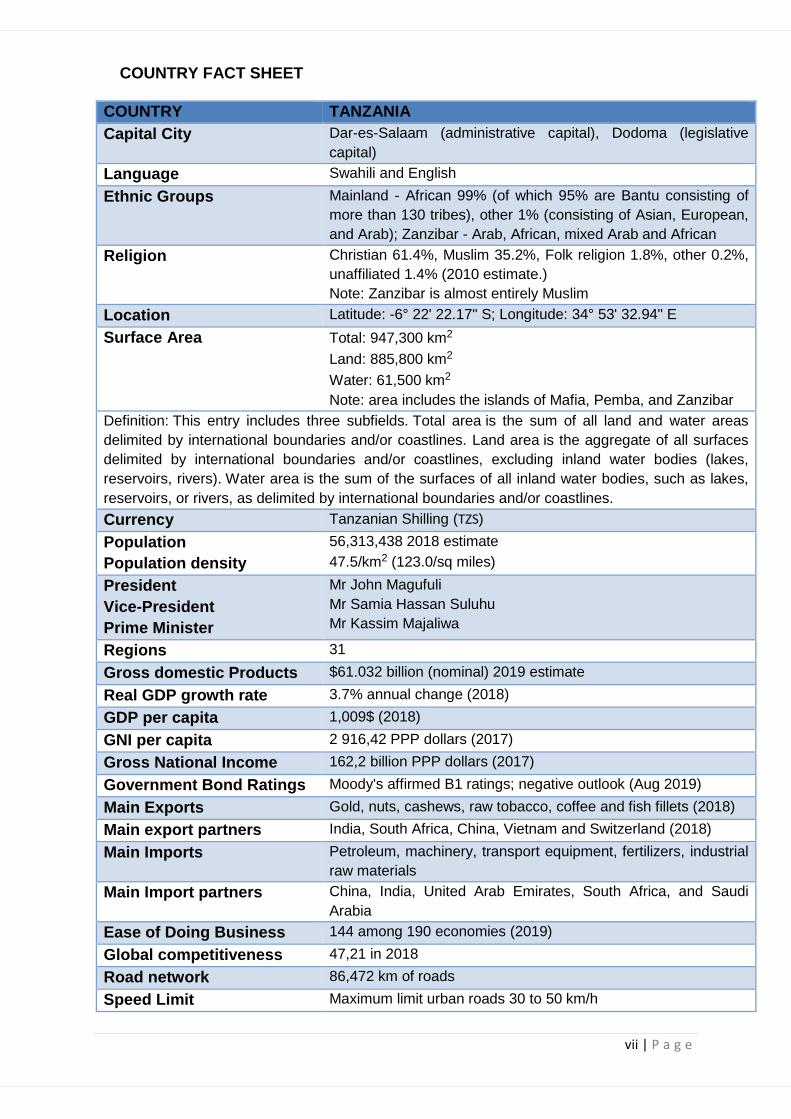
COUNTRY FACT SHEET
COUNTRY TANZANIA
Capital City Dar-es-Salaam (administrative capital), Dodoma (legislative
capital)
Language Swahili and English
Ethnic Groups Mainland - African 99% (of which 95% are Bantu consisting of
more than 130 tribes), other 1% (consisting of Asian, European,
and Arab); Zanzibar - Arab, African, mixed Arab and African
Religion Christian 61.4%, Muslim 35.2%, Folk religion 1.8%, other 0.2%,
unaffiliated 1.4% (2010 estimate.)
Note: Zanzibar is almost entirely Muslim
Location Latitude: -6° 22' 22.17" S; Longitude: 34° 53' 32.94" E
Surface Area
Total: 947,300 km2
Land: 885,800 km2
Water: 61,500 km2
Note: area includes the islands of Mafia, Pemba, and Zanzibar
Definition: This entry includes three subfields. Total area is the sum of all land and water areas
delimited by international boundaries and/or coastlines. Land area is the aggregate of all surfaces
delimited by international boundaries and/or coastlines, excluding inland water bodies (lakes,
reservoirs, rivers). Water area is the sum of the surfaces of all inland water bodies, such as lakes,
reservoirs, or rivers, as delimited by international boundaries and/or coastlines.
Currency Tanzanian Shilling (TZS)
Population
Population density
56,313,438 2018 estimate
47.5/km2 (123.0/sq miles)
President
Vice-President
Prime Minister
Mr John Magufuli
Mr Samia Hassan Suluhu
Mr Kassim Majaliwa
Regions 31
Gross domestic Products $61.032 billion (nominal) 2019 estimate
Real GDP growth rate 3.7% annual change (2018)
GDP per capita 1,009$ (2018)
GNI per capita 2 916,42 PPP dollars (2017)
Gross National Income 162,2 billion PPP dollars (2017)
Government Bond Ratings Moody's affirmed B1 ratings; negative outlook (Aug 2019)
Main Exports Gold, nuts, cashews, raw tobacco, coffee and fish fillets (2018)
Main export partners India, South Africa, China, Vietnam and Switzerland (2018)
Main Imports Petroleum, machinery, transport equipment, fertilizers, industrial
raw materials
Main Import partners China, India, United Arab Emirates, South Africa, and Saudi
Arabia
Ease of Doing Business 144 among 190 economies (2019)
Global competitiveness 47,21 in 2018
Road network 86,472 km of roads
Speed Limit Maximum limit urban roads 30 to 50 km/h

viii | P a g e
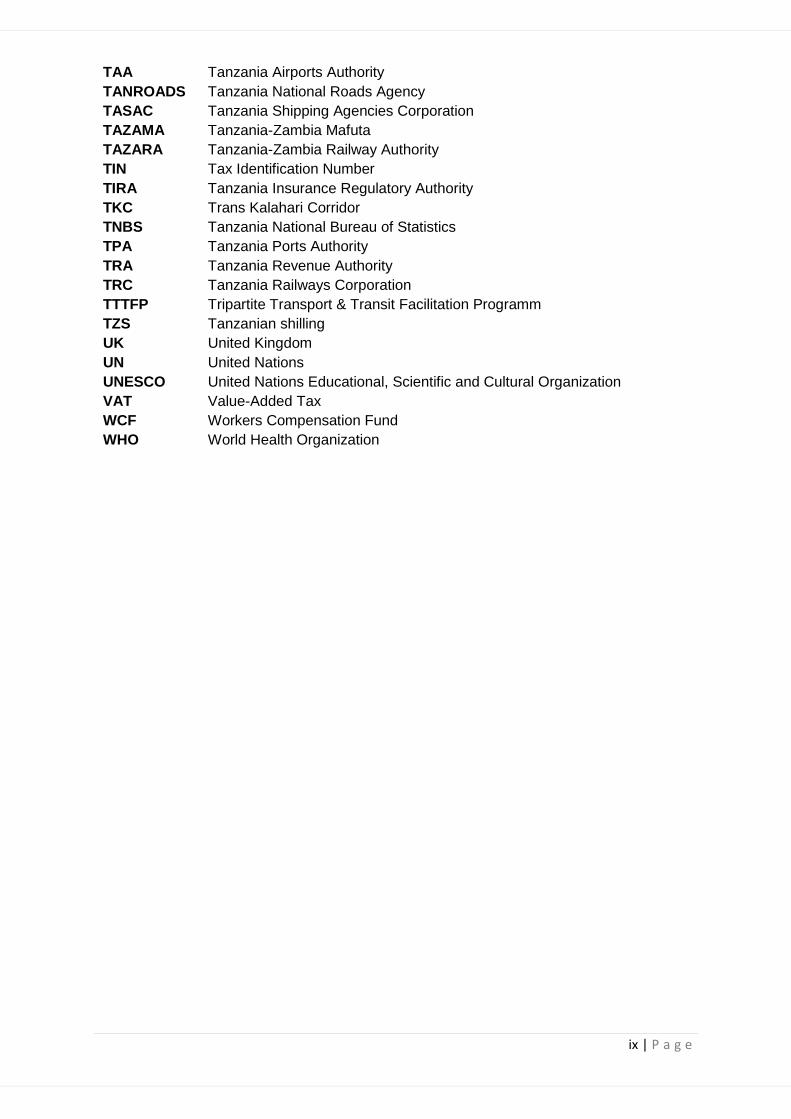
LIST OF ACRONYMS
ASYCUDA Automated System for Customs Data
AU African Union
BOT Balance of trade
C-BRTA Cross-Border Road Transport Agency
CBU Copperbelt University
CCM Chama Cha Mapinduzi
CCTTFA Central Corridor Transit Transport Facilitation Agency
CFA Chartered Financial Analyst
CIA Central Intelligence Agency
COMESA Common Market for Eastern and Southern Africa
DCC Dar-es-Salaam Corridor Committee
DRC Democratic Republic of the Congo
EAC East African Community
EGL Ethnic Community Language
EU European Union
EWURA Energy and Water Utilities Regulatory Authority
GCI Global Competitiveness Index
GDP Gross Domestic Product
HDI Human Development Index
ICT Information and communications technology
JNIA Julius Nyerere International Airport
LCU Local Currency Unit
LDC Least Developed Countries
MCBRTA Multilateral Cross Border Road Transport Agreement
MoU Memorandum of Understanding
MRA Malawi Revenue Authority
NBS National Bereau of Statistics of Tanzania
NCTTCA Northern Corridor Transit and Transport Coordination Authority
NHC National Housing Corporation
NIT National Institutes of Transport
NTP National Transport Policy
OSBP One-Stop-Boarder-Post
OSHA Occupational Safety and Health Authority
PAD Pre – Arrival Declaration
PIDA Programme for Infrastructure Development in Africa
PPP Public–Private Partnership
PTCM Protocol on Transport, Communication and Meteorology
QGDP Quarterly Gross Domestic Product
RECs Regional Economic Communities
SACU Southern African Customs Union
SADC Southern African Development Community
SGR Standard Gauge Railway
SNCC Société Nationale des Chemins de Fer du Congo
S&P Standard & Poor's
SUMATRA Surface and Marine Transport Regulatory Authority
ix | P a g e
TAA Tanzania Airports Authority
TANROADS Tanzania National Roads Agency
TASAC Tanzania Shipping Agencies Corporation
TAZAMA Tanzania-Zambia Mafuta
TAZARA Tanzania-Zambia Railway Authority
TIN Tax Identification Number
TIRA Tanzania Insurance Regulatory Authority
TKC Trans Kalahari Corridor
TNBS Tanzania National Bureau of Statistics
TPA Tanzania Ports Authority
TRA Tanzania Revenue Authority
TRC Tanzania Railways Corporation
TTTFP Tripartite Transport & Transit Facilitation Programm
TZS Tanzanian shilling
UK United Kingdom
UN United Nations
UNESCO United Nations Educational, Scientific and Cultural Organization
VAT Value-Added Tax
WCF Workers Compensation Fund
WHO World Health Organization
x | P a g e
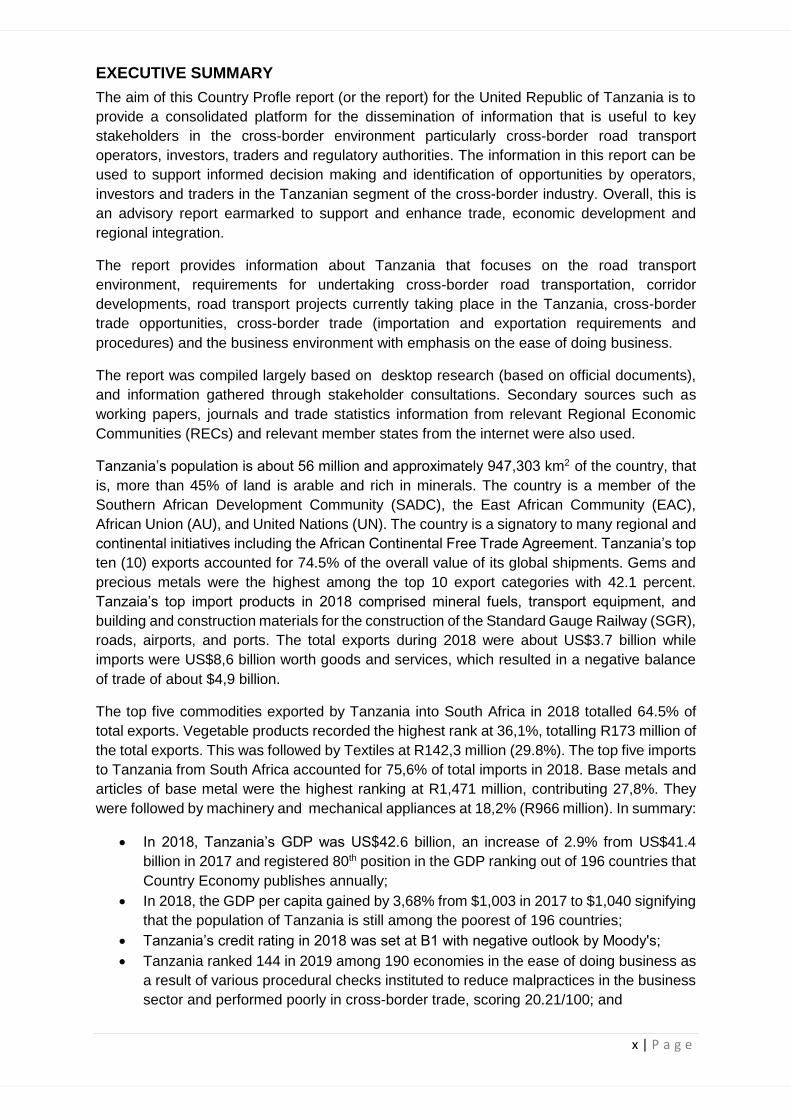
EXECUTIVE SUMMARY
The aim of this Country Profle report (or the report) for the United Republic of Tanzania is to
provide a consolidated platform for the dissemination of information that is useful to key
stakeholders in the cross-border environment particularly cross-border road transport
operators, investors, traders and regulatory authorities. The information in this report can be
used to support informed decision making and identification of opportunities by operators,
investors and traders in the Tanzanian segment of the cross-border industry. Overall, this is
an advisory report earmarked to support and enhance trade, economic development and
regional integration.
The report provides information about Tanzania that focuses on the road transport
environment, requirements for undertaking cross-border road transportation, corridor
developments, road transport projects currently taking place in the Tanzania, cross-border
trade opportunities, cross-border trade (importation and exportation requirements and
procedures) and the business environment with emphasis on the ease of doing business.
The report was compiled largely based on desktop research (based on official documents),
and information gathered through stakeholder consultations. Secondary sources such as
working papers, journals and trade statistics information from relevant Regional Economic
Communities (RECs) and relevant member states from the internet were also used.
Tanzania’s population is about 56 million and approximately 947,303 km2 of the country, that
is, more than 45% of land is arable and rich in minerals. The country is a member of the
Southern African Development Community (SADC), the East African Community (EAC),
African Union (AU), and United Nations (UN). The country is a signatory to many regional and
continental initiatives including the African Continental Free Trade Agreement. Tanzania’s top
ten (10) exports accounted for 74.5% of the overall value of its global shipments. Gems and
precious metals were the highest among the top 10 export categories with 42.1 percent.
Tanzaia’s top import products in 2018 comprised mineral fuels, transport equipment, and
building and construction materials for the construction of the Standard Gauge Railway (SGR),
roads, airports, and ports. The total exports during 2018 were about US$3.7 billion while
imports were US$8,6 billion worth goods and services, which resulted in a negative balance
of trade of about $4,9 billion.
The top five commodities exported by Tanzania into South Africa in 2018 totalled 64.5% of
total exports. Vegetable products recorded the highest rank at 36,1%, totalling R173 million of
the total exports. This was followed by Textiles at R142,3 million (29.8%). The top five imports
to Tanzania from South Africa accounted for 75,6% of total imports in 2018. Base metals and
articles of base metal were the highest ranking at R1,471 million, contributing 27,8%. They
were followed by machinery and mechanical appliances at 18,2% (R966 million). In summary:
• In 2018, Tanzania’s GDP was US$42.6 billion, an increase of 2.9% from US$41.4
billion in 2017 and registered 80th position in the GDP ranking out of 196 countries that
Country Economy publishes annually;
• In 2018, the GDP per capita gained by 3,68% from $1,003 in 2017 to $1,040 signifying
that the population of Tanzania is still among the poorest of 196 countries;
• Tanzania’s credit rating in 2018 was set at B1 with negative outlook by Moody's;
• Tanzania ranked 144 in 2019 among 190 economies in the ease of doing business as
a result of various procedural checks instituted to reduce malpractices in the business
sector and performed poorly in cross-border trade, scoring 20.21/100; and
xi | P a g e
• Tanzania's overall ranking dropped position from 116 out of 140 nations in 2018, to
position 117 out 141 nations in 2019, scoring 48.19 points out of 100 on the 2019 in
Global Competitiveness Index depreciating by 0,98 from score of 47,21 in 2018.
There are many opportunities for investors, traders and cross-border road transport operators
in Tanzania and they include:
• Cross-border road transportation and logistics: There are opportunities for cross-
border operators emanating from improvements in capacity at the Dar es Salaam port,
especially for exports bound for Asian markets and imports into Tanzania, Uganda,
DRC and Zambia, amongst others. Opportunites also exist in the infrastructure and
logistics sectors especially with respect to warehousing facilities and logistics services.
The growing improvement in roads and railways across East Africa opens
opportunities for logistics in a country where urbanisation stands at about 30 percent,
and many farms operate at a significant distance from the ports in Dar-es-Salaam.
Opportunities for operators also exist in the tourism sector owing to many tourist
attraction destinations;
• Construction sector: Reconstruction of regional railroad infrastructure linking the
Tanzania to regional countries e.g. along Benguela corridor from DRC to Lobito port in
Angola;
• Mining sector: Tanzania is very rich in minerals . Coal reserves in Tanzania are
estimated at 1.9 billion tons, 25% of which are proven.The country has over 60% of
global cobalt reserves. Opportunities exist in iron ore, diamonds, gold and manganese
mining;
• Power generation: Tanzania, with its many rivers, has rich hydroelectricity potential.
Investors can invest in or construct hydropower infrastructure;
• Real Estate: The shortage of property developers in the country and high demand for
housing has resulted in subsequent opportunities for real estate investment;
• Information Communication Technology (ICT): Tanzania has potential in the
telecommunications and ICT sector, which remains largely untapped. Investment in
ICT systems has big potential in Tanzania, given the country’s population size;
• Agricultural sector: Tanzania is blessed with diverse climate zones, fertile land and
water to support its agriculture. Currently, Tanzania’s commercial-scale farming cannot
keep up with growing market demand;
• Manufacturing sector: There are opportunities for manufacturing and processing of
raw products, as well as investments in packaging infrastructure; and
• Skills development: There are massive opportunities for capacity building and skills
development in the country. Opportunities for investing in education are wide-ranging
especially with respect to establishment of schools, colleges and universities.
1 | P a g e
1. INTRODUCTION AND BACKGROUND
1.1. Introduction
The aim of this Tanzania Country Profile report (or the report) is to provide a consolidated
platform for the dissemination of information that is useful to key stakeholders in the cross-
border environment, particularly cross-border road transport operators, investors, traders and
regulatory authorities. The information in this report can be used for making informed decisions
and identifying opportunities by operators and traders in respect of the Tanzania segment of
the cross-border industry. Overall, this is an advisory report earmarked to support and
enhance trade, economic development and regional integration. The report provides
information about the United Republic of Tanzania ( or Tanzania) focusing on the road
transport environment, requirements for undertaking cross-border road transportation, corridor
developments, road transport projects currently taking place in the Tanzania, cross-border
trade opportunities, cross-border trade (importation and exportation requirements and
procedures) and the business environment specifically focusing on the ease of doing
business.
1.2. Background
The Cross-Border Road Transport Agency (C-BRTA or the Agency) is an economic regulatory
authority founded in terms of the Cross-Border Road Transport Act No. 4 of 1998 (C-BRT Act),
as amended, for the purpose of facilitating unimpeded movement of persons and goods
between South Africa and neighbouring countries in the region in support of regional trade,
economic development and regional integration.
The core mandate of the Agency is to:
• Improve the unimpeded flow of freight and passengers in the region;
• Introduce regulated competition in respect of cross-border passenger road transport;
• Reduce operational constraints for the cross-border road transport industry as a whole;
• Liberalise market access progressively in respect of cross-border freight road
transport;
• Enhance and strengthen the capacity of the public sector in support of its strategic
planning, enabling and monitoring functions; and
• Empower the cross-border road transport industry to maximise business opportunities
and to incrementally regulate themselves to improve safety, security, reliability, quality
and efficiency of services.
The four core functions of the C-BRTA are: regulatory, facilitation, advisory and law
enforcement. There are other instruments that also provide the broader context of the mandate
and functions of the Agency and they include the following:
• Southern African Development Community (SADC) Protocol on Transport,
Communications and Meteorology (PTCM);
• Memorandum of Understanding on Road Transportation in the Common Customs
Area pursuant to the Customs Union Agreement between the Governments of
Botswana, Lesotho, South Africa and Swaziland (SACU MoU);
• Memorandum of Understanding on the development and management of the Trans-
Kalahari Corridor (TKC MoU); and
• Bilateral Road Transport Agreements between South Africa, Malawi, Mozambique,
Zambia and Zimbabwe.
2 | P a g e
The C-BRTA compiled this report in pursuit of its mandate, which is to provide advice and up
to date information that can be used to advance regional trade, economic development and
regional integration as well as to the Minister of Transport, road transport industry, traders and
other stakeholders in the cross-border value chain.
The development of this report is therefore aligned to the mandate of the Agency and the
goals of enhancing opportunities for cross-border road transport operators, traders and
ensuring that cross-border road transportation between the Tanzania and South Africa is
conducted in a seamless way.
As a building block, it is envisaged that through information in this report, the C-BRTA
contributes to overall objectives of enhancing cross-border road transport system efficiency,
intra-Africa trade, regional integration and business opportunities to cross-border road
transport operators and business community in general.
1.3. Objectives of the Report
The objectives of the report are to:
• Provide information to stakeholders for purposes of enhancing cross-border trade,
trade facilitation, economic development and regional integration;
• Provide relevant information that can be used by traders and cross-border road
transport operators in conducting their business;
• Assist relevant stakeholders to know and understand requirements of doing business
in the Republic of Tanzania;
• Assist transport operators to have a better understanding of the regulatory
requirements and operational conditions that exist in Tanzania, that may have an
impact on cross-border operations;
• Proactively provide up to date information on cross-border trade and road transport to
current and aspirant cross-border traders and transport operators; and
• Provide information with respect to possible opportunities for South African cross-
border road transport operators and prospective investors.
1.4. Methodology
The methodology utilised in this report is primarily desktop research using data sources of
official documents and information gathered from stakeholders’ consultations. Secondary
sources such as working papers, journals and trade statistics information from relevant
Regional Economic Communities (RECs) and relevant member states from the internet were
also used.
1.5. Structure of the Report
The report is structured as follows:
• Chapter 1: Introduction and background outlining the objectives and scope of the
Report;
• Chapter 2: Overview of Tanzania regarding its geographic location, language, and the
Tanzania historical context;
• Chapter 3: Economic outlook regarding the recent economic developments in the
Tanzania in terms of Gross Domestic Product (GDP) growth, trade environment,
nature of goods traded, imports and exports analysis, business environment, the ease
and cost of doing business and regional integration;

3 | P a g e
• Chapter 4: Road transport environment regarding legislative and regulatory
requirements;
• Chapter 5: Passenger transport environment regarding legislative and regulatory
requirements;
• Chapter 6: Rail transport environment;
• Chapter 7: Air Transport in Tanzania;
• Chapter 8: Maritime Transport in Tanzania
• Chapter 9: Border Posts linking Tanzania and connectivity to regional countries;
• Chapter 10: Challenges and Opportunities in Tanzania for operators, traders and
investors; and challenges encountered by operators when doing business in
Tanzania;
• Chapter 11: Contact details of regulatory authorities; and
• Chapter 12: Conclusions.
4 | P a g e
2. OVERVIEW OF TANZANIA
2.1. Geography
2.1.1. Land and location
Shortly after obtaining independence from Britain in the early 1960s, Tanganyika and Zanzibar
merged to form the United Republic of Tanzania in 1964. Tanzania is located just south of
the Equator in the African Great Lakes region. It borders Uganda to the north, Kenya to the
northeast, Comoro Islands in the Indian Ocean to the east, Mozambique and Malawi to the
south, Zambia to the southwest, and Rwanda, Burundi, and the Democratic Republic of the
Congo to the west. (Central Intelligence Agency [CIA], 2019). Mainland Tanganyika covers more
than 99 percent of the combined territories’ total area. Mafia Island is administered from the
maniland while Zanzibar and Pemba islands have a separate government administration. Dodoma,
since 1974 the designated official capital of Tanzania, is centrally located in the mainland. Dar-es-
Salaam, however, remains the seat of most government administration, as well as being the largest
city and port in the country (CIA, 2019).
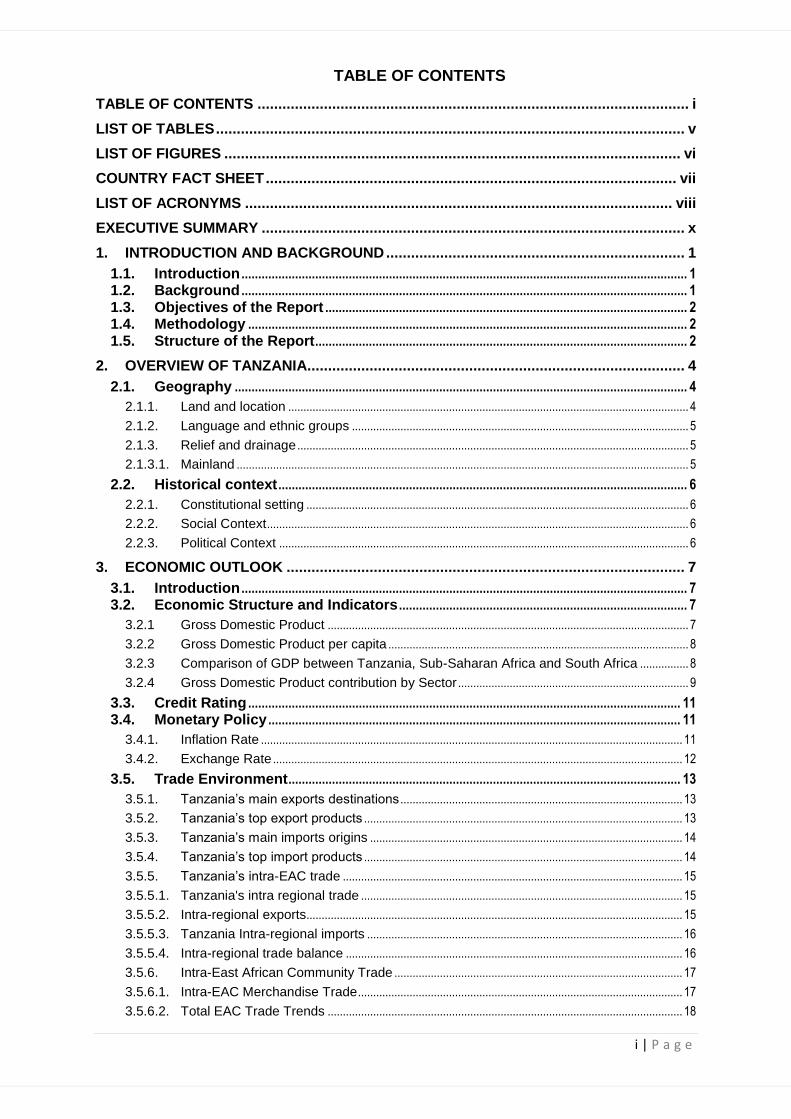
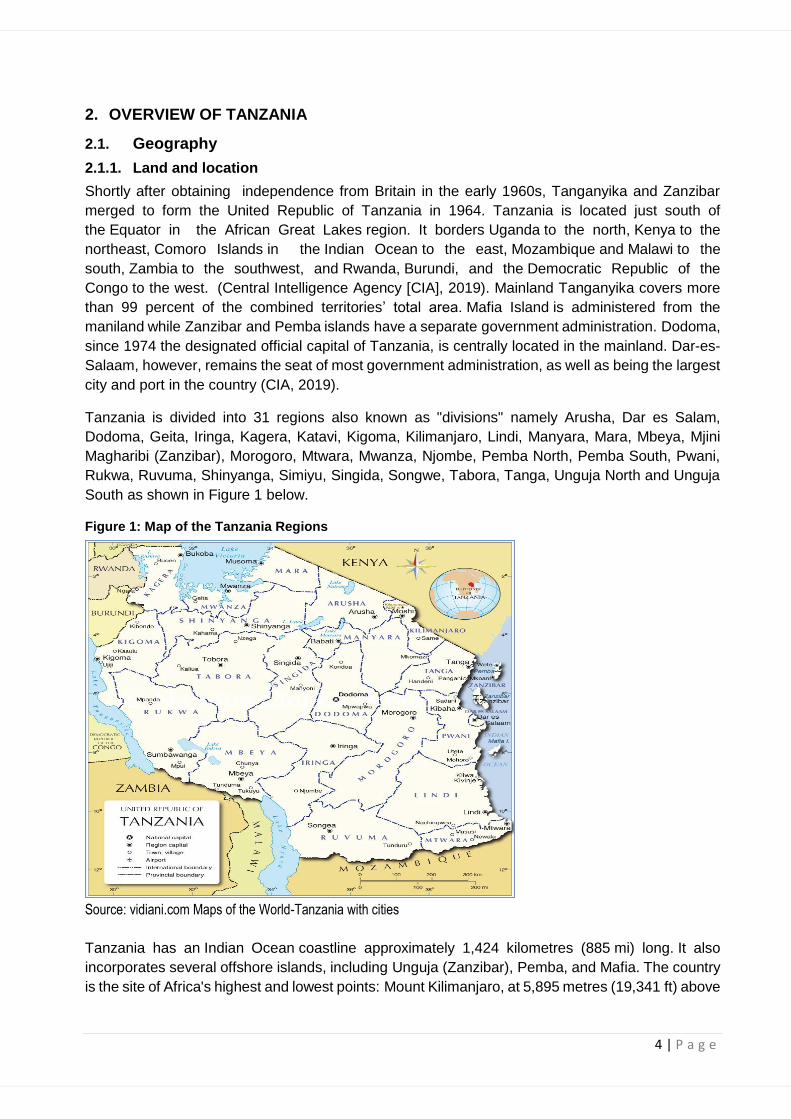
Tanzania is divided into 31 regions also known as "divisions" namely Arusha, Dar es Salam,
Dodoma, Geita, Iringa, Kagera, Katavi, Kigoma, Kilimanjaro, Lindi, Manyara, Mara, Mbeya, Mjini
Magharibi (Zanzibar), Morogoro, Mtwara, Mwanza, Njombe, Pemba North, Pemba South, Pwani,
Rukwa, Ruvuma, Shinyanga, Simiyu, Singida, Songwe, Tabora, Tanga, Unguja North and Unguja
South as shown in Figure 1 below.
Figure 1: Map of the Tanzania Regions
Source: vidiani.com Maps of the World-Tanzania with cities
Tanzania has an Indian Ocean coastline approximately 1,424 kilometres (885 mi) long. It also
incorporates several offshore islands, including Unguja (Zanzibar), Pemba, and Mafia. The country
is the site of Africa's highest and lowest points: Mount Kilimanjaro, at 5,895 metres (19,341 ft) above
5 | P a g e
sea level, and the floor of Lake Tanganyika, at 1,471 metres (4,826 ft) below sea level, respectively
(Lake, 2013).
The country is mountainous and densely forested in the northeast, where Mount Kilimanjaro is
located. Three of Africa's Great Lakes are partly within Tanzania. To the north and west lie Lake
Victoria, Africa's largest lake, and Lake Tanganyika, the continent's deepest lake, known for its
unique species of fish. To the southwest lies Lake Nyasa. Central Tanzania is a large plateau, with
plains and arable land. The eastern shore is hot and humid, with the Zanzibar Archipelago just
offshore. Kalambo Falls in the southwestern region of Rukwa is the second highest uninterrupted
waterfall in Africa, and is located near the southeastern shore of Lake Tanganyika on the border
with Zambia. The Menai Bay Conservation Area is Zanzibar's largest marine protected area.
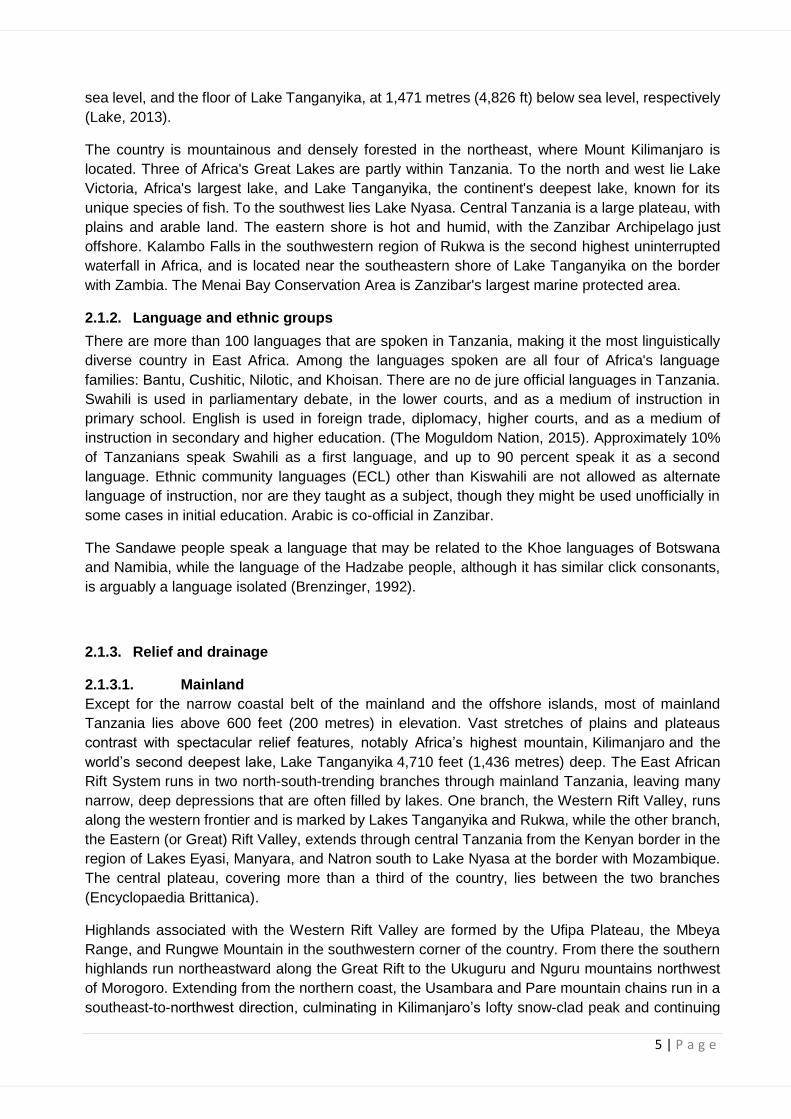
2.1.2. Language and ethnic groups
There are more than 100 languages that are spoken in Tanzania, making it the most linguistically
diverse country in East Africa. Among the languages spoken are all four of Africa's language
families: Bantu, Cushitic, Nilotic, and Khoisan. There are no de jure official languages in Tanzania.
Swahili is used in parliamentary debate, in the lower courts, and as a medium of instruction in
primary school. English is used in foreign trade, diplomacy, higher courts, and as a medium of
instruction in secondary and higher education. (The Moguldom Nation, 2015). Approximately 10%
of Tanzanians speak Swahili as a first language, and up to 90 percent speak it as a second
language. Ethnic community languages (ECL) other than Kiswahili are not allowed as alternate
language of instruction, nor are they taught as a subject, though they might be used unofficially in
some cases in initial education. Arabic is co-official in Zanzibar.
The Sandawe people speak a language that may be related to the Khoe languages of Botswana
and Namibia, while the language of the Hadzabe people, although it has similar click consonants,
is arguably a language isolated (Brenzinger, 1992).
2.1.3. Relief and drainage
2.1.3.1. Mainland
Except for the narrow coastal belt of the mainland and the offshore islands, most of mainland
Tanzania lies above 600 feet (200 metres) in elevation. Vast stretches of plains and plateaus
contrast with spectacular relief features, notably Africa’s highest mountain, Kilimanjaro and the
world’s second deepest lake, Lake Tanganyika 4,710 feet (1,436 metres) deep. The East African
Rift System runs in two north-south-trending branches through mainland Tanzania, leaving many
narrow, deep depressions that are often filled by lakes. One branch, the Western Rift Valley, runs
along the western frontier and is marked by Lakes Tanganyika and Rukwa, while the other branch,
the Eastern (or Great) Rift Valley, extends through central Tanzania from the Kenyan border in the
region of Lakes Eyasi, Manyara, and Natron south to Lake Nyasa at the border with Mozambique.
The central plateau, covering more than a third of the country, lies between the two branches
(Encyclopaedia Brittanica).
Highlands associated with the Western Rift Valley are formed by the Ufipa Plateau, the Mbeya
Range, and Rungwe Mountain in the southwestern corner of the country. From there the southern
highlands run northeastward along the Great Rift to the Ukuguru and Nguru mountains northwest
of Morogoro. Extending from the northern coast, the Usambara and Pare mountain chains run in a
southeast-to-northwest direction, culminating in Kilimanjaro’s lofty snow-clad peak and continuing

6 | P a g e
beyond to Mount Meru (14,978 feet or 4,565 metres). Immediately west of Mount Meru, another
chain of mountains begins, which includes the still-active volcano Ol Doinyo Lengai as well as
Ngorongoro Crater, the world’s largest caldera, or volcanic depression. This chain extends through
a corridor between Lake Eyasi and Lake Manyara toward Dodoma (Encyclopaedia Brittanica).
Because of its numerous lakes, approximately 22,800 square miles (59,000 square km) of
Tanzania’s territory consists of inland water. Lake Victoria, which ranks as the world’s second
largest freshwater lake, is not part of the Rift System. Although Tanzania has no big rivers, it forms
the divide from which the three great rivers of the African continent rise the Nile, the Congo, and
the Zambezi, which flow to the Mediterranean Sea, the Atlantic Ocean, and the Indian Ocean,
respectively. Separated by the central plateau, the watersheds of these rivers do not meet.
Tanzania’s major rivers are named the Ruvuma, the Rufiji, the Wami, and the Pangani drain into
the Indian Ocean. The largest, the Rufiji River, has a drainage system that extends over most of
southern mainland Tanzania. The Kagera River flows into Lake Victoria, whereas other minor rivers
flow into internal basins formed by the Great Rift Valley. With so many rivers, mainland Tanzania is
rich in hydroelectricity potential.
2.2. Historical context
2.2.1. Constitutional setting
Tanzania is a single state under a presidential parliamentary democratic system, consisting of a
union between mainland Tanzania (known until 1964 as Tanganyika) and the islands of Zanzibar,
the largest of which are Unguja and Pemba. Tanganyika and Zanzibar entered into the union in
1964, and under the union’s terms Zanzibar has semi-autonomous status. Mainland Tanzania and
Zanzibar each maintain executive, judiciary and legislative organs. In Zanzibar, these have authority
over a set of issues described in Tanzania’s constitution as ‘non-union matters’, which include
health, education and the environment. On the mainland, these organs have responsibility for state
functions over the whole of Tanzania’s territory including the mainland and union matters in
Zanzibar. The parliament of Tanzania is based in the capital city, Dodoma, while the government
sits in Dar-es-Salaam.
2.2.2. Social Context
Despite efforts between 2007 and 2016 that have reduced the country’s poverty rate from 34.4% to
26.8%, the absolute number of poor people is estimated at about 13 million, owing to high population
growth. The most recent poverty measures based on the Household Budget Survey of 2017/18 are
still being processed, but it seems likely that a downward trend in the poverty rate will gradually
continue. Government efforts to expand access to social services like education, health, and water
have been undermined by their declining quality as the population rises faster than the demand of
these services can be met with supply.
2.2.3. Political Context
In October 2015, John Pombe Magufuli was elected the fifth president of Tanzania. Magufuli’s Fifth-
Phase Government has prioritised efforts to clampdown on corruption, improve public
administration and manage public resources for improved social outcomes. The Mo Ibrahim Index
of African Governance shows Tanzania has improved in its overall governance indicators between
2015-18. However, the Worldwide Governance Indicators show Tanzania has either deteriorated
or has been stagnant in all governance indicators between 2012 and 2017 (except for control of
corruption). Tanzania is a member of the African, Caribbean and Pacific Group of States, African
7 | P a g e
Union, East African Community, Indian Ocean Rim Association, Non-Aligned Movement, Southern
African Development Community, United Nations and World Trade Organization.
3. ECONOMIC OUTLOOK
3.1. Introduction
This section outlines the recent economic performance and developments in Tanzania in terms of
Gross Domestic Product (GDP) growth, trade environment from a viewpoint of the assessment and
analysis of imports and exports into and from Tanzania, the business environment with emphasis
on the ease and cost of doing business and regional integration.
3.2. Economic Structure and Indicators
The economic structure of Tanzania reflects the changing balance of output, trade, and incomes
drawn from different economic sectors ranging from primary (farming, fishing, mining etc) to
secondary (manufacturing and construction industries), tertiary and quaternary sectors (tourism,
banking and software industries).
3.2.1 Gross Domestic Product
Gross Domestic Product (GDP) is the sum of output within the economy’s territory minus the sum
of intermediate consumption (increased by taxes net of subsidies on products). It is measured in
nominal terms and with market exchange rates. Economic growth rate (GDP growth rate) is the
percentage change in the value of all of the goods and services produced in a nation during a
specific period of time, as compared to an earlier period. The economic growth rate is used to
measure the comparative health of an economy over time. The numbers are usually compiled and
reported quarterly and annually.
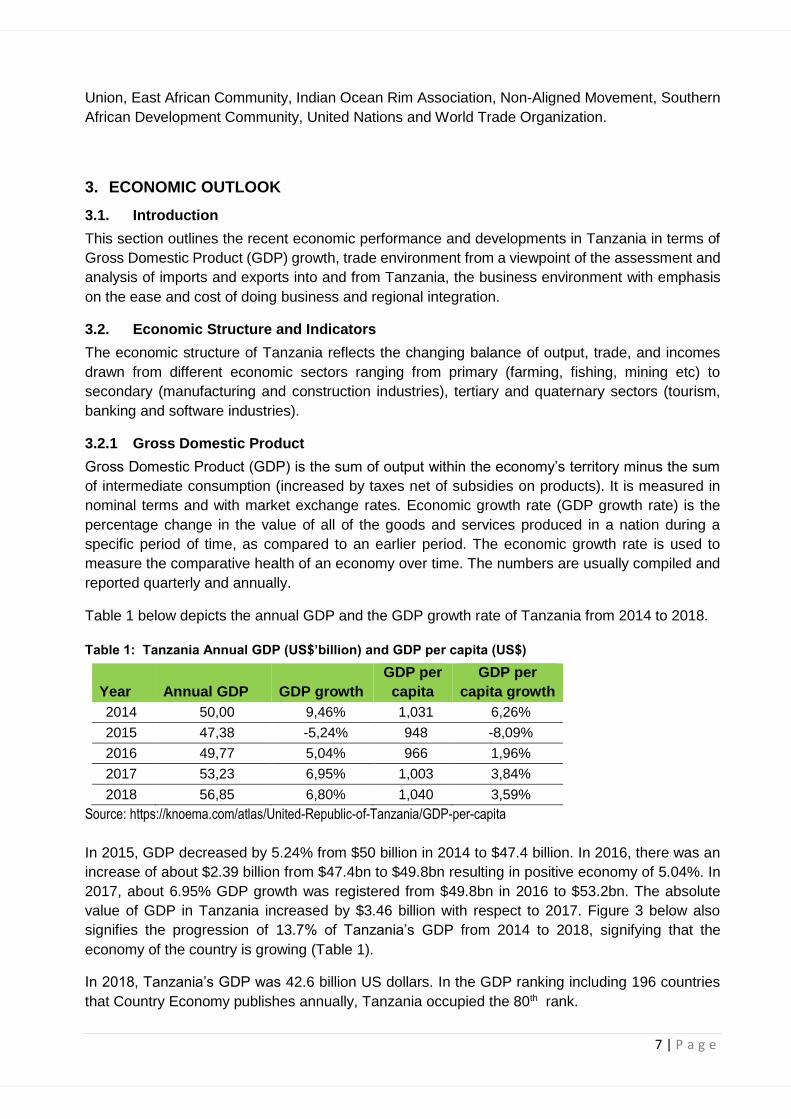
Table 1 below depicts the annual GDP and the GDP growth rate of Tanzania from 2014 to 2018.
Table 1: Tanzania Annual GDP (US$’billion) and GDP per capita (US$)
Year Annual GDP GDP growth
GDP per
capita
GDP per
capita growth
2014 50,00 9,46% 1,031 6,26%
2015 47,38 -5,24% 948 -8,09%
2016 49,77 5,04% 966 1,96%
2017 53,23 6,95% 1,003 3,84%
2018 56,85 6,80% 1,040 3,59%
Source: https://knoema.com/atlas/United-Republic-of-Tanzania/GDP-per-capita
In 2015, GDP decreased by 5.24% from $50 billion in 2014 to $47.4 billion. In 2016, there was an
increase of about $2.39 billion from $47.4bn to $49.8bn resulting in positive economy of 5.04%. In
2017, about 6.95% GDP growth was registered from $49.8bn in 2016 to $53.2bn. The absolute
value of GDP in Tanzania increased by $3.46 billion with respect to 2017. Figure 3 below also
signifies the progression of 13.7% of Tanzania’s GDP from 2014 to 2018, signifying that the
economy of the country is growing (Table 1).
In 2018, Tanzania’s GDP was 42.6 billion US dollars. In the GDP ranking including 196 countries
that Country Economy publishes annually, Tanzania occupied the 80th rank.

8 | P a g e
3.2.2 Gross Domestic Product per capita
GDP per capita is estimated by deviding the economy’s GDP by the population. It is calculated on
the basis of data for three latest years available. Table 1 above shows the GDP per capita as a
measure of the country's gross domestic product by person from 2014 to 2018.
The GDP per capita of Tanzania in 2014 recorded at $1,031, which is $83 more than in 2015, when
it was $948, resulting in about a 8,04% decline. In 2016, the GDP per capita increased by 1,94%
from $948 in 2015 to $966 and in the consecutive year (2017), the GDP per capita heightened from
$966 in 2016 to $1,003 registering about 3,79% increase. In 2018, the GDP per capita gained by
3,68% from $1,003 to $1,040. In overall, the GDP per capita slightly increased by about 0,9% from
2014 to 2018 meaning that the population of Tanzania is still among the poorest of 196 countries
(Country Economy publication). The Annual GDP and economic growth is shown in Figure 2 below.
Figure 2: Tanzania’s Annual GDP and growth
Source: https://knoema.com/atlas/United-Republic-of-Tanzania/GDP-per-capita
3.2.3 Comparison of GDP between Tanzania, Sub-Saharan Africa and South Africa
Figure 3 below shows the comparison of GDP between Tanzania, Sub-Saharan Africa and the
Republic of South Africa (RSA) from 2014 to 2018. Regarding the GDP in 2018, comparatively
Tanzania was 29,8 times lower than South Africa ($1,697bn) at approximately $56,9 billion and
also lower than the average for Sub-Saharan Africa at $368 billion. The GDP per capita was also
6,1 times below that of South Africa ($6,377) at $1,040, and that of Sub-Saharan Africa at $1,657
per capita.
Figure 3: Comparison of GDP between Tanzania and South Africa (RSA)
50,0
47,4
49,8
53,2
56,9
46,00
48,00
50,00
52,00
54,00
56,00
58,00
2014 2015 2016 2017 2018
Tanzania's Annual GDP ($'billion)
1031
948
966
1003
1040
940
950
960
970
980
990
1 000
1 010
1 020
1 030
1 040
2014 2015 2016 2017 2018
Tanzania's GDP per Capita ($)

9 | P a g e
Source: https://countryeconomy.com/gdp/tanzania
3.2.4 Gross Domestic Product contribution by Sector
This section presents rebased Quarterly Gross Domestic Product (QGDP) for base year 2015 at
current and constant prices for Tanzania Mainland. It also shows where production takes place in
Tanzania’s economy. The QGDP estimates facilitate frequent and appropriate policy interventions
by providing reliable and timely reports on recent short-term economic developments. Data used in
the compilation of the third quarter (July – September) GDP for the year 2019 was collected for all
economic activities in the country.
The compilation followed the United Nation Statistics Division’s guidelines on the compilation of
national accounts statistics including the System of National Accounts 2008. Currently, the National
Bureau of Statistics is implementing the National Accounts Revision Policy which became
operational in early 2019. During the third quarter of 2019, the value of QGDP in absolute terms at
current prices was Tanzanian Shiilings (TZS) 32,184,431 million compared to TZS 30,474,904
million of the similar quarter of 2018. Furthermore, the value of QGDP at constant 2015 prices
increased to TZS 28,640,136 million in the third quarter of 2019 from TZS 26,817,993 million in the
corresponding quarter of 2018 equivalent to a growth of 6.8 percent as shown in Figure 4 below.
Figure 4: Quarter 3 GDP growth rate in Tanzania, 2014-2019
50,0 47,4 49,8 53,2 56,9
351 318 296349 368
1740
1827
1662
1545
1697
0
200
400
600
800
1000
1200
1400
1600
1800
2000
2014 2015 2016 2017 2018
Comparative Annual GDP (US$'bn)
Tanzania Sub-Saharan Africa RSA
1031 948 966 1003 1040
1688 1690 1665 1662 1657
6501
58015327
6182 6377
0
1000
2000
3000
4000
5000
6000
7000
2014 2015 2016 2017 2018
Comparative GDP per Capita (US$)
Tanzania Sub-Saharan Africa RSA
4,7%
7,6%
6,6%
5,0%
7,1%
6,8%
4,5%
5,0%
5,5%
6,0%
6,5%
7,0%
7,5%
8,0%
2014 2015 2016 2017 2018 2019
Q3 GDP Growth Rate, 2014-2019

10 | P a g e
The distribution gives the percentage contribution of agriculture, industry, and services to total GDP:
• Agriculture includes farming, fishing, and forestry;
• Industry includes mining and quarrying, manufacturing, electricity and natural gas, water
supply, and construction; and
• Services include government activities, communications, transportation, finance, and all
other private economic activities that do not produce material goods.
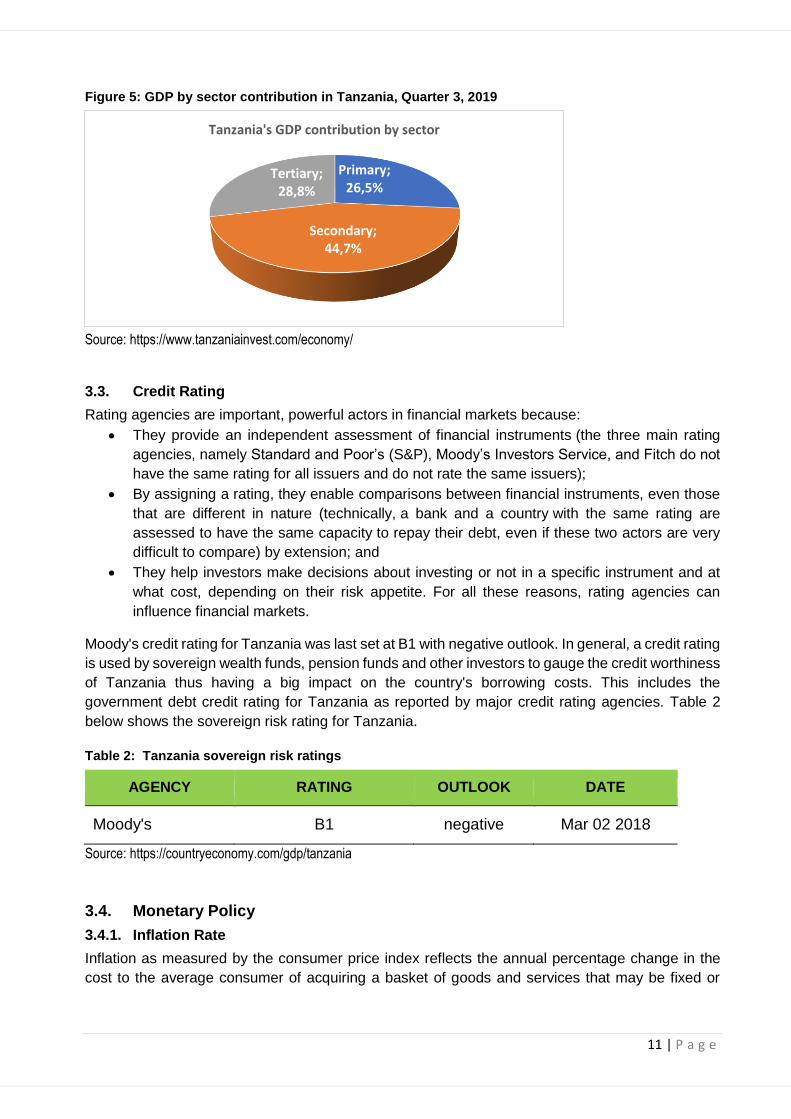
The largest share to GDP before adjustment for taxes in the third quarter of 2019 in Tanzania was
from tertiary activities which accounted for 44.7%, followed by secondary activities by 28.8% and
primary activities had the least share of 26.5% as shown in Figure 5 below.
11 | P a g e
Figure 5: GDP by sector contribution in Tanzania, Quarter 3, 2019
Source: https://www.tanzaniainvest.com/economy/
3.3. Credit Rating
Rating agencies are important, powerful actors in financial markets because:
• They provide an independent assessment of financial instruments (the three main rating
agencies, namely Standard and Poor’s (S&P), Moody’s Investors Service, and Fitch do not
have the same rating for all issuers and do not rate the same issuers);
• By assigning a rating, they enable comparisons between financial instruments, even those
that are different in nature (technically, a bank and a country with the same rating are
assessed to have the same capacity to repay their debt, even if these two actors are very
difficult to compare) by extension; and
• They help investors make decisions about investing or not in a specific instrument and at
what cost, depending on their risk appetite. For all these reasons, rating agencies can
influence financial markets.
Moody's credit rating for Tanzania was last set at B1 with negative outlook. In general, a credit rating
is used by sovereign wealth funds, pension funds and other investors to gauge the credit worthiness
of Tanzania thus having a big impact on the country's borrowing costs. This includes the
government debt credit rating for Tanzania as reported by major credit rating agencies. Table 2
below shows the sovereign risk rating for Tanzania.
Table 2: Tanzania sovereign risk ratings
AGENCY RATING OUTLOOK DATE
Moody's B1 negative Mar 02 2018
Source: https://countryeconomy.com/gdp/tanzania
3.4. Monetary Policy
3.4.1. Inflation Rate
Inflation as measured by the consumer price index reflects the annual percentage change in the
cost to the average consumer of acquiring a basket of goods and services that may be fixed or
Primary; 26,5%
Secondary; 44,7%
Tertiary; 28,8%
Tanzania's GDP contribution by sector
12 | P a g e
changed at specified intervals, such as yearly. The Laspeyres formula is generally used. Data for
inflation are averages for the year, not end-of-period data:
• The National Bureau of Statistics of Tanzania (NBS) indicates that the annual inflation rate
for the month January 2020 decreased to 3.7% from 3.8% recorded in December 2019
(Table 3); and
• The annual inflation rate in Tanzania remained unchanged at 3.8% in December 2019 from
November 2019, recording the highest level in 2019 as shown in Figure 6 below.
Figure 6: Tanzania’s inflation rate
Source: National Bureau of Statistics of Tanzania
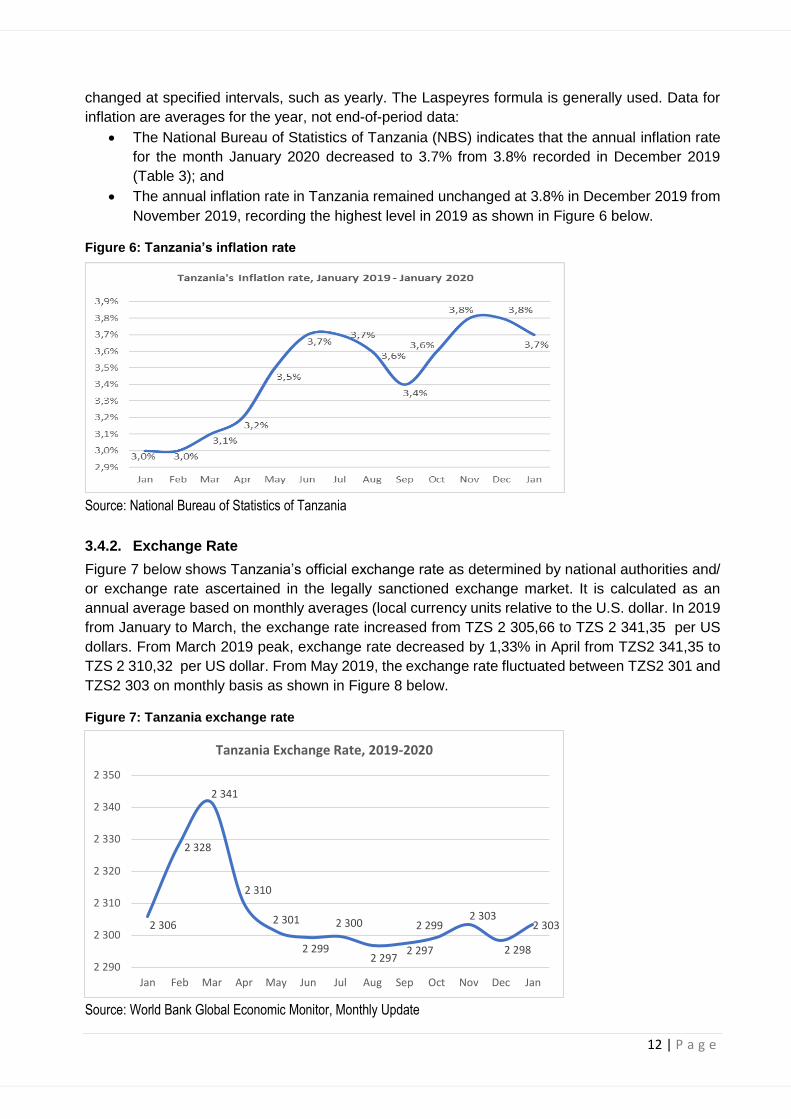
3.4.2. Exchange Rate
Figure 7 below shows Tanzania’s official exchange rate as determined by national authorities and/
or exchange rate ascertained in the legally sanctioned exchange market. It is calculated as an
annual average based on monthly averages (local currency units relative to the U.S. dollar. In 2019
from January to March, the exchange rate increased from TZS 2 305,66 to TZS 2 341,35 per US
dollars. From March 2019 peak, exchange rate decreased by 1,33% in April from TZS2 341,35 to
TZS 2 310,32 per US dollar. From May 2019, the exchange rate fluctuated between TZS2 301 and
TZS2 303 on monthly basis as shown in Figure 8 below.
Figure 7: Tanzania exchange rate
Source: World Bank Global Economic Monitor, Monthly Update
2 306
2 328
2 341
2 310
2 301
2 299
2 300
2 2972 297
2 2992 303
2 298
2 303
2 290
2 300
2 310
2 320
2 330
2 340
2 350
Jan Feb Mar Apr May Jun Jul Aug Sep Oct Nov Dec Jan
Tanzania Exchange Rate, 2019-2020
13 | P a g e
3.5. Trade Environment
3.5.1. Tanzania’s main exports destinations
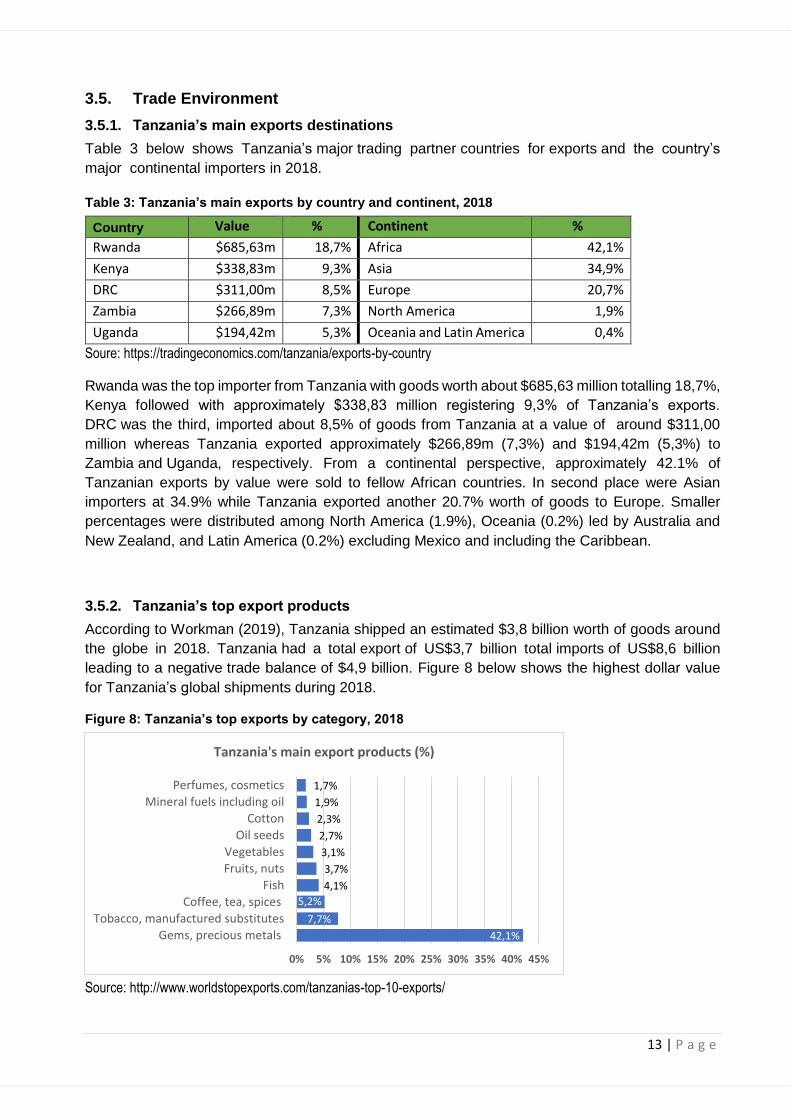
Table 3 below shows Tanzania’s major trading partner countries for exports and the country’s
major continental importers in 2018.
Table 3: Tanzania’s main exports by country and continent, 2018
Country Value % Continent %
Rwanda $685,63m 18,7% Africa 42,1%
Kenya $338,83m 9,3% Asia 34,9%
DRC $311,00m 8,5% Europe 20,7%
Zambia $266,89m 7,3% North America 1,9%
Uganda $194,42m 5,3% Oceania and Latin America 0,4%
Soure: https://tradingeconomics.com/tanzania/exports-by-country
Rwanda was the top importer from Tanzania with goods worth about $685,63 million totalling 18,7%,
Kenya followed with approximately $338,83 million registering 9,3% of Tanzania’s exports.
DRC was the third, imported about 8,5% of goods from Tanzania at a value of around $311,00
million whereas Tanzania exported approximately $266,89m (7,3%) and $194,42m (5,3%) to
Zambia and Uganda, respectively. From a continental perspective, approximately 42.1% of
Tanzanian exports by value were sold to fellow African countries. In second place were Asian
importers at 34.9% while Tanzania exported another 20.7% worth of goods to Europe. Smaller
percentages were distributed among North America (1.9%), Oceania (0.2%) led by Australia and
New Zealand, and Latin America (0.2%) excluding Mexico and including the Caribbean.
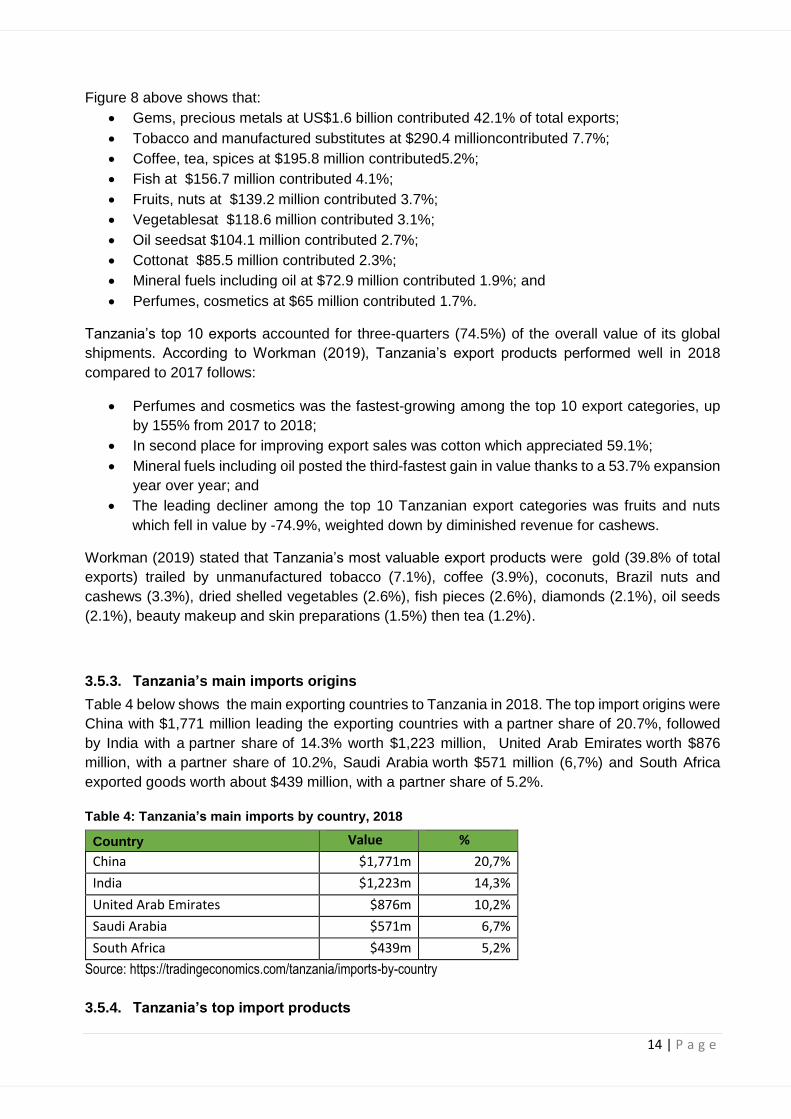
3.5.2. Tanzania’s top export products
According to Workman (2019), Tanzania shipped an estimated $3,8 billion worth of goods around
the globe in 2018. Tanzania had a total export of US$3,7 billion total imports of US$8,6 billion
leading to a negative trade balance of $4,9 billion. Figure 8 below shows the highest dollar value
for Tanzania’s global shipments during 2018.
Figure 8: Tanzania’s top exports by category, 2018
Source: http://www.worldstopexports.com/tanzanias-top-10-exports/
42,1%
7,7%
5,2%
4,1%
3,7%
3,1%
2,7%
2,3%
1,9%
1,7%
0% 5% 10% 15% 20% 25% 30% 35% 40% 45%
Gems, precious metals
Tobacco, manufactured substitutes
Coffee, tea, spices
Fish
Fruits, nuts
Vegetables
Oil seeds
Cotton
Mineral fuels including oil
Perfumes, cosmetics
Tanzania's main export products (%)
14 | P a g e
Figure 8 above shows that:
• Gems, precious metals at US$1.6 billion contributed 42.1% of total exports;
• Tobacco and manufactured substitutes at $290.4 millioncontributed 7.7%;
• Coffee, tea, spices at $195.8 million contributed5.2%;
• Fish at $156.7 million contributed 4.1%;
• Fruits, nuts at $139.2 million contributed 3.7%;
• Vegetablesat $118.6 million contributed 3.1%;
• Oil seedsat $104.1 million contributed 2.7%;
• Cottonat $85.5 million contributed 2.3%;
• Mineral fuels including oil at $72.9 million contributed 1.9%; and
• Perfumes, cosmetics at $65 million contributed 1.7%.
Tanzania’s top 10 exports accounted for three-quarters (74.5%) of the overall value of its global
shipments. According to Workman (2019), Tanzania’s export products performed well in 2018
compared to 2017 follows:
• Perfumes and cosmetics was the fastest-growing among the top 10 export categories, up
by 155% from 2017 to 2018;
• In second place for improving export sales was cotton which appreciated 59.1%;
• Mineral fuels including oil posted the third-fastest gain in value thanks to a 53.7% expansion
year over year; and
• The leading decliner among the top 10 Tanzanian export categories was fruits and nuts
which fell in value by -74.9%, weighted down by diminished revenue for cashews.
Workman (2019) stated that Tanzania’s most valuable export products were gold (39.8% of total
exports) trailed by unmanufactured tobacco (7.1%), coffee (3.9%), coconuts, Brazil nuts and
cashews (3.3%), dried shelled vegetables (2.6%), fish pieces (2.6%), diamonds (2.1%), oil seeds
(2.1%), beauty makeup and skin preparations (1.5%) then tea (1.2%).
3.5.3. Tanzania’s main imports origins
Table 4 below shows the main exporting countries to Tanzania in 2018. The top import origins were
China with $1,771 million leading the exporting countries with a partner share of 20.7%, followed
by India with a partner share of 14.3% worth $1,223 million, United Arab Emirates worth $876
million, with a partner share of 10.2%, Saudi Arabia worth $571 million (6,7%) and South Africa
exported goods worth about $439 million, with a partner share of 5.2%.
Table 4: Tanzania’s main imports by country, 2018
Country Value %
China $1,771m 20,7%
India $1,223m 14,3%
United Arab Emirates $876m 10,2%
Saudi Arabia $571m 6,7%
South Africa $439m 5,2%
Source: https://tradingeconomics.com/tanzania/imports-by-country
3.5.4. Tanzania’s top import products

15 | P a g e
The value of total merchandise imports to Tanzania totalled $8,55 billion in 2018. Merchandise
imports to Tanzania increased by 10,1% compared to 2017. Goods imports grew up by $788 million
in 2018 (the value of merchandise imports to Tanzania was equal to $7,76 billion in 2017). The
imports structure into Tanzania in 2018 is summarised below:
• 20% ($1,78 billion): mineral fuels, mineral oils and products of their distillation, bituminous
substances and mineral waxes;
• 12% ($1 billion): nuclear reactors, boilers, machinery and mechanical appliances and parts
thereof;
• 9,7% ($829 million): vehicles other than railway or tramway rolling stock, and parts and
accessories thereof;
• 5,9% ($507 million): electrical machinery and equipment and parts thereof; sound recorders
and reproducers, television image and sound recorders and reproducers, and parts and
accessories of such articles;
• 5,7% ($491 million): plastics and articles thereof
• 5,0% ($427 million): iIron and steel;
• 3,6% ($304 million): articles of iron or steel;
• 3,3% ($281 million): pharmaceutical products;
• 2,9% ($248 million): miscellaneous chemical products; and
• 2,8% ($238 million): animal or vegetable fats and oils and their cleavage products prepared
edible fats; animal or vegetable waxes.
Table 5 below shows the top import products of Tanzania.
Table 5: Tanzania’s top imports by category, 2018
Imports Value %
Mineral fuels, oils, distillation products $1,78bn 21%
Machinery, nuclear reactors, boilers $1,01bn 12%
Vehicles other than railway, tramway $829,75m 9,7%
Electrical, electronic equipment $509,64m 6,0%
Plastics $491,06m 5,7%
Iron and steel $427,88m 5,0%
Articles of iron or steel $304,84m 3,6%
Source: https://tradingeconomics.com/tanzania/imports-by-category
3.5.5. Tanzania’s intra-EAC trade
3.5.5.1. Tanzania's intra regional trade
Total intra-EAC trade increased by 14,6% to US$811,3 million in 2018 from US$707,7 million
recorded in 2017 as shown in Table 6 below. This good performance was largely resultant of an
increase in both exports and imports to and from the EAC market.
3.5.5.2. Intra-regional exports
Tanzania’s domestic exports to EAC member states increased by 4.2% to US$448.6 million in 2018,
from US$430.5 million recorded in 2017, with much upsurge registered in exports destined to
Uganda (Table 5). Nonetheless, Kenya remained the major destination, accounting for 48% of
Tanzania’s domestic exports to EAC member states, followed by Uganda which accounted for 24%
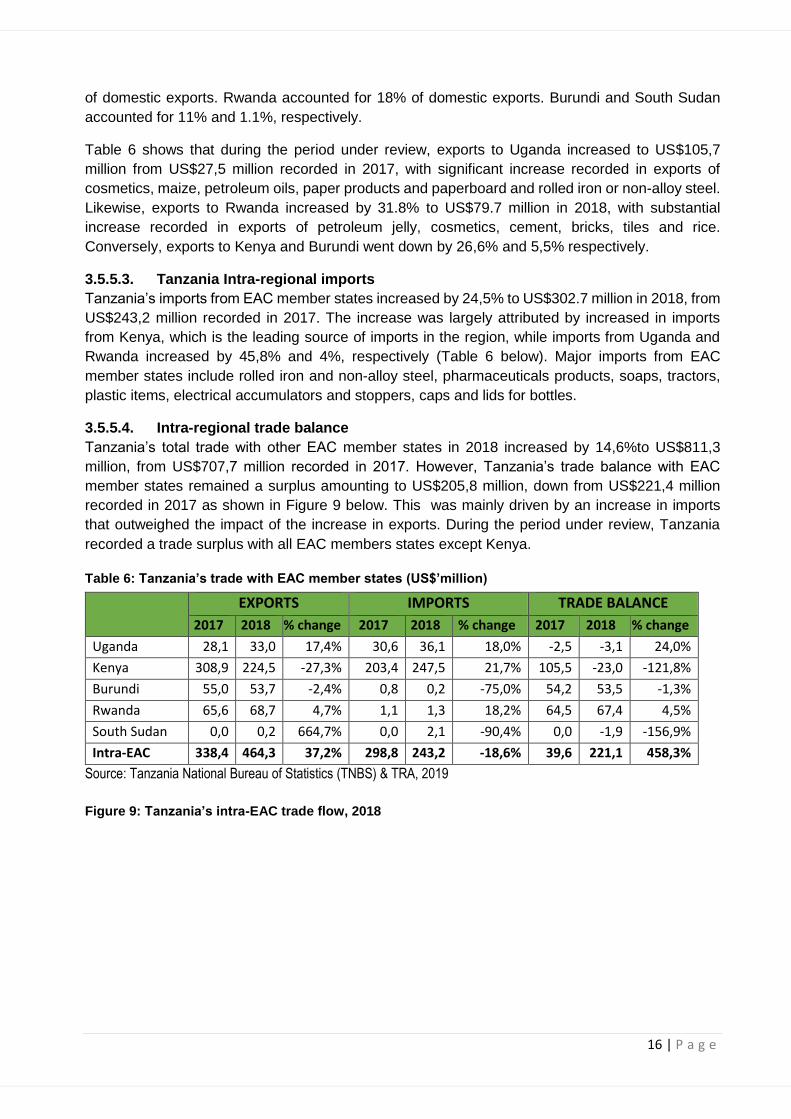
16 | P a g e
of domestic exports. Rwanda accounted for 18% of domestic exports. Burundi and South Sudan
accounted for 11% and 1.1%, respectively.
Table 6 shows that during the period under review, exports to Uganda increased to US$105,7
million from US$27,5 million recorded in 2017, with significant increase recorded in exports of
cosmetics, maize, petroleum oils, paper products and paperboard and rolled iron or non-alloy steel.
Likewise, exports to Rwanda increased by 31.8% to US$79.7 million in 2018, with substantial
increase recorded in exports of petroleum jelly, cosmetics, cement, bricks, tiles and rice.
Conversely, exports to Kenya and Burundi went down by 26,6% and 5,5% respectively.
3.5.5.3. Tanzania Intra-regional imports
Tanzania’s imports from EAC member states increased by 24,5% to US$302.7 million in 2018, from
US$243,2 million recorded in 2017. The increase was largely attributed by increased in imports
from Kenya, which is the leading source of imports in the region, while imports from Uganda and
Rwanda increased by 45,8% and 4%, respectively (Table 6 below). Major imports from EAC
member states include rolled iron and non-alloy steel, pharmaceuticals products, soaps, tractors,
plastic items, electrical accumulators and stoppers, caps and lids for bottles.
3.5.5.4. Intra-regional trade balance
Tanzania’s total trade with other EAC member states in 2018 increased by 14,6%to US$811,3
million, from US$707,7 million recorded in 2017. However, Tanzania’s trade balance with EAC
member states remained a surplus amounting to US$205,8 million, down from US$221,4 million
recorded in 2017 as shown in Figure 9 below. This was mainly driven by an increase in imports
that outweighed the impact of the increase in exports. During the period under review, Tanzania
recorded a trade surplus with all EAC members states except Kenya.
Table 6: Tanzania’s trade with EAC member states (US$’million)
EXPORTS IMPORTS TRADE BALANCE
2017 2018 % change 2017 2018 % change 2017 2018 % change
Uganda 28,1 33,0 17,4% 30,6 36,1 18,0% -2,5 -3,1 24,0%
Kenya 308,9 224,5 -27,3% 203,4 247,5 21,7% 105,5 -23,0 -121,8%
Burundi 55,0 53,7 -2,4% 0,8 0,2 -75,0% 54,2 53,5 -1,3%
Rwanda 65,6 68,7 4,7% 1,1 1,3 18,2% 64,5 67,4 4,5%
South Sudan 0,0 0,2 664,7% 0,0 2,1 -90,4% 0,0 -1,9 -156,9%
Intra-EAC 338,4 464,3 37,2% 298,8 243,2 -18,6% 39,6 221,1 458,3%
Source: Tanzania National Bureau of Statistics (TNBS) & TRA, 2019
Figure 9: Tanzania’s intra-EAC trade flow, 2018
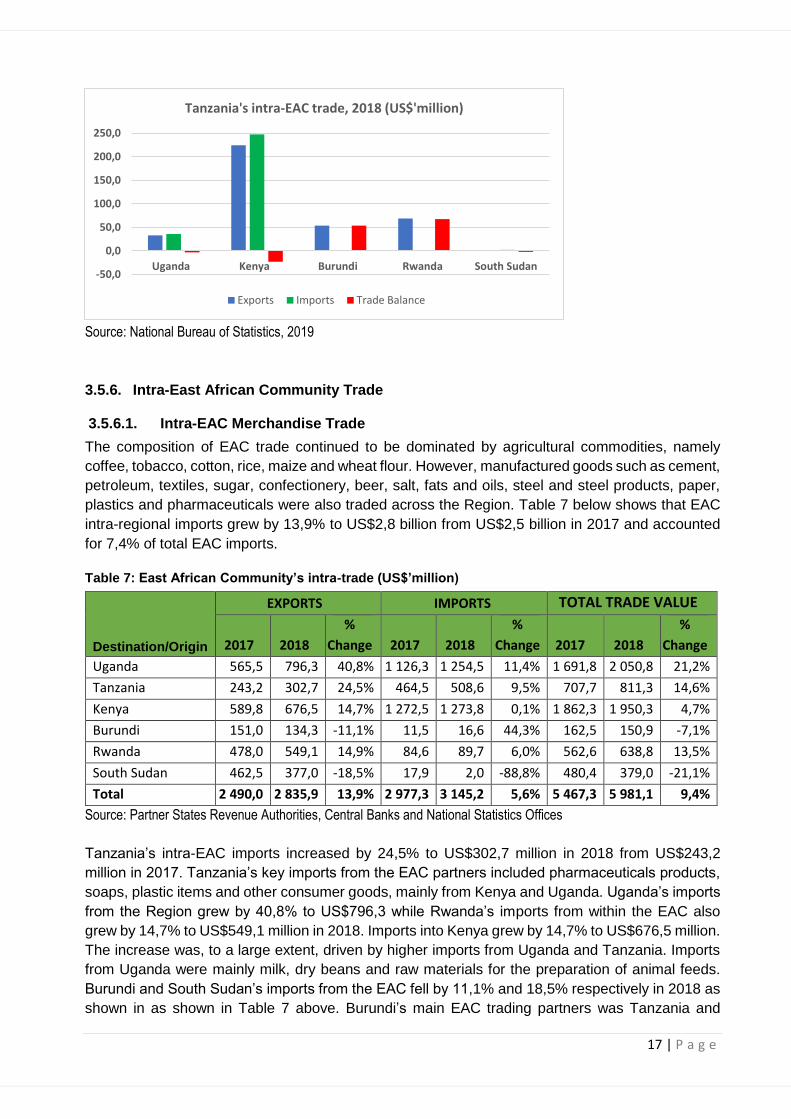
17 | P a g e
Source: National Bureau of Statistics, 2019
3.5.6. Intra-East African Community Trade
3.5.6.1. Intra-EAC Merchandise Trade
The composition of EAC trade continued to be dominated by agricultural commodities, namely
coffee, tobacco, cotton, rice, maize and wheat flour. However, manufactured goods such as cement,
petroleum, textiles, sugar, confectionery, beer, salt, fats and oils, steel and steel products, paper,
plastics and pharmaceuticals were also traded across the Region. Table 7 below shows that EAC
intra-regional imports grew by 13,9% to US$2,8 billion from US$2,5 billion in 2017 and accounted
for 7,4% of total EAC imports.
Table 7: East African Community’s intra-trade (US$’million)
Destination/Origin
EXPORTS IMPORTS TOTAL TRADE VALUE
2017 2018
%
Change 2017 2018
%
Change 2017 2018
%
Change
Uganda 565,5 796,3 40,8% 1 126,3 1 254,5 11,4% 1 691,8 2 050,8 21,2%
Tanzania 243,2 302,7 24,5% 464,5 508,6 9,5% 707,7 811,3 14,6%
Kenya 589,8 676,5 14,7% 1 272,5 1 273,8 0,1% 1 862,3 1 950,3 4,7%
Burundi 151,0 134,3 -11,1% 11,5 16,6 44,3% 162,5 150,9 -7,1%
Rwanda 478,0 549,1 14,9% 84,6 89,7 6,0% 562,6 638,8 13,5%
South Sudan 462,5 377,0 -18,5% 17,9 2,0 -88,8% 480,4 379,0 -21,1%
Total 2 490,0 2 835,9 13,9% 2 977,3 3 145,2 5,6% 5 467,3 5 981,1 9,4%
Source: Partner States Revenue Authorities, Central Banks and National Statistics Offices
Tanzania’s intra-EAC imports increased by 24,5% to US$302,7 million in 2018 from US$243,2
million in 2017. Tanzania’s key imports from the EAC partners included pharmaceuticals products,
soaps, plastic items and other consumer goods, mainly from Kenya and Uganda. Uganda’s imports
from the Region grew by 40,8% to US$796,3 while Rwanda’s imports from within the EAC also
grew by 14,7% to US$549,1 million in 2018. Imports into Kenya grew by 14,7% to US$676,5 million.
The increase was, to a large extent, driven by higher imports from Uganda and Tanzania. Imports
from Uganda were mainly milk, dry beans and raw materials for the preparation of animal feeds.
Burundi and South Sudan’s imports from the EAC fell by 11,1% and 18,5% respectively in 2018 as
shown in as shown in Table 7 above. Burundi’s main EAC trading partners was Tanzania and
-50,0
0,0
50,0
100,0
150,0
200,0
250,0
Uganda Kenya Burundi Rwanda South Sudan
Tanzania's intra-EAC trade, 2018 (US$'million)
Exports Imports Trade Balance

18 | P a g e
imports mainly consisted of chemical fertilizers, cement and textile articles. South Sudan’s main
trading partners were Kenya and Uganda and imports mainly consisted of maize, sugar and
manufactured commodities.
Intra-regional exports grew by 5,6% to US%3.2 billion in 2018 from US$2.9 billion in 2017.
Noticeably, exports from all partner states grew with the exception of South Sudan during the year.
Burundi experienced 44,3% growth in exports while exports from Uganda, Tanzania and Rwanda
grew by 11,4%, 9.5% and 6% respectively during the year as shown in a Table 7 above. Exports
from Kenya to the other partner states experienced a modest growth of 0,1% in 2018. Despite the
increased total trade, the region continues to face challenges related to the trade performance and
they include: vulnerability of the agricultural sector to the forces of nature, dependence on exports
of primary products, and rising oil prices. As such, there is a need to reduce dependence on imports
of fossil fuels, motors, crude palm oil, textiles and capital items. Initiatives such as fast tracking the
production of EAC oil and gas reserves, assembly of motors in the region and improvement of
agricultural production through irrigation, post-harvest handling and value addition should be
explored.
3.5.6.2. Total EAC Trade Trends
The EAC Merchandize trade in the EAC grew by 11,7% growth to US%52.4 billion in 2018 from
US$46,9 billion in 2017 as shown in Table 8 below.
Table 8: East African Community’s total trade flows (US$’million)
Trade Flow Destination/Origin 2017 2018 % change
Exports
Total EAC Exports 14 727,3 14 027,9 -4,7%
Intra-EAC Total Exports 2 977,4 3 145,1 5,6%
COMESA 1 976,7 1 548,1 -21,7%
SADC 1 420,2 1 898,4 33,7%
Rest of Africa 328,3 225,4 -31,3%
EU 2 301,1 2 451,4 6,5%
USA 755,7 599,8 -20,6%
Rest of the World 5 191,8 4 533,1 -12,7%
Imports
Total EAC Imports 32 165,5 38 329,4 19,2%
Intra-EAC Total Imports 2 490,6 2 835,9 13,9%
COMESA 1 535,5 1 135,9 -26,0%
SADC 2 410,3 2 104,7 -12,7%
Rest of Africa 90,2 186,9 107,2%
EU 4 138,0 4 327,6 4,6%
USA 921,6 942,9 2,3%
Rest of the World 20 587,6 16 977,6 -17,5%
Total Trade
Total intra EAC Trade 5 467,9 5 981,1 9,4%
Total Trade 46 892,8 52 357,4 11,7%
EAC Trade Balance -17 438,2 -24 301,5 39,4%
Source: National Statistical Offices and Revenue Authorities of Partner States
Notes:
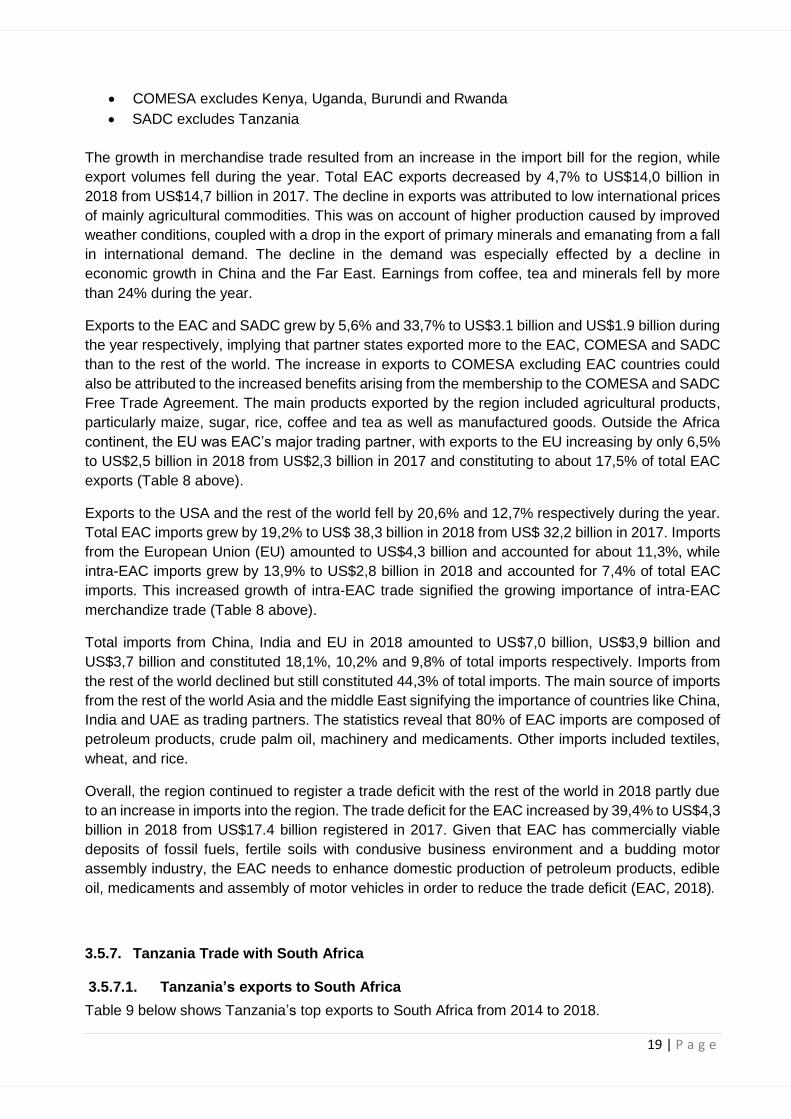
19 | P a g e
• COMESA excludes Kenya, Uganda, Burundi and Rwanda
• SADC excludes Tanzania
The growth in merchandise trade resulted from an increase in the import bill for the region, while
export volumes fell during the year. Total EAC exports decreased by 4,7% to US$14,0 billion in
2018 from US$14,7 billion in 2017. The decline in exports was attributed to low international prices
of mainly agricultural commodities. This was on account of higher production caused by improved
weather conditions, coupled with a drop in the export of primary minerals and emanating from a fall
in international demand. The decline in the demand was especially effected by a decline in
economic growth in China and the Far East. Earnings from coffee, tea and minerals fell by more
than 24% during the year.
Exports to the EAC and SADC grew by 5,6% and 33,7% to US$3.1 billion and US$1.9 billion during
the year respectively, implying that partner states exported more to the EAC, COMESA and SADC
than to the rest of the world. The increase in exports to COMESA excluding EAC countries could
also be attributed to the increased benefits arising from the membership to the COMESA and SADC
Free Trade Agreement. The main products exported by the region included agricultural products,
particularly maize, sugar, rice, coffee and tea as well as manufactured goods. Outside the Africa
continent, the EU was EAC’s major trading partner, with exports to the EU increasing by only 6,5%
to US$2,5 billion in 2018 from US$2,3 billion in 2017 and constituting to about 17,5% of total EAC
exports (Table 8 above).
Exports to the USA and the rest of the world fell by 20,6% and 12,7% respectively during the year.
Total EAC imports grew by 19,2% to US$ 38,3 billion in 2018 from US$ 32,2 billion in 2017. Imports
from the European Union (EU) amounted to US$4,3 billion and accounted for about 11,3%, while
intra-EAC imports grew by 13,9% to US$2,8 billion in 2018 and accounted for 7,4% of total EAC
imports. This increased growth of intra-EAC trade signified the growing importance of intra-EAC
merchandize trade (Table 8 above).
Total imports from China, India and EU in 2018 amounted to US$7,0 billion, US$3,9 billion and
US$3,7 billion and constituted 18,1%, 10,2% and 9,8% of total imports respectively. Imports from
the rest of the world declined but still constituted 44,3% of total imports. The main source of imports
from the rest of the world Asia and the middle East signifying the importance of countries like China,
India and UAE as trading partners. The statistics reveal that 80% of EAC imports are composed of
petroleum products, crude palm oil, machinery and medicaments. Other imports included textiles,
wheat, and rice.
Overall, the region continued to register a trade deficit with the rest of the world in 2018 partly due
to an increase in imports into the region. The trade deficit for the EAC increased by 39,4% to US$4,3
billion in 2018 from US$17.4 billion registered in 2017. Given that EAC has commercially viable
deposits of fossil fuels, fertile soils with condusive business environment and a budding motor
assembly industry, the EAC needs to enhance domestic production of petroleum products, edible
oil, medicaments and assembly of motor vehicles in order to reduce the trade deficit (EAC, 2018).
3.5.7. Tanzania Trade with South Africa
3.5.7.1. Tanzania’s exports to South Africa
Table 9 below shows Tanzania’s top exports to South Africa from 2014 to 2018.
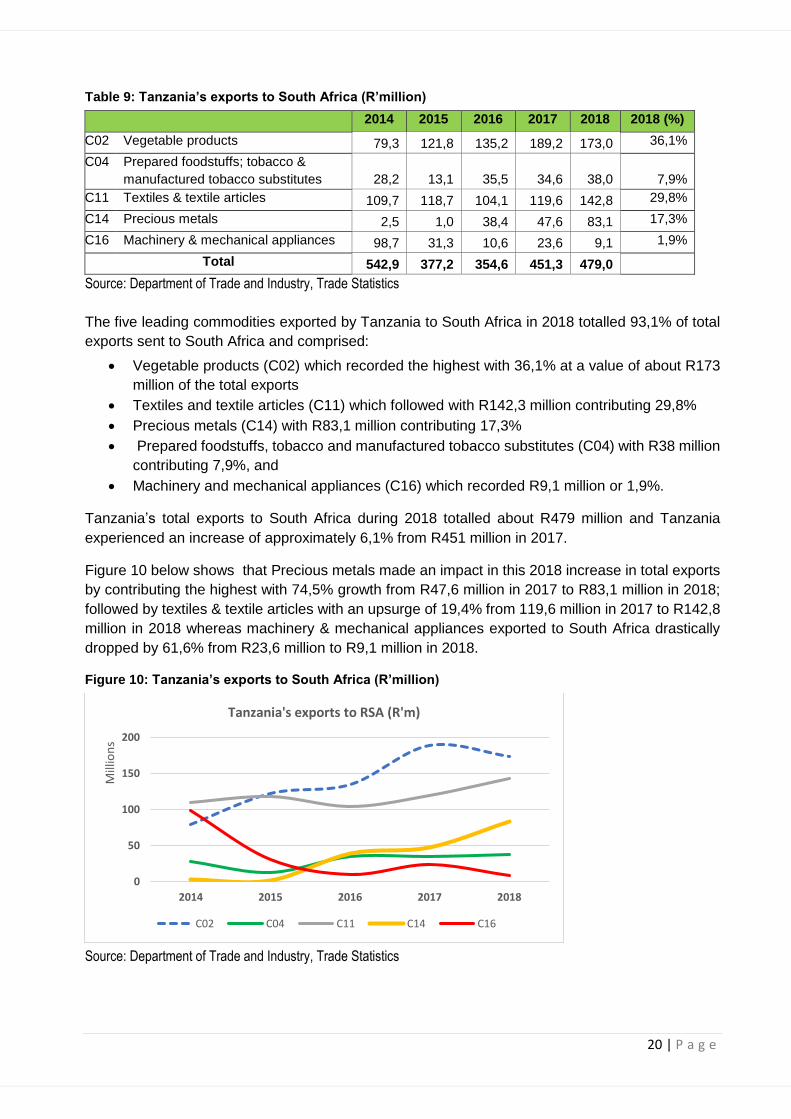
20 | P a g e
Table 9: Tanzania’s exports to South Africa (R’million)
2014 2015 2016 2017 2018 2018 (%)
C02 Vegetable products 79,3 121,8 135,2 189,2 173,0 36,1%
C04 Prepared foodstuffs; tobacco &
manufactured tobacco substitutes 28,2 13,1 35,5 34,6 38,0
7,9%
C11 Textiles & textile articles 109,7 118,7 104,1 119,6 142,8 29,8%
C14 Precious metals 2,5 1,0 38,4 47,6 83,1 17,3%
C16 Machinery & mechanical appliances 98,7 31,3 10,6 23,6 9,1 1,9%
Total 542,9 377,2 354,6 451,3 479,0
Source: Department of Trade and Industry, Trade Statistics
The five leading commodities exported by Tanzania to South Africa in 2018 totalled 93,1% of total
exports sent to South Africa and comprised:
• Vegetable products (C02) which recorded the highest with 36,1% at a value of about R173
million of the total exports
• Textiles and textile articles (C11) which followed with R142,3 million contributing 29,8%
• Precious metals (C14) with R83,1 million contributing 17,3%
• Prepared foodstuffs, tobacco and manufactured tobacco substitutes (C04) with R38 million
contributing 7,9%, and
• Machinery and mechanical appliances (C16) which recorded R9,1 million or 1,9%.
Tanzania’s total exports to South Africa during 2018 totalled about R479 million and Tanzania
experienced an increase of approximately 6,1% from R451 million in 2017.
Figure 10 below shows that Precious metals made an impact in this 2018 increase in total exports
by contributing the highest with 74,5% growth from R47,6 million in 2017 to R83,1 million in 2018;
followed by textiles & textile articles with an upsurge of 19,4% from 119,6 million in 2017 to R142,8
million in 2018 whereas machinery & mechanical appliances exported to South Africa drastically
dropped by 61,6% from R23,6 million to R9,1 million in 2018.
Figure 10: Tanzania’s exports to South Africa (R’million)
Source: Department of Trade and Industry, Trade Statistics
0
50
100
150
200
2014 2015 2016 2017 2018
Mill
ion
s
Tanzania's exports to RSA (R'm)
C02 C04 C11 C14 C16

21 | P a g e
3.5.7.2. Tanzania’s imports from South Africa
Tanzania’s imports from South Africa for 2014 to 2018 are shown in Table 10 below.
Table 10: Tanzania’s imports from South Africa (R’million)
2014 2015 2016 2017 2018 2018 (%)
C04 Prepared foodstuffs; tobacco &
manufactured tobacco substitutes 371,2 411,1 503,7 452,0 434,3 8,2%
C06 Products of the chemical or allied
industries 464,4 550,5 568,1 622,6 527,4 10,0%
C15 Base metals & articles of base metal 1 229,5 1 264,9 1 287,0 1 231,8 1 471,0 27,8%
C16 Machinery & mechanical appliances 1 151,9 1 367,0 1 530,9 1 210,7 965,7 18,2%
C17 Vehicles, aircraft, vessels &
associated transport equipment 572,9 1 599,8 874,7 911,5 651,0 12,3%
Total 5 374,1 6 927,2 6 498,7 6 010,5 5 295,2 Source: Department of Trade and Industry, Trade Statistics
The top five Tanzania’s commodities imported from South Africa accounted for 75,6% of total
imports in 2018. Base metals & articles of base metal (C15) registered the highest with R1,471
million contributing 27,8%; seconded by Machinery & mechanical appliances (C16) with 18,2%
(R966 million); Vehicles, aircraft, vessels & associated transport equipment (C17) with 12.3% (R651
million); Products of the chemical or allied industries (C06) recorded 10% (R527 million); and
Prepared foodstuffs; tobacco & manufactured tobacco substitutes (C04) contributed 8,2% with
R434 million as shown in Figure 11 below.
Figure 11: Tanzania’s imports from South Africa
Source: Department of Trade and Industry, Trade Statistics
3.5.7.3. Tanzania’s trade balance with South Africa
In 2018, Tanzania exported about R479 million in goods and services, but imported approximately
R5,3 billion to South Africa, then Tanzania recorded a trade balance of negative R4,8 billion, or a
R4,8 billion trade deficit. This means that trading between Tanzania and South Africa favoured
South Africa with about R4,8 billion in 2018 or disfavoured Tanzania with a deficit of i about R4,8
billion in 2018 as shown in Figure 12 below. In general, South Afica has been benefiting in trading
200
400
600
800
1 000
1 200
1 400
1 600
2014 2015 2016 2017 2018
Mill
ion
s
Tanzania's imports from RSA (R'm)
C15 C16 C17 C06 C04
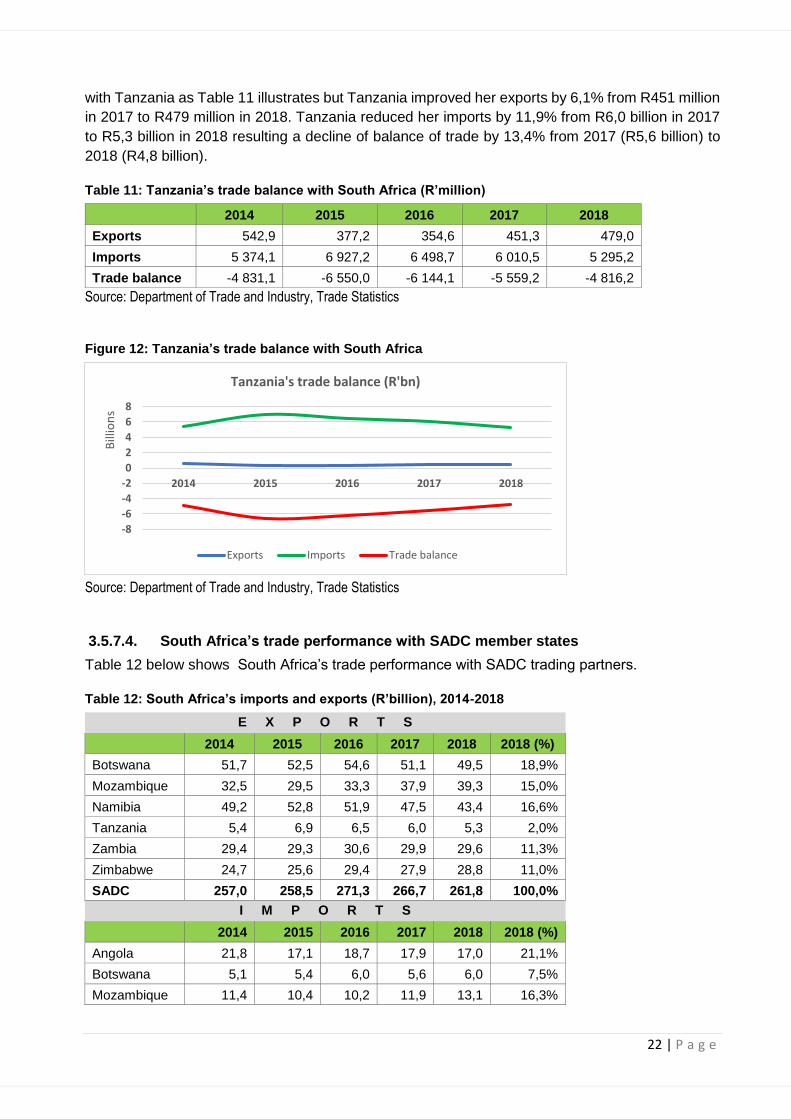
22 | P a g e
with Tanzania as Table 11 illustrates but Tanzania improved her exports by 6,1% from R451 million
in 2017 to R479 million in 2018. Tanzania reduced her imports by 11,9% from R6,0 billion in 2017
to R5,3 billion in 2018 resulting a decline of balance of trade by 13,4% from 2017 (R5,6 billion) to
2018 (R4,8 billion).
Table 11: Tanzania’s trade balance with South Africa (R’million)
2014 2015 2016 2017 2018
Exports 542,9 377,2 354,6 451,3 479,0
Imports 5 374,1 6 927,2 6 498,7 6 010,5 5 295,2
Trade balance -4 831,1 -6 550,0 -6 144,1 -5 559,2 -4 816,2
Source: Department of Trade and Industry, Trade Statistics
Figure 12: Tanzania’s trade balance with South Africa
Source: Department of Trade and Industry, Trade Statistics
3.5.7.4. South Africa’s trade performance with SADC member states
Table 12 below shows South Africa’s trade performance with SADC trading partners.
Table 12: South Africa’s imports and exports (R’billion), 2014-2018
E X P O R T S
2014 2015 2016 2017 2018 2018 (%)
Botswana 51,7 52,5 54,6 51,1 49,5 18,9%
Mozambique 32,5 29,5 33,3 37,9 39,3 15,0%
Namibia 49,2 52,8 51,9 47,5 43,4 16,6%
Tanzania 5,4 6,9 6,5 6,0 5,3 2,0%
Zambia 29,4 29,3 30,6 29,9 29,6 11,3%
Zimbabwe 24,7 25,6 29,4 27,9 28,8 11,0%
SADC 257,0 258,5 271,3 266,7 261,8 100,0%
I M P O R T S
2014 2015 2016 2017 2018 2018 (%)
Angola 21,8 17,1 18,7 17,9 17,0 21,1%
Botswana 5,1 5,4 6,0 5,6 6,0 7,5%
Mozambique 11,4 10,4 10,2 11,9 13,1 16,3%
-8
-6
-4
-2
0
2
4
6
8
2014 2015 2016 2017 2018
Bill
ion
s
Tanzania's trade balance (R'bn)
Exports Imports Trade balance
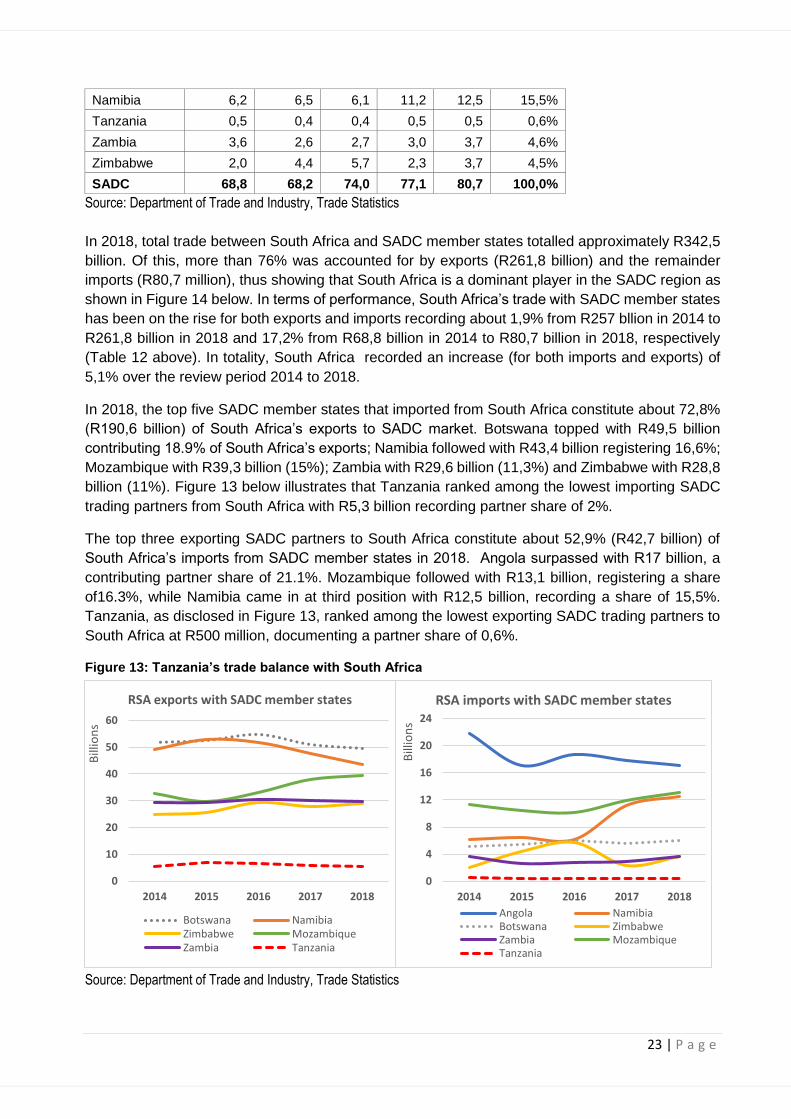
23 | P a g e
Namibia 6,2 6,5 6,1 11,2 12,5 15,5%
Tanzania 0,5 0,4 0,4 0,5 0,5 0,6%
Zambia 3,6 2,6 2,7 3,0 3,7 4,6%
Zimbabwe 2,0 4,4 5,7 2,3 3,7 4,5%
SADC 68,8 68,2 74,0 77,1 80,7 100,0%
Source: Department of Trade and Industry, Trade Statistics
In 2018, total trade between South Africa and SADC member states totalled approximately R342,5
billion. Of this, more than 76% was accounted for by exports (R261,8 billion) and the remainder
imports (R80,7 million), thus showing that South Africa is a dominant player in the SADC region as
shown in Figure 14 below. In terms of performance, South Africa’s trade with SADC member states
has been on the rise for both exports and imports recording about 1,9% from R257 bllion in 2014 to
R261,8 billion in 2018 and 17,2% from R68,8 billion in 2014 to R80,7 billion in 2018, respectively
(Table 12 above). In totality, South Africa recorded an increase (for both imports and exports) of
5,1% over the review period 2014 to 2018.
In 2018, the top five SADC member states that imported from South Africa constitute about 72,8%
(R190,6 billion) of South Africa’s exports to SADC market. Botswana topped with R49,5 billion
contributing 18.9% of South Africa’s exports; Namibia followed with R43,4 billion registering 16,6%;
Mozambique with R39,3 billion (15%); Zambia with R29,6 billion (11,3%) and Zimbabwe with R28,8
billion (11%). Figure 13 below illustrates that Tanzania ranked among the lowest importing SADC
trading partners from South Africa with R5,3 billion recording partner share of 2%.
The top three exporting SADC partners to South Africa constitute about 52,9% (R42,7 billion) of
South Africa’s imports from SADC member states in 2018. Angola surpassed with R17 billion, a
contributing partner share of 21.1%. Mozambique followed with R13,1 billion, registering a share
of16.3%, while Namibia came in at third position with R12,5 billion, recording a share of 15,5%.
Tanzania, as disclosed in Figure 13, ranked among the lowest exporting SADC trading partners to
South Africa at R500 million, documenting a partner share of 0,6%.
Figure 13: Tanzania’s trade balance with South Africa
Source: Department of Trade and Industry, Trade Statistics
0
10
20
30
40
50
60
2014 2015 2016 2017 2018
Bill
ion
s
RSA exports with SADC member states
Botswana NamibiaZimbabwe MozambiqueZambia Tanzania
0
4
8
12
16
20
24
2014 2015 2016 2017 2018
Bill
ion
s
RSA imports with SADC member states
Angola NamibiaBotswana ZimbabweZambia MozambiqueTanzania
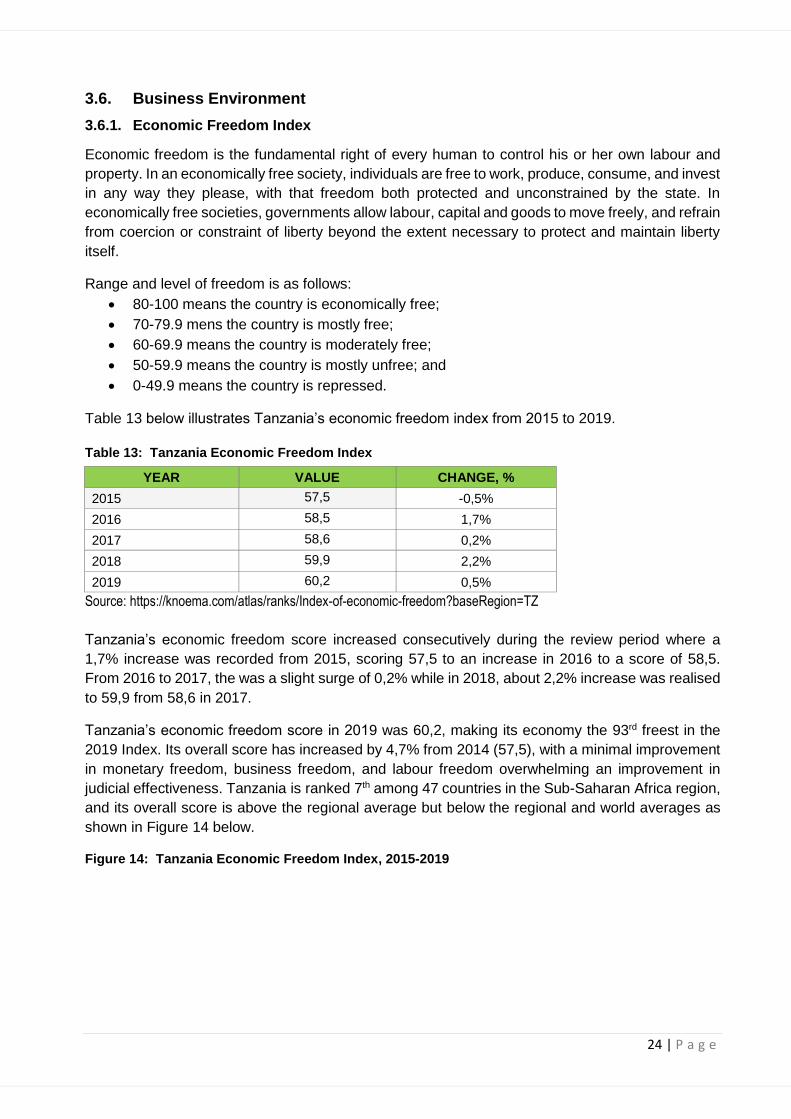
24 | P a g e
3.6. Business Environment
3.6.1. Economic Freedom Index
Economic freedom is the fundamental right of every human to control his or her own labour and
property. In an economically free society, individuals are free to work, produce, consume, and invest
in any way they please, with that freedom both protected and unconstrained by the state. In
economically free societies, governments allow labour, capital and goods to move freely, and refrain
from coercion or constraint of liberty beyond the extent necessary to protect and maintain liberty
itself.
Range and level of freedom is as follows:
• 80-100 means the country is economically free;
• 70-79.9 mens the country is mostly free;
• 60-69.9 means the country is moderately free;
• 50-59.9 means the country is mostly unfree; and
• 0-49.9 means the country is repressed.
Table 13 below illustrates Tanzania’s economic freedom index from 2015 to 2019.
Table 13: Tanzania Economic Freedom Index
YEAR VALUE CHANGE, %
2015 57,5 -0,5%
2016 58,5 1,7%
2017 58,6 0,2%
2018 59,9 2,2%
2019 60,2 0,5%
Source: https://knoema.com/atlas/ranks/Index-of-economic-freedom?baseRegion=TZ
Tanzania’s economic freedom score increased consecutively during the review period where a
1,7% increase was recorded from 2015, scoring 57,5 to an increase in 2016 to a score of 58,5.
From 2016 to 2017, the was a slight surge of 0,2% while in 2018, about 2,2% increase was realised
to 59,9 from 58,6 in 2017.
Tanzania’s economic freedom score in 2019 was 60,2, making its economy the 93rd freest in the
2019 Index. Its overall score has increased by 4,7% from 2014 (57,5), with a minimal improvement
in monetary freedom, business freedom, and labour freedom overwhelming an improvement in
judicial effectiveness. Tanzania is ranked 7th among 47 countries in the Sub-Saharan Africa region,
and its overall score is above the regional average but below the regional and world averages as
shown in Figure 14 below.
Figure 14: Tanzania Economic Freedom Index, 2015-2019
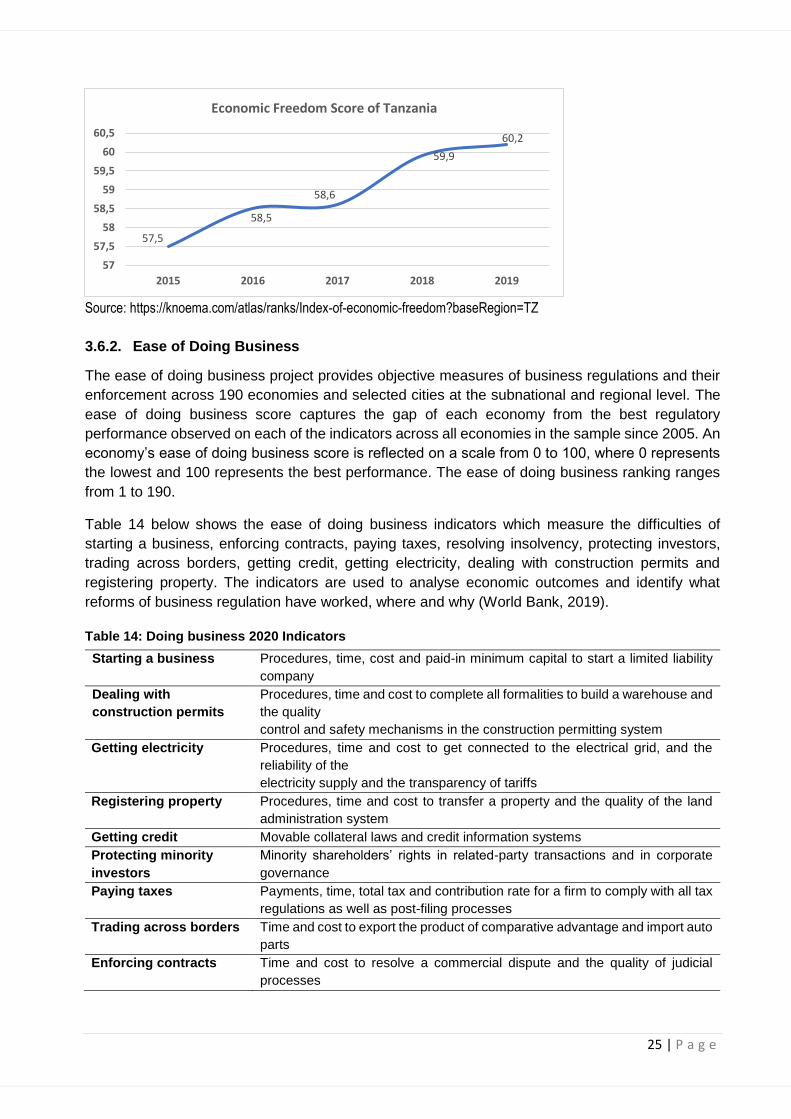
25 | P a g e
Source: https://knoema.com/atlas/ranks/Index-of-economic-freedom?baseRegion=TZ
3.6.2. Ease of Doing Business
The ease of doing business project provides objective measures of business regulations and their
enforcement across 190 economies and selected cities at the subnational and regional level. The
ease of doing business score captures the gap of each economy from the best regulatory
performance observed on each of the indicators across all economies in the sample since 2005. An
economy’s ease of doing business score is reflected on a scale from 0 to 100, where 0 represents
the lowest and 100 represents the best performance. The ease of doing business ranking ranges
from 1 to 190.
Table 14 below shows the ease of doing business indicators which measure the difficulties of
starting a business, enforcing contracts, paying taxes, resolving insolvency, protecting investors,
trading across borders, getting credit, getting electricity, dealing with construction permits and
registering property. The indicators are used to analyse economic outcomes and identify what
reforms of business regulation have worked, where and why (World Bank, 2019).
Table 14: Doing business 2020 Indicators
Starting a business
Procedures, time, cost and paid-in minimum capital to start a limited liability
company
Dealing with
construction permits
Procedures, time and cost to complete all formalities to build a warehouse and
the quality
control and safety mechanisms in the construction permitting system
Getting electricity Procedures, time and cost to get connected to the electrical grid, and the
reliability of the
electricity supply and the transparency of tariffs
Registering property Procedures, time and cost to transfer a property and the quality of the land
administration system
Getting credit Movable collateral laws and credit information systems
Protecting minority
investors
Minority shareholders’ rights in related-party transactions and in corporate
governance
Paying taxes Payments, time, total tax and contribution rate for a firm to comply with all tax
regulations as well as post-filing processes
Trading across borders Time and cost to export the product of comparative advantage and import auto
parts
Enforcing contracts Time and cost to resolve a commercial dispute and the quality of judicial
processes
57,5
58,5
58,6
59,9
60,2
57
57,5
58
58,5
59
59,5
60
60,5
2015 2016 2017 2018 2019
Economic Freedom Score of Tanzania
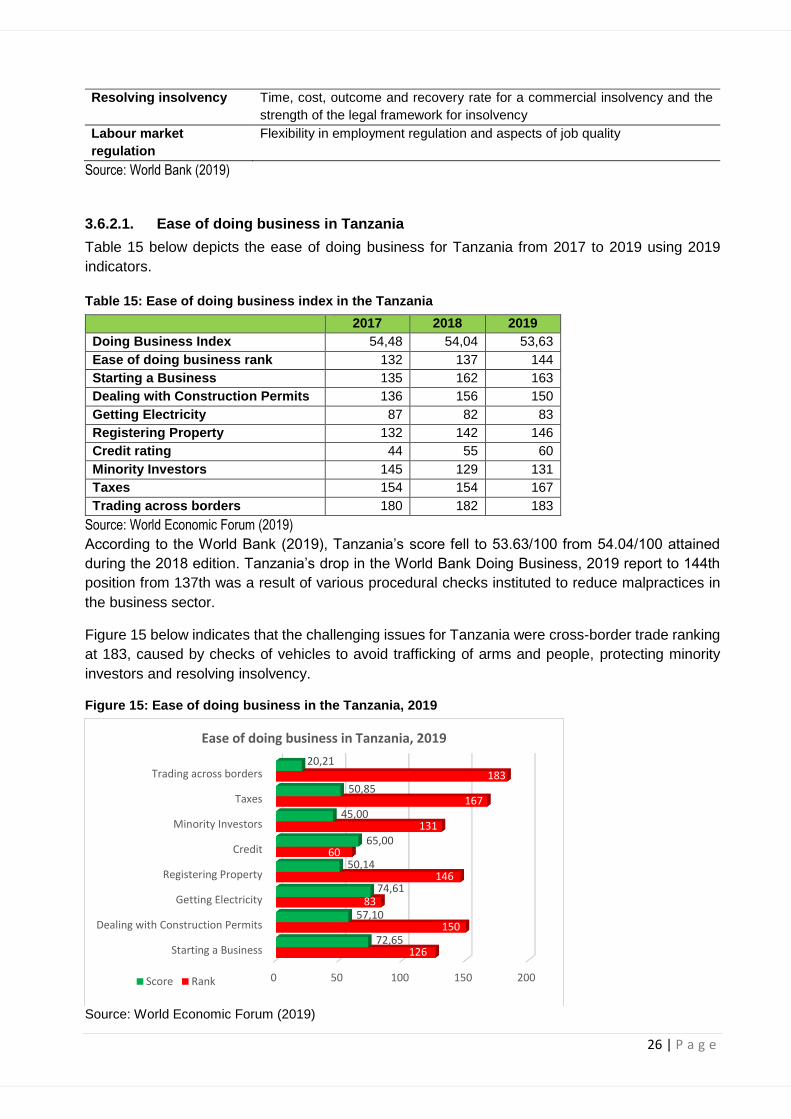
26 | P a g e
Resolving insolvency Time, cost, outcome and recovery rate for a commercial insolvency and the
strength of the legal framework for insolvency
Labour market
regulation
Flexibility in employment regulation and aspects of job quality
Source: World Bank (2019)
3.6.2.1. Ease of doing business in Tanzania
Table 15 below depicts the ease of doing business for Tanzania from 2017 to 2019 using 2019
indicators.
Table 15: Ease of doing business index in the Tanzania
2017 2018 2019
Doing Business Index 54,48 54,04 53,63
Ease of doing business rank 132 137 144
Starting a Business 135 162 163
Dealing with Construction Permits 136 156 150
Getting Electricity 87 82 83
Registering Property 132 142 146
Credit rating 44 55 60
Minority Investors 145 129 131
Taxes 154 154 167
Trading across borders 180 182 183
Source: World Economic Forum (2019)
According to the World Bank (2019), Tanzania’s score fell to 53.63/100 from 54.04/100 attained
during the 2018 edition. Tanzania’s drop in the World Bank Doing Business, 2019 report to 144th
position from 137th was a result of various procedural checks instituted to reduce malpractices in
the business sector.
Figure 15 below indicates that the challenging issues for Tanzania were cross-border trade ranking
at 183, caused by checks of vehicles to avoid trafficking of arms and people, protecting minority
investors and resolving insolvency.
Figure 15: Ease of doing business in the Tanzania, 2019
Source: World Economic Forum (2019)
0 50 100 150 200
Starting a Business
Dealing with Construction Permits
Getting Electricity
Registering Property
Credit
Minority Investors
Taxes
Trading across borders
126
150
83
146
60
131
167
183
72,65
57,10
74,61
50,14
65,00
45,00
50,85
20,21
Ease of doing business in Tanzania, 2019
Score Rank

27 | P a g e
It can be deducted that:
• Tanzania did not perform well on paying taxes (ranking 167) due to the fact that many
businesses are informal with owners who consider taxes as a nuisance and not obligation;
• Tanzania performed poorly in cross-border trade, scoring 20.21/100, followed by resolving
insolvency at 39.04/100 and protecting minority investors in which it scored 45/100;
• Tanzania performed slightly better in starting business, getting electricity, getting credit,
enforcing contracts, paying taxes, registering property and construction permits by scoring
more than 50%; and
• Additionally, export and import procedures and infrastructure were improved as well as
constructing One Stop Border Posts (OSBPs) to ease procedures and save time. Finally,
the government of Tanzania must implement plans and policies, which include reducing fees
and taxes and reducing delays in business transactions to address these challenges.
3.6.2.2. Ease of doing business in the EAC region
In the East African region, Tanzania was fourth, ranking 144 out of 190 economies. Rwanda is on
top after being ranked 29th globally, followed by Kenya which is ranked 61st. Uganda came third in
the region after being ranked 127th globally, while South Sudan and Burundi were at the bottom on
185th and 168th respectively as shown in Figure 16 below.

28 | P a g e
Figure 16: Ease of doing business in the EAC Region, 2019
Source: World Economic Forum (2019)
3.6.3. Global Competitiveness Index
The Global Competitiveness Index (GCI) is a global system that ranks countries in terms of
economic competitiveness in the world. The World Economic Forum defines competitiveness as
the ability of the country and its institutions to ensure stable economic growth, which would be stable
in the medium term. The index is composed of twelve pillars of competitiveness. They
are Institutions, Infrastructure, Macroeconomic Stability, Health and Primary Education, Higher
Education and Training, Goods Market Efficiency, Labour Market Efficiency, Financial Market
Sophistication, Technological Readiness, Market Size, Business Sophistication, Innovation.
Figure 17 displays Global Competitiveness Index (GCI), and indicates a decline in Tanzania's over-
all ranking from 116 out of 140 nations in 2018, to position 117 out 141 nations in 2019. Tanzania
scored 48.19 points out of 100 on the 2019 Global Competitiveness Report meaning that the global
competitiveness of the country depreciated by 0,98 from 2018 score of 47,21 in 2019.
Since 2016, Tanzania has improved the global competitiveness from 120 to 117 in 2019 and the
score also enhanced from 50,99 to 47,21 in 2019, as shown in Figure 17 below
Figure 17: Global Competitiveness Index of Tanzania
Source: World Economic Forum (2019)
29
61
127
144
168
185
119
77,88
70,31
57,06
53,63
47,41
35,34
56,94
0 50 100 150 200
Rwanda
Kenya
Uganda
Tanzania
Burundi
South Sudan
EAC Region
EAC regional ease of doing business, 2019
Score Rank
120113
116 117
50,99 53,00 47,21 48,19
0
20
40
60
80
100
120
2016 2017 2018 2019
Global Competitiveness index of Tanzania
Rank Index
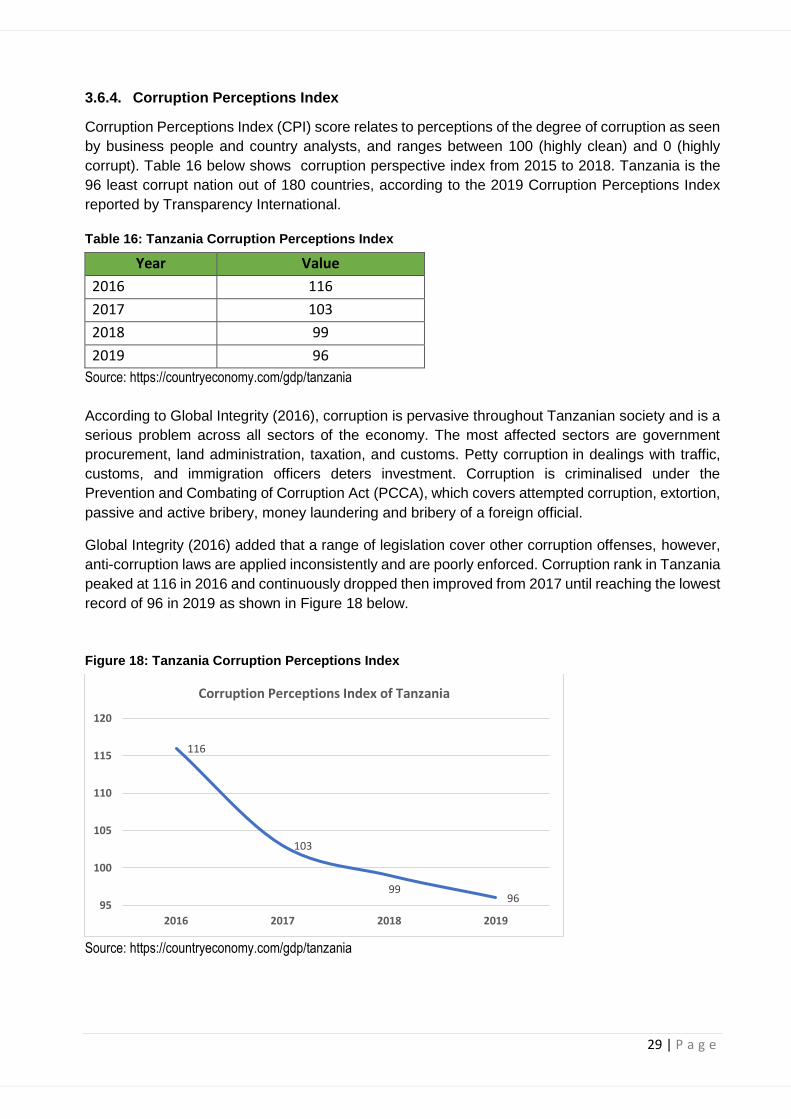
29 | P a g e
3.6.4. Corruption Perceptions Index
Corruption Perceptions Index (CPI) score relates to perceptions of the degree of corruption as seen
by business people and country analysts, and ranges between 100 (highly clean) and 0 (highly
corrupt). Table 16 below shows corruption perspective index from 2015 to 2018. Tanzania is the
96 least corrupt nation out of 180 countries, according to the 2019 Corruption Perceptions Index
reported by Transparency International.
Table 16: Tanzania Corruption Perceptions Index
Year Value
2016 116
2017 103
2018 99
2019 96
Source: https://countryeconomy.com/gdp/tanzania
According to Global Integrity (2016), corruption is pervasive throughout Tanzanian society and is a
serious problem across all sectors of the economy. The most affected sectors are government
procurement, land administration, taxation, and customs. Petty corruption in dealings with traffic,
customs, and immigration officers deters investment. Corruption is criminalised under the
Prevention and Combating of Corruption Act (PCCA), which covers attempted corruption, extortion,
passive and active bribery, money laundering and bribery of a foreign official.
Global Integrity (2016) added that a range of legislation cover other corruption offenses, however,
anti-corruption laws are applied inconsistently and are poorly enforced. Corruption rank in Tanzania
peaked at 116 in 2016 and continuously dropped then improved from 2017 until reaching the lowest
record of 96 in 2019 as shown in Figure 18 below.
Figure 18: Tanzania Corruption Perceptions Index
Source: https://countryeconomy.com/gdp/tanzania
116
103
9996
95
100
105
110
115
120
2016 2017 2018 2019
Corruption Perceptions Index of Tanzania
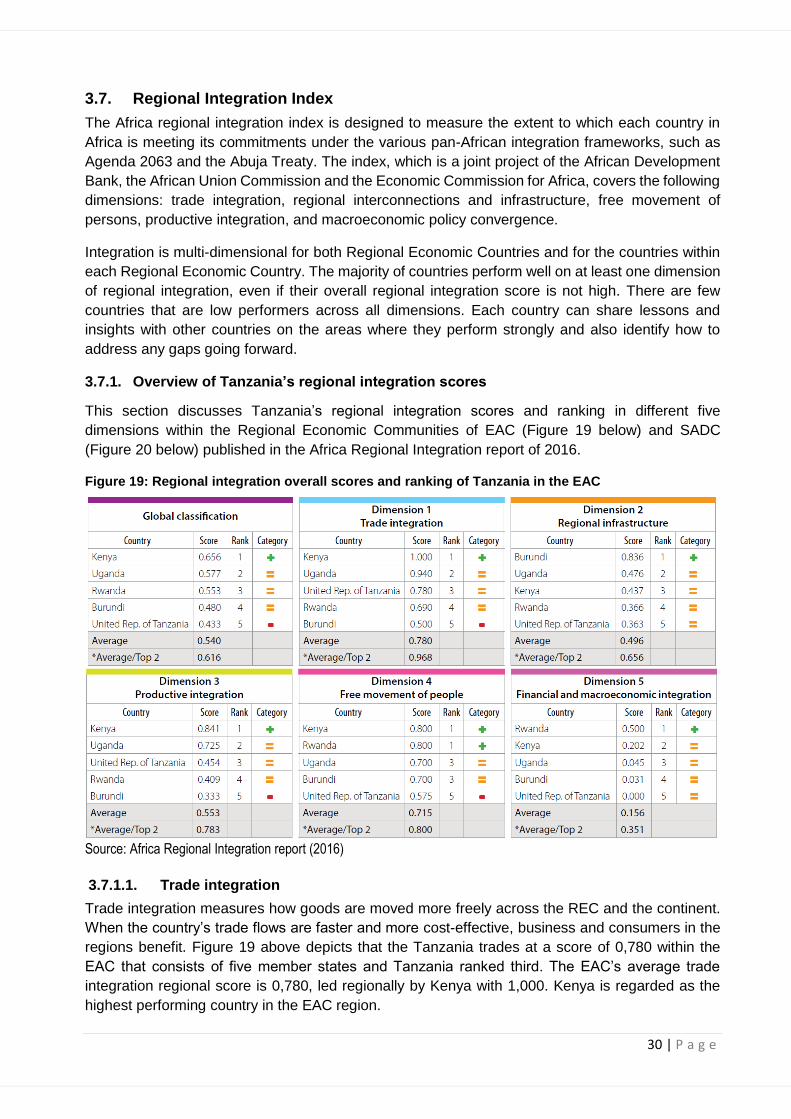
30 | P a g e
3.7. Regional Integration Index
The Africa regional integration index is designed to measure the extent to which each country in
Africa is meeting its commitments under the various pan-African integration frameworks, such as
Agenda 2063 and the Abuja Treaty. The index, which is a joint project of the African Development
Bank, the African Union Commission and the Economic Commission for Africa, covers the following
dimensions: trade integration, regional interconnections and infrastructure, free movement of
persons, productive integration, and macroeconomic policy convergence.
Integration is multi-dimensional for both Regional Economic Countries and for the countries within
each Regional Economic Country. The majority of countries perform well on at least one dimension
of regional integration, even if their overall regional integration score is not high. There are few
countries that are low performers across all dimensions. Each country can share lessons and
insights with other countries on the areas where they perform strongly and also identify how to
address any gaps going forward.
3.7.1. Overview of Tanzania’s regional integration scores
This section discusses Tanzania’s regional integration scores and ranking in different five
dimensions within the Regional Economic Communities of EAC (Figure 19 below) and SADC
(Figure 20 below) published in the Africa Regional Integration report of 2016.
Figure 19: Regional integration overall scores and ranking of Tanzania in the EAC
Source: Africa Regional Integration report (2016)
3.7.1.1. Trade integration
Trade integration measures how goods are moved more freely across the REC and the continent.
When the country’s trade flows are faster and more cost-effective, business and consumers in the
regions benefit. Figure 19 above depicts that the Tanzania trades at a score of 0,780 within the
EAC that consists of five member states and Tanzania ranked third. The EAC’s average trade
integration regional score is 0,780, led regionally by Kenya with 1,000. Kenya is regarded as the
highest performing country in the EAC region.
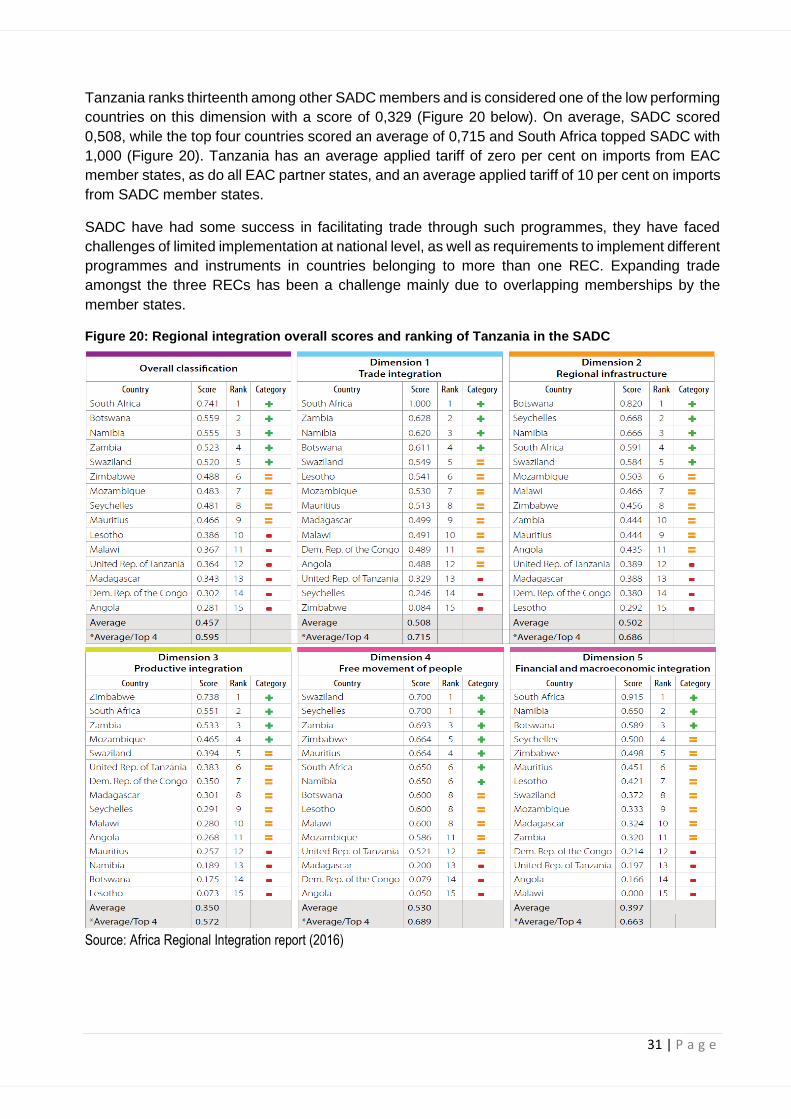
31 | P a g e
Tanzania ranks thirteenth among other SADC members and is considered one of the low performing
countries on this dimension with a score of 0,329 (Figure 20 below). On average, SADC scored
0,508, while the top four countries scored an average of 0,715 and South Africa topped SADC with
1,000 (Figure 20). Tanzania has an average applied tariff of zero per cent on imports from EAC
member states, as do all EAC partner states, and an average applied tariff of 10 per cent on imports
from SADC member states.
SADC have had some success in facilitating trade through such programmes, they have faced
challenges of limited implementation at national level, as well as requirements to implement different
programmes and instruments in countries belonging to more than one REC. Expanding trade
amongst the three RECs has been a challenge mainly due to overlapping memberships by the
member states.
Figure 20: Regional integration overall scores and ranking of Tanzania in the SADC
Source: Africa Regional Integration report (2016)
32 | P a g e
3.7.1.2. Regional infrastructure
Regional infrastructure measures infrastructure development across the region or the continent by
means of highways being built across borders, flights taking passengers from one capital to
another, electricity connectivity, water and sanitation, more people on mobile phones on city streets
and at rural outposts. Figure 19 above defines that in the EAC, Tanzania has average regional
infrastructure score of 0,363, ranking fifth overall. In terms of regional infrastructure, Tanzania is the
lowest performing country in the EAC region. Burundi leads in this dimension with 0,836 while the
average score of the top two countries is 0,496 (Appendix 1).
Figure 20 above shows that out of 15 SADC member states, the Tanzania ranks number 12 with a
regional infrastructure score of 0.389 while the average regional infrastructure score is 0,502.
Botswana topped this dimension with 0,820.
3.7.1.3. Productive integration
Productive integration matters mainly in creation of an economic base that is more resilient to
shocks and is more diverse. It also caters for building a more skilled regional labour force that adds
value to goods and services while raising people’s incomes on the ground. That includes
opportunities in mining and manufacturing that are now shifting to Africa’s advantage.
Figure 19 above shows that the Tanzania is ranking third in the EAC region with productive
integration score of 0,454 while the EAC’s average productive integration score is 0,553. Kenya is
leading in this regional dimension with 0,841.
In terms of productive integration, SADC region performed at an average score of 0,350, with
Tanzania performing slightly higher at a score of 0,383 occupying position six out of fifteen member
states (Figure 20). This productive integration in the REC is led by Zimbabwe with 0,738. The low
performing score of the REC is due to weak productive capacity in the SADC region and in Africa,
high production costs, large infrastructure deficits and other challenges that affect SADC and
Africa’s competitiveness.
3.7.1.4. Free movement of people
Free Movement of People dimension matters when people travel with ease for business, tourism or
education, and everyone benefits from opening up of borders. This free movement of people across
RECs or Africa signifies an influential boost to economic growth and skills development. Gor (2017)
adds that the Free Movement of People dimension has three indicators, namely: the proportion of
REC member countries whose nationals do not require a visa for entry, ratification (or not) of REC
protocol on free movement of persons, and the proportion of REC member countries whose
nationals are issued with a visa on arrival.
Free movement of people within EAC averaged about 0,715 and the Tanzania ranked fifth with the
score of 0,575 whereas Kenya and Rwanda ranked first position scoring 0,800 each (Figure 19).
Hofmeijer (2019) stated that as the region intensifies efforts to achieve its integration milestones,
specifically within the context of the EAC Common Market Protocol, cross-border labour movements
have made labour migration a pertinent issue for the partner states.
The East African Common Market Protocol provides for the movement of persons, travel
documents and the free movement of workers in particular. It focuses on three migration issues:
national policy frameworks, data management and migrant worker practices (Hofmeijer, 2019).
33 | P a g e
Free movement of people in the SADC region averaged about 0.530 and the Tanzania ranks twelfth
with a score of 0,521. eSwatini in this dimension leads the region with a score of 0.700 (Figure 20
above). Many governments within SADC are reluctant to delegate power to regional, supranational
arrangement as it challenges the role of the state. Meanwhile, the dominance of relatively more
developed states such as South Africa, Namibia and Botswana, who prefer to pursue bilateral
agreements with their key labour supplying partners, has made free movement a difficult issue
within the region.
3.7.1.5. Financial and macroeconomic integration
Financial and Macroeconomic Integration dimension is built up of two indicators namely; the
regional convertibility of national currencies and the Harmonised Consumer Price Index (HCPI)
based inflation rate differential. Figure 19 portrays that EAC has average financial and
macroeconomic integration score of 0,156 with Tanzania ranking fifth at a score of 0,000 while
Rwanda was best performer in the East African Community region with a score 0,500.
Regarding the financial and macroeconomic integration in the SADC region, Tanzania ranked
thirteenth with a score of 0,197 falling under the lowest performing countries while the SADC region
registered an average score of 0.397. South Africa topped with a score of 0.915 (Figure 20 above).
Economically powerful countries are not necessarily better integrated in their RECs, with the
exception of South Africa in the SADC region. There is a strong potential for the Tanzania to
integrate more within their RECs by steering their economies towards the region.
3.7.2. Regional Integration Index overall in countries by Regional Economic Community
Figure 21 below illustrates the progress being made on Regional Economic Community’s (REC’s)
regional integration agendas. The RECs score highly on areas that they have prioritised on regional
integration to date.
3.7.2.1. East African Community (EAC)
The East African Community (EAC) is a regional intergovernmental organisation consisting of the
five East African countries of Burundi, Kenya, Rwanda, Uganda and Tanzania. Figure 21 illustrates
that Tanzania ranked fifth with the overall regional integration index score of 0.433 that positions it
in the lowest performing countries rank in the EAC region. Kenya recorded first in EAC regional
integration with a score of 0.841, which was higher than the EAC’s average score of 0.540 and
above the top 2 EAC member states’ score of 0.616.
3.7.2.2. Southern African Development Community (SADC)
Wtithin the SADC’s fifteen member states under study, the Tanzania ranked twelfth in the overall
REC regional integration index with a score of 0.364, followed by Madagascar with 0,343, thus
placing the Tanzania amongst the lowest performing countries in the SADC region (Figure 21
below). South Africa led the list with a score of 0,741, placing it above the overall SADC average
score of 0.457 and above the average of the four leading SADC member states’ score of 0,597.
South Africa also represents 61% of regional GDP.
The overall SADC regional integration index including 5 dimensions during the 2016 publication
were as follows: trade integration = 0,508; regional infrastructure = 0,502; productive integration =
0,350; free movement of people = 0,530; and financial and macroeconomic integration = 0,397.
Therefore, the average SADC regional integration index was 0,457 which is an average
performance of the REC (Figure 20).
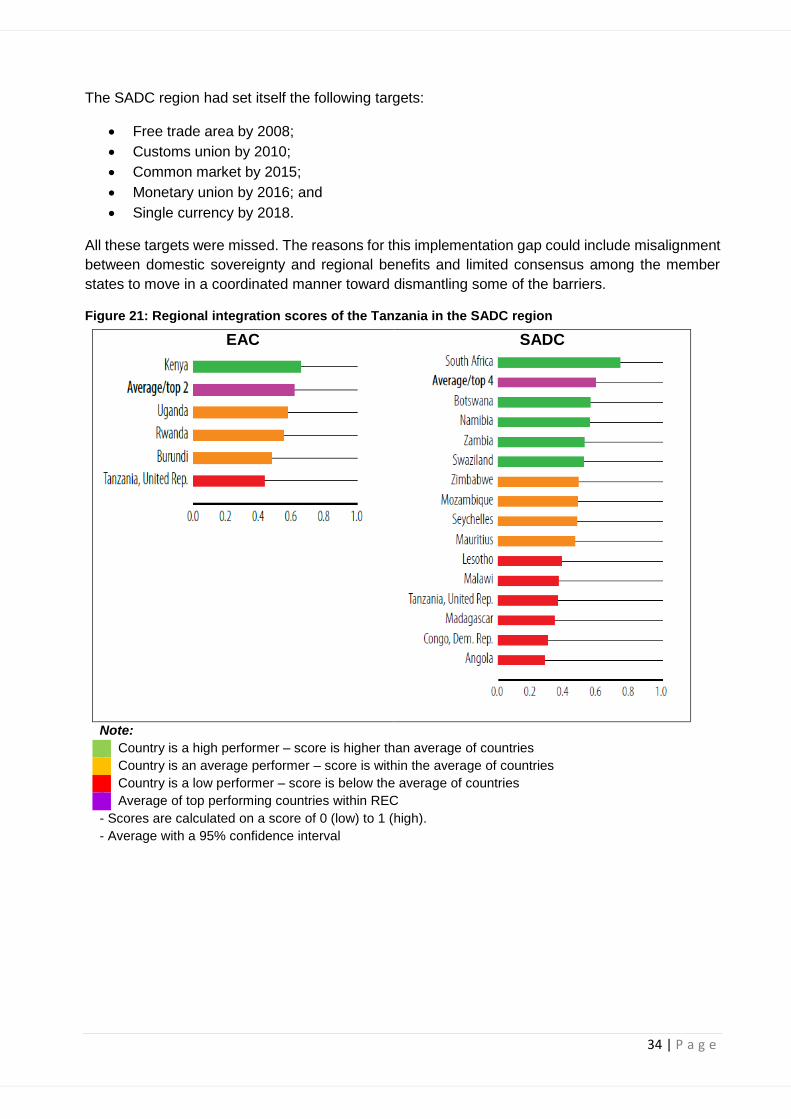
34 | P a g e
The SADC region had set itself the following targets:
• Free trade area by 2008;
• Customs union by 2010;
• Common market by 2015;
• Monetary union by 2016; and
• Single currency by 2018.
All these targets were missed. The reasons for this implementation gap could include misalignment
between domestic sovereignty and regional benefits and limited consensus among the member
states to move in a coordinated manner toward dismantling some of the barriers.
Figure 21: Regional integration scores of the Tanzania in the SADC region
EAC SADC
Note:
Country is a high performer – score is higher than average of countries
Country is an average performer – score is within the average of countries
Country is a low performer – score is below the average of countries
Average of top performing countries within REC
- Scores are calculated on a score of 0 (low) to 1 (high).
- Average with a 95% confidence interval
35 | P a g e
4. TRANSPORT ENVIRONMENT
4.1. Overview
Tanzania’s national development strategy identifies the need for extensive and efficient transport
infrastructure to support economic growth as a key priority. The government of Tanzania has
formulated legal, regulatory and institutional framework to guide and regulate all transport sub
sectors for sustainable operations in the transport system in the country. Tanzania’s transport sector
plays a critical role in the growth of the Tanzanian economy as it facilitates domestic and
international trade, contributes to national integration, and provides access to jobs, health,
education and other essential facilities. Further to economic benefits, Tanzania serves as the
international gateway for several of its landlocked neighbouring countries. Burundi, Rwanda,
Uganda, DRC, Zambia and Malawi are all dependent to some extent on Tanzania’s extensive land
transport network for access to local and global markets.
4.2. Transport Infrastructure
The transport system in Tanzania consists of five modes, namely roads, rail, water, air and
pipelines. The road network in Tanzania comprises around 86,472 km of roads, 12,786 km of which
are trunk roads and 21,105 km regional roads. The remaining 52,581 km are district, urban and
feeder roads under the responsibility of the Prime Minister’s Office Regional Administration and
local government. Road transport in Tanzania faces different problems which include insufficient
funds for construction and rehabilitation, upgrading for routine maintenance, high accident rate and
weak institutional coordination.
Railway transport is the second most important mode of transport after road transport and critical
for long distance freight along the main transport corridors in Tanzania. Tanzania has a total of
3,676 km of railway lines operated by two railway systems, named Tanzania Railways Corporation
(TRC) and Tanzania-Zambia Railways (TAZARA). The mainline of TRC comprises the central
corridor between the port of Dar es Salaam in the east, linking central and western areas of the
country and terminating at Kigoma on Lake Tanganyika in the west. The TAZARA line is 1,860 km
in length, 975 km of which is in Tanzania and 885 km in Zambia.
((https://www.tanzaniainvest.com/transport)
There are 58 airports and more than 300 private airstrips in Tanzania owned by mining companies
and tour operators. The Julius Nyerere International Airport (JNIA) located in Dar es Salaam is the
largest and busiest airport in Tanzania, accounting for over 70% of Tanzania’s air passengers and
around 80% of the country’s cargo capacity. (https://www.tanzaniainvest.com/transport).
Tanzania has a coastline of about 720 km on the Indian Ocean, and also borders Lake Victoria,
Lake Nyasa, and Lake Tanganyika. Both sea and inland waterways ports in Tanzania are managed
and operated by the Tanzania Ports Authority (TPA). The TPA’s main Indian Ocean ports are Dar
es Salaam, Mtwara, and Tanga. Minor seaports serving coastal traffic include Lindi, Kilwa Masoko,
Mafia Island, Bagamoyo, Pangani and Kwale. Dar es Salaam is the Tanzania’s principal port with
a capacity of around 10.1 million tons per year and handling around 92% of the total maritime ports’
throughput. The port of Dar es Salaam also serves the land-locked countries of Malawi, Zambia,
DRC, Rwanda, Burundi and Uganda through two railway systems, the road network and the
TAZAMA oil pipeline that runs between Zambia and Tanzania. TPA also operates Tanzania’s lake
ports. Other Tanzanian seaports include Bukoba, Kemondo Bay, Musoma and Nansio.
(https://www.tanzaniainvest.com/transport).

36 | P a g e
4.3. Distance Matrix
Table 17 below shows the distance matrix of Tanzania from Dar-es-Salaam to other major cities.
The distance matrix shows the distance between cities by road .
Table 17: Distance Matrix from Dar-es-Salaam to Major Towns (km)
Dodoma Dar Kigoma Mwanza Arusha Mbeya Tanga Mtwara
Dodoma - 451 807 594 425 594 588 1007
Dar 451 - 1258 1152 646 822 354 556
Kigoma 807 1258 - 633 1090 860 1525 1814
Mwanza 594 1152 633 - 787 924 1222 1708
Arusha 425 646 1090 787 - 1020 435 1202
Mbeya 594 822 860 924 1020 - 959 1122
Tanga 588 354 1525 1222 435 959 - 910
Mtwara 1007 556 1814 1708 1202 1122 910
Source: https://dlca.logcluster.org/display/public/DLCA/2.3+Tanzania+Road+Network
The statistics in Table 17 above reveal that Tanzania is a big country. Long travel distances between
major towns require efficient land transport infrastructure and systems to lower transportation costs.
Unfortunately a large proportion of the country’s transport infrastructure / rolling stock were not
maintained or modernised over the years due to limited financial resourcs. On-going transport and
economic reforms seek to restore transport infrastructure and systems, while also addressing non-
tariff barriers to trade.
4.4. Road Safety and Security
Road safety is an emerging issue in Tanzania as the growth in the vehicle fleet is rapidly increasing.
According to the latest World Health Organisation (WHO) data published in 2017, fatalities from
road traffic accidents in Tanzania reached 17,840 or 4.78% of total deaths
(https://www.worldlifeexpectancy.com/tanzania-road-traffic-accidents).
An examination of police accident data indicates that the greatest proportion of fatalities involves
pedestrians and that around one-third of passenger fatalities is attributed to the common practice
of carrying passengers in the rear of trucks and pick-ups. Another noticable trend is the large
number of non-motorised fatalities (e.g. pedestrians and cyclists) of total fatalities and the rapidly
increasing trend in motorcycle deaths. The latter is primarily due to a steady increase in the
ownership of motorcycles.
In order to improve road safety, government has implemented a comprehensive road safety
programme that incorporates a points penalty system and straight arraignment of recless drivers.
The payment of fines depend on the offence committed. Furthermore, a maximum speed limit of
50 km per hours are enforced on all highways that approach main towns and villages. This affects
the total travel time as speed limit(s) is strictly enforced.
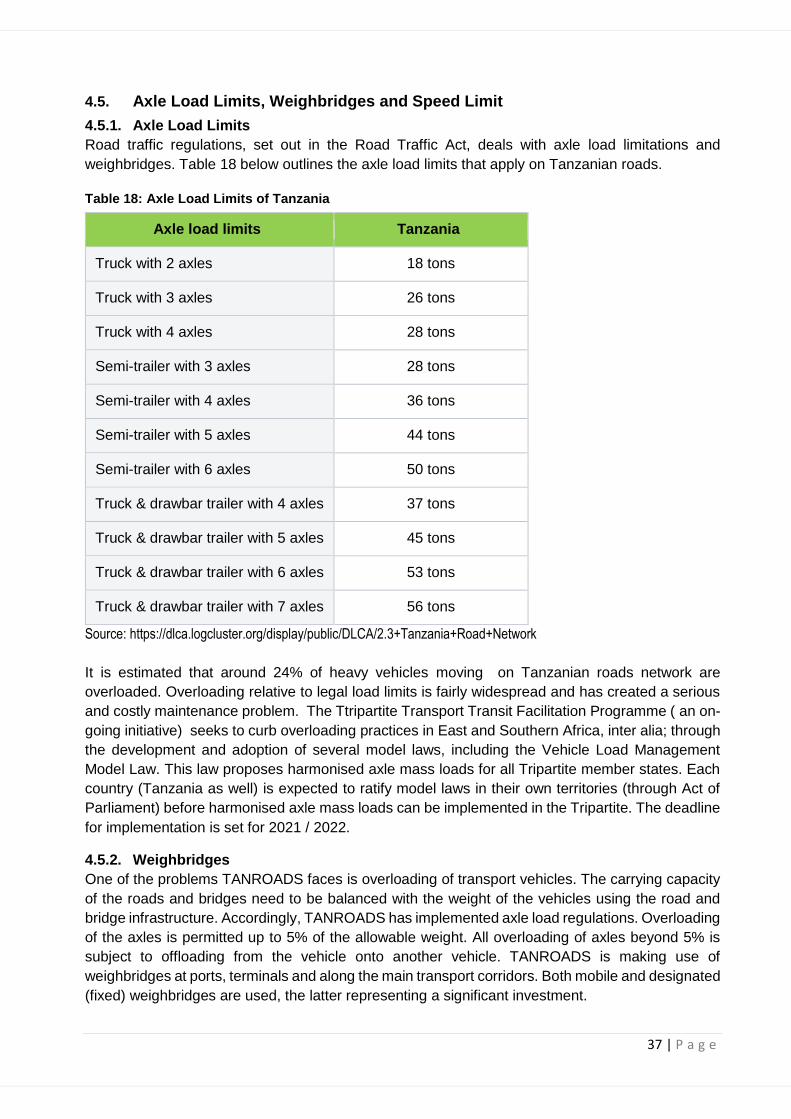
37 | P a g e
4.5. Axle Load Limits, Weighbridges and Speed Limit
4.5.1. Axle Load Limits
Road traffic regulations, set out in the Road Traffic Act, deals with axle load limitations and
weighbridges. Table 18 below outlines the axle load limits that apply on Tanzanian roads.
Table 18: Axle Load Limits of Tanzania
Axle load limits Tanzania
Truck with 2 axles 18 tons
Truck with 3 axles 26 tons
Truck with 4 axles 28 tons
Semi-trailer with 3 axles 28 tons
Semi-trailer with 4 axles 36 tons
Semi-trailer with 5 axles 44 tons
Semi-trailer with 6 axles 50 tons
Truck & drawbar trailer with 4 axles 37 tons
Truck & drawbar trailer with 5 axles 45 tons
Truck & drawbar trailer with 6 axles 53 tons
Truck & drawbar trailer with 7 axles 56 tons
Source: https://dlca.logcluster.org/display/public/DLCA/2.3+Tanzania+Road+Network
It is estimated that around 24% of heavy vehicles moving on Tanzanian roads network are
overloaded. Overloading relative to legal load limits is fairly widespread and has created a serious
and costly maintenance problem. The Ttripartite Transport Transit Facilitation Programme ( an on-
going initiative) seeks to curb overloading practices in East and Southern Africa, inter alia; through
the development and adoption of several model laws, including the Vehicle Load Management
Model Law. This law proposes harmonised axle mass loads for all Tripartite member states. Each
country (Tanzania as well) is expected to ratify model laws in their own territories (through Act of
Parliament) before harmonised axle mass loads can be implemented in the Tripartite. The deadline
for implementation is set for 2021 / 2022.
4.5.2. Weighbridges
One of the problems TANROADS faces is overloading of transport vehicles. The carrying capacity
of the roads and bridges need to be balanced with the weight of the vehicles using the road and
bridge infrastructure. Accordingly, TANROADS has implemented axle load regulations. Overloading
of the axles is permitted up to 5% of the allowable weight. All overloading of axles beyond 5% is
subject to offloading from the vehicle onto another vehicle. TANROADS is making use of
weighbridges at ports, terminals and along the main transport corridors. Both mobile and designated
(fixed) weighbridges are used, the latter representing a significant investment.

38 | P a g e
Weigbridges are unevenly spread throughout Tanzania (Table 19 below). The following
weighbridges are located along the Central Corridor that connects the port of Dar-es-Salaam with
neighbouring countries: Vigwaza, Njuki, Nyakahura, Mikese, Kihonda, Nala, Mwendakulima,
Kyamyolwa and Mutukula. Transit time along the Central Corridor has reduced significantly since
the launch of a directive in 2016 that permit transit trucks to stop at three weighbridges only.
Table 19: Tanzania’s Weigbridge Information
Name Type Region
Vigwaza Fixed (multi deck) and weigh-in-motion Coast
Mkuranga Fixed – single axle weigher Coast
Makofia Fixed Coast
Mikese 1 Fixed and weigh-in-motion Morogoro
Mikese 2 Fixed – single axle weigher Morogoro
Mikumi Fixed Morogoro
Kihonda Fixed – single axle weigher Morogoro
Nala Fixed Dodoma
Njuki Fixed Singida
Tinde Fixed Shinyanga
Mwendakulima Fixed Shinyanga
Usagara Fixed Mwanza
Sirari Fixed Mara
Nyakahura Fixed Kagera
Mutukula Fixed Kagera
Kyamyorwa Fixed Kagera
Kyaka Fixed – single axle weigher Kagera
Wenda Fixed Iringa
Makambako Fixed Njombe
Uyole Fixed – single axle weigher Mbeya
Source: https://www.tanroads.go.tz/weighbridges
4.5.3. Road Speed limit
There are three general speed limits stipulated by law: according to Section 51 of the Road Traffic
Act of 1973:
• The speed limit for the vehicles with more than 3.5 tonnes is 80 km/h;
• For lorries and buses, the general speed limit on all road types, except on urban roads, is
80 km/h; and
• In built-up areas, the speed limit is according to the Act 50 km/h for all vehicles but may
occasionally locally be set at 60 km/h.
In urban areas where signed speed limits are set by the road authority, the location and signage of
such speed limits lack consistency. There are long stretches of 50 km/h restrictions which do not
exhibit characteristics that would justify such a limit. It is often found within these extended sections
that the police undertake speed enforcement. Local speed limits at schools, for example, may be
used following careful consideration and could for instance be used at schools.
At both end of villages and end of local speed limits an End of Restriction sign (sign R600) should
be used as a rule. The speed limits set within the traffic laws are simple and functional however
they lack a maximum speed limit for private cars and vehicles under 3,5 tonnes, outside built-up
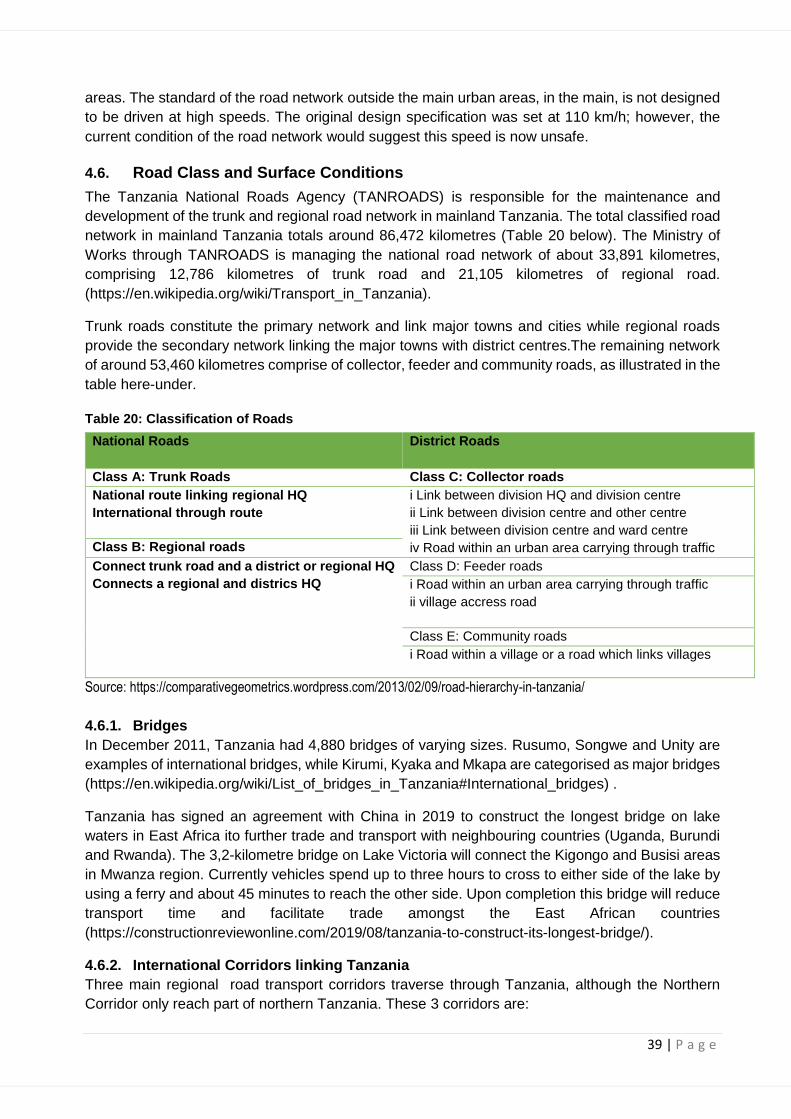
39 | P a g e
areas. The standard of the road network outside the main urban areas, in the main, is not designed
to be driven at high speeds. The original design specification was set at 110 km/h; however, the
current condition of the road network would suggest this speed is now unsafe.
4.6. Road Class and Surface Conditions
The Tanzania National Roads Agency (TANROADS) is responsible for the maintenance and
development of the trunk and regional road network in mainland Tanzania. The total classified road
network in mainland Tanzania totals around 86,472 kilometres (Table 20 below). The Ministry of
Works through TANROADS is managing the national road network of about 33,891 kilometres,
comprising 12,786 kilometres of trunk road and 21,105 kilometres of regional road.
(https://en.wikipedia.org/wiki/Transport_in_Tanzania).
Trunk roads constitute the primary network and link major towns and cities while regional roads
provide the secondary network linking the major towns with district centres.The remaining network
of around 53,460 kilometres comprise of collector, feeder and community roads, as illustrated in the
table here-under.
Table 20: Classification of Roads
National Roads
District Roads
Class A: Trunk Roads Class C: Collector roads
National route linking regional HQ
International through route
i Link between division HQ and division centre
ii Link between division centre and other centre
iii Link between division centre and ward centre
iv Road within an urban area carrying through traffic Class B: Regional roads
Connect trunk road and a district or regional HQ
Connects a regional and districs HQ
Class D: Feeder roads
i Road within an urban area carrying through traffic
ii village accress road
Class E: Community roads
i Road within a village or a road which links villages
Source: https://comparativegeometrics.wordpress.com/2013/02/09/road-hierarchy-in-tanzania/
4.6.1. Bridges
In December 2011, Tanzania had 4,880 bridges of varying sizes. Rusumo, Songwe and Unity are
examples of international bridges, while Kirumi, Kyaka and Mkapa are categorised as major bridges
(https://en.wikipedia.org/wiki/List_of_bridges_in_Tanzania#International_bridges) .
Tanzania has signed an agreement with China in 2019 to construct the longest bridge on lake
waters in East Africa ito further trade and transport with neighbouring countries (Uganda, Burundi
and Rwanda). The 3,2-kilometre bridge on Lake Victoria will connect the Kigongo and Busisi areas
in Mwanza region. Currently vehicles spend up to three hours to cross to either side of the lake by
using a ferry and about 45 minutes to reach the other side. Upon completion this bridge will reduce
transport time and facilitate trade amongst the East African countries
(https://constructionreviewonline.com/2019/08/tanzania-to-construct-its-longest-bridge/).
4.6.2. International Corridors linking Tanzania
Three main regional road transport corridors traverse through Tanzania, although the Northern
Corridor only reach part of northern Tanzania. These 3 corridors are:
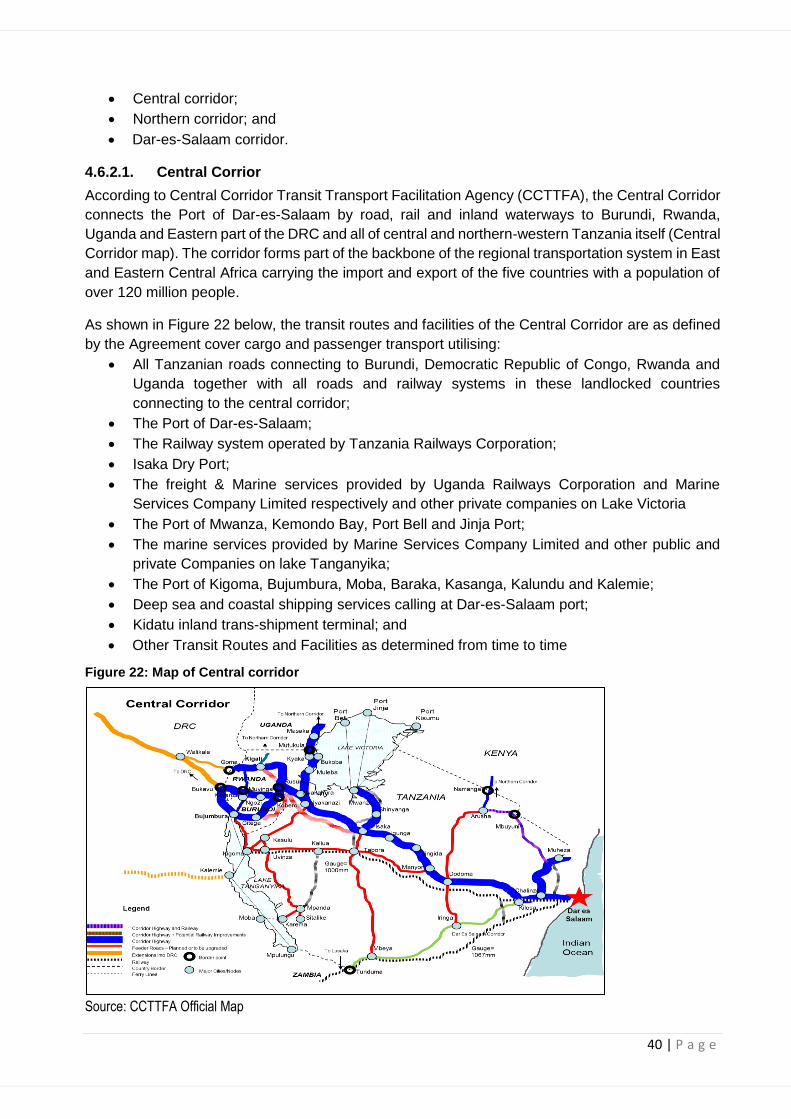
40 | P a g e
• Central corridor;
• Northern corridor; and
• Dar-es-Salaam corridor.
4.6.2.1. Central Corrior
According to Central Corridor Transit Transport Facilitation Agency (CCTTFA), the Central Corridor
connects the Port of Dar-es-Salaam by road, rail and inland waterways to Burundi, Rwanda,
Uganda and Eastern part of the DRC and all of central and northern-western Tanzania itself (Central
Corridor map). The corridor forms part of the backbone of the regional transportation system in East
and Eastern Central Africa carrying the import and export of the five countries with a population of
over 120 million people.
As shown in Figure 22 below, the transit routes and facilities of the Central Corridor are as defined
by the Agreement cover cargo and passenger transport utilising:
• All Tanzanian roads connecting to Burundi, Democratic Republic of Congo, Rwanda and
Uganda together with all roads and railway systems in these landlocked countries
connecting to the central corridor;
• The Port of Dar-es-Salaam;
• The Railway system operated by Tanzania Railways Corporation;
• Isaka Dry Port;
• The freight & Marine services provided by Uganda Railways Corporation and Marine
Services Company Limited respectively and other private companies on Lake Victoria
• The Port of Mwanza, Kemondo Bay, Port Bell and Jinja Port;
• The marine services provided by Marine Services Company Limited and other public and
private Companies on lake Tanganyika;
• The Port of Kigoma, Bujumbura, Moba, Baraka, Kasanga, Kalundu and Kalemie;
• Deep sea and coastal shipping services calling at Dar-es-Salaam port;
• Kidatu inland trans-shipment terminal; and
• Other Transit Routes and Facilities as determined from time to time
Figure 22: Map of Central corridor
Source: CCTTFA Official Map
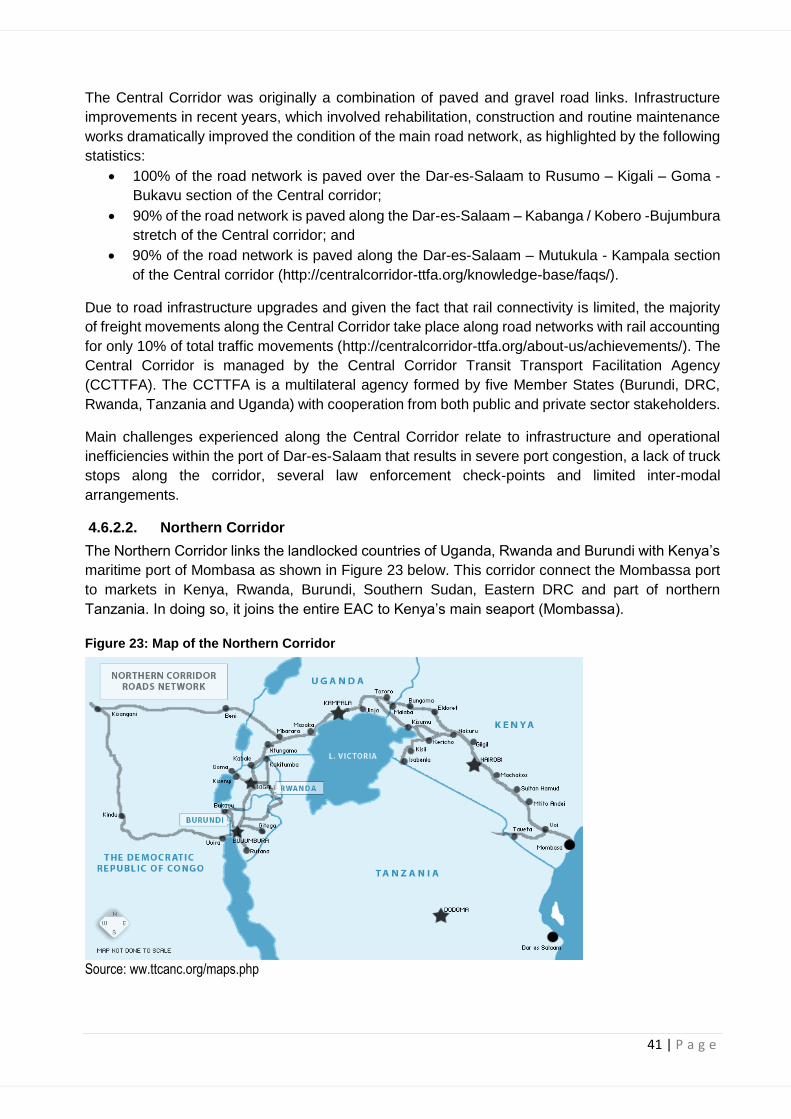
41 | P a g e
The Central Corridor was originally a combination of paved and gravel road links. Infrastructure
improvements in recent years, which involved rehabilitation, construction and routine maintenance
works dramatically improved the condition of the main road network, as highlighted by the following
statistics:
• 100% of the road network is paved over the Dar-es-Salaam to Rusumo – Kigali – Goma -
Bukavu section of the Central corridor;
• 90% of the road network is paved along the Dar-es-Salaam – Kabanga / Kobero -Bujumbura
stretch of the Central corridor; and
• 90% of the road network is paved along the Dar-es-Salaam – Mutukula - Kampala section
of the Central corridor (http://centralcorridor-ttfa.org/knowledge-base/faqs/).
Due to road infrastructure upgrades and given the fact that rail connectivity is limited, the majority
of freight movements along the Central Corridor take place along road networks with rail accounting
for only 10% of total traffic movements (http://centralcorridor-ttfa.org/about-us/achievements/). The
Central Corridor is managed by the Central Corridor Transit Transport Facilitation Agency
(CCTTFA). The CCTTFA is a multilateral agency formed by five Member States (Burundi, DRC,
Rwanda, Tanzania and Uganda) with cooperation from both public and private sector stakeholders.
Main challenges experienced along the Central Corridor relate to infrastructure and operational
inefficiencies within the port of Dar-es-Salaam that results in severe port congestion, a lack of truck
stops along the corridor, several law enforcement check-points and limited inter-modal
arrangements.
4.6.2.2. Northern Corridor
The Northern Corridor links the landlocked countries of Uganda, Rwanda and Burundi with Kenya’s
maritime port of Mombasa as shown in Figure 23 below. This corridor connect the Mombassa port
to markets in Kenya, Rwanda, Burundi, Southern Sudan, Eastern DRC and part of northern
Tanzania. In doing so, it joins the entire EAC to Kenya’s main seaport (Mombassa).
Figure 23: Map of the Northern Corridor
Source: ww.ttcanc.org/maps.php
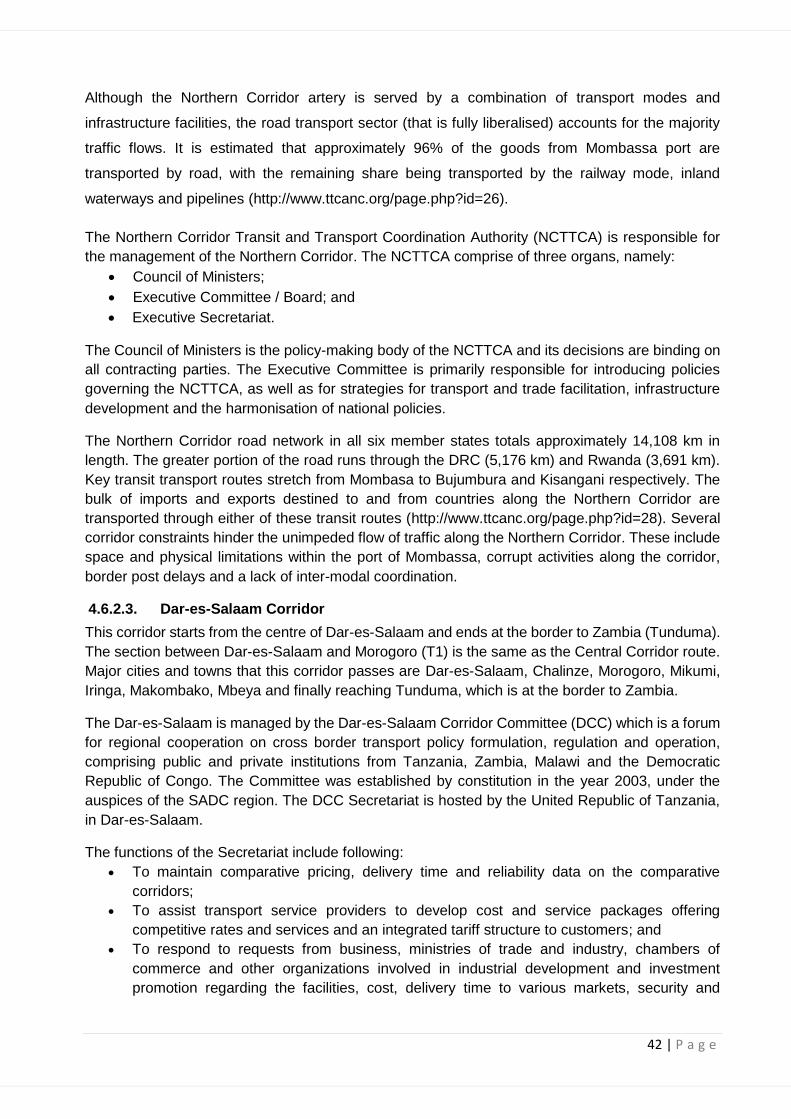
42 | P a g e
Although the Northern Corridor artery is served by a combination of transport modes and
infrastructure facilities, the road transport sector (that is fully liberalised) accounts for the majority
traffic flows. It is estimated that approximately 96% of the goods from Mombassa port are
transported by road, with the remaining share being transported by the railway mode, inland
waterways and pipelines (http://www.ttcanc.org/page.php?id=26).
The Northern Corridor Transit and Transport Coordination Authority (NCTTCA) is responsible for
the management of the Northern Corridor. The NCTTCA comprise of three organs, namely:
• Council of Ministers;
• Executive Committee / Board; and
• Executive Secretariat.
The Council of Ministers is the policy-making body of the NCTTCA and its decisions are binding on
all contracting parties. The Executive Committee is primarily responsible for introducing policies
governing the NCTTCA, as well as for strategies for transport and trade facilitation, infrastructure
development and the harmonisation of national policies.
The Northern Corridor road network in all six member states totals approximately 14,108 km in
length. The greater portion of the road runs through the DRC (5,176 km) and Rwanda (3,691 km).
Key transit transport routes stretch from Mombasa to Bujumbura and Kisangani respectively. The
bulk of imports and exports destined to and from countries along the Northern Corridor are
transported through either of these transit routes (http://www.ttcanc.org/page.php?id=28). Several
corridor constraints hinder the unimpeded flow of traffic along the Northern Corridor. These include
space and physical limitations within the port of Mombassa, corrupt activities along the corridor,
border post delays and a lack of inter-modal coordination.
4.6.2.3. Dar-es-Salaam Corridor
This corridor starts from the centre of Dar-es-Salaam and ends at the border to Zambia (Tunduma).
The section between Dar-es-Salaam and Morogoro (T1) is the same as the Central Corridor route.
Major cities and towns that this corridor passes are Dar-es-Salaam, Chalinze, Morogoro, Mikumi,
Iringa, Makombako, Mbeya and finally reaching Tunduma, which is at the border to Zambia.
The Dar-es-Salaam is managed by the Dar-es-Salaam Corridor Committee (DCC) which is a forum
for regional cooperation on cross border transport policy formulation, regulation and operation,
comprising public and private institutions from Tanzania, Zambia, Malawi and the Democratic
Republic of Congo. The Committee was established by constitution in the year 2003, under the
auspices of the SADC region. The DCC Secretariat is hosted by the United Republic of Tanzania,
in Dar-es-Salaam.
The functions of the Secretariat include following:
• To maintain comparative pricing, delivery time and reliability data on the comparative
corridors;
• To assist transport service providers to develop cost and service packages offering
competitive rates and services and an integrated tariff structure to customers; and
• To respond to requests from business, ministries of trade and industry, chambers of
commerce and other organizations involved in industrial development and investment
promotion regarding the facilities, cost, delivery time to various markets, security and

43 | P a g e
reliability of the route, as needed to effectively market the corridor and spur economic
development based, in part, on the quality of the transport system.
4.6.3. Domestic Road Transport Corridors
Further to international road transport corridors, a number of secondary corridors serve national
trade. These corridors are positioned along areas of high population density, providing opportunities
for the movement of goods. Although the condition of trunk and regional roads have improved
significantly over the past two decades, the same cannot be said for district (local) roads that are
generally in a poor condition, with a large proportion of roads remaining impassable.
4.6.3.1. Mtwara Corridor
The Mtwara Corridor starts from the port of Mtwara and passes several major cities such as
Mingoyo, Masasi, Tunduru, and Songea and reaches Mbamba Bay, which is facing Lake Nyasa.
The total length of the corridor is 825 km (Figure 26 below).
4.6.3.2. Coastal Corridor
Coastal Corridor (T7 and T2) starts from Mtwara and passes Mingoyo, Lindi and Dar-es-Salaam. It
starts again from Chalinze and reaches Segero, which is the junction to Tanga. The distance from
Mingoyo to Dar-es-Salaam is 479 km, 422 km of which is paved and the remaining 57 km is not
paved (Figure 24 below).
4.6.3.3. Namanga Corridor
This corridor handles the north-south traffic starting from Arusha, Babati, Karema, and Dodoma and
reaches Iringa, a city on the TAZARA Corridor. This is an important north-south connection in the
middle of the country between Tanga Corridor and TAZARA Corridor via Dodoma, which is the
political capital. (Figure 24 below).
4.6.3.4. Sumbawanga Corridor
This corridor (T9) starts from Tunduma, connection to the TAZARA Corridor, and passes
Sumbawanga, Mpanda and Kasulu. The road T9 continues to Kalebezo via Kibondo, Nyakanazi,
which is the junction to the Central Corridor, and reaches Kibondo. The Sumbawanga Corridor
branches off at Kasulu, which is about 80 km from Kigoma port via T19, toward the border of
Burundi, enters Burundi, passes Mabando, Nyanza-Lac and finally reaches Bujunbura (Figure 22
below).
Figure 22: Major corridors and roads network in Tanzania
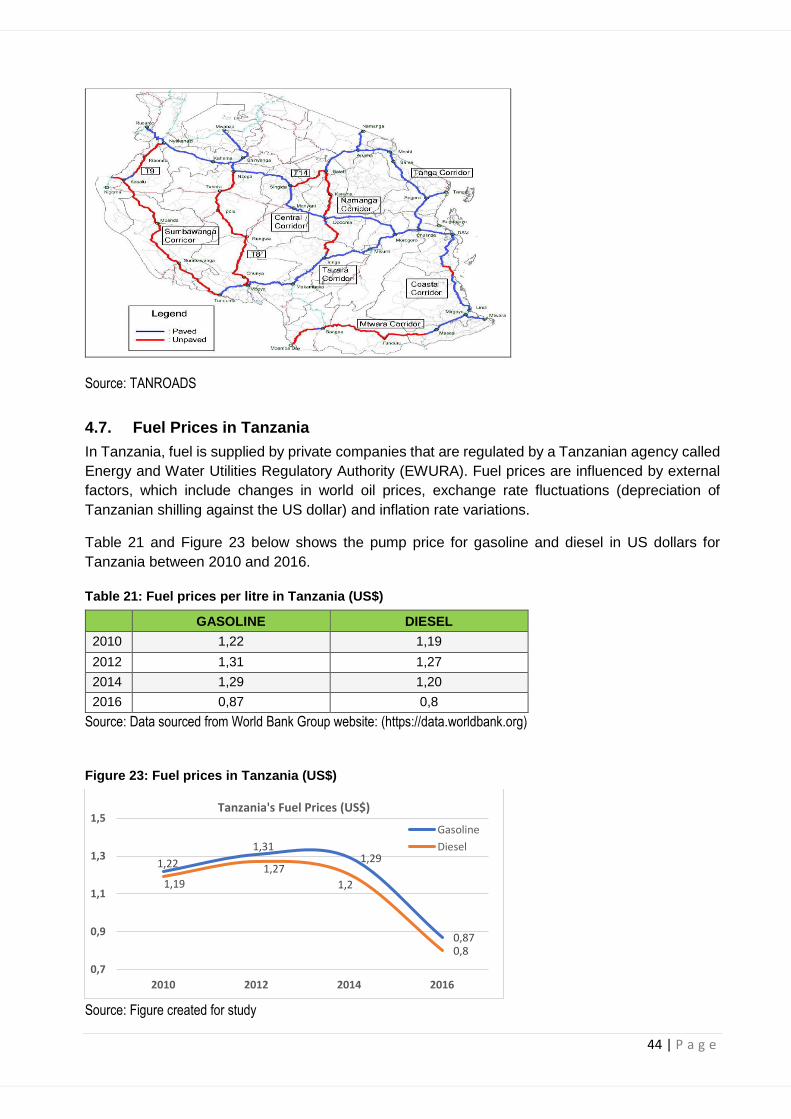
44 | P a g e
Source: TANROADS
4.7. Fuel Prices in Tanzania
In Tanzania, fuel is supplied by private companies that are regulated by a Tanzanian agency called
Energy and Water Utilities Regulatory Authority (EWURA). Fuel prices are influenced by external
factors, which include changes in world oil prices, exchange rate fluctuations (depreciation of
Tanzanian shilling against the US dollar) and inflation rate variations.
Table 21 and Figure 23 below shows the pump price for gasoline and diesel in US dollars for
Tanzania between 2010 and 2016.
Table 21: Fuel prices per litre in Tanzania (US$)
GASOLINE DIESEL
2010 1,22 1,19
2012 1,31 1,27
2014 1,29 1,20
2016 0,87 0,8
Source: Data sourced from World Bank Group website: (https://data.worldbank.org)
Figure 23: Fuel prices in Tanzania (US$)
Source: Figure created for study
1,22
1,311,29
0,87
1,19
1,27
1,2
0,8
0,7
0,9
1,1
1,3
1,5
2010 2012 2014 2016
Tanzania's Fuel Prices (US$)
Gasoline
Diesel

45 | P a g e
4.8. Tanzania Cross-Border Road Transport Permits issued by the C-BRTA
The Cross-Border Road Transport Agency in South Africa does not issue any cross-border bus or
taxi permits between South Africa and Tanzania. South African commuters prefer to travel to
Zambia from where they use local (Zambian buses) to cross over to Tanzania.
While the demand for cross-border road freight permits has been low in the past, the start of the
new year (2020) has witnessed a spike in the demand for cross-border road transport permits to
Tanzania. To date, the C-BRTA has issued 100 cross-border road freight permits. Of the total, 11
permits are one-year permits, while the remainder (89) permits are temporary permits.
4.9. Regulatory Environment
The regulation of the road transport industry is the responsibility of the Surface and Marine
Transport Regulatory Authority (SUMATRA). In the past, Tanzania had only one regulator named
SUMARTA, but with increases in the demand for travel and technolotgy advances, SUMATRA
found it increasingly difficult to regulate marine and surface transport operations efficiently.
Therefore, in January 2019, Parliament passed a Bill for the new Land Transport Regulatory
Authority Act 2018, which repealed the SUMATRA Act and established the Tanzania Shipping
Agency Cooperation (Tasac) to regulate marine transport. SUMATRA remains responsible for the
economic regulation of the road transport sector. This regulatory body is tasked, amongst others,
with the functions of issuing, renewing, cancelling and amending road service licences and public
carrier’s licenses in accordance with the provisions of the Transport Licensing Act, 1973.
Economic regulation ensures that the road transport sector promotes competition and ensures fair
trade practices among service providers. Furthermore it safeguards that the rates charged for freight
and passenger transport services are in line with the cost of operations, while also considering
reasonable financial returns on business investment. Although SUMATRA monitors road freight
rates it does not regulate freight charges. One of the important activities in the regulation of road
transport is the issuance of licenses and timetables. During 2010/11, with regards to the last
available records, the authority issued a total of 78,238 licenses. In addition, the authority issued
passenger timetables for 3,721 different public transport routes.
Several other authorities are also involved in the regulation of road transport in Tanzania. These
include:
• Tanzania National Roads Agency (TANROADS) responsible for the maintenance and
development of the trunk and regional road network in Tanzania’s mainland classified road
network;
• Ministry of Works, Transport and Communications responsible for the formulation of policy,
regarding works, construction, transport and communications technology, as well as
performing monitoring functions during implementation;
• Roads Fund Board which performs various functions, including the collection of tolls and the
identification of new sources of revenue to the fund;
• National Institute of Transport (NIT) responsible for the training of transport professionals,
including vehicle inspectors and drivers;
• Tanzania Revenue Authority (TRA) responsible for the registration of motor vehicles, motor
vehicle transfer tax collection, annual motor vehicle licensing and the issuing of driving
licences; and
• National Road Safety Council responsible for coordinating road safety activities and
undertaking research with regard to road safety matters.
46 | P a g e
4.9.1. Challenges and opportunities
4.9.1.1. Challenges
Major weaknesses in the regulatiory environment include non-alignment of regulatory frameworks
to those of other SADC member states, inadequate coordination between transport authorities, poor
governance (corruption) and weak enforcement. Therefore the challenge is to streamline the
functions of regulators and increase coordination, while also strengthening policy formulation,
regulation and implementation oversight.
4.9.1.2. Opportunities
As a member of both the SADC and EAC RECs, Tanzania is supporting on-going Tripartite trade
and transport initiatives, including the TTTFP. Essentially, the TTTFP combines a series of
initiatives of all 3 Tripartite RECs into a single trade facilitation programme that provides a
mechanism for reporting, monitoring and eliminating non-tarrif barriers (NTBs) and the
harmonisation of vehicle regulations and standards.
The successful implementation of the TTTFP is relaint on Tripartite MS signing and implementing
the:
• Multilateral Cross-Border Road Transport Agreement (MCBRTA); and
• Vehicle Load Management Agreement (VLMA).
The above instruments serve as the primary legal instruments to drive the harmonisation of related
regulations, standards and systems. However, harmonisation can not be introduced exclusive of a
supporting statutory framework in the form of enabling legislation. For this reason, several model
laws have been developed under the TTTFP, namely:
• Vehivle Load Management Model Law;
• Vehicle and Driver Quality Model Law;
• Cross-Border Road Transport Model Law;
• Dangerous Goods Model Law; and
• Model Law on Decrminalisation of Road Traffic and Transport Offences and Demerit Points
System.
The harmonisation of regulatory requirements will yield several positive impacts for cross-border
operators, including a reduction in NTB’s (e.g. inspection points along transport corridors) that will
lead to reductions in logistics and transportation costs.
4.9.2. New Transport Developments
The administration of President John Magufuli has identified transportation as a vital component of
Tanzania’s mid-term economic development agenda and is investing significantly in major projects
including an expansive standard-gauge railway (SGR) network, highway construction and
rehabilitation, and ports modernisation with a focus on increasing cargo volumes as well as
establishing new transport hubs for its energy and tourism sectors. The Tanzanian road network
handle most inter-regional trade. Under-investment over the years has created several
infrastructure inefficiencies, yet demand for licences (permits) continues to increase. To off-set
these challenges, TANROADS has been tasked with creating new routes and rehabilitating existing
roads.
The Tazara flyover project at the junction of the Julius Nyerere Road and the Nelson Mandela
Expressway in Dar-es-Salaam was completed in September 2018. The new road that consists of
four lanes and a 425-metre bridge has successfully reduced the level of congestion and shortened
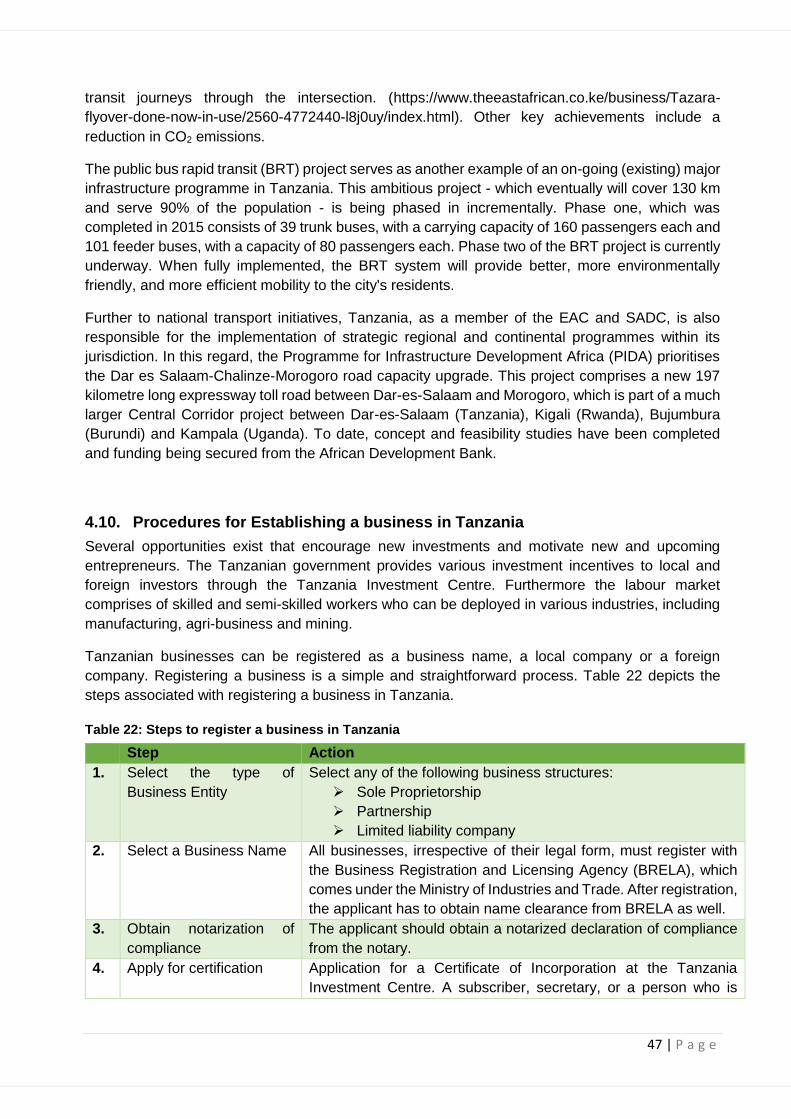
47 | P a g e
transit journeys through the intersection. (https://www.theeastafrican.co.ke/business/Tazara-
flyover-done-now-in-use/2560-4772440-l8j0uy/index.html). Other key achievements include a
reduction in CO2 emissions.
The public bus rapid transit (BRT) project serves as another example of an on-going (existing) major
infrastructure programme in Tanzania. This ambitious project - which eventually will cover 130 km
and serve 90% of the population - is being phased in incrementally. Phase one, which was
completed in 2015 consists of 39 trunk buses, with a carrying capacity of 160 passengers each and
101 feeder buses, with a capacity of 80 passengers each. Phase two of the BRT project is currently
underway. When fully implemented, the BRT system will provide better, more environmentally
friendly, and more efficient mobility to the city's residents.
Further to national transport initiatives, Tanzania, as a member of the EAC and SADC, is also
responsible for the implementation of strategic regional and continental programmes within its
jurisdiction. In this regard, the Programme for Infrastructure Development Africa (PIDA) prioritises
the Dar es Salaam-Chalinze-Morogoro road capacity upgrade. This project comprises a new 197
kilometre long expressway toll road between Dar-es-Salaam and Morogoro, which is part of a much
larger Central Corridor project between Dar-es-Salaam (Tanzania), Kigali (Rwanda), Bujumbura
(Burundi) and Kampala (Uganda). To date, concept and feasibility studies have been completed
and funding being secured from the African Development Bank.
4.10. Procedures for Establishing a business in Tanzania
Several opportunities exist that encourage new investments and motivate new and upcoming
entrepreneurs. The Tanzanian government provides various investment incentives to local and
foreign investors through the Tanzania Investment Centre. Furthermore the labour market
comprises of skilled and semi-skilled workers who can be deployed in various industries, including
manufacturing, agri-business and mining.
Tanzanian businesses can be registered as a business name, a local company or a foreign
company. Registering a business is a simple and straightforward process. Table 22 depicts the
steps associated with registering a business in Tanzania.
Table 22: Steps to register a business in Tanzania
Step Action
1. Select the type of
Business Entity
Select any of the following business structures:
➢ Sole Proprietorship
➢ Partnership
➢ Limited liability company
2. Select a Business Name All businesses, irrespective of their legal form, must register with
the Business Registration and Licensing Agency (BRELA), which
comes under the Ministry of Industries and Trade. After registration,
the applicant has to obtain name clearance from BRELA as well.
3. Obtain notarization of
compliance
The applicant should obtain a notarized declaration of compliance
from the notary.
4. Apply for certification Application for a Certificate of Incorporation at the Tanzania
Investment Centre. A subscriber, secretary, or a person who is
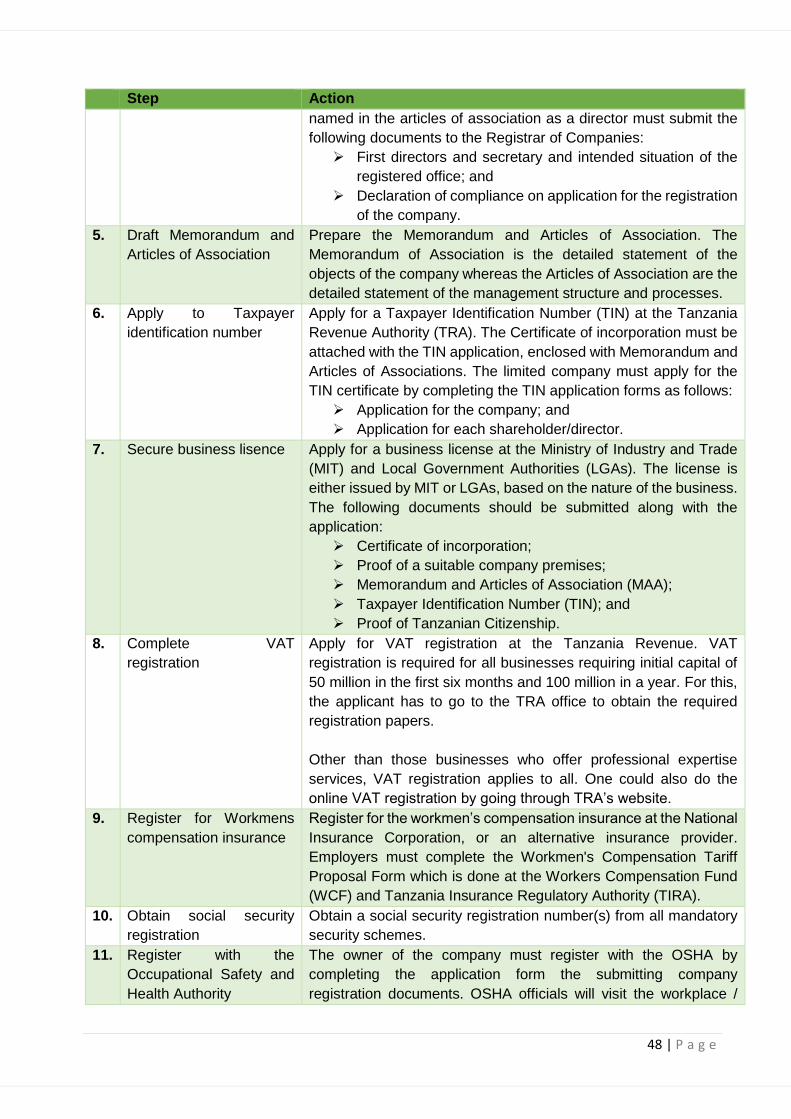
48 | P a g e
Step Action
named in the articles of association as a director must submit the
following documents to the Registrar of Companies:
➢ First directors and secretary and intended situation of the
registered office; and
➢ Declaration of compliance on application for the registration
of the company.
5. Draft Memorandum and
Articles of Association
Prepare the Memorandum and Articles of Association. The
Memorandum of Association is the detailed statement of the
objects of the company whereas the Articles of Association are the
detailed statement of the management structure and processes.
6. Apply to Taxpayer
identification number
Apply for a Taxpayer Identification Number (TIN) at the Tanzania
Revenue Authority (TRA). The Certificate of incorporation must be
attached with the TIN application, enclosed with Memorandum and
Articles of Associations. The limited company must apply for the
TIN certificate by completing the TIN application forms as follows:
➢ Application for the company; and
➢ Application for each shareholder/director.
7. Secure business lisence Apply for a business license at the Ministry of Industry and Trade
(MIT) and Local Government Authorities (LGAs). The license is
either issued by MIT or LGAs, based on the nature of the business.
The following documents should be submitted along with the
application:
➢ Certificate of incorporation;
➢ Proof of a suitable company premises;
➢ Memorandum and Articles of Association (MAA);
➢ Taxpayer Identification Number (TIN); and
➢ Proof of Tanzanian Citizenship.
8. Complete VAT
registration
Apply for VAT registration at the Tanzania Revenue. VAT
registration is required for all businesses requiring initial capital of
50 million in the first six months and 100 million in a year. For this,
the applicant has to go to the TRA office to obtain the required
registration papers.
Other than those businesses who offer professional expertise
services, VAT registration applies to all. One could also do the
online VAT registration by going through TRA’s website.
9. Register for Workmens
compensation insurance
Register for the workmen’s compensation insurance at the National
Insurance Corporation, or an alternative insurance provider.
Employers must complete the Workmen's Compensation Tariff
Proposal Form which is done at the Workers Compensation Fund
(WCF) and Tanzania Insurance Regulatory Authority (TIRA).
10. Obtain social security
registration
Obtain a social security registration number(s) from all mandatory
security schemes.
11. Register with the
Occupational Safety and
Health Authority
The owner of the company must register with the OSHA by
completing the application form the submitting company
registration documents. OSHA officials will visit the workplace /

49 | P a g e
Step Action
factory prior to the business applying for inspection and health
safety. The application requires the following:
➢ Name of occupier;
➢ Address;
➢ Nature of work; and
➢ Total number of employees.
Source: https://www.businesssetup.com/blog/10-step-guide-how-register-your-company-tanzania
Tanzania is ranked 141 among 190 economies in the ease of doing business, according to the
latest World Bank annual ratings. The ease of doing business index ranks countries against each
other based on how the regulatory environment is conducive to business operations. Economies
with a high rank (1 to 20) have simpler and more friendly regulations for businesses
(https://tradingeconomics.com/tanzania/ease-of-doing-business).
With its score of 141, it is evident that more can be done to create a conducive business
environment in Tanzania. This environment should not only stimulate new entrants to the market,
but also provide favourable conditions for existing businesses to sustain their operations.
5. PASSENGER TRANSPORT IN TANZANIA
5.1. Public Transport in Tanzania
SUMATRA is responsible for promoting, facilitating and ensuring availability of efficient, safe, fair,
reliable and environmentally friendly transportation services. Tanzania is promoted as a tourist state
but urban transport is constrained by low level of motorization. Public transportation comprise
informal pick-up trucks, rickshaws, and route taxis. Road transport infrastructure in the country is
poorly developed and there are frequent journey delays due to traffic congestion on roads, rush for
vehicles arising from private cars and low capacity. There is serious traffic congestion in Dar-es-
Salaam particularly in city centre due to the rapid increase in car ownership and use. Government
planned a core transport plan for public transport system which is centred upon implementing a
BRT system. The Dar-es-Salaam Rapid Transport (DART) has helped to decongest the city (African
Development Bank [AfDB], 2013).
Orangesmile (2019) stated that the rural passenger public transport is predominantly non-
motorised, walking and head-loading, poor infrastructure development, high transport operation
costs and charges experienced by operators and users respectively. Low demand of transport is
due to low level of affordability. The rural roads construction and maintenance are implemented by
the Local Government Authorities. In the long rainy season, most dirt roads simply blur, which
makes certain regions of the country absolutely cut off from civilization. All major cities of the country
are connected by railways
Tanzania consists of a number of islands and archipelagoes, and so the sea service is very popular.
The main tourist destinations for water are from Dar-es-Salaam to the islands of Zanzibar and
Pemba. This means of transport has a schedule, and, as a rule, ferries comply with it (Orangesmile,
2019).
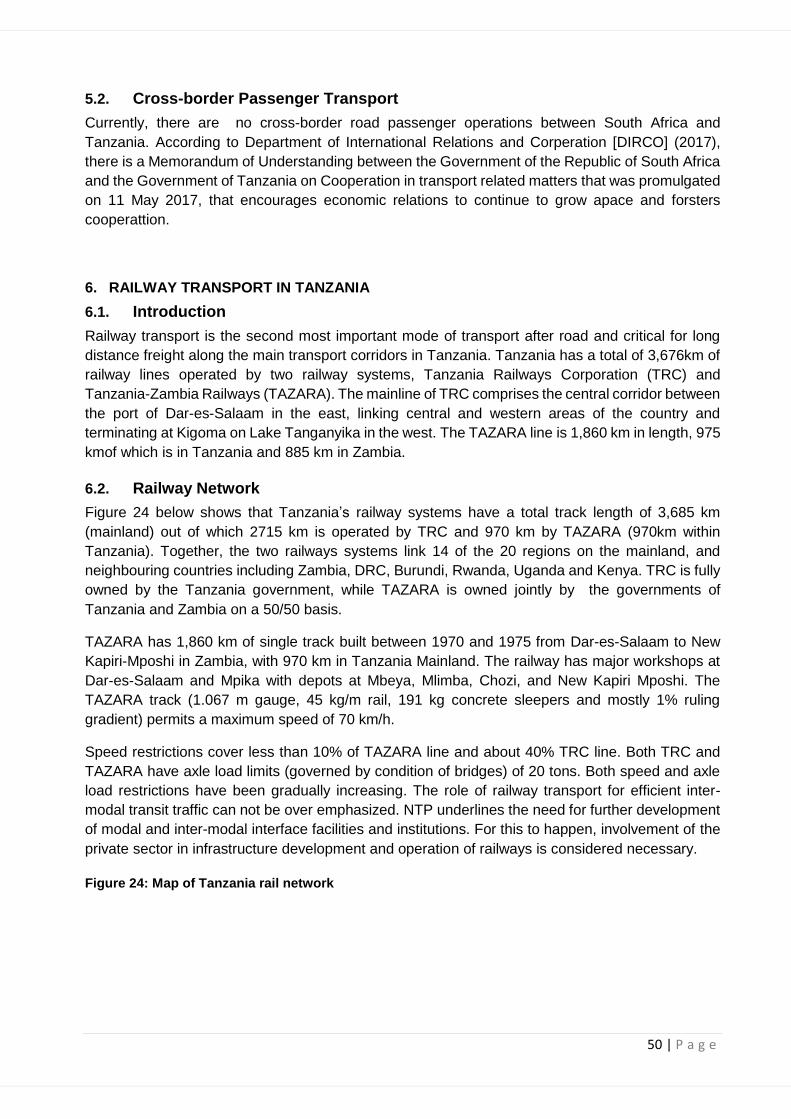
50 | P a g e
5.2. Cross-border Passenger Transport
Currently, there are no cross-border road passenger operations between South Africa and
Tanzania. According to Department of International Relations and Corperation [DIRCO] (2017),
there is a Memorandum of Understanding between the Government of the Republic of South Africa
and the Government of Tanzania on Cooperation in transport related matters that was promulgated
on 11 May 2017, that encourages economic relations to continue to grow apace and forsters
cooperattion.
6. RAILWAY TRANSPORT IN TANZANIA
6.1. Introduction
Railway transport is the second most important mode of transport after road and critical for long
distance freight along the main transport corridors in Tanzania. Tanzania has a total of 3,676km of
railway lines operated by two railway systems, Tanzania Railways Corporation (TRC) and
Tanzania-Zambia Railways (TAZARA). The mainline of TRC comprises the central corridor between
the port of Dar-es-Salaam in the east, linking central and western areas of the country and
terminating at Kigoma on Lake Tanganyika in the west. The TAZARA line is 1,860 km in length, 975
kmof which is in Tanzania and 885 km in Zambia.
6.2. Railway Network
Figure 24 below shows that Tanzania’s railway systems have a total track length of 3,685 km
(mainland) out of which 2715 km is operated by TRC and 970 km by TAZARA (970km within
Tanzania). Together, the two railways systems link 14 of the 20 regions on the mainland, and
neighbouring countries including Zambia, DRC, Burundi, Rwanda, Uganda and Kenya. TRC is fully
owned by the Tanzania government, while TAZARA is owned jointly by the governments of
Tanzania and Zambia on a 50/50 basis.
TAZARA has 1,860 km of single track built between 1970 and 1975 from Dar-es-Salaam to New
Kapiri-Mposhi in Zambia, with 970 km in Tanzania Mainland. The railway has major workshops at
Dar-es-Salaam and Mpika with depots at Mbeya, Mlimba, Chozi, and New Kapiri Mposhi. The
TAZARA track (1.067 m gauge, 45 kg/m rail, 191 kg concrete sleepers and mostly 1% ruling
gradient) permits a maximum speed of 70 km/h.
Speed restrictions cover less than 10% of TAZARA line and about 40% TRC line. Both TRC and
TAZARA have axle load limits (governed by condition of bridges) of 20 tons. Both speed and axle
load restrictions have been gradually increasing. The role of railway transport for efficient inter-
modal transit traffic can not be over emphasized. NTP underlines the need for further development
of modal and inter-modal interface facilities and institutions. For this to happen, involvement of the
private sector in infrastructure development and operation of railways is considered necessary.
Figure 24: Map of Tanzania rail network
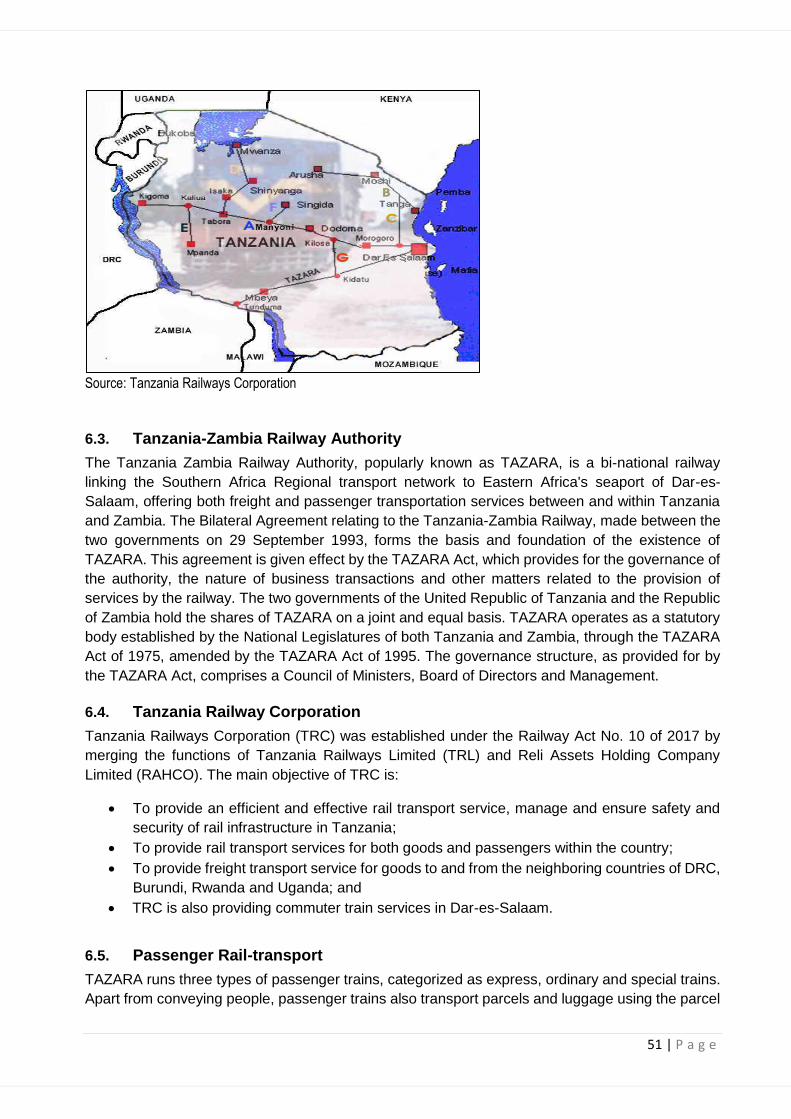
51 | P a g e
Source: Tanzania Railways Corporation
6.3. Tanzania-Zambia Railway Authority
The Tanzania Zambia Railway Authority, popularly known as TAZARA, is a bi-national railway
linking the Southern Africa Regional transport network to Eastern Africa's seaport of Dar-es-
Salaam, offering both freight and passenger transportation services between and within Tanzania
and Zambia. The Bilateral Agreement relating to the Tanzania-Zambia Railway, made between the
two governments on 29 September 1993, forms the basis and foundation of the existence of
TAZARA. This agreement is given effect by the TAZARA Act, which provides for the governance of
the authority, the nature of business transactions and other matters related to the provision of
services by the railway. The two governments of the United Republic of Tanzania and the Republic
of Zambia hold the shares of TAZARA on a joint and equal basis. TAZARA operates as a statutory
body established by the National Legislatures of both Tanzania and Zambia, through the TAZARA
Act of 1975, amended by the TAZARA Act of 1995. The governance structure, as provided for by
the TAZARA Act, comprises a Council of Ministers, Board of Directors and Management.
6.4. Tanzania Railway Corporation
Tanzania Railways Corporation (TRC) was established under the Railway Act No. 10 of 2017 by
merging the functions of Tanzania Railways Limited (TRL) and Reli Assets Holding Company
Limited (RAHCO). The main objective of TRC is:
• To provide an efficient and effective rail transport service, manage and ensure safety and
security of rail infrastructure in Tanzania;
• To provide rail transport services for both goods and passengers within the country;
• To provide freight transport service for goods to and from the neighboring countries of DRC,
Burundi, Rwanda and Uganda; and
• TRC is also providing commuter train services in Dar-es-Salaam.
6.5. Passenger Rail-transport
TAZARA runs three types of passenger trains, categorized as express, ordinary and special trains.
Apart from conveying people, passenger trains also transport parcels and luggage using the parcel
52 | P a g e
vans attached to the passenger trains. Each parcel van can carry up to 15,7 metric tons of parcels
and, depending on the demand, one or more vans can be attached to the train at a time. Each
passenger train has dining cars with sub-contracted professional caterers serving international
cuisines at very reasonable prices.
6.5.1. Express Trains
TAZARA operates one express passenger train, the Mukuba Express Train, every Tuesday from
New Kapiri Mposhi to Dar-es-Salaam and every Friday from Dar-es-Salaam to New Kapiri-Mposhi,
departing from New Kapiri-Mposhi and Dar-es-Salaam at 16h00 CAT and 15h50 EAT, respectively.
The Mukuba is named after Zambia's top mineral export, copper, for which the country remains one
of its top producers in the world. It takes approximately 46 hours to travel between Dar-es-Salaam
and New Kapiri Mposhi.
Passengers have the rare treat of viewing a variety of game along the way. When passing though
the tunnels, crossing rivers and gorges, passengers have a chance to appreciate the awesome and
inspirational engineering works of the Chinese, who constructed the rail line between 1970 and
1975.
6.5.2. Ordinary Trains
The Ordinary Passenger Train, on the other hand, runs in the opposite direction of the Express
every Tuesday and Friday, departing Dar-es-Salaam and New Kapiri-Mposhi at 13h50 EAT and
14h00 CAT, on Tuesday and Friday, respectively. The ordinary train stops at every serviceable
railway station in the respective regions of Tanzania and Zambia.
6.5.3. Commuter Trains
TAZARA introduced commuter train services on 29 October 2012, in Tanzania’s port city of Dar-es-
Salaam, covering a distance of 30km from Dar-es-Salaam main station to Mwakanga, on the
outskirts of the city. The Commuter Train Service was introduced at the request of the Tanzanian
government, which was keen to ease the transport challenges in the city, especially during peak
hours. The government financed the initial costs of refurbishing the dilapidated coaches and
locomotives to put them back into service having been discarded for years. The Commuter Trains
utilize TAZARA’s main track, transporting some 9,000 passengers every day, except on weekends
and public holidays when the service is not available.
6.5.4. Tourist and Special Trains
TAZARA also runs special tourist trains for specific events and special groups. The most common
of special trains is the tourist train to the Selous Game Reserve, about 200km from Dar-es-Salaam.
Selous Game Reserve is the largest unexploited wildlife reserve in Africa covering 54,000 square
kilometers, named after the famous hunter, Fredrick Courtney, who was killed and buried there
during World War One.
The TAZARA rail cuts through the Selous Game Reserve. Tourist trains are usually run during
Christmas, Easter, New-Year and other public holidays. Tour operators also use the regular
passenger services for special tourist excursions to the Selous Game Reserve. The Rovos is one
of the world’s renowned luxurious tourist trains which regularly runs on the TAZARA line between
Cape Town in South Africa and Dar-es-Salaam in Tanzania, offering tourists special excursions
along the way. The Shongololo Train, another tourist train from South Africa, has also recently been
re-launched and is primed to be plying the TAZARA line at least once every year.

53 | P a g e
6.6. Freight Rail-transport
TAZARA operates two types of freight trains through traffic and local traffic trains. Through traffic
trains convey cargo originating from Dar-es-Salaam in Tanzania to New Kapiri Mposhi in Zambia
and vice versa. Local traffic trains convey intermediate cargo and may or may not cross the border.
TAZARA also provides block train services and mixed train services which are designed to meet
particular needs and requirements of the clients.
6.6.1. Regional Connections
The TAZARA railway line is designed with a 1067mm-gauge, which allows through traffic operations
with other Southern African railways, such as Spoornet of South Africa, Botswana Railways,
National Railways of Zimbabwe, Zambia Railways Limited Namibia Railways, Mozambique
Railways and Societe Nationale Des Chemins De Fer Du Congo Sarl (SNCC) of the DRC.
Essentially, all railway networks in the southern part of Africa can be accessed by TAZARA. With a
designed capacity of five million tonnes of freight per annum, TAZARA has been handling traffic for
the SADC as well as the Common Market for Eastern and Southern Africa (COMESA), thereby
providing a vital regional link amongst Southern, Eastern and Central African regions with the rest
of the world through the port of Dar-es-Salaam.
6.6.2. Cargo Terminus
TAZARA has modern cargo terminus, complete with gantry cranes and other handling facilities at
New Kapiri Mposhi, Kasama, Makambako and Dar-es-Salaam stations. These facilities provide a
quick and efficient means for exporters and importers from different regions of Africa to load and
offload cargo onto and from TAZARA wagons.
New Kapiri Mposhi handles cargo to and from the Southern and Central African regions, whilst
Kasama covers the Great Lakes region. Similarly, Mbeya and Makambako cater for cargo from
Malawi and some parts of the Great Lakes. With such spread of the TAZARA terminus, cargo is
easily relayed from region to region. In addition, there is a privately owned trans-shipment facility at
Kidatu that handles the transfer of cargo from the wider gauge (1,067mm) wagons of TAZARA onto
the narrower gauge (1,000mm) wagons of the Tanzania Railways Limited (TRL) facilitating
interconnectivity amongst Southern, Central and East Africa.
6.7. Railway Regional Developments
6.7.1. Tanzania and EAC regional railway projects
The 205km line is the first phase of the 2,561km standard-guage railway project linking the Indian
Ocean port of Dar-es-Salaam with Mwanza on Lake Victoria and Kigoma on Lake Tanganyika, as
well as neighbouring Rwanda and Burundi was commissioned in May 2017 and was completed in
July 2019. Approximately US$1,2 billion contract to build this first phase was awarded to Yapi
Merkezi, Turkey, and Mota-Engil, Portugal (Burroughs, 2019). Burroughs (2019) added that the
state railway infrastructure authority Reli Assets Holding Company had also awarded Yapı Merkezi
a US$1,92bn contract to build the 336 km Morogoro – Makutupora 1,435 mm gauge line. This is
the second phase of the proposed 2,200 km standard gauge network which would connect Dar-es-
Salaam with Mwanza on Lake Victoria, Kigali in Rwanda and Musongati in Burundi. The second
phase will also have eight passenger stations and six freight terminals.
54 | P a g e
6.7.2. CBU-TAZARA Academic Business Partnership
The Copperbelt University (CBU) of Zambia and the Tanzania-Zambia Railway Authority (TAZARA)
have signed an Academic Business Partnership Agreement, officially operationalising the
establishment of the CBU-TAZARA Mpika Campus at the TAZARA Training Centre, which has
already begun offering skills development in railway related engineering and logistics academic
programs at Diploma, Bachelor Degree, Master Degree and PhD levels.
Apart from setting up a unique relationship that creates unheralded value and opportunities for both
the University and the railway industry, the partnership is an undertaking to position both institutions
towards contributing to the planned African Integrated High Speed Railway Network (AIHSRN) in
areas of human capital development and manufacturing of railway related products. The AIHSRN
is a flagship project of the African Union (AU) Agenda 2063, which has earmarked TAZARA’s Mpika
Workshops as one of the centres to play a key role in the manufacture of components for the railway
project. The Business Agreement, which specifies the contributions and benefits of each party as
well as dispute resolution mechanisms, was signed in Dar-es-Salaam, on 4 January 2020, by the
two institutions’ Chief Executive Officers, Eng. Bruno Ching’andu, Managing Director of TAZARA,
and Professor Naison Ngoma, the CBU Vice Chancellor, respectively.
Signing of this Agreement signaled the implementing of the Memorandum of Understanding that
was signed in 2017 to provide a framework for establishing a practical training institute that
maximizes the utilization of the already existing resources at TAZARA and CBU. This Agreement
also gave impetus to the relationship and enabled to harness the knowledge and experience in the
railway sector, which should be applied by all relevant parties to the benefit of the institutions and
the countries in the region. TAZARA benefits through the training of employees, knowledge
exchange and economic value for the utilisation of the TAZARA infrastructure.
7. AIR TRANSPORT IN TANZANIA
7.1. Airports in Tanzania
Air transport and airports in Tanzania plays an important part in the country’s transport system as it
provides direct international gateway.
7.2. Airports in Tanzania
Tanzania has three international airports in Dar-es-Salaam, Kilimanjaro and Zanzibar. In addition,
there are a number of domestic airports. Tanzania has one of the largest domestic air transportation
markets in sub-Saharan Africa. However, the high demand pften leads to capacity constraints,
especially at Julius Nyerere (formerly) Dar-es-Salaam international airport. Indeed, the airport is
currently operating beyond its design capacity in terms of the numbers of passengers that it
accommodates. In contrast to its vibrant domestic air transport market, its international market is
one of the smallest in sub-Saharan Africa. Tanzania’s appeal as a tourist destination would benefit
greatly from the increased availability of direct intercontinental flights.
7.2.1. Julius Nyerere International Airport
The Julius Nyerere International Airport (JNIA) is the primary gateway to Tanzania and the major
hub for domestic traffic in the country. It serves the major city of Dar es Salaam and is approximately
10 km from the city centre. In 2011, the airport recorded a throughput of about 1.8 million

55 | P a g e
passengers representing over 72% of the total volume of passengers at Tanzania Airports Authority
(TAA) airports and about 60% of total air passengers.
7.2.2. Kilimanjaro International Airport
The Kilimanjaro International Airport (KIA) is located at the foot of Mount Kilimanjaro and is
approximately 450 km from Dar es Salaam. The airport, located midway between Arusha and
Moshi, is approximately 50 km from each town. It is the mainland’s second international gateway.
It is strategically located near the main tourist attractions of Mount Kilimanjaro and several wildlife
parks of Tanzania including the Serengeti National Park, Ngorongoro Crater and Lake Manyara
National Park. Many tourists enter the country through KIA which is a short flight from Nairobi, the
regional airport hub.
7.2.3. Other Domestic Airports
Of the remaining airports, Mwanza is the largest and has a large domestic passenger flow as noted
above. Located in the lake region, Mwanza airport serves a region that is rich in natural resources
particularly fish from Lake Victoria and minerals from the surrounding towns and villages.
7.3. Key Regulators of the Civil Aviation Industry in Tanzania
7.3.1. Tanzania Civil Aviation Authority
Tanzania Civil Aviation Authority (TCAA) is a statutory body formed in 2003 for air navigation
services, safety, security and economic regulation of the civil aviation sector in Tanzania. The
authority provides navigations services at 14 airports in Tanzania. The authority also runs the Civil
aviation Centre (located and Julius Nyerere International Airport) which offer various aviation
courses in Air Traffic Control, Aeronautical Information Service, Aviation Security, Airport And Flight
Operations. TCAA ensures that airlines and airlines operators comply with the requirements of the
standards provided by the International Civil Aviation Organization (ICAO).
7.3.2. Tanzania Airports Authority
Tanzania Airports Authority (TAA) is an executive agency with power to manage, operate and
develop all public airports in Tanzania. The authority also ensures that the government policies and
regulations are implemented. The agency was established in 1999 by the Government Notice No.
404 of 1999 under the Executive Agency Act, Act No. 30 of 1997 and assumed the functions of the
former Directorate of Aerodromes of the Ministry of Transport.
7.4. Airline Operators in Tanzania
Currently, there are more than 20 international airline operators and more than 16 airline operators
operating domestic flights in Tanzania. The list includes, but not limited to, Air Tanzania, Qatar
Airways, Ethiopian Airlines, Etihad Airways, Emirates, Swiss International Airline, Air France – KLM,
Egypt Air, Air Mauritius, South African Airways, Oman Air, Rwanda Air, Fastjet Tanzania and
Precision Air.
International airline operators are expected to increase in number in Tanzania with the completion
of Terminal III construction project at Julius Nyerere International Airport. This is for a fact that,
Terminal III will be facilitating international flights and Terminal I and II of Julius Nyerere International
Airport will cater for domestic flights.
56 | P a g e
7.5. Operating Airdromes (airports and airstrips)
There are more than 240 airdromes (airports and airstrips) operating and under the authority of the
government, agencies and private individuals in Tanzania. The number includes Tanzania Airport
Authority (TAA) with 58; Zanzibar Airport Authority (TAA) with 2; Kilimanjaro Airport Development
Operation Company Limited (KADCO) with 1; Tanzania National Parks Authority (TANAPA) with
26; Ministry of Natural Resources and Tourism Tanzania (MSRT) with 61; Ngorongoro Conservation
Area Authority (NCAA) with and Private individuals/companies with 93.
7.6. Airline Operators in Tanzania
Currently, there are more than 20 international airline operators and more than 16 airline operators
operating domestic flights in Tanzania. They include Air Tanzania, Qatar Airways, Ethiopian
Airlines, Etihad Airways, Emirates, Swiss International Airline, Air France, KLM, Egypt Air, Air
Mauritius, South African Airways, Oman Air, Rwanda Air, Fastjet Tanzania and Precision Air.
International airline operators are expected to increase in number in Tanzania with the completion
of Terminal III construction project at Julius Nyerere International Airport. This is for a fact that,
Terminal III will be facilitating international flights and Terminal I and II of Julius Nyerere International
Airport will cater for domestic flights.
8. MARITIME TRANSPORT IN TANZANIA
8.1. Introduction
This chapter looks at maritime transport in Tanzania in terms of the responsible authority, their
mandate, developments with respect to seaports and coastal ports that the country utilise for
international and local trading.
8.2. Tanzania Ports Authority
The Tanzania Ports Authority (TPA) was established under the Ports Act No 17 of 2004 to take over
the functions of the Tanzania Harbours Authority and the Marine Services Company. The major
responsibilities of TPA are to develop, manage and promote the port subsector in Tanzania
mainland. The primary objective in establishing TPA was to enhance the advantages of the
geographical position of Tanzania’s maritime resources by:
• Promoting effective management and operations of sea and inland waterways ports;
• Securing the provision of, or to provide services in relation to loading and unloading of cargo
and passenger services;
• Developing, promoting and managing port infrastructure and superstructure;
• Maintaining port safety and security;
• Entering into contractual obligations with other person or body of persons in order to secure
the provision of efficient maritime transportation, port services, whether by means of
concession; joint venture, public private partnership or other means, and to this end to
delegate its own function of providing port services to one or more port operators.
The main objective of the Ports Act was to change the function of the port subsector from one that
provided a public service to one which functioned as a landlord to manage private sector operators
under conditions that fostered efficiency and service to its customers. Under the Act, TPA was
provided the mandate and powers to undertake the following functions:

57 | P a g e
• Administer the land and waters within the limits of the ports boundaries;
• Promote the use, improvement and development of the ports and their hinterlands;
• Regulate and control navigation and the protection of the environment;
• Ensure that services and facilities are provided and may enter into agreements or licence
other parties to provide these services;
• Ensure that adequate, affordable, equitable and efficient port services and facilities are
provided for port users;
• Ensure nondiscriminatory, fair, transparent access to port services and facilities;
advancement of previously
• Disadvantaged people; promotion of gender representation and participation in terminal
operations;
• Enhanced transparency in port management; and advise on all matters relating to the port
subsector; and
• Liaise with all stakeholders.
TPA performs the role of both a landlord and operator; and the number of assets and functions
concessioned to the private sector are relatively limited since the enactment of the Act in 2004. It
also administers a diverse system of ports along the Indian Ocean and the inland lakes of Victoria,
Tanganyika and Nyasa.
The major sea ports are located in Dar-es-Salaam, Tanga and Mtwara while smaller sea ports are
at Kilwa, Lindi, Mafia, Pangani, Bagamoyo and Mikindani. The lake ports are located at Mwanza
North and South, Nansio, Kemondo Bay, Bukoba and Musoma on Lake Victoria, Kigoma and
Kasanga on Lake Tanganyika, and Itungi Port, Manda Liuli and Mbamba Bay on Lake Nyasa.
8.3. Seaports of Tanzania
8.3.1 Dar-es-Salaam Port
Dar-es-Salaam port is the country’s largest port with an annual throughput of about 10 million tons
a year (2010-11). The port is strategically located serving the interior hinterland and the
neighbouring landlocked countries in the west, the Middle East, Asia and Australia to the east as
well as linkages to Europe via Suez and America via Southern Africa.
The entrance to the port can be accessed through a 2.8km channel which is approximately 140
meters in width. The channel was last dredged in 1998 when it was deepened, widened, and
straightened to cater to vessels of up 9.4m depth and 200m length at all states of the tide but
passenger of larger vessels is possible during high tide.
The port has 11 berths totalling to about 2,000 m in length, 2 berths at an adjacent oil jetty and a
single point mooring located outside the port approximately 3 km offshore. Recently, TPA operates
berths 1 to 7 which are used for handling break bulk, containers, RoRo and dry bulk cargo while
berths 8 to 11 comprise the container terminal and are used by Tanzania International Container
Services TICTS under a concession agreement.
8.3.2 Mbegani-Bagamoyo Port
The port masterplan identified that despite continuing implementation in increased efficiency
measures and additional investment at Dar-es-Salaam port, the location has a finite capacity which
is currently expected to be reached around 2020. Additional capacity that was needed to be built at
a separate location and the decision had been taken to provide new port capacity together with a
new export processing zone with excellent road and rail transport links at Mbegani located near
58 | P a g e
Bagamoyo approximately 60km to the north of Dar-es-Salaam. In the initial stage of its
development, the focus of the new port was to handle containers and the import of vehicles. Both
these trades are forecast to increase rapidly in line with economic growth.
8.3.3 Tanga Port
Tanga port is located in northern Tanzania approximately 350 km north of Dar es Salaam. It was
the first port to be developed in the country serving as the port of access for the Arusha and Moshi
areas where early farming settlements and towns had developed. It was subsequently linked to
these settlements by the first railway line to be developed in the country which was constructed in
the 1890s. Due to limited depth Tanga port has remained as a lighterage port and therefore suffers
from double handling and the associated additional costs from such operations.
Tanga has two anchorage areas: one is located inside the bay and the other outside. Each has the
capacity to accommodate six vessels but the inner area has a draft limitation of 3.5m while the
outside anchorage has 11.5m depth. Liquid bulk is handled at four buoys for mooring and is
facilitated by using flexible hoses connected to a submarine pipeline.
The port also has two berths and a total length of 440 m but suffers from a limited depth of 1.5 m at
low tide due to sedimentation and siltation over the years. It was originally constructed with a 2.5 m
depth at low tide. Over the years, it has remained an important port for its agricultural hinterland
where the primary crops are coffee, tea and sisal.
8.3.4 Mtwara Port
Mtwara port is located in southern Tanzania close to the border with Mozambique approximately
580 km south of Dar-es-Salaam. It is the third largest coastal port in the country and was initially
constructed between 1948 and 1954. Similar to the two other major sea ports, Mtwara had originally
railway linking the port with its hinterland. The railway was built in 1949 stretched between Tanga
and Nachingwea, with a distance of 211 km with a branch line from Chilungula to Masasi of 42 km.
The line was constructed to support the groundnut industry but when this scheme failed, the line
fell into diuse and was uprooted in 1962.
8.3.5 Small Coastal Ports
TPA has five small coastal ports comprising:
• Pangani, which is located south of Tanga,
• Kilindoni,
• Kilwa,
• Lindi; and
• Mikindini, all 4 are located south of Dar es Salaam.
These small coastal ports are all basically serving local trade. Many of the ports have limited
hinterlands due to limitations of the road network.
8.3.6 Lake Ports
Tanzania has three major lakes bordering its north west, west and south west:
• Lake Victoria borders Kenya and Uganda in the north west,
• Lake Tanganyika borders Burundi, DR Congo and Zambia in the west; and
• Lake Nyasa with Malawi and Mozambique in the south west.
59 | P a g e
These lakes have facilitated trade with neighbouring countries providing outlets and alternative
outlets to the sea for all neighbouring countries.
9. BORDER POSTS OF TANZANIA
Tanzania is surrounded by several neighbouring countries namely Burundi, DR Congo (DRC),
Kenya, Malawi, Mozambique, Rwanda, Uganda, and Zambia. There is also a variety of land border
crossings to Tanzania that travelers can use. Crossing into Tanzania via one of the land borders is
generally straightforward and easy. Travellers can cross the borders either by bus or using their
own vehicle. Those arriving from either Kenya, Uganda, or Rwanda on main routes are able to take
a through-bus which will take them over the border, although they will need to disembark on each
side in order to take care of visa formalities. Although eligible citizens crossing into Tanzania will be
able to get a visa on arrival at land borders, travelers are advised to obtain a visa online in advance
in order to cut down waiting times.
9.1. Tanzania and Kenya
The main route to/from Kenya is the good sealed road connecting Arusha (Tanzania) and Nairobi
(Kenya) via the recently modernised Namanga border post (open 24 hours, with a bank and
immigration inside the main building). There are also border crossings at Horohoro (Tanzania),
north of Tanga; at Holili (Tanzania), east of Moshi; at Loitokitok (Kenya), northeast of Moshi; and at
Sirari (Tanzania), northeast of Musoma. With the exception of the Serengeti–Masai Mara crossing
(which is currently closed), there is public transport across all Tanzania–Kenya border posts.
9.1.1. Holili, Tanzania | Taveta, Kenya
The Taveta/Holili border crossing point is between Southern Kenya and Northern Tanzania and is
located about 264 km south-east of Mombasa and 110 km west of Arusha. The Kenyan side of the
border is in Taita-Taveta County, while the Tanzanian side is in Himo Town, Rombo District,
Kilimanjaro Region. Taveta is one of the key border crossing points between the two countries due
to the border’s proximity to major cities.
To transport goods to Arusha and surrounding areas in northern Tanzania, vehicles currently must
pass through the Namanga border which is considerably longer than the Taveta/Holili route.
Operationalising the Taveta/Holili border is expected to increase with the construction of a new Voi-
Arusha road passing through the two border points, stretching the capacity of the current
infrastructure and operations and increase waiting time for import and export processing. Increased
delays create costs for traders.
From commencement of the Holili-Taveta OSBP, a number of benefits have been noticed, including
quick clearance of pedestrians and passengers as they are now not stopping in the country of exit.
This saves time as travellers are only stopping once for border formality and increased turnaround
of commercial traffic as compliant traders are now spending little time at the border. The OSBP has
also reduced the number of stops incurred previously by truck drivers.
According Baseline Traffic Data of 2011, to cross from Holili in Tanzania to Taveta in Kenya it was
7 hours 19 minutes and recently in 2017, Time & Traffic Survey it was 1 hour 41 minutes (74% time
saving). Lead Agency on the Kenyan side is Kenya Revenue Authority (KRA). From Taveta in
Kenya to Holili in Tanzania: 22 hours 59 minutes was taken during the Baseline Traffic Data of 2011
and in 2017, about 87% time savings was recordered when crossing from Taveta in Kenya to Holili
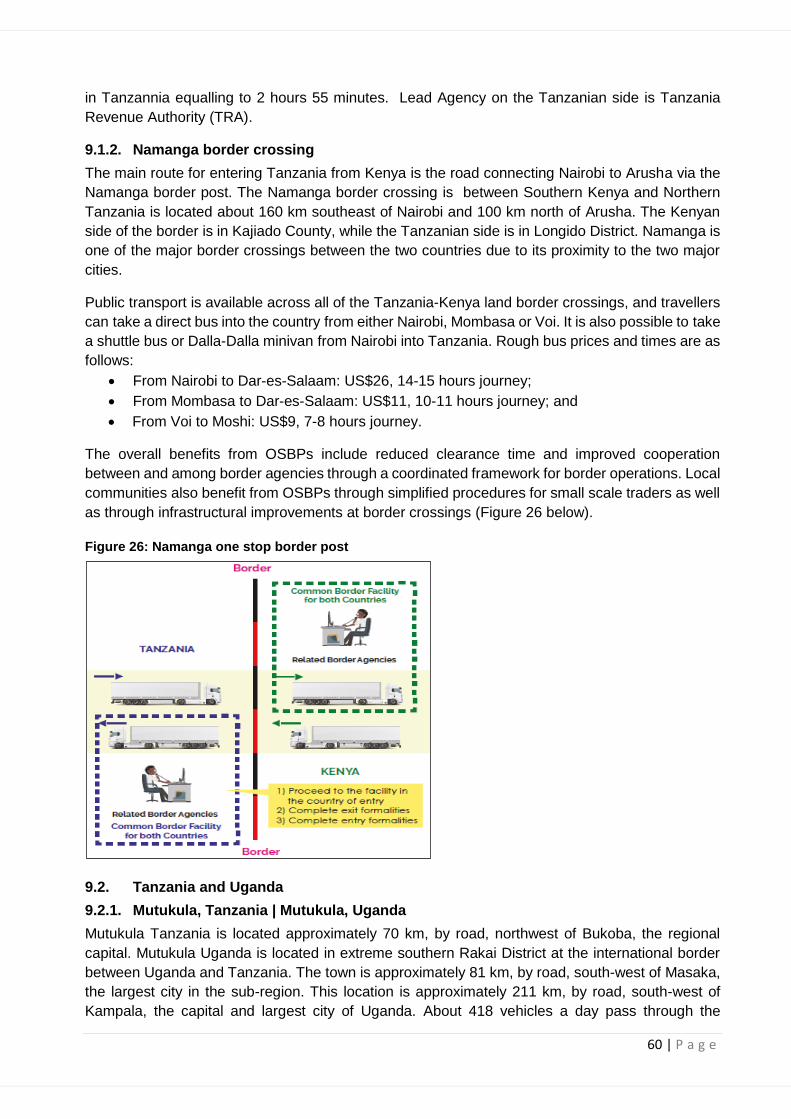
60 | P a g e
in Tanzannia equalling to 2 hours 55 minutes. Lead Agency on the Tanzanian side is Tanzania
Revenue Authority (TRA).
9.1.2. Namanga border crossing
The main route for entering Tanzania from Kenya is the road connecting Nairobi to Arusha via the
Namanga border post. The Namanga border crossing is between Southern Kenya and Northern
Tanzania is located about 160 km southeast of Nairobi and 100 km north of Arusha. The Kenyan
side of the border is in Kajiado County, while the Tanzanian side is in Longido District. Namanga is
one of the major border crossings between the two countries due to its proximity to the two major
cities.
Public transport is available across all of the Tanzania-Kenya land border crossings, and travellers
can take a direct bus into the country from either Nairobi, Mombasa or Voi. It is also possible to take
a shuttle bus or Dalla-Dalla minivan from Nairobi into Tanzania. Rough bus prices and times are as
follows:
• From Nairobi to Dar-es-Salaam: US$26, 14-15 hours journey;
• From Mombasa to Dar-es-Salaam: US$11, 10-11 hours journey; and
• From Voi to Moshi: US$9, 7-8 hours journey.
The overall benefits from OSBPs include reduced clearance time and improved cooperation
between and among border agencies through a coordinated framework for border operations. Local
communities also benefit from OSBPs through simplified procedures for small scale traders as well
as through infrastructural improvements at border crossings (Figure 26 below).
Figure 26: Namanga one stop border post
9.2. Tanzania and Uganda
9.2.1. Mutukula, Tanzania | Mutukula, Uganda
Mutukula Tanzania is located approximately 70 km, by road, northwest of Bukoba, the regional
capital. Mutukula Uganda is located in extreme southern Rakai District at the international border
between Uganda and Tanzania. The town is approximately 81 km, by road, south-west of Masaka,
the largest city in the sub-region. This location is approximately 211 km, by road, south-west of
Kampala, the capital and largest city of Uganda. About 418 vehicles a day pass through the
61 | P a g e
Mutukula border point, with trucks taking over a day on average to process through customs from
Tanzania to Uganda. This delay imposes serious costs on traders. They must wait longer for their
import or export, pay for the truck to wait at the border, risk perishable goods losing their value and
manage unpredictable transport times.
According Baseline Traffic Data of 2011, to cross from Mutukula in Tanzania to Mutukula in Uganda
Taveta it took about 45 hours 49 minutes. In 2017, the Time and Traffic Survey report indicated that
it takes about 4 hours 37 minutes (which was about 79% time reduction). The lead Agency on the
Ugandan side is Uganda Revenue Authority (URA). From Mutukula in Uganda to Mutukula in
Tanzania, the crossing time was 10 hours 12 minutes using 2011 Baseline Traffic Data and in 2017,
from Mutukula in Uganda to Mutukula in Tanzania, the crossing time improved to 3 hours 24 minutes
(67% time reduction). Lead Agency on the Tanzannian side is Tanzania Revenue Authority (TRA).
Travellers can take a bus from Kampala, the capital city of Uganda, to Arusha in Tanzania, passing
through Nairobi, which costs US$32 and takes approximately 20 hours journey. It is also possible
to take a bus from Kampala to Bukoba in Tanzania (US$9, 6-8 hours), or from Kampala to Mwanza
(US$20, 16 hours).
9.3. Tanzania and Burundi
9.3.1. Kabanga, Tanzania | Kobero, Burundi
Kabanga is located approximately 300 kilometres, by road, northwest of Bukoba, the regional
capital. Kobero is located in the region of Muyinga. Muyinga’s capital, Muyinga, is approximately 23
km away from Kobero. The distance from Kobero to Burundi’s capital, Bujumbura, is approximately
142 km.
Kobero OSBP is the main border post for Burundi and is the gateway for transit cargo into the
Democratic Republic of Congo (DRC). The border post handles about 70% of the cargo using this
border into and transiting through Burundi.
According to 2012 Baseline Traffic Data Kabanga in Tanzania to Kobero in Burundi, crossing time
was 11 hours 56 minutes and in 2017, from Kabanga to Kobero it was 8 hours 48 minutes (26%
time reduction) Lead Agency on the Burundian side is Burundi Revenue Authority (BRA). From
Kobero to Kabanga 2012 Baseline Traffic Data recorded 8 hours 5 minutes crossing time and in
2017, from Kobero to Kabanga 58% time reduction was registered equalling 3 hours 25 minutes.
Lead Agency on the Tanzanian side isTanzania Revenue Authority (TRA).
Travellers crossing by bus from Burundi are required to disembark at the border, walk through
immigration, and catch another bus in Tanzania to their onward destination. Rough bus routes,
prices and travel times are as follows:
• Mwanza to Ngara: US$9, 7-8 hours journey; and
• Bujumbura or Kigoma to Manyovu: US$ 7-9, 7 hours journey.
It is also possible for travellers to take a shared taxi from Nyakanazi to Nagara ( US $4, 2 hours),
or a dalla-dalla minibus from Kigoma to Manyovu (US$3, 1-2 hours) before walking through
immigration and finding onward transportation.
62 | P a g e
9.4. Tanzania and Zambia
9.4.1. Tunduma, Tanzania | Nakonde, Zambia
Tunduma-Nakonde is between the United Republic of Tanzania and Zambia and it handles traffic
from Dar-es-Salaam to Zambia and DR Congo and vice versa. Tunduma is a border town between
Tanzania and Zambia. It lies in Tanzania, in the region. It has border posts for both the Tanzam
highway and the TAZARA railway (for which it has a station) linking the two countries. It is 113 km
southwest of Mbeya. It is also the junction for the road which runs via Sumbawanga through the
remote far western districts of Tanzania to Kasulu and Kibondo in the north-west. Tunduma One
Stop Border Post (OSBP) was officially launched on 5 October 2019 by His Execellency John
Pombe Joseph Magufuli, President of the United Republic of Tanzania and His Execellency Edgar
Lungu, President of the Republic of Zambia.
One of the main benefits of this OSBP is the enhancement of operational efficiency of the border
post which will lead to faster transit times(or reduced waiting times at the border), which will in turn
lower the costs of trading. The governments of Tanzania and Zambia are committed to implement
a comprehensive programme that would develop legal, operational and institutional arrangements
required for the operation an efficient one stop border crossing at Nakonde/Tunduma.
The OSBP ensures effective border control mechanisms are in place. It will boost trade by cutting
the time taken to clear goods between the two nations, thus contributing to a reduction in transport
cost, whilst increasing volumes of transhipment cargo through the Dar-es-Salaam Corridor. On
average trucks leaving Tanzania take about 2.5 days to cross the Tunduma border into Zambia. It
is expected that time to cross the border will reduce by at least a third.
Over the years, delays in cross border clearance were attributed to duplication of handling
procedures on either side of the border, poor institutional arrangement and cargo management
systems, inadequate physical infrastructures and services and immigration management. The new
established OSBP is envisioned to address some of these challenges.
Construction of the Tunduma OSBP including systems and other related soft infrastructure was
carried out with funding of US$7.8 million from the United Kingdom through the Department for
International Development (DFID). The OSBP investment includes office buildings, roads and
parking yards, cargo verification bays, scanner shed, passenger sheds, targeting booths,
warehouse and canopies, ICT networks and hardware, furniture, and institutional support to the
border agencies.
Tunduma is the busiest transit and entry point in Tanzania linking transit trade destined for DRC,
Malawi, Zambia and Zimbabwe. New investments in natural resources in Southern Tanzania are
driving up traffic along the border point. This is likely to stretch border capacity and lead to further
delays. Moreover, inadequate understanding of import and export procedures by border agency
staff results in inaccurate entries and more delays. These factors impose serious costs on traders.
Several studies conducted in the region have established that the high cost of exporting and
importing goods in the Southern Africa region discourages international and intraregional trade,
makes commerce and industry less competitive, and contributes to food insecurity. The ports and
border post delays have been identified to contribute significantly to the high cost of transportation
in the region. According to the LPI Index Results (2010), it takes about 3-4 days to cross the land
borders along the Dar-es-Salaam Corridor borders.
63 | P a g e
Bilateral trade between Tanzania and Zambia stood at TZS 265 Billion in the past year with
Tanzania exporting goods worth TZS 149 Billion and importing goods worth TZS 116 Billion from
Zambia. This facility will eradicate barriers to trade and will further promote not only trade between
our two countries but also intra-Africa trade.
All inbound visitors to Zambia need a passport valid for six months and a temporary visitor's visa
issued at the border valid for three months after which a six month visa is issued thereafter. South
African citizens do not require visas for a stay of up to 30 days. Visitors travelling with vehicles need
to pay for temporary road permit fees, road user charge, third party Insurance, Carbon pollution tax
and the driver should have White and Red Reflective Tape and a fire extinguisher. All payments
are made by cheques or cash (accepted if the charges are less than Zambian Kwacha ZMK 5000.
Nakonde and Tunduma operates on different time zones. Tanzania is an hour behind Zambia.
Tunduma times are 07h00-19h00 from May 2016. Travellers crossing into Tanzania from
Zambia have several options to do so, either by bus, car, or train. The train from Zambia to
Tanzania runs twice weekly from Kapiri Mposhoi to Dar-es-Salaam. The trip costs approximately
US $31-26 and the journey can take between 43-59 hours.
9.5. Tanzania and Mozambique
9.5.1. Matchedje Border Post Crossing
The border post between Mozambique and Tanzania cross the Rio Rovuma river in the Niassa
province of Mozambique. This border is in a very remote location with a narrow bridge crossing the
Rovuma River into Mozambique. Although recomendations are that travellers must choose to enter
Mozambique through this border from Tanzania (as opposed to Namoto-Kilambo Ferry and
Negomano / Mtambaswala / Unity Bridge borders) it is known as a "hotspot" for ruby smuggling.
The border opens between 06h00-18h00 (GMT+2) Time Guideline.
9.5.2. Namoto - Kilambo Ferry border post
The Namoto - Kilambo Ferry border is located 40km from Mtwara Tanzania crossing the Ruvuma
River mouth into Mozambique. The relatively new barge-like ferry can transport approximately six
4x4 vehicles or eight smaller vehicles across the river. Departure times depend entirely on the tide
(water must be at least three meters deep) and will vary from day to day. Crossing through the
Matchedje Border post which is 130km south of Songea (Tanzania) or through Malawi via the
Songwe Border post is highly advised.
9.5.3. Negomano / Mtambaswala (Unity Bridge) border post crossing
Negomano/Mtambaswala (Unity Bridge) Border Control is a border control post between
Mozambique and Tanzania. Negomano is on the Mozambican side and approximately 9km, from
the Negomano town. Permits are required to reach the border as the road is through a restricted
Niassa Hunting Block hence there are police check points along the route.
The border is at the confluence of the Ruvuma River and the Lugenda River and falls. The border
crossing to Tanzania is through unity bridge, with 5km of tarred road towards the border. Negamono
is situated within Cabo Delgado province of Mozambique. All travellers into Mozambique need to
have Valid passport (US$80/ZAR570) and a visa for all countries except South Africa, Malawi and
Mauritius arrange beforehand as visas are not issued at this border post. Travellers travelling with
own vehicles require a valid driver's license, valid vehicle documents, third party Insurance (ZAR150
per vehicle, ZAR80 for trailer), and temporary import permit (ZAR15) for the vehicle.
64 | P a g e
9.6. Tanzania and Rwanda
9.6.1. Rusumo border post
The Rusumo border post is located on the Central Corridor (total length of 1,463 km), which extends
from the port of Dar-es-Salaam in Tanzania to the Rwandan capital of Kigali, connecting the Congo
Basin with the Tanzanian coast, and is important not only for Rwanda and Tanzania, but also for
the DRC, Burundi and other neighbouring countries. The Central Corridor is an economic corridor
within the East African Community (EAC) region, it is a key logistics link for the inland countries of
East Africa which rivals to the Northern Corridor connecting Kenya–Uganda–Rwanda. And it is an
important alternative logistics route to the Northern Corridor, particularly for the landlocked Rwanda.
Since April 2016, the Rwandan and Tanzanian side of Rusumo border has become a One Stop
Border Post (OSBP), operating from the same building. Rusumo OSBP recorded a traffic volume
of 55,884 trucks in 2016/2017, an average of 155 trucks per day. While the clearance has reduced
from four days before the one-stop border post started to operate to between half an hour to two
hours in 2016/2017. As for human traffic, about 280,000 people exited Rwanda using the Rusumo
border for the whole of 2018, according to figures from the Rwanda Directorate General of
Immigration and Emigration. Rusumo is the Rwanda's busiest border and in general, about 95% of
Rwanda's imports pass through Rusumo border, ferried from Dar-es-Salaam port.
9.7. Tanzania and DRC
There is no land border between Tanzania and the DRC. The only option to go directly from DRC
to Tanzania is to cross Lake Tanganyika. There is a port of Kalemie where passengers traverse the
lake with a cargo boat to Kigoma.
9.8. Tanzania and Malawi
7.8.1. Kasumulu, Tanzania | Songwe, Malawi
The border posts of Kasumulu in Tanzania and Songwe in northern Malawi is only land crossing
from Tanzania to Malawi is at the Songwe River Bridge at Kasmulu, southeast of Mbeya. The
Kasumulu / Songwe border between Tanzania and Malawi still operates as a traditional two-way
border post. Separate feasibility studies have been initiated for converting this border into an OSBP.
Tanzania and Malawi conducted feasibility studies of the OSBP independently. The only crossing
is at Kasumulu (Songwe River Bridge, 7am to 7pm Tanzanian time, 6am to 6pm Malawi time),
southeast of Mbeya (Tanzania).
9.8.1.1. Imports into Tanzania arriving from Malawi
All imports into Tanzania, except small cross border traders/ visitors/tourists, require a PreArrival
Declaration (PAD). The PAD is issued by the Tanzania Revenue Authority (TRA) Central Data
Processing Office in Dar-es-Salaam. Before goods arrive, the importer sends the clearing agent
scanned copies of goods documents that give the description of the goods, quantities, origin and
value for declaration. Upon receiving the documents, the clearing agent submits an electronic
application with the scanned documents to TRA in Dar-es-Salaam.
TRA in response sends the clearing agent a Pre-PAD which gives the valuation opinion. If the
clearing agent agrees with the valuation, he signs the Pre-PAD and sends it back to TRA in Dar-
es-Salaam. The Central Office then issues an A-PAD (Assessed Pre Arrival Declaration). The
clearing agent can pay duties on the basis of the A-PAD before the goods arrive.
When the truck arrives at the border and once cleared at Songwe, the following process follows:
65 | P a g e
• MRA brings a compiled manual escort sheet of goods cleared in Songwe and the supporting
goods documents to TRA reception because the two borders are not linked electronically;
• TRA receives the escort sheet, acknowledges receipt by stamping the sheet and its copies,
the original escort sheet is returned to MRA and a copy of the escort sheet is kept;
• CFA collects the goods documents on behalf of the importer from TRA reception to prepare
a declaration;
• If the goods are restricted, that is they require an import permit or license, CFA takes the
declaration to the relevant border agency for endorsement before submitting to Customs;
• Once endorsed, CFA makes electronic filing into ASYCUDA, and after filing, brings the
documents (originals and photocopies) in a file to the TRA front desk; For those who do not
have the facility to file electronically, the CFA submits documents and the APAD to the TRA
reception for ASYCUDA data capture;
• Documents are taken to ASYCUDA hall for verification; and
• Where duties were not paid in advance, CFA pays duties and taxes and processing fees by
swiping a card issued for this purpose by a bank (cash is strictly prohibited).
Note: Duty free consignments also pay processing fees.
• A verification officer is assigned to process the declaration; If the risk is minimal, the system
will automatically give a green signal, thus a release order is issued. A yellow signal requires
documentary check (e.g. to special permits), and a red signal will require a physical
examination. Where the physical examination reveals some irregularities, the officer issues
a query for modification, e.g. uplift. If additional duty is in the range of 5 to 10%, and there
is no penalty;
• Where examination results are conforming, a release order is issued; CFA collects the
release order and gives it to the driver;
• If the vehicle is foreign registered, the driver pays for toll fees, insurance and a temporary
importation permit; and
• Once all necessary payments are done, the driver enters Tanzania by showing his
documents at the barrier gate.
9.8.1.2. Exports from Tanzania
• The exporter contacts a CFA who prepares a customs export document;
• CFA presents export documents to agencies controlling exports for their endorsement;
• Once endorsed, CFA presents documents to Front Desk of TRA; and
• TRA Officer takes document to Customs Service Center where the supervisor assigns an
officer to conduct a risk assessment.
Note: Most exports are green lane with a few requiring documentary check, or a check for special
permits. When satisfied that the documents are in order, they are signed and returned to
reception for collection by CFA. There are no fees charged for export, not even processing
fees.
9.8.1.3. Goods Transiting Tanzania into Malawi
• The driver submits documents (T1 and movement sheet) to entry gate for recording;
• Documents are forwarded to the Customs and Services Center to check for conformity of all
documents;
• When satisfied the documents are in order, they are signed and returned to reception;

66 | P a g e
• The officer at reception signs the documents to acknowledge receipt;
• The officer conducts a physical inspection to check if the seal is intact;
• If conforming, the truck is allowed to proceed; and
• TRA records the consignment on the escort sheet for delivery to MRA.
9.8.1.4. Goods Transiting Tanzania from Malawi
• MRA brings an escort sheet and all necessary documents of consignments cleared in
Songwe to TRA reception;
• TRA receives the escort sheet, acknowledges receipt by stamping the sheet and its copies;
• TRA gives the original escort sheet to MRA and keeps copy;
• CFA collects the documents on behalf of the importer from TRA reception and lodges a
transit declaration;
• After lodging, CFA brings the documents (originals and photocopies) in a file to the TRA
front desk;
• Documents are taken to ASYCUDA hall for risk assessment;
• All transit consignments are red and selected for a physical examination to verify that the
goods in the truck are as noted on the declaration;
• If examination results are satisfactory, MRA officer generates a bond and issues a T1 form;
and
• If a foreign registered vehicle, the driver pays for toll fees, insurance and TIP, and is allowed
into Tanzania.
10. CHALLENGES AND OPPORTUNITIES IN TANZANIA
10.1. Challenges
Tanzania has undergone impressive political and economic developments and improvements in
social welfare in recent years. However, the country continues to face considerable development
challenges in essential areas such as economic distribution and population growth. Additionally,
Tanzania is facing many challenges that must be overcome to establish the fundamentals for
successful regional integration. These challenges comprise:
• Infrastructure development in terms of (transport, energy, information and communication
Technology, shared waters);
• The reduction of non-tariff barriers;
• Economic diversification and the development of productive capacities;
• The response to climate change, the rational management of natural resources, and
protection of the environment;
• The operationalisation and harmonisation of the RECs free trade areas;
• Human and institutional capacity building at the regional level;
• Improvement of the business climate;
• The mobilisation of domestic resources and stronger public-private partnerships;
• Youth employability; and
• The leadership and involvement of senior authorities in implementing harmonized regional
instruments.
67 | P a g e
10.2. Opportunities
Tanzania’s political stability and interesting economic growth are far from being the country’s only
strengths.
• The country is strategically positioned as a gateway to six landlocked countries. Its 56,3
million people belong to the East African Community Common Market and the SADC Free
Trade Area, expanding its consumer market to over 300 million people.
• Tanzania has potential to become the most economically successful country in Africa and
this is undoubtable. Tanzania is eligible for preferential treatment under the European
Union’s Everything But Arms (EBA) initiative and also has access to the US market under
the terms of the African Growth and Opportunity Act (AGOA);
• Access to Tanzania is facilitated by the three major ports located along the Indian Ocean
coast, through Dar-es-Salaam, Tanga and Mtwara as well as international airports at Dar-
es-Salaam and Kilimanjaro. In addition, there are freshwater inland ports at strategic
locations on Lakes Victoria, Tanganyika and Nyasa; and
• Tanzania provides access to the landlocked countries of Burundi, the Democratic Republic
of the Congo, Malawi, Rwanda, Uganda and Zambia; and
• Tanzania is strategically located to service most of its landlocked neighbours and offers
many investment opportunities targeting the neighbouring States of Burundi, the Democratic
Republic of the Congo and Rwanda. A number of opportunities in service sectors such as
tourism, communication, education and health remain untapped.
10.2.1 Energy and Power generation
At present in Tanzania, 21% of the population with about 7.4 percent in the rural areas has access
to electricity. Tanzania is endowed with diverse energy sources, including biomass, natural gas,
hydro, coal, geothermal, solar and wind power and uranium, much of which is untapped.
Commercial energy sources, i.e. petroleum and electricity, account for about 8% and 1.2%,
respectively, of the primary energy used. Coal, solar and wind account for less than 1%.
The Tanzania power sector is dominated by a single vertically integrated national utility, Tanzania
Electricity Supply Company Ltd (TANESCO). The total plant generation capacity of public and
private power plants is 1,438.24 MW. There are many investment opportunities in this sector,
including:
• Generation, transportation and distribution of energy from various sources;
• Power infrastructure development, rehabilitation and expansion;
• Extraction of biofuels – ethanol from sugar; biodiesel from palm oil and jatropha;
• Construction of a petroleum pipeline and petroleum products offloading terminals,
development of upcountry storage and distribution facilities;
• Geothermal exploration and development;
• Rural electrification;
• Development of new and renewable energy resources; and
• Promotion of energy efficiency and conservation initiatives.
10.2.2 Infrastructure and Transportation
Improving the transportation infrastructure is a key priority for the government of Tanzania.
Developing the nation’s roads, ports, railways and airport infrastructure is critical to the country
improving its internal and external trade and commercial activities. The sector’s further development
68 | P a g e
includes improvements in the energy sector as Tanzania strives to become a middle-income
country:
• Infrastructure projects provide exciting opportunities for investors looking to capitalise on
Tanzania’s fast growing economy;
• Large road construction works as well as PPP opportunities in airport, rail and port projects;
• Huge untapped opportunities in the power generation sector, utilizing the country’s abundant
energy resources such as natural gas, coal, uranium and renewable resources; and
• Opportunities in the development of inland container depots and extended railway lines.
10.2.3 Mining
Tanzania has a wide variety of minerals, including diamonds, gold, base metals, gemstones and
industrial minerals. It is the continent’s third largest gold producer after South Africa and Ghana.
The mining sector has grown very rapidly in recent years. In 2017 alone, it grew by 8.5 percent,
exporting minerals such as gold, Tanzanite gemstones to other geographic regions. Investment
opportunities include:
• Processing of precious metals and gemstones;
• Establishing a caustic soda refinery plant in Engaruka;
• Production of iron ore and steel in Liganga;
• Processing of nickel in Kabanga;
• Extracting Uranium in Mkuju; and
• Investment in minerals smelters.
10.2.4 Human Settlement
The majority of households in Tanzania do not have access to formal finance. Rather, they depend
a great deal on their own savings and informal financial sources to pay for the land, building
materials and labour needed for construction. As a result, most people build their houses
incrementally over many years as resources become available.
Tanzania’s rapidly growing population, coupled with relatively high economic growth, presents an
excellent opportunity for both investors and other stakeholders investing in housing. These
opportunities can be reflected in the various housing projects that are undertaken by institutions
such as the National Housing Corporation (NHC) and Watumishi Housing Company (WHC). But a
significant housing deficit still exists.
Investors may form a synergy with the NHC or the Tanzania Building Agency (TBA), or other private
firms and provide commercial building solutions for residential and commercial purposes.
10.2.5 Logistics and Warehousing
Warehouses tend to be one of the most ignored elements of infrastructure and logistics, but they
are a fundamental part of the supply chain, critical for economic development and growth. High-
quality warehousing is not only needed for storage and distribution, but also for the packing,
processing, assembling and light manufacturing of goods, the foundations of any economy (World
Economic Forum, 2019).
Tanzania’s roads and railways are not the best in the region, but the government is making an active
effort to change that with the support of development finance institutions (DFIs). The African
Development Bank (AfDB) recently approved a $232.5 million loan for a Tanzania-Kenya road
project. Roads and railways are the key to improving distribution and life in Tanzania and to
69 | P a g e
broadening regional integration because most east African governments cannot afford it without
DFI money.
The growing improvement in roads and railways across East Africa opens opportunities for logistics
in a country where urbanisation stands at about 30 percent, and many farms operate at a significant
distance from the ports in Dar-es-Salaam. Fuel and electricity prices have undermined logistics and
warehousing generally in Africa, but the changing dynamics around these two factors in Tanzania
in the near future should boost returns. Prices for both fuel and electricity should slowly starting
decreasing with new investments in each sector. As they drop, manufacturing and industrials will
grow, giving way to a demand for logistics and warehousing for a multitude of sectors.
10.2.6 Information and Communications Technology
The potential in telecom and ICT in Tanzania remains largely untapped. But the potential is too
great to ignore and movement in the sector has already showed that the country is on the right
track. The government has poured large amounts of capital and energy into the National Fiber Optic
Cable network known as the National ICT Backbone (NICTBB). Following its connection to
submarine fiber optic cable operators EASSy and SEACOM, bandwidth costs dropped more than
80 percent.
The expansion and upgrade of towers in Tanzania boost mobile usage and leads to a drop in prices.
Some experts estimate that mobile usage could match Kenya in the next five to seven years. But
even with a growth in usage, there is more to be done to ensure that it adds the highest value to
the economy. Mobile banking, for example, has not reached anywhere near its full potential in the
Tanzanian market. The country is still very much unbanked with less than 20 percent having a
formal bank account. Kenya’s ICT darling M-Pesa has more than 40,000 agents across Tanzania,
a clear message about the growing opportunity in the country. More can be done, particularly with
the development of local companies as well as with the expansion of other African companies into
the country. There are enormous opportunities in the services sector, particularly ICT. The market
has changed rapidly over the last ten years and has increased number of subscribers, the variety
of services offered, and has seen the coverage area expand:
• Provision of mobile services especially in the rural areas as penetration is higher in urban
areas;
• Provision and operation of value added network/data services (internet, voice mail,
electronic mail services);
• Repair and maintenance of telecommunications facilities; and
• Huge potential in financial services which include establishment of financial institutions,
microfinance banks, investment banks, agricultural banks and commercial banks.
10.2.7 Agriculture and Agribusiness
Tanzania’s commercial-scale farming cannot keep up with growing demand. Tanzania is blessed
with diverse climate zones, fertile land, and water to support its agriculture. There are over 44 million
hectares of arable land available in Tanzania, with 29.4 million ha suitable for irrigation. Agriculture
has a huge role to play in the country’s industrialisation, offering the possibility of providing markets
for industrial products and raw materials for industries. Investment opportunities in agriculture
include:
• Undertaking in large-scale commercial farming of crops such as sugarcane, rice, wheat,
coffee, tea, sunflower, pulses, floriculture, cotton, sisal, grape, simsim and maize;
70 | P a g e
• Huge potential for sugarcane farming and sugar production. Sugarcane farming and sugar
production are supported by vast water sources, good climate conditions and huge market
potential;
• Huge potential in investment in agro-industries and agro-processing;
• Development of outgrowers to complement the sources of raw materials for the industries
as appropriate; and
• Expansion and improvement of irrigation systems; improvement of R&D in crops cultivation
10.2.8 Tourism and Leisure
Tanzania’s tourism industry is the fast-growing sector that offers plenty of investment opportunities.
Here are some of the opportunities waiting to be seized by entrepreneurs:
• Construction of tourist hotels in towns, game parks as well as along the coast line of
mainland Tanzania and the beautiful shores of the spice Island of Zanzibar;
• Establishment of leisure parks;
• Construction of golf courses;
• Investing in conference tourism facilities;
• Provision of air/ground transport;
• Tour operations and trophy hunting;
• Sea and lake cruising;
• Development of eco-tourism facilities; and
• Beach tourism, cultural and historical sites.
10.2.9 Aviation
This is one of the most highly profitable business enterprises one can get into because even the
government of Tanzania is ready to issue license to willing and capable investors to grow the
country’s aviation industry.
71 | P a g e
10.2.10 Human resource development
Tanzania has many expatriates serving in a number of fields. Trade liberalization and the
promulgation of the Education Policy of 1995 have attracted some private capital into education,
increasing the number and quality of training institutions in the country. Total foreign ownership is
allowed, as are other investment modes, including joint ventures, leases, and build-operate-transfer
(BOT) schemes.
Opportunities for investing in education are wideranging, from the establishment of schools,
colleges and universities to facilities such as catering, accommodation, recreation, sports, hospitals,
convention centres, and technology/industrial parks.
11 CONCLUSION
This report articulated information that is useful to key stakeholders in the cross-border value chain.
The information is envisaged to support and enhance cross-border road transport operations, cross-
border trade, trade facilitation, economic development and regional integration. Tanzania is a
member of several RECs in Africa, which demonstrates the country’s commitment to improving
trade and integration with other African countries. As articulated, there are many opportunities that
can be explored by investors, traders and transport operators in Tanzania particularly with respect
to transport and logistics, tourism, mining and agriculture. There are also many initiatives the
country is pursuing with the objective of improving trade with regional countries. Tanzania, like many
other African countries is a signatory to the African Continental Free Trade Agreement and this is
expected to create many opportunities in the cross-border industry.
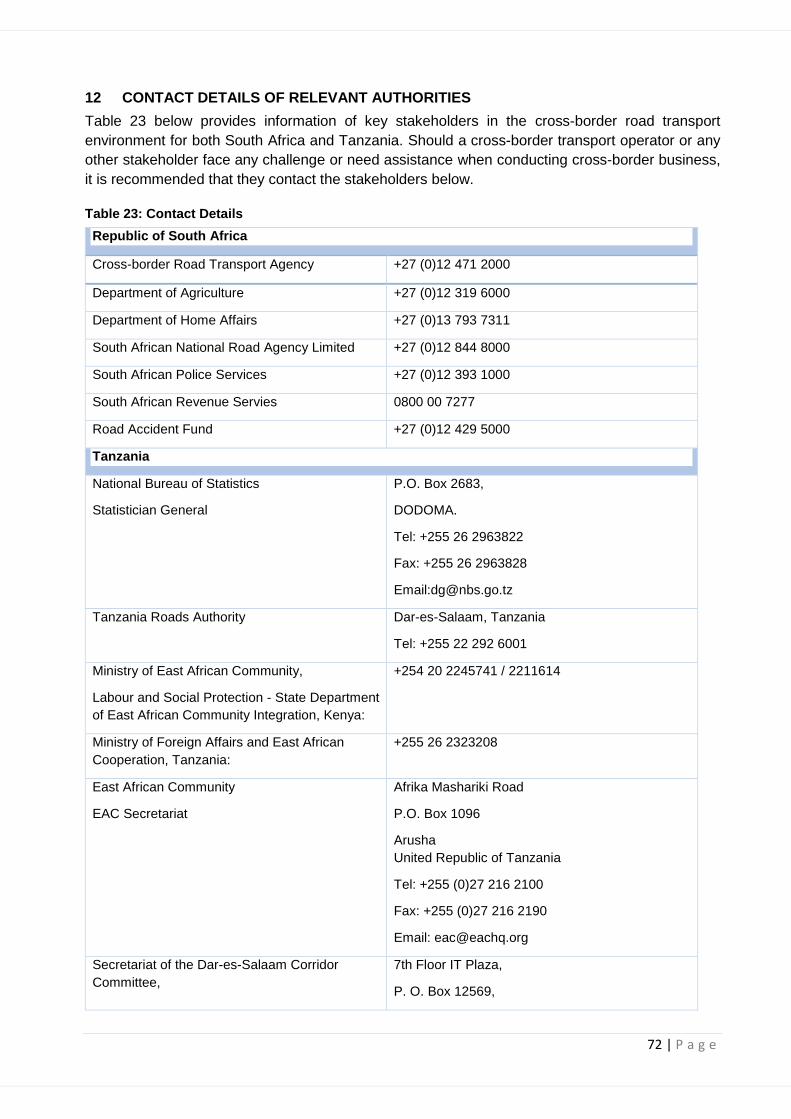
72 | P a g e
12 CONTACT DETAILS OF RELEVANT AUTHORITIES
Table 23 below provides information of key stakeholders in the cross-border road transport
environment for both South Africa and Tanzania. Should a cross-border transport operator or any
other stakeholder face any challenge or need assistance when conducting cross-border business,
it is recommended that they contact the stakeholders below.
Table 23: Contact Details
Republic of South Africa
Cross-border Road Transport Agency +27 (0)12 471 2000
Department of Agriculture +27 (0)12 319 6000
Department of Home Affairs +27 (0)13 793 7311
South African National Road Agency Limited +27 (0)12 844 8000
South African Police Services +27 (0)12 393 1000
South African Revenue Servies 0800 00 7277
Road Accident Fund +27 (0)12 429 5000
Tanzania
National Bureau of Statistics
Statistician General
P.O. Box 2683,
DODOMA.
Tel: +255 26 2963822
Fax: +255 26 2963828
Email:[email protected]
Tanzania Roads Authority Dar-es-Salaam, Tanzania
Tel: +255 22 292 6001
Ministry of East African Community,
Labour and Social Protection - State Department
of East African Community Integration, Kenya:
+254 20 2245741 / 2211614
Ministry of Foreign Affairs and East African
Cooperation, Tanzania:
+255 26 2323208
East African Community
EAC Secretariat
Afrika Mashariki Road
P.O. Box 1096
Arusha
United Republic of Tanzania
Tel: +255 (0)27 216 2100
Fax: +255 (0)27 216 2190
Email: [email protected]
Secretariat of the Dar-es-Salaam Corridor
Committee,
7th Floor IT Plaza,
P. O. Box 12569,

73 | P a g e
Executive Director
Dar-es-Salaam, Tanzania
Tel: +255 784 333 802
Surface and Marine Transport Regulatory
Authority (SUMATRA)
P.O. box 3093,
Dar-es-Salaam, Tanzania
Tel: +255 22 219 7500
Trade Mark, East Africa 2nd Floor, Fidelity Insurance Centre
Waiyaki Way, Westlands
+254 20 423 5000, +254 724 315 425, +254 737
423 500
Tanzania Ports Authority Headquaters 28 Edward Sokoine Drive,
11105 Mchafukoge, Ilala CBD,
P.O.Box 11491,
Dar-es-Salaam, Tanzania
Tel:+255 22 2119591-4
Tanzania Investment Centre (TIC)
Executive Director
P.O. Box 938
Dar-es-Salaam
Tel: +255 22 2116328-32
Fax: +255 22 2118253
Email: [email protected]
Website: www.tic.co.tz
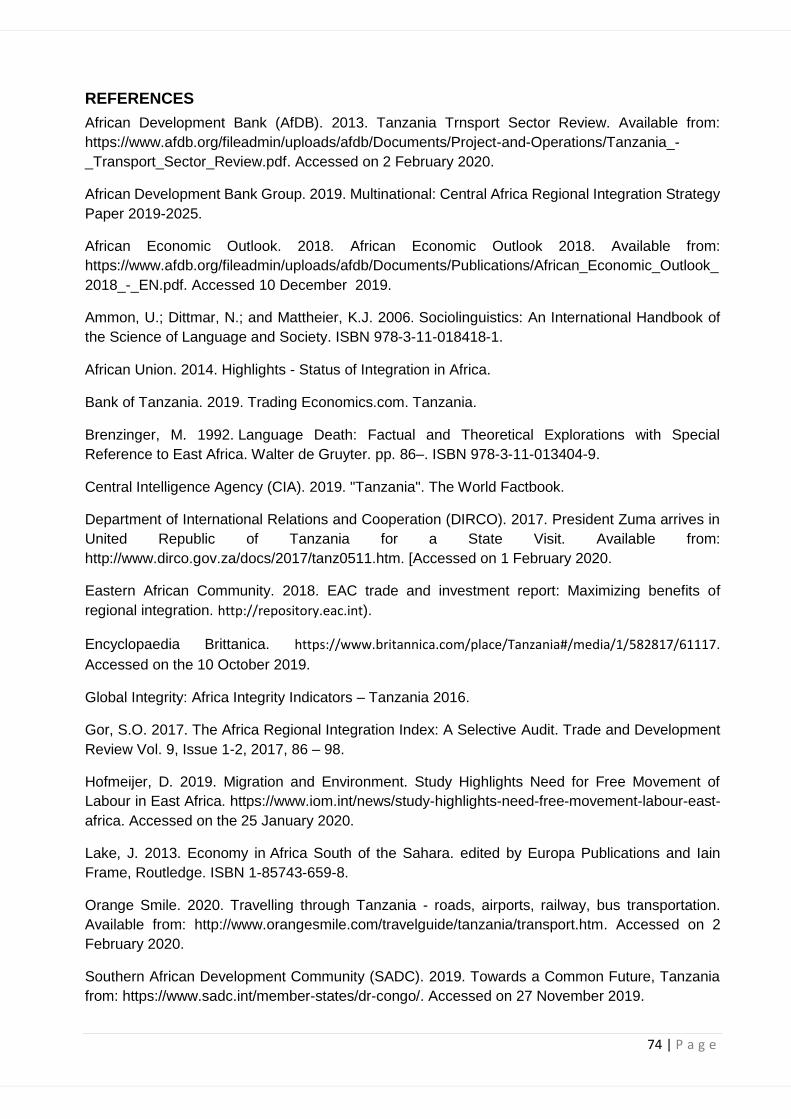
74 | P a g e
REFERENCES
African Development Bank (AfDB). 2013. Tanzania Trnsport Sector Review. Available from:
https://www.afdb.org/fileadmin/uploads/afdb/Documents/Project-and-Operations/Tanzania_-
_Transport_Sector_Review.pdf. Accessed on 2 February 2020.
African Development Bank Group. 2019. Multinational: Central Africa Regional Integration Strategy
Paper 2019-2025.
African Economic Outlook. 2018. African Economic Outlook 2018. Available from:
https://www.afdb.org/fileadmin/uploads/afdb/Documents/Publications/African_Economic_Outlook_
2018_-_EN.pdf. Accessed 10 December 2019.
Ammon, U.; Dittmar, N.; and Mattheier, K.J. 2006. Sociolinguistics: An International Handbook of
the Science of Language and Society. ISBN 978-3-11-018418-1.
African Union. 2014. Highlights - Status of Integration in Africa.
Bank of Tanzania. 2019. Trading Economics.com. Tanzania.
Brenzinger, M. 1992. Language Death: Factual and Theoretical Explorations with Special
Reference to East Africa. Walter de Gruyter. pp. 86–. ISBN 978-3-11-013404-9.
Central Intelligence Agency (CIA). 2019. "Tanzania". The World Factbook.
Department of International Relations and Cooperation (DIRCO). 2017. President Zuma arrives in
United Republic of Tanzania for a State Visit. Available from:
http://www.dirco.gov.za/docs/2017/tanz0511.htm. [Accessed on 1 February 2020.
Eastern African Community. 2018. EAC trade and investment report: Maximizing benefits of
regional integration. http://repository.eac.int).
Encyclopaedia Brittanica. https://www.britannica.com/place/Tanzania#/media/1/582817/61117.
Accessed on the 10 October 2019.
Global Integrity: Africa Integrity Indicators – Tanzania 2016.
Gor, S.O. 2017. The Africa Regional Integration Index: A Selective Audit. Trade and Development
Review Vol. 9, Issue 1-2, 2017, 86 – 98.
Hofmeijer, D. 2019. Migration and Environment. Study Highlights Need for Free Movement of
Labour in East Africa. https://www.iom.int/news/study-highlights-need-free-movement-labour-east-
africa. Accessed on the 25 January 2020.
Lake, J. 2013. Economy in Africa South of the Sahara. edited by Europa Publications and Iain
Frame, Routledge. ISBN 1-85743-659-8.
Orange Smile. 2020. Travelling through Tanzania - roads, airports, railway, bus transportation.
Available from: http://www.orangesmile.com/travelguide/tanzania/transport.htm. Accessed on 2
February 2020.
Southern African Development Community (SADC). 2019. Towards a Common Future, Tanzania
from: https://www.sadc.int/member-states/dr-congo/. Accessed on 27 November 2019.
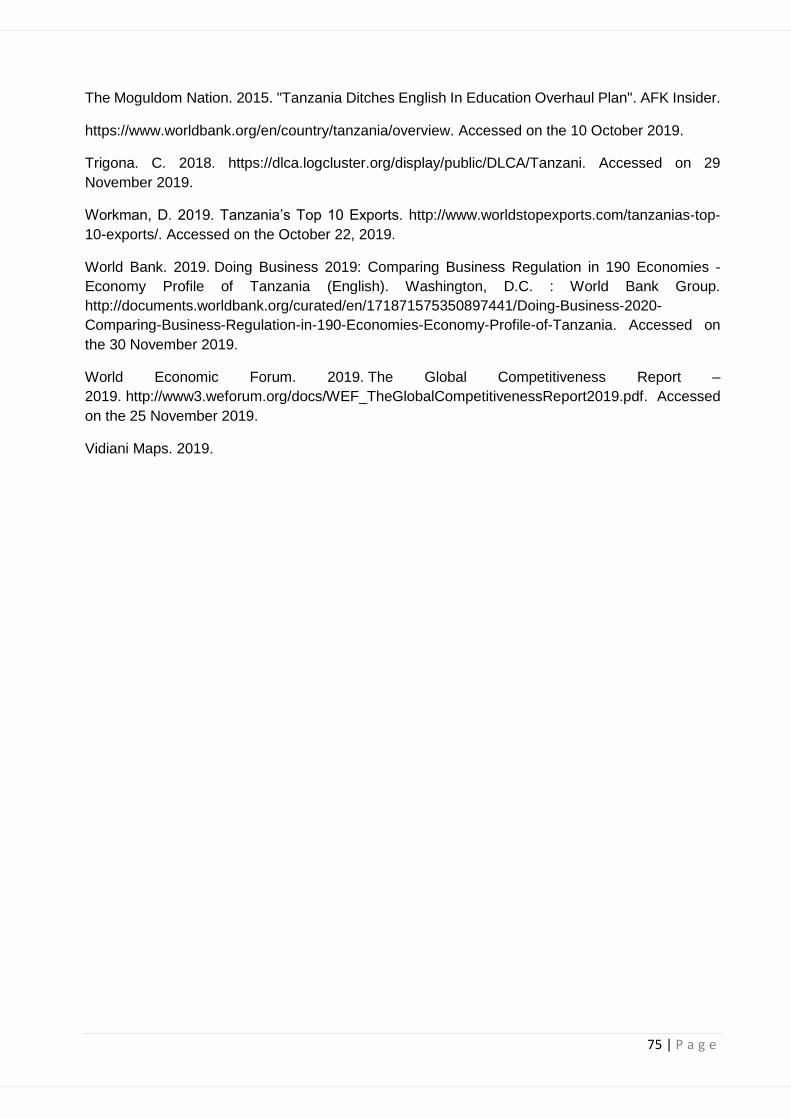
75 | P a g e
The Moguldom Nation. 2015. "Tanzania Ditches English In Education Overhaul Plan". AFK Insider.
https://www.worldbank.org/en/country/tanzania/overview. Accessed on the 10 October 2019.
Trigona. C. 2018. https://dlca.logcluster.org/display/public/DLCA/Tanzani. Accessed on 29
November 2019.
Workman, D. 2019. Tanzania’s Top 10 Exports. http://www.worldstopexports.com/tanzanias-top-
10-exports/. Accessed on the October 22, 2019.
World Bank. 2019. Doing Business 2019: Comparing Business Regulation in 190 Economies -
Economy Profile of Tanzania (English). Washington, D.C. : World Bank Group.
http://documents.worldbank.org/curated/en/171871575350897441/Doing-Business-2020-
Comparing-Business-Regulation-in-190-Economies-Economy-Profile-of-Tanzania. Accessed on
the 30 November 2019.
World Economic Forum. 2019. The Global Competitiveness Report –
2019. http://www3.weforum.org/docs/WEF_TheGlobalCompetitivenessReport2019.pdf. Accessed
on the 25 November 2019.
Vidiani Maps. 2019.