i BRAND EQUITY'S RELATIONSHIP TO PRODUCT FAILURE ...
38
i BRAND EQUITY’S RELATIONSHIP TO PRODUCT FAILURE Herschell Newman Submitted in partial fulfillment of the requirements for Departmental Honors in the Department of Marketing Texas Christian University Fort Worth, Texas by May 4 th , 2015
-
Upload
khangminh22 -
Category
Documents
-
view
2 -
download
0
Transcript of i BRAND EQUITY'S RELATIONSHIP TO PRODUCT FAILURE ...

i
BRAND EQUITY’S RELATIONSHIP
TO PRODUCT FAILURE
Herschell Newman
Submitted in partial fulfillment of the
requirements for Departmental Honors in the
Department of Marketing Texas Christian
University Fort Worth, Texas
by
May 4th, 2015

ii
BRAND EQUITY’S RELATIONSHIP
TO PRODUCT FAILURE
Project Approved:
Supervising Professor: Eric Yorkston, Ph.D.
Department of Marketing
Chris White, Ph.D.
Department of Marketing
Jon Carr, Ph.D.
Department of Management, Entrepreneurship and Leadership

iii

iv
ABSTRACT
Companies recognize that innovation is an extremely important aspect of
continual market domination. Companies that fail to innovate, often fail. However little is
understood of the relationship between a company’s brand equity and the success or
failure of its product innovations. This study seeks to explore the relationship between
brand equity and product failures specifically the effect that brand equity has on the
chance of product failure after launch in the primetime television market. Companies
with higher brand equity are expected to have a higher chance of product successes. This
hypothesis did not find support. Consequently, companies with lower brand equity were
found to not have a higher chance of product success. This study also proposes that brand
equity is not effected by product failures. Specifically the number of failures of a
company does not affect the brand equity. This hypothesis found support. A discussion of
these findings is presented below, along with directions for future research.

v
TABLE OF CONTENTS
INTRODUCTION .............................................................................................................. 1
LITERATURE REVIEW ................................................................................................... 3
Brand Equity ................................................................................................................... 3
Dimensions of Brand Equity ....................................................................................... 4
Brand Awareness .................................................................................................... 4
Brand Associations ................................................................................................. 6
Brand Equity Measurement ............................................................................................ 6
Brand Loyalty ............................................................................................................. 7
Perceived Quality ........................................................................................................ 8
Brand Association Measures....................................................................................... 8
Brand Awareness Measure ....................................................................................... 10
Market Behavior ....................................................................................................... 11
Product Creation and Launch ........................................................................................ 11
New Product Development ....................................................................................... 11
Product Launch ......................................................................................................... 11
Subsequent Product Performance ................................................................................. 12
Product Failure .......................................................................................................... 12
Product Success ........................................................................................................ 13
PRIMETIME TELEVISION MARKET .......................................................................... 14
vi
Ratings Measurement.................................................................................................... 15
Viewer Measurement .................................................................................................... 15
Research Design............................................................................................................ 15
Brand Equity ................................................................................................................. 16
Model ........................................................................................................................ 16
Results ....................................................................................................................... 17
Implications............................................................................................................... 19
Brand Equity and Product Failure................................................................................. 19
Model ........................................................................................................................ 19
Results ....................................................................................................................... 20
Interpretation: ............................................................................................................ 22
Model ........................................................................................................................ 22
Results ....................................................................................................................... 22
Interpretation ............................................................................................................. 23
Additional Considerations ............................................................................................ 23
Differences from Other Markets ................................................................................... 24
Similarities to Other Markets ........................................................................................ 26
CONCLUSION ................................................................................................................. 28
BIBLIOGRAPHY ............................................................................................................. 29

1
INTRODUCTION
Product development and release is a major part of every business. Business that
do not develop and release new products tend to not adapt to a shifting marketplace and
fall out of favor with consumers. Notable examples include companies like Nokia and
Kodak. Nokia was at one point was the largest mobile phone manufacturer in the world,
but it did not focus on creating innovative new products and has since been surpassed by
companies like Apple and Samsung. Kodak is another perfect example. Instead of
focusing on developing new products and innovating in the product category of
photography, Kodak maintained a strict focus on the production of film and film related
cameras. Kodak has been destroyed by this focus and the accompanying lack of
profitable, innovative new products.
A lot of research has been focused on finding what different factors contribute to
success in product development and launch (Ernest, 2002). Research has been done on
factors ranging from prototype testing to protocol of project definition prior to product
development (Ernest, 2002).
The product development process has been broken down significantly. Ernest
(2002) compiled an empirical survey of all research conducted on success factors
surrounding product development and launch. Ernest’s compilation includes over 100
individual papers written on various success factors of product development. Ernest

2
(2002) organizes these studies around the new product development process, the
organization of the company, the culture, and the involvement of management.
Research of specific product failures was done by Brady, Connic, Fox, and
Roehm. They looked at the effect of product failures on brand equity. Brady, Coninc, Fox
& Roehm (2008) found that following product failures brands with high equity have
higher satisfaction ratings then low equity brands, however the drop in satisfaction is
more immediate. However, they did not examine if the brand equity itself had any effect
on the success or failure of the product.
Liao and Cheng also looked into the effect of product failure on brand equity.
Liao & Cheng (2014) found that high equity brands will have better post-failure brand
evaluations than low equity brands. Also preannouncements vs. no preannouncements of
by high equity brands will create larger drops in evaluations then low equity brands.
Evaluations without the word of mouth of an opinion leader are worse post failure then
evaluations with. They did not look to see if brand equity played a role in the success or
failure of a product.
However, to date most studies have been focused on the factors pertaining to pre-
launch activities and launch itself. Very little research has actually been spent on the
relation between the brand equity of the company releasing the new product and the
product’s success rate. The objective of this study is to examine the aspects of the
relationship between brand equity and product success or failure. For example, do brands
with high equity have a better chance of having a successful product launch because the
high brand equity signifies trust and credibility, so consumers will be more likely to try
and like a new product with high brand equity? Does brand equity play no role in a

3
product’s success or failure? Do product success or failures effect our perceptions of
brand equity?
The difficulties faced with this process is isolating the effect of brand equity itself.
Companies with high brand equity tend to be large companies with much larger product
development, marketing, and launch budgets that their low equity counterparts. To
achieve this studies goals, a case study database will be compiled and associations
between low and high brand equity product launches will be examined.
LITERATURE REVIEW
Brand Equity
Brand equity is defined as the value that a brand name adds to a product when
compared to a product with identical features (Liao & Cheng, 2014). Practically
speaking, this would be the perceived difference between a Samsung phone and a phone
with identical features. Keller (2003) has a similar definition, “brand equity should be
defined in terms of marketing effects that are uniquely attributable to a brand” and further
explains this definition by saying, “That is, brand equity relates to the fact that different
outcomes result from the marketing of a product or service because its brand than if that
same product or service had not been identified by that brand”
Brand equity can be broken down into multiple dimensions. Aaker (1991, 1996)
defines brand equity of consisting of brand loyalty, brand awareness, perceived quality,
and brand associations. Shoker and Weitz (1988) define the dimensions of brand equity
as brand loyalty and brand associations. Keller (2003) defines the major components of

4
brand equity as brand awareness and brand associations. For the purposes of this study,
brand equity consists of brand awareness and brand associations.
This means that high brand equity would stem from high awareness and positive
brand associations. Conversely, low brand equity would be from very little awareness and
negative associations.
Dimensions of Brand Equity
Brand awareness and brand associations are incredibly complex concepts. To
better understand them, the definition and facets of each of these two components are laid
out below.
Brand Awareness
Aaker (1996) defines brand awareness as “the salience of the brand in the
customer’s mind”. This is an important component because without a basic awareness of
the brand, customers cannot build brand associations or a concept of perceived quality of
the brand. Awareness is the root of all consumer perceptions of a brand, and a
prerequisite for strong brand equity as well as a component.
Keller (2003) further elaborates on brand awareness with the point that brand
awareness consists of brand recognition and brand recall. According to Keller (2003)
“brand recognition relates to a consumer’s ability to confirm prior
exposure to the brand when given the brand as a cue. In other words,
brand recognition requires that consumers can correctly discriminate
the brand as having been previous seen or heard.”

5
Brand recall, according to Keller (2003), is the
“consumer’s ability to retrieve the brand from memory when given
the product category, the needs fulfilled by the category, or a purchase
or usage situation as a cue. In other words, brand recall requires that
consumers correctly generate the brand from memory when given a
relevant cue.”
The literature on this subject defines a couple of advantages of brand
awareness. Keller (2003) lists three specific advantages: learning advantages,
consideration advantages, and choice advantages.
Learning advantages are the advantages of a brand with high
awareness being able to easily form brand associations. Keller (2008)
specifically talks about the fact that the first step to creating brand
associations is for a brand to develop a memory node to attach those
associations too.
Consideration advantages specifically refers to a brand having an
advantage because it is part of a consumer’s consideration set, or in other
words the set of products that a consumer serious considers for purchase.
Choice advantages are gained by brands because they may be chosen
as the item for purchase because the only association to that brand is simply
that the consumer is aware of it. Keller (2003) says this advantage is most
likely to be considered with purchases that take very little involvement

6
Brand Associations
According to Aaker (1991), brand association is “anything linked in memory to a
brand”. According to Keller (2003) positive brand associations are strong, favorable, and
unique. Keller (2003) defines strength as a function of both the amount of processing that
information receives in addition to the nature of that processing. This function is effected
by the personal relevance of that information and the consistency with which that
information is presented over time.
Keller (2003) says, “In the most basic sense, favorable brand associations are
created by convincing consumers that the brand possesses relevant attributes and benefits
that satisfy their needs and wants”. Keller also says “favorable associations for a brand
are those associations that are desirable to consumers and are successfully delivered by
the product and conveyed by the supporting marketing program for the brand”.
Keller (2003) also discusses the fact that brand associations may be shared with
competing brands. “The essence of brand positioning is that the brand has a sustainable
competitive advantage or “unique selling proposition” that gives consumers a compelling
reason why they should buy that particular brand” (Keller, 2003). Therefore, it is
important for a brand to have unique brand associations.
Brand Equity Measurement
Because brand equity is so complex and intangible, its measurement is difficult.
Brand equity has many facets. Below, Aaker (1996) defines ten brand equity measures.
They are organized into measures of brand loyalty, perceived quality, brand association
measures, brand awareness, and market behavior. Brand Loyalty, perceived quality, and

7
brand association measures are all facets of the larger component of brand association
defined above, while brand awareness and market behavior can be considered part of the
larger component of brand awareness. The difference in breakdown is due to differing
conceptualizations of brand equity.
Brand Loyalty
Brand Loyalty is defined as “a deeply held commitment to rebuy or repatronize a
preferred product or service consistently in the future, despite situational influences and
marketing efforts having the potential to cause switching behavior” (Oliver, 1997). High
brand loyalty means that there is a high chance of a consumer buying a specific product
again, despite the marketing efforts of competitors.
Aaker (1996) gives two measures for brand loyalty: price premium and
satisfaction/ loyalty. Price premium is the measure of how much more a customer will
pay for a specific brand over competitor brands offering similar benefits. Price premiums
can be both positive and negative. Aaker (1996) also suggests segregating customers in
the market by loyalty, because mixing groups will cloud the true price premium in each
group.
Aaker (1996) also provides another measure of loyalty as customer satisfaction.
High satisfaction can indicate habitual use of a product. The issue with customer
satisfaction is that it cannot be applied to non-customers. Customer’s need to use the
product before they can determine their satisfaction.

8
Perceived Quality
Quality is the measure of superiority or excellence, so according to Zeithaml
(1988) perceived quality is the judgment of a consumer about the products overall
superiority or excellence. It is important to note that perceived quality is a consumer’s
judgment, so it is different from objective quality. However, Zeithaml also argues that
objective quality may not exist due to the fact that all quality is perceived by someone,
and that there is no truly objective measure of quality. What matters in this case, is that
the quality is perceived by consumers.
Aaker (1996) suggests using scales to measure perceived quality ranking products
from higher than average quality to lower than average quality. However problems exist
in providing the right competitor frame of reference for customers. Additionally,
customers should be segmented by loyalty.
Another measure of perceived quality mentioned by Aaker (1996) is leadership.
He suggests measuring it with scales asking whether the brand is (1) a leading brand vs.
one of the leading brands vs. not one of the leading brands; (2) growing in popularity; (3)
innovative, first with advances in product or service. This measure has not been
researched as fully as the other ones mentioned to this point, so there is very little
evidence backing its use.
Brand Association Measures
Aaker (1996) breaks brand associations into three different measures: (1) brand
value; (2) brand personality; (3) organizational associations. Brand value treats the brand
as a product and asks customers to define the brand’s value proposition. Aaker (1996)
specifically lists “whether the brand provides good value for the money” and “whether

9
there are reasons to buy this brand over competitors” as two assessing measures. This
measure does suffer to sensitivity to the frame of reference of the customer. Aaker (1996)
also points out that there may not be a significant difference between brand value and
perceived quality measures, but goes on to say that “perceived quality has a higher
association with prestige and respect that a brand holds, while value relates more to
functional benefits and the practical utility of buying and using the brand.” This measure
will need to be carefully assessed on a case by case bases to determine if it is truly
different then perceived quality.
Aaker (1996) also mentions brand personality. He summarizes this as treating the
brand as a person. This measure gets at the brand’s emotional and self-expressive
benefits. This measure is especially strong for “brands that have only minor physical
differences and that are used in a social setting where the brand can make a visible
statement about the consumer” (Aaker, 1996). Aaker (1996) goes on to list specific scales
that can be used to ascertain a brand’s personality.
“Candidate scales might include:
This brand has personality
This brand is interesting
I have a clear image of the type of person who would use the brand”
It is important to note that not all brands can be assessed as people and that brands that
have strong brand value are not good candidates for brand personality tests.
Aaker’s (1996) final test of brand association looks at the brand from a
organizational perspective, specifically the people, values, and programs. This measure is

10
particularly good for measuring brands when they have similar attributes, when the
organization is extremely visible, or when looking at a large corporate brand. Aaker
(1996) says that, “[o]rganizational associtations that are often important bases of
differentiation and choise include having a concern for customers, being innovative,
striving for high quality, being successful, having visibility , being oriented toward the
community, and being a global player”. This measure needs to be assessed on a company
by company basis because it may not be a very strong measure for some product
categories.
Brand Awareness Measure
Aaker (1996) breaks awareness into different strata: recognition, recall, top of
mind, brand dominance, brand knowledge, and brand opinion. Recognition, recall, top of
mind, and brand dominance are all varying levels of a brand’s awareness. Recognition
signifies that a consumer has heard of the brand. Recall means that the consumer would
remember a brand in the evoked set of a specific product category. Top of mind means
that the brand is the prototype of a particular category. Brand dominance means the brand
is the only one recalled (ex. Kleenex being the only facial tissue a customer can
recognize). Brand knowledge involves customers knowing the message of the brand.
Brand opinion means that customers have an opinion about the brand.
Aaker (1996) cautions that this measure is difficult to compare across brands and
categories. For some brands recognition level is important, but for others brand
dominance is more important. Also it is important to measure the brand name and
associated imagery, not just name.

11
Market Behavior
Aaker (1996) also recognizes market share and market price and distribution
coverage as measures of brand equity. These two measures should be used together to
assess the brand’s market behavior, and are much more powerful when both are included.
Market share is a measure of the amount of the total market that buys from a specific
brand. Market price and distribution coverage measures the percentage of stores carrying
the brand or the percentage of people who have access to it.
Product Creation and Launch
New Product Development
Related literature in this field assesses product success and failure, and the factors
that lead up to it. Ernest (2002) breaks it into two parts: new product development and
product launch. Ernest (2002) summarizes the empirical data when he says “Four aspects
have a positive influence on the financial success of a new product: (1) clear definition of
the product before development begins […] (2) high quality preparatory work on the
project, in which the idea is initially broadly defined – subsequently more detailed
technical and market-oriented feasibility studies, along with a commercial evaluation of
the NPD project must be conducted; (3) clear orientation of the NPD process to market
demands, principally in the form of market research activity and the observation of the
competition; and (4) the existence of a high-quality NPD process.”
Product Launch
Product launch is the actual release of a product into the consumer market.
Launch strategies vary widely. Bhalla (2013) specifically identifies a waterfall or
sequential launch and the sprinkler or simultaneous launch. Sequential launch “allows

12
subsequent customers to observe the decisions of prior customers, thereby assisting them
in assessing its value” (Bhalla, 2013). Simultaneous launch happens in all markets at the
same time allowing revenue generation from all possible customers.
Bhalla (2013) finds that the optimal launch strategy is sequential with a lowering
average optimal price over time. Simultaneous launch is only desirable if the product has
a high assessable probability of success. For the purposes of this paper, a product launch
is the release of a product into a market.
Schneider & Hall (2011) five major flaws of product launches. (1) The company
can’t support fast growth; (2) The product falls short of advertising claims (3) The new
item exists in “Product Limbo” which refers to a product’s benefits not being able to
sway buyers to it’s buy it because of it’s specific benefits; (4) The product defines a new
category and requires substantial consumer education, but doesn’t get it; (5) The product
is revolutionary, but there’s no market for it.
Subsequent Product Performance
Product Failure
Product launch is easier to identify then product success or failure. Both are very
subjective and depend on the company. Product success or failure cannot purely be
identified as the revenue generated by the product, or even the revenue generated by the
product in relation to other products in its field. Also net profit cannot be used due to the
variation from industry to industry. A definition must be determined that is flexible
enough to allow for failure to be recognized across industries.
13
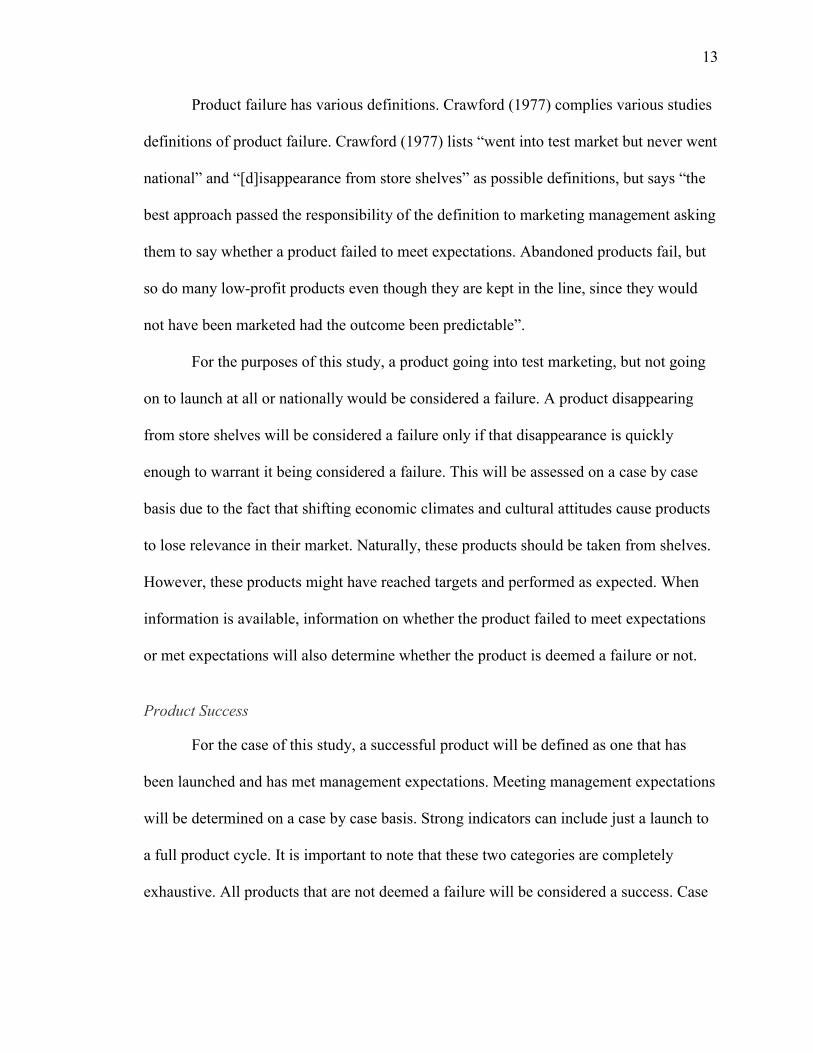
Product failure has various definitions. Crawford (1977) complies various studies
definitions of product failure. Crawford (1977) lists “went into test market but never went
national” and “[d]isappearance from store shelves” as possible definitions, but says “the
best approach passed the responsibility of the definition to marketing management asking
them to say whether a product failed to meet expectations. Abandoned products fail, but
so do many low-profit products even though they are kept in the line, since they would
not have been marketed had the outcome been predictable”.
For the purposes of this study, a product going into test marketing, but not going
on to launch at all or nationally would be considered a failure. A product disappearing
from store shelves will be considered a failure only if that disappearance is quickly
enough to warrant it being considered a failure. This will be assessed on a case by case
basis due to the fact that shifting economic climates and cultural attitudes cause products
to lose relevance in their market. Naturally, these products should be taken from shelves.
However, these products might have reached targets and performed as expected. When
information is available, information on whether the product failed to meet expectations
or met expectations will also determine whether the product is deemed a failure or not.
Product Success
For the case of this study, a successful product will be defined as one that has
been launched and has met management expectations. Meeting management expectations
will be determined on a case by case basis. Strong indicators can include just a launch to
a full product cycle. It is important to note that these two categories are completely
exhaustive. All products that are not deemed a failure will be considered a success. Case

14
where there is not enough information yet to determine a product’s status as either a
failure or a success will be excluded.
PRIMETIME TELEVISION MARKET
To measure the association between brand equity and product failure, this study
used primetime television. Traditional Primetime television is defined as the block of
shows spanning from 8:00 PM to 11:00 PM East Coast time, Monday through Friday
(“What Time Is Really Primetime”). The idea is that most television watchers come
home from work and sit down to watch television at this time since it is after the end of
the workday and the traditional American dinner time, but before bed. Primetime
television has traditionally been dominated by the five major American television
broadcasting networks were used as the companies to issuing new products. These
networks were: American Broadcasting Company (ABC), Columbia Broadcasting
System (CBS), National Broadcasting Company (NBC), Fox Broadcasting Company
(Fox), and the CW Television Network (CW).
In this market, companies buy 30 second advertising spots from broadcast
networks that are aired at commercial breaks of television shows with the purpose of
reaching consumers with a message. Broadcasting networks are selling access to
consumer groups through their shows. The product is the audience that the television
show attracts, and the customer is the company. Each television show is considered a
product. Products can continue to run for multiple seasons, or only air for one season.
Primetime Television was chosen because information could be easily obtained
about whether products failed or not. In this study, a show was deemed a failure if it

15
didn’t come back for another season. This clearly meets the definition of not meeting
expectations since managers have chosen to refuse to invest additional funds into the
production of another season of the show.
Also, primetime television is a good market to explore because of the rapid launch
and subsequent failure or success of shows. Over 300 shows aired from 2008 to 2014
during the primetime television slot. The abundance of data makes it a good market for
the use of regression equations to explore various correlations.
Ratings Measurement
For this study, Nielsen ratings were used. In the Nielsen rating point system, one
point is equivalent to on 1% of the specific Nielsen Universe being measured. The
specific universe used to acquire ratings was the 18-49 year olds demographic (“Numbers
101”). For the purpose of this study, ratings were pulled from the site
tvbythenumbers.zap2it.com which publishes each year’s ratings, viewers, and average ad
spot from Nielsen.
Viewer Measurement
The number of viewers breaks this out into the total number of viewers watching
a specific program but does not put the number in a specific Nielsen Universe. Instead it
just lists the total number of viewers.
Research Design
To study the relation between brand equity and product failure, product data was
compiled on primetime television programs. For the purpose of the study, thirty second
ad spot cost on various programs was used as the measure of the relation between brand
16
equity and failures. Records were created on primetime television shows recording
network, ABC, CBS, NBC, Fox, and CW, thirty second ad spot costs, times, ratings, and
viewers. Data was gathered on each of the shows as an individual record. 679 individual
records were created spanning the time period between 2008 and 2014 for ad spots and
ratings covering 312 shows. Ratings could not be acquired for 2014 due to the recent
nature of the information. Each record lists out the name of the show, the network that it
aired on, the year, the day, the time, the Nielsen rating it received, the Nielsen viewers,
the ad rate of the show, and the number of seasons the show aired for in total.
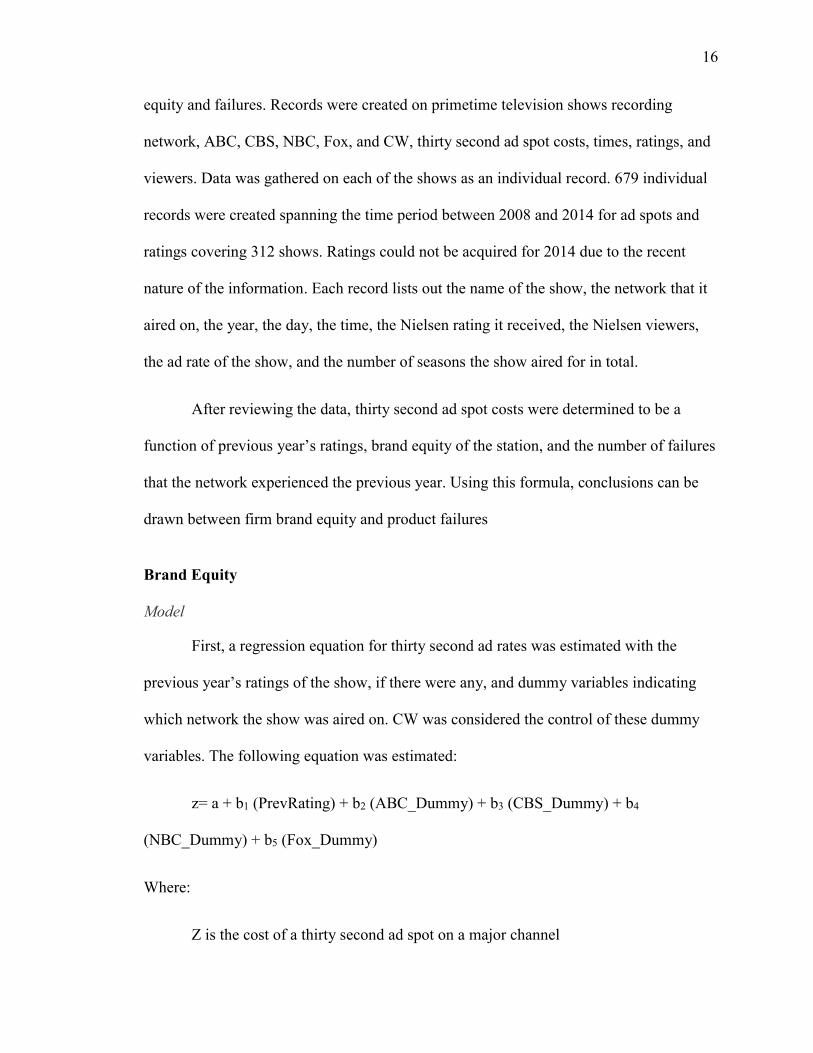
After reviewing the data, thirty second ad spot costs were determined to be a
function of previous year’s ratings, brand equity of the station, and the number of failures
that the network experienced the previous year. Using this formula, conclusions can be
drawn between firm brand equity and product failures
Brand Equity
Model
First, a regression equation for thirty second ad rates was estimated with the
previous year’s ratings of the show, if there were any, and dummy variables indicating
which network the show was aired on. CW was considered the control of these dummy
variables. The following equation was estimated:
z= a + b1 (PrevRating) + b2 (ABC_Dummy) + b3 (CBS_Dummy) + b4
(NBC_Dummy) + b5 (Fox_Dummy)
Where:
Z is the cost of a thirty second ad spot on a major channel

17
A is the slope intercept of the estimated regression equation
PrevRating is the previous year’s ratings of the show, if available. If the Previous
year’s ratings were not available the data was excluded from the regression
equation.
ABC_Dummy is the dummy variable for ABC.
CBS_Dummy is the dummy variable for CBS.
NBC_Dummy is the dummy variable for NBC.
Fox_Dummy is the dummy variable for Fox.
Results
The regression equation was run in IBM SPSS.
R – This is the correlation coefficient. It ranges from -1 to 1 where -1 is a negative
correlation, and 1 is a positive correlation. R is used in the comparison of models. A
higher R means a better correlation in the model between the regression equation and the
thirty second ad spot value being predicted.
R2 - This is the coefficient of determination. It is represented as a percent and is another
measure of the correlation of a model. An R2 of 0% is no correlation, whereas the higher
the R2 the better the model is at predicting the outcome.
Figure 1a: Model Summary
Model R R Square
Adjusted R
Square

18
1 .683a .466 .458
a. Predictors: (Constant), Fox_Dummy, PrevRating, NBC_Dummy,
ABC_Dummy, CBS_Dummy
After running the regression, the model has an R of .683 and a R2 of .466. This means
that we can determine that the regression fits the data with a positive correlation, and that
it explains about 46% of the variation of the data.
The outcome of the regression is displayed in Figure 1b. All of the variables were
determined to be significant. The following values were shown as the beta coefficents.
B1 = $26,271.45
B2 = $15,574.34
B3 = $57,065.52
B4 = $48,709.59
B5 = $110,598.91
Figure 1b: Coefficientsa
Model
Unstandardized Coefficients
Standardized
Coefficients
t Sig. B Std. Error Beta
1 (Constant) 26271.453 8865.900 2.963 .003
PrevRating 15574.342 1430.958 .464 10.884 .000
ABC_Dummy 57065.523 10971.784 .338 5.201 .000
CBS_Dummy 48709.593 11163.653 .296 4.363 .000
NBC_Dummy 44194.177 11588.327 .221 3.814 .000
Fox_Dummy 110598.908 11553.340 .578 9.573 .000
a. Dependent Variable: AdRate

19
Implications
After examining the results of the regression model, all of the variables used to
create the model are significant. Furthermore, the dummy variables for the broadcast
companies provided added monetary value above and beyond that of just ratings. This
supports the idea that different prime time television networks have different brand
equity, since different monetary values are purely associated with the broadcast company
that aired the show. The largest bump was received by Fox and accounted for an increase
in thirty second ad spot cost of $110,598.91. Conversely the intercept is the brand equity
of the CW which was $26,271.45.
Brand Equity and Product Failure
Next, a regression equation was modeled including the network’s previous year’s
product failures. This model included the previous variables, with the CW as the control
for the regression equation, and the added variable of previous year’s product failures.
This was included to see if it had any effect on the next year’s thirty second ad spot rate.
Model
The equation was estimated as:
z= a + b1 (PrevFailure) + b2 (ABC_Dummy) + b3 (CBS_Dummy) + b4 (NBC_Dummy) +
b5 (Fox_Dummy) + b6 (PrevRating)
Where:
Z is the cost of a thirty second ad spot on a major channel
A is the slope intercept of the estimated regression equation

20
PrevFailure is the previous year’s failures of the specific network running that
show.
ABC_Dummy is the dummy variable for ABC.
CBS_Dummy is the dummy variable for CBS.
NBC_Dummy is the dummy variable for NBC.
Fox_Dummy is the dummy variable for Fox.
PrevRating is the previous year’s ratings of the show, if available. If the Previous
year’s ratings were not available the data was excluded from the regression
equation.
Results
The regression equation was run in IBM’s SPSS.
R – This is the correlation coefficient. It ranges from -1 to 1 where -1 is a negative
correlation, and 1 is a positive correlation. R is used in the comparison of models. A
higher R means a better correlation in the model between the regression equation and the
thirty second ad spot value being predicted.
R2 - This is the coefficient of determination. It is represented as a percent and is another
measure of the correlation of a model. An R2 of 0% is no correlation, whereas the higher
the R2 the better the model is at predicting the outcome.
Figure 2a: Model Summary
Model R R Square Adjusted R
Square
Std. Error of the
Estimate

21
1 .667a .445 .431 56236.320
a. Predictors: (Constant), PrevRating2, PreviousYearFailures, Fox,
NBC, CBS, ABC
The estimated model has an R of .667 and a R2 of .445.The regression fits with a
positive correlation and explains 38% of the variation of the data. This model has a lower
rate of correlation then the previous model just explaining brand equity.
Figure 2b: Coefficientsa
Model Unstandardized Coefficients Standardized
Coefficients
t Sig.
B Std. Error Beta
1
(Constant) 24210.656 12896.003 1.877 .062
PreviousYearFailures 1376.961 2568.155 .036 .536 .592
ABC 58132.723 15467.320 .346 3.758 .000
CBS 48077.948 14379.769 .283 3.343 .001
NBC 31761.750 16265.600 .162 1.953 .052
Fox 113576.372 14708.139 .590 7.722 .000
PrevRating 13768.015 1854.195 .408 7.425 .000
a. Dependent Variable: AdRate
Figure 2b provides the coefficients of the variables as:
B1 = $1,376.96
B2 = $58132.72
B3 = $48,077.94
B4 = $31,761.75
B5 = $113,576.37
B6 = $13768.015

22
Interpretation:
When creating a model that accounts for both equity and failures, the dummy
variables representing equity were still significant, but the variables representing previous
year’s failures were not significant in the ad spot revenue.
Model
Since product failure is a binary event, in this case it could be represented as 1
being a product success or a television show stays on for more than one season, or 0 a
television show fails and is taken off the air after one season, it is possible for a logistic
regression to be run in this case. Using the data gleaned from the previous two
regressions about brand equity, the broadcasting companies can be separated into high
and low equity companies. The difference was drawn at a brand equity of $50,000 in for
the dummy variable in the first regression equation. Therefore, Fox and ABC were
deemed to have high brand equity and CBS, NBC, and CW were deemed to have low
brand equity. Using these two variables logistic regression was run to see the effect that
a binary brand equity variable had on a binary success/failure variable.
Results
The logistic regression was run in IBM’s SPSS.
Figure 3a: Case Processing Summary
Unweighted Casesa N Percent
Selected Cases
Included in Analysis 429 100.0
Missing Cases 0 .0
Total 429 100.0
Unselected Cases 0 .0
Total 429 100.0

23
a. If weight is in effect, see classification table for the total number of
cases.
Figure 3b: Variables in the Equation
B S.E. Wald df Sig. Exp(B)
Step 1a BrandEquity -.268 .279 .924 1 .336 .765
Constant 1.946 .199 96.084 1 .000 7.000
a. Variable(s) entered on step 1: BrandEquity.
Figure 3a shows that 429 cases were used for the analysis. Figure 3b shows
variable calculated for brand equity has a significance of .336 meaning that it is not a
significant predictor of success or failure.
Interpretation
This supports the previous regression equation’s analysis of product failure in
relation to brand equity. The logistic regression shows us that brand equity is not a
significant predictor of product failure in this data set.
Additional Considerations
Using the previous regression, a comparison between company equity and the
percent of shows that failed in the 2008 to 2014 timeframe can be compiled. The
following chart, Table 1, compares network equity to the number of shows launched, the
number of shows that failed, and the percentage of new shows that failed
Table 1: Network Equity and Shows Launched from 2008 to 2014

24
Network Equity
New Shows
Launched
Number that
Failed
% of New Shows that
Failed
ABC $ 62,014.67 59 38 64% CBS $ 47,943.17 34 20 59% NBC $ 35,875.00 63 41 65% Fox $ 114,841.92 43 25 58% CW $ 27,794.44 26 17 65%
The table above supports the previous conclusion that equity does not have a
significant effect on product failure rate. In fact, all five networks had a very similar
product failure rate that ranged between 58% to 65%. Chart 1 below visually represents
this.
Differences from Other Markets
Primetime television has some major differences from other major product
markets. The beginning stages of the product development process are for the most part
similar. Product ideas are generated in much the same way, but the testing process is
64%59%
65%58%
65%
0%
10%
20%
30%
40%
50%
60%
70%
80%
90%
100%
$-
$20,000.00
$40,000.00
$60,000.00
$80,000.00
$100,000.00
$120,000.00
$140,000.00
ABC CBS NBC Fox CW
Per
cent
of
New
Sho
ws
that
Fai
l
Net
wor
k E
quit
y
Equity Compared to Percent of Shows that Fail

25
radically different than other markets. Extensive test markets cannot be performed in the
primetime television markets.
Another major difference is the number of new shows introduced each year. In
total the percent varies from 30% to almost 40% with some individual networks reaching
65%. This is an incredibly high turnover of product offering. Table 2, below, shows the
number of shows launched each year as a percent of the total shows aired during
primetime television.
Table 2: Number of Shows Launched as a Percent of Total Shows Aired
2008 2009 2010 2011 2012 2013 2014
ABC 21% 52% 21% 36% 36% 43% 32% CBS 23% 19% 29% 22% 14% 21% 27% NBC 42% 40% 50% 36% 45% 35% 65% Fox 21% 31% 27% 38% 33% 33% 46% CW 43% 25% 30% 40% 27% 50% 27%
Total 30% 36% 31% 34% 34% 35% 39%
Another major difference is the average failure rate. The data compiled for this
study led to an average failure rate of 62%. According to Castellion and Markaham
(2012), product failure rates hover around 40%. Obviously there is a significant
difference between the average rate and the rate of failure in the television market. This
could stem from the fact that it is hard to test the commercial feasibility of new television
shows.
Another major difference is the guarantee of a new product getting a spot in front
of end consumers. New shows are guaranteed a show time on the network that produces

26
them. This is not the same in other markets, especially the consumer packaged goods
market, where products may not get a spot on store shelves.
Similarities to Other Markets
However the primetime television market is similar in the respect that it does
meet two types of customer needs. Television shows have the unique position of
satisfying both major customer groups. They are created and marketed towards the
general consumer population. However, ad spots are sold to other businesses.
Another major similarity is the fact that even though the product lifecycle for
television shows is shorter, it is still the same product life cycle. The seven years of data
compiled for this study represent over 300 shows and 141 failures. This means that the
analysis is robust.
Also, the television shows themselves tend to follow the same product life cycle
curve. Chart 2 shows the average ad rate for shows by their season. Ad rates tend to be
low, then increase around the middle of the show’s life, then taper off. Show Ratings by
season, follow a similar trend. Chart 3 shows average rating by season, and Chart 4
superimposes the two over each other.

27
$-
$50,000.00
$100,000.00
$150,000.00
$200,000.00
$250,000.00
1 2 3 4 5 6 7 8 9 10
Ave
rage
Ad
Sp
ot C
ost
Chart 2: Average Ad Spot by Seasons on Air
0.00
0.50
1.00
1.50
2.00
2.50
3.00
3.50
4.00
4.50
5.00
1 2 3 4 5 6 7 8 9 10
Chart 3: Average Rating by Seasons on Air

28
CONCLUSION
This analysis would support the previous research into brand equity. It seems that
customers assign additional value to a network above and beyond what can be accounted
for purely by the benefits of the product. Since both regressions accounted for ratings,
which would be the data that marketers have available when purchasing ad spots for the
coming year, the premium that marketers are willing to pay for a spot on Fox or ABC
over that of what they would pay for a spot on CBS, NBC, or CW was significant.
However, brand equity does not necessarily effect whether products succeed or
fail. The product itself is more important when determining success or failure. Both linear
and logistic regression equations did not show brand equity as a significant variable in
product failures or successes.
0.00
0.50
1.00
1.50
2.00
2.50
3.00
3.50
4.00
4.50
5.00
$-
$50,000.00
$100,000.00
$150,000.00
$200,000.00
$250,000.00
1 2 3 4 5 6 7 8 9 10
Ave
rage
Ad
Sp
ot C
ost
Chart 4: Average Ad Spot by Seasons on Air Compared to Average Rating
29
More importantly, this analysis suggests that product failures, within the normal
industry expectations, don’t actually effect brand equity. Broadcast television companies
with high and low brand equity still had a very similar percentage of failures. This means
that the value that customers ascribe to a brand is pretty resistant to failure by the
company’s ability to produce successful products.
ADDITIONAL RESEARCH
Additional research in this area should look to expand on other primetime
television networks. This will allow for analysis of more, lower brand equity networks to
see if the conclusions reached in this study are supported in other studies. Additional
research should be done on other industries to see if the conclusions hold true in other
industries, particularly consumer products industries. Different industries might have
different perceptions of failure so the conclusions reached here, might not hold true.
BIBLIOGRAPHY
Ernst, H. (2002). Success Factors of New Product Development: A Review of the
Empirical Literature. International Journal Of Management Reviews, 4(1), 1.
Brady, M. K., Cronin, J., Fox, G., & Roehm, M. L. (2008). Strategies to offset
performance failures: The role of brand equity. In Journal of Retailing (84th ed.,
pp. 151-164). N.p.: Elsevier. Retrieved April 10, 2014, from Business Source
Complete

30
Liao, S., & Cheng, C. C. (2014). Brand equity and the exacerbating factors of product
innovation failure evaluations: A communication effect perspective. In Journal of
Business Research (67th ed., Vols. 2919 - 2925, pp. 2919-2925). N.p.: Elsevier.
Retrieved April 10, 2014, from Business Source Complete.
Aaker, D. A. (1996). Measuring brand equity across products and markets. California
Management Review, 38102-120.
Crawford, C. M. (1977). Marketing Research and the New Product Failure Rate. Journal
Of Marketing, 41(2), 51-61.
Liao, S., & Cheng, C. C. (2014). Brand equity and the exacerbating factors of product
innovation failure evaluations: A communication effect perspective. In Journal of
Business Research (67th ed., Vols. 2919 - 2925, pp. 2919-2925). N.p.: Elsevier.
Retrieved April 10, 2014, from Business Source Complete.
Yoo, B., Donthu, N., & Lee, S. (2000). An Examination of Selected Marketing Mix
Elements and Brand Equity. Journal Of The Academy Of Marketing
Science, 28(2), 195-211.
Aaker, David A. 1991 Managing Brand Equity and 1996 Measuing brand equity across
products and markets and 1994 The financial information content of perceived
quality
Shocker and Weitz 1988 “A perspective on brand equity principles and issues”
Zeithaml, V. A. (1988). Consumer Perceptions of Price, Quality, and Value: A Means-
End Model and Synthesis of Evidence. Journal Of Marketing, 52(3), 2-22.

31
Olver, Richard L. 1997. Satisfaction: A behavioral Perspective on the Consumer. New
York: McGraw-Hill
Castellion, George, and Stephen K. Markham. "Perspective: New Product Failure Rates:
Influence Ofand Self-Interest." Journal of Product Innovation Management 30.5
(2013): 976-79. Web.
Bhalla, M. (2013). Waterfall Versus Sprinkler Product Launch Strategy: Influencing the
Herd Waterfall Versus Sprinkler Product Launch Strategy: Influencing the Herd.
Journal Of Industrial Economics, 61(1), 138-165.
Ernst, Holger. 2002. "Success Factors of New Product Development: A Review of the
Empirical Literature." International Journal Of Management Reviews 4, no. 1: 1.
Business Source Complete, EBSCOhost (accessed November 2, 2014).
Schneider, J., & Hall, J. (2011). Why Most Product Launches Fail. Harvard Business
Review, 89(4), 21-23.
Keller, K. (2003). Building, Measuring, and Managing Brand Equity. Upper Saddle
River: Pearson Education.
"What Time Is Really Primetime." What Time Is Really Primetime? Neilsen, 11 Sept.
2011. Web. 22 Mar. 2015.
"Numbers 101." TVbytheNumbers. Zap 2 It, 04 July 2009. Web. 23 Mar. 2015.

32