I 8 383 - World Bank Documents & Reports
368
A WORLD BANK COUNTRY STUDY I8 383 Lithuania An Opportunity for Economic Success Volume 2. Analytical Background Public Disclosure Authorized Public Disclosure Authorized Public Disclosure Authorized Public Disclosure Authorized Public Disclosure Authorized Public Disclosure Authorized Public Disclosure Authorized Public Disclosure Authorized
-
Upload
khangminh22 -
Category
Documents
-
view
0 -
download
0
Transcript of I 8 383 - World Bank Documents & Reports

A WORLD BANK COUNTRY STUDY
I 8 383
LithuaniaAn Opportunity for Economic Success
Volume 2. Analytical Background
Pub
lic D
iscl
osur
e A
utho
rized
Pub
lic D
iscl
osur
e A
utho
rized
Pub
lic D
iscl
osur
e A
utho
rized
Pub
lic D
iscl
osur
e A
utho
rized
Pub
lic D
iscl
osur
e A
utho
rized
Pub
lic D
iscl
osur
e A
utho
rized
Pub
lic D
iscl
osur
e A
utho
rized
Pub
lic D
iscl
osur
e A
utho
rized

A WORLD BANK COUNTRY STUDY
LithuaniaAn Opportunity for Economic Success
Volume 2: Analytical Background
The World BankWashington, D.C.

Copyright i 1998The Intemational Bank for Reconstructionand Development/THE WORLD BANK1818 H Street, N.W.Washington, D.C. 20433, U.S.A.
All rights reservedManufactured in the United States of AmericaFirst printing August 1998
World Bank Country Studies are among the many reports originally prepared for internal use as part ofthe continuing analysis by the Bank of the economic and related conditions of its developing membercountries and of its dialogues with the governments. Some of the reports are published in this series withthe least possible delay for the use of governments and the academic, business and financial, anddevelopment communities. The typescript of this paper therefore has not been prepared in accordancewith the procedures appropriate to formal printed texts, and the World Bank accepts no responsibility forerrors. Some sources cited in this paper may be informal documents that are not readily available.
The findings, interpretations, and conclusions expressed in this paper are entirely those of the author(s)and should not be attributed in any manner to the World Bank, to its affiliated organizations, or tomembers of its Board of Executive Directors or the countries they represent. The World Bank does notguarantee the accuracy of the data included in this publication and accepts no responsibility for anyconsequence of their use. The boundaries, colors, denominations, and other information shown on anymap in this volume do not imply on the part of the World Bank Group any judgment on the legal status ofany territory or the endorsement or acceptance of such boundaries.
The material in this publication is copyrighted. Requests for permission to reproduce portions of itshould be sent to the Office of the Publisher at the address shown in the copyright notice above. TheWorld Bank encourages dissemination of its work and will normally give permission promptly and, whenthe reproduction is for noncommercial purposes, without asking a fee. Permission to copy portions forclassroom use is granted through the Copyright Clearance Center, Inc., Suite 910, 222 Rosewood Drive,Danvers, Massachusetts 01923, U.S.A.
The cover illustration is The Mechanism (1996) by Klaudijus Petrulis, reproduced courtesy of the artistand Regimantas Skarzaukas. Photograph by Rimantas Ivoska.
ISSN: 0253-2123
Library of Congress Cataloging-in-Publication Data
Lithuania: an opportunity for economic success.p. cm. - (A World Bank country study)
Contents: v. 1. Main report - v. 2. Analytical background.ISBN 0-8213-4244-4 (v. 1). - ISBN 0-8213-4327-0 (v. 2)1. Lithuania-Economic policy-1991- 2. Lithuania-Economic
conditions-1991- I. World Bank. II. Series.HC340.6.L565 1998338.94793-DC21 98-23755
CIP

CONTENTS
PREFACE .... ix
ABSTRACT .... ,xi
ABBREVIATIONS AND ACRONYMS .xiii
1. BANKING .IHISTORY AND RECENT DEVELOPMENTS .2KEY MEDIUM- AND LONG-TERM POLICY ISSUES .9POLICY RECOMMENDATIONS .18
2. ENERGY.25MAIN RECOMMENDATIONS .25PRINCIPAL FEATURES OF LITHUANIA'S ENERGY SECTOR .26KEY MEDIUM- AND LONG-TERM ISSUES FACING LITHUANIA'S ENERGY
SECTOR .37POLICY RECOMMENDATIONS ........................ 51Annex 2-1. Financial Statements of Lithuanian Power Company .57Annex 2-2. Sample Performance Indicators for LPC .59
3. MUNICIPAL FINANCE .61MAIN FEATURES OF MUNICIPAL FINANCE IN LITHUANIA AND RECENT
DEVELOPMENTS .62KEY MEDIUM-TERM POLICY ISSUES .73POLICY RECOMMENDATIONS .82Annex 3-1. Data Tables .89Annex 3-2. Municipal Budgeting Issues .99Annex 3-3. Sirnulations of Equalization Transfers: A Description of the Methodology . 107Annex 3-4. International Comparison Tables .113
4. AGRICULTURE .123ECONOMIC AND SECTORAL REFORMS IN AGGREGATE .123STRUCTURE AND PERFORMANCE OF THE SECTOR, 1990-96 .124KEY POLICY ISSUES IN THE FOOD AND AGRICULTURAL SECTOR. 141POLICY RECOMMENDATIONS .156
5. PRIVATIZATION .165BACKGROUND .165THE TECHNICAL IMPEDIMENTS TO FASTER PRIVATIZATION
IN LITHUANIA .169POLICY RECOMMENDATIONS .174Annex 5-1. Privatization in Post-Communist Europe: Enterprise Productivity .179Annex 5-2. Privatization in Post-Communist Europe: Public and Private Finance .183Annex 5-3. Organizing Government for Privatization .187Annex 5-4. Valuation Methodology: International Best Practices .189Annex 5-5. Hiring and Using Financial and Other Advisers
for Case-by-Case Privatization . 191Annex 5-6. Lessons from International Experience .193
.i.i
Annex 5-7. Case-by-Case Privatization Defined .................................................. 195
6. PSD: TAKING STOCK OF RECENTDEVELOPMENTS AND PERCEIVED CONSTRAINTS ................................................... ;.197THE ANATOMY OF LITHUANIA'S PRIVATE SECTOR .197CONSTRAINTS TO PSD IN LITHUANIA: THE PERCEPTIONS OF DOMESTIC
ENTREPRENEURS .201CONSTRAINTS TO PSD IN LITHUANIAt THE PERCEPTIONS OF FOREIGN
INVESTORS .207
7. PSD ENVIRONMENT: TAX ADMINISTRATION .211THE LITHUANIAN TAX SYSTEM AND TAX ADMINISTRATION .211KEY POTENTIAL LONG-TERM IMPROVEMENTS TO BUSINESS TAX
ADMINISTRATION .219POLICY RECOMMENDATIONS .225ANNEX: Data Tables .227
8. PSD ENVIRONMENT: THE COMMERCIAL JUDICIAL SYSTEM .239LITHUANIA'S JUDICIAL SYSTEM: A DESCRIPTIVE ANALYSIS .240KEY MEDIUM- AND LONG-TERM POLICY ISSUES FACING THE LITHUANIAN
JUDICIAL SYSTEM .244POLICY RECOMMENDATIONS .251
9. PSD ENVIRONMENT: CORPORATE GOVERNANCE .259CORPORATE GOVERNANCE-IN THE INTERNATIONAL AND LITHUANIAN
CONTEXTS .259KEY CONSTRAINTS TO BETTER CORPORATE GOVERNANCE IN LITHUANIA . 260POLICY RECOMMENDATIONS .267
10. PENSION REFORM .273DESCRIPTIVE ASSESSMENT OF LITHUANIA'S PENSION PROGRAM .275KEY REMAINING ISSUES IN PENSION REFORM .283POLICY RECOMMENDATIONS .286ANNEX: Data Tables .295
11. THE SECURITIES MARKET .307THE STRUCTURE OF THE PRESENT LITHUANIAN SECURITIES MARKET .307KEY OUTSTANDING POLICY ISSUES .311POLICY RECOMMENDATIONS .321ANNEX .325
12. THE MACROECONOMIC FRAMEWORK .329LITHUANIA'S FINANCIAL EVOLUTION SINCE INDEPENDENCE: A
FLOW-OF-FUNDS VIEW .329SECTOR POLICY AND THE QUASI-PUBLIC-SECTOR DEFICIT .338A POLICY CHOICE: TWO MACROECONOMIC SCENARIOS FOR
LITHUANIA .342SOME CONCLUDING POLICY RECOMMENDATIONS .351
iv

TABLES
Table 1-1. The Lithuanian Banking Sector, 1994-March 1997, Selected Information ...............................4Table 1-2. Lithuanian Banking System: Sources of Funding, March 1997 .................................................5Table 1-3. IAS Financial Information, 31 December 1996 ...................................................................... 6-7Table 2-1. Final Energy Consumption, by Sector ...................................................................... 27Table 2-2. Indigenous Primary Energy Production ...................................................................... 27Table 2-3. Imports of Primary Energy Resources ...................................................................... 28Table 2-4. Final Energy Consumption, by Fuel ...................................................................... 28Table 2-5. The Electricity Balance ...................................................................... 29Table 2-6. The Natural Gas Balance ...................................................................... 30Table 2-7. The Oil Balance ...................................................................... 31Table 2-8. The Heat Balance ...................................................................... 31Table 2-9. Key Indicators, Energy Sector Companies ...................................................................... 33Table 2-10. Electricity and Heat Tariffs ...................................................................... 35Table 2-1 1. Average Energy Prices in Baltic States, January 1997 ............................................................ 35Table 2-12. Consumer Arrears for Electricity ...................................................................... 37Table 2-13. Heat Losses in DH Networks, 1990-96 ...................................................................... 40Table 2-14. Summary Features of LPC, 1998 (forecast) ...................................................................... 45Table 2-15. Lithuanian Gas Company ...................................................................... 48Table 2-16. A Comparison of the Lithuanian and Irish Gas Systems ......................................................... 49Table 3-1. The Relative Size of Municipal Budgets and National Budget Expenditure ............................ 63Table 3-2. Municipal and Total National Expenditures . ..................................................................... 64Table 3-3. Lithuania: Composition of Municipal Expenditures, 1997 ...................................................... 64Table 3-4. Lithuania: Social Expenditures as a Share of the Municipal Budget, 1992-97 ....................... 65Table 3-5. Economic (Classification of Budget Expenditures in 1996 at the Municipal and Central
Governmernt Levels ...................................................................... 66Table 3-6. Descriptive Statistics for per Capita Local Expenditures, 1996 ............................................... 67Table 3-7. Regression of Transfers and Municipal Expenditures on Fiscal Characteristics, 1996 ........... 67Table 3-8. Composition of Municipal Revenues, 1996 and 1997 .............................................................. 68Table 3-9. Sources oi Municipal Revenues 1992-97 ...................................................................... 69Table 3-10. Descriptive Statistics for per Capita Local Revenues, 1996 .................................................... 69Table 3-11. Budget Expenditure by Function of Government in 1996 ....................................................... 71Table 3-12. Municipal Share of National Revenues, 1992-96 ................................................................... 72Table 3-13. Lithuania: Administrative Expenditures as a Share of the Municipal Budget, 1992-97 ........ 82Table 3-14. Subsidies Granted from Budgets, 1996 ...................................................................... 91Table 3-15. Budget Expenditure on Education Affairs and Services, 1996 ................................................ 92Table 3-16. Budget Expenditures on Health Care Affairs and Services, 1996 ........................................... 93Table 3-17. Budget Expenditure on Social Security and Welfare, 1996 ..................................................... 94Table 3-18. Vilnius: MvIunicipal Budget Loans and Loans Scheduled for Repayment ................................ 95Table 3-19. Lithuania: Municipal Revenue by Municipality, by Source, 1996 .......................................... 96Table 3-20. Lithuania: Municipal Expenditure by Municipality, by Category, 1996 ................................. 97Table 3-21. Municipal Budget of Cities and Regions of the Republic of Lithuania, 1994-96 ................. 102Table 3-22. City of Vilnius Arrears, 1996 and 1997 ...................................................................... 104Table 3-23. Lithuania: Simulated Equalization Transfers for 1997 Based on the Law of Muncipal
Budget Income ...................................................................... 110Table 3-24. Lithuania: Comparison of Municipal Revenues after Simulated Equalization
Transfers in per Capita Terms, 1997 ....................................................................... 111Table 3-25. International Comparison of Government Revenues and Composition of Subnational
Revenues ...................................................................... 115
v

Table 3-26. International Comparison of Government Revenues and Composition of Subnational TaxRevenues ....................................................................... 117
Table 3-27. International Comparison of Government Expenditures and Composition of SubnationalGovernment Expenditures ....................................................................... 119
Table 3-28. International Comparison of Expenditure Assignment by Level of Government ................. 120Table 3-29. International Comparison of Expenditure Assignment by Level of Government ................. 121Table 4-1. Importance of the Agricultural Sector in the National Economy, 1990-96 .......................... 125Table 4-2. Comparison of CEEC Applicant Countries with the EU-15, 1995 ......................................... 127Table 4-3. Areas Planted in Main Crops and Livestock Numbers, 1991-96 ........................................... 127Table 4-4. Dynamics of Crop and Livestock Productivity, 1991-96 ....................................................... 128Table 4-5. Mineral Fertilizer Use by Agricultural Companies, 1990-96 ................................................ 128Table 4-6. Dynamics of Agricultural Output Volume ....................................................................... 129Table 4-7. Comparison of Meat and Milk Production Changes in CEECs, 1989-95 .............................. 130Table 4-8. Dynamics of Output in the Food Industry, 1992-96 .............................................................. 131Table 4-9. Dynamics of Industrial Output for Major Food Commodities, 1990-96 ................................ 132Table 4-10. Food Expenditure and Annual per Capita Consumption ...................................................... 132Table 4-11. Dynamics of Number of Agricultural Land Users and Farm Size, 1991-97 ........................ 133Table 4-12. Distribution of Agricultural Land by Main User Group, 1991-97 ........................................ 133Table 4-13. Distribution of Agricultural Production by Type of Farm, 1990-96 .................................... 134Table 4-14. Comparison of Farm Structure in CEECs, 1995 .................................................................. 135Table 4-15. Lithuanian Real Producer and Retail Prices, 1990-96 Indices ............................................. 136Table 4-16. Comparison of Lithuanian Farm Prices and World Market Prices, 1990-96 ....................... 137Table 4-17. Comparison of Farm and Retail Prices in Baltic States ........................................................ 138Table 4-18. Regional Pattern of Agricultural and Food Exports and Imports, 1995-96 ......................... 139Table 4-19. Regional Shares of Agricultural and Food Exports and Imports ......................................... 140Table 4-20. Capital Structure of Food Chain Enterprises in Lithuania, September 1997 ........................ 143Table 4-21. Degree of Privatization in Upstream and Downstream Industries, September 1997 ........... 144Table 4-22. Agriculture Budget Expenditure, 1994-96 ....................................................................... 147Table 4-23. Agriculture Budget Estimate for 1997 Compared with 1996 .............................................. 148Table 4-24. Summary of Aggregate PSEs for Selected CEECs, EU, and OECD ................................... 149Table 4-25. Composition of Agricultural Support in Lithuania and Selected Countries, 1996 ............... 150Table 4-26. Import Tariffs for Main Agricultural and Food Products in Lithuania, 1997 ....................... 152Table 4-27. Comparison of MFN Tariff Rates in Selected CEECs ......................................................... 152Table 4-28. Comparison of WTO Minimum Access Rates with Lithuanian MFN Rates ....................... 153Table 5-1. Cash Privatization Results ....................................................................... 166Table 5-2. Case-by-Case Privatization, 1997 ....................................................................... 166Table 5-3. Features of the Database ...................................... 179Table 5-4. Annual Labor Productivity Growth, 1992-95 ...................................... 180Table 5-5. Privatization Revenues in Selected Transition Economies ..................................................... 183Table 5-6. Interest Rate Spreads in Selected Transition Economies ........................................................ 184Table 6- 1. Breakdown of Nonfinancial State-Owned and Private Enterprises
Surveyed by Sector, as of I January 1997 ................................................................ 198Table 6-2. Breakdown of Nonfinancial State-Owned and Private Enterprise Sales,
Profit, and Assets, as of I January 1997 ................................................................ 199Table 6-3. Residual Shares Retained by the Government in Enterprises Sold Through Share
Subscription ................................................................ 200Table 6-4. Private Enterprise Establishments by Economic Activity and Year of Creation ................... 201Table 6-5. Characteristics of Companies in the 1997 Enterprise Survey ................................................ 202Table 6-6. Main Constraints to Company Operation and Growth ........................................................... 202Table 6-7. Main Constraints by Size and Sector of Enterprises, June 1997 ............................................ 203Table 6-8. Government Regulation-Related Constraints ................................................................ 204
vi

Table 6-9. Government Agencies Causing the Greatest Difficulties, June 1997 ..................................... 205Table 6-10. Finance-Related Constraints .................................................................... 205Table 6-11. Problems Related to Unfair or Illegal Practices of Competitors, June 1997 ........................ 207Table 6-12. Investment Climate in Central and Eastem Europe .............................................................. 209Table 6-13. Baltic Cities' Advantages for FDI .................................................................... 209Table 6-14. The Major Constraints to FDI as Seen by Foreign Investors ................................................ 210Table 7-1. Structure of Lithuanian and Average OECD Tax Receipts .................................................... 212Table 7-2. Comparative Levels of Tax Revenue in Selected OECD Countries (1995) and Lithuania
(I 996 and 1997) .................................................................... 213Table 7-3. Nominal Rates of Personal and Corporate Income Tax and VAT
at Federal/Central Level .................................................................... 214Table 7-4. Breakdown of Excise Tax Revenues .................................................................... 216Table 7-5. Tax-Related Constraints: The Incumbent Private Sector's Views ......................................... 218Table 7-6. General Appeals Procedures for Selected Countries .............................................................. 229Table 7-7. Decisions Subject to Appeal and Time Limits, Selected Countries ................................. 230-31Table 7-8. Specific Appeals Procedures, Selected Countries ............................................................ 232-34Table 7-9. General Review of Taxpayers' Rights, Selected Countries .................................................... 235Table 7-10. Availability of Advance Rulings, Selected Countries .......................................................... 236Table 7-11. Withholding Tax Systems, Selected Countries ............................................................... 237-38Table 10-1. Comparison of Value Added Tax Rates .................................................................... 292Table 10-2. Summary of Assumptions Used in Projections Model ......................................................... 297Table 10-3. Current Law Projections .................................................................... 298-99Table 10-4. Projections Given SAL Conditionalities and Increases in the Retirement Age to 65
for Both Genders .................................................................... 3 01-02Table 10-5. Comparison of Wage Taxes in the Baltic Countries ............................................................. 304Table 10-6. Projections for Second-Pillar Accumulation .................................................................... 304Table 11-1. Lithuanian Securities Market Growth, 1993-96 ................................................................... 327Table 11-2. Average Size of Listed Companies, Selected Countries ....................................................... 327Table 11-3. Shareholding Structure for Lithuanian Public Companies by Sector ................................... 328Table 11-4. Structure of Ownership of NSEL ........... 8..................... 328Table 11-5. NSEL Member Firms: Volume and Value of Business, 1997 ............................................. 328Table 12-1. Flow-of-Funds Matrix, 1995 ............................................................. 337Table 12-2. The Quasi-Public-Sector Deficit ............................................................. 340Table 12-3. Moderate-Growth Projection ............................................................. 344Table 12-4. Moderate-Growth Projection, Flow-of-Funds Matrix, 2007 ................................................ 346Table 12-5. High-Growth Projection ............................................................. 348Table 12-6. High-Growth Projection, Flow-of-Funds Matrix, 2007 ........................................................ 350
FIGURES
Figure 4-1. Gross Agricultural Output, 1989-96 ............................................................. 126Figure 4-2. Distribution of Agricultural Land by User Group ............................................................. 133Figure 4-3. Agricultural Trade ............................................................. 139Figure 4-4. Agricultural Budget Allocation ............................................................. 146Figure 4-5. Aggregate PSEs in 1996, Various Countries ............................................................. 149Figure 5-1. Privatization and Revenues in East-Central Europe and the Baltics ..................................... 168Figure 6-1. Cumulative Foreign Investment in Lithuania, 1991-97 ........................................................ 208Figure 6-2. Cumulative Foreign Investment in Lithuania by Country, 1991-96 ..................................... 208Figure 10-1. PercentaLge of Basic Pension Received as a Function of Years of Service . .................... 276Figure 10-2. Comparison of Cumulative Growth in Average Old-Age Pensions and
Average Prices, 1997 ............................................................. 277
vii

Figure 10-3. Comparison of Retirement Ages (Males) ........................................................................ 279Figure 10-4. Comparison of Retirement Ages (Females) ........................................................................ 279Figure 10-5. Dependency Ratio ........................................................................ 281Figure 10-6. Net Cash Flow of Pension System as Percentage of Wage Base under Current Law
and SAL-Supported Reforms ........................................................................ 283Figure 10-7. Rate of Growth in Real Old-Age Pension Expenditures under Current Law
and under SAL-Supported Acceleration of Increases in the Retirement Age . ....... 287Figure 10-8. Comparison of Contributions and Total Benefits .................................................................. 300Figure 10-9. Comparison of Contributions and Total Benefits Under SAL Conditionalities/Increase
in Retirement Ages to 65 for Both Genders ....................................................................... 303Figure 10- 10. Assets Invested in Second-Pillar Accounts Expressed as a Percentage of GDP ................ 305Figure 11 -1. Sources and Uses of Investment in the Lithuanian Securities Market, 1996 . .................. 327Figure 12-1. Sector Investment, Saving, and Surplus/Deficit ........................................ 331Figure 12-2. General Government Sector Finance ........................................................................ 332Figure 12-3. Rest-of-the-World Net Lending to Lithuania ...................................................................... 333Figure 12-4. Private Sector Investment and Financing ........................................................................ 335Figure 12-5. Banking Sector Finance ........................................................................ 336
BOXES
Box 3- 1. Summary of New System of Equalization Transfers ................................................................ 109Box 5- 1. The High Cost of Not Having Professional Privatization Advice ............................................ 171Box 5-2. Lowering the Cost of Financial Advisers ........................................................................ 172Box 7- 1. Voluntary Compliance at Work: The United Kingdom Tax Charter ........................................ 222
viii

PREFACE
This report has been prepared by a World Bank team composed of Marcelo Giugale (teamleader), Dana Cook (banking), Peter Kelly (energy), Jorge Martinez (municipal finance), WilliamMeyers (agriculture), James Welch (privatization), Barbara Lee (infrastructure privatization),Peter Modeen (corporate governance, commercial judicial systems, private investors'perceptions), Ken Messere (tax administration), David Lindeman (pensions), Christopher Bender(pensions), Robert Pardy (securities markets), John Dawson (flow of funds), and Zhicheng Li(macro projections).
Valuable inputs and guidance were received from the following sector specialists at the Bank'sEastern Europe and Central Asia Vice-Presidency: Rodrigo Chaves, Csaba Csaki, AlexanderFleming, Louise Fox, Kristin Gilbertson, Philip Goldman, Marc Heitner, John Holsen, VilijaKostelnikiene, Mantas Nocius, and Yoshine Uchimura. Useful comments from Ardo Hansson,Robert Holzmann, Dominique Lallement, Laszlo Lovei, Melinda Roth-Alexandrowicz, andHelen Sutch are graLtefully acknowledged. Waleed Malik, Gary Stuggins, Samuel Talley, andDimittri Vittas were the peer reviewers. Dagney Faulk and Midori Makino provided researchassistance.
The report was carried out under the general direction of Basil Kavalsky and Pradeep Mitra.James Q. Harrison and Frank Lysy were the senior advisers to the report team.
The editorial staff, coordinated by Michael Geller and Marinette Guevara, included ArmandaCarcani, Omar Hadi, David Robbins, and Jessica Rodriguez. Caroline McEuen was the principaleditor.
The team wants to express its gratitude to the many officials and institutions in the Lithuaniangovernment, academia, and business community whose cooperation made this report possible.In particular, special thanks are due the staff of the Bank of Lithuania; the Ministries ofAgriculture and Forestry, European Integration, Finance, National Economy, Justice, and SocialSecurity and Labor; the Auditing and Accounting Institute; the Lithuanian SecuritiesCommission; the National Stock Exchange; the Central Depository; and the Judicial TrainingCenter, all of whom provided extensive comments to early drafts of this report.
ix


ABSTRACT
Lithuania could now consolidate and complete the achievements of its first structuraladjustment effort, create an environment that will allow private entrepreneurs to thrive,and-within five years-become both the fastest-growing economy in the region and asought-after, successful partner in Europe. In other words, Lithuania does not have animmediate development problem-it has a unique development opportunity.
For the country to make the most of that opportunity, this report proposes a policy agendadriven by two overarching objectives: the elimination of the remaining structural sourcesof macroeconornic imbalance and the rapid shifting of boundaries between the privateand the public sectors-both in production and in investment and saving-as means toinstill efficiency and to move the country to a higher long-term growth plateau.
To achieve the first objective, policymakers must end the direct and indirect fiscal drainsassociated with the resolution of pending banking problems, inefficient performance instate-controlled energy companies, poor municipal finance, and the remaining distortionsin the agriculture sector. In other words, the first target of the new reform agenda shouldbe to do away--permanently-with the operating deficit of the "quasi-public" sector(that is, the aggregate financial performance of the general government, the public energysector, strategic public enterprises, farmers, pensioners, and the other sectors and interestgroups that are, in effect, financially dependent on the state).
The second target of the new reform agenda-an efficiency-led increase in long-termgrowth-will require reforms in the legal, regulatory, and institutional frameworks, notonly for privatization and private sector initiative, but also for the operation of thepension system and the development of the securities market. The core idea behind thiselement of the agenda is to place the allocation of the country's resources fully in thecharge of profit-driven, private initiative. Freed to accumulate and invest their own long-term savings, private owners should, through their dealings in the securities market, putincreased pressure on the managers of private and newly privatized firms to perform.The ensuing efficiency gains should bring the economy onto a faster growth path.
xi


LITHUANIA-FISCAL YEAR
January I-December 31
CURRENCY EQUIVALENTS
(as of 20 April 1998)Currency Unit = Litas
4 Litai = US$1
WEIGHTS AND MEASURES
Metric System
ABREVIATIONS AND ACRONYMS
ADI American Depository Receipt LPC Lithuania Power CompanyBFTA Baltic Free Trade Agreement LPG Liquefied petroleum gasBNM Basic nontaxable minimum MCF Municipal Credit FacilityBoL Bank of Lithuania MEA Minister of European AffairsBSD Bank Supervision Department MFN Most-favored nationCAA Court Administration Agency MMPP Minimal marginal purchase priceCEEC Central and eastern European countries MPARLA Ministry of Public Reform and Local AuthoritiesCEFTA Central European Free Trade Association MoAF Ministry of Agriculture and ForestryCHP Combined heat and power MoJ Ministry of JusticeCIS Commonwealth of Independent States MSL Minimum Subsistence LevelCIT Corporation income tax MSSL Ministry of Social Security and LaborCSDL Central Securities Depository mtoe Million tons of oil equivalentDCF Discounted cash flow method MVV Mannheimer Versorgungs-undDH District heating Verkehrsgesellschaft NGHDOD Debt outstanding and disbursed MW Mega-wattEFTA European Free Trade Association NAP National Agricultural ProgramEPC Energy Pricing Commission NDC National Defined Contribution AccountsESR Energy sector review NOCs Notional Defined Contribution AccountsEBRD European Bank for Reconstruction NSEL National Stock Exchange of Lithuania
and Development OECD Organization for Economic Cooperation andEU European Union DevelopmentFDI Foreign direct investment PADP Private Agricultural Development ProgramFSU Former Soviet Union PAYGO Pay as you goGAO Gross agricultural output PIT Personal income taxGATT General Agreement on Tariffs and Trade Pi PetajoulesGcal Giga-calorie PPP Purchasing power parityGDP Gross domestic product PSD Private sector developmentGDR Global Deposjitory Receipt PSEs Producer Subsidy EquivalentsGoL Government cf Lithuania RSF Rural Support FundHOB Heat-only boiler SAL Structural Adjustment LoanIAS International accounting standards SEM Small and medium-sizeICOR Incremental capital output ratio SODRA Social Insurance FundIEA International Energy Agency SRP Savings Restitution PlanIFC International Finance Corporation TB Treasury billsINPP Ignalina Nuclear Power Plant Tcal Tetra-calorieIPO Initial public offering TMCF Transitional Municipal Credit FacilityIPS Interconnected Power System TOE Tons of oil equivalentISA International Standards on Audit Twh Tetra-wattKLASC Klaipeda Stevedoring UNDP United Nations Development Programktoe Thousand tons of oil equivalent USAID United States Agency for InternationalKwh Kilowatt DevelopmentLAAI Lithuanian Auditing and Accounting Institute VAT Value added taxLG Lithuania Gas Company VICA Vilnius International Commercial ArbitrationLIA Lithuanian Investment Agency WTO World Trade OrganizationLISCO Lithuanian Shipping XGS Exports of goods and nonfactor servicesLLA Lithuania Lawyers Association
-for The World Bank-Vice President: Johannes Linn, ECAVPPREM Director: Pradeep Mitra, ECSPEChief Economist: Marcelo Selowsky, ECAVPCountry Director: Basil Kavalsky, ECCO9Sector Leader: Frank Lysy, ECSPESenior Adviser: James Q. Harrison, ECSPETeam Leader: Marcelo Giugale, ECSPE
xiii

1BANKING
Lithuania's banking sector has survived the (expected) difficult initial transition adjustments and hasemerged stronger as a result of the process. The rapid increase in the number of banks following thecollapse of the Soviet Union led to the creation of many "pocket" banks that were subsequently closed,with little systemic impact. In addition, in late December 1995, the largest private bank and three others,together representing a. quarter of the total banking system's assets, were placed in "moratorium."Consolidation through failure has led to a greatly reduced number of much stronger banks.
After an initial period of excessive branch expansion, the remaining banks have begun a processof branch and staffing rationalization. With the help of twinning partners and other donor programs,management systems and asset generation quality have improved. Traditional sources of revenue-currency speculation and trading and high-margin lending-have been replaced by more traditionalbanking activities.
From a public policy viewpoint, several positive steps have enhanced the safety and soundness ofthe sector. The Bank of Lithuania (BoL) has received and absorbed invaluable training from advisers.The introduction of international accounting standards and Basle capital rules has been completed. TheBoL has adopted more stringent large exposure and connected lending rules. All banks are regularlyexamined, and it is now BoL policy (in the absence of laws to the contrary) to revoke the license of anybank that fails to comply with prudential standards. The government and the banking sector have begunto fund a deposit insurance fund to protect individual deposits.
Despite this progress, several key policy issues remain unresolved. After an initial, partialprivatization effort, the state-controlled banks continue to face major problems in corporate governance.The state banks are undercapitalized (Seimas having passed a law overriding the BoL regarding licenserevocation policy for banks on their way "to privatization") to some degree. The banks continue to beused as sources of government funding and programs. The government has decided to privatize the tworemaining state banks, but it has not yet devised a plan to privatize the Savings Bank, which has thelargest concentration of individual deposits in the country and is the largest buyer of treasury bills (TBs).
Undue political influence and interference still operate in the sector, influencing not only theinvestments and management of the state-controlled banks, but also BoL supervisory responsibility.BoL's independence is frequently threatened by actions of Seimas and the government that affect specificbanks and banking issues.
The legal and institutional framework for the supervision of banks and their provision of servicescould be enhanced. The Central Bank Law and the Commercial Bank Law have been improved, but
I
Banking
often in a patchwork fashion in a response to a given event. A comprehensive revision to both laws thatfocuses on impediments to supervisory action, problem bank resolutions, and the independence of BoL iswarranted. Lithuania's credit laws are generally debtor-friendly. As banks have become moreknowledgeable about lending techniques, these laws have restricted credit growth. Recent amendmentsto the Bankruptcy Law and the proposed establishment of lien registries are improvements. Otherimpediments remain. The inability of banks to take title to land in foreclosure and lengthy foreclosureprocesses for property (especially moveables) have caused banks to either not lend or to developcomplicated alternatives. The deposit insurance fund is in its infancy. Recent amendments that expandedcoverage with complicated coinsurance schedules may strain the ability of the sector to provide adequatereserves and avoid moral hazard. In addition, there is no statutory link outlining the fund's role inmaximizing the recovery of expended funds in failed banks.
History and Recent Developments
Evolution of the Banking Sector
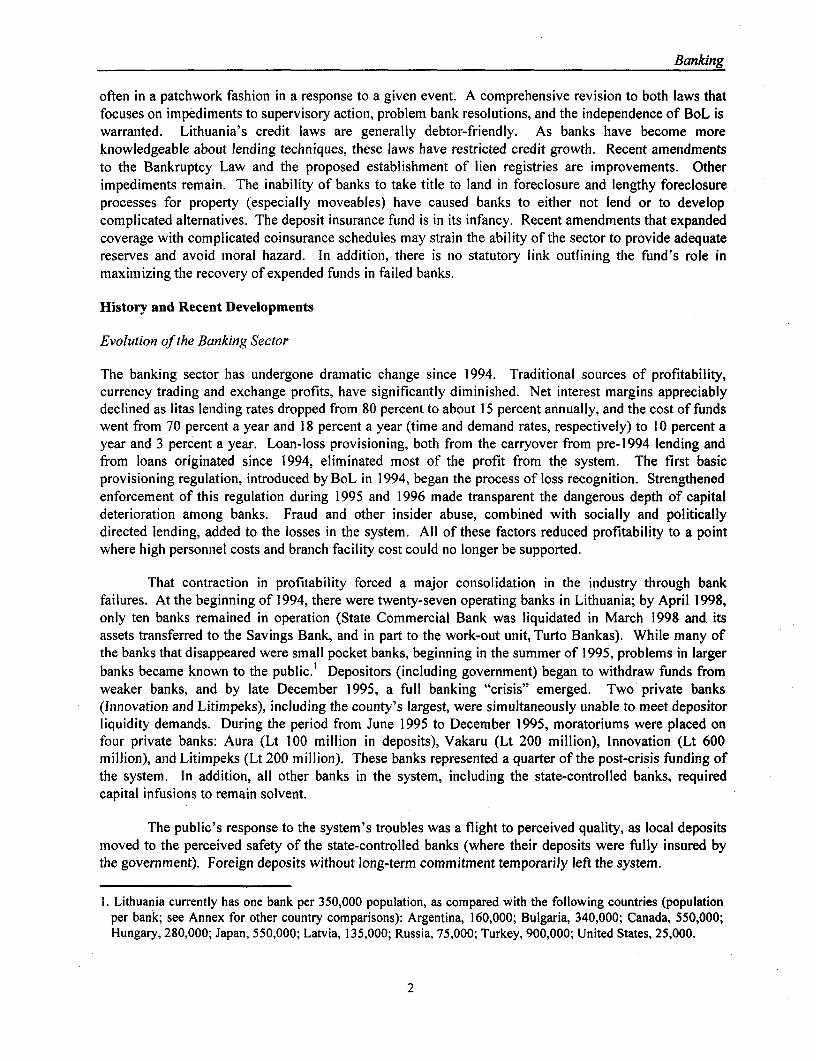
The banking sector has undergone dramatic change since 1994. Traditional sources of profitability,currency trading and exchange profits, have significantly diminished. Net interest margins appreciablydeclined as litas lending rates dropped from 80 percent to about 15 percent annually, and the cost of fundswent from 70 percent a year and 18 percent a year (time and demand rates, respectively) to 10 percent ayear and 3 percent a year. Loan-loss provisioning, both from the carryover from pre-1994 lending andfrom loans originated since 1994, eliminated most of the profit from the system. The first basicprovisioning regulation, introduced by BoL in 1994, began the process of loss recognition. Strengthenedenforcement of this regulation during 1995 and 1996 made transparent the dangerous depth of capitaldeterioration among banks. Fraud and other insider abuse, combined with socially and politicallydirected lending, added to the losses in the system. All of these factors reduced profitability to a pointwhere high personnel costs and branch facility cost could no longer be supported.
That contraction in profitability forced a major consolidation in the industry through bankfailures. At the beginning of 1994, there were twenty-seven operating banks in Lithuania; by April 1998,only ten banks remained in operation (State Commercial Bank was liquidated in March 1998 and itsassets transferred to the Savings Bank, and in part to the work-out unit, Turto Bankas). While many ofthe banks that disappeared were small pocket banks, beginning in the summer of 1995, problems in largerbanks became known to the public.' Depositors (including government) began to withdraw funds fromweaker banks, and by late December 1995, a full banking "crisis" emerged. Two private banks(Innovation and Litimpeks), including the county's largest, were simultaneously unable to meet depositorliquidity demands. During the period from June 1995 to December 1995, moratoriums were placed onfour private banks: Aura (Lt 100 million in deposits), Vakaru (Lt 200 million), Innovation (Lt 600million), and Litimpeks (Lt 200 million). These banks represented a quarter of the post-crisis funding ofthe system. In addition, all other banks in the system, including the state-controlled banks, requiredcapital infusions to remain solvent.
The public's response to the system's troubles was a flight to perceived quality, as local depositsmoved to the perceived safety of the state-controlled banks (where their deposits were fully insured bythe government). Foreign deposits without long-term commitment temporarily left the system.
1. Lithuania currently has one bank per 350,000 population, as compared with the following countries (populationper bank; see Annex for other country comparisons): Argentina, 160,000; Bulgaria, 340,000; Canada, 550,000;Hungary, 280,000; Japan, 550,000; Latvia, 135,000; Russia, 75,000; Turkey, 900,000; United States, 25,000.
2

Banking
The government responded to the crisis with a three-pronged program: (a) the enactment of anemergency deposit insurance scheme providing limited coverage to individual deposits in all banks, (b)provision of limited liquidity support for banks, and (c) the granting of a full government guarantee of alldeposits and creditors of two banks under moratorium (Innovation and Litimpeks). The government andBoL were unable to resolve the crisis involving the four troubled banks quickly, however, because therewas no planned approach to deal with a banking emergency, the banking laws were deficient, and theconstituencies of the four banks sponsored political interventions. Aura (with most of its depositors beinggovernment agencies) was transformed into Turto Bank, a government-owned workout unit, and itsprivate depositors were fully compensated in the summer of 1996. Vakaru was placed into bankruptcy inSeptember 1996, and its individual depositors were compensated according to the emergency depositinsurance law. Litimpeks reopened in May 1996, because enough depositors elected to convert theirdeposits to equity to meet the prevailing BoL capital rules, based on Lithuanian accounting practices.Nevertheless, the bank remained deeply insolvent under IAS (international accounting standards) and wasunable to attract new bisiness. BoL gave the bank until June 1997 to comply with prudential rules. Thebank reached compliance, but it has been struggling to achieve profitable operations and to remain incompliance. Innovation's resolution was hampered by the law guaranteeing all deposits and the resultingfiscal cost to the government of its deep insolvency. In addition, the Seimas passed a series of laws,including one that recluired Innovation to reopen, one that required deposit conversion before thegovernment could recapitalize, and, finally, one that established a new compensation scheme, overridingall previously passed laws. In the summer of 1997, Innovation's license was revoked; its depositors willreceive minimal cash compensation and non-interest-bearing government bonds (with maturities of fiveto ten years, depending on the legal nature of the depositor).
BoL also begarn a program of enhanced regulation and supervision. New rules regarding largeexposure, connected lending, and loan provisioning were introduced. ISA (international standard ofaudit) audits were demanded of all banks, and IAS and Basle capital rules were implemented as of IJanuary 1997. While the previous Lithuanian accounting standards were in place as of 31 December1996, BoL required all banks to publish IAS financial statements in the local press. In addition, BoL'sBanking Supervision Department (BSD) has implemented an early warnin1g system that evaluates thecurrent status of the banking system and foresees trends. On-call audits are carried out by internationalaudit firms at the instigation of the BSD on an on-going basis.
During the surnmer of 1996, the State Commercial Bank experienced liquidity pressure as anapparent result of the spreading news of a recent BoL examination. The government was forced to injectboth capital and liquidity into the bank; it increased the bank's capital by Lt 165 million (146 million intreasury securities, the balance in cash and property). The government also ordered all state agencies totransfer their bank accounts to State Commercial. As a result, by the end of 1996, 65 percent (overLt475 million) of the funcling of the bank was government or government-related. The bank continued tobe subject to partial moratorium and its condition was becoming progressively worse. After two failedprivatization efforts and unsuccessful discussions with EBRD about the rescue of the bank, in March1998 the government was forced to decide about liquidation of the bank. Its good assets and all liabilitieswere tranferred to the Savings Bank. The government contributed Lt 180 million in nontradablerestructuring bonds to eclualize the transfer. Bad loans were transferred to the work-out unit.
While total funding of the banking system has grown by Lt 500 million since the end of 1995(after a 20 percent growth in 1994), private sector funding has not increased. Ninety percent of thesystem's funding is frorn domestic sources, indicating a lack of confidence and/or interest by foreign-based bank customers. Similarly, while total fund deployment in earning assets has increased by Lt onebillion since 1995, the entire increase is the product of bank investments in treasury bills and monetary
3
Banking
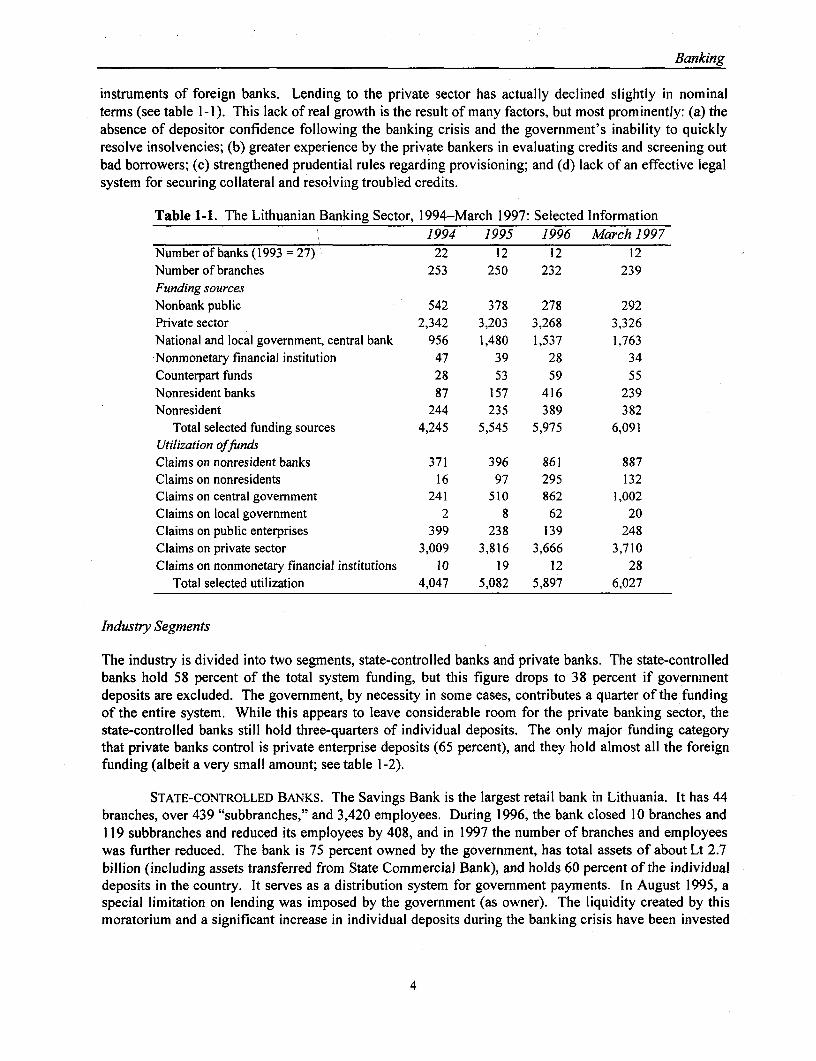
instruments of foreign banks. Lending to the private sector has actually declined, slightly in nominalterms (see table 1-1). This lack of real growth is the result of many factors, but most prominently: (a) theabsence of depositor confidence following the banking crisis and the government's inability to quicklyresolve insolvencies; (b) greater experience by the private bankers in evaluating credits and screening outbad borrowers; (c) strengthened prudential rules regarding provisioning; and (d) lack of an effective legalsystem for securing collateral and resolving troubled credits.
Table 1-1. The Lithuanian Banking Sector, 1994-March 1997: Selected Information1994 1995 1996 March 1997
Number of banks (1993 = 27) 22 12 12 12Number of branches 253 250 232 239Funding sourcesNonbank public 542 378 278 292Private sector 2,342 3,203 3,268 3,326National and local government, central bank 956 1,480 1,537 1,763Nonmonetary financial institution 47 39 28 34Counterpart funds 28 53 59 55Nonresident banks 87 157 416 239Nonresident 244 235 389 382
Total selected funding sources 4,245 5,545 5,975 6,091Utilization offundsClaims on nonresident banks 371 396 861 887Claims on nonresidents 16 97 295 132Claims on central government 241 510 862 1,002Claims on local government 2 8 62 20Claims on public enterprises 399 238 139 248Claims on private sector 3,009 3,816 3,666 3,710Claims on nonmonetary financial institutions 10 19 12 28
Total selected utilization 4,047 5,082 5,897 6,027
Industry Segments
The industry is divided into two segments, state-controlled banks and private banks. The state-controlledbanks hold 58 percent of the total system funding, but this figure drops to 38 percent if governmentdeposits are excluded. The government, by necessity in some cases, contributes a quarter of the fundingof the entire system. While this appears to leave considerable room for the private banking sector, thestate-controlled banks still hold three-quarters of individual deposits. The only major funding categorythat private banks control is private enterprise deposits (65 percent), and they hold almost all the foreignfunding (albeit a very small amount; see table 1-2).
STATE-CONTROLLED BANKS. The Savings Bank is the largest retail bank in Lithuania. It has 44branches, over 439 "subbranches," and 3,420 employees. During 1996, the bank closed 10 branches and119 subbranches and reduced its employees by 408, and in 1997 the number of branches and employeeswas further reduced. The bank is 75 percent owned by the government, has total assets of about Lt 2.7billion (including assets transferred from State Commercial Bank), and holds 60 percent of the individualdeposits in the country. It serves as a distribution system for government payments. In August 1995, aspecial limitation on lending was imposed by the government (as owner). The liquidity created by thismoratorium and a significant increase in individual deposits during the banking crisis have been invested
4

Banking
primarily in TB and other bank instruments; the bank is currently the largest holder (and most activeparticipant in the auction) of treasury bills. The chairman and the management board were replaced inAugust of 1997. At the end of 1997, the bank met BoL capital rules, but it is questionable whether thebank was capital-adequate under IAS. The government is increasing the capital of the bank to ensureIAS compliance. The bank showed a modest profit in 1997, but only after a write-up of certaingovernment receivables, for which the IAS audit expressed a qualification (see table 1-3 for IAS financialstatements for 1997).
Table 1-2. Lithuanian Banking System: Sources of Funding, March 1997(Lt million)
Operating, StateCommercial Savings Agriculture Total, private Total banks
Source Bank Bank Bank state banks banks system (percent)Central Bank 19,976 0 68,222 88,198 63,940 152,138 58Other banks 46,682 4,213 9,442 60.337 305.961 366,298 16Government 524,116 43,201 509,859 1,077,176 356,623 1,433,799 75State enterprises 52,026 8,657 50,129 110,812 85,442 196,254 56Private, nonindividual 116,341 134,998 303,616 554,955 1,027,859 1,582,814 35Private individual 90,231 953,673 219,434 1,263,338 418,395 1,681,733 75
Total funding 849,372 1,144,742 1,160,702 3,154,816 2,258,220 5,413,036 58Funds in state-controlled banksa 38Total funding, direct firom government 26Domestic versus foreignCentral bank,
government, andstate enterprises 596,118 51,858 628,210 1,276,186 506,005 1,782,191 72
Domestic banks 1,218 4,196 9,437 14,851 123,862 138,713 11Domestic private sector 198,082 1,088,671 522,504 1,809,257 1,165,186 2,974,443 61Total domestic 795,418 1,144,725 1,160,151 3,100,294 1,795,053 4,895,347 63Foreign banks 45,464 17 5 45,486 182,099 227,585 20Foreign private sector 8,490 0 546 9,036 281,068 290,104 3Total foreign 53,954 17 551 54,522 463,167 517,689 11Total 849,372 1,144,742 1,160,702 3,154,816 2,258,220 5,413,036
Domestic to totalfunding (%) 94 100 100 98 79 90
a. Excluding government deposits.
The Agricultural Bank is the largest bank in Lithuania in total funding. It has 46 branches and2,400 employees. The bank is 86 percent owned by the government, and has total assets worth Lt 1.5billion. Almost half of the bank's funding is supplied by the government, including significant amountsearmarked to support special lending programs to benefit the agricultural sector. The bank suffered a lossof Lt 32 million in 1997. As a result, it did not meet the capital or large exposure regulations at the end ofthe year. According to qualifications expressed by the international auditors, the bank is capital deficient.A Lt 40 million capital increase is in progress. The prior management board has been replaced. Theseactions have hampered privatization efforts. Advisers have prepared a revised tender, which they haveplanned to have in place by June-July 1998.
PRIVATE BANKS. There are eight private banks in Lithuania. Vilnius Bank is the largest privatebank, with over Lt 1,800 million in assets, and it has experienced significant growth since the end of1995. Hermis Bank (Lt 1,200 million in assets) competes with Vilnius for both the individual and privateenterprise customers in the Vilnius market and in other major commercial centers. Both banks, with
5
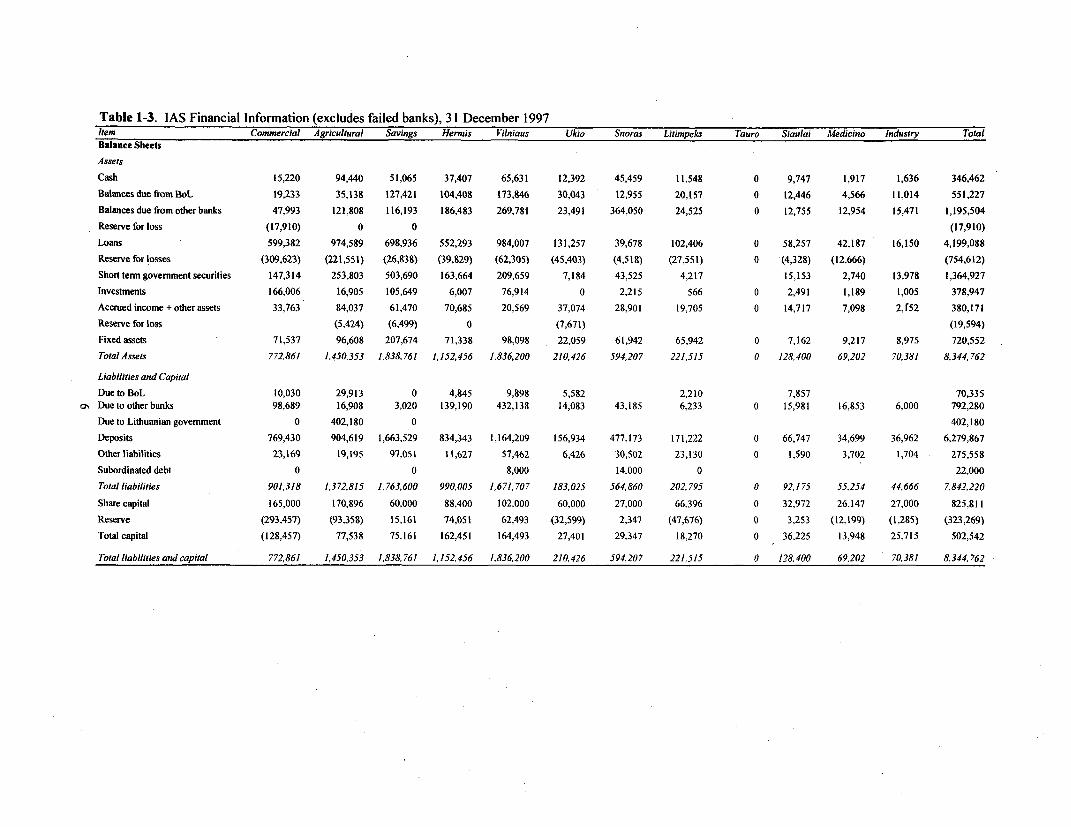
Table 1-3. IAS Financial Information (excludes failed banks), 31 December 1997Item Commercial Agricultural Savings Hermis Vilniaus Ukio Snoras Litimpeks Tauro Siaulai Medicino Industry Total
Balance Sheets
Assets
Cash 15,220 94,440 51,065 37,407 65,631 12,392 45,459 11,548 0 9,747 1,917 1,636 346,462
BalancesduefromBoL 19,233 35,138 127,421 104,408 173,846 30,043 12,955 20,157 0 12,446 4,566 11,014 551,227
Balances due from other banks 47,993 121,808 116,193 186,483 269,781 23,491 364,050 24,525 0 12,755 12,954 15,471 1,195,504
Reserve for loss (17,910) 0 0 (17,910)
Loans 599,382 974,589 698,936 552,293 984,007 131,257 39,678 102,406 0 58,257 42,187 16,150 4,199,088
Reserve for losses (309,623) (221,551) (26,838) (39,829) (62,305) (45,403) (4,518) (27,551) 0 (4,328) (12.666) (754,612)
Short term govemment securities 147,314 253,803 503,690 163,664 209,659 7,184 43,525 4,217 15,153 2,740 13,978 1,364,927
Investments 166,006 16,905 105,649 6,007 76,914 0 2,215 566 0 2,491 1,189 1,005 378,947
Accrued income + other assets 33,763 84,037 61,470 70,685 20,569 37,074 28,901 19,705 0 14.717 7,098 2,f52 380,171
Reserve for loss (5,424) (6,499) 0 (7,671) (19,594)
Fixed assets 71,537 96,608 207,674 71,338 98,098 22,059 61,942 65,942 0 7,162 9,217 8,975 720,552
Total Assets 772,861 1,450,353 1,838,761 1,152,456 1,836,200 210,426 594,207 221,515 0 128,400 69,202 70,381 8,344,762
Liabilities and Capital
Due to BoL 10.030 29,913 0 4,845 9,898 5,582 2,210 7,857 70,335
as Due to otherbanks 98,689 16,908 3,020 139,190 432,138 14,083 43,185 6,233 0 15,981 16,853 6,000 792,280
Due to Lithuanian government 0 402,180 0 402,180
Deposits 769,430 904,619 1,663,529 834,343 1,164,209 156,934 477,173 171,222 0 66,747 34,699 36,962 6,279,867
Otherliabilities 23,169 19,195 97,051 11,627 57,462 6,426 30,502 23,130 0 1,590 3,702 1,704 275,558
Subordinated debt 0 0 8,000 14.000 0 22,000
Total liabilities 901,318 1,372,815 1,763,600 990,005 1.671,707 183,025 564,860 202,795 0 92,175 55,254 44,666 7.842,220
Share capital 165,000 170,896 60.000 88,400 102,000 60,000 27,000 66,396 0 32,972 26.147 27,000 825,811
Reserve (293.457) (93,358) 15,161 74,051 62,493 (32,599) 2,347 (47,676) 0 3.253 (12.199) (1,285) (323,269)
Total capital (128,457) 77,538 75,161 162,451 164,493 27,401 29,347 18.270 0 36.225 13,948 25,715 502,542
Total liabilities and capital 772,861 1,450,353 1,838,761 1,152,456 1,836,200 210,426 594,207 221,515 0 128.400 69,202 70,381 8,344,762
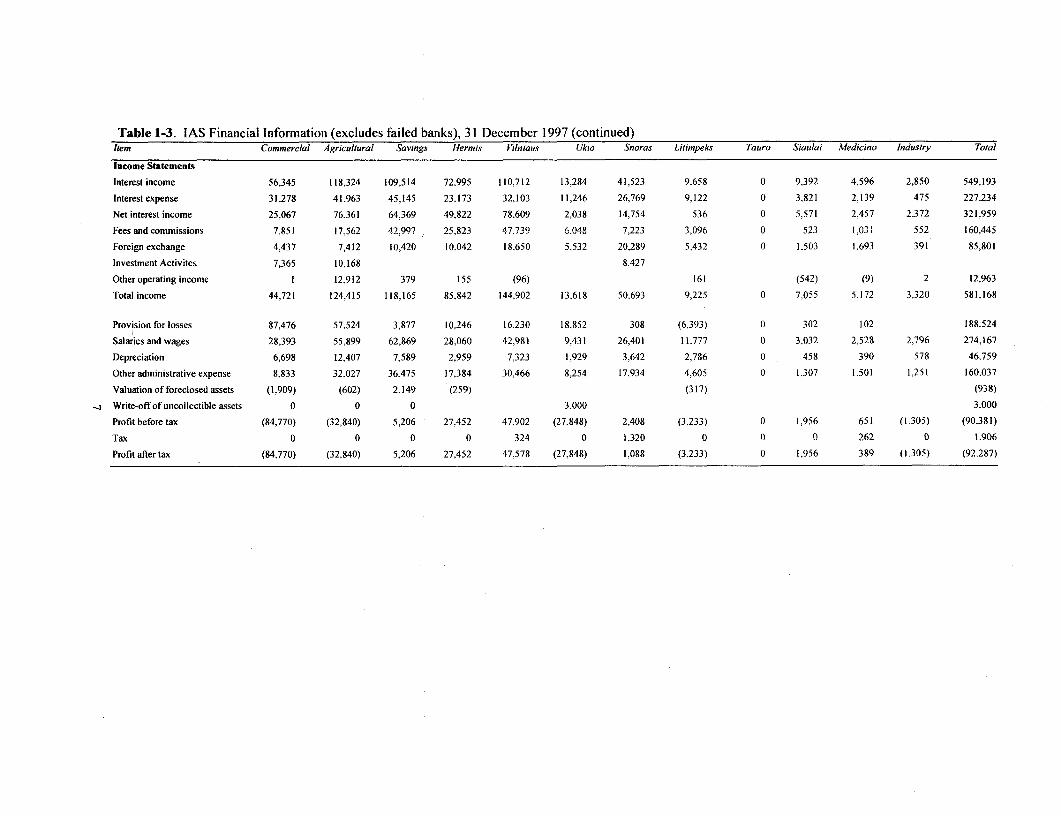
Table 1-3. IAS Financial Information (excludes failed banks), 31 December 1997 (continued)Item Commercial Agricultiral Savings Hermis iilniaus Ukio Snoras Litimpeks Tauro Siaulai Medicino Industry Total
Income Statements
Interest income 56.345 118.324 109.514 72.995 110,712 13,284 41,523 9.658 0 9,392 4.596 2.850 549.193
Interestexpense 31,278 41.963 45,145 23.173 32.103 11,246 26,769 9.122 0 3.821 2.139 475 227.234
Net interest income 25,067 76.361 64,369 49.822 78.609 2,038 14,754 536 0 5.571 2.457 2.372 321.959
Fees and commissions 7,851 17.562 42,997 25,823 47.739 6.048 7.223 3,096 0 523 1.031 552 160.445
Foreign exchange 4,437 7.412 10.420 10.042 18.650 5,532 20,289 5,432 0 1.503 1.693 391 85,801
Investment Activites 7.365 10.168 8.427
Other operating income 1 12.912 379 155 (96) 161 (542) (9) 2 12.963
Total income 44,721 124,415 118.165 85.842 144,902 13.618 50.693 9,225 0 7.055 5.172 3.320 581,168
Provision for losses 87.476 57.524 3,877 10.246 16.230 18.852 308 (6.393) 0 302 102 188.524
Salaries and wages 28.393 55.899 62,869 28.060 42,981 9.431 26,401 11.777 0 3,032 2,528 2.796 274.167
Depreciation 6,698 12.407 7,589 2,959 7.323 1.929 3,642 2,786 0 458 390 578 46.759
Other administrative expense 8.833 32.027 36,475 17,384 30.466 8,254 17.934 4,605 0 1.307 1.501 1.251 160.037
Valuation of foreclosed assets (1,909) (602) 2.149 (259) (317) (938)
Write-offofuncollectible assets 0 0 0 3,000 3.000
Profit before tax (84.770) (32,840) 5,206 27.452 47,902 (27.848) 2.408 (3.233) 0 1,956 651 (1.305) (90.381)
Tax 0 0 0 0 324 0 1,320 0 0 0 262 0 1.906
Profitaftertax (84.770) (32,840) 5,206 27.452 47,578 (27,848) 1,088 (3.233) 0 1.956 389 (1.305) (92.287)

Banking
major institutional and strategic foreign investors, have been able to attract both customers and capitalduring the period following the banking crisis. Recently, Vilnius Bank applied to the Bank of Lithuaniato acquire a 45 percent stake in Hermis Bank. The Bank of Lithuania has delayed approval of theapplication for somewhat dubious reasons. At the same time, Litimpeks and Ukio have suffered depositdeclines and have generally fallen behind in the marketplace. Litimpeks still depends on partialgovernment funding support. Snoras Bank, which has grown rapidly, primarily by investing in theforeign interbank market, has a sustained record of profitability. In an effort to attract more localconsumer deposits, Snoras has recently opened the first group of unmanned banking kiosks at severallocations, an innovation in the Lithuanian banking market. Siauliai Bank, located in Siauliai, primarilyserves its unique geographic market. The remaining two banks are small institutions, primarily servingspecific niches. (See table 1-3 for IAS financial statements for all private banks.)
Deposit Insurance Protection
Until the banking crisis in December 1995, the only legal basis for deposit protection was in the country'sCivil Code, which provided 100 percent protection for individual deposits in state-controlled banks.Private banks' deposits were not afforded deposit protection. During the banking crisis, Seimas passedseveral laws related to deposit protection. First, it passed a measure insuring individual deposits in allbanks up to a balance of Lt 5,000, with a 20 percent coinsurance provision. This law provided for thecreation of a deposit insurance fund, a methodology for financing the fund, and membership criteria forqualifying banks. Second, Seimas passed a law fully guaranteeing the creditors (including deposits) ofInnovation and Litimpeks "with all the assets of the state," but this law was rather vague concerning themethod and time of payment. Third, a temporary law was passed to compensate all deposits up to Lt5,000 (with a 20 percent coinsurance provision) in bankrupt banks. This law was intended to providedeposit protection for banks that had declared bankruptcy before the general deposit insurance lawbecame effective, as well as (during the period of effectiveness of the law) deposits in banks that did notqualify for membership in the newly enacted deposit insurance fund. According to the Ministry ofFinance, this law has expired.
The Seimas has since passed several laws that affected deposit insurance coverage. Late in thesummer of 1996, it revised the special Litimpeks and Innovation law to remove coverage for Litimpeksdeposits (the bank had been allowed to reopen) and to modify the Innovation provisions to provide fortermination of the coverage unless 40 percent of the litas amount of deposits was converted to equity by IDecember 1996. In April 1997, the special provisions for Innovation were again amended, this time toprovide for a payment mechanism. Individual depositors will receive up to Lt 8,000 in cash over aperiod ending in 1998, and any excess balance will be paid in five-year, non-interest-bearing bonds;nonindividual accounts would receive ten-year, non-interest-bearing bonds. In the spring of 1997,Seimas passed a law revoking the Civil Code provisions that granted 100 percent deposit protection forindividual deposits in state-controlled banks, thus removing the unfair advantage of these banks overprivate institutions in the competition for individual deposits.
In May 1997 the government finally funded the deposit insurance fund. At the end of 1997, thefund had a balance of Lt 48 million (including Lt 21 million in insurance premiums paid by the banks).The government will contribute an additional Lt 20 million in 1998. Monthly insurance premiums areexpected to be approximately Lt 2.4 million in 1998. The government will contributeLt 30 million in1998. Premium revenue is approximately Lt 2 million monthly based on current premiums of 1.5 percentof individual deposits. In July 1997 Seimas passed a law to increase the level of deposit coverage anddecrease the premiums paid by banks. This new law introduces two sliding scales-first, the depositcoverage is increased, beginning at Lt 25,000 in 1998 and rising to Lt 65,000 in 2000; second, the amount
8
Banking
of coinsurance is increased, depending on the amount of the deposit (the amounts differ for domestic andforeign currencies). For example, in the year 2000, the first Lt 25,000 will be 100 percent insured; thenext 20,000, 90 percent insured; and the top 20,000, 70 percent insured. If the same deposit were in aforeign currency, the coverage would be 90 percent, 80 percent, and 60 percent, respectively. Premiumspaid by banks are scheduled to be reduced to I percent of individual deposits in 2000.
Regulatory Structure
The banking system is regulated by BoL under the authority of the Law on1 the Bank of Lithuania. Whileseveral laws apply to the formation, operation, and liquidation of banks, the basic governing law is theLaw on Commercial Banks. This law has been subject to constant and repetitive amendment since itsintroduction in 1994. BoL has the authority under many provisions to issue regulations to carry out theintenit of the law.
Under the framework of these laws, BoL supervises banks through the operation of its BSD,which is staffed by fifty-three employees (increased from seventeen in 1993), twenty of whom are bankexaminers (increased from five). The staff has received advice and training from on-site advisers,participated in a range of technical seminars, and received training abroad. The BSD is charged with theresponsibility to examine banks and to report to the BoL board. This board, composed of fourteenmembers, is the decisionmaking body for any actions to be taken against banks. All examination reports,proposed administrative actions, imposition of restrictions on activities, and bank closings must beapproved by the board.
The BoL has Ibeen aggressive in improving regulations since the end of 1995. The adoption ofIAS (for all regulatory purposes) and the bank capital adequacy rules are most noteworthy. New,strengthened provisioning regulations and currency exposure reporting rules have been imposed. Largeexposure and connected lending rules have been tightened, and the definition of borrower and connectedperson expanded.
Key Medium- and Long-Term Policy Issues
Excessive Political Interference in the Banking System
The banking sector remains subject to excessive political influence and control. This has seriouslyhampered BSD's abilbity to consistently supervise banks, allowed for inconsistent treatment of banks,undermined the transparency of the system, and thwarted privatization efforts. Politically and sociallymotivated lending, while reduced in volume, is still present. Laws and policies that favor or penalizespecific banks, their depositors and customers, or their shareholders continue to be part of the system.That influence has taken several forms.
INDEPENDENCIE OF THE CENTRAL BANK. The independence (both in principle and practice) ofBoL is, at best, not apparent in Lithuania. The BoL board is structured to allow for governmentknowledge and influence. A few notable recent actions illustrate the situation:
In 1997, BoL adopted IAS and tougher capital requirements and announced that any bank thatdid not meet the requirements would have its license revoked. The determination would be madeon the basis of March 1997 data. In April 1997, Seimas passed a law exempting the state-ownedCommercial Bank (then deeply insolvent) and the Agricultural Bank (undercapitalized) from theBoL rules, effectively eliminating the country's largest and fourth-largest banks (a quarter of thesystem's assets) from supervisory action until (and if) the banks are privatized.
9

Banking
* The BSD has proposed fourteen monetary sanctions against banks and bankers in the last year.Only two have been approved by the fourteen-member board of BoL. Those serving on theboard include members of the business community and a representative of the Bankers'Association.
* BoL receives numerous inquiries from both government and Seimas for information. Some ofthese requests involve bank-specific information that by law and rule is not to be made public byBoL. Failure to respond to such requests, however, is viewed as noncooperation andincompetence on the part of BoL. Responding to such requests risks not only potentialviolations of law, but also inappropriate public disclosure of the information (often incomplete orinaccurately interpreted), which can lead to damage to the financial sector.
* In 1997 Seimas passed an amendment to the Commercial Banking Law regarding the duties andresponsibilities of temporary administrators. The law specified that temporary administratorsreported directly to BoL. Through the temporary administrator, the board of BoL assumedduties and responsibilities of the board and council (and in some matters, shareholders) of theadministered bank. The law also provided, however, that all significant actions of a temporaryadministrator in a state-controlled bank must be approved by the government, thereby cedingsignificant supervisory and management authority to the government (which controlled thetroubled bank council before the appointment of an administrator), while BoL retained all theresponsibility.
* Government policies that limit compensation and expand background clearance of members ofBoL's board and staff further undermine their commitment to act independently of politicalconsiderations.
BANK-SPECIFIC LAWS. The practice of proposing and enacting laws that target individual banks,and selected issues surrounding those banks, needs to be stopped. This practice creates the impression ofa lack of foresight on the part of government, inadequacy in the existing laws, and/or political intrigue inthe application of laws and policies. It also rewards inappropriate actions in the banking sector and raisescompetitive issues for well-run banks, ultimately promoting inequitable treatment of banks (explainedfurther below).
The Innovation resolution is representative of this issue. After BoL placed a moratorium onInnovation Bank (a deeply insolvent bank), Seimas passed an emergency deposit insurance law partiallyinsuring deposits in all banks up to Lt 5,000. At the same time, Seimas passed a law guaranteeing, in full,all creditors (including all deposits) in Innovation Bank. These two laws not only did not reassure themarket (their alleged purpose) but also sent a clear signal that political forces were at work-forces thatundermined the authority of BoL. The subsequent series of special Innovation laws, which required thatInnovation be reopened (clearly giving preference to large, influential depositors) and its creditorguarantee be made contingent upon deposit conversion, as well as the eventual modification of itscreditor compensation scheme in 1997, effectively foreclosed the mandated actions by BoL under theexisting statutes. In the end, all of this prolonged the resolution of Innovation's problems throughliquidation and created additional fiscal and political costs for the government.
In another notable example, BoL issued enhanced capital adequacy regulations in 1997 tostrengthen the banking sector's solvency position. All banks knew of these new requirements well inadvance of the effective enforcement date, including the possibility that BoL would revoke the licensesof any banks that failed to comply. The well-run private banks all met these new rules by raising capitalin advance of the enforcement date. Yet, when it became apparent that two of the state-controlled bankswould not meet the requirements, Seimas passed a law effectively exempting these banks from BoLcorrective actions until they were privatized. The seeming reluctance of the government (as controllingshareholder) to assure compliance by its banks and the apparent will of the government (as regulator) to
10
Banking
override internationially accepted banking standards creates, at the least, an uneveni playing field for thebanking sector. The rules apparently do not apply to the biggest players, and BoL can be overriddenwhen it imposes the same discipline and cost on government (as a shareholder) as on the private sector.At worst, this indicates that political expediency overrides financial reality. In addition, such actionsundermine privatization of state-owned banks. Overt political interference and lack of financialdiscipline decrease the willingness of market-oriented investors to buy equity in the banks in question.
FUNDING SUFPPORT FOR TROUBLED BANKS. BoL has adopted more stringent guidelines on theuse of its funding for troubled banks. These requirements, common in most industrial countries, includethe requirement that BoL advances be collateralized; this renders BoL unable to fund the liquidity needsof a bank with uncollateralized advances, as was done in the cases of Innovationi, Litimpeks, and otherformerly troubled banks. In addition, the guidelines require short-term repayment of advances, whichhistorically had not been repaid. Because these guidelines have removed a source of unsecured, long-term funding support, troubled banks have turned to the government.
For example, the government publicly committed not to provide any additional fundilig supportfor Litimpeks upon its reopening in 1996 and required the repayment of the outstanding governmentdeposits by the end of 1996. Nevertheless, little repayment was received. While the government did notdirectly provide additional support, state-owned enterprises increased their funding, while the privatesector withdrew funds. This could be understood by the market as either total disregard by the state-owned enterprises of the financial condition of the bank or political direction by the government-bothperceptions could have resulted in a loss of funds or value to the government.
In another example, during 1996 the State Commercial Bank realized significant losses andexperienced a funding crisis. When the bank's problem became known, the government ordered publicauthorities and agencies to move their deposits to the bank to minimize its liquidity problem. Theeffective funding of private sector deposit withdrawals with government deposits is essentially a fullguarantee of the withdrawn private deposits and permits a "preference" (under the deposit insuranicescheme) to the withdrawing depositors over both the remaining depositors and depositors of other banks.It can be argued that the funding was placed by the government in its role as shareholder-if so, thegovernment should have placed significant funds in capital, as opposed to a deposit account, because thecapital needs of the bank must also be met by the shareholder. As capital, the funds would allow the bankto meet prudential guidelines and permit the government to avoid the appearance of continuing to fundinsolvent banks. Funds invested in capital would also represent a budget expenditure, however,something the government may have not been able to afford.
In at least two other cases (Aura and Tauro), the government and related agencies haveconcentrated deposits in banks so heavily that they became the banks' largest class of depositors. Such ahigh concentration of deposits without financial diligence on the part of the depositor (especially thegovernment) or competitive bidding creates the impression of political motivation. Subsequent directrequests to BoL for information and assurances of the quality of the bank also impinge on BoLindependence and could be perceived as a violation of law.
DIRECTED FUNDING. The government has historically directed funds to state-controlled banksfor use in lending programs designed to support selected sectors of the economy. These programs wereprimarily directed toward agriculture and housing (as of 31 December 1996, 20 percent and 29 percent ofState Commercial Bark and Agricultural Bank loans, respectively, were directed lending, and 20 percentand 30 percent, respectively, of the banks' funding was directed funding). The banks used these funds toprovide loans that could not otherwise be obtained in the market to selected sectors-for instance, long-term loans for housing at subsidized interest rates. The bank could generally earn a spread of 5 percent
11

Banking
over the cost of funding and would be responsible for the credit risk. Under these programs, thegovernment has provided the funds at no, or low, interest rates. The banks historically had little or no sayin the loan process. As a result, the maximum margin the bank could make was more than offset bycredit losses. In one program, the government ordered a suspension of loan servicing to aid debtor farmprocessors. The agriculture programs were essentially stopped in 1997, with the governmentguaranteeing the remaining balance of program loans (by government decree, the bank could offsetspecific provisions against the funding balance). The housing program continues. Considering the creditlosses, limited margin, and implied capital utilization, the banks do not see this activity as profitable.While most countries provide support for policy initiatives, such programs are usually structured so thatthe private sectors (in this case, banks) can choose to participate or not, and they can reasonably expectto earn a profit. Because the Lithuanian programs are carried out only in state-controlled banks, there is astrong presumption that government policy costs are being borne "off budget" at the expense of thebanking system.
SALARY LIMITATIONS IN STATE-CONTROLLED BANKS. In June 1997, the government decreedthat salaries of executives in state-controlled banks would be determined by a formula and tied togovernment employee salaries. The highest-paid bank employee (the chairman) could makeapproximately Lt 4,000 monthly (roughly the salary of an assistant department head in a private bank).This proposal affects virtually every board member of every state-controlled bank. All employees underlong-term contracts at higher amounts were asked to renegotiate their contracts to bring their salaries intoline with the new framework. Refusal meant facing the threat of dismissal, with relief from the courts fortheir contractual compensation. Bank directors owe a fiduciary responsibility, not to specificshareholders, but to the shareholders as a group, to the institution, and to the depositors. Representingone shareholder's interest against the best interest of the other constituencies is a serious breech offiduciary duty. By dictating instructions to bank council members, the government undermines theirability to act in the best interest of the institution. By lowering salaries to civil service levels withoutconsideration of the impact on the competitive position of the institutions, the government has placed thetwo largest banks in the country in potential financial peril, because experienced management will seekother opportunities. The government has indicated that the reason for the lowering of salaries was tobring cost/revenue ratios in line with the private sector and to reflect the lack of generally acceptableperformance. The way to address these issues, of course, is through a strategic business plan, the hiringof professionally competent leadership at competitive compensation, and the removal of politicaloperations from the banks, not through a wholesale reduction of board salaries that may lead to the massresignation of competent senior management. In addition, major cost reduction is not to be found incutting board salaries, but in a thorough evaluation of all staff and branch facility costs. If the councilbelieves management salaries are too high, the council, not government, should compare them with thetotal compensation of similar positions in the industry, not in government. If a board member is notperforming according to the bank's strategic plan, the proper action is to replace the individual boardmember, not to reduce salaries for the entire board.
Ironically, state-controlled banks covered by this proposal had one of their best performanceyears, and both the Savings and Agricultural Bank have begun implementation of branch and personnelrationalization programs. The present capital needs of the banks were not created by poor 1996performance, but by growth and the adoption of IAS (which recognized long-standing problems).Finally, plans to privatize the state-controlled banks are undoubtedly jeopardized because experienced,quality management is a major asset to the purchaser. To cause a change in management and/or to createdisenchantment among management is clearly not in the best interest of a shareholder (that is, thegovernment) in the midst of a privatization process.
12

Banking
DIRECTED BANK INVESTMENTS AND LOANS. The state-controlled banks own more than half ofthe outstanding TBs. While holding securities is a normal part of banking operations, such a largeconcentration of ownership to the exclusion of other investment alternatives, combined with governmentownership, could indicate a subsidy to the government at the expense of the bank. The nature of the TBauctions (the government, which owns some of the bidding banks, sets an undisclosed upper limit to therate), the lack of participation of other domestic banks, and the (recently removed) restriction on lendingat the Savings Bank (Savings Bank is the largest single owner, and its participation in the market beganafter the government imposed a lending moratorium on the bank in the summer of 1995) will inevitablybe seen as a controlleci purchase environment.
Directed lending to the energy sector provides further illustration of non-profit-maximizingdecisions among state-controlled banks. In the fall of 1996, the government tried to reduce the level ofenergy payment arrears among its agencies and institutions at the control and municipal levels. Becausethe government did not want to fund this reduction "on budget" at the time, the Savings Bank (then undera lending moratorium) was asked to lend, and did lend, the enterprises the required funding. This notonly represented use of public deposits to fund government, but also raised corporate governance issueson the part of the bank's councils. It hampered both the will and the ability of the government toprivatize the banks. In the longer term, the government will not give up control of such a powerful policytool and the private sector will not want to invest in banks that are instruments of government control.
GOVERNMENT RESTITUTION PROGRAMS. The government is in the process of developingrestitution vehicles for citizens. The recently passed Savings Restitution Program includes twoprovisions that indicate possible government favoritism and political use of the banking system. Thefirst provision calls for the establishment of accounts at the Savings Bank as the depository for fundsreceived in the restitution process. The government envisions the eventual deposit of significantprivatization-generated funds into these accounts. Nevertheless, these deposits could generate significantadditional capital neecls in the Savings Bank at a time when the government (as owner) has indicated nowillingness to privatize the bank or to provide additional capital to the undercapitalized state banks. Inaddition, there is no indication of how the Savings Bank could profitably employ these funds or if the costof servicing the accounts will exceed their value to the bank. Because the law establishes these accountsand specifies that they are to be held at the Savings Bank, there is no vehicle for competitive bidding byother banks. Since all banks (except state-controlled banks, which are effectively exempted by law) mustmeet higher supervisory standards, there is no reason banks should not compete for the opportunity toservice restitution accounts.
The Savings Restitution Law also provides for the creation of a Savings Restitution Fund, whichis allowed to borrow nnoney to pay for restitutions, using the assets (or securities) listed for privatizationas collateral (in an amount not less than 50 percent of the value of the assets). These loans will not beguaranteed by the government. Early drafts of the law indicated that the fund would borrow from theSavings Bank. The law, as passed, refers to "the Savings Bank and other banks" as possible lenders.Nevertheless, it is very likely that the government will borrow from the Savings Bank to accelerate thetransfer of funds to thie beneficiaries of the restitution scheme. The government's recent decision toallow the Savings Bank to reinstitute lending, its reluctance to privatize the bank and relinquish control ofthe council and board., and its history of directed lending further strengthen this possibility. Also, therequirement of not lending less than 50 percent of the value of an asset is a decision that should not bemade by law, but by the lender. The banking system should be involved in the Savings RestitutionProgram only on a voljntary, profit-driven, and transparent basis, if it should be involved at all.
13
Banking
The Pace of Privatization of State-Controlled Banks
PROGRESS AND FUTURE PLANS. In February 1997, the government announced plans to privatize theState Commercial Bank and the Agricultural Bank. The plan envisioned the hiring of investment advisersfor each bank through international tender. The investment adviser's role is to assist the government inpreparing the banks for privatization by providing advice on privatization methods and assisting in theevaluation of proposals for purchasing bank shares.
As previously mentioned, the State Commercial Bank was liquidated in the spring of 1998, andmost of its assets and liabilities were transferred to the Savings Bank. Originally, the bank was scheduledto be privatized by September 1997. There were no expressions of interest in buying the bank during twointernational tenders. Major private banks were not interested in the franchise, and foreign buyers wereapparently concerned about asset quality, future profitability, and current capital deficiencies. Thegovernment's current plan for privatization of State Commercial Bank is based solely on a proposal forthe European Bank for Reconstruction and Development (EBRD) to contribute Lt 120 million in capitalin return for 35 percent of the bank's stock. EBRD's proposal contains several key conditions:completion of a due diligence examination; transfer of troubled assets to Turto; new managementacceptable to EBRD; resumption of the twinning arrangements; and, most important, a "put option" to thegovernment at cost (surely to be negotiated to include a minimal financial return) after a specified periodif EBRD is not satisfied with the investment. The government would retain a 65 percent ownershipposition. The bank would be privatized after a period of two or three years.
The tender for advisers for the Agricultural Bank is complete; the government selected aconsortium consisting of two international firms and a local brokerage firm. The bank is believed to havesome investor appeal and could attract interest. The IAS information in table 1-3 indicates that the bankis solvent. Current plans envisage that this privatization will be completed no later than 30 June 1998.
The government has long hesitated to make a decision to privatize the Savings Bank. A varietyof reasons were given for its reluctance to include the bank in privatization efforts. Some feel there is apublic need for government ownership to provide a safety net for depositors. This reason has beensignificantly less important since the elimination of the special deposit protection provided by the CivilCode, the strengthening of the prudential rules (and their enforcement), and the increased stability of themajor private banks. In addition, the perception of government ownership (even when the Civil Codeprovisions applied) did not stop a liquidity crisis at the State Commercial Bank. Others believe that thebroad branch network of the Savings Bank provides the only alternative for banking services to smallcommunities in the rural areas. While a valid concern, the Savings Bank has recently begun a branchjustification program that is likely to eliminate smaller, unprofitable branches. There is also a belief thata government-controlled distribution system is needed to disburse government funds to participants instate-sponsored programs (such as social insurance, welfare, and unemployment). These programscould-and should-be handled through other mechanisms. The main issues of a distribution system aresecurity of payments and cost. To have the banking system and its depositors fund the cost of thedistribution system is inappropriate. If the Savings Bank were privately owned, it, along with otherbanks, could competitively bid to provide the government with that service, and the postal system couldbe employed as well. All factors considered, there appeared to be no justifiable reason not to privatizethe Savings Bank, and, after discussion with the World Bank in May 1998, the government announcedthat the Savings Bank would be privatized within one year after the Agricultural Bank has beenprivatized.
IMPEDIMENTS TO PRIVATIZATION. The balance sheets and operations of the state-controlled
14

Banking
banks create both policy and value maximization issues that should be addressed during the privatizationprocess. Some issues are relevant to both banks, while others are unique to individual institutions.
First, large concentrations of government securities may be a disincentive to bLyers (for example,the Savings Bank holds a quarter of all outstanding TBs, worth one-fifth of its assets). A buyer may beable to liquidate short-term securities through the market or normal maturity, but if a buyer chooses not toparticipate in future short-term security offerings, the government could be faced with an increased costof borrowing, because the largest participants (the currently state-controlled banks) may choose not toparticipate. Longer-term securities (especially recapitalization bonds) may be discounted by a purchaser(resulting in a reduced sale price for the bank) because of inadequate yield and the lack of liquiditycaused by the nontransferability of these assets.
Second, the government may not be politically able to afford the large discounts that potentialbuyers will require to buy the state-controlled banks in their current condition. Buyers generally formtheir own opinion of the quality of a bank's loan portfolio. Such an opinion is based on the buyers'methodology and judgrnent, not necessarily the same techniques and judgments forned by the bank'sauditors and regulators. A buyer will also subtract from value any potential cost (both lost interestincome and collection expense). Less uncertainty and suspicion are created when subquality loans areeither removed or their quality enhanced by the seller of the bank. Subsidized and directed loans may notbe attractive to a buyer, and below-market-interest-rate loans will be discounted. Directed credits will bereviewed with particular care for credit risk. A buyer will evaluate the cost of management and capitalsupport for these programs in addition to the yield and loss risk.
Third, the banks in question have large government and state-owned enterprise deposits and othergovernment-related funding. Government deposits (especially those in place for liquidity purposes) donot necessarily enhance, and may decrease, privatization value. A buyer will be concerned about thestability of these deposits after privatization and may request binding agreements governing theirpresence to protect the bank's liquidity. A buyer will be required to maintain capital to support thesedeposits and will look for an adequate return on this additional capital. If the deposits are to remain in thebanks, the government should evaluate the impact that reduced interest rates and extended terms willhave on government operations and budgets in order to enhance (or maintain) privatization values.Similarly, the deposits of state-owned enterprises, as well as deposits of municipal organizations, mayalso be subject to long-term arrangements to maintain privatization values, a process that the centralgovernment may find difficult to coordinate.
Fourth, the banks in question have a number of unprofitable branches and an excessive numberof employees. Based on1 analysis by their own management, they range in size from 32 to 46 branches,1,500 to 3,400 employees, and a deposit size for each employee of Lt 300,000-400,000. This can becompared with Vilnius Bank, the largest private bank, which has 15 branches, 745 employees, and Lt1,000,000 in deposits for each employee. A buyer will analyze branch profitability, including theimbedded cost of facilities and the flexible cost of salaries. Too large a branch network and overstaffingwill reduce privatization values. The banks are now in various stages of branch and employeerationalization programs. If significant adjustments are required, privatization values will be enhanced ifthese costs-including accrued branch closing and employee termination costs-are recognized before,or during, privatization. Excess facilities may be redeployed for other government activities and can betransferred to the government in return for a reduction in deposit balances.
Finally, a key element in enhancing privatization value is quality, experienced management.Lack of experienced management is a serious threat, not only to privatization, but also to the continuedviability of the bank. The previously mentioned government decrees related to capping the salaries of
15

Banking
management boards at civil service compensation levels in the state-owned banks has led to resignationsand uncertainty at the other two banks. This action has jeopardized not only the privatization effort butalso the future financial risk the government (as owner and as regulator) is accepting by notcompensating senior management competitively.
The Need to Enhance the Legal and Institutional Framework
LEGAL AND REGULATORY FRAMEWORK DEFICIENCIES GOVERNING BANKING INSTITUTIONS.Since 1994, the Commercial Banking Law has been significantly improved. During this time, numerousamendments to the law have been incorporated, many in swift reaction to crisis or immediate need. As aresult of this climate of change, a comprehensive review of this law and other laws related to banking hasnot been undertaken. There are currently several laws that govern the activities of banks and bankers.For instance, if not specifically overridden by provisions of the Commercial Banking Law, the Joint-Stock Company Act applies to corporate activities and governance of banks. Financially related crimes,fines, and penalties are covered in other statutes. Bankruptcy of banks and related liquidation proceduresare defined elsewhere.
Recognizing that banks are different from other corporate entities because of the additionalresponsibility to depositors and the nature of the public trust, the general provisions of laws relating tocorporations, corporate directors and officers, and bank customers are not adequate to meet therequirements of the unique banking environment. Bank management and bank employees have a specialaccountability to the public. Bank stockholders do not necessarily have the same accountability, butshare the risk of reduced rights if the public trust is not honored by the council and management of thebank. As a result of their choice to be bankers and bank owners, these individuals may waive the normalproperty right protections, privacy standards, and other rights afforded by general law.
Provisions of general statutes have occasionally been difficult to apply or enforce in a bankingcontext. For example, the Joint-Stock Company Act's securities issuance provisions have delayed theraising of capital when a bank has been critically undercapitalized. The act's shareholder rightsprovisions have also hampered the raising of capital. The Bankruptcy Act provisions can createadministrative delays in distributing funds to depositors. There is no clear definition of insolvencysuitable for the banking environment. Penalties for financial crimes are often inadequate when comparedwith the financial reward for committing the offense.
The Commercial Banking Law itself has also occasionally been difficult to apply because of itsconflicting or ambiguous sections. For example, there is a view that BoL can hire, but not fire, atemporary administrator. The Commercial Banking Law is ambiguous regarding BoL's ability tosupervise bank subsidiaries, or even to request certain financial information regarding those subsidiaries,a key issue as banks set up more operations (for instance, leasing) in subsidiaries. The information thatregulators can request about bank officials is limited.
LEGAL AND PRACTICAL IMPEDIMENTS TO INCREASING THE VOLUME OF QUALITY LOANS. TheLithuanian legal framework is generally debtor-friendly. This bias has led to increased losses in banks,not only from credit losses but also through undue direct costs and losses of interest from delayedcollection of residual values. More important, as banks have gained knowledge and experience (realizingthat the borrower has a definite advantage over the lender), lending activity has been curtailed. Someprofitable lending markets have failed to develop (for example, auto, office and plant equipment, andconsumer goods) and banks have explored costly and laborious methods of creating quality loans (suchas leasing and substitute collateral). Recent legal developments have improved the situation. The
16

Banking
amendments enacted to the Bankruptcy Law assuring recovery to secured creditors to the extent of theircollateral value have been a significant enhancement. The ability to perfect a lien through the enactmentof lien registry provisions also indicates continued progress. Nevertheless, bankers still claim that it wasbetter in many cases to make an unsecured loan and take the credit risk than to obtain, collateral, registerthe lien, and repossess the collateral in the event of default.
The new lien registry system, while recently authorized, has not yet been implemented. Theexisting system for immovables did not fully protect against multiple pledging. In addition, the cost ofregistering was a percentage of the loan, and it was unrelated to the cost of registering. As a result, manybanks did not register a lien (especially on large loans) until the loan experienced difficulties. The newlaw should be implemented expeditiously and a cost structure established that relates to the cost of theregistry.
The process of'debt resolution is still burdened by legal and procedural obstacles. The inabilityof Lithuanian corporations to own land has hampered the ability of banks to make loans backed by realestate.2 If a bank makes a loan on an office building or house and the borrower defaults, the bank (as acorporation) cannot foreclose and take title to the land under the building, and temporary title to hold foreventual sale is unlawful. This results in a bifurcation of ownership. The law has also led to a longprocess for the acquisition of real property held as collateral; the transaction often extends for monthsafter a borrower has defaulted. While the new Bankruptcy Law clarifies the secured creditor's priority inbankruptcy, it does not address the secured creditor's ability to remove the collateral from the bankruptcyprocess in a timely manner and recover the sale proceeds.
The repossession of moveables is equally complicated. For instance, bankers indicate it oftentakes three months to repossess a vehicle that is collateral for a loan. As a result, very few loans aresecured by automobiles. By the time the bank has the right to possess the collateral, in most cases thecollateral has been damaged or has disappeared. The result is an increase in the leasing ofmoveables; thebank retains title to the collateral until all payments are made. While apparently circumventing thecollection (and lien registration) problem, this practice could subject the bank to liability from legalactions for loss or tort through the ownership of the moveable. For example, if an accident occurs in anautomobile that a bank "owns," the bank may be held liable.
One method of stimulating quality credit on both a mass scale (that is, loans on identical termsand collateral) and for large projects is to create the legal framework for syndicated lending. Forexample, if a large project requires financing beyond the legal ability or risk tolerance of one bank, thebank could sell participation in (parts of) the loan to other banks or sophisticated investors. Not only isthere no legal framework for this activity in Lithuania, but there is also a statutory prohibition againstlending money unless granted a license by BoL. For instance, when the government established atroubled-debt work-out unit (owned by the government), it was necessary to create a limited-license bankto collect and restructure debts. This prohibition appears to prevent nonbanks from participating inmajor loans or any other kind of lending activity.
DEPOSIT INSURANCE COVERAGE AND PREMIUM ISSUES. The existing deposit insurance schemeis two-tiered. According to the Ministry of Finance, the recently funded deposit insurance fund will notafford deposit protection for a bank until the bank has paid at least one year of premiums. All operating
2. A law has been passed allowing legal entities to own land, but government decrees and detailed instructions aremissing. The law has therefore not yet become effective, and there is some doubt that it will become effective inthe near future.
17
Banking
banks have by now paid the required one year of premiums. The Temporary Law on Deposit Insurance,which covered deposits until the required premiums had been paid, has expired.
The overall cost of the fund is also a major issue for the domestic banking industry. The plannedincreases in coverage mentioned earlier raised the potential cost to the fund. At the same time, thecurrent level of assessments to banks (1.5 percent of household deposits) exceeds the profitability of thesector for 1996. Even excluding the 1996 losses of State Commercial Bank, those assessments amount toa quarter of the system's profitability. (The sector currently has approximately Lt 1.6 billion inhousehold deposits.)
RELATIONSHIP OF THE DEPOSIT INSURANCE FUND WITH OTHER GOVERNMENTAL UNITS. Theresponsibilities of the deposit insurance fund are limited to the compensation of depositors. According tothe Ministry of Finance, the fund cannot file claims with the Bankruptcy Court to recoup funds advancedto depositors. The only claims the fund can file are those for expenses in administering depositorcompensation.
The fund's relationship with other governmental units is not clearly defined. For example,interactions and communication between the fund and BoL and/or the Ministry of Finance are notspecified. Under present law, revocation of license is the only way for BoL to close a bank. BoL maypetition the Bankruptcy Court to place a bank in bankruptcy, but this does not technically close a bank. IfBoL revokes a bank's license, then BoL no longer has authority over the institution, and the law is muteas to whether the fund can take over the liquidation of the failed bank. There is a possibility that a bank(now a former bank) can exist in regulatory limbo, with no government oversight and no automaticadministrator (until the court can appoint a liquidator).
The government has yet to develop a policy regarding the best method to recover assets fromfailed banks. In most cases to date, the recovery has been left to the court handling the bankruptcy. Inthose cases, the court appoints a receiver and the receiver marshals assets and pays claims uponcompletion of the asset collection process. Bureaucratic court procedures, the lack of written policies orguidance, the rights of all creditors to appeal decisions, and other structural problems (debtormanagement appointed as administrators; government, by law, prohibited from writing off debts; lack ofexperienced and trained judges) cause prolongation of bankruptcy cases. To date, no bank bankruptcycase has been completed. In the case of Innovation Bank, the largest failure so far, the special lawrequires a liquidation outside bankruptcy. Innovation's assets were transferred to Turto Bank formanagement of the process of collection and sale (with the government retaining title to the assets).
Policy Recommendations
The main elements of continuing banking sector reforms will be a significant reduction of politicalinfluence, complete privatization of the government's ownership in the sector, an enhanced legal andinstitutional framework for bank operation, and an improved deposit insurance system. All of thesereforms should be undertaken with the following goals in mind:
* Increasing the safety and soundness of the banking sector* Insuring a level playing field for all sector participants* Improving the transparency of government social and budgetary programs* Increasing the quality and availability of credit and other services to bank customers* Enhancing public confidence in the sector.
18

Banking
Reducing Political Interference in the Banking Sector
INCREASING THE INDEPENDENCE OF BoL. A critical element in improving public confidence andincreasing the safety and soundness of the banking sector is the assurance of a well-goVerned, consistent,and fair supervisory function. This function should be independent of political influence. While politicaloversight and involvement in the legislative process related to banking is appropriate, and common in allcountries, such political activity should normally be limited to establishing a consistent and viable legalframework for the operation of the banking sector. International practice (including EU directives) callsfor the independence of the Central Bank and, in particular, the bank supervision function. A 1992study3 has rated central bank independence. Countries with a less independent central banks (Argentina,Brazil, Indonesia, Japan, and, most recently, Malaysia, Mexico, Sweden, Thailand, and Venezuela) haveall experienced significant banking crises. Countries with more independent central banks (Canada,Germany, Greece, and South Africa) have generally remained crisis-free. The independence of a centralbank's bank supervision function is usually determined by the extent to which external bodies(government, Seimas, the private sector) can influence (a) the consistency of the legally enacted policyframework under which the central bank operates, (b) the appointment and continued tenure of itschairman and board, and (c) the budget and operating policies of the central bank and its staff. Countrieswith central banks that report to the government and can have their chairman dismissed for policy reasons(such as Japan) have a much more dependent central bank than countries where the only possible reasonsfor dismissal are criminal offenses, illness, or conflicts of interest (such as Germany and the UnitedStates). Budgets and operating policies that are subject to political influence weaken the central bank(Japan). Still, legislative bodies have a review function to instill transparency (Germany, Sweden, andthe United States). Some countries, notably New Zealand, have a system where the central bank's budgetis approved by the legislative body, but for a five-year period instead of the normal one-year period of thegovernment's budget, in order to remove short-term political influences.
While the current law alludes to BoL independence from the government, legal deficiencies andpractices threaten the truie independence of the bank. To increase the independence of BoL, the followingchanges in law are suggested:
* Explicitly stipulate that BoL is independent of Seimas. Provide for Seimas to receive reports ofthe activities of BoL and to review its budget, but to have no direct, required approval of theactions or budgetary issues of BoL.
* Give BoL the legal right (or option) to act under existing laws and regulations to resolve specificbank issues in lieu of bank-specific legislation by Seimas. Alternatively, require all changesimpacting enforcement of the banking law or regulations affecting individual banks (rather thanthe sector as a whole) to have a minimum prospective effective date.
* Specify that Seimas cannot reduce a particular BoL board chairman's salary once the chairman isappointed.
* Provide that employees of BoL enjoy the same independence as board members.* Prohibit BoL board membership of people whose immediate relatives are part of the council or
board of a financial institution, or persons with a financial interest in, or who represent in anymanner, a financial institution or group of financial institutions.
* Require documented abstention if a board member and/or his immediate family has direct orindirect (through partnerships or legal entities) borrowings from an institution under boardconsideration.
3. A. Cukierman, S. B. Webb, and B. Neyapri, "Measuring the Independence of Central Banks and Its Effect onMonetary Policy Outcomes," World Bank Economic Review 6, No. 3.
19

Banking
* Provide that the chairman of the board (or the board in its entirety) determine compensationlevels for BoL employees.
* Specify that employee hiring decisions and related background investigations are to be a functionof the BoL board or its designees. Ensure that government agencies with information necessaryto make the decision are given authority to provide such information to BoL.
* Provide that selected, minimal data and information held by BoL are confidential. Allow BoL thecontinued authority to expand confidential treatment if it is necessary to protect the financialsystem.
* Provide for selected (but not all) bank supervisory actions to be determined by less than the entireboard (that is, by an executive committee or bank supervision committee).
The government and the Seimas need to take immediate steps to reverse any laws and policiesthat hinder BoL independence, particularly provisions of the Bank Privatization Law that permit theAgricultural Bank to be exempt from BoL regulations and the recently enacted policies that placearbitrary limits on BoL staff compensation.
ADOPT RULES (OR LAWS) FOR PLACING GOVERNMENT DEPOSITS. The government should haveexplicit, definitive policies that govern the placement of its funds. The use of government funds toprovide liquidity for troubled banks not only puts the funds at risk of loss, but may also deny theiravailability for normal government operations until the institution recovers. In addition, concentrations ofgovernment deposits in particular banks (troubled or not) creates liquidity risk to the bank if thegovernment chooses to quickly withdraw funds. Consideration should be given to establishing criteriafor the minimum standards a bank should meet to receive funds (perhaps higher than BoL standards) andlimitations on concentrations based on the size of the bank (for instance, as a multiple of capital).Additional thought should be given to requiring collateralization for large government deposits (if theyexceed an established standard) and developing a bidding system that allows qualified-and onlyqualified-banks to compete for deposits based on yield to the government. For instance, in the UnitedStates, most states require an open bidding (based on interest rate and services provided) from qualifiedbanks. In addition, all deposits over a specified amount require collateralization (pledging) withacceptable securities (usually government or government-backed) in an amount in excess of the deposit.Lithuanian policy should at least specifically prohibit funding of banks that do not meet the requirementsof government criteria.
REMOVE SALARY LIMITATIONS ON STATE-CONTROLLED BANKs. The imposition of the civilservice salary scale on the boards of state-controlled banks should be ended. This action not onlyindicates political involvement, but also strengthens the appearance that the banks are not banks, butmerely agencies of the government. More important, these banks, which are the largest in the sector,need to attract quality, motivated management to compete-and not repeat mistakes of the past. Thegovernment should survey the private banks, and perhaps other comparable private financial institutionsin similar economies, to set an updated salary scale and incentive program.
DEVELOP POLICIES TO REDUCE THE INFLUENCE OF THE STATE-CONTROLLED BANKS IN THE
SECURITIES MARKET. Steps should be taken to minimize the influence of these banks in the TB auctionsto improve transparency and to avoid the appearance that the profits of the state-controlled banks aresubsidizing government borrowing costs or that depositors are indirectly funding government borrowings.Because the banks are currently viewed by the government as a government agency (see salarylimitations, above), TB purchases by state-controlled banks could be viewed as government buying in itsown auction. Thus, the government should consider limiting state-controlled banks to noncompetitivebids.
20

Banking
ADOPT NEW POLICIES REGARDING SUBSIDIZED AND DIRECTED LENDING PROGRAMS. Thegovernment should consider amending the current subsidized lending programs to (a) increase thepermitted margin to allow banks to achieve reasonable profit; (b) guarantee a portion, or all, of the creditexposure; (c) allow all banks to participate in the program; or (d) a combination of all of the above. Aproperly designed program will prompt all banks to participate. Directed lending for special purposes atthe bank's own risk (thiat is, on their balance sheets) should cease immediately.
ELIMINATE THE ABILITY OF THE GOVERNMENT'S RESTITUTION PROGRAMS TO BORRow FUNDS.
Borrowing from state-controlled banks to finance restitution programs (even when collateralized onassets to be privatized, and especially when based on the valuations of government valuation experts)could be characterized as a connected-party transaction-the owner of the bank causes an entity of itscreation to receive the proceeds of a loan secured by assets valued by the owner. It is also anticipatedthat the government will not guarantee the loans, no matter what kind of bank, public or private, grantsthem. Most banks in arms-length transactions require some entity or person to be responsible forrepayment of loans if the collateral turns out to be insufficient. Since the spirit of the restitution programis to distribute the proceeds of privatization, not the proceeds of loans, there is no need to borrow fundsfor distribution other than for political appeasement. If operating funds are needed, they should beobtained from the government's budget, not from bank borrowings. Therefore, it is suggested that therelevant law be amended to prohibit borrowing by restitution programs and agencies.
OPEN THE PROCESSING OF GOVERNMENT RESTITUTION AND DISTRIBUTION PROGRAMS TO
PRIVATE BANKS. The exclusive right of state-controlled banks to handle restitution accounts and othergovernment payment distribution programs is both a market distortion and an unfair competitiveprivilege. If the cost of handling these programs exceeds the profits a bank can make from utilization ofthe funds, it represents a subsidy to the government, funded by the public's deposits. In contrast, if thebank is profiting from the relationship, it represents a subsidy from the taxpayers to the bank. In eithercase, the process suggests that state-controlled banks are government agencies that compete against theprivate sector. It is also probable (but unclear in law) that funds deposited in these programs are coveredunder the deposit insurance fund, something that could eventually spread the cost of restitution across allthe depositors in the system (not improbable, because it is state-controlled banks that do not fully meet allregulatory standards). The government should consider allowing other banks in compliance withregulations to bid competitively for these services.
Privatization of the Government 's Ownership in the Banking Sector
SALE OF THE GOVERNMENT'S MINORITY POSITIONS IN PRIVATE BANKS. The governmentshould proceed immediately with the sale of all its (and that of state-owned enterprises) minority stock inprivate banks. Most could be sold in a short period of time in the open market. Other positions could besold in private transactions with other bank shareholders. These small positions clearly represent anonstrategic asset on the part of government, and it is not the role of government to speculate in equitysecurities. In the case of state-owned enterprises, the cash generated from the sale could be better used intheir core businesses and would remove the appearance of undue influence on the banks.
CONCLUDE THE IMPLEMENTATION OF THE AGRICULTURAL BANK PRIVATIZATION PLAN. Thegovernment should proceed with the current privatization plan. Key issues that need to be addressed inthe near future are the impact of the bank's excessive personnel and branches on ultimate privatizationvalues; the remaining subsidized lending program, residual loans, and funding for terminated lendingprograms; and foreclosed shipping assets. Determination of possible modification of these programs andtransfers of assets (including subquality loans) before the actual privatization process may enhance
21

Banking
values. As mentioned earlier, the impact of the government's policy on board compensation should beseriously considered.
DEVELOP A STRATEGY AND TIMETABLE FOR PRIVATIZATION OF THE SAVINGS BANK. Althoughthe Savings Bank will be privatized only within a year of the privatization of the Agricultural Bank(scheduled to be accomplished in the fall of 1998), the government should immediately prepare a detailedplan for the privatization of the bank. The government should proceed to address the structural problemsin the bank and to hire investment advisers well in advance of the start of the privatization process. Thebank and the government are presently codependent in many areas. On the asset side of the balancesheet, the bank owns a significant amount of TBs, recapitalization bonds, and government notes issued inreturn for its claim on the former Soviet Foreign Trade Bank. These assets may not be attractive toprospective purchasers and could detract from the value of the bank. In addition, the bank has severalforeclosed assets (including one large asset) that may require transfer before privatization to avoidlessening proceeds. A careful evaluation, similar to the evaluation performed on the State CommercialBank, should begin as soon as possible. As in the other state-owned banks, reconsideration of thegovernment policy on compensation is needed.
Enhancing the Legal and Institutional Framework for Banking
The government and BoL should study the special nature of banking in the context of the public trust thatbanks must honor. In doing so, the government and BoL should consider adopting a comprehensivebanking law that clarifies the issues discussed above. Special attention to corporate statutes, consolidatedsupervision, bankruptcy and liquidation, and access to information is warranted. The review shouldconsider, along with the other potential improvements identified, the following actions:
* Combine the laws that regulate banks into one statute. For example, the Joint-Stock CompanyAct provisions relating to capitalization, shareholder rights, and the like could be incorporatedand modified to meet banking needs.
* Incorporate a definition of insolvency into the law that will permit BoL to close a bank (andunder current law, petition for bankruptcy). Include in the definition of insolvency (that is,permitting BoL to petition for bankruptcy) the inability to meet liquidity demands.
* Incorporate bankruptcy provisions for banks into the Commercial Banking Law to allowexpedited resolution. Adopt bank-specific resolution (liquidation) processes in coordination withthe deposit insurance fund.
* Codify penalties and fines for financial crimes involving banks, including appeal procedures inthe Banking Law.
* Clarify that BoL can regulate, establish standards, and examine bank subsidiaries. Requireconsolidated reports to be filed with BoL.
* Allow banks to classify doubtful assets according to BoL's approved procedures and includespecific provisions in expenses (to make them tax deductable).
The review should seek to identify areas in which regulatory actions are limited by the ability ofshareholders, councils, or boards to utilize the Commercial Banking Law or other statutes to deny ordelay BoL authority. For example, work already in progress to amend the law relating to the authority oftemporary administrators should be completed or included in this overall review. Temporaryadministrators should clearly report to BoL. While it is not necessary (and probably not preferable) thatthey be BoL employees, temporary administrators should work under BoL direction and policy, and BoLshould have the authority to dismiss them.
Several other legal and institutional modifications can be utilized to create an environment more
22
Banking
conducive to improved credit quality and to minimize losses and costs in the credit process. Recentlyproposed registry laws for both moveables and immovables are a significant improvement. The newBankruptcy Law allowing for priority claims for secured creditors is also a very positive development.The government, in conjunction with the banking sector, should continue this progress through thefollowing initiatives:
* The registries envisioned in the new laws should be established quickly, with a view toward easeof process and efficiency. Fee schedules, if any, should relate to cost recovery and not be viewedas a tax or revenue source.
* The law allowing banks to own land should be brought into force by issuing necessary decreesand instructions. At a minimum, banks should be allowed to own land acquired throughforeclosure until the credit is resolved.
* Laws should be adopted to allow lenders to seize collateral quickly if a borrower defaults on aloan. Adequate post-seizure remedies for wrongful seizure can be provided (appeals to court forfinancial damages for unjustified or illegal seizure).
* The Bankruptcy Law should be amended to ensure that secured creditors (with judicial consent)have the right to remove collateral from the bankruptcy process, liquidate the collateral to theextent of their claim, and return excess collateral or funds to the court.
* Laws and processes should be adopted to allow syndicated lending, both within and outside thebanking system.
Improving the Deposit Insurance System
The initial funding oi- the deposit insurance fund is a notable achievement. Combined with the new,strengthened prudential regulations, that step should lead to enhanced depositor confidence. Also, recentamendments to the Deposit Insurance Law have almost entirely eliminated moral hazard amongindividual depositors.
AMEND THE LEVEL OF DEPOSIT INSURANCE PROTECTION. The recently passed law significantlyincreases deposit protection for individual deposits (from Lt 5,000 to Lt 65,000 by the year 2000). Inaddition, the new law introduces three levels of coinsurance for litas deposits, three different levels ofcoinsurance for foreign currency deposits, and a three-year phase-in schedule. The government shouldconsider amending this law to ensure (a) that the levels of coverage are appropriate for the Lithuaniansituation (the BoL coverage of Lt 10,000 will safeguard 98 percent of the individual depositors), (b) thatthe insurance levels can be supported by bank assessments without overburdening the paying banks'profitability, (c) that the coinsurance levels for foreign currency deposits meet EU standards (EU requireshomogeneous coverage across currencies), and (d) that the new coinsurance levels will comply with EUstandards in the year 2000 (EU requires higher coinsurance levels). Consideration should be given toinvestigating whether ompliance with EU standards is essential. With a proposed compensation level in2000 of three times the current per capita income, the levels of compensation would exceed those of mostdeveloped countries (with exceptions, notably the United States and Japan) and would also exceed thoseof most developing nations. In addition, only a few major countries (the United States and Norway beingtwo notable examples) include foreign currency deposits in their insurance coverage.
REEVALUATE THE LEVEL OF DEPOSIT INSURANCE ASSESSMENTS. The current level ofassessments on banks is 1.5 percent of individual deposits. This level represents 25 percent of the 1996profits of the system (excluding the loss of State Commercial Bank). This level is to be maintainedduring 1998-99 and reduced to 1 percent of deposits in 2000. This rate of assessment is among thehighest in the world (compare Argentina, 0.36 to 0.72 percent; the Czech Republic, 0.5 percent;
23

Banking
Germany, 0.03 percent; Hungary, 0.2 percent; Nigeria, 0.937 percent; the United States, 0.24 percent).Separate statutes also provide for the proceeds of bank privatizations to be contributed to the fund. Thecurrent law has no targeted minimum funding, or the flexibility to reduce assessments if the fund reachesa given targeted level. In setting targeted minimum funding, the government should consider the newenhanced supervisory regime in determining risk to the fund. The law should be amended to allow thefund the flexibility to reduce premiums if a targeted minimum level of funding is achieved.
LINK THE DEPOSIT INSURANCE FUND WITH THE AsSET RECOVERY PROCESS. It is unclear in thelaw whether the fund has the right to file claims in bankruptcy proceedings to recover money advanced topay depositors; the law should be amended immediately to make clear that this right of substitution exists.Previous recommendations have indicated a need for a statutory scheme to improve the liquidationprocess of failed banks. In developing this scheme, the fund should have authority over the process tomaximize the amount of funds recovered and to minimize recovery time. Among the methodologies usedin other countries are (a) having a fund-appointed administrator of the bankrupt estate, (b) having thefund legally represent all depositors in the process, and (c) having the fund control the work-out unit thatmanages the asset resolutions. The. government should incorporate the needs of the fund whendeveloping the statutory scheme to address the unique issues of bankrupt banks. The law should be clear,so that all parties (shareholders, depositors, government, and Seimas) know the process beforehand and,except in rare cases, the process is not modified to suit any party's special interest. In the United States,for example, when the primary regulator revokes a license, the bank is immediately placed in bankruptcy.The fund is immediately (within the hour) appointed administrator for the bankrupt estate, with widediscretionary powers over all matters (including asset security and disposition, employee retention, anddepositor payment). The only significant involvement of the bankruptcy court is the final resolution ofthe bankrupt estate. There is no delay, no issue of who is responsible, and no chance of asset stripping byinterested parties.
24
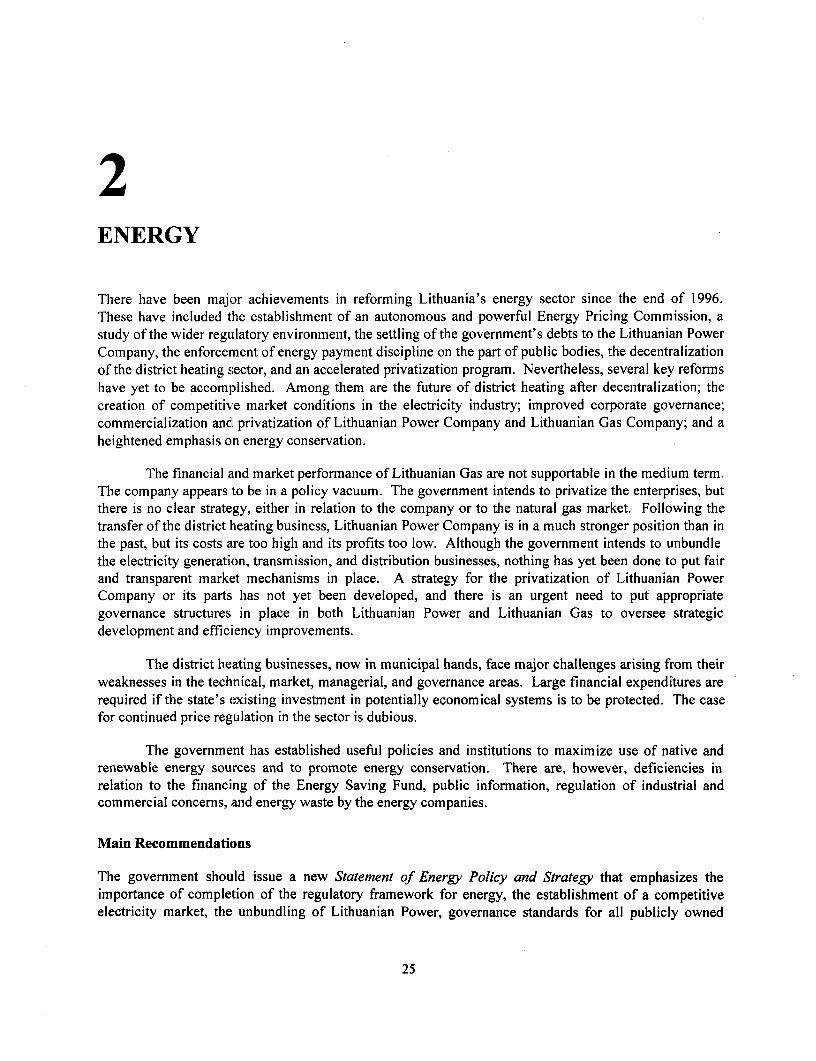
ENERGY
There have been major achievements in reforming Lithuania's energy sector since the end of 1996.These have included the establishment of an autonomous and powerful Energy Pricing Commission, astudy of the wider regulatory environment, the settling of the government's debts to the Lithuanian PowerCompany, the enforcement of energy payment discipline on the part of public bodies, the decentralizationof the district heating sector, and an accelerated privatization program. Nevertheless, several key reformshave yet to be accomplished. Among them are the future of district heating after decentralization; thecreation of competitive market conditions in the electricity industry; improved corporate governance;commercialization andl privatization of Lithuanian Power Company and Lithuanian Gas Company; and aheightened emphasis on energy conservation.
The financial and market performance of Lithuanian Gas are not supportable in the medium term.The company appears to be in a policy vacuum. The government intends to privatize the enterprises, butthere is no clear strategy, either in relation to the company or to the natural gas market. Following thetransfer of the district heating business, Lithuanian Power Company is in a much stronger position than inthe past, but its costs are too high and its profits too low. Although the government intends to unbundlethe electricity generation, transmission, and distribution businesses, nothing has yet been done to put fairand transparent market mechanisms in place. A strategy for the privatization of Lithuanian PowerCompany or its parts has not yet been developed, and there is an urgent need to put appropriategovernance structures in place in both Lithuanian Power and Lithuanian Gas to oversee strategicdevelopment and efficiency improvements.
The district heating businesses, now in municipal hands, face major challenges arising from theirweaknesses in the technical, market, managerial, and governance areas. Large financial expenditures arerequired if the state's existing investment in potentially economical systems is to be protected. The casefor continued price regulation in the sector is dubious.
The government has established useful policies and institutions to maximize use of native andrenewable energy sources and to promote energy conservation. There are, however, deficiencies inrelation to the financing of the Energy Saving Fund, public information, regulation of industrial andcommercial concerns, and energy waste by the energy companies.
Main Recommendations
The government should issue a new Statement of Energy Policy and Strategy that emphasizes theimportance of completion of the regulatory framework for energy, the establishment of a competitiveelectricity market, the unbundling of Lithuanian Power, governance standards for all publicly owned
25

Energy
energy companies (including the district heating networks), the privatization of the state's remainingownership positions in the sector (except Ignalina Nuclear Power Plant), and the setting of standards andtargets for energy conservation and the development of new energy sources. Key overall objectives forthe sector should be set, accompanied by transparent performance measures.
The state's fiscal exposure to the energy sector should be explicitly terminated, and the currentsubsidies to low-income households should be phased out. The government should carry out an urgentstudy of the municipalities' district heating investment needs and design and put in place a financingprogram. It should specify by law the governance standards to be met by district heating companies,publish "league tables" of performance, and phase out price regulation in the sector.
The ongoing review of the regulatory environment should be speedily completed, and electricitymarket structures selected and established in accordance with European Union (EU) norms. Each ofLithuanian Power's generating stations and distribution utilities should be separately incorporated, andprivate investment should be sought. Before privatization of Lithuanian Power, performance indicatorsshould be established for the company, an appropriate board appointed, and barriers to commercial ratesof management remuneration, the use of incentives, and measurement removed. The total privatizationof Lithuanian Gas should be placed immediately in the hands of advisers.
The Energy Saving Fund should be adequately funded. An enhanced program of public energyawareness should be established and financed. Rules and standards for energy conservation should beapplied to industrial, commercial, and institutional energy consumers, including requirements for energyaudits. Publicly owned energy companies must accept their prime responsibility to minimize losses andwaste of energy, and this should be a key performance indicator applied to their boards.
Principal Features of Lithuania's Energy Sector
The Demand and Supply Balance
ENERGY DEMAND. As in all of the other countries of the former Soviet Union, the salient featureof Lithuania's energy sector since the reestablishment of independence has been a collapse in demand.Between 1990 and 1996, total demand (measured in final energy consumption) fell by 58 percent, from10.7 to 4.5 million tons of oil equivalent. The primary cause of such a marked reduction was the demiseof the centrally planned Soviet economic system, which led to widespread closures of industrialenterprises and rapid energy price increases.
While every class of energy consumer was compelled to reduce usage (table 2-1), the reductionwas most marked in manufacturing industry, agriculture, and construction, the sectors most directlyaffected by the collapse of central economic planning. In relative terms, households and services,including transport, exhibited less severe reductions in consumption. Households are now the largestconsumers of energy in Lithuania, followed by the transport sector. Industry and the household sector aremajor consumers of all three kinds of energy-electric power, heat, and organic fuels-while thetransport and agriculture sectors depend primarily on oil products.
The economy has now bottomed out. The future evolution of domestic energy demand will bedetermined by the expansionary effects of economic growth, moderated by the effects of tariff increasesand conservation efforts.
26
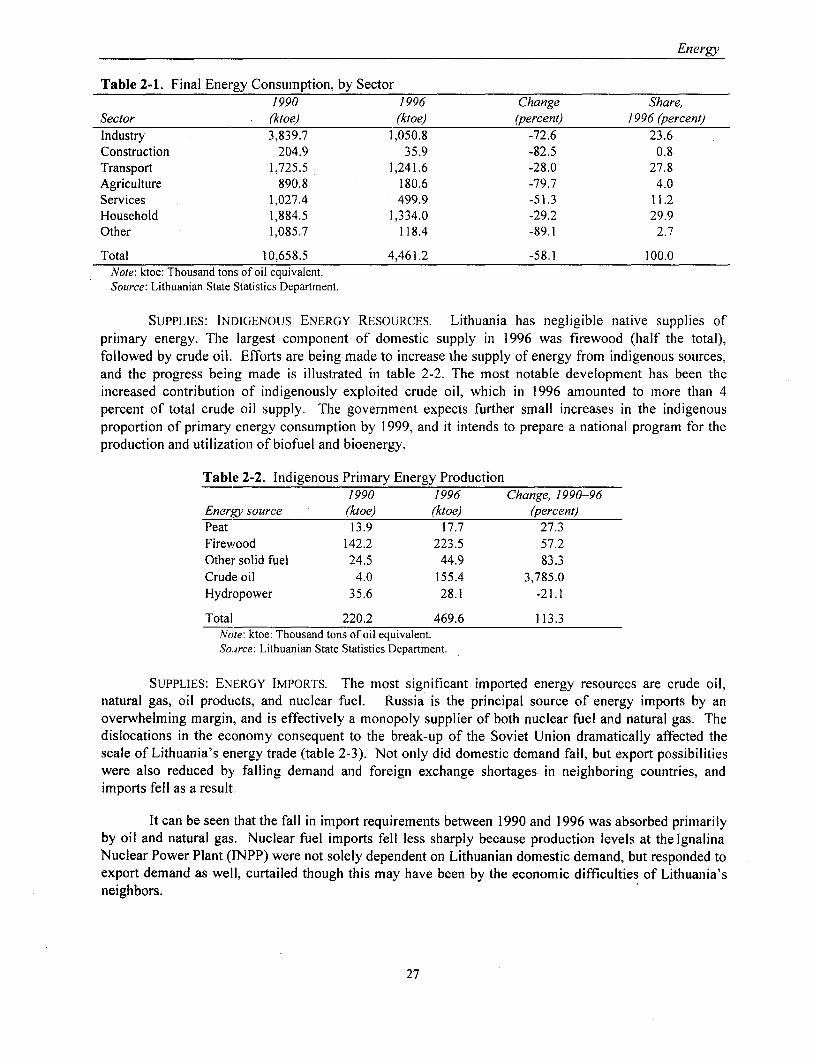
Energy
Table 2-1. Final Energy Consumption, by Sector1990 1996 Change Share,
Sector (ktoe) (ktoe) (percent) 1996 (percent)Industry 3,839.7 1,050.8 -72.6 23.6Construction 204.9 35.9 -82.5 0.8Transport 1,725.5 1,241.6 -28.0 27.8Agriculture 890.8 180.6 -79.7 4.0Services 1,027.4 499.9 -51.3 11.2Household 1,884.5 1,334.0 -29.2 29.9Other 1,085.7 118.4 -89.1 2.7
Total 10,658.5 4,461.2 -58.1 100.0Note: ktoe: Thousand tons of oil equivalent.Source: Lithuanian State Statistics Department.
SUPPLIES: INDIGENOUS ENERGY RESOURCES. Lithuania has negligible native supplies ofprimary energy. The largest component of domestic supply in 1996 was firewood (half the total),followed by crude oil. Efforts are being made to increase the supply of energy from indigenous sources,and the progress being made is illustrated in table 2-2. The most notable development has been theincreased contribution of indigenously exploited crude oil, which in 1996 amounted to more than 4percent of total crude oil supply. The government expects further small increases in the indigenousproportion of primary energy consumption by 1999, and it intends to prepare a national program for theproduction and utilization of biofuel and bioenergy.
Table 2-2. Indigenous Primary Energy Production1990 1996 Change, 1990-96
Energy source (ktoe) (ktoe) (percent)Peat 13.9 17.7 27.3Firewood 142.2 223.5 57.2Other solid fuel 24.5 44.9 83.3Crude oil 4.0 155.4 3,785.0Hydropower 35.6 28.1 -21.1
Total 220.2 469.6 113.3Note: ktoe: Thousand tons of oil equivalent.Source: Lithuanian State Statistics Department.
SUPPLIES: ENERGY IMPORTS. The most significant imported energy resources are crude oil,natural gas, oil products, and nuclear fuel. Russia is the principal source of energy imports by anoverwhelming margin, and is effectively a monopoly supplier of both nuclear fuel and natural gas. Thedislocations in the economy consequent to the break-up of the Soviet Union dramatically affected thescale of Lithuania's energy trade (table 2-3). Not only did domestic demand fall, but export possibilitieswere also reduced by falling demand and foreign exchange shortages in neighboring countries, andimports fell as a result.
It can be seen that the fall in import requirements between 1990 and 1996 was absorbed primarilyby oil and natural gas. Nuclear fuel imports fell less sharply because production levels at the IgnalinaNuclear Power Plant (INPP) were not solely dependent on Lithuanian domestic demand, but responded toexport demand as well, curtailed though this may have been by the economic difficulties of Lithuania'sneighbors.
27
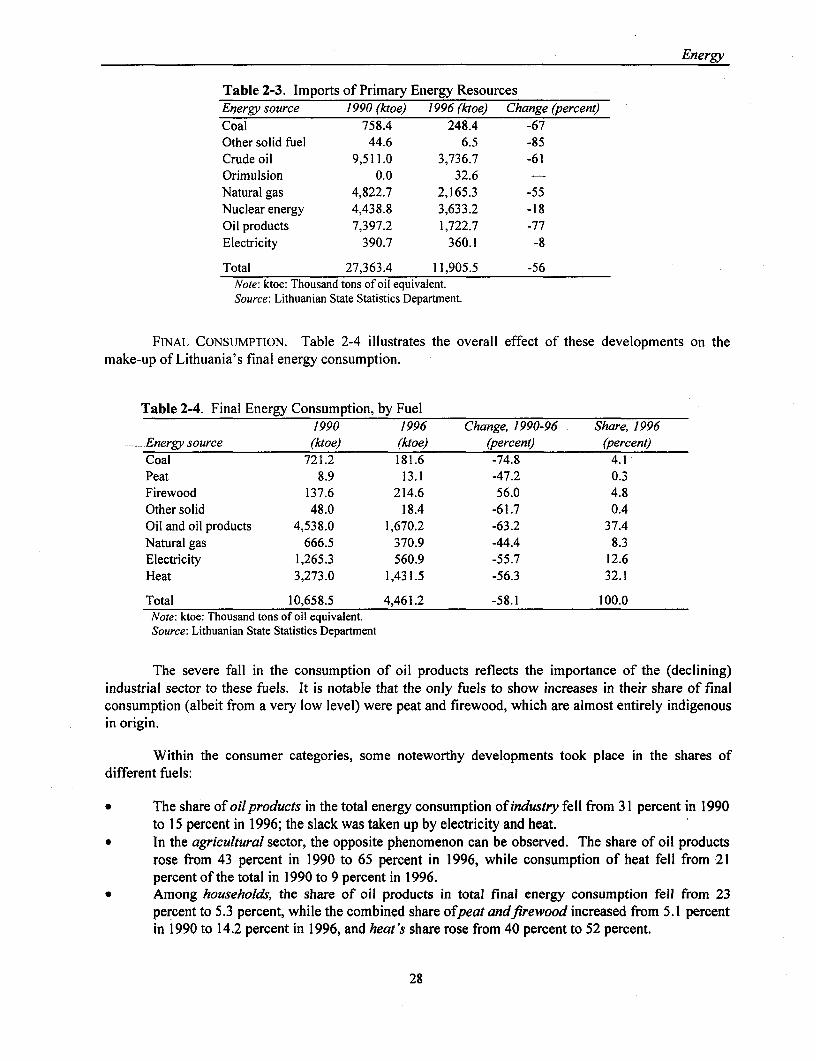
Energy
Table 2-3. Imports of Primary Energy ResourcesEnergy source 1990 (ktoe) 1996 (ktoe) Change (percent)Coal 758.4 248.4 -67Other solid fuel 44.6 6.5 -85Crude oil 9,511.0 3,736.7 -61Orimulsion 0.0 32.6 -
Natural gas 4,822.7 2,165.3 -55Nuclear energy 4,438.8 3,633.2 -18Oil products 7,397.2 1,722.7 -77Electricity 390.7 360.1 -8
Total 27,363.4 11,905.5 -56Nrote: ktoe: Thousand tons of oil equivalent.Source: Lithuanian State Statistics Department.
FINAL CONSUMPTION. Table 2-4 illustrates the overall effect of these developments on themake-up of Lithuania's final energy consumption.
Table 2-4. Final Energy Consumption, by Fuel1990 1996 Change, 1990-96 Share, 1996
E Energy source (ktoe) (ktoe) (percent) (percent)Coal 721.2 181.6 -74.8 4.1Peat 8.9 13.1 -47.2 0.3Firewood 137.6 214.6 56.0 4.8Other solid 48.0 18.4 -61.7 0.4Oil and oil products 4,538.0 1,670.2 -63.2 37.4Natural gas 666.5 370.9 -44.4 8.3Electricity 1,265.3 560.9 -55.7 12.6Heat 3,273.0 1,431.5 -56.3 32.1
Total 10,658.5 4,461.2 -58.1 100.0Note: ktoe: Thousand tons of oil equivalent.Source: Lithuanian State Statistics Department
The severe fall in the consumption of oil products reflects the importance of the (declining)industrial sector to these fuels. It is notable that the only fuels to show increases in their share of finalconsumption (albeit from a very low level) were peat and firewood, which are almost entirely indigenousin origin.
Within the consumer categories, some noteworthy developments took place in the shares ofdifferent fuels:
* The share of oilproducts in the total energy consumption of industry fell from 31 percent in 1990to 15 percent in 1996; the slack was taken up by electricity and heat.
* In the agricultural sector, the opposite phenomenon can be observed. The share of oil productsrose from 43 percent in 1990 to 65 percent in 1996, while consumption of heat fell from 21percent of the total in 1990 to 9 percent in 1996.
* Among households, the share of oil products in total final energy consumption fell from 23percent to 5.3 percent, while the combined share ofpeat andfirewood increased from 5.1 percentin 1990 to 14.2 percent in 1996, and heat's share rose from 40 percent to 52 percent.
28

Energy
THE ELECTRICITY SECTOR. The capacity of Lithuania's electricity generation system is about5,800 megawatts (MW). Peak demand in 1996 was just under 2,000 MW, which explains many of thepeculiarities of the Lithuanian electricity sector, particularly the huge export potential provided by thesegeneration assets, the lheavy costs imposed by the maintenance of generating capacity (represented by thethermal plant at Elektrenai, for example) that is rarely used, and the difficulties inherent in theestablishment of effective market mechanisms. Table 2-5 shows the evolution of supply and demand inrecent years.
Table 2-5. Thie Electricity Balance1990 1996 Change, 1990-96 Share, 1996
Activity (TWh) (TWh) (percent) (percent)Production 28.4 16.8 -41 -
Imports 4.5 4.2 -8 -
Total supply 32.9 21.0 -36 -
Exports 16.5 9.3 -43 -Domestic consumption 16.4 11.6 -29 -
UseEnergy system 0.2 3.4 1,600 -
Losses 1.6 1.8 15 -
Final consumption 14.7 6.5 -56 -
Industry 8.0 2.7 -65 42Construction 0.3 0.1 -72 1Transport 0.2 0.1 -58 1Agriculture 2.9 0.4 -85 7Services 0.7 0.9 37 14Households 1.8 1.6 -9 25Other 0.8 0.6 -22 10
Total final consumption 14.7 6.5 -56 100Note: Twh: terawatt hour.Source: Lithuanian State Statistics Department.
The very great increase in the consumption of electricity by the electricity sector itself is a featureof the tables. The particularly sharp fall in agricultural demand is also notable, but it was in line with the80 percent reduction in that sector's overall energy consumption. The reduction in exports has hadimplications for both the finances of the energy companies and the balance of payments.
Final domestic electricity consumption increased by 4 percent in 1996 over 1995. This was thefirst increase in several years, and it was driven primarily by a recovery in industry. The trend wasmaintained in 1997. Exports also increased in 1996, by 17.5 percent, but are thought to have reverted to1995 levels in 1997.
The dominant asset in the Lithuanian electricity industry is INPP. With a capacity (derated) of2,500 MW, it provides 43 percent of national capacity. In recent years INPP has been able to supplybetween 80 and 90 percent of domestic demand, and it also makes possible the large export trade inelectricity. Many economic, financial, managerial, and safety issues surround the operation of INPP,which is the subject of G7 monitoring under a Nuclear Safety Agreement administered by the EuropeanBank for Reconstruction and Development (EBRD). These issues, however, are outside the scope of thischapter.
THE NATURAL GAS SECTOR. Lithuania has an extensive natural gas network that distributes gas,
29
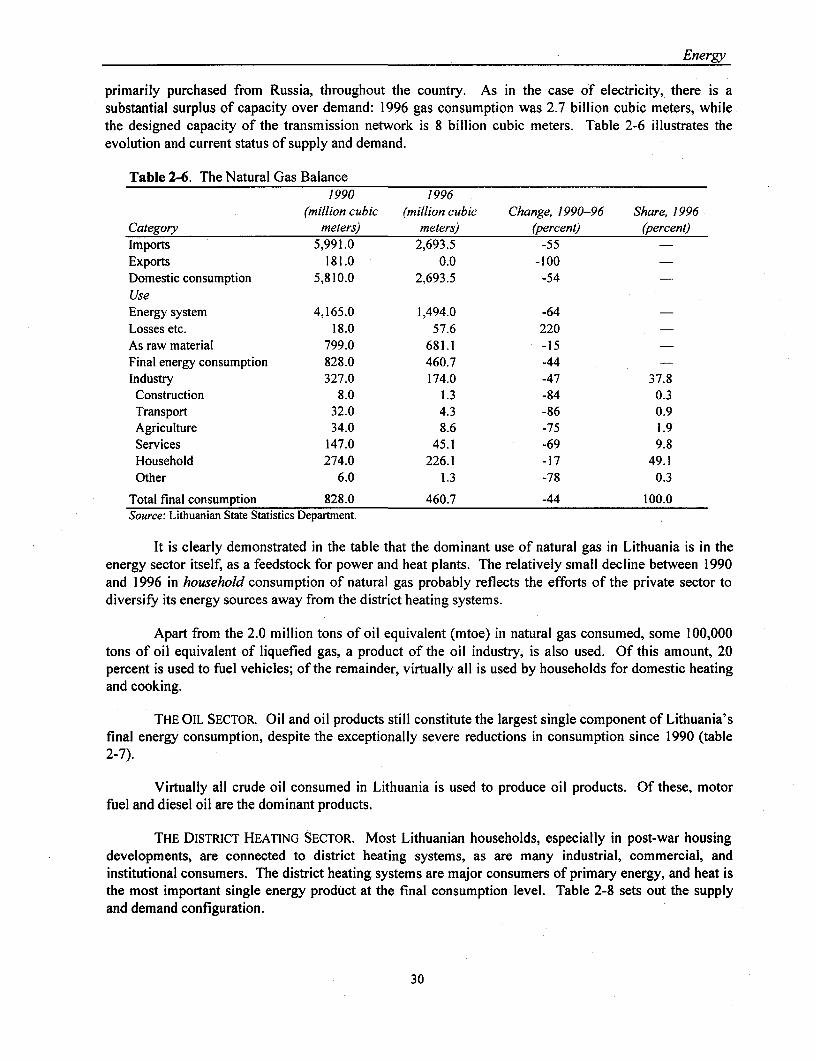
Energy
primarily purchased from Russia, throughout the country. As in the case of electricity, there is asubstantial surplus of capacity over demand: 1996 gas consumption was 2.7 billion cubic meters, whilethe designed capacity of the transmission network is 8 billion cubic meters. Table 2-6 illustrates theevolution and current status of supply and demand.
Table 2-6. The Natural Gas Balance1990 1996
(million cubic (million cubic Change, 1990-96 Share, 1996Category meters) meters) (percent) (percent)Imports 5,991.0 2,693.5 -55Exports 181.0 0.0 -100Domestic consumption 5,810.0 2,693.5 -54UseEnergy system 4,165.0 1,494.0 -64Losses etc. 18.0 57.6 220As raw material 799.0 681.1 -15Final energy consumption 828.0 460.7 -44Industry 327.0 174.0 -47 37.8Construction 8.0 1.3 -84 0.3Transport 32.0 4.3 -86 0.9Agriculture 34.0 8.6 -75 1.9Services 147.0 45.1 -69 9.8Household 274.0 226.1 -17 49.1Other 6.0 1.3 -78 0.3
Total final consumption 828.0 460.7 -44 100.0Source: Lithuanian State Statistics Department.
It is clearly demonstrated in the table that the dominant use of natural gas in Lithuania is in theenergy sector itself, as a feedstock for power and heat plants. The relatively small decline between 1990and 1996 in household consumption of natural gas probably reflects the efforts of the private sector todiversify its energy sources away from the district heating systems.
Apart from the 2.0 million tons of oil equivalent (mtoe) in natural gas consumed, some 100,000tons of oil equivalent of liquefied gas, a product of the oil industry, is also used. Of this amount, 20percent is used to fuel vehicles; of the remainder, virtually all is used by households for domestic heatingand cooking.
THE OIL SECTOR. Oil and oil products still constitute the largest single component of Lithuania'sfinal energy consumption, despite the exceptionally severe reductions in consumption since 1990 (table2-7).
Virtually all crude oil consumed in Lithuania is used to produce oil products. Of these, motorfuel and diesel oil are the dominant products.
THE DISTRICT HEATING SECTOR. Most Lithuanian households, especially in post-war housingdevelopments, are connected to district heating systems, as are many industrial, commercial, andinstitutional consumers. The district heating systems are major consumers of primary energy, and heat isthe most important single energy product at the final consumption level. Table 2-8 sets out the supplyand demand configuration.
30

Energy
Table 2-7. The Oil Balance1990 1996 Change, 1990-96 Share, 1996
Category (ktoe) (ktoe) (percent) (percent)Crude oil production 4.0 155.4 3,785 -
Imports 9,511.0 3,736.7 -61 -
Exports 0.0 122.9 - -Stock changes 11.0 6.2 -44 -Domestic consumption 9,526.0 3,763.0 -60 -UseFuel forenergy 2.0 5.5 175 -Raw material 9,368.0 3,725.2 -60 -Losses 154.0 25.3 -84 -Final energy consumrption 2.0 7.0 250 -Oil productsFinal energy consumption 4,694.9 1,663.2 -65 100.0Industry 1,208.9 158.7 -87 9.5Construction 95.9 26.3 -73 1.6Transport 1,663.0 1,226.6 -26 73.7Agriculture 378.7 116.5 -69 7.0Services 154.3 55.5 -64 3.3Household 436.0 71.3 -84 4.3Other 758.1 8.3 -99 0.5
Total final consumption 4,694.9 1,663.2 -65 100.0Note: ktoe: Thousand tons of oil equivalent.Source: Lithuanian State Statistics Department.
A feature of the heating figures is that in a period when every other economic sector sharplyreduced its consumption of heat, the household sector maintained its level of usage. Given that the 1990-96 period was one of rising domestic heating tariffs, this may reflect the absence of viable alternativeheating systems for most domestic consumers. It also highlights the scale of the energy conservation taskin Lithuania. The year 1996 was the first in which total household consumption of heat fell below the1991 level.
Table 2-8. The Heat Balance1990 1996 Change, 1990-96 Share, 1996
District heating (000 Tcal) (000 Tcal) (percent) (percent)Production 34.2 19.7 -42 -
Used in energy systems 0.0 1.1 -
Losses 1.4 4.3 201 -
Final consumption 32.7 14.3 -56 -Industry 16.5 4.9 -70 34.3Construction 0.7 0.0 -98 0.1Transport 0.1 0.0 -98 0.0Agriculture 1.9 0.2 -92 1.1Services 4.3 1.8 -57 12.7Household 7.5 7.0 -7 48.6Other 1.8 0.5 -74 3.1
Total final consumption 32.7 14.3 -56 100.0Note: Tcal: tetra-calories.Source: Lithuanian State Statistics Department.
31

Energy
The Energy Intensity of the Lithuanian Economy
Like those of other FSU countries, the Lithuanian economy is highly energy-intensive. Energy supply ischaracterized by a large degree of overcapacity at the secondary level, most notably in power generationand natural gas distribution, and demand is marked by a slow adjustment to the realities of world energyprices. These features dominate policymaking in the sector and are at the root of many of the difficultiesthe government has faced in seeking to bring about much-needed energy economy and the rationalizationand commercialization of energy enterprises.
Extravagant consumption of energy was a feature of the economy of the FSU, and wasunaffected by the oil shocks of the 1970s. To illustrate this phenomenon, between 1972 and 1990 theenergy intensity of the Organization for Economic Cooperation and Development (OECD) countries fellfrom about 520 to 400 tons of oil equivalent (toe) for each US$1 million in GDP. During the sameperiod, the average energy intensity of the countries of the FSU rose from 720 to 820 toe for each US$1million in GDP. Lithuania's energy intensity was about 1,400 toe for each US$1 million in GDP in 1990,more than three times the intensity found in market economies. Even with the reduction in energydemand since the restoration of independence, which was driven partly by the collapse of inefficientindustry and partly by the inability of both residential and industrial consumers to pay higher prices,energy intensity in 1996 was only slightly lower, at about 1,200 toe for each US$1 million in GDP. In1994, Lithuania's intensity was slightly higher than Estonia's, and 85 percent greater than that of Latvia.While the differences can be partly explained by differences in economic structure (for example,Lithuania is more industrialized than either of its Baltic neighbors) and Lithuania's production ofelectricity for export, such a high level of intensity compounds the adjustment problems of the Lithuanianeconomy and underlines the need for more rapid progress in achieving improved energy conservation.
The Main Institutions in the Energy Sector
Since the end of 1996, the ministry responsible for policy and planning in the energy sector has been theMinistry of Economy, which embraces the functions of three former ministries: the Ministry of Economy,the Ministry of Industry and Trade, and the Ministry of Energy.
Five specialized agencies are of particular importance to the energy sector:
* VATESI. This is the state nuclear safety inspection agency. Its guidelines for operation wereformulated by the International Atomic Energy Agency.
* The Energy Agency. This body is responsible for the preparation and implementation of energysector development programs and projects, the drafting of normative acts for the energy sector,and international cooperation.
* The Lithuanian Energy Institute. This group carries out fundamental and applied research in allfields of energy technology and economics.
*. The State Energy Inspection. This body carries out technical supervision of the energy sectorand controls industrial safety issues.
* The State Commission for Pricing of Energy Resources and Energy Activity Control (commonlyknown as the Energy Pricing Commission, or EPC). The members of the EPC are appointed bypresidential decree, and it serves as the ultimate arbiter of electricity, gas, and heat prices.
In addition, the Ministry of Finance is responsible for the implementation of government policyin a number of areas of significance to the energy sector. These include the payment of productionsubsidies to the Lithuanian Power Company (necessitated by tariffs that, until recently, did not cover
32
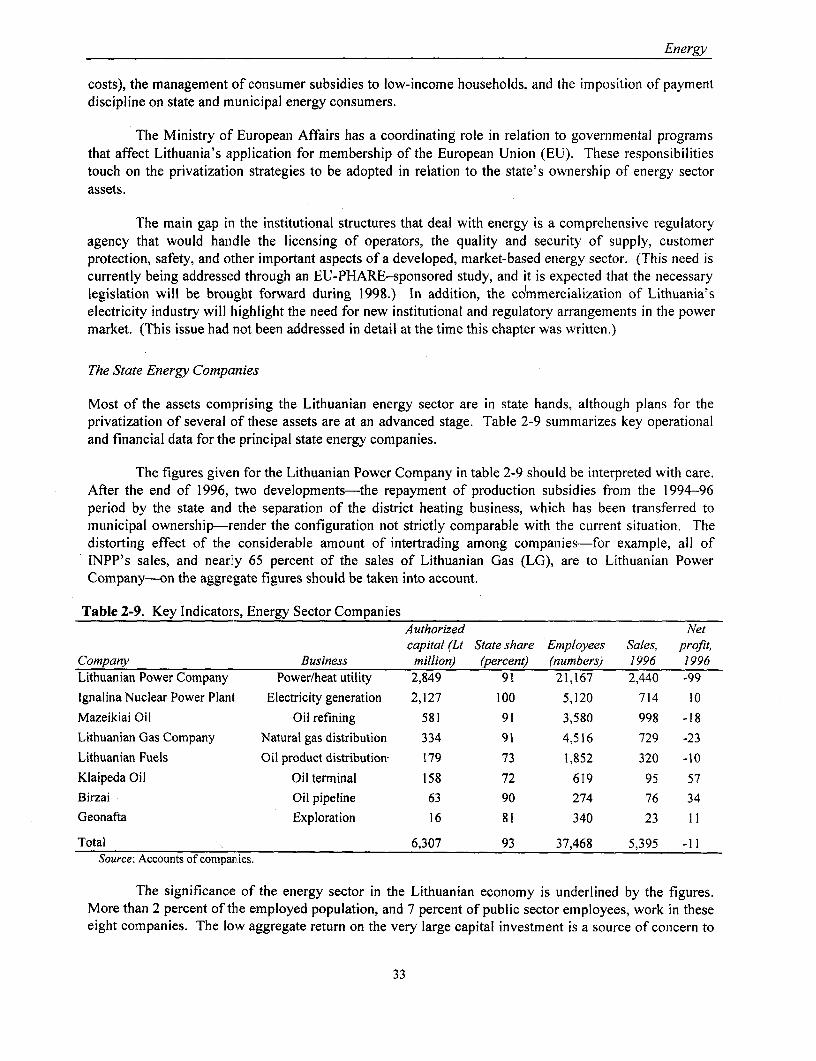
Energy
costs), the management of consumer subsidies to low-income households, and the imposition of paymentdiscipline on state and rnunicipal energy consumers.
The Ministry of European Affairs has a coordinating role in relation to governmental programsthat affect Lithuania's application for membership of the European Union (EU). These responsibilitiestouch on the privatization strategies to be adopted in relation to the state's ownership of energy sectorassets.
The main gap in the institutional structures that deal with energy is a comprehensive regulatoryagency that would handle the licensing of operators, the quality and security of supply, customerprotection, safety, and other important aspects of a developed, market-based energy sector. (This need iscurrently being addressed through an EU-PHARE-sponsored study, and it is expected that the necessarylegislation will be brought forward during 1998.) In addition, the codmmercialization of Lithuania'selectricity industry will highlight the need for new institutional and regulatory arrangements in the powermarket. (This issue had not been addressed in detail at the time this chapter was written.)
The State Energy Companies
Most of the assets comprising the Lithuanian energy sector are in state hands, although plans for theprivatization of several of these assets are at an advanced stage. Table 2-9 summarizes key operationaland financial data for the principal state energy companies.
The figures given for the Lithuanian Power Company in table 2-9 should be interpreted with care.After the end of 1996, two developments-the repayment of production subsidies from the 1994-96period by the state and the separation of the district heating business, which has been transferred tomunicipal ownership-render the configuration not strictly comparable with the current situation. Thedistorting effect of the considerable amount of intertrading among companies-for example, all ofINPP's sales, and nearly 65 percent of the sales of Lithuanian Gas (LG), are to Lithuanian PowerCompany-on the aggregate figures should be taken into account.
Table 2-9. Key Indicators, Energy Sector CompaniesAuthorized Netcapital (Lt State share Employees Sales, profit,
Company Business million) (percent) (numbers) 1996 1996Lithuanian Power Company Power/heat utility 2,849 91 21,167 2,440 -99
lgnalina Nuclear Power Plant Electricity generation 2,127 100 5,120 714 10
Mazeikiai Oil Oil refining 581 91 3,580 998 -18
Lithuanian Gas Company Natural gas distribution 334 91 4,516 729 -23
Lithuanian Fuels Oil product distribution 179 73 1,852 320 -10
Klaipeda Oil Oil terninal 158 72 619 95 57
Birzai Oil pipeline 63 90 274 76 34
Geonafta Exploration 16 81 340 23 11
Total 6,307 93 37,468 5,395 -11Source: Accounts of comparies.
The significance of the energy sector in the Lithuanian economy is underlined by the figures.More than 2 percent of the employed population, and 7 percent of public sector employees, work in theseeight companies. The low aggregate return on the very large capital investment is a source of concern to
33
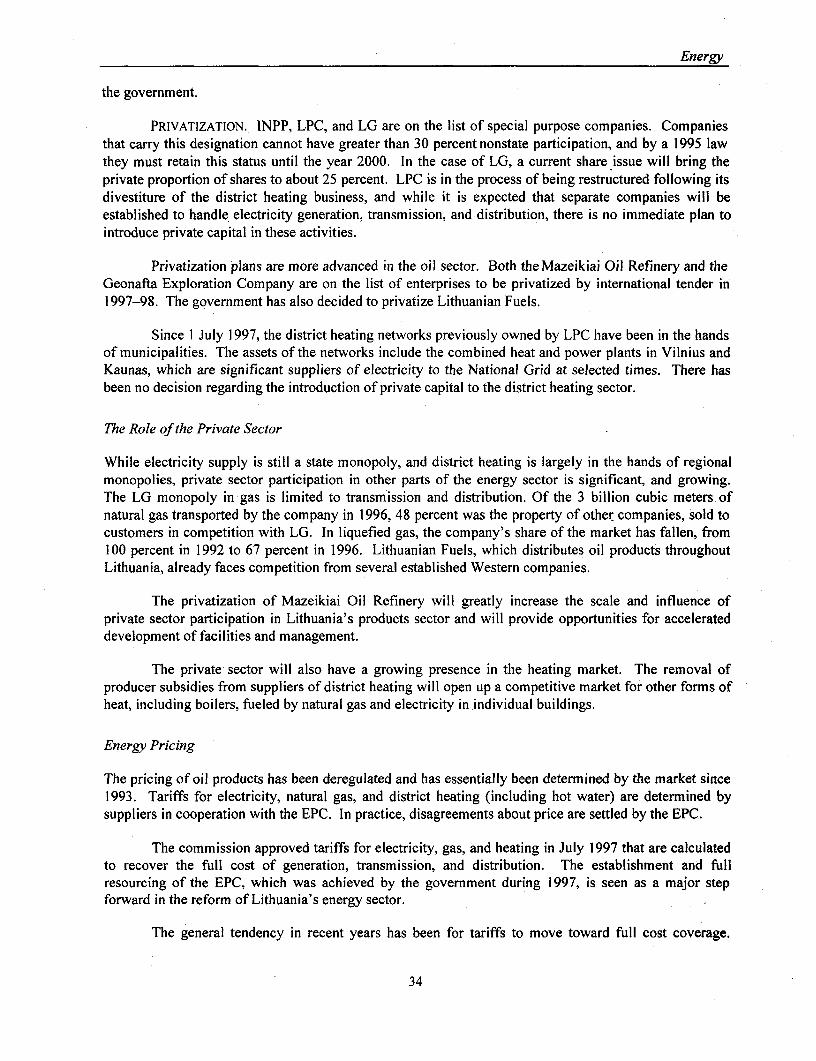
Energy
the government.
PRIVATIZATION. INPP, LPC, and LG are on the list of special purpose companies. Companiesthat carry this designation cannot have greater than 30 percent nonstate participation, and by a 1995 lawthey must retain this status until the year 2000. In the case of LG, a current share issue will bring theprivate proportion of shares to about 25 percent. LPC is in the process of being restructured following itsdivestiture of the district heating business, and while it is expected that separate companies will beestablished to handle electricity generation, transmission, and distribution, there is no immediate plan tointroduce private capital in these activities.
Privatization plans are more advanced in the oil sector. Both theMazeikiai Oil Refinery and theGeonafta Exploration Company are on the list of enterprises to be privatized by international tender in1997-98. The government has also decided to privatize Lithuanian Fuels.
Since 1 July 1997, the district heating networks previously owned by LPC have been in the handsof municipalities. The assets of the networks include the combined heat and power plants in Vilnius andKaunas, which are significant suppliers of electricity to the National Grid at selected times. There hasbeen no decision regarding the introduction of private capital to the district heating sector.
The Role of the Private Sector
While electricity supply is still a state monopoly, and district heating is largely in the hands of regionalmonopolies, private sector participation in other parts of the energy sector is significant, and growing.The LG monopoly in gas is limited to transmission and distribution. Of the 3 billion cubic meters ofnatural gas transported by the company in 1996, 48 percent was the property of other companies, sold tocustomers in competition with LG. In liquefied gas, the company's share of the market has fallen, from100 percent in 1992 to 67 percent in 1996. Lithuanian Fuels, which distributes oil products throughoutLithuania, already faces competition from several established Western companies.
The privatization of Mazeikiai Oil Refinery will greatly increase the scale and influence ofprivate sector participation in Lithuania's products sector and will provide opportunities for accelerateddevelopment of facilities and management.
The private sector will also have a growing presence in the heating market. The removal ofproducer subsidies from suppliers of district heating will open up a competitive market for other forms ofheat, including boilers, fueled by natural gas and electricity in individual buildings.
Energy Pricing
The pricing of oil products has been deregulated and has essentially been determined by the market since1993. Tariffs for electricity, natural gas, and district heating (including hot water) are determined bysuppliers in cooperation with the EPC. In practice, disagreements about price are settled by the EPC.
The commission approved tariffs for electricity, gas, and heating in July 1997 that are calculatedto recover the full cost of generation, transmission, and distribution. The establishment and fullresourcing of the EPC, which was achieved by the government during 1997, is seen as a major stepforward in the reform of Lithuania's energy sector.
The general tendency in recent years has been for tariffs to move toward full cost coverage.
34

Energy
Table 2-10 illustrates the effects of this trend on electricity and heat tariffs. The table illustrates the extentof the reduction that has been made in cross-subsidization between consumer groups, evidenced by thesteep increases in tariffs for households, particularly in the case of heat. Table 2-1 1 puts two importantLithuanian energy prices into a Baltic perspective.
Table 2-10. Electricity and Heat Tariffs(US cents)Customer category Unit Average, 1995 Average, 1996Electricity
Industry kWh 3.29 3.45Households kWh 3.95 4.21Other kWh 4.00 4.38
HeatIndustry Gcal 18.88 20.78Households Gcal 12.94 22.44Other Gcal 18.56 20.22Note: kWh: Kilowatt hour; Gcal: giga-calorie.Source: Lithuanian Power Company.
Table 2-11. Average Energy Prices in Baltic States, January 1997(US cents)Commodity Unit Estonia Latvia LithuaniaElectricity kWh 3 6 4Petrol (A93) litre 41 50 38
Source: Lithuanian State Statistics Department.
As a result of the introduction of tariffs that cover costs, no further subsidies to energy producersare expected, and none have been provided in the 1997 state budget. Subsidization of the energy sector isnow limited to a system of consumer subsidies that are available to low-income households with heat andhot water bills that exceed a set proportion of their incomes; eligibility is determined according to acomplex set of rules. These subsidies are expected to cost the state around Lt 200 million in 1997.
Energy Strategy of the Government of Lithuania
The government's strategy for the reform of the energy sector is set out in the 1995 Energy Law of theRepublic of Lithuania. Article 3, under the heading of Energy Policy Objectives, states:
The main state energy policy objectives shall be:
1 ) Energy saving2) Effective usage of primary energy resources3) Decreasing comparative energy expenses for production of national product4) Trying to find and guarantee access to reliable local sources of energy supply as well as to import
fuel from more than one foreign country with regard to the need for demonopolization anddecentralization
5) Encouraging energy producers and consumers to use local, recovering, and secondary energyresources in the most effective way
6) Reliable, high-quality production and supply of fuel, electric, and heating energy at the lowestpossible costs in different energy systems
7) Minimizing energy production adverse impacts on the environment
35

Energy
8) Creating favorable legal and economic conditions for investment9) Encouraging competition and participation of private capital to increase economic efficiency.
After a period of seemingly slow progress toward these objectives, there has been verysignificant and positive change during 1997. The formal objectives of the Energy Law have beensupplemented by a series of governmental and ministerial initiatives and statements that have set out avery clear agenda for continuing reform, restructuring, and commercialization. These initiatives andintentions, in their focus and strategic direction, can be summed up as follows:
* Achieve economic pricing for all energy products and terminate energy subsidies.* Attract private capital into the sector.* Commercialize and privatize energy enterprises.* Diversify both indigenous primary energy resources and sources of imports.* Create competitive energy markets wherever possible.* Heighten the emphasis on energy conservation.* Increase attention to the protection of the environment.* Establish an unambiguous regulatory environment designed to achieve long-term security of
supply and equitable treatment for energy producers and consumers.* Achieve conformity of energy laws and markets with EU norms.
A new and up-dated energy strategy is in preparation that will take into account the changes todate and identify the challenges of current circumstances.
Recent Reform Progress
THE ACHIEVEMENTS OF 1997. The arrival in office of a new government in December 1996 ledto the transformation of the energy policy environment. After several years in which implementation ofreform lagged far behind intentions, a series of decisions, backed up by implementation measures, hascreated a much more positive reform environment than seemed possible a year ago.
The Energy Pricing Commission was established on a basis of complete autonomy and with thepower to be the ultimate arbiter of heat, gas, and electricity prices. Commissioners of standing have beenappointed by presidential decree, and they have been provided with sufficient funds from the state budgetto commence their work satisfactorily. The EPC approved new energy tariffs as of I July 1997. Becausethere had not been enough time to undertake a thorough inquiry into all the costs of energy supply,possible efficiency improvements, and the short- and long-term investment needs of the energy supplycompanies, the EPC approved tariffs that generally accepted the current cost levels of suppliers, but madeno allowance for the financing of investments. This was a holding action on the part of the EPC. Overthe longer term, it intends to analyze costs and efficiencies in detail and to use the tariff methodologies toput downward pressure on the costs it considers to be excessive and that should not be borne byconsumers. The EPC will make demand forecasts for energy products and, working with the energycompanies, examine models of future supply and investment needs, and methods of financing theseneeds, including the place of investment costs in energy tariffs.
The wider question of regulation in the energy sector, including licensing, consumers' rights,security of supply, and other important issues, is also recieving attention. Studies are under way andlegislation is expected in 1998.
The buildup of losses in the Lithuanian Power Company, primarily caused by inadequate tariffs
36
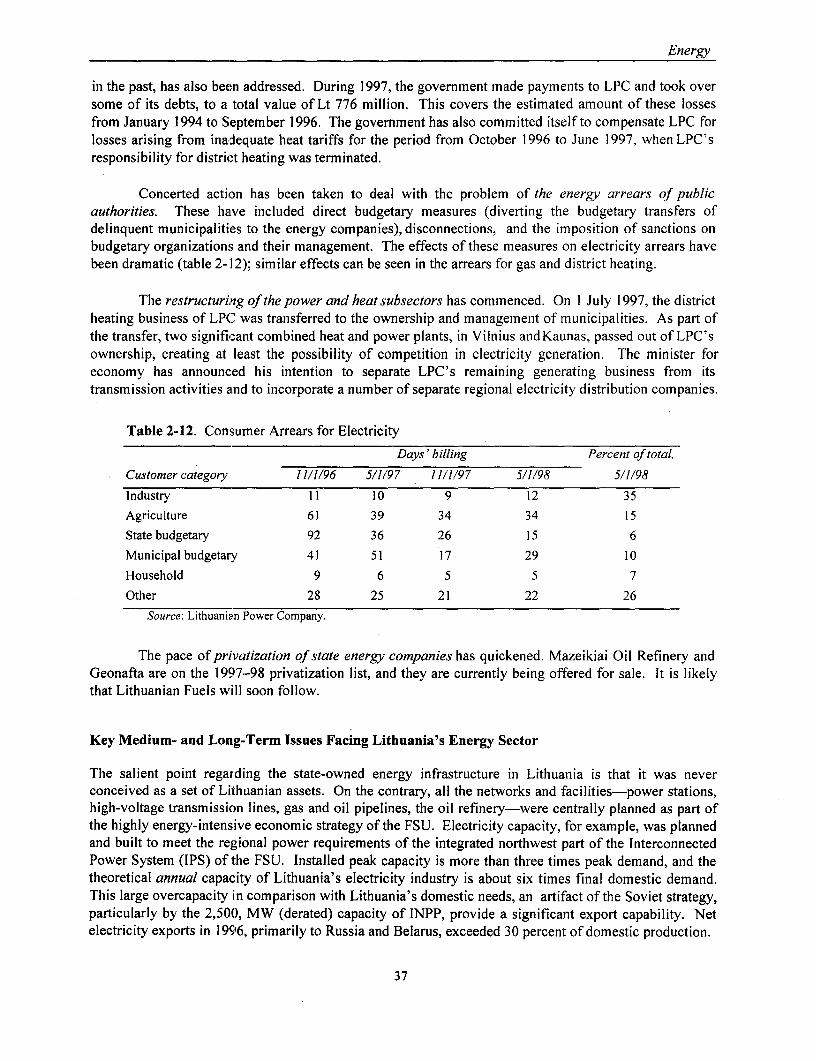
Energy
in the past, has also been addressed. During 1997, the government made payments to LPC and took oversome of its debts, to a total value of Lt 776 million. This covers the estimated amount of these lossesfrom January 1994 to September 1996. The government has also committed itself to compensate LPC forlosses arising from inadequate heat tariffs for the period from October 1996 to June 1997, when LPC'sresponsibility for district heating was terminated.
Concerted action has been taken to deal with the problem of the energy arrears of publicauthorities. These have included direct budgetary measures (diverting the budgetary transfers ofdelinquent municipalities to the energy companies), disconnections, and the imposition of sanctions onbudgetary organizations and their management. The effects of these measures on electricity arrears havebeen dramatic (table 2-12); similar effects can be seen in the arrears for gas and district heating.
The restructuring of the power and heat subsectors has commenced. On 1 July 1997, the districtheating business of LPC was transferred to the ownership and management of municipalities. As part ofthe transfer, two significant combined heat and power plants, in Vilnius and Kaunas, passed out of LPC'sownership, creating at least the possibility of competition in electricity generation. The minister foreconomy has announced his intention to separate LPC's remaining generating business from itstransmission activities aLnd to incorporate a number of separate regional electricity distribution companies.
Table 2-12. Consumer Arrears for Electricity
Days' billing Percent of total,
Customer category 1 1/1/96 5/1/97 11/1/97 5/1/98 5/1/98
Industry II 10 9 12 35Agriculture 61 39 34 34 15State budgetary 92 36 26 15 6Municipal budgetary 41 51 17 29 10Household 9 6 5 5 7Other 28 25 21 22 26
Source: Lithuanian Power Company.
The pace of privatization of state energy companies has quickened. Mazeikiai Oil Refinery andGeonafta are on the 1997-98 privatization list, and they are currently being offered for sale. It is likelythat Lithuanian Fuels will soon follow.
Key Medium- and Long-Term Issues Facing Lithuania's Energy Sector
The salient point regarding the state-owned energy infrastructure in Lithuania is that it was neverconceived as a set of Lithuanian assets. On the contrary, all the networks and facilities-power stations,high-voltage transmission lines, gas and oil pipelines, the oil refinery-were centrally planned as part ofthe highly energy-intensive economic strategy of the FSU. Electricity capacity, for example, was plannedand built to meet the regional power requirements of the integrated northwest part of the InterconnectedPower System (IPS) of the FSU. Installed peak capacity is more than three times peak demand, and thetheoretical annual capacity of Lithuania's electricity industry is about six times final domestic demand.This large overcapacity in comparison with Lithuania's domestic needs, an artifact of the Soviet strategy,particularly by the 2,500, MW (derated) capacity of INPP, provide a significant export capability. Netelectricity exports in 1996, primarily to Russia and Belarus, exceeded 30 percent of domestic production.
37
Energy
The scale of INPP's capacity and its cost advantage in comparison with fossil fuel generatorscombine to make it the producer of the bulk of the electricity generated in Lithuania-83 percent in 1996.In contrast, some of the thermal plants, notably the large oil- and gas-fired station at Elektrenai, run atextremely low levels of capacity utilization. The overall load factor is less than 20 percent. To put this inperspective, Lithuania has about as much electricity generating capacity as Hungary, with one-third of itspopulation. One of the cost burdens borne by the energy sector is that while domestic energy demandshrank by 45 percent between 1991 and 1996, the energy infrastructure is the same as it was in the past inits capacity generate, transmit, distribute, supply, and manage facilities and related costs.
Progress is being made in commercializing and privatizing the main companies in the energysector and in putting in place an appropriate regulatory framework. Nevertheless, difficult problems lieahead for the authorities. Among them, the future of nuclear power in Lithuania is critical, but in light ofthe many geopolitical uncertainties surrounding a potential decision to close INPP, it is not covered inthis Policy Note. Equally important for policymakers is the future structure, ownership, and governanceof the publicly owned companies that operate in the district heating, electricity, and gas sectors becauseof the very large investment requirements of these businesses, the need to promote competition at everyfeasible level, and the weak competitive position of some district heating networks.
Altogether, just under 50 percent of Lithuania's final energy consumption is supplied by theseenterprises, which are virtually monopoly suppliers in the domestic market. For this reason, policies thataffect these enterprises are of much greater significance than policies governing the other state-ownedenergy companies in the oil subsector, which are already exposed to competition. The emphasis in thischapter is thus on policy issues that affect the district heating, electricity, and gas companies.
As in the banking industry (discussed in a Chapter I of this volume), the key underlyingquestions are how to disentangle the role of the state as owner of most of the energy sector with that ofthe state as regulator, and how to deal with the implied transition period (of perhaps two or three years) inwhich the government must act to achieve better management of publicly controlled assets in the interestsof consumers, taxpayers, and the employees of these enterprises, and also in the interest of maximizingultimate privatization proceeds later on.
The Forthcoming Problems of the Newly Decentralized District Heating Sector
More than 80 percent of buildings in the residential and commercial sectors are connected to districtheating (DH) systems. Although there are about 2,000 producers of heat in the country, includingindustrial, commercial, and other large concerns that have their own heat-generating capacity, mostconsumers are connected to one of the pipeline networks previously controlled by LPC, but owned bysixteen municipalities since I July 1997. These supplied over 70 percent of the 20 Tcal of heatconsumed nationally in 1996. This investment, the economic and environmental costs of developingalternatives, and the energy economy that should-in principle-be available in such systems are allreasons that the future of DH should be of concern to policymakers.
The recently implemented decentralization of the DH system should encourage greater economy,efficiency, and effectiveness in the provision of an essential utility. There are several reasons for this.Heating is a local resource. There is no concept in DH like a national grid that requires management atthe national level. The technical characteristics of heat exclude national dispatching. Local authoritiescan maximize welfare in their areas by responding directly to local needs instead of accepting a centrallydesigned service model that may not suit all municipalities. The ensuing costs can be assigned to smallerunits, with management accountability tied to cost and financial objectives. Managers can be closer to
38

Energy
customers, and thus understand local market trends better. In addition, investment, tariff, and servicedecisions can be tailored to local conditions.
The decentralization of the DH networks, together with the important combinied heat and power(CHP) plants at Vilnius and Kaunas, also marks an important step in the restructuring of the sectorbecause it is accompanied by new pricing arrangements. Under the terms of the legislation, prices are setby regional municipal groupings, subject to the approval of the EPC. Until early 1997, governmentpolicy regarding heating tariffs had two main elements. First, it set tariffs at levels that did not covercosts and met the deficit out of public funds (in 1996, the last full year in which deficits were expected tobe met out of budget funds, costs exceeded sales revenues by Lt 440 million. Second, low-incomehouseholds were directly subsidized through a limitation on the amount a household could be charged forheating to 25 percent (5 percent for hot water) of household income. This limit was also subject to rathercomplex criteria based on the size of families and dwellings. The state then paid for consumption inexcess of that proportion (Lt 203 million is provided for the purpose in the 1997 budget).
Tariffs approved by the EPC for the 1997/98 heating season show some regional variations. Forexample, an increase was approved in Vilnius that raised the old national tariff for householders of Lt103.97/Tcal to Lt 114 9/Tcal (excluding value added tax), an increase of 10.5 percent. For Siauliai, theincrease approved brought the rate to Lt 147.1/Tcal, an increase of 41.5 percent. In the smallermunicipalities, which can set their own prices, increases ranged from 21 percent (Mazeikiai) to 146percent (Skuodo).
The power of the EPC to approve tariffs that cover legitimate costs would appear to assure thefinancial viability of the new municipal entities. On this basis, it would be reasonable to expect that fromthe 1997/98 heating season forward, the only subsidy required in the heating sector would be the directconisumer subsidy to low-income households, which can legitimately be regarded as a social welfareprovision. (Although from the standpoint of national policy, the present system of subsidizing low-income households is extremely inefficient, offering no incentives for economy, and inferior to moredirect income-support measures.)
On the debit side, decentralization could also carry some costs arising from the general shortageof qualified and experienced staff in key management areas (such as finance) in Lithuania. It has beenthe general experience in other countries that the benefits of decentralizing the management of companiescompeting in local markets tend, after what may be a difficult adjustment period, to exceed the costs."Empowerment" of regional and local enterprise management has been seen to be effective in sectors asdiverse as food retailing, banking, and public administration. It has also been effective in the energysectors of countries of western, central, and eastern Europe. In Poland, for example, the district heatingindustry has been decentralized to forty-nine municipal groupings, which are operating with increasingeffectiveness in a deregulated market. In the Czech Republic, the larger networks have been privatizedand are moving rapidly toward normal financial targets.
Nevertheless, the DH systems operating in Lithuania suffer from many problems, problems thatcan cause serious imbalances in the finances of their municipal owners, and ultimately in the finances ofthe central government. Four of these problems stand out.
The systems have massive investment needs. Lithuania has an unbalanced (by internationalstandards) heat generation structure. DH systems usually take advantage of the heat produced as a by-product of electricity generation in CHP plants, and use heat-only boiler (HOB) plants only to meet peakdemand and at the peripheries of networks. The dominance of INPP in Lithuania's electricity supply
39
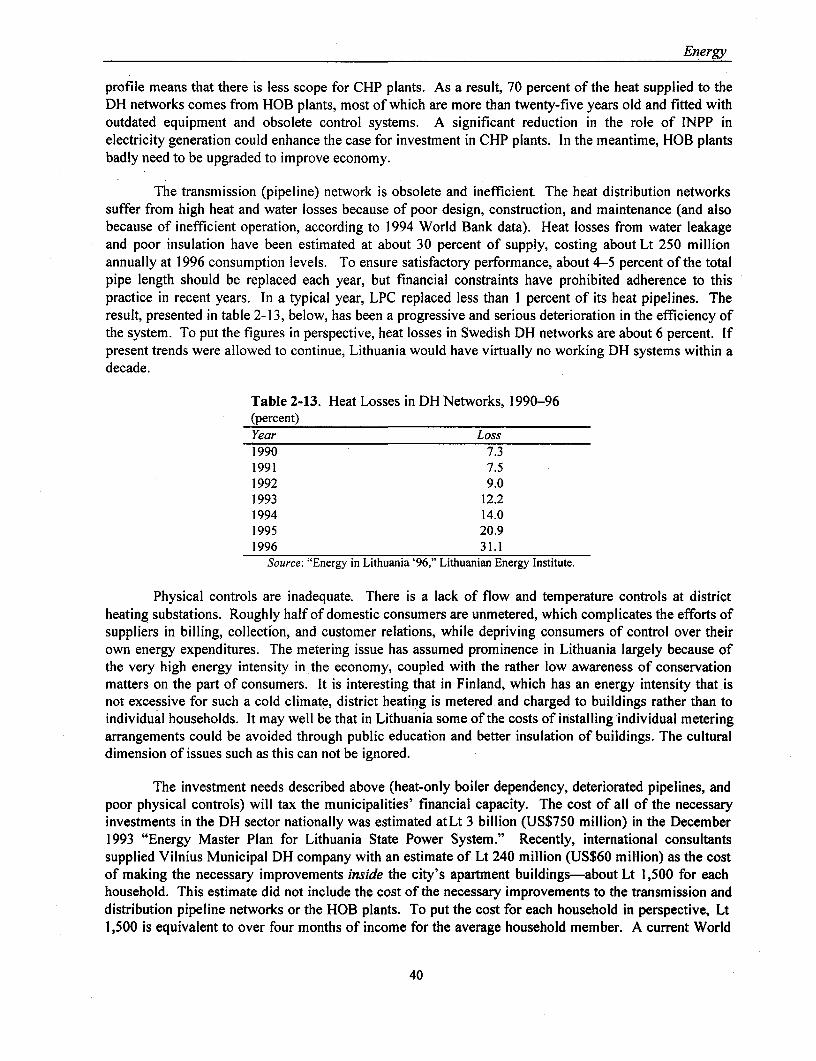
Energy
profile means that there is less scope for CHP plants. As a result, 70 percent of the heat supplied to theDH networks comes from HOB plants, most of which are more than twenty-five years old and fitted withoutdated equipment and obsolete control systems. A significant reduction in the role of INPP inelectricity generation could enhance the case for investment in CHP plants. In the meantime, HOB plantsbadly need to be upgraded to improve economy.
The transmission (pipeline) network is obsolete and inefficient The heat distribution networkssuffer from high heat and water losses because of poor design, construction, and maintenance (and alsobecause of inefficient operation, according to 1994 World Bank data). Heat losses from water leakageand poor insulation have been estimated at about 30 percent of supply, costing about Lt 250 millionannually at 1996 consumption levels. To ensure satisfactory performance, about 4-5 percent of the totalpipe length should be replaced each year, but financial constraints have prohibited adherence to thispractice in recent years. In a typical year, LPC replaced less than 1 percent of its heat pipelines. Theresult, presented in table 2-13, below, has been a progressive and serious deterioration in the efficiency ofthe system. To put the figures in perspective, heat losses in Swedish DH networks are about 6 percent. Ifpresent trends were allowed to continue, Lithuania would have virtually no working DH systems within adecade.
Table 2-13. Heat Losses in DH Networks, 1990-96(percent)Year Loss1990 7.31991 7.51992 9.01993 12.21994 14.01995 20.91996 31.1
Source: "Energy in Lithuania '96," Lithuanian Energy Institute.
Physical controls are inadequate. There is a lack of flow and temperature controls at districtheating substations. Roughly half of domestic consumers are unmetered, which complicates the efforts ofsuppliers in billing, collection, and customer relations, while depriving consumers of control over theirown energy expenditures. The metering issue has assumed prominence in Lithuania largely because ofthe very high energy intensity in the economy, coupled with the rather low awareness of conservationmatters on the part of consumers. It is interesting that in Finland, which has an energy intensity that isnot excessive for such a cold climate, district heating is metered and charged to buildings rather than toindividual households. It may well be that in Lithuania some of the costs of installing individual meteringarrangements could be avoided through public education and better insulation of buildings. The culturaldimension of issues such as this can not be ignored.
The investment needs described above (heat-only boiler dependency, deteriorated pipelines, andpoor physical controls) will tax the municipalities' financial capacity. The cost of all of the necessaryinvestments in the DH sector nationally was estimated atLt 3 billion (US$750 million) in the December1993 "Energy Master Plan for Lithuania State Power System." Recently, international consultantssupplied Vilnius Municipal DH company with an estimate of Lt 240 million (US$60 million) as the costof making the necessary improvements inside the city's apartment buildings-about Lt 1,500 for eachhousehold. This estimate did not include the cost of the necessary improvements to the transmission anddistribution pipeline networks or the HOB plants. To put the cost for each household in perspective, Lt1,500 is equivalent to over four months of income for the average household member. A current World
40

Energy
Bank case study in Kaunas estimates the cost of replacing the entire Kaunas DH network grid over aperiod of ten years at US$114 million with the conventional pipe system, which would have an estimatedlife of between three and twenty years (average, ten years). The cost would be US$210 million ifpreinsulated pipe were used, which would have an estimated life in excess of thirty years.
By any measure, Lithuania's municipalities face very costly investment programs if their DHnetworks are to be modernized, but the return from such investment could be high. Lithuania's 1994Energy Sector Review (ESR) called for a DH rehabilitation program that could achieve energy savings ofabout 25 percent. Given that fuel costs alone in LPC's heat networks amounted to Lt 726 millionnationally in 1996 (US$181.5 million), the potential for worthwhile investment seems clear.
Heating tariffs, of course, could and should include provision for the remuneration of necessaryinvestment, and should, over time, help pay for it. However, financing that investment will be a majorchallenge. There are three main reasons for the difficulty of this project. First, it is extremely unlikelythat the DH companies would be able to borrow the necessary funds on their own; municipal governmentintervention and/or guarantees would be needed. And, as explained in another part of this report, themunicipal governments face serious financial problems of their own. It seems inevitable that the centralgovernment will have ito play a role, compromising its own fiscal accounts. Second, EPC takes the viewthat much can be done by the DH enterprises to reduce their operating costs, and that until this has beendone, it would be unjust to expect consumers to pay higher tariffs to finance investments. There is meritin the EPC's view. While Lithuania's DH companies are money-losing operations, there are nine CzechDH enterprises with mtixed municipal and private ownership that produce an aggregate rate of return onnet assets of about 11 percent, even though they apply a household tariff of US¢1.925 per kWh, morethan 10 percent less than the average household tariff in Lithuania (US02. 15 per kWh). Poland is anotherexample. As a consequence of the reform measures undertaken in four Polish cities (which include bothinstitutional and technical components), energy losses have been reduced to about a third of the levelbefore the reforms; significant management capacity has been created within DH enterprises; and directsubsidies to residential consumers have been reduced from almost 70 percent of cost in 1991 to virtuallyzero. Similar programis in Lithuania should yield comparably attractive benefits. Finally, as discussedbelow, it is not certain that the new tariff structures will be enforceable or competitive.
Weak mechanisms to enforce payment discipline are the second major problem the newlydecentralized DH companies will face. While a more local management focus and autonomous customerrelations strategies can help improve the payment collections of DH entities, they and their municipalowners will undoubtedly have political difficulties within their own constituencies when raising heat andhot water tariffs (as an example, tariff adjustments ranging up to 41 percent were needed in Siauliai, andeven larger ones were required in smaller municipalities). A particular problem is posed by the heatingarrears of state budgetary organizations. In September 1997, these organizations owed Lt 32 million toLPC (then the owner of the DH network) for heat-almost 30 percent of LPC's total receivables for heat.Half of this figure was owed by municipal budgetary organizations, whose debts were equivalent to fifty-six days worth of billing. (A year earlier, these debts amounted to 190 days worth of billing, and onlyfiscal measures taken by the central government in October 1996 and March 1997 prevented them fromreturning to such levels.) In other words, the new DH companies, now municipal entities, are likely tofind that their biggest consumer debt problems will be caused by their sister organizations undermunicipal control. It is moot whether they will be able to enforce payment discipline on such bodies,especially because disconnections of electricity supply to defaulting heat consumers will no longer bepossible in the post-decentralization environment.
The third key problem inherited by the DH companies is their limitedcapacitiy to compete with
41
Energy
alternative sources of heating. Once tariffs are adjusted and enforced to cover economic cost-and, thus,to include provisions for necessary investments-consumers may switch to heating provided byelectricity and natural gas at an increasing rate. The price elasticity of heat demand in Lithuania has notbeen systematically measured. A study in the Czech Republic concluded that price elasticity of DHheating was low, and that the negative effects of even large price increases would be outweighed in themedium and long term, in the case of industrial users, by a perception that DH was the cheapest heatingsource. In 1996, Lithuanian consumers responded to an average tariff increase (for householders) of 73percent by reducing their purchases of heat by 11.5 percent, confirming a rather low level of elasticity.This may, however, have been assisted by two factors that are likely to change in the next few years.
First, for consumers still benefiting from the heat subsidy to low-income households, theincreased tariff was of only academic interest because their heating expenditures are capped at a setproportion of their income. Once the subsidy is phased out (or converted into a direct income supporttool), the reactions of those households may change dramatically. Second, for other consumers, therelationship between consumption and cost is insufficiently transparent, not least because only half of allhouseholds have meters. The prevalence of domestic bathtubs and sinks without plugs, the thermalinefficiency of many buildings, and poor building maintenance procedures are telling examples of thecurrent attitude. Cost-covering price increases, however, will eventually bring home to consumers thevalue of economy in the use of heat and hot water and a deeper awareness of alternative sources ofsupply.
Once each network faces sufficient competition from electricity and natural gas in the heatingmarket in their area, the overall purpose of EPC regulation of heat price will come into question becausethe free working of the market will prevent any one supplier from extracting rents. In the medium term,district heating could (and should) be removed from the purview of the EPC. Country examples helpillustrate the actual and potential intensity of competition in the heat market. In Poland, as of January1998, the new Energy Law provides that heat prices are to be left to the market. In the Czech Republic,price control on heat is being gradually liberalized. In Sweden, the government has been forced toprovide grants for extensions to district heating systems. In Denmark, the Heat Supply Act has beenamended to ban the conversion to electric heating of existing buildings located within a district heating ornatural gas supply network.
Finally, the newly decentralized DH companies lack adequate governance and managementstructures. It is unclear if the improvements in governance, management, and cost control that should beassociated with decentralization will be realized quickly in Lithuania. Although studies were carried outbefore the actual decentralization of DH, little has been done to prepare municipal authorities for theirnew responsibilities.' For example, structures of governance have not been put in place in municipalitiesthat would ensure efficient management control. The companies have not prepared business plans thatwould clarify the likely levels of their immediate financial performance and anticipate the financialimpact of their future investment needs. While the DH enterprises in larger cities will have managementand technical capabilities, the business "culture" of these entities may not be conducive to profitableoperation, and the smaller entities may be lacking in the most basic skills and facilities. In suchcircumstances, better cost control, investment planning, and treasury and financial management will notbe easily achieved.
There are several reasons why these are important, and potentially serious, negative factors. In
1. For instance, the consulting arm of the German utility Mannheimer Versorgungs-und Verkehrsgesellschaft mbH(MVV), Decentralization of District Heatingfor Lithuania, in 1996.
42

Energy
the first place, the current management of DH networks will, in most cases, remain in place after thenetworks have been tranisferred to municipal ownership and control. This is a positive factor-DHmanagers have a thorough knowledge of their business and strong technical skills. At the same time, theyhave not yet been required to work in a rigorously commercial environment, and they are accustomed toreceiving support frorn corporate management in LPC. To make a successful transition to profit-driven,market-aware modes of operation will require not only effort on their part, but also a framework ofstrategic direction and support from the municipality.
That support should be provided by a board that is a blend of political, economic, andcommercial acumen, as well as consumer representation. This is normal practice in the Scandinaviancountries, for example. Such a board can provide the best assurance that, on the one hand, the municipalowner's prerogatives are respected, while on the other hand, corporate management of the DH enterpriseis provided with the legal basis for resisting attempts to exercise unreasonable control against its bestinterests. In Germany, for example, the supervisory board of MVV (the Mannheim DH entity)discharges the normal functions of any corporate board (hiring and evaluating the chief executive,approving budgets, approving major investment plans and financing, and the like). It also approves majorexpansions of the network, tariff applications, and large contracts. Legally constituted supervisoryboards of this nature can, in the Lithuanian DH context, act as necessary insulation between thecommercial imperative and the political expedient. They can also represent an important element of thebarrier that should be put in place between the DH companies and the municipalities to guard against bothsubsidization of DH by the municipalities and the local-level expropriation of DH cash flows that shouldbe retained for investment in the networks. The information at hand, however, is that no such boardshave been put in place in Lithuanian DH entities, and that governance is essentially a matter for theelected local authorities and municipal officials.
In sum, urgent investment needs, difficulties enforcing payment, loss of competitiveness, andweak governance will plague Lithuania's DH companies in the short and medium term. Some of themwill be less equipped than others to deal with these issues because of their economic circumstances, thecapabilities of their mnanagement, or the political environment in their parent municipalities. In somecases, this will lead to corporate failures in the coming years. To the extent that there is a competitivemarket for heat, with other operators standing ready to fill the gap, this should not be a dramatic problem.Indeed, such failures might be a fast route for private capital to become involved in the heating industry,with consequent improvements in efficiency for the economy as a whole.
The Future Role of the State in Power and Gas
THE LITHUANIAN POWER COMPANY. LPC's accounts for 1995 and 1996 are summarized inAnnex 2-1. In 1996 the company had some 21,000 employees; 1.3 million electricity customers; and justunder 0.5 million consumers for heat. Apart from 9 percent of its shares that were distributed toemployees and are now quoted on the Vilnius Stock Exchange, its equity is owned by the state. As in thecase of LG, it is governed by a supervisory board of five members-all civil servants-and by amanagement board chaired by the director general (it is understood, however, that the supervisory board,which has never operated effectively, is to be abolished).
This importan'L company-the largest corporation and the largest employer in Lithuania, evenafter the decentralization of DH (the largest private sector employer, AB Ekranas, an electronicsmanufacturer, employs 25 percent of LPC's numbers)-is in a state of transition. LPC as it stood at theend of 1997 is a very different corporate entity from what it was six months earlier. It is the operator ofLithuania's national electricity grid and the monopoly distributor and supplier of electricity. It is now a
43
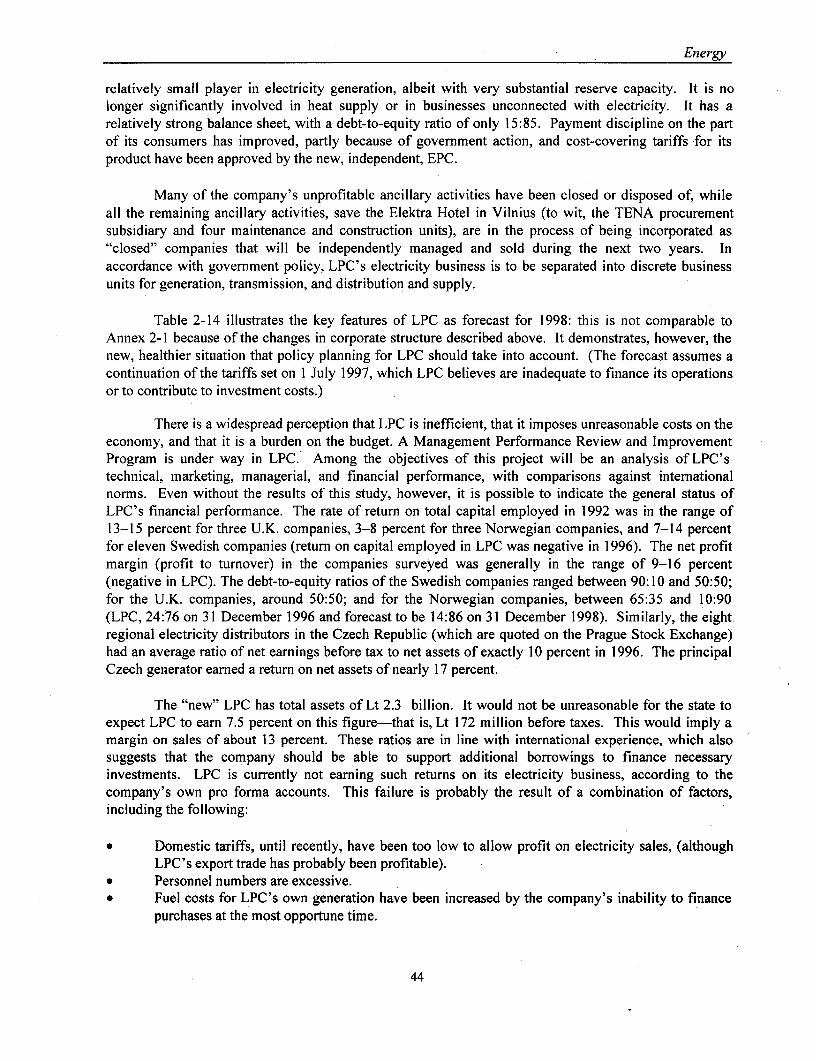
Energy
relatively small player in electricity generation, albeit with very substantial reserve capacity. It is nolonger significantly involved in heat supply or in businesses unconnected with electricity. It has arelatively strong balance sheet, with a debt-to-equity ratio of only 15:85. Payment discipline on the partof its consumers has improved, partly because of government action, and cost-covering tariffs for itsproduct have been approved by the new, independent, EPC.
Many of the company's unprofitable ancillary activities have been closed or disposed of, whileall the remaining ancillary activities, save the Elektra Hotel in Vilnius (to wit, the TENA procurementsubsidiary and four maintenance and construction units), are in the process of being incorporated as"closed" companies that will be independently managed and sold during the next two years. Inaccordance with government policy, LPC's electricity business is to be separated into discrete businessunits for generation, transmission, and distribution and supply.
Table 2-14 illustrates the key features of LPC as forecast for 1998: this is not comparable toAnnex 2-1 because of the changes in corporate structure described above. It demonstrates, however, thenew, healthier situation that policy planning for LPC should take into account. (The forecast assumes acontinuation of the tariffs set on 1 July 1997, which LPC believes are inadequate to finance its operationsor to contribute to investment costs.)
There is a widespread perception that LPC is inefficient, that it imposes unreasonable costs on theeconomy, and that it is a burden on the budget. A Management Performance Review and ImprovementProgram is under way in LPC. Among the objectives of this project will be an analysis of LPC'stechnical, marketing, managerial, and financial performance, with comparisons against internationalnorms. Even without the results of this study, however, it is possible to indicate the general status ofLPC's financial performance. The rate of return on total capital employed in 1992 was in the range of13-15 percent for three U.K. companies, 3-8 percent for three Norwegian companies, and 7-14 percentfor eleven Swedish companies (return on capital employed in LPC was negative in 1996). The net profitmargin (profit to turnover) in the companies surveyed was generally in the range of 9-16 percent(negative in LPC). The debt-to-equity ratios of the Swedish companies ranged between 90: 10 and 50:50;for the U.K. companies, around 50:50; and for the Norwegian companies, between 65:35 and 10:90(LPC, 24:76 on 31 December 1996 and forecast to be 14:86 on 31 December 1998). Similarly, the eightregional electricity distributors in the Czech Republic (which are quoted on the Prague Stock Exchange)had an average ratio of net earnings before tax to net assets of exactly 10 percent in 1996. The principalCzech generator earned a return on net assets of nearly 17 percent.
The "new" LPC has total assets of Lt 2.3 billion. It would not be unreasonable for the state toexpect LPC to earn 7.5 percent on this figure-that is, Lt 172 million before taxes. This would imply amargin on sales of about 13 percent. These ratios are in line with international experience, which alsosuggests that the company should be able to support additional borrowings to finance necessaryinvestments. LPC is currently not earning such returns on its electricity business, according to thecompany's own pro forma accounts. This failure is probably the result of a combination of factors,including the following:
Domestic tariffs, until recently, have been too low to allow profit on electricity sales, (althoughLPC's export trade has probably been profitable).Personnel numbers are excessive.Fuel costs for LPC's own generation have been increased by the company's inability to financepurchases at the most opportune time.
44
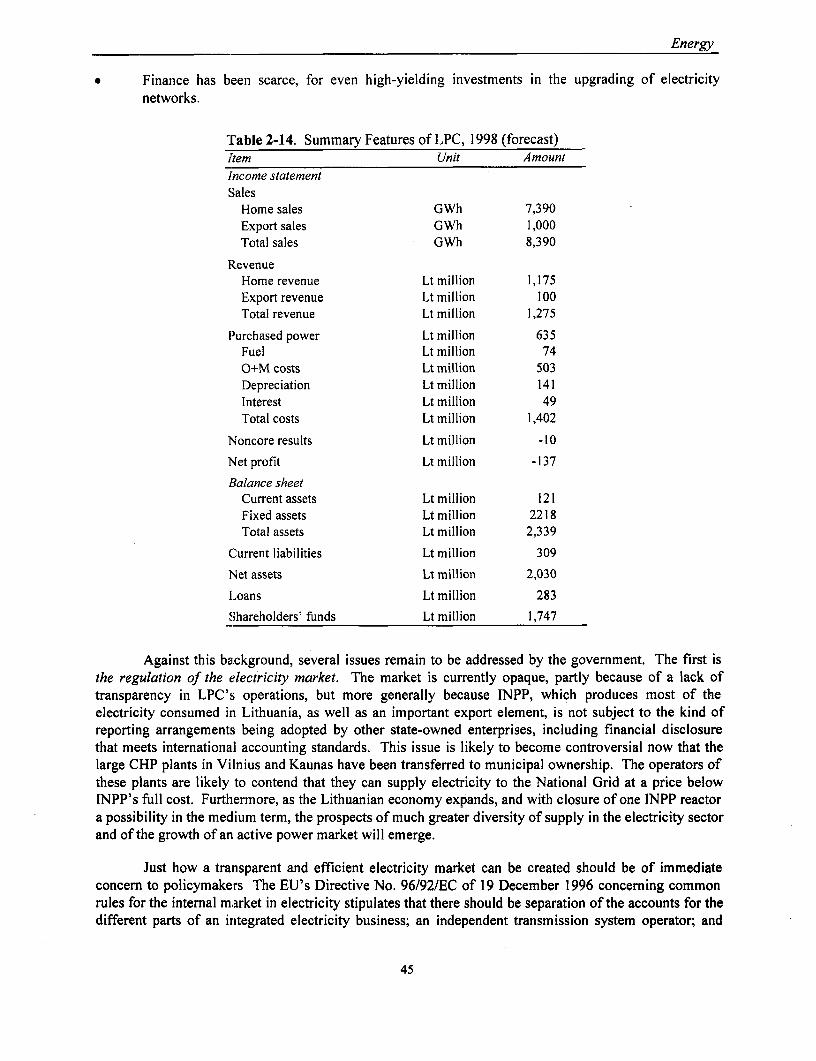
Energy
* Finance has been scarce, for even high-yielding investments in the upgrading of electricitynetworks.
Table 2-14. Summary Features of LPC, 1998 (forecast)i'tem Unit Amountincome statementSales
Home sales GWh 7,390Export sales GWh 1,000Total sales GWh 8,390
RevenueHome revenue Lt million 1,175Export revenue Lt million 100Total revenue Lt million 1,275
Purchased power Lt million 635Fuel Lt million 74O+M costs Lt million 503Depreciation Lt million 141Interest Lt million 49Total costs Lt million 1,402
Noncore results Lt million -10
Net profit Lt million -137
Balance sheetCurrent assets Lt million 121Fixed assets Lt million 2218Total assets Lt million 2,339
Current liabilities Lt million 309
Net assets Lt million 2,030
Loans Ltmillion 283
Shareholders' funds Lt million 1,747
Against this background, several issues remain to be addressed by the government. The first isthe regulation of the electricity market. The market is currently opaque, partly because of a lack oftransparency in LPC's operations, but more generally because INPP, which produces most of theelectricity consumed in Lithuania, as well as an important export element, is not subject to the kind ofreporting arrangements being adopted by other state-owned enterprises, including financial disclosurethat meets international accounting standards. This issue is likely to become controversial now that thelarge CHP plants in Vilnius and Kaunas have been transferred to municipal ownership. The operators ofthese plants are likely to contend that they can supply electricity to the National Grid at a price belowINPP's full cost. Furthermore, as the Lithuanian economy expands, and with closure of one INPP reactora possibility in the medium term, the prospects of much greater diversity of supply in the electricity sectorand of the growth of an active power market will emerge.
Just how a transparent and efficient electricity market can be created should be of immediateconcem to policymakers The EU's Directive No. 96/92/EC of 19 December 1996 concerning commonrules for the internal market in electricity stipulates that there should be separation of the accounts for thedifferent parts of an integrated electricity business; an independent transmission system operator; and
45

Energy
access to the system for producers, suppliers, and eligible customers. Within these general provisions,several approaches are possible. Argentina, Australia, Chile, Sweden, and the United Kingdom favor the"pool" model, in which there is open access by all generators to a continuous marketplace. This, in theshort term, yields the lowest prices. In Lithuania's current circumstances, however, INPP will be thelowest bidder under almost all conditions, which would mean bankruptcy for LPC's Elektrenai Plant, anessential national reserve capacity. The alternative is the "single buyer" model in use in several otherEuropean countries. In this arrangement, a monopoly buyer negotiates supply agreements with allavailable generators, and "availability" contracts with all stations considered to be necessary to thecountry's overall power strategy. At first examination, this would seem to offer the best route forLithuania, and the closure of even one of INPP's reactors would allow a lively electricity market todevelop. While no new capacity is needed in today's conditions, an INPP closure would create openingsfor new private generators. It is relevant that technological change has meant that a unit as small as 250MW can now be as competitive in cost as a 1,000-MW unit.
The way the electricity market is eventually regulated will be critical for the second pendingpolicy issue affecting LPC-the strategy for its privatization. Most of the successful transformations ofpreviously state-owned power companies around the world have followed the model of privatization first,then internal reorganization. The United Kingdom electricity industry is a good example of thisapproach, where private sector attitudes and management skills have succeeded in achieving radicalchange in culture and performance. Rather fewer countries-France and Ireland are examples-havechosen to reform and reconstruct their electricity sectors while keeping them in state ownership, althoughat least in Ireland, later privatization is a strong possibility. In Lithuania, market realities-the capacityand demand equation and the dominance of INPP-seem to make early and full privatization unlikely, atleast in generation. In these circumstances, policymakers may be forced to push for reform to enhanceinternal efficiency now, and to keep the privatization timetable open.
An important related issue is the selection of companies that would be preferred partners in theelectricity industry. The government has a choice between seeking strategic investors with expertise inthe industry or simply selecting those with the necessary financial capacity. Given the outdated nature ofmuch of LPC's generating and transmission/distribution plant, there would be advantages in attracting theinterest, for example, of Scandinavian or German power companies, in both generation and transmission.
Another policy matter in the possible sale of LPC is whether its power generation assets shouldbe privatized as one or as several entities. LPC management believes there is competitive strength inkeeping the stations in one entity. The arguments in favor of this do not seem compelling, and indeedsuch a model could provide a continuing screen for inefficiency.
The government will also need to decide whether to corporatize and privatize the regionaldistribution utilities as seven companies (the present number), divide them into a greater number, orconvert them into one national network.. While managerial competition would confer benefits, theremight also be costs arising from the loss of critical mass. It is relevant that in Ireland, which hasapproximately the same geographical area as Lithuania and where the number of electricity customers is1.4 million (LPC's is 1.3 million), the government, after extensive study, has decided to retain thedistribution and supply network as a single business (naturally, with regional divisions). Europeanexperience seems to bear out the belief that a regional distribution utility needs about 250,000 customersto be viable. This suggests that Lithuania should have no more than five such utilities. Such a numberwould offer the opportunity for development of a strong, competitive supply sector, with managementcompetition in performance, customer interests at the forefront, and management that can be rewardedfrom market returns.
46

Energy
Finally, before privatization is achieved, oth2r corporate issues will require government attention.For example, it will need to decide how much freedom LPC should have to reinvest funds liberated by thesale of subsidiaries and ancillary businesses. Given the need of the company to invest in therehabilitation of its assets, a case could be made that it should be allowed to retain the proceeds of thedisposal of noncore assets on the basis of investment plans approved by the government-appointedsupervisory board.2 Yet, if further unbundling of LPC-into generation companies, a nationalgrid/national dispatch company, and a number of distribution utilities-precedes privatization, it may beadvisable that the proceeds from the sale of separate corporate units revert to the government and othershareholders, not to the company.
The third pending policy issue is the promotion of efficiency enhancements in the period leadingto privatization. While from a policy point of view, an adequate management incentive structure is thebest tool to seek efficiency in the use of public assets, some nonfuel costs deserve immediate attentionfrom the government as owner. For example, the ratio of personnel costs to fuel costs in LPC has risenby over 60 percent in three years-from 22 percent in 1994 to an estimated 36 percent in 1997. Theextremely high staff numbers in the company cannot be overlooked. In 1996, approximately I 1,000 staffworked in the electricity business of LPC, as well as over 5,000 in INPP. There were, therefore,approximately twice as many employees for each 1,000 customers in the Lithuanian electricity sector asthere were in the comparably sized Irish industry.
The emphasis placed on efficiency improvements by the management of an enterprise may beaffected by their perception of the rewards they receive. In this respect, LPC (and LG; see below) suffersfrom government restrictions placed on the remuneration of senior executives. The civil-service-linkedpay structure for such executives is not capable of offering incentives for exceptional effort andperformance. Senior financial staff, furthermore, is aware of the very much higher salaries available towell-qualified and experienced accountants and financial analysts in growing private sector enterprisesand have no incentive to remain in worse-paid public sector employment.
Issues of the kind outlined here (immediate efficiency-promoting steps) are exactly the sorts ofissues that should concern the board of a company. They require a cost-cutting program frommanagement, provision of management incentives, and the improvement of financial management. Theyare at the heart of corporate governance as described earlier. LPC, as well as LG and other energycompanies, lacks such a board.
THE LITHUANIAN GAS COMPANY. LG transported 3.06 billion cubic meters of natural gas in1996; its own sales represented 1.59 billion cubic meters of this total. Allowing for the 422 million cubicmeters transshipped to Kaliningrad, LG's share of domestic Lithuanian consumption was 60 percent. Thecompany provided transmission services to the suppliers of the other 40 percent, half a dozen importersthat are primarily supplifers for LPC, and a number of large industrial users. LPC was the buyer in 65percent of LG's sales, and 34 percent of the sales of other suppliers of power and heat generation. Thecompany also supplies 67 percent of the LPC market, the balance of the market being in the hands ofabout 60 small, regional distributors.
LG's pipelines have a capacity at the Lithuanian border of 12 billion cubic meters annually, so
2. A first step should be to require professional valuations of these businesses, which comprise, inter alia, the TENAprocurement subsidiary, a concrete fabrication plant, the Kruonis construction company, two power linemaintenance operations, and the Hotel Elektra in Vilnius. Total employment in these operations is about 1,200people.
47
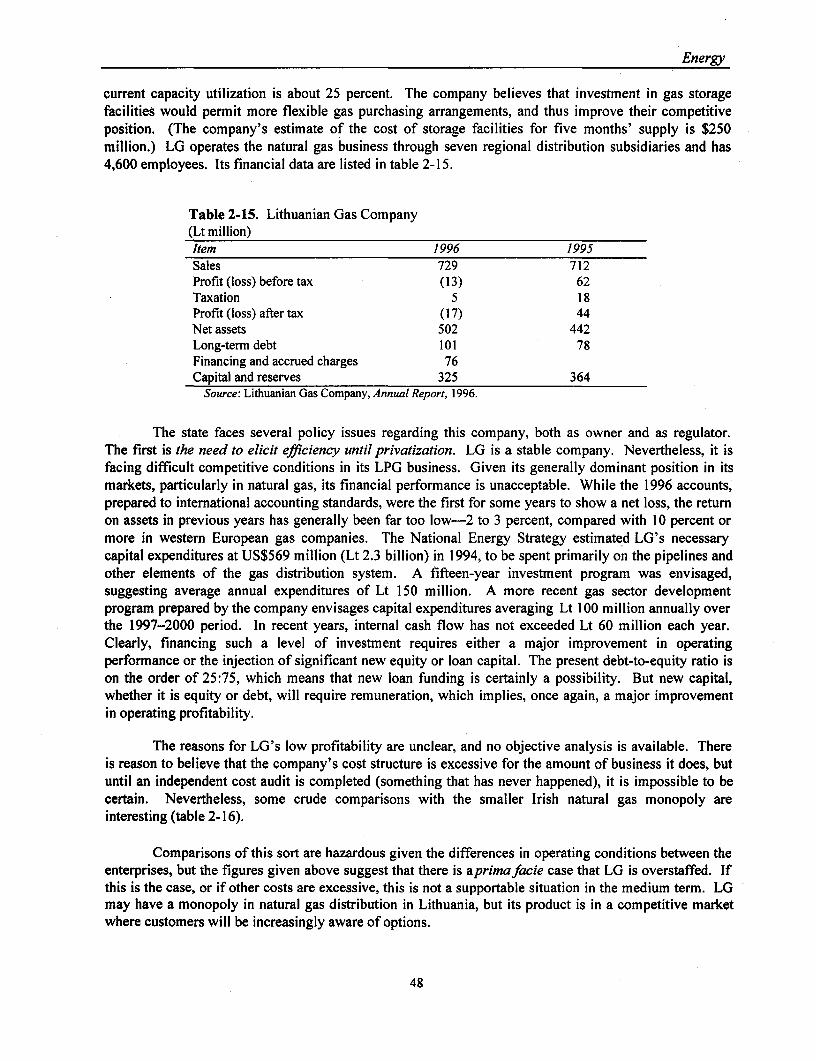
Energy
current capacity utilization is about 25 percent. The company believes that investment in gas storagefacilities would permit more flexible gas purchasing arrangements, and thus improve their competitiveposition. (The company's estimate of the cost of storage facilities for five months' supply is $250million.) LG operates the natural gas business through seven regional distribution subsidiaries and has4,600 employees. Its financial data are listed in table 2-15.
Table 2-15. Lithuanian Gas Company(Lt million)Item 1996 1995Sales 729 712Profit (loss) before tax (13) 62Taxation 5 18Profit (loss) after tax (17) 44Net assets 502 442Long-term debt 101 78Financing and accrued charges 76Capital and reserves 325 364
Source: Lithuanian Gas Company, Annual Report, 1996.
The state faces several policy issues regarding this company, both as owner and as regulator.The first is the need to elicit efficiency until privatization. LG is a stable company. Nevertheless, it isfacing difficult competitive conditions in its LPG business. Given its generally dominant position in itsmarkets, particularly in natural gas, its financial performance is unacceptable. While the 1996 accounts,prepared to international accounting standards, were the first for some years to show a net loss, the returnon assets in previous years has generally been far too low-2 to 3 percent, compared with 10 percent ormore in western European gas companies. The National Energy Strategy estimated LG's necessarycapital expenditures at US$569 million (Lt 2.3 billion) in 1994, to be spent primarily on the pipelines andother elements of the gas distribution system. A fifteen-year investment program was envisaged,suggesting average annual expenditures of Lt 150 million. A more recent gas sector developmentprogram prepared by the company envisages capital expenditures averaging Lt 100 million annually overthe 1997-2000 period. In recent years, internal cash flow has not exceeded Lt 60 million each year.Clearly, financing such a level of investment requires either a major improvement in operatingperformance or the injection of significant new equity or loan capital. The present debt-to-equity ratio ison the order of 25:75, which means that new loan funding is certainly a possibility. But new capital,whether it is equity or debt, will require remuneration, which implies, once again, a major improvementin operating profitability.
The reasons for LG's low profitability are unclear, and no objective analysis is available. Thereis reason to believe that the company's cost structure is excessive for the amount of business it does, butuntil an independent cost audit is completed (something that has never happened), it is impossible to becertain. Nevertheless, some crude comparisons with the smaller Irish natural gas monopoly areinteresting (table 2-16).
Comparisons of this sort are hazardous given the differences in operating conditions between theenterprises, but the figures given above suggest that there is aprimafacie case that LG is overstaffed. Ifthis is the case, or if other costs are excessive, this is not a supportable situation in the medium term. LGmay have a monopoly in natural gas distribution in Lithuania, but its product is in a competitive marketwhere customers will be increasingly aware of options.
48

Energy
Table 2-16. A Comparison of the Lithuanian and Irish Gas SystemsItem Lithuanian Gas Company Irish Gas BoardCustomers 484,000 267,500Transmission lines (km) 1,400 1,030Distribution lines (km) 4,100 5,000Employees 4,500 733Sales ($ million) 178 379Net profit (loss) ($ million) -4.3 117
Source: Lithuanian Gas Company, Bord Gais Eireann.
Second, that lack of efficiency is compounded by serious corporate governance problems.Management is supposedly overseen by a supervisory board. In theory, this board includes fivemembers, all civil servants, but in practice it appears to play no independent role. The latest informationis that it is to be disbanded, and no alternative mechanism is under discussion. It should be noted that inother European countries such boards are becoming the norm in state-owned enterprise, as they have longbeen among private sector companies. Ireland's Electricity Supply Board, which strongly resembles LPCas a state-owned, vertically integrated power monopoly undergoing a painful change process, iscontrolled by a board of twelve, none of whom is a civil servant.
Third, there is an obvious policy vacuum regarding LG's privatization. Nine percent of LG'sshares are in private ownership and are traded on the Vilnius Stock Exchange, while the remaining 91percent are held by the state. The government has approved the issue of additional shares'with a nominalvalue of Lt 66 million to Russian gas suppliers, bringing the total private shareholding to 25 percent.These shares are being issued at a premium of 65 percent, and will therefore yield Lt 109 million to thecompany. The rationale for the sale strategy is unclear. It would have been preferable to have sold theshares by international tender. It would also have been advantageous for the government to have soldsome of its existing shareholding rather than issuing fresh shares, which will leave the proceeds in thecompany's hands rather than with the government.
The full privatization of the company is envisaged in the medium term, although a firmprivatization timetable and plan have not yet been established, despite the evident interest in the companyby several overseas gas enterprises. More immediately, the company is currently contemplating spinningoff its seven regional distribution utilities into joint ventures with municipalities (in this respect, a pilotstudy is under way in Kaunas municipality). It is evident from these developments, and from similarsuggestions that have been made in relation to electricity distribution, that some municipalities envisage afuture in which they will control integrated utilities for their regions (electricity, heat, gas, and waterdistribution). No econornic, strategic, or financial case has been made for such integrated utilities.
Although it is understood that the government intends to fully privatize the company, nothingconcrete has happened. Three company-specific factors seem to be delaying LG's privatization. First,while the government appears to be committed to the sale of the company (with necessary safeguards inplace because of the strategic importance of the pipeline and supply network), there is disagreement inthe Seimas about the proportion of equity the state should retain, although there is no obvious benefit inretaining any part of LG in public ownership. Second, the creation of regional integrated utilities, whichis apparently under consideration, could make the company less attractive. (The example of LPC wouldnot inspire confidence in the conglomerate model.) Third, privatization initiatives are being effectivelyleft to company management. While management has an important role to play in supplying governmentwith information to aid decisionmaking, the initiative should be firmly in the hands of the shareholders(the government in particular) and their representatives, the supervisory board.
49
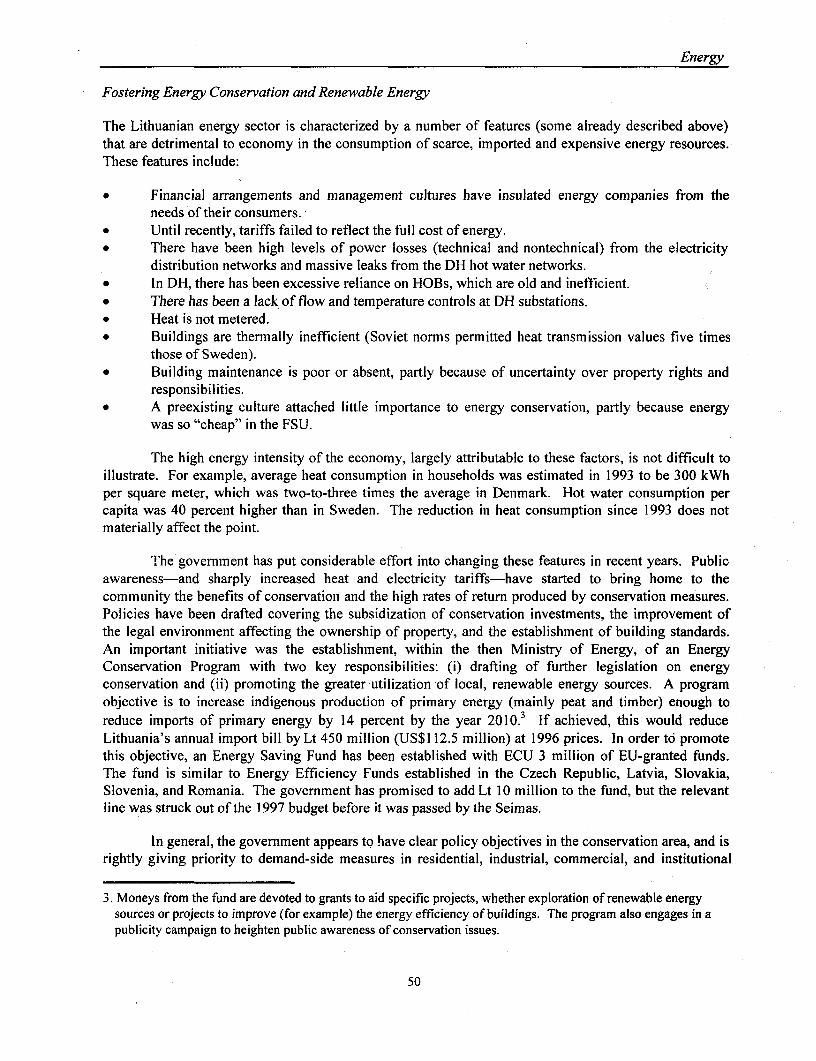
Energy
Fostering Energy Conservation and Renewable Energy
The Lithuanian energy sector is characterized by a number of features (some already described above)that are detrimental to economy in the consumption of scarce, imported and expensive energy resources.These features include:
* Financial arrangements and management cultures have insulated energy companies from theneeds of their consumers.
* Until recently, tariffs failed to reflect the full cost of energy.* There have been high levels of power losses (technical and nontechnical) from the electricity
distribution networks and massive leaks from the DH hot water networks.* In DH, there has been excessive reliance on HOBs, which are old and inefficient.* There has been a lack of flow and temperature controls at DH substations.* Heat is not metered.* Buildings are thermally inefficient (Soviet norms permitted heat transmission values five times
those of Sweden).* Building maintenance is poor or absent, partly because of uncertainty over property rights and
responsibilities.* A preexisting culture attached little importance to energy conservation, partly because energy
was so "cheap" in the FSU.
The high energy intensity of the economy, largely attributable to these factors, is not difficult toillustrate. For example, average heat consumption in households was estimated in 1993 to be 300 kWhper square meter, which was two-to-three times the average in Denmark. Hot water consumption percapita was 40 percent higher than in Sweden. The reduction in heat consumption since 1993 does notmaterially affect the point.
The government has put considerable effort into changing these features in recent years. Publicawareness-and sharply increased heat and electricity tariffs-have started to bring home to thecommunity the benefits of conservationi and the high rates of return produced by conservation measures.Policies have been drafted covering the subsidization of conservation investments, the improvement ofthe legal environment affecting the ownership of property, and the establishment of building standards.An important initiative was the establishment, within the then Ministry of Energy, of an EnergyConservation Program with two key responsibilities: (i) drafting of further legislation on energyconservation and (ii) promoting the greater utilization of local, renewable energy sources. A programobjective is to increase indigenous production of primary energy (mainly peat and timber) enough toreduce imports of primary energy by 14 percent by the year 2010.3 If achieved, this would reduceLithuania's annual import bill by Lt 450 million (US$112.5 million) at 1996 prices. In order to promotethis objective, an Energy Saving Fund has been established with ECU 3 miliion of EU-granted funds.The fund is similar to Energy Efficiency Funds established in the Czech Republic, Latvia, Slovakia,Slovenia, and Romania. The government has promised to add Lt 10 million to the fund, but the relevantI ine was struck out of the 1997 budget before it was passed by the Seimas.
In general, the government appears to have clear policy objectives in the conservation area, and isrightly giving priority to demand-side measures in residential, industrial, commercial, and institutional
3. Moneys from the fund are devoted to grants to aid specific projects, whether exploration of renewable energysources or projects to improve (for example) the energy efficiency of buildings. The program also engages in apublicity campaign to heighten public awareness of conservation issues.
50
Energy
buildings and in industry, transport, and agriculture. In gross terms, these are the areas where the greatestsavings can be made. The government has commissioned studies of energy-saving and resource-diversification possibiliities, and has been assisted in this by the World Bank and other agencies. It ispaying particular attention to building codes and investments in existing buildings.
There are four areas where further development of policy, or the more forceful expression ofexisting policies, appears necessary. The most important of these relates to an area where theresponsibility of the state is most clear: in the operations of the energy companies owned by the state orby municipalities.
The government's national energy efficiency program, originally issued in 1992 and published inrevised form in 1996, estimates that the total annual saving potential through the implementation of allmeasures is 24.7 TWh (equivalent to the output of two INPPs). Of these potential savings, 5.3 TWh-21percent of the total-are in the generation and distribution of electricity and heat, activities that arecurrently controlled by publicly owned enterprises. The approximate value of such savings, in terms ofimported fuel and associated variable costs, is Lt 600 million (US$150 million). This estimate includesan assumption that losses from the DH system would be at the 1994 level of about 14 percent. Since1994, however, these losses have risen to over 31 percent; using the higher figure would add up to Lt200 million to the annual saving. The program estimates the investments needed to secure such savingsat Lt 7 billion. Here, the financial interests of the state parallel the economic case for conservation, not tomention the environmental benefits-an example of what the International Energy Agency (IEA) hascalled "no regret" actions. It can be very crudely estimated that the state budget's exposure to the energysector will be in the region of Lt 500 million in both fiscal 1998 and 1999, falling to less than Lt 400million in 2000 and 2001, and heading toward zero thereafter as the remaining consumer subsidies are(presumably) phased out. Rapid and effective implementation of energy-saving investments by publiclyowned energy companies could thus greatly ease the impact of these costs, particularly through increasedlevels of technical efficiency in the generation, transmission, and distribution of electricity and heat.
The second area where greater force and consistency of policy is required is in relation to theEnergy Saving Fund. Tlhe failure of the government to meet its commitments to the fund gives the wrongmessage to consumers and does not seem economically justifiable.
Third, little direct pressure is placed on large industrial and commercial consumers to examinetheir energy-using practices. Energy-efficiency audits are all but nonexistent.
Finally, there is evidence that consumers are generally still not as conscious as they should be ofthe costs of wastefulness in energy consumption or of the benefits to be gained from economy.According to a social assessment carried out in connection with the World Bank's EnergyEfficiency/Housing Pilot Project, 45 percent of householders interviewed in Vilnius and Kaunas eitherthought that energy saving was a waste of time or had no opinion, while 80 percent felt that to reducetheir consumption further would inflict hardship on their families. It seems that, despite thecommendable efforts of the Energy Conservation Program, the message may not have gotten through.The IEA specifically recommends the use of information policies to show consumers how they can savemoney by saving energy.
Policy Recommendations
Overall Strategy and Principles
The Statement of Energv Sector Development Policy and Strategy adopted by the government in 1994
51
Energy
remains valid. Considerable progress has been made in implementing important elements of that policyand strategy-for example, in DH decentralization, in establishing the EPC, in planning the overallregulatory environment, in achieving pricing transparency, and in attracting private capital. Importantshortfalls persist, however, in other areas of energy policy. These relate primarily to the performance ofstate-owned energy companies, the future role of the state as owner, the development of energy marketmechanisms, and energy conservation. In all of these areas, new policy approaches are needed so thatLithuania may realize its overall objectives of efficiency in energy production and consumption;reliability and quality of supply; diversity of energy resources and sources; protection of the environment;and, critically, the financial independence of the energy sector from the state.
The main tools to achieve those objectives are (I) fiscal policy, to support the principle that thelevel, nature, and effects of any explicit or implicit subsidies to energy producers or consumers should becontrolled; (2) governance, to support the principle that the overall strategic role of the state as owner (asfar as this role lasts) should be clearly separated from the direction and management of commercialenterprises; (3) conservation policy, to support the principle that fiscal, pricing, investment, and otherincentives and penalties should be deployed to encourage economy on the part of energy producers andusers, and to accelerate the development of indigenous renewable primary energy sources; (4) regulatorypolicy, to support the principles of consumer protection, long-run economy of supply, and the operationof the market; and (5) privatization, to support the principle that private sector involvement in the energysector will contribute to long-term improvements in efficiency and customer service.
Although the 1995 Energy Law remains valid, progress has been slow in some important areasthat should receive special attention from government. It is therefore recommended that the governmentadopt a new, time-bound Plan of Action formulated along the lines of the Plan of Action appended to the1994 Statement of Energy Sector Development Policy and Strategy, but recognizing the changes incircumstances over the past four years and, consequently, adopting a different emphasis. The new planshould (I) set a date by which the regulatory framework for the energy sector will be complete, with thenecessary agencies staffed, resourced, and at work; (2) state how a competitive electricity market willoperate; (3) provide a firm schedule for the unbundling of LPC into transparent corporate entities; (4)provide a firm schedule for the privatization of all the state's investments in the energy sector (exceptINPP); (5) set out comprehensive governance rules for energy enterprises controlled by the state or bymunicipalities and specify the duties, prerogatives, and membership guidelines for supervisory boards ofsuch enterprises; and (6) set targets for energy conservation, the diversification of energy sources, and theexploitation of renewable energy resources, and proclaim the measures (including incentives andsanctions) being taken to achieve the targets.
A statement of the type recommended above should be accompanied by the selection of a seriesof key objectives for the energy sector, and the establishment of measurable monitoring indicators foreach. These should relate to the principal areas of government concern, including overall energyintensity, diversity of fuel sources, development of indigenous and renewable energy forms, levels ofsubsidization, financial performance of state-controlled utilities, and the like. The objectives shouldinclude, inter alia, (I) reduction of energy intensity of the economy by 10 percent annually (suchreductions have been achieved by several European countries over short periods); (2) reduction of importdependency by 10 percentage points by the year 2000 (for example, Denmark reduced its importdependency from 47.4 percent in 1990 to 28.8 percent in 1994); (3) reduction in the proportion of oilsupplies sourced from Russia to less than 80 percent by 2000; (4) phasing out of consumer heat subsidiesover three years; (5) earning annual dividends (or interest) from remaining state-owned energycompanies equivalent to 5 percent of net assets (all such enterprises had a combined book value in 1996of slightly more than Lt 10 billion; a 5 percent rate of return would have implied aggregate profits of Lt
52
Energy
500 million, whereas the enterprises incurred an aggregate loss of aboutLt 50 million); and (6) increasingthe private sector share of electricity generation to 5 percent of the total by 1999.
Performance targets of this type should be supplemented by similar targets at the utility orcompany level, covering the principal measures of technical, managerial, and manpower efficiency.(Annex 2-2, which is drawn from World Bank Technical Paper No. 243, Improving Electric PowerUtility Efficiency, suggests some appropriate headings for setting targets for LPC; similar targets might beset for the other energy companies.)
Making Viable the Transfer of District Heating to Municipal Ownership
Two general principles should be protected in designing policy to meet the new DH environment: thestate budget's exposure to the DH sector must be completely eliminated, and the government's overallenergy objectives and strategy must continue to be supported in the new ownership environment.
In 1997 the state was fiscally exposed to the DH sector through the consumer subsidy for low-income households and through the inclusion in the budgets of the municipalities of provision for DHdeficits. As economic growth resumes and heating tariffs are being set at cost-recovering levels, it shouldbe feasible for the government to evaluate the impact on households of reducing that subsidyprogressively over a (small) number of years, with the intention of eliminating it altogether by a targetdate-the year 2000, for example.
As regards operating deficits, it is inevitable that these will be incurred in 1997. There is nojustification, however, for any future provision for heating losses, in the 1998 budget or subsequently. Itis important that the advantages achieved by securing municipalization of the sector should be maximizedwithout delay. For that purpose, the government should make it absolutely clear that it will not financedeficits in the future, as it did in the past when DH was under LPC control. It is the responsibility of themunicipal authorities to make whatever changes are necessary in their DH entities to secure profitableoperation within the tariffs approved by the EPC.
There is one dilemma that the municipalities will face that merits government involvement insolving. This relates to the weakening competitive position of many DH networks. Technicaldeficiencies are compounded in consumers' eyes by large tariff increases. Yet the investment fundsrequired to upgrade D]I facilities and strengthen the competitive position of the networks, by reducingfuture (maintenance and other) operating costs, are enormous. The weaker the DH networks become, themore consumers will turn to other forms of heating. In many cases, this will be a suboptimaldevelopment because the efficiency of the alternative system will be significantly less than that of an(efficient) DH system. The consequences will be manifested in Lithuania's balance of payments, inindustrial costs, and in environmental effects. The financial costs of the necessary investments, largethough they may be, could probably be recovered through tariffs, but only over a long time-scale.Suitably structured borrowing would appear to offer a solution, but Lithuania's municipalities have noreal borrowing capacity, no track record in bond markets, no suitable collateral to offer to lenders, and noexperience of evaluating and preparing projects of this scale (see the chapter on municipal finance in thisvolume).
It is therefore recommended that the government provide assistance to municipalities in twoways:
By carrying out an urgent study of the investments needed on a municipality-by-municipality
53

Energy
basis (estimated to be Lt 3 billion nationally over the period 1995 to 2010, an average of Lt 200million a year, in the 1993 Energy Master Plan for Lithuania State Power System)4
By negotiating and coordinating a borrowing program to obtain the necessary finance toimplement a major rehabilitation program for the entire DH sector, concentrating on thoseprojects that are estimated to yield the best combination of economic and environmental benefits.
The Municipal Development Project currently under consideration by the World Bank envisagesthe establishment of a Municipal Credit Facility (MCF), initially amounting to $32.5 million, for on-lending to municipalities for a variety of capital purposes, mainly infrastructural. The suggested MCFseems to provide a structure that would be perfectly appropriate to the financing of investments in the DHsystems. The emphasis that it places on local capacity building and institutional development-and thefact that successful MCF lending operations would greatly ease subsequent bond market or other creditoperations of the municipalities-fully supports overall energy sector development in Lithuania. It isquestionable, however, whether the scale of the MCF being considered is adequate for the substantial DHinvestment program that is required. It may be necessary to consider a separate operation specifically forthe municipal DH enterprises. The funds made available by such an operation could be supplemented bya special temporary levy on tariffs that would divert into investment a proportion of the cost savingsachieved through the investment program and other cost efficiencies. Whether the instrument used is theproposed MCF or a custom-made alternative, the conditionalities attached to lending to municipalitiesshould include requirements in relation to the governance of DH entities (see below) to ensure that theycan operate in a fully commercial manner, as businesses rather than as departments of the municipaladministration.
It is equally important that the state use the powers at its disposal to insist upon the higheststandards of management and governance in the DH sector. The work of the EPC, and the expectedestablishment of a broad regulatory agency for the energy sector, will contribute toward this objective.However, there are additional measures that the government could usefully adopt:
Provisions that are currently being applied on an effective temporary basis to compel statebudgetary organizations to pay their DH bills promptly should be made permanent.The structure of governance that applies to DH entities should be specified through legislation,including the powers and membership of boards, which should include, as in similar companiesin western Europe, a majority of "outside" (nonmanagerial) representation such as consumers,financial experts, and business people, as well as representatives of the municipalities.Regular "league tables" should be published ranking DH entities in terms of their performanceagainst a range of indicators, including profit ratios, tariffs, cost per customer, market share intheir areas, heat losses, thermal efficiency, receivables overdue, use of indigenous and renewablefuels, and the like.Finally, a date should be set by which the heating sector should be freed from price regulation;this process should go in tandem with the introduction of private capital, on an unrestricted basis,to the DH sector.
Toward the Privatization of LPC and LG
The first principle that must inform policy in relation to these two important and influential companies isthat decisions about their future ownership, regulation, and financial objectives are for the government,not the companies' management, to make, and that the latter's role is only to implement policy and to
4. Perhaps building on the work already being done in Kaunas by the Bank's ESMAP program.
54
Energy
achieve the financial and service objectives set. This has two important implications: there must be clearlines of demarcation between the government as shareholder, the government as regulator, thegovernment as customer, and the utility's management; and the government as controlling shareholdermust make clear decisions about the future of the companies, and must establish organs of corporategovernance to ensure implementation of these decisions. These organs should include supervisory boardsthat contain a majority of outside members, including economists, financial experts, successful figuresfrom the private sector, and representatives of consumers (industrial and commercial as well asresidential; as mentioned earlier, the five-member supervisory boards appointed to LPC and LG in April1997 consist exclusive'ly of civil servants).
Thus, it is recommended to:
Complete the current review of the regulatory environment for energy with a view to having acomprehensive regulatory agency, responsible for all key issues such as the licensing of operatorsand the specification and monitoring of supply standards (in addition to theEPC's existing role inthe tariff area), fully resourced and operational.Following full analysis of the options, and in conformity with European Union policies, put inplace electricity market mechanisms that will provide for competition between, and fairremuneration of, electricity generators (whether the assets under their control are characterized asbase load, peak load, or reserve capacity) for efficient bulk trading with distribution utilities, andlong-run minimalization of the cost of electricity to consumers.* Establish each of LPC's remaining generating stations as a separate state-owned company, itsshares controlled by the Ministry of Economy and reporting directly (through its board) to thatministry, until privatization takes place.* Establish each of LPC's seven regional electricity distribution utilities as a separate subsidiary ofLPC, incorporated under company legislation and with municipal representation on itssupervisory board, again until privatization takes place.Remove all barriers to fully commercial operation in LPC, in particular by replacing the membersof the present supervisory board with a board of seven to nine persons, consisting of oneexecutive of the company (the general director), one civil servant, and five to seven others whomight include a private sector business person, a banker, a financial expert, a consumer, aneconomist, ancl an LPC employee elected by the workforce (all of these would be appointed andaccountable to the ministry, but their remit on the board would be to ensure the highest possiblestandards of efficiency, service, and financial performance).Appoint boards, selected along similar lines, to the generating and distribution companies.Establish a series of performance indicators for LPC to achieve, based on the framework shownin Annex 2-2.Engage experienced international financial advisers to attract private capital into the electricityindustry and to develop a plan for the ultimate privatization of the generation anddistribution/supply sectors (the transmission activity, the National Grid, should remiain in publicownership).Place the total privatization of LG immediately in the hands of duly selected internationaladvisers; assumning the regulatory agency is in place before the sale is concluded, there should beno need for the government to retain a "golden share."Remove all obstacles, such as the present proviso that the maximum salary in LPC may notexceed five tirnes the average pay in the company, to the establishment of performance-relatedremuneration of energy sector managers in line with managers carrying similar responsibility inthe Lithuanian private sector. (On the basis of studies in thirty-two developing countries, a recentWorld Bank policy research report, "Bureaucrats in Business," 1995, concluded that performance
55
Energy
contracts between government and the managements of state-owned enterprises could help tospeed the reform of such enterprises if incentives are aligned appropriately.)
Capturing More of the Benefit of Energy Conservation
Although government has shown a considerable degree of commitment to the principles of energyconservation and the development of Lithuania's indigenous sources of renewable energy, further effortsare needed.
The Energy Saving Fund should be adequately funded, initially by the government making goodon its commitment of Lt 10 million. This is essential if the government is to be perceived by consumersas serious in its commitment to energy economy. Without such financial resources, the fund will beunable to make its intended contribution to conservation.
The government, and in particular the Ministry of Economy through its Energy ConservationProgram, must examine defects in its efforts to educate Lithuania's consumers in the benefits ofconservation and must allocate the resources necessary for the program to mount a much more effectiveand continuing public education and information campaign. This should include setting up informationand advice centers, "Energy Information Kiosks" (as are widely used in Belgium, for instance), greateruse of the media, and special modules in primary school curricula. Other devices, such as a "NationalEnergy Awareness Week," as in Ireland in 1994, would help to "plant" ideas in the public's mind. Thecost of such measures should be met out of energy tariffs.
Industrial, commercial, and institutional consumers (starting with large consumers) should berequired by law to carry out energy audits according to standards set by the Energy ConservationProgram. Public procurement rules should incorporate energy-saving technologies among their criteria.
Finally, the government must make it clear to the supervisory boards of state and municipalenergy companies that progress in replacing energy-wasteful equipment and methods will be considered akey performance indicator. State funds for that purpose should not be used, or indirectly committed tothese companies. All categories of such companies, on present tariffs, should be able to structure theirfinances to make energy-preserving rehabilitation investments possible without government guarantee orsupport, since all will earn continuing financial benefits from making these investments. The governmentshould seek an understanding with the EPC that tariffs will take account of the need for conservationinvestments over a lengthy period, and that the tariffs will encourage companies, rather than penalizethem, for making these investments.
56
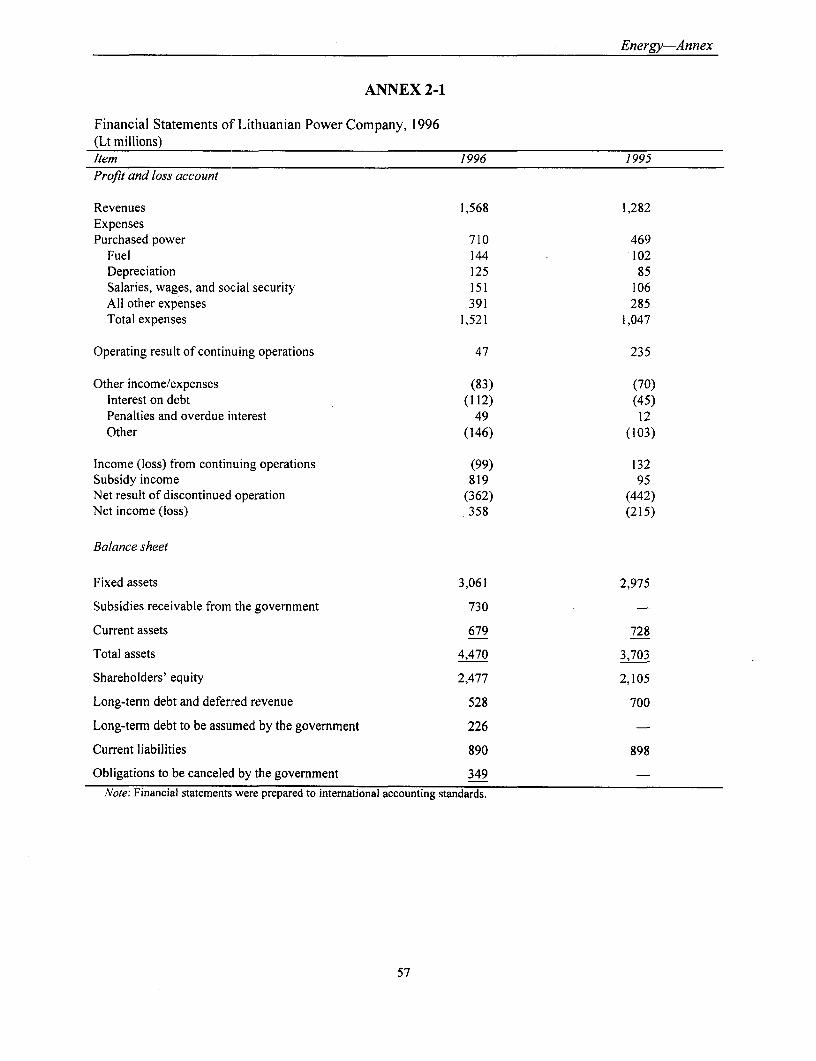
Energy-Annex
ANNEX 2-1
Financial Statements oi Lithuanian Power Company, 1996(Lt millions)Item 1996 1995Profit and loss account
Revenues 1,568 1,282ExpensesPurchased power 710 469
Fuel 144 102Depreciation 125 85Salaries, wages, and social security 151 106All other expenses 391 285Total expenses 1,521 1,047
Operating result of continuing operations 47 235
Other income/expenses (83) (70)Interest on debt (112) (45)Penalties and overdue interest 49 12Other (146) (103)
Income (loss) from continuing operations (99) 132Subsidy income 819 95Net result of discontinued operation (362) (442)Net income (loss) 358 (215)
Balance sheet
Fixed assets 3,061 2,975
Subsidies receivable from the government 730
Current assets 679 728
Total assets 4,470 3,703
Shareholders' equity 2,477 2,105
Long-term debt and defenred revenue 528 700
Long-term debt to be assumed by the government 226
Current liabilities 890 898
Obligations to be cancelecd by the government 349
Note: Financial statements were prepared to international accounting standards.
57

... ...

Energy-Annex
ANNEX 2-2
Sample Performance Indicators for LPC
Qualitative Indicators-GeneralDoes LPC have clear and consistent objectives?Has management the right to hire and fire?Is there an appropriate management information and reporting system?Is management held accountable for its performance?Is LPC's training program adequate?Are daily operations insulated from external political pressure?Does management control salaries?Is there continuous monitoring of ongoing projects?Are performance-based incentives in place for employees?
Quantitative Indicatcrs
Human resourcesTurnover of manpower/average workforceTraining costs per employeeNumber of employees/customersRate of absenteeismEmployees per MWh sold
Commercial and accountingAccounts receivable/months billing l_lBad debts/accounts receivableBilling lag in days _
Accounts more than 3 months overdue/total accounts receivableService connection lag in days _______________
FinancialRate of return on assetsDebt-service ratioAverage revenue from electricity salesSelf-funding ratio
TechnicalForced outage ratePlant availability hours/8760System cost of power producedSystem load factorTechnical lossesSystem own useReserve marginSystem fuel costStaff years per MWh generatedSystem lossesNontechnical lossesSource: World Bank, Improving Electric Power Utility Efficiency, Technical Paper No. 243 (Washington, D.C.).
59

I
MUNICIPAL FINANCE
This note reviews developments in Lithuania's fiscal decentralization policy since the World Bank reportLithuania: Municipal Finance Report of April 1995 and suggests an agenda for further reform. Therationalization and modlernization of the system of municipal finances will play a significant role inplacing Lithuania's public accounts on a sustainable path. Close to a third of consolidated public sectorspending is at the municipal level, and key public services such as education and public utilities areprimarily the responsibility of municipal governments. Municipal governments also play a significantrole in social protection. With no taxing powers of their own of any significance, and with no clearborrowing guidelines, the financial balance of municipalities is a crucial element in the stability of thecountry's macroeconomic framework, because the central government implicitly plays the role of payerof last resort.
After a spate of new laws and reforms in 1993-94, followed by the Municipal Finance Reportand an ensuing government task force, the process of municipal reform would appear to have come to ahalt. During 1995 and 1996 the system of municipal governments continued to operate within a faultyframework characterized by lack of revenue autonomy; perverse incentives for expenditure efficiency,revenue mobilization, or cost recovery; and a budgeting system that was still anchored in the gap-fillingsystem inherited from thie central planning era.
Fortunately, in July 1997, the Seimas approved the Law on Methodology for EstablishingMunicipal Budget Inconne. This law has returned Lithuania to an innovative and creative path of reform.It set in place a system of formula-driven transfers for equalization purposes that does much to addressthe perverse incentives and uncertainties that have plagued the country's municipal finances during thetransition years.
Nevertheless, the design and implementation of. an efficient system of municipal finance forLithuania remains incomplete, and in some areas seriously flawed. The government's agenda for futurereform will need to encompass a long list of issues, including the structure of decentralized governments,the clarification of assignments for capital investment responsibilities, the long-term viability ofdecentralized district heating companies, the increase in revenue certainty and autonomy of municipalbudgets, the improvement in the design of equalization and categorical transfers, the regulation ofborrowing activities by municipalities and the facilitation of long-term credit, and the complete overhaulof the budgeting process at the local level.
61

Municipal Finance
Main Features of Municipal Finance in Lithuania and Recent Developments
The Structure of Decentralized Governments
At the time of independence, the structure of decentralized governments in Lithuania consisted of elevencities with "republican" subordination, forty-four rayon (or county) governments, and a third tier of ruralsettlements or villages subordinated to the rayon governments. This vertical structure of government wastoo complex and lacked optimal scale at the third tier of rural settlements. The old structure also lackedadequate democratic representation at the rayon (or county) level. The Law on Local AdministrativeUnits and their Boundaries of July 1994 reformed the decentralized structure of government byintroducing a single tier consisting of fifty-six municipalities.' The urban or city municipalitiesrepresented 44 percent of all municipal expenditures in 1996. The level of concentration has not been aspronounced in Lithuania as in other small countries, such as Estonia and Latvia. The two largestmunicipalities, Vilnius and Kaunas, represent approximately one-quarter of all municipal expenditures,and the six largest municipalities account for close to 40 percent.
Among the Baltic states, Estonia, like Lithuania, has only two tiers of government, the centralgovernment and 255 municipalities. The municipalities in Estonia have a considerably lower averagesize in population than those in Lithuania. Latvia is now in the process of reforming its vertical structureof government, moving from three to two tiers of government and consolidating local governments into150 to 200 municipalities. These new municipalities, on average, would also be significantly smaller thanthose in Lithuania. Most eastern European countries and those of the former Soviet Union have threelevels of government, as is the case in most Organization for Economic Cooperation and Development(OECD) countries. However, some smaller OECD countries and quite a few small developing countrieshave only two tiers of government. Although there are significant variations in the average size inpopulation of local governments in these countries, Lithuania's average municipality would be above the
2international average.
An important part of the 1994 reform in Lithuania was the elimination of an intermediate,decentralized level of government, the rayons (or counties). In their place, the Law on AdministrativeUnits created ten regional, deconcentrated administrative units (or counties), which operate as arms of thecentral government ministries to deliver central government services in a deconcentrated fashionthroughout the national territory. In addition, there are plans to expand the number of municipalities.(This issue is discussed in the section entitled "Key Medium-Term Policy Issues," below.)
Local government interests are represented by an Association of Municipalities, which isofficially recognized by the government.3 The association has some positive features. Membership isvoluntary and funding comes entirely from contributions of the member municipalities.4
1. In addition to the fifty-six municipalities, there are about 500 neighborhoods (seniunijos), essentially the formerrural towns and settlements, that are headed by an officer appointed by the mayor of the municipality. Theseneighborhoods, however, do not have administrative unit status.
2. See, for example, Richard M. Bird, Robert D. Ebel, and Christine 1. Wallich (eds.) Decentralization of theSocialist State: Intergovernmental Finance in Transition Economies (Washington, D.C.: The World Bank, 1995).
3. For example, the 1997 Law on the Methodology for Establishing Municipal Budget Income names theAssociation of Municipalities as part of the dialogue with the Seimas and the government for determining the sizeof the municipal budgets in the general government budget.
4. There is only one municipality (Klaipeda) that is not a member of the association.
62
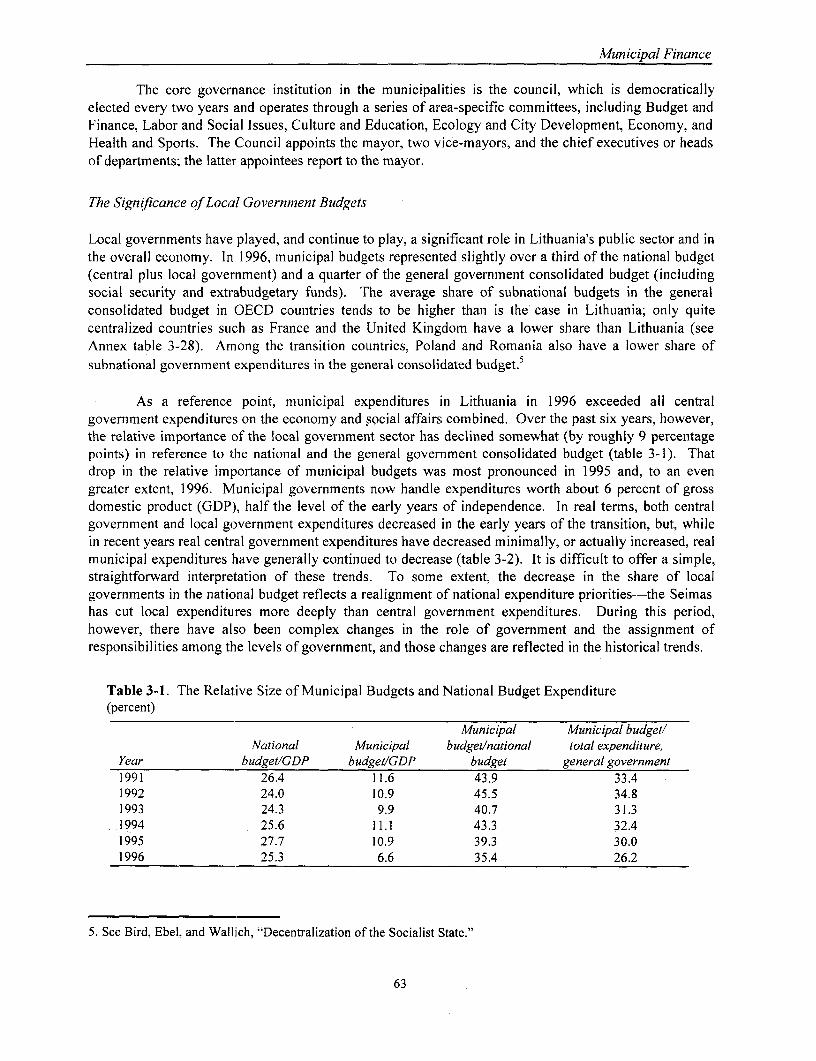
Municipal Finance
The core governance institution in the municipalities is the council, which is democraticallyelected every two years and operates through a series of area-specific committees, including Budget andFinance, Labor and Social Issues, Culture and Education, Ecology and City Development, Economy, andHealth and Sports. The Council appoints the mayor, two vice-mayors, and the chief executives or headsof departments; the latter appointees report to the mayor.
The Significance of Local Government Budgets
Local governments have played, and continue to play, a significant role in Lithuania's public sector and inthe overall economy. In 1996, municipal budgets represented slightly over a third of the national budget(central plus local government) and a quarter of the general government consolidated budget (includingsocial security and extrabudgetary funds). The average share of subnational budgets in the generalconsolidated budget in OECD countries tends to be higher than is the case in Lithuania; only quitecentralized countries such as France and the United Kingdom have a lower share thani Lithuania (seeAnnex table 3-28). Arnong the transition countries, Poland and Romania also have a lower share ofsubnational government expenditures in the general consolidated budget.5
As a reference point, municipal expenditures in Lithuania in 1996 exceeded all centralgovernment expenditures on the economy and social affairs combined. Over the past six years, however,the relative importance of the local government sector has declined somewhat (by roughly 9 percentagepoints) in reference to the national and the general government consolidated budget (table 3-1). Thatdrop in the relative importance of municipal budgets was most pronounced in 1995 and, to an evengreater extent, 1996. M/lunicipal governments now handle expenditures worth about 6 percent of grossdomestic product (GDP), half the level of the early years of independence. In real terms, both centralgovernment and local government expenditures decreased in the early years of the transition, but, whilein recent years real central government expenditures have decreased minimally, or actually increased, realmunicipal expenditures have generally continued to decrease (table 3-2). It is difficult to offer a simple,straightforward interpretation of these trends. To some extent, the decrease in the share of localgovernments in the national budget reflects a realignment of national expenditure priorities--the Seimashas cut local expenditures more deeply than central government expenditures. During this period,however, there have also been complex changes in the role of government and the assignment ofresponsibilities among the levels of government, and those changes are reflected in the historical trends.
Table 3-1. The Relative Size of Municipal Budgets and National Budget Expenditure(percent)
Municipal Municipal budget/National Municipal budget/national total expenditure,
Year budget/GDP budget/GDP budget general government1991 26.4 11.6 43.9 33.41992 24.0 10.9 45.5 34.81993 24.3 9.9 40.7 31.31994 25.6 11.1 43.3 32.41995 27.7 10.9 39.3 30.01996 25.3 6.6 35.4 26.2
5. See Bird, Ebel, and Walliich, "Decentralization of the Socialist State."
63

Municipal Finance
Table 3-2. Municipal and Total National Expenditures(Lt million)
1992 1993 1994 1995 1996In nominal termsMunicipal expendituresa 370 1,100 1,860 2,494 2,657Total national expenditures 1,060 3,402 5,920 8,228 10,132In constant 1992 litasbMunicipal expenditures 370 216 212 219 188Annual change in real terms (percent) -42 -2 3 -14Total national expenditures 1,060 667 675 722 717Annual change in real terms (percent) -37 1 7 -1
a. Excludes expenditures of municipal enterprises other than subsidies from municipal budget.b. Based on annual average inflation rates according to the IMF: 1993, 410 percent; 1994, 72 percent; 1995. 30 percent;
and 1996, 24 percent.Source: Updated from World Bank, Lithuania Municipal Finance Report, 1995.
Composition of Municipal Budgets
ExPENDITURES. Traditionally, the most important component of local expenditures has beensocial services, which include education, culture and recreation, health, and social assistance. In 1996,expenditures in social services represented four-fifths of total municipal expenditures; educationaccounted for half of the total, and health care for a little over a quarter. The other major component ofthe municipal budget in 1996 was "housing and municipal economy," which represented 13 percent oftotal municipal expenditures. For 1997 (through July 1), over half of all municipal expenditures were ineducation alone (table 3-3). The other two most important expenditure categories were welfare andhousing, each representing approximately one-tenth of overall expenditures. The figures for 1997already reflect the recently decreed shifting of health service responsibilities from local governments tothe state's Health Insurance Fund.
Table 3-3. Lithuania: Composition of Municipal Expenditures, 1997(Lt million)
Percentage ofCategory Total totalGeneral administration 47.3 3.5Social security and public order 10.2 0.8Education 719.0 53.3Health care 66.7 4.9Welfare 145.9 10.8Housing and municipal economy 151.6 11.2Culture and recreation 56.2 4.2Fuel, energy, and supplies 39.0 2.9Agriculture 0.0 0.0Other expenditures 113.8 8.4Total expenditures 1,349.6 100.0
Note: The figures are based on expenditures up to I July 1997.Source: The figures are compiled from data provided by the Ministry of Finance.
The relative importance of expenditures on social services in Lithuania's local budgets has beenincreasing during the transition, as shown in table 3-4. This reflects a change in priorities, especially
64
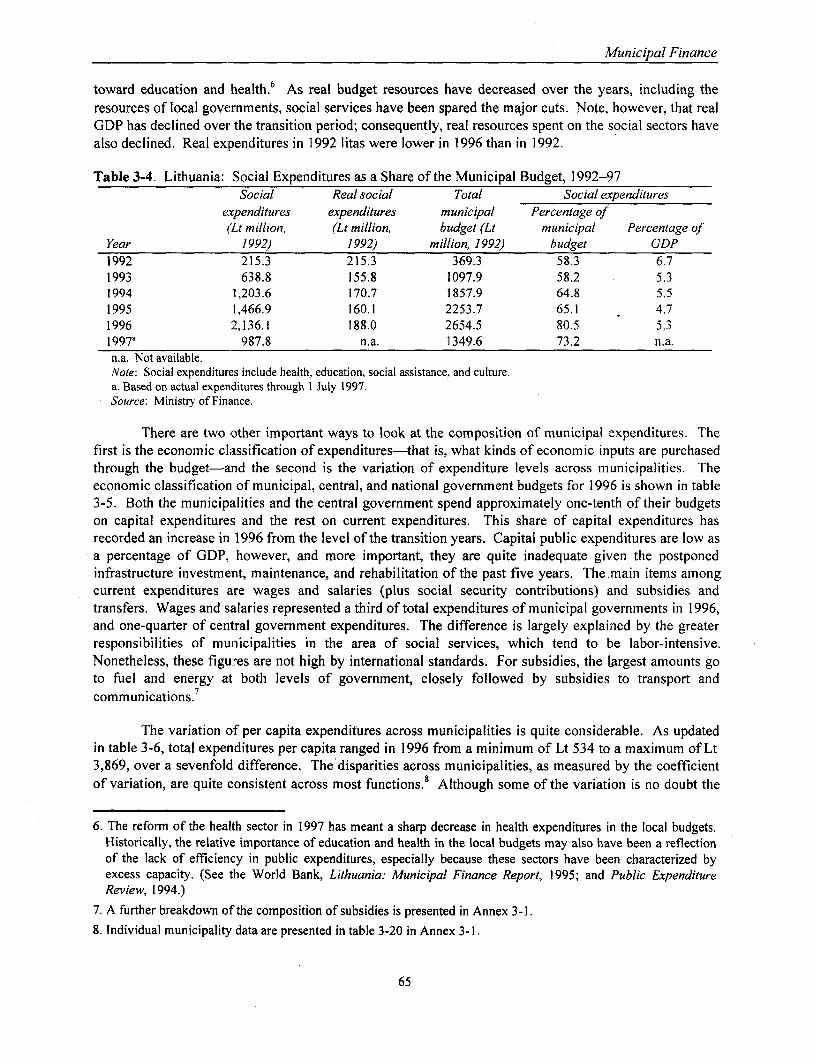
Municipal Finance
toward education and health.6 As real budget resources have decreased over the years, including theresources of local governments, social services have been spared the major cuts. Note, however, that realGDP has declined over the transition period; consequently, real resources spent on the social sectors havealso declined. Real exipenditures in 1992 litas were lower in 1996 than in 1992.
Table 3-4. Lithuania: Social Expenditures as a Share of the Municipal Budget, 1992-97Social Real social Total Social expenditures
expenditures expenditures municipal Percentage of(`Lt million, (Lt million, budget (Li municipal Percentage of
Year 1992) 1992) million, 1992) budget GDP1992 215.3 215.3 369.3 58.3 6.71993 638.8 155.8 1097.9 58.2 5.31994 1,203.6 170.7 1857.9 64.8 5.51995 1,466.9 160.1 2253.7 65.1 4.71996 2,136.1 188.0 2654.5 80.5 5.31997a 987.8 n.a. 1349.6 73.2 n.a.n.a. Not available.Note: Social expenditures include health, education, social assistance, and culture.a. Based on actual expenditures through I July 1997.Source: Ministry of Finknce.
There are two other important ways to look at the composition of municipal expenditures. Thefirst is the economic classification of expenditures-that is, what kinds of economic inputs are purchasedthrough the budget-and the second is the variation of expenditure levels across municipalities. Theeconomic classification of municipal, central, and national government budgets for 1996 is shown in table3-5. Both the municipalities and the central government spend approximately one-tenth of their budgetson capital expenditures and the rest on current expenditures. This share of capital expenditures hasrecorded an increase in 1996 from the level of the transition years. Capital public expenditures are low asa percentage of GDP, however, and more important, they are quite inadequate given the postponedinfrastructure investment, maintenance, and rehabilitation of the past five years. The.main items amongcurrent expenditures are wages and salaries (plus social security contributions) and subsidies andtransfers. Wages and salaries represented a third of total expenditures of municipal governments in 1996,and one-quarter of central government expenditures. The difference is largely explained by the greaterresponsibilities of municipalities in the area of social services, which tend to be labor-intensive.Nonetheless, these figu:res are not high by international standards. For subsidies, the largest amounts goto fuel and energy at both levels of government, closely followed by subsidies to transport andcommunications.7
The variation of per capita expenditures across municipalities is quite considerable. As updatedin table 3-6, total expenditures per capita ranged in 1996 from a minimum of Lt 534 to a maximum of Lt3,869, over a sevenfold difference. The disparities across municipalities, as measured by the coefficientof variation, are quite consistent across most functions.8 Although some of the variation is no doubt the
6. The reform of the health sector in 1997 has meant a sharp decrease in health expenditures in the local budgets.Historically, the relative importance of education and health in the local budgets may also have been a reflectionof the lack of efficiency in public expenditures, especially because these sectors have been characterized byexcess capacity. (See the World Bank, Lithuania: Municipal Finance Report, 1995; and Public ExpenditureReview, 1994.)
7. A further breakdown of the composition of subsidies is presented in Annex 3-1.8. Individual municipality data are presented in table 3-20 in Annex 3-1.
65

Municipal Finance
result of reporting issues, as appears to be the case for health services, it is still too large to be ignored.For example, education expenditures per capita differ sixfold across municipalities. In addition, thedisparity in expenditure per capita across municipalities does not appear to follow a systematic pattern.This is shown in table 3-7, where per capita municipal expenditures9 are regressed on a measure of fiscalcapacity (per capita general revenues collected in the jurisdiction), a measure of need (percentage of thepopulation not of working age), a measure of scale (population of the municipality), and a dummyvariable that distinguishes between urban and rural municipalities. The only two explanatory variablesthat are statistically significant are population and the dummy variable. Expenditures per capita tend todecrease with the size of the municipality, and they are consistently larger in urban municipalitiescompared with rural municipalities. The regression, however, only explains 17 percent of the variation inthe dependent variable, per capita municipal expenditures.
Table 3-5. Economic Classification of Budget Expenditures in 1996 at the Municipal and CentralGovernment Levels
National expenditure Central government MunicipalitiesThousand Thousand Thousand
litai Percent litai Percent litai Percent
Total expenditure 7,510,191 100.0 5,332,794 100.0 2,852,500 100.0
Current expenditure 6,700,107 89.2 4,789,988 89.8 2,556,677 89.6Goods and services 5,382,695 71.7 3,214,402 60.3 2,168,293 76.0Wages and salaries 2,310,281 30.8 1,282,012 24.0 1,028,269 36.0Social security contributions 652,806 8.7 357,703 6.7 295.103 10.3Other 1,236,603 16.5 996,965 18.7 239,638 8.4
Interest payments 296,228 3.9 292,785 5.5 3,443 0.1Outside general government 217,592 2.9 214,149 4.0 3,443 0.1Abroad 78,636 1.0 78,636 1.5 - -
Subsidies and other transfers 1,021,184 13.6 1,282,801 24.1 384.941 13.5Subsidies 396,449 5.3 252,560 4.7 143,889 5.0
To nonfinancial institutions 303,730 4.0 165,785 3.1 137,945 4.8Transfers among government levels n.a. n.a. 646,558 12.1 - -Transfers of households 619,787 8.3 379,752 7.1 240.035 8.4Scholarships 68,417 0.9 68,417 1.3 - -
Capital expenditure 807,827 10.8 542,806 10.2 265,021 9.3Acquisition of fixed capital assets 785,491 10.5 520,470 9.8 265.021 9.3
Construction 499,765 6.7 275,815 5.2 223,950 7.9Land reclamation and expansion 125,267 1.7 125,267 2.3 - -Purchase of tangible assets 153,429 2.0 118,096 2.2 35.333 1.2
Lending minus repayments 2,257 0.0 - - 2,257 0.1To nonfinancial public enterprises 257 0.0 - - 257 0.0To financial institutions 2,000 0.0 - - 2,000 0.1
Transfers to the state budget n.a. n.a. - - 28,545 1.0n.a. Not available.Source: Govemment Financos of the Republic of Lithuania, Vilnius, 1996.
REVENUES. The most important source of municipal revenues in 1996 was the personal incometax (PIT). Revenue sharing from this tax represented 57 percent of all revenues when transfers areincluded in total revenues, and 75 percent when transfers are excluded. (Transfers from the centralgovernment amounted to about one-fifth of total municipal revenues for 1996; see table 3-8.) Amongother taxes, the corporate income tax (CIT) was the second most important source of revenue,representing 8 percent of total revenues, followed by taxes on property (the land tax, enterprise assets,and land rental), which together represented about 7 percent. All other income sources are very small.
9. The results for per capita transfers in this table are discussed in a separate section.
66
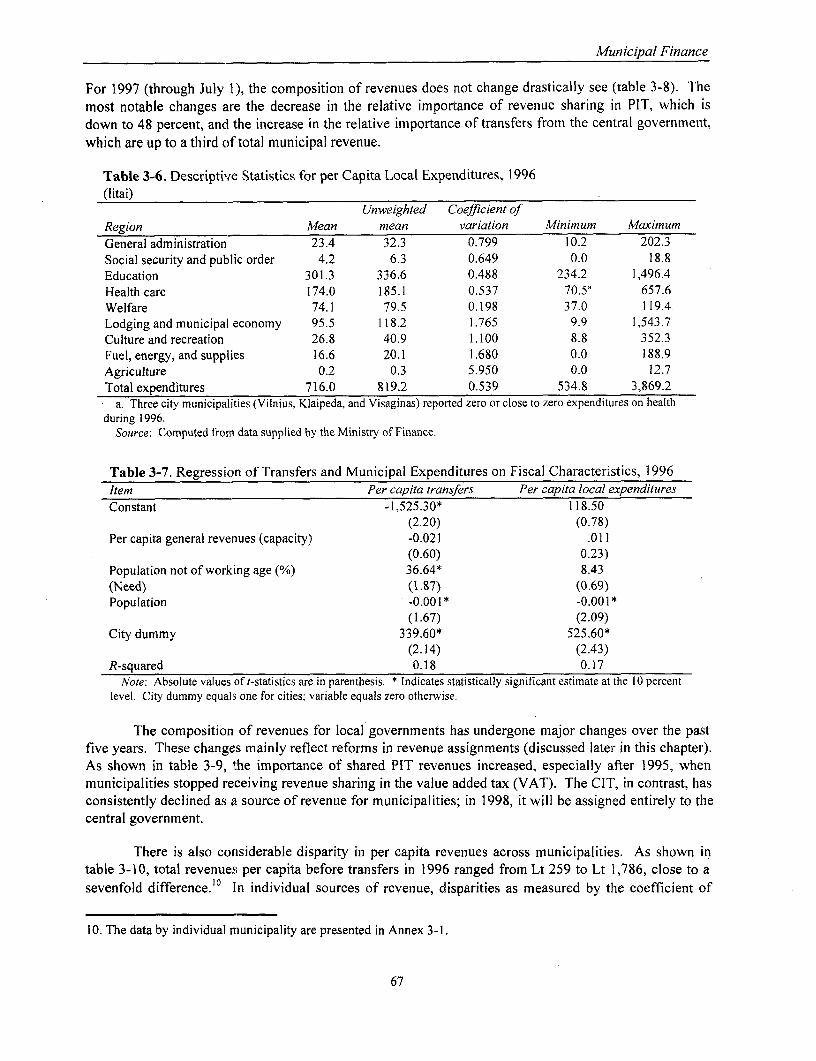
Municipal Finance
For 1997 (through July 1), the composition of revenues does not change drastically see (table 3-8). Themost notable changes are the decrease in the relative importance of revenue sharing in PIT, which isdown to 48 percent, and the increase in the relative importance of transfers from the central government,which are up to a third of total municipal revenue.
Table 3-6. Descriptive Statistics for per Capita Local Expenditures, 1996(litai)
Unweighted Coefficient ofRegion Mean mean variation Minimum MAaximumGeneral administration 23.4 32.3 0.799 10.2 202.3Social security and public order 4.2 6.3 0.649 0.0 18.8Education 301.3 336.6 0.488 234.2 1,496.4Health care 174.0 185.1 0.537 70.5a 657.6Welfare 74.1 79.5 0.198 37.0 119.4Lodging and municipal economy 95.5 118.2 1.765 9.9 1,543.7Culture and recreation 26.8 40.9 1.100 8.8 352.3Fuel, energy, and supplies 16.6 20.1 1.680 0.0 188.9Agriculture 0.2 0.3 5.950 0.0 12.7Total expenditures 716.0 819.2 0.539 534.8 3,869.2
a. Three city municipalities (Vilnius, Klaipeda, and Visaginas) reported zero or close to zero expenditures on healthduring 1996.
Source: Computed from data supplied by the Ministry of Finance.
Table 3-7. Regression of Transfers and Municipal Expenditures on Fiscal Characteristics, 1996Item Per capita transfers Per capita local expendituresConstant -1,525.30* 118.50
(2.20) (0.78)Per capita general revenues (capacity) -0.021 .011
(0.60) 0.23)Population not of working age (%) 36.64* 8.43(Need) (1.87) (0.69)Population -0.001 * -0.00°
(1.67) (2.09)City dummy 339.60* 525.60*
(2.14) (2.43)R-squared 0.18 0.17
Note: Absolute values of t-statistics are in parenthesis. * Indicates statistically significant estimate at the Io percentlevel. City dummy equals one for cities; variable equals zero otherwise.
The composition of revenues for local governments has undergone major changes over the pastfive years. These changes mainly reflect reforms in revenue assignments (discussed later in this chapter).As shown in table 3-9, the importance of shared PIT revenues increased, especially after 1995, whenmunicipalities stopped receiving revenue sharing in the value added tax (VAT). The CIT, in contrast, hasconsistently declined as a source of revenue for municipalities; in 1998, it will be assigned entirely to thecentral government.
There is also considerable disparity in per capita revenues across municipalities. As shown intable 3-10, total revenues per capita before transfers in 1996 ranged from Lt 259 to Lt 1,786, close to asevenfold difference.10 In individual sources of revenue, disparities as measured by the coefficient of
10. The data by individual municipality are presented in Annex 3-1.
67
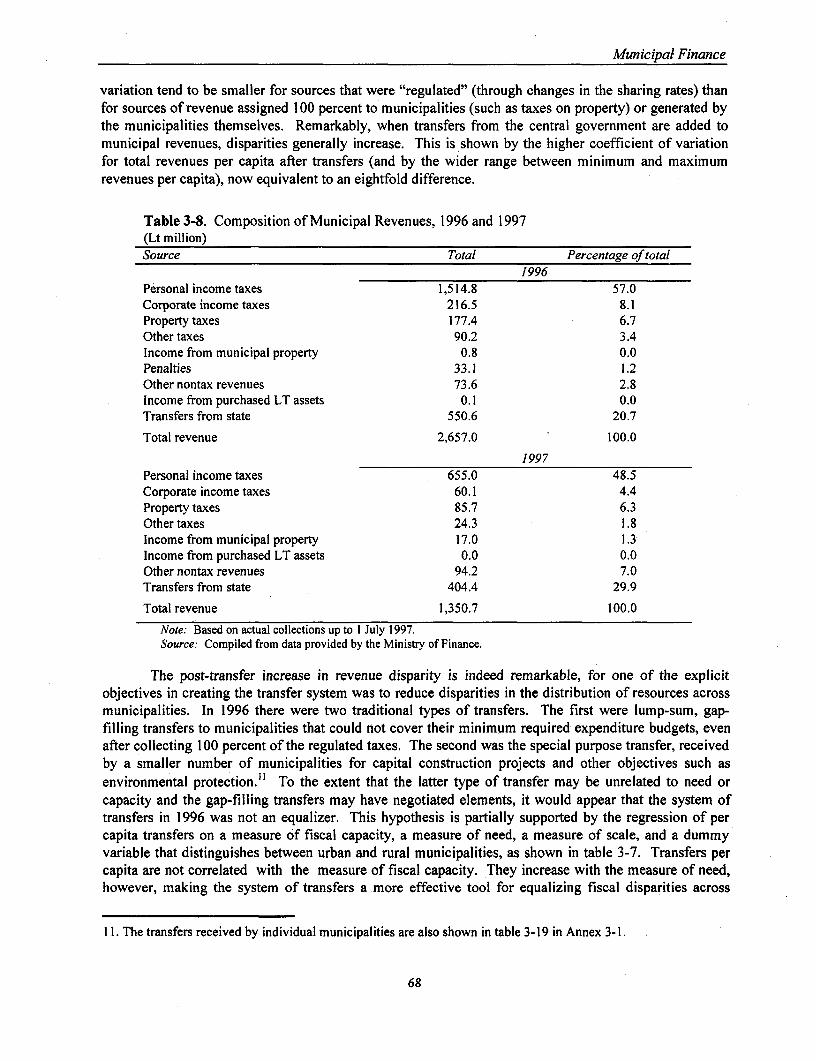
Municipal Finance
variation tend to be smaller for sources that were "regulated" (through changes in the sharing rates) thanfor sources of revenue assigned 100 percent to municipalities (such as taxes on property) or generated bythe municipalities themselves. Remarkably, when transfers from the central government are added tomunicipal revenues, disparities generally increase. This is shown by the higher coefficient of variationfor total revenues per capita after transfers (and by the wider range between minimum and maximumrevenues per capita), now equivalent to an eightfold difference.
Table 3-8. Composition of Municipal Revenues, 1996 and 1997(Lt million)Source Total Percentage of total
1996Personal income taxes 1,514.8 57.0Corporate income taxes 216.5 8.1Property taxes 177.4 6.7Other taxes 90.2 3.4Income from municipal property 0.8 0.0Penalties 33.1 1.2Other nontax revenues 73.6 2.8Income from purchased LT assets 0.1 0.0Transfers from state 550.6 20.7
Total revenue 2,657.0 100.0
1997Personal income taxes 655.0 48.5Corporate income taxes 60.1 4.4Property taxes 85.7 6.3Other taxes 24.3 1.8Income from municipal property 17.0 1.3Income from purchased LT assets 0.0 0.0Other nontax revenues 94.2 7.0Transfers from state 404.4 29.9
Total revenue 1,350.7 100.0
Note: Based on actual collections up to I July 1997.Source: Compiled from data provided by the Ministry of Finance.
The post-transfer increase in revenue disparity is indeed remarkable, for one of the explicitobjectives in creating the transfer system was to reduce disparities in the distribution of resources acrossmunicipalities. In 1996 there were two traditional types of transfers. The first were lump-sum, gap-filling transfers to municipalities that could not cover their minimum required expenditure budgets, evenafter collecting 100 percent of the regulated taxes. The second was the special purpose transfer, receivedby a smaller number of municipalities for capital construction projects and other objectives such asenvironmental protection." To the extent that the latter type of transfer may be unrelated to need orcapacity and the gap-filling transfers may have negotiated elements, it would appear that the system oftransfers in 1996 was not an equalizer. This hypothesis is partially supported by the regression of percapita transfers on a measure of fiscal capacity, a measure of need, a measure of scale, and a dummyvariable that distinguishes between urban and rural municipalities, as shown in table 3-7. Transfers percapita are not correlated with the measure of fiscal capacity. They increase with the measure of need,however, making the system of transfers a more effective tool for equalizing fiscal disparities across
11. The transfers received by individual municipalities are also shown in table 3-19 in Annex 3-1.
68

Municipal Finance
municipalities, which has been a main objective of the reforms introduced in 1997 that are discussedbelow.
Table 3-9. Sources of Municipal Revenues, 1992-97(percent of municipal revenues)Source 1992 1993 1994 1995 1996 1997aCorporate income tax (CIT) 20.6 18.2 16.4 15.2 10.7 6.3Land tax and other property taxes 1.4 3.3 2.9 8.7 8.8 9.1Fees and other b 10.7 9.4 10.1 6.7 5.0 15.4Personal income tax (PIT) 56.9 48.3 47.1 69.4 75.4 69.2VAT 10.4 20.8 23.5 0.0 0.0 0.0Total 100.0 100.0 100.0 100.0 100.0 100.0Note: For 1992-94, the table excludes revenues from local service fees collected by local governments, representing
2-5 percent of total municipal revenues.a. Based on collections through 1 July 1997.b. Court fees, car inspection fees, market fees, taxi licenses, alcohol licenses, fines, confiscations, and the like. From
1995, fees defined as "state fees" are a shared revenue source (30 percent to local governments).Source: Updated from World Bank, Municipal Finance Report (Washington, D.C., 1995), with data provided by the
Ministry of Finance.
Table 3-10. Descriptive Statistics for per Capita Local Revenues, 1996(litai)
Unweighted Coefficient ofSource Mean mean variation Minimum MaximumPIT 408.6 372.5 0.333 190.0 867.3CIT 58.4 57.9 0.798 13.8 223.5Property taxes 47.9 53.4 1.054 17.1 434.1Othertaxes 24.3 21.1 1.014 6.0 149.3Income from municipal property 0.2 0.3 3.909 -0.2 6.2Penalties 8.9 8.3 0.545 1.3 21.2Other nontax revenues 19.8 25.7 1.535 0.3 236.9Income from purchased LT assets 0.0 0.1 3.388 0.0 . 1.0Total revenues (before transfers) 568.2 539.0 0.439 259.9 1,786.2Transfers 148.5 283.0 1.154 0.0 2,243.3Total revenue 716.7 822.0 0.566 550.3 4,029.5Source: Computed from data supplied by the Ministry of Finance.
Assignment of Expenditure Responsibilities
The assignment of expenditure responsibilities has not changed significantly since it was reviewed in theWorld Bank's Lithuania: Municipal Finance Report (1995). This section focuses on some recentalterations. For the most part, the assignment of expenditure responsibilities between municipalities andthe central government in Lithuania obeys generally accepted principles. Local governments areresponsible for the provision of public services of direct benefit to local residents that have small, or no,benefit spillovers to residents of other municipalities (such as transportation, garbage collection and solidwaste disposal, and waiter and sewerage). The central government, in turn, is responsible for theprovision of services with nationwide benefits, such as national defense or public order and safety. Animportant exception in this area is district heating (DH), which was the responsibility of a state (centralgovernment) enterprise, but was decentralized to the municipal level (and ownership) in July 1997.Given the significance and complexity of the DH issues, this reform is discussed in a separate sectionbelow.
69
Municipal Finance
Municipal governments have also played a significant role in the provision of social services,including education, culture and recreation, health, and social welfare services. These functions havebeen shared with the central government and, not surprisingly, have been a source of confusion, in partbecause some of these functions have been declared as delegated (as opposed to devolved) from thecentral government, with the implication that the central government has retained the right to intervene,and it has done so through sectoral laws. This has been the case in education services, for example. Inother cases, such as health services, the murkiness in assignment of responsibilities has been rooted notonly in the concept of delegation, but also in the complexity of operating some facilities. In otherinstances, confusion in the assignment of responsibilities has not been in the delivery of the service, butin determining the level of government that is responsible for its actual financing, as has been the casewith some social welfare services.
A good way to understand the division of expenditure responsibilities is to examine actualexpenditures by function at the two levels of government. This differentiation is shown in table 3-11. In1996, municipalities accounted for over two-thirds of total expenditures on education, for 60 percent ofhealth services, for virtually all expenses in housing and community amenities, and for a third of socialwelfare services.'2 In contrast, municipal expenditures represented only 2 percent of nationalexpenditures on public order and safety.
Lithuania's division of expenditure responsibilities between the central and local governments isquite similar to that of the average OECD country, as shown in Annex table 3-28. Internationalexperience indicates that there is no absolute best blueprint for the assignment of expenditureresponsibilities. Countries with centralized regimes tend to have lower expenditures on education, andespecially on health, at the subnational level. The provision of health serviced through a separate,extrabudgetary fund at the central level, of course, also affects its relative importance in the local budgets.All OECD countries listed in table 3-28 (except Austria and the United States) also assign most housingexpenditures to the subnational level, as in Lithuania. In contrast, Lithuania assigns more welfareexpenditures at the local level than is the case in most OECD countries, where this redistributive functionis considered more the role of the central government. One important exception to this pattern isDenmark, where over 90 percent of welfare expenditures are disbursed through local budgets.
Revenue Assignments
Three stages are clearly identifiable in revenue assignment policy during the past seven years of transitionin Lithuania. The first stage was the revenue assignment contained in the Law on Budget Structure of1990. In this stage, the three major tax sources (VAT, PIT, and CIT) were shared with local governmentson a derivation basis (that is, taxes are shared with the community where they are actually "derived" orcollected) and generally at "regulated" (customized by municipality) rates. In the case of CIT, localgovernments were allowed to retain 100 percent of tax revenues from "municipal enterprises." Localgovernments also retained 100 percent of the revenues of taxes on property (which included the land tax,the land rental tax, and the enterprise assets tax). In addition, local governments were assigned a list offees and charges.
The second stage followed the amendment to the Law on Budget Structure in 1995. The mostimportant change was the assignment of all VAT revenues to the central government. Revenues fromPIT and CIT continued to be shared with local governments; in the case of CIT, distinctions were no
12. A further breakdown in the composition of these three services is shown in tables 3-15 to 3-17 in Annex 3- 1.
70

Municipal Finance
longer made between revenues from municipal enterprises and those from other contributors.
Table 3-11. Budget Expenditure by Function of Government in 1996
National Central government Municipalities Local as
Thousand Thousand Thousand percentagelitai Percent litai Percent litai Percent of national
Total expenditure 7,510,191 100.0 5,332,794 100.0 2,852,500 100.0 37.9
Expenditure on the economy 1,525,205 20.3 1,040,675 19.5 484,530 17.0 31.7Housing and community amenity
affairs and services 352,984 4.7 531 0.0 352,453 12.4 99.8Fuel and energy affairs and services 296,699 4.0 234,985 4.4 61,714 2.2 20.8Agriculture, forestry, fishing, and
veterinary affairs and services 631,695 8.4 631,594 11.8 101 0.0 0.0Mining (fuel excluded), manufacturing,
and construction affairs and services 31,401 0.4 31,401 0.6 - - -Transport and communication affairs
and services 168,170 2.2 98,525 1.8 69,645 2.4 41.4Other economic affairs and services 44,256 0.6 43,639 0.8 617 0.0 1.4
Expenditure on social affairs 3,821,972 50.9 1,685,832 31.6 2,136,140 74.9 55.9Education affairs and services 1,712,880 22.8 595,773 11.2 1,117,107 39.2 65.2Health care affairs and services 1,072,669 14.3 427,657 8.0 645,012 22.6 60.1Social security and welfare affaLrs and
services 746,299 9.9 471.775 8.8 274,524 9.6 36.8Recreational, cultural, and religious
affairs and services 290,124 3.9 190,627 3.6 99.497 3.5 34.3Expenditure on other functions of
government 2,163,014 28.8 2,606,287 48.9 231,830 8.1 10.7General public services 553,189 7.4 466,572 8.7 86,617 3.0 15.6National defense affairs and services 177,805 2.4 177,805 3.3 - - -Public order and safety affairs 829,744 11.0 814,258 15.3 15,486 0.5 1.8Expenditure not classified by major
group 602,276 8.0 1,147,652 21.5 129,727 4.5 21.5Source: Government Finances of the Republic of Lithuania, 1996.
The third stage started with the adoption of the Law for Establishing Municipal Budget Incomein July 1997. The major change in this law is that 100 percent of CIT revenues are now retained at thecentral level, and at the same time, revenues from the PIT are assigned to municipalities, with someimportant qualifications. According to the new law, tax revenues for the municipalities are:"3 (i) PITrevenues, after the contributions to the Compulsory Health Insurance Fund are subtracted;'4 (ii) land tax;(iii) rent for state land and water reservoirs; (iv) assets tax on enterprises and organizations; (v) the stampfee (based on the Law on the Stamp Fee); (vi) the trade outlet fee; (vii) estate tax (on inheritances and
13. This same assignment appears in the Law on Amendment of the Law on Budget Structure of July 1997.14. These contributions, stated as a percentage of collections in each municipality, are defined in the Law on Health
Insurance. In addition, as discussed below, municipalities with higher than average per capita PIT collectionswill have to make forced contributions to the new system of equalization transfers. The new law also makes itclear that the PIT remains a regulated tax, with a customized sharing rate to be established annually by theSeimas.
71

Municipal Finance
gifts); and (viii) other income from taxes as provided by law (at present, none).'5
A historical overview of the actual revenue sharing between the central and local governments isshown in table 3-12. Shared revenues from PIT have gained importance as the main financing source oflocal governments; this importance will increase even further in 1998 because CIT revenues are no longershared with municipalities. The second most important source of revenues is transfers.
Table 3-12. Municipal Share of National Revenues, 1992-961996 Revenues
Percentage of total revenues (million litai)Revenue source 1992 1993 1994 1995 1996 National MunicipalPersonal income tax (PIT) 80 66 53 74 73 2,087 1,514Corporate income tax (CIT) 25 24 39 50 37 587 216VAT 10 20 26 - - 2,280 -Excise taxes and customs - - - - - 836 -
Other tax and nontax revenue 10 11 13 10 11 3,497 377"Subsidies" and other support 15 7 27 37 26 - 550Total 46 42 47 32 29 9,287 2,657
Source: Updated from World Bank, Lithuania Municipal Finance Report (Washington, D.C., 1995).
Transfers
Over the past five years, the system of transfers from the central to the local governments has beensimple, and had not changed much from the methodology used in the Soviet Union. The main form oftransfer has been the gap-filling lump-sum transfer to local governments that are unable to finance theminimum expenditure budget, as determined by the Ministry of Finance, through their own and sharedrevenue.'6 Conceptually, these transfers have been used as fiscal equalization tools in support of theequalization already undertaken through the regulated rates for shared taxes. To the extent that theminimum required budget was formulated in a nontransparent and, at times, negotiated fashion, the gap-filling transfers have also been nontransparent. As the regression analysis of table 3-7 showed, it is alsoquestionable whether or not the end result of the transfers was truly equalizing.
The gap-filling transfers were complemented by transfers for capital investment purposes, anecho of the previous regime, which viewed all capital investment in public infrastructure as theresponsibility of the highest level of government. In recent years, capital transfers have taken the form oftransfers to the municipal budgets for single investment projects overLt 5 million, individually approvedby the Seimas, and for several central government programs (such as land development or environmentalprotection). These are categorical grants, and the municipalities have little or no discretion in their use.The system of transfers for equalization purposes has recently been completely overhauled by the Law ofEstablishing Municipal Budget Income. (The new system is discussed below: "Key Medium-TermPolicy Issues.")
15. The new law also lists nontax revenue sources for municipalities as: (i) local levies and fees (in accordance withthe Law on Local Levies), (ii) penalties and income from confiscated assets, (iii) income from municipal assets,(iv) income from municipal enterprises, and (v) other incomes. Both tax and nontax revenues are supposed tobe transferred directly to the municipal budgets by the State Tax Inspectorate.
16. The budgeting process and the concept of the minimum expenditure budget are discussed below.
72
Municipal Finance
Borrowing
The current legal framework for municipal borrowing is ambiguous."' The Local Government Law(article 15) regulates the use of bank credit. There are no explicit limits on the level of borrowing,however, nor are there provisions for bankrupt and nonpaying local governments, collateral provisions topermit escrowing of revenue streams, or the pledging of municipal assets to guarantee repayment ofloans.'8 Some observers have argued that municipal borrowing is prohibited by article 27 of the Law onBudget Formation, which states that municipal budgets must be balanced. Finally, the new Law forEstablishing Municipal Budget Income (article 8) states that municipalities have the right to borrow"according to the procedures and conditions established by the government." But none has yet beenissued.
The new law also stipulates that the central government can issue loans in the event of atemporary shortage in municipal budgets. This practice is already in place: the central government hasprovided bridge financing at zero interest to municipalities for liquidity management purposes.'9 Otherthan these short-term loans, there has been little borrowing. No municipality appears to have issuedbonds, and there are no prospects for such activity anytime soon. Borrowing from commercial banks istaking place, but on a small scale. Banks have been less than eager to lend because of the lack ofcollateral and the inability of most municipalities to pay their arrears to state entities and suppliers.Examples of bank borrowing are provided by the city of Vilnius, which was granted loans by the StateCommercial Bank ancl the Agricultural Bank (two state-controlled banks) for a total of less than Lt 20million in 1997 (see Annex table 3-18). The City of Kaunas also recently borrowed Lt 3 million forparking meters from a commercial bank at 10 percent annual interest; all revenues from parking in thecity commercial district were escrowed to the.repayment of this loan.
Key Medium-Term Policy Issues
Structure of Decentralized Governments
The current vertical goDvernment structure of two levels, central government and municipalities, and tendeconcentrated administrative units within the central government, appears to fit the needs and size ofLithuania, and it seems to be a settled issue. What is not settled is the composition of local governments,particularly by the nurnber of municipalities. The Seimas has passed a resolution providing for a secondphase of territorial administration reform that calls for the preparation and approval of criteria andprocedures for the establishment of new municipalities.2 0 This process of enlargement is envisioned to
17. Issues in municipal borrowing are discussed in more detail in C. Bareikien and V. Sukys, "On the Possibilitiesof the Use of Credit and Loans by Local Government Institutions" (Proceedings from the National Seminar onFiscal Decentralization in Lithuania [FDI-CEE], Vilnius, May 1966); and T. H. Cochran, "Building a HardCredit Culture with Lithuanian Local Authorities and Municipal Enterprises" (New York: The Institute of PublicAdministration for the Lithuania Municipal Development Project, for The World Bank, May 1997).
18. See Cochran, "Building a Hard Credit Culture."19. For example, Vilnius and Kaunas recently borrowed from the Ministry of Finance to pay teachers' salaries
during the summer vacation.20. The legal framework through 1996 is reviewed in N. Puteikis, "Report on the System of Local Self-Government
in Lithuania" (paper presented in the National Seminar on Fiscal Decentralization in Lithuania [FDI-CEEJ,Vilnius, I May 1996).
73

Municipal Finance
take place over time; the target number of municipalities mentioned varies from 80 to 112.21 There isinterest in the Seimas in increasing political representation, through further fragmentation among ruralmunicipalities, but the executive branch has decided to move slowly in this area. This is probably theright approach, one that will provide stability and continuity.
Whatever final number of municipalities is agreed upon, Lithuania will face major municipalfinance issues over the next three years. If unattended, these issues could have serious repercussions onthe country's macroeconomic framework. These issues are addressed below.
Expenditure Assignments
Several events in the recent past have helped make the assignment of expenditure responsibilities lessconvoluted in Lithuania's system of decentralized government. First, the provision of all health servicesbecame the exclusive responsibility of the national Health Insurance Institute in July of 1997.22 Thedecentralization of district heating (DH) services to the municipalities is also a step in the right direction.These services, of such a clear local benefit, had been misassigned by the central government. Further,the passage of time and increased practice have begun to lessen the responsibility-assignment confusionof earlier years.
Yet, important problems remain in the assignment of expenditure responsibilities. The mostcritical among them is the determination of capital investment responsibilities for local services,especially in light of the vast needs for infrastructure investment at the local level (in turn, arising fromlack of maintenance or new undertakings during the past five years).23 Policy in this area is less thanclear. Municipalities are, in principle, responsible for all the capital investment necessary for the servicesassigned to them. This is theoretically the right approach, but the central government is responsible forall capital investments above Lt 5 million.
These contradictory policies are largely the result of compromise forced by the lack of developedcredit markets or institutions that would allow municipalities to borrow for long-term investments. Inother words, this is a problem of a lack of credit, not a lack of revenue autonomy. Although revenueautonomy at the local level is a desirable feature in its own right, as emphasized throughout this note,revenue autonomy is not necessary for local governments to be able to borrow or invest in infrastructure.The ability of a municipality to repay a loan is enhanced by autonomous sources of revenue, althoughmunicipalities can certainly use funds from general revenue sharing and lump-sum transfers to repay anyloans. Thus, the solution to the problem of capital investment responsibilities hinges on the solution tothe issue of borrowing at the local level. (This issue is addressed separately in this Policy Note.)
A second issue that will require attention in the assignment of expenditure responsibilities is thatof unfunded government mandates. Unfunded mandates from the central government are a commonproblem in all decentralized systems of government, and Lithuania is no exception. In principle,Lithuania's Law on Local Self-Government offers the right solution. It states that municipal functionsdelegated by the state shall be financed by special transfers form the state budget to the municipalities.Delegated functions currently include civil registry, registry of enterprises and organizations, and
21. The administrative reform of 1994 had two versions, one with 56 municipalities and the other with 1 12.22. During the transition, some large municipalities may still have obligations for the maintenance of hospitals.23. See the World Bank, Lithuania: Public Expenditure Review (March 1994); and Lithuania: Municipal Finance
Report (April 1995).
74

Municipal Finance
management of state parks. Other functions, such as public order, civil safety, and fire protection alsoappear to be on the list of delegated functions. The new Law on Municipal Budget Income (article 16)rules out unfunded mandates from the central government to the municipalities. What is needed isadherence to the principle of explicit compensation for mandates as a matter of practice for all mandates.
The Decentralization of District Heating
The government decentralized the ownership and responsibility for DH to municipalities in July 1997.Prior to that change, [H was the responsibility of the Lithuanian Power Company (LPC), which operatedsix regional DH networks located in large municipalities.24 Smaller municipalities managed their ownDH facilities, in some cases inherited from bankrupt enterprises and collective farms. There are alsostate-owned enterprises with their own boilers, which provide heating for adjacent buildings.25 Thecoverage of DH varies across areas and is, of course, less prominent in rural areas or areas with single,detached homes as opposed to high-rise buildings.
The DH operations of LPC and those of municipalities were subsidized by the centralgovernment. Tariffs for DH were controlled, and direct subsidies to the producers covered about half ofthe operating costs of the companies.
The decentralization of DH has broken up the former LPC operation into six new companies.These will be owned jointly by several municipalities. but in most cases it is expected that the largestmunicipality in the area will play a dominant role in running the company.26 Smaller municipalities willcontinue their own DH operations. As part of the reform, tariffs will be set by a newly created EnergyPricing Commission (EPC), and the understanding is that the new tariffs will allow full cost recovery forthe new DH companies. The DH operations of the smaller municipalities will not be forced to use EPC-set tariffs. As part of the reform in DH, the government will discontinue direct subsidies to producers; itis planning to introduce a means-tested cash subsidy program for low-income households in its place.
Municipalities have inherited a trouble-filled service that has been plagued by low tariffs, lowcollection rates, obsolete and outmoded physical infrastructure, significant operating losses, and debt.The transfer of responsibilities for DH to municipalities under these conditions could be interpreted as amaneuver to transfer tlhe financial imbalance from the central to the local level; the DH subsector was themain drain of resources for LPC in the recent past. It is clear that simply transferring ownership of assetsand responsibility for provision of DH to the municipalities should not lead to any changes in the bottomline. Without further changes, the financial shortfall that has plagued the LPC could continue to troublethe municipalities. The fundamental question for the future is whether or not current plans are sufficientto avert the problems of the past.
On the plus side, decentralization could lead to improved management and organization,including improved cost recovery for services rendered. On the minus side, the list is much longer. Costrecovery continues to be uncertain. The general goal is to set tariffs at cost recovery, but the highertariffs may also lead to many more customers not paying their bills. The threat to cut off heating tononpayers at times may not be credible because of the adverse impact it would have to other users in the
24. These are Vilnius, Kaunas, Klaipeda, Siauliai, Panevezys, and Alytus.25. In most cases, these enterprises are eager to divest this responsibility.26. The number of new companies in the breakup of LPC is determined by the technical requirements of the
existing distribution retworks.
75

Municipal Finance
building. The main problem with the new cost recovery strategy is the lack of metering for heating.27 Inthe past, LPC had the leverage of threatening to cut off electricity to individual nonpayers of heatingbills, because electricity was metered, but municipalities will not have this power.
Other changes introduced in the system may also make things more difficult for municipalities.A means-tested cash subsidy is, on balance, the most desirable way to address the problem of the impactof higher tariff rates on low-income households. It will give them not only the means to pay the higherbills but also an incentive to conserve energy and to introduce energy-efficient renovations. The fearamong municipalities is that poor recipient households will use the money for other, more immediate,needs, such as buying food, and will not pay the DH bills.
A further threat to the municipal DH companies is that as tariffs rise, the customers that are moreable to pay will be, at least marginally, converting to alternative sources of heating (natural gas andelectric heating). To the extent that this happens, the municipal DH companies may get into a viciouscycle of higher per customer costs that will require higher tariffs, which in turn will induce moreconversion to alternative modes of heating. This would leave municipal companies primarily withcustomers who can neither switch to alternate modes nor pay.
There are other institutional issues that will affect the performance and viability of the newmunicipal DH companies. First, the role of EPC in setting tariffs and standards needs to be clarified.Second, it is unclear what level of government (municipalities or central) will be ultimately responsiblefor covering operating deficits arising from low-income or other nonpaying customers. Municipalofficials appear to believe that this will be a responsibility taken over by the central government. Finally,there will be an immediate need for new capital investment and rehabilitation of the infrastructure of thenew DH companies, but it is less than certain where this financing will originate.28
Remaining Issues ofRevenue Assignment
The evolution of revenue assignments in Lithuania has both positive and negative features. On thepositive side, revenue sharing has been restricted to revenues that are most easily shared on a derivationbasis. Retaining 100 percent of VAT revenues at the national level has been the right policy decision.VAT is debited and credited throughout the nation, and it is difficult, if not impossible, to identify howmuch tax is actually generated in a single local jurisdiction. Similarly, the apportionment of CITrevenues gets complicated when enterprises have economic activity in several jurisdictions.2 9 PIT andproperty taxes are, in theory, the best taxes to share with local governments, if taxes are to be shared.The tax bases of the property tax and PIT are the least mobile, they are unlikely to lead to tax exporting,and they establish a link with those directly benefiting from municipal services. An added positive effectof the evolution in Lithuania's revenue sharing arrangements is that the tax bases for PIT and propertytaxes are less volatile in relation to changes in economic activity than those for CIT and VAT. If sharingrates are kept stable in the future, the current choice of sharable taxes should provide greater revenue
27. The problem is less acute for the distribution of hot and cold water, for which there is almost 100 percentmetering.
28. A nonexhaustive list of other issues that have not been resolved includes adequate corporate governanceinstitutions for the new companies, appropriate incentives to managers, and means to retain the advantage of thecentralized purchase of heating oil.
29. The apportionment of CIT revenues is implemented in other countries through the use of formulas based on theshare of the sales, labor, and/or property of enterprises in each jurisdiction.
76
Municipal Finance
stability and certainty for municipal governments. This is significant, given the dearth of both in recentyears.
On the negative side, the evolution of revenue assignments in Lithuania has not provided anysignificant degree of revenue autonomy to local governments.3 0 As argued elsewhere in this note, theability of local governments to raise their own revenues in some marginal but significant amount is afundamental pillar of a well-developed system of decentralized government. With very few exceptions,the structure of subnational government revenues in OECD countries shows that from one-third to two-thirds of these revenues come from taxes assigned to local governments (Annex table 3-25). Dependingon whether or not property taxes are counted as local taxes, the share of own-taxes in Lithuania's localgovernment revenues is between 3 and 10 percent.31
Another negative feature of revenue assignments in Lithuania has been the lack of certainty that ithas generated for local governments, something that has contributed to poor planning and inefficienciesin public expenditures at the local level. Although the scope for uncertainty decreased after revenuesharing was restricted to PIT revenues, the reform of July 1997 failed to provide a fixed sharing rate tomunicipalities that was stable over time because, as pointed out earlier, the Seimas has retained the rightto determine the annual PIT sharing rates. In addition, the Seimas is to legislate the fixed share of the PITcollected in each municipality that will go to finance the new Health Insurance Fund.32
The New System of Transfers
The system of transfers has been the subject of a far-reaching reform in the Law for EstablishingMunicipal Budget Income of July 1997. This law introduces a system of formula-driven transfers forequalization purposes. It also lists other transfers from the central government, including (i) transfersfor capital investments in municipalities as provided in the Public Investment Programs; (ii) transfers forcompensation for restitution of houses and apartments to former owners; (iii) transfers for the purchaseof housing for returning Lithuanian political prisoners and exiles; and (iv) transfers for housing.
Missing in the new system of transfers are conditional grants that would allow the centralgovernment to pursue or encourage municipal expenditure in areas of national priority or importance, orin areas that exhibit significant externalities across municipalities. Perhaps this omission is linked to the
.lack of tax autonomy at the local level. Local governments, however, have considerable discretion in thespending of shared tax revenues and general transfers, and thus a matching grant program could be
30. Local governments have the freedom to impose local fees and charges, but these cannot generate significantamounts of revenue. Municipalities also have some degree of discretion, but only to lower their revenues eitherby reducing the rate of the land tax from its maximum statutory rate of 4 percent or by granting tax holidays tolocal enterprises for revenues shared by the municipality. Ironically, this latter is a form of discretion thatshould be discouraged or limited.
31. PIT, shared at 100 percent with the municipalities, is not considered a local, own-tax. PIT remains a centralgovernment tax, since local governments have no discretion over the rate or any other aspect of the tax. Strictlyspeaking, shared taxes are a form of government transfer.
32. Although it may have been politically expedient, financing the Health Insurance Fund with earmarked revenuesfrom PIT retained at the local level is a complicated and nontransparent arrangement with little or no economiclogic. It is not good budgetary practice to earmark tax revenues for any particular kind of expenditure program,unless there is an explicit linkage between payments and services, as may be the case, for example, betweensocial security contributions and pension payments. No such connection exists between personal income taxand national health insurance benefits.
77

Municipal Finance
effective in the future, even if no revenue autonomy is granted. It is quite common for centralgovernments to use conditional grants, often with matching arrangements, to encourage and channelsubnational government expenditures into priority areas. It has also become more common for nations touse formulas for the distribution of transfers for equalization purposes. The degree of sophistication andeffectiveness of these formulas varies significantly. The reforms of 1997 for equalization transfers putLithuania ahead of many other countries in transition.
Nevertheless, the new system of equalization transfers for Lithuania's municipalities introducedin the Law for Establishing Municipal Budget Income of July 1997 is complex. In order to understand itsproperties and how it may be further improved, we examine the steps in the formulas in detail in thefollowing paragraphs and use the mathematical notation employed in the law. (A detailed examination isalso justified because the formulas are new, and they have not been explained elsewhere.)
The first step is the determination of the total pool of funds to be distributed as grants or as an"overall state budget grant." The pool of funds (D) is calculated according to the following formula:
D=A -B-C
where A is the forecast level of expenditures for all municipalities for the planned year, B is the forecastof total revenues from tax and nontax sources for all municipalities, and C is the total amount of specificgrants from the central government to the municipalities for the planned year.
Two important rules are employed that tend to minimize the perverse impact of this gap-fillingapproach on incentives. First, rather than using the normative approach of the past, the forecastedamount of expenditures for the entirety of municipal budgets is politically determined (in a dialogueamong the central government, the Seimas, and the Association of Municipalities) as a percentage shareof total expenditures of the national budget. Also important in minimizing the perverse incentive effectson revenue collection efforts by the municipalities, the level of nontax revenues is determined as a fixedpercentage share of the tax-income forecast for all municipalities.
The overall pool of transfer funds (D) is subdivided into three subfunds and distributed throughthree separate windows: (a) "Reserves for Extraordinary Events" (DI); (b) "Equalization of TaxRevenues" (D2); and (c) "Equalization of Expenditure Needs" (D3).
FIRST WINDOW: RESERVES FOR EXTRAORDINARY EVENTS. The total size of Dl is determinedpolitically at budget time as a percentage share of the overall pool of transfer funds (D). The purpose ofthis window is to help municipalities with realized or actual tax revenues that fall below the forecast forthe budget year. The grant, therefore, is given toward the end of the current fiscal year. DI isapportioned according to the relative claim of each municipality in the group, calculated as the fraction ofthe municipality shortfall to the shortfall of all municipalities.3 3
To avoid free-riding by municipalities, the figure for actual revenues is augmented by the forgonerevenues implied by the tax exemptions and special treatments granted by the municipal council. Thisfirst window presents two problems, however. First, how will forecasted revenues be defined, and bywhom? Second, transfers are still aimed at filling a gap ex-post, and thus lower the incentive of
33. Thus, for each municipality (i) with a shortfall, the amount of funds received from the first window, Dl i, is: Dl i= Dl * (xif- xi) / I(xjf- xj), where xi is actual and xif forecast tax income in municipality i, and Y(xjf- xj) is thesummation of shortfalls across all municipalities.
78
Municipal Finance
municipalities to collect their own revenues.
SECOND WINDOW: EQUALIZATION OF TAX REVENUES. Again, the total size of D2 is determinedpolitically at budget time as a percentage of the overall pool of funds, D. The goal of this window is tobring municipalities with per capita forecast tax revenues below the national average closer to theaverage. The gap between the municipality's forecast per capita tax revenues (pcxyA and the nationalaverage forecast per capita tax revenues for all municipalities (PCX) is closed only by a given percentage(H). The actual number of qualifying municipalities under the second window can also be adjusted bymeans of a scaling coefficient (K) for the national average per capita tax revenues:.3 Note that as Kdecreases from a value of one down, the number of municipalities qualifying for a transfer willdecrease.35
The perverse incentive to collect less revenue is addressed in this window by using forecastrevenues rather than actual revenues.36 This still poses the problem of how forecast revenues will bedetermined, and by whom. In theory, these forecasts will be carried out by the Ministry of Finance. Ifthe forecasts are based on past collections, the mechanism may not be time-consistent becausemunicipalities may affect the forecast for next year with collection efforts in the current year.
THIRD WINDOW: EQUALIZATION OF EXPENDITURE NEEDS. The goal of this window is toaccount for expenditure needs beyond the direct control of the municipalities. The total level of fundsavailable for this window (D4) comes from two sources-that is, D4 = D3 + P. The first component(D3) is the funds left over from the partitioning of D to the first two windows; thus D3 = D - DI - D2.The second component (P) is formed by mandatory contributions from PIT collections frommunicipalities with forecast per capita collections (pcyij) that are higher than the national average for allforecast per capita collections of municipalities (PCI). This is a "fraternal system," also known as a"Robin Hood" system of funding, which is used by most Scandinavian and some central Europeancountries. The contributions from better-off municipalities are automatically computed by the State TaxInspectorate and deposited directly in the State Treasury Account. As in the case of the second window,only a share (h) (note that this differs from parameterH) of the difference between the municipality's percapita collections and the national average is actually contributed to the fund. In addition, the nationalaverage figure (Y) used in the formula can be adjusted by a scaling coefficient (k) (note that this differsfrom parameter K) that affects the number of municipalities that will be contributing to the fraternalfund.3"
The overall funds in the third window (D4) are allocated to the municipalities according to a
34. The claim to D2 for a qualifying municipality is given by the formula: d2i = Gi * H * (K * PCX- pcxif), whereGi is the population of mnunicipality i.
35. Even though the "next step" is not clearly stated in the text of the law translation, the actual amount of the grantreceived by a qualifying municipality in the second window should be D2i = D2 * (d2i / Y:d2j). Actually,article 12 of the law calls the expression for d2i in the previous footnote the share of the grant allocated to amunicipality. This formula as stated in the law, however, does not guarantee that when all shares are added, thetotal will be equal to the amount available (D2). The "next step" we discuss in this footnote should beincorporated in the law.
36. Conventionally, equalization formulas use a measure of fiscal capacity (tax bases) rather than actual revenues toavoid the problem of perverse incentives toward tax effort.
37. The complete formula for the determination of Pi is: Pi= Gi * h * [pCy - (k * PCY)], where, as before, Gi isthe population in the ith municipality, and the total transfer fund is: P = Pi.
79
Municipal Finance
relative measure of need based on three demographic variables that are determined for each 1,000inhabitants. The demographic variables are number of children under eighteen years of age, denoted by(rl); number of disabled persons, denoted by (r2); and number of pension-age persons, denoted by (r3).
The amount of transfer actually received by a municipality from the third window is given by theformula:
D4i = D4 * Ei
where Ei is the demographic index for the ith municipality, computed as the ratio of the weighted averageof needs in the ith municipality to the sum of weighted average needs for all municipalities.38
The formalization of the third window includes a flaw: it does not take into account the relativesize of the population in a municipality in relation to the rest of the country. As a result, smallmunicipalities may receive larger need-based transfers than much larger municipalities. For example,while Vilnius is 200 times more populous than Neringa, the latter municipality may receive a largeramount of need-based transfers under the third window. The culprit here is the way the demographicfactors (rb, i = 1, 2, 3) are defined by 1,000 inhabitants. For example, if Neringa has twice as manychildren (and the other demographic variables) per 1,000 inhabitants as Vilnius, it tends to receive twiceas much in transfers from the third window. There are several simple ways to correct this problem. Twopossible methods are described in the simulations of the new system of transfers in Annex 3-3, in whichthe demographic factors (rb, i = 1, 2, 3) are defined as type of population in a municipality in relation tothe nation as a whole.
The flaw in the population scale has important consequences for the actual distribution ofmunicipal revenues. Summary statistics are shown in Annex table 3-24 for the distribution of municipalrevenues that would result from several simulations. The table also presents summary statistics for thedistribution of (forecast) revenues for 1997 before the transfers and the distribution of actual revenues for1996. The disparities in the distribution of municipal revenues, measured by the coefficient of variation,is larger for the simulation with a literal application of the text of the law (Municipal Budget Income)than for the distribution before the equalization transfers or the distribution for 1996. Changing themethodology to take the scale of population into account produces distributions of municipal revenuesthat show considerably smaller disparities.
The simulations presented in Annex table 3-24 also sound a cautionary note about thecomputation of the fratemal reserve fund. The size of the municipalities' payments into the fund isdetermined by two parameters, h and k. As explained above, parameter k determines how "wealthy"municipalities must be, as determined by PIT collections, in order to pay into the fund. Parameterh
38. The formula is given by:
Ei = E Mr(ri- min.rj) / E E Mr(ri- min.rj)i j i
where Mr is the weight attached in the formula to each of the three demographic variables (ri, i = 1, 2, 3).Note that while the numerator of the formula is added across the three weighted demographic components forone municipality, i, the denominator of the formula is added across the three weighted components and for allmunicipalities. Only if a single municipality has the minimum figure for all three variables would it fail toreceive any transfer from the third window. In any other case, the municipality will get a positive amount.
80
Municipal Finance
determines the share of "excess revenues" (per capita revenues minus k* per capita average revenues)that municipalities must pay into the fund. The extent of equalization is extremely sensitive to the levelof these parameters. Our simulations show that increasing h from 0.5 to 1.0 reduces the coefficient ofvariation in the distribution of revenues tenfold.
SETTING AND APPROVAL OF TRANSFER FORMULA PARAMETERS. The Law on the Methodologyfor Establishing Municipal Income distinguishes between two sets of parameters, depending on whetherthey are set for a period of three years or set every year in the annual budget. The list of parameters,which was negotiated by the Ministry of Finance, the Ministry of Municipal Affairs, and the LithuanianAssociation of Municipalities, and eventually approved by Seimas, includes: (i) the share of consolidatedmunicipal budget expenditures in total national budget expenditures; (ii) the fixed share of municipalnontax income as a percentage of municipal tax income; (iii) the gap coefficient (H) in the secondwindow; (iv) the adjustrnent coefficient (K) in the second window; (v) the gap coefficient (h) in the thirdwindow; (vi) the adjustment coefficient (k) in the third window; and (vii) the weights (Mr) for thedemographic variables in the third window.
The list of parameters set in the budget each year includes: (i) the share of the total pool oftransfer funds from the central government budget (D) destined for the second window for equalization oftax revenues (D2); (ii) the share of the total pool of transfer funds from the central government budget(D) destined for the third window for equalization of expenditure needs; and (iii) the specialized ortargeted grants.
It should be noted that these provisions appear to contradict earlier elements in the law, whichstated that grant funding for the third window (equalization of expenditure needs), or D3, is to becomputed as a residual from overall funding (or the "overall state budget grant"), minus the funding forthe first and second windows, or D3 = D - DI - D2. With respect to the first window, the law states thatafter three-quarters of the budgetary year have passed, the Seimas will establish the sum of funds for thefirst window for "Reserves for Extraordinary Events" (Dl). This creates a timing problem and isprobably the cause of the inconsistency in the text of the law regarding the determination of D3.
The distinction between parameters determined for a period of three years and those set annuallyis a positive step toward more predictability and stability in municipal revenues. The magnitudes of theequalization transfers (D, DI, D2, and D3), however, will vary annually. Given that the revenue sharingrates for PIT could also vary annually, as will targeted grants, only modest progress has been made in theLaw for Establishing Municipal Budget Income to provide municipalities with more predictable sourcesof revenue. At the least, the shares dividing the annual pool of funds (or "overall state budget grant") intothe three different windows could also be fixed for a period of three years. The same should be done forthe municipalities' sharing rates in PIT.
Borrowing Issues
The municipalities' inability to engage in long-term borrowing in any significant amount is a criticalissue, given the vast needl for capital infrastructure investment at the local level. Furthermore, borrowingis the right way to finance long-lived infrastructure. It addresses the otherwise impossible liquidityproblems of financing investments out of current savings and it distributes the payment for infrastructureservices among the generations of taxpayers that will benefit from them. The government needs to issueregulations and limits for municipal borrowing and to facilitate the development of commercial credit formunicipalities. (Some specific options are discussed in the Policy Recommendations section.)
81

Municipal Finance
Budgeting Process at the Municipal Level
Although generally not discussed under intergovernmental relations, the existence of proper budgetaryinstitutions is central to effective decentralization. The realization of the benefits of decentralization-increasing the efficiency of public expenditures by making government more responsive and accountableto the needs and preferences of taxpayers-is impossible without budgetary autonomy and good budgetpractices. Because of the length and complexity of budget process issues at the local level in Lithuania,these issues are addressed separately in Annex 3-2.
Policy Recommendations
REFORM THE NUMBER OF LoCAL GOVERNMENTS. There appears to be room in the future forincreasing the current number of municipalities to enjoy the benefits of increased representation andaccountability without sacrificing the principle of a minimum desired scale.39 Although the minimumscale for some services should remain a concern, the administrative costs of a larger number ofmunicipalities will probably represent a minimum amount. As shown in table 3-13, administrativeexpenditures as a percentage of total local expenditures have remained almost the same throughout thetransition period. Ironically, it rose slightly only after the administrative reform of 1994 that consolidated-all local governments into only fifty-six municipalities. If new municipalities are created, the benefitsfrom economies of scale in some services should be preserved through the arrangement of specialdistricts or the creation of companies that provide services to several municipalities. This is the approachnow being followed in the decentralization of DH, and it should be imitated for other services withsignificant economies of scale in production, such as water or sewerage treatment plants.
Table 3-13. Lithuania: Administrative Expenditures as a Share of the Municipal Budget, 1992-97(Lt million)
Administrative AdministrativeAdministrative Total municipal expenditures as expenditures as
Year expenditures budget percentage of total percentage of GDP1992 9.7 369.3 2.6 0.31993 26.1 1,097.9 2.4 0.21994 46.6 1,857.9 2.5 0.21995 59.7 2,253.7 2.7 0.21996 86.6 2,654.5 3.3 0.21997a 47.3 1,349.6 3.5 n.a.
n.a. Not available.a. Based on actual expenditures through I July 1997.Source: Ministry of Finance.
CLARIFY THE ASSIGNMENT OF CAPITAL EXPENDITURE RESPONSIBILITIES. Current policy on the
assignment of capital expenditure is inadequate. Municipalities are theoretically responsible for allcapital infrastructure for the public services assigned to them, but at the same time, the centralgovernment has become responsible for all public investment in infrastructure projects with costs overLt 5 million. International practice varies with respect to the level of involvement of central governmentsin the provision of capital infrastructure at the subnational level. From a first-best, theoretical viewpoint,the principle of assigning responsibility for infrastructure to local governments is the right one.
39. A chief objective of the 1994 administrative reform was to reach a minimum size of municipalities of 10,000inhabitants to realize economies of scale. There are currently only nine municipalities with populations under30,000.
82

Municipal Finance
Maintenance, operation, and capital investment for infrastructure should all be assigned to the level ofgovernment that is responsible for the delivery of the public service involved. Assigning responsibilityfor operation to one level of government and capital investment to another tends to lead to a lack ofmaintenance and inefficient investment choices.
From a practical viewpoint, direct involvement of the central government in the provisionofcapital infrastructure at the subnational level may be needed when local governments do not have thefinancial means to invest in infrastructure. This is the case in developing and transitional countries withincomplete credit markets and weak intergovernmental finance systems. Although direct involvement ofthe central government may be temporarily justified in Lithuania, it also carries risks. The dichotomybetween operation and investment has often been singled out as the main cause for the poor state ofcapital infrastructure in the former Soviet Union. At the same time, indirect involvement of nationalgovernments through matching grants or similar arrangements is quite common interinationially, and it isalso desirable in light of interjurisdictional externalities and equity considerations.
In the medium term, as sources of credit are developed for long-term borrowing bymunicipalities, the central government should have the option of phasing out the current policy offinancing projects over Lt 5 million and let municipalities take charge of these responsibilities. Inaddition, the funds currently used at the central government level for projects over Lt 5 million could beused for conditional or categorical grants from the central government in support of well-developedpolicies of national relevance or with significant externalities, as is the case now for drainage projects forland development, wastewater treatment, and other environmental purposes. The funds could also beused to provide partial financial support to poorer municipalities or to capitalize a municipal creditfacility, as discussed below.
PUT DECENTRALIZED DH COMPANIES ON A FINANCIALLY SUSTAINABLE PATH. To strengthenthe viability of the new DH companies, the government should take several measures. Foremost is theissue of metering, which must be dealt with up front. Postponing the introduction of metering savesmuch-needed resources in a sector that faces considerable demands for capital infrastructure renovations,but international experience clearly shows that it is unlikely that attempts at cost recovery will besustainable without the eventual introduction of metering. Conservation and efficiency gains are likely tobe minimal until metering is introduced; otherwise, the actions of an individual customer will not belinked to the utility bills they pay.
There is also a need for a better understanding of the tariffs that must be set for DH to makealternate modes of heating provision feasible or profitable. Considerable insight can be gained fromstudying the experience of other countries where there has been conversion to natural gas or electricheating. If tariffs are set too high too quickly, the switch to alternate modes may make the processirreversible. Finally, it would have been desirable to have tested the switch from direct subsidies toproducers to means-tested subsidies to low-income households through a pilot project in order to betterhandle nonpaying customers. To compensate for this lack of experience, the new companies should shareexperiences in this area soon-and as often-as possible.
INTRODUCE MOIRE REVENUE CERTAINTY AT THE LOCAL LEVEL. One of the most distortingfactors in municipal finances during the transition years has been the uncertainty local governments haveexperienced regarding their revenue sources. This has led to poor planning and diminished efficiencylevels in public expenditures. Some degree of uncertainty has been unavoidable given the shrinking oftraditional tax bases associated with economic restructuring and downsizing; but a significant degree hasbeen generated by unstable revenue assignment policies. Recent reforms in revenue assignments have
83

Municipal Finance
been in the right direction: both VAT and CIT are assigned entirely at the central government level, andrevenue sharing in PIT and property taxes are now the main sources of tax revenue for municipalities.Unfortunately, recent legislation has left considerable uncertainty about what share of PIT a municipalitycan expect. The uncertainty continues because the Seimas can still change the sharing rate for eachmunicipality annually and because a set percentage of PIT collections will be dedicated to funding theHealth Insurance Fund.
Two measures to improve revenue certainty at the municipal level are recommended here. First,the funding of the Health Insurance Fund should be decoupled from any revenue sharing with themunicipalities. As argued earlier in this note, the current arrangement has no economic merit or rationale.The Health Insurance Fund should be financed from general revenues or from earmarked payroll taxes,depending on the health insurance scheme adopted. Most countries with public health insurance plansuse earmarked payroll taxes for financial support. The government could consider this option to coverthe costs of health services provided to employed contributors and their families, while the costs of healthservices to the poor, unemployed, and the elderly should be financed, as in most countries, by transfersfrom the general budget. These changes should be accompanied by complementary measures on revenuesharing that adjust the overall level of funding for municipalities downward to reflect the decrease in theirexpenditure responsibilities in health services.
Second, the government should consider providing stable sharing rates in PIT for allmunicipalities for a period of three years. The timing for the review of these rates by the Seimas couldbe synchronized with the review of the formula coefficients in the new system of transfers that determinethe contribution of better-off municipalities to the "fraternal reserve fund" for the equalization ofexpenditure needs across municipalities. Revenue certainty for municipalities will also be heightened ifall other parameters in the new system of equalization transfers were set for a period of three years. Thiswould leave only the overall pool of funds for equalization purposes to be determined on an annual basis.It is a common international practice to fix transfer formula parameters into a law, and sometimesempower a commission to review these parameters every three years or so, rather than leaving therecurrent decisions to political institutions.
INCREASE REVENUE AUTONOMY AT THE LOCAL LEVEL. The lack of any significant degree ofrevenue discretion is among the most important problems left on the agenda for reform ofintergovernmental relations in Lithuania. As a consequence, many of the efficiency gains associated withdecentralization have not been realized. The failure to grant tax autonomy to municipalities is rooted inwhat appears to be a widespread interpretation of the Constitution that bestows the power to introducetaxes exclusively on the Seimas.40 This constitutional mandate, however, does not seem to contradict thepractice in many unitary countries (for example, Denmark, Estonia, Spain, or the United Kingdom) ofparliamentary delegation of power to local governments to raise taxes on their own within set rules andmargins. Annex table 3-26 shows the significant reliance on local taxes in OECD countries with bothunitary and federal systems. The two most commonly used taxes with revenue significance at the locallevel are the property (real estate) tax and a (subnational) personal income tax. Local sales and excisetaxes are also quite important in some of these countries.
Economic efficiency and political accountability at the local level in Lithuania could be greatly
40. Within this interpretation, municipalities would have the right to reduce tax burdens (as long as they havebudgetary consequences only for the municipality itself), but would not have the right to increase any tax.
84
Municipal Finance
enhanced by providing local governments with discretionary revenue authority.4' In seeking these goals,the government has essentially two choices: to introduce taxes that are exclusively assigned to localgovernments, giving them discretion to vary rates within predetermined bands, and/or to introducesurtaxes (or piggyback taxes) on PIT, with some discretion over rates. The latter is the simplest and mosteffective means of providing municipalities with the potential for discretionary revenues. Again,international experience varies. Some countries provide decentralized governments with both options(locally assigned taxes and a local surtax on personal income), and other countries tend to rely more onone of the two options. Local surtaxes on personal income are common in western European countries(such as Austria, Denmark, Germany, or Sweden).
Under the first option of exclusively assigned local taxes, the clearest candidate is theintroduction of a real estate property tax that would include in its tax base not only the value of land andstructures of commercial and industrial properties, but also those of residential properties. Many OECDcountries have some form of locally assigned real estate property tax. The government has plans tointroduce such a tax, although it is unclear if there are plans to give limited discretion over rates to themunicipalities, even to give them the option to set their rates between a minimum and maximum set bythe Seimas. The introduction of this tax presents significant challenges, such as the accurate valuation ofproperty at market values and the dispersion of property registration.42 The most important andimmediate task is the preparation of fiscal cadasters with clear identification of property (land andstructures), current owner, and updated market value. In the medium term, this tax should beadministered by the State Tax Inspectorate, but the eventual development of local tax administrationsshould be considered;
A second candidate for providing municipalities with revenue discretion is an annual tax onmotor vehicles. This tax is common in OECD countries and in many developing countries. Followinginternational practice, this tax could be based on the value of the vehicle, as proxied by model and age,for example, and could also give discretion to the municipalities to set their own rates within marginsestablished by the Seimas. To facilitate enforcement, the tax would be paid annually with the renewal ofregistration of motor vehicles in the place of residence of the owner.43
IMPROVE THE DESIGN OF THE NEW SYSTEM OF TRANSFERS. The reform in the system oftransfers introduced in the Law for Establishing Municipal Budget Income of July 1997 is a significantaccomplishment. It represents a radical departure from the gap-filling approach to equalization of thepast and it provides a solid foundation in a critical area of intergovernmental finances. It is a rare event in
41. Discussions of decentralization issues in Lithuania seem to miss the point that efficiency at the local level isenhanced by allowing municipalities to exert greater tax pressure if local residents so desire. The emphasisshould not be on unilormity, but rather on the ability of citizens to tax themselves according to their ownpreferences to provide public services at the local level. At the desired level, the greater or lesser taxes paid byresidents are balanced against the services actually provided. Fundamentally, this concept of efficiency is notunlike that associated with private markets, which let individuals decide on their own how much and for whatpurpose to spend their incomes. It would be difficult to argue that, in general, citizens would be better-off iftheir freedom to make these decisions were restricted.
42. The registry for urban land is kept by the Ministry of Justice; for rural land, by the Ministry of Agriculture; andfor buildings, by the Ministry of Housing. Liens on real estate property are kept in a completely differentregistry.
43. One potential problem is that owners may try to register their cars in lower tax municipalities, something thathas been addressed quite effectively in other countries by, for example, requiring that car owners show proof oftheir place of residence. This approach, however, requires compliance by all municipalities.
85
Municipal Finance
any country that a new and complex law does not include areas that need revision and modification, andthere are aspects of the new law that will need reassessment by the government.
Any system of equalization of transfers must address two issues: disparities in fiscal capacity orability to generate tax revenue and differences in expenditure patterns arising from the incidence ofpopulation groups with special needs or other elements that affect the costs of service provision. Thesetwo issues are generally addressed by windows two (equalization of tax revenues) and three (equalizationof expenditure needs), respectively, of the current system. Window one (reserves for extraordinaryevents) of the new system, in contrast, appears to be a remnant of the old, gap-filling approach, exceptthat the gap is generated ex-post. Nevertheless, the perverse consequences on the revenue mobilizationeffort are unchanged. Municipalities that make less of an effort to raise their own revenues will get larger
44transfers. The new system of transfers would be improved with the elimination of window one.
Similarly, the use of forecast revenues in a municipality for equalization in relation to the nationalaverage in window two (equalization of tax revenues) helps with the problem of perverse incentives toraise own-revenues, but if forecasts are actually based on past collections, the incentive problem willreappear over time. Collecting less actual revenue this year yields lower forecast revenues next year, andtherefore creates the hope of larger transfers. In the medium term, the solution should be to baseequalization in window two (equalization of tax revenues) on fiscal capacity as approximated bymeasures of tax bases. This approach, based on capacity rather than forecast or actual collections, willbecome imperative, if and when municipalities are granted true tax discretion.
The choice of parameters in window three (equalization of expenditure needs) for thedevelopment of the fraternal pool of funds will require great care, given the sensitivity of the results tothe parameters set. In addition, as discussed at length earlier, the definition of the formulas for theequalization of expenditure needs will have to take into account the scale effect of municipality size toavoid unfortunate results in the distribution of transfers.
Finally, for categorical grants with objectives other than equalization, the government shouldfollow best international practices for using matching grants to promote and leverage central governmentresources with municipal resources in areas of national priority, such as education, or areas withotherwise significant externalities across municipalities, such as environmental protection.
REGULATE BORROWING AND FACILITATE ACCESS TO LONG-TERM CREDIT BY LOCAL
GOVERNMENTS. The main solution to the severe need for capital infrastructure at the local level is formunicipalities to engage in long-term borrowing for worthy projects. The government, however, needs tobe aware that irresponsible borrowing behavior by municipalities may arise in an unregulatedenvironment, and such borrowing could easily threaten fiscal stability at the national level. At the sametime, municipalities willing and-able to borrow for worthy projects now find it difficult to get creditbecause of the lack of developed credit markets and institutions.
The tasks ahead for the central government in this regard are twofold: regulate and facilitatemunicipal credit. In regulation, international experience (for example, western European countries forsuccessful experiences and Latin American countries for generally unsuccessful ones) provides a time-tested set of rules:
44. This window may have a weak justification, however, because window two is based on forecast, rather thanactual, revenues.
86
Municipal Finance
* Municipalities should only borrow for capital investment purposes.45* There should be strict borrowing limits. For example, for long-term debt for capital investment
purposes, debt service (interest and repayment of principal) should at no time exceed 1 5 or 20percent of the municipal "recurrent revenues" (which exclude special grant funds and borrowingproceeds).
* If the municipiality issues debt guarantees, these guarantees should be included in the 1 5 percentceiling.
* Borrowing should also be allowed for short-term cash or liquidity management. In this case,annual borrovwing should not exceed 5 percent of projected revenues, and all loans should bereimbursed at the end of the year.
* International borrowing should require previous approval by the Ministry of Finance.* There should be strict reporting requirements to the Ministry of Finance and credible and
effective sanctions for noncompliant municipalities. The Ministry of Finance should maintain apublic debt registry for outstanding local government debt.
* Municipalities with outstanding long-term loans should be subjected to external audit every year.Loan nonpayrnent (or default) situations should be clearly defined to automatically trigger afinancial rehabilitation plan supervised by the central government authorities.
Facilitating the development of credit sources for municipalities will be a more difficultproposition. This issue has been ably analyzed in Cochran,46 and his conclusions are worth repeatinghere. Given the lack of a credit market and the unwillingness or inability of banks to lend tomunicipalities, the best bet in the immediate future for developing a sustainable credit line formunicipalities is to create a transitional municipal credit facility (TMCF). This entity would lend directlyto municipalities and municipal enterprises within a strict "hard credit" culture and could be capitalizedby borrowing from the IBRD and from other potential sources.47 Later on, this entity could launch otherfinancing models, including a "loan to lenders" model that will permit TMCF to lend to a small numberof banks willing to accept long-term municipal credit risk. At some later date, the municipal creditfacility could also be authorized to operate as a bond bank to facilitate the development of a municipalbond market. The municipal credit facility should incorporate "sunset" provisions and not interfere withthe development of private credit markets for municipal governments.
IMPROVE THE BUDGET PROCESS AT THE LOCAL LEVEL. The budget system and fiscalmanagement process at the local level have lagged behind in the reform. While other components of thesystem of decentralized governance have been the subject of continuous reform, changes in the budgetingprocess have been scanty. The process is still regulated by the Budget Formation Law of Lithuania of1990, an antiquated legal framework that has limited the efficiency of local governments. The current
45. Borrowing to service debt should not be allowed. Borrowing to roll over or convert debt, however, ispermissible.
46. T. H. Cochran, "Building a Hard-Credit Culture with Lithuanian Local Authorities and Municipal Enterprises"(mimeo, 1997).
47. Independence of the TMCF from government intervention will be an essential element of its success. This is acritical issue, especially given the current record of political intervention in the credit decisions of not onlypublic banks, but also private banks, with the objective of "directing" funds toward public policy objectives.See M. Giugale, "Lithuania: Macroeconomic Issues and Prospects for a Transition Country at a Junction"(presented at Lithuania's Agricultural Strategy Conference, Vilnius, April 1992).
48. International experiences with what systems have worked and have not worked are discussed in Cochran,"Building a Hard-Credit Culture."
87

Municipal Finance
budgetary process presents serious deficiencies at all stages of the budget cycle, including budgetpreparation and revenue forecasting, budget execution, and ex-post audit and evaluation.
A key policy measure in the medium term is thus the drafting and approval of a MunicipalBudget Law. This law should program budget preparation, not from the perspective of expenditureneeds, but rather from the perspective of revenue availability; introduce a modern treasury function forbudget execution; introduce budget evaluation; and strengthen current institutions of control and audit.More specific recommendations for the reform of the budget process are offered in Annex 3-2.
88

ANNEX 3-1Data Tables
89

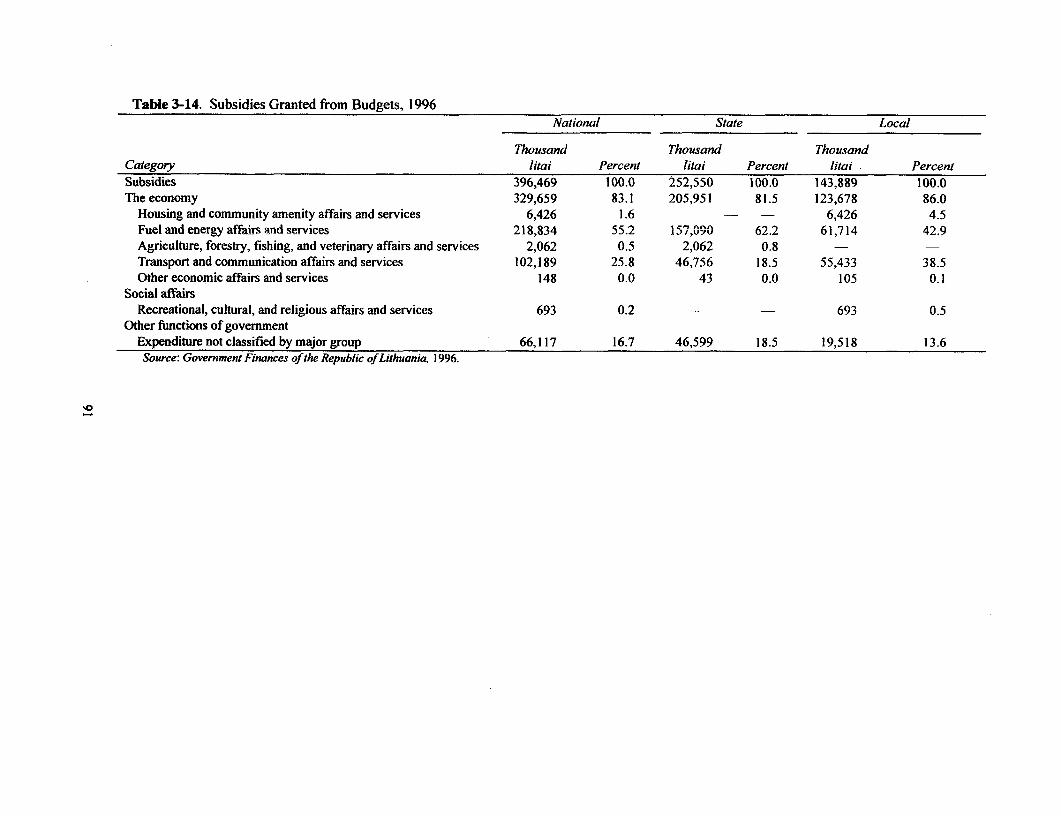
Table 3-14. Subsidies Granted from Budgets, 1996National State Local
Thousand Thousand ThousandCategory litai Percent litai Percent litai PercentSubsidies 396,469 100.0 252,550 100.0 143,889 100.0The economy 329,659 83.1 205,951 81.5 123,678 86.0
Housing and community amenity affairs and services 6,426 1.6 - - 6,426 4.5Fuel and energy affairs and services 218,834 55.2 157,09 62.2 61,714 42.9Agriculture, forestry, fishing, and veterinary affairs and services 2,062 0.5 2,062 0.8 -
Transport and communication affairs and services 102,189 25.8 46,756 18.5 55,433 38.5Other economic affairs and services 148 0.0 43 0.0 105 0.1
Social affairsRecreational, cultural, and religious affairs and services 693 0.2 - - 693 0.5
Other functions of governmentExpenditure not classified by major group 66,117 16.7 46,599 18.5 19,518 13.6Source: Government Finances of the Republic of Lithuania, 1996.

Table 3-15. Budget Expenditure on Education Affairs and Services, 1996National State Local
Category Thousand litai Percent Thousand litai Percent Thousand litai PercentTotal expenditure on education affairs and services 1,712,880 100.0 595,773 100.0 1,117,107 100.0
Preprimary establishments 246,549 14.4 - - 246,549 22.1
Comprehensive and vocational schools 978,024 57.1 232,468 39.0 745,556 66.7Comprehensive primary basic and secondary schools 755,584 44.1 15,985 2.7 739,599 66.2Boarding schools and child care homes (families
included) 97,824 5.7 91,867 15.4 5,957 0.5Vocational schools 124,616 7.3 124,616 20.9 - -
Higher schools 310,503 18.1 310,503 52.1 - -Higher schools (after graduation, a university diploma is
awarded) 229,438 13.4 229,438 38.5 - -
Special secondary schools 81,065 4.7 81,065 13.6 -
Other educational institutions 88,246 5.2 10,837 1.8 77,409 6.9Support for nonstate educational institutions 1,129 0.1 112 0.0 1,017 0.1
Preschool establishments 437 0.0 - 437 0.0Comprehensive schools 580 0.0 - - 580 0.1Special secondary schools 112 0.0 112 0.0 -
Other educational functions 76,751 4.5 31,799 5.3 44,952 4.0Maintenance of central and municipal institutions 5,864 0.3 4,240 0.7 1,624 0.1Research and research institutions 842 0.0 842 0.1 - -
Socioeconomic programs 4,972 0.3 4,972 0.8Source: Government Finances of the Republic ofLithuania, 1996.
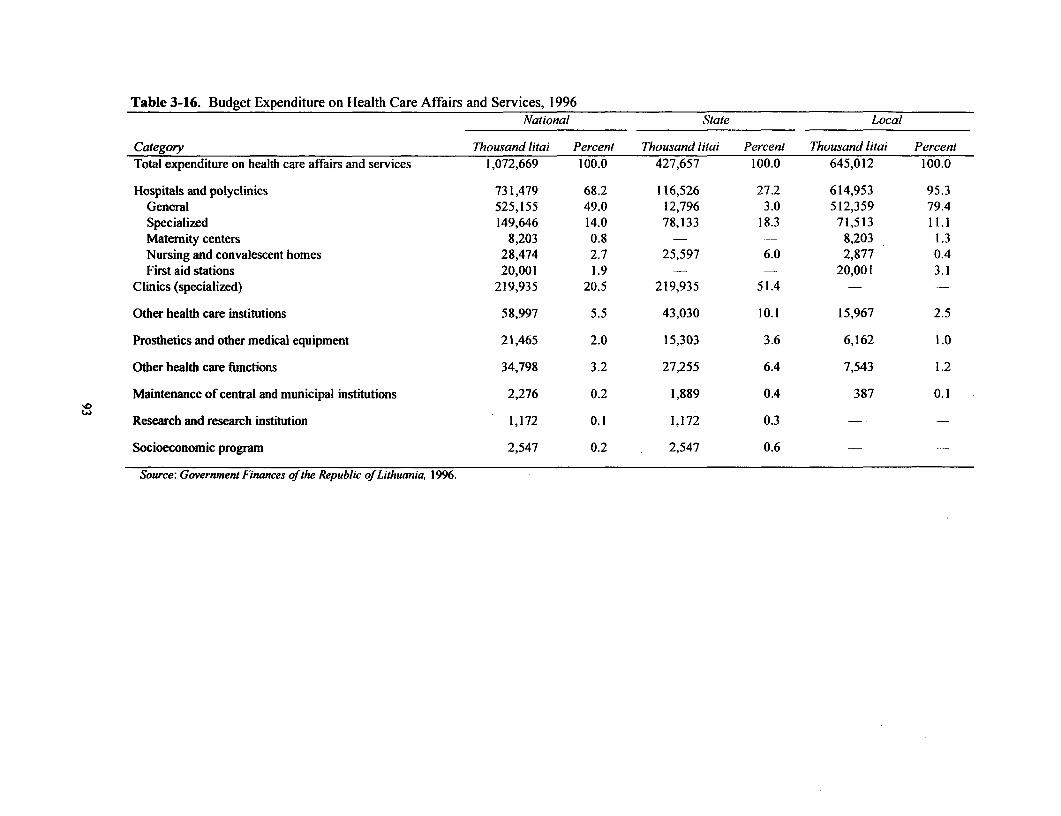
Table 3-16. Budget Expenditure on Health Care Affairs and Services, 1996National State Local
Category Thousand litai Percent Thousand litai Percent Thousand litai PercentTotal expenditure on health care affairs and services 1,072,669 100.0 427,657 100.0 645,012 100.0
Hospitals and polyclinics 731,479 68.2 116,526 27.2 614,953 95.3General 525,155 49.0 12,796 3.0 512,359 79.4Specialized 149,646 14.0 78,133 18.3 71,513 11.1Maternity centers 8,203 0.8 - - 8,203 1.3Nursing and convalescent homes 28,474 2.7 25,597 6.0 2,877 0.4First aid stations 20,001 1.9 - - 20,001 3.1
Clinics (specialized) 219,935 20.5 219,935 51.4 - -
Other health care institutions 58,997 5.5 43,030 10.1 15,967 2.5
Prosthetics and other medical equipment 21,465 2.0 15,303 3.6 6,162 1.0
Other health care functions 34,798 3.2 27,255 6.4 7,543 1.2
Maintenance of central and municipal institutions 2,276 0.2 1,889 0.4 387 0.1
Research and research institution 1,172 0.1 1,172 0.3 - -
Socioeconomic program 2,547 0.2 2,547 0.6 -
Source: Government Finances of the Republic of Lithuania, 1996.

Table 3-17. Budget Expenditure on Social Security and Welfare, 1996National State Local
Thousand Thousand ThousandCategory litai Percent litai Percent litai PercentTotal expenditure on social security and welfare affairs and services 746,299 100.0 471,775 100.0 274,524 100.0
Social security affairs and services 508,378 68.1 277,772 58.9 230,606 84.0Special pensions 808 0.1 343 0.1 465 0.2State pensions of the first and second class of the Republic of
Lithuania 4,616 0.6 4,616 1.0 - -State pensions of casualties 88,900 11.9 88,900 18.8 - -
State pensions to interior officers 19,641 2.6 19,641 4.2State pensions to officers of national defense 1,175 0.2 1,175 0.2State pensions to officers of national security 45 0.0 45 0.0State pensions to officers of prosecuting magistracy 215 0.0 215 0.0State pensions to scientists 5,399 0.7 5,399 1.1 --
Social pensions 156,947 21.0 156,947 33.3 - -
Social benefits 77,171 10.3 - - 77,171 28.1Family and child allowances 108,353 14.5 - 108,353 39.5Funeral grant 21,311 2.9 - - 21,311 7.8Other social assistance welfare affairs and services 23,797 3.2 491 0.1 23,306 8.5
Social welfare 131,749 17.7 98,336 20.8 33,413 12.2Children's residential institutions 27,785 3.7 15,312 3.2 12,473 4.5Old persons' residential institutions 31,337 4.2 21,558 4.6 9,779 3.6Handicapped persons' residential institutions 61,510 8.2 59,008 12.5 2,502 0.9Other residential institutions 5,427 0.7 2,458 0.5 2,969 1.1Institutions delivering home visiting and housekeeping 5,690 0.8 - - 5,690 2.1Other functions of social security and welfare 97,207 13.0 91,695 19.4 5,512 2.0Maintenance of central and municipal institutions 7,665 1.0 2,672 0.6 4,993 1.8
Source: Government Finances ofthe Republic of Lithuania, 1996.
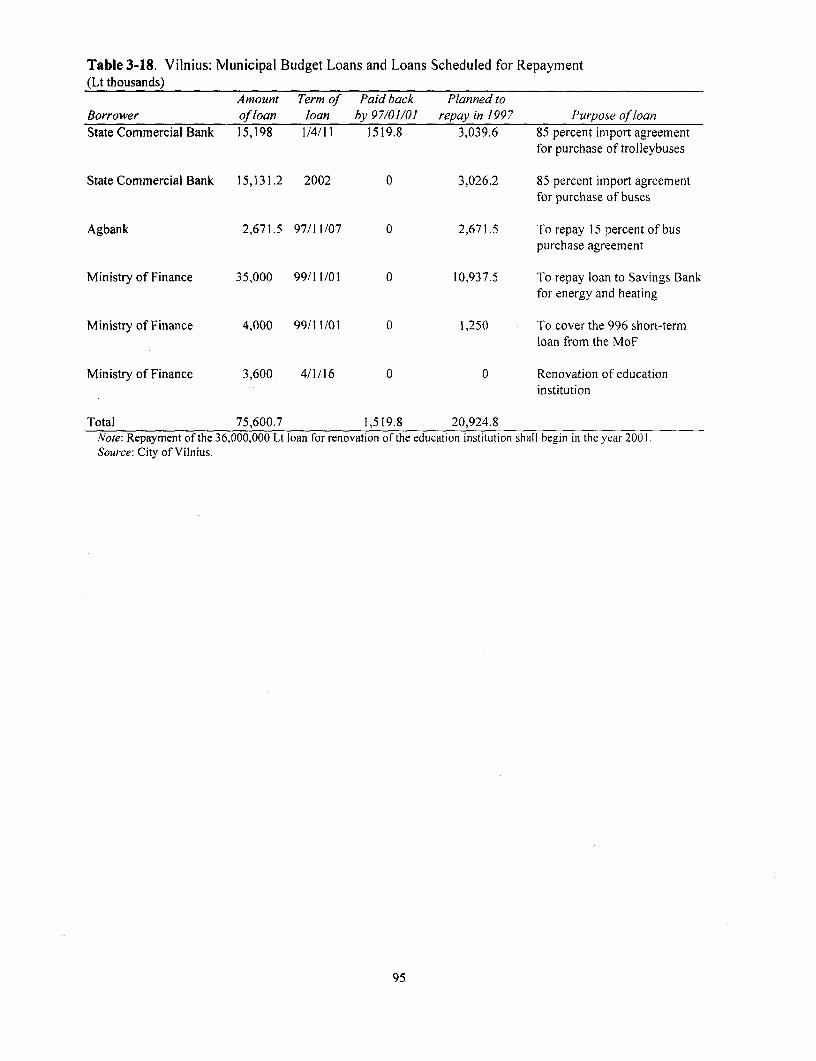
Table 3-18. Vilnius: Mlunicipal Budget Loans and Loans Scheduled for Repayment(Lt thousands)
Amount Term of Paid back Planned toBorrower of loan loan by 97/01/01 repay in 1997 Purpose of loanState Commercial Bank 15,198 1/4/11 1519.8 3,039.6 85 percent import agreement
for purchase of trolleybuses
State Commercial Bank 15,131.2 2002 0 3,026.2 85 percent import agreementfor purchase of buses
Agbank 2,671.5 97/11/07 0 2,671.5 To repay 15 percent of buspurchase agreement
Ministry of Finance 35,000 99/11/01 0 10,937.5 To repay loan to Savings Bankfor energy and heating
Ministry of Finance 4,000 99/11/01 0 1,250 To cover the 996 short-termloan from the MoF
Ministry of Finance 3,600 4/1/16 0 0 Renovation of educationinstitution
Total 75,600.7 1,519.8 20,924.8Note: Repayment of the 36.000.000 Lt loan for renovation of the education institution shall begin in the year 2001.Source: City of Vilnius.
95
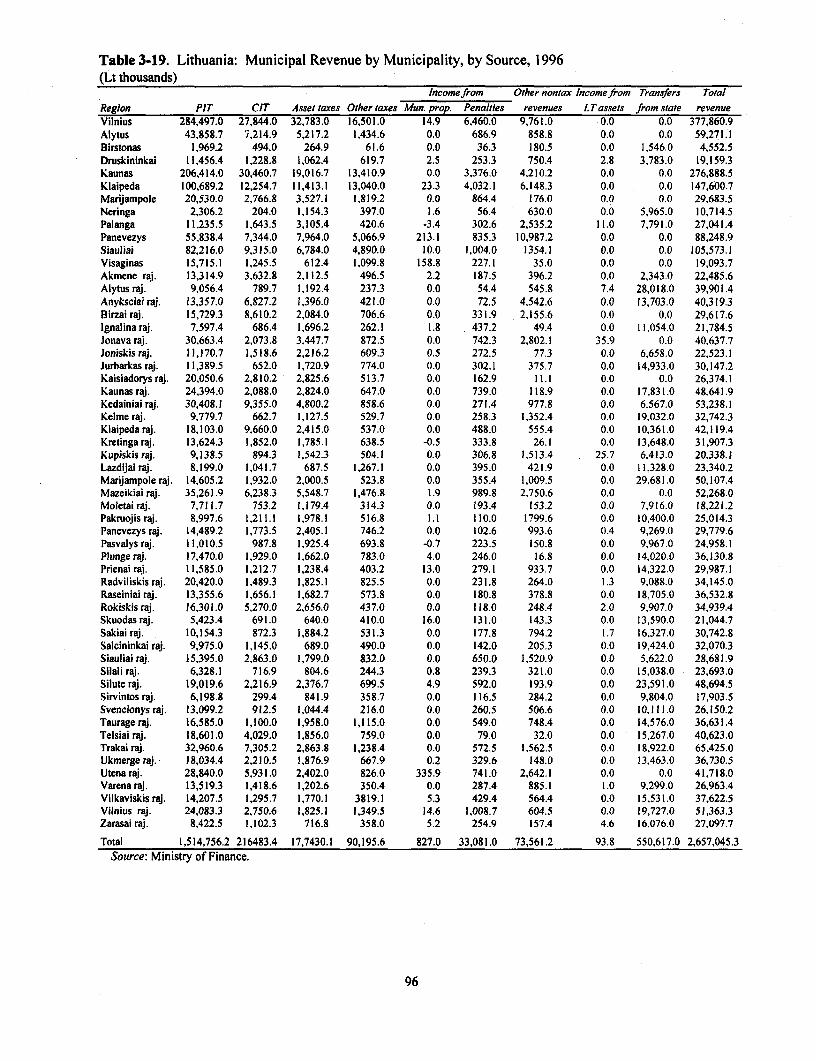
Table 3-19. Lithuania: Municipal Revenue by Municipality, by Source, 1996(Lt thousands)
Incomefrom Other nontax Incomefrom Transfers Total
Region PIT CIT Asset taxes Other taxes Mun. prop. Penalties revenues LTassets fromstate revenueVilnius 284,497.0 27,844.0 32,783.0 16,501.0 14.9 6,460.0 9,761.0 0.0 0.0 377,860.9Alytus 43.858.7 7,214.9 5,217.2 1,434.6 0.0 686.9 858.8 0.0 0.0 59,271.1Birstonas 1,969.2 494.0 264.9 61.6 0.0 36.3 180.5 0.0 1,546.0 4,552.5Druskininkai 11,456.4 1,228.8 1,062.4 619.7 2.5 253.3 750.4 2.8 3,783.0 19,159.3Kaunas 206,414.0 30,460.7 19,016.7 13,410.9 0.0 3,376.0 4,210.2 0.0 0.0 276,888.5Klaipeda 100,689.2 12,254.7 11,413.1 13,040.0 23.3 4,032.1 6,148.3 0.0 0.0 147,600.7Marijampole 20,530.0 2,766.8 3,527.1 1,819.2 0.0 864.4 176.0 0.0 0.0 29,683.5Neringa 2,306.2 204.0 1,154.3 397.0 1.6 56.4 630.0 0.0 5,965.0 10,714.5Palanga 11,235.5 1,643.5 3,105.4 420.6 -3.4 302.6 2,535.2 11.0 7.791.0 27,041.4Panevezys 55,838.4 7,344.0 7,964.0 5,066.9 213.1 835.3 10,987.2 0.0 0.0 88,248.9Siauliai 82,216.0 9,315.0 6,784.0 4,890.0 10.0 1,004.0 1354.1 0.0 0.0 105,573.1Visaginas 15,715.1 1,245.5 612.4 1,099.8 158.8 227.1 35.0 0.0 0.0 19,093.7Akmene raj. 13,314.9 3.632.8 2,112.5 496.5 2.2 187.5 396.2 0.0 2,343.0 22,485.6Alytus raj. 9,056.4 789.7 1,192.4 237.3 0.0 54.4 545.8 7.4 28,018.0 39,901.4Anyksciai raj. 13,357.0 6,827.2 1,396.0 421.0 0.0 72.5 4,542.6 0.0 13,703.0 40,319.3Birzai raj. 15,729.3 8,610.2 2,084.0 706.6 0.0 331.9 2,155.6 0.0 0.0 29,617.6Ignalinaraj. 7,597.4 686.4 1,696.2 262.1 1.8 . 437.2 49.4 0.0 11,054.0 21,784.5Jonava raj. 30,663.4 2,073.8 3.447.7 872.5 0.0 742.3 2,802.1 35.9 0.0 40,637.7Joniskisraj. 11,170.7 1,518.6 2,216.2 609.3 0.5 272.5 77.3 0.0 6.658.0 22,523.1Jurbarkas raj. 11,389.5 652.0 1,720.9 774.0 0.0 302.1 375.7 0.0 14,933.0 30,147.2Kaisiadorys raj. 20,050.6 2,810.2 2,825.6 513.7 0.0 162.9 11.1 0.0 0.0 26,374.1Kaunas raj. 24,394.0 2,088.0 2,824.0 647.0 0.0 739.0 118.9 0.0 17,831.0 48.641.9Kedainiai raj. 30,408.1 9,355.0 4,800.2 858.6 0.0 271.4 977.8 0.0 6,567.0 53,238.1Kelme raj. 9,779.7 662.7 1,127.5 529.7 0.0 258.3 1,352.4 0.0 19,032.0 32,742.3Klaipedaraj. 18,103.0 9,660.0 2,415.0 537.0 0.0 488.0 555.4 0.0 10,361.0 42,119.4Kretingaraj. 13,624.3 1,852.0 1,785.1 638.5 -0.5 333.8 26.1 0.0 13,648.0 31,907.3Kupiskis raj. 9,138.5 894.3 1,542.3 504.1 0.0 306.8 1,513.4 25.7 6,413.0 20,338.1Lazdijai raj. 8,199.0 1,041.7 687.5 1,267.1 0.0 395.0 421.9 0.0 11,328.0 23,340.2Marijampole raj. 14,605.2 1,932.0 2,000.5 523.8 0.0 355.4 1,009.5 0.0 29,681.0 50,107.4Mazeikiai raj. 35,261.9 6,238.3 5,548.7 1,476.8 1.9 989.8 2.750.6 0.0 0.0 52,268.0Moletairaj. 7,711.7 753.2 1,179.4 314.3 0.0 193.4 153.2 0.0 7,916.0 18,221.2Pakruojisraj. 8,997.6 1,211.1 1,978.1 516.8 1.1 110.0 1799.6 0.0 10,400.0 25,014.3Panevezys raj. 14,489.2 1,773.5 2,405.1 746.2 0.0 102.6 993.6 0.4 9,269.0 29,779.6Pasvalysraj. 11,010.5 987.8 1,925.4 693.8 -0.7 223.5 150.8 0.0 9,967.0 24,958.1Plunge raj. 17,470.0 1,929.0 1,662.0 783.0 4.0 246.0 16.8 0.0 14,020.0 36,130.8Prienai raj. 11,585.0 1,212.7 1,238.4 403.2 13.0 279.1 933.7 0.0 14,322.0 29,987.1Radviliskis raj. 20,420.0 1,489.3 1,825.1 825.5 0.0 231.8 264.0 1.3 9,088.0 34,145.0Raseiniai raj. 13,355.6 1,656.1 1,682.7 573.8 0.0 180.8 378.8 0.0 18,705.0 36,532.8Rokiskis raj. 16,301.0 5,270.0 2,656.0 437.0 0.0 118.0 248.4 2.0 9,907.0 34,939.4Skuodasraj. 5,423.4 691.0 640.0 410.0 16.0 131.0 143.3 0.0 13,590.0 21,044.7Sakiai raj. 10,154.3 872.3 1,884.2 531.3 0.0 177.8 794.2 1.7 16,327.0 30,742.8Salcininkai raj. 9,975.0 1,145.0 689.0 490.0 0.0 142.0 205.3 0.0 19,424.0 32,070.3Siauliai raj. 15,395.0 2,863.0 1,799.0 832.0 0.0 650.0 1,520.9 0.0 5,622.0 28,681.9Silali raj. 6,328.1 716.9 804.6 244.3 0.8 239.3 321.0 0.0 15,038.0 23,693.0Silute raj. 19,019.6 2,216.9 2,376.7 699.5 4.9 592.0 193.9 0.0 23,591.0 48,694.5Sirvintos raj. 6,198.8 299.4 841.9 358.7 0.0 116.5 284.2 0.0 9,804.0 17,903.5Svencionys raj. 13,099.2 912.5 1,044.4 216.0 0.0 260.5 506.6 0.0 10.111.0 26,150.2Taurage raj. 16,585.0 1,100.0 1,958.0 1,115.0 0.0 549.0 748.4 0.0 14,576.0 36,631.4Telsiai raj. 18,601.0 4,029.0 1,856.0 759.0 0.0 79.0 32.0 0.0 15,267.0 40,623.0Trakai raj. 32,960.6 7,305.2 2,863.8 1,238.4 0.0 572.5 1,562.5 0.0 18,922.0 65,425.0Ukmerge raj. 18,034.4 2,210.5 1,876.9 667.9 0.2 329.6 148.0 0.0 13,463.0 36,730.5Utenaraj. 28,840.0 5,931.0 2,402.0 826.0 335.9 741.0 2,642.1 0.0 0.0 41,718.0Varenaraj. 13,519.3 1,418.6 1,202.6 350.4 0.0 287.4 885.1 1.0 9,299.0 26,963.4Vilkaviskis raj. 14,207.5 1,295.7 1,770.1 3819.1 5.3 429.4 564.4 0.0 15,531.0 37,622.5Vilnius raj. 24,083.3 2,750.6 1,825.1 1,349.5 14.6 1,008.7 604.5 0.0 19,727.0 51,363.3Zarasai raj. 8,422.5 1,102.3 716.8 358.0 5.2 254.9 157.4 4.6 16,076.0 27,097.7
Total 1,514,756.2 216483.4 17,7430.1 90,195.6 827.0 33,081.0 73,561.2 93.8 550,617.0 2,657,045.3
Source: Ministry of Finance.
96
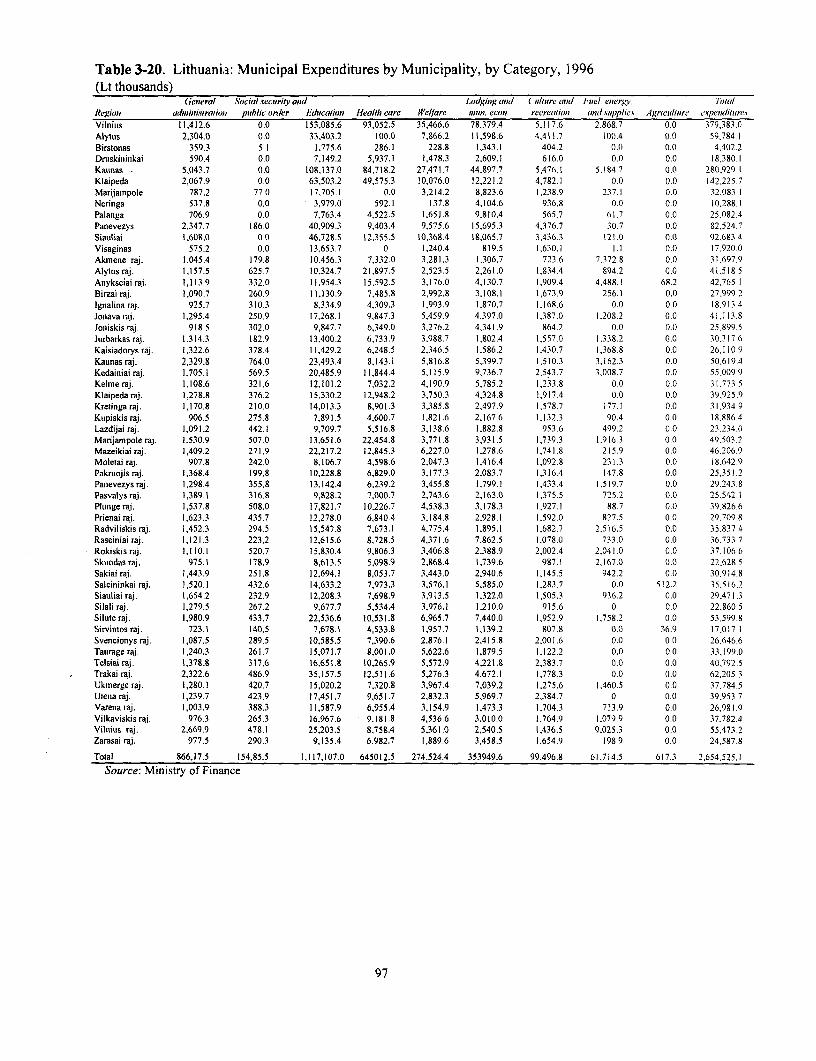
Table 3-20. Lithuania: Municipal Expenditures by Municipality, by CCategory, ] 996(Lt thousands)
Genewle .Socialvecurily and LoXdging and Culture ntd Fuxel eiiergv. Ma/ilRegion (leinfinisirevionl pv6b1ic or(ler A.duwionirl Health cart, Weltare, nituer econl recreztlioit wedsufpplies Agricuilitire expendziatlre.sVilniLus 11,412.6 0.0 153,085.6 93,052.5 35,466.6 78,379.4 5,117.6 2.868.7 0.0 379,383.0Alyltus 2,304.0 0.0 33.403.2 1 00.0 7,866.2 11,59S.6 4,41 1.7 100.4 0.0 59,784.1Birstonas 359.3 S. 1 1,775.6 286.1 228.8 1.343.1 404.2 0.0 0.0 4,402.2Drmskiniinkai 590.4 0.0 7,149.2 5,937.1 1,478.3 2,609.1 616.0 0.0 0.0 18,380 1Katinas 5.043.7 0. 10S,137.0 84,719.2 27,471.7 44.8997.7 5,476.1 5,1S4.7 0.0 2S0(,929.t Klaipeda 2,067.9 0.0 63,503.2 49,575.3 10,076.0 12,221.2 4,782.1 0.0 0.0 142,225.7Marijampole 787.2 77.0 17,705.1 0.0 3,214.2 8,823.6 1,238.9 237.1 0.0 32.083.1Neringa 537.8 0.0 3,979.0 592.1 137.8 4,104.6 936.8 0.0 0.0 10,288.1Palaniga 706.9 0.0 7,763.4 4,522.5 1,65 1.8 9,810.4 565.7 61.7 0.0 25,082.4Panevezys 2,347.7 186.0 40,909.3 9,403.4 9.575.6 15,695.3 4,376.7 30.7 0.0 82.524.7Siauliai 1,608.0 0.0 46,728.5 12,355.5 10,368.4 18,065.7 3,436.3 121.0 0.0 92.6S3 4Visagiiias 575.2 0.0 13,653.7 0 1,240.4 819.5 1,630.1 1.1 0.0 17.920.0Akineiie raj. 1,045.4 179.8 10,456.3 7,332.0 3,281.3 1,306.7 723.6 7.372.8 0.0 31,697.9Alytus raj. 1,157.5 625.7 10,324.7 21,897.5 2,523.5 2,261.0 1.834.4 894.2 0.0 41.518 5Aliyksciai raj. 1,113.9 332.0 11,954.3 15,592.5 3.176.0 4.130.7 1,909.4 4.488.1 68.2 42.765.1Birzai raji. 1,090.7 260.9 11,130.9 7,485.8 2,992.8 3.108.1 1,673.9 256.1 0.0 27.999.2Ignalina raJ. 925.7 310.3 8,334.9 4,309.3 1,993.9 1.~870.7 1,168.6 0.0 0.0 18,913 4Joniava raj. 1,295.4 250.9 17.268.1 9.847.3 5.459.9 4,397.0 1,387.0 1.208.2 0.0 41,113.8Joiiiskis ra^i. 918.5 302.0 9,847.7 6,349.0 3,276.2 4,341.9 864.2 0.0 0 0 25.899.5Jurbarkas raj. 1,314.3 IS2.9 13.400.2 6,733.9 3.988.7 1,802.4 1,557 0 1.338.2 0.0 30,3 17 6Kaisiadorys raj. 1,322.6 378.4 11,429.2 6,248.5 2,346.5 1.586.2 1.430.7 1,368.8 0.0 26.110.9Kawltas raj. 2,329.8 764.0 23,493.4 8,143.1 5,816.8 5.399.7 1,510.3 3,162.3 0.0 50,619.4Kedainiai raj. 1,705.1 569.5 20.485.9 11,844.4 5.115.9 9,736.7 2,543.7 3.008.7 0.0 55,009 9Kelimeraj. 1,108.6 321.6 12,101.2 7,032.2 4,190.9 5,785.2 1,2 33.8 0 0 0.0 31,773 5Klaipeda raj. 1,278.8 376.2 15,330.2 12,948.2 3,750.3 4,324.8 1,917.4 0.0 0.0 39,925.9Kretinga raj, 1,170.8 210.0 14,013.3 8,901.3 3,385.8 2,497.9 1,578.7 177.1 0.0 31.934 9Ktipiskis raj. 906.5 275.8 7.891.5 4,600.7 1,821.6 2,167.6 1.132.3 90.4 0.0 18.886 4ILazdijai raj. 1,091.2 442.1 9,709.7 5,516.8 3,138.6 1,882.8 953.6 499.2 0 0 23.234.0Mtarijampzole raj. 1,5309 507.0 13,651.6 22,454.8 3,771.8 3,931.5 1,739.3 1.916.3 0.0 49.503.2Mazeikiai raj. 1,409.2 271.9 22,217.2 12,845.3 6,227.0 1,278.6 1.741.8 2 15.9 0.0 46,206.9Moletai raj, 907.8 242.0 8,106.7 4,598.6 2.047.3 1,416.4 1,092.8 23 1. 3 0.0 18.642.9Paknmojis raj. 1,368.4 199.8 10,228.8 6,829.0 3,177.3 2,083.7 1,316.4 147.8 0.0 25,351 2Panievezys raj. 1,298.4 355,8 13,142.4 6,239.2 3.455.8 1,799.1 1,433.4 1.519.7 0.0 29.43.8Pasvalys raj. 1,389.1 3168 9.828.2 7.000.7 2,743.6 2,163.0 1.375.5 725.2 0.0 25.542.1PuLInge raj. 1,537.8 508.0 17,821.7 10,226.7 4,538.3 3,178.3 1,927.1 88.7 0.0 39,82().6Prieiiai raj. 1,623.3 435.7 12,278.0 6,840.4 3.184.8 2,928.1 1.592.0 827.5 0.0 29,709.8Radviliskis raj. 1,452.3 294.5 15,547.8 7,673.1 4.775.4 1,895.1 1,682.7 2.51 6.5 0.0 35.837.4Raseiniiai raj. 1,121.3 223.2 12,615.6 8,728.5 4,371.6 7,862.5 1,078.0 733.0 0.0 36.733.7Rokiskis raj. 1.110.1 520.7 15.830.4 9,806.3 3,406.8 2,388.9 2,002.4 2.041.0 0.0 37.106.6.Skuiodas raj. 975.1 1789 8,613.5 5,098.9 2,868.4 1,739.6 987.1 2.167 0 0.0 22.628.5Sakiai raj. 1,443.9 25 1.8 12,694.1 8,053.7 3,443.0 2,940.6 1,145.5 942.2 0.0 30914.8Salciiiinkai raj. 1,520.1 432.6 14,633.2 7,973.3 3,576.1 5,585.0 1,283.7 0.0 512.2 35.516.2Siauliai raj. 1,654.2 232.9 12,208.3 7,698.9 3,913.5 1,322.0 1,505.3 936.2 0.0 29.471.3Silali raj. 1,279.5 267.2 9.677.7 5,534.4 3,976.1 1,210.0 915.6 0 0.0 22.80.5Siltute raj. 1,980.9 433.7 22,536.6 10,531.8 6,965.7 7,440.0 1.952.9 1.758.2 0.0 53.599.8Sirvintos raj. 723.1 140.5 7,678.1 4,533.8 1,957.7 1,139.2 807 8 0.0 36.9 17.017.1Svenicioniys raj. 1,087.5 289.5 10,585.5 7,390.6 2.876.1 2,415.8 2.001.6 0.0 0.0 26,646.6Tatirge raj. 1,240.3 261.7 15,071.7 8,001.0 5,622.6 1,879.5 1,122.2 0.0 0.0 33,199.0Telsiai raj. 1,378.8 317,6 16,651.8 10.265.9 5,572.9 4,221.8 2,383.7 0.0 0.0 40.792.5Trakai raj. 2.322.6 486.9 35,157.5 12,511.6 5,276.3 4,672.1 1,778.3 0.0 0.0 62,205,3Ukinerge raj. 1,280.1 420.7 15,020.2 7,320.8 3.967.4 7,039.2 1,275.6 1,460.5 0.0 37.784.5Uteiia raj. 1,239.7 423.9 17,451.7 9,651.7 2,832.3 5,969.7 2.384.7 0 0. 39,953.7Vareiia raj. 1,003.9 388.3 11,587.9 6,955.4 3,154.9 1,473.3 1,704.3 713.9 0.0 26,981.9Vilkaviskis raj. 976.3 265.3 16,967.6 9,181.8 4,536.6 3,010.0 1,764.9 1.079.9 0.0 37.782.4Vilnius raj. 2.669.9 478.1 25,203.5 8,758.4 5,361.0 2,540.5 1,436.5 9,025.3 0.0 55.473.2Zarasai raj. 977.5 290.3 9,135.4 6,982.7 1,889.6 3,458.5 1.654.9 198.9 0.0 24,587.8
Total 866, 17.5 1 54,85.5 1 ,11 7, 107.0 6450 12.5 274,524.4 3 53949.6 99,496 .8 6 1.,7 14.5 6 17.3 2,654 ,525 .
Source: Ministry of Finance
97

I
Municipal Finance-Annexes
ANNEX 3-2. Municipal Budgeting Issues
The realization of benefits from decentralization-increasing the efficiency of public expenditures bymaking government more responsive and accountable to the needs and preferences of taxpayers-is notpossible without budgetary autonomy and good budget practices. This Annex first examines the existinglevel of budgetary autonomy at the municipal level in Lithuania. The last three sections of the Annexreview the current practices in budget preparation, execution, and audit, and recommend directions forreform.
Extent of Budgetary Autonomy
Lithuania is a unitary state, and all the budgetary authority of subnational governments is delegated by thestate. Article 121 of tlhe Constitution gives local authorities the right to draft and approve their ownbudgets, charge fees, and provide for the "leverage of taxes and duties at the expense of their ownbudget." In addition, the Budget Formation Law of 1990, which, with many amendments, remains thekey legal framework for the budget process, grants autonomy to local governments from interferencefrom the central government budget.
Despite the declarations of municipal budget autonomy, the budgets at the municipal level arehierarchically interlinked with the central government budget. In practice, budgetary autonomy requiresseveral things. First, local governments must be able to formulate their budgets separately from (thebudgetary cycle of) the central government, including the approval of their budgets, even when thecentral government budget has not been approved. This demands stability and certainty in fundingsources of subnational governments. Second, local governments must have the means at their disposal toincrease their budgets, at least at the margin, through autonomous sources of revenues, even if revenuesharing and transfers from the central government are the main sources of revenue. Third, localgovernments must have the freedom to allocate most resources to budget programs as they see fit andshould be able to produce and deliver public services using the techniques and input combinations theyconsider most appropriate.
By these standards, the scorecard for Lithuania's decentralized government is mixed. Municipalbudgets are not yet independent of the budgetary cycle of the central government and there is very littlerevenue autonomy to raise revenues at the margin. Nevertheless, with the important exceptions discussedbelow, municipal governments have discretion to spend their funds as they see fit.
It is necessary to underscore the importance of revenue autonomy, an issue that appears to bemisunderstood in Lithuania. Over the past seven years, considerable discussion and effort has gone intothe form of revenue sharing and transfers. But without some degree of tax autonomy at the municipallevel, the form central government funding takes is in some ways irrelevant because the centralgovernment has always adjusted revenue sharing or transfers to meet the funding level predetermined byan independently estimated "minimum required" budget. The reaction of some municipal officials to thenew Law for Establishing Municipal Budget Income of 1997 was precisely that nothing would changefrom the past because the Ministry of Finance would find a way to restrict overall funding to what it
99

Municipal Finance-Annexes
deemed to be a "minimum required" budget. 49
In practice, municipal budgetary autonomy in Lithuania has been reduced by the lack of a stablemethod of financing local governments, annual changes in revenue sharing, and poor revenue forecasts.The uncertainty associated with funding sources reduced, if it did not eliminate, the municipalities' abilityto plan their expenditures. The new Law for Establishing Municipal Budget Income is an importantattempt to improve on past practices. Until now, municipal governments received almost all their fundsfrom revenue sharing and subventions from the central government, and these were changed every year,their amounts unknown until the central government budget was approved. The new law increases thecertainty of revenue streams by fixing a number of parameters in the transfer formulas for a period ofthree years. Some other important parameters in these formulas, however, will still be determined everyyear. But of greater consequence, revenue sharing of PIT, the most important source of revenue formunicipalities, will still be determined every year, and the sharing rates can be "regulated" or customizedfor each individual municipality.
On the other side of the budgetary autonomy debate is the criticism that municipalities may beabusing their current powers, because they continue to be too heavily involved in "economicdevelopment" activities, acting to the detriment of private initiative. Furthermore, the lack of nationalrules for local codes and regulation for certification processes has led to fraud and corrupt practices.There would appear to be a long agenda for the Ministry of Public Administration Reform and LocalAuthorities (MPARLA) "to regulate the regulatory activities" of municipal governments. In the view ofsome observers in Lithuania, these practices in municipal governance have given decentralization a badname and contributed to the delay of reform.
Issues in Budget Preparation and Structure
OVERALL APPROACH TO BUDGETING. An important problem in budget preparation in Lithuaniahas been, and continues to be, the overall approach to budgeting from a perspective of needs rather thanfrom a consideration of which programs are feasible given current revenue sources.
The tradition inherited from the previous regime was that the first step in the budget process is toput together a minimum required (expenditure) budget for each municipality. The methodology used bythe Ministry of Finance and the municipalities to arrive at this minimum required budget has evolved inrecent times, but conceptually remains the same as in the past-required budgets were developed bottom-up on the basis of an extensive list of budgetary norms. More recently, the minimum required budget wasbuilt on the basis of the past-year budget, adjusted for inflation. After the minimum expenditure budget isdetermined, it may be scaled down further to fit the availability of funds. At the same time, the Ministryof Finance produces a forecast for own municipal revenues.50 The funding gap for each municipality isfilled through revenue sharing. Because tax bases differ across municipalities, the sharing rates for some
49. The "minimum required" budget is a concept inherited from the previous regime, when budgets were formed onthe basis of physical and cost norms that pretended to quantify minimum expenditure needs of governments. Inpractice, the budgets constructed on these bases became maximum budgets, and actual fund allocations wererarely large enough to finance the minimum expenditure need established by the norms. This issue is discussedfurther below.
50. In the process of budget determination, each municipality must accept the Ministry of Finance's estimates ofboth revenue and expenditure projections, although the municipalities are free to make their own projections.In other countries in transition, this process has been more subject to negotiation between central and localgovernments.
100

Municipal Finance-Annexes
taxes are regulated or customized so that the municipality does not receive more funds than allowed in theminimum required budget. Poorer municipalities with lower tax bases receive 100 percent of thecollections from shared taxes, and if this is not enough to cover the minimum required budget, theyreceive a lump-sum transfer for the remaining gap.
The new Law for Establishing Municipal Budget Income of July 1997 takes some significantsteps toward a budgeting approach based on available means rather than needs, but it stops short ofbreaking with the past. This new law brought more budget certainty to municipalities by introducingformula-driven transfers, but it retains the expenditure-need approach to budgeting in two fundamentalways. First, revenue sharing from PIT will continue to be set annually, and supposedly "regulated" by anassessment of budgetarv needs of the municipality by the Ministry of Finance. Second, the first windowof the new system of transfers is still based on the notion of gap-filling for municipalities with actualrevenues that fall short of those forecast. In theory, these forecast revenues will be the counterpart of aminimum required budget.
The approach to budgeting based on a minimum required budget has been criticized for puttingemphasis on the fulfillment of needs by maintaining existing capacity and programs rather than by askingthe hard questions of whether or not some expenditures should be continued, or if there is a more efficientway to achieve the same results. The discontinuation of the use of physical and cost norms and the realityof significant real budget cuts, however, have eroded the severity of these problems. A more enduringproblem is the notion iLhat the central government should still provide the means for fulfilling someminimum expenditure needs. This has had a negative impact on the search for efficiency and in themobilization of revenues at the local level.
On the agenda for future reform in the municipal budget process in Lithuania is the developmentof a local budget law that, among other things, develops an approach to budgeting based on the principlethat the budget is an instrument for implementing programs within available means, not an instrument forfulfilling predetermined needs.
REVENUE FORECASTS. Poor revenue forecasts have been a source of difficulty in budgetpreparation at the local level. The normal difficulties in forecasting in an unstable environment may havebeen exacerbated by the lack of trained staff. There is also a possibility that the authorities ignored morerealistic revenue forecasts and included optimistic revenue projections in the budget for political reasons.Either poor forecasting or political pressures have led to unrealistic budgets and to the use of budgetsequestering during budget execution, as discussed below. Although municipal governments, by law, aresupposed to operate with balanced budgets, in reality they have been running significant deficits in theform of arrears.
The extent of the revenue projection problem is illustrated in table 3-21, where forecast revenuesare shown side-by-side with actual revenues for 1994, 1995, and 1996. The problem has varied fromyear to year, but except for a few municipalities, it has not been disastrous. During 1994, only 84.3percent of the forecast revenues were realized for the consolidated municipal sector. Somemunicipalities, such as Alytus and Varena, barely realized half of their forecast revenue. Performancewas much better during 1995, when actual revenues for the entire sector exceeded forecast revenues byabout 10 percent, but here again, there were municipalities, such as Visaginas, that barely collected halfof forecast revenues. Aggregate actual revenues during 1996 were 94 percent of forecast revenues, andmany municipalities collected 80+ percent of their forecast revenues.
Both the Ministiy of Finance and municipalities must understand the significance of improvedrevenue forecasts, and therefore the need to invest resources in achieving these results. The new revenue
101
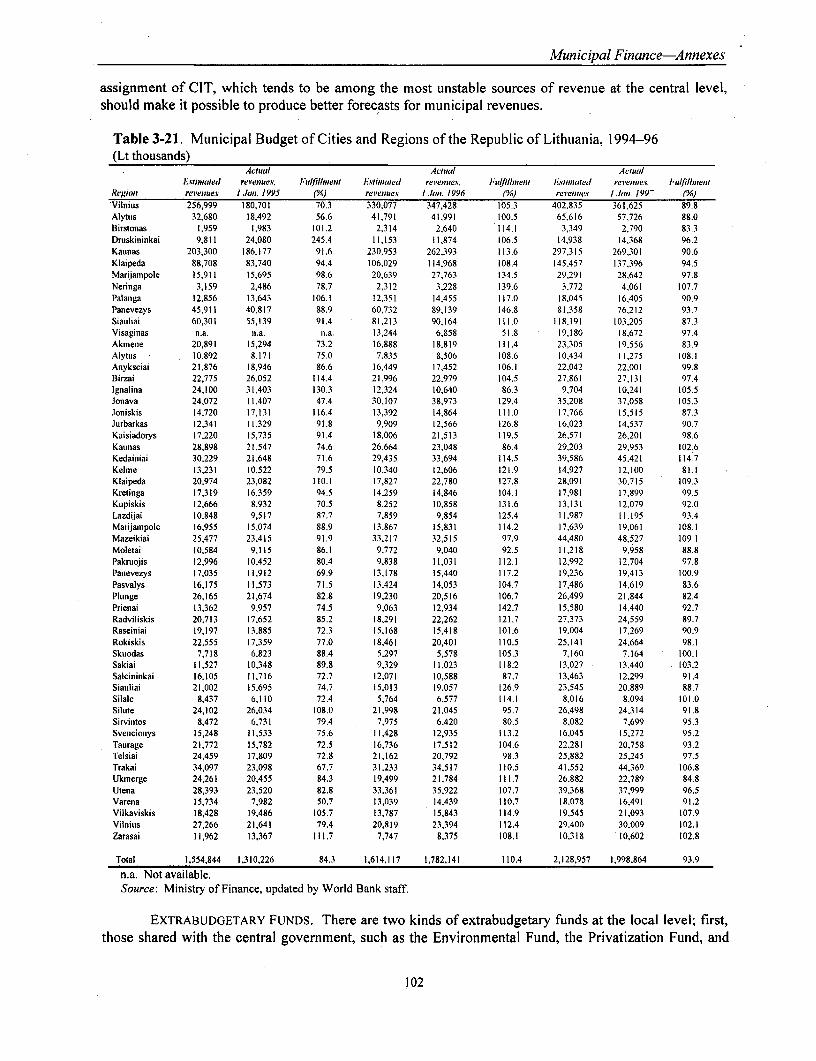
Municipal Finance-Annexes
assignment of CIT, which tends to be among the most unstable sources of revenue at the central level,should make it possible to produce better forecasts for municipal revenues.
Table 3-21. Municipal Budget of Cities and Regions of the Republic of Lithuania, 1994-96(Lt thousands)
Acthiael Acitul ActutrlI si hnated revenues, Ju711filinent I:tinA,ened revenues. Fu rifiln,ent l:s/lat eeld revenues. Iulfiln,ment
Regioan revenues lan. 1995 (Y) revenues 1 lan. 1996 (%/) rlVenues I Jan. 199- (j)Vilnitis 256,999 180,701 70.3 330,077 347,428 105.3 402,835 361,625 89.8Alytus 32.680 18,492 56.6 41,791 41,991 100.5 65;616 57,726 88.0Birstonas 1,959 1,983 101.2 2,314 2,640 114.1 3,349 2,790 83.3Dniskiniinkai 9,811 24,080 245.4 11,153 11,874 106.5 14,938 14.368 96.2Katnas 203,300 186,177 91.6 230,953 262,393 113.6 297,315 269.301 90.6Klaipeda 88,708 83,740 94.4 106,029 114,968 108.4 145.457 137,396 94.5Marijampole 15,911 15,695 98.6 20,639 27,763 134.5 29.291 28,642 97.8Neringa 3,159 2,486 78.7 2,312 3,228 139.6 3.772 4,061 107.7Palanga 12.856 13.643 106.1 12,351 14,455 117.0 18.045 16,405 90.9Panevezys 45,911 40.817 88.9 60,732 89,139 146.8 81,358 76,212 93.7Siauliai 60,301 55,139 91.4 81,213 90,164 111.0 118.191 103,205 87.3Visaginas n.a. ii.a. i.a. 13,244 6,858 51.8 19,180 18,672 97.4Akinene 20,891 15,294 73.2 16,888 18.819 111.4 23,305 19.556 83.9Alytts 10,892 8.171 75.0 7.835 8,506 108.6 10,434 11.275 108.1Anyksciai 21,876 18,946 86.6 16,449 17,452 106.1 22,042 22,001 99.8Birzai 22,775 26,052 114.4 21,996 22.979 104.5 27,861 27,131 97.4Ignalina 24.100 31,403 130.3 12,324 10,640 86.3 9,704 10,241 105.5Jonava 24,072 11,407 47.4 30,107 38.973 129.4 35,208 37,058 105.3Joniskis 14,720 17,131 116.4 13,392 14,864 111.0 17,766 15,515 87.3Jtirbarkas 12,341 11,329 91.8 9,909 12,566 126.8 16,023 14,537 90.7Kaisiadorys 17,220 15,735 91.4 18,006 21,513 119.5 26,571 26,201 98.6Katnas 28,898 21,547 74.6 26,664 23,048 86.4 29,203 29,953 102.6Kedainiai 30,229 21,648 71.6 29,435 33,694 114.5 39,586 45,421 114.7Kelme 13,231 10,522 79.5 10,340 12,606 121.9 14.927 12,100 81.1Klaipeda 20,974 23,082 110.1 17,827 22,780 127.8 28,091 30.715 109.3Kretiniga 17,319 16,359 94.5 14,259 14,846 104.1 17,981 17,899 99.5Kupiskis 12,666 8,932 70.5 8,252 10,858 131.6 13.131 12,079 92.0Lazdijai 10,848 9,517 87.7 7,859 9,854 125.4 11.987 11.195 93.4Marijainpole 16,955 15,074 88.9 13,867 15,831 114.2 17,639 19,061 108.1Mazeikiai 25,477 23,415 91.9 33.217 32,515 97.9 44,480 48,527 109.1Moletai 10,584 9,115 86.1 9.772 9,040 92.5 11,218 9,958 88.8Paknmojis 12,996 10,452 80.4 9,838 11,031 112.1 12,992 i2,704 97.8Panevezys 17,035 11,912 69.9 13,178 15,440 117.2 19,236 19,413 100.9Pasvalys 16,175 11,573 71.5 13.424 14,053 104.7 17,486 14,619 83.6Pltnge 26,165 21,674 82.8 19.230 20,516 106.7 26,499 21,844 82.4Prienai 13.362 9,957 74.5 9.063 12,934 142.7 15,580 14.440 92.7Radviliskis 20,713 17,652 85.2 18,291 22,262 121.7 27,373 24,559 89.7Raseiniai 19,197 13,885 72.3 15.168 15,418 101.6 19,004 17,269 90.9Rokiskis 22,555 17,359 77.0 18,461 20,401 110.5 25,141 24.664 98.1Skiodas 7,718 6,823 88.4 5,297 5,578 105.3 7,160 7,164 100.1Sakiai 11,527 10,348 89.8 9,329 11,023 118.2 13,027 13A440 103.2Salcininkai 16,105 11,716 72.7 12,071 10,588 87.7 13.463 12,299 91.4Siauliai 21,002 15,695 74.7 15,013 19,057 126.9 23.545 20.889 88.7Silale 8,437 6,110 72.4 5,764 6,577 114.1 8,016 8,094 101.0SilLite 24,102 26,034 108.0 21,998 21,045 95.7 26.498 24.314 91.8Sirvintos 8,472 6,731 79.4 7,975 6,420 80.5 8,082 7,699 95.3Svencionys 15,248 11,533 75.6 11,428 12,935 113.2 16.045 15.272 95.2Taturage 21,772 15,782 72.5 16,736 17,512 104.6 22,281 20.758 93.2Telsiai 24,459 17,809 72.8 21,162 20,792 98.3 25,882 25.245 97.5Trakai 34,097 23,098 67.7 31,233 34,517 110.5 41.552 44,369 106.8Ukmerge 24,261 20,455 84.3 19,499 21,784 111.7 26.882 22,789 84.8Utena 28,393 23,520 82.8 33.361 35,922 107.7 39,368 37,999 96.5Varena 15,734 7,982 50.7 13,039 14,439 110.7 18,078 16,491 91.2Vilkaviskis 18,428 19,486 105.7 13,787 15,843 114.9 19,545 21,093 107.9Villnius 27,266 21,641 79.4 20,819 23,394 112.4 29,400 30.009 102.1Zarasai 11,962 13,367 111.7 7,747 8,375 108.1 10,318 10,602 102.8
Total 1,554,844 1,310,226 84.3 1,614,117 1,782,141 110.4 2,128,957 1,998,864 93.9
n.a. Not available.Source: Ministry of Finance, updated by World Bank staff.
EXTRABUDGETARY FUNDS. There are two kinds of extrabudgetary funds at the local level; first,those shared with the central government, such as the Environmental Fund, the Privatization Fund, and
102

Municipal Finance-Annexes
the Road Fund; and second, local extrabudgetary funds properly financed by municipal service fees. Thesize and number of subnational extrabudgetary funds are not known, and there are no reportingrequirements for them. Their relative importance is said to differ by municipality.
The undesirability of extrabudgetary funds is well known. They break the principles ofuniversality and integrality of the budget. They are not subject to the same level of scrutiny as regularbudget funds, which means that they generally lack adequate accountability. The use of multipleextrabudgetary funds decreases the careful consideration of priorities in the allocation of publicresources. With the exception of social insurance and pension funds, which can be justified as beingoutside the budget at the central level, all other extrabudgetary funds, including those of municipalities,should be fully integrated into the regular budgets.
CAPITAL INVESTMENTS. The management of the investment program for municipalities remainsa weak point; funds are still allocated to individual investment projects for municipal investments over Lt5 million.51 The Ministry of Economy is responsible for evaluating the requests from the municipalities.The selection criteria are not transparent, and the choice of a Lt 5 million threshold may discriminateagainst smaller but more efficient projects, and perhaps against smaller municipalities.5 2 The majority ofthe proposals approved by the Ministry of Economy involve the completion of unfinished projects, andthese proposals do not always seem to be subject to a rigorous economic analysis.53
It would be desirable to improve the planning framework and time horizon for theseexpenditures. The large number of programs that remain incomplete at the local level is a clear reflectionof these needs. One option would be to pool the funds into well-defined sectoral programs with clearguidelines for eligibility, perhaps with cofinancing by the municipalities.
Issues of Budget Execution
EFFECTIVENESS OF EXPENDITURE CONTROLS AND BUDGETARY ARREARS. Among the mostserious problems in budget execution is the lack of efficient control of expenditures. The municipalitiesstill rely on the control of cash release to spending units as the primary mechanism for expenditurecontrol. Once the spending unit has been credited the funds, it can write checks up to the maximumauthorized in the budget. The unit is supposed to report the actual balances drawn from the accountmonthly, but this can differ from the expenditures the spending unit has accrued during the period. Thisis how substantial arrears are possible within the budget system.
We have direct evidence of arrears only in the two largest municipalities, Vilnius and Kaunas.These municipal governments appear to be using arrears, or the postponement of payments due, as asource of regular financing. Arrears can be quantified by the difference between cash payments andpayment obligations. Arrears are also created by delaying the processing of incoming bills prior to thewriting of payment orders. In the case of Vilnius, half of the arrears are in the nonpayment of socialsecurity contributions and withheld PIT to the State Tax Inspectorate. Other arrears are in wages,heating bills, and other services (table 3-22). The actual size of the arrears at the consolidated municipal
51. This issue was addressed in the World Bank, Lithuania: Public Expenditure Review (Washington, D.C., 1994).52. For projects under Lt 5 million, municipalities have to use their own funds.53. It is not clear how much weight is given to the option of leaving the unfinished projects as sunk costs.
103

Municipal Finance-Annexes
level is not known, but it could be considerable.54
Table 3-22. City of Vilnius Arrears, 1996 and 1997(Lt thousands)Item 1996 1997aTotal arrears 72,030.6 98,673.6
Wages 8,009.1 8,965.9Individual income tax 9,616.5 34,576.9Social security contributions 7,570.9 16,454.7Heating 21,460.5 4,639.1Community services 29.0 81.5Transportation expenses 1,034.8 980.7a. For the first six months.Source: City of Vilnius.
Part of the solution to the expenditure control problem is the adoption of a treasury function at thelocal level. This will permit the control of expenditures in three stages: (a) the commitment ofexpenditures, meaning that budget appropriations are authorized, contracts are signed, and procurement isinitiated; (b) the verification stage, in which work is completed, bills received, and the obligation to pay isverified by each spending unit; and (c) the payment stage. Part of the current problem is that control ofexpenditures is done at the payment stage rather than at the time of commitment. The effective constrainton expenditures is actually exercised by limiting the amount of fund transfers to the spending units. Thismeans that there are no checks or information flows on spending until the payment obligation has beengenerated.
The introduction of a treasury function at the local level may not stop all arrears (for example,social security and PIT payments), but it will stop many. A modern treasury function will also help withother aspects of budget execution, including cash and debt management, accounting, and procurement.From a practical viewpoint, carrying arrears may only provide municipal governments with temporaryrelief."5
IMPLEMENTATION FLEXIBILITY. Another important issue in budget execution is giving spendingunits the necessary flexibility to implement the budget. Municipalities are subject to rigid national wagescales, and Seimas requires that the wage fund be no larger than the amount spent last year in wages, plusan adjustment for inflation. The lack of flexibility in wage setting has caused a high turnover amongemployees, who are looking for better-paid jobs in the private sector. The problem is more acute inspecial skills. In the longer term, GoL should give freedom to municipal governments to set wages andsalaries at levels that can compete with the private sector within the geographical area.
Another persistent problem of budget implementation flexibility is that municipalities cannotclose facilities or reorganize them without prior permission from the line ministry. For example, themunicipality cannot close a school without official permission from the Ministry of Education. Of
54. If, on average, all municipalities have arrears proportional to those of Vilnius, the level of arrears for allmunicipalities would have have been close to Lt 400 million in 1996 (about I percent of GDP) and Lt 520million (1.10 percent of GDP) in 1997.
55. Prices charged by suppliers will tend to be adjusted upward to compensate for the additional financial costs ofdelayed payment. More often than not, total costs for governments will be higher when significant arrears arecarried. It should be noted that arrears to private providers tend to be less than those to public entities becausemany private vendors demand to be paid on delivery.
104
Municipal Finance-Annexes
course, these rules severely limit the budgeting implementation efficiency of local governments.Municipalities should have complete discretion to manage the hiring of inputs to deliver the publicservices assigned to them. The constraints set by the central government on the use of funds for targetedcapital transfers, however, are entirely reasonable and should be kept.
BUDGET SEQUESTERING. An important development in budget execution procedures has beenthe linking of expenditure payments to actual cash collections through sequestering. Although suchresponsible budget practices are laudable, these practices also carry the risk of significant perverseresults. Without a detailed plan from policymakers setting priorities for all items in the budget,sequestering de facto empowers those officials in charge of budget execution with the right to redirectbudget priorities.56 It would appear, however, that in many instances sequestering priorities are dictatedby the municipal councils. At some point of budgetary shortfall, it becomes more desirable to adopt arevised budget plan.
The only way to get rid of the need for budget sequestering is to formulate more realistic budgets.The Budget Formation Law of 1990 is silent on how to proceed in the implementation of sequestering. Afuture local budget law should regulate budget sequestering and introduce explicit rules for triggering aformal process for revision of the overall budget.
Issues of Budget Control, Audit, and Evaluation
In theory, three different budget compliance functions are required in this phase of the budget cycle.First, internal control and an audit are carried out by the government agencies themselves, to check thelegality of disbursements. Second, external audit is carried out ex-post by an independent institution orone that responds exclusively to the legislative branch of government to verify the legality and correct useof funds by the spending agencies in the executive branch. Third, the evaluation of budget programs iscarried out by several institutions, with an emphasis on outcomes and performance, and with the purposeof improving the effectiveness of government expenditures. These three modes of compliance arecomplementary and reinforcing.
Budget compliance measures, except for internal control, lack tradition in Lithuania. Internalaudit and control practices were strong and effective under the previous regime. Ex-post monitoring andaudit is incipient at the municipal level. External ex-post audit at the municipal level is carried out by thecomptroller, who is appointed by, and reports to, the Municipal Council. In addition, the StateComptroller's Office, which performs the audit of central government accounts, can audit municipalgovernment accounts as requested by central authorities. Because there is no separation of powers at themunicipal level (the mayor is not elected directly, but rather is appointed by the Municipal Council), theremay be an issue with the proper detachment and independence of the municipal comptroller. The maincharge of the comptroller is to prevent and uncover inappropriate or fraudulent use of funds.
Little or no budget evaluation is now carried out. The focus of the evaluation function is on theeffectiveness of public expenditure programs; this allows reexamination of the relevance of the programobjectives in the context of the problems and needs initially identified, and of the correspondencebetween the resources allocated to the program and final performance.
The strengthening of ex-ante internal control will be accomplished by the creation of a treasuryfunction at the municipal level. Internal control should also be reinforced by (i) the adoption ofadministrative sanctions based on shared responsibility for infractions or for fraudulent use of funds, and
56. The room for distortion is larger, the smaller the share that is eventually executed out of the planned budget.
105

Municipal Finance-Annexes
(ii) the establishment of explicit rules and regulations for the management of public funds, procurement,and conflicts of interest.
There also seems to be consensus on the need to complete and reinforce the external auditfunction. Independent audits of municipal finances by private accounting firms is an option that shouldbe considered in the drafting of a future local budget law. There is also a need for an effective budgetevaluation function. The comptroller and budget departments of the municipalities should be trained inbudget and program evaluation techniques.
106

Municipal Finance-Annexes
ANNEX 3-3. Simulations of Equalization Transfers: A Description of the Methodology
The simulations performed in this Annex are based on the newly introduced Law on MunicipalGovernment Revenues for 1997. They assume that funding from the central government is set at Lt332,438 thousand, which is all allocated to Window 11. Resources from the fraternal reserve fund areallocated in Window 111. Because the allocation of funds in Window I is determined ex-post uponshortfalls of forecast revenues, no funds are allocated to Window I in the simulations. A summary of thethree windows, with definitions of terms and symbols, is presented in box 3-1.
Simulation results are presented in tables 3-23 and 3-24. Table 3-23 shows the allocation ofresources to all municipal governments, depending on one specific set of assumptions, which are stated inthe footnote to the table.
Table 3-24 presents the descriptive statistics for several simulations based on varyingassumptions. For comparison purposes, table 3-24 also presents descriptive statistics on the level of percapita revenues before transfers for 1997, as well as the distribution of revenues for 1996 using the oldmethod of gap-filling transfers. That is, for 1996, municipal revenues were generated from own-sources,shared revenues, and subventions based on gap-filling principles. Table 3-24 shows five additionalsimulated distributions of revenues for 1997. These simulations are the result of different assumptionsconcerning the parameters in the fraternal sharing formula and the definition of the demographic factorformula.
Window I
According to the new legislation, the allocation of resources in Window I is based on the differencebetween actual and forecast levels of municipal revenue collections. For the purpose of thesesimulations, no funds are distributed in Window 1, thus D1 = 0.
Window II
In the simulations presented in this note, all central government funds are allocated to thiswindow (thus D = D2 ). The allocation of resources in this window depends on two parameters, K andH. These parameters are set at K = 0.95 and H = 0.95. This means that regions that collect less than thebenchmark of 95 percent of average per capita revenues will receive a transfer of 95 percent of the gapbetween per capita regional revenue collections and the benchmark. The simulated distribution of fundsin Window 11 is based on forecasts of municipal revenue collections for 1997. The amount allocated tothis window (Lt 332,438 thousand) is exactly equal to the amount necessary to finance equalization of thepoorer regions up to 95 percent of the benchmark level.
Window III
FRATERNAL POOL. The fraternal fund is allocated fully to Window III (thus D3 = P). Unlessstated otherwise, the parameters used in these simulations are k = 1I.1 and h = 0.5. This would mean thatonly regions that have per capita collections more than 10 percent above the national average pay into thereserve fund. These parameters would result in a reserve fund of Lt 151,743 thousand. Alternatively,when the parameter values are adjusted to k = I and h = 1, a reserve fund of Lt 400,669 thousand isproduced.
DISTRIBUTION OF FUNDS. Several variations of need-based equalization were simulated as a
107
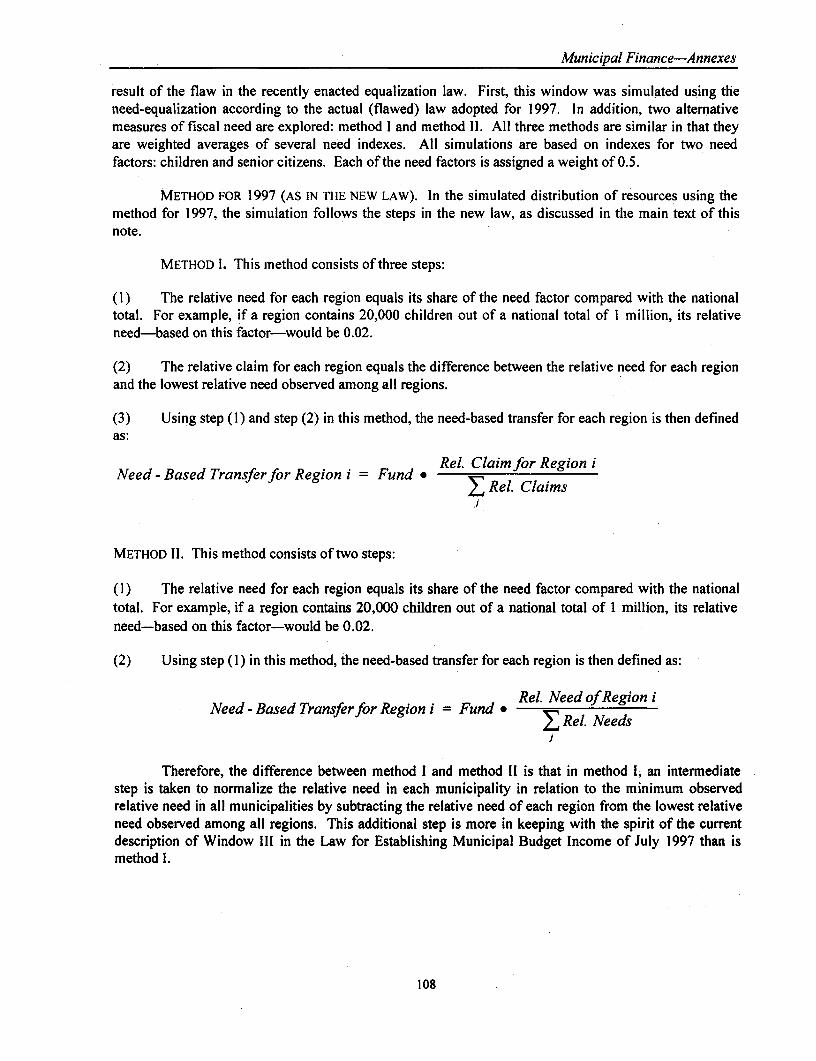
Municipal Finance-Annexes
result of the flaw in the recently enacted equalization law. First, this window was simulated using theneed-equalization according to the actual (flawed) law adopted for 1997. In addition, two alternativemeasures of fiscal need are explored: method I and method II. All three methods are similar in that theyare weighted averages of several need indexes. All simulations are based on indexes for two needfactors: children and senior citizens. Each of the need factors is assigned a weight of 0.5.
METHOD FOR 1997 (AS IN THE NEW LAW). In the simulated distribution of resources using themethod for 1997, the simulation follows the steps in the new law, as discussed in the main text of thisnote.
METHOD 1. This method consists of three steps:
(1) The relative need for each region equals its share of the need factor compared with the nationaltotal. For example, if a region contains 20,000 children out of a national total of I million, its relativeneed-based on this factor-would be 0.02.
(2) The relative claim for each region equals the difference between the relative need for each regionand the lowest relative need observed among all regions.
(3) Using step (1) and step (2) in this method, the need-based transfer for each region is then definedas:
Rnel. Claim for Region iNeed - Based Transferfor Region i = Fund * Rel. Claims
METHOD 11. This method consists of two steps:
(1) The relative need for each region equals its share of the need factor compared with the nationaltotal. For example, if a region contains 20,000 children out of a national total of 1 million, its relativeneed-based on this factor-would be 0.02.
(2) Using step (1) in this method, the need-based transfer for each region is then defined as:
Rel. Need of Region iNeed - Based Transfer for Region i = Fund * Rel. Needs
Therefore, the difference between method I and method II is that in method I, an intermediatestep is taken to normalize the relative need in each municipality in relation to the minimum observedrelative need in all municipalities by subtracting the relative need of each region from the lowest relativeneed observed among all regions. This additional step is more in keeping with the spirit of the currentdescription of Window III in the Law for Establishing Municipal Budget Income of July 1997 than ismethod 1.
108
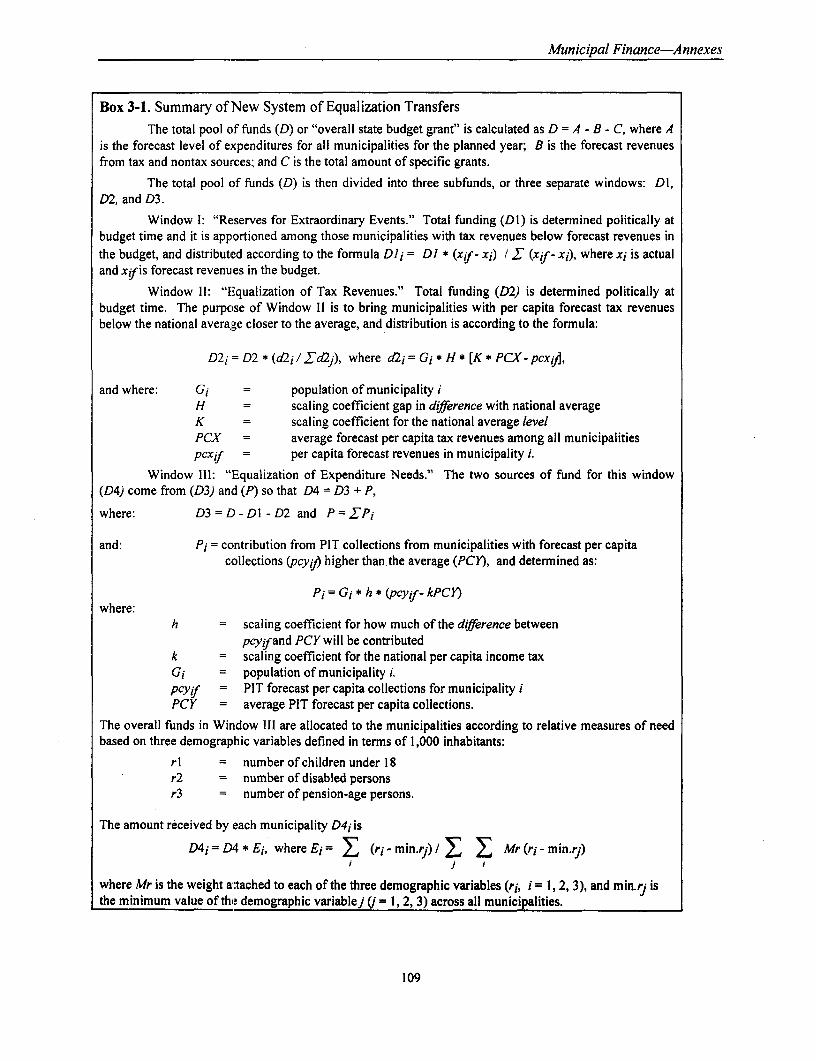
Municipal Finance-Annexes
Box 3-1. Summary of New System of Equalization Transfers
The total pool of funds (D) or "overall state budget grant" is calculated as D = A - B - C, where Ais the forecast level of expenditures for all municipalities for the planned year; B is the forecast revenuesfrom tax and nontax sources; and C is the total amount of specific grants.
The total pool of funds (D) is then divided into three subfunds, or three separate windows: Di,D2, and D3.
Window 1: "Reserves for Extraordinary Events." Total funding (DI) is determined politically atbudget time and it is apportioned among those municipalities with tax revenues below forecast revenues inthe budget, and distributed according to the formula Dli = Dl * (xif - xi) / (xif - xi), where xi is actualand xif is forecast revenues in the budget.
Window If: "E,qualization of Tax Revenues." Total funding (D2) is determined politically atbudget time. The purpose of Window 11 is to bring municipalities with per capita forecast tax revenuesbelow the national average closer to the average, and distribution is according to the formula:
D2i D2 * (d2i/Zd2j), where d2i= Gi * H * [K * PCX- pcxYj,
and where: Gi = population of municipality iH = scaling coefficient gap in difference with national averageK = scaling coefficient for the national average levelPCX = average forecast per capita tax revenues among all municipalitiespcxif = per capita forecast revenues in municipality i.
Window Ill: "Equalization of Expenditure Needs." The two sources of fund for this window(D4) come from (D3) an(d (P) so that D4 = D3 + P,
where: D3 = L) -Di - D2 and P = ZPi
and: Pi = contribution from PIT collections from municipalities with forecast per capitacollections (pcyip) higher than the average (PCI), and determined as:
Pi =Gi * h * (pcyi- kPCY)where:
h = scaling coefficient for how much of the difference betweenpcyif and PCY will be contributed
k = scaling coefficient for the national per capita income taxGi = population of municipality i.pcyif = PIT forecast per capita collections for municipality iPCY = average PIT forecast per capita collections.
The overall funds in Window Ill are allocated to the municipalities according to relative measures of needbased on three demographic variables defined in terms of 1,000 inhabitants:
rI = number of children under 18r2 = number of disabled personsr3 = number of pension-age persons.
The amount received by each municipality D4i is
D4i= D4 * Ei, whereEi= E (ri- min.rjl E Mr(ri- min.rj)J I
where Mr is the weight aittached to each of the three demographic variables (ri, i = 1, 2, 3), and min.rj isthe minimum value of the demographic variablej (1 = 1, 2, 3) across all municipalities.
109

Municipal Finance-Annexes
Table 3-23. Lithuania: Simulated Equalization Transfers for 1997 Based on the Law of MunicipalBudget Income (Lt thousands)
Local tax Payment into Transferfor Transferfor Transferfor Local revenueRegion revenue reserve fund Window I Windowv II Windowv III after transfersVilnius 530,278 90,550 0 0 21,373 461,101Alytus 57,239 5,336 0 0 2,762 54,664Birstonas 2,090 0 0 0 64 2,154Druskininkai 11,665 0 0 0 826 12,491Kaunas 265,152 6,560 0 0 16,438 275,030Klaipeda 185,208 31,427 0 0 7,797 161,577Marijampole 34,266 1,493 0 0 1,993 34,766Neringa 3,967 1,183 0 0 0 2,784Palanga 14,882 1,507 0 0 708 14,083Panevezys 98,101 8,918 0 0 5,107 94.290Siauliai 89,556 538 0 0 5,647 94,665Visaginas 11,215 0 0 5,894 1,035 I8.143Akmene raj. 14,410 0 0 5,590 1,667 21.667Alytus raj. 9,626 0 0 7.300 1,648 18,574Anyksciai raj. 13,965 0 0 5,515 1,805 21,285Birzai raj. 15,754 0 0 4,057 1,740 21,551Ignalina raj. 10,445 0 0 2,565 1,132 14,142Jonava raj. 36,231 1,682 0 0 2,053 36,602Joniskis raj. 12,140 0 0 5,482 1,460 19,081Jurbarkas raj. 13,082 0 0 7,710 1,783 22,576Kaisiadorys raj. 21,815 0 0 0 1,756 23,571Kaunas raj. 24,744 0 0 16,950 3,338 45,032Kedainiai raj. 34,089 0 0 2,229 2,972 39,290Kelme raj. 10,199 0 0 11,693 1,978 23.869Klaipeda raj. 18,590 0 0 4,702 1,933 25,226Kretingaraj. 14,354 0 0 9,155 1.977 25,486Kupiskis raj. 9,914 0 0 3,511 1,161 14,587Lazdijai raj. 8,030 0 0 8,605 1,610 18,245Marijampole raj. 15,181 0 0 10,829 2,376 28,386Mazeikiai raj. 43,766 2,548 0 0 2,571 43.788Moletai raj. 8,640 0 0 4,948 1,213 14,801Pakruojis raj. 10,635 0 0 5,202 1,332 17,169Panevezys raj. 15,137 0 0 6,239 1,914 23,290Pasvalys raj. 12,340 0 0 6,601 1,650 20,591Plunge raj. 18,288 0 0 10,746 2,532 31,566Prienai raj. 12,114 0 0 7,739 1,810 21,663Radviliskis raj. 20,356 0 0 7,846 2,464 30,666Raseiniai raj. 14,091 0 0 9,664 2,111 25,866Rokiskis raj. 17,406 0 0 6,398 2,123 25,927Skuodas raj. 5,934 0 0 8,079 1,223 15,236Sakiai raj. 10,797 0 0 10,641 1,957 23,394Salcininkai raj. 10,319 0 0 10,080 1,728 22,126Siauliai raj. 16,326 0 0 10,229 2,305 28,861Silali raj. 6,508 0 0 10,264 1,493 18,265Silute raj. 19,975 0 0 15,876 3,095 38,945Sirvintos raj. 6,675 0 0 4,383 926 11,984Svencionys raj. 12,722 0 0 5,615 1,617 19,954Taurage raj. 17,506 0 0 11,069 2,395 30,970Telsiai raj. 18,847 0 0 12.416 2,679 33,942Trakai raj. 33,103 0 0 8,010 3,255 44,368Ukmerge raj. 18,564 0 0 7,774 2,286 28,624Utena raj. 30,787 0 0 0 2,263 33,050Varenaraj. 13,379 0 0 5,571 1,681 20,631Vilkaviskis raj. 15,454 0 0 11,551 2,374 29,378Vilnius raj. 24,003 0 0 19,750 3,510 47,263Zarasai raj. 8,751 0 0 4,005 1,103 13,858
Total 2,028,611 151,743 0 332,483 151,743 2,361,094
Note: The similation is based on the following assumptions:Equalization Fund is Lt 332,483 thousand, allocated to Window 11; where K= 0.95 and H 0.95.Payments into 'fratemal' Reserve Fund are based on k = 1.1 and h = 0.5, allocated to Window Ill.Funds in Window Ill are allocated based on method 1.See the text for a complete description of the equalization mechanism.
110
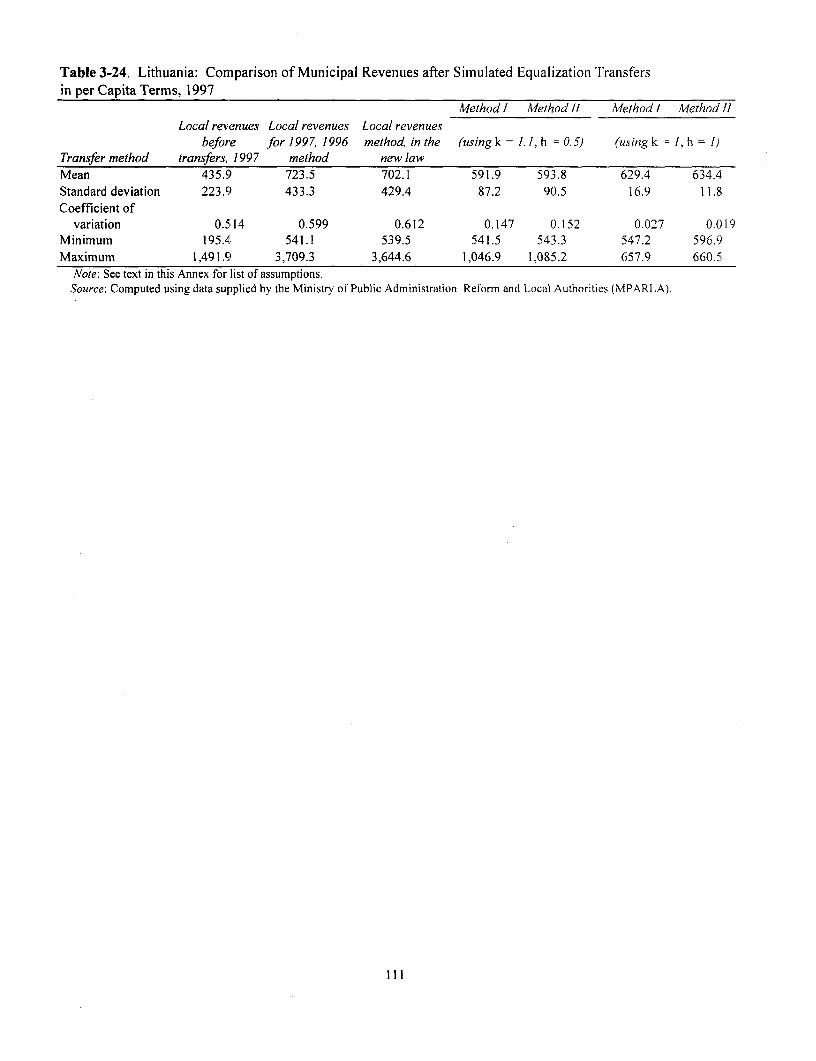
Table 3-24. Lithuania: Cornparison of Municipal Revenues after Simulated Equalization Transfersin per Capita Terms, 1997
Method I Method 1/ Method I Method 11Local revenues Local revenues Local revenues
before for 1997, 1996 method, in the (using k = 1.1, h = 0.5) (using k = 1, h - 1)Transfer method transfers, 1997 method new lawMean 435.9 723.5 702.1 591.9 593.8 629.4 634.4Standard deviation 223.9 433.3 429.4 87.2 90.5 16.9 11.8Coefficient of
variation 0. 514 0.599 0.612 0.147 0.152 0.027 0.019Minimum 195.4 541.1 539.5 541.5 543.3 547.2 596.9Maximum 1,491.9 3,709.3 3,644.6 1,046.9 1,085.2 657.9 660.5
Note: See text in this Annex for list of assumptions.Source: Computed using data supplied by the Ministry of Public Administration Reforn and Local Authorities (MPARLA).
111


ANNEX 3-4
International Comparison Tables
113

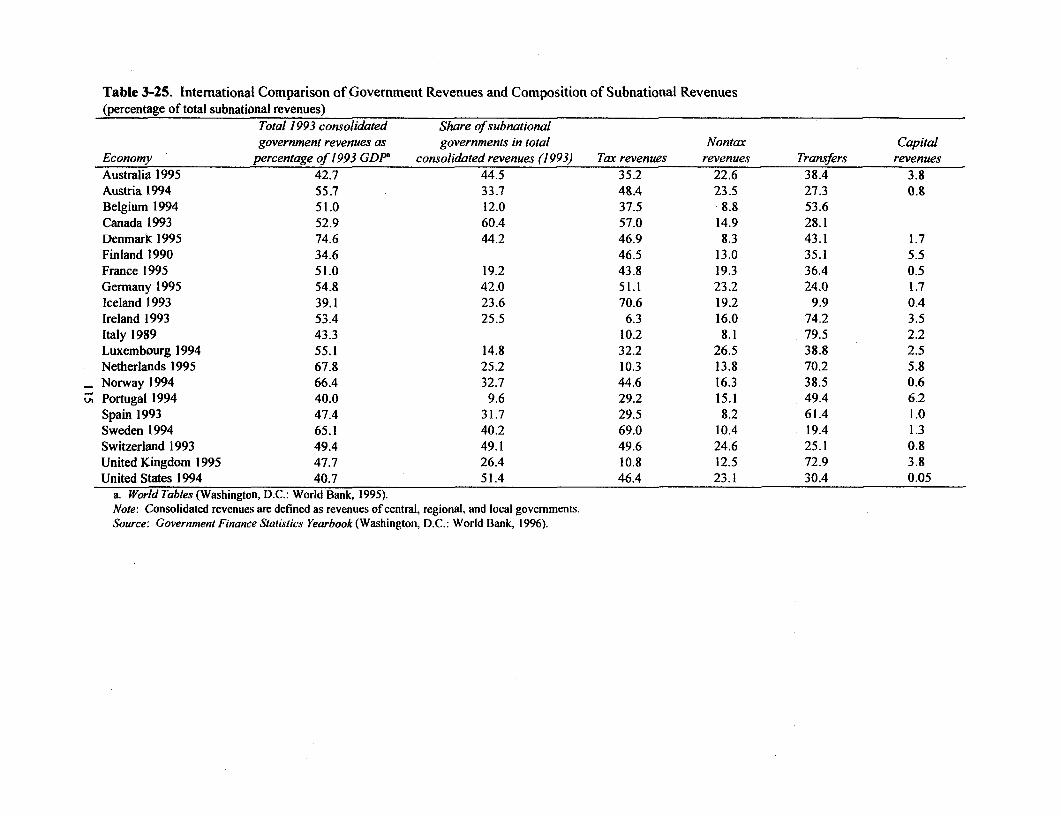
Table 3-25. International Comparison of Government Revenues and Composition of Subnational Revenues(percentage of total subnational revenues)
Total 1993 consolidated Share of subnationalgovernment revenues as governments in total Nontax Capital
Economy percentage of 1993 GDP' consolidated revenues (1 993) Tax revenues revenues Transfers revenuesAustralia 1995 42.7 44.5 35.2 22.6 38.4 3.8Austria 1994 55.7 33.7 48.4 23.5 27.3 0.8Belgium 1994 51.0 12.0 37.5 8.8 53.6Canada 1993 52.9 60.4 57.0 14.9 28.1Denmark 1995 74.6 44.2 46.9 8.3 43.1 1.7Finland 1990 34.6 46.5 13.0 35.1 5.5France 1995 51.0 19.2 43.8 19.3 36.4 0.5Germany 1995 54.8 42.0 51.1 23.2 24.0 1.7Iceland 1993 39.1 23.6 70.6 19.2 9.9 0.4Ireland 1993 53.4 25.5 6.3 16.0 74.2 3.5Italy 1989 43.3 10.2 8.1 79.5 2.2Luxembourg 1994 55.1 14.8 32.2 26.5 38.8 2.5Netherlands 1995 67.8 25.2 10.3 13.8 70.2 5.8Norway 1994 66.4 32.7 44.6 16.3 38.5 0.6
Z Portugal 1994 40.0 9.6 29.2 15.1 49.4 6.2Spain 1993 47.4 31.7 29.5 8.2 61.4 1.0Sweden 1994 65.1 40.2 69.0 10.4 19.4 1.3Switzerland 1993 49.4 49.1 49.6 24.6 25.1 0.8United Kingdom 1995 47.7 26.4 10.8 12.5 72.9 3.8United States 1994 40.7 51.4 46.4 23.1 30.4 0.05
a. World Tables (Washington, D.C.: World Bank, 1995).Note: Consolidated revenues are defined as revenues of central, regional, and local govemments.Source: Government Finance Statistics Yearbook (Washington, D.C.: World Bank, 1996).

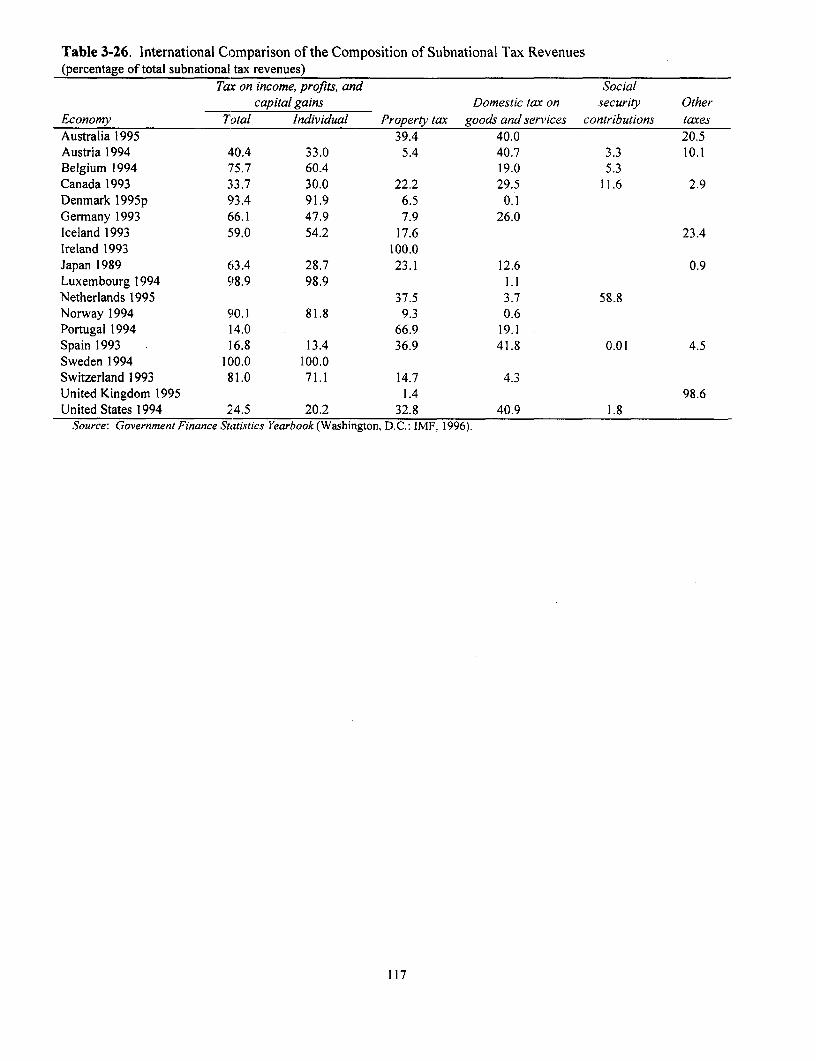
Table 3-26. International Comparison of the Composition of Subnational Tax Revenues(percentage of total subnational tax revenues)
Tax on income, profits, and Socialcapital gains Domestic tax on security Other
Economy Total Individual Property tax goods and services contributions taxesAustralia 1995 39.4 40.0 20.5Austria 1994 40.4 33.0 5.4 40.7 3.3 10.1Belgium 1994 75.7 60.4 19.0 5.3Canada 1993 33.7 30.0 22.2 29.5 11.6 2.9Denmark 1995p 93.4 91.9 6.5 0.1Germany 1993 66.1 47.9 7.9 26.0Iceland 1993 59.0 54.2 17.6 23.4Ireland 1993 100.0Japan 1989 63.4 28.7 23.1 12.6 0.9Luxembourg 1994 98.9 98.9 1.1Netherlands 1995 37.5 3.7 58.8Norway 1994 9l0.1 81.8 9.3 0.6Portugal 1994 14.0 66.9 19.1Spain 1993 16.8 13.4 36.9 41.8 0.01 4.5Sweden 1994 100.0 100.0Switzerland 1993 81.0 71.1 14.7 4.3United Kingdom 1995 1.4 98.6United States 1994 24.5 20.2 32.8 40.9 1.8
Source: Government Finance Statistics Yearbook (Washington. D.C.: IMF. 1996).
117


Table 3-27. International Comparison of Government Expenditures and Composition of Subnational Government Expenditures(percent)
Subnational government expenditures as percentage of total subnational expenditures
1993 Share ofconsolid. subnational General
general ex- governments in public Housingpenditures as general coo.lid. services, und Recreation, Ts.portationpercentage of expenditures, public order, community cultural and and Other
Economy/year 1993 GDPa 1993 and safety Education Health Welfare amenities religion communication expendituresAustralia 1995 47.3 41.5 17.4 24.2 16.5 4.8 5.6 4.2 11.1 16.3
Austria 1994b 60.1 31.2 12.8 22.1 20.2 22.8 4.3 2.8 5.1 9.9
Canada 1993 60.8 58.3 9.7 24.2 19.9 16.7 4.6 2.5 5.7 16.7
Denmark 77.2 43.6 3.6 11.1 14.8 58.2 2.2 3.0 3.1 3.8l995p
France 1993 57.1 17.6 12.8 19.5 2.3 17.6 24.0 7.6 3.6 12.5
Germany 1991 33.6 12.7 17.0 10.4 20.7 9.9 3.9 5.3 20.1
Iceland 1993 43.4 23.9 5.9 14.3 1.0 16.7 6.7 16.8 11.0 27.6
Ireland 1993 55.8 24.1 4.3 11.2 45.9 6.1 12.0 2.1 12.5 6.0
Luxembourg 53.1 16.1 13.8 15.7 0.3 6.7 20.9 11.8 13.3 17.51994
Netherlands 71.5 24.6 12.8 17.9 2.6 22.6 20.0 5.8 6.7 11.61995
Norway 1994 69.2 31.5 6.1 21.3 28.5 17.6 7.7 4.5 5.5 8.9
Spain 1993 55.9 29.6 5.2 25.1 31.7 5.5 4.2 3.5 5.0 19.7
Switzerland 52.5 48.4 9.7 25.4 17.5 12.2 4.9 3.5 9.1 17.61993
United 55.1 22.8 19.1 29.2 13.2 21.2 3.4 5.5 8.5Kingdom 1995
United States 44.2 46.0 10.7 36.2 17.0 13.5 1.2 1.7 7.1 12.71994a. World tables (Washington, D.C.: IMF, 1995).b. The composition of subnational government expenditures contains only the regional level.Source: Government Finance Statistics Yearbook (Washington, D.C.: IMF, 1995).
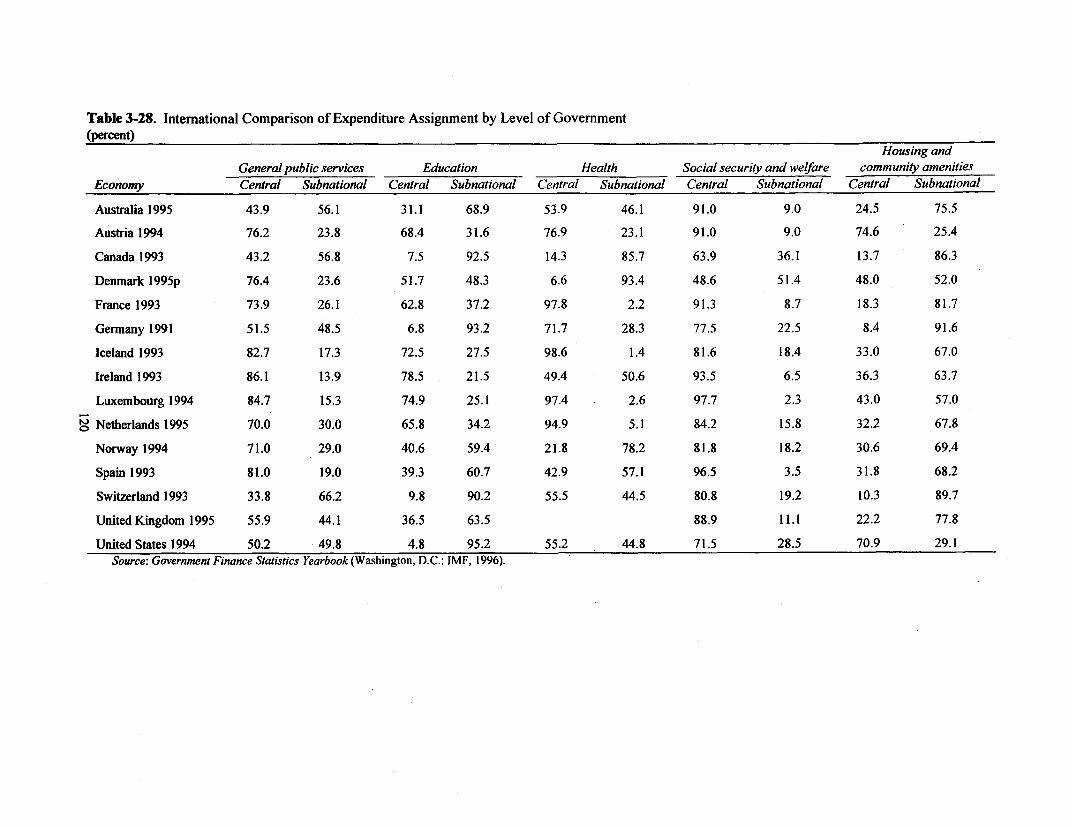
Table 3-28. International Comparison of Expenditure Assignment by Level of Government(percent)
Housing andGeneral public services Education Health Social security and welfare community amenities
Economy Central Subnational Central Subnational Central Subnational Central Subnational Central Subnational
Australia 1995 43.9 56.1 31.1 68.9 53.9 46.1 91.0 9.0 24.5 75.5
Austria 1994 76.2 23.8 68.4 31.6 76.9 23.1 91.0 9.0 74.6 25.4
Canada 1993 43.2 56.8 7.5 92.5 14.3 85.7 63.9 36.1 13.7 86.3
Denmark 1995p 76.4 23.6 51.7 48.3 6.6 93.4 48.6 51.4 48.0 52.0
France 1993 73.9 26.1 62.8 37.2 97.8 2.2 91.3 8.7 18.3 81.7
Germany 1991 51.5 48.5 6.8 93.2 71.7 28.3 77.5 22.5 8.4 91.6
Iceland 1993 82.7 17.3 72.5 27.5 98.6 1.4 81.6 18.4 33.0 67.0
Ireland 1993 86.1 13.9 78.5 21.5 49.4 50.6 93.5 6.5 36.3 63.7
Luxembourg 1994 84.7 15.3 74.9 25.1 97.4 2.6 97.7 2.3 43.0 57.0
9 Netherlands 1995 70.0 30.0 65.8 34.2 94.9 5.1 84.2 15.8 32.2 67.8
Norway 1994 71.0 29.0 40.6 59.4 21.8 78.2 81.8 18.2 30.6 69.4
Spain 1993 81.0 19.0 39.3 60.7 42.9 57.1 96.5 3.5 31.8 68.2
Switzerland 1993 33.8 66.2 9.8 90.2 55.5 44.5 80.8 19.2 10.3 89.7
United Kingdom 1995 55.9 44.1 36.5 63.5 88.9 11.1 22.2 77.8
United States 1994 50.2 49.8 4.8 95.2 55.2 44.8 71.5 28.5 70.9 29.1Source: Government Finance Statistics Yearbook (Washington, D.C.: IMF, 1996).
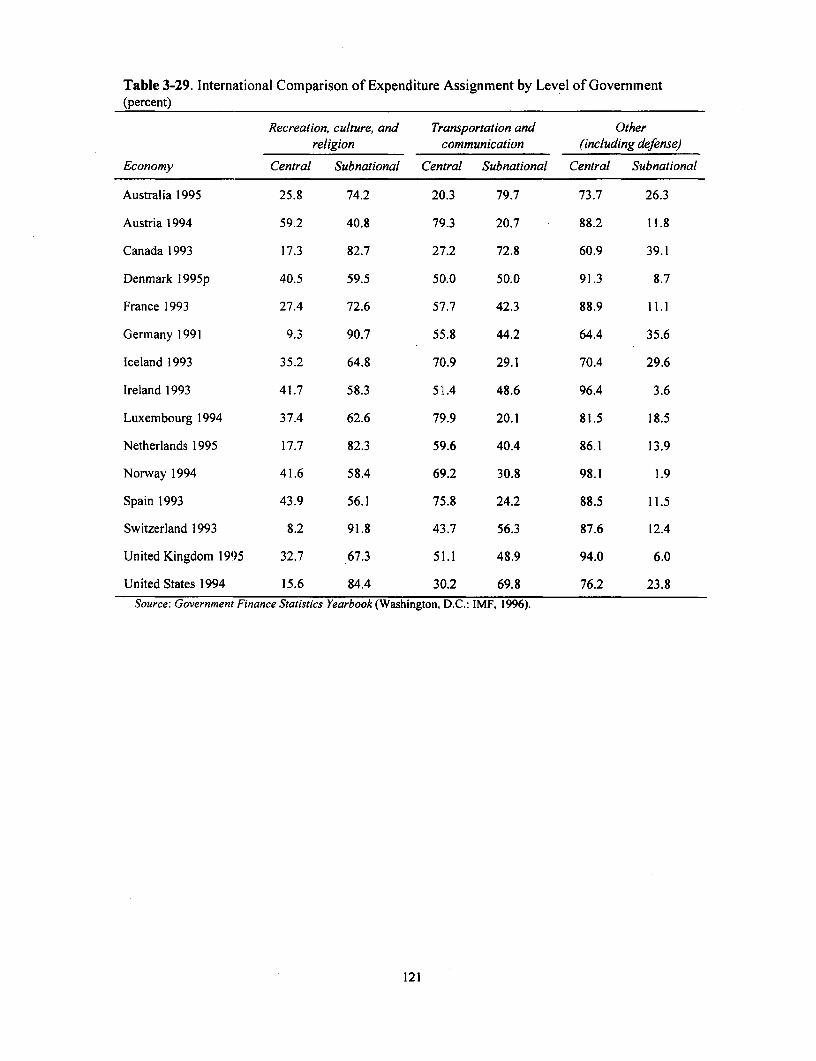
Table 3-29. International Comparison of Expenditure Assignment by Level of Government(percent)
Recreation, culture, and Transportation and Otherreligion communication (including defense)
Economy Central Subnational Central Subnational Central Subnational
Australia 1995 25.8 74.2 20.3 79.7 73.7 26.3
Austria 1994 59.2 40.8 79.3 20.7 88.2 11.8
Canada 1993 17.3 82.7 27.2 72.8 60.9 39.1
Denmark 1995p 40.5 59.5 50.0 50.0 91.3 8.7
France 1993 27.4 72.6 57.7 42.3 88.9 11.1
Germany 1991 9.3 90.7 55.8 44.2 64.4 35.6
Iceland 1993 35.2 64.8 70.9 29.1 70.4 29.6
Ireland 1993 41.7 58.3 51.4 48.6 96.4 3.6
Luxembourg 1994 37.4 62.6 79.9 20.1 81.5 18.5
Netherlands 1995 17.7 82.3 59.6 40.4 86.1 13.9
Norway 1994 41.6 58.4 69.2 30.8 98.1 1.9
Spain 1993 43.9 56.1 75.8 24.2 88.5 11.5
Switzerland 1993 8.2 91.8 43.7 56.3 87.6 12.4
United Kingdom 1995 32.7 67.3 51.1 48.9 94.0 6.0
United States 1994 15.6 84.4 30.2 69.8 76.2 23.8
Source: Government Finance Statistics Yearbook (Washington, D.C.: IMF, 1996).
121

4AGRICULTURE
As it was in other Baltic countries in the pre-Soviet period, agriculture was one of the most significantcomponents of the Lithuanian economy. Lithuania, like the other Baltic countries, went through a rapidperiod of industrialization and collectivization of agriculture under Soviet rule. During that time,agriculture remained tlhe second-largest sector of the Lithuanian economy, accounting for 28 percent ofGDP in 1990.' Livestock and dairy production were the major agricultural activities in the Soviet era,accounting for over three-fifths of total agricultural output. The country was a major supplier of livestockand dairy products, while grain and other needed inputs were delivered to the country according to centralplanning decisions. Lithuania had one of the most developed agricultural sectors in the former SovietUnion (FSU). The coLintry produced 2.7 percent of the total meat and 3 percent of the milk output of theFSU, despite having only 0.3 percent of FSU agricultural land. More than a third of these products weredelivered to the central funds, while Lithuania received about 1.1-1.3 million tons of feed grain in return.
Yields and the economic efficiency of the livestock sector were among the best inside the FSU,and comparable to levels in central and eastern Europe. Yet Lithuanian agriculture suffered many of theshortcomings common in the other FSU republics. The quantity of livestock products was of primaryimportance, which led to reduced attention to the crop sector. Quality and efficiency, both in agricultureand agro-processing, played only a secondary role, as in the rest of the FSU. The large livestock sectorwas based on an expensive system of subsidies and secure product markets inside the FSU.
Economic and Sectoral Reforms in Aggregate
Reforms in the food and agricultural sector started rather early, in parallel with the struggle to reestablishan independent state and a viable market economy. Lithuania initiated a transition program in food andagriculture to create a privatized and market-oriented sector. Land reform and privatization, liberalizationof the macro environrnent, creation of a new incentive framework, and institutional and legal reformrepresent the major components of this program.
The Lithuanian food and agriculture sector, although it shows the first signs of recovery, is stillhaving serious difficulties, which have been worsened by social problems in the rural areas related to theoverall transition. Achievements in reforming the food and agricultural sector have been significant sofar, but in some respects they lag behind reforms in other economic sectors and in the macroeconomicenvironment as a whole.
1. GDP calculated by the "old methodology."
123

Agriculture
The macroenvironment for agriculture improved relatively early in the reform period. Thedifficulties of adjustment from the old, distorted production system, however, were combined with theproblems of coping with the pressure created by the new liberal policies; as a result, social tensionincreased in rural areas. The government responded to these tensions and to the initial political andeconomic difficulties of the agricultural transition with increased intervention and protection (theNational Agricultural Program and the 1994 Law on Government Regulation of Economic Relations inAgriculture), rather than by accelerating the transition. As a result, in 1995 Lithuania introduced anagricultural support system that probably created the greatest market distortion seen among the domesticmarkets of the Baltic countries. The price supports provided a safeguard to a system that needed basicadjustment, and therefore prolonged the pain of adjustment, not only in agriculture, but also in theeconomy as a whole.
The new government that took office in late 1996 recognized that the agricultural sector's level offinancial dependency on the state was no longer sustainable, and at the beginning of 1997 it beganimplementation of a better-targeted, more transparent, more cost-effective, and less distorting supportsystem for farms and rural communities. These reforms have set a new direction for agricultural supportpolicies that is more market-friendly and provides an improved framework for longer-term reforms andinvestments-something the sector badly needed.
The progress in farm restructuring and land privatization is significant, but is far from complete.The process of restitution of landownership and the settlement of claims was delayed in 1997 as variouslaws and implementation procedures were amended to facilitate acceleration of the process, but it is tooearly to assess if these changes will have significant results. The privatization and restructuring ofagroprocessing followed a path similar to that of the other Baltic countries, providing preferentialpurchasing rights to raw material producers. The initial phase of privatization is over, but the objective ofcreating real owners with adequate capital has been only partially realized. On the whole, bothagricultural and agroprocessing enterprises have major efficiency problems. With some exceptions, theyare not ready to cope with the challenge of competition created by potential European Union (EU)membership.
For a small country such as Lithuania, with significant agricultural resources, the mostappropriate way of preparing the sector for EU accession is to develop an agricultural system that iscompetitive. Such a system, both in size and structure, needs to be quite different from the system thatwas in place during the Soviet era. It is essential, therefore, that the policy response to rural socialproblems and demands of the agricultural sector for more support take an appropriate form, focusing onthe enhancement of efficiency and competitiveness rather than delaying unavoidable changes andmaintaining or increasing distortions.
Structure and Performance of the Sector, 1990-96
Agriculture and the National Economy
GROWTH. As in other central and eastern European countries, gross agricultural output (GAO)declined significantly in the initial transition phase, plunging more than 50 percent between 1990 and1994 (table 4- 1). The largest annual drops in output occurred between 1992 and 1994, when productioncontracted by 23 percent and 20 percent, respectively. These two sharp falls were a consequence of veryunfavorable weather conditions, but the general decline resulted from transition adjustments that led tosharply higher real input prices, lower real output prices, declining demand in domestic and foreign
124
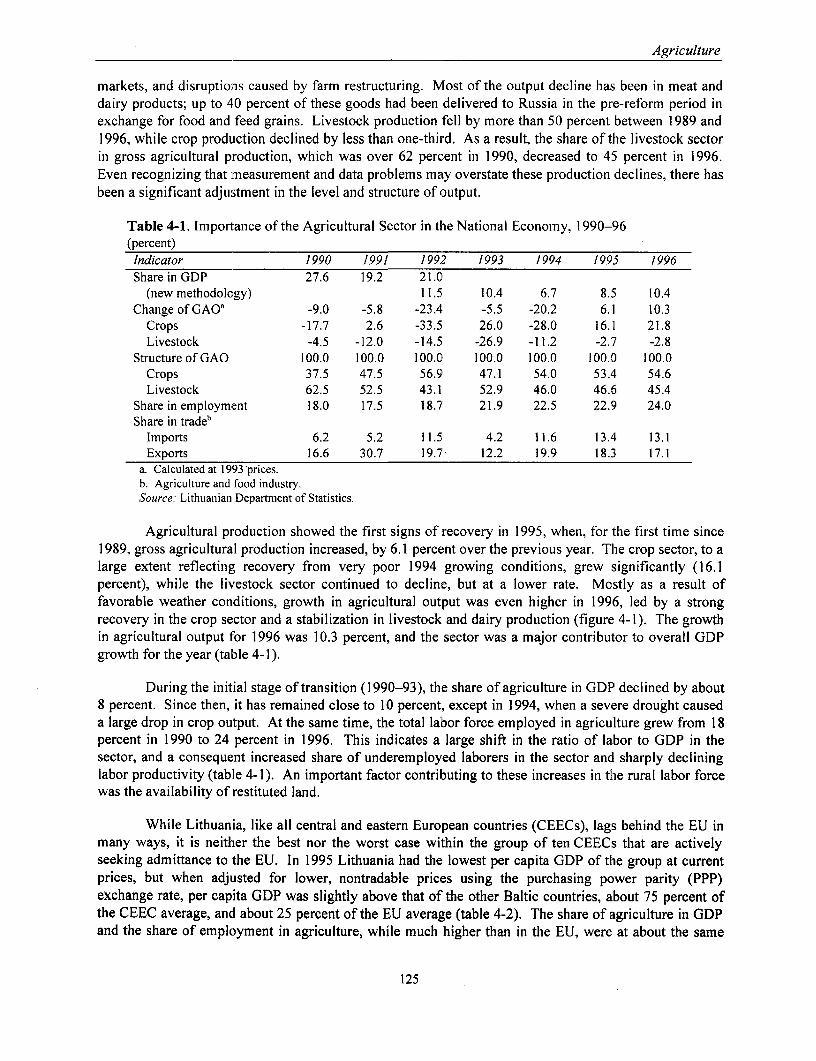
Agriculture
markets, and disruptions caused by farm restructuring. Most of the output decline has been in meat anddairy products; up to 40 percent of these goods had been delivered to Russia in the pre-reform period inexchange for food and feed grains. Livestock production fell by more than 50 percent between 1989 and1996, while crop production declined by less than one-third. As a result, the share of the livestock sectorin gross agricultural production, which was over 62 percent in 1990, decreased to 45 percent in 1996.Even recognizing that rmeasurement and data problems may overstate these production declines, there hasbeen a significant adjustment in the level and structure of output.
Table 4-1. Importance of the Agricultural Sector in the National Economy, 1990-96(percent)Indicator 1990 1991 1992 1993 1994 1995 1996Share in GDP 27.6 19.2 21.0
(new methodology) 11.5 10.4 6.7 8.5 10.4Change of GAO' -9.0 -5.8 -23.4 -5.5 -20.2 6.1 10.3
Crops -17.7 2.6 -33.5 26.0 -28.0 16.1 21.8Livestock -4.5 -12.0 -14.5 -26.9 -11.2 -2.7 -2.8
Structure of GAO 100.0 100.0 100.0 100.0 100.0 100.0 100.0Crops 37.5 47.5 56.9 47.1 54.0 53.4 54.6Livestock 62.5 52.5 43.1 52.9 46.0 46.6 45.4
Share in employment 18.0 17.5 18.7 21.9 22.5 22.9 24.0Share in tradeb
Imports 6.2 5.2 11.5 4.2 11.6 13.4 13.1Exports 16.6 30.7 19.7 12.2 19.9 18.3 17.1
a. Calculated at 1993 prices.b. Agriculture and food industry.Source: Lithuanian Department of Statistics.
Agricultural production showed the first signs of recovery in 1995, when, for the first time since1989, gross agricultural production increased, by 6.1 percent over the previous year. The crop sector, to alarge extent reflecting recovery from very poor 1994 growing conditions, grew significantly (16.1percent), while the livestock sector continued to decline, but at a lower rate. Mostly as a result offavorable weather conditions, growth in agricultural output was even higher in 1996, led by a strongrecovery in the crop sector and a stabilization in livestock and dairy production (figure 4-1). The growthin agricultural output for 1996 was 10.3 percent, and the sector was a major contributor to overall GDPgrowth for the year (table 4- 1 ).
During the initial stage of transition (1990-93), the share of agriculture in GDP declined by about8 percent. Since then, it has remained close to 10 percent, except in 1994, when a severe drought causeda large drop in crop output. At the same time, the total labor force employed in agriculture grew from 18percent in 1990 to 24 percent in 1996. This indicates a large shift in the ratio of labor to GDP in thesector, and a consequent increased share of underemployed laborers in the sector and sharply declininglabor productivity (table 4-1). An important factor contributing to these increases in the rural labor forcewas the availability of restituted land.
While Lithuania, like all central and eastern European countries (CEECs), lags behind the EU inmany ways, it is neither the best nor the worst case within the group of ten CEECs that are activelyseeking admittance to the EU. In 1995 Lithuania had the lowest per capita GDP of the group at currentprices, but when adjusted for lower, nontradable prices using the purchasing power parity (PPP)exchange rate, per capita GDP was slightly above that of the other Baltic countries, about 75 percent ofthe CEEC average, and about 25 percent of the EU average (table 4-2). The share of agriculture in GDPand the share of employment in agriculture, while much higher than in the EU, were at about the same
125
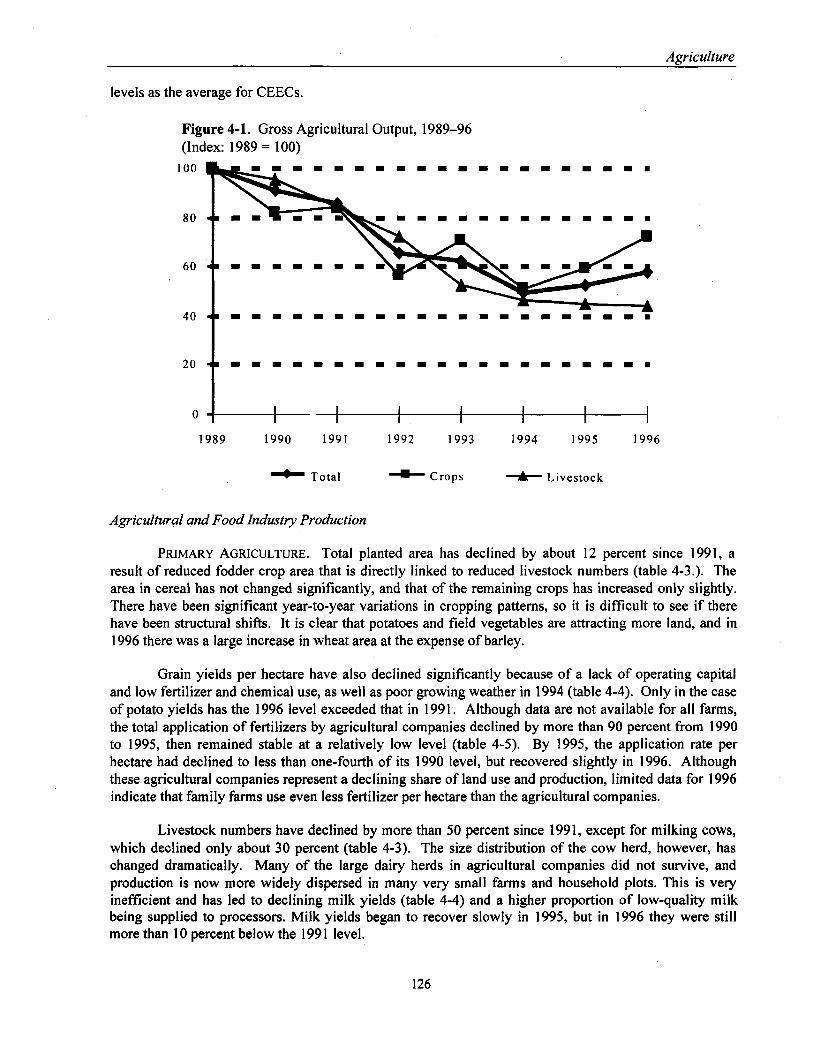
Agriculture
levels as the average for CEECs.
Figure 4-1. Gross Agricultural Output, 1989-96(Index: 1989 = 100)
100
80 ^..*
60^ - -
40 a m I .
20 m .. * .. * m... mm............m m
O- l l l l l l I
1989 1990 1991 1992 1993 1994 1995 1996
- Total ~ Crops Livestock
Agricultural and Food Industry Production
PRIMARY AGRICULTURE. Total planted area has declined by about 12 percent since 1991, aresult of reduced fodder crop area that is directly linked to reduced livestock numbers (table 4-3.). Thearea in cereal has not changed significantly, and that of the remaining crops has increased only slightly.There have been significant year-to-year variations in cropping patterns, so it is difficult to see if therehave been structural shifts. It is clear that potatoes and field vegetables are attracting more land, and in1996 there was a large increase in wheat area at the expense of barley.
Grain yields per hectare have also declined significantly because of a lack of operating capitaland low fertilizer and chemical use, as well as poor growing weather in 1994 (table 4-4). Only in the caseof potato yields has the 1996 level exceeded that in 1991. Although data are not available for all farms,the total application of fertilizers by agricultural companies declined by more than 90 percent from 1990to 1995, then remained stable at a relatively low level (table 4-5). By 1995, the application rate perhectare had declined to less than one-fourth of its 1990 level, but recovered slightly in 1996. Althoughthese agricultural companies represent a declining share of land use and production, limited data for 1996indicate that family farms use even less fertilizer per hectare than the agricultural companies.
Livestock numbers have declined by more than 50 percent since 1991, except for milking cows,which declined only about 30 percent (table 4-3). The size distribution of the cow herd, however, haschanged dramatically. Many of the large dairy herds in agricultural companies did not survive, andproduction is now more widely dispersed in many very small farms and household plots. This is veryinefficient and has led to declining milk yields (table 4-4) and a higher proportion of low-quality milkbeing supplied to processors. Milk yields began to recover slowly in 1995, but in 1996 they were stillmore than 10 percent below the 1991 level.
126
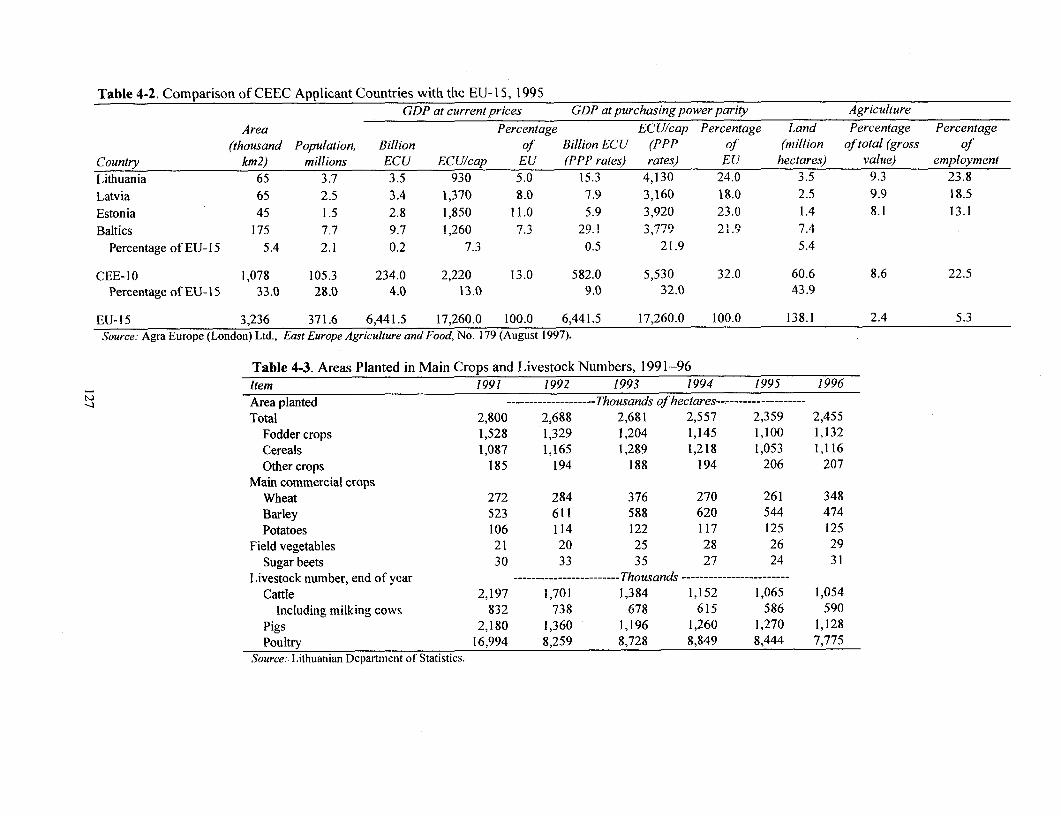
Table 4-2. Comparison of CEEC Applicant Countries with the EU- 15, 1995GDP at current prices GDP at purchasing power parity Agriculture
Area Percentage ECU/cap Percentage Land Percentage Percentage(thousand Population, Billion of Billion ECU (PPP of (million of total (gross of
Country km2) millions ECU ECU/cap EU (PPP rates) rates) EU hectares) value) employment
Lithuania 65 3.7 3.5 930 5.0 15.3 4,130 24.0 3.5 9.3 23.8
Latvia 65 2.5 3.4 1,370 8.0 7.9 3,160 18.0 2.5 9.9 18.5
Estonia 45 1.5 2.8 1,850 11.0 5.9 3,920 23.0 1.4 8.1 13.1
Baltics 175 7.7 9.7 1,260 7.3 29.1 3,779 21.9 7 A
Percentage of EU-15 5.4 2.1 0.2 7.3 0.5 21.9 5.4
CEE-10 1,078 105.3 234.0 2,220 13.0 582.0 5,530 32.0 60.6 8.6 22.5Percentage of EU-I5 33.0 28.0 4.0 13.0 9.0 32.0 43.9
EU-15 3,236 371.6 6,441.5 17,260.0 100.0 6,441.5 17,260.0 100.0 138.1 2.4 5.3Source: Agra Europe (London) Ltd., East Europe Agriculture and Food, No. 179 (August 1997).
Table 4-3. Areas Planted in Main Crops and Livestock Numbers, 1991-96
Item 1991 1992 1993 1994 1995 1996Area planted -------------------- Thousands of hectares------------------Total 2,800 2,688 2,681 2,557 2,359 2,455
Fodder crops 1,528 1,329 1,204 1,145 1,100 1,132Cereals 1,087 1,165 1,289 1,218 1,053 1,116Othercrops 185 194 188 194 206 207
Main commercial cropsWheat 272 284 376 270 261 348Barley 523 611 588 620 544 474Potatoes 106 114 122 117 125 125
Field vegetables 21 20 25 28 26 29Sugar beets 30 33 35 27 24 31
Livestock number, end of year ------------------------Thousands ------------------------Cattle 2,197 1,701 1,384 1,152 1,065 1,054
Including milking cows 832 738 678 615 586 590Pigs 2,180 1,360 1,196 1,260 1,270 1,128Poultry 16,994 8,259 8,728 8,849 8,444 7,775
Source: Lithuanian Department of Statistics.

Table 4-4. Dynamics of Crop and Livestock Productivity, 1991-96Item 1991 1992 1993 1994 1995 1996Average yield of crops, ton per hectare
Wheat 3.15 3.00 2.39 1.84 2.10 2.69Barley 3.25 1.56 2.05 1.76 1.93 2.48Potatoes 14.20 9.50 14.50 9.40 12.80 16.30Sugar beets 27.20 19.00 24.60 17.30 28.40 25.50
Annual average productivity of livestock and poultryMilk, kg/cow 3,481 3,080 2,910 2,925 3,010 3,093Eggs, pieces/hen 230 212 209 225 254 254Source: Lithuanian Department of Statistics.
Table 4-5. Mineral Fertilizer Use by Agricultural Companies, 1990-96(thousand tons of active ingredient)Item 1990 1991 1992 1993 1994 1995 1996Total application 660.7 601.4 266.6 117.4 75.1 51.7 51.1
Nitrogen 244.8 204.0 94.3 57.7 41.3 28.8 29.0Phosphorus 153.9 144.1 61.0 23.0 13.0 10.9 10.5Potassium 262.0 253.3 111.3 36.7 20.8 12.0 11.6
Application per hectare, kilograms 227.0 247.0 107.0 69.0 56.0 54.0 72.0Source. Lithuanian Department of Statistics.

Agriculture
The indications are that levels of production in the sector are stabilizing, and for some productsthey are increasing (table 4-6). Potato production is 30 percent higher than in 1991, while wheat andsugar beet production are nearly the same as in 1991. Meat, milk, and egg production levels seem tohave stabilized, indicating the completion of this market adjustment. Since livestock numbers declinedfar more than grain and fodder production, there is no longer any significant dependence on importedfeed grains, as was the case during Soviet times. In normal years, domestic pasture and crop productionresources need to be supplemented only with imported protein and feed supplements.
Table 4-6. Dynamics of Agricultural Output Volume(thousand tons)
Product 1991 1992 1993 1994 1995 1996Wheat 855 834 890 549 637 936Barley 1,699 955 1,208 1,091 892 1,177Potatoes 1,508 1,080 1,773 1,096 1,594 2,044Sugar beets 811 622 855 462 692 796Meat (carcass weight) 450 415 276 224 208 199
Beef and veal 209 226 162 116 87 83Pig meat 194 155 90 82 93 89Poultry 44 32 22 24 26 25Other 3 2 2 2 2 2
Milk 2,916 2,21 2,067 1,896 1,819 1,831Eggs (million pieces) 1,235 880 610 714 793 751Source: Lithuaniarn Department of Statistics.
The largest adjustment in production for Lithuania, as in most CEECs was in meat and milkproduction. Although circumstances differed among the countries, the major common factors in thisadjustment were significant declines in domestic and export demand for these products. Lithuania'sdecline in meat production was less than those recorded in Estonia and Latvia, but significantly more thanin other CEECs (table 4-7). The much larger meat production declines in the Baltics relative to theCEECs are an artifact of the special role of the Baltics in Soviet meat production, which had no realeconomic basis and suffered a sharp loss in market demand after independence. While other CEECsbegan to see a slight recovery in meat production in 1995 or 1996, the three Baltic states were stillexperiencing declines in. 1996. Milk was somewhat different, in that there was less disparity inadjustments (declines ranging from 30 to 50 percent); and among the countries in this comparison, onlyLithuania and Hungary began to experience a small turnaround in milk production in 1996. This growthcan only be seen as a positive development if it was stimulated by market demand rather than bygovernment incentives. In the case of Lithuania, the government price support and subsidy incentives arethe more likely reason for the increased milk production.
AGROPROCESSING. The real value of output in the manufacture of food and beverages declinedby more than 50 percent between 1992 and 1994, then remained nearly constant in real terms (table 4-8).During this period, the decline in agroprocessing has been less than in the rest of industry, so the share ofthe food and beverage sector in total industrial production rose slightly, from 22 percent in 1992 to 27percent in 1996. One area of concern is that employment in the food and beverage industry declined only1 I percent, while output was cut by half, indicating a large decline in labor productivity. This disparitywas also evident, but to a lesser degree, in industry as a whole. Within this industry group, there is a widedispersion in the impacts of the adjustment on products. Some products, such as fermented cheese, sugar,and alcoholic beverages, declined less then 20 percent from 1990 to 1996, while meat, soft drinks, andcanned fruits and vegetables declined by 75 percent or more (table 4-9). Most products began showingthe first signs of recovery in 1995, while a few were still declining in 1996.
129
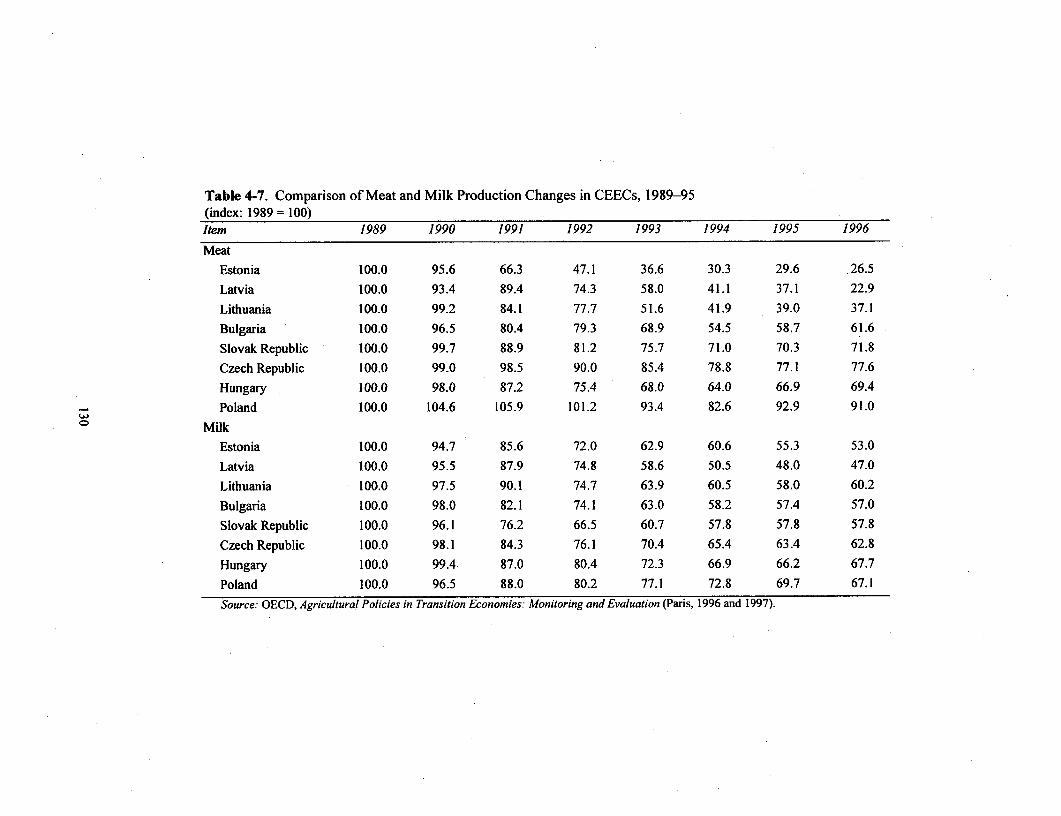
Table 4-7. Comparison of Meat and Milk Production Changes in CEECs, 1989-95(index: 1989 = 100)Item 1989 1990 1991 1992 1993 1994 1995 1996
MeatEstonia 100.0 95.6 66.3 47.1 36.6 30.3 29.6 26.5Latvia 100.0 93.4 89.4 74.3 58.0 41.1 37.1 22.9Lithuania 100.0 99.2 84.1 77.7 51.6 41.9 39.0 37.1Bulgaria 100.0 96.5 80.4 79.3 68.9 54.5 58.7 61.6
Slovak Republic 100.0 99.7 88.9 81.2 75.7 71.0 70.3 71.8Czech Republic 100.0 99.0 98.5 90.0 85.4 78.8 77.1 77.6
Hungary 100.0 98.0 87.2 75.4 68.0 64.0 66.9 69.4Poland 100.0 104.6 105.9 101.2 93.4 82.6 92.9 91.0
0 Milk
Estonia 100.0 94.7 85.6 72.0 62.9 60.6 55.3 53.0
Latvia 100.0 95.5 87.9 74.8 58.6 50.5 48.0 47.0Lithuania 100.0 97.5 90.1 74.7 63.9 60.5 58.0 60.2
Bulgaria 100.0 98.0 82.1 74.1 63.0 58.2 57.4 57.0
Slovak Republic 100.0 96.1 76.2 66.5 60.7 57.8 57.8 57.8Czech Republic 100.0 98.1 84.3 76.1 70.4 65.4 63.4 62.8
Hungary 100.0 99.4 87.0 80.4 72.3 66.9 66.2 67.7Poland 100.0 96.5 88.0 80.2 77.1 72.8 69.7 67.1Source: OECD, Agricultural Policies in Transition Economies: Monitoring and Evaluation (Paris, 1996 and 1997).
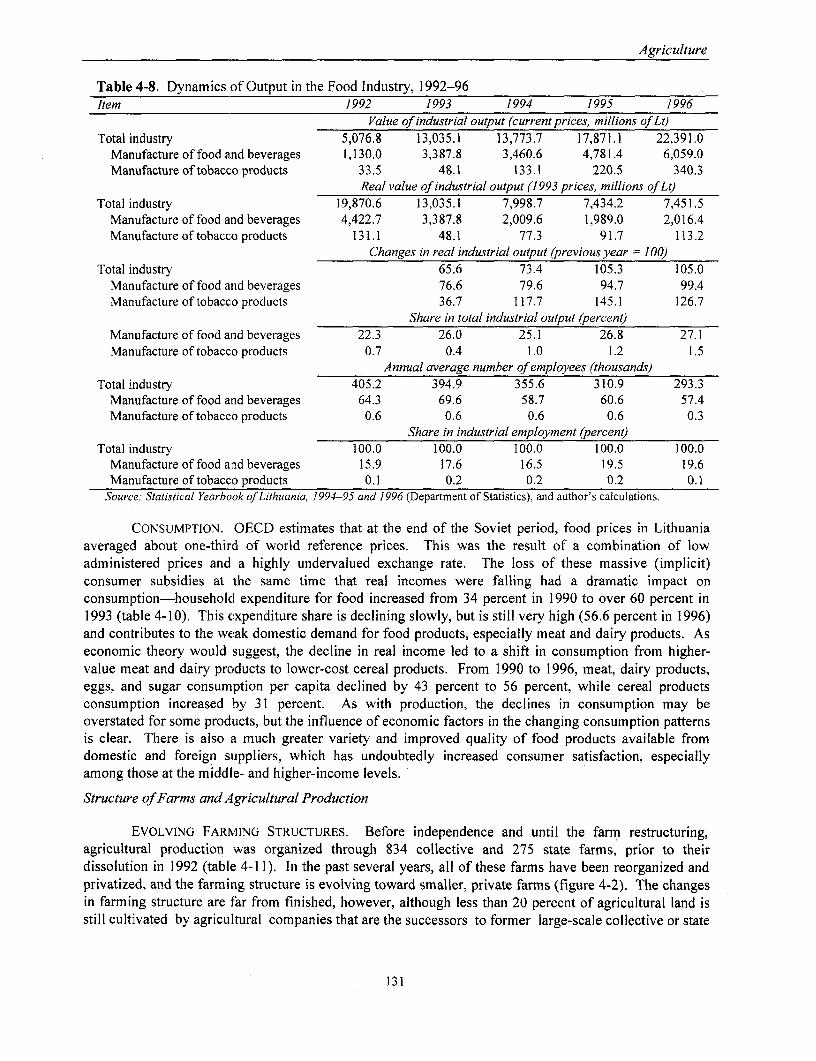
Agriculture
Table 4-8. Dynamics of Output in the Food Industry, 1992-96Item 1992 1993 1994 1995 1996
Value of industrial output (current prices, millions of Lt)Total industry 5,076.8 13,035.1 13,773.7 17,871.1 22,391.0
Manufacture of food and beverages 1,130.0 3,387.8 3,460.6 4,781.4 6,059.0Manufacture of tobacco products 33.5 48.1 133.1 220.5 340.3
Real value of industrial output (1993 prices, millions of Lt)Total industry 19,870.6 13,035.1 7,998.7 7,434.2 7,451.5
Manufacture of food and beverages 4,422.7 3,387.8 2,009.6 1,989.0 2,016.4Manufacture of tobacco products 131.1 48.1 77.3 91.7 113.2
Changes in real industrial output (previous year = 100)Total industry 65.6 73.4 105.3 105.0
Manufacture of food and beverages 76.6 79.6 94.7 99.4Manufacture of tobacco products 36.7 117.7 145.1 126.7
Share in total industrial output (percent)Manufacture of food and beverages 22.3 26.0 25.1 26.8 27.1Manufacture of tobacco products 0.7 0.4 1.0 1.2 1.5
Annual average number of employees (thousands)Total industry 405.2 394.9 355.6 310.9 293.3
Manufacture of food and beverages 64.3 69.6 58.7 60.6 57.4Manufacture of tobacco products 0.6 0.6 0.6 0.6 0.3
Share in industrial employment (percent)Total industry 100.0 100.0 100.0 100.0 100.0
Manufacture of food and beverages 15.9 17.6 16.5 19.5 19.6Manufacture of tobacco products 0.1 0.2 0.2 0.2 0.1
Source: Statistical Yearbook of Lithuania, 1994-95 and 1996 (Department of Statistics), and author's calculations.
CONSUMPTION. OECD estimates that at the end of the Soviet period, food prices in Lithuaniaaveraged about one-third of world reference prices. This was the result of a combination of lowadministered prices and a highly undervalued exchange rate. The loss of these massive (implicit)consumer subsidies at the same time that real incomes were falling had a dramatic impact onconsumption-householcl expenditure for food increased from 34 percent in 1990 to over 60 percent in1993 (table 4-10). This expenditure share is declining slowly, but is still very high (56.6 percent in 1996)and contributes to the weak domestic demand for food products, especially meat and dairy products. Aseconomic theory would suggest, the decline in real income led to a shift in consumption from higher-value meat and dairy products to lower-cost cereal products. From 1990 to 1996, meat, dairy products,eggs, and sugar consumption per capita declined by 43 percent to 56 percent, while cereal productsconsumption increased by 31 percent. As with production, the declines in consumption may beoverstated for some prodiacts, but the influence of economic factors in the changing consumption patternsis clear. There is also a much greater variety and improved quality of food products available fromdomestic and foreign suppliers, which has undoubtedly increased consumer satisfaction, especiallyamong those at the middle- and higher-income levels.
Structure of Farms and Agricultural Production
EVOLVING FARMING STRUCTURES. Before independence and until the farm restructuring,agricultural production was organized through 834 collective and 275 state farms, prior to theirdissolution in 1992 (table 4-11). In the past several years, all of these farms have been reorganized andprivatized, and the farming structure is evolving toward smaller, private farms (figure 4-2). The changesin farming structure are far from finished, however, although less than 20 percent of agricultural land isstill cultivated by agricultural companies that are the successors to former large-scale collective or state
131
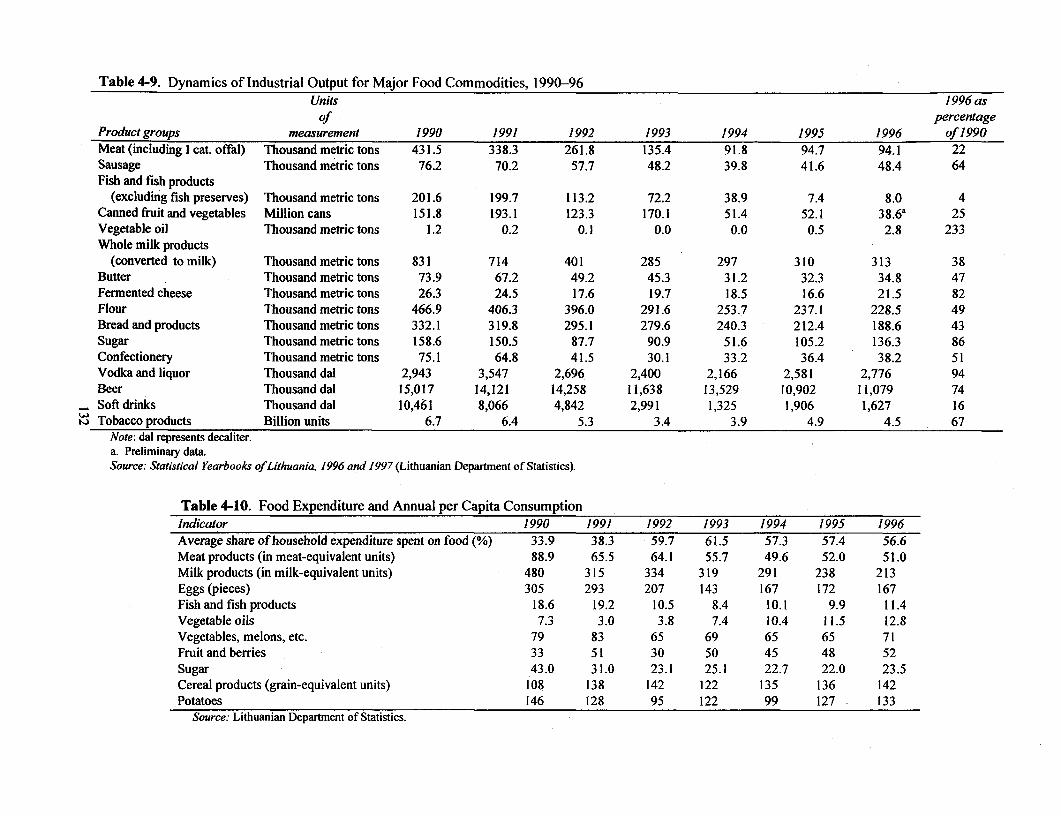
Table 4-9. Dynamics of Industrial Output for Major Food Commodities, 1990-96Units 1996 as
of percentageProduct groups measurement 1990 1991 1992 1993 1994 1995 1996 of 1990Meat (including I cat. offal) Thousand metric tons 431.5 338.3 261.8 135.4 91.8 94.7 94.1 22Sausage Thousand metric tons 76.2 70.2 57.7 48.2 39.8 41.6 48.4 64Fish and fish products
(excluding fish preserves) Thousand metric tons 201.6 199.7 113.2 72.2 38.9 7.4 8.0 4Canned fruit and vegetables Million cans 151.8 193.1 123.3 170.1 51.4 52.1 38.6a 25Vegetable oil Thousand metric tons 1.2 0.2 0.1 0.0 0.0 0.5 2.8 233Whole milk products
(converted to milk) Thousand metric tons 831 714 401 285 297 310 313 38Butter Thousand metric tons 73.9 67.2 49.2 45.3 31.2 32.3 34.8 47Fermented cheese Thousand metric tons 26.3 24.5 17.6 19.7 18.5 16.6 21.5 82Flour Thousand metric tons 466.9 406.3 396.0 291.6 253.7 237.1 228.5 49Bread and products Thousand metric tons 332.1 319.8 295.1 279.6 240.3 212.4 188.6 43Sugar Thousand metric tons 158.6 150.5 87.7 90.9 51.6 105.2 136.3 86Confectionery Thousand metric tons 75.1 64.8 41.5 30.1 33.2 36.4 38.2 51Vodka and liquor Thousand dal 2,943 3,547 2,696 2,400 2,166 2,581 2,776 94Beer Thousand dal 15,017 14,121 14,258 11,638 13,529 10,902 11,079 74Soft drinks Thousand dal 10,461 8,066 4,842 2,991 1,325 1,906 1,627 16
S Tobacco products Billion units 6.7 6.4 5.3 3.4 3.9 4.9 4.5 67Note: dal represents decaliter.a. Preliminary data.Source: Statistical Yearbooks of Lithuania, 1996 and 1997 (Lithuanian Department of Statistics).
Table 4-10. Food Expenditure and Annual per Capita ConsumptionIndicator 1990 1991 1992 1993 1994 1995 1996Average share of household expenditure spent on food (%) 33.9 38.3 59.7 61.5 57.3 57.4 56.6Meat products (in meat-equivalent units) 88.9 65.5 64.1 55.7 49.6 52.0 51.0Milk products (in milk-equivalent units) 480 315 334 319 291 238 213Eggs (pieces) 305 293 207 143 167 172 167Fish and fish products 18.6 19.2 10.5 8.4 10.1 9.9 11.4Vegetable oils 7.3 3.0 3.8 7.4 10.4 11.5 12.8Vegetables, melons, etc. 79 83 65 69 65 65 71Fruit and berries 33 51 30 50 45 48 52Sugar 43.0 31.0 23.1 25.1 22.7 22.0 23.5Cereal products (grain-equivalent units) 108 138 142 122 135 136 142Potatoes 146 128 95 122 99 127 133
Source: Lithuanian Department of Statistics.
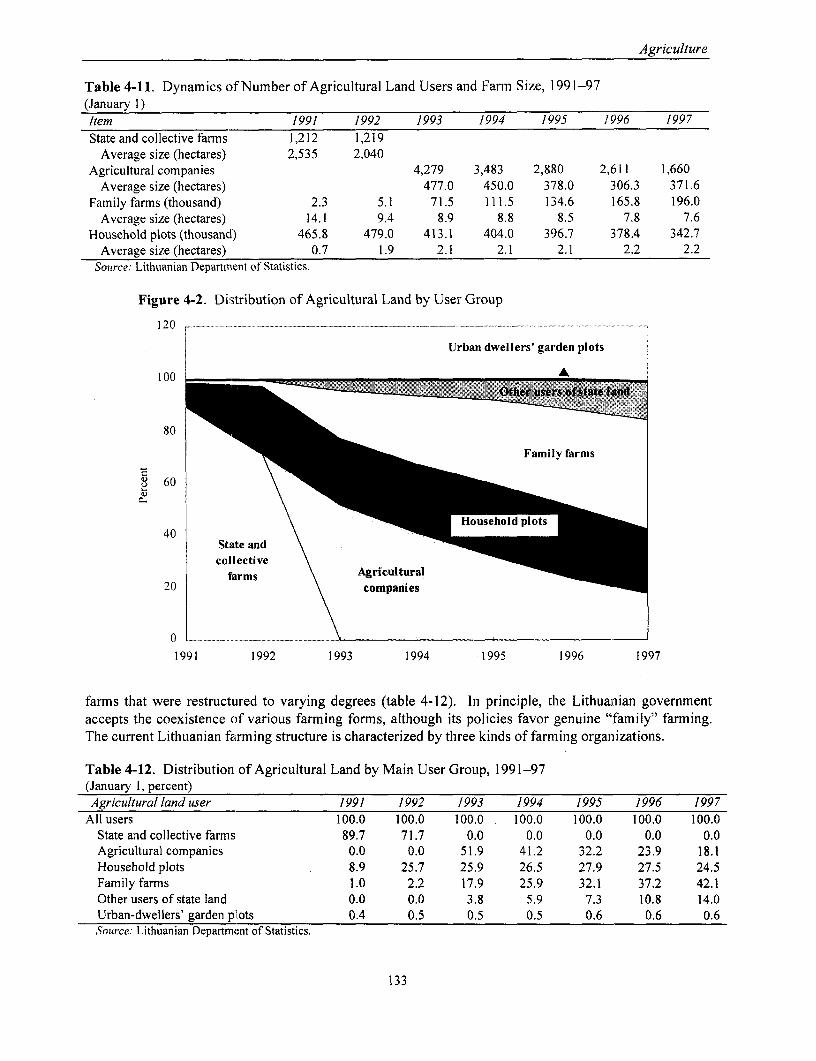
Agriculture
Table 4-11. Dynamics of Number of Agricultural Land Users and Farm Size, 1991-97(January 1)Item 1991 1992 1993 1994 1995 1996 1997
State and collective farms 1,212 1,219Average size (hectares) 2,535 2,040
Agricultural companies 4,279 3,483 2,880 2,611 1,660Average size (hectares) 477.0 450.0 378.0 306.3 371.6
Family farms (thousand) 2.3 5.1 71.5 111.5 134.6 165.8 196.0Average size (hectares) 14.1 9.4 8.9 8.8 8.5 7.8 7.6
Household plots (thousand) 465.8 479.0 413.1 404.0 396.7 378.4 342.7Average size (hectares) 0.7 1.9 2.1 2.1 2.1 2.2 2.2
Source: Lithuanian Department of Statistics.
Figure 4-2. Distribution of Agricultural Land by User Group
120 ......
Urban dwellers' garden plots
100 '_ ; 1
80
Family farms
O 60
Household plots40
State andcollective
farms Agricultural20 companies
o ........................ ................. ... ....... _
1991 1992 1993 1994 1995 1996 1997
farms that were restructured to varying degrees (table 4-12). In principle, the Lithuanian governmentaccepts the coexistence of various farming forms, although its policies favor genuine "family" farming.The current Lithuanian farming structure is characterized by three kinds of farming organizations.
Table 4-12. Distribution of Agricultural Land by Main User Group, 1991-97(January 1, percent)Agricultural land user 1991 1992 1993 1994 1995 1996 1997
All users 100.0 100.0 100.0 100.0 100.0 100.0 100.0State and collective farms 89.7 71.7 0.0 0.0 0.0 0.0 0.0Agricultural companies 0.0 0.0 51.9 41.2 32.2 23.9 18.1Household plots 8.9 25.7 25.9 26.5 27.9 27.5 24.5Family farms 1.0 2.2 17.9 25.9 32.1 37.2 42.1Other users of state land 0.0 0.0 3.8 5.9 7.3 10.8 14.0Urban-dwellers' garden plots 0.4 0.5 0.5 0.5 0.6 0.6 0.6Source: Lithuanian Department of Statistics.
133
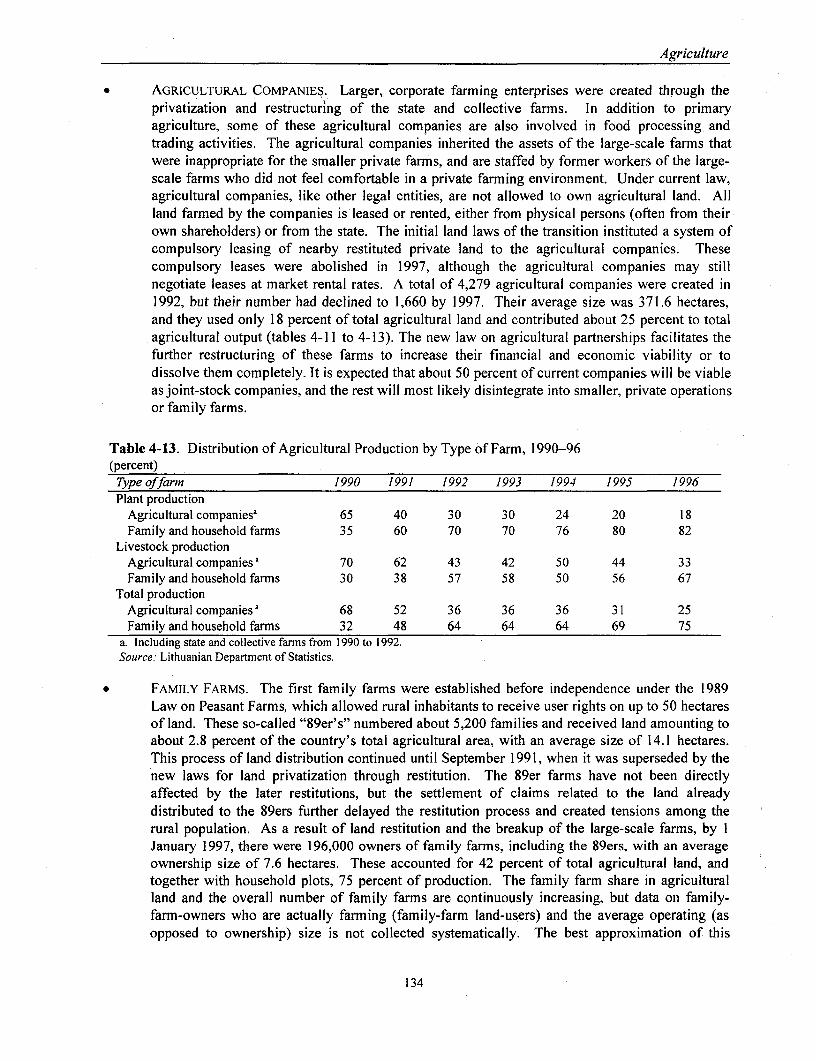
Agriculture
AGRICULTURAL COMPANIES. Larger, corporate farming enterprises were created through theprivatization and restructuring of the state and collective farms. In addition to primaryagriculture, some of these agricultural companies are also involved in food processing andtrading activities. The agricultural companies inherited the assets of the large-scale farms thatwere inappropriate for the smaller private farms, and are staffed by former workers of the large-scale farms who did not feel comfortable in a private farming environment. Under current law,agricultural companies, like other legal entities, are not allowed to own agricultural land. Allland farmed by the companies is leased or rented, either from physical persons (often from theirown shareholders) or from the state. The initial land laws of the transition instituted a system ofcompulsory leasing of nearby restituted private land to the agricultural companies. Thesecompulsory leases were abolished in 1997, although the agricultural companies may stillnegotiate leases at market rental rates. A total of 4,279 agricultural companies were created in1992, but their number had declined to 1,660 by 1997. Their average size was 371.6 hectares,and they used only 18 percent of total agricultural land and contributed about 25 percent to totalagricultural output (tables 4-11 to 4-13). The new law on agricultural partnerships facilitates thefurther restructuring of these farms to increase their financial and economic viability or todissolve them completely. It is expected that about 50 percent of current companies will be viableas joint-stock companies, and the rest will most likely disintegrate into smaller, private operationsor family farms.
Table 4-13. Distribution of Agricultural Production by Type of Farm, 1990-96(percent)
Type offarm 1990 1991 1992 1993 1994 1995 1996Plant production
Agricultural companiesa 65 40 30 30 24 20 18Family and household farms 35 60 70 70 76 80 82
Livestock productionAgricultural companiesa 70 62 43 42 50 44 33Family and household farms 30 38 57 58 50 56 67
Total productionAgricultural companiesa 68 52 36 36 36 31 25Family and household farms 32 48 64 64 64 69 75
a. Including state and collective farms from 1990 to 1992.Source: Lithuanian Department of Statistics.
* FAMILY FARMS. The first family farms were established before independence under the 1989Law on Peasant Farms, which allowed rural inhabitants to receive user rights on up to 50 hectaresof land. These so-called "89er's" numbered about 5,200 families and received land amounting toabout 2.8 percent of the country's total agricultural area, with an average size of 14.1 hectares.This process of land distribution continued until September 1991, when it was superseded by thenew laws for land privatization through restitution. The 89er farms have not been directlyaffected by the later restitutions, but the settlement of claims related to the land alreadydistributed to the 89ers further delayed the restitution process and created tensions among therural population. As a result of land restitution and the breakup of the large-scale farms, by IJanuary 1997, there were 196,000 owners of family farms, including the 89ers, with an averageownership size of 7.6 hectares. These accounted for 42 percent of total agricultural land, andtogether with household plots, 75 percent of production. The family farm share in agriculturalland and the overall number of family farms are continuously increasing, but data on family-farm-owners who are actually farming (family-farm land-users) and the average operating (asopposed to ownership) size is not collected systematically. The best approximation of this
134

Agriculture
number is the list of family farms registered for the purpose of participating in governmentinvestment programs, which includes 46,922 farms, with an average size of 1]1.7 hectares, as of IJanuary 1997. The group of 89ers and family-farm entrepreneurs who have leased significantadditional land represent the most efficient operations, while the rest are largely unconsolidatedoperations with lower efficiency and significant financial difficulties. Providing the incentivestructure to encourage the consolidation of the large number of smaller-scale private farms willbe one of the most serious challenges facing the agricultural leadership of the country.
HOUSEHOLD PL_OTS. There are more than 340,000 household plots, averaging about 2.2 hectaresin size (table 4-11). These are often operated by the shareholders of agricultural companies or byrural inhabitants to provide subsistence or to supplement their income from other sources. Whilethe number of household plots is declining, in 1997 they still accounted for 24.5 percent ofagricultural land (table 4-12).
A comparison with selected CEECs also indicates that Lithuania is in an internediate position inits farm structure at this stage of transition. More than two-thirds of family farms are below 10 hectares,which is more like the configuration in Hungary and Poland than in Estonia and Latvia (table 4-14). It isevident, however, that there has been a more radical restructuring of former state and collective farms;their average size in Lithuania is far less than in most of the other countries in this comparison. Theexception is Albania, where more radical restructuring of large farms was implemented.
Table 4-14. Comparison of Farm Structure in CEECs, 1995Family farms
Percent below 10 Agricultural companies,Country hectares Average size average sizeAlbania 99.7 1.3 380Romania 97.3 3.8 1,051Bulgaria 88.6 4.1 1,600Hungary 74.3 11.0 2,800Lithuania 67.7 8.5 378Poland 59.9 12.3 1,500Latvia 30.9 19.9 706Estonia 21.0 23.0 584Source: World Bank Discussion Paper No. 268 (Washington, D.C.); data for Baltics from S. Wengren, ed., Land Reform in
the Former Soviet Union and Eastern Europe (New York and London: Routledge, 1998).
Farm and Retail Price Developments
PRICES. Lithuania, like most transition economies, has progressed through all or most of thesteps in the evolution of price formation mechanisms. Beginning with the state-determined prices andimplied subsidy patterns of the pre-reform period, input subsidies were removed (1990), regulated farmand retail prices were increased (1991), prices were deregulated (1992-95), quantitative trade restrictionswere replaced by tariffs (1993), and domestic market intervention policies were introduced (1992 and1995). As of late 1997, many of the distorting components of the price support mechanism had beenremoved, but direct government payments to farmers remained a significant budget expenditure.
Real farm prices declined substantially, while real retail prices increased after price liberalization(table 4-15). For many products, the decline in real farm prices ended in 1994 or 1995 and began to turnaround slowly. In the case of real retail prices, there were sharp increases in the early years, followed bya gradual decline. Except for chicken, meat, and eggs, however, real retail prices in 1996 were 15 to 85percent above the December 1990 levels. Thus, for most products, the gap between farm and retail prices
135

Agriculture
first increased, then stabilized or decreased. It is normal for the marketing margin between farm and retailfor most food products to rise significantly during the transition, as input and product subsidies areremoved and the margin must reflect the full farm-to-market processing and distribution costs. It is alsoencouraging that these farm-to-retail margins are beginning to decrease, indicating some improvement inprocessing and distribution efficiency.
Table 4-15. Lithuanian Real Producer and Retail Prices, 1990-96 Indices(December 1990 = 100)
1990 1991 1992 1993 1994 1995 1996Product (December) (December) (Average) (Average) (Average) (Average) (Average)Producer price
Cattle (live weight) 100.0 57.2 47.5 46.4 28.0 24.1 25.0Pigs (live weight) 100.0 63.3 81.8 81.6 63.3 48.4 49.2Broilers (live weight) 100.0 66.2 54.7 65.0 79.2 62.1 56.9Milk 100.0 30.4 63.5 46.6 25.4 28.8 27.1Eggs 100.0 141.2 153.7 132.7 89.0 74.9 71.8GrainsWheat 100.0 51.2 86.0 61.2 33.9 37.3 50.9Barley 100.0 46.1 73.2 52.1 25.2 28.8 42.2Potatoes 100.0 63.7 67.7 75.1 37.3 55.7 28.0Sugar beets 100.0 124.6 47.7 33.9 22.8 22.4 20.9
Retail priceBeef 100.0 194.1 202.5 219.9 165.8 147.9 132.7Pork 100.0 169.5 216.7 215.3 145.0 134.7 141.8Chicken 100.0 128.0 131.5 120.9 105.0 79.7 78.1Milk 100.0 98.6 209.9 207.7 152.1 166.2 185.3Eggs 100.0 146.3 129.1 94.1 71.5 62.8 65.7Wheat bread 100.0 160.3 155.0 153.5 153.6 161.2 152.9Rye bread 100.0 126.7 87.3 127.5 149.4 133.9 136.9Potatoes 100.0 227.8 228.2 120.2 171.8 227.2 123.8Sugar 100.0 193.9 281.5 232.8 137.6 127.7 115.5Source: Calculated from Lithuanian Department of Statistics data.
An increased alignment with external reference prices reflects the impact of farm price supportprograms, the real appreciation of the litas, and the gradual maturation of market behavior. In general,farm prices are relatively close to U.S. or OECD reference prices, with the exception of beef, milk, eggs,and potatoes (table 4-16). Farm prices in Estonia, Latvia, and Lithuania have also been converging overthe last two years, but there are still some notable differences. Assuming the data are comparable,Estonian and Lithuanian farm prices for cattle in 1996 were 10 percent lower than prices for Latviancattle; pigs in Estonia cost 10 percent less than in the other two countries; broilers were 10 percentcheaper in Lithuania than in the other two countries; the farm price of milk in Lithuania was significantlylower than in Latvia and Estonia; wheat cost about 1 I percent less in Estonia and Latvia than inLithuania; and sugar beets in Latvia were 15 percent less costly than they were in Lithuania (table 4-17).
Retail prices across the Baltic states have converged to a greater extent than farm prices, but thereare a few exceptions among the selected products evaluated (table 4-17). Items that cost less than 90percent of the highest country price in the first half of 1997 are beef, milk, and sugar in Estonia; pork inLatvia; and wheat bread in Lithuania. The 30 percent lower sugar price in Estonia is clearly the result ofEstonia's trade policies, which allow the tariff-free import of sugar at world prices, while Lithuania andLatvia have import tariffs of more than 80 percent.
136

Table 4-16. Comparison of Lithuanian Farm Prices and World Market Prices, 1990-96(US$ per ton)Item Comparison 1990 1991 1992 1993 1994 1995 1996Cattle, Lithuania 184 74 174 382 448 538 695
live weight U.S. farm 1,731 1,636 1,661 1,682 1,517 1,460 1,436OECD reference price for beef and veala
(live weight equivalent, Hungary) 728 583 633 795 880 1,090 1,084Pigs, Lithuania 175 78 303 670 961 1,033 1,316
live weight U.S. farm 1,220 1,096 949 1,016 884 933 1,176OECD reference price for pig meat a
(live weight equivalent, Hungary) 1,059 1,016 1,167 988 994 1,309 1,469Poultry Lithuania 150 70 171 476 1,031 1,137 1,312
U.S. wholesale 1,207 1,146 1,160 1,217 1,228 1,243 1,351OECD reference pricea (EC) 1,199 1,220 1,258 1,150 1,174 1,240 1,333
Milk Lithuania 34 7 46 71 75 120 137Australia, average farm 179 188 202 180 205 231 225OECD reference pricea (New Zealand) 122 129 144 138 147 184 192
Eggs Lithuania 81 79 311 530 704 841 1,095OECD reference pricea (EC) 1,012 1,024 928 930 968 886 1,356
Wheat Lithuania 25 9 49 71 74 116 194U.S. FOB, Gulf 150 134 147 142 147 181 200OECDreferencepricea(EC) 142 98 133 117 115 164 199
Barley Lithuania 25 8 42 60 55 90 161(nonmalt) U.S. FOB, Pacific Northwest 101 114 119 118 117 142 151
OECD reference pricea (EC) 109 96 104 85 81 129 167Potatoes Lithuania 16 7 28 54 53 110 69
OECD reference pricea(Germany) 106 121 88 56 135 270 91a. Used by the OECD in calculations of PSE and for Lithuania (OECD, Review ofAgricultural Policies: Lithuania [Paris, 1996]).

Agriculture
Table 4-17. Comparison of Farm and Retail Prices in Baltic StatesRetail price
Farm price Percent of highestAverage Highest Average
1996 1996 Feb.-June 1997Products (US$/ton) (percent) (US$/kg) Feb.-June 1997 July-Dec. 1996Cattle (live weight) Beef
Estonia 717 92.0 2.36 88.4 92.3Latvia 779 100.0 2.67 100.0 100.0Lithuania 695 89.4 2.60 97.5 99.4
PorkPigs (live weight)
Estonia 1,180 90.4 3.12 93.6 89.4Latvia 1,305 99.9 2.95 88.6 89.3Lithuania 1,316 100.0 3.35 100.0 100.0
ChickenBroilers (liveweight) 1,467 100.0 2.41 90.2 100.0
Estonia 1,312 99.3 2.61 98.0 86.4Latvia 1,292 90.9 2.67 100.0 82.6Lithuania
MilkMilk
Estonia 214 100.0 0.41 87.4 100.0Latvia 181 84.7 0.46 98.5 99.5Lithuania 137 65.2 0.47 100.0 97.0
BreadWheat
Estonia 174 89.6 1.00 100.0 100.0Latvia 172 89.0 0.94 94.1 88.8Lithuania 194 100.0 0.77 76.3 65.8
SugarSugar beets
Estonia n.p. n.p. 0.58 68.1 75.4Latvia 40 84.1 0.83 97.5 96.3Lithuania 47 100.0 0.85 100.0 100.0n.p. Not produced on a commercial basis.Source: Lithuanian Department of Statistics.
Trade in Agricultural and Food Products
TRADE. In the 1970s and 1980s, Lithuania was a net exporter of agricultural products andfoodstuffs, mainly to other FSU republics. Lithuania was traditionally a significant exporter of dairy andmeat products, while it was a net importer of grain, fruits, and vegetables. The positive balance ofagricultural trade has been continuously eroding since 1993, and by 1996, Lithuania had become a smallnet importer (figure 4-3). From 1995 to 1996, net exports to Estonia and the Commonwealth ofIndependent States (CIS) increased by about US$50 million, but net imports from the EU increased byUS$102 million (table 4-18). In 1996, food and agriculture contributed 17.1 percent to overall exports,while its share of imports amounted to 13.1 percent. Both imports and exports include a substantialquantity of goods for reexport from East to West and West to East. The main domestic products exportedto Western markets are primary products designated for further processing or reexport. In Easternmarkets, Lithuania still sells mainly meat and dairy products.
138
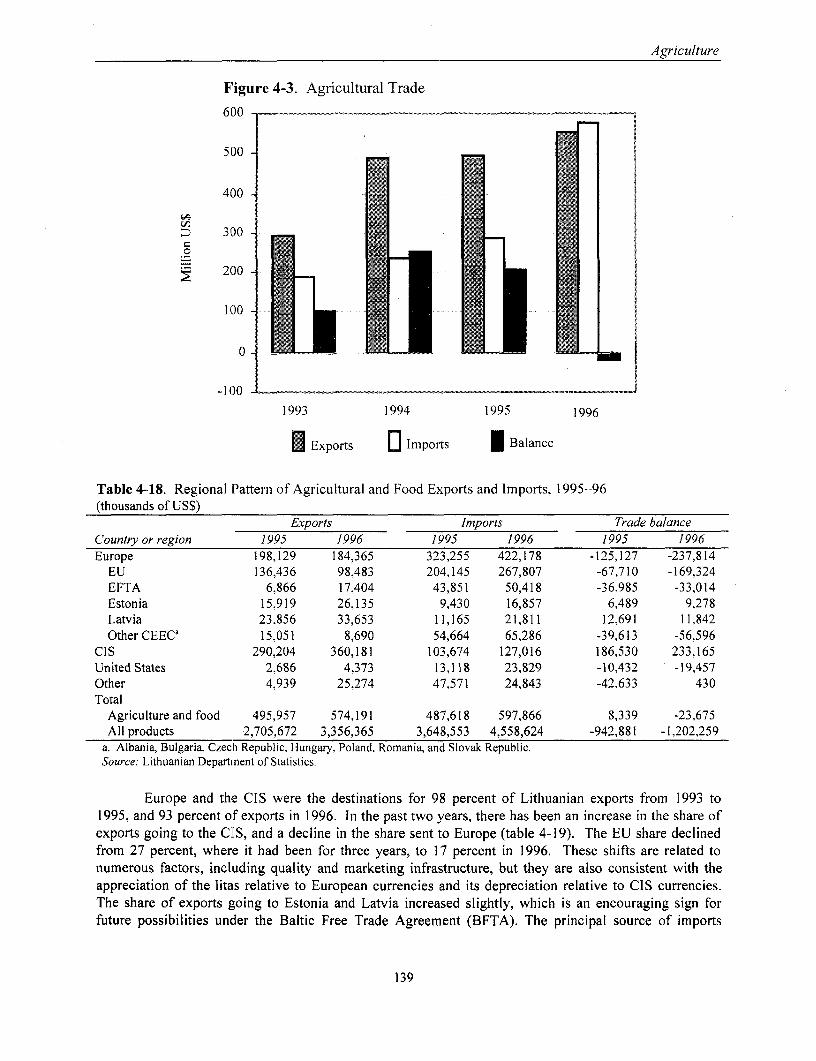
Agriculture
F'igure 4-3. Agricultural Trade
600
500
400
:: 3J0
200
1 00
0 : X
-1(O
1993 1994 1995 1996
a Exports 3 Imports I Balance
Table 4-18. Regional Pattern of Agricultural and Food Exports and Imports, 1995-96(thousands of US$)
Exports Imports Trade balanceCountry or region 1995 1996 1995 1996 1995 1996Europe 198,129 184,365 323,255 422,178 -125,127 -237,814
EU 136,436 98,483 204,145 267,807 -67,710 -169,324EFTA 6,866 17,404 43,851 50,418 -36,985 -33,014Estonia 15,919 26,135 9,430 16,857 6,489 9,278Latvia 23,856 33,653 11,165 21,811 12,691 11,842Other CEEC' 15,051 8,690 54,664 65,286 -39,613 -56,596
CIS 290,204 360,181 103,674 127,016 186,530 233,165United States 2,686 4,373 13,118 23,829 -10,432 -19,457Other 4,939 25,274 47,571 24,843 -42.633 430Total
Agriculture and food 495,957 574,191 487,618 597,866 8,339 -23,675All products 2,705,672 3,356,365 3,648,553 4,558,624 -942,881 -1,202,259
a. Albania, Bulgaria, Czech Republic, Hungary, Poland, Romania. and Slovak Republic.Source: Lithuanian Department of Statistics.
Europe and the CIS were the destinations for 98 percent of Lithuaniiani exports from 1993 to1995, and 93 percent of exports in 1996. In the past two years, there has been an increase in the share ofexports going to the CIS, and a decline in the share sent to Europe (table 4-19). The EU share declinedfrom 27 percent, where it had been for three years, to 17 percent in 1996. These shifts are related tonumerous factors, inclading quality and marketing infrastructure, but they are also consistent with theappreciation of the litas relative to European currencies and its depreciation relative to CIS currencies.The share of exports going to Estonia and Latvia increased slightly, which is an encouraging sign forfuture possibilities under the Baltic Free Trade Agreement (BFTA). The principal source of imports
139

Agriculture
during the last three years has been Europe, and the share from this region increased from 53 percent in1993 to around 70 percent in 1996. The second important-source has been the CIS, but this share declinedfrom 39 percent in 1993 to around 21 percent in the past three years. A close third, and gaining in importshare, are the other CEE countries, which represent close to an 1 I percent share.
Table 4-19. Regional Shares of Agricultural and Food Exports and Imports(percent)
Exports ImportsCountry or region 1995 1996 1995 1996Europe 39.9 32.1 66.3 70.6
EU 27.5 17.2 41.9 44.8EFTA 1.4 3.0 9.0 8.4Estonia 3.2 4.6 1.9 2.8Latvia 4.8 5.9 2.3 3.6Other CEECa 3.0 1.5 11.2 10.9
CIS 58.5 62.7 21.3 21.2United States 0.5 0.8 2.7 4.0Other 1.0 4.4 9.8 4.2Total 100.0 100.0 100.0 100.0
a. Albania, Bulgaria, Czech Republic, Hungary, Romania, and Slovak Republic.Source: Calculated from Table 4-15.
Data for the first half of 1997 indicate that the trade deficit will likely increase in 1997. By theend of June, the trade deficit for all products was nearly 70 percent of the total deficit for 1996. For foodand agricultural products, the trade deficit at the end of June was already greater than for the entire yearin 1996. A positive development in late 1997 was the inspection of eleven Lithuanian dairy enterprisesby EU veterinary officials, which led to approval of the enterprises for exports to the EU. This wasespecially encouraging in view of the denial of this approval to Polish and Estonian enterprises.
Progress on EUAccession
The free trade agreement between the EU and Lithuania, including preferential tariff rates and tariff ratequotas for food and agricultural products, became effective on I January 1995. Lithuania signed anassociation agreement with the EU in June of 1995, and later applied for full membership. Theassociation agreement, which came into force on 1 February 1998, provides a supportive framework forthe preparation necessary for full membership. Original expectations regarding improved access to EUfood and agricultural markets have generally not been realized, however, primarily because of theinadequate quality of Lithuanian products. The country receives significant financial assistance throughthe EU/PHARE program, which will focus on pre-accession measures beginning with the 1998 FinancialMemorandum. Lithuania will be eligible for additional funds for structural adjustment to bring it in linewith the requirements of the EU single market. During the past five years, Lithuania received over 20million ECU in support of the restructuring of the agricultural sector. The program provided assistancefor training in agricultural policy, improvement of productivity in the livestock and crop sectors, themodernization of land information systems, an Agricultural Management Training Center, and expandedthe agricultural advisory services to aid farms and to facilitate the restructuring of agroprocessing,among other things.
The country has made significant progress in preparing the sector for EU membership.According to the July 1997 evaluation of the EU Commission, however, substantial, sustained efforts are
140
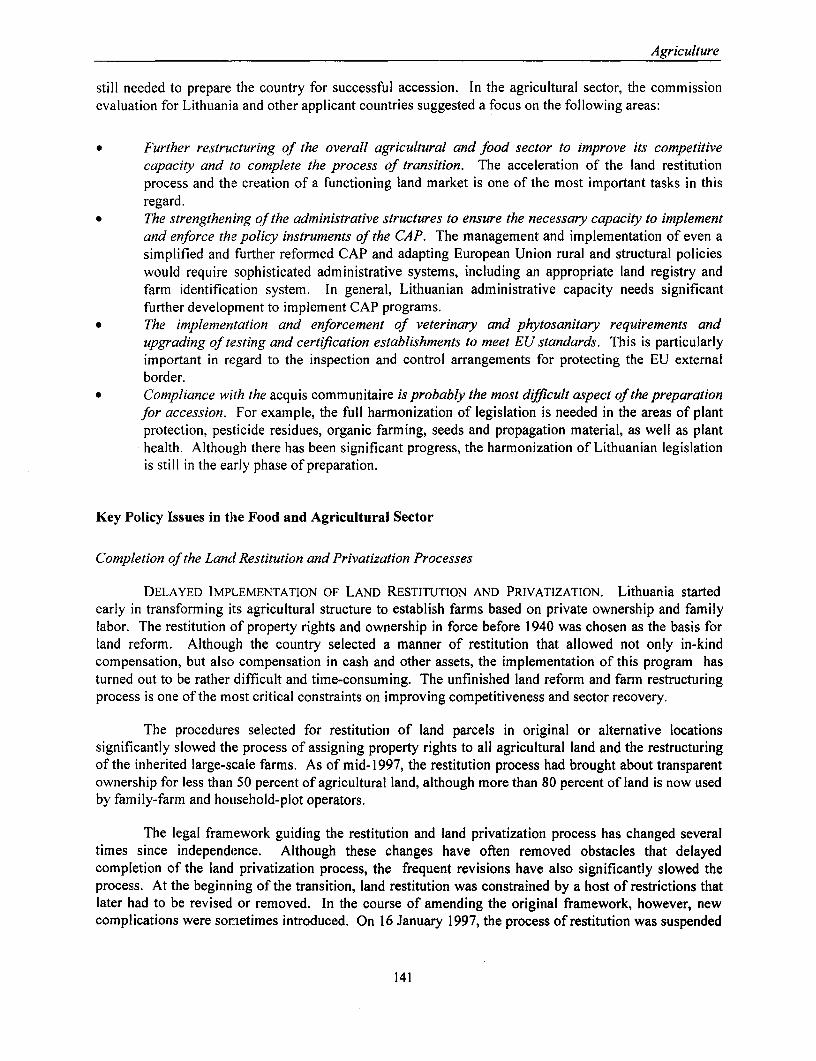
Agriculture
still needed to prepare the country for successful accession. In the agricultural sector, the commissionevaluation for Lithuania and other applicant countries suggested a focus on the following areas:
Further restructuring of the overall agricultural and food sector to improve its competitivecapacity and to complete the process of transition. The acceleration of the land restitutionprocess and the creation of a functioning land market is one of the most important tasks in thisregard.The strengthening of the administrative structures to ensure the necessary capacity to implementand enforce the policy instruments of the CAP. The management and implementation of even asimplified and further reformed CAP and adapting European Union rural and structural policieswould require sophisticated administrative systems, including an appropriate land registry andfarm identification system. In general, Lithuanian administrative capacity needs significantfurther development to implement CAP programs.The implementation and enforcement of veterinary and phytosanitary requirements andupgrading of testing and certification establishments to meet EU standards. This is particularlyimportant in regard to the inspection and control arrangements for protecting the EU externalborder.Compliance with the acquis communitaire is probably the most difficult aspect of the preparationfor accession. For example, the full harmonization of legislation is needed in the areas of plantprotection, pesticide residues, organic farming, seeds and propagation material, as well as planthealth. Although there has been significant progress, the harmonization of Lithuanian legislationis still in the early phase of preparation.
Key Policy Issues in the Food and Agricultural Sector
Completion of the Land Restitution and Privatization Processes
DELAYED IMP!LEMENTATION OF LAND RESTITUTION AND PRIVATIZATION. Lithuania startedearly in transforming its agricultural structure to establish farms based on private ownership and familylabor. The restitution of property rights and ownership in force before 1940 was chosen as the basis forland reform. Although the country selected a manner of restitution that allowed not only in-kindcompensation, but also compensation in cash and other assets, the implementation of this program hasturned out to be rather difficult and time-consuming. The unfinished land reform and farm restructuringprocess is one of the most critical constraints on improving competitiveness and sector recovery.
The procedures selected for restitution of land parcels in original or alternative locationssignificantly slowed the process of assigning property rights to all agricultural land and the restructuringof the inherited large-scale farms. As of mid-1997, the restitution process had brought about transparentownership for less than 50 percent of agricultural land, although more than 80 percent of land is now usedby family-farm and household-plot operators.
The legal framework guiding the restitution and land privatization process has changed severaltimes since independence. Although these changes have often removed obstacles that delayedcompletion of the land privatization process, the frequent revisions have also significantly slowed theprocess. At the beginning of the transition, land restitution was constrained by a host of restrictions thatlater had to be revised or removed. In the course of amending the original framework, however, newcomplications were somnetimes introduced. On 16 January 1997, the process of restitution was suspended
141

Agriculture
in order to enact new legislation that would provide increased opportunities for original landowners(including foreign residents) to receive land or compensation, increase the amount of land that wasallowed for each original owner under restitution (agricultural land, from 80 to 150 hectares; forestedland, from 25 to 150 hectares), make available more attractive compensation arrangements, and eliminatethe obligatory lease to agricultural companies. The new amendments to the laws were designed toaccelerate the process, but opening the process to a wider range of claimants may also cause furtherdelays and increase the cost of restitution.
Altogether, about 500,000 claims were submitted for restitution of 3.5 million hectares of land.Of these, 89,000 claimants requested cash compensation, and 13,200 wanted forested land. By the end of1997, about 165,000 claims were to be fully processed and 26,000 partially settled (representing about 30percent of agricultural land). About 197,000 claims remain unsettled, which are, of course, the moredifficult ones. The cash compensation is significantly constrained by the availability of financialresources. The amended restitution law has the potential to increase the number of claims by increasingthe allowed size of restituted land and opening the process to heirs who are now foreign residents.According to government estimates, with the currently available resources, the completion of therestitution process will require another three to five years.
Land restitution has required an immense effort by the government. The process of surveyingland, designing maps, identifying land use, and legally processing ownership documents has beenextremely time-consuming and administratively and technically difficult. Administratively, land reformis being run by the National Land Survey under the Ministry of Agriculture and Forestry. Most of theadministrative work is done in district agriculture boards and agrarian reform boards under the localauthorities. Possibly more important than the recent legal changes, the organization and staffing of theNational Land Survey has been restructured to increase the number of surveyors and streamline theadministrative procedures.
SLOW DEVELOPMENT OF THE LAND MARKET. Closely related to the slow restitution process isthe slow development of a real agricultural land market. The land market is constrained by the relativelylow percentage of land that is actually registered and titled, the legal constraints restrictinglandownership to physical persons and the state, and the upper limit on individually owned land. Foreignlegal persons, however, became eligible for landownership after the Association Agreement came intoforce. Only registered land can be legally sold or leased. There is no reliable information available onactual land sales, but according to estimates, the market is rather modest.
At the same time, there is a quite active lease market, which increased further and carried higherrents after compulsory leasing to agricultural companies was eliminated in mid-1997. The mostsignificant land-trading activity is related to the purchase from the government of the household plotsused in rural areas during the Soviet period. The current users have priority in purchasing the plots overformer owners who might claim them. Of 340,000 household plots, about one-third of the owners havealready purchased their plots with privatization vouchers. Another third of the users have included thisland in their restitution claims. The remaining third of the cases are still unsettled.
ECONOMIC COSTS OF A POORLY FUNCTIONING LAND MARKET. One of the often-cited reasonsfarmers give for lack of creditworthiness is the lack of adequate collateral. In part, this problem will besolved as more landowners secure title to their land. Nevertheless, banks will continue to be reluctant toaccept land as collateral unless this asset can first be acquired by a bank in foreclosure, and then sold in areasonable period of time for a price that can be evaluated in advance. This cannot be the case unlesslegal entities, including banks, are permitted to own land, and the land market is sufficiently active to
142
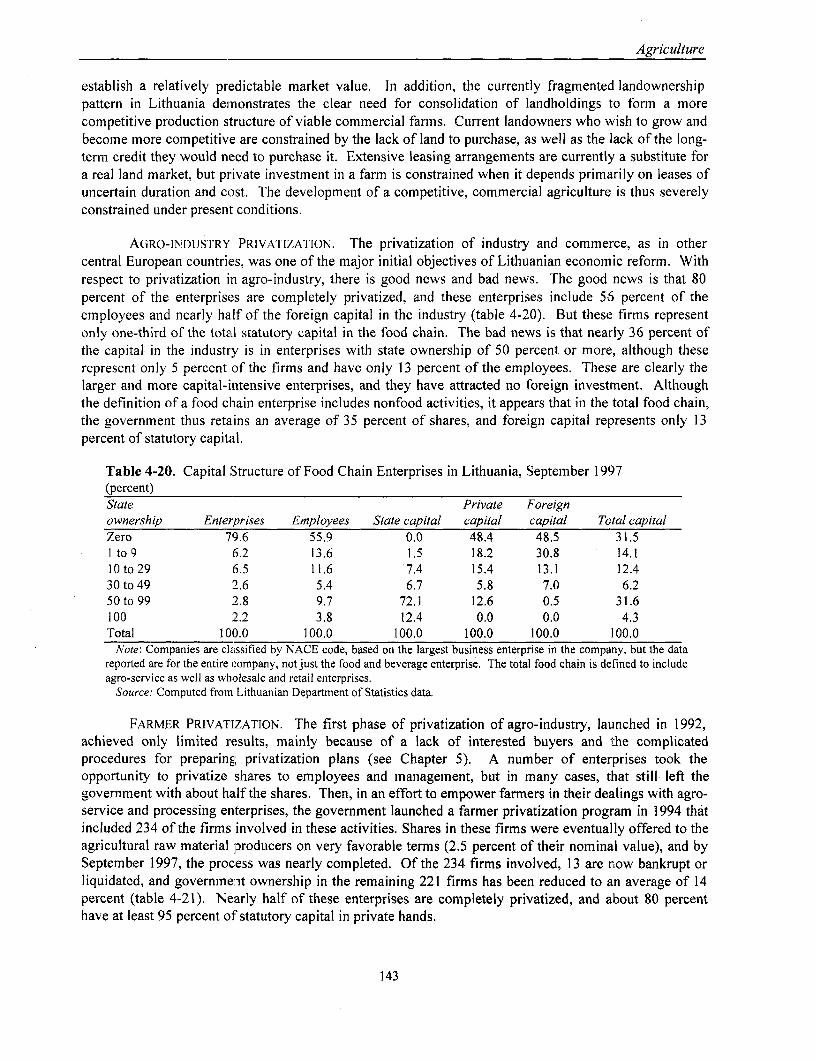
Agriculture
establish a relatively predictable market value. In addition, the currently fragmented landownershippattern in Lithuania demnonstrates the clear need for consolidation of landholdings to form a morecompetitive production structure of viable commercial farms. Current landowners who wish to grow andbecome more competitive are constrained by the lack of land to purchase, as well as the lack of the long-term credit they would need to purchase it. Extensive leasing arrangements are currently a substitute fora real land market, but private investment in a farm is constrained when it depends primarily on leases ofuncertain duration and cost. The development of a competitive, commercial agriculture is thus severelyconstrained under present conditions.
AGRO-INDUSTRY PRIVATIZATION. The privatization of industry and commerce, as in othercentral European countries, was one of the major initial objectives of Lithuanian economic reform. Withrespect to privatization in agro-industry, there is good news and bad news. The good news is that 80percent of the enterprises are completely privatized, and these enterprises include 56 percent of theemployees and nearly half of the foreign capital in the industry (table 4-20). But these firms representonly one-third of the total statutory capital in the food chain. The bad news is that nearly 36 percent ofthe capital in the industry is in enterprises with state ownership of 50 percent or more, although theserepresent only 5 percent of the firms and have only 13 percent of the employees. These are clearly thelarger and more capital-intensive enterprises, and they have attracted no foreign investment. Althoughthe definition of a food chain enterprise includes nonfood activities, it appears that in the total food chain,the government thus retains an average of 35 percent of shares, and foreign capital represents only 13percent of statutory capital.
Table 4-20. Capital Structure of Food Chain Enterprises in Lithuania, September 1997(percent)State Private Foreignownership Enterprises Employees State capital capital capital Total capitalZero 79.6 55.9 0.0 48.4 48.5 31.5I to9 6.2 13.6 1.5 18.2 30.8 14.110 to 29 6.5 11.6 7.4 15.4 13.1 12.430 to 49 2.6 5.4 6.7 5.8 7.0 6.250to99 2.8 9.7 72.1 12.6 0.5 31.6100 2.2 3.8 12.4 0.0 0.0 4.3Total 100.0 100.0 100.0 100.0 100.0 100.0
Note: Companies are classified by NACE code, based on the largest business enterprise in the company, but the datareported are for the entire company, not just the food and beverage enterprise. The total food chain is defined to includeagro-service as well as wholesale and retail enterprises.
Source: Computed from Lithuanian Department of Statistics data
FARMER PRIVATIZATION. The first phase of privatization of agro-industry, launched in 1992,achieved only limited results, mainly because of a lack of interested buyers and the complicatedprocedures for preparing privatization plans (see Chapter 5). A number of enterprises took theopportunity to privatize shares to employees and management, but in many cases, that still left thegovernment with about half the shares. Then, in an effort to empower farmers in their dealings with agro-service and processing enterprises, the government launched a farmer privatization program in 1994 thatincluded 234 of the firms involved in these activities. Shares in these firms were eventually offered to theagricultural raw material producers on very favorable terms (2.5 percent of their nominal value), and bySeptember 1997, the process was nearly completed. Of the 234 firms involved, 13 are now bankrupt orliquidated, and government ownership in the remaining 221 firms has been reduced to an average of 14percent (table 4-21). Nearly half of these enterprises are completely privatized, and about 80 percenthave at least 95 percent of statutory capital in private hands.
143

Agriculture
Table 4-21. Degree of Privatization in Upstream and Downstream Industries, September 1997
Statutory Assets privatizedType of enterprise Number capital (million Lt) (percent)Agro-service 77 87.0 93.1Land reclamation 45 67.8 91.7Crop selection 9 8.2 99.1Livestock breeding 13 1.4 90.0Meat processing I 1 86.7 80.8Milk processing 30 261.4 77.3Fruit and vegetable processing 7 4.5 98.8Grain processing 21 147.3 96.7Sugar refineries 4 98.5 90.7Flax processing 4 13.5 75.3Total with farmer privatization 221 776.3 86.5
Total food and beverage manufacture 421 1,789.4 59.5Total food chain 1,527 2,274.6 65.4Note: See note to table 4-20.
Source: Lithuanian Ministry of Agriculture and Forestry and Lithuanian Department of Statistics.
Despite these achievements, there remain many companies with a small percentage ofgovernment shares, and a significant number of large companies with controlling government shares.Moreover, there is still very little foreign investment in agro-industry, although foreign investment is akey factor in gaining access to the needed capital and experience necessary to rapidly develop a modern,competitive, and efficient upstream and downstream industry. The inability ofagro-industries to produceproducts of the quality required by international markets, and to market them competitively, is a seriousconstraint for the entire rural sector.
Changing market and policy conditions caused a sharp reduction in both farm product supply andconsumer demand (both domestic and external), as well as an increase of competition in the domesticmarket (created by the liberalization of trade policies and growing imports), so the large-scale foodindustry enterprises often found themselves with excess capacity, outdated technology, andunderdeveloped input supply and output marketing infrastructures. The low rate of capacity utilization,combined with poor efficiency and the limitations on the ability to reduce costs created by inefficienttechnology, also contributed to growing product unit cost and, in some cases, bankruptcies. At the sametime that successor agroprocessing industries are working far below capacity, a large number of smaller-scale, fully private, modern, and more competitive agroprocessing enterprises have been established.This trend reflects the slow pace and difficulties of restructuring within the inherited agroprocessingstructures.
Strategyfor Further Rationalization ofDomestic Market Support and Trade Policies
AGRICULTURAL SUPPORT PROGRAMS. The evolution of the macro policy environment and theincentive framework has been one of the most critical and debated components of the transition processin the sector. The recent trend indicates a move toward supporting the development of a competitivefarming sector by gradually abolishing price subsidies and supporting farm incomes through directpayments and investment support, as well as reducing the level of market protection.
The National Agricultural Program (NAP) was a fund for direct subsidies, credit programs,infrastructure investment, research, and extension support that accounted for about 70 percent of totalagricultural budget expenditures from 1994 to 1995. In 1994, about half of NAP funds were used to
144

Agriculture
establish soft credit funds for farmers and processors. In subsequent years, about half of NAP funds wereused for the farm price subsidies introduced in 1995. The largest portion of these subsidies went to cattleand milk producers.
The minimal marginal purchase price (MMPP) was the major component of market regulation in1995 and 1996. Price support measures implemented in 1995 included MMPPs for specified quantitiesof farm products, direct subsidy payments to farmers for a subset of these products, and periodic ad hocinterventions that included government stock purchases and temporary export subsidies. These programswere not well targeted, and in many cases provided conflicting incentives to private decisionmakers.Thus they contributed neither to quality improvements nor to the development of an efficient farmingstructure, but the measures did put additional pressure on the budget. Inasmuch as the MMPP wasintended as a floor price, this program could be compared with the intervention price system in the EU.The government had no intervention system, however, and had to rely on private processing enterprisesto implement this schem[e. The levels of these support prices compared with farm prices indicates thatMMPPs and subsidies in 1995 were high enough to distort price signals to producers in many cases, andwere even more distorting at the higher 1996 levels.
RURAL SUPPORT FUND. At the beginning of 1997, the new government initiated a series ofchanges in these prograrns to integrate all support measures under the framework of the Rural SupportFund (RSF). The reform of agricultural support programs includes several measures: (1) reform of theMMPP by eliminating or reducing the levels and quotas for MMPPs and targeting direct payments tohigher-quality products; (2) decreasing the amount and increasing the transparency of credit subsidies; (3)creation of a Rural Credit Guarantee Fund; and (4) introduction of investment grant programs. Theseprograms are spelled out in a public document that includes all provisions and procedures, which indicatethat support will be allocated in a much more targeted, demand-driven, and transparent fashion. Thesubsidized credit progranms were replaced by targeted investment grants, a Rural Credit Guarantee Fund,and a copayment system for interest on short-term bank loans for fuel, fertilizer, and chemicals. Exceptfor market regulation, implementation of all RSF programs is carried out at the district level.
The goal of these reforms is to provide a more targeted, more transparent, more cost-effective,and less distorting support system for farms and rural communities. If a farmer, rural entrepreneur, orgroup of entrepreneurs prepares an investment project in one of the targeted areas and is foundcreditworthy by a bank, he or she can compete for a grant equal to 25 percent of the investment cost.Competitions are to be held publicly in each district, and recipients of grants will be announced publicly.In addition, Lt 20 million was allocated as the government contribution to a market-driven Rural CreditGuarantee Fund. In other significant actions, the new government revoked the 12 percent increasepreviously announced (in July 1996) to the MMPP plus subsidy levels for products covered by the pricesupport program for 1997.
Beginning in the second quarter of 1997, the Ministry of Agriculture and Forestry alsoimplemented major reforms in the price support programs by reducing the number of commoditiessubject to MMPPs and subsidies, freezing or limiting increases in the levels of the remaining supports,and targeting higher-quality production. These changes included the complete elimination of MMPPsfor barley, feed grains, lowest-grade flax straw, and lowest-grade pigs. MMPPs for higher-grade pigs,feed legumes, and buckwheat were kept at the same level as in 1996, while food wheat, rye, rapeseed,and the highest-grade flax straw increased slightly (the largest increase was 10 percent, for highest-gradeflax straw). Direct subsidy payments were eliminated for the lowest grade of pigs and the lowest grade offlax straw; they were increased for highest-quality flax and rye; and they remained the same for otherproducts. The cattle subsidy was targeted to discourage the marketing of young calves for veal. There is
145

Agriculture
now no subsidy for slaughtered veal, and headage payments are only paid to farmers for heavier animalsmarketed in the higher-grade classes. On August 1, a direct subsidy payment of Lt 70 per ton wasintroduced for the 200,000-ton food-wheat quota. With the same guaranteed price (MMPP plus subsidy),the introduction of a subsidy reduces the MMPP (and thereby market price) by an equivalent amount, andthereby reduces the market distortion. On September 1, the support program for pigs was eliminatedcompletely.
The quotas that determine the amount of the product that is eligible for MMPPs and subsidieswere drastically reduced for crops. The grain quota is 33 percent lower than in 1996, and the total cropquota is 10 percent below 1996. Quotas are no longer used as an instrument in cattle and milk programs.But these quotas, unlike the quotas for grains, have been at least as large as the quantity processed byparticipating plants, and this change has little effect except to reduce administrative costs.
Based on increasing pressure from farm groups and supported by higher government levels, inJuly the Ministry of Agriculture and Forestry (MoAF) revised its price and subsidy support strategy ofApril 1997 and raised the support levels for milk producers. This led to an increase of 7.3 percent inMMPPs and subsidies on I August 1997. These levels are still well below those set by the previousgovernment for 1997, but they will delay the overall direction of the effort by MoAF to reduce marketdistortions. This development underscores the need for a broadly supported, longer-term policyframework that would provide greater stability in the policy and economic environment fordecisionmakers.
AGRICULTURAL BUDGET. The agricultural budget of Lithuania has been increasing since 1994,but at a rate that has caused it to remain nearly constant in real terms (table 4-22), and to increase in U.S.dollars, because of the real appreciation of the litas (figure 4-4). The total agricultural budget remainedapproximately 10 percent of the total state budget from 1994 to 1996; but as a share of GDP, agriculturalGDP, and the value of agricultural production, the total budget and the subsidies have been declininggradually (the agricultural budget in 1996 was 1.7 percent of GDP). About one-third of the 1997
Figure 4-4. Agricultural Budget Allocation
Current 1994 LitasUS$ 19 ia
160 350
140 300
120 250
100200
80150
60
10040
20 50
1994 1995 1996 1997
In current US$ - 1994 Litas
146

Agriculture
Table 4-22. Agriculture Budget-Expenditure, 1994-96(Lt thousand)Item 1994 1995 1996
1. Financing of agricultural agencies 69,856 70,511 92,1452. Strategic food and seed reserves 12,480 29,175 27,0003. Capital investment 8,465 3,930 4,5394. Compensation for agricultural land and forest 0 0 11,0005. Ministry of Agriculture 3186 4,184 6,6876. National agricultural program 202,900 305,500 347,5416.1. Farm price subsidies 27,700 140,300 195,0006.2. Net cost of intervention stocks 0 17,000 14,2006.3. Subsidy for dairy mixes for babies 0 0 4506.4. Credit programs 101,700 34,600 20,4286.5. Restructuring grants to farmers in low-productivity land 0 13,800 12,3546.6. Farm establishment and infrastructure 37,000 34,700 42,9186.7. Subsidies for quality breeds and seeds 1,300 7,900 14,4936.8. Liming of acid soils 0 16,000 06.9. Financing of breeding program 5,300 11,000 17,4506.10. Agricultural research and extension 4,100 8,200 12,1806.11. Development of organic production and removal of pollution 3,500 3,750 2,6736.12. Development of cooperation and agro-service 6,400 0 10,8356.13. Other 15,900 18,250 33,624Total 296,887 413,300 517,976
(In 1994 Lt) 296,887 296,060 296,835Source: Lithuanian Ministry' of Agriculture and Forestry.
agricultural budget has been allocated for financing agricultural agencies to maintain strategic food andseed reserves, as well as for public investment and to cover the cash compensation of land restitution(table 4-23). The capital investment program has been significantly reduced for 1997, while there is analmost fourfold increase in the funds available for cash compensation to accelerate the restitution process.Lithuania has provided significant funds for the direct and indirect support of agricultural producers inrecent years, and this accounts for about two-thirds of agricultural budget allocations.
AGGREGATE MEASURE OF SUPPORT. Although there are many conceptual problems in theapplication of producer subsidy equivalents (PSE) calculations in transition economies such as Lithuania,it is nevertheless a way of comparing similar countries through some aggregate measure of support. Bythis measure, the PSE coefficient for Lithuania was positive, at 14 percent, in 1996. Accordingly, in1996, Lithuania had a support level about one-third of the level in the EU, slightly below the average inother CEECs, and about twice that in Estonia or Latvia (figure 4-5). Because the PSE methodologyassumes that domestic price levels reflect levels of market support, the PSE has been increasing withtime, partly because domestic prices are converging on world price levels, and partly because ofincreased direct payments (table 4-24). In support per hectare of agricultural land, Lithuania's PSE isthree times the levels in Estonia and Latvia, and far below those in Hungary and Poland (table 4-25).Another indicator is the relative importance of different types of support. Here, Lithuania seems to relymore on direct payments compared with other CEECs; the proportions more closely resemble those seenin the EU and the United States. While direct payments are considered to be less distorting than marketprice supports, they still clistort market signals to producers.
147
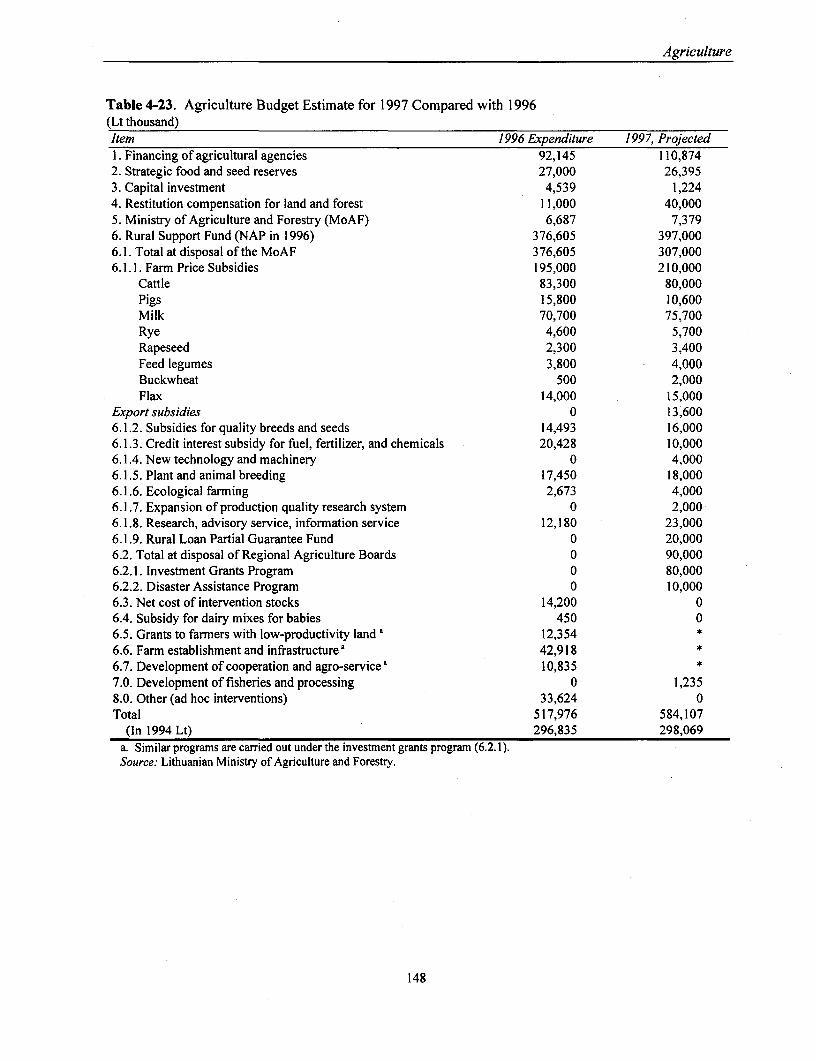
Agriculture
Table 4-23. Agriculture Budget Estimate for 1997 Compared with 1996(Lt thousand)Item 1996 Expenditure 1997, Projected1. Financing of agricultural agencies 92,145 110,8742. Strategic food and seed reserves 27,000 26,3953. Capital investment 4,539 1,2244. Restitution compensation for land and forest 11,000 40,0005. Ministry of Agriculture and Forestry (MoAF) 6,687 7,3796. Rural Support Fund (NAP in 1996) 376,605 397,0006.1. Total at disposal of the MoAF 376,605 307,0006.1.1. Farm Price Subsidies 195,000 210,000
Cattle 83,300 80,000Pigs 15,800 10,600Milk 70,700 75,700Rye 4,600 5,700Rapeseed 2,300 3,400Feed legumes 3,800 4,000Buckwheat 500 2,000Flax 14,000 15,000
Export subsidies 0 13,6006.1.2. Subsidies for quality breeds and seeds 14,493 16,0006.1.3. Credit interest subsidy for fuel, fertilizer, and chemicals 20,428 10,0006.1.4. New technology and machinery 0 4,0006.1.5. Plant and animal breeding 17,450 18,0006.1.6. Ecological farming 2,673 4,0006.1.7. Expansion of production quality research system 0 2,0006.1.8. Research, advisory service, information service 12,180 23,0006.1.9. Rural Loan Partial Guarantee Fund 0 20,0006.2. Total at disposal of Regional Agriculture Boards 0 90,0006.2.1. Investment Grants Program 0 80,0006.2.2. Disaster Assistance Program 0 10,0006.3. Net cost of intervention stocks 14,200 06.4. Subsidy for dairy mixes for babies 450 06.5. Grants to farmers with low-productivity land a 12,354 *
6.6. Farm establishment and infrastructure a 42,918 *
6.7. Development of cooperation and agro-servicea 10,835 *
7.0. Development of fisheries and processing 0 1,2358.0. Other (ad hoc interventions) 33,624 0Total 517,976 584,107
(In 1994 Lt) 296,835 298,069a. Similar programs are carried out under the investment grants program (6.2.1).Source: Lithuanian Ministry of Agriculture and Forestry.
148

Agriculture
Figure 4-5. Aggregate PSEs in 1996, Various Countries
45-
40-
35. U30.
I t25___ U 20.
5 U...
0
Estonia Latvia Lithuania Hungary Poland EU OECD
Table 4-24. Summary of Aggregate PSEs for Selected CEEC, EU, and OECD
Country/group 1993 1994 1995 1996Estonia -30 -6 3 7Latvia -38 9 8 7Lithuania -33 -8 6 14Czech Republic 25 20 14 10Hungary 23 29 16 11Poland 15 22 21 28Slovakia 35 31 25 19European Union 49 49 49 43OECD countries 42 42 40 36Source: OECD, Agricultural Policies in Transition: Monitoring and Evaluation 1997; Statistical annex (Paris.
1997).
149

Table 4-25. Composition of Agricultural Support in Lithuania and Selected Countries, 1996United Czech
Item Lithuania Latvia Estonia OECD EU States Australia Republic Hungary Poland
US$ per hectare
PSE per hectare ofagricultural land 50 13 17 161 745 63 3 76 104 291
Percentage
PSE 14 7 7 36 43 16 9 10 11 28
Type of supportMarket price support 69.8 44.4 85.5 60.0 51.0 47.0 42.0 -2.0 24.0 99.0Directpayments 24.5 11.1 0.0 23.0 33.0 20.0 5.0 17.0 11.0 0.0Other support 23.4 44.4 26.6 18.0 16.0 33.0 61.0 37.0 53.0 13.0Feed adjustment + levies -17.7 0.0 -12.1 -1.0 0.0 0.0 -8.0 48.0 12.0 -12.0
,, Total 100.0 100.0 100.0 100.0 100.0 100.0 100.0 100.0 100.0 100.0Source: OECD, various publications.

Agriculture
TAX POLICY. Agriculture in Lithuania received significant tax preferences up to 1997. Recentgovernment decisions reduced some of these indirect subsidies, but tax preferences remain significant.Agricultural companies are given a preferential profits tax rate of 10 percent, compared with a 29 percentrate for other legal entities. The income tax schedule for individual farmers provides a zero tax rate forthose who receive 50 percent or more of their incomes from farming. It is unlikely that the income-sharetest can be enforced, since there is no universal income reporting system in Lithuania. Nevertheless, eventhese preferential tax rates were waived for agricultural companies and individual farmers every yearuntil I January 1997, at an estimated cost of Lt 60 million annually. The waiver of income and profit taxobligations for farmers has not been extended, although farmers still benefit from preferential tax rates.A land tax was introduced in 1992 at a basic rate of 1.5 percent of land value, but it was only to takeeffect three years after land had been recorded in the registry. The three-year exemption is expiring onland acquired in 1994 and earlier, and collection of the land tax has begun. Those who did not farm theland themselves were required to pay the land tax immediately after registration of the land.
Since the introduction of the VAT in May 1994, and up until January 1997, there was apreferential VAT rate for domestically produced food and agricultural products (9 percent rather than thestandard 18 percent on other products). In addition to the implicit subsidy for food products relative tononfood items, this VAT preference also provided increased protection for domestically produced foodproducts over importedl products, which were taxed at the 18 percent rate. These VAT preferences wereestimated to cost the budget about Lt 200 million annually in lost revenues before they were discontinuedon I January 1997.
TRADE POLICIES. The development of trade policy proceeded from the implementation ofquantitative restrictions, including export bans and licensing, toward more consistent and transparenttrade regulations. External pressures to establish consistent and transparent trade policies led toelimination of nontariff barriers and a switch to the use of mostly ad valorem tariffs. Bilateral andmultilateral agreements enforced this process. On I April 1995, a government resolution established adifferentiated tariff system that includes most-favored nation, MFN (conventional); preferential (underfree trade agreements); and autonomous tariffs. Tariff rates are set by government resolution and otherlegal acts that do not require Parliament's approval. More consistent trade policies are beginning toemerge, and they have begun to harmonize the trade regime with domestic and world market conditionsand constraints. Under the 1994 EEF Arrangement with the IMF, Lithuania reduced average tariff rateson a specified basket of food products from 44 percent to 35.2 percent in October 1995, and to 27.5percent in October 1997. Further tariff reductions did not take place after the Arrangement with the IMFwas renegotiated in early 1997, and tariff levels have remained essentially unchanged since then. Importtariffs range from 20 lto 30 percent for most agricultural and food products, except for butter, at 45percent, and sugar, which was tariffed at 87 percent in 1997 (table 4-26).
The tariff rates are generally lower than those in Latvia, and substantially lower for most productsthan the WTO bound tariff rates of the Visograd countries (table 4-27). Latvia and Poland also still usespecific tariffs that no longer exist in Lithuania. Lithuania's MFN rates are similar to the minimumaccess tariff rate comimitments made by the Visograd countries in the Uruguay Round AgricultureAgreement for limited quantities of imports (table 4-28).
Lithuania does not have a significant or regular system of export subsidization. In 1995, therewere limited export subsidies for butter, cheese, and canned milk. There was also an export subsidy forpork and ad hoc export restrictions for a few other products. In 1996 and 1997, export subsidies werepaid on tenders to export beef surpluses to Russia. In general, however, export measures have beensporadic, and less important than import measures.
151

Agriculture
Table 4-26. Import Tariffs for Main Agricultural and Food Products in Lithuania, 1997(percent)Commodity MFN rate Autonomous rateLive cattle 20 25Live pigs 20 25Live poultry 20 25Beef and veal 30 30Pig meat 30 30Poultry meat 25 25Milk and dairy products 20 20Butter 45 45.Fermented and cottage cheese 30 35Eggs 30 30Potatoes 20 20Grain 30 35Wheat and rye flour 30 35Combined feed 30 35Sugar 87 87Bakery products 30 35
Note: MFN, most-favored-nation.Source: Lithuanian Ministry of Agriculture and Forestry.
Table 4-27. Comparison of MFN Tariff Rates in Selected CEECs(percent)
Czech SlovakRepublic, Republic, Poland,a Hungary, Lithuania, Latvia,
Product 1995 1995 1995 1995 1997 1995
Cattle 61-115 61-115 20,max. 1,454/t 47 20 30Beef 40 39-43 30, max. 4,740/t 112 30 30Pork 30 24 129, max. 1,400/t 61 30 45Poultry meat 54 54 120, max. 2,005/t 61 25 30Sausage 20 20 140, max. 2,400/t 60 14 45Eggs 20 20 100, min. 164/1000 30 30 30Milk powder 50 50 160, min. 2,857/t 80 20 30Butter 69 77.7 160, max. 3,614/t 159 45 45Cheese 10 10 250 105 30 45Potatoes 69 10 200 52 20 30Wheat, durum 25 25 40 50 0 25 Ls/mtWheat, other 25 25 100, min. 150/t 50 30 25 Ls/mtOther grains 25 25 80, min. 145/t 41-50 30 75 Ls/mtSugar 70 70 120, min. 0.53/kg 80 87 120 Ls/mt
a. Poland-specific rates are in ECU.Note: MFN, Most-favored-nation.Source: CEFTA countries from A. Pouliquen, "Agro-food Dynamics and Competitiveness in Central Europe: Implications for
the EU Enlargement," in Agricultural Accession of the CEECs to the European Union (Budapest: Institute for World Economicsof the Hungarian Academy of Sciences, 1997) and selected UR commitment schedules; Lithuania, from Lithuanian MoAF;Latvia, from World Bank EC4NR Agriculture Policy Note No. 3.
152

Agriculture
Table 4-28. Comparison of WTO Minimum Access Rates with Lithuanian MFN RatesMinimum access rates
(3-5 percent of domestic consumption)Czech Slovak Lithuania,
Republic, Republic, Poland,a Hungary, MFN rates,Product 1995 1995 1995 1997 1997
Cattle 30 20 20 15 20Beef 30 30 30 15-25 30Pork 30 25-30 30 15-25 30Poultry meat 24 30 30 or 0.3/kg 35 25Sausage 20 20 35 25 14Eggs 20 20 25 or min 0.03/pc 35 30Milk powder 30-35 30-35 40 30 20Butter 32 32 40 60 45Cheese 10 10 35 50 30Potatoes 50 50 50 10 20Wheat, durum 7 7 20 10 0Wheat, other 7 25 25 10 30Other grains 7 25 20 3 30Sugar 70 70 40, min 0.17/kg 80 87a. Poland-specific rates are in ECU.Note: MFN, Most-favored-nation.Source: Minimum access rates from OECD; Lithuania, from Lithuanian MoAF.
Lithuania, like many other countries with fledgling customs services, has had difficulty dealingwith undervaluation of imported goods. In response to this problem, the Seimas introduced a system ofthreshold prices in the 1994 law, but these instruments were never implemented. It is unclear how thesewould be set, and they would not survive negotiations with the World Trade Organization (WTO) onaccession. Moreover, the implementation mechanisms would be very costly and would require additionalinstitutional development and personnel training. There is, however, a reference price that is used toassess the sugar tariff. This means that the actual tariff is about twice as high as it would have been if itwere calculated from world market prices. This is a form of protection that was extended to grain andgrain products in July 1997, but will be eliminated at the time of accession to WTO.
FREE TRADE AGREEMENTS. Since independence, Lithuania has signed a series of bilateral tradeagreements with neighboring countries, and also with the EU and EFTA. The Baltic Free TradeAgreement (BFTA), signed in 1994, has included free trade provisions for farm products since January1997. Trade with CIS countries has been through a period of difficulties, although Lithuania now hastrade agreements with most of these countries, and the region is a major market for meat and dairyproducts. The Central European Free Trade Association (CEFTA) countries have become significanttrading partners, and Lithuania is actively working to join CEFTA once its membership in the WTO hasbeen approved and bilateral free trade agreements have been signed with all CEFTA members.
WTO. Lithuania is in the final stages of negotiating its membership in WTO, having hadobserver status in the General Agreement on Tariffs and Trade (GATT) since 1992. Many of the majorsteps necessary to bring Lithuania's trade policies in line with WTO regulations have already beencompleted. There are, however, several important outstanding issues yet to be resolved. Membership inWTO will definitely encourage greater consistency and transparency in Lithuania's agricultural tradepolicies and will support the emergence of an internationally competitive sector.
153

Agriculture
URGENT POLICY ISSUES. Although the government has made significant progress in reducingmarket distortions, this progress has been achieved primarily by increasing direct subsidy paymen'ts thatsend price signals to producers that are inconsistent with market realities and continue to strain budgetresources. Moreover, the continued use of MMPPs for some products in the absence of governmentintervention authority puts pressure on the private processing industry to pay prices that are, at times,above market-clearing levels. These problems have recently been most notable in the wheat, dairy, andsugar markets.
When world market prices for wheat fell in 1997, the MMPP (although only for a small portionof high-quality food wheat) was too high, and the government was obliged to introduce a direct payment(Lt 70 per ton) to reduce the purchase price. The cost to the budget was Lt 14 million, which had to becovered by reallocations within fixed budget resources. In the case of milk, more than 90 percent ofprocessed milk is used for manufactured products, half of which are exported. These products must becompetitive in the world market, and attempts by the government to increase the purchase price can leadto surplus products with no market. There is some evidence that the MMPP on second-grade milk hasreduced the premium that processors would normally pay for higher-quality milk.
Sugar policy is by far the most distorting of all. Because of the 1995 Sugar Law that establisheda minimum explant price for processed sugar, competition among domestic plants is curtailed. Since thisprice is currently Lt 2.5 a kilogram ($625/ton), an effective tariff of over 100 percent is required tomaintain competitiveness in the domestic market. As already noted, this is achieved by using a referenceprice in assessing the import tariff, making the tariff prohibitive. Since application of such a tariff woulddestroy the export potential of the domestic confectionery industry, tariff rate quotas with zero duty onsugar are permitted to allow the food industry to produce exportable products. Thus, a new sugar policymust be formulated in the near future to bring the sugar regime into compliance with WTO requirements.
Policies to Facilitate Restructuring of the Agricultural and Rural Economy
Since 1990, the share of employment in the agricultural sector has increased by a fifth (to 24 percent),while the share of agriculture in GDP has remained stagnant (at about II percent in normal weatheryears). These trends were partially the result of widespread restitution of land, and, while the statisticsmay overstate the case, they suggest that agricultural employment has been a safety net in the early yearsof the transition (albeit at income levels that are well below the economy's average). The ruralpopulation has remained fairly stable at one-third of the population, even though unemployment rates inrural areas have been rising more rapidly than in urban areas. The reduction of subsidies, opening oftrade, and privatization or liquidation of food industry enterprises will very likely put further strain onrural employment and income levels. This creates important externalities in fostering integrated ruraldevelopment and farm labor retraining programs that public policy may need to address.
In the Soviet era, most of the rural population was employed directly or indirectly in agriculture,and rural services were largely provided by the state and collective farms. When these farms werereconstituted during the privatization and restructuring of farming systems, rural services often sufferedseverely, and the existing infrastructure was not suitable for the increasing number of homestead farms.
Despite the shortcomings of the infrastructure, rural areas in Lithuania have the potential todevelop a viable local economy. Extensive privatization, and the transition in general, has alreadyresulted in a significant increase in rural trading services and small-scale production activities.Nevertheless, development of the nonagricultural rural economy still lags behind the development ofagricultural activities; there remains a substantial opportunity for employment and income growth in rural
154

Agriculture
service enterprises. Growth in the rural service sector has the dual benefit of creating jobs for workersdisplaced from agriculltural employment and of creating a supporting infrastructure for a dynamic andcompetitive agriculture.
The role of the government in this integrated agricultural and rural development effort is not toplan or impose, but rather to provide guidance and create an enabling environment that will allow farmersand other rural entrepreneurs to exploit the opportunities that are presented to them. Such anenvironment includes a stable and benign policy framework as well as basic infrastructure. Some ofthese rural infrastructure needs are the focus of the investment grants initiative in the Rural Support Fund.One of the least developed and most needed areas of infrastructure is rural financial services. Althoughmost discussions of financial service needs in Lithuania and elsewhere focus on credit, individuals andbusinesses need access to deposit and financial transaction services as well as credit.
Access to credits for the agricultural sector has been very limited and complicated, despitenumerous efforts to irnprove it. The situation is similar for nonagricultural rural entrepreneurs. TheAgriculture Bank, one of the state-owned banks, has remained the dominant source for rural credits.High transaction costs brought about by lack of information and experience, as well as the absence ofsufficient and reliable collateral and land titles, are the main reason for other banks' reluctance to providerural financing, especially for long-term investments. Moreover, under current law, banks as legal entitiesare not permitted to own agricultural land and cannot take landownership in foreclosure proceedings.Credit access is also very uneven among farm enterprises. Small farms and other small-scale ruralentrepreneurs have scant access to outside financing, as neither the Agriculture Bank nor other banks inLithuania have significant experience or the capacity to provide loans to small borrowers.
In the early part of transition, the government gave support to agriculture by subsidizing creditsto farmers and farming enterprises, channeled through the Agriculture Bank. Interest subsidies weremade available mainly for short-term credits for spring planting and the purchase of fuel. Funds werecostly in terms of budget spending, but too small to have a considerable impact on1 the sector. Therefore,credit subsidy programs have recently been essentially phased out. When the Agricultural Support Fundunder the National Agriculture Program was created in 1994, Lt 102 million was spent on "soft" credits.Government expenditures for agricultural credits decreased to onlyLt 35 million in 1995 and 20 millionin 1996 (table 4-22). In 1997 only Lt 10 million was allocated for interest credit subsidies for fuel,fertilizer, and chemicals (2.7 percent of the total agricultural budget), and Lt 20 million was provided forthe Rural Credit Guarantee Fund (3.4 percent). Political loans that were implemented by the AgricultureBank of Lithuania have now been separated from the commercial activities of the bank. The subsidizedcredit programs were replaced with targeted investment grants, the Rural Credit Guarantee Fund, and aco-payment system for interest on short-term bank loans for fuel, fertilizer, and chemicals.
While these new directions in farm credit and investment grant assistance are far less distortingthan earlier capital grants and credit subsidies, government resources can only serve a limited number offarmers and rural entrepreneurs who need to be energized to stimulate rural development. By contrast, incountries where successful rural financial intermediaries have been established and have providedservices to large numbers of small clients,2 government resources have not been a constraining factor, theprivate companies providing the services have been very profitable, and the clients (borrowers) and theircommunities have been the ultimate beneficiaries. Thus, rather than operating credit programs, thegovernment can be more effective by creating the legal and institutional mechanisms necessary to
2. R. A. Chaves and C. Cionzalez-Vega, "The Design of Successful Rural Financial Intermediaries: Evidence fromIndonesia," World Development 24(1): 65-78.
155
Agriculture
stimulate the extension of financial services to rural entrepreneurs, large and small.
In general, the Lithuanian authorities may also need to identify impediments (legal and other) tothe shedding of labor in the agricultural sector and to the creation of alternative employment and incomeopportunities in rural areas. The government will need to find an optimal strategy for attracting andutilizing potential pre-accession funding from the EU, with the overall objective of fostering sustainableintegrated rural development as a long-term alternative to primary agricultural employment and relatedincome support programs. Structural adjustment and infrastructure development in rural areas are verylikely to be included in the pre-accession funding priorities of the EU.
Government Role in Institutional and Infrastructure Development
Lithuania has implemented significant institutional reforms to create the environment required by amarket-based food and agriculture sector. Recent evaluation, however, indicates that institutional andlegal frameworks in general, and in food and agriculture in particular, are not yet fully up to EUrequirements. Further efforts are needed in this area, and the strengthening of government institutions forthe provision of public goods comprises one of the most important tasks for the coming years.
MARKETING MECHANISMS. Wholesale markets, commodity exchanges, grades and standardssystems, export promotion, market information, and the like are still in their infancy in Lithuania; thereare important externalities in efficiently fostering their development. Timely information is lacking at alllevels: farm, wholesale, retail, and external trade. Occasional price information is published innewspapers, but there is no system of regular market data collection, analysis, and dissemination foragricultural and food products. Nor is there a coordinated effort to disseminate external tradeopportunities or technical and regulatory standards in foreign markets. The current needs of managingagricultural market policy, and EU accession particularly, require a speedy development of a modern,EU-conforming statistical information system in agriculture.
PUBLIC ADMINISTRATION. The government institutions in the agricultural sector have beenreorganized more than once since independence. A Ministry of Agriculture and Forestry was created onI January 1997, combining two former ministries and allowing for- a complete restructuring andrestaffing according to the needs of a market-based agricultural sector. New functions related to EUintegration and market economics were added, and at the same time there has been a significant change inthe staffing of the ministry, bringing new and better-trained young staff to replace the older generation.The ministry has also been downsized, and the regional agricultural administrations have been givengreater decisionmaking authority. These steps, however, are only the beginning of the changes inpersonnel requirements, skills, and training that will be needed to carry out administrative functions in thepre-accession and post-accession periods. The government will need to set priorities in implementingpublic investments in general support services (such as extension, research, and training), both as ademonstration effort and as a longer-term intervention. All this may set the stage for a redefinition offunctions (and capacity upgrading) among the agriculture-related civil services.
Policy Recommendations
Completing Land Restitution and Privatization
LANDOWNERSHIP BY LEGAL ENTITIES. One key element to a smoothly functioning land marketis adequate demand, which means removing the current limitations on who can own land. This does not
156

Agriculture
necessarily mean that a land market needs to be completely free of government influence. It does mean,however, that regulations governing land sales should be designed to maintain proper records and ensureorderly and speedy transactions, rather than to restrict access. It means that legal entities as well asphysical persons should compete in the land market.
CONTINUED IMPROVEMENTS OF LAND REGISTRATION AND TITLING. It is too early to know howwell the 1997 changes in law and in implementation procedures and staffing are working to speed up theland privatization process. By government estimates, these changes will cut the completion time by half.Since the remaining cases are mostly those with disputed claims or insufficient documentation, thecompletion of the process is more than just a matter of having the time and technicians to do propercadasteral work. Much of the difficulty is associated with two features of the Lithuanian restitutionprocess. One was that too many legal heirs (including grandchildren) were given the right to claim land,and the second was that the initial right given to heirs was linked to the historical deed. As a result, thereare problems associated with disputes among heirs, as well as difficulties in determining whether andhow to substitute an alternative property or compensation for the ancestors if the land claimed is notavailable for restitution.
These problenns are inherent in the process of restitution to former owners and their heirs.Restitution was a political imperative at the time of independence, and other countries that chose thisbasis for land privatization (principally Estonia and Latvia) have, if anything, made less progress thanLithuania. While this historical choice cannot be revisited, Lithuania has exacerbated the difficulties byadding new claimants to limited resources-earlier, grandchildren were added, and now foreign residentsas well. It seems reasonable that the government should increase incentives for the claimants to acceptvouchers or some other form of compensation. Any remaining government land allocated forprivatization should then be sold.
LEVEL PLAYING FIELD FOR ALL FARMS. It is clear that in the process of privatization andrestructuring of former state and collective farms into what are now referred to as agricultural companies,Lithuanian policy did not grant many favors to these farming entities. They are still considered to be atransitional form, and relatively few are expected to survive. It has already been mentioned that thecompulsory leasing of land to these farms that was considered vital at the beginning of transition has nowbeen eliminated. This was a kind of special privilege, but these farms have also been at a disadvantage innot being able to owIn land as a legal entity. The main emphasis of the government at this stage oftransition should be to provide a level playing field for competitive farms to grow and flourish.Governments cannot know which size or organizational form may be best-suited for a given purpose in adeveloping agriculture, so it is best to let the farmer-entrepreneurs compete and find the most profitablemeans and organizational forms to conduct their business.
RAPID DiVES-TITURE OF REMAINING GOVERNMENT SHARES. During 1997, twelve relativelylarge companies that were not included in the farmer privatization were prepared for privatization throughthe Privatization Agency. These companies have Lt 187.3 million in statutory capital; 63 percent is state-owned. This is an imiportant step, but the procedures currently required by law are very cumbersome,time-consuming, and costly. With the current resources at the Ministry of Agriculture and Forestry,preparing several enterprises each year in keeping with these procedures would take years, but allindications are that the government wants to proceed more rapidly. Streamlined procedures need to bedeveloped for all sectors (see Chapter 5), and applied as well to agro-industry. Where the governmentowns 20 percent or less of shares, it may be most efficient to sell shares on the stock exchange to quicklyeliminate government ownership. If for some reason this fails, a less desirable option would be to cancelthe shares or distribute them proportionately to current shareholders.
157

Agriculture
INCREASE THE TRADABILITY OF FARMER SHARES. It was noted that a major motivation offarmer privatization was to empower producers in dealings with input and processing enterprises. Forthis reason, the shares owned by farmers can only be sold to other producers. Farmers are not alwaysbetter-off when they are shareholders in companies with whom they do business. If they actuallycontrolled pricing decisions and decided to pay themselves higher product prices, they would merelydrive their own company bankrupt, and be worse-off than before. (This did happen to a farmer-owneddairy processor in the Czech Republic.) Thus, to deprive the producer of the right to get the best possibleprice for his or her shares in a company is to make the producer less well-off than other shareholders inthe same company. The farmer privatization should be viewed as a transition phase, not the end of theprivatization process. In these companies, as in any other company, the tradability of shares is onemechanism to attract new capital by bringing new investors into the company. Essentially freezing halfof the shares within a group of shareholders that have no investment capital puts that company at adisadvantage relative to companies that have no such restrictions-once again, to the disadvantage of theproducers.
AVOID BAIL-OUTS. In the past, there has be a tendency to slow or prevent inevitable failures orbankruptcies. In an industry with such a large surplus capacity, this is damaging to the strongercompanies that have a chance to become more efficient and competitive. If natural restructuring throughliquidation and bankruptcy is allowed to occur, and to occur in a timely fashion, it will speed up thedevelopment of a competitive industry. Excess capacity in remaining firms will be reduced, and scarcecapital will not be squandered on a failing enterprise.
ATTRACTING FOREIGN INVESTMENT. The measures already proposed will also have the effect ofmaking the industry more attractive to foreign investors. There are agro-processing companies inLithuania that have attracted significant foreign investment. Two of these are in the dairy processingbusiness, which also has had the greatest number of bankruptcies. Their success does not owe itself togovernment support or special privilege, but rather to good management and ingenuity. The government,however, can make these companies less attractive by excessive regulatory or market intervention, or byprolonging the life of a failing competitor.
Rationalization of Domestic Market Support and Trade Policy
POLICY STRATEGY FOR THE FUTURE. As the current policy issues reveal, Lithuanian domesticmarket and trade policies need more than reform. These policies evolved in response to assorteddomestic and international pressures, and it is evident that a consistent and durable policy strategy isneeded. Lithuania is a small, open economy (as indicated by an openness index of 33 percent in 1996)that is a price taker on world markets and has significant levels of imports and exports of food andagricultural products. When the market institutions are adequately developed and market intermediariesare sufficiently experienced, domestic prices will reflect the border measures that are in place. Thus,domestic market policies and trade measures must be developed in a consistent framework. Thesemeasures should reflect well-defined policy objectives, which certainly need to place a high priority onbuilding competitiveness in domestic and foreign markets.
In grains policy, the mechanisms adopted need to recognize that world prices fluctuate from yearto year, and Lithuania can do nothing to influence those prices. The latest proposal for EU reform of theCAP would reduce the intervention price well below anticipated world market prices. As a prospectiveEU member, Lithuania should expect that the EU will have a cereal policy of that kind in effect by theyear 2000. Producers and processors in Lithuania will need to be tuned to world market signals and learnhow to manage risk. The government could facilitate that adjustment by replacing the current MMPP
158
Agriculture
system with a risk sharing mechanism, such as a modest safety net program that would come into effect ifprices fall below 70 or 80 percent of a selected average of past world market prices. This kind ofmechanism would also provide a simple, self-adjusting, and stable long-term rule for minimalintervention that decisionmakers could anticipate. The disadvantage of such a safety net system is theassociated budget uncertainty. Even though it would seldom be called into play, the timing and size ofpayments for such a safety net would be unpredictable. The best way to minimize budget exposurewould be to set the safety net support percentage at a level that would seldom-if ever-be triggered.The current U.S. "loan rate" formula and the Hungarian intervention price are examples of safety netlevels that are seldom triggered.
Even less distorting, and with less budget exposure, would be a partially subsidized insuranceagainst yield and/or price risk. This is becoming a very significant approach in the United States, and it iswell accepted by farmers. To develop an actuarially sound insurance product, however, requires a greatdeal of data that is not yet available in Lithuania. Since insurance products are very likely to be indemand commercially, vvhether or not they are used as a policy mechanism, it is very important to begin aprocess that would generate the necessary supporting data for this type of insurance in the future.
Dairy policy also needs to be market-oriented. Since a large portion of the produce is exported,competitiveness is essential. Support prices (MMPPs, or any other form) should be avoided, and anysubsidies should be targeted to supplement private incentives for higher-quality milk production. Aprogram that increases incentives for higher-quality milk and quality preservation will also contribute tocompetitiveness by reducing processing costs. It would, however, be preferable to avoid subsidies basedon produced quantities altogether, since they provide producers with a higher production incentive thancan be observed in the mnarket. But if that type of subsidy is unavoidable, a simple and transparent rulesuch as a fixed direct subsidy payment per ton for highest- and first-grade milk that meets other sanitationand quality criteria wouild provide a better incentive structure. It would also be known well in advance,and once established, it would not be subject to two or three changes a year, as has been the case since1995. The budget exposure could be estimated each year, based on projected price and production levels,and the payment rate could be set to keep expenditures within budgetary limits (the dairy-related subsidybudget allocation has been cut in half for 1998).
Sugar is a much more difficult issue, since it is currently highly distorted, not only in Lithuania,but in most temperate-climate countries as well. Lithuania can lead the way for other countries byintroducing a forward-looking policy that recognizes the need to deregulate this industry. Given the goalto design a policy that is friendly to the dynamic Lithuanian confectionery industry, emphasis should befocused on support to farmers, rather than to processors or intermediate users of sugar. Farmers could begiven a fixed payment per ton or hectare based on some portion of historical production. If this wereprovided to the farmer as a transferable quota right to a fixed or declining payment stream, it would allowfor entry and exit, or even shifting of production among regions, as the quota is sold or transferred. Anyproduction of sugar above or without the quota would receive only the market price, without any subsidy.The minimum explant price would have to be eliminated, with the sole market protection coming from anad valorem tariff assessed to the world market price. This would hardly be a distortion-free mechanism,but such an approach would significantly reduce present distortions and would have some realistic chanceof winning approval among the interested groups that influence policy decisions. The major difficulty inthis approach is the cost, because no budget resources are used for sugar in the current programs.However, the consumer gains from lower prices would be sufficiently large that only a portion of thesegains would be needed to compensate farmers.
Finally, policy formulations (for grain, dairy, sugar, and other agricultural products) should be
159

Agriculture
designed for a period of four to five years to provide some measure of stability in the policy environment.Government and private decisionmakers would benefit from such stability. Farmers and agribusinessenterprises have plenty of risk and uncertainty to deal with on a daily basis, and they do not need thegovernment to introduce more uncertainty through ad hoc and unpredictable policy changes.
Facilitating the Restructuring of the Agricultural and Rural Economy
The main challenge facing agriculture-related policymakers in Lithuania is to develop rural policies thatprovide a balance of economic opportunities and social conditions without distorting market signals.While past policies have tended to focus on support for farmers, the rural recovery in Lithuania requires acomplex and comprehensive approach that would integrate agriculture into an overall rural developmentstrategy that involves farm and nonfarm jobs and businesses. Such a strategy should include support forinstitutional and infrastructure development, as well as increased competitiveness of the agricultural andfood industry.
RURAL FINANCIAL INSTITUTIONS. Technical assistance and public investments should beallocated to improve the institutional framework for financial transactions in rural areas that would serveboth farm and nonfarm entrepreneurs, as well as individuals. This would include:
* Legislation that would permit greater use of the kinds of collateral generally available in ruralareas, such as farm real estate, farm equipment, inventory, accounts receivable, warehousereceipts, and consumer goods.
* Improved public registries for collateral, especially for movable property.* Implementation of credit bureaus to facilitate screening of credit applicants and to improve
reputation-based incentives to honor credit contracts.
A pilot experiment with retail banking in rural areas should be initiated to demonstrate that retaillending to small farms and rural entrepreneurs is both feasible and profitable. A specific and detailedproposal for such a pilot project has already be developed in connection with the World Bank-supportedPrivate Agricultural Development Program (PADP). A successful pilot project of this nature, incombination with the institutional innovations listed above, would stimulate private financial institutionsto enter this market and establish enterprises or branches that provide financial services to small andmicro rural entrepreneurs. By fostering financial institutions that are private, profitable, and compatiblewith the needs and conditions in rural areas, Lithuania can remove one of the major constraints toagricultural and rural development and provide an example that other CEECs can follow in addressingthis pervasive rural credit problem.
RURAL INFRASTRUCTURE. Public investment in the improvement of roads, power and watersupplies, telecommunications facilities, housing, and social services can contribute to rural economicdevelopment by allowing businesses to locate in rural areas without significant disadvantages in cost andquality of services or in communications with clients, suppliers, and professional associates. Someprograms of this kind have already been initiated under the Rural Support Fund launched in 1997.
STABLE RULES OF THE GAME. The importance of a stable agricultural policy environment hasalready been emphasized as an important factor in reducing uncertainty for farmers and agribusinessenterprises. The same applies to other rural workers and enterprises. In addition, the growth in small-scale business activity in rural areas would be enhanced through stable rules of the game and properincentives that reward initiative and entrepreneurship, such as secure property rights, contract sanctityprotection, and tax policies that do not disadvantage small enterprises.
160
Agriculture
HUMAN CAPITAL. There is no doubt that agricultural employment will decline and laborproductivity and incomres in agriculture will increase with time. However, those workers leavingagriculture will be much better off if they are pulled away from agricultural employment by higherearning opportunities elsewhere. This transition in the rural workforce will occur with less social tensionif retraining programs are available to prepare farmers and farm workers to compete in growing sectors ofthe labor market. Experiences in United States and Europe indicate that many companies choose tolocate in smaller towns rather than large cities if they can be assured of an adequate and well-trainedlabor pool.
INCREASED COMPETITIVENESS OF THE AGRICULTURE AND FOOD INDUSTRY. As Lithuaniaprepares for accession to the EU, it is essential that the agriculture and food industry become competitivein order to prosper within the Union. At the same time, the EU is gradually reducing its protectionism sothat its industry can be more competitive in the global market, implying that Lithuania needs to focus onthe world market. Achieving and maintaining competitiveness is primarily the task of the private sector,but the government can provide a policy environment that slows or speeds this process. The process isslowed when the government unduly protects the industry from competitive pressures, imposes excessiveregulation or control (for example, administered pricing), or creates instability in policy or themacroeconomy. The government can speed up the process through investments in public goods such asimproved marketing infrastructure, demonstration-type rural financial institutions, information services,and extension services. It is essential that the farm and the food processing and distribution industry beviewed together, since inefficiencies or quality deficiencies in either affect the competitiveness of theindustry as a whole.
Government Assistancejkr Institutional and Infrastructure Development
The development of an efficient and effective public administration and the provision of public goods area key task for the imrnediate future in light of EU accession. Aside from the institutional andinfrastructure policy recommendations addressed in the previous section, the government has a vital roleto play in providing agricultural statistics, market information, and policy analysis.
AGRICULTURAL STATISTICS. The statistics currently collected are inadequate to providenecessary information for monitoring, market information, and analysis of conditions in, and policyoptions for, the food and agricultural sector. The following information is missing:
* An annual statistics survey of farms is needed to provide information, by size and type of farm,on land use (owned, leased in, leased out, total operating area), farm crop production, yields, croparea, animal nurnbers, slaughter, births, production, productivity, input use (including labor),marketed and farm use of output, and product inventories at the end of the marketing year, aswell as on cost and returns, land and assets, and financial balances. Because of the continuingchange in farm structure, the best method would be to establish statistical sample-frame areas andto do a complete census within each area. Current categories of farms by type (agriculturalcompanies, family farms, household farms) should be replaced by size categories using EUmethodology. Crop and livestock inventories and livestock slaughter and replacementinformation should be updated quarterly. Planting intentions should be collected at appropriatetimes in the growing season to provide a basis for estimates of new crop production.
* A periodic survey of farm, wholesale, and retail prices in representative markets should be usedto calculate national average prices at each level, at least quarterly.
* Annual balances should be produced by combining the production and inventory data above withconsumption and trade data provided by other statistics sections in the Department of Statistics.
161
Agriculture
This is currently done for some products, but it needs to be extended to a wider list of products,including individual grains and some processed products such as beef, pork, chicken meat, fluidmilk, butter, cheese, milk powder, and vegetable oil.
* Data should be reported in periodic publications of the Department of Statistics and provided indigital form to the units described below.
MARKET INFORMATION AND OUTLOOK UNIT. This unit would be established to provide the bestavailable information on commodity markets to the widest possible audience as frequently as possible.This will help input suppliers, producers, processors, and other market intermediaries to make moreinformed decisions on production and marketing and will help the government in monitoring conditionsand making informed policy decisions. This activity could be conducted in a unit set up within theMinistry of Agriculture and disseminated by various mechanisms, including the Farmer AdvisoryServices. It should include the following:
Situation and outlook reports would be provided on market prices and balances, and updatedbased on the agricultural statistics noted above. This should done at least quarterly, but not morethan monthly, and should include estimated production, disappearance, and prices for the nextmarketing year based on planting intentions and quarterly livestock statistics.Quarterly (or monthly) data should be supplemented with brief analyses of expected tendenciesin the market in the current and next marketing year.
POLICY ANALYSIS UNIT. This unit would be established to provide policy options and analysis insupport of policy decisionmaking and program implementation in the government and as a basis fordiscussion of options and impacts with representatives of producer, industry, and consumer interests.This unit should be somewhat removed from the Ministry of Agriculture to provide sufficientindependence from political pressures and to increase the actual and perceived objectivity and credibilityof analytical results. Both the Agribusiness Training Center and the International Agricultural TradeAgency would be possible locations, although neither currently has this mandate. The Training Center isrecommended, because it has a well-developed training record, a domestic orientation, and a clientelebase and physical facility that could more easily be adapted to these new tasks. However, professionalstaff and research facilities would have to be added to the center to carry out the new mandate. The unitshould focus on the following activities:
* Data base systems and analytical tools should be developed to analyze the impacts of policyoptions for the food and agricultural sector and for rural economic development. A closeworking relationship with the Market Information and Outlook Unit described above would benecessary, both for data and analytical coordination and exchange of expertise.
* Drawing upon policy proposals, experiences, and analytical studies in Lithuania and othercountries, alternative policy designs should be formulated in consultation with working groupsincluding government and private sector representatives.
* The impacts of different policy options should be evaluated in quantitative and practical terms,including effects on farms, the food chain, consumers, trade, rural communities, governmentbudget (taxpayers), and the national economy.
* Results of studies should be disseminated by conducting workshops and conferences, publishingbriefing papers and reports, briefing government and Seimas officials, issuing press reports, andproviding analytical summaries on the internet.
PUBLIC ADMINISTRATION AND REGULATION. Lithuania is already in the process of harmonizinginspection, certification, standards, and the like with EU regulations as specified in the Union's accession
162

Agriculture
White Paper and the acquis communautaire. This effort will also include an agenda for harmonizationand strengthening of market institutions to enable them to deal with CAP measures. All of these tasksand their ultimate implementation require human capital investments, especially the training of civilservants in the national and local governments. The content of this training and its funding shouldcertainly be a priority in the use of pre-accession funding from the EU.
163


5PRIVATIZATION
Background
Lithuania 's Privatization Achievements
VOUCHER PRIVATIZATION, 1991-95. Shortly after Lithuania left the former Soviet Union (FSU),the government launched a voucher privatization program that (i) restored agricultural land to formerowners and provided land to former collective farm workers; (ii) moved housing from the state to privateownership; and (iii) moved the ownership of many small and medium-size enterprises from the state toprivate individuals. The program resulted in about 5,724 privatizations out of approximately 6,095enterprises actually offered for sale. The total proceeds from voucher privatization were Lt 130.5 million(US$32.6 million), received by the State Privatization Fund, and Lt 18.5 million (US$4.6 million),received by municipalities.
Despite these successes, the program left a legacy of insider control, worker and managementownership, lack of goocl corporate governance, and poor access to capital and foreign ownership. Forexample, a number of companies fell into the hands of insider-controlled investment companies. Therewere also cases where significant firms fell into the hands of management groups and other insidersthrough an opaque process based on the best business plan presented.
CASH PRIVATIZATION, 1995-97. In 1995, the voucher privatization program came to an end andwas succeeded by a program based on cash privatizations. A new privatization law, The Law on thePrivatization of State-Owned and Municipal Property, was passed in mid-1995, and a new institution, theLithuanian Privatization Agency, was established. Unfortunately, the law and its institutions have notbeen successful in promoting the privatization program. To 30 June 1997, only 140 firms (58 of thesewere sold by municipalities), totaling US$2.6 million in sales receipts, were privatized under the 1995law, while total cash privatization receipts to the end of 1997 were only US$20.2 million. Table 5-1summarizes the results of the cash privatization program from 1996 to July 1997. (No sales were made in1995 under the program.)
CASE-BY-CASE PRIVATIZATION, 1997. In February 1997, the new Lithuanian governmentannounced that it would privatize fourteen major Lithuanian state enterprises using the case-by-casemethod. Some, by a previous law, could not be privatized before the year 2000 and had to be removed
The "Background" section is based, in part, on B. Blaszeryk and Richard Woodward, "Privatization in PostCommunist Countries" (Warsaw: The Center for Social and Economic Research, 1996, mimeo).
165
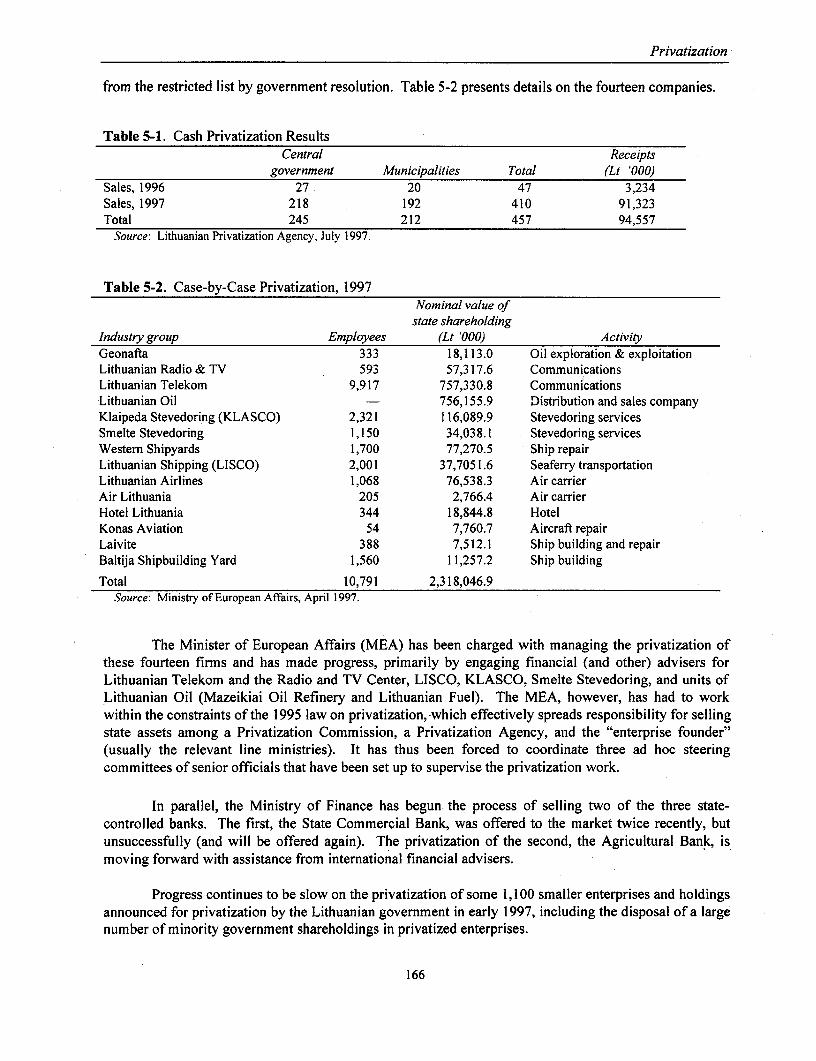
Privatization
from the restricted list by government resolution. Table 5-2 presents details on the fourteen companies.
Table 5-1. Cash Privatization ResultsCentral Receipts
government Municipalities Total (Lt '000)Sales, 1996 27 20 47 3,234Sales, 1997 218 192 410 91,323Total 245 212 457 94,557
Source: Lithuanian Privatization Agency, July 1997.
Table 5-2. Case-by-Case Privatization, 1997Nominal value of
state shareholdingIndustry group Employees (Lt '000) ActivityGeonafta 333 18,113.0 Oil exploration & exploitationLithuanian Radio & TV 593 57,317.6 CommunicationsLithuanian Telekom 9,917 757,330.8 CommunicationsLithuanian Oil - 756,155.9 Distribution and sales companyKlaipeda Stevedoring (KLASCO) 2,321 116,089.9 Stevedoring servicesSmelte Stevedoring 1,150 34,038.1 Stevedoring servicesWestern Shipyards 1,700 77,270.5 Ship repairLithuanian Shipping (LISCO) 2,001 37,7051.6 Seaferry transportationLithuanian Airlines 1,068 76,538.3 Air carrierAir Lithuania 205 2,766.4 Air carrierHotel Lithuania 344 18,844.8 HotelKonas Aviation 54 7,760.7 Aircraft repairLaivite 388 7,512.1 Ship building and repairBaltija Shipbuilding Yard 1,560 11,257.2 Ship building
Total 10,791 2,318,046.9Source: Ministry of European Affairs, April 1997.
The Minister of European Affairs (MEA) has been charged with managing the privatization ofthese fourteen firms and has made progress, primarily by engaging financial (and other) advisers forLithuanian Telekom and the Radio and TV Center, LISCO, KLASCO, Smelte Stevedoring, and units ofLithuanian Oil (Mazeikiai Oil Refinery and Lithuanian Fuel). The MEA, however, has had to workwithin the constraints of the 1995 law on privatization, which effectively spreads responsibility for sellingstate assets among a Privatization Commission, a Privatization Agency, and the "enterprise founder"(usually the relevant line ministries). It has thus been forced to coordinate three ad hoc steeringcommittees of senior officials that have been set up to supervise the privatization work.
In parallel, the Ministry of Finance has begun the process of selling two of the three state-controlled banks. The first, the State Commercial Bank, was offered to the market twice recently, butunsuccessfully (and will be offered again). The privatization of the second, the Agricultural Bank, ismoving forward with assistance from international financial advisers.
Progress continues to be slow on the privatization of some 1,I00 smaller enterprises and holdingsannounced for privatization by the Lithuanian government in early 1997, including the disposal of a largenumber of minority government shareholdings in privatized enterprises.
166

Privatization
On I December 1997, a new law on the privatization of state and municipal assets came intoeffect. The law is based on the 1995 privatization law but incorporates several major changes. A newagency, the State Property Fund (established under separate legislation), will now be responsible forprivatization, having assumed the role of the enterprise founder (previously carried out by the lineministry), which was the key player under the 1995 laws. The fund is also expected to absorb theexisting Privatization Agency; otherwise, the 1997 law remains similar in most key respects to the 1995law it replaced.
Privatization Achievements in Central and Eastern Europe
In 1997, the World Bank published a comprehensive analysis' of the industrial restructuring that hastaken place since 1992 in Bulgaria, the Czech Republic, Hungary, Poland, Romania, the Slovak Republic,and Slovenia. The study covered some 6,300 industrial firms and considered which government policieshad been most effective in fostering enterprise restructuring. The results showed that privatization wasby far the most important factor in restructuring and that privatized firms performed much better thanthose that remained state-owned. Labor productivity grew by an average of 7.3 percent yearly inprivatized firms, but it declined by 0.2 percent annually in state-owned firms. The econometric analysisundertaken in the study indicated that privatization accounted for almost all the growth in laborproductivity. The anallysis also showed that privatization had increased annual total factor productivitygrowth by about 4 percentage points.
The study also found that privatized firms used the large productivity gains from privatization tofinance needed investmnents. Labor productivity grew more rapidly than real wages in the privatizedfirms, while state-owned firms raised wages in spite of lagging productivity, which depleted theircapacity to finance themselves through internal sources. The positive effects of privatization on thefinances of privatized firms also had a positive effect on the banking system and made governmentintervention in the banking industry less necessary. In countries that had done little or no privatization,the continued weak financial situation of many state firms worsened the loan problems of banks.
A second study of 500 mid-size firms in the Czech Republic, Poland, and Hungary between 1991and 1993 also compared the performance of privatized and state firms.2 Not only did this study confirmthat private ownership improved labor productivity and revenue, but it also found no evidence of anyshort-run disruption of the firms' performance immediately following ownership change. On thecontrary, private ownership appears to dampen the shock of "marketization" resulting from the priceliberalization and the removal of barriers to entry that characterize transitions away from centralplanning. All surveyed firms were forced to cut bloated payrolls, probe new markets after demandcollapsed for their products, improve product quality, and reduce inefficiencies. Evidence from thesefirms indicates that private owners, in this regard, restructure more effectively than the state. (For detailson both studies, see Annex 5- 1.)
Privatization Revenues in Lithuania Compared with Central and Eastern Europe
Annual privatization revenues in Lithuania, as a percentage of GDP, have lagged those of Estonia andLatvia and are well below those of the "high performers" such as Hungary. While privatization has
1. Gerhard Pohl and others, Privatization and Restructuring in Central and Eastern Europe, World Bank TechnicalPaper No. 368 (Washington, D.C., 1997).
2. Roman Frydman and others, "Private Ownership and Corporate Performnance: Some Lessons from TransitionEconomies" (unpublished manuscript, June 1997).
167

Privalizalion
slowed since 1995 in most transition economies, revenues as a percentage of GDP have consistenitlyfallen each year since 1993 in Lithuania. Annual revenues in the three years from 1993 to 1995 averagedjust over I percent of GDP. The cash privatization program begun in 1996. however, brought in revenuesthat are less than one-twenitietih of this amount-a 0.05 percent of GDP-and the results for 1997. up toJuly, are no better.
Analysis of privatization receipts in ninle transition economies in central and eastern Europeconfirms that countries that relied on voucher-based enterprise sales or mixed cash and voucher sales, asmight be expected, lagged behind countries using traditional privatization methods-that is, case-by-caseprivatization or its variants. In addition, countries that registered average privatization-reveniue-to-GDPratios of less than 1 percent (Bulgaria, Lithuania, and Russia) typically suffered the most from insider-dominated enterprise sales, inadequate commercialization, and a lack of buyer demanid. Figure 5.1presents aninual privatization revenues in selected eastern European countries, east-central Europe, andthe Baltics from 1989 to 1996 (see Aniex 5-2).
Figure 5-1. Privatization and Revenues in East-Central Europe and the Baltics8 -
76
0
2
Czech Estonia Hungary Latvia Lithuania PolandRepublic
a 1989 a 1990 E 1991 1992 Ea 19 93 a 1994 a1995 a 1996
168

Privatization
The Technical Impediments to Faster Privatization in Lithuania
Thus far it has been demonstrated that Lithuania's privatization performance has not been as successfulas the records of other eastern European countries. This section attempts to identify the reasons for this.In general, the current cash privatization program, which was, until December 1997, based on legislationpassed by a previous government, has major faults and weaknesses that seriously compromise the currentgovernment's ability to undertake privatizations. There are too many institutions involved. The role ofthe "enterprise founder" allows line or branch ministries to frustrate the privatization process. There is aserious lack of privatization knowledge (particularly pertaining to large, case-by-case privatizations) insome of the institutions responsible for the privatization process. There is a perceived reluctance to usequalified financial advisers who will be responsible for selling firms (and will be paid a commission onthe sale). Valuation techniques do not reflect best practices. Transparency is often missing. There is alack of leadership and perceived commitment to privatization. No institution is actively engaged inmarketing the firms, and no institution pays a penalty if a sale is a failure. In brief, the overall incentivestructure is simply not conducive to rapid privatization.3
Inadequacy of the Legal and Institutional Framework
In 1995, the Lithuanian govemment replaced the voucher privatization program with a cash programbased on a new privatization law (The Law on Privatization of State-Owned and Municipal Property).This law and its accornpanying institutional process proved to be ineffective and, by mid-1997, hadresulted in only 140 sjmall privatizations (58 were done by municipalities). The law established aninstitutional framework and hierarchy, including:
* The enterprisefiounder, usually the line ministry responsible for the privatization candidate* The Privatization Commission (a supervisory body made up primarily of members of Seimas)* The Privatization Agency (a technical, implementing institution)* Municipal privatization commissions that undertake privatizations of local enterprises and
property.
The enterprise founder effectively controlled the privatization process through control of thecandidates put forward for sale, how they were restructured, the method used for divestment, the termsand conditions of the privatization, and by supervision of the implementation and conclusion of the sale.The Privatization Agency, on the recommendation of the enterprise founder, drafted privatization lists;noted the method, terms, and conditions of sale; looked for buyers; and suggested restructuring proposals.The Privatization Commission approved or vetoed programs put forth by the Privatization Agency andapproved or disapproved transactions. (For a more detailed description, see Annex 5-3.)
Under the 1995 law, the enterprise founder had little incentive to sell enterprises, yet wasresponsible for choosing the companies to sell, seeing that they were valued properly, and designing thesales procedure (even though it was not responsible for the sale or its success). The privatization law didnot specify the crucial rnatters of what should be sold or set deadlines for sales, leaving such decisions tothe discretion of the founder. The Privatization Agency followed a bureaucratic process of sale but, in
3. It should be noted here that the Ministry of Finance has been exempted from the privatization legislation forprivatizing the state banks. The Ministry of European Affairs, which has had initial success in moving forwardon some of the fourteen large privatizations assigned to it, also operates a privatization process that is only partlybound by the privatization legislation.
169
Privatization
practice, it did not value the companies or actively involve itself in marketing them or finding buyers. Itappeared to consider its function fulfilled after publishing the privatization program in its PrivatizationBulletin and managing the sales process. The Privatization Commission approved decisions but was notengaged in the sales effort, nor does it have any incentive to ensure a successful sale.
International experience has repeatedly shown that the line or branch ministries of governmentshould not be responsible for privatizing companies. The line ministries have too many conflicting policyobjectives and may wish to keep enterprises that the government has decided to sell. In Lithuania, thesubmission of firms for cash privatization was left to the judgment of the enterprise founders, who hadlittle incentive to sell assets under their direct control. It is not surprising that, according to PresidentBrauzaukas' annual report to Parliament in February of 1997, enterprise founders are in "open boycott"of cash privatization-they have refused to place larger enterprises on the privatization list and havedelayed the sales of firms tendered for privatization.
In addition, line ministries seldom have the technical competence to manage privatizations or thehighly qualified staff necessary to run a successful privatization program. It has been found to be muchmore effective to place privatization programs in central ministries that are close to the apex ofgovernment, free to build institutional competence, and free of the interest in keeping firms that a lineministry often shows. Best international practices suggest that a successful privatization program needsto (i) be located near the center of government (reporting to the president or prime minister); (ii) besupported at the highest ministerial and bureaucratic levels; (iii) have clearly defined aims and goals; (iv)develop institutional competence and experience to be effective; and (v) have a built-in incentive to sell(for example, the Ministry of Finances's need for enhanced and rapid revenue).
Perceived Reluctance to Use Qualified Advisers and Poor Valuation Methods
Successful privatization programs usually call upon qualified financial and other advisers to assist invaluing privatization candidates, assessing their marketability, and developing options for sale and salesplans. These advisers have the technical expertise that is needed to sell companies. More important, theyhave the financial incentive to do so because most of their fees come from commissions on the sale.Lithuania's privatization officials have shown reluctance to engage and use financial advisers (forunclear, but likely political, reasons). The valuation process, which is undertaken by local evaluators(effectively licensed by the Ministry of Finance), meets none of the international standards of bestpractice. Generally accepted valuation techniques for valuing significant companies, such as discountedcash flow analysis and "comparables" analysis (which analyzes the sale prices for comparablecompanies), are almost never used. Instead, the dominant valuation technique in the Lithuanianprivatization process is replacement value, a method that privatization experts worldwide generally regardas improper and misleading, because it generally leads to a valuation well above the market's.
Lack of adequate financial advice and excessively high valuations have led time and again tounsuccessful privatizations or sales at less than optimum prices (see box 5-1). There have been a numberof firms put up for sale by the Privatization Agency that have not sold or have sold only after repeatedattempts. The inability to sell a firm or to sell it at its first offering is of particular concern. Internationalprivatization experience shows that firms that are unsuccessfully offered for sale or offered several timesbefore a successful sale suffer commercial damage through the disruptive effect these failures have on thebusiness of the firm, the morale of management and employees, and the confidence of the firm's bankersand other lenders.
170

Privatization
Box 5-1. The High Cost of Not Having Professional Privatization Advice
Several years ago the government of Lithuania decided to privatize the country's biggest hotel, the HotelLithuania, located in the capital city, Vilnius. International financial advisers were not used, although officialsenvisioned a sale to a foreign buyer. A minimum price of US$10 million was set for the hotel, in spite of the veryextensive renovations and refurbishing the buyer would need to do.
The first tender was unsuccessful, although the tender attracted some interest. Public criticism, however,that the minimum price was too low resulted in government cancellation of the tender before a buyer was selected.
In 1997 the new government attempted to privatize the hotel a second time in a tender supervised by thePrivatization Agency. The price was again set at over US$10 million. This time no bids were received, and thetender failed. The government subsequently opened negotiations with an interested buyer, and a sale may takeplace at a reduced price.
The cost to the government of these two botched sales has been considerable. If the government is paying9 percent, on average, tc, borrow, the interest forgone on the final sale price, of perhaps US$9 million, has been atleast US$2.5 million, and this does not include the costs of organizing and running the two unsuccessful sales.
Had the government engaged internationally reputed financial advisers at the beginning of the privatizationprocess to advise on valuation and assist in planning the first sale, the sale could have gone smoothly, and thegovernment could have defended its minimum price. An adviser for the second sale would have advised a morerealistic price. The costs of competent financial advisers would have been much less than the interest forfeited fromthe unsuccessful sales process. Also, the enterprise itself would not have been unnecessarily disrupted, and theimage of Lithuania would have not been affected by the often widely publicized failed sales.
Lack of Perceived Commitment
Splitting the privatization process in a cumbersome and nonproductive way among three institutionsmeans that no institution is responsible for the success of the program, nor is any one institutionresponsible if it fails. The program, therefore, suffers from a lack of leadership. Lithuania badly needs aprivatization "champion" at the strategic policy-decision level. At the level of execution, it needs toengage highly qualified advisers who are also responsible for sales and get the bulk of their fees fromsuccessful sales; this will help ensure that privatization candidates are properly valued and packaged forsale. Both elements (unclear responsibility and poor methodology) worsened a third critical impedimentto privatization in Lithuania: weak perceived commitment.
The problem of a government's perceived "commitment" to privatization is not unusual in post-communist economies. The governments face the formidable influence of the state enterprise sector-thelinchpin of a reputedly powerful coalition of beneficiaries with privileged access to public resources-and, often, public hostility toward the sale of "crown jewel" firms to foreign investors. These factorshave clearly been at play in Lithuania since the completion of the voucher phase of the privatizationprogram in July 1995.
In addition, Lithuania's current cash privatization program has relied on the discretion ofparticipating public agencies instead of uniform rules. For example, the submission of firms for cashprivatization is left to the "judgment" of the enterprise founders. Experience from the rest of eastern andcentral Europe suggests that the problems of overlapping jurisdictions and excessive governmentaldiscretion tend to go together. Investors, particularly foreign prospects, have been reluctant to participate
171

Privatization
in the privatization process because lack of transparency and predictability have cast broad (perhapsundeserved) doubts on the government's commitment to an economy led by the private sector. It issomewhat revealing that between 1989 and 1995, foreign direct investment as a percentage of GDP hasincreased in all eastern European countries except Lithuania and the Slovak Republic, whereprivatizations have been fostered least. The weakness of the perceived commitment hampered anotherimportant benefit of privatization: it did not prompt incumbent Lithuanian public sector managers toenhance their performance in credible anticipation of a takeover by more profit-conscious private owners(an effect that has been well documented elsewhere in eastern Europe; see Annex 5-1) (see box 5-2).
Box 5-2. Lowering the Cost of Financial Advisers
Ministers and senior government officials often express the view that financial advisers, particularlyinternational ones, are too expensive and not justified given the smaller amounts that all but the largest SOEprivatizations may bring. Governments, however, cannot run a credible case-by-case privatization program withoutprofessional financial advice. Grouping similar companies-hotels, for example-together and hiring one financialadviser to advise on the sale of all of them is a useful, cost-saving technique. Bulgaria has recently begun tenderingfor international financial advisers using this approach. It has grouped firms by industry and is searching foradvisers for each group of firms. In addition, the extensive use of the Internet to announce tenders, and the resultsof tenders, lowers costs and promotes transparency.
A Potentially Lost Opportunity: The New Privatization Law of 1997
A new privatization law was recently passed by the Seimas. The law, unfortunately, carries over manyof the bureaucratic and unsuccessful features of the current law, and is unlikely to lead to improvement inprivatization performance. While the greater centralization of the privatization effort in a "State PropertyFund" (which adopts the role of founder and may also house the Privatization Agency) could be apositive feature, the Property Fund's structure gives little confidence that it can provide the leadership,attention, and technical competence needed for a successful privatization program. The Property Fund isnot attached to a strong central ministry. Its attention will not be entirely focused on privatizing firms,because its major function is managing and administering state assets, rather than selling them. Aswitnessed elsewhere with such institutions, the focus is likely to shift from privatizing assets to managingthem. Further, the Property Fund will take some time to set up, which may create further delays inprivatization. While it may inherit the staff of the Privatization Agency, the latter has little realexperience in selling firms. The new law does not insist on modern best practices in privatization, butrather continues many of the unsuccessful practices of the current law (such as emphasizing the use oflocal valuators). But, most critical, the new proposed law fails (as its predecessor did) to enunciate whatshould be sold or to establish sale deadlines.
Special Challenges in Infrastructure Privatization
Privatization of infrastructure raises several special issues that differ markedly from issues ofprivatization in the traded goods sector. The government of Lithuania is beginning to face these issues asit seeks to enhance private sector involvement in its infrastructure sectors.
It is usually difficult to harness the many benefits of competition in infrastructure activities. Inmany sectors, Lithuania, like other reforming countries, may need to restructure enterprises horizontallyand vertically prior to privatization to create more efficient market structures. For example, it is
172

Privatization
increasingly common for power sector enterprises to be restructured vertically by separating generation,transmission, and distribution activities, and to restructure generation and distribution horizontally tocreate a number of separate firms. Even in cases where competition is feasible-such as most tele-communications services-the pros and cons of temporarily restricting competition require carefulevaluation. Lithuania is only beginning to grapple with these issues in the sectors slated for privatizationin the near future (for example, the telecommunications and some transport subsectors), and a substantialagenda remains in the development of strategies in other sectors (such as energy and railways).
In activities where competition is not feasible, regulation is required to protect consumers frommonopoly abuse, to protect investors from arbitrary government action, and to provide incentives forefficiency. In regulated industries, the details of the regulatory framework are usually much moreimportant to potential investors than the condition of the particular assets, or even the size of the market.These issues are now being assessed in the energy and telecommunication sectors in Lithuania, but noactual solutions are yelt in place. Moreover, the government is right in seeking to define the rules andinstitutions before privatization. Otherwise, potential investors will respond to the resulting uncertaintyand accompanying risk-by reducing the value of their bids. Many governments, however, have foundthat a public commitment to privatize an infrastructure company has provided it with the needed incentiveto move forward on developing and putting into place appropriate regulation as part of the privatizationprocess leading to sale.
Lithuania recently enacted a Concessions Law that governs the scope of concessions in sectorsincluding infrastructure and regulates the awarding of concessions. Application of the new law, however,seems to have been limited, either by the central or by the local governments. In addition, there is noclear institutional mechanism linking the provisions of that law with the public investment program,something that might prove critical, because the decision to award concessions (rather than financeinvestments from government resources) has considerable budgetary implications.
Also, Lithuania's Competition Law of 1992 establishes prohibitions on the abuse of a dominantmarket position, unfair competition, and anticompetitive agreements and mergers. It also prohibits stateand local governments from adopting standards or carrying out activities that restrict competition. Thelaw is administered by a seven-member Competition and Consumer Protection Office, which currentlyenjoys limited safeguards of its autonomy. A new law is in preparation that would fine-tune some ofthese prohibitions (and would, in principle, strengthen the autonomy of the implementing office). Animportant issue that warrants further attention, however, is the interaction ofeconomywide competitionrules with sector-specific rules. For example, there is potential for overlap between sector-specific rulesgoverning access to electricity networks and economywide rules on the abuse of a dominant marketposition. Unless issues of this kind are clearly addressed, there may be uncertainty about the interactionof the legal regimes, as well as the responsibilities of particular regulatory authorities.
The government's desire to provide widespread access to basic infrastructure services often leadsto pressures to subsidize prices to particular groups of users. In traditional, state-controlled monopolisticmarkets, subsidies have often been funded through cross-subsidies-some users pay higher prices tofinance reduced-cost services to others. Traditional cross-subsidies, however, also involve inefficiencies,including poor targeting of beneficiaries (the middle-class often benefits much more than the poor),distortions in resource use, and the costs of forgoing competition. Rebalancing tariffs, accompanied byother measures, can a[llow social goals to be accomplished more effectively and at lower cost toefficiency. In Lithuania, the issue of cross-subsidies is beginning to be assessed in conjunction with thepreparation for telecommunications privatization; in other sectors (such as power and rail transport), amajor effort to rebalance tariffs remains to be launched.
173
Privatization
Infrastructure industries have a critical impact on industrial competitiveness and living standardsacross the economy. The short-term goal of maximizing the proceeds from privatization thus needs to beweighed against the longer-term goal of providing incentives for efficient investment and operation. Theongoing telecommunications privatization will be the first experience for the Lithuanian government inbalancing these goals, and if done properly, can serve as a model for future infrastructure privatizations.
In addition to the recruitment of strategic investors, a source of expertise and investment capital,there are also potential benefits in promoting widespread local ownership in infrastructure enterprises.The promise of such local participation may reduce political resistance to privatization. Well-regulatedinfrastructure enterprises can create a large volume of securities that are particularly attractive toinstitutional investors, and that can play an important role in developing local capital markets. Broadlocal ownership can also bolster commitments to a fair regulatory framework because it will reduce thepressure on the government to renege on regulatory undertakings. Lithuania is well-positioned to reservesome shares for public offerings during infrastructure privatization, thereby further developing its small,but growing, capital market.
Finally, while privatization in the traded goods sector is usually regarded as synonymous with thedivestiture of the state's shares in enterprises, infrastructure privatization often involves choosing from abroader range of options. In many activities, for example, a common approach is to grant time-boundconcessions to private operators, while retaining long-term state ownership of sector assets.Nondivestiture forms of private participation are widely used for many types of greenfield investments,but can also be used to structure private involvement in existing enterprises, such as water distributionand ports. Lithuanian municipalities have already been approached with proposals from foreign parties tomanage or concession municipal infrastructure, and they will likely need assistance in considering suchproposals.
Policy Recommendations
International experience shows that an effective privatization program can bring a government a range ofeconomic benefits, including:
* Efficiency Gains. Privatization, done well, restructures firms and improves their performance,profitability, total factor productivity, labor productivity, and exports. Privatized firms can raisewages and increase investments using internally generated funds.
* Improved Foreign Investment. FSU countries that have undertaken effective privatizationprograms have attracted higher levels of foreign investment than countries that have not.
* Improved Banking Sector. The performance of the financial sector has improved in countrieswith successful privatization programs. Privatized firms have much better financial performancethan state-owned companies, and this, coupled with the greater financial discipline that privatebanks exercise on their customers, has led to improved banking performance.
* Improved Revenue Flows to Government. An efficient, effective, and faster privatizationprogram could bring substantial revenues to the government over the next few years, as has beenthe case in the other FSU countries. Hungary's privatization receipts equaled 7.4 percent of GDPin 1995 and 4.6 percent in 1993; Estonia's privatization receipts equaled 5.2 percent of GDP in1994; and the Slovak Republic's privatization receipts were 5.8 percent of GDP in 1995.
There is no technical reason why Lithuania's privatization program should prove less successfulthan those of other transitional economies. Given the potential of the country's economy, its strategiclocation, and the quality of its workforce, a well-structured privatization program should be a promising
174

Privatization
undertaking. The analysis provided in this Policy Note shows that most policy constraints to speedy andeffective privatization could be removed by public policy measures and the passage of new legislationover a relatively short period of time. International privatization experience (see Annex 5-7 forworldwide lessons) points to a number of general principles to guide that policymaking and legislation:
* The core privatization objective is to move state enterprises rapidly to effective privatemanagement (not to maximize sale revenues).
* Governments should resist restructuring firms and, when possible, should sell them quickly "asis" (restructuring happens when controlling majority ownership is transferred to competentinvestors).
* Large companies and infrastructure services should be a key part of the privatization program.* Transparency, fairness, and a level playing field are of utmost importance.* Case-by-case privatization is preferable (over mass or voucher-based programs) because it
provides the largest enhancement in corporate governance, the highest returns, and the possibilityof effectively addressing company- or industry-specific issues (regulation, environmentalprotection, and the like). (Annex 5-7 provides a more comprehensive definition of case-by-casesales.)
* Outside expertise should be sought; all best practice methods of sale should be used (IPO, tradesales, mixed sales).
* Sales to employees and insiders should be avoided, beyond those necessary to prevent union orstakeholder resistance.There should be proper incentives in place to ensure that those responsible for the program arerewarded (punished) because of their success (failure), not for meticulously followingbureaucratic procedure.
Toward a New Privatization Strategy
In light of these principles, the institutional process for privatization in Lithuania needs to be simplifiedand centralized in one institution located at the center of government. The sole responsibility of thisinstitution should be privatization, including the fostering of institutional competence and the impositionof government policy. The privatization process should be based on international best practices; foreignand domestic advisers, particularly financial advisers, should be used; and adequate budgets should beestablished to pay for them (including payment on a performance basis). Best case-by-case practicesshould be employed for both large and medium-size privatizations, especially in the infrastructure area.The processes should be made transparent and the most suitable sales methods-based on the advice ofoutside experts-should be used. Wide latitude should be provided in sales methods so that selectedtechniques can be applied to different enterprises of differing sizes and industries. Flexibility should alsobe allowed for the disposition of residual shares and small shareholdings. At the same time, thegovernment will have to commit itself to a privatization process that meets the best internationalstandards and can be made the flagship of the country's transition efforts.
A More Effective Framework for Privatization
OPTION ONE. Much of the above-mentioned strategy could be put in place quickly throughgovernment administrative arrangements and decisions. Privatization through the MEA was meant to beestablished this way. The privatization law, however, needs to be replaced, and the institutions andresponsibilities of privatization detailed in the current law require major revisions. First, a newprivatization law is necessary to set forth, inter alia:
175

Privatization
Explicit goals and applicability-what the goals of privatization are and what is to beprivatized-are needed. Both companies in the tradable and the infrastructure areas should beconsidered for privatization.
* The institution that would undertake the privatization program, preferably a central ministry ofprivatization, must be established. The Privatization Agency and Privatization Commissionwould be integrated, if retained, into the privatization ministry.
* The privatization ministry would be given wide authority to use best practices (especially toengage international experts and financial advisers and to use best valuation practices) (Annex 5-4 describes the pros and cons of valuation methods and Annex 5-5 addresses some key practicalissues in selecting and hiring financial advisers), to use the most suitable methods of sale, andshould receive adequate funding so that it can hire needed experts.
* The proceeds of the sale would be transferred immediately to. the fiscal budget, with the provisionthat some of the proceeds would be available to pay expenses involved in the sale in question (astandard international practice).
* The new privatization law would be specific on the (high) level of disclosure required and theneed to use competitive, open tenders and sales methods to ensure transparency.
OPTION Two. Should the government decide that it is expedient to continue its privatizationprogram under the current law (as revised in December 1997) and with the current privatizationinstitutions-that is, the State Property Fund and the Privatization Commission-then the governmentshould consider the following necessary changes, inter alia, to assure the efficiency and effectiveness ofthe program:
- The government would lay out, annually, a list of state-owned companies and state holdings incompanies that it wished to privatize, with a time frame for the privatization. This list would bedeveloped in cooperation with the State Property Fund and the Privatization Commission.The government would indicate that best practices were to be used in these privatizations; thatreputable and experienced financial and other advisers should undertake valuations, design salesoptions, and assist in sales; and that market-based valuations would be used in establishingprices, for example, discounted cash flow analysis and comparative companies valuations (seeAnnex 5-4).
* The government would indicate that public offerings, trade (third-party) sales, mixed sales,negotiated sales, and other innovative sales methods were to be used, with a view to obtainingfair prices, attracting domestic and foreign investors, and obtaining the best possible new ownersfor privatized firms.
* The government would provide the political and financial support to the State Property Fund andthe Privatization Commission to enable them to carry out the annual privatization plan using therequired advisers and techniques as outlined by the goverment.
A New Battery of Privatization Tools
The present law is restrictive in its prescription of the methods for privatization. The new legislation andprivatization program should look to the best international practices for sale, some of which are listedbelow.
PUBLIC OFFERINGS. Public share offerings on stock markets can be used for profitable, larger,relatively well-known state enterprises. Often the share offer is an opportunity to raise additional capitalfor the company (through the issue of new shares), as well as to transfer ownership of the enterprise. Itcan also serve the objective of promoting transparency and widespread share ownership by allocating a
176

Privatization
proportion of shares to small investors. The government can offer shares on the domestic market as wellas in international markets as American or Global Depository Receipts (ADRs orGDRs), given the lackof depth in Lithuania's securities markets.
TRADE (THIRD-PARTY) SALES. Trade sales use auctions or open bidding to sell the enterprise toa third party. This involves the preparation of an information memorandum by financial advisers andgovernment officials. The memorandum is sent to potentially interested parties; nonbinding expressionsof interest are received from interested bidders; and the government signs confidentiality agreements withshort-listed bidders and gives them access to a confidential data room, access to management, and a draftsales agreement. Bidders then submit a binding offer (bid) and a required deposit. The government,aided by its financial advisers, then chooses the "best" offer (considerations beyond price-proposals fornew investments, service standards, and the like-are normally part of the offer assessment).
MIXED SALES-TRADE SALES COMBINED WITH SHARE OFFERINGS. Of particular interest totransitional economies is the mixed sale privatization that uses a combination of trade sales to attract amajor strategic investor(s) by offering a control block, and a share offering for all or most of the balanceon domestic and, often, foreign markets. Such an offer has the advantage of attracting importantinvestor(s) who will bring management and technical skills, market connections, and capital to the firmand who will pay a significant price for control, while at the same time gathering consensus for theprivatization.
NEGOTIATED SALE. The negotiated sale is a special case of the more common trade sale auction.The government has already chosen the buyer, and the aim of the sale is to negotiate an agreement. Thegovernment would use a negotiated sale when there is just one buyer or a buyer possesses strategicsynergies that give it a marked advantage over others. It is difficult, however, to achieve the highest pricein such a sale, and the sale is less transparent than an open bidding process.
OTHER METHODS. Given the significant level of holdings, many minority, that the Lithuaniangovernment still has in small and medium-size companies, flexible sales procedures will need to bedeveloped using local and foreign financial advisers. Disposal of minority government holdings willrequire innovative techniques (such as packaging multiple share holdings in units and offering the unitsfor sale by tender) to sell shares in companies where control has already passed to others and/or whereinsiders have little incentive to buy additional shares.
Facilitating Infrastructure Privatization
Experience with the new Concessions Law seems too limited. Both central and local governments inLithuania may wish to engage advisers to determine an appropriate use for-and negotiate-any earlyconcessions that may be undertaken. Such a decision should also be made in conjunction with the publicinvestment programming; work of the Ministry of Economy.
The interaction of economywide competition rules with sector-specific rules must be clearlydefined. For example, there is potential for overlap between sector-specific rules governing access tonetworks and economywide rules on the abuse of a dominant market position. In addition, the roles andrelationships of infrastructure regulators, sector ministries, and economywide regulatory agencies willrequire careful elaboration and articulation.
The government's decision to focus initial efforts on telecommunications is consistent withinternational practice and makes good sense. The lessons learned and expertise acquired from evaluating
177

Privatization
tradeoffs among multiple policy considerations in this sector will be useful for grappling with similarissues in other sectors. It would be advisable for the government to undertake an ex-post assessment ofthe experience of telecommunications privatization to identify lessons for other sectors and to establishmechanisms for sharing insights and experience among relevant sector authorities. In addition, theauthorities may wish to undertake an independent assessment of regulatory capabilities and the skill mixof existing and proposed regulators to determine further staff recruitment and training needs.
The government should ensure the independence of all existing and proposed regulatoryinstitutions. Initial steps should include the following: (i) remove the telecommunications regulatoryfunctions from the Ministry of Communications; (ii) eliminate budgetary financing for regulatory bodiesand replace it with earmarked funding; (iii) increase the autonomy of the Competition Agency; and (iv)ensure that the members of the Energy Commission are allowed to serve full terms unless professionalincompetence can be demonstrated.
178

Privatization-Annexes
ANNEX 5-1. Privatization In Post-Communist Europe: Enterprise Productivity
In 1997, the World Bank published a comprehensive analysis of the industrial restructuring that has takenplace since 1992 in Bulgaria, the Czech Republic, Hungary, Poland, Romania, the Slovak Republic, andSlovenia.4 The study covered a sample of 6,368 industrial firms and examined which governmentpolicies were the most effective in fostering enterprise restructuring. The number of firms sampled ineach country ranged from 700 to 1,000; the firms accounted for between 40 to 90 percent of thecountries' employment in manufacturing. The results showed that privatization was by far the singlemost important factor in restructuring and that the privatized firms performed much better than those thatremained state-owned. Table 5-3 shows the features of the study database.
Table 5-3. Features of the DatabaseEmployees Employees as percentage of total
Country Firms (1992) manufacturing employmentBulgaria 828 314,042 48Czech Republic 706 829,312 64Hungary 1,044 428,645 41Poland 1,066 1,338,645 45Romania 1,092 2,121,102 91Slovak Republic 905 578,737 93Slovenia 727 219,959 90
Total 6,368 5,830,442
The measures of restructuring used in the study included profitability, the proportion of firmswith a positive operating cash flow, average operating cash flow as a percentage of revenue, growth inlabor productivity, growth in total factor productivity, and growth in exports. The econometric analysisfocused on the two most reliable indicators of restructuring: growth in labor productivity and growth intotal factor productivity.
Growth in Labor and Total Factor Productivity
Table 5-4 shows the annual percentage growth in the firms' labor productivity from 1992 to 1995in the seven countries studied.
Labor productivity growth averaged 7.3 percent yearly in privatized firms and declined by 0.2percent annually in state-owned firms. The econometric analysis undertaken in the study indicated thatprivatization accounted Jor almost all the growth in labor productivity. The analysis also showed thateven a credible threat of privatization promoted restructuring. In Poland, where the government'scommitment to privatization was seen as serious, firms included in the mass privatization programimproved their profitability in 1994 and 1995, well before they were privatized, probably because of thesignaling effect to management of the government's policy and the expectation that management wouldbe held more accountable by new owners.
4. G. Pohl and others, Privatization and Restructuring in Central and Eastern Europe, World Bank Technical PaperNo. 368 (Washington, D.C., 1997).
179
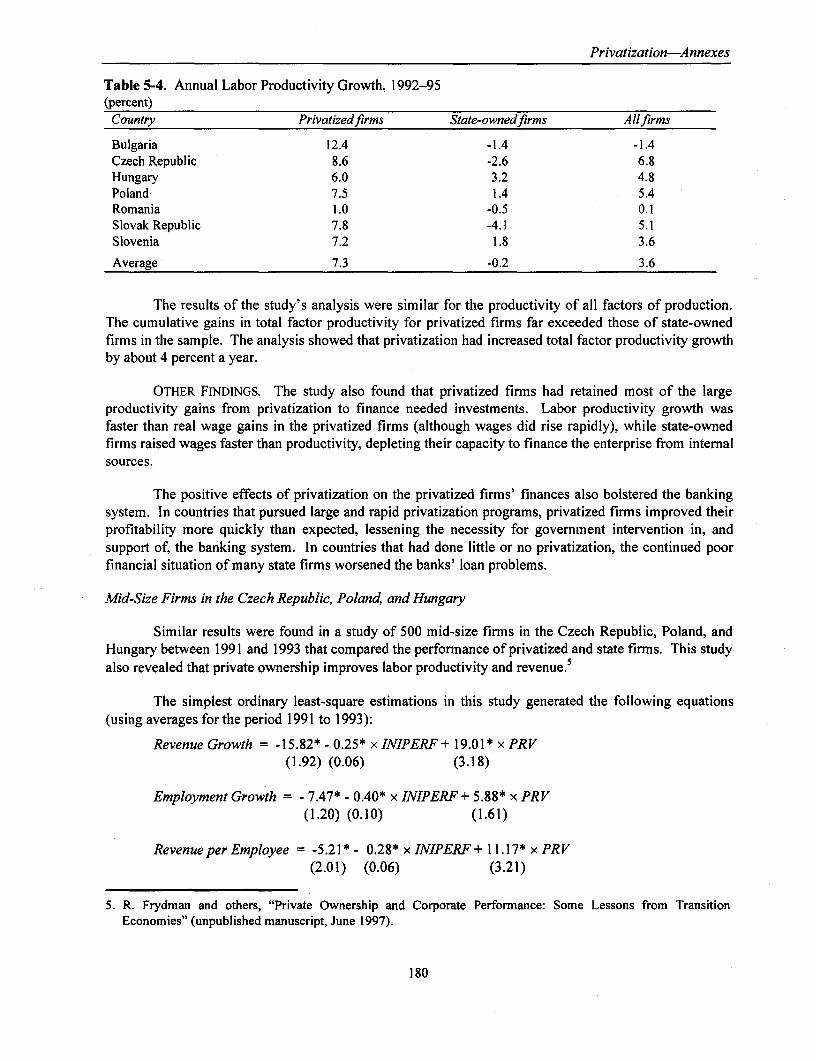
Privatization-Annexes
Table 5-4. Annual Labor Productivity Growth, 1992-95(percent)
Country Privatizedfirms State-ownedfirms Allfirms
Bulgaria 12.4 -1.4 -1.4Czech Republic 8.6 -2.6 6.8Hungary 6.0 3.2 4.8Poland 7.5 1.4 5.4Romania 1.0 -0.5 0.1Slovak Republic 7.8 -4.1 5.1Slovenia 7.2 1.8 3.6
Average 7.3 -0.2 3.6
The results of the study's analysis were similar for the productivity of all factors of production.The cumulative gains in total factor productivity for privatized firms far exceeded those of state-ownedfirms in the sample. The analysis showed that privatization had increased total factor productivity growthby about 4 percent a year.
OTHER FINDINGS. The study also found that privatized firms had retained most of the largeproductivity gains from privatization to finance needed investments. Labor productivity growth wasfaster than real wage gains in the privatized firms (although wages did rise rapidly), while state-ownedfirms raised wages faster than productivity, depleting their capacity to finance the enterprise from internalsources.
The positive effects of privatization on the privatized firms' finances also bolstered the bankingsystem. In countries that pursued large and rapid privatization programs, privatized firms improved theirprofitability more quickly than expected, lessening the necessity for government intervention in, andsupport of, the banking system. In countries that had done little or no privatization, the continued poorfinancial situation of many state firms worsened the banks' loan problems.
Mid-Size Firms in the Czech Republic, Poland, and Hungary
Similar results were found in a study of 500 mid-size firms in the Czech Republic, Poland, andHungary between 1991 and 1993 that compared the performance of privatized and state firms. This studyalso revealed that private ownership improves labor productivity and revenue.5
The simplest ordinary least-square estimations in this study generated the following equations(using averages for the period 1991 to 1993):
Revenue Growth = -15.82* - 0.25* x INIPERF+ 19.01* x PRV(1.92) (0.06) (3.18)
Employment Growth = - 7.47* - 0.40* x INIPERF + 5.88* x PRV(1.20) (0.10) (1.61)
Revenue per Employee = -5.21* - 0.28* x INIPERF+ 11.17* x PRV(2.01) (0.06) (3.21)
5. R. Frydman and others, "Private Ownership and Corporate Performance: Some Lessons from TransitionEconomies" (unpublished manuscript, June 1997).
180

Privatization-Annexes
Cost-to-Revenue Ratio = 30.06* - 0.31 * x INIPERF - 3.00 x PRV(4.16) (0.05) (2.28)
where INIPERF is the initial value of the relevant performance indicator (for privatized firms, the initialvalue corresponds to the year of privatization), and PRV is a dummy variable, coded I if private, 0otherwise. Standard errors are in parentheses, and coefficients significant at the 95 percent interval aremarked with an asterisk. These equations show that private ownership significantly increases theprobability that firms will have higher rates of revenue growth, higher rates of employment growth, andgreater labor productivity. Additional dummy variables-indicating, among other things, whether thelargest owner of the firm was an investment fund, a foreign company, management, employees, the state,and so on-generate robust findings that private owners of all institutional forms (with the exception ofemployees) produce significant revenue, employment, and efficiency gains. These results are found evenwhen the level of pre-pr'ivatization performance is controlled for in the regressions.
Over the data period, all firms had been forced to reduce bloated payrolls, probe new marketsafter demand collapsed for their products, improve product quality, and reduce inefficiencies. Evidencefrom these firms indicates that private owners produce this restructuring more effectively than the state.
181


Privatization-Annexes
ANNEX 5-2. Privatization in Post-Communist Europe: Public and Private Finance
Privatization Revenues
In most transition economies, privatization has slowed since 1995. Privatization revenues as apercentage of GDP: in Lithuania, which has fared worse than its Baltic neighbors over the wholeperiod, have consistently fallen each year since 1993. Table 5-5 reflects the heavy reliance oncash sales in Estonia, Latvia, Hungary, and the Slovak Republic, as well as in the Czech Republicafter 1995, all of which generated privatization revenues in excess of 3 percent of GDP at somepoint during the main period of enterprise sales between 1992 and 1995. Hungary and Estonia,using a modified form of the east German Treuhandanstalt method of enterprise sales, show thelargest proportional revenue gains. The low figure for the Czech Republic in 1994 most likelyindicates the end of the mass privatization program. The switch to traditional methods ofenterprise sales in 1995-most notably with the sale of SPT Telecom-is responsible for theobserved increase of over 3 percent in 1995. Similarly, the Slovak Republic's strong showing in1995 primarily stems from the direct sales of a few large enterprises, including the SlovnaftRefinery and the East Slovak Ironworks.
Table 5-5 contrasts voucher-based or mixed cash and voucher sales (which, bydefinition, produce little revenue) with traditional methods. In addition, the countries that registeraverage privatization-revenue-to-GDP ratios of less than I percent (Bulgaria, Russia, andLithuania) typically suffered the most from insider-dominated enterprise sales, inadequatecommercialization., and a lack of customer demand.
Table 5-5. Privatization Revenues in Selected Transition Economies(percent of GDP)Country 1989 1990 1991 1992 1993 1994 1995 1996Bulgaria 0.42 1.51 0.86 0.31Czech Republic 2.06 0.02 3.49 0.36Estonia 2.58 5.19 2.72 1.29Hungary 1.58 1.46 2.39 2.12 4.56 1.02 7.44 2.07Latvia 3.75 0.17Lithuania 1.34 1.14 0.98 0.05Poland 0.16 1.17 1.23 2.78 2.13 0.81Russian Federation 0.07 0.29 0.09Slovak Republic 0.52 3.01 5.79 0.08
Note: Figures for 1996 are based on revenue estimates and GDP projections from Privatization Yearbook 1996.Years for which figures are unavailable are left blank.
Source: World Bank, Global Development Finance (Washington, 1997); IMF, International Financial Statistics,various issues (Washington, D.C.); Privatization International, Privatization Yearbook, various issues (London).
Privatization and the Financial Sector
Public enterprise reform and financial sector reform are two sides of one coin. While theexpansion in the range of financial services, the depth of financial intermediation, and thereliability of financial infrastructure supports and encourages public enterprise reform, publicenterprise reform also stimulates improvements in the financial sector. Experience from thetransition economies suggests that the privatization of public enterprises (i) increases the demand
183

Privatization-A nnexes
for financial services; (ii) reduces the losses that the financial sector, particularly commercialbanks, must absorb, (iii) allows for more accurate monitoring of company behavior bymoneylenders and other financiers; and (iv) enables financiers to punish their borrowers for poorperformance more credibly than would be the case under public ownership.
In all countries, banks have reduced lending to public enterprises as a portion of totallending. Several factors may be responsible for this change, including a more prudent attitudetoward lending on the part of the banking system; attractive interest rates on government paper,which induce banks to lend more to the government at the expense of its enterprises; low creditdemand; and, of course, the privatization of formerly public enterprises. At the same time, table5-6 reveals a wide range of interest rate spreads, suggesting that individual banking systems facevarying levels of uncertainty. High interest rate spreads indicate one of two circumstances. Theydemonstrate either the level of "stress" a banking system faces, since increased spreads betweenborrowing and deposit rates reflect an attempt by banks to increase interest income in order tocover nonperforming loans, or the presence of an oligopolistic banking system. To the extentthat the transfer of state firms to private ownership leads toward a stabilization of bad lending,narrower margins are more likely to be sustained in economies that have taken significant stepstoward privatization.
Table 5-6. Interest Rate Spreads in Selected Transition EconomiesCountry 1989 1990 1991 1992 1993 1994 1995 1996
Bulgaria 9.86 11.69 16.90 21.44 23.03 48.80
Czech Republic 7.04 6.05 5.84 5.75
Estonia 30.50 27.30 11.58 7.21 7.62
Hungary 10.92 4.10 4.68 8.64 9.77 7.09 6.51
Lithuania 43.20 34.94 18.66 21.57
Latvia 51.57 24.18 19.77 14.07
Poland -36.00 12.50 1.08 1.25 1.25 -0.57 6.67 6.06
Russia 217.49 91.76
Slovak Republic 6.39 5.24 6.64 7.03
Note: Lending minus deposit rates using period averages. Years for which figures are unavailable are blank.Source: IMF, International Financial Statistics, various issues (Washington, D.C.).
Indeed, there are some suggestive correlations that derive from this table. First, countriesin which interest rate spreads have been held to single digits tend to be countries that have madethe most substantial progress in privatization. A comparison of the figures in table 5-5-a proxyfor progress in privatization-reveals that the countries that have achieved higher revenue gainsfrom privatization have maintained lower interest rate spreads than states that have been unableto raise revenues from privatization beyond 2 percent of GDP.6 Second, the performances of thebanking systems in countries plagued by spontaneous privatization and excessive insidercontrol-both countries that relied on voucher sales (Russia) and those that utilized cash sales(Latvia)-have been the worst in the group. Third, the trend in interest rate spreads may revealmore about the burden of bad enterprise loans than static values. In the Czech Republic, Estonia,Hungary, Latvia, Russia, and the Slovak Republic, the trend has been downward. In Bulgaria,
6. The one exception is Latvia, which raised the equivalent of 3.75 percent of GDP from public enterprisesales in 1994 (the only year for which figures are available), yet has suffered from high interest ratemargins. These, however, have been cut in half in recent years.
184

Privatization-A nnexes
the trend seems to be on the rise. In Lithuania, there has been a slight increase from (alreadyhigh) 1995 levels. To be sure, the health of the banking system is a function of several relatedfactors. There is, however, evidence that progress in privatization may be a necessary (althoughperhaps not sufficient) condition for banking reform.
185

Privatization-Annexes
ANNEX 5-3. Organizing Government for Privatization
A successful government privatization program needs to (i) be located at the center ofgovernment; (ii) be supported at the highest ministerial and bureaucratic levels; (iii) have clearlydefined aims and goals; and (iv) develop institutional competence and experience.
CENTRAL LOCATION AND HIGH-LEVEL SUPPORT. Privatization programs are generallyat the center of government and attached to the president's or prime minister's office; the Ministryof Finance or Ministry of Treasury; or some other powerful central ministry or department.There are a number of reasons for this:
* Privatization will inevitably meet bureaucratic opposition and political resistance becauseprivatization changes the status quo.
* By locating thie privatization group near the center of government power, government canovercome bureaucratic resistance and manage political issues effectively.
* Privatization programs are usually part of an overall program of structural adjustment orresult from the government's need to raise money, and it is the central ministries andministers of government that are responsible for the success of such initiatives and have themost incentive to make the privatization program a success.
Because privatizations affect so many parties within and outside government-lineministries, the state corporation being privatized, labor unions, national and local politicians,employees of the state enterprise, customers and suppliers, and the like- privatizations can bevery contentious. It is often necessary for the most senior and powerful government ministers tointervene to resolve issues and to move the privatization forward.
International experience suggests that most successful privatization programs areoperated at or near the center of government. Canada ran its most successful privatizationprogram in association with the Department of Finance. New Zealand centered its program in theTreasury Department, as did the United Kingdom. The French used their powerful TreasuryMinistry and a privatization commission. The German privatization effort under theTrehandanstalt reported to the Minister of Finance.
CLEARLY DEFINED AIMS FOR THE PRIVATIZATION PROGRAM. Privatization programsshould have clearly defined goals. The government may enumerate these goals in policystatements, legislation, and decrees or as instructions to the government officials who willadminister the privatization program. If these explicit aims and goals are missing from aprogram, confusion will develop among participants in the process about why the privatization isbeing undertaken and why it should be supported.
Given the wide range of interests affected by any significant privatization, governmentwill need to trade off stakeholder and government gains and losses. To make these tradeoffs, andto prevent the privatization process from bogging down in a welter of unresolved issues,government will need to be clear on the objectives and priorities of privatization. For example,
This Annex is based on D. Welch and 0. Fremond, The Case-by-Case Approach to Privatization:Techniques and Examples, World Bank Technical Paper 403 (Washington, D.C., 1998).
187
Privatization-Annexes
governments must make tradeoffs among the interests of line ministries, which may have beenmore concerned about how the privatization affects their policy stance and authority than thegovernment's need to restructure the economy or raise money.
DEVELOP INSTITUTIONAL COMPETENCE AND EXPERIENCE. It is important that thegovernment institutions responsible for the privatization program gain experience and developcompetence in privatization. Privatization of state firms is a complex, difficult task, and it oftenrequires commercial skills and experience that many government officials in developing andtransitional economies do not have. The need to develop institutional competence and expertisesuggests the establishment of one single privatization body. Spreading the privatization effortthroughout a number of institutions or ministries is a mistake that militates against building theinstitutional capacity needed in privatization.
Under no circumstances should the state allow enterprises to privatize themselves. Theirmanagement in such a circumstance would experience conflicts among its own interests, theinterests of the enterprise, and the interests of the government.
188

Privatization-Annexes
ANNEX 5-4. Valuation Methodology: International Best Practices
Government has a fiduciary duty toward its citizens when it privatizes. It is entrusted to sellmarketable assets at or above their fair market value. Valuation is the process of estimating whatbuyers will pay fir an enterprise, and it is the cornerstone of case-by-case privatization. Asopposed to mass privatization, where the value of assets is not known with precision and is not acritical factor, in case-by-case privatization, value is of fundamental importance to both buyerand seller. Agreeing to sell below market value will favor some group of individuals over others.
Financial advisers start a valuation with a financial audit and one or more targetedmethods of sale. The method of sale determines the weight and level of detail that should beapplied to the various valuation methods. It is usually advantageous to select the financialadviser for the valuation ahead of the auditor so that the adviser can provide input in thepreparation of the terms of reference for the audit, which normally includes an operational andlegal review in addition to the financial review. At the end of this process, the financial adviserwill submit a first valuation report to the government. The government is responsible forestablishing the reserve price of the sales tender, or the fixed price of the public offering, but thegovernment needs to base its decision on a set of objective data. These data are provided in avaluation report.
All valuation methods yield an estimate or range of expected market value. Somemethods are particularly appropriate if the company is to be divested by an initial public offering(IPO), others if control is to be sold to a strategic investor or through a trade sale (auction). Thediscounted cash flow method (DCF) and comparable companies method are best practices forcase-by-case privatization. The adjusted net assets method and replacement value methodsshould not be used, because they are not indicative of market values.
THE DISCOUNTED CASH FLOW METHOD. The DCF method is most relevant in a sale to astrategic investor who will control management of the company, and thus its cash flows. Itconsists of estimating the company's cash flow over a medium- to long-term horizon, taking intoaccount variations in working capital and future capital expenditures. A discount rate is thenapplied to these anticipated cash flows to calculate their present value. The discount rate reflectsthe weighted average cost of capital of the acquisition candidate and the political risk of thecountry where the company's operations are based. Strategic investors concentrate theirvaluation efforts on the DCF method. They verify that their calculations are not significantly offmarket by contrasting them with market values of comparable quoted companies and with pricespaid by other acquirers in recent comparable transactions, but their DCF valuation will make up asignificant component of their ultimate privatization offer.
THE COMPARABLE COMPANIES METHOD. The comparable companies and comparabletransaction methods are particularly appropriate when the company is privatized in whole or inpart through the stock exchange. The underlying principle is that companies' market values canbe determined by applying a series of empirically derived valuation multiples to their latest (ornormalized) financial results. The most commonly used multiples are the multiple of turnover,
This Annex is based on D. Welch and 0. Fremond, The Case-by-Case Approach to Privatization:Techniques and Examples World Bank Technical Paper 403 (Washington, D.C., 1998).
189
Privatization-Annexes
the multiples of operating income, or the multiple of net earnings, also known as the price-earnings ratio. A series of multiples are calculated and sorted to obtain a range (high, low, andarithmetic mean), which is applied to the financial results of the company being valued. Inaddition, for capital-intensive industries such as cement or oil and gas, a variety of operationalratios, such as the dollar per ton of capacity or the dollar per barrel of reserves in the ground, canalso be used to approximate market values.
THE REPLACEMENT VALUE METHOD. The replacement value method consists ofestimating the total costs of replacing a company's assets-principally the fixed assets such asplant and machinery, but also start-up costs and certain current assets, such as a transport fleet.This value is often abnormally high compared with the results obtained by the other methodsdescribed herein. Investors almost never consider the replacement value method when valuing acompany because it does not give them a measure of the expected return from the proposedinvestment, and sellers should not use this method. It should nevertheless be calculated, andarguments should be prepared to explain why it has been discarded. Otherwise, critics of theprivatization process may use this method to argue that a company is worth far more, or that itwas sold for a fraction of its worth.
THE ADJUSTED NET ASSETS METHOD. The adjusted net assets method seeks to ascertainthe fair market value of the shareholders' equity by estimating the market value of its assets, andthen subtracting from this total the company's balance sheet and off-balance-sheet liabilities.Acquirers generally discard this method because it does not take into account the capacity of theassets to generate revenues for the firm. (The firm may well be using the assets in a suboptimalmanner.) Such an approach is often the cause of unreconcilable differences between buyers andseller.
190

Privatization-Annexes
ANNEX 5-5. Hiring and Using Financial and Other Advisers for Case-By-CasePrivatization
Financial advisers are investment or merchant bankers who sell and advise on the sale of firms.They sell using share flotations (IPOs), which they may underwrite; third-party trade sales;negotiated sales; or mixed sales (trade sale to a strategic buyer combined with an IPO). Thegovernment may use a single financial adviser or a consortium of financial and other advisers. Ifthe government wants to attract both domestic and foreign buyers, it will need both a foreign-based and domestic adviser working together.
Considerations in Selecting Financial Advisers
If a small enterprise is being privatized and is unlikely to attract much international interest,accounting firms ancl financial consultants may suffice as financial advisers. But if the enterpriseis large, or if it has an international dimension, it is preferable to award the valuation mandate toan investment or merchant bank. This is because a valuation exercise requires market awarenessin addition to technical skills.
ROLE OF FINANCIAL ADVISERS. Governments need financial advisers in case-by-caseprivatizations to value the enterprise and to advise on timing and method of sale. Advisers willestablish the price (usually a price range) that the government could receive for the enterprise,and may provide several valuations based on different sales methods (for example, whether saleis through a stock flotation or through a trade sale). The financial adviser will also advise onsales options. This advice will cover such issues as:
* Is the company salable?* Should it be sold now or later, when markets improve?* What sorts of sales choices are feasible, and at what cost?
Once the government has decided when and how to privatize, it will require a financialadviser (sales agent) to undertake the sale. The sales agent will help design the privatization planand will undertake the sale, in cooperation with government officials. If a privatization moves tothe sales stage through an IPO, a syndicate of investment or merchant banks will be formed tosell the shares. The government will need to appoint a firm as a lead manager for the syndicate tomanage the sale process.
Other Advisers
Other professional advisers are also necessary in the privatization process. Lawyers andaccountants will be required to manage due diligence activities, which involve such issues asverifying asset ownership, assessing effects of contracts the firm has made, verifying accounts,and the like. Lawyers will advise government on the legal aspects of the privatization, draft andhelp negotiate sales contracts, and draw up confidentiality agreements. Accountants and auditorsmay be needed to undertake audits prior to sale, and technical experts with special industry skill
This Annex is based on D. Welch and 0. Fremond, The Case-by-Case Approach to Privatization:Techniques and Examples, World Bank Technical Paper 403 (Washington, D.C., 1998).
191

Privatization-Annexes
and knowledge may be required as well. The government may find it convenient to tender for allthese advisers as a single consortium rather than hiring them separately.
SHOULD THE GOVERNMENT USE THE SAME FINANCIAL ADVISER FOR BOTH THEPRIVATIZATION FEASIBILITY STUDY AND THE SALE? Privatization literature often questionswhether the same financial advisory firm that advised the government during the early stages ofthe privatization process should undertake the sale of the enterprise. The argument against usingthe same adviser is that there is a conflict of interest inherent in advising on whether and how toprivatize an enterprise and the sale of that enterprise. Nevertheless, the best adviser firms areoften reluctant to undertake the advisory role if they cannot participate in the sale, which isusually the more profitable assignment.
A way to manage this issue is to tender for both the initial financial advisory and thesales agent advisory, but not to restrict the winner of the first from participating in, or winning,the second. Alternatively, the authorities can bind the adviser to a two-stage assignment-afeasibility study and the sales process-giving the government an exit at the first stage if it is notcontent with the adviser.
192

Privatization-Annexes
ANNEX 5-6. Lessons from International Experience
Significant case-by-case privatization experience has accumulated throughout the world. Aconsensus is emerging about the main factors in successful privatization programs, and we canpresent a number of conclusions here.
STRONG POLITICAL SUPPORT AND LEADERSHIP ARE VITAL FOR SUCCESS. Governmentmust support the privatization process from the highest levels to overcome inertia and theinevitable resistance from bureaucracy and special interest groups. Government should entrustimplementation to pragmatic individuals who have no personal stake in the status quo and haveaccess to world-class technical competence. The privatization arm of government should reportto a senior minister, and it often has special status.
TRANSPARENCY, FAIRNESS, AND A LEVEL PLAYING FIELD ARE OF UTMOST
IMPORTANCE. Transparency is key to a successful case-by-case privatization program.Independent, third-party experts should carry out asset valuation procedures to ensure that theyare realistic, fair, and consistently applied, as are procedures for calling for bids and evaluatingoffers. The implementing agency should take the necessary time and effort to think out, plan,and execute the privatization process. Widespread publicity campaigns help ensure that potentialinvestors are aware of the opportunities. In trade sales, it is important to include the contractterms as part of the bidding documents to prevent undesirable changes during post-awardnegotiations. The privatization award process should be transparent and clear beforehand toavoid corruption and controversies.
OUTSIDE EXPERTISE SHOULD BE SOUGHT. The need to make full use of specializedconsultants is now clear. There is a growing body of specialist experience in privatizationworldwide. Government can use local experts, but governments should not hesitate to resort tothe services of foreign privatization experts. Investment banks, consulting firms, environmentalexperts, accountants, and lawyers are necessary participants in case-by-case programs.Institutional failure, the inability of the government to manage the process because of lack ofqualified staff, has slowed and undermined many privatization programs.
INVESTORS WILL COME FORWARD FOR A PROPERLY PREPARED TRANSACTION.
Officials are often concerned over a perceived shortage of foreign and domestic investor interest.Heavy oversubscriptlion of share offerings in Britain, Latin America, and Africa (Nigeria,Senegal) took many by surprise. Often the level of informal savings and capital flight indeveloping and transition economies is underestimated. Properly designed privatizations withappropriate incentive structures can motivate domestic and international investors to buy equities.
PRIVATIZATIoDN IN TRANCHES OR THROUGH A MIXED SALE MAY HELP MAXIMIZE
GOVERNMENT RECEIPTS. Because of the lack of market depth in emerging markets, sale throughseveral tranches may be necessary to attract the maximum number of individual and institutionalinvestors, both at homne and abroad. The use of mixed sales can help satisfy both domestic andforeign demand to the fullest extent possible and solve the issue of corporate governance through
This Annex is based on D. Welch and 0. Fremond, The Case-by-Case Approach to Privatization:Techniques and Examples, World Bank Technical Paper 403 (Washington, D.C., 1998).
193

Privatization-Annexes
the introduction of a strong, controlling shareholder.
PRIVATIZATION PROGRAMS SHOULD BE PROACTIVE. Competition among governmentsfor investors in privatized assets is fierce. Without a conscious, consistent, and aggressive policyto attract the participation of foreign investors, privatization programs may fall short on therevenue side or turn away investors who could provide market access, the latest technology, andmanagement expertise. Privatization programs should be designed with the view that foreigninvestors will participate with local investors in the country's privatizations on as equal a basis aspossible. It is critical to reassure investors that the state will not use its political power or anyresidual or "golden share" in a way that will jeopardize the company's ability to maximize profitsand efficiency.
NECESSARY PRE-PRIVATIZATION RESTRUCTURING SHOULD BE SHORT-TERM ANDMINIMALIST. Government should limit restructuring to balance sheet and organizationalchanges, which may include closures, reductions in labor, or transfers of social services. It ispreferable that government undertake necessary labor restructuring prior to privatizing a stateenterprise. Government should leave the implementation of technology changes, investment ofcapital, and major purchases to the new owners, not to government agencies or officials.
GOVERNMENTS SHOULD LIMIT THE CONDITIONS ATTACHED TO PRIVATIZATION TO AMINIMUM. Complex, elaborate undertakings will detract from the value and attractiveness of theenterprise and may undermine the deal. The government should clean up regulatory andenvironmental issues, price controls, subsidies, and other problem areas before the sale.
RELATED STRUCTURAL REFORMS SHOULD KEEP ABREAST WITH PRIVATIZATION.Governments should implement privatization programs in the framework of an overall packageof mutually reinforcing economic reforms, such as macroeconomics stabilization, tradeliberalization, financial sector reform, elimination of subsidies, a pro-competition policy, andregulatory reform. Privatization alone is unsustainable and cannot restructure the economy ifother reforms are lagging.
PUBLIC INFORMATION AND PUBLICITY CAMPAIGNS PLAY A CRITICAL ROLE IN CASE-BY-CASE PROGRAMS. Most successful privatization programs placed a strong emphasis oneducating the public through extensive advertising of the expected sales.
194
Privatization-Annexes
ANNEX 5-7. Case-by-Case Privatization Defined
Case-by-case privatization is often referred to as classical privatization. It moves stateenterprises to the private sector, usually one at a time, through domestic and international publicofferings, negotiated or trade sales, or through "mixed sales." (The latter combines a third-partysale of control to a strategic buyer with a public share offering for the remainder of the state'sshares.) Case-by-case privatization allows governments to resolve the policy issues surroundingthe privatization, such as regulatory, environmental, and labor issues. It encourages governmentto engage reputable financial advisers, to obtain market-based valuations for the firm, and to sellthe firm in a transparent sales process for its market value. Case-by-case privatization transfersall or a majority of the shares-a control block-to new, private sector owners. Case-by-caseprivatization has a number of advantages over the mass or voucher privatization technique,because governments can structure sales to bring in needed foreign capital, technical knowledge,and market connections and can maximize financial returns.
195


6PSD ENVIRONMENT: TAKING STOCK OF RECENTDEVELOPMENTS AND PERCEIVED CONSTRAINTS
The World Bank's Lithuania Private Sector Development report of June 1995 examined the progress andpotential of private sector development (PSD) through privatization, foreign investment, and newbusiness establishment. The study's primary goals were to explain why new domestic and foreigninvestment had moved only hesitantly into Lithuania and to suggest ways in which the rate of privateinvestment could be accelerated. This Policy Note serves as a follow-up and update to the previousreport, and includes the presentation and analysis of the following: (i) the anatomy of Lithuania's privatesector, (ii) the perceptions of domestic enterpreneurs as to what constrains the growth of their businesses,and (iii) the perceptions of foreign investors. More important, this Note has served as a basis for theidentification of key policy issues for private sector development, which are treated in detail in separatePolicy Notes.
The statistical data was collected from the Lithuanian Department of Statistics,the LithuanianPrivatization Agency, and the publications of these institutions. The information on the perceptions ofthe private sector was gathered through two surveys, both carried out in the first half of 1997. A surveyof domestic enterprises was conducted by Baltic Survey, Ltd., at the request of the World Bank, and asurvey of foreign investors was conducted independently by the Lithuanian Investment Agency.
The Anatomy of Lithuiania's Private Sector'
According to the Department of Statistics, approximately 60,000 public, semi-public, and privateenterprises are currently registered in Lithuania. Only about 20,000 of these enterprises, however, werethought to be pursuing their day-to-day operations in 1997. This large discrepancy has several causes.First, because there are no requirements to report bankruptcy or liquidation, a huge number of enterpriseshave ceased to exist, but have not updated their registry status to reflect this change. Second, somecompanies that have been privatized have registered themselves as new enterprises without eliminatingtheir former, state-owned, company names. Third, a significant number of enterprises that had stoppedoperating for a period of time registered themselves as new enterprises when they resumed operation.Although the number of registered enterprises overestimates the true figure, the actual number ofenterprises in operation would be closer to that total if the informal sector were taken into account (seebelow, under "Crime, Rent-Seeking, and the Informal Sector").
1. In the context of this section, "private sector" excludes all financial institutions such as banks and insurancefirms.
197

PSD Environment. Taking Stock
Of the 20,000 operating enterprises, some 12,400 have taken part in a statistical survey that wasconducted by the Lithuanian Department of Statistics at the end of 1996. Although the number ofenterprises corresponds only to about one-sixth of those registered, the Department of Statistics hasfound, by double-checking with the tax authority, that those 12,400 account for almost 90 percent of thesector's total sales.
Tables 6-1 and 6-2 present the economic and financial findings of the survey. Of the 12,400enterprises included, about 11,000 (89 percent) were classified as "private," which is defined here asenterprises with less than 50 percent state ownership. Extrapolating that proportion to the total populationof firms, we can assume that approximately 17,800 (89 percent of 20,000) operating enterprises areprivately held. Since the total accumulated number of privatized enterprises is 5,880 (according to thePrivatization Agency), an estimated 12,000 private enterprises have been established since independencethat are still in operation.
Table 6-1. Breakdown of Nonfinancial State-Owned and Private Enterprises Surveyed by Sector,as of 1 January 1997
Number of companies Number of employeesState Private Percent of State Private Percent of
Activity Total sector sector private sector Total sector sector private sectorAgriculture, hunting,
and forestry 245 69 176 71.8 20,214 16,445 3,769 18.6Fishing 56 2 54 96.4 882 17 865 98.1Mining and quarrying 41 8 33 80.5 2,982 582 2,400 80.5Manufacturing 2,527 241 2,286 90.5 233,844 36,771 197,073 84.3Electricity, gas, and
water supply 131 109 22 16.8 40,836 40,460 376 0.9Construction 1,174 62 1,112 94.7 73,161 9,005 64,156 87.7Wholesale and retail
trade 4,980 311 4,669 93.8 95,044 7,860 87,184 91.7Hotels and restaurants 597 54 543 91.0 11,322 2,716 8,606 76.0Transport, storage, and
communications 1,025 86 939 91.6 81,432 61,380 20,052 24.6Real estate, rental, and
business activities 1,080 200 880 81.5 22,875 12,683 10,192 44.6Education 60 28 32 53.3 1,583 1,231 352 22.2Health and social work 89 18 71 79.8 4,647 2,275 2,372 51.0Other community,
social, and personalservice activities 386 150 236 61.1 13,923 9,166 4,757 34.2
Total 12,391 1,338 11,053 89.2 602,745 200,591 402,154 66.7Source: Lithuanian Department of Statistics.
Only 11 percent (1,338) of the surveyed enterprises have been identified as having more than 50percent state ownership. At the same time, state enterprises, on average, are much larger than privateconcerns, because the former hold more than half of the assets and employ one-third of the (surveyed)workforce. The private sector of the (surveyed) businesses accounted for 70 percent of total annual salesand 52 percent of annual net profits. This indication of lower profitability in the private sector is not in
198
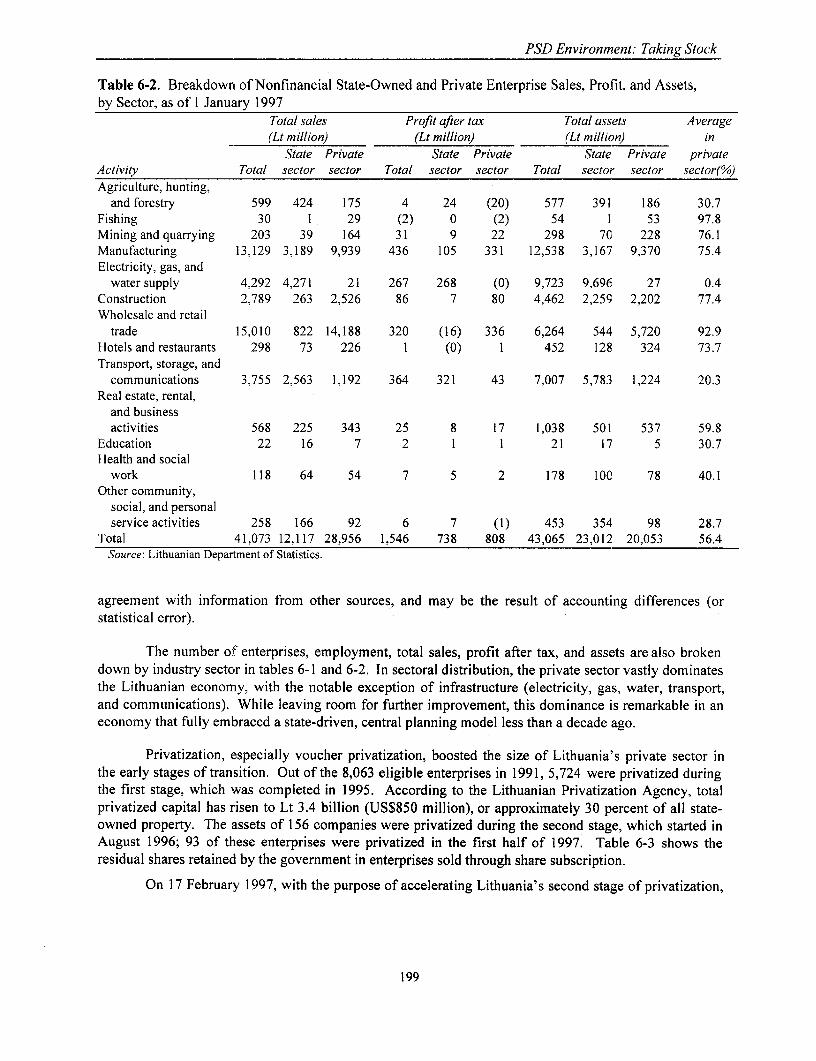
PSD Environment: Taking Stock
Table 6-2. Breakdown of Nonfinancial State-Owned and Private Enterprise Sales, Profit, and Assets,by Sector, as of I January 1997
Total sales Profit after tax Total assets Average(Lt million) (Lt million) (Lt million) in
State Private State Private State Private privateActivity Total sector sector Total sector sector Total sector sector sector(%/O)Agriculture, hunting,
and forestry 599 424 175 4 24 (20) 577 391 186 30.7Fishing 30 1 29 (2) 0 (2) 54 1 53 97.8Mining and quarrying 203 39 164 31 9 22 298 70 228 76.1Manufacturing 13,129 3,189 9,939 436 105 331 12,538 3,167 9,370 75.4Electricity, gas, and
water supply 4,292 4,271 21 267 268 (0) 9,723 9,696 27 0.4Construction 2,789 263 2,526 86 7 80 4,462 2,259 2,202 77.4Wholesale and retail
trade 15,010 822 14,188 320 (16) 336 6,264 544 5,720 92.9Hotels and restaurants 298 73 226 1 (0) 1 452 128 324 73.7Transport, storage, and
communications 3,755 2,563 1,192 364 321 43 7,007 5,783 1,224 20.3Real estate, rental,
and businessactivities 568 225 343 25 8 17 1,038 501 537 59.8
Education 22 16 7 2 1 1 21 17 5 30.7Health and social
work 118 64 54 7 5 2 178 100 78 40.1Other community,
social, and personalservice activities 258 166 92 6 7 (1) 453 354 98 28.7
Total 41,073 12,117 28,956 1,546 738 808 43,065 23,012 20,053 56.4Source: Lithuanian Department of Statistics.
agreement with information from other sources, and may be the result of accounting differences (orstatistical error).
The number of enterprises, employment, total sales, profit after tax, and assets are also brokendown by industry sector in tables 6-1 and 6-2. In sectoral distribution, the private sector vastly dominatesthe Lithuanian economy, with the notable exception of infrastructure (electricity, gas, water, transport,and communications). While leaving room for further improvement, this dominance is remarkable in aneconomy that fully embraced a state-driven, central planning model less than a decade ago.
Privatization, especially voucher privatization, boosted the size of Lithuania's private sector inthe early stages of transition. Out of the 8,063 eligible enterprises in 1991, 5,724 were privatized duringthe first stage, which was completed in 1995. According to the Lithuanian Privatization Agency, totalprivatized capital has risen to Lt 3.4 billion (US$850 million), or approximately 30 percent of all state-owned property. The assets of 156 companies were privatized during the second stage, which started inAugust 1996; 93 of these enterprises were privatized in the first half of 1997. Table 6-3 shows theresidual shares retained by the government in enterprises sold through share subscription.
On 17 February 1997, with the purpose of accelerating Lithuania's second stage of privatization,
199
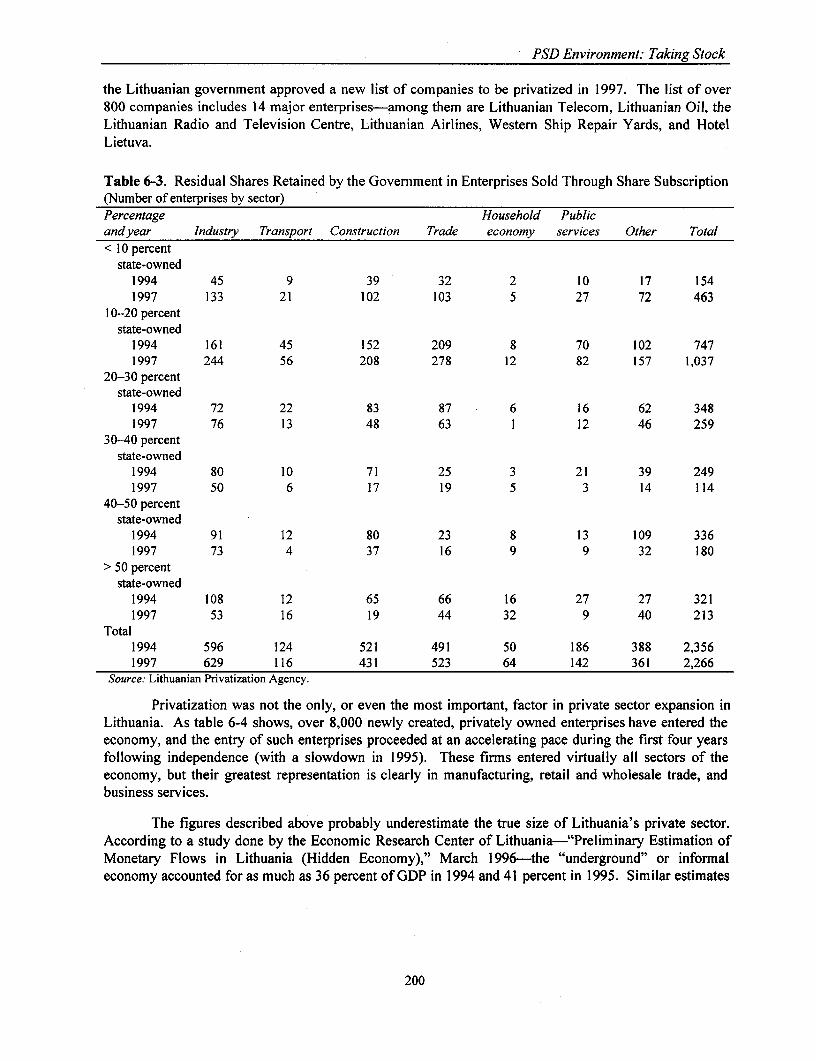
PSD Environment: Taking Stock
the Lithuanian government approved a new list of companies to be privatized in 1997. The list of over800 companies includes 14 major enterprises-among them are Lithuanian Telecom, Lithuanian Oil, theLithuanian Radio and Television Centre, Lithuanian Airlines, Western Ship Repair Yards, and HotelLietuva.
Table 6-3. Residual Shares Retained by the Government in Enterprises Sold Through Share Subscription(Number of enterprises by sector)Percentage Household Publicand year Industry Transport Construction Trade economy services Other Total< 10 percent
state-owned1994 45 9 39 32 2 10 17 1541997 133 21 102 103 5 27 72 463
10-20 percentstate-owned
1994 161 45 152 209 8 70 102 7471997 244 56 208 278 12 82 157 1,037
20-30 percentstate-owned
1994 72 22 83 87 6 16 62 3481997 76 13 48 63 1 12 46 259
30-40 percentstate-owned
1994 80 10 71 25 3 21 39 2491997 50 6 17 19 5 3 14 114
40-50 percentstate-owned
1994 91 12 80 23 8 13 109 3361997 73 4 37 16 9 9 32 180
> 50 percentstate-owned
1994 108 12 65 66 16 27 27 3211997 53 16 19 44 32 9 40 213
Total1994 596 124 521 491 50 186 388 2,3561997 629 116 431 523 64 142 361 2,266
Source: Lithuanian Privatization Agency.
Privatization was not the only, or even the most important, factor in private sector expansion inLithuania. As table 6-4 shows, over 8,000 newly created, privately owned enterprises have entered theeconomy, and the entry of such enterprises proceeded at an accelerating pace during the first four yearsfollowing independence (with a slowdown in 1995). These firms entered virtually all sectors of theeconomy, but their greatest representation is clearly in manufacturing, retail and wholesale trade, andbusiness services.
The figures described above probably underestimate the true size of Lithuania's private sector.According to a study done by the Economic Research Center of Lithuania-"Preliminary Estimation ofMonetary Flows in Lithuania (Hidden Economy)," March 1996-the "underground" or informaleconomy accounted for as much as 36 percent of GDP in 1994 and 41 percent in 1995. Similar estimates
200
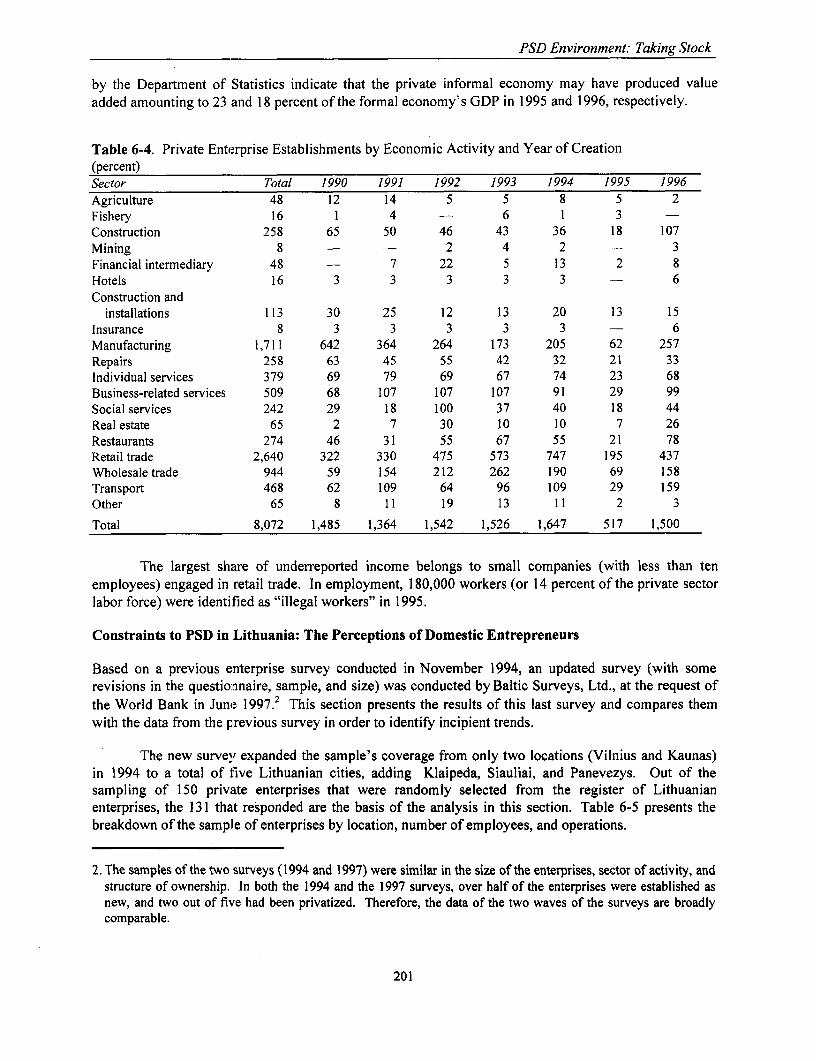
PSD Environment. Taking Stock
by the Department of Statistics indicate that the private informal economy may have produced valueadded amounting to 23 and 18 percent of the formal economy's GDP in 1995 and 1996, respectively.
Table 6-4. Private Enterprise Establishments by Economic Activity and Year of Creation(percent)Sector Total 1990 1991 1992 1993 1994 1995 1996Agriculture 48 12 14 5 5 8 5 2Fishery 16 1 4 - 6 1 3 -
Construction 258 65 50 46 43 36 18 107Mining 8 - - 2 4 2 - 3Financial intermediary 48 - 7 22 5 13 2 8Hotels 16 3 3 3 3 3 - 6Construction and
installations 113 30 25 12 13 20 13 15Insurance 8 3 3 3 3 3 - 6Manufacturing 1,711 642 364 264 173 205 62 257Repairs 258 63 45 55 42 32 21 33Individual services 379 69 79 69 67 74 23 68Business-related services 509 68 107 107 107 91 29 99Social services 242 29 18 100 37 40 18 44Real estate 65 2 7 30 10 10 7 26Restaurants 274 46 31 55 67 55 21 78Retail trade 2,640 322 330 475 573 747 195 437Wholesale trade 944 59 154 212 262 190 69 158Transport 468 62 109 64 96 109 29 159Other 65 8 11 19 13 11 2 3
Total 8,072 1,485 1,364 1,542 1,526 1,647 517 1,500
The largest share of underreported income belongs to small companies (with less than tenemployees) engaged in retail trade. In employment, 180,000 workers (or 14 percent of the private sectorlabor force) were identified as "illegal workers" in 1995.
Constraints to PSD in Lithuania: The Perceptions of Domestic Entrepreneurs
Based on a previous enterprise survey conducted in November 1994, an updated survey (with somerevisions in the questionnaire, sample, and size) was conducted by Baltic Surveys, Ltd., at the request ofthe World Bank in June 1997.2 This section presents the results of this last survey and compares themwith the data from the previous survey in order to identify incipient trends.
The new survey expanded the sample's coverage from only two locations (Vilnius and Kaunas)in 1994 to a total of five Lithuanian cities, adding Klaipeda, Siauliai, and Panevezys. Out of thesampling of 150 private enterprises that were randomly selected from the register of Lithuanianenterprises, the 131 that responded are the basis of the analysis in this section. Table 6-5 presents thebreakdown of the sample of enterprises by location, number of employees, and operations.
2. The samples of the two surveys (1994 and 1997) were similar in the size of the enterprises, sector of activity, andstructure of ownership. In both the 1994 and the 1997 surveys, over half of the enterprises were established asnew, and two out of five had been privatized. Therefore, the data of the two waves of the surveys are broadlycomparable.
201

PSD Environment: Taking Stock
Table 6-5. Characteristics of Companies in the 1997 Enterprise SurveyNumber of enterprises surveyed Percent
LocationVilnius 50 38Kaunas 23 23Klaipeda 18 18Siauliai 20 15Panevezys 20 15
Total 131 100
Form of companyNewly established 75 57Privatized 52 40Other 4 3
Total 131 100
Number of employeesUpto 10 36 2711-100 57 44101 and more 38 29
SectorIndustry 70 53Retail/service 61 47
Total 131 100
Main Constraints
Table 6-6 shows the perceptions of the enterprises surveyed regarding the main constraints tooperations and growth in order of importance. In the following paragraphs, the constraints are analyzedand discussed.
Table 6-6. Main Constraints to Company Operation and GrowthRank Rank(June 1997) (November 1994). ConstraintI I High level of taxes2 5 Access to finance3 2 Cost of finance4 6 Weak demand5 4 Inflation or price instability6 3 Government regulation7 7 Judicial system8 8 Political or policy uncertainty9 10 Technology and production10 9 Lack of qualified labor
According to both surveys, the high level of taxes was by far the main constraint to operationsand growth. However, as can be deduced from the part of the survey that deals specifically withgovernment-related action and regulation, the problem is really taxation in a broader sense. Taxregulation and tax administration are considered almost as problematic as the level of the taxes. Duringdirect interviews with Lithuanian businessmen, it became clear that contradictions and frequent changesin taxation rules and regulations, and arbitrariness and unpredictability in interpretation and
202

PSD Environment: Taking Stock
implementation, are more bothersome than the level of taxes, which are not high by internationalstandards. (The taxation issue, particularly tax administration, is the subject of a separate Policy Note.)
Access to finance and the cost of finance ranked second and third, respectively, among theconstraints to private sector development in the 1997 survey. The problem of the cost of finance does notseem to have decreased much in importance since the previous survey, despite the considerable decreasein interest rates since 1994. At the same time, the problem of access to finance seems to have worsenedsince 1994, when it ranked much lower on the list of problems. It should also be noted (see table 6-7)that large companies seemed to have more problems with finance than small and medium-sizeenterprises (SMEs). It may be that SMEs have accepted that external financing is more or less out ofreach for the time being. It probably also indicates that larger enterprises, particularly those endeavoringto increase exports, feel a mounting need to modernize their production facilities. (The Policy Note onthe Lithuanian banking sector deals with impediments to increasing credit availability from banks.)
Table 6-7. Main Constraints by Size and Sector of Enterprises, June 1997Overall Size of company Sector
Constraint score Small Medium Large Industry CommerceHigh level of taxes 4.38 4.42 4.28 4.50 4.36 4.41Access to finance 3.58 3.27 3.56 3.91 3.37 3.88Cost of finance 3.55 2.96 3.64 3.86 3.48 3.64Weak demand 3.54 3.39 3.38 3.93 3.67 3.38Inflation or price instability 3.42 3.60 3.08 3.80 3.30 3.55Regulation 3.30 3.16 3.25 3.47 3.13 3.51Functioning of judicial system 3.00 2.85 2.92 3.24 3.00 3.00Political or policy uncertainty 2.53 2.72 2.42 2.57 2.48 2.60Technology and production 2.48 2.21 2.49 2.68 2.68 2.20Lackofqualifiedlabor 2.30 2.40 2.38 2.10 2.31 2.30Accesstoservices 2.26 2.09 2.27 2.38 2.38 2.10Procuring inputs 1.91 1.74 1.93 2.00 2.00 1.78Infrastructure problems 1.72 1.63 1.83 1.62 1.68 1.76
Note: On a scale from I to 5. 1 = no constraint and 5 = severe constraint.
Fourth on the list of constraints in 1997 was weak demand. It was considered almost as seriousas the finance constraints and has become more serious than in 1994, when it ranked only sixth on thelist. The problem is partly a reflection of the continued low domestic purchasing power and increasingcompetition from imports. Exports, which still make up a relatively small part of total sales, also pose aproblem for most Lithuanian enterprises. Among the surveyed enterprises, exports accounted for anaverage of 24 percent of the sales of large enterprises, 16 percent of the sales of medium-size firms, and14 percent of the sales of small enterprises. The share of exports has actually been decreasing for smalland medium-size enterprises over the last year. The notion of weak demand is likely to be linked to a lowlevel of competitiveness; weak marketing skills; and, above all, weak management. (Mechanisms toimprove management performance are discussed in the Policy Note on corporate governance.)
Inflation and price instability are considered a relatively serious problem, although less so thanthe problems mentioned above. It was considered less severe in 1997 than in 1994, which, of course, is aresult of the considerable reduction in inflation over this period. Inflation, however, has still beenconsiderably higher than in Lithuania's trading partners in the West. Combined with the nominalexchange rate fixed by the Currency Board, this has led to a real effective appreciation of the lita againstthe currencies of those countries. Anxiety in regard to the fate of the lita after the abandonment of theCurrency Board is also possibly embedded in the concerns regarding inflation and price stability.
203

PSD Environment: Taking Stock
Government regulation (and bureaucracy in general) is still considered a problem, although thesituation has improved, judging from the lesser worries of entrepreneurs about these matters in 1997compared with 1994. Taxation issues, however, loom far above other worries about governmentinterference, as discussed below.
The judicial system is seventh on the list, and the last of the constraints that can be classified as"serious" according to the 1997 survey. Its relatively low ranking, however, conceals a general lack ofconfidence in the judicial system; the disillusion of those who have tried to use the system; and,ultimately, the resignation of those who assume the courts away. Of the enterprises surveyed, one-third-the majority of them large enterprises-had gone to court an average of just over four times to getjustice in the last three years. Of those who won their cases, less than 60 percent managed to get theirjudgments enforced. And of those who went to court, only about half said they were likely to go to courta second time. It is interesting to note that for every case solved in court, approximately one case wassolved before going to court. (The judicial system is the subject of a separate Policy Note.)
Government Regulation
The survey also attempted to determine the areas of government regulation (and which agencies ofgovernment) caused the greatest problems in the activities of enterprises. As shown in table 6-8, taxation(the level of taxes, tax regulation, and tax administration) clearly caused the most trouble. Taxadministration has become much more troublesome in 1997 than it was in 1994. Labor regulations,ownership rights, licensing requirements, import regulation, and customs procedures were next in line inthe 1997 survey, but the difficulties in these areas were considered only moderate. In particular, importregulation and customs procedures were considered much less of a problem in 1997 than they were threeyears ago. Export regulation, price controls, and restrictions relating to labor were not consideredproblems in 1997 or 1994.
Table 6-8. Government Regulation-Related ConstraintsConstraint 1997 1994 Change1. High level of taxes 4.30 4.60 (0.30)2. Tax-related regulations 4.25 4.35 (0.10)3. Tax administration/collection 3.64 3.17 0.474. Government labor regulations 2.59 1.89 0.705. Annual licensing requirements 2.20 2.09 0.116. Regulations on land ownership, sale, or mortgage 2.20 2.53 (0.33)7. Import regulations/customs procedures for imports 2.11 2.94 (0.83)8. Regulations on changes in ownership and capital of my firm 2.09 2.17 (0.08)9. Regulations on foreign investment 1.90 2.08 (0.18)10. Export regulations 1.84 2.08 (0.24)1 1. Price controls of inputs 1.74 1.48 0.2612. Labor union restrictions 1.33 1.14 0.19
Note: On a scale from I to 5, 1 = no constraint and 5 = severe constraint.
Predictably, the Ministry of Finance, which is responsible for taxation, is considered to be themost problematic agency of government. It is perhaps surprising that the government in general andSeimas are next on the list of troublesome "agencies." Enterprises seem to have little difficulty withlabor inspection, the Social Insurance Agency (SODRA), and local governments (table 6-9).
204
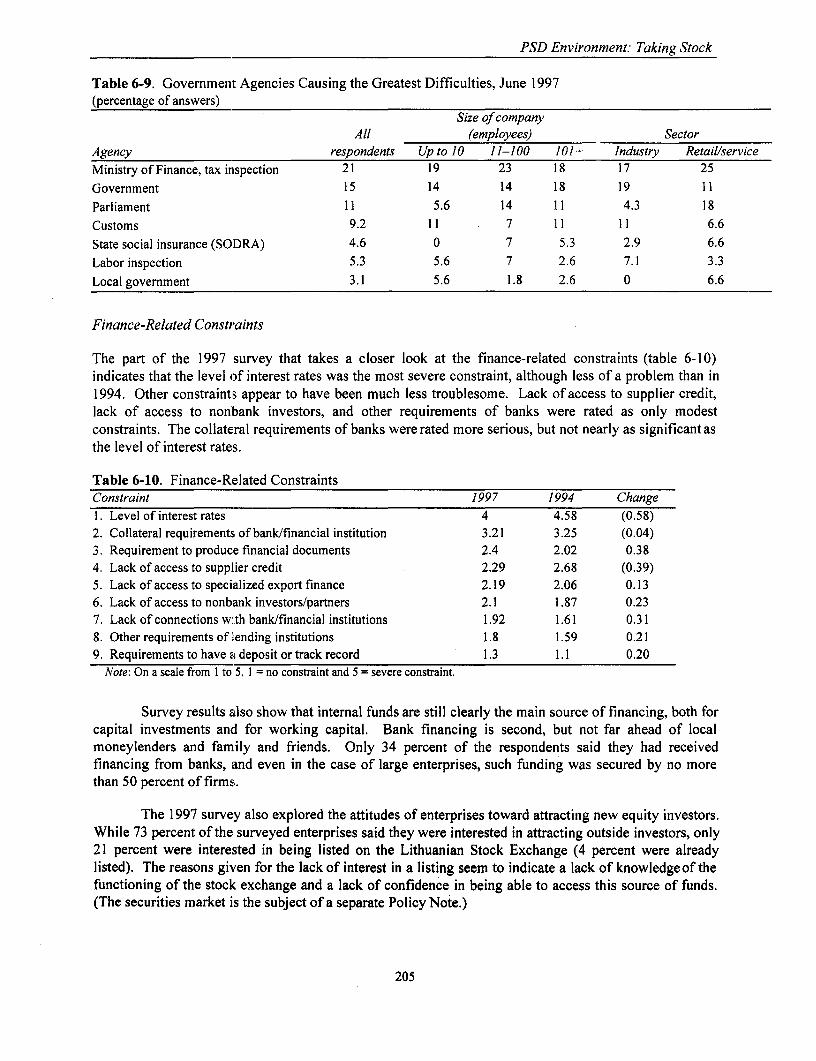
PSD Environment. Taking Stock
Table 6-9. Government Agencies Causing the Greatest Difficulties, June 1997(percentage of answers)
Size o companyAll (employees) Sector
Agency respondents Up to 10 11-100 101+ Industry Retail/serviceMinistry of Finance, tax inspection 21 19 23 18 17 25Government 15 14 14 18 19 11Parliament 11 5.6 14 11 4.3 18Customs 9.2 11 7 11 11 6.6State social insurance (SODRA) 4.6 0 7 5.3 2.9 6.6Labor inspection 5.3 5.6 7 2.6 7.1 3.3Local government 3.1 5.6 1.8 2.6 0 6.6
Finance-Related Constraints
The part of the 1997 survey that takes a closer look at the finance-related constraints (table 6-10)indicates that the level of interest rates was the most severe constraint, although less of a problem than in1994. Other constraints appear to have been much less troublesome. Lack of access to supplier credit,lack of access to nonlbank investors, and other requirements of banks were rated as only modestconstraints. The collateral requirements of banks were rated more serious, but not nearly as significant asthe level of interest rates.
Table 6-10. Finance-Related ConstraintsConstraint 1997 1994 ChangeI. Level of interest rates 4 4.58 (0.58)2. Collateral requirements of bank/financial institution 3.21 3.25 (0.04)3. Requirement to produce financial documents 2.4 2.02 0.384. Lack of access to supplier credit 2.29 2.68 (0.39)5. Lack of access to specialized export finance 2.19 2.06 0.136. Lack of access to nonbank investors/partners 2.1 1.87 0.237. Lack of connections with bank/financial institutions 1.92 1.61 0.318. Other requirements of liending institutions 1.8 1.59 0.219. Requirements to have a deposit or track record 1.3 1.1 0.20
Note: On a scale from I to 5, 1 = no constraint and 5 = severe constraint.
Survey results also show that internal funds are still clearly the main source of financing, both forcapital investments and for working capital. Bank financing is second, but not far ahead of localmoneylenders and family and friends. Only 34 percent of the respondents said they had receivedfinancing from banks, and even in the case of large enterprises, such funding was secured by no morethan 50 percent of firms.
The 1997 survey also explored the attitudes of enterprises toward attracting new equity investors.While 73 percent of the surveyed enterprises said they were interested in attracting outside investors, only21 percent were interested in being listed on the Lithuanian Stock Exchange (4 percent were alreadylisted). The reasons given for the lack of interest in a listing seem to indicate a lack of knowledge of thefunctioning of the stock; exchange and a lack of confidence in being able to access this source of funds.(The securities market is the subject of a separate Policy Note.)
205
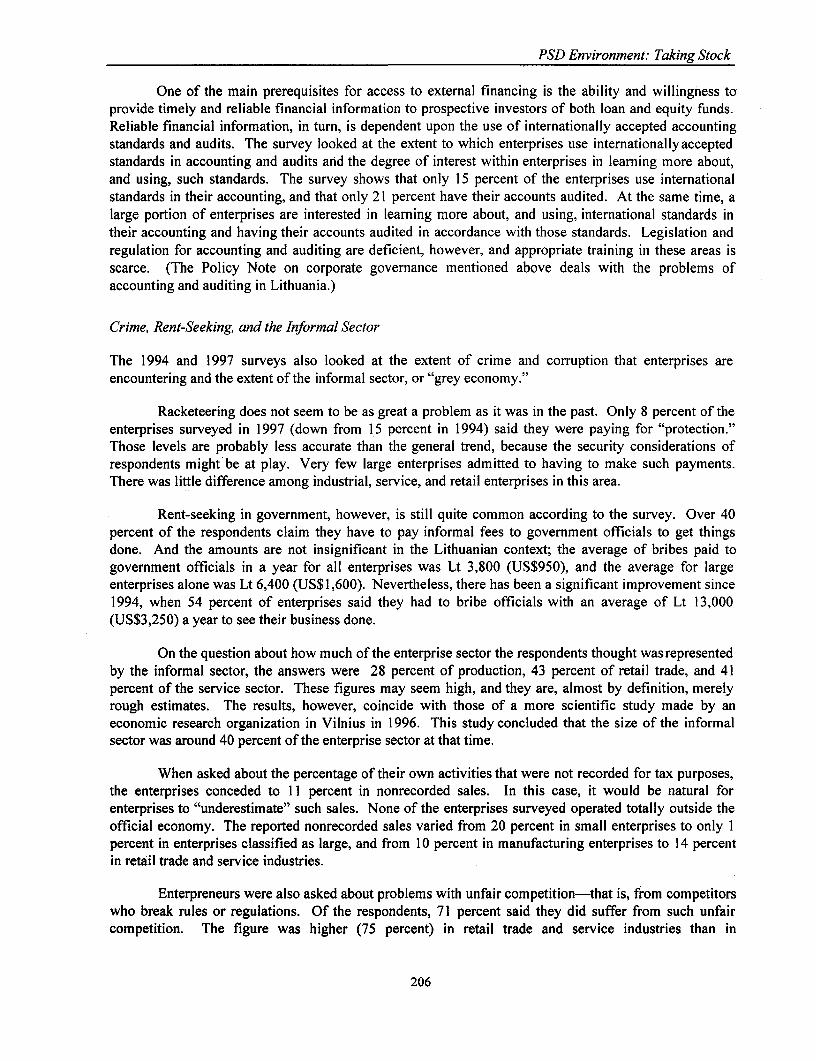
PSD Environment: Taking Stock
One of the main prerequisites for access to external financing is the ability and willingness toprovide timely and reliable financial information to prospective investors of both loan and equity funds.Reliable financial information, in turn, is dependent upon the use of internationally accepted accountingstandards and audits. The survey looked at the extent to which enterprises use internationallyacceptedstandards in accounting and audits and the degree of interest within enterprises in learning more about,and using, such standards. The survey shows that only 15 percent of the enterprises use internationalstandards in their accounting, and that only 21 percent have their accounts audited. At the same time, alarge portion of enterprises are interested in learning more about, and using, international standards intheir accounting and having their accounts audited in accordance with those standards. Legislation andregulation for accounting and auditing are deficient, however, and appropriate training in these areas isscarce. (The Policy Note on corporate governance mentioned above deals with the problems ofaccounting and auditing in Lithuania.)
Crime, Rent-Seeking, and the Informal Sector
The 1994 and 1997 surveys also looked at the extent of crime and corruption that enterprises areencountering and the extent of the informal sector, or "grey economy."
Racketeering does not seem to be as great a problem as it was in the past. Only 8 percent of theenterprises surveyed in 1997 (down from 15 percent in 1994) said they were paying for "protection."Those levels are probably less accurate than the general trend, because the security considerations ofrespondents might be at play. Very few large enterprises admitted to having to make such payments.There was little difference among industrial, service, and retail enterprises in this area.
Rent-seeking in government, however, is still quite common according to the survey. Over 40percent of the respondents claim they have to pay informal fees to government officials to get thingsdone. And the amounts are not insignificant in the Lithuanian context; the average of bribes paid togovernment officials in a year for all enterprises was Lt 3,800 (US$950), and the average for largeenterprises alone was Lt 6,400 (US$1,600). Nevertheless, there has been a significant improvement since1994, when 54 percent of enterprises said they had to bribe officials with an average of Lt 13,000(US$3,250) a year to see their business done.
On the question about how much of the enterprise sector the respondents thought wasrepresentedby the informal sector, the answers were 28 percent of production, 43 percent of retail trade, and 41percent of the service sector. These figures may seem high, and they are, almost by definition, merelyrough estimates. The results, however, coincide with those of a more scientific study made by aneconomic research organization in Vilnius in 1996. This study concluded that the size of the informalsector was around 40 percent of the enterprise sector at that time.
When asked about the percentage of their own activities that were not recorded for tax purposes,the enterprises conceded to 1I percent in nonrecorded sales. In this case, it would be natural forenterprises to "underestimate" such sales. None of the enterprises surveyed operated totally outside theofficial economy. The reported nonrecorded sales varied from 20 percent in small enterprises to only Ipercent in enterprises classified as large, and from 10 percent in manufacturing enterprises to 14 percentin retail trade and service industries.
Enterpreneurs were also asked about problems with unfair competition-that is, from competitorswho break rules or regulations. Of the respondents, 71 percent said they did suffer from such unfaircompetition. The figure was higher (75 percent) in retail trade and service industries than in
206

PSD Environment: Taking Stock
manufacturing industry (67 percent), and, surprisingly, the percentage rose with the size of the enterprise.Most problems were caused by competitors not paying social security taxes, followed by avoidance ofpayment of VAT and other taxes; avoidance of import duties; violations of health and safety regulations;and violations of copyright, patent, or trademark laws. All of these problems seem to have increasedbetween 1994 and 1997 (see table 6-1 1).
Table 6-11. Problems Related to Unfair or Illegal Practices of Competitors, June 1997Size of company
(employees) SectorAll
Practice respondents Up to 10 11-100 101+ Industry Retail/service1. They avoid sales tax ancl other taxes 3.99 3.95 4.13 3.83 3.90 4.09
2. They do not pay duties or observe traderegulations 3.60 3.55 3.67 3.53 3.52 36.8
3. They sell imports below internationalprices 3.63 3.95 3.64 3.40 3.77 3.48
4. They unfairly sell below my prices 4.04 3.86 4.05 4:17 4.09 4.00
5. They avoid labor taxes/regulations (e.g.,social security) 4.11 3.90 4.17 4.17 4.16 40.5
6. They violate copyright, patent, ortrademark laws 2.90 3.21 3.14 2.40 3.00 2.78
7. They collude to limit my access to credit,supplies, land, equipment, or customers 2.90 3.21 2.76 2.87 2.93 2.85
8. They don't obev health amd safetyregulations 3.34 3.11 3.33 3.50 3.25 3.45
Constraints to PSD in Lithuania: The Perceptions of Foreign Investors3
Foreign Investment in Lithuania
The flow of foreign direct investment (FDI) into Lithuania has been relatively insignificant thus far, and ithas been much less (on a per capita basis) than foreign investment in its Baltic neighbors and in mostother east European countries, but it picked up significantly in 1997. The total amount of FDI through1996 was Lt 2.3 billion (US$580 million), and it is estimated to have exceeded US$1 billion in 1997. Thelargest investors in Lithuania (as of I October 1997) were the United States (25 percent of total FDI),Sweden (11), Germany (10.5), the United Kingdom (7), Luxembourg (5.4), and Finland (5.3). Figures 6-I and 6-2 show the cumulative foreign investment flow to Lithuania from 1991 to 1997, as well as thetotal investments by country for the period 1991-96.4
Overall Assessment of the FDI Environment
According to the previously mentioned 1994 survey, the three main factors that attracted foreigninvestment in Lithuania were found to be (i) the proximity to both European and FSU markets, (ii) askilled labor force, (iii) successful macrostabilization, and (iv) relatively rapid privatization. A survey
3. The source for this section is "Country Information 97.2," by the Lithuanian Investment Agency.
4. The ranking differs to some extent from the one above, because the graph is based on data as of the end of 1996.
207
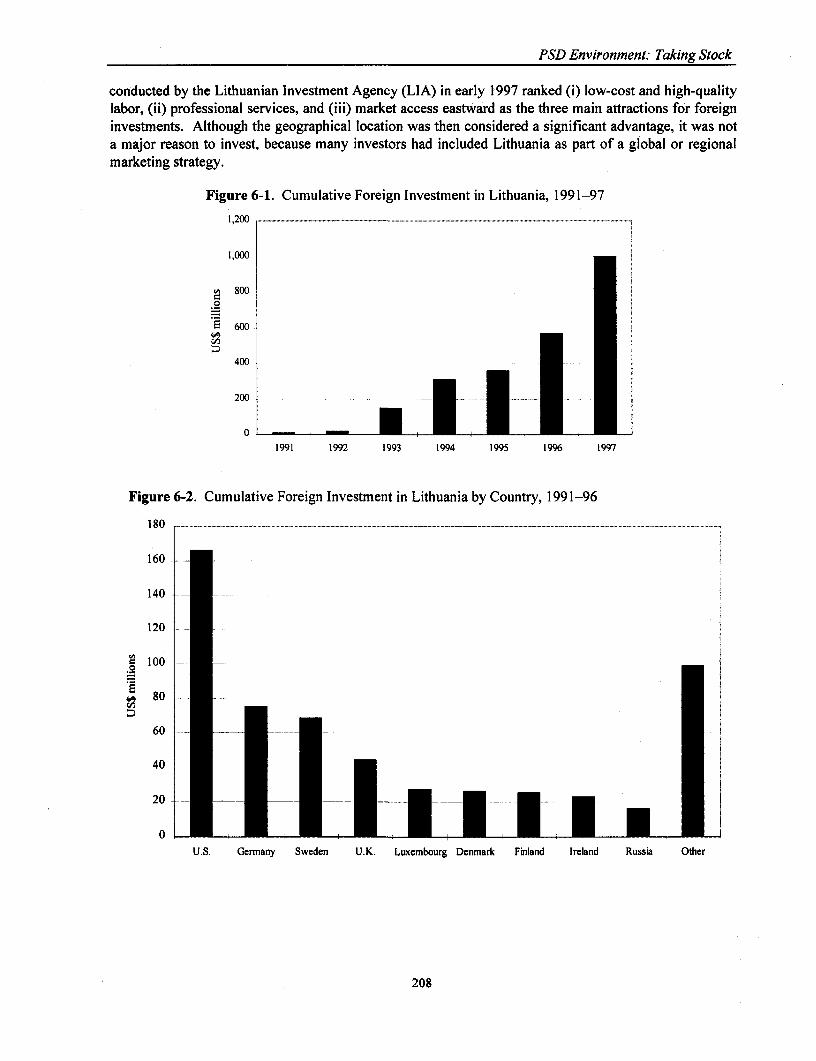
PSD Environment: Taking Stock
conducted by the Lithuanian Investment Agency (LIA) in early 1997 ranked (i) low-cost and high-qualitylabor, (ii) professional services, and (iii) market access eastward as the three main attractions for foreigninvestments. Although the geographical location was then considered a significant advantage, it was nota major reason to invest, because many investors had included Lithuania as part of a global or regionalmarketing strategy.
Figure 6-1. Cumulative Foreign Investment in Lithuania, 1991-97
1,200
1,000
3 800
600~600
400
200
0
1991 1992 1993 1994 1995 1996 1997
Figure 6-2. Cumulative Foreign Investment in Lithuania by Country, 1991-96
180 - - -.. . ............. ............................................. ,.,......,..,.,.,..............................
160-
140 _
120 -
100 -. -
80..
60 - - -.--- -
40 S U L D F I
20 ..-- -. - - . ~ .0
0U.S. Germany Sweden U.K. Luxembourg Denmark Finland Ireland Russia Other
208

PSD Environment: Taking Stock
Also in the LIA survey, 83 percent of the respondents expressed interest in investing more inLithuania. The survey also ranked east European and FSU countries by the attractiveness of theirinvestment climate. Table 6-12 shows that Lithuania ranked in the middle of the group, considerablybelow Estonia and also below Latvia.
Table 6-12. Investment Climate in Central and Eastern EuropeCountry Score
1. Czech Republic 1.902. Estonia 2.223. Hungary 2.294. Poland 2.435. Slovakia 2.666. Latvia 2.777. Slovenia 3.008. Lithuania 3.109. Ukraine 3.1410. Russia 3.3811. Rumania 3.6312. Bulgaria 4.0413. Bellarus 4.54
Note: On a scale of I to 5, 1 = most favorable and 5 = least favorable.
A separate survey made by the European Bank for Reconstruction and Development (EBRD) thatpolled foreign investors regarding the investment climate in the three Baltic capitals ranks Tallin andRiga ahead of Vilnius. The respective advantages of the three cities identified in the survey are listed intable 6-13.
Table 6-13. Baltic Cities' Advantages for FDITallin Riga Vilnius
. Openness * Largest market * Relations with Russia* Economic stability * Better growth prospects as a "Eurocity" * Ethnic stability* Speed of economic development * Availability of business partners * Lowest labor costs* Low costs * Closeness to Russia * Lowest manufacturing costs* Linguistic skills* Proximity to Nordic countries* Knowledge of the West
Main Constraints to Foreign Investment
In the 1994 survey, the foreign investors interviewed uniformly perceived three main constraints toforeign investment: (i) a generally negative attitude toward FDI and pervasive FDI discrimination(mentioned by 80 percent of firms interviewed); (ii) frequently changing and often vague andnontransparent legislation, a problem exacerbated by red tape and corruption; and (iii) slower overallprogress with market reforms and liberalization and key institutional reforms comparedwith neighborsand other FDI competitors.
Fortunately, in LIA's 1997 survey, negative attitudes toward discrimination against FDI were notraised as major constraints by the foreign investors interviewed. The major obstacles were identified as
209
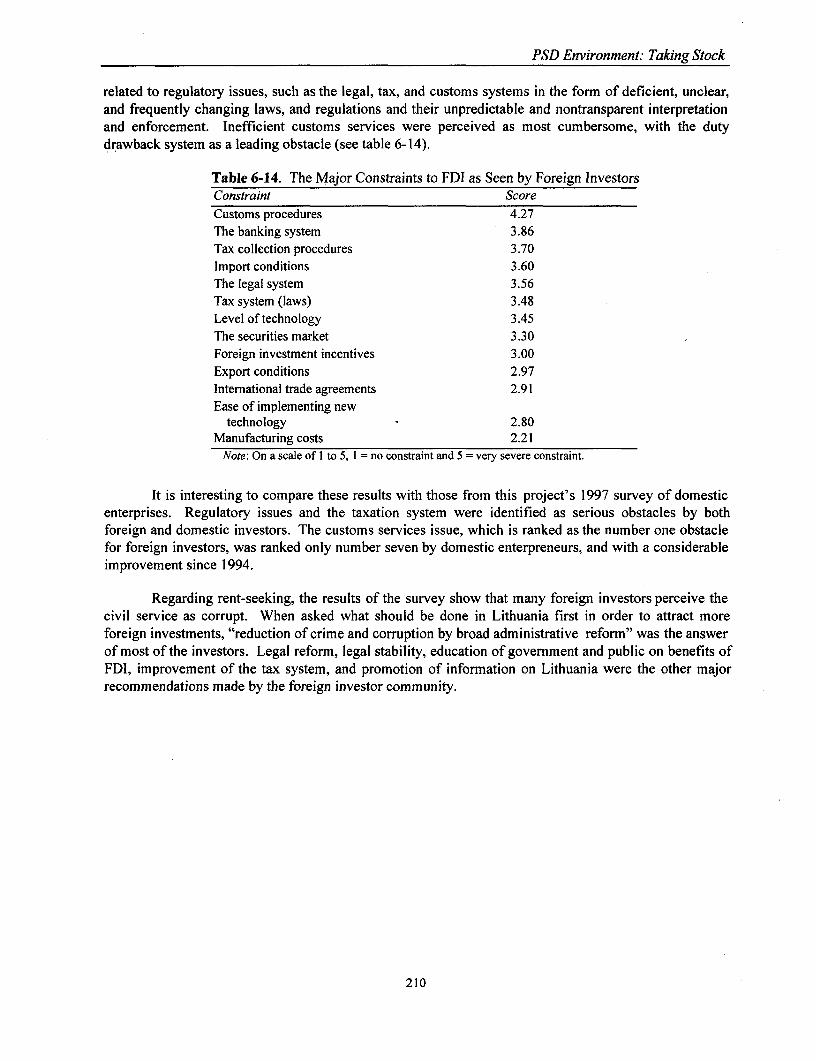
PSD Environment: Taking Stock
related to regulatory issues, such as the legal, tax, and customs systems in the forn of deficient, unclear,and frequently changing laws, and regulations and their unpredictable and nontransparent interpretationand enforcement. Inefficient customs services were perceived as most cumbersome, with the dutydrawback system as a leading obstacle (see table 6-14).
Table 6-14. The Major Constraints to FDI as Seen by Foreign InvestorsConstraint ScoreCustoms procedures 4.27The banking system 3.86Tax collection procedures 3.70Import conditions 3.60The legal system 3.56Tax system (laws) 3.48Level of technology 3.45The securities market 3.30Foreign investment incentives 3.00Export conditions 2.97International trade agreements 2.91Ease of implementing new
technology 2.80Manufacturing costs 2.21Note: On a scale of I to 5, 1 = no constraint and 5 = very severe constraint.
It is interesting to compare these results with those from this project's 1997 survey of domesticenterprises. Regulatory issues and the taxation system were identified as serious obstacles by bothforeign and domestic investors. The customs services issue, which is ranked as the number one obstaclefor foreign investors, was ranked only number seven by domestic enterpreneurs, and with a considerableimprovement since 1994.
Regarding rent-seeking, the results of the survey show that many foreign investors perceive thecivil service as corrupt. When asked what should be done in Lithuania first in order to attract moreforeign investments, "reduction of crime and corruption by broad administrative reform" was the answerof most of the investors. Legal reform, legal stability, education of government and public on benefits ofFDI, improvement of the tax system, and promotion of information on Lithuania were the other majorrecommendations made by the foreign investor community.
210
7PSD ENVIRONMENT: TAX ADMINISTRATION
Although the focus of this chapter is tax administration, its problems cannot be separated from thosearising from the tax law. Over the past few years, the Lithuanian government has demonstated arecognition that taxpayers in general, and foreign investors in particular, prefer certainty, stability, andimpartiality to tax incentives, as evidenced by the phasing out of tax holidays and the broadening of theVAT tax base. This pattern follows the practice of both OECD countries and a number of easternEuropean countries that have made efforts to increase the simplicity and neutrality of their tax systems bywithdrawing tax concessions to selected groups of taxpayers. Such concessions inevitably createborderline cases, inhibit the administration and consistent interpretation of the tax system, and areconsidered unfair by the taxpayers who are not entitled to such concessions.
Many of the difficulties in administering individual and corporate income taxes in Lithuaniafollow from the past proliferation of special rates for selected groups or activities that were designed toconfer preferential treatment. For example, farmers, small traders, recipients of dividend income andcapital gains, and enterprises reinvesting their profits all receive special treatment. In addition, theabsence of clear criteria make it difficult to interpret the law on such questions as what constitutes alegitimate deduction from taxable profits. The widening of the individual and corporate income tax basethat has occurred in virtually all OECD countries and a number of others has enabled income tax rates tobe lowered considerably without loss of revenue, but this has not yet taken place in Lithuania, where theerosion of the individual and corporate income tax base has led to administrative complexity, distortionsof economic decisions, and low tax compliance.
This chapter, apart from a summary of the Lithuanian tax system and its comparison with thesystems of other countries, is confined to suggesting possible improvements in the administration ofbusiness taxes.' Broadly speaking, these suggestions take two forms: the first is the implementation ofmeasures that will lead to greater compliance and cooperation by taxpayers; the second is to improve theefficiency of the tax inspectorate and its revenue collection techniques.
The Lithuanian Tax System and Tax Administration
Tax Structures
As in virtually all countries, over 95 percent of total tax revenues in Lithuania are derived from the taxes
1. In Lithuania, business taxes also comprise VAT and excise taxes. Although designed to fall on consumers, thesetaxes are collected by businesses.
211
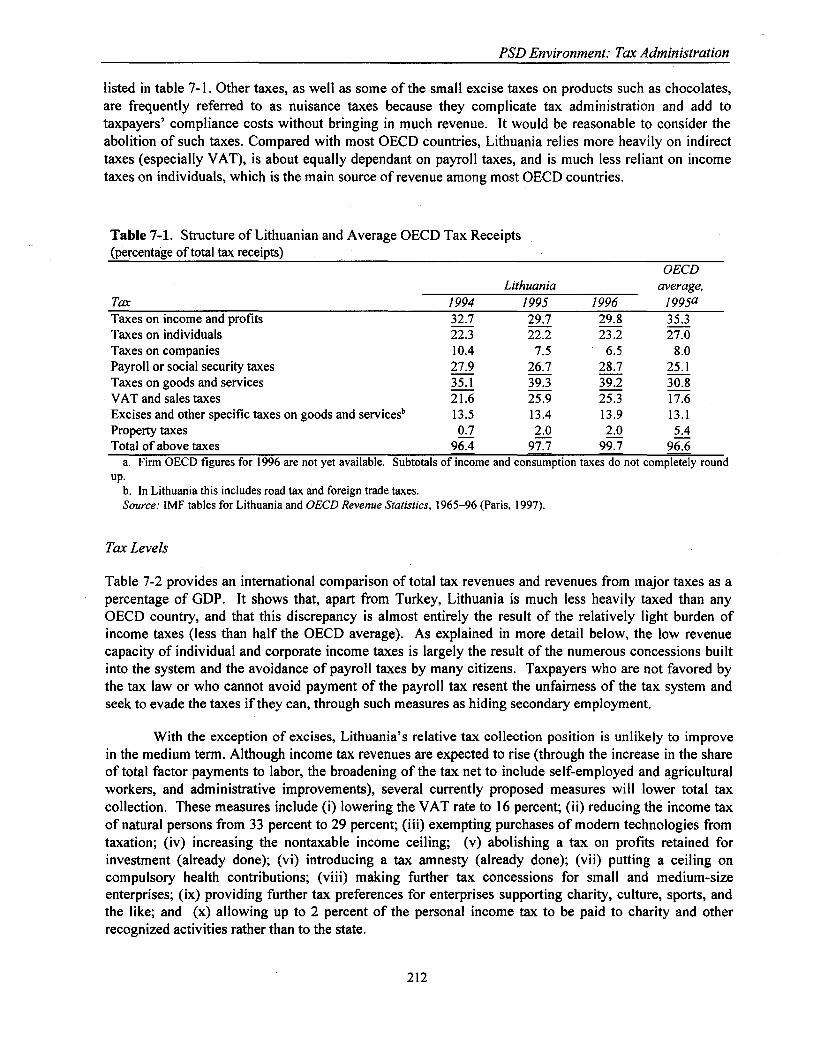
PSD Environment: Tax Administration
listed in table 7-1. Other taxes, as well as some of the small excise taxes on products such as chocolates,are frequently referred to as nuisance taxes because they complicate tax administration and add totaxpayers' compliance costs without bringing in much revenue. It would be reasonable to consider theabolition of such taxes. Compared with most OECD countries, Lithuania relies more heavily on indirecttaxes (especially VAT), is about equally dependant on payroll taxes, and is much less reliant on incometaxes on individuals, which is the main source of revenue among most OECD countries.
Table 7-1. Structure of Lithuanian and Average OECD Tax Receipts(percentage of total tax receipts)
OECDLithuania average,
Tax 1994 1995 1996 1995aTaxes on income and profits 32.7 29.7 29.8 35.3Taxes on individuals 22.3 22.2 23.2 27.0Taxes on companies 10.4 7.5 6.5 8.0Payroll or social security taxes 27.9 26.7 28.7 25.1Taxes on goods and services 35.1 39.3 39.2 30.8VAT and sales taxes 21.6 25.9 25.3 17.6Excises and other specific taxes on goods and servicesb 13.5 13.4 13.9 13.1Property taxes 0.7 2.0 2.0 5.4Total of above taxes 96.4 97.7 99.7 96.6
a. Firm OECD figures for 1996 are not yet available. Subtotals of income and consumption taxes do not completely roundup.
b. In Lithuania this includes road tax and foreign trade taxes.Source: IMF tables for Lithuania and OECD Revenue Statistics, 1965-96 (Paris, 1997).
Tax Levels
Table 7-2 provides an international comparison of total tax revenues and revenues from major taxes as apercentage of GDP. It shows that, apart from Turkey, Lithuania is much less heavily taxed than anyOECD country, and that this discrepancy is almost entirely the result of the relatively light burden ofincome taxes (less than half the OECD average). As explained in more detail below, the low revenuecapacity of individual and corporate income taxes is largely the result of the numerous concessions builtinto the system and the avoidance of payroll taxes by many citizens. Taxpayers who are not favored bythe tax law or who cannot avoid payment of the payroll tax resent the unfairness of the tax system andseek to evade the taxes if they can, through such measures as hiding secondary employment.
With the exception of excises, Lithuania's relative tax collection position is unlikely to improvein the medium term. Although income tax revenues are expected to rise (through the increase in the shareof total factor payments to labor, the broadening of the tax net to include self-employed and agriculturalworkers, and administrative improvements), several currently proposed measures will lower total taxcollection. These measures include (i) lowering the VAT rate to 16 percent; (ii) reducing the income taxof natural persons from 33 percent to 29 percent; (iii) exempting purchases of modem technologies fromtaxation; (iv) increasing the nontaxable income ceiling; (v) abolishing a tax on profits retained forinvestment (already done); (vi) introducing a tax amnesty (already done); (vii) putting a ceiling oncompulsory health contributions; (viii) making further tax concessions for small and medium-sizeenterprises; (ix) providing further tax preferences for enterprises supporting charity, culture, sports, andthe like; and (x) allowing up to 2 percent of the personal income tax to be paid to charity and otherrecognized activities rather than to the state.
212
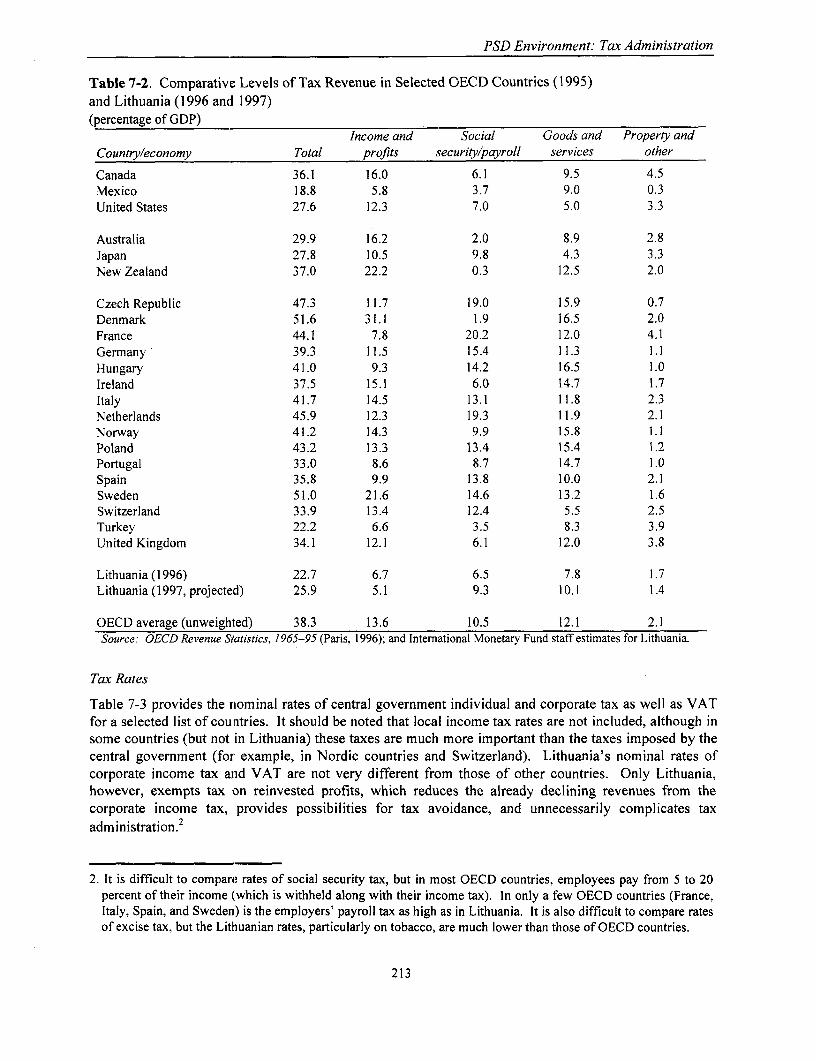
PSD Environment: Tax Administration
Table 7-2. Comparative Levels of Tax Revenue in Selected OECD Countries (1995)and Lithuania (1996 and 1997)(percentage of GDP)
Income and Social Goods and Property andCountry/economy Total profits security/payroll services other
Canada 36.1 16.0 6.1 9.5 4.5Mexico 18.8 5.8 3.7 9.0 0.3United States 27.6 12.3 7.0 5.0 3.3
Australia 29.9 16.2 2.0 8.9 2.8Japan 27.8 10.5 9.8 4.3 3.3New Zealand 37.0 22.2 0.3 12.5 2.0
Czech Republic 47.3 11.7 19.0 15.9 0.7Denmark 51.6 31.1 1.9 16.5 2.0France 44.1 7.8 20.2 12.0 4.1Germany 39.3 11.5 15.4 11.3 1.1Hungary 41.0 9.3 14.2 16.5 1.0Ireland 37.5 15.1 6.0 14.7 1.7Italy 41.7 14.5 13.1 11.8 2.3Netherlands 45.9 12.3 19.3 11.9 2.1Norway 41.2 14.3 9.9 15.8 1.1Poland 43.2 13.3 13.4 15.4 1.2Portugal 33.0 8.6 8.7 14.7 1.0Spain 35.8 9.9 13.8 10.0 2.1Sweden 51.0 21.6 14.6 13.2 1.6Switzerland 33.9 13.4 12.4 5.5 2.5Turkey 22.2 6.6 3.5 8.3 3.9United Kingdom 34.1 12.1 6.1 12.0 3.8
L ithuania (1996) 22.7 6.7 6.5 7.8 1.7Lithuania (1997, projected) 25.9 5.1 9.3 10.1 1.4
OECD average (unweighted) 38.3 13.6 10.5 12.1 2.1Source: OECD Revenue Statistics, 1965-95 (Paris, 1996); and International Monetary Fund staff estimates for Lithuania.
Tax Rates
Table 7-3 provides the nominal rates of central government individual and corporate tax as well as VATfor a selected list of countries. It should be noted that local income tax rates are not included, although insome countries (but not in Lithuania) these taxes are much more important than the taxes imposed by thecentral government (for example, in Nordic countries and Switzerland). Lithuania's nominal rates ofcorporate income tax and VAT are not very different from those of other countries. Only Lithuania,however, exempts tax on reinvested profits, which reduces the already declining revenues from thecorporate income tax, provides possibilities for tax avoidance, and unnecessarily complicates taxadministration.2
2. It is difficult to compare rates of social security tax, but in most OECD countries, employees pay from 5 to 20percent of their income (which is withheld along with their income tax). In only a few OECD countries (France,Italy, Spain, and Sweden) is the employers' payroll tax as high as in Lithuania. It is also difficult to compare ratesof excise tax, but the Lithuanian rates, particularly on tobacco, are much lower than those of OECD countries.
213
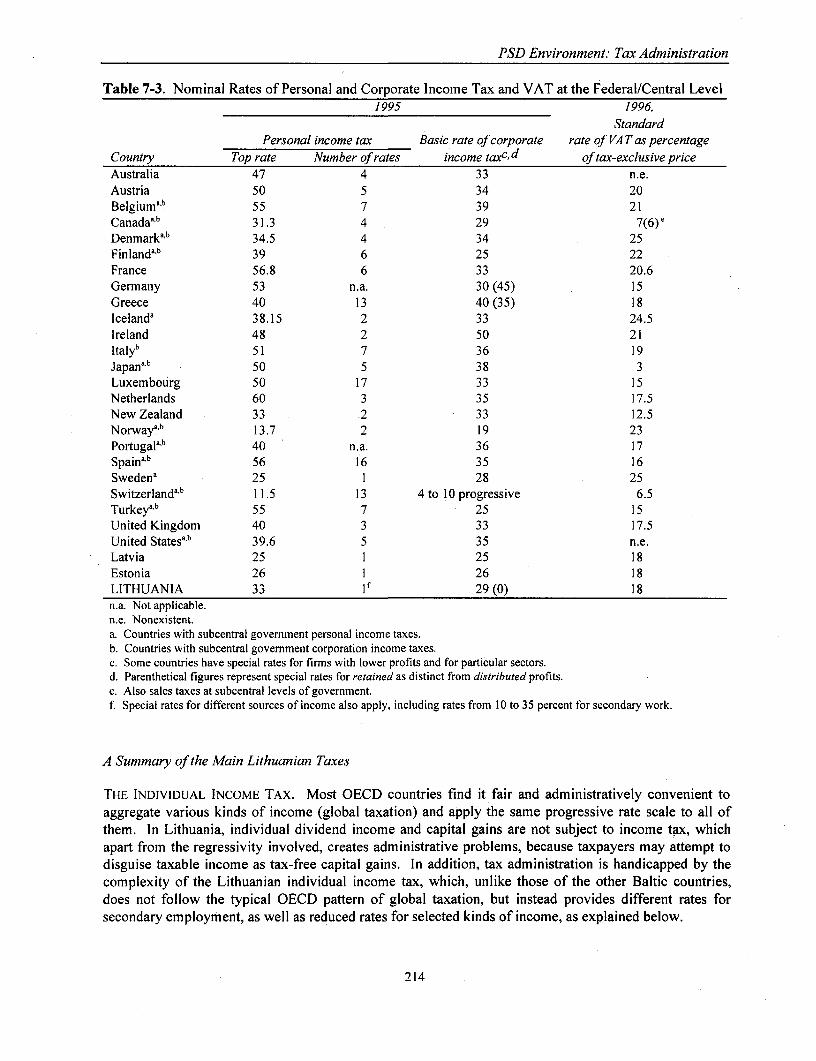
PSD Environment: Tax Administration
Table 7-3. Nominal Rates of Personal and Corporate Income Tax and VAT at the Federal/Central Level1995 1996,
StandardPersonal income tax Basic rate of corporate rate of VA T as percentage
Country Top rate Number of rates income taxc,d of tax-exclusive priceAustralia 47 4 33 n.e.Austria 50 5 34 20Belgiuma`b 55 7 39 21Canadaab 31.3 4 29 7(6)Denmarkab 34.5 4 34 25Finland"b 39 6 25 22France 56.8 6 33 20.6Germany 53 n.a. 30 (45) 15Greece 40 13 40 (35) 18Icelanda 38.15 2 33 24.5Ireland 48 2 50 21Italyb 51 7 36 19Japanab 50 5 38 3Luxembourg 50 17 33 15Netherlands 60 3 35 17.5New Zealand 33 2 33 12.5Norway"b 13.7 2 19 23Portugalab 40 n.a. 36 17Spainab 56 16 35 16Swedena 25 1 28 25Switzerlanda,b 11.5 13 4 to 10 progressive 6.5Turkeyab 55 7 25 15United Kingdom 40 3 33 17.5United States,b 39.6 5 35 n.e.Latvia 25 1 25 18Estonia 26 1 26 18LITHUANIA 33 if 29 (0) 18n.a. Not applicable.n.e. Nonexistent.a. Countries with subcentral government personal income taxes.b. Countries with subcentral government corporation income taxes.c. Some countries have special rates for firms with lower profits and for particular sectors.d. Parenthetical figures represent special rates for retained as distinct from distributed profits.e. Also sales taxes at subcentral levels of government.f Special rates for different sources of income also apply, including rates from 10 to 35 percent for secondary work.
A Summary of the Main Lithuanian Taxes
THE INDIVIDUAL INCOME TAX. Most OECD countries find it fair and administratively convenient toaggregate various kinds of income (global taxation) and apply the same progressive rate scale to all ofthem. In Lithuania, individual dividend income and capital gains are not subject to income tax, whichapart from the regressivity involved, creates administrative problems, because taxpayers may attempt todisguise taxable income as tax-free capital gains. In addition, tax administration is handicapped by thecomplexity of the Lithuanian individual income tax, which, unlike those of the other Baltic countries,does not follow the typical OECD pattern of global taxation, but instead provides different rates forsecondary employment, as well as reduced rates for selected kinds of income, as explained below.
214
PSD Environment. Tax Administration
Income from employment is taxed in two ways. Income from an individual's main employmentby a company, institution, or organization in Lithuania or by a branch or representative office of aLithuanian company, institution, or organization in a foreign country is taxed at a rate of 33 percent.Income from an individual's secondary employment is taxed at three different rates, ranging between 10and 35 percent (incorne less than half the basic nontaxable minimum, BNM, is taxed at 10 percent;income between half and the full BNM is taxed at 20 percent; and income over the BNM is taxed at 35percent). Personal income tax is deducted at the source by the employer. Income from an individual'semployment by a foreign company, institution, or organization is taxed at a rate of 20 percent. The BNMdoes not apply to such income. Payment of this portion of personal income tax is the responsibility of theindividual taxpayer.
Income derived from other sources is taxed as follows: (i) income from royalties is taxed at 13percent; (ii) income from the sale of mushrooms, berries, medicinal herbs, and other forestry products istaxed at 5 percent; (iii) income from the sale of property is taxed at 10 percent; and (iv) income from therental of property and income from other sources is taxed at 20 percent.
The income of partnerships and personal companies without the rights of legal persons is taxed at24 percent, which is reduced to zero on income that is reinvested.
It is difficult to see the rationale for all these distinctions, which certainly complicate taxadministration. It is particularly unclear why a distinction is made between an individual's main andsecondary employment, with a progressive schedule applying only to the latter, and why partnerships aretaxed at 24 percent while companies are taxed at 29 percent. It has already been noted that the share ofreceipts from the individual income tax is unusually low (table 7-1). This is partly the result of thenumerous concessions described above, and partly the product of evasion by the self-employed, andpartly an outcome of the government policy to move to indirect taxation on grounds of economicefficiency and ease of collection. In addition, the lack of progressivity of the individual income tax maycause resentment among taxpayers on equity grounds. Such resentment provides a strong motive fornoncompliance.
THE CORPORATE INCOME TAX. The standard rate is 29 percent, but as with the individualincome tax, there are a number of concessions that complicate the administration of the tax on enterprisesand facilitate tax avoiclance. Some of the more important concessions are: (i) agricultural enterprises aretaxed at ] 0 percent; (i i) companies in priority sectors, determined by the government, are taxed at a ratebetween 5 percent and 29 percent; (iii) manufacturing companies and organizations that employhandicapped workers qualify for a reduction in the corporate income tax of between 25 percent and 100percent, depending on the proportion of handicapped workers in their workforce; (iv) under the Law onSmall Enterprises, the corporate income tax applied to certain companies with no more than 50employees and total gross annual income of less than Lt 500,000 is reduced by 50 percent.
In addition, there is no withholding on income from dividends and interest, although a 10 percentwithholding tax is levied on payments by residents to nonresidents for marketing, consultancy, andmediation services and on the rights to use trademarks, licenses, and company names.
All enterprises can apply straight line depreciation of fixed assets for tax purposes; thedepreciation period depends on the nature of the asset. With the phasing-out of tax holidays for foreignenterprises and the planned introduction of a three-year carry-forward of losses, Lithuania is movingnearer to the practice of other countries. At the same time, Lithuania is unique in having a zero tax ratefor reinvested profits.
215
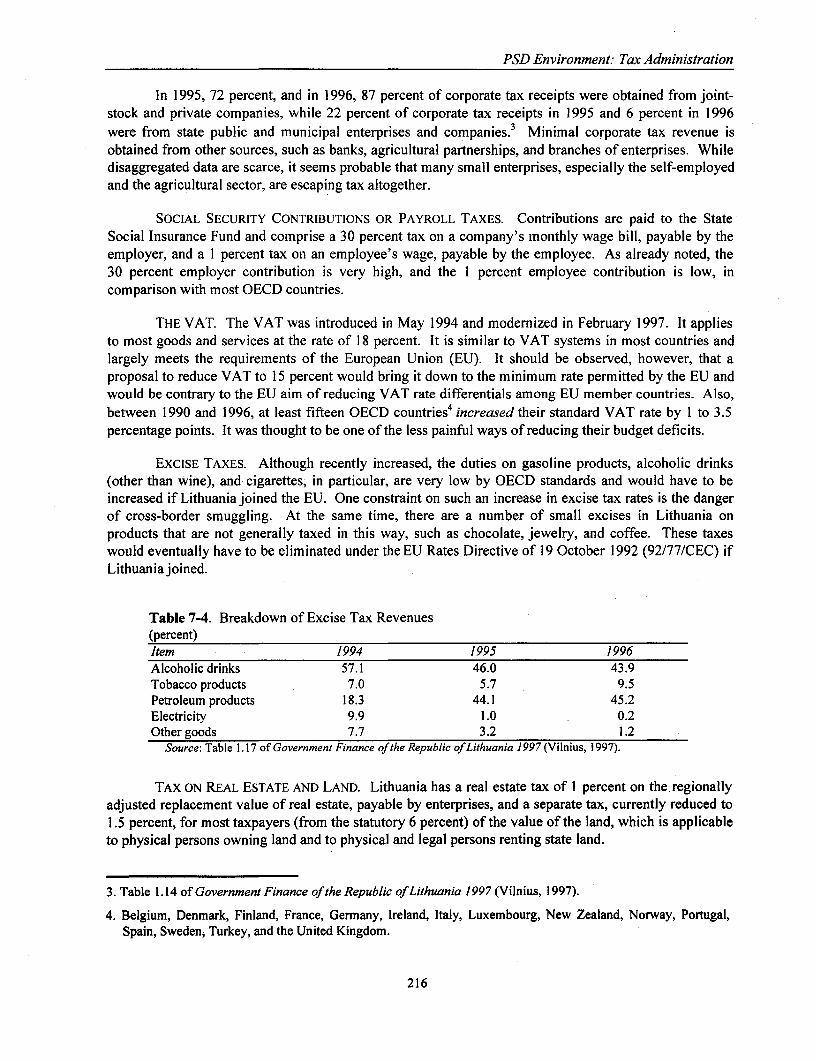
PSD Environment: Tax Administration
In 1995, 72 percent, and in 1996, 87 percent of corporate tax receipts were obtained from joint-stock and private companies, while 22 percent of corporate tax receipts in 1995 and 6 percent in 1996were from state public and municipal enterprises and companies.3 Minimal corporate tax revenue isobtained from other sources, such as banks, agricultural partnerships, and branches of enterprises. Whiledisaggregated data are scarce, it seems probable that many small enterprises, especially the self-employedand the agricultural sector, are escaping tax altogether.
SOCIAL SECURITY CONTRIBUTIONS OR PAYROLL TAXES. Contributions are paid to the State,Social Insurance Fund and comprise a 30 percent tax on a company's monthly wage bill, payable by theemployer, and a 1 percent tax on an employee's wage, payable by the employee. As already noted, the30 percent employer contribution is very high, and the 1 percent employee contribution is low, incomparison with most OECD countries.
THE VAT. The VAT was introduced in May 1994 and modernized in February 1997. It appliesto most goods and services at the rate of 18 percent. It is similar to VAT systems in most countries andlargely meets the requirements of the European Union (EU). It should be observed, however, that aproposal to reduce VAT to 15 percent would bring it down to the minimum rate permitted by the EU andwould be contrary to the EU aim of reducing VAT rate differentials among EU member countries. Also,between 1990 and 1996, at least fifteen OECD countries4 increased their standard VAT rate by I to 3.5percentage points. It was thought to be one of the less painful ways of reducing their budget deficits.
EXCISE TAXES. Although recently increased, the duties on gasoline products, alcoholic drinks(other than wine), and cigarettes, in particular, are very low by OECD standards and would have to beincreased if Lithuania joined the EU. One constraint on such an increase in excise tax rates is the dangerof cross-border smuggling. At the same time, there are a number of small excises in Lithuania onproducts that are not generally taxed in this way, such as chocolate, jewelry, and coffee. These taxeswould eventually have to be eliminated under the EU Rates Directive of 19 October 1992 (92/77/CEC) ifLithuania joined.
Table 7-4. Breakdown of Excise Tax Revenues(percent)Item 1994 1995 1996Alcoholic drinks 57.1 46.0 43.9Tobacco products 7.0 5.7 9.5Petroleum products 18.3 44.1 45.2Electricity 9.9 1.0 0.2Other goods 7.7 3.2 1.2
Source: Table 1.17 of Government Finance of the Republic of Lithuania 1997 (Vilnius, 1997).
TAX ON REAL ESTATE AND LAND. Lithuania has a real estate tax of I percent on the, regionallyadjusted replacement value of real estate, payable by enterprises, and a separate tax, currently reduced to1.5 percent, for most taxpayers (from the statutory 6 percent) of the value of the land, which is applicableto physical persons owning land and to physical and legal persons renting state land.
3. Table 1.14 of Government Finance of the Republic of Lithuania 1997 (Vilnius, 1997).
4. Belgium, Denmark, Finland, France, Germany, Ireland, Italy, Luxembourg, New Zealand, Norway, Portugal,Spain, Sweden, Turkey, and the United Kingdom.
216
PSD Environment: Tax Administration
OTHER TAXES. There is a "road tax" that is based on revenue from goods sold and servicesprovided. Rates vary from 0.1 percent to 0.5 percent, depending on the activity of the company. Suchtaxes do not exist in most countries. There is also a tax on pollution and on the value of extracted naturalresources.
Tax Administration
Lithuania's tax administration is divided into fifty-six offices; the vast majority deal with fewer than2,000 taxpayers. Apart from directions from the head office to local offices, there appears to be littlecontact or coordination among those fifty-six offices, although each follows rough central guidelines.There is also little contact or information exchange among the tax administration, the customsadministration, and the social security administration. Nevertheless, the same tax inspector is responsiblefor the collection of the personal and corporate income tax and the VAT from each enterprise. This is auseful method of enabling cross-checking of tax declarations and reducing taxpayer compliance costs,and is an enhancement that is often lacking in the tax administration of OECD countries.
The administration of Lithuania's tax system is summarized below, first, as seen by tax officialsin a small local tax office and in the largest (Vilnius) district; and second, in relation to the unanimousdissatisfaction, although expressed to varying degrees, of the private sector, including bankers, taxlawyers, and tax accountants, as well as managers of large and small enterprises.
THE POINT OF VIEW OF TAX OFFICIALS. The small tax office of the district of Salcininku R. isatypical in that it includes only one large firm of contractors; otherwise, it is responsible only for small tomedium-size firms. Nevertheless, it illustrates how the administration of the corporate income tax systemoperates at this level. Although sophisticated audit selection techniques were unavailable because theoffice is still in the early days of computerization, the choice of firms for priority audit is not random.The aim is to audit all enterprises in full every three years, so about 30 percent of the enterprises areaudited each year. The criteria for selection are to concentrate on the following: firms that have not beenaudited for a long time, larger firms from which little tax has been collected or that claimed to realize noprofit, and firms in the alcohol and oil sectors. Around 90 percent of the declarations are found to require(generally small) adjustments upward. In cases where the enterprise challenges this ruling, virtually allcases are settled at the local level, and the final settlement is usually at the amount of taxable profitdetermined by the local office. During the past year, only two appeals (by the same firm) have beenmade to the central tax office. It is unclear whether taxpayers systematically underdeclare their taxableprofits, knowing that whatever they declare, the tax authorities will adjust them upward, or whether theydo not appeal against local rulings for the reasons indicated below. Nor is it clear whether thesesettlements at the local level result in too much, too little, or about the right amount of tax being paid.The tax authorities note that while they use their discretion in imposing maximum or minimum fines foradministrative offenses, the law obliges them to impose heavy penalties (25 percent of turnover) wheninformal laborers or unsealed bottles of alcoholic drinks are found.
The central taxs office (and the largest local office, Vilnius) appears well aware of the deficienciesthat exist in the country's tax administration (discussed below). To some extent, officials are preventedfrom making the improvements they would like, and know how to make, by lack of resources and theconsiderable extra work created by frequent changes in the tax law (following the move away from theformer Soviet form of tax system).
Among improvements recently made-or contemplated-by the tax administration are thefollowing: (a) plans for the implementation of minimum or presumptive taxation on hard-to-tax small
217
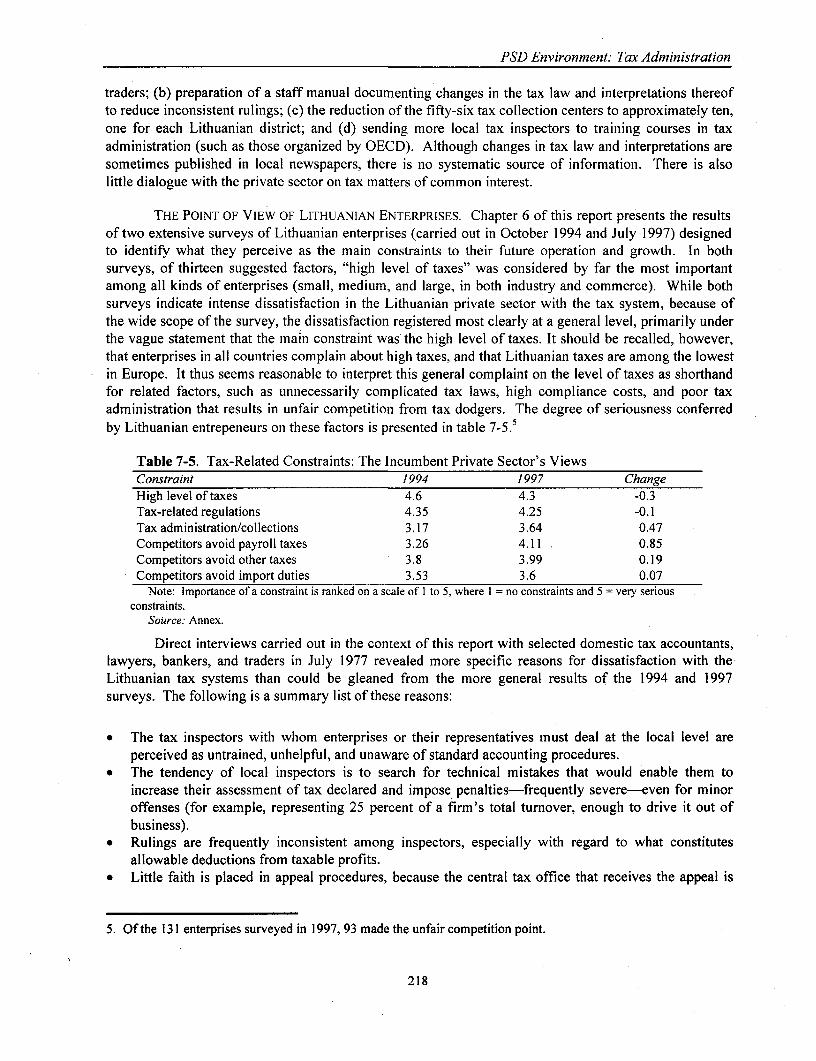
PSD Environment. Tax Administration
traders; (b) preparation of a staff manual documenting changes in the tax law and interpretations thereofto reduce inconsistent rulings; (c) the reduction of the fifty-six tax collection centers to approximately ten,one for each Lithuanian district; and (d) sending more local tax inspectors to training courses in taxadministration (such as those organized by OECD). Although changes in tax law and interpretations aresometimes published in local newspapers, there is no systematic source of information. There is alsolittle dialogue with the private sector on tax matters of common interest.
THE POINT OF VIEW OF LITHUANIAN ENTERPRISES. Chapter 6 of this report presents the resultsof two extensive surveys of Lithuanian enterprises (carried out in October 1994 and July 1997) designedto identify what they perceive as the main constraints to their future operation and growth. In bothsurveys, of thirteen suggested factors, "high level of taxes" was considered by far the most importantamong all kinds of enterprises (small, medium, and large, in both industry and commerce). While bothsurveys indicate intense dissatisfaction in the Lithuanian private sector with the tax system, because ofthe wide scope of the survey, the dissatisfaction registered most clearly at a general level, primarily underthe vague statement that the main constraint was the high level of taxes. It should be recalled, however,that enterprises in all countries complain about high taxes, and that Lithuanian taxes are among the lowestin Europe. It thus seems reasonable to interpret this general complaint on the level of taxes as shorthandfor related factors, such as unnecessarily complicated tax laws, high compliance costs, and poor taxadministration that results in unfair competition from tax dodgers. The degree of seriousness conferredby Lithuanian entrepeneurs on these factors is presented in table 7-5.5
Table 7-5. Tax-Related Constraints: The Incumbent Private Sector's ViewsConstraint 1994 1997 ChangeHigh level of taxes 4.6 4.3 -0.3Tax-related regulations 4.35 4.25 -0.1Tax administration/collections 3.17 3.64 0.47Competitors avoid payroll taxes 3.26 4.11 0.85Competitors avoid other taxes 3.8 3.99 0.19Competitors avoid import duties 3.53 3.6 0.07
Note: Importance of a constraint is ranked on a scale of 1to 5, where I = no constraints and 5 very seriousconstraints.
Source: Annex.
Direct interviews carried out in the context of this report with selected domestic tax accountants,lawyers, bankers, and traders in July 1977 revealed more specific reasons for dissatisfaction with theLithuanian tax systems than could be gleaned from the more general results of the 1994 and 1997surveys. The following is a summary list of these reasons:
* The tax inspectors with whom enterprises or their representatives must deal at the local level areperceived as untrained, unhelpful, and unaware of standard accounting procedures.
* The tendency of local inspectors is to search for technical mistakes that would enable them toincrease their assessment of tax declared and impose penalties-frequently severe-even for minoroffenses (for example, representing 25 percent of a firm's total turnover, enough to drive it out ofbusiness).
* Rulings are frequently inconsistent among inspectors, especially with regard to what constitutesallowable deductions from taxable profits.
* Little faith is placed in appeal procedures, because the central tax office that receives the appeal is
5. Of the 131 enterprises surveyed in 1997, 93 made the unfair competition point.
218
PSD Environment. Tax Administration
staffed entirely by tax inspectors, who are perceived to support the local tax rulings. If a case isconsidered sufficiently important to take to court, it is alleged that judges have insufficient technicalknowledge of the issues involved and would tend to support the tax inspector's ruling. Meanwhile,apart from the costs and delays involved, the taxpayer is obliged to pay tax claimed by the taxinspector until the matter is finally resolved.
* Large firms with standard accounting procedures believe their declarations are challenged by the taxadministration largely because of the latter's inability to collect tax from small firms that keep norecords. Such tax disparities distort competition.
* Contract prices invariably provide the basis of tax assessments, even if the supplier could prove hiscustomer has failed to make full, or even partial, payment of that price.
* It is never clear why a particular tax official goes for the maximum or minimum in the penalty range,and when questioned, replies are slow or nonexistent.
* Uncertainty over tax liability is increased by the absence of any precedents that might influence thetax administration.
* Although bribery is said to occur, it is not believed that corruption is widespread. But it is claimedthat serious deterioration could occur in the absence of reform.
Key Potential Long-Term Improvements to Business Tax Administration
Politicians, senior officials, and the private sector, if not entirely in agreement on how the present taxadministration should be modified, all accept that Lithuania's tax administration requires urgent reform.How to embark on such reform raises questions of priorities and feasibility. This section makes somesuggestions on how progress might be made and draws heavily on the experience of EU and other OECDcountries that have faced analogous problems during the last decade.
Although they may overlap and reinforce each other, there are two broad areas that would benefitfrom more effective tax administration. The first is generally known as the voluntary tax compliancestrategy. The aim is to persuade all but the most delinquent citizens that it is in the interests of thetaxpayers themselves, and the community as a whole, to pay the taxes that are legally due. The secondarea is the improvement of the efficiency of the tax inspectorate. Both elements are addressed below.
Winning the Taxpayers over: A Voluntary Compliance Strategy
The aim of the strategy is to persuade the taxpaying community that tax officials are providing the serviceof collecting taxes in an impartial manner and are not trying to overtax or discriminate among taxpayers.The success of this strategy depends on whether tax officials normally feel sufficiently confident of theaccuracy of taxpayers' declarations that they can dispense with full verification. This allows officials todevote their limited resources to investigating areas where they consider tax is unlikely to be paid-in fullor in part. The other side of the coin is that voluntary compliance occurs when taxpayers customarily filethe information required by the tax authorities in an accurate and timely manner and make correct taxpayments when due, without intervention by the tax authorities. The following paragraphs outline someof the measures that, together, constitute a voluntary compliance approach and that have been introducedover the past ten years in a number of OECD countries. They have been considered successful, in thattax compliance has imlproved and tax revenues have increased without changes in the tax law.
THE ESTABLISHMENT OF AN INDEPENDENT TAX APPEALS TRIBUNAL. This is perhaps the mostimportant way of improving relations between the tax administration and taxpayers. When there aredisagreements on tax assessments, after attempts have been made to resolve them at the local level, there
219

PSD Environment: Tax Administration
may or may not be further discussion in the central tax office. In either event, the taxpayer in OECDcountries, unlike those in Lithuania, has recourse to the judgment of an independent tribunal thatgenerally does not include representatives of the tax authorities. Instead, members of professional bodies(accountants, lawyers, judges, and the like) are appointed to the body by the government as tax experts.The Nordic countries (and Switzerland) present another example of unbiased tax appeal committees: theyinvolve local elected laymen, assisted by the tax authority and/or juridical experts. Similarly, in theUnited Kingdom, most appeals that cannot be settled by agreement are heard by a local body of appointedlaymen, although taxpayers can elect to have their cases heard by an alternative, national quasi-judicialbody of tax specialists. Details of tax appeal procedures in OECD countries are presented in table 7-6, inthe Annex. In Lithuania, however, the tax authorities act as judges in their own cause, which naturallyprovokes suspicion among taxpayers, who, in addition, often have to wait about six months for a ruling(although theoretically it should be only one month). A draft of a new law on tax administration is said toinclude the establishment of some kind of tax appeal tribunal.
Both in Lithuania and in OECD countries, a very small proportion of cases (primarily those inwhich large amounts are in dispute) reach the law courts, but for different reasons. Taxpayers (and taxauthorities) in OECD countries rarely need to take their cases to court; the first and second levels ofappeal usually suffice to provide a fair settlement. In Lithuania, taxpayers are obliged by law toimmediately pay half of the court costs and all the costs of the external appeal committee. Only afterpayment has been made can they sue for reimbursement, and, as already noted, they have limitedconfidence in the ability or impartiality of the courts, whose decision normally involves a delay of anadditional year.
Although the biased composition of both tax appeal committees and the de facto lack of recoursethrough the court system reinforce the discretionary power of the tax authority, it actually hampers taxcollection and discourages private sector development. By removing independent avenues for reversingovertaxing, and thus enhancing the power of individual tax inspectors, the current appeal system makestaxpayers more inclined to accept (and, indeed, to seek) informal settlements with the tax inspector. Atthe same time, potential investors (especially from abroad) unfamiliar with the workings of the system aredeterred by the prospects of unpredictable, arbitrary taxation.
Fortunately, Lithuania may have a base that could, in principle, be used to construct better taxappeal mechanisms. The Auditing and Accounting Institute, set up under the control of the Ministry ofFinance, has made considerable progress toward a draft law that follows international practice in auditing.A considerable number of auditors has also been licensed by the institute. Although little progress hasbeen made in advancing accounting practice, the institute, along with some of the larger accounting andlegal firms already established in the country, could provide the mechanism for setting up independenttax tribunals.
SYSTEMATIC DISSEMINATION OF INFORMATION TO HELP TAXPAYERS. This is another way ofobtaining the good will of the taxpayer. Without such long-term measures as the adoption of officiallyaccepted accounting standards and greater coordination among tax officials (discussed below), it isdifficult to remove the taxpayers' main concerns of uncertainty and inconsistency regarding their taxliability. But even under the present regime, the tax administration could still become more taxpayer-friendly-for example, by providing systematic information to taxpayers on their rights and obligations,on changes in the tax law or in administrative interpretations, and through the provision of explanatorybooklets on all the main taxes. At present, this is done sporadically in local newspapers, by organizingseminars, and by publishing booklets on taxation, but use of television and leaflets addressed personally
220
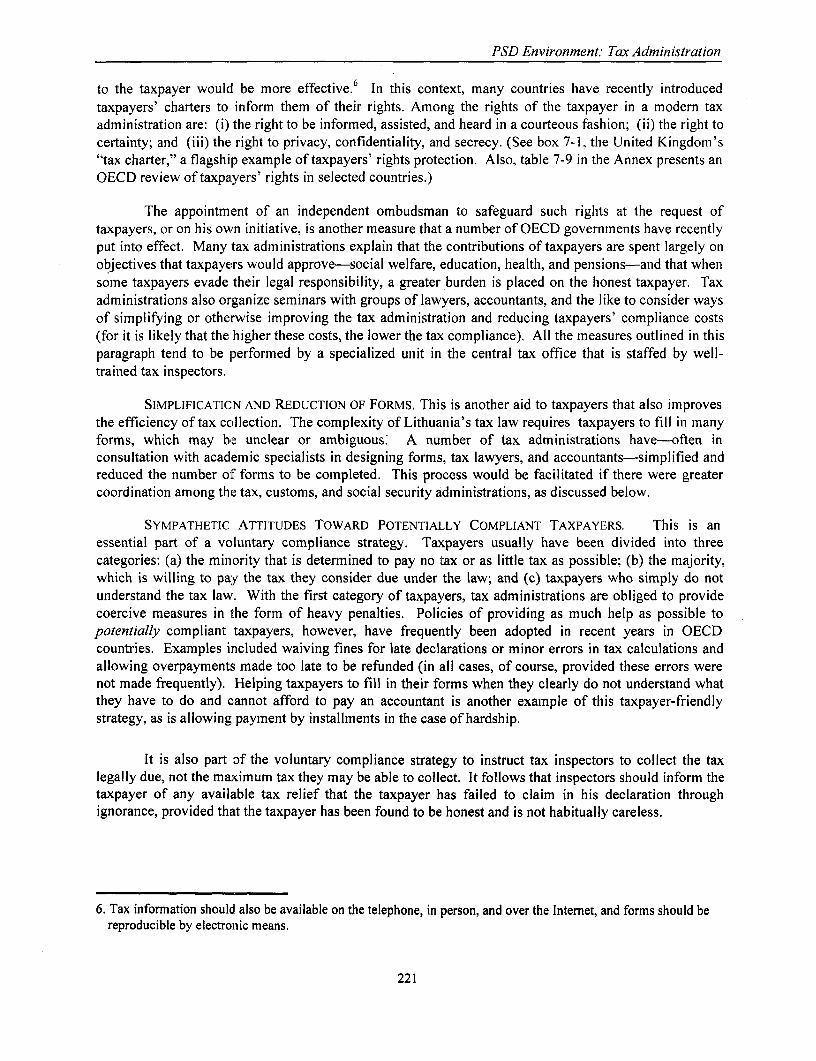
PSD Environment.- Tax Administration
to the taxpayer would be more effective.6 In this context, many countries have recently introducedtaxpayers' charters to inform them of their rights. Among the rights of the taxpayer in a modern taxadministration are: (i) the right to be informed, assisted, and heard in a courteous fashion; (ii) the right tocertainty; and (iii) the right to privacy, confidentiality, and secrecy. (See box 7-1, the United Kingdom's"tax charter," a flagship example of taxpayers' rights protection. Also, table 7-9 in the Annex presents anOECD review of taxpayers' rights in selected countries.)
The appointment of an independent ombudsman to safeguard such rights at the request oftaxpayers, or on his own initiative, is another measure that a number of OECD governments have recentlyput into effect. Many tax administrations explain that the contributions of taxpayers are spent largely onobjectives that taxpayers would approve-social welfare, education, health, and pensions-and that whensome taxpayers evade their legal responsibility, a greater burden is placed on the honest taxpayer. Taxadministrations also organize seminars with groups of lawyers, accountants, and the like to consider waysof simplifying or otherwise improving the tax administration and reducing taxpayers' compliance costs(for it is likely that the higher these costs, the lower the tax compliance). All the measures outlined in thisparagraph tend to be performed by a specialized unit in the central tax office that is staffed by well-trained tax inspectors.
SIMPLIFICATION AND REDUCTION OF FORMS. This is another aid to taxpayers that also improvesthe efficiency of tax collection. The complexity of Lithuania's tax law requires taxpayers to fill in manyforms, which may be unclear or ambiguous' A number of tax administrations have-often inconsultation with academic specialists in designing forms, tax lawyers, and accountants-simplified andreduced the number of forms to be completed. This process would be facilitated if there were greatercoordination among the tax, customs, and social security administrations, as discussed below.
SYMPATHETIC ATTITUDES TOWARD POTENTIALLY COMPLIANT TAXPAYERS. This is anessential part of a voluntary compliance strategy. Taxpayers usually have been divided into threecategories: (a) the minority that is determined to pay no tax or as little tax as possible; (b) the majority,which is willing to pay the tax they consider due under the law; and (c) taxpayers who simply do notunderstand the tax law. With the first category of taxpayers, tax administrations are obliged to providecoercive measures in t:he form of heavy penalties. Policies of providing as much help as possible topotentially compliant taxpayers, however, have frequently been adopted in recent years in OECDcountries. Examples included waiving fines for late declarations or minor errors in tax calculations andallowing overpayments made too late to be refunded (in all cases, of course, provided these errors werenot made frequently). Helping taxpayers to fill in their forms when they clearly do not understand whatthey have to do and cannot afford to pay an accountant is another example of this taxpayer-friendlystrategy, as is allowing payment by installments in the case of hardship.
It is also part of the voluntary compliance strategy to instruct tax inspectors to collect the taxlegally due, not the maximum tax they may be able to collect. It follows that inspectors should inform thetaxpayer of any available tax relief that the taxpayer has failed to claim in his declaration throughignorance, provided that the taxpayer has been found to be honest and is not habitually careless.
6. Tax information should also be available on the telephone, in person, and over the Internet, and forms should bereproducible by electronic means.
221

PSD Environment: Tax Administration
Box 7-1. Voluntary Compliance at Work: The United Kingdom Tax Charter
In 1994, the tax authorities of the United Kingdom de facto institutionalized a system of voluntary compliancefor tax administration by publishing a "Tax Charter." The following is the core of that charter as published andwidely distributed to the public.
Filing your Tax Return, you are entitled to expect the Inland Revenue:* To be fair:
* by settling your tax affairs impartially* by expecting you to pay only what is due under the law* by treating everyone with equal fairness.
* To help you:* to get your tax affairs right* to understand your rights and obligations* by providing clear leaflets and forms* by giving you information and assistance at our inquiry offices* by being courteous at all times.
* To provide an efficient service:* by settling your tax affairs promptly and accurately* by keeping your tax affairs strictly confidential* by using the information you give us only as allowed by the law* by keeping to a minimum your costs of complying with the law* by keeping our costs down.
* To be accountable for what we do:* by settling standards for ourselves and publishing how well we live up to them.
If you are not satisfied:* we will tell you exactly how to complain* you can ask for your tax affairs to be looked at again* you can appeal to an independent tribunal* your MP can refer your complaint to the Ombudsman.
In return, we need you:* to be honest* to give us accurate information* to pay your tax on time.
DISTRIBUTION OF LEGAL COSTS. The usual practice is to award costs to the taxpayer if he winshis appeal, but not if he loses it. This could be regarded as part of the voluntary compliance strategy. Insome countries, however, the taxpayer is not awarded costs even if he wins (Spain and Sweden), or hislegal fees are not reimbursed (Japan and Portugal), and in still others, the awarding of costs is left to thediscretion of the courts or tribunals (Canada, France, Ireland, and Turkey).
A more difficult concession is the provision of advance rulings. In most countries whereinspectors are prepared to advise taxpayers of the tax consequences of their proposed transactions, it is acondition that the ruling is not legally binding. The transaction may, in practice, differ from thatoriginally described, or the area involved may lack clarity according to legal precedents. In relativelystraightforward cases, however, the tax inspector may be able to inform the taxpayer of his probable taxliability, a free service that is likely to be met with gratitude. Table 7-10, in the Annex, reports on theavailability of advance rulings in selected OECD countries.
AMNESTIES. Amnesties are rarely granted; if they are, it is usually when there is a large backlogof cases and a pending change of law. Amnesties are not popular with either tax collectors or honest
222

PSD Environment: Tax Administration
taxpayers, who consider them unfair, and they usually bring in less revenue than the government hadhoped. Of the eleven OECD countries where amnesties are reported, only three were described assuccessful.7 Governments generally agree that amnesties should be employed very rarely, and only Italyand Portugal have used them more than once in recent years. Many countries prefer not to apply them atall.
Enhancing the Efficiency of the Tax Inspectorate
RECRUITING, TRAINING, AND RETAINING QUALIFIED STAFF. Staffing is a problem that faces alltax administrations in view of the higher salaries generally available to tax experts in the private sector.To meet this challenge requires not only paying tax inspectors market-competitive salaries,commensurate with the skills required of them, but also providing them with comfortable workingconditions, varied work, prospects for promotion, and enough responsibility to be motivated in theirwork.
The bonus system practiced in some countries, including Lithuania until January 1997, is notrecommended. In Lithuania, a proportion of tax revenues was collected for the purpose of supplementingtax officials' salaries. These bonuses represented a high proportion of the tax official's regular salary,and may also have resulted in inequalities of remuneration among inspectors doing the same kind of workwith similar efficiency. Bonuses also gave rise to the suspicion in the private sector that the tax inspectorwas overcharging tax in order to increase his bonus. While the removal of the collection bonus system isa step in the right direction, tax inspectors claim to have been insufficiently compensated for their loss ofincome.
Some countries have tried to solve the problem of remuneration by privatizing taxadministrations under a revenue board or revenue authority, so that tax collectors were not subject to theconstraints of civil service pay.8 This radical approach has not been found necessary in most OECDcountries, however, and it would be recommended only if the central tax administration determined thatfurther extensive training of tax officials would result in their massive desertion to the private sector.
THERE Is No LEGALLY ENFORCED ACCOUNTING OR AUDITING STANDARD IN LITHUANIA.Although the Auditing and Accounting Institute bodies have developed "usually accepted auditingpractices," over time these practices have no legally binding power, and agreed accounting standardsseem an even more remote possibility. Beyond other important consequences for the economy as awhole (for example, limiting banks' ability to accurately determine the creditworthiness of firms), thelack of officially accepted accounting standards has two main effects on the efficiency of taxadministration. First, it effectively converts tax "audits" into tax "assessments." Tax inspectors are defacto entitled to judge how profitable a certain business is, and hence how much tax it should pay,independent of books and records. Second, it strengthens the discretionary power of the inspector,already strong because of the biased system of appeal. This, in turn, results in an enhanced willingness ofthe taxpayer to agree to informal settlements, which the experience of other countries in similar situationssuggests may reduce overall tax collections.
A MINIMUM TA:K. A number of countries that, like Lithuania, have a complicated system ofreduced rates, exemptions, and tax holidays that erode the corporate income tax base collect a minimum
7. Reported in OECD, Taxpayers' Rights and Obligations: A Survey of the Legal Situation in OECD Countries(Paris, 1990), op. cit. (table 27, page 90).
8. Canada, Singapore, Spain, and a number of African and Latin American countries.
223
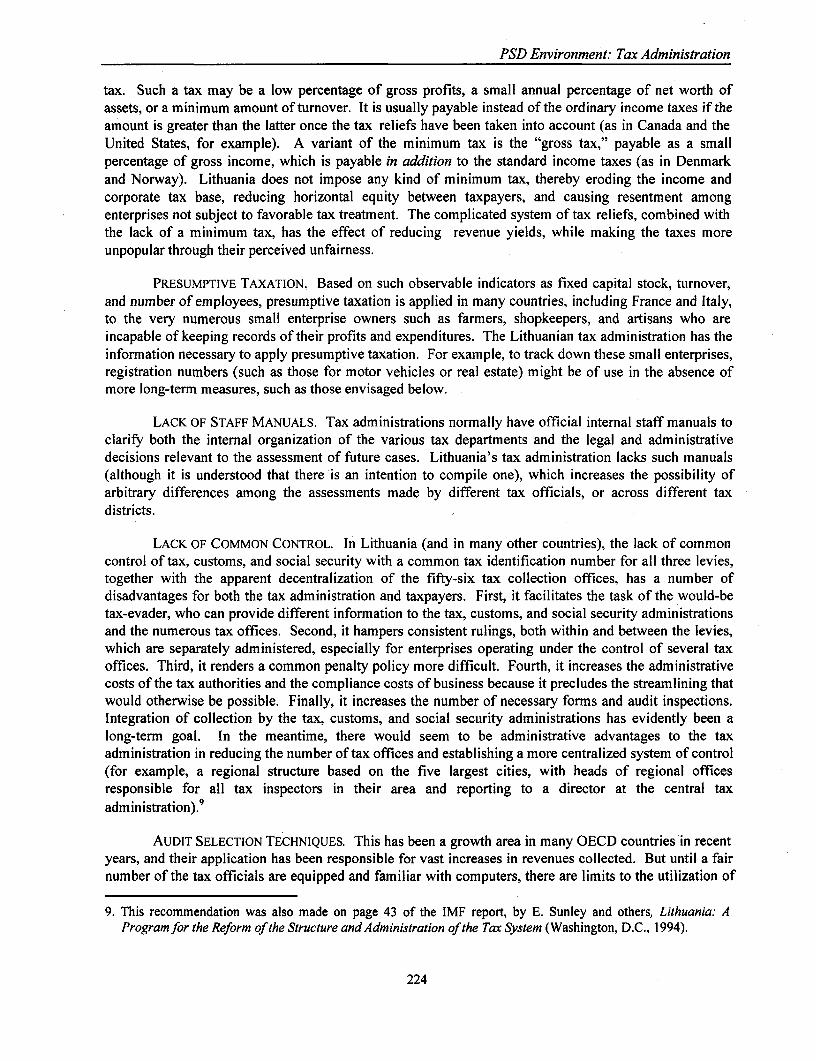
PSD Environment: Tax Administration
tax. Such a tax may be a low percentage of gross profits, a small annual percentage of net worth ofassets, or a minimum amount of turnover. It is usually payable instead of the ordinary income taxes if theamount is greater than the latter once the tax reliefs have been taken into account (as in Canada and theUnited States, for example). A variant of the minimum tax is the "gross tax," payable as a smallpercentage of gross income, which is payable in addition to the standard income taxes (as in Denmarkand Norway). Lithuania does not impose any kind of minimum tax, thereby eroding the income andcorporate tax base, reducing horizontal equity between taxpayers, and causing resentment amongenterprises not subject to favorable tax treatment. The complicated system of tax reliefs, combined withthe lack of a minimum tax, has the effect of reducing revenue yields, while making the taxes moreunpopular through their perceived unfairness.
PRESUMPTIVE TAXATION. Based on such observable indicators as fixed capital stock, turnover,and number of employees, presumptive taxation is applied in many countries, including France and Italy,to the very numerous small enterprise owners such as farmers, shopkeepers, and artisans who areincapable of keeping records of their profits and expenditures. The Lithuanian tax administration has theinformation necessary to apply presumptive taxation. For example, to track down these small enterprises,registration numbers (such as those for motor vehicles or real estate) might be of use in the absence ofmore long-term measures, such as those envisaged below.
LACK OF STAFF MANUALS. Tax administrations normally have official internal staff manuals toclarify both the internal organization of the various tax departments and the legal and administrativedecisions relevant to the assessment of future cases. Lithuania's tax administration lacks such manuals(although it is understood that there is an intention to compile one), which increases the possibility ofarbitrary differences among the assessments made by different tax officials, or across different taxdistricts.
LACK OF COMMON CONTROL. In Lithuania (and in many other countries), the lack of commoncontrol of tax, customs, and social security with a common tax identification number for all three levies,together with the apparent decentralization of the fifty-six tax collection offices, has a number ofdisadvantages for both the tax administration and taxpayers. First, it facilitates the task of the would-betax-evader, who can provide different information to the tax, customs, and social security administrationsand the numerous tax offices. Second, it hampers consistent rulings, both within and between the levies,which are separately administered, especially for enterprises operating under the control of several taxoffices. Third, it renders a common penalty policy more difficult. Fourth, it increases the administrativecosts of the tax authorities and the compliance costs of business because it precludes the streamlining thatwould otherwise be possible. Finally, it increases the number of necessary forms and audit inspections.Integration of collection by the tax, customs, and social security administrations has evidently been along-term goal. In the meantime, there would seem to be administrative advantages to the taxadministration in reducing the number of tax offices and establishing a more centralized system of control(for example, a regional structure based on the five largest cities, with heads of regional officesresponsible for all tax inspectors in their area and reporting to a director at the central taxadministration).9
AUDIT SELECTION TECHNIQUES. This has been a growth area in many OECD countries in recentyears, and their application has been responsible for vast increases in revenues collected. But until a fairnumber of the tax officials are equipped and familiar with computers, there are limits to the utilization of
9. This recommendation was also made on page 43 of the IMF report, by E. Sunley and others, Lithuania: AProgram for the Reform of the Structure and Administration of the Tax System (Washington, D.C., 1994).
224

PSD Environment: Tax Administration
these techniques. Nevertheless, it does seem possible to improve on the Lithuanian practice of auditingnearly all taxpayers' transactions. This activity absorbs a great deal of tax administration resources (aswell as increasing taxpayers' costs). As noted earlier, it would appear rational to reduce the extent ofaudits, both across taxpayers and within tax declarations. This would free resources for concentration onareas identified prior to the audit. Identification of appropriate areas for investigation will vary from taxto tax, and extensive traiining through technical assistance is a prerequisite of an effective audit selectionsystem. Once in force, rnany firms will rarely be audited, and then only for certain kinds of transactions.The central tax office plans to develop a program for audit selection and has arranged for a Swedishcompany to help them in this effort.
REDUCTION OF TAX COLLECTION LAGS. Such a reduction will improve revenue collections.Delays in collecting tax mean that the government will lose revenue in real terms through inflation andloss of interest. Except: in rare cases, tax is not now collected at the time of the tax inspection, butafterward, and much of the work of local tax offices is directed against late filers and late payers. Ideally,filing tax declarations and making payments should be carried out simultaneously, and it is recommendedthat the tax authorities move toward such a system as soon as the tax law can be amended andarrangements for immediate payment negotiated with banks. This is a problem faced by many taxadministrations and is, ofcourse, especially important when inflation is high.
A "STICK" APPFROACH. Both the threat and the reality of punishment for noncompliance mustaccompany the taxpayer-friendly voluntary compliance strategy to deal with taxpayers who refuse tocooperate, whether they are deliberately evading tax or are habitually careless. Maximum fines orimprisonment in sufficiently serious cases is the obvious treatment. One method is to prosecute the worsttax offenders and to publicize some of the heavier penalties imposed by the law courts as a deterrent toother would-be tax evaders. Publishing the names of habitual tax offenders is also done in somecountries, including Lithuania. Rigorous punishment should also be applied to taxpayers and taxinspectors involved in iinformal settlements that enable them to share a portion of the tax due thegovernment.
Nearly all countries withhold tax on wages and salaries, but income tax revenue is also securedby applying the withholding technique to other sources of income such as dividends, interest, royalties,directors fees, pensions, and capital gains. (Table 7-11, in the Annex, describes practices of OECDcountries in this area.) If, as earlier recommended, the Lithuanian income tax base were extended, itwould be rational to rely more heavily on the withholding taxes.
Finally, it shoulcd be noted that the Lithuanian government has already announced its intention toimplement a number of the suggestions listed in this section as part of its "Action Program for 1997-2000." These measures include: (i) abolition of the bonus system (now accomplished); (ii) distinguishingbetween persistent nonpayment and nonpayment by mistake, and reducing fines in the latter case andincreasing penalties for fraudulent or careless declarations; (iii) provision of broader rights for taxpayers;and (iv) keeping tax laws unchanged as long as possible, and changing them when necessary, but onlyafter providing preliminary information.
Policy Recommendations
Until quite recently, most OECD tax administrations had similar problems to those now faced inLithuania: bad relations between tax authorities and the private sector and a perception that the tax systemwas inefficient and unfair (mainly because of high nominal rates and complicated exemptions, whichencouraged widespread tax evasion by some businesses and laid a heavy burden on others).
225

PSD Environment: Tax Administration
Unfortunately, unlike most OECD and eastern European countries, Lithuanian income tax laws retain toomany rates and concessions, which hamper improved tax administration. There is a project to unify taxrates for all types of income. In addition, reform of tax administration is an urgent matter if a rapiddeterioration in tax compliance, which would be difficult to reverse, is to be avoided. Lithuania hasenough accumulated technical experience to provide, in a relatively short period of time, a more efficient,transparent, and fair tax administration, and one that could gather larger revenues for the fiscal budget.For that purpose, the overall priority should be greater cooperation with the private sector in the contextof a full involuntary compliance strategy. This should be combined with technical improvements in thecollection process.
Lithuania should immediately establish independent tax appeal tribunals. While other policiesare implemented, giving taxpayers a credible means of recourse would rapidly transform the relationshipbetween taxpayers and the tax inspectors and would reduce the attraction of informal settlements.
In the medium term, the Lithuanian tax authorities should move to a voluntary compliancesystem. Implementing such a system will require a battery of policies, including the adoption of a tax-related ombudsman, regular reports on how the taxes collected are actually used, and greater assistanceprovided to bona fide taxpayers.
To improve efficiency within the tax administration, a centralized and unique tax identificationnumber should be used for all taxes, customs duties, and social security contributions, and the currentuniversal auditing system should be abandoned and replaced by a selective auditing mechanism. Delaysbetween assessment and collection of tax should be minimized. To improve equity among taxpayers andto reduce inconsistencies, a minimum tax for both corporate and unincorporated businesses should beintroduced, along with guidelines for presumptive taxation of hard-to-tax groups. Tax collection officesshould be reduced in number and centralized, and an internal staff manual containing current tax laws andtheir interpretations by the court and the central tax office should be issued and kept up to date. Finally, alegally enforced system of accounting and auditing standards (following international practices, afternecessary adaptation to Lithuania's circumstances) should be put in place.
There is already integration of the collection of income tax, profit tax, and VAT within the taxadministration, which evidently facilitates consistent assessments and efficient revenue collection, as wellas reducing taxpayer compliance costs. In the longer run and for the same reasons, the authorities shouldconsider the integration of the tax' and customs administration (both of which are responsible forconsumption taxes), as well as the joint control of VAT and income and profit taxes, with that of socialsecurity contributions.
226

PSD Environment: Tax Administration-Annexes
ANNEXData Tables
227

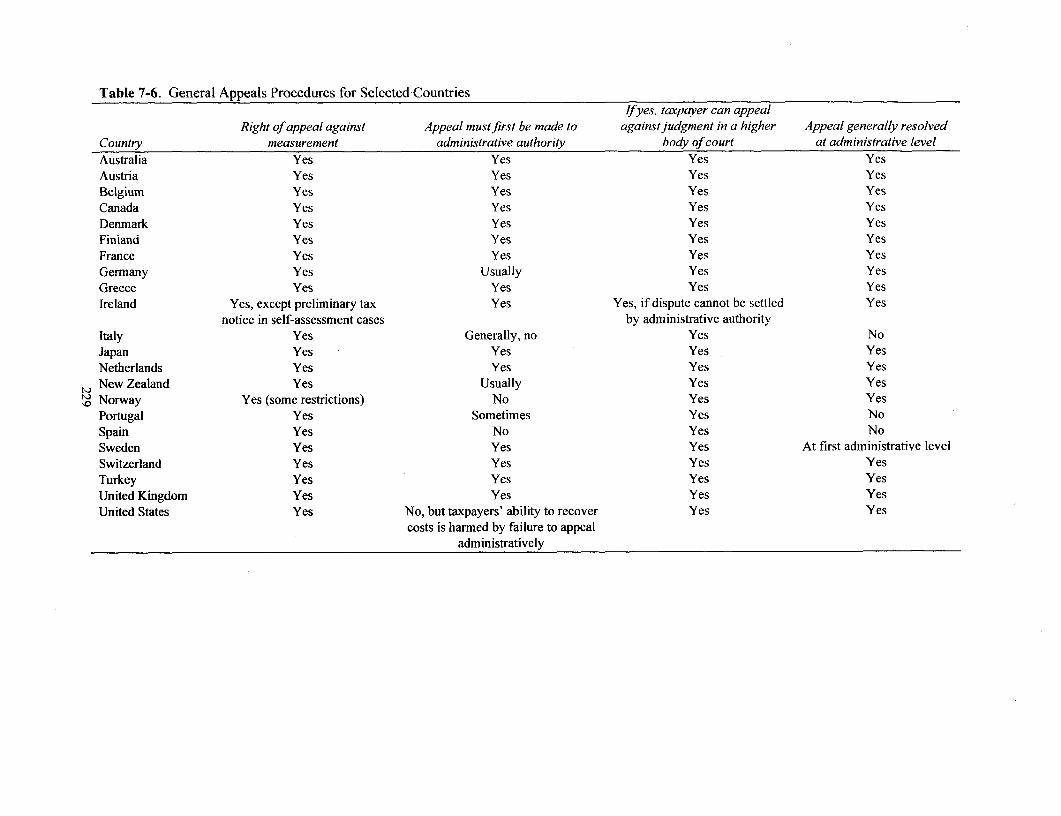
Table 7-6. General Appeals Procedures for Selected CountriesIfyes, taxpayer can appeal
Right of appeal against Appeal must first be made to against judgment in a higher Appeal generally resolvedCountry measurement administrative authority body of court at administrative levelAustralia Yes Yes Yes YesAustria Yes Yes Yes YesBelgium Yes Yes Yes YesCanada Yes Yes Yes YesDenmark Yes Yes Yes YesFinland Yes Yes Yes YesFrance Yes Yes Yes YesGermany Yes Usually Yes YesGreece Yes Yes Yes YesIreland Yes, except preliminary tax Yes Yes, if dispute cannot be settled Yes
notice in self-assessment cases by administrative authorityItaly Yes Generally, no Yes NoJapan Yes Yes Yes YesNetherlands Yes Yes Yes YesNew Zealand Yes Usually Yes Yes
0 Norway Yes (some restrictions) No Yes YesPortugal Yes Sometimes Yes NoSpain Yes No Yes NoSweden Yes Yes Yes At first administrative levelSwitzerland Yes Yes Yes YesTurkey Yes Yes Yes YesUnited Kingdom Yes Yes Yes YesUnited States Yes No, but taxpayers' ability to recover Yes Yes
costs is harmed by failure to appealadministratively

Table 7-7. Decisions Subject to Appeal and Time Limits, Selected CountriesTime limits for appeals by taxpayers
Country Decisions subject to appeala Administrative appealsa Appeals on court decisionsbAustralia All assessment and administrative 60 daysc 60 days'
decisionsAustria All assessment and administrative I month None (except criminal proceedings); court decisions in
decisions of substance tax matters are only issued by the Supreme Court ofPublic Law (except criminal cases)
Belgium All assessment and administrative 30 April after end of assessment year 40 daysdecisions
Canada All assessments 90 days 90 daysDenmark All assessments 4 weeks 8 weeks (Tax Board)
6 months (National Tax Tribunal)Finland All assessments 14 days 5 years from year assessmentGermany All decisions on a tax claim/refund I month I monthGreece All assessments Normally 20 days Normally 60 daysIreland All decisions on a tax claim/refund 30 days 10 days (General Court) 21 days (High Court)Italy All assessments and administrative 60 days 60 days (90 days for appeals before Court of Appeal)
decisionsO Japan All administrative decisions 2 months 3 months
Netherlands Decisions taken in response to 2 monthsd 2 monthsd = (Courts of Appeal)objections against assessments or 2 months (Supreme Court)pursuant to any other provision oflegislation. It is not possible toappeal against a provisionalassessment.
New Zealand All assessments 2 months 30 days (High Court)3 months (Court of Appeal) 21 days (Privy Council)
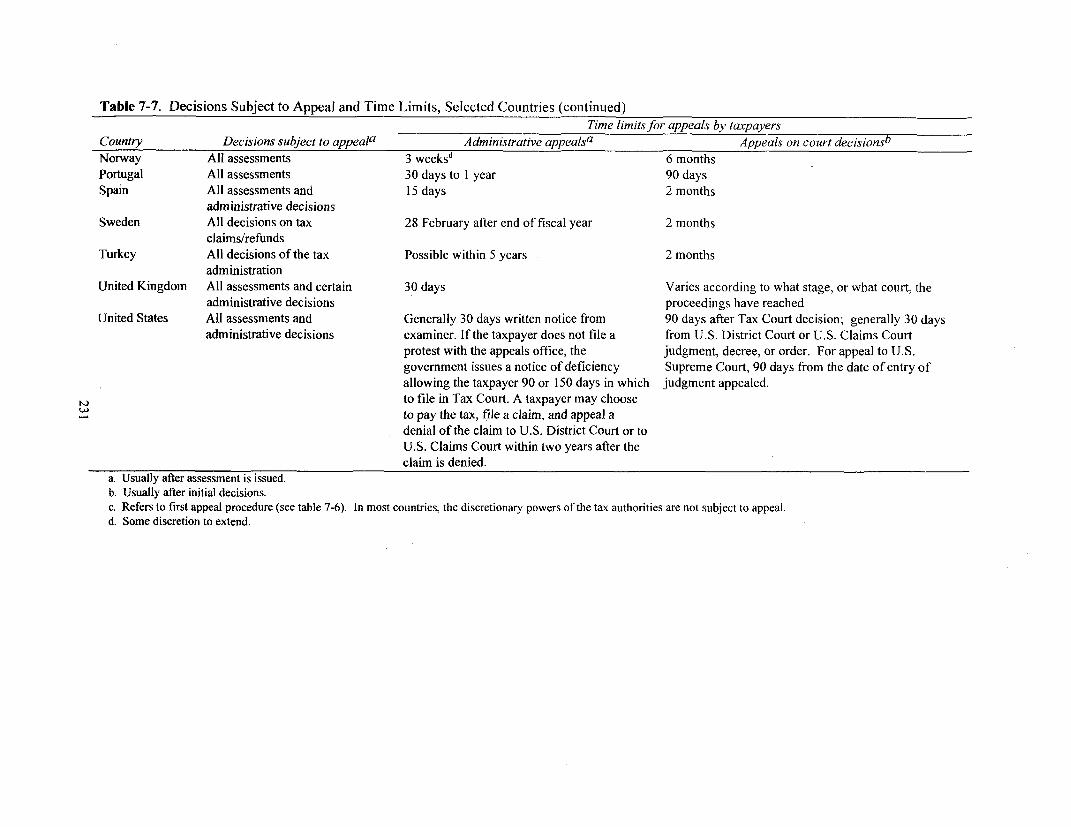
Table 7-7. Decisions Subject to Appeal and Time Limits, Selected Countries (continued)Time limits for appeals by taxpayers
Country Decisions subject to appeala Administrative appealsa Appeals on court decisionsb
Norway All assessments 3 weeksd 6 monthsPortugal All assessments 30 days to 1 year 90 days
Spain All assessments and 15 days 2 monthsadministrative decisions
Sweden All decisions on tax 28 February after end of fiscal year 2 monthsciaims/refunds
Turkey All decisions of the tax Possible within 5 years 2 monthsadministration
United Kingdom All assessments and certain 30 days Varies according to what stage, or what court, the
administrative decisions proceedings have reachedUnited States All assessments and Generally 30 days written notice from 90 days after Tax Court decision; generally 30 days
administrative decisions examiner. If the taxpayer does not file a from U.S. District Court or U.S. Claims Courtprotest with the appeals office, the judgment, decree, or order. For appeal to U.S.government issues a notice of deficiency Supreme Court, 90 days from the date of entry ofallowing the taxpayer 90 or 150 days in which judgment appealed.to file in Tax Court. A taxpayer may chooseto pay the tax, file a claim, and appeal adenial of the claim to U.S. District Court or toU.S. Claims Court within two years after theclaim is denied.
a. Usually after assessment is issued.b. Usually after initial decisions.c. Refers to first appeal procedure (see table 7-6). In most countries, the discretionary powers of the tax authorities are not subject to appeal.d. Some discretion to extend.

Table 7-8. Specific Appeals Procedures, Selected CountriesTaxpayer representation Hearings made public
Tax Regular Tax RegularCountry Bodies that can hear appeals Members of tax court boarda court/boardb courts court/tribunalc courtsAustralia Specialist tribunal Supreme/ Federal Governor-general-appointed Tax agent or laywer [Lawyer] No
Court member with tax experienceAustria Tax official, specialist tribunal, 5 members, appointed by the 70% represented by tax [Lawyer] No Generally no
Supreme Court administration accountant (applies toSupremeAdministrationCourt decisions)
Belgium Administrative authorities and courts Government-appointed judges Taxpayer Lawyer No NoCanada Tax Court/Federal Court! Appellate Government-appointed Taxpayer Lawyer Yes Yes
Court/ Supreme CourtDenmark Assessment Committee, Tax Board, Primarily appointed laymen Taxpayer or lawyer Lawyer Yes Yes
National Tax Tribunal, courts (when they are essential)Finland Appeals board, Provincial Court, Elected laymen; tribunal; Taxpayer No
Supreme Adminstration Court government-appointed judges,court
France Administrative Tribunal, Juridical _ Taxpayer Lawyer Yes YesTribunal (tribunaux de GrandeInstance et Cour de Cassation) Tax authorities' lawyer
Germany Finance courts 3 professional judges, 2 laymen Taxpayer or lawyer Yes YesGreece Administrative Courts, Specialist Judges appointed by Taxpayer or lawyer Yes Yes
Tribunals government for life (second instance = lawyer)Ireland Appeal commissioners, court Government-appointed experts Accountant, lawyer [Lawyer] No Yes
and judgesItaly Tax Commission, Appeal Court Government-appointed experts Lawyer/accountant and Lawyer Yes Yes
and judges taxpayer

Table 7-8. Specific Appeals Procedures, Selected Countries (continued)Taxpayer representation Hearings made public
Tax Regular Tax RegularCountry Bodies that can hear appeals Members of tax court boarda court/boardb courts court/tribunalc courts
Japan Tax Office, tribunal, and court Tax official: tax office Taxpayer or adviser: tax office Lawyer NoGovernment-appointed experts: tribunal (no tax court)tribunalGovernment-appointed judges:courts
Netherlands General Court of Appeals (tax Government-appointed judges No obligation to be represented. No, however, court Yesdivision). Fiscal criminal offenses are Representation by legal or tax decisions may be publishedheard in the first instance by the Law counselor in nevertheless the anonymously unless theCourt and in appeal by the criminal general rule. In criminal taxpayer objects on thedivision of the General Courts of preceedings, representation by grounds of possibleAppeal. Cassation proceedings are legal counsel is obligatory. infringement on hisheard by the Supreme Court. privacy. Criminal court
cases are public unless thejudge decides otherwise.
New ZealandTribunal, High Court Government-appointed judges Generally taxpayer, lawyer [Nol Yes
s Norway Elected tax boards/ regular court Elected laymend Taxpayer Lawyer No YesW Portugal Tax courts, authorities, and special Judges, civil servants Taxpayer Lawyer No Yes
commissions on certain issuesSpain Administrative tribunals and ordinary Public officials Representation from tax Lawyer No Yes
courts advisersSweden Administrative courts Government-appointed judges Taxpayer Lawyer No Yes
and laymenSwitzerland Tax Board, Administrative Court, Elected judges, elected laymen, Taxpayer, adviser, lawyer No No
Supreme Court civil servants
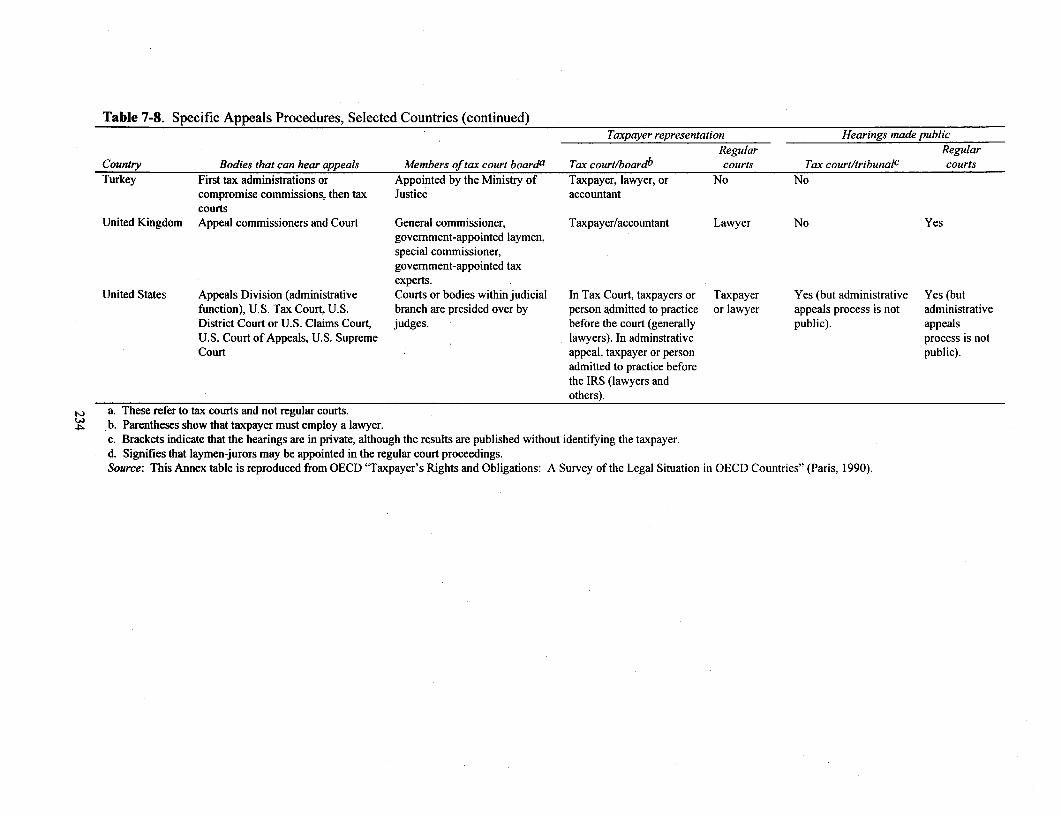
Table 7-8. Specific Appeals Procedures, Selected Countries (continued)Taxpayer representation Hearings made public
Regular RegularCountry Bodies that can hear appeals Members of tax court boarda Tax court/boardb courts Tax court/tribunalc courtsTurkey First tax administrations or Appointed by the Ministry of Taxpayer, lawyer, or No No
compromise commissions, then tax Justice accountantcourts
United Kingdom Appeal commissioners and Court General commissioner, Taxpayer/accountant Lawyer No Yesgovernment-appointed laymen,special commissioner,government-appointed taxexperts.
United States Appeals Division (administrative Courts or bodies within judicial In Tax Court, taxpayers or Taxpayer Yes (but administrative Yes (butfunction), U.S. Tax Court, U.S. branch are presided over by person admitted to practice or lawyer appeals process is not administrativeDistrict Court or U.S. Claims Court, judges. before the court (generally public). appealsU.S. Court of Appeals, U.S. Supreme lawyers). In adminstrative process is notCourt appeal, taxpayer or person public).
admitted to practice beforethe IRS (lawyers andothers).
, a. These refer to tax courts and not regular courts.v b. Parentheses show that taxpayer must employ a lawyer.
c. Brackets indicate that the hearings are in private, although the results are published without identifying the taxpayer.d. Signifies that laymen-jurors may be appointed in the regular court proceedings.Source: This Annex table is reproduced from OECD "Taxpayer's Rights and Obligations: A Survey of the Legal Situation in OECD Countries" (Paris, 1990).
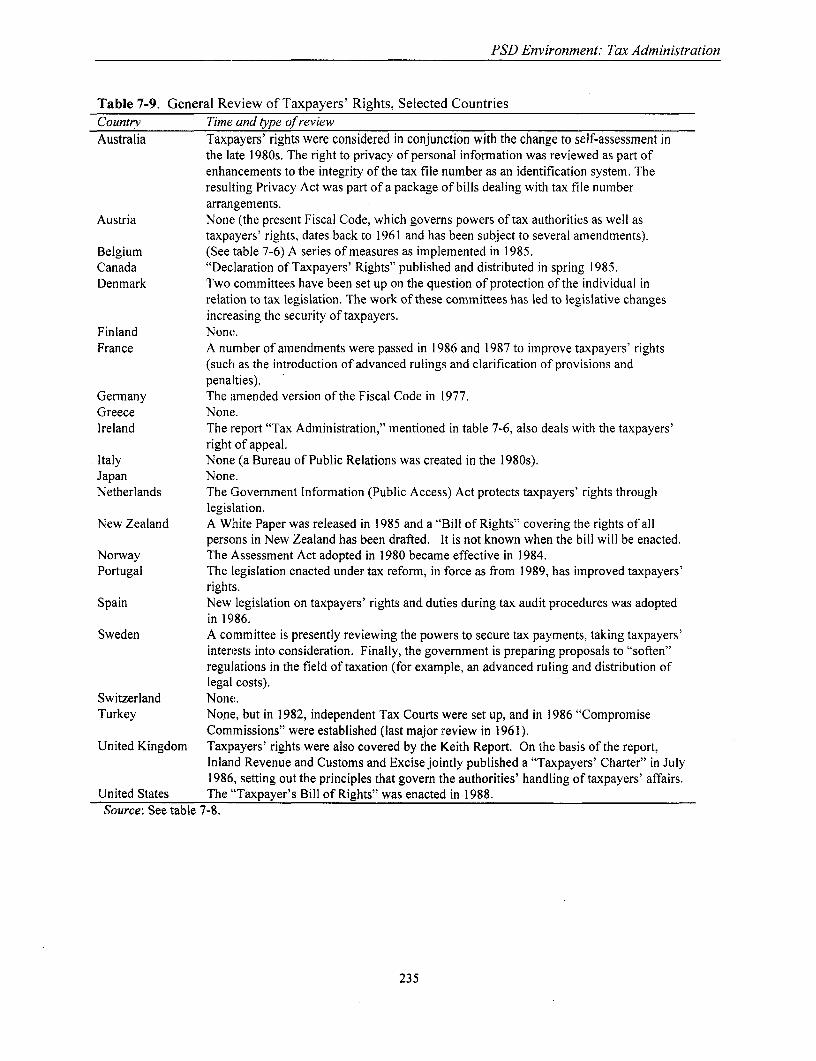
PSD Environment: Tax Administration
Table 7-9. General Review of Taxpayers' Rights, Selected CountriesCountry Time and type of reviewAustralia Taxpayers' rights were considered in conjunction with the change to self-assessment in
the late 1980s. The right to privacy of personal information was reviewed as part ofenhancements to the integrity of the tax file number as an identification system. Theresulting Privacy Act was part of a package of bills dealing with tax file numberarrangements.
Austria None (the present Fiscal Code, which governs powers of tax authorities as well astaxpayers' rights, dates back to 1961 and has been subject to several amendments).
Belgium (See table 7-6) A series of measures as implemented in 1985.Canada "Declaration of Taxpayers' Rights" published and distributed in spring 1985.Denmark Two committees have been set up on the question of protection of the individual in
relation to tax legislation. The work of these committees has led to legislative changesincreasing the security of taxpayers.
Finland None.France A number of amendments were passed in 1986 and 1987 to improve taxpayers' rights
(such as the introduction of advanced rulings and clarification of provisions andpenalties).
Germany The amended version of the Fiscal Code in 1977.Greece None.Ireland The report "Tax Administration," mentioned in table 7-6, also deals with the taxpayers'
right of appeal.Italy None (a Bureau of Public Relations was created in the 1980s).Japan None.Netherlands The Government Information (Public Access) Act protects taxpayers' rights through
legislation.New Zealand A White Paper was released in 1985 and a "Bill of Rights" covering the rights of all
persons in New Zealand has been drafted. It is not known when the bill will be enacted.Norway The Assessment Act adopted in 1980 became effective in 1984.Portugal The legislation enacted under tax reform, in force as from 1989, has improved taxpayers'
rights.Spain New legislation on taxpayers' rights and duties during tax audit procedures was adopted
in 1986.Sweden A committee is presently reviewing the powers to secure tax payments, taking taxpayers'
interests into consideration. Finally, the govemment is preparing proposals to "soften"regulations in the field of taxation (for example, an advanced ruling and distribution oflegal costs).
Switzerland None.Turkey None, but in 1982, independent Tax Courts were set up, and in 1986 "Compromise
Commissions" were established (last major review in 1961).United Kingdom Taxpayers' rights were also covered by the Keith Report. On the basis of the report,
Inland Revenue and Customs and Excise jointly published a "Taxpayers' Charter" in July1986, setting out the principles that govern the authorities' handling of taxpayers' affairs.
United States The "Taxpayer's Bill of Rights" was enacted in 1988.Source: See table 7-8.
235

PSD Environment: Tax Administration
Table 7-10. Availability of Advance Rulings, Selected CountriesAdvancerulings If used, generalform
Not Legally Taxpayer bears costCountry used Used bindinga Not binding CommentAustralia X X Must establish new No
interpretation coveringnumber of taxpayers
Austria XBelgium XCanada X X (binding as a Seriously contemplated, Yes
matter of specific transactions onlydepartmentpolicy)
Denmark X X YesFinland X X In exceptionally Yes
important cases onlyFrance X XGermany X X Limited purpose only NoGreece X X According to No
interpretations of the lawIreland X (except for relieves for Industrial Development Authority or other state agency projects)Italy X X NoJapan XNetherlands X Yes Limited use in matters No
involving corporation taxNew Zealand X X Applies to specific Yes
transactions onlyNorway X X Opinion usually followed NoPortugal X X Can be appealed NoSpain X X Legally binding only in No
cases of investment offoreign capital in Spain
Sweden X X If referred to by the Yestaxpayer
Switzerland XTurkey XUnited X X (if all Limited use, mainly in NoKingdom information corporate area
disclosed)United States X Xb Yes. A fee of $50-
$3,000, depending onthe subject matter, ischarged. The nominalfee is $2,500.
a. Normally binding on the tax administration only if the facts are not misrepresented.b. Binding on the tax authority only.Source: See table 7-8.
236
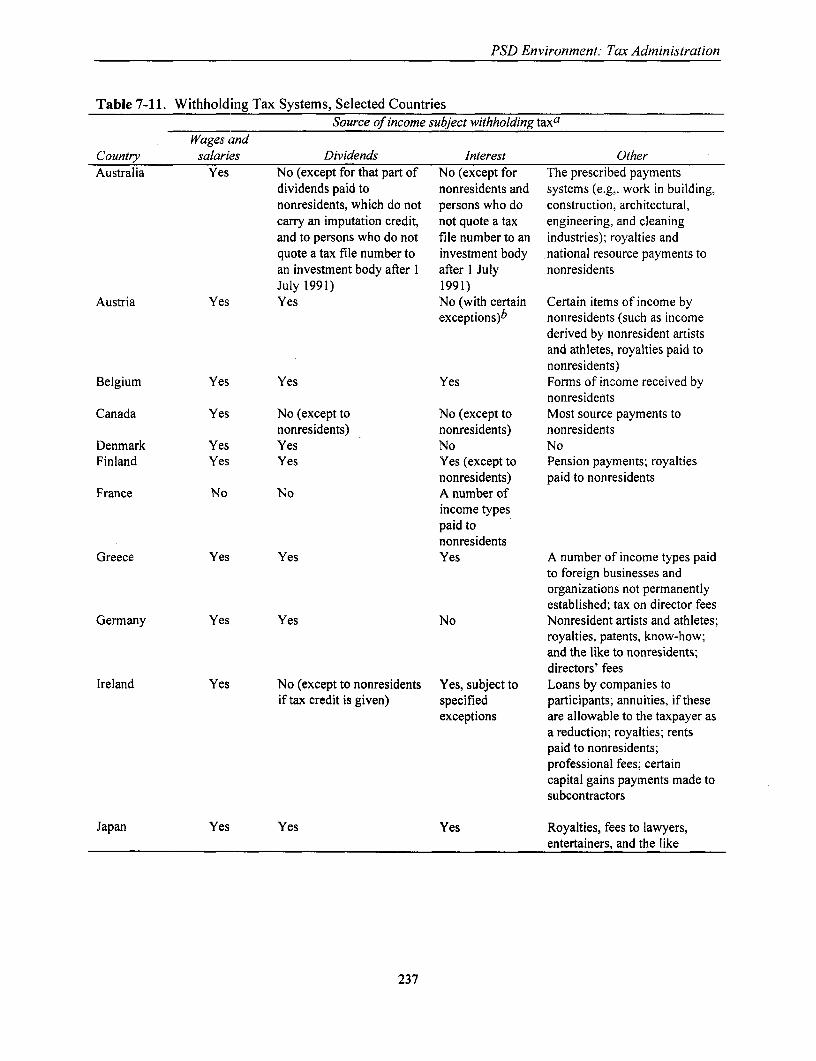
PSD Environment: Tax Administration
Table 7-11. Withholding Tax Systems, Selected CountriesSource of income subject withholding taxa
Wages andCountry salaries Dividends Interest OtherAustralia Yes No (except for that part of No (except for The prescribed payments
dividends paid to nonresidents and systems (e.g,. work in building,nonresidents, which do not persons who do construction, architectural,carry an imputation credit, not quote a tax engineering, and cleaningand to persons who do not file number to an industries); royalties andquote a tax file number to investment body national resource payments toan investment body after I after I July nonresidentsJuly 1991) 1991)
Austria Yes Yes No (with certain Certain items of income byexceptions)b nonresidents (such as income
derived by nonresident artistsand athletes, royalties paid tononresidents)
Belgium Yes Yes Yes Forms of income received bynonresidents
Canada Yes No (except to No (except to Most source payments tononresidents) nonresidents) nonresidents
Denmark Yes Yes No NoFinland Yes Yes Yes (except to Pension payments; royalties
nonresidents) paid to nonresidentsFrance No No A number of
income typespaid tononresidents
Greece Yes Yes Yes A number of income types paidto foreign businesses andorganizations not permanentlyestablished; tax on director fees
Germany Yes Yes No Nonresident artists and athletes;royalties, patents, know-how;and the like to nonresidents;directors' fees
Ireland Yes No (except to nonresidents Yes, subject to Loans by companies toif tax credit is given) specified participants; annuities, if these
exceptions are allowable to the taxpayer asa reduction; royalties; rentspaid to nonresidents;professional fees; certaincapital gains payments made tosubcontractors
Japan Yes Yes Yes Royalties, fees to lawyers,entertainers, and the like
237

PSD Environment: Tax Administration
Table 7-11. Withholding Tax Systems, Selected Countries (continued)Source of income to which withholding tax is applieda
Wages andCountry salaries Dividends Interest OtherNetherlands Yes Yes No NoNew Zealand Yes No (except to No (except Commissions, company
nonresidents and nonresidents) directors' fees, agriculturaldividends received by a work, contributors toresident company from a newspapers, resident andforeign source) nonresident entertainers;
payments to nonresidents,contractors, and ofdividends, interest,royalties, and the like tononresidents
Norway Yes No (except to No Nonresident entertainersnonresidents) and artists
Portugal Yes YesSpain Yes YesSweden Yes (including No (except to No Nonresident entertainers
pensions and nonresidents) and artistssicknessbenefits)
Switzerland No Yes Yes (with certain Nonresident artists,exceptions) athletes, members of
boards of directors; lotterywinnings and insurancepayments.
Turkey Yes Generally, no Yes Rental income, agriculturalsales, and professionalfees; exemptions fromcorporation tax are subjectto withholding tax.
United Kingdom Yes No (except for non- Yes (with certain Royalties; nonresidentresidents if tax credits are exceptions) entertainers and athletes;given) subcontractors in the
construction industry.United States Yes Generally no (except for In general, no Prizes, awards, and the
nonresident aliens and like; certain payments toforeign corporations). If foreigners, such asthe payee fails to furnish royalties; income ofhis taxpayer foreign partners and gainsidentification number on dispositions of U.S. real(TIN) to the payer, the property interests.payment is subject to tax.
a. In general, withholding is operated by the payer of the income. In some cases, the tax withheld represents the final taxliability; in most instances, however, it is seen as a prepayment of an annual tax liability.b. Since 1989, interest income has been, with certain exceptions, covered.Source: See table 7-8.
238

8PSD ENVIRONMENT:THE COMMERCIAL JUDICIAL SYSTEM
This chapter focuses on the judicial system, particularly the commercial judicial system, in the context ofits impact on private sector development. Because the problems of the judicial system stem partly fromissues related to legislation and the legislative process, these are also discussed.
Overall, the transition from a Soviet-style judicial system toward a more modern, market-drivensystem has been remarkably swift and efficient. Nevertheless, the Lithuanian judicial system cannot yetfully support the needs of a diversified and privately oriented economy. While the quantity of courtservices, with some exceptions, is not a problem, quality is, especially in PSD-sensitive areas such asbankruptcy proceedings and disputes relating to commercial contracts and business relationships.
There are several reasons for the poor quality of court services: a shortage of experienced andtrained judges and other court personnel; a lack of court support structures; poor court procedures,inefficient pricing of court services; and the absence of alternative dispute resolution mechanisms.Contributing to the difficulties is an underdeveloped legislative process that has resulted in aninconsistent and somewhat confusing legal framework.
The difficulties of the judicial system have thus far frustrated a move toward greaterindependence and the eventual emergence of the judiciary as a full-fledged, self-contained branch of theLithuanian government. Instead, the judiciary has been brought under even tighter control of theexecutive branch in a probably misguided effort to improve the quality of judicial services. Theweaknesses of the judicial system are reflected in the lack of confidence the private business sector andthe public at large show in its services.
A number of measures have been, and continue to be, taken to enable the judicial system to catchup with and match the demands of a fast-growing and diversifying private sector. The court system wasextensively reformed in 1994-95, and the next reform wave is currently being planned. The productionof this Policy Note is thus timely. It provides a brief assessment of the judicial system in Lithuania, withparticular attention to the main constraints to PSD, and offers a set of broad policy recommendations forconsideration by the Lithuanian government.
239

PSD Environment: The Commercial Judicial System
Lithuania's Judicial System: A Descriptive Analysis
The Legal Framework
The first permanent Constitution of the Lithuanian state was adopted in 1922. It was based on thetraditional separation of powers into the legislative, executive, and judicial branches. Another importantprinciple expressed in this Constitution was the independence of courts and judges. Commerciallegislation did not consist of an integrated civil code, but of a number of separate laws that differedsomewhat throughout the country. The legislation was based on continental European civil law andGerman legal tradition.
In the Soviet Union, the Lithuanian judiciary functioned largely as an enforcement arm of thegovernment-in effect, of the Communist Party. Many areas of law, such as constitutional andcommercial law, were virtually ignored, and the judiciary did not protect citizens from the state or realizethe guarantees explicitly provided in the Soviet Constitution. Judges were reasonably well educated,trained, and paid, and public respect for the judiciary was in some ways greater in Soviet times than it isnow, but it clearly played a subservient role within the government structure.
After the restoration of independence in 1990, Lithuania quickly readopted a Western-style legalsystem, largely a modernized version of the system in place before the Soviet annexation. A newConstitution was enacted by referendum in 1992. The commercial judicial system is also based on theLaw on Courts adopted in 1994 and the Soviet Civil Code, with substantial revisions and supplementationby special laws, such as the Law on Bankruptcy, the Law on Enterprises, the Law on Commercial Banks,and the Law on Trading of Securities.
The Court System
The Lithuanian Constitution and the Law on Courts establish a four-level court system: the SupremeCourt, the Court of Appeals, district courts, and local courts. Most countries in western and easternEurope have three-level court systems. The Lithuanian Constitution-in line with those of many othereastern European countries-also established the Constitutional Court and allowed for specialized courtsfor administrative, labor, family, and other purposes. Unlike most western European countries, Lithuaniadoes not have separate courts for administrative cases. The only specialized court, the CommercialCourt, an offspring of the Soviet-era court for adjudicating commercial cases, was recently abolished.
A Law on Commercial Arbitration was adopted in April 1996. The law provides for privatedispute resolution by an arbitral tribunal, either organized by a permanent arbitral institution or by theparties themselves. The Vilnius International Commercial Arbitration was established in July 1996 as aprivate, nonprofit arbitral institution.
The main functions of the courts are the following:
Local courts are tribunals of first instance for all cases that are not assigned to some other courtby law. Local court judges conduct pretrial investigations of cases as provided by law. Aminimum of two judges serve on each of these courts. There are fifty-four local courts.The district courts are courts of first instance for civil and criminal cases specifically assigned bylaw to their jurisdiction. The designation of a district court as the court of first instance dependson the amount at issue and the nature of the charge. District courts also hear appeals from localcourt decisions. There are five district courts.
240

PSD Environment. The Commercial Judicial System
* The Court of Appeals is composed of a civil and a criminal division. The court hears appeals ofdecisions of the district courts in cases where the district court has acted as the court of firstinstance. Cases where a district court acted as a court of appeal are appealed directly to theSupreme Court.
* The Supreme Court includes a civil division, a criminal division, and a Senate of Judges. TheSupreme Court is an appellate court for cases from the Court of Appeals and for cases fromdistrict courts when these courts have acted as courts of appeal. The Supreme Court will strive toensure uniform practice in the application of laws. The Senate of Judges, consisting of theSupreme Court chairman, the division chairmen, and other members of the Supreme Court, shall,at the request of the Supreme Court chairman, confirm rulings of the Supreme Court andcassation rulings of the Court of Appeals, if such confirmation is important for the formation ofuniform legal practice. The Senate will also rule on decisions by Lithuanian courts that violatethe European Convention on Human Rights and Protection of Major Liberties according to theEuropean Court on Human Rights. Its decisions on the applicability of laws are binding uponlower courts. The minister of justice, the prosecutor general, the chairman of the Court ofAppeals, and the chairmen of district courts have the right to participate in meetings of the Senateof Judges and to propose issues concerning the application of laws for Senate consideration.There has been some controversy in Lithuania regarding the Senate-a body uncommon in otherlegal systems-in relation to its role as a "supercassation" instance and the apparent conflict ofinterest of Supreme Court judges confirming their own rulings.
* The Commercial Court, which derived from the Soviet body and handled disputes between state-owned enterprises, adjudicates disputes between legal persons arising out of economic andcommercial activities. If one of the parties is a physical person or a foreign entity, cases areusually solved in ordinary court. Commercial disputes between persons are always solved inordinary courts. The Commercial Court has the status of a local court, and appeals against thecourt's decisions are made to a district court. The future of this court is uncertain. Draftlegislation is currently under review, which may result in the Commercial Court being mergedwith the district courts or local courts.
* The Constitutional Court, at the request of the president, members of Seimas, the government, orthe judiciary, reviews the constitutionality of laws and other legal acts, as well as that of actionsby the president of the republic and the Council of Ministers. The court also reviews allegedviolations of presidential and parliamentary election laws, determines whether the president'shealth is limiting his ability to continue in office, and rules on the constitutionality of actions bymembers of the Seimas (parliament) against whom impeachment proceedings have beeninstituted. The Constitutional Court has earned a great deal of respect within the Lithuanian legaland governmental system, and its authority to issue the final word on subjects within itsjurisdiction is unquestioned.
Status of Judicial Services
A major reform of the court system commenced with the enactment of the Law on Courts in 1994. Since1995, the number of positions for judges and other court personnel has more than doubled, and judges'salaries were increased considerably. Although a number of positions in the lower courts remain unfilledbecause of budget constraints, on I January 1997, the number of judges had increased from less than 200at the beginning of 1995 to around 500 (317 in the local courts, 8 in the Commercial Court, 122 in thedistrict courts, 24 in the Court of Appeals, and 18 in the Supreme Court), about 135 judges for each onemillion inhabitants. This is much below the ratio in Germany (224 judges for each I million inhabitants),Hungary (200), Slovenia (250), and Spain (244), for example. It is about the same as the number in Italy(130 for every one million people) and above the relative number of judges in Belgium (88), France (90),
241

PSD Environment: The Commercial Judicial System
and Venezuela (68).
Although the relative number of judges is low compared with some countries, quantity is not amajor problem in Lithuania. The problem is quality, which is one of the main weaknesses of theLithuanian judiciary. The rapid increase in the number of judges since 1995 has created an acuteshortage of experienced, well-trained judges. The government is recognizing the seriousness of theproblem and is taking a number of palliative measures. (This subject is analyzed in the section "PolicyIssues," below.)
A factor counterbalancing the lack of skilled judges has been the relatively low number of casesfiled. Based on information received from the Ministry of Justice for the first six months of the year,around 100,000 civil cases will be filed in 1997. As a comparison, in Slovenia, with about half thepopulation of Lithuania, more than 250,000 civil cases were filed in 1990.2 In Finland, where the numberof cases filed has been decreasing since the 1980s, 240,000 civil cases were filed in 1996; in relation tothe population, this number is 1.8 times greater than in Lithuania. In Poland, 540,000 civil cases werefiled in 1995; in relative terms, this is only half of the figure in Lithuania.4 According to the statisticsprepared by the Ministry of Justice, the clearance rate-that is, cases disposed of as a percentage of casesreceived within a certain period of time-is high in Lithuania. It reached 94 percent for civil cases in thefirst half of 1997, which compares favorably with Belgium's 50 percent and Japan's 80 percent in 1993.5In Finland, where concerted efforts to increase the effectiveness of the courts have been made, theclearance rate was 105 percent in 1996. In the Lithuanian Supreme Court, the clearance rate was actuallyclose to- 100 percent, and the backlog of pending cases had been reduced to eighteen at the end of June1997. For all courts taken together, the backlog of pending cases is at a reasonable level, although it hasbeen slowly rising. From the beginning of 1997 to the end of the first half of the year, the backlog ofcivil cases increased from 17,600 to 19,700, which, in both absolute and relative terms, is much less thanthe 56,000 cases pending in Finland at the end of 1996, for example.
The waiting time for resolution of civil cases is currently relatively short, usually 3-6 months.The exception is bankruptcy cases, which take 1-2 years to resolve. As a comparison, in the beginning ofthe 1990s, it took an average of 1.8 years to get a commercial case resolved in Portugal, 2 years inHungary, 3-5 years in Slovenia, and over 6 years in Egypt.6 At the other end of the spectrum are theNordic countries. In Finland, for example, most civil cases are resolved in 2-3 months, and even therelatively few complicated cases require, on the average, no more than 6-7 months.
Although judicial services have improved appreciably, particularly since the reform in 1994-95,and Lithuania compares rather favorably in the statistics presented above, the confidence in thecommercial judicial system is low, as is the perceived public standing of judges. This lack of confidence,together with some other factors, such as the structure of court fees, are most likely the reasons that sofew commercial cases are filed compared with many other countries. Lithuania was not included in an
1. Waleed Malik and others, "Judicial Sector Benchmarks: Examples from Developing Countries" (Washington,D.C.: World Bank, Latin America and the Caribbean PREM, 1994), processed.
2. Cheryl W. Gray, "Evolving Legal Frameworks for Private Sector Development in Central and Eastern Europe,"World Bank Discussion Paper 209 (Washington, D.C., 1993).
3. Annual Report 1996, Ministry of Justice of Finland.4. Statistical Yearbook 1996, Poland.5. W. Malik, "Judicial Sector Benchmarks."6. W. Malik, "Judicial Sector Benchmarks."
242

PSD Environment: The Commercial Judicial System
international survey of user confidence in commercial justice systems made in 1993. On a scale of zeroto ten, the Scandinavian countries ranked high, with Norway at the top (confidence factor, 8.2). Hungary(4.4) and Poland (3.2) were at the lower end, while Russia trailed at 1.0.7 Based on interviews inLithuania, its confidence factor is likely to be close to that of Poland. These matters will be discussedfurther below.
Independence of the Judiciary
In accordance with the law, the judiciary is an independent branch of the Lithuanian government. Thisindependence is guaranteed under Article 109 of the Constitution and Articles 46-55 of the Law onCourts. To realize this independence, the Constitution prohibits any interference with the work of thejudiciary or attempt to influence judges by any citizen or office of government. Nevertheless, both bylaw and in practice, the executive branch, through the Ministry of Justice (MoJ), is heavily involved inthe administration of the judicial branch, with the exception of the Supreme Court, which enjoys a largemeasure of independence. This is no different from most other transition countries in eastern Europe.Similarly, in many western European countries, the judiciaries are in many respects dependent by law onthe government. In practice, however, the judiciaries in these countries enjoy a large measure ofindependence based on tradition; in many of them, greater independence for the judicial branch is beingintroduced or contemplaled.
In Lithuania, the independence of the judiciary is, in practice, limited in several ways. First, thebudget of the judiciary is part of the budget of the MoJ. The judiciary has limited authority over its ownrevenues, expenses, and resources; it is heard, and can make proposals, but the MoJ, the president, orSeimas will determine the number and remuneration of judges, resources for other court staff andexpenses, and investments. While not uncommon, this pattern is not best international practice. InDenmark, where a proposal for a comprehensive reform of the court system has been submitted to theParliament, three alternatives for the allocation of funds to the judicial branch were considered; one wastotal financial independence; the second was a shift of responsibility from the working government(Council of Ministers) to Parliament; and the third, which was chosen by the committee, was the commonwestern European practice of the judiciary remaining dependent on the government for its finances. Tostrengthen the independence of the judiciary, however, the committee has proposed the establishment ofan independent body within the judiciary to prepare budget proposals for the judiciary and to appropriatefunds within the approved budget.8 Similar systems exist in many other countries as well. In Chile,where a major reform oiF the judiciary was realized at the beginning of the decade, the AdministrativeCorporation, a technical advisory body for the judiciary, governed by a council of judges, was establishedto inter alia prepare budgets and to administer, invest, and control the funds assigned to the judiciary bythe national budget law.9
The second limitation of the independence of the judiciary is that appointments, promotions, anddismissals of judges for all courts except the Supreme Court are decided by the president of the republicat the proposal of the minister of justice. (Supreme Court judges are appointed by the Seimas at theproposal of the president.) The Council of Judges, consisting of nine judges, including the chairmen ofthe Supreme and Appeals Courts, makes recommendations to the minister and the president regarding
7. W. Malik, "Judicial Sector Benchmarks."8. "Domstolsudvalgets Betaenkning Nr. 1319" (Proposal of the Courts' Committee), Denmark, 1996.9. World Bank, Judicial Rejorm in Latin America and the Caribbean, Malcolm Rowat, Waleed H. Malik, and Maria
Dakolias, eds., World Bank Technical Paper No. 280 (Washington, D.C., 1995).
243
PSD Environment: The Commercial Judicial System
candidates. (In the case of Supreme Court candidates, the Supreme Court makes recommendations to thepresident.) In many countries, including the Netherlands, Sweden, and the United Kingdom, thegovernment is also legally entitled to decide on appointments, promotions, and dismissals. But inpractice, decisions follow the recommendations of courts or bodies of judges established for this purpose.In Denmark, the reform referred to above includes steps to strengthen the influence of the judiciary.Currently the Minister of Justice (formally, the queen) decides about appointments, promotions, anddismissals at the suggestion of the respective courts. Although the minister almost always follows therecommendations of the courts, the reform committee has nevertheless proposed a separate body-consisting of judges from the various courts, a lawyer, and representatives of the public-to prepare andsubmit such proposals.'0 In Finland, judges are appointed and dismissed by the president of the republicat the suggestion of the appropriate courts.
Key Medium- and Long-Term Policy Issues Facing the Lithuanian Judicial System
Legislation and Legislative Process
Because the current Lithuanian civil and commercial legislation was based mainly on Soviet law, therewas initially a need to renew the legislation and to pass new laws after independence was regained.There was also tremendous pressure to get things done in the shortest possible time. In addition, therewas little tradition or experience left in handling the legislative process, and technical assistance wasoffered from a large number of countries with different legal traditions, but there were no systematicefforts or guidelines to guide the selection of the foreign jurisdictions that would serve as models in givenareas of law. Consequently, Lithuanian commercial legislation has become something of a patchwork,with a lack of conformity and consistency. Laws have been changed frequently, sometimes withretroactive effect. New laws have been enacted ad hoc to solve specific problems, sometimes in areasalready covered by other legislation and without proper harmonization with related legislation. Forinstance, legislation governing the activities of enterprises is reportedly included in some two dozendifferent laws. And, although the Law on Commercial Banks includes most of what is needed to regulatebanking, there are still a number of more general laws, such as the Law on Enterprises, which includeprovisions affecting banks, often ill-suited for their special circumstances. In addition, the Seimas hasenacted laws that pertain to specific banks, instead of amending the laws that apply to all banks.
The legislative process, from the development of a concept for a law to solve a specific problemto the implementation of that law, is not yet fully developed in Lithuania. In the Nordic countries, forexample, the process starts with the appointment of an expert committee to develop and propose aconcept for the legislative solution to the problem at hand. Such a committee typically consists ofexperts in the fields to be covered by the law, both from the private and the public sectors. The task ofthe committee is to compare the circumstances and relevant legislation in the country with those of othercountries, to discuss possible alternative solutions and concepts, and to make a proposal for the conceptbest-suited for the purpose. The proposal usually includes an outline of the needed legislation oramendments to existing legislation and detailed explanations of what the various elements of theproposed legislation are intended to achieve-that is, an ex ante interpretation of the law. This process isoften missing or deficient in Lithuania, or takes place during actual drafting of the law. Committees arenot always formed, and when they are formed, usually include civil servants and scientists, but seldomrepresentatives of the "consumers" of the law. Comprehensive analyses and international comparisonsare not regularly or systematically undertaken.
10. "Domstolsudvalgets Betaenkning."
244

PSD Environment: The Commercial Judicial System
The most common next step in the legislative process is the submission of the committee reportto all interested parties for comment. In the Nordic countries, this includes comprehensive distribution tothe private sector. In Lithuania, comments are solicited from ministries, government agencies, and usuallyfrom academics, but comments are not sufficiently and systematically collected from the private sector orcivil society.
The drafting of the text of a law or the checking of the draft text, as well as the harmonization ofthe new law with existing legislation, is the responsibility of a specialized unit within the Ministry ofJustice in many other countries, including Finland. In Lithuania, this function is performed mainly by thelegal department of the Seimas, but not in a systematic and consistent way, which is why gaps,duplications, and contradictions in legislation are common. This is largely the result of an extremeshortage of staff in this department.
Also, laws in some countries-in the Nordic countries, for example-are always accompanied bygovernmental decrees that are generally prepared and enacted in tandem with the law. Such decreescontain detailed instructions about the implementation of the law and facts and figures that requireperiodic adjustment, and are therefore not included in the text of the law. The decrees are essentialelements of the legislation and intended to assist in the implementation and interpretation of the law. InLithuania, such decrees are usually prepared only after the law has been passed, often with considerabledelay, and sometimes they are never issued. For instance, the Law on Prevention of Money Laundering,which came into effect on I January 1998, needs to be accompanied by detailed instructions about interalia suspicious transactions and the like. No such instructions have been issued. This understandablycauses difficulties in irnplementation and interpretation and is a major reason for inconsistent courtdecisions in an environment made difficult enough by the myriad of new laws and the relatively recentadoption of legal principles and concepts that are totally different from those prevailing during Soviettimes.
Finally, laws sometimes emerge from the review process in the Seimas with numerous,sometimes considerable, changes that were not contemplated during their preparation. If importantchanges are made to a draft law in the reading of the law in the Seimas, such a law should go back to thedrafting board for a review of text to determine consistency and workability of the concept. Thisprocedure is not always consistently applied, which is one more factor behind the current difficulties inthe implementation of laws.
The Limited Independence of the Judiciary
By law, the Lithuanian judiciary is guaranteed a relatively large measure of independence and immunityfrom pressure by the other branches of government. In theory, this independence is much like theindependence enjoyed by the judiciaries in many Western countries. In these countries, however, thelegal tradition has usually developed in the direction of extending a larger measure of independence to thejudiciaries than the law requires. And, despite this, many countries are in the process of strengthening theindependence offered by law. In Lithuania, as in many other transition countries, the absence of Westernlegal tradition and the lack of experience and training, both within the government and in the judiciary,has resulted in the Ministry of Justice more or less "running the show" in an administrative sense. In theearly days of independence, this may have been a practical approach in the absence of a better alternative.Nevertheless, unless control is handed over to the judiciary itself as soon as possible, the development ofthe judicial branch into an independent and efficient branch of government will be hampered, andultimately delayed. Some developing countries, among them many Latin American countries, have optedfor a relatively large measure of independence for the judiciary in an effort to overcome some of the
245

PSD Environment: The Commercial Judicial System
difficulties associated with a high degree of dependence on other branches of government.
In the description of the judicial system presented earlier, the two major factors affecting theindependence of the Lithuanian judiciary-budgetary dependence and the rules for appointing,promoting, and dismissing judges-were discussed. They manifest themselves in the actual extent towhich the government solicits and takes into account opinions and proposals from the judiciary regardingthe need for monetary, human, and technical resources, as well as appointments, promotions, anddismissals ofjudges. Perceptions in this matter vary considerably. Those directly involved on both sides,government and judges, do not seem to perceive the influence of the government as a major problem,while outside observers cite this influence as one of the main handicaps of the country's judicial system.
The role of the government in the administration of the courts is formally established in the Lawon Courts, which stipulates that, with the exception of the Supreme Court, the operation of the courtsshall be guaranteed, and the improvement of qualifications of judges and the "material-technical supply"of the courts shall be overseen by the minister of justice. At the same time, it stipulates that the chairmenof the courts and the divisions "shall administer justice and conduct the operation of the court." Inpractice, the chairmen have little staff to assist them in these tasks, and the Ministry of Justice is thereforeinvolved in court administration and in the operation of the court system. For instance, the ministry hasbeen in charge of arranging and administering examinations for judges and other court personnel,supplying equipment and material, and maintaining buildings and equipment. The ministry also arrangesfor the inspection and audit of the business and financial activities of the courts, again with the exceptionof the Supreme Court, which is audited by a commission formed by the Seimas. The right of thegovernment to inspect these activities of the court is common in other countries as well. In theLithuanian case, however, the government is partly inspecting itself.
The general trend-in many Latin American countries and in some eastern European countries,for example-in the administration of the judiciary is to establish mechanisms for self-administration ofthe court system, with the executive branch involved only in the general allocation of resources to thejudiciary and the audit of its operational and financial activities. In Lithuania, in contrast, draftamendments to the Law on Courts" significantly increase the involvement of the Ministry of Justice indetermining resources for the courts; in the appointment, promotion, and dismissal of judges; in theadministration of the court system; and even in case management. For instance, according to the draftproposal, the right to appoint a majority of the members (judges) to the commission that administers andsupervises the examination of candidates for judgeships would shift from the judiciary to the ministry,and the Council of Judges, which currently recommends candidates for judgeships, would only have an
11. According to the Ministry of Justice, the amended Law on Courts has recently been passed by the Seimas. Thepresident of the republic has not signed the law and is likely to send it back to the Seimas with some suggestionsfor changes. These changes, according to the ministry, would make the judiciary less dependent on the ministry.The most important factor in this regard would be that the Courts Department will be established as "a separate,independent department with its own budget." The department would, however, not come under the jurisdictionof the judiciary. The prime minister would appoint the director of the department, and the department would, inmost cases, m'ake its proposals (for example, candidates for judgeships) to the Ministry of Justice. Thedepartment would be staffed with judges on one-year assignments from their judgeships. It is unclear how muchindependence the draft law actually grants the Courts Department.. In practice, its independence is likely todepend to a large extent on how much independence the Ministry of Justice and the government are going to bewilling to grant to it. And the judiciary would, in any case, be heavily influenced from the outside, whether bythe Ministry of Justice or the Courts Department. If the important posts in the department are occupied byjudges, this could, of course, lead to increased influence by the judiciary on its own affairs, but only if it has adecisive say in nominating candidates for these posts.
246
PSD Environment: The Commercial Judicial System
advisory function in the future. The selection of candidates would be transferred to a special CourtsDepartment in the Ministry of Justice, which would take over the current and new tasks of the ministryrelating to the judiciary. According to a concept paper prepared il connection with the draftamendments, the ministry, through a purpose-built Training Department, would be heavily involved, notonly in the training of judges and other court staff, but also in university studies by instituting "stateexaminations" as final examinations for law degrees and by introducing other compulsory certificationrequirements also to be supervised by this department, instead of by the universities themselves. Such"reforms" would seem to return legal education almost to Soviet-style patronage. The heavy involvementby the Ministry of Justice is allegedly a matter of necessity, and the plan is that tasks and responsibilitieswill be transferred to the judiciary as soon as it is capable of taking them over. Experience from mostcountries, however, shows that such transfers of responsibility are rendered unlikely or very difficult byentrenchment and politics.
Shortage of Qualified Judges and Other Court Personnel
The shortage of skilled and well-educated judges (especially in market-driven commercial practice) andother court personnel is undoubtedly one of the main problems of the judicial system and a reason for thelack of public confidence.
The problem in regard to judges became even more acute when, as a result of the past courtreform, the number of judges more than doubled in a relatively short time. There were simply not enoughqualified lawyers in Lithuania. Consequently, qualifications for judges were lowered to make it possibleto fill the positions. For judges in local courts, no prior experience is required. A person twenty-fiveyears of age or older with a law degree can be appointed a "candidate to local court judge" and getpractical training (but not independently solve cases) as a judge at a reduced salary for one year. It isthen possible for the candidate to become an ordinary judge after the probation period by passing a localcourt judges' examination. Persons with five years of practice as judges, prosecutors, or practicinglawyers can be appointed local court judges without any probation period. Despite these relatively laxrequirements, the output of new lawyers has not been sufficient to fill the gap. Vilnius University, whichis the main institution for higher legal education, graduates only eighty to one-hundred masters of laweach year, and a large portion of these graduates is quickly absorbed by the private sector. Despite thesignificant increase in judges' salaries as a result of the reform, making them about twice those of civilservants at equivalent levels, their income still does not match salaries in the private sector. Nevertheless,relative salaries in the profession are only a partial explanation of the shortage of qualified judges. Thedifference in salary levels between judges and the private sector is smaller in Lithuania than in manyWestern countries. The problem in Lithuania, as in eastern Europe generally, is not just compensation,but also the rapidly increasing demand for legal expertise and assistance, particularly in areas such asinternational commercial law, which together with the low output of new lawyers and the increase indemand from the judiciiary, has caused difficulties, particularly for the latter.
With the exception of the Supreme Court and the Court of Appeals, judges do not specialize in aparticular field. The judges of the Commercial Court do not specialize in particular areas of commerciallaw. The lack of specialization causes difficulties in complicated commercial cases, particularly inbankruptcy cases. The new draft of the Law on Courts allows specialization in local courts at thediscretion of the chairman, but limits the specialization to three years'2 in any one field, which is a shorttime, and partially defeats the purpose of specialization. In many countries, judges are specializing, and
12. The limitation of specialization in any one field to three years has, according to the Ministry of Justice, beendeleted from the final draft of the law.
247
PSD Environment: The Commercial Judicial System
their choices are often directed toward the particular needs of the country. In the United States, forinstance, there are special bankruptcy judges; Venezuela has commercial and labor judges; and Panamahas family and maritime judges. Hungary has a special Labor Court, and judges in general courts tend tospecialize as well (in commercial cases, for example).
Lithuania's university education for lawyers suffers from a lack of resources and modernteaching methods and equipment. Teaching is heavily concentrated on theory. Case-solving anddiscussion groups are uncommon, and practical training is not offered. Salaries of university teachers arevery low, and the law faculty of Vilnius University thus has difficulty attracting talented lawyers asteachers. Most of the teachers have other jobs as their main source of income. While the development ofprivate university education may eventually fill the gap, there are few other programs of legal educationin addition to Vilnius University. A semi-private university in Kaunas has recently started a master oflaw program, partially staffed by teachers from the United States. The program, however, does notrequire a legal degree for admission, and graduates may thus not qualify for judgeships (the firstgraduation is scheduled for 1998). Also, the Police Academy is being turned into an institution to teachlaw in order to provide legally trained staff for public administration. The teaching will be at the collegelevel. Neither of these two institutions, however, are likely to alleviate the shortage of judges, at least inthe short run.
There is also a serious shortage of skilled court secretaries, bailiffs, and other court personnel.There is no formal education or training that qualifies students for such positions. The status and salariesof court personnel are low. Courts have little staff for general and court administration-there is only alittle more than one support person (assistants, court secretaries, and court office staff) for each judge inLithuanian courts. In comparison, the ratio is 6:1 in Portugal, 5:1 in Quebec (Canada), and 4:1 inBelgium.'3
The Ministry of Justice has recognized the need to give high priority to increased and improvededucation and training of both judges and other court staff. A concrete result of efforts in this regard isthe establishment of the Lithuanian Judicial Training Center (the Center), which was established in March1997. The Center is an independent, not-for-profit institution established to provide legal training toLithuanian judges and other court personnel on a systematic and continuing basis. Other goals of theCenter are to continuously analyze the status of the court system and current practices; to maintainrelevant research and reference material; and to publish, both on paper and electronically, informationnecessary for judges.14 The Center started operations with three full-time staff and part-time consultants.The first training course was arranged in September of 1997. So far, a dozen courses have been offeredand many more are planned, including courses on labor law, economic crimes, and copyright law. Theprogram will include courses for other court staff starting in 1998. The courses, which are free of charge,have been well attended and considerably oversubscribed.
Modern judicial systems put strong emphasis on developing specialized legal skills andmanagement capacity. Some countries, such as France and Spain, have excellent schools to train futurejudges, and new judges are selected solely from graduates of those schools. In other countries, such as
13. W. Malik, "Judicial Sector Benchmarks."14. The founders of the Center are the Ministry of Justice, the Supreme Court, the Lithuanian Judges' Association,
the Open Society Fund of Lithuania, United Nations Development Program (UNDP), and the American BarAssociation/CEELI. Donors to the Center, in addition to the founders, are United States Agency forInternational Development (USAID), EU Phare, and the government of Finland.
248

PSD Environment: The Commercial Judicial System
the United States, the emphasis is on training newly appointed judges and developing specializedadministrative capacity among other court staff. Both systems attempt to develop a strong sense ofethical responsibility that discourages corruption and emphasize the importance of continuing educationto keep judges informed about legal developments and to provide them with opportunities to exchangelessons learned from experience. This is the direction in which Lithuania's incipient (and potentiallypromising) efforts should be channeled.
Inadequate Court Procedures
Case management and the administration of court proceedings suffer from the above-mentioned lack ofskilled personnel, but they are also hampered by the lack of computerization, and even more critical, frompoor design and practice. Case management is handled manually by court or division chairmen and ismainly restricted to the distribution of cases among judges. The Ministry of Justice maintainscomputerized records of laws and decrees that are available electronically to the courts, but electronicequipment in the courts is usually limited to one station in each court, rather than one for each judge.Court hearings are manually recorded, but because of the absence of parallel electronic recording and thelack of education and training of hearing secretaries, the records are often deficient and incorrect. Often,no more than a summary of testimony is transcribed by hearing secretaries. The records of proceedingsin lower courts are thus often of little or no use in the upper courts, and procedures, in case of appeal,must largely start from scratch. The problem of appellate proceedings being bogged down with factualinquiries, basically de novo, have plagued the Lithuanian court system since independence.
Court proceedings are public, unless otherwise specified by law, and records of proceedings anddecisions are to be published. In practice, only parts of the records and decisions are published, and thereis no comprehensive clatabase for court decisions. The principles of the validity of jurisprudence aresomewhat unclear, and access to jurisprudence is lacking, with the exception of decisions and opinionspublished by the Supreme Court. The reason for uncertainty regarding the binding effect of jurisprudenceis said to be its neglect in the Constitution. Even the binding effect of decisions and opinions publishedby the Supreme Court is being questioned.
Also, according to the law, the burden of proof in commercial disputes lies on both parties-bothparties must present evidence in support of their respective claims. In practice, the burden of proof issaid to lie mainly on the plaintiff. Defendants are able to delay proceedings considerably on technicaland other grounds. The rules and practices with regard to appeals are not always observed. For example,the enforcement of time limits for appeals is lax. Cases are sometimes heard in the court of appeal,despite expiration of the time limit. Another problem is that judges tend to issue their formal opinionslong after the initial decision has been made, and after the appeals process has been set in motion. This iscontrary to rules and international practice because it may interfere with-and contradict-the findings ofthe higher court.
The enforcement of court decisions presents problems as well. There are too few bailiffs,particularly qualified bailiffs. There are currently 290 bailiffs, or a little more than one bailiff for everytwo judges. This compares with a bailiff-to-judge ration of 1:1.3 in Finland. Moreover, unclear laws andregulations further complicate enforcement. For instance, temporary restraining orders are difficult toobtain, which allows assets to be hidden or squandered before they can be seized. The problems ofimproperly influencing judges and others involved in an action, as well as outright corruption, are alsopresent, although apparently they are not a very serious problem. Court orders and decisions are difficultto deliver, in part becaLuse of a deficient law on enterprise registers that has resulted in an incomplete andunreliable enterprise register.
249
PSD Environment: The Commercial Judicial System
Inefficient Pricing of Court Services
The pricing of court services, in practice, restricts access to the court system. The court fee for getting acase heard in the first instance is generally 5 percent of the amount of the claim. The fee has to be paid atthe outset, and is not reimbursable once it has been paid. The fee for appealing a court decision is half ofthe fee in the first instance, and again, half of this fee in the court of cassation. For tax and otheradministrative disputes, however, no fees are charged, and in bankruptcy cases only a nominal fee isrequired.'5 The system of charging relatively high up-front fees, partly to ensure partial or total costcoverage, and partly to reduce incidences of frivolous charges, is not uncommon. For example, courts inPoland require a deposit of 12 percent of the disputed amount by the party bringing the claim to court incommercial cases. This deposit is supposed to be returned in part or in whole following a decision in thecase, but it nevertheless imposes a significant financial burden on the plaintiff, particularly sincecommercial cases often take about two years to be resolved in Poland.'6
Although Lithuanian courts usually order a losing defendant to reimburse all or part of the courtfee to the plaintiff, the obligation to pay the fee in advance and the uncertainty about reimbursementwhen winning a case is said to significantly deter enterprises, particularly small enterprises, from seekingjustice in court. Many Western countries, such as Canada, France, and the United Kingdom, haveresorted to relatively low flat or fixed fees rather than percentage-based fees. The court fee in the UnitedKingdom, for example, is only about $300, irrespective of the amount of the claim.'7 In Finland courtfees are $100-200, depending on the court.
Plaintiffs in Lithuania usually cannot get relief from paying court fees. Moreover, Lithuanianlegislation does not provide for the possibility of free legal aid. Although lawyers' fees are lower than inwestern Europe and the United States, they are nevertheless significant in the Lithuanian context, andfurther restrict the possibilities for enterprises to seek justice in court.
Lack of Alternative Dispute-Resolution Mechanisms
The development of alternative dispute-resolution mechanisms in Lithuania is not currently motivated bythe need to ease case loads or shorten the time required for decisions; as noted above, these are not majorproblems. What is needed are mechanisms that can offer cheaper ways of resolving commercial disputesthan the avenues available through the ordinary court system. Many enterprises, particularly smallbusinesses, cannot afford the fees. Also, alternative dispute-resolution mechanisms can involvespecialists in the subjects of disputes, an option that is not available in the courts.
There are no provisions in the Law on Courts for court-associated dispute-resolutionmechanisms. Settlements mandated by judges or equivalent settlements out of court are not excluded bythe law, but in the absence of related mechanisms, procedures, and tradition, cases are usually not settledout of court. Bankruptcy law-both the old and the new, which became effective on 1 October 1997-provides for extrajudicial bankruptcy proceedings. In a portion of bankruptcy cases currently in court(mainly conceming state enterprises), extrajudicial proceedings are being applied. But so far, suchproceedings have not been much more effective than proceedings in court, largely for the same reasons:
15. Before the reform of the court system, court fee revenues exceeded the costs of operating the court system. Thesignificant increase in the number of judges and in the salaries of judges has reversed this relation, but fees stillcover a considerable portion of costs.
16. C. Gray, "Evolving Legal Frameworks."17. W. Malik, "Judicial Sector Benchmarks."
250
PSD Environment: The Commercial Judicial System
lack of detailed procedural rules and experienced bankruptcy administrators and judges.
The Seimas adopted the Law on Commercial Arbitration in April 1996. The law recognizes, andis based, on the New York Convention of 1958 "On Recognition and Enforcement of Foreign ArbitralAwards." The law provides for private arbitration of commercial disputes, either in the form ofinstitutional arbitration (that is, arbitration facilitated and organized by a permanentarbitral institution) orin the form of ad hoc arbitration, which is organized without the assistance of such an arbitral institution.There is now one such permanent arbitral institution, the Vilnius International Commercial Arbitration,which was founded by the Lithuanian Lawyers Association in May 1996. The Ministry of Justice hasapproved a list of recommended arbitration chairmen, but both the chairman and the other members ofthe arbitral tribunal may be chosen from outside the list. Arbitral awards may not be appealed.
The arbitration mechanism is not yet functioning, and only one case has been brought toarbitration in Lithuania so far. The legislation has some significant flaws, and it is reported that the set-up of the arbital institution is flawed as well. Experts have expressed doubts about the enforceability ofarbitral awards outside Lithuania. There is also uncertainty and lack of knowledge about the arbitrationprocess, and few people have experience with arbitration. Lawyers are not yet including provisions forarbitration in commercial contracts in Lithuania.
The success of alternative dispute-resolution mechanisms-both court-associated and private-inthe United States has inspired many countries to introduce and try out such mechanisms. Common court-associated mechanismrs, which in many countries have been incorporated into codes of procedure, aremediation, early neutral evaluation, settlement conferences, and arbitration. Examples of private dispute-resolution mechanisms that have been introduced, in addition to arbitration, are negotiation andmediation. Alternative dispute-resolution mechanisms are actively encouraged by both courts and privateorganizations, such as Chambers of Commerce. In Poland and Slovenia, for example, private arbitrationis directly connected with the Chambers of Commerce, which provide organized forums-arbitralinstitutions-for arbitration. In Latvia, where private arbitration is regulated by out-dated legislation andnew legislation is only now being drafted, the Riga International Arbitration Court nevertheless receivedninety-four requests for arbitration in the first nine months of 1997, a considerable increase over thetwenty-five requests received during all of 1996. Assessments of the quality and effectiveness ofarbitration in the Riga International Arbitration Court vary, but many users consider arbitration to be acheaper and quicker way to get decisions than going to court. In Finland, a system of adjudicatingroutine cases by nonlegal staff, without hearing by a judge, has recently been introduced, and by now isthe mechanism used for a large portion of civil cases.
Policy Recommendations
The Framework and Principles for Judicial Reform
WHAT IS BEING DONE? The Ministry of Justice has prepared a draft, "Guidelines for the Reformof the System of Legal Institutions," as a continuation of the reform of the judicial system, originallyapproved by the Seimas in December 1993. According to the draft, the Ministry of Justice and theMinistry of Interior shall be reformed to be better able to perform their functions as "governinginstitutions" of the system for law and order. The Ministry of Justice would, inter alia, establish adivision within the ministry to analyze "judicial practice" (case law) and to make recommendationsconcerning the improvement of such practice. The ministry would also be charged with developingjudicial training programs for judges and other court personnel and legal studies in universities. Thesuggested reforms also include the development of a system for adjudicating administrative cases, either
251

PSD Environment: The Commercial Judicial System
by using the current court system or by setting up specialized administrative courts; the further reform ofthe general court system and court procedures, particularly the merging of the Commercial Court with thegeneral court system; reform of the prosecutor institution and the police; and the recognition anddevelopment of regulations for the Lithuanian bar.
A draft of amendments to the Law on Courts has also been prepared, with the aim of improvingthe functioning and administration of the courts. The suggested amendments would transfer a number oftasks and responsibilities, including those involving appointments, promotions and dismissals of judges,judge examinations and training of judges, and the interpretation and application of laws from the courtsand the judges to the Ministry of Justice. At the same time, it moves many such tasks and responsibilitiesfrom the minister of justice to the Court Department of the ministry. The amendments also lessen theimportance of jurisprudence, lower requirements for appointments of judges to local courts, and requirelocal court judges to be reappointed twice instead of once before confirmation of appointment untilretirement. These amendments, while designed to improve the functioning of the judicial system,considerably decrease the independence of the judiciary. Such a reform would be contrary to the trend inthe European Union, where the courts and the judges are given progressively more independence andresponsibility in running the judicial system. The rejection or lessening of the importance ofjurisprudence would be in sharp contrast to the system in other European countries. In addition, a recentreport of the United Nation's Human Rights Commission cited the review process for local court judgesafter five years of service in preparation for permanent appointment as one of Lithuania's outstandinghuman rights issues.
A significantly amended Law on Enterprise Bankruptcy came into effect on I October 1997. Thelaw is an improvement over the old version, although it fails to correct some problems, but rules andprocedures for implementing the law and for the training of judges and bankruptcy administrators andtrustees are needed for the law to have the desired effect of speeding up and improving bankruptcyprocedures. The Civil Code is being thoroughly revised too, with the principal aim of completing,systematizing, and consolidating commercial legislation. Finally, as mentioned earlier, the JudicialTraining Center was established and has started operations. The Center could, if properly supported andfunded, have a major impact on improving the knowledge and expertise ofjudges and other court staff.
WHAT CAN AND SHOULD BE DONE? International experience suggests that commercial judicialreform should (a) have a long-term approach, with a clearly defined set of actions for both the short andthe medium term; (b) be broad in scope and address judicial sector issues as a whole, and at the sametime, contain targeted intervention in areas in urgent need of improvement; (c) build on the strong pointsor reinforce ongoing activities of the sector; (d) have a mechanism that constantly evaluates progress andmakes necessary adjustments; and (e) be broadly participatory and involve all stakeholders in the system(judges, lawyers, court staff, users, and so forth).
Experience in other countries also shows that successful judicial reforms have made the judiciarymore independent. Important components in such reforms have been simplified and updated legalprocedures and laws; improved administration of justice; improved legal education and training;expanded access to justice; and the provision of alternative mechanisms for dispute resolution. Basicvehicles for reforms of the administration of justice have been improved training; enhanced andautomated case management; computerization; and alternative or innovative solutions. In Singapore,where these vehicles were the main elements in a major overhaul of the administration of justice in 1988-93, the number of cases awaiting trial in the Supreme Court was reduced by more than 90 percent, thetime to reach decisions in lower courts fell from 11-22 months to 4-6 months, and the world ranking ofSingapore's commercial judicial system improved from eleventh to first.
252
PSD Environment. The Commercial Judicial System
The policy recommendations presented below, while based on observations about deficienciesand needs in Lithuania, largely coincide with measures that have proven successful elsewhere.
Improving the Legislative Process
Many elements of an appropriate and smoothly functioning legislative process are essentially in place inLithuania. The enormous pressure on lawmakers of the great need for new and amended laws during thetransition of the legal system caused shortcuts to be taken in the process and reduced the quality of theend product in order to create a new legal framework in the shortest possible time. Whatever its faults,the basic legal framework is now in place and in need of a thorough review. International experiencesuggests that a meaningful and standardized legislative process, such as the one outlined below, althoughincluding many time-consuming phases, is in practice more expedient and, above all, will result in betterand more easily applicable legislation.
It is thus suggested that the government cause the following adjustments to be made to thelegislative process. First, the process of drafting and enacting a law should be standardized. Any newlaw or amendment to an existing law should essentially go through the same procedure. Although theinitiative in preparing new laws usually lies with the ministry with jurisdiction in the subject area of thelaw, as is the case in Lithuania, there should be unified "quality control" along the way by a specializedunit. This quality control should include the assurance of the legal correctness of the language and thepractical applicability of the law, as well as its conformity with (and, if necessary, the initiation ofchanges in) other legisllation. In case of changes to the law during the review process, this quality controlprocess must be repeated, including a control phase after the law has been passed by Parliament. Thisquality control, or at least its major steps, is usually assigned to a law preparation unit in the Ministry ofJustice. The government should consider implementing such a system in Lithuania, at least over themedium to long term. Since this apparently requires a considerable increase in resources and changes inprocedures of the Ministry of Justice, an alternative or atransitionary arrangement could be that the legaldepartment of Seimas take over part or all of this process. Although this department already performssome of these tasks, however, its capacity is already insufficient, and the need for additional resourceswould be considerable, A third, perhaps most practical, alternative would be to divide the responsibilitybetween the Ministry of Justice and the legal department of the Seimas. The latter would take overresponsibility when the law is submitted for review to the Seimas. Any of these alternatives requiresadditional resources, the preparation and approval by the relevant authority of clear and conciseprocedures for this quality control process, and the unequivocal assignment of the necessary authority tothe chosen unit(s). Such an arrangement, if properly realized, is likely to result in a considerable payoffover time in the form of more consistent, more easily implementable legislation, as has been the case inmany other countries. Possibilities for comprehensive technical assistance for this effort should beexplored.
In parallel, the practice of appointing a committee to make a proposal for a law or an amendmentto a law should be made standard for any law or amendment of significance. Time limits for thecommittees to prepare proposals have often been much too short, and should be set realistically, based onthe complexity of the task. The members of the committee should be experts in the subject fromgovernment, academia, civil society, and the private sector, including future "consumers" of the new law.The task of the committee should be to work out a proposal for the concept of the law, using internationalcomparisons to explain in detail what the law is intended to accomplish and how it should work and topropose an outline of the law or a first draft of the text. The proposal should be submitted to thecoordinating and law preparation unit recommended above for the drafting or finalizing of the law's text,drafting of necessary decree(s) to accompany the law, and drafting of amendments to any other laws anddecrees that need to be harmonized with the law in question. The unit should send proposals of any
253

PSD Environment: The Commercial Judicial System
significance-including drafts of laws, decrees, and amendments-for comprehensive review, withdeadlines for comments, to ministries and government agencies, but also to other interested parties,mainly in the private sector. A comprehensive and transparent review process should eliminate theoccasional appearance of several parallel drafts of the same law, which has caused considerableconfusion and delay.
In case the reading in the Seimas results in major changes to the law, or to the whole concept ofthe law, the proposal needs to be returned to the coordinating and law preparation unit, which willdetermine the need for resubmission-if necessary, all the way to the start of the process.
Increase the Independence of the Judiciary
Although the ultimate goal of the government is an independent judicial system, it currently appears to bemoving in the opposite direction. It has deemed it necessary to participate in and supervise theadministration of the judiciary more closely to achieve improvements in the functioning of the system.As mentioned before, increasing rather than limiting independence has usually been the best way torealize that improvement.
There are, in principle, several alternative approaches to achieving greater independence for thejudiciary. A basic element in the functioning of the judiciary, and thereby in its independence, is theallocation of resources for its activities-that is, who controls the budget. Today, the budget of thejudiciary is part of the budget of the Ministry of Justice and is controlled by the ministry. Very fewjudiciaries have full control over their own revenues and expenses, but many (Denmark, Chile, andHungary) have a large say in the planning and determination of the budget.
Although the country models of judicial independence have differences, they are usually basedon separate administrative bodies within the judiciary, governed by a board staffed mainly by judges andcharged with budgetary and administrative tasks. It is thus recommended that the Lithuanian governmentconsider proposing to the Seimas the establishment of a Court Administration Agency (CAA) to assist thecourts on issues concerning budgets and administration, along the lines of the Chilean model.Appropriations to the judiciary would remain in the sphere of the Ministry of Justice, but the budget ofthe judiciary should be separated from the budget of the ministry, and the judiciary should be given alarge measure of independence, both in regard to its budget and its administration. According to theMinistry of Justice, the Courts Department (referred to in footnote 11) will be vested with many of thetasks proposed for the CAA and is a more realistic alternative at this stage. However, as pointed outabove, since the Courts Department comes within the jurisdiction of the government rather than thejudiciary, the latter is unlikely to be able to exert much influence over this department. An alternativerealization of a CAA would be to make a plan for the gradual shift of the Courts Department to thejurisdiction of the judiciary. In case this alternative is realized, the judiciary should be given moreinfluence over the department at the outset-for example, by being given the right to nominate or appointthe director and at least part of the professional staff.
The CAA should be govemed by a board with representation from, but not control by, theMinistry of Justice. The Supreme Court Senate or Council of Judges could serve as such a board. One ofthe first tasks of the CAA would be to carry out studies of the gradual transfer of administrative tasksfrom the courts and the Ministry of Justice to the agency. Examples of functions to be transferred to theCAA would be preparation of budgets; administering, investing, and controlling the use of funds assignedto the judiciary; administering, acquiring, fitting, and maintaining buildings and furnishings for thecourts; providing technical advice concerning the design and analysis of statistical information and thedevelopment and application of computer systems; and organizing and supervising training and
254
PSD Environment: The Commercial Judicial System
examinations for judicial personnel. The CAA could also gradually take over functions relating to courtprocedures, such as case management, and the production, maintenance, printing, and distribution ofcourt records, decisions, and jurisprudence. This reform, if realized, would be a major effort, and shouldtherefore be realized in stages.
In addition, to be truly independent, the judiciary should have a major say in the appointment,promotion, and dismissal of judges in all courts. In no case should the judiciary's role in this regard bereduced from the role currently granted by the Law on Courts. The possibilities for nominations andappointments on political or other nonprofessional grounds should be eliminated as much as possible.This has been achieved in western Europe, for example, by excluding the executive branch from theprocess (France) or by a long tradition of decisionmakers adhering to proposals or recommendationsmade by judicial bodies (Nordic countries). The government should consider proposing reductions in therole of the Ministry of Justice in judicial appointments. As a minimum, it should consider proposing tothe Seimas that the Supreme Court or the Council of Judges be given the authority to designate andpropose candidates for appointments and promotions, as well as to propose dismissals from all judicialpositions. To maintain outside control of the judiciary, the Seimas (in the case of the Supreme Court) andthe Ministry of Justice (in the case of other courts) should continue to arrange for the inspection and auditof the business operations (but not the decisions) and the financial activities of the courts.
Training Judges and Other Court Personnel
The Lithuanian Judicial Training Center is off to a good start and enjoys broad support from thegovernment, the judiciary, and international donors. The Center should be supported and furtherdeveloped to become a major and long-term provider of training for judicial personnel. The action planof the Center is meaningful and correctly geared toward covering the most pressing needs for training.Nevertheless, even when operating at full capacity, the present and planned resources of the Center allowit to fill only a relatively small part of the large gap in knowledge and experience among judges and othercourt personnel. Although any expansion of its activities must be gradual because of the constraints inhuman resources and funding, the government should give high priority to continued strong support forthe Center and to securing regular and increasing budgetary funding for its activities. Although theMinistry of Justice and other interested parties should continue to be involved in the supervision of theCenter and contribute financially, the main responsibility should, in line with the suggested generalincrease in the independence and self-sufficiency of the judiciary, be transferred to the judiciary,preferably to the Supreme Court and the Judges Association.
Understandably, the Center has limited its initial activities to training of judges and other courtstaff. As noted above, the successful implementation of the new laws on commercial arbitration andbankruptcy requires a cadre of skilled and efficient arbitrators and bankruptcy administrators. In view ofthe considerable difficulties in getting bankruptcy cases through court, there is a special need for trainingand practice in bankruptcy procedures for both judges and administrators. Unless something is done toaddress this deficiency, the mere existence of the new laws will have little effect. Although the focus ofthe Center should no doubt continue to be on the training for judges, the government, in consultation withthe Supreme Court and the board of the Center, should consider including the above-mentionedprofessions among the targets of its training program over the medium term. Court lawyers and otherprivate lawyers could also benefit from, and would probably be interested in, taking part in trainingarranged by the Center. Participants from the private sector and from governmental units beyond thejudiciary should pay fees for participation, and could thus contribute to the funding of the Center.Because the Center has only recently started operations and has limited resources, an alternative solutioncould be to arrange separate training for arbitrators, and particularly for bankruptcy administrators.Training for the latter could possibly be arranged in conjunction with the recently established work-out
255

PSD Environment: The Commercial Judicial System
unit, Turto Bankas.'s
The Law on Courts contains provisions for appointing "candidates to local court judges."Persons who do not qualify for local judgeships because of their insufficient age or inadequate experiencecan serve as assistant judges for a year, and then be confirmed as ordinary judges. This way of movingyoung lawyers into the court system and alleviating the shortage of judges is expanded in the draftamendments to the law. This is an effort in the right direction, but the draft also includes less desirablefeatures. The major undesirable element is the provision that the entire process, from designatingcandidates to confirming final appointments, would be almost completely the responsibility of theMinistry of Justice. The government should consider sharing the responsibility for this system oftraineeships with the judiciary. The CAA, if established, could administer this process.
Judges in the local and district courts are not specialized and are hearing both criminal and civilcases, although there are separate panels for civil and criminal cases in district courts. The draftamendments to the Law on Courts encourage specialization, but at the same time limit periods of work inspecial fields to three years. The government should, in consultation with the Supreme Court, introducerequirements for specialization in various areas of commercial law. There is a particular need forspecialization in bankruptcy procedures, but also in other areas, such as contract law, intellectual propertylegislation, and financial legislation."9
State-sponsored university education for lawyers and other legal professionals needs reform.More and better-educated lawyers are needed, and there is no education available for other legalprofessionals such as prosecutors, bailiffs, and court secretaries. Lack of funds is clearly the mainhindrance to hiring more qualified teachers and improving teaching facilities and methods. One conceptbeing considered (mentioned earlier) is to improve the quality of legal graduates by instituting finalexaminations arranged and supervised by the Ministry of Justice. Such a system is unlikely to producethe desired results and would infringe significantly on academic freedom. An alternative strategy toimprove the quality of graduates-practiced, for example, in the Nordic countries-is to require a periodof training (usually 6-12 months) in court for graduation. In addition, the government, in consultationwith Vilnius University and possibly with other universities and colleges as well, should considerinstituting lower-level (bachelor) legal examinations for those interested in careers as prosecutors,bailiffs, court secretaries, and the like. Although possibilities for establishing significant, fully privateuniversities may be remote, the government should nevertheless remove any disincentives to theestablishment of such universities and actively promote their creation.
A crucial aspect of improving judges' skills is a viable code of ethics. The Judges Associationhas issued a one-page list of ethics rules, but a comprehensive code is missing. The government shouldinstruct the Judges Association to prepare such a code, and the association should also be maderesponsible for enforcing ethics, which should apply to all judges. The Ministry of Justice shouldinterfere only if enforcement is not effective.
18. The work-out unit (Turto Bankas), established as part of the governments' plan to restructure the state banks, isin the process of taking over the assets of the defunct Innovation Bank. Turto Bankas is, in effect, acting as aliquidator of the bank. The knowledge being accumulated within the unit could be utilized by assigning the taskof administering and liquidating bankrupt banks.
19. According to the Ministry of Justice, the limitation to three years on specialization in a particular field has beenremoved from the final text of the Law on Courts, which reportedly also includes the discontinuation of theCommercial Court.
256

PSD Environment. The Commercial Judicial System
Improving Court Procedures
Although cases pass through the courts relatively quickly in Lithuania in comparison with many othercountries, there are a number of measures that could be taken to improve the quality of court services anddecisions, and thus to increase public confidence in the judicial system. This, in turn, would likely resultin an increase in cases brought to court. Many of the measures suggested above are likely to result inimprovements in court procedures. More consistent and clear legislation facilitates reaching correct andjust decisions; better educated, trained, and motivated judges and other court personnel improveprocedures, decisions, and enforcement; and the CAA, if established, could spearhead efforts towardimproved court procedures.
There are several additional measures that would improve the flow and administration of cases.First, court functions, including case assignments and case management, should be computerized. InArgentina, computerization of case assignments enabled courts to avoid "judge shopping" (that is, thepossibility of choosing a judge of your liking to hear your case) and rationalized judges' work. InSingapore, automated case management contributed to the improvement of the country's judicial system,which has become one of the top-ranking systems in the world. Second, the tape recording of courtproceedings and automated production of court transcripts should be introduced to facilitate proceedingsin higher courts, in case of appeal, as well as in the lower courts. Third, court decisions should be storedelectronically, published, and made easily accessible to judges and the public. Fourth, the right of theSupreme Court to publish decisions and interpretations should not be decreased, as proposed in the draftamendments to the Law on Courts, but rather expanded to explicitly include publication andinterpretation of decisions of lower courts. Fifth, rules regarding court procedures should be tightenedand strictly enforced. IFor instance, hearing cases in appellate court, despite expiration of time limits,should be avoided. And the practice of issuing opinions by judges after appeals have been made shouldbe discontinued. Sixth, fines for dilatory tactics should be introduced and enforced. Finally, theenterprise register has become an unreliable source of information to the courts and other users becauseof a deficient law; as a result, the register contains insufficient and unreliable information. Thegovernment should review the law, the rules, and the functioning of the register with the aim ofimplementing a major overhaul.
Better Access to the Court System Through More Efficient Pricing
The cost of bringing commercial cases to court-mainly court fees and lawyers' fees-is a particularlyeffective deterrent to smrall and medium-size enterprises that would seek justice in court. Court fees arehigh in comparison with fees in the courts in western Europe, for example, and the practice of chargingthe fees up-front is particularly cumbersome (and sometimes unfair) for many prospective plaintiffs.Consequently, the government should review the court fees for commercial cases with a view tofacilitating access to courts. One alternative is to institute a system of relatively low, flat fees. Thiswould have the drawback of reducing income from fees (unless the number of cases increasesdramatically) at a time when government finances are strained. As an alternative, court fees could bemade payable "in installments," with an affordable first installment due at case registration (theregistering of ill-founded cases could be prevented by other means, such as giving judges a largermeasure of discretion to refuse cases), and with the last installment payable upon release of the judgment.There should also be an upper limit for the amount of the fee. The rule that losers pay the cost should bemade standard practice.
The government should also consider setting up a legal assistance program for commercial users.The program, which could be administered by the CAA, should provide for the possibility of coveringboth court fees and lawyers charges, in whole or in part. To avoid an excessive burden on the budget, the
257

PSD Environment: The Commercial Judicial System
program could be made restrictive, and available only to those most in need of such aid. Another way ofhelping those who cannot afford to bring disputes to court-a method practiced in the United States-isto form legal aid "clinics" run by the bar association and universities. Vilnius University is planning toarrange such clinics as part of the program for advanced students. The government should considersupporting this effort as part of a legal aid program.
Fostering Alternative Dispute-Resolution Mechanisms
Despite the apparent lack of need for alternative dispute-resolution mechanisms, the government shouldnevertheless provide a framework conducive to such mechanisms, both court-associated and private, andactively promote their use. This would diversify the possibilities for the resolution of commercialconflicts; provide cheaper, and often faster, alternatives to court procedures; and help avoid an increase inthe backlog of cases. Such an increase is likely to occur in the next few years with the growth anddiversification of the private sector and the increased propensity to seek justice in court that willaccompany growing confidence in the judicial system.
The government should thus consider proposing additions to the Law on Courts to provide forsome court-associated mechanisms. Several such mechanisms are possible. First, mediation and earlyneutral evaluation could be developed. In both of these practices, the parties to a pending suit, eitherthrough mutual agreement or at the instigation of the judge, try to settle the case out of court with the helpof a third party. In mediation, the third party-the mediator-only facilitates the mediation effort, whilein the early neutral evaluation, the third party, usually an attorney with expertise in the kind of caseinvolved, makes an early evaluation of the case to help the parties to come to a settlement. A secondmechanism includes the pretrial conference and settlement conference. In these cases, the judge hearingthe case or a designated "settlement judge" tries to mediate a settlement out of court, either before(pretrial conference) or during (settlement conference) trial. All these mechanisms are appropriate; iflegally sanctioned, they could be effective in Lithuania, and could lessen the time and the cost ofrelatively minor or clear-cut cases, and thereby allow the courts to concentrate on the more complicatedcases and help clear backlogs.
Despite the existence of a legal framework for private dispute resolution since mid-1996, privatearbitration has not gotten off the ground. To get things started, a productive approach would probably beto concentrate on institutional arbitration as the more organized, and therefore less unfamiliar, method ofdispute resolution. The government should make an evaluation of the arbitration law to remove allegedflaws, and should, together with the Lithuanian Lawyers Association (LLA), which is the founder of theVilinius International Commercial Arbitration (VICA), make an assessment of the workability of VICAas an arbitral institution. The rules and regulations of VICA should, if necessary, be changed to make thearbitration process workable and the awards enforceable. LLA should explore the possibilities ofestablishing an arbitration-promotion partnership with the Lithuanian Chamber of Commerce, a modelthat has been successfully applied in Poland and Slovenia, for example. The government, together withthe judiciary, should also launch an information campaign to encourage the use of private arbitration.Such a campaign should also promote the inclusion of arbitration clauses in commercial contracts.
A campaign to promote alternative dispute resolution mechanisms should, if it is to have a chanceto be successful, be preceded by training of judges, arbitrators, and mediators. Judges should beencouraged to promote alternative dispute resolution. As mentioned above, the Judicial Training Centershould include training in alternative dispute-resolution mechanisms in its program and should be allowedto include-for a fee-private arbitrators as participants in such training.
258
9PSD ENVIRONMENT: CORPORATE GOVERNANCE
This chapter reviews the status of the main determinants of corporate governance in Lithuania-that is,the ways of enforcing accountability on the management of enterprises by those who invest in them. Itattempts to consolidate the aspects of corporate governance indirectly treated in the other Policy Notes (inthis volume, see the chapters treating securities markets, banking, and privatization), to add some newaspects, and to analyze the information in a systematic way. Corporate governance is examined, mainlyfrom the viewpoint of the investors, and elements and structures of corporate governance in other areas,primarily Japan, the United States, and the western Europe, are considered in order to extract practicallessons and policy reconrmendations for Lithuania.
Corporate Governance-In the International and Lithuanian Contexts
In recent years, policy reform efforts, initiated partly as a result of constraints to private sectordevelopment (PSD) identified in the World Bank's 1995 Lithuania-Private Sector Development Report,have substantially improved Lithuania's business environment. Nevertheless, lack of adequate corporategovernance-that is, positive influence by shareholders, banks, and other interested outside parties onmanagement to improve performance-is one of the most serious remaining constraints to an efficiency-led increase in long-termn growth. The economywide enhancements to efficiency that were expected toresult from Lithuania's early and, in some respects, successful (voucher-based) privatization have notfully materialized. It is unlikely that they will come to pass unless remaining impediments to bettercorporate governance are removed; measures to increase transparency and to develop channels ofinfluence by providers of finance are introduced and enforced; and a framework for the emergence ofnew, strong categories of investors, such as pension funds and investment funds, is created.
The most effective systems of corporate governance have arguably been developed in countriessuch as Germany, Japan, and the United States. There are, however, important differences among them.While corporate governance in the United States and the United Kingdom is based substantially on legalprotection of investors, in much of Continental Europe and Japan there is more reliance on large investorsand banks.' In much of the rest of the world, legal protection of investors is considerably weaker, andownership is usually heavily concentrated in families and among a few large outside investors and banks.
The system of corporate governance in Lithuania is still underdeveloped; the legal protection ofshareholders and creditors is slight, although some improvements have been realized or are planned; andthe enforcement of rules and regulations intended to protect investors is generally weak (for example,
1. A. Shleifer and R. W. lVishny, "A Survey of Corporate Governance," NBER Working Paper 5554 (Cambridge,Mass.: National Bureau of Economic Research, April 1966).
259
PSD Environment: Corporate Governance
requirements for disclosure of information to investors by enterprises quoted on the stock exchange areinsufficient and inadequately enforced). In addition, during the first stage of privatization, a majority ofthe ownership of a large portion of the privatized enterprises was transferred to incumbent managers andworkers. The second stage of privatization has started on a cash basis, but many enterprises, particularlymany of the largest, remain state-controlled. These forms of concentrated ownership, as one wouldexpect, have not led to good corporate governance. Most state-controlled enterprises are poorly run andmanagers have little or no incentive to improve performance, especially in the large, infrastructure-relatedenterprises that operate in nontradable markets. Also, many of the large enterprises that have asignificant or majority insider stake (such as the agro-industries) have restrictions on transfer of shares.Because such enterprises are generally internally financed, there are often no outside agents with thepower to control insider abuse, poor management, or moral hazard behavior. And finally, the capitalmarket in Lithuania is still in its infancy. There is an almost total lack of domestic institutional investors,such as investment funds, pension funds, and insurance companies, in the markets.
According to the survey of private enterprises presented earlier in the volume, Lithuanianbusiness managers and employees hold, on average, two-thirds of the shares in privatized companies andabout half of the shares in newly established enterprises. In privatized companies, there has been anotable shift from employee ownership to management ownership after privatization. Although notdirectly brought out by the survey, enterprises dominated by management and employees are generallythought to have been inefficiently run, and restructurings and reorganizations have been uncommon.Misappropriation of company resources in favor of management and other actions to the detriment ofnonmanagement shareholders have also been frequent. Such misappropriation or outright fraud have, forexample, been major reasons for the demise and ultimate bankruptcy of most failed banks. Most of theseobservations can also be made for enterprises with less or no management or employee ownership.Because of both deficiencies in company legislation and bad or fraudulent practices, outside shareholdershave had little influence on the way companies are run and managed. According to the above-mentionedenterprise survey, only one-quarter of managers interviewed were of the opinion that shareholders werethe main decisionmakers in the major issues in their enterprises.
Key Constraints to Better Corporate Governance in Lithuania
Weak Legal Protection of Investors
There are several main weaknesses in Lithuania's legal framework that make effective corporategovernance by investors, irrespective of their size, difficult, and sometimes impossible. First, while inprinciple company legislation in Lithuania provides a reasonable framework for corporate governance byshareholders, many rights and protective rules explicitly or implicitly afforded to shareholders in mostindustrial countries are missing. The duties of managers to serve the interests of shareholders first are notdefined in the Company Law. The law sets forth a general obligation of management to act inaccordance with the law and the bylaws and decisions made by management bodies, but there are fewexplicit obligations or restrictions-such as restrictions on self-dealing by management and excessivecompensation, a requirement to consult with the board of directors or shareholders before makingimportant decisions, and the like. The requirement to refer decisions to sell, transfer, lease, or mortgagefixed assets exceeding 5 percent of the enterprise's authorized capital to a shareholders' meeting isreportedly not often met. Mechanisms that enable shareholders to interfere in management decisions,impose the will of shareholders on management, or change management through proxy solicitation andprocedures and rules for takeovers are not included in Lithuanian legislation. Individual and minorityshareholders, in particular, are generally referred to the courts to repeal decisions of the management andthe board of directors. (The deficiencies in company legislation in shareholder protection, and
260
PSD Environment: Corporate Governance
recommendations for improvement, are included in the chapter on the securities market.)
Second, listing on the Lithuanian Stock Exchange does not yet require enterprises to disclosesufficient information, and disclosure requirements are frequently not observed or are followed withconsiderable delay. Although the basic legal and institutional framework for securities trading is in placein Lithuania, disclosure rules, of both financial and nonfinancial information, and the critical enforcementof compliance need to be substantially improved. With the exception of a handful of enterprises-mainlythose quoted on the official list (currently only 5 out of around 250 firms listed and traded on theexchange)-the information provided for public consumption is often scanty and unreliable. Informationis provided late, if at all, and with long intervals, often as much as a year (at least quarterly disclosure isrequired in all major stock markets in Europe). The Securities Commission has issued a detailed list ofso-called special events (incidents that are likely to affect the price of the enterprise's shares) that must bereported to the commission, the stock exchange, and the media within five days of the&r vccurrence. Thisobligation is persistently disregarded despite numerous sanctions by the commissien (in 1996, forexample, the commission imposed sanctions on management in the form of fines, mainly for violations ofdisclosure requirements, about 100 times; one of the major banks, which in June was warned aboutviolations of provisioning rules, did not provide information about the incident until November). Also,the five-day limit for reporting special events seems too long-it is certainly overly generous comparedwith most stock markets in Europe, where such events must be reported immediately.
Third, although the Law on the Principles of Accounting requires accounting practices forenterprises to be in accordance with international standards, Lithuania lacks a system of accounting andauditing based on such standards (the banking sector is an exception; audits based on internationalstandards were introduced in 1995, and accounting based on international accounting standards becamemandatory as of I January 1997). Accounting regulations are scant and very general, but their veryvagueness leaves roomi for accounting and financial statements that are close to international standards.In practice, however, few enterprises in Lithuania, other than banks, present financial information inaccordance with such standards. The main demand-and in the case of most enterprises, the onlyexternal demand-for financial information comes from the tax authorities. Accounting practices havethus largely been formed by the requirements of the taxmen, and therefore differ in many respects frominternational accounting rules. These requirements are not eliminated by audits, because accounts are notalways audited. When they are, with a few exceptions, it is not in accordance with international auditingstandards. The accounting law is currently being thoroughly revised. As it currently stands, the draft ofthe new law is, in principle, based on international standards and European directives and includes someimprovements. According to accounting professionals, however, it still has many flaws and includes alarge number of detailed provisions and standard charts of accounts that would make it rigid,unworkable, and cause it to deviate from international and European Union (EU) standards. The draftattempts to conform accounting to the demands of taxation, when, as mentioned, taxation should conformto accounting. The draft includes provisions that cover areas treated in other. laws and may possiblyconflict with those laws. The important international accounting standard (IAS) principles of "substanceover form" and "true and fair" view are difficult to implement in accordance with the draft law. Therehas been no discussion of the concepts involved, and the draft was prepared without consulting localaccounting and auditing professionals. Even if a new and better law is passed, the main problem will stillbe implementation and enforcement. There is currently no law on auditing, but such a measure is underpreparation. Company legislation and stock exchange regulations, however, do include provisionsregarding auditing, but these are insufficient and not generally enforced. Most enterprises, including alarge number of the 645 enterprises listed on the B list of the stock exchange, are not audited by licensedauditors. Only a handful, including those listed on the official list of the stock exchange, are audited in
261

PSD Environment: Corporate Governance
accordance with international auditing standards; many enterprises are not audited at all.2
Until recently, the government, through the Accounting Methodology Department of theMinistry of Finance, has been the only regulatory authority in the areas of accounting and auditing. Ashas been the case in most other countries in similar situations, the authorities have had difficulty keepingup with the rapidly developing and changing demands of the private sector. While the governmentretains the ultimate authority in these areas, the Lithuanian Auditing and Accounting Institute (LAAI)was set up in 1996 as a semi-autonomous body to develop accounting and auditing standards andpractices and to license auditors. LAAI, although it has had a good start, is still in its infancy and hasvery limited resources to carry out its tasks. In practice, LAAI has mainly been involved in tasks relatingto auditing (training and licensing auditors and preparing auditing standards). What it will accomplish inthe area of accounting standards is unclear. The members of the LAAI board are mainly civil servants,and only one of its seven members-an auditor-is from the private sector. LAAI receives no fundingfrom government other than the value of the premises put at its disposal at no charge. It is financing itsactivities through licensing fees, by arranging training for auditors and accountants, and by charging forpublications.
The effect of weak accounting and auditing standards on corporate governance is compounded bythe absence of credit-rating agencies and other institutions that provide general and specific marketinformation. In addition, the quality of the economic information provided by independent news media,both printed and electronic, is allegedly not high, a likely consequence of the lack of a tradition anddemand for such reporting.
Fourth, the Lithuanian judicial system-the subject of a separate Policy Note-is still in an earlystage of development and has some distance to go before it will become a smoothly functioning,independent branch of govemment. The Law on Courts provides for the establishment of commercialcourts to solve commercial disputes. Only one such court-the Vilnius Commercial Court-has actuallybeen established. This court has very limited resources and capacity, and the judges in this and othercourts have little training and experience in solving complicated commercial cases. Few cases againstmanagers or board members of commercial enterprises have been brought to court by shareholders. In afew instances, charges of fraud or other criminal acts have been raised against managers and boardmembers, and in some of these cases managers have actually been prosecuted. Shareholders, however,have gained little or nothing from such prosecutions. Lack of confidence in commercial courts, and inthe court system as a whole, and lack of knowledge about the judicial system and its workings are likelythe reasons that Lithuanian shareholders and other investors are not yet trying to exercise their corporate
2. There is currently considerable debate in Lithuania regarding the desired degree of self-regulation in the fields ofboth accounting and auditing. Government representatives are inclined to maintain, or even expand-at least forthe time being-the state's role in regulating and supervising accounting, while the private sector prefers thegradual transfer of regulation to a private, or at least independent, body such as the Lithuanian Auditing andAccounting Institute. Of the two other Baltic countries, Latvia has recently chosen to transfer most of theregulatory and supervisory functions for accounting and auditing to the private sector. The Latvian Associationof Certified Auditors is in the process of preparing new Latvian accounting and auditing standards based oninternational accounting standards, intemational standards on audit, and EU directives. In Estonia, in contrast,these regulatory and supervisory functions are vested in a governmental agency, the Estonian Accounting Board.This agency, however, enjoys a large measure of independence, and the private sector is represented on its board.
262

PSD Environment: Corporate Governance
governance rights through the court system.3
Fifth, the size-specific legal protection afforded minority shareholders in many developedsocieties is still partly missing in Lithuania (in addition to protection for shareholders as a whole). Forexample, mandatory systems of cumulative voting, qualified majority, and supermajority requirements inmajor decisions; extensive disclosure requirements; and explicit obligations for managers to runcompanies in the interest of all shareholders, not just majority shareholders or insiders, are lacking in thecountry's legislation. Moreover, although Lithuanian company law requires a two-thirds majority forsome basic decisions (for example, approval of annual accounts, increase of share capital, and liquidationor reorganization), other areas are not covered. Managers, especially owner-managers, are known tohave jawboned small shareholders, particularly employees, into supporting them or selling their shares tomanagement. Evidence of the latter can be observed in the changes in ownership patterns chronicled inthe enterprise survey mentioned above: employee ownership in privatized enterprises decreased by halffrom 1991 to 1997, with a corresponding increase in ownership by management.
Finally, in Lithuania, the legal framework has been debtor-biased-favoring shareholders overcreditors and weakenijng creditors' ability to exercise "outside" pressure on nonperforming managers-until very recently. (The Lithuanian situation in this regard is discussed in the Policy Note on theLithuanian banking sector and is therefore only briefly touched upon here.) The Law on Bankruptcy hasbeen extensively amended and now gives creditors first priority to the full extent of their collateral(previously, several categories of creditors were prioritized ahead of collateral-holders), but it does notclearly address recovery through disposal of collateral outside the bankruptcy process, a common practicein western Europe and the United States. New and amended collateral laws and laws on the registrationof liens have also recently been adopted, but are not yet fully implemented. As a result, banks, the onlylarge private creditors in Lithuania, have not yet assumed a significant role in corporate governance.Banks, and the banking sector as a whole, are still small, even in relation to the Lithuanian economy.Lending to the corporate sector remains insignificant-total lending by banks is about 12 percent of 1996GDP-although a few of the stronger banks have begun increasing their lending volumes and improvingcredit analysis capabilities significantly. Despite existing shortcomings, the use of banks as largecreditors may still be one of the quickest and most realistic ways of improving corporate governance inLithuania. Their power comes, in part, from control rights through default and debt covenants in loanagreements, and in part because they typically lend short term, so borrowers must return at short intervalsfor more funds.
Absence of Large Investors
The most direct form of outside control of enterprises is concentrated nonmanagement ownership. Thiscan take the form of majority ownership by one shareholder or a substantial minority ownership stake byone or several investors. Experience around the world shows that large shareholders play an active rolein corporate governance and that their presence is associated with better performance.4 The other side of
3. In March 1995, Lithuania became the first Baltic country to establish a (well-functioning) Seimas Ombudsman'sOffice, based on the Swedish model, which hears citizens' complaints about abuse of official position orbureaucracy by officials of the central government, the municipalities, and the army. This includes complaintsagainst officials in the Ministry of Finance and Tax Inspectorate for abuse in taxation matters. In 1996, close to1,300 complaints were filed with the Seimas ombudsman. Of these complaints, close to 1,000 cases wereinvestigated or rejectecl. In time, the ombudsman could become a means for shareholders to exercise their rightswhen the system proves to be ineffective.
4. Shleifer and Vishny, "Ak Survey of Corporate Governance."
263
PSD Environment: Corporate Governance
the coin, however, is that large shareholders represent their own interests, which may not coincide withthose of the enterprise or other shareholders. The risk of such a divergence of interests increases with theavailability of classes of shares that give one class superior voting rights over other classes-for example,if control rights exceed cash flow rights. Large shareholders may expropriate enterprises at the expenseof other shareholders, management, or employees. On balance, however, the positive influences of largeshareholders dominate, especially in developed economies; there is little evidence of serious abuse orexpropriation in countries such as Germany, Sweden, and the United States.5
There are few large shareholders in Lithuania other than the government and managementinsiders, neither of which has been known for inducing good corporate governance. There is also a totaldearth of institutional investors. The voucher-based investment funds that played a large role in the initialprivatization effort have all but disappeared, partly as a result of the amended legislation on investmentfunds that requires the funds to reorganize. Pension reform is under way, but the emergence ofinstitutional investors under the new compulsory or voluntary pension schemes that have been envisionedis still years away.
Similarly, the market for life and property insurance is still very small in Lithuania. Insurancecompanies are thus small, and play almost no role as investors in the securities market. (As acomparison, in Finland, where the securities market is more developed than in Lithuania, but still farbehind the markets of countries such as the Germany, the United Kingdom, and the United States,investments by insurance companies in the securities market totaled US$30 billion at the end of 1996,which was about 25 percent of the market's capitalization.) The insurance sector is dominated by onestate-owned insurance company (Joint-Stock Company Lithuanian Insurance), a legacy of Soviet times,with about three-quarters of the market. It is inefficiently run and has required government support. Itsmain business is the insurance of apartment buildings and single-family homes, which by law must beinsured for fire. Liability insurance for cars is not mandatory, and a very small percentage of cars haveeven rudimentary insurance. The introduction of mandatory liability insurance is under discussion.
The banking sector-although more developed and larger than the insurance sector-is stillrelatively small and weak. Banks are not significant investors in the securities market, mainly because ofthe restriction on investments in shares (a bank is allowed to invest a total of 10 percent of its equity inshares of nonfinancial enterprises).
Finally, foreign investment in Lithuania is still modest (despite a marked upward trend since thechange in government at the end of 1996), and the impact of foreign shareholders on corporategovernance has been small. A recent survey of foreign investors in Lithuania conducted by theLithuanian Investment Agency (recently renamed the Lithuanian Economic Development Agency, after amerger with the Lithuanian Export Promotion Agency) indicates that, although the general attitudetoward foreign investment has improved and discrimination against foreign investors has decreased, thereare still many obstacles in the way of foreign investment, and Lithuania still ranks behind Estonia andLatvia in attractiveness for foreign investment. The most severe constraints in the perceptions of foreigninvestors, according to the survey, were related to legislation and regulation (frequently changing, vague,and nontransparent laws and regulations, exacerbated by heavy bureaucracy), the tax system (unclear andfrequently changing rules, low predictability, confiscatory administration), the customs system, andrestrictions on landownership.
The entrance of large investors into the market is further complicated by the absence of hostile
5. Shleifer and Vishny, "A Survey of Corporate Governance."
264
PSD Environment: Corporate Governance
takeovers in Lithuania (a problem common in other east European countries as well). This is an unknownphenomenon for a variety of reasons, but mainly because of the structure and stage of development of thecorporate sector, the lack of provisions for such activities in the legislation, and the underdevelopedsecurities market. Corporate takeovers, mainly hostile takeovers, even the possibility of a hostiletakeover, can serve as a powerful corporate governance mechanism. In a hostile takeover, one or a fewcorporate bidders generally make an offer to the dispersed shareholders of the target enterprise, and if theoffer is accepted, they acquire control of the enterprise. The targets often have shown poor performance;the management is replaced and measures to improve performance are introduced. In the United Statesand the United Kingdom, where large shareholders are less common, takeovers have been viewed as acritical corporate governance mechanism. Nevertheless, the history of takeovers, particularly in theUnited States, is checkered, and their effectiveness in corporate governance is questioned by many. Inother countries, hostile takeovers are rare, partly because of political opposition. Also, takeovers requirea liquid capital market, one that can give access to large amounts of capital on short notice.
Inadequate Legal Frameworkfor Board-Management Interaction
An important part of the owners' governance-related rights and responsibilities in the operation of anenterprise is usually exercised through its board(s). Some countries (such as Germany and theNetherlands) have a two-tiered structure, with a supervisory board and a board of directors. In mostcountries (including Japan, the United Kingdom, the United States, and the countries of Scandinavia),enterprises operate witlh a single-board system. In countries with tiered systems, the supervisory boardsusually have nonexecutive (outsider) members, and the board of directors is mainly composed ofexecutive (insider) members. In theory, the supervisory board serves as the shareholders' "prolongedarm" for corporate governance and as a link to provide two-way communication between shareholdersand management. In practice, there is some question of whether supervisory boards, which usually meetonly a few times a year, have been effective in enforcing accountability of management. As a result,some countries (such as Finland) have been moving away from a two-tier structure toward a single-boardmechanism. Single-beard systems vary in the proportions of executive and nonexecutive directors, buttend to be dominated by insiders, which also raises questions about their effectiveness in corporategovernance. There are many proponents of a single-board system with exclusively-or at leastmajority-outside directors as the preferred system for effective corporate governance. (For example,Denmark, Norway, and Sweden have adopted single-board systems, with only nonexecutive directors.)Such a system-to be effective-requires that the size of the board be limited, that the board members areappropriately qualified., that the positions of chairman of the board and the chief executive officer be keptseparate, and that the board meet frequently enough and have sufficient power to enforce accountability.
Lithuania's Company Law provides for a choice between a tiered system; a single-board system;and, in the case of private companies, no board at all. Supervisory boards, if established, may only havenonexecutive directors, while boards of directors may include both executive and nonexecutive directors.If an enterprise chooses a single-board system, the rules governing the composition and powers of theboard follow those of the supervisory board. In practice, Lithuanian enterprises use both two-tiered andsingle-board systems. Recently, however, there has been a trend toward only one board. In both cases,the boards have often been formally or informally dominated by insiders or a few large managementshareholders. Supervisory boards in Lithuania have not been very effective instruments for enforcingdiscipline on management as a rule, and the real decisionmakers have been the management boards.Knowledge and information about the enterprise is not always shared with the supervisory board or isdeficient or inaccurate. For example, the supervisory boards of many of the failed Lithuanian bankscould do little to stop expropriation, and were, directly or indirectly, dominated by management and a fewowners (often having only small direct shareholdings). Also, members of enterprise boards can, by law,
265

PSD Environment: Corporate Governance
be reimbursed only out of net profits, which increases the uncertainly and lessens their incentive toparticipate in companies that require major restructuring.
Much of management's domination of supervisory boards and shareholders' meetings is anoutgrowth of the Company Law. Although it obligates management to act in accordance with law andthe bylaws and board decisions of an enterprise, it does not impose "duty of loyalty" toward the companyor the shareholders, and while it requires management to compensate the company for losses that are"their fault," it does not specify penalties for breach of this duty. The only penalties imposed onmanagers, other than penalties decided by courts in a civil or criminal suit, are imposed by the SecuritiesCommission for breach of the disclosure rules mentioned above. The general threat of sanctions has notprevented managers from acting in their own interest to the detriment of shareholders, particularly sincethe risk of such behavior is quite low, both because of the deficiencies in the legislation and becausesanctions have been difficult to impose in practice. A much-discussed complement to these "sticks"embodied in the law is the "carrot" of incentive contracts; that is, agreements between the enterprise andmanagers on performance-based remuneration and other benefits that could align the interests ofmanagers with those of investors. Effective incentive contracts, however, are not easy to establish; theevidence of correlation between incentives and performance is not always clear, and high-poweredincentive contracts may create enormous opportunities for self-dealing by managers if poorly negotiated.In addition, long-term contracts are needed to avoid actions by managers that may be beneficial toinvestors in the short run, but detrimental in the long run. All of these factors would be difficult tocontrol given Lithuania's legal, judicial, and accounting frameworks. Incentives in the form of stockoptions and warrants remain unknown in the country. The Company Law speaks vaguely of suchinstruments (in somewhat contradictory language, it also requires payment for all shares issued), but thereare no instructions regarding how such instruments should be structured and treated. For all thesereasons, incentive contracts are rare in Lithuanian enterprises and are confined mainly to cash bonuses.
High Degree of State Ownership
Some 30 percent of Lithuania's GDP is still produced by state-owned or state-controlled assets. Energy,telecommunications, infrastructure, and part of manufacturing industry are still in state hands. While thecountry is moving toward full privatization-fourteen large enterprises are on a special list for case-by-case privatization and close to 800 small and medium-size enterprises (many with minority stateholdings) are scheduled for sale-the first such large privatization has yet to take place, and there islimited knowledge or experience in this field. The privatization of the large number of minority holdings(in such varied activities as production of pumps and compressors, retail trade in fruits and vegetables,dental surgery, and public baths) is progressing slowly, and not very efficiently; much of this activity isthe byproduct of the earlier voucher-based disinvestment effort. (The privatization process is the subjectof a separate Policy Note.) Experience with majority state ownership-a record of inefficient, outdated,and often loss-making enterprises-shows that the government has not been exerting effective corporategovernance. Of some 2,000 enterprises with state ownership (ranging from I to 100 percent), thegovernment is represented in the boards of about 200. The State Fund of Securities administersapproximately 1,200 minority holdings (an average of 1I percent ownership) of the state, but thegovernment is not represented on their boards. The priority of the State Fund is not to influencedecisionmaking in these enterprises, but to prepare information and plans for their sale. Sinceestablishment of the fund in 1993, however, only some 100 shareholdings have been sold. Its staff of tenhas concentrated primarily on collecting information rather than actively participating in corporatestrategies-with an average of 120 companies for each staff member, it would be impossible for the fundto closely track management performance on a continuous basis. Assorted ministries also administermajority shareholdings of the state as "founders." The most important ministry in this regard is the
266

PSD Environment: Corporate Governance
Ministry of National Economy, which is the founder of 250 enterprises, among them all the large,infrastructure-related enterprises. The ministry is represented on the boards of the approximately 100enterprises in which the state holds a majority of the shares. Representation is at the ministerial or vice-ministerial level in a handful of the most important enterprises, and usually involves more than oneperson representing the state (for example, representation from the Ministry of Finance as well).Representation in other enterprises is provided from the level of department director to division deputyhead. The ministry has a special department to manage those holdings, and a total of approximately thirtypeople act as board members and take part in shareholder meetings.
Policy Recommendations
Several important measures to enhance corporate governance are presented in policy recommendations inother Policy Notes (the chapters that discuss the securities market, judicial system, banking sector, and soforth); they are mentioned, but not repeated, here. Only recommendations directly related to corporategovernance and not discussed elsewhere are listed below.
Improving the Legal Protection of Investors
MANAGEMENT- DUTIES AND SHAREHOLDERS' RIGHTS. The Policy Note on the securities marketrecommends changes to company legislation to clearly delineate the obligations and responsibilities ofmanagers of publicly held enterprises and to improve the rights of shareholders, particularly minorityshareholders. Such changes to company law should be extended to all enterprises. Although nonlistedenterprises are usually smaller and more closely held, and therefore easier to control for shareholders,minority shareholders in such enterprises need protection as much as minority shareholders in publiclyheld companies do, particularly in view of the absence of the protection afforded by listing and tradingprivileges on the stock exchange.
Company law in many countries (such as the Nordic nations) goes beyond requiring themanagement and board of directors not act or make decisions in breach of laws and company bylaws andregulations. It imposes the positive obligation on managers and directors not to take actions that will, orare likely to, benefit selected shareholders or other persons at the expense of the other shareholders or thecompany. Such legislation usually does not detail penalties for violations of these obligations, but it doesrequire managers ancl directors to provide compensation for the damage caused by their willfulmisconduct or negligence. The law in these countries can thus be said to be biased in favor ofshareholders, and it places a high degree of responsibility on management and boards of directors to actprudently and in favor of the company and its shareholders. Moreover, provisions governing proceduresfor filing suits against managers and directors, special rights for minorities to file such suits despitemajority decisions to the contrary, and special procedures for court proceedings and arbitration indisputes between shareholders and management and directors are also usually part of company law.Because of the dearth of legal tradition and jurisprudence in this field in Lithuania, legislation should giveshareholders greater and more specific protection against the consequences of misconduct by managersand directors than is the case in the developed countries. Accordingly, the duty of loyalty should beclearly spelled out, and penalties, in the form of maximum fines and imprisonment, should be defined inthe Company Law (as is proposed in the draft of a new accounting law; see below).
ACCOUNTING AND AUDITING. Drafts of a substantially amended accounting law, the Law on theAnnual Financial Statements, and of an audit law, the Law of the Republic of Lithuania on AuditProcedures, have been prepared. These draft laws should be reviewed by experts, especially accountingand auditing professionals. The laws should be in agreement with and clearly spell out the requirement
267

PSD Environment: Corporate Governance
that international standards and EU directives serve as the basis for Lithuanian accounting and auditingstandards.
As explained earlier, taxation has largely driven both accounting and the preparation of financialstatements. In contrast, in most of Europe and in North America, accounts and financial statements areprepared on the basis of standards designed to give a true and fair view of the financial position andresults of the enterprise. Such financial statements, usually with certain adjustments, form the basis fortaxation. Thus, Lithuanian accounting standards should also be made applicable to accounting and thepreparation of financial statements for tax purposes, and they should be made binding for tax collectors.
In addition, the draft accounting law goes into considerable detail (189 pages, including tables),and includes standard forms of financial statements and standard charts of accounts. Such forms andcharts should be specimens rather than standard to allow for adaptation to the differing needs ofenterprises. They should be issued by the relevant ministry or by a regulatory body rather than includedin the law.
The draft accounting law suggests the creation of a "Commission for Accounting and AuditStandards" run by the Ministry of Finance. It is recommended that the Lithuanian Auditing andAccounting Institute (LAAI) be designated as regulatory body for this law. While the ultimate regulatoryauthority-the power to approve Lithuanian accounting standards and major changes to such standardsand accounting principles-should, at least for the time being, rest with the Ministry of Finance, thegradual shift toward self-regulation of accounting and auditing by the private sector is likely to benefitboth the government and the private sector through better and more transparent financial statements anddisclosure of financial and related information. This has been the experience in many countries (forexample, in Finland and Sweden) where bodies appointed by the appropriate ministry, but consistingmainly of experts from the private sector, issue accounting standards and regulations, interpretations ofaccounting laws and regulations, and opinions relating to accounting at the request of individualenterprises or organizations. Similarly, auditing regulation has-in the Nordic countries, the UnitedKingdom, and the United States, for example-been assigned to professional organizations of charteredaccountants or licensed auditors.
The designation of LAAI as the regulatory body will require considerable strengthening of itsorganization and funding. This is not an easy task, in view of the limited availability of individuals withrelevant education and sufficient experience. Nevertheless, it is preferable to trying to build up suchcapacity and experience within the civil service. The Ministry of Finance is currently the only "founder"of LAAI. Licensed auditors should be given a greater say within the LAAI, and in the medium term-ifnecessary, by amending relevant legislation-they should be admitted as founders of LAAI. This wouldbe particularly appropriate if auditing firms, which already pay a large part of the costs, paid an annualfee to the LAAI as proposed in the draft auditing law.6 The Board of LAAI should also be reconstitutedto include a majority of representatives from the private sector, mainly licensed auditors and experiencedaccountants. LAAI has formed, and is forming, committees of participants, mainly from the privatesector to work on issues such as accounting standards, auditing standards, ethics for auditors, andeducation and training. The LAAI badly needs more staff and larger premises to be able to cope with itsincreasing responsibilities, even if one excludes the suggested additional tasks. At the same time, LAAI
6. A problem in this regard is that there are presently three competing organizations representing auditors, and, tosome extent, accountants. The govemment and LAAI could contribute to the formation of one nationwidefederation by forming a "roof-organization" for licensed auditors registered with LAAI. Auditors could belongto this organization as individuals or through one of the existing associations.
268

PSD Environment: Corporate Governance
has recently been assigned to take care of training and licensing of enterprise evaluators (who participatein the evaluation of enterprises slated for privatization), which is not the area of its expertise and has littleto do with its main tasks. Despite increasing revenues from the private sector, partial funding from thestate would be necessary for LAAI to effectively perform the role assigned by the government and tomanage the burden of increasing activities and new tasks, partly as a result of the above proposals. Thepossibility of donor financing for the build-up and training of LAAI's organization should be explored.Over the medium to loirig term, LAAI could become largely, or even entirely, self-financing. In sum, thegovernment should strengthen the organization of LAAI, reconstitute its board, and provide the necessaryadditional funding as detailed above.
In western Europe, it is customary that all companies be audited in accordance with "goodauditing standards," effectively international standards. In addition, many countries (such as Denmark,Finland, and Norway) require large and medium-size enterprises (in Finland, for example, these aredefined as enterprises with annual sales in excess of $30 million, or more than 300 employees) and allenterprises quoted on stock exchanges to be audited by highly qualified, specially licensed auditors. TheLithuanian draft auditing law requires enterprises with sales exceeding Lt 0.5 million, total assetsexceeding Lt 0.25 million, or twenty employees or more to be audited by a licensed auditor. Theprovision does not ensuare that the audits are of an international standard. Audits based on internationalstandards on audit (ISA), or Lithuanian standards based on ISA, should be made mandatory for allenterprises traded on the stock exchange and for large (in.the Lithuanian context) enterprises, irrespectiveof whether they are traded or not.
Finally, although it does not necessarily require legislative action, an essential prerequisite for animprovement in the standard of accounting and auditing is the availability of appropriate education andtraining for accountants and auditors. LAAI is arranging training for both auditors and accountants andexpects to increase such activities in the future. LAAI has had, and still has, EU-Phare funded assistancein this effort. While LAAI's efforts in this area are important and should be supported by the governmentand donors, it cannot be expected to take on this rather formidable task on its own. Private efforts shouldalso be encouraged ancl supported. One initial and temporary form of such support could be to arrange,under the auspices of LAAI, training for trainers, both from LAAI and the private sector, to be funded(but not delivered) by the state. In the medium term, the possibilities for establishing a training centeralong the lines of the Lithuanian Judicial Training Center should be explored (see Policy Note on thecommercial judicial system), possibly within LAAI or as a combination of LAAI and private efforts. Inmany countries in western Europe, arranging for the training of auditors and accountants is mainly aprivate activity, carried out by professional organizations, by chambers of commerce, and throughcommercial courses arranged by business schools. Privately funded and arranged training, however,cannot be expected to become significant in Lithuania in the near future. The government should thussupport and competitively allocate funding for both the efforts of LAAI and the private sector to arrangeappropriate education and training for accountants and auditors.
Improving Corporate Governance Through Large Investors
With the exception of the state and management insiders, there are very few large investors in Lithuania.The Policy Note on the securities market suggests policy measures to build domestic institutionalinvestment capacity by enabling and facilitating the emergence of investment and pension funds.(Pension reform is also discussed in detail in a separate Policy Note.) A third category of potentialinstitutional investor-insurance companies-already exists in Lithuania, but the insurance sector isinsignificant and state-dominated, and insurance companies are small and their activities in the securitiesmarkets, and therefore their impact on corporate governance, is negligible. The government should
269

PSD Environment: Corporate Governance
review the status, legislation, and regulation of the insurance sector-both life and property insurance-and identify policy options that would promote the development of an insurance industry led by theprivate sector that could eventually become an active participant in the domestic capital market. Further,the government should consider privatizing all its stakes in insurance companies.
Improving Corporate Governance Through Banks
Although Lithuanian banks are still too small to have a significant impact on corporate governance,banks, as large creditors, in addition to foreign direct investors, may still be Lithuania's best hope incorporate governance in the short run. In addition to amendments to the legal framework to removeimpediments to increasing the volume of (quality) loans, several other measures should be taken tofacilitate (safe) lending. The Policy Note on the banking sector suggests measures to implement lawsrelating to collateral and the registration of collateral, to enable lending in foreign currencies, and topromote syndicated lending. The privatization of all state banks would, almost by definition, improvecorporate governance. Representation by banks on the governing bodies of client enterprises would be adirect way to exert influence. In Japan and, in particular, in Germany, where creditors have strong rights,banks are frequently represented on the boards of enterprises. In Lithuania, there are no legal hurdles toboard membership by bank representatives, but in practice such cases are rare. The severe restrictions onshareholdings by banks mentioned earlier (10 percent of equity) preclude bank representation onenterprise boards as shareholders. Nevertheless, bank representation on boards could have considerabledisciplinary effects on enterprise management and contribute to better portfolio quality of banks,particularly in enterprises dominated by insiders. The government could, in consultation with Bank ofLithuania, consider proposing changes to the banking regulatory environment to encourage banks toinclude good representation clauses in case of large lending contracts.
Improving Corporate Governance Through Board-Management Interaction
The Lithuanian system of one or two external boards (or possibly no board, in the case of privatecompanies) is outdated and apparently is not working well. The boards of directors are often dominatedby insiders and leave little opportunity for supervisory boards to have a strategic influence on the wayenterprises are run. This is also one of the reasons that most countries have, or are now moving to, one-board systems, with all or majority outside membership. (This, of course, does not exclude enterprisesfrom having intemal management boards, which can be prescribed by their own bylaws.) In mostcountries, board members' fees are considered normal business expenses rather than being paid out ofprofits, as in Lithuania. The government should consider proposing changes to the Company Law tointroduce a governance system with one external board with at least a majority ofnonexecutive members,with only nonexecutive members eligible to be chairman, and with board members' fees paid as normalbusiness expenses (not exclusively out of net profits). To give minority shareholders a larger measure ofinfluence, the introduction of cumulative voting in enterprise elections should be considered.
The Company Law should include both "sticks" and "carrots" to prompt management to performtheir duties in the best interests of the enterprise and the shareholders. Measures to clarify the obligationsof management and penalties for noncompliance have been suggested in the Policy Note on the securitiesmarket, and their importance is reemphasized here, for both publicly held and privately held firms.Management incentives are more difficult to legislate or regulate. The Company Law should bereviewed, however, and, if necessary, it should be amended to enable a full range of managementincentives, such as stock options, warrants, and the like.
270
PSD Environment: Corporate Governance
Reducing the Government's Role in Corporate Governance
As recommended in the Policy Notes on privatization and the banking sector, state enterprises, includingbanks, should, with few exceptions, be entirely privatized and the government should immediately riditself of minority holdings. None of the corporate governance structures discussed above will beeffective unless enterprises are allowed to operate in an environment where government interference ispredictable and restricted to the necessary minimum and enterprises are forced to function subject tomarket forces, without the promise of government bailouts if they fail. The recently established Seimas'Ombudsman Office could play an increasing role in this area if its supporting law were amended to allowthe filing of complaints against public enterprise managers (as part of the civil service), filing by foreignindividual and institutional investors operating in Lithuania, and a broader range of penalties for failure todisclose information to the ombudsman.
271


10PENSION REFORM
Lithuania's pension program is a reformed pay-as-you-go (Paygo) public pension system, introduced bythe Seimas in 1994. Pension benefits are among the lowest in eastern and central Europe-the targetedbenefit for a full-caree:r worker is about 40 percent of the final year of wages, and the actual averagebenefit is about 36 percent of average wages. The relative modesty of the benefit package enables thepayroll contribution rate of employers to be set at 22.5 percent. Even after taking into account a portionof the I percent contribution paid by workers and an additional I percent in employer contributions thathave been effectively diverted from other programs to help pay for pensions, the resulting effective rateof about 24 percent is one of the lower rates in the region. This reduces incentives for tax paymentavoidance and migration of the workforce to the informal economy. Moreover, the inclusion of a flatbenefit component in the benefit package and the wage ceiling used in the benefit computation for theearnings-related benefit component make the program highly redistributional, particularly for very highwage earners.
As is the case in most countries in the region, Lithuania's population is aging. Lengthening lifeexpectancy, combined with lower birth rates over the past decades and liberal early retirement under theold Soviet regime, has resulted in an increasingly small population of working persons relative to thepopulation of retirees. The aging of the population is inevitable, and two issues must be addressed now toprevent a financial crisis in the pension program in about the year 2010. First, benefits paid to currentretirees must not be allowed to grow beyond the capacity of the wage base to support them. Second, theretirement age must be increased to restore long-term demographic equilibrium. These issues wereaddressed by the government's structural reform program with the support of the World Bank's 1996Structural Adjustment Loan (SAL). In that program, authorities agreed to implement policies to limit therate of growth in pension benefits to available resources and to accelerate the rate of increase in theretirement age.'
The 1994 pension law, coupled with the ongoing reforms, has made significant progress towardrestoring the medium- to long-term financial health of the Lithuania's public pension system. The mostrecent projections forecast that the system will face relatively small deficits over the next three years, andit should be financially sustainable over the medium to long term, provided that retirement age increases
1. Under the 1994 reform, the retirement age is scheduled to increase from 55.0 to 60.0 at the rate of four monthsannually for women and from 60.0 to 62.5 at the rate of two months annually for men, with the ultimate ageattained by the year 2009. Under the SAL-supported reforns, the government will accelerate these increases atthe rate of six months yearly for both women and men and will increase the retirement age for women further, to62.0.
273

Pension Reform
are accelerated and are eventually extended to age 65.0 for both women and men.2 Absent these changes,however, the pension system could suffer persistent deficits, on the order of 5 percent or more of taxablepayroll, by the year 2030. Accordingly, there is a continuing need for prudence in setting benefit levels.
This Policy Note starts with two premises. The first is that, assuming that the governmentfollows through with the amendments to the 1994 law under its structural adjustment program asdiscussed above, the existing pension system is financially viable. The second is that the 1994 reform,itself the product of a World Bank-supported project, embodies a clear set of social values concerningredistribution and the appropriate size of a mandatory pension system. Accordingly, this Policy Noteaddresses the question not of how to "fix" a fundamentally flawed pension system, but of how to improveit over the medium to long term. From this perspective, the key issues before the government include (a)improving public perception of the current pension program and reducing adverse labor force incentivesby making the features of the current program more transparent to workers and retirees and (b) using thepension program to promote the development of capital markets, thus fostering economic growth. Of thetwo, the most compelling justification for further reform of the pension program is the second. Becausethe 1994 reform continued the pattern of financing pension benefits on a Paygo basis, rather than movingthe system toward partial funding,3 Lithuania's current pension system does not contribute to theaccumulation of investment capital, and therefore remains largely neutral with respect to the challenge ofpromoting higher levels of economic growth. While estimates vary, real, long-term economic growthmay be suffering by as much as 0.5 to 1.0 percent annually as a result.4
A working group under Lithuanian government auspices has drafted a framework law forvoluntary private pensions. The law is well drafted and provides a solid framework for mostcontingencies. Unfortunately, its enactment has not yet been made a priority.
This Policy Note makes the following recommendations:
Modifications to the current program: (a) increase incentives for long-career and older workersto participate in the Paygo system; (b) monitor compliance, particularly among the self--employed; (c) raise the retirement age at the rate currently envisaged by the SAL-supportedreforms, but to an ultimate age of 65.0 for both women and men; (d) shift 11.0 percentage pointsof the 22.5 percent payroll contribution rate to employees, with a mandatory and commensurate"gross-up" in wages to leave workers with the same level of post-tax income, and create and
2. These forecasts-are subject to some caveats: (a) genuine uncertainty regarding long-term trends in the wage base,compliance, and mortality (risks inherent in the nature of Paygo financing) and (b) some of the economic growthassumptions used in the government's projections may be overly optimistic. In addition, the last forecasts weredone in early 1997 and do not reflect events since then. It has been suggested that those forecasts are based onunrealistically low real wage and labor force participation assumptions. Given that Lithuania's system is largelywage-indexed, changing the real wage assumption is not likely to have major effects on the results. Increasedlabor force participation would improve short-term financing, but at the price of larger long-term liabilities. Inany event, it would be desirable for Lithuania to have a more flexible model available to test economic anddemographic scenarios, and steps have been taken to develop and make available such a model.
3. By this it is meant that the accumulated payroll contributions in investment accounts are then invested insecurities and other financial instruments, in contrast with the present practice of using current contributions topay for the benefits of retirees.
4. For a discussion of this issue in the context of the Chilean pension reform, see R. Holzmann, "Pension Reform,Financial Market Development, and Economic Growth: Preliminary Evidence from Chile," InternationalMonetary Fund StaffPapers 44, No. 2:149-78 (June 1997).
274
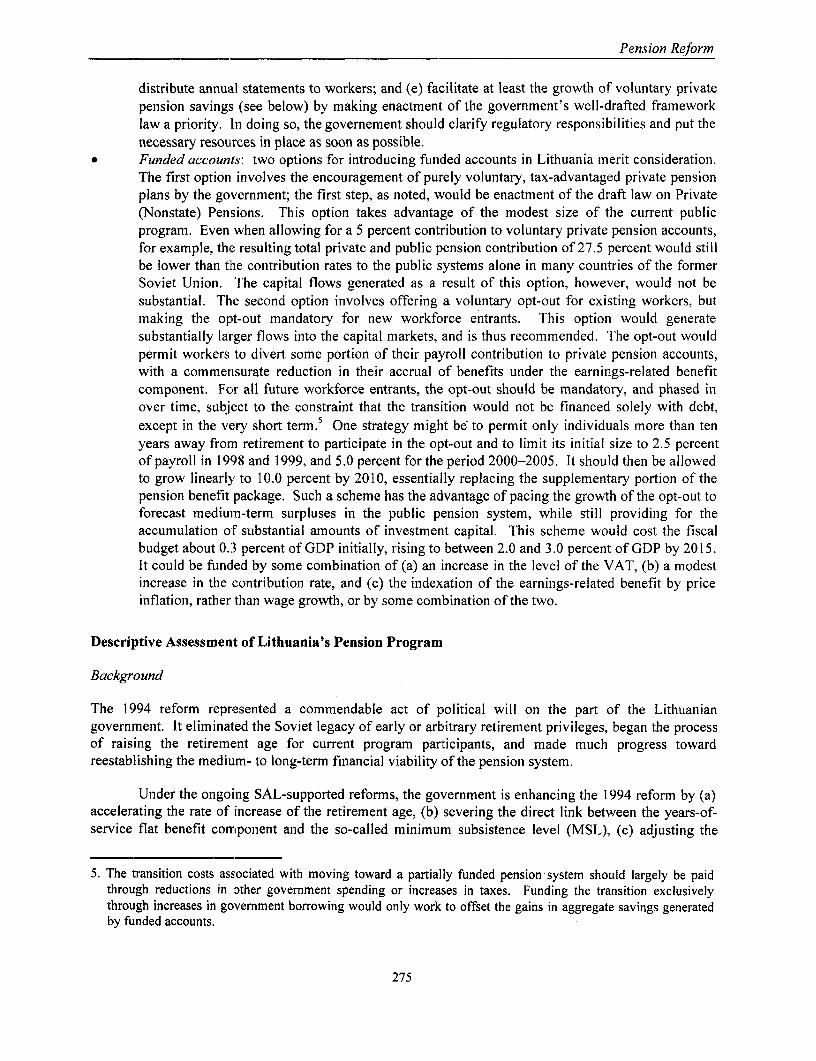
Pension Reform
distribute annual statements to workers; and (e) facilitate at least the growth of voluntary privatepension savings (see below) by making enactment of the government's well-drafted frameworklaw a priority. In doing so, the governement should clarify regulatory responsibilities and put thenecessary resources in place as soon as possible.
* Funded accounts: two options for introducing funded accounts in Lithuania merit consideration.The first option involves the encouragement of purely voluntary, tax-advantaged private pensionplans by the government; the first step, as noted, would be enactment of the draft law on Private(Nonstate) Pensions. This option takes advantage of the modest size of the current publicprogram. Even when allowing for a 5 percent contribution to voluntary private pension accounts,for example, the resulting total private and public pension contribution of 27.5 percent would stillbe lower than the contribution rates to the public systems alone in many countries of the formerSoviet Union. The capital flows generated as a result of this option, however, would not besubstantial. The second option involves offering a voluntary opt-out for existing workers, butmaking the opt-out mandatory for new workforce entrants. This option would generatesubstantially larger flows into the capital markets, and is thus recommended. The opt-out wouldpermit workers to divert some portion of their payroll contribution to private pension accounts,with a commensurate reduction in their accrual of benefits under the earnings-related benefitcomponent. For all future workforce entrants, the opt-out should be mandatory, and phased inover time, subject to the constraint that the transition would not be financed solely with debt,except in the very short term.5 One strategy might be- to permit only individuals more than tenyears away from retirement to participate in the opt-out and to limit its initial size to 2.5 percentof payroll in 1998 and 1999, and 5.0 percent for the period 2000-2005. It should then be allowedto grow linearly to 10.0 percent by 2010, essentially replacing the supplementary portion of thepension benefit package. Such a scheme has the advantage of pacing the growth of the opt-out toforecast medium-term surpluses in the public pension system, while still providing for theaccumulation of substantial amounts of investment capital. This scheme would cost the fiscalbudget about 0.3 percent of GDP initially, rising to between 2.0 and 3.0 percent of GDP by 2015.It could be funded by some combination of (a) an increase in the level of the VAT, (b) a modestincrease in the contribution rate, and (c) the indexation of the earnings-related benefit by priceinflation, rather than wage growth, or by some combination of the two.
Descriptive Assessment of Lithuania's Pension Program
Background
The 1994 reform represented a commendable act of political will on the part of the Lithuaniangovernment. It eliminated the Soviet legacy of early or arbitrary retirement privileges, began the processof raising the retirement age for current program participants, and made much progress towardreestablishing the medium- to long-term financial viability of the pension system.
Under the ongoing SAL-supported reforms, the government is enhancing the 1994 reform by (a)accelerating the rate of increase of the retirement age, (b) severing the direct link between the years-of-service flat benefit component and the so-called minimum subsistence level (MSL), (c) adjusting the
5. The transition costs associated with moving toward a partially funded pension system should largely be paidthrough reductions in other government spending or increases in taxes. Funding the transition exclusivelythrough increases in government borrowing would only work to offset the gains in aggregate savings generatedby funded accounts.
275
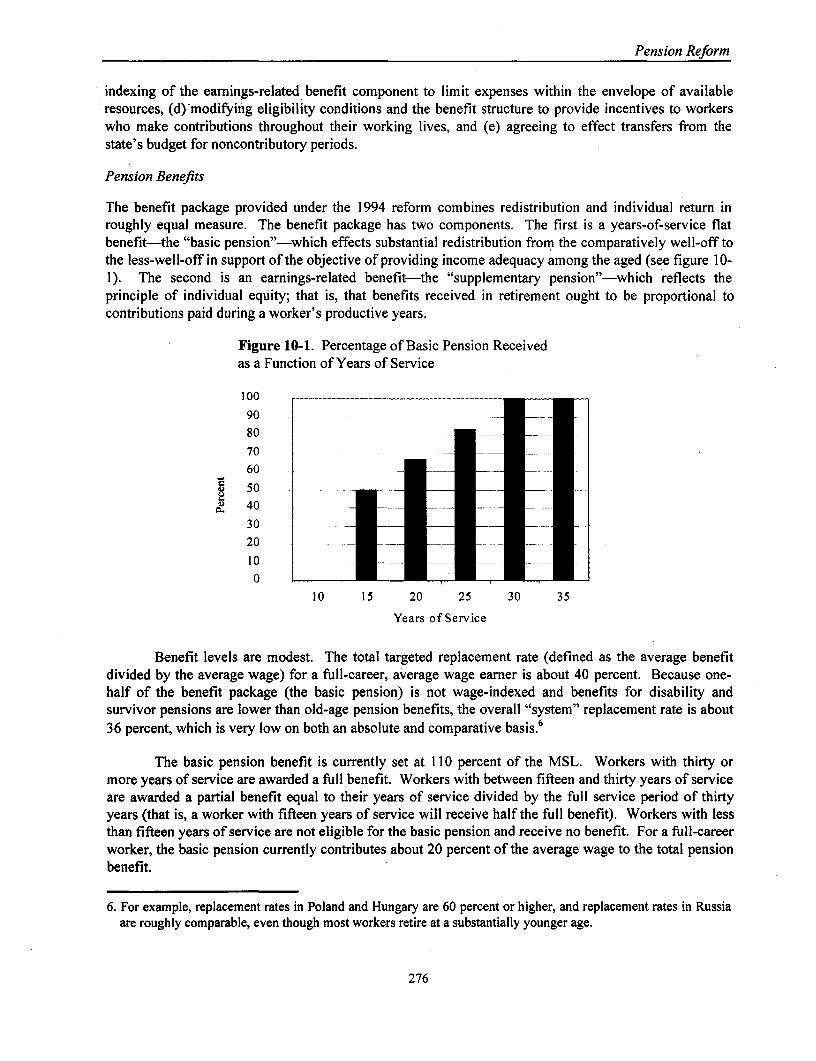
Pension Reform
indexing of the earnings-related benefit component to limit expenses within the envelope of availableresources, (d) modifyiing eligibility conditions and the benefit structure to provide incentives to workerswho make contributions throughout their working lives, and (e) agreeing to effect transfers from thestate's budget for noncontributory periods.
Pension Benefits
The benefit package provided under the 1994 reform combines redistribution and individual return inroughly equal measure. The benefit package has two components. The first is a years-of-service flatbenefit-the "basic pension"-which effects substantial redistribution from the comparatively well-off tothe less-well-off in support of the objective of providing income adequacy among the aged (see figure 10-I). The second is an earnings-related benefit-the "supplementary pension"-which reflects theprinciple of individual equity; that is, that benefits received in retirement ought to be proportional tocontributions paid during a worker's productive years.
Figure 10-1. Percentage of Basic Pension Receivedas a Function of Years of Service
100
90
80 1 2
70
60- -- . - --
5040 ~ 30
20
1 0 1 5 20 25 3 0 3 5
Years of Service
Benefit levels are modest. The total targeted replacement rate (defined as the average benefitdivided by the average wage) for a full-career, average wage earner is about 40 percent. Because one-half of the benefit package (the basic pension) is not wage-indexed and benefits for disability andsurvivor pensions are lower than old-age pension benefits, the overall "system" replacement rate is about36 percent, which is very low on both an absolute and comparative basis.6
The basic pension benefit is currently set at 110 percent of the MSL. Workers with thirty ormore years of service are awarded a full benefit. Workers with between fifteen and thirty years of serviceare awarded a partial benefit equal to their years of service divided by the full service period of thirtyyears (that is, a worker with fifteen years of service will receive half the full benefit). Workers with lessthan fifteen years of service are not eligible for the basic pension and receive no benefit. For a full-careerworker, the basic pension currently contributes about 20 percent of the average wage to the total pensionbenefit.
6. For example, replacement rates in Poland and Hungary are 60 percent or higher, and replacement rates in Russiaare roughly comparable, even though most workers retire at a substantially younger age.
276
Pension Reform
The MSL is purportedly recomputed quarterly based on the rate of price inflation (see figure 10-2). In February 1997, however, the government adjusted the MSL, and thus the basic pension, by abouttwice the increase in the cost of living index because it anticipated a greater inflationary effect fromincreases in VAT than has actually occurred-or is likely to occur. In principle, the government hasagreed to sever this link between the basic pension and the MSL in favor of some other adjustmentmeasures in order to constrain increases in benefit payments to the available fiscal envelope. Indeed,under the policies established by the SAL-supported reforms, the basic pension should be allowed toerode in real terms. The extent to which this will happen, however, is subject to intense political pressureand is difficult to predict. For instance, actions by the government during the first half of 1997 haveundermined the core message that the longer-term financial sustainability of the public pension programdepends upon the preservation of tight fiscal discipline in the short run. Real benefit levels increased byabout 8 percent during the first eight months of 1997 as a direct result of February's increase in theamount of the basic pension and the government-established minimum wage.
Figure 10-2. Comparison of Cumulative Growth in AverageOld-Age Pensions and Average Prices, 1997
1.120
1.100
1.080
1.060
1.040 /
1.020
1.000 I
Jan Feb Mar Apr May Jun Jul
Pensions - - - - -Prices
The supplementary pension benefit is based on a worker's average lifetime earnings relative tothe average wage. Earnings are adjusted for inflation through of the German coefficient system, which issimply a technique for adjusting earnings for wage growth and expressing them relative to averagewages. Under this system, a record is kept of a worker's wages, expressed relative to the average wage,for each year of employment. (For example, in a given year, someone who earns 200 percent of theaverage wage is credited with a point value of 2.0.) At retirement-and subject to a legislated awardceiling of 5.0 points in any one year-a worker's twenty-five highest points are averaged to compute theaverage lifetime earnings relative to the average wage.
Benefits are computed by multiplying the worker's average lifetime relative earnings (points) bythe average wage in the period prior to retirement, with credit given at the rate of 0.5 percent for eachyear of service. Thus, an average wage earner who worked for forty years will receive a benefit ofexactly 20 percent in replacement rate value from the supplementary pension. The value of thesupplementary pension is indexed after retirement on the basis of the rate of wage inflation, although the
277
Pension Reform
SAL-supported reforms empower the Social Insurance Council to index benefits at a lower rate to limitexpenses within the envelope of available resources, subject to the constraint that the rate of indexationcannot be less than either wage or price growth, whichever is lower.
Two factors-the inclusion of a flat benefit component in the pension benefit package and theexistence of a ceiling on wages used in the benefit computation for the supplementary pension-make theprogram very redistributional, particularly among the small number of persons earning more than fivetimes average earnings. (Approximately 1 percent of workers earn more than five times average wages,and the total contributions collected on the basis of wages in excess of this ceiling is about 2 percent oftotal program revenue.) The overall level of redistribution provided under the program is roughlycomparable to that of the Swiss and U.S. systems.
Coverage
All citizens in Lithuania, including farmers, sole proprietors, and the self-employed, are covered by thebasic pension, although only citizens with fifteen or more years of service credit are eligible to receivebenefits.' Only persons employed under labor contracts are covered by the supplementary pension.
Retirement Age
Prior to the introduction of the 1994 reform, the retirement age was 55.0 for women and 60.0 for men.As originally drafted, the 1994 reform provided for the retirement age to increase to 65.0 for both women(at the rate of four months annually) and men (at the rate of two months annually), but the law was latermodified. It now specifies that the retirement age will increase to only 60.0 for women and to 62.5 formen, although the rates of increase have not changed. The ultimate retirement age will be reached in theyear 2009 for both women and men.
Under the government's current reform effort, the increase in the retirement age is to beaccelerated to six months annually, attaining the target age of 62.0 for women and 62.5 for men (both inthe year 2010),8 and the retirement age for women is to be raised by an additional six months in order toequalize the ages for women and men at 62.5. It appears unlikely, however, that scheduled changes tothe retirement age will be enacted until the late spring or early summer of 1998, if at all. This isproblematic, because the long-term fiscal sustainability of the pension program hinges not only on thesechanges, but also on further increases in the retirement age to 65.0 for both women and men (see figures10-3 and 10-4).
Payroll Contributions
The payroll contribution rate in Lithuania is 22.5 percent and is paid by employers. An additional Ipercent of payroll is paid by workers, and in 1995 and 1996, about I percent of payroll was diverted fromother activities to help finance pensions. The effective rate for pensions, therefore, is roughly 24 percent.Although not as low as in Latvia and Estonia, where the pension contribution rates are closer to 20percent, Lithuania's pension rate is among the lowest in the region (compared with Hungary or Poland,for example), although promised benefits are commensurately lower as well. Unlike its neighbor, Latvia,
7. Coverage refers to benefit eligibility, not to benefit entitlement.8. This assumes that the changes are made effective in 1998.
278
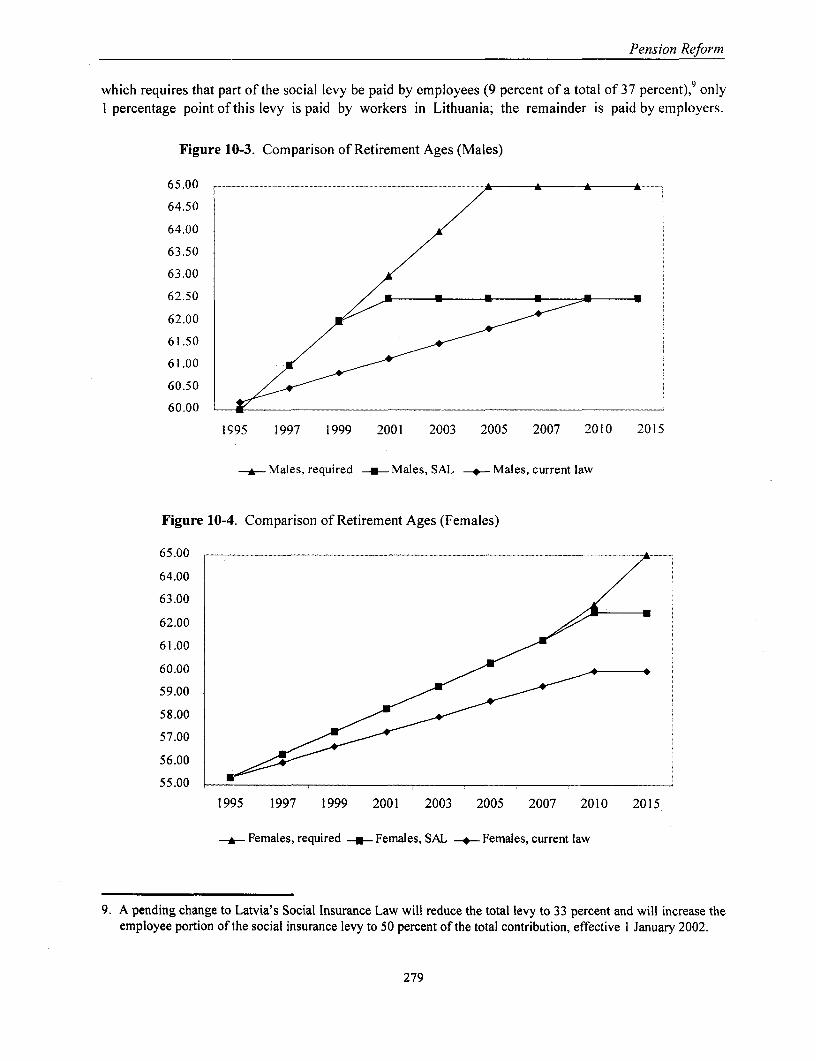
Pension Reform
which requires that part of the social levy be paid by employees (9 percent of a total of 37 percent),9 onlyI percentage point of this levy is paid by workers in Lithuania; the remainder is paid by employers.
Figure 10-3. Comparison of Retirement Ages (Males)
65.00 _....._.._.. -- . - _-------
64.50
64.00
63.50
63.00
62.50
62.00
61.50
61.00
60.50
60.00 -
1995 1997 1999 2001 2003 2005 2007 2010 2015
A Males, required -- Males, SAL + Males, current law
Figure 10-4. Comparison of Retirement Ages (Females)
65.00 .--- ---_-_ _-_-
64.00
63.00
62.00
61.00
60.00
59.00
58.00
57.00
56.00
55.00
1995 1997 1999 2001 2003 2005 2007 2010 2015
-A, Females, required -- Females, SAL + Females, current law
9. A pending change to Latvia's Social Insurance Law will reduce the total levy to 33 percent and will increase theemployee portion of the social insurance levy to 50 percent of the total contribution, effective I January 2002.
279

Pension Reform
Farmers, sole proprietors, and the self-employed (who are covered only by the basic pension) pay a flatmonthly fee that is equal to one-half of the basic pension benefit. Payment of contributions for soldiers inobligatory service and for parents on leave to provide care for a child under the age of three is paid fromthe state budget.
Demographics
Lithuania's population follows a demographic pattern similar to those of many countries in eastern andcentral Europe, and much of the developed world: the population is aging. Lengthening life expectancy,combined with lower birth rates over the past decades, has resulted in a steadily shrinking population ofworking persons relative to the population of retirees. The aging of Lithuania's population is inevitableand irreversible. It is already a major contributor to the country's pension financing difficulties and willbecome the predominant issue facing the pension system in the foreseeable future.
This pattern of aging in Lithuania's population is evident in the old-age dependency ratiospresented in figure 10-5. Defined as the number of persons over the retirement age divided by thenumber of persons of working age, the old-age dependency ratio is currently about 0.33 (or about 3.0persons of working age for each person over the retirement age). It will rise to about 0.44 (or about 2.3persons of working age for each person over the retirement age) by the year 2030. Lithuania's currentold-age dependency ratio of 0.33 is roughly average for countries in the region, and it is substantiallybetter than that of countries such as Bulgaria and Hungary. In the long run, the population of agedpersons in Lithuania as a percentage of the total population will be roughly comparable to that of mostother countries in the region.'0
Nevertheless, for the next decade, the old-age dependency ratio is expected to remain relativelystable. This would be an encouraging sign if it meant that demographic pressure is easing, but instead itis a direct reflection of the policies introduced in 1994, which raised the retirement age for both womenand men, particularly by eliminating early retirement privileges. Without this reform, the dependencyratios would not remain stable over the next decade, but would show the very same pattern of degradationin the short run that is seen in the remainder of the projection period.
Further evidence of the postponement (albeit only slight) of the impact of the aging ofLithuania's population provided by the 1994 reform can be found in the pattern of system dependencyratios presented in figure 10-5. The system dependency ratio, defined as the number of pensionrecipients divided by the number of program contributors, is currently about 0.56 (there are about 1.8workers supporting each retiree). This is comparable to other countries in the region with a similardemographic profile, such as Slovakia, Poland, and the Czech Republic. The system dependency ratiowill improve slightly, to about 0.50 (or 2.0 workers supporting each retiree) over the next decade, beforerising steadily thereafter.
10. For example, by the year 2030, approximately 26 percent of Lithuania's population will be over age sixty-five.Estimates for other countries in the region include 23 percent (Poland), 25 percent (Russia), 26 percent (Latvia),and 29 percent (Slovenia and Croatia). The weighted average for all of eastern Europe and the former SovietUnion is somewhat lower-22 percent-because of historically high fertility rates in the countries of centralAsia.
280
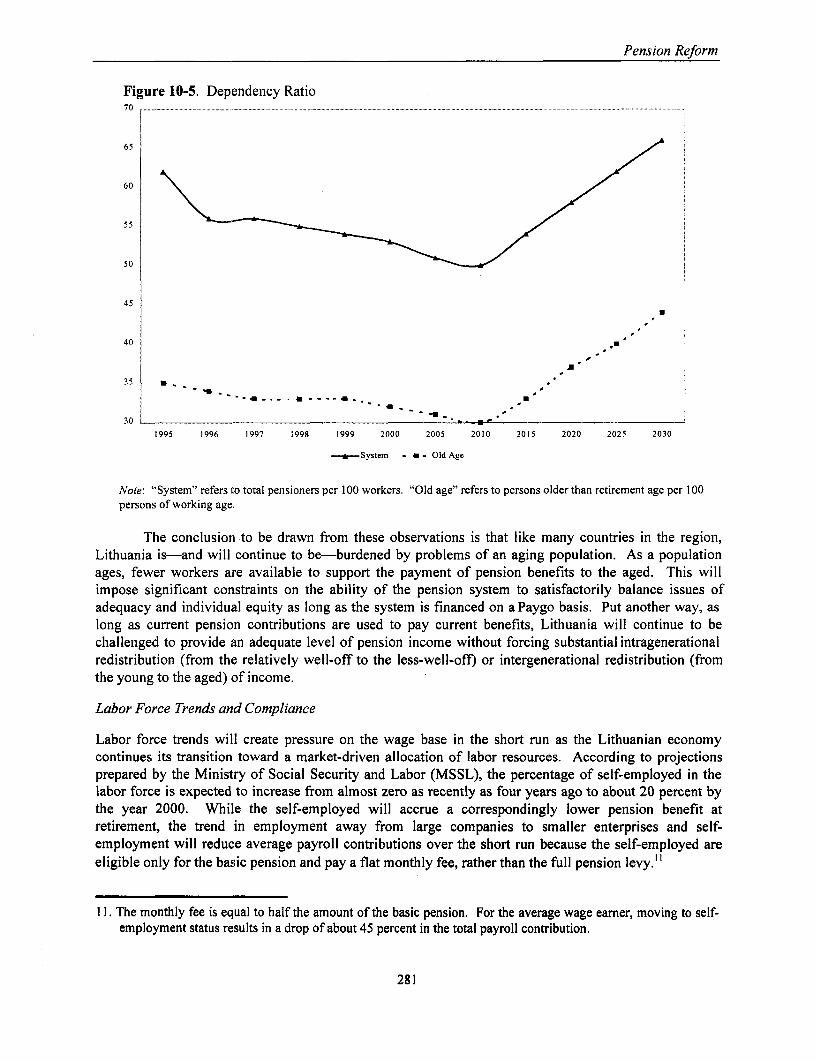
Pension Reform
Figure 10-5. Dependency Ratio70 ................................. .... .. ............. ......... ........................... ... ....... ... .. ...... ... ... ... ... ... ... ... ... .......... ... .... ... .... . ....... ........ .. .................. ....... ... ......... . .. . .. ..
65
60
55
45
40 .'
35 5. _
30*_
1995 1996 1997 1998 1999 2000 2005 2010 2015 2020 2025 2030
y - * - Old Age
Note: "System" refers to total pensioners per 100 workers. "Old age" refers to persons older than retirement age per 100persons of working age.
The conclusion to be drawn from these observations is that like many countries in the region,Lithuania is-and will continue to be-burdened by problems of an aging population. As a populationages, fewer workers a;re available to support the payment of pension benefits to the aged. This willimpose significant constraints on the ability of the pension system to satisfactorily balance issues ofadequacy and individual equity as long as the system is financed on a Paygo basis. Put another way, aslong as current pension contributions are used to pay current benefits, Lithuania will continue to bechallenged to provide an adequate level of pension income without forcing substantial intragenerationalredistribution (from the relatively well-off to the less-well-off) or intergenerational redistribution (fromthe young to the aged) of income.
Labor Force Trends and Compliance
Labor force trends will create pressure on the wage base in the short run as the Lithuanian economycontinues its transition toward a market-driven allocation of labor resources. According to projectionsprepared by the Ministry of Social Security and Labor (MSSL), the percentage of self-employed in thelabor force is expected to increase from almost zero as recently as four years ago to about 20 percent bythe year 2000. While the self-employed will accrue a correspondingly lower pension benefit atretirement, the trend in employment away from large companies to smaller enterprises and self-employment will reduce average payroll contributions over the short run because the self-employed areeligible only for the basic pension and pay a flat monthly fee, rather than the full pension levy."
I1. The monthly fee is equal to half the amount of the basic pension. For the average wage earner, moving to self-employment status results in a drop of about 45 percent in the total payroll contribution.
281

Pension Reform
These same patterns have implications for payroll tax payment compliance as well. WhileLithuania's track record is not among the worst-estimates suggest that approximately 85 percent ofcontributions that ought to be collected under the law are actually collected-the system's financing issuffering from the compliance ills characteristic of the region. Compliance in many eastern and centralEuropean countries is less than 80 percent, and compliance elsewhere in the former Soviet Union is oftensubstantially lower.12 Some covered economic activity is unreported, and it is believed that many firmsreport money wages only up to the statutory minimum. No reliable estimates of the extent of suchevasion in Lithuania are available, but the underreporting of income seems to be quite common.Moreover, collection of contributions on reported income is not assured. Arrears totaled about Lt 615million as of July 1997, or about two months of projected 1997 collections. Of this amount,approximately one-third is considered to be uncollectible.
A great deal of hope for the alleviation of the problem of long-term fiscal deficits is placed inimproved collection of payroll taxes-under MSSL projections, for example, collection rates willincrease from 85 percent to 90 percent by the year 2000-but such hopes may be overly optimistic, givencurrent labor market trends.
Cash Flow Projections
Projections prepared by MSSL are summarized in the Annex to this chapter. Under current law, theseprojections predict annual cash flow deficits in the range of 1.0 to 1.25 percent of taxable payroll-between 5.0 percent and 6.5 percent of total pension expenditures, and roughly 0.3 percent of GDP-forthe next three years. This compares favorably with other countries in the region; about half of thesecountries have incurred deficits in excess of 2.0 percent of GDP in recent years. Nevertheless, the StateSocial Insurance Fund's reserves at the end of 1996 were close to depletion, and arrears had developed inpayments to medicine vendors and for some short-term benefits.
In the medium term, the aging of the population will work to Lithuania's advantage, because,alarge portion of the workforce will enter their most productive years. Deficits are projected to decline tozero between 2000 and 2005, and to actually grow into small surpluses. When these cohorts begin toretire in about the year 2010, however, the surpluses will disappear, and the projections predict persistentannual deficits, on the order-of 5 percent or more of taxable payroll (between I and. 2 percent of GDP) bythe year 2030.
These long-term deficits are primarily the result of the demographic imbalance created by arelatively large caseload inherited from the old regime coupled with an insufficiently fast increase inretirement ages. If the retirement age is gradually increased to 65.0 for both women and men at theproposed rate of six months annually, these same simulations illustrate that equilibrium will bereestablished, and Lithuania will avoid what would otherwise be persistent long-term deficits in thefinancing of its pension system (see figure 10-6).
The following conclusions can be drawn from this analysis. First, continued increases in theretirement age are necessary for the long-term financial stability of the pension program. Without suchincreases, the aging of Lithuania's population will force the government to take radical action to restorefiscal balance to the pension system, starting in about the year 2010. Such actions could include (a)substantial reductions in benefit levels, leaving many aged in poverty or further eroding the principle ofindividual equity (that benefits ought to be proportional to contributions); (b) an increase in the
12. Compliance among the central Asian republics is generally well below 50 percent.
282
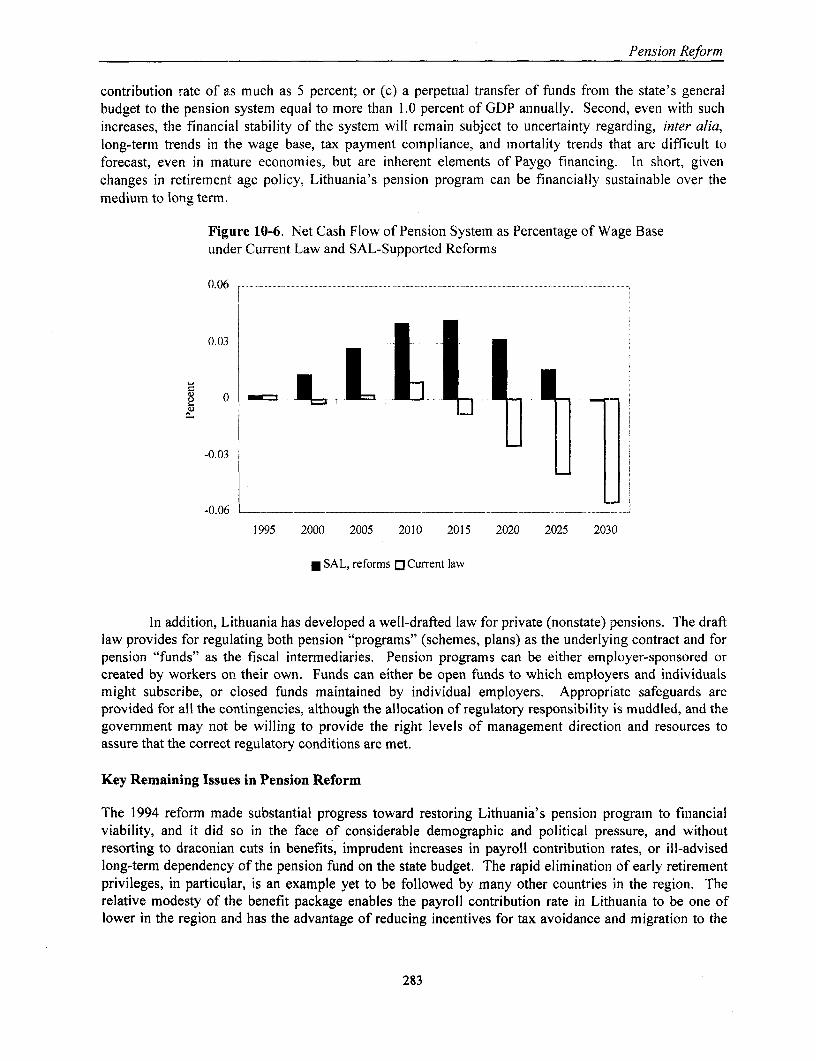
Pension Reform
contribution rate of as much as 5 percent; or (c) a perpetual transfer of funds from the state's generalbudget to the pension system equal to more than 1.0 percent of GDP annually. Second, even with suchincreases, the financial stability of the system will remain subject to uncertainty regarding, inter alia,long-term trends in the wage base, tax payment compliance, and mortality trends that are difficult toforecast, even in mature economies, but are inherent elements of Paygo financing. In short, givenchanges in retirement age policy, Lithuania's pension program can be financially sustainable over themedium to long term.
Figure 10-6. Net Cash Flow of Pension System as Percentage of Wage Baseunder Current Law and SAL-Supported Reforms
0.06
0.03
-0.03
-0.061995 2000 2005 2010 2015 2020 2025 2030
I SAL, reforms D Current law
In addition, Lithuania has developed a well-drafted law for private (nonstate) pensions. The draftlaw provides for regulating both pension "programs" (schemes, plans) as the underlying contract and forpension "funds" as the fiscal intermediaries. Pension programs can be either employer-sponsored orcreated by workers on their own. Funds can either be open funds to which employers and individualsmight subscribe, or closed funds maintained by individual employers. Appropriate safeguards areprovided for all the contingencies, although the allocation of regulatory responsibility is muddled, and thegovernment may not be willing to provide the right levels of management direction and resources toassure that the correct regulatory conditions are met.
Key Remaining Issues in Pension Reform
The 1994 reform made substantial progress toward restoring Lithuania's pension program to financialviability, and it did so in the face of considerable demographic and political pressure, and withoutresorting to draconian cuts in benefits, imprudent increases in payroll contribution rates, or ill-advisedlong-term dependency of the pension fund on the state budget. The rapid elimination of early retirementprivileges, in particular, is an example yet to be followed by many other countries in the region. Therelative modesty of the benefit package enables the payroll contribution rate in Lithuania to be one oflower in the region and has the advantage of reducing incentives for tax avoidance and migration to the
283
Pension Reform
informal economy. With necessary adjustments in retirement age policy, Lithuania's current pensionprogram would arguably be a model of successful Paygo pension reform. The program represents areasoned and prudent effort to balance a number of conflicting objectives, including the core issues ofincome adequacy and individual equity (which, from an incentive perspective, always present a tradeoff).
Within this context, the question becomes not how to fix the Lithuanian program, but how toimprove it. The key issues in addressing this question are (a) the challenge of introducing greatertransparency in the features of the current program in order to improve its public acceptance and reduceadverse labor force incentives and (b) the policy alternative of using the pension program to promote thedevelopment of capital markets and accelerate economic growth.3
Labor Incentives
The first issue is that of the adverse labor force incentives created by the lack of an obvious connectionbetween the payroll contributions made by firms on behalf of workers and the benefits these workersultimately receive from the program.
Because the payroll contribution is imposed nominally on employers rather than employees, theemployees are not fully cognizant of the payroll contributions made on their behalf. Combined with themurkiness of the benefit formula, this lack of awareness creates incentives for the migration of theworkforce from the formal to the informal economy. Employees discount the value of the pensionbenefit in their labor negotiations and look for opportunities to negotiate labor contracts outside the net ofthe social insurance program. Although Lithuania's total social levy-31 percent-is one of the lowest ineastern and central Europe, for many workers the opportunity to increase cash income through evasion isnonetheless attractive. This is confirmed by existing estimates of the size of the informal economy,which range as high as 40 percent of GDP. The lack of an obvious connection between contributions andbenefits also contributes to the chronic and widespread underreporting of income within the formaleconomy, which is the result of collusion between employees and employers to avoid payingcontributions on the total wage package. There are no reliable estimates that can be used to calibrate theextent of such behavior, but it is widely believed that many firms report money wages only up to thestatutory minimum.
Moreover, the current program creates disincentives for workers to remain in the workforcebeyond the statutory retirement age. Full-career workers receive no additional credit for added years ofservice under the years-of-service basic pension. For workers who remain in the workforce beyond thestatutory retirement age, the actuarial adjustments for delayed retirement may be too low. The currentsystem also may encourage workers to characterize themselves as self-employed; in so doing, they canobtain the minimum basic pension after only fifteen years of work, and then supplement that minimumpension with the proceeds from private savings, which likely will have a higher rate of return than
13. Debate on precisely how redistributional the mandatory pension program ought to be and on the bestmechanisms to effect such changes is necessary and important. No clear consensus exists, however, on eitherthe degree or means of redistribution in public pension schemes. Accordingly, this Policy Note has taken assettled the basic structure and underlying distributional policies of the 1994 reform, which are partly theproduct of Bank-supported assistance.
284

Pension Reform
continued participation in the basic pension or voluntary subscription to the earnings-relatedsupplementary Paygo pension.
Capital Market Development
The third pension policy issue faced by Lithuanian authorities in the medium term relates to thealternative of trying to use the pension program to promote the development of capital markets, and thusto enhance economic growth. There are a number of arguments that can be made for introducing someform of private pension account within the context of the public pension program. First, over the longrun, aggregate savings may be increased. In Chile, for example, assets held by private pension fundstotaled 35 percent of GDP by 1991, ten years after the old Paygo system was replaced with a scheme offully privatized, individual savings plans.14 Second, the formation of funded pension plans-particularly if coincident with, or subsequent to, privatization-increases the efficient allocation of capitalwithin the economy and can accelerate economic growth. This is the lesson of Chile, where the grossannual real rate of return on private pension fund capital during the first ten years of the reform exceeded13 percent, and the nel: yield to workers, after fees, exceeded 9 percent. In addition, the placement oflarge blocks of shares of Lithuanian companies in the portfolios of professional investors may lead toincreased market liquidity and improved corporate governance."5 Third, funded accounts may offerLithuania a more efficient mechanism for financing retirement income, given expected trends in thecountry's system dependency ratio. Put another way, the rate of return available from Lithuania's Paygopublic pension programn, which is determined by the pattern of real wage growth and demographics, maybe bettered substantially by the rate of return available in the private capital markets. Finally, fundedaccounts eliminate the labor force and demographic risks resident in the financing of purely Paygoregimes. (Admittedly, this gain comes at the expense of exposure to other risks, but these new risks can,to some degree, be mitigated through legal and regulatory oversight and investment diversification,particularly if pension funds are allowed to invest assets in the financial markets of other countries.)
Because the 1994 reform continued the pattern of financing pension benefits on a Paygo basisrather than moving the system toward partial funding, Lithuania's pension system currently providesnone of the above-mentioned benefits. The current system does not contribute to (a) increasing nationalsavings, (b) improving the allocation of investment capital and corporate governance, or (c) reducinglabor force disincentives. While estimates vary, real economic growth may be suffering by as much as0.5 to l.O percent annually as a result.16 For these reasons, Lithuania needs to stage an explicit debate
14. Other factors were at work during this period, so it is difficult to arrive at a precise estimate of the contributionof private pensions to higher levels of aggregate savings. The point remains, however, that funded privatepensions are superior to Paygo systems in promoting national savings.
15. See R. Holzmann, "On the Economic Benefits and Fiscal Requirements of Moving from Unfunded to FundedPensions," American Institute for Contemporary German Studies, The John Hopkins University, ResearchReport Number 4, Economic Studies Program (Baltimore, Md., 1997); also to be published in a special issue ofEuropean Economy, Commission of the European Union, forthcoming.
16. For a discussion of this issue in the context of the Chilean experience, see R. Holzmann, "Pension Reform,Financial Market Development, and Economic Growth: Preliminary Evidence from Chile." Holzmann estimatesthat in the long-run, the Chilean pension reform improved total, factor productivity by 0.5 to 1.3 percent,increased capital formation by 0.2 to 0.6 percent, and enhanced labor market performance by 0.0 to 1. 1 percent,leading to a total long-term growth effect of between 0.7 and 3.0 percent, assuming a labor share of 0.7.Holzmann notes, however, that such gains arose only in the context of a comprehensive and consistent programof macroeconomic reform, and that the impact of the reform on savings was achieved indirectly throughincreases in public savings (by reducing the large stock of debt implicit under the former Paygo system) andincreases in savings from higher levels of economic growth.
285

Pension Reform
on the question of whether to convert all or some of its earnings-related benefit (the supplementarypension) to a funded, second pillar of private pension accounts. This discussion is currently under way inneighboring countries (Latvia and Poland), and the system has been implemented in a number ofcountries worldwide.
In addition, it should be noted that the current combination of a modest and redistributionalreplacement rate schedule, if combined with accelerated increases in retirement ages, eventually to age 65for both genders, creates, at least in principle, space for voluntary private retirement schemes. Even afterallowing for a 5 percent contribution to voluntary private pension accounts, for example, the resultingtotal private and public pension contribution of 27.5 percent would still be lower than the contributionrates to public systems in many countries of the former Soviet Union. The enactment of a framework lawfor such schemes awaits final government sign-off, a clear allocation of regulatory responsibility withingovernment, completion of a satisfactory draft, and a consensus among key actors. At this point, it isdifficult to gauge the public demand for voluntary tax-advantaged retirement savings, or to envision howquickly the financial intermediaries can respond (or will be interested in responding).
Continuity
Balancing continuity with the advantages of further reforms also merits consideration, although this ismore an issue of implementation than economic policy. Arguments are firmly voiced by thoseresponsible for administering Lithuania's pension program that (a) substantial resources have beeninvested to educate the public about the current program, and any further reforms will only serve toincrease confusion and decrease the transparency of the pension system to the general public; (b) to effectchanges to the program now would undermine the credibility of the government; and (c) implementationof reforms involving funded accounts will be met with skepticism, given massive public mistrust offinancial markets and the banking sector. To some degree, all of these arguments have merit and deserveto be factored into any decision to make additional changes to the current program.
Policy Recommendations
Overall Strategy and Principles
The basis for the discussion of recommended changes in Lithuania's pension program is the premise thatthe program, as established by the 1994 reform, is generally financially viable over the medium to longterm. Nonetheless, several of the SAL-supported reforms have not yet been implemented, including (a)the acceleration of the rate of retirement to six months yearly for both women and men (up from fourmonths annually for women and two months annually for men); (b) the severance of the direct linkbetween the years-of-service flat benefit component and the MSL; and (c) a change in the indexing of thesupplementary pension benefit to reflect the envelope of resources available to pay for higher benefits.
Unless the government implements these remaining reforms and continues to raise the retirementage further, to 65.0 for women and men from the 62.5 under the current structural reform program,Lithuania's pension program will face deficits in the medium to long term (possibly starting between2010 and 2015) that will necessitate an ever-increasing contribution rate or an increasing shift toward
286

Pension Reform
(and perpetual reliance upon) general budgetary financing." This is illustrated in figure 10-7, whichshows the relative rates of growth in real old-age pension expenditures under current law and under theSAL-supported changes, which provide for an acceleration in the rate of increase in the retirement age.In less than two decades, under current law, the cumulative growth in real benefits over 1995expenditures is more than twice the growth under SAL-supported reforms.
Figure 10-7. Rate of Growth in Real Old-Age Pension Expenditures under Current Lawand under SAL-Supported Acceleration of Increases in the Retirement Age
60
50
40
o; 30 *| -30
20
10
1996 1997 1998 1999 2000 2005 2010 2015
* Current law SAL conditions
In addition to thie criteria of financial sustainability, potential reforms should also consider thefollowing:
e Transparency of the program and the degree to which understanding of the program minimizeslabor force distortions.
* Economic growth and the degree to which the boundaries between the public and private sectorscan be repositioned to facilitate investment and increase overall economic efficiency.
Modifications to the Current Program
Some narrowly focused modifications to the current program are discussed below. With one exception,they are part of the structural adjustment program, although they have not been developed as provisionsto accelerate the retirement age increase or to contain expenditures within existing revenues. Onemeasure, increasing the retirement age to 65.0 in the long run, is not part of the structural adjustmentprogram, as such.
17. Unfortunately, one recently proposed amendment to the public pension law-a change that effectively increasesbenefits for roughly one-half of all of Lithuania's old-age pension recipients-is moving the pension system inexactly the opposite direction. This amendment, which increases the credit given for wages earned prior to IJanuary 1994 under the supplementary pension program, is estimated to increase the cost of old-age pensionbenefits by about 5 percent yearly (worth Lt 85 million in 1998) over the next decade, after which the costsshould decrease. Depending upon how rapidly the government implements the remaining provisions of theamendment, its cost could rise to as much as 7 to 8 percent of total old-age pension expenditures.
287
Pension Reform
INCREASE INCENTIVES FOR PARTICIPATION IN THE PAYGO PENSION. Under current law, accrualsunder the basic pension are stopped after 30 years of work. In addition, the roughly 4 percent per annumadjustment factor for delayed retirement after the statutory retirement age is insufficient as the statutoryretirement age increases. Incentives to comply after thirty years of work and to delay retirement wouldbe enhanced through these relatively minor changes in the law. In principle, the government has agreedto making such changes in the current law under the structural adjustment program, but clear legislationalong these lines has not been developed.
Focus COMPLIANCE EFFORTS ON THE SELF-EMPLOYED. The self-employed and, to a lesserextent, farmers present a difficult policy choice under current law. Quite reasonably, Lithuania decidednot to compel participation in the supplemental-earnings-related pension for the self-employed (includingfarmers) on the grounds that the costs of administration (for example, measuring "earnings" in theagricultural sector) and compliance with respect to these groups are too high relative to likely results. Inaddition, the urban self-employed represent a natural constituency for voluntary private pensions. But byexempting the self-employed from the earnings-related supplementary Paygo pension, the self-employed may escape their fair share of the financing of the redistributiive burden of the two-tier natureof the overall scheme (that is, a proportional contribution that finances aredistributive benefit formula).At the extreme, a self-employed person could rationally participate for only fifteen years under the basicpension, avoid if possible further mandatory contributions to the basic pension, and concentrate his or hersavings in private savings vehicles that earn a greater return than continued participation in the basicpension. In any event, the self-employed would not voluntarily choose to participate in the earnings-related supplementary pension so long as its rate of return is, as is likely, inferior to what can be obtainedin private savings. Accordingly, higher-income people under conventional labor contracts are likely tobear a disproportionate burden of the current system's redistributional structure, and such individualshave an incentive to characterize themselves as self-employed.
Under the current structure, the issues of the self-employed can be addressed only through bettercompliance. One step would be closer collaboration with the general tax service in monitoring the self-employed, who represent the greatest problem for tax compliance generally. Along these lines, thereshould be careful monitoring of any tax-favored private pensions so that any self-employed participantsmust show that they are in full compliance with respect to their contributions for the basic pension. Thedistributional advantage that the wealthier self-employed enjoy under the current system could beaddressed only by forcing their participation in the Paygo supplementary pension, or gradually shiftingthe supplementatry pension to one based on capitalization, with its higher rate of return (see below).28
CONTINUE TO INCREASE THE RETIREMENT AGE TO 65.0 FOR BOTH WOMEN AND MEN. Asshown in the Annex, under the government's projections, the current system will remain financiallysustainable until about the year 2010, when the system will begin to exhibit progressive and debilitatingannual deficits, primarily as a result of demographic forces, on the order of 5 percent or more of taxablepayroll (between I and 2 percent of GDP) by the year 2030. A continuing increase in the retirement age
18. Because roughly half of the benefit provided under the current formula is based on a flat amount for each yearof service rather than on relative earnings or contributions paid, the overall pension scheme is highlyredistributional. In theory, it might be possible to secure the income adequacy objective and the consequentredistribution through other means such as "volkspension" (typically, a function of age and residency only) orrequired participation in the basic pension, even by those not in the labor force (as in Switzerland). Thesestructural options, however, have uncertain effects on labor incentives, and their financing may impose just asmany compliance and incentive issues as a wage tax.
288

Pension Reform
to age 65.0 for both nnen and women is necessary for the long-term financial viability of the pensionprogram.19 Without alction to effect further increases in the retirement age, not only is the system likelyto become financially unsustainable in about fifteen years, but the cost of restoring balance to the systemonce it becomes financially insolvent will grow enormously.
SHIFT 11.0 PERCENTAGE POINTS OF THE 22.5 PERCENT PAYROLL CONTRIBUTION RATE TOEMPLOYEES, WITH A MANDATORY AND COMMENSURATE INCREASE IN WAGES TO LEAVE WORKERSWITH THE SAME LEVEL OF POST-TAX INCOME.20 As noted earlier, this has recently been donesuccessfully in Latvia, and the formal splitting of the contribution between employers and employees isrelatively common in developed countries, including, for example, the United States and Canada. Themerits of explicitly imposing some portion of the payroll tax directly on employees appear to be generallyunderstood in Lithuania. Such a move has obvious merit in improving labor force incentives-tighteningthe connection between contributions and benefits and making clear the implications of noncompliance-without affecting the take-home pay of workers.21 To reinforce the effectiveness of this shift, workersshould be provided periodic benefit statements showing how additional contributions have-and will-affect future benefit levels.22
ENACT A PRIVATE (NONSTATE) PENSION LAW AND DEVELOP A PLAN TO IMPLEMENT IT. Theworking group on the private (non-state) pension law has crafted a well-drafted law that comprehensivelyand logically deals withi all the necessary issues for a good franiework law on private pensions. It makesthe necessary distinctions between the underlying economic contract (pension "program") and the fiscalintermediaries ("funds"). It provides for both individual and employer-based schemes with a high degreeof institutional and other protections. The law should be enacted as soon as possible, although in sodoing, the regulatory responsibilities for the respective agencies should be clarified. In addition, thegovernment should devote management time and sufficient resources to assure that its regulatoryresponsibilities will be met. Given the relative modesty of Lithuania's mandatory pension system, failureto make voluntary retirement savings readily available poses the risk that political pressures will build toexpand the size of the mrandatory Paygo regime.
19. A retirement age of 655.0 (or higher) for both women and men is common to many countries, particularlycountries with aging populations, including, for example, Belgium, Canada, Denmark, Finland, Germany,Japan, the Netherlands, Norway, Sweden, and the United States.
20. Given that this Policy Note addresses only the pension component of social programs funded by the payroll tax,the recommendation presented here addresses only that portion of the payroll tax attributable to pensions.Nonetheless, the principle applies to the full social levy as well.
21. This can be accomplished by effccting the change all at once, at the end of a tax year, by keeping a record ofcontributions paid on behalf of workers and stipulating that gross pay be increased by the amount an employeewould have paid had hle or she borne the cost of some portion of the contribution, with an adjustment made forinflation.
22. In addition to making workers more aware of the connection between contributions and benefits, another stepmight be to rechaldcterize the earnings-related supplementary pension along the lines of a so-called "notionaldefined contribution" system, such as that being implemented in Sweden and Latvia. The advantages of thisnotional account formula over the German coefficient system now being used to express rights in theLithuanian supplementary Paygo pension are not so great, by themselves, to justify the public communicationand other administrative burdens that such a change would entail. The notional account formula, however,could facilitate conversion of the earnings-related pension to a funded scheme ("privatization"), and in thatcontext, it may be an appropriate change that could have the additional benefit of increasing the perception of a';nk between contributions and benefits.
289

Pension Reform
OTHER PROGRAMMATIC ISSUES. Any proposal to increase the size of the basic pension or toprovide for a minimum pension that, in effect, overrides the current benefit structure is not recommended.The degree of redistribution provided under the current system is already very high-comparable to thatof the U.S. and Swiss systems, which are highly redistributional-and such changes could not beaccomplished without either increasing costs substantially or effecting additional redistribution, and thusfurther discouraging compliance.
Funded Accounts
The merits of funded systems appear to be generally understood in Lithuania. Two options meritconsideration. The first involves the encouragement by the government of purely voluntary, tax-advantaged private pension plans. This takes advantage of the modest size of the current public program.Even when allowing for a 5 percent contribution to voluntary private pension accounts, for example, theresulting total private and public pension contribution of 27.5 percent would still be lower than thecontribution rates to the public systems alone in many countries of the former Soviet Union. In addition,the establishment of a purely voluntary system is unlikely to face much political opposition. As notedearlier, a solid framework law for a voluntary private pension has been drafted, although it awaits finalgovernment clearance. As also noted, failure to enact and promote the use of this law runs the risk that,instead, pressures will build to expand the mandatory Paygo pension system.
Despite the attractiveness of the voluntary approach, however, some form of mandatory fundedsystem should also be considered; the capital flows generated by this option, however, would not besubstantial. The second option, and the one recommended here, is to provide for an opt-out that permitsworkers to divert an increasing fraction of their supplementary pension contribution to private pensionaccounts, with a commensurate reduction in their accrual of benefits under the supplementary pension.The opt-out should be voluntary for current workers but should be made mandatory for all new workforceentrants. As noted earlier, this opt-out arrangement, in effect, already exists for the self-employed.Unless the opt-out arrangement is formally extended to other workers, there likely will be continuedefforts among wealthier individuals to characterize themselves as much as possible as self-employed.
A variant on this sort of proposal appears to be already under consideration. The variant providesfor a voluntary opt-out of contributions on wages in excess of a preset wage ceiling for high-wage-earners. Although such a proposal has some logical basis, it suffers from a number of limitations. First,only a very small percentage of the workforce will be eligible to participate, unless the ceiling is verylow.23 Second, it will result in only modest capital flows into the private capital markets.24 Third, andmost important, high-wage-earners could probably be induced to participate in tax-deferred, voluntaryprivate pension schemes even without such a program, so the scheme being proposed may not result inadditional net savings, while it will certainly reduce short-term revenue to an already financiallyconstrained program.
A better approach is to make the opt-out available to all current workers on a voluntary basis,and to make the opt-out mandatory for new workforce entrants. Under this proposal, current workers
23. If the ceiling is set at five-times average wages, roughly I percent of contributors will be eligible to participate.Even if the ceiling is set at three-times average wages, eligibility will only increase to about 3.5 percent ofcontributors.
24. Contributions on wages above the ceiling of five-times average wages represent only about 2 percent of totalrevenue; contributions on wages above the ceiling of three-times average wages represent about 5 percent oftotal revenue.
290
Pension Reform
would be given the right to divert some of their payroll contribution to private pensioni accounts, and theiraccrual of benefits under the supplementary pension would be reduced in keeping with this amount. Thiswould give workers the right to explicitly trade the certainty of some portion of their supplementarypension for the potential of higher returns from an investment in the capital markets. For new workforceentranits, participation sliould be mandatory, because the risks of a mandatory funded pillar are lower forpersons further from retirement.
Purely Voluntary, Tax-Advantaged Voluntary Opt-Out for Current Workers
Private Pensions (Mandatory for New Workforce Entrants)
* Preserve the existingy structure of the * Replaces, over the long term, thesupplemenitary pension. supplementary pension.
* Modest capital flows and modest impact on the * Substantial capital flows and substanitial impactcapital markets. on the capital markets.
* Politically nonconitroversial, but a perk to the * Potentially controversial, but far less so thanrelatively well-off. fully mandatory alternatives.
Uiless the vocabulary of the Paygo supplementary pensionl is chaliged from tilat of a definedbenefit pension scheme to that of a defined contribution scheme, hiowever, tile mechanism for reducingthe value of the supplementary pension to reflect participation in the opt-out could become quitecomplicated and would probably not be transparent to most workers. 2 For this reason, if Lithuanliawishes to provide for a partial opt-out to funded accounts withlin the structure of the public pensionprogram, it is recommended that Litlhuania consider shifting to tlhe use of the "'notionial account" formula(nlow used in Sweden and Latvia) in defining rights in the remaining supplementary Paygo pensioni. Ifthe notional account approach is used (inistead of the current supplementary benefit formula based on theGerman coefficient system), workers can simply choose to have some portion of their "inotionial"conitribution invested in actual securities through the pension fund,26 withi a commensurate reduction inthe amount of the contribution credited to their account on a notional basis. Thlis would give workers theright to explicitly forego the notional rate of return (determined, optimally, by the rate of growth inaggregate wages) for whatever return is generated by their investments. This is a major advantage of thenotional account structure, because it employs the vocabulary of a defined contribution pensioni scheme,making the transition to funded accounts much more transparent and greatly simplifying the accountingand otlher administrative requirements of moving toward a partially funded system. In addition, incombination with shifting half of the contribution rate to employees and periodic reporting to workers onlwhiat extra contributionls "buy" in future benefit levels, the consequences of nonicomplianice under such ascheeme become very clear.
Any move toward a funded system, however, raises a hanidful of policy questions:
25, The reason for this is that the supplementary pension is calculated on a worker's average earnings (as computedunder the German coefficient system) and the worker's length of service. Adjusting this benefit formula toreflect that some percentage-for example, 5 percent-of the total payroll contribution rate has been divertedinto a funded account would require relatively complicated adjustments to ensure that the decrements to thesupplementary pension benefit are fair.
26. The same funds created under the forthcoming Voluntary Private Pension Law could be used.
291

Pension Reform
* Who should be eligible?* How can the needs of the disabled and survivors be protected?* For what portion of the contribution rate should workers be allowed to opt-out?* How can the transition be financed?
Given that any efficiencies inherent in funded schemes will manifest over relatively long timehorizons, eligibility should be restricted to persons ten years or more from retirement. The relatively hlighlevel of transaction costs associated with private pension schemes calls for a relatively long break-evenperiod, and the risks of market volatility are greatest in the short term, rather than the long run.
The needs of survivors and the disabled can be protected by providing them with some form ofbenefit top-up to ensure adequate income in retirement for those unable to accumulate sufficient balancesin their investment accounts. This issue merits additional study in order to tailor the top-up to thecharacteristics and needs of Lithuania's survivors and disabled and to ensure that the costs are sustainablewith the current payroll contribution rate, but the general concept would be to provide a minimum benefitfloor, financed on a Paygo basis.
Under this proposal, funded accounts would largely or completely replace the supplementarypension over the long term, although the transition to funded accounts will have to be gradual. Oneexample of a gradual transition would be to enable current workers to divert 2.5 percent of theircontributions (out of the 11 percent employee contribution) to funded accounts in the initial years; 5.0percent for a ten-year period thereafter, and 10 or 11 percent when the transition is complete. (As notedabove, for new workforce entrants, participation would be mandatory.) The supplementary pensionwould essentially be replaced over the long run, as illustrated in the Annex. The capital accumulationresulting from even this gradual a transition will be substantial-as much as 60 percent of GDP,or about five times the current market capitalization of the Lithuanian stock market, by the year2025. This scheme also has the advantage of pacing the growth of the "opt-out" to forecast
Table 10-1. Comparison of Value Added Tax Rates
(percent)Country/area Rate NotesBaltic
Estonia 18 Exemptions for medicines, education, some services, among others.Latvia 18 Limited exemptions.Lithuania 18 Limited exemptions.
OtherBulgaria 1 8Czech Republic 24 Rate ranges from 23 to 24%. Rate of 5% for most services and foodstuffs.Hungary 25 Rate of 12% on basic food products and utilities.Poland 22 Rate of 7% on foodstuffs and other items.Romania 18 Various exemptions for bread, fuel sources, and utilities, inter alia.Russia 20 Rate of 1O% on foodstuffs. Other exemptions.Slovak Republic 25 Rate of 6% on foodstuffs and most services.Slovenia 20 Slovenia levies a sales tax, not a VAT. Rates vary by category.Ukraine 20 Exemptions for fuel supplies.
Source: Coopers and Lybrand, Business and Investment Guides, 1997; Deloitte-Touche-Tohmatsu International,Taxation in Eastern Europe, 1995.
292

Pension Reform
medium-term surpluses in the public pension system, while providing for the accumulation of substantialamounts of investment capital. If the rates of return earned on the funded accounts are high, thegovernment should also consider adjusting the level of the basic pension downward, with acommensurate reduction in the contribution rate.
Finally, the proposed partial opt-out scheme would cost the fiscal budget about 0.3 percent ofGDP initially, rising to between 2.0 and 3.0 percent of GDP by 2015. It could be funded by somecombination of (a) an increase in the level of the VAT, (b) a modest increase in the contribution rate, and(c) the indexation of thie earnings-related benefit by price inflation, rather than wage growth (or by somecombination of the twc).
It is worth noting that Lithuania's VAT rate of 18 percent is comparable to those of its Baltictrading partners, but significantly lower-by 4 percentage points-than the VAT rate in Poland and anumber of other countries in the region, as is illustrated by the VAT rates for a selection of countries fromthe former Soviet Union presented in table 10-1.
293

Pension Reform-Annex
ANNEXData Tables
295

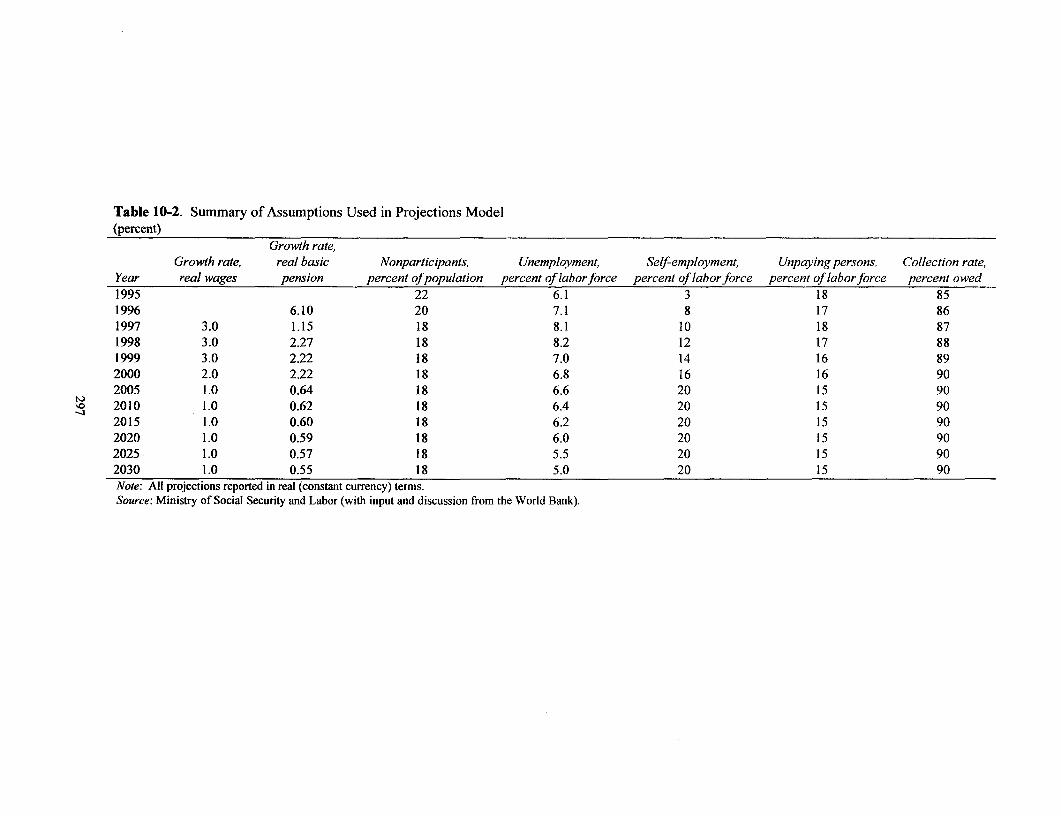
Table 10-2. Summary of Assumptions Used in Projections Model(percent)
Growth rate,Growth rate, real basic Nonparticipants, Unemployment, Self-employment, Unpaying persons, Collection rate,
Year real wages pension percent of population percent of labor force percent of laborforce percent of laborforce percent owed1995 22 6.1 3 18 851996 6.10 20 7.1 8 17 861997 3.0 1.15 18 8.1 10 18 871998 3.0 2.27 18 8.2 12 17 881999 3.0 2.22 18 7.0 14 16 892000 2.0 2.22 18 6.8 16 16 902005 1.0 0.64 18 6.6 20 15 902010 1.0 0.62 18 6.4 20 15 902015 1.0 0.60 18 6.2 20 15 902020 1.0 0.59 18 6.0 20 15 902025 1.0 0.57 18 5.5 20 15 902030 1.0 0.55 18 5.0 20 15 90Note: All projections reported in real (constant currency) terms.Source: Ministry of Social Security and Labor (with input and discussion from the World Bank).
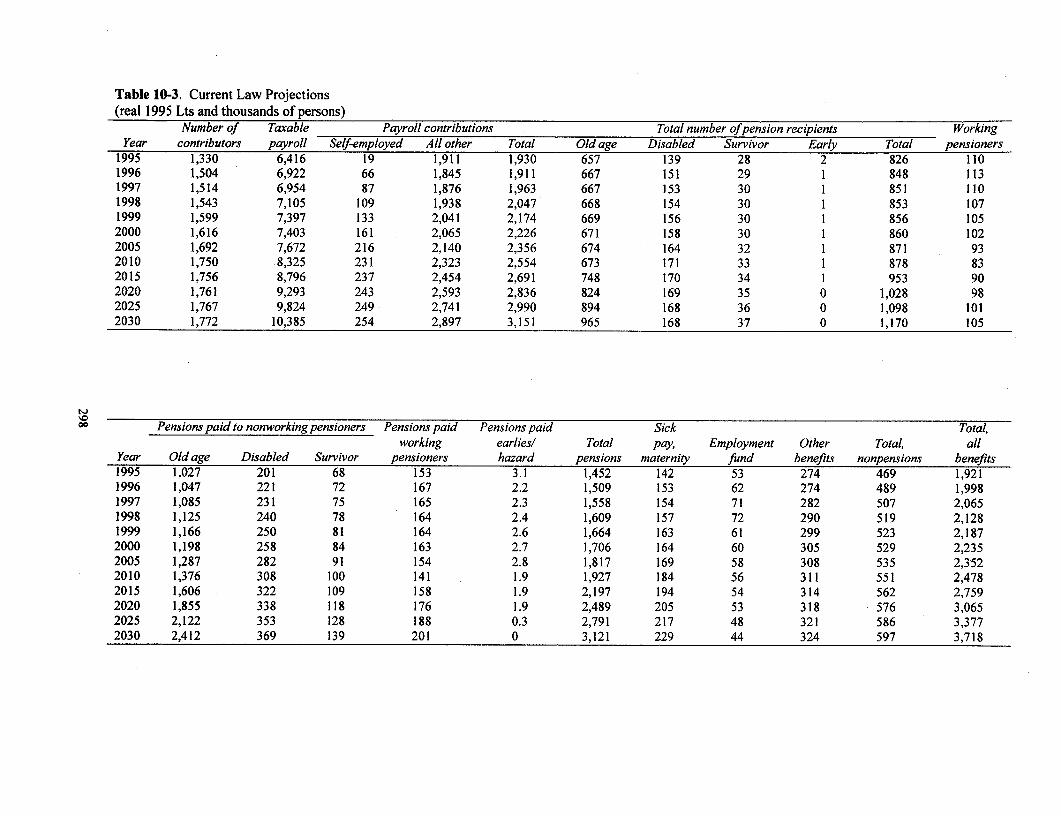
Table 10-3. Current Law Projections(real 1995 Lts and thousands of persons)
Number of Taxable Payroll contributions Total number ofpension recipients WorkingYear contributors payroll Self-employed All other Total Old age Disabled Survivor Early Total pensioners
1995 1,330 6,416 19 1,911 1,930 657 139 28 2 826 1101996 1,504 6,922 66 1,845 1,911 667 151 29 1 848 1131997 1,514 6,954 87 1,876 1,963 667 153 30 1 851 1101998 1,543 7,105 109 1,938 2,047 668 154 30 1 853 1071999 1,599 7,397 133 2,041 2,174 669 156 30 1 856 1052000 1,616 7,403 161 2,065 2,226 671 158 30 1 860 1022005 1,692 7,672 216 2,140 2,356 674 164 32 1 871 932010 1,750 .8,325 231 2,323 2,554 673 171 33 1 878 832015 1,756 8,796 237 2,454 2,691 748 170 34 1 953 902020 1,761 9,293 243 2,593 2,836 824 169 35 0 1,028 982025 1,767 9,824 249 2,741 2,990 894 168 36 0 1,098 1012030 1,772 10,385 254 2,897 3,151 965 168 37 0 1,170 105
x0 Pensions paid to nonworking pensioners Pensions paid Pensions paid Sick Total,working earlies/ Total pay, Employment Other Total, all
Year Old age Disabled Survivor pensioners hazard pensions maternity fund benefits nonpensions benefits1995 1,027 201 68 153 3.1 1,452 142 53 274 469 1,9211996 1,047 221 72 167 2.2 1,509 153 62 274 489 1,9981997 1,085 231 75 165 2.3 1,558 154 71 282 507 2,0651998 1,125 240 78 164 2.4 1,609 157 72 290 519 2,1281999 1,166 250 81 164 2.6 1,664 163 61 299 523 2,1872000 1,198 258 84 163 2.7 1,706 164 60 305 529 2,2352005 1,287 282 91 154 2.8 1,817 169 58 308 535 2,3522010 1,376 308 100 141 1.9 1,927 184 56 311 551 2,4782015 1,606 322 109 158 1.9 2,197 194 54 314 562 2,7592020 1,855 338 118 176 1.9 2,489 205 53 318 576 3,0652025 2,122 353 128 188 0.3 2,791 217 48 321 586 3,3772030 2,412 369 139 201 0 3,121 229 44 324 597 3,718

Table 10-3. Current Law Projections (continued)Contribution Yearly Net Contributions, Benefits Net cash
Contribution Cost rates (percent) rate less net cashflow, GDP percent of percent of flow, percentYear rate (Yo) Pensions Nonpensions Total cost rate (/o) cashflow % ofpayroll (1, 000, 0OOs) GDP GDP of GDP
1995 31 22.6 7.3 29.9 1.1 8.9 0.1 30,034 6.4 6.4 0.031996 31 21.8 7.1 28.9 2.1 (87.2) -1.3 31,115 6.1 6.4 -0.281997 31 22.4 7.3 29.7 1.3 (102.3) -1.5 32,235 6.1 6.4 -0.321998 31 22.7 7.3 30.0 1.0 (81.4) -1.1 33,589 6.1 6.3 -0.241999 31 22.5 7.1 29.6 1.4 (12.6) -0.2 35,201 6.2 6.2 -0.042000 31 23.0 7.1 30.2 0.8 (8.7) -0.1 37,032 6.0 6.0 -0.022005 31 23.7 7.0 30.7 0.3 4.2 0.1 39,328 6.0 6.0 0.012010 31 23.1 6.6 29.8 1.2 76.1 0.9 42,081 6.1 5.9 0.182015 31 25.0 6.4 31.4 -0.4 (67.9) -0.8 44,816 6.0 6.2 -0.152020 31 26.8 6.2 33.0 -2.0 (228.9) -2.5 47,505 6.0 6.5 -0.482025 31 28.4 6.0 34.4 -3.4 (387.3) -3.9 50,118 6.0 6.7 -0.772030 31 30.1 5.7 35.8 -4.8 (567.0) -5.5 52,624 6.0 7.1 -1.08Source: Ministry of Social Security and Labor (programmatic projections); World Bank (GDP growth rates to 2050); independent estimates (GDP growth, 2006-2030).

Figure 10-8. Comparison of Contributions and Total Benefits(real 1995 Lt millions)4,000
3,500
3,000
2,500
1,500 .. -
1,000 ---
500
01995 1996 1997 1998 1999 2000, 2005 2010 2015 2020 2025 2030
-- Contributions ....- Total Benefits

Table 10-4. Projections Given SAL Conditionalities and Increases in the Retirement Age to 65 for Both Genders(real 1995 Lts and thousands of persons)
Number of Taxable Payroll contributions Total number ofpension recipients WorkingYear contributors payroll Self-employed All other Total Old age Disabled Survivor Early Total pensioners
1995 1,330 6,416 19 1,911 1,930 657 139 28 2 826 1101996 1,504 6,922 66 1,845 1,911 667 151 29 1 848 1131997 1,523 6,993 88 1,886 1,974 643 155 30 1 829 1031998 1,557 7,158 111 1,953 2,064 635 157 30 1 823 981999 1,616 7,463 136 2,059 2,195 629 159 30 1 819 932000 1,637 7,478 165 2,086 2,251 623 161 30 1 815 882005 1,732 7,813 225 2,180 2,405 586 171 32 1 790 692010 1,806 8,558 242 2,388 2,630 573 178 33 1 785 652015 1,848 9,208 254 2,569 2,823 587 182 34 1 804 632020 1,867 9,785 263 2,730 2,993 641 183 35 0 859 672025 1,869 10,327 269 2,881 3,150 718 182 36 0 936 722030 1,871 10,898 274 3,041 3,315 796 180 37 0 1,013 76
0
Pensions paid to nonworking pensioners Pensions paid Pensions paid Sick Total,working earlies/ Total pay, Employment Other Total, all
Year Old age Disabled Survivor penioners. hazard pensions maternity fund benefits nonpensions benefits1995 1,027 201 68 153 3.1 1,452 142 53 274 469 1,9211996 1,047 221 72 167 2.2 1,509 153 62 274 489 1,9981997 1,053 234 75 153 2.3 1,517 155 71 282 508 2,0251998 1,081 244 78 149 2.4 1,554 158 72 290 520 2,0741999 1,111 255 81 145 2.6 1,595 165 61 299 525 2,1202000 1,132 264 84 141 2.7 1,624 165 60 305 530 2,1542005 1,155 293 91 113 2.8 1,655 173 58 308 539 2,1942010 1,197 322 100 110 1.9 1,731 189 56 311 556 2,2872015 1,296 346 109 110 1.9 1,863 203 54 314 571 2,4342020 1,487 365 118 120 1.9 2,092 216 53 318 587 2,6792025 1,750 381 128 133 0.3 2,392 228 48 321 597 2,9892030 2,035 397 139 146 0 2,717 241 44 324 609 3,226

Table 10-4. Projections Given SAL Conditionalities and Increases in the Retirement Age to 65 for Both Genders (continued)Contribution Yearly Net Contributions, Benefits Net cash
Contribution Cost rates (percent) rate less net cashflow, GDP percent of percent of flow, percentYear rate (%) Pensions Nonpensions Total cost rate (%1) cashflow % ofpayroll (1,000, 000s) GDP GDP of GDP
1995 3-1 22.6 7.3 29.9 1.1 8.9 0.1 30,034 6.4 6.4 0.031996 31 21.8 7.1 28.9 2.1 (87.2) -1.3 31,115 6.1 6.4 -0.281997 31 21.7 7.3 29.0 2.0 (51.3) -0.7 32,235 6.1 6.3 -0.161998 31 21.7 7.3 29.0 2.0 (10.4) -0.1 33,589 6.1 6.2 -0.031999 31 21.4 7.0 28.4 2.6 75.4 1.0 35,201 6.2 6.0 0.212000 31 21.7 7.1 28.8 2.2 97.3 1.3 37,032 6.1 5.8 0.262005 31 21.2 6.9 28.1 2.9 211.2 2.7 39,328 6.1 5.6 0.542010 31 20.2 6.5 26.7 4.3 343.1 4.0 42,081 6.2 5.4 0.822015 31 20.2 6.2 26.4 4.6 389.1 4.2 44,816 6.3 5.4 0.872020 31 21.4 6.0 27.4 3.6 314.1 3.2 47,505 6.3 5.6 0.662025 31 23.2 5.8 28.9 2.1 160.7 1.6 50,118 6.3 6.0 0.322030 31 24.9 5.6 30.5 0.5 (11.0) -0.1 52,624 6.3 6.3 -0.02Source: Ministry of Social Security and Labor (programmatic projections); World Bank (GDP growth rates to 2050); independent estimates (GDP growth, 2006-2030).
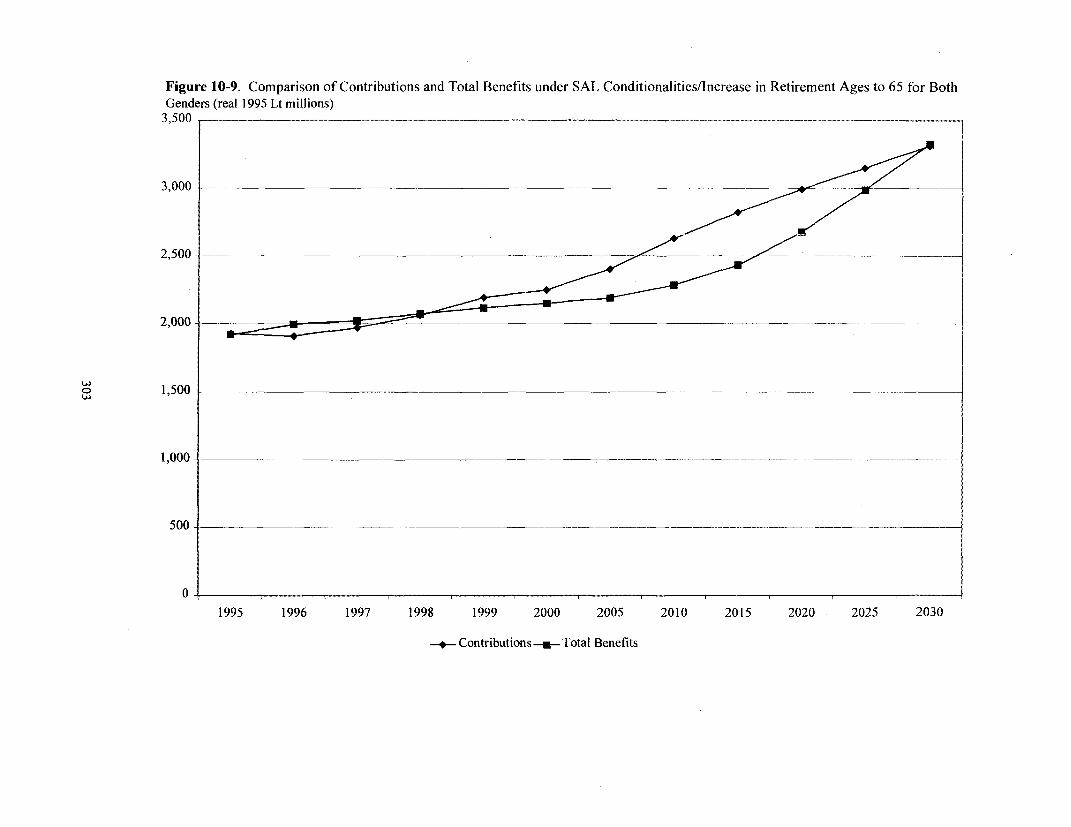
Figure 10-9. Comparison of Contributions and Total Benefits under SAL Conditionalities/Increase in Retirement Ages to 65 for Both
Genders (real 1995 Lt millions)3,500 -_
3,000 - ____
2,500 ____{.._
2,000 - _ _
0o, 1,500 - ______ _ _ X
1,000 . . . _ ______
500 -______________ ____ ______ ____._ __
0
1995 1996 1997 1998 1999 2000 2005 2010 2015 2020 2025 2030
-sContributions---Total Benefits
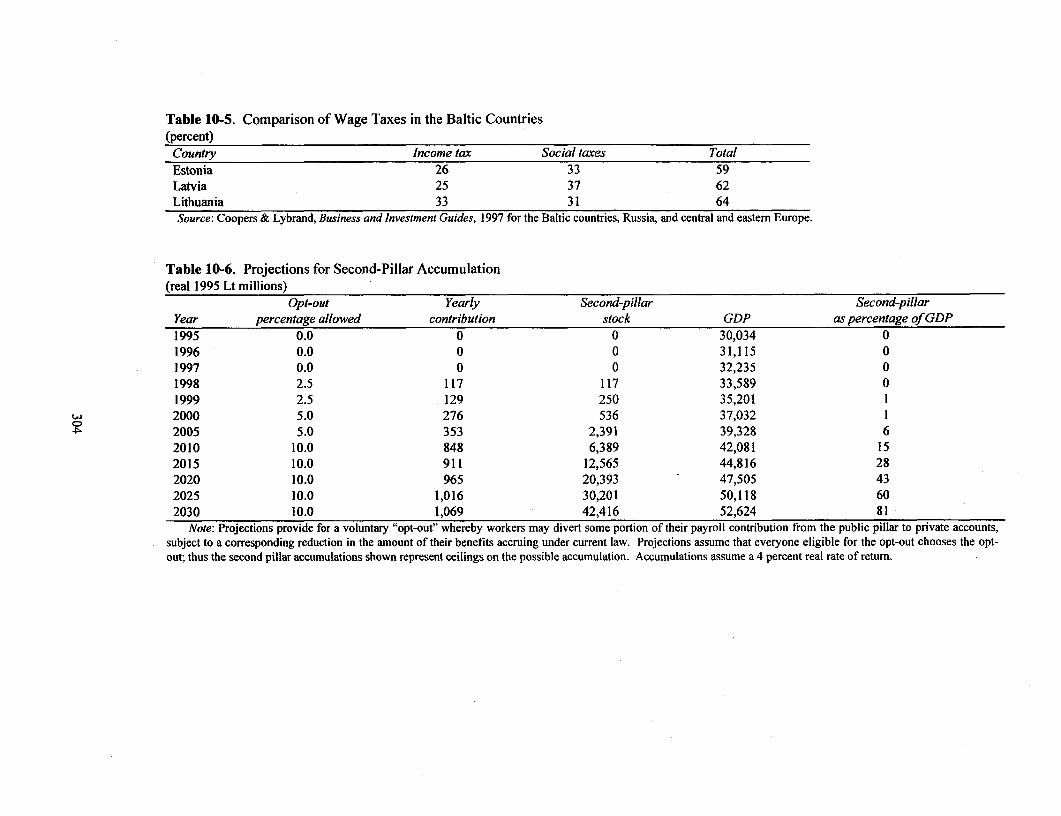
Table 10-5. Comparison of Wage Taxes in the Baltic Countries(percent)
Country Income tax Social taxes TotalEstonia 26 33 59Latvia 25 37 62Lithuania 33 31 64Source: Coopers & Lybrand, Business and Investment Guides, 1997 for the Baltic countries, Russia, and central and eastern Europe.
Table 10-6. Projections for Second-Pillar Accumulation(real 1995 Lt millions)
Opt-out Yearly Second-pillar Second-pillarYear percentage allowed contribution stock GDP as percentage of GDP1995 0.0 0 0 30,034 01996 0.0 0 0 31,115 01997 0.0 0 0 32,235 01998 2.5 117 117 33,589 01999 2.5 129 250 35,201 12000 5.0 276 536 37,032 1
4>- 2005 5.0 353 2,391 39,328 62010 10.0 848 6,389 42,081 152015 10.0 911 12,565 44,816 282020 10.0 965 20,393 47,505 432025 10.0 1,016 30,201 50,118 602030 10.0 1,069 42,416 52,624 81
Note: Projections provide for a voluntary "opt-out" whereby workers may divert some portion of their payroll contribution from the public pillar to private accounts,subject to a corresponding reduction in the amount of their benefits accruing under current law. Projections assume that everyone eligible for the opt-out chooses the opt-out; thus the second pillar accumulations shown represent ceilings on the possible accumulation. Accumulations assume a 4 percent real rate of return.
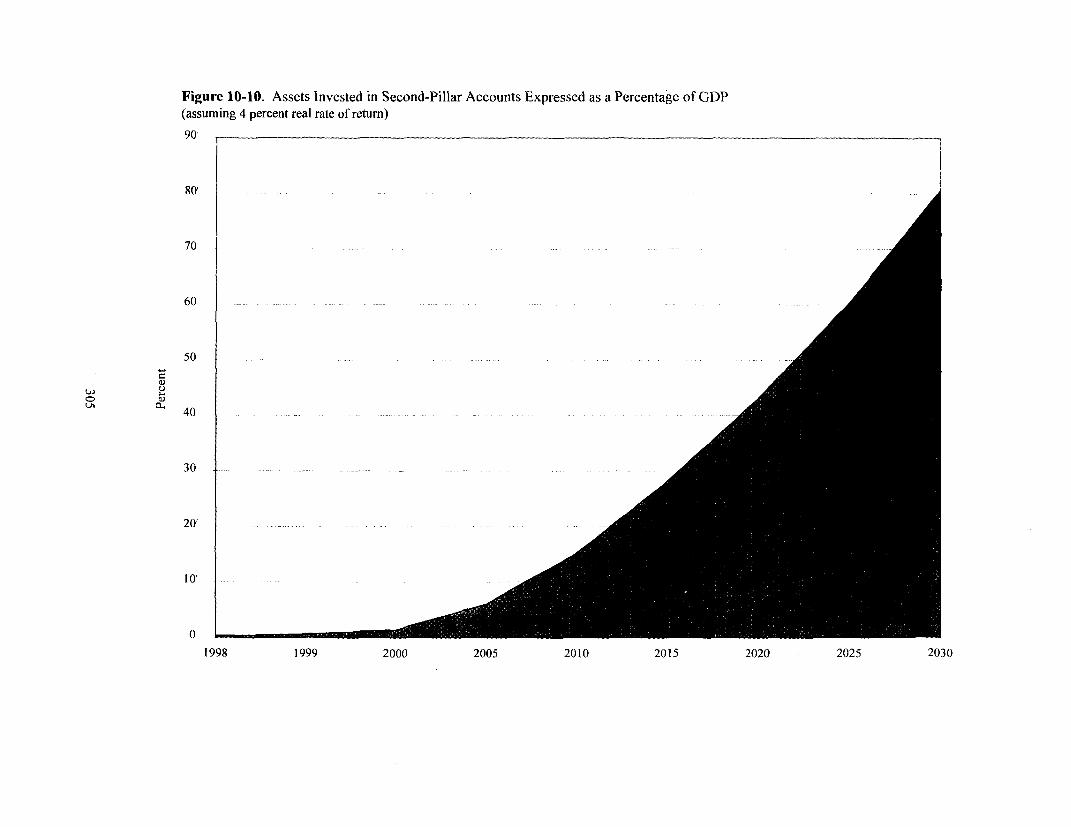
Figure 10-10. Assets Invested in Second-Pillar Accounts Expressed as a Percentage of GDP(assuming 4 percent real rate of return)
90
80,
70
60
50
40
30
20'
10'
1 9 8 - ............ .9..... . .... ..... ........... ..........2
1998 1999 2000 2005 2010 2015 2020 2025 2030


THE SECURITIES MARKET
This chapter focuses on the role of securities markets in supporting privatization and pension reform. Itsuggests that Lithuania has the basis of a suitable securities market policy, as well as the required legalframework and operational capacity, but that there are areas that need further development to ensure thatthe securities market contributes as it should to the success of privatization and pension reform.
The principal policy nexus between privatization and pension reform and the securities market iscorporate governance. The securities market imposes incentives and disciplines on managers of publiclytraded companies through its information disclosure and price-setting mechanisms and through theactions of institutional investors and other substantial minority shareholders, who lead the market in theeffective exercise of the shareholder rights accorded them under securities law. Lithuania has the basis ofa securities market capable of imposing such incentives and disciplines, but important gaps remain.These can be filled by (i) developing the aspects of the legal and regulatory system that can improve thequality and timeliness of information disclosed to the market, provide more comprehensive checks andbalances on the exercise of management prerogatives, and strengthen the rights of minority shareholdersand (ii) building the capacity of domestic institutional investors to analyze and judge the quality ofmanagement performance.
The principal operational nexus between privatization and pension reform and the securitiesmarket is the securities market's absorptive capacity. If the expected increase in supply of securities andinvestment arising from privatization and pension reform is to be absorbed by the securities marketwithout disruption or distortion, the operational capacity of the market must be high. Lithuania hasachieved a great deal in a short time in creating its securities market, but to handle the increased supply ofsecurities and investment expected from privatization and pension reform, two things are necessary.First, the uncertainties in the law pertaining to the application of the securities law to shares issued undercash privatization and to the concept of nominee shareholding as it is applied to custodian services forforeign institutional investors must be remedied. Second, the planning and implementation ofprivatization and pension reform need to be coordinated with development of the securities market toensure that the securities market is able to fulfill the role expected of it.
The Structure of the Present Lithuanian Securities Market
This section describes the main structural features of the Lithuanian securities market. (Data on themarket can be found in the Annex to this chapter.)
307

The Securities Market
Legacy of Mass Privatization
The present structure of the Lithuanian securities market has been greatly influenced by massprivatization. Like other countries that undertook mass privatization, Lithuania has rapidly created alarge number of public companies, but most are very small. There are 1,500 Lithuanian publiccompanies, but only the top 100 had annual revenues of more than US$10 million in 1997. Without massprivatization, companies with annual revenues of less than US$10 million would ordinarily remain inprivate hands, owned by individuals or families. But the political imperatives of rapid transformationfrom a socialist to a capitalist market economy in Russia and much of eastern Europe led to privatizationprograms that were intended to spread ownership of former state enterprises widely and equitably amongthe population. As a result, many companies that would not usually qualify for public company status onfinancial or economic grounds were created as public companies rather than as private or closely heldenterprises.
As a corollary, mass privatization created a large number of small shareholders in a short time.There are approximately 1.5 million shareholders in Lithuania-40 percent of the total population-andeach owns, on average, less than 0.2 percent of the shares of the companies in which they have a stake.In comparison, in the United States, which is considered to have a high rate of share ownership, less than20 percent of the population owns shares. In the United Kingdom and Australia, which are notable forthe scale of their privatization programs over the last decade, the figure is approximately 15 percent.
In addition, because the companies created under mass privatization were so recently and rapidlycreated, very few have a proven profit history or reliable audited accounts. For 1997, only 54 of the 607companies listed on the National Stock Exchange of Lithuania (NSEL) prepared accounts according tointernational standards and had them audited by an auditing firm working at the international standard. Incomparison, any company listed on a stock exchange in the United States or western Europe must have athree-to-five-year record of audited financial accounts and any public company, whether listed or not,must have its accounts audited annually.
Lithuania implemented a voucher-based mass privatization similar to the programs in the CzechRepublic and Russia.' One part of such voucher-based schemes.was the creation of investment funds thatwere used to accumulate vouchers and convert them into a portfolio of significant holdings of securitiesin privatized companies. These voucher investment funds were intended to provide the same benefitsoffered by the more common kind of cash investment fund in the West: higher returns and better riskmanagement for investors and more influence over the management of the privatized companies throughthe accumulation of significant holdings by the investment companies. Most of these funds have failed tooperate successfully, however, because they lacked revenue, cash reserves, and management skill. Asignificant number have collapsed because of fraud. Lithuania has shared this unhappy experience withthe Czech Republic and Russia.2 The Lithuanian government is now attempting to address the problemthrough liquidation and consolidation of the voucher investment funds into a small number of potentially
1. See Ira Lieberman and Raj Desai, eds., Between State and Market: Mass Privatization in Transition Economies(Washington, D.C.: World Bank, 1997), especially the chapter "Investment Funds in Mass Privatization" byPistor and Spicer; and Stijn Claessens, Simeon Djankov, and Gerhard Pohl, Ownership and CorporateGovernance-Evidence from the Czech Republic, Policy Research Working Paper 1737 (Washington, D.C:World Bank, April 1997).
2. At its peak, Russia had 500 registered voucher investment funds. The number is now just over 300, and it isestimated that only 25 to 30 of these have an active portfolio with long-term prospects. In the Czech Republic thenumbers were 620 funds initially, 250 now, and 30 that are viable.
308

The Securities Market
viable investment holding companies.
Overall, the legacy of privatization in Lithuania is the large number of domestic companies withpublicly issued shares and a large number of domestic shareholders, although there are few domesticinvestors. This at first. appears somewhat paradoxical, but it is a typical outcome of voucher-basedprivatization. The large number of domestic shareholders was created through the mass issuance ofvouchers, but these are shareholders who are not investors: they did not invest their own savings to obtainsecurities. In addition, following voucher privatization, relatively little domestic savings has beendirected to securities investment other than by banks managing their reserves. For example, according toan NSEL survey at the end of 1996, about US$220 million of domestic savings was invested in thesecurities market as a whole (equities and treasury bills). Of this total, almost 60 percent was in treasurybills (TBs) held by banks, leaving about US$140 million invested in equities from domestic sources in1996. According to the survey, most of this was accounted for by existing insiders, such as companymanagers, as they accumulated additional shares to consolidate their control over the companies theymanage. Other domestic investors are few in number. The main reason for this lack of activity appearsto be that the reliable information required as the basis for investment decisions is not readily availableand the securities market is not widely trusted as an investment mechanism. Nevertheless, activities onNSEL are picking up, partly because of domestic investors. At the end of 1997, holdings of shares bydomestic investors had increased to US$240 million, an increase of US$100 million, of which aboutUS$70 million was new money and US$30 million was an increase in value.
Institutional Arrangements
STOCK EXCHANGE. The NSEL was created by government resolution on 3 September 1992. It isthe only organized securities market in Lithuania and trades both private and government securities. It isorganized as a nonprofit company. The major shareholder is the state through the Ministry of Finance,which holds 44.6 percent of NSEL's capital, with the balance of the shares divided into small holdings asdescribed in table 11-1 of the Annex. The exchange has membership, listing, and trading rules, andsupervisory arrangements to enforce these rules. The rules must be approved by the SecuritiesCommission and are regularly amended to keep them in line with market developments.3
The trading system of the exchange is a computer-based, order-driven, and, until recently, single-price market with one price fixing each day. In April 1998 the exchange moved to continuous trading forthe official list and around 50 securities on the current list. The system was provided to the NSEL by theFrench government in 1993. It was modified in 1996 to facilitate greater order clearance at the fixedprice, and further modified in 1997-98 to enable continuous trading.
SECURITIES DEPOSITORY. The Central Securities Depository (CSDL) was created bygovernment resolution on 20 May 1993, and began operation on 31 March 1994. It is the only securitiesdepository in Lithuania and keeps accounts for both private and government securities. The depository isa nonprofit company; the major shareholder is the state through the Bank of Lithuania (60 percent) andthe Ministry of Finance (32 percent). The remaining 8 percent is held by the NSEL.
The depository issues rules and procedures related to admission to participant status, accountingfor securities, registration of securities, payment in settlement of securities transactions, and otherrelevant topics. It also provides standardized computer software that permits participants to integrate the
3. Resident foreign technical assistance is available to the exchange to assist with this work.
309
The Securities Market
central system with their office management systems.4 The depository operates a dematerialized transferand settlement system, which allows account balances for both securities and cash to be maintained andenables book-entry settlement of trading in registered securities of all public companies. Securitiestransfer is effected by the depository itself; cash transfer is done by the Payments Center of the Bank ofLithuania on instructions from the depository.
Size and Liquidity
At the end of 1997, the NSEL listed 668 securities issues of 607 corporate issuers. There are two tradinglists: (i) the Official List, which was created in April 1997 and contains the securities of seven issuers thatmeet capital, accounting, and legal requirements (at least Lt 5 million in authorized capital; annualfinancial reports prepared according to international accounting standards and audited by an internationalauditor; securities fully paid up, of equal rank and without restriction on transfer); and (ii) theCurrentList, which is divided into group A (48 issues) and group B (615 issues), according to established criteria.Group A includes securities of issuers that have shown a profit in their annual financial statement for thepreceding year; have been on the current list for at least one month; have traded at least once; and havehad bid and offer prices quoted at least three times during the previous month. Group B includes theremainder.
Six characteristics of the market stand out. First, it is small. Market capitalization at the end of1997 was US$2,200 million, or 23 percent of GDP. It is notable that a large part (more than one-third atthe end of 1997) of the shares are still held by the state. The average of market capitalization to GDPratio for securities markets in the International Finance Corporation's (IFC) emerging market index is 25percent, and for most it is more than 40 percent. Second, it is illiquid. There were approximately 71,000trades during the 1997 calendar year: 70,500 share transactions for a turnover value of US$240 millionand 500 TB transactions for a turnover value of US$126 million. The turnover ratio (turnovervalue/market capitalization) for shares in Lithuania was 9.5 in 1997, almost twice as much as in 1996, butstill well below the 30 percent average turnover ratio in the IFC index. Third, it is narrow. The top fivecompanies accounted for a quarter of turnover by value, and the top ten companies accounted for 60percent. The average market concentration in the IFC index is 30 percent for the top ten companies.Fourth, the share offoreign investment is increasing. In 1996 and 1997, holdings by foreign investorsincreased manyfold, to about half of total holdings. Investment by residents has been increasing, but at aslower pace. By country of origin, the United States, at the end of 1997, had the largest share, 38 percent,of foreign investments in the stock market, followed by Estonia, 16 percent, the United Kingdom, 13percent, and Sweden, 5 percent. Fifth, intermediation is highly concentrated. In 1997 the top threebrokerage firms accounted for 54 percent of the secondary market turnover, sharing it about equallyamong themselves. Many of the remaining brokers conduct a negligible number of trades and are notviable. At the end of 1996, there were sixty-three licensed brokers, but in early 1997, ten went out ofbusiness. Finally, nonbrokerage intermediation is very limited. Corporate finance activity is small, as isthe average transaction size. There were 109 new issues in 1997, with an average size of Lt 8 million, orUS$2 million. Issues of this size are not really viable as public offerings, because the regulatory andadministrative costs make the price of capital too high. There is currently no securities market assetmanagement activity, but the five biggest brokerage firms have plans to establish investment companiesunder the Investment Company Law when certain impediments are removed (see the "Key Issues"section, below).
4. Foreign technical assistance is also available to the depository to assist with this work.
310

The Securities Market
Regulation
LAWS. The most fundamental aspects of the legal foundation of Lithuania's securities market arefound in the Civil Code, which defines the nature of legal persons, including companies, and the nature ofsecurities and how title to securities is created and transferred. Building on the Civil Code, the SecuritiesLaw and Companies Law more specifically define the processes, rights, and obligations of the partiesengaged in forming and managing companies and issuing and trading securities.5
Overall, Lithuania has established a reasonable legal foundation for the development of thesecurities market, but there are some gaps and uncertainties that impede market development. Theserelate to the quality andl timeliness of information, the powers and responsibilities of managers, the rightsof minority shareholders, and the concept of nominee ownership. They are discussed in the "Key Issues"section, below.
SECURITIES COMMISSION. The Securities Commission was first established under the Ministryof Finance through a number of temporary laws. In 1996, Chapter 7 of the Securities Law allowed thecommission to be permanently established as an independent authority reporting to the Seimas. Thecommission is charged with responsibility for regulating all aspects of the public trading of securities,including licensing stock exchanges, securities depositories, and intermediaries and approvingprospectuses and periodic reports by public companies. The commission consists of a chairman and fourmembers appointed by the Seimas for staggered terms of up to five years. It has an active trainingprogram to improve the knowledge and skills of its staff and members, as well as resident foreigntechnical assistance available to assist in its work.
Key Outstanding Policy Issues
There are a number of key securities market issues related to supporting privatization and pension reform.The issues can be grouped under two headings: corporate governance and absorptive capacity.
Corporate Governance
One of the underlying policy objectives of privatization and pension reform is improvement in thestandard of corporate governance. (Corporate governance is discussed in more detail in Chapter 9 of thisvolume.) Briefly stated, the objective is to expose company management to the disciplines and incentivesof the market economy so that the assets of companies will be used in the most productive way, and thusmake the maximum contribution to economic growth.
The securities market is an important-perhaps the most important-mechanism for thetransmission of such clisciplines and incentives. When a company is actually financed through thesecurities market, the performance of the company's management comes under public scrutiny, and goodperformance is rewarded, while poor performance is penalized. This behavior is first seen in thesecondary market price of the company's securities. Companies that are performing well see their pricerise on the securities mnarket, and companies performing poorly will be subject to falling prices. Theserising and falling prices provide a direct incentive for managers to maximize the company's return on
5. The relevant laws are: Law on Public Trading of Securities, issued on 16 January 1996; Company Law, issued on5 July 1994, as amended 22 August 1996; Law on Investment Companies, issued on 5 July 1995; Law onEnterprises, issued on El May 1990, as amended 23 January 1996; and General Accounting Rules for Securitiesand their Circulation, issued by the Securities Commission on 5 August 1993.
311
The Securities Market
investment in order to reduce the marginal cost of capital, because a higher secondary market pricetranslates into a lower primary market cost of capital in any subsequent securities issue of the company.
But more important, the rising and falling secondary market price provides an incentive toprospective investors to monitor management performance and take action accordingly. The simplestavailable action in the case of a falling price is to sell the securities. This in itself has an effect onmanagers. If enough investors decide to sell because the company's prospects are poor, their actions willcontribute to a further fall in the price, which should potentially motivate managers to change their plansfor the company. For substantial shareholders, there may also be more direct avenues of influence overmanagers available, such as solicitation of proxies to allow passage of resolutions at general meetings ofshareholders. Such resolutions can involve the election or removal of board members, the issuance ofspecial shares or options to directors, the provision of other benefits to directors, and other matters thatdirectly affect the balance of responsibilities between directors and shareholders. And finally, asubstantial shareholder or other party may use the securities market to make a takeover bid for acompany. The potential for such takeovers is a check on management conduct, because it implies thatpoorly performing managers may be ousted by new owners who are better able to manage the company'sassets. In all these ways, the securities market can be a mechanism for encouraging higher standards ofcorporate governance.
The effective operation of these disciplines and incentives depends on the following:
- TTimely information about the financial performance and profit potential of companies must beavailable so that investors can assess company value. An efficient price-setting mechanism inthe securities market is needed so that investors' assessments can be signaled through buy andsell decisions and translated into publicly observed price movements.
* Well-balanced rights, powers, and obligations-such as those between majority owners andmanagers on the one hand, and minority shareholders on the other-must be established by law.
* Avenues of action against poorly performing management, such as proxy solicitation andcompany takeover processes, must be available.
- There must be a pool of investors who are able to exercise their rights and protect their interestsif they run counter to those of management.
Each of these is discussed below in relation to Lithuania.
INFORMATION AND PRICING
Financial Information. Public disclosure of accurate and timely financial information is acornerstone of securities market efficiency and is directly linked to improved corporate governance.Unless such information is available to the securities market, the market will trade blind-that is, it willbe speculative and not based on an assessment of fundamentals-and entrenched managers and majorityowners will have an enhanced ability to misuse the assets of public companies.
The Lithuanian authorities recognize this danger, and they have made a start in improving thequality and timeliness of the financial information disclosed to the securities market. But in practice,financial disclosure of a high standard is still very limited. Only 54 of the 607 firms listed on the NSELhad their accounts prepared and audited to international standards in 1997.
The NSEL has created a market structure that encourages enterprises to make extensive, high-quality financial information available to investors. This effort began with the opening of the official list
312
The Securities Market
in April 1997. The current (divided into groups A and B) and official trading lists on the NSEL create anincentive for companies to improve their financial disclosure. Companies graduate from the B to the A tothe official list by applying international standard accounting rules and obtaining an international-standard audit, in addition to meeting other requirements, such as profitability and liquidity. Entry intothe official list confers respectability on a company, makes it more attractive to foreign portfolioinvestors, and tends to lower its cost of capital. Thus, there is an incentive for the more forward-lookingmanagers to meet the official list requirements. While so far only seven companies have done so, severalmore have realized the benefits and intend to meet the requirements. The NSEL and the SecuritiesCommission are to be commended for creating the right incentive structure.
Nevertheless, a problem of accounting and auditing practice in Lithuania remains. The currentlisting rules of the NSEI cannot specify a domestically applicable set of accounting standards or auditingpractices because the domestic accounting profession is not sufficiently developed to adopt suchstandards. Nor is there a legally sanctioned standard. Local accountants are trained and experienced inthe accounting methods of the centrally planned economy, but they have little or no experience inpreparing accounts in a market economy.
For this reason, the NSEL listing rules for the official list require that "an internationalaccounting firm" prepare the accounts and carry out the audit "in line with international practice." Thisis a reasonable approach in the short-term, but it needs to be followed up with medium-term actions todevelop domestic accounting and auditing practices. Typical listing requirements in developed marketsspecify the domestic accounting and auditing standards to be applied. This is important, because there isa relatively small number of officially agreed-or enforceable-international standards, and what reallycounts are the domestically established standards. In the modern world of international finance-and ofthe European Union-these standards are converging, but they remain largely a domestic matter.
Nonfinancial Information. Disclosure of nonfinancial, price-sensitive information is a secondcornerstone of securities market efficiency. This is often referred to as continuous disclosure todistinguish it from the periodic disclosure of financial information (semi-annual and annual accounts).Continuous disclosure requirements are typically part of securities law and the listing rules of stockexchanges. They are aimed at keeping securities markets fully informed at all times, and they usuallyrequire officeholders oif companies with shares traded on a public securities market to immediatelydisclose to the market any information that may materially affect the price of the company's securities.
The enforcement of such requirements is taken very seriously in all developed securities markets.They are the basis of fairness and transparency and are directly linked to improved corporate governance.Without such requirements, insiders can easily manipulate the securities market to take advantage ofinformation unavailable to the public.
The legal requirement and the regulations for such disclosure are in place in Lithuania, butenforcement is still weak, notwithstanding that 1,300 notices of material events have been filed since theSecurities Commission adopted regulations on such disclosure in June 1996. The time limit forinforming about material events is five days, which is too long (in most EU countries such events have tobe reported immediately) and is frequently exceeded.6 Sanctions are applied, but are apparently too mildto be effective.
6. On 15 May 1998, the Securities Commission shortened the time limit for disclosure to 24 hours. Equallyimportant is that this nev rule is strictly enforced.
313

The Securities Market
Efficient Price Setting. The NSEL moved to continuous trading on 12 April 1998, for thesecurities traded on the official list and the fifty-one most-traded securities on the current list. Othersecurities will be transferred to continuous trading if trading in such securities becomes active.
POWERS AND OBLIGATIONS OF MANAGERS
The powers and obligations of managers in relation to the affairs of public companies are established firstunder the framework of company law, and second within the terms of the articles of association or charterof a company.
The traditional American approach to these topics has been considered the most favorable togood corporate governance. The details vary from state to state, but the basic framework in the UnitedStates provides that managers must (i) manage the company in the interests of all shareholders, not intheir own interest or that of selected shareholders; (ii) conduct the company's affairs within the terms ofthe company's charter; and (iii) convene and conduct a general meeting of shareholders according to setprocedures in order to report to the shareholders and put to a shareholder vote such matters asappointment or removal of board members or auditors, acquisition or disposal of an asset that represents asignificant percentage of total assets (variously expressed as between 15 and 30 percent of total assets), achange in the nature of the business conducted by the company as described in its charter, and so on.
In the last three years, Russia has provided an interesting example of an approach to these issuesin a climate where managers are generally considered to be too entrenched, backward-looking, andunconcerned with shareholders. Under the Russian law on joint-stock companies, managers are requiredto strictly adhere to the terms of a company's charter and must report to, and gain the approval of, ageneral meeting of shareholders in all matters typically required in U.S. practice, but with stricter votingrequirements (for example, a three-quarter voting majority is needed to pass a measure rather than 51percent) or lower thresholds (such as requiring approval for sale or acquisition of assets representing 10percent of total assets). The net result is that the powers of managers are significantly reduced comparedwith those of U.S. managers, and the obligations of managers to consider the interests of shareholders andto report to them are increased.
In Lithuania, the Company Law of 1994 and Law on Enterprises of 1990 include minimalprovisions governing the powers and obligations of managers. This is a cause for concern bypolicymakers and is being addressed through the law reform program of the Securities Commission.
The commission is mindful of Lithuania's desire to join the European Union (EU). Althoughthere is no specific EU directive on the topic, the commission wishes to ensure that its approach isacceptable within the European context. This is a reasonable approach in the circumstances, but it maynot be appropriate to take a wholly "European" approach. The European tradition has been to give morediscretion to managers and to require less scrutiny and approval by shareholders than has been the case inthe United States, and certainly less than now applies in Russia. The European tradition has relied on atwo-tiered management structure-a supervisory board oversees the work of the management board-and on close involvement of creditors and major shareholders, especially banks, in managementdecisions. The public securities market has traditionally been relatively small, and the number ofminority shareholders has also been small. But the Lithuanian corporate scene has more in common withthe circumstances in Russia and the United States than with those typical of Europe. For example, thereare many listed companies and many small shareholders; the local universal banks are not as well placedto play a supervisory role as they are in much of the rest of Europe; and the mangers of many Lithuaniancompanies are perhaps as entrenched and backward-looking as many in Russia. The Russian and U.S.
314
The Securities Market
models are thus very relevant, and it would be wise to consider them in amending the Lithuaniani law.7
PROXY SOLICITATION AND CORPORATE TAKEOVERS
An important way in which the securities market contributes to improved corporate governance isthrough the discipline zimposed on managers by shareholders through the threat of company takeovers orthrough motions at general meetings that are organized through proxy solicitations. Such avenues ofaction are usually provided for in the companies and securities laws. In Lithuania, they are mentioned inlaw, but the rights of the parties and the procedures to be followed are unclear and lack detail, and theireffectiveness is thus greatly diminished.
The ability to call a general meeting and pass motions that require managers to do or not dospecific things is one of the most important disciplines shareholders can impose on managers: itrepresents a direct intervention by shareholders in the running of a company. For example, if managersare not performing as t'hey should, shareholders can propose motions directing them to undertake specificactions or to remove them from the board of management and replace them with representatives who theshareholders expect to perform better. For this to be an effective discipline, the procedures for callinggeneral meetings, soliciting proxies, and voting by proxy need to be very clearly specified. This is notthe case in Lithuania, and the companies law should be amended or a regulation should be promulgated tointroduce detailed rights and procedures. The Russian model provides an good example of a stronglyshareholder-favorable approach (beyond even the U.S. approach), while the German model provides amore management-favorable strategy. As already mentioned, it is probably the Russian/U.S. end of thespectrum that best suits Lithuania's present circumstances.
Corporate takeovers represent the ultimate securities market discipline on managers; they involvea new controlling shareholder using the securities market to unseat the existing major shareholders andmanagers. It is often airgued that the mere threat of a takeover is a significant discipline on managers inthe same way that monopoly practice is thought to be tempered by the mere threat of a new entrant into acontestable market.
For the threat of takeover to be effective, the securities or companies law must specify, in detail,the rules governing takeovers, and thus make it possible for new controlling shareholders to emerge. InLithuania, this is not the case. The law needs to be amended to set out the triggering events and processesthat allow takeovers to occur and to specify the rights and obligations of the parties during a takeover,including those of the person making the takeover bid, the target company managers, and the othershareholders of the company. The Securities Commission approved rules on tender offers both on andoutside the NSEL in February and May 1998.
The frequency of unsolicited corporate takeovers, as opposed to friendly corporate mergers,varies greatly from market to market. The highest rate of takeovers has traditionally been in the UnitedStates, but the United Kingdom and other developed markets such as Australia and Canada have not beenfar behind. Continental Europe and Japan, in contrast, have traditionally not had a high level of corporatetakeover activity. Proponents of the European and Japanese models argue that a heightened concern
7. Raphael La Porta, Florencio Lopez de-Silnes, and Andre Shleifer, "Law And Finance," Working Paper 5661(Washington, D.C.: National Bureau of Economic Research, July 1996), provides a useful summary of the levelof investor protection and the balance of rights between managers and owners under common law and civil lawregimes and compares French and German civil law protections with those applying in the United Kingdom andthe United States.
315

The Securities Market
about takeovers leads managers to focus too much on short-term returns so that the share price remainshigh and predators are discouraged. They argue that this focus depletes the long-term viability ofcompanies because it discourages investment in research and development or other costly activities thatpay off only in the long term. There are some indications that this may now be changing, but it is tooearly to say what the trend will be. In Lithuania's case, the entrenched ownership and managementstructures that have risen out of the privatization process lead to concern that too limited a scope fortakeover activity may simply serve to shield managers from an important market discipline.
ACTIVE SHAREHOLDERS
The preceding discussion has focused on rebalancing the rights of managers and majority shareholdersand the rights of minority shareholders so that minority shareholders can play an active role in monitoringand influencing the performance of companies. For such a rebalancing to have any effect in practice,there must be minority shareholders that are able to exercise the rights available to them under the law.There are two categories of shareholders that can play such a role: minority shareholders with asubstantial holding and institutional investors.
Substantial Shareholders. A holding of between 10 and 30 percent of a company's shares istypically considered a substantial minority shareholding.8 Substantial shareholders can be an importantinfluence on company management, and small minority shareholders rely considerably on substantialshareholders to lead the way in monitoring management performance and in protecting the interests of allshareholders.
Substantial minority shareholders usually lead the market and carry smaller investors with them.They have more at stake and are able to apply more resources to protect and enhance their investment bymonitoring a company's management performance and assessing the company's prospects. In doing so,their actions serve as a signal to other investors. In their efforts to monitor and improve corporategovernance, substantial shareholders can call on smaller shareholders as allies against entrenchedmanagement. For example, it is usually a substantial shareholder who initiates a proxy solicitation andseeks to marshal smaller shareholders to support resolutions at general shareholders' meetings.
In Lithuania, many firms are classed as public companies and are listed on the NSEL, eventhough they are closely held by a relatively few shareholders. The Company Law generally prohibitsrestrictions on the transferability of shares. Certain restrictions, however, can be imposed on employee-owned shares. Such rights and restrictions on transfer make it difficult for a substantial minorityshareholder to emerge, because any transfer of title to securities must, in effect, be approved by thecontrolling shareholders of the company. The very reason that such restrictions are common in Lithuaniais that insiders have sought to entrench their positions in many companies following privatization.
While there is no good policy reason for a blanket prohibition on a company's members beingable to agree to impose restrictions on transfer of securities if they so desire, there are good policy
8. The actual percentage that is considered a substantial holding varies from country to country and company tocompany. It depends on the structure of share ownership. If shareholding is very dispersed, relatively smallholdings, such as 5 percent, may be sufficient to have a significant influence over the affairs of the company.Usually, however, a substantial minority holder needs upwards of 10 percent to exercise any influence. In manymarkets, a holding of 15 to 20 percent would lead to the holder being asked to nominate a representative to theboard of management of the company. Holdings above 30 percent usually begin to be considered majorityholdings rather than substantial minority holdings.
316
The Securities Market
reasons for excluding such companies from characterization as public companies and from inclusion onthe stock exchange. The very essence of listed public company status should be that the securities arefreely tradable. The benefits of listing should be possible only for companies without preemptive rightsagreements and should accrue only to freely tradable securities, and if such rights or restrictions exist orare introduced, such shares should be excluded from listing and should preferably be known as closedcorporations (or some similar title) rather than as public companies.9 The main reason for taking such anapproach is simply to allow the market to operate efficiently: investors should have the certainty of beingable to assume that the securities of all listed public companies are freely tradable. An importantancillary benefit of this is that new substantial shareholders will be able to build up holdings withoutrestriction, and thus have the potential to discipline existing controlling shareholders and managers.'"
Institutional Investors. Institutional investors such as pension funds and investment companiescan play an important leadership role in the effective exercise of minority shareholder rights. They alsobring other important benefits to the securities market.
Pension reform is discussed in Chapter 10 of this Policy Note. Briefly stated, in relation to thesecurities market, if pension reform in Lithuania involves the creation of a funded, defined contributioncomponent, a significant pool of savings will be created that will be partly invested in the securitiesmarket. Chile and Argentina introduced pension reforms of this kind, which became operational in 1981and 1994, respectively. In their first year of operation, they achieved long-term capital accumulationrates (contributions minis expenses) of 0.7 percent of GDP in Chile and 0.5 percent of GDP in Argentina.In the fifteen years to t]he end of 1996, the Chilean pension funds had accumulated long-term savingsequivalent to 43 percent of GDP. The figure for the three years of operation of the Argentine pensionscheme is 2.5 percent (in Chile, at the three-year mark, it was 3.5 percent)." These savings pools havebeen directed to the securities market in the following proportions: corporate equities, 30 percent in Chileand 15 percent in Argentina; corporate bonds, 10 percent in Chile and 8 percent in Argentina; and thebalance is largely invested in government securities. In the early years of its operation, the Chileanpension scheme devoted a relatively modest percentage of investment to private sector securities,comparable to Argentina's present rates. This is because of an appropriately conservative approach torisk management by the pension funds under the regulations imposed by their supervisory agencies.Even so, over time, the impact of pension funds on the liquidity of the securities market in both countrieshas been very marked because the size of the savings pool has been so large.
The impact of the pension funds on the securities market has been manifest in a number of ways,not just through increased liquidity. For example, in Argentina, both the securities and the securitiesmarkets that the pension funds are allowed to invest in must be approved by the Securities and ExchangeCommission. The comrmission uses this authorization power to raise standards of practice for bothsecurities issuers and market providers. It does so by setting very high standards of transparency for
9. On 17 April 1998, the Securities Commission adopted a rule that only securities with no restrictions ontransferability could be listed on the official list.
10. Substantial shareholders typically have to disclose their identity and the size of their holding when it rises abovea specified threshold, such as 5 percent. They may also be required to make a takeover offer if their holdingrises to 30 percent or so. These requirements serve to give the existing majority owners and the remainingminority shareholders protections from covert takeover of a company. But protections such as disclosure andmandatory takeover offers do not restrict the ability to actually acquire a substantial holding.
11. See the Policy Note on pension reform for projections of capital accumulation under various scenarios inLithuania.
317
The Securities Market
securities issuers and markets that want to be included on the list of authorized investments for pensionfunds. Because the potential pool of savings is so large, issuers and market providers have an incentiveto meet the commission's standards, and transparency has improved notably, as has the commission'soverall stature and influence in the market.
Another manifestation of the positive impact of pension reform on securities markets is its effecton corporate governance. In both Chile and Argentina, the professional management of the portfolio ofsecurities created by investment of the accumulated pension funds requires the pension fund managers tomonitor the performance of the companies in their portfolios and the performance of the marketgenerally. The fund managers invest and disinvest according to their assessment of the future potentialreturn on their securities investments, and they compare their own investment performance with that oftheir competitors. They also report directly to each pension fund participant or account holder on thereturns on investment for their account. The pension funds have thus fostered a very active interest inmarket transparency and investment performance.
In considering pension reform, Lithuanian policymakers should bear these benefits in mind.They are not the primary motivation for undertaking pension reform, but they are important secondaryreasons.
Apart from pension funds, the other institutional investor likely to be important in the Lithuaniansecurities market is the investment company. There are no such companies yet, but there is an investmentcompany law, and the government would like to see these companies develop. Like pension funds, theycould come to play an important part in adding liquidity to the market and improving corporategovernance. There are currently two legal impediments to the growth of investment companies inLithuania. Until both impediments are removed, none will develop.
First, the present tax treatment of investment companies is discriminatory; in practice, it makesthem unviable. In Lithuania, income and capital gains from financial investments in the hands ofindividuals are not taxed, but such gains by companies are treated as a contribution to profit, and aretherefore subject to a 29 percent profit tax. Investment companies would therefore be liable to the profittax on the income and capital gains earned from their investments. This means that investment ininvestment companies would be unattractive compared with investment in other financial instruments.The investment companies could only overcome this disadvantage by earning a return high enough tooffset the tax liability and still pay their investors a rate comparable to, or better than, that available fromother investment instruments. Because this is essentially impossible, they are unviable.
In most countries, investment companies (or unit trusts or mutual funds) are exempted from thiskind of tax liability as long as they act only as pass-through investment vehicles. A pass-throughinvestment vehicle-a company or unit trust-is a legal entity that accumulates income and capital gainsfrom its investments solely for the purpose of passing them on to its investors. This could be achieved inLithuania by exempting investment companies authorized under the investment company law from theprofits tax. This is the most common approach in eastern Europe and Russia, which instituted thepractice early this year.
The second factor impeding development of investment companies arises from the InvestmentCompany Law itself. The present law imposes restrictions on related-party activity, which makes itimpossible for any existing domestic intermediaries to establish and manage a pooled investment vehicle.These restrictions were imposed to protect against conflicts of interest among the investment company,the investment company manager, and broker/dealers acting on the instructions of the investment
318

The Securities Market
company manager. Protecting against such conflicts is a reasonable policy objective, but the currentprohibition is too broad-.ranging as a policy instrument. It means, in effect, that the securities marketintermediaries most able and willing to establish and manage investment companies are prohibited fromdoing so.
A solution to this problem would be to replace the current prohibition with a more refined set ofprovisions governing conflicts of interest. These could be written to allow a broker-dealer to act in twoor more capacities, but also to impose a duty to act in the best interests of clients in each capacity. Theprovisions could be strengthened with specific restrictions on the payment of management fees and thehandling of client assets. In this way, the existing broker-dealer community in Lithuania would beeligible to establish and manage investment companies, but would be subject to close supervision to avoidconflicts of interest.
Absorptive Capacity
The second set of issues that links the securities market with privatization and pension reform can begrouped under the heading of absorptive capacity. There are two main issues: the first relates to legaluncertainties and the second to coordination between privatization and pension reform and securitiesmarket development.
Privatization ancl pension reform have the potential to bring a greatly increased supply ofsecurities and investment to the securities market. This increase will have an impact on both the primaryand secondary securities markets. In the case of the primary market, privatization could bring fromfifteen to thirty significant new securities issues to the public over the next three years. In the case of thesecondary market, the ad(dition of fifteen to thirty good-quality stocks to the NSEL trading list would addsignificant and badly needed breadth to the market, and if pension reform proceeds with a fundedcomponent, a large pool of savings would be available over the long term for investment in securities,which would add greatly to the depth of the market.
Lithuania has already achieved a good deal in a short time in creating its securities market, but tohandle the increased depth and breadth expected from privatization and pension reform, work in twoareas is necessary:
* The planning and implementation of privatization and pension reform must be coordinated withdevelopment of the securities market to ensure that the securities market is able to fulfill the roleexpected of it.
* Uncertainties in the law regarding the application of the securities law to shares issued under cashprivatization and the concept of nominee shareholding as it is applied to custodian services forforeign institutional investors need to be remedied.
PLANNING AND COORDINATION
It is important for the success of the privatization that the increased supply and distribution of securities isabsorbed in an orderly manner. Problems could arise in a number of ways. If promotion and distributionof the public offer subscription form is poorly managed, there could be complaints that segments of thepopulation were excluded from participating or that they were defrauded by the intermediaries involved.If the pricing of the offer is far above or below reasonable expectations, it could cause majorundersubscription or oversubscription. Also, if the subsequent entry of the securities onto the trading listof the stock exchange is not well managed, there could be speculative pressure on the price in the
319

The Securities Market
secondary market. All of these events could jeopardize not only the success of the privatization programitself, but also the stability of the securities market and the trust placed in it.
The same sorts of considerations arise with respect to the increased supply of investment fundsthat may accumulate under a reformed pension scheme. Even if only a small proportion of the pensionfunds' investment portfolio is allowed to be invested in the domestic securities market, as is likely underprudential rules for such funds, the volume of available savings could easily outstrip the supply of qualitysecurities. Extrapolating from the experiences of Argentina and Chile, pension-driven demand forsecurities could increase demand by up to 30 percent of current market capitalization in the first threeyears of pension reform. Although there currently appears to be an oversupply of securities, it must beremembered that many of these would not meet the investment criteria that a prudent pension fund (or aprudent investment company manager) would follow in building a sound portfolio. The privatizationprogram will help to alleviate this problem, but the balance between supply and demand should bemanaged carefully to ensure that the market is not distorted or disrupted.
Coordination between the development of the securities market's absorptive capacity and theimplementation of privatization and pension reform will not be a linear process. It is not possible to mapout a simple progression of steps at the outset. This is especially the case now, when important structuraldetails of the pension reform are yet to be decided and the privatization program is not yet fullydeveloped. The best approach, therefore, is to establish a mechanism to plan and coordinate activities asthey evolve. It may be that the informal relationships between the decisionmakers and administratorsinvolved in the three areas in Lithuania can achieve much of the coordination required. The number ofpeople involved in the issues at a senior level is relatively small, and they are well known to each other.Nevertheless, some form of coordinating committee is probably a better choice.
The exact nature of such a committee will be determined by the usual practices of Lithuanianpublic administration, but some general points can be made about its structure. First, its function shouldbe coordination of implementation, not development of policy. Second, its membership should includerepresentatives from the Securities Commission, NSEL, CSDL, the Privatization Agency, and theMinistry of Social Security and Labor (in relation to pension reform). Third, its objective should be toidentify any securities market aspects of privatization and pension reform implementation and to plan andorganize all necessary steps to ensure that the securities market is fully able to facilitate the privatizationand pension reform agenda.'2 The NCEL plans to introduce a requirement that all companies in thecurrent list file annual accounts-prepared and audited in accordance with international standards-withthe NSEL, starting with 1998 accounts.
PENDING LEGAL ISSUES
The are two current legal uncertainties that should be remedied as a matter of priority in order to put thesecurities market on a sound footing in advance of privatization and pension reform.
Application of Securities Law. The present Article 3, Clause 4, of the Law on Public Trading ofSecurities appears to exempt any securities issued as part of cash privatization from the application of thelaw. This is clearly untenable, because it would mean that all of the requirements of the law governingdisclosure and investor protection would not apply to the most importanttranche of securities likely to belisted on the securities market in the next ten years. The probable intention of the arrangement was to
12. There is already a standing committee of the Seimas on "reform of the financial system," but it has a wide-ranging agenda and is too policy-oriented for the purpose outlined here.
320
The Securities Markel
exempt private placements of securities under the privatization program from the full prospectusdisclosure requirements. This would be a reasonable policy position, but the effect of the article as it iscurrently written appears much broader than this."3
Nominee Ownership. As is the case in other Napoleonic law countries in transition fromcommunist economic and legal arrangements, Lithuania's civil code lacks a clear definition of theconcept of nominee ownership in contrast to direct or beneficial ownership.
In a modern securities market, there are many instances when persons or institutions holdsecurities on behalf of others. This agency role is captured in the common law concept of nominee. Animportant example is the local custodian for securities against which depository receipts are issued orthrough which foreign institutional investors protect and manage their securities holdings. Suchcustodians act as the agent of the beneficial owners and, although their names may appear on thesecurities register, they do so only as the nominees of the beneficial owner. Many foreign institutionalinvestors, especially in the United Kingdom and the United States, are subject to stringent regulation intheir home country regarding the safeguarding of their assets, and an important part of this regulationestablishes certainty regarding the nominee role of the local custodian. The present Lithuanian law doesnot give sufficient certainty to such investors.
Policy Recommendations
This section presents recommendations that deal with each of the points raised in the "Key Issues"discussion. They are again grouped under two headings: corporate governance and absorptive capacity.
Corporate Governance
INFORMATION AND PRICING
Financial Information. The transparency of the Lithuanian securities market and its contributionto improved corporate governance would be increased if a domestic accounting and auditing professionwith training and experience in modern methods were developed and if there were sufficient incentivesfor the adoption of better accounting and auditing practices. The Securities Commission and NSEL arewell placed to take the lead role in this area. Two things are needed: training and certification foraccountants and auditors that is oriented toward modern practice and adoption by the accounting andauditing profession of standards and practices that are in accord with those in Europe and the UnitedStates, but are applicable to the specifics of Lithuania's situation. By requiring, for example, list Acompanies to disclose their financial information using the upgraded accounting standards, and to beaudited accordingly, the Securities Commission and the NSEL can create a powerful incentive towardbetter accounting and auditing in Lithuania, an incentive that is likely to spread.
Nonfinancial Information. The transparency of the securities market and its contribution toimproved corporate governance would also be greatly enhanced by tightening the rules, and in particularby improving enforcement of the requirements for disclosure of price-sensitive information by listedpublic companies. The recently shortened time limit for disclosing such information should be strictlyenforced, and penalities to both the companies and their responsible officers should be tightened.
13. According to the Lithuanian Securities Commission, this exemption is intended to apply only to situations wherean investor in a privatization acquires more than 50 percent of the shares of a company, and under normal ruleswould then have to offer to buy the rest of the shares.
321

The Securities Market
Repeated failure to report price-sensitive information in a timely manner should lead to temporary orpermanent delisting, and fines imposed on officers should be sufficiently high and strictly enforced tostrongly discourage noncompliance.
POWERS AND OBLIGATIONS OF MANAGERS
The fairness of the securities market and its contribution to improved corporate governance would beenhanced by amendment of the companies and securities laws to impose more specific and stricterrequirements on company managers to protect the interests of minority shareholders. Typical provisionsof this kind require, among other things, that managers must (i) manage the company in the interests ofall shareholders, not in their own interest or that of selected shareholders; (ii) conduct the company'saffairs within the terms of the company's charter; (iii) convene and conduct a general meeting ofshareholders according to set procedures in order to report to the shareholders and put to a shareholdervote such matters as appointment or removal of board members or auditors or acquisition or disposal ofmajor assets.
In considering how to draft the detailed provisions for Lithuanian law, policymakers shouldconsider the Russian and U.S. examples. These are stricter than is typical in western Europe, and theyare likely to be more appropriate to the structure of ownership and management of post-privatizationfirms in Lithuania than the more management-friendly approach common in western Europe.
PROXY SOLICITATION AND COMPANY TAKEOVERS
The contribution of the securities market to improved corporate governance would be greatly improved ifthe companies and securities laws provided more fully developed procedures for proxy solicitation andcompany takeovers. The procedures for calling general meetings, soliciting proxies, and voting by proxyneed to be clearly specified. The rules on tender offers recently issued by the Securities Commissionshould be bolstered and incorporated in legislation. The Russian model provides a good example of astrongly shareholder-favorable approach (beyond even the U.S. approach), while the German modelprovides a more management-favorable strategy. As already mentioned, it is probably the Russian/U.S.end of the spectrum that best suits Lithuania's present circumstances. Similarly, the law needs to beamended to set out the triggering events and processes that allow takeovers to occur and to specify therights and obligations of the parties during a takeover, including those of the person making the takeoverbid, the target company managers, and the other shareholders of the company.
ACTIVE SHAREHOLDERS
Substantial Shareholders. The contribution of the securities market to better corporategovernance would be improved by facilitating the emergence of substantial shareholders who could takea leadership role in protecting the rights of all shareholders. In Lithuania, the emergence of suchshareholders is constrained by the ability of listed public companies to have preemptive rights agreementsand, in the case of companies with employee ownership, to place certain restrictions on the transfer oftheir securities. Such restrictions allow entrenched managers to stop unwelcome substantial shareholdersfrom obtaining title to securities. The recently introduced rule prohibiting the listing of securities withrestricted transferability on the official list should be extended to all listed securities.
Institutional Investors. The development of institutional investors, such as pension funds andinvestment companies, could bring many benefits to the securities market. They could play an importantleadership role in promoting increased liquidity, improved transparency, and enhanced corporate
322
The Securities Market
governance. They are currently prevented from doing so by two impediments to their development.
First, the present tax treatment of pooled investment vehicles is discriminatory. In practice, itmakes them unable to compete with other investment vehicles that do not face the same tax burden. Thesolution to this is to treat: all investment instruments equally for tax purposes. This could be achieved byexempting, as is done in other countries, authorized investment companies that act only as pass-throughinvestment vehicles from the 29 percent profit tax.
Second, the present law governing investment companies imposes a prohibition on related-partyactivity that makes it irapossible for domestic intermediaries to establish and manage an investmentcompany. A better approach would be to replace the current prohibition with a detailed set of provisionsgoverning conflicts of interest that allow a broker-dealer to act as an investment company manager, butwould also impose a duty to act in the best interests of clients. In this way, the existing broker-dealercommunity in Lithuania could build domestic asset management capabilities, but would be subject toclose supervision to avoid conflicts of interest.
In addition, to ensure greater availability of shares to institutional investors and the public atlarge, privatization authorities should be obligated to earmark, as a rule, a significant allocation of sharesfor public subscription in companies being privatized.
Absorptive Capacity
Privatization and pension reform have the potential to greatly increase the supply of securities andinvestment in the securities market. It is important that the increased supply be absorbed into the marketin an orderly manner. Work in two areas would help ensure this outcome: developments in the securitiesmarket must be coordinated with implementation of privatization and pension reform, and two existinglegal uncertainties require remedy.
PLANNING AND COORDINATION. Coordination is needed between the development of thesecurities market's absorptive capacity and the implementation of privatization and pension reform. Thiswill not be a linear process, and some form of interagency coordinating committee is probably the bestmethod of managing it. The committee's function should be coordination of implementation, notdevelopment of policy, and its objective should be to identify any securities market aspects ofprivatization and pension reform implementation and to propose, plan, and organize all necessaryremedial steps.
LEGAL UNCERTAINTY. In Lithuania, there are two areas where weaknesses in the legalframework might jeopardize the synergies among securities market development, privatization, andpension reform. First, it appears from Article 3, Clause 4, of the Law on Public Trading of Securities thatsecurities issued to the public under a privatization program may not be subject to the disclosure orshareholder protection provisions of the law. This is apparently not the intention of the article, but itappears to be the effect. The resultant uncertainty should be remedied by amending the law so that theprivate placement of securities under cash privatization is exempted from the full prospectus disclosurerequirements, but that in all other respects the law applies to securities issued under the privatizationprogram. Second, Lithuania's civil code lacks a clear definition of the concept of nominee ownership.This is an impediment to efficient and secure securities transfer (one that acts as an especially perversedeterrent to foreign investors) and should be remedied through legal amendment to introduce such aconcept.
323


ANNEX
325


Figure 11-1. Sources and Uses of Investment in the LithuaniianSecurities Market, 1996
100%
63%55%
45%37%
0%IForeign Domestic Shares T-Bills
Source Use
Source: National Stock Exchange of Lithuania Survey ofBrokerage Companies, End-1997.
Table 11-1. Lithuanian Securities Market Growth, 1993-97Item 1993 1994 1995 1996 1997
Total market capitalization,US$million - 62 159 920 2,200
Annual turnover,US$million 0.31 20 128 130 366
Number of listedcompanies, year-end 44 183 351 460 607Source: National Stock Exchange of Lithuania Securities Market Annual Report 1996.
Table 11-2. Average Size of Listed Companies, Selected Countries(market capitalization, US$m)Country Average size
United States 894United Kingdom 677Philippines 287Indonesia 280China 130Poland 70Hungary 57Czech Republic 10Bulgaria 9Lithuania 4
Source: International Finance Corporation, Emerging Stock Markets.Factbook 1997 (Washington, D.C., 1997); National Stock Exchange ofLithuania Securities Market Report, 4th Quarter 1997.
327

The Securities Market
Table 11-3. Shareholding Structure for Lithuanian Public Companies by SectorGovern- Private Small Other
ment sector share- share-Sector holdings holdings Total holdersa holdersb TotalManufacturing 41 59 100 37 63 100
Chemical 10 90 100 32 68 100
Agricultural and food processing 29 71 100 47 53 100
Construction and construction materials 36 64 100 66 34 100
Energy 84 16 100 17 83 100
Paper and printing 2 98 100 51 49 100
a. Small shareholders own 5 percent or less of a company.b. Other shareholders own more than 5 percent.Source: Central Securities Depository of Lithuania Research Group Survey of Top 100 Companies.
Table 11-4. Structure of Ownership of NSELType of shareholder Number of shares Percent
State (Ministry of Finance) 110 45Brokerage companies 39 16Banks 16 6Other Lithuanian legal persons 69 28Private individuals 9 4Foreign companies 3 1Total 246 100Source: Annual Report, 1996, NSEL.
Table 11-5. NSEL Member Firms: Volume and Value of Business, 1997Total number Total value
Rank by percentage of Number of transactions per of transactions per firmtotal market turnover offirms firm (average) (average), US$mTop 3 firms 3 8,789 132
Next twelve firms 12 2,309 21
Remainder of firms 41 635 2
Source: National Stock Exchange of Lithuania, Trading Results, Fourth Quarter 1997.
328

THE MACRCOECONOMIC FRAMEWORK
Despite the progress that Lithuania has made in its transition to a market economy led by the privatesector, a wide range of structural problems remain to be managed. These second-generation problems arelargely sectoral in nature, and the preceding chapters have analyzed them and made sectoral policyproposals. It is the task of this chapter to place these proposals into a consistent macroeconomiccontext-that is, to show their aggregate effect on the economy's growth, stability, and financingprospects.
The Lithuanian economy now faces a critical macroeconomic choice. It can maintain themoderate speed and coverage of its current reform program, achieving a respectable growth rate, butcontinuing to face a variety of bothersome problems. Or, with a more vigorous and comprehensivereform initiative, it can move into a more rapid and sustainable growth path. In other words, Lithuaniacould remain a relative laggard at the fringes of the European Union or become a major performer in theregion with enhanced chances of European integration. Whether Lithuania's growth takes off depends onwhether it implements a structural reform agenda that accomplishes two objectives: the elimination ofthe remaining sources of fiscal imbalance in sectors associated directly or indirectly with the state, andthe generation of a major private-sector-led increase in efficiency and investment.
The first goal of the new reform agenda should be to control the fiscal drains associated with thequasi-public sector, defined to include the general government, the public energy sector, strategic publicenterprises, the agriculture sector, and other interest groups that are financially dependent on the state.This quasi-public sector deficit is far larger than that posted in the general government accounts, some 4-5 percent of GDP rather than the 2 percent of GDP currently observed in the formal budget. A quasi-public-sector deficit of this size is an immediate fiscal threat to the balance and stability of themacroeconomy. Its measurement, fiscal impact, and the method of its elimination are a central focus ofthis chapter.
The second macroeconomic goal (an overall enhancement in efficiency) will, in effect, result from thedeepening and completion of the adjustment process associated with transition. The state will completeits withdrawal from centrally planned, protected economic activity to make room for private sectorinitiative in a competitive market environment. The accelerated structural reforms are expected tofacilitate growth in the size and efficiency of private investment, which will be the key engine ofenhanced growth.
Lithuania's Financial Evolution Since Independence: A Flow-of-Funds View
Because of the key role played in Lithuania's macro framework by investment and by the variousdeficits-government, foreign, and private-it is essential to examine the current state of these factors.
329
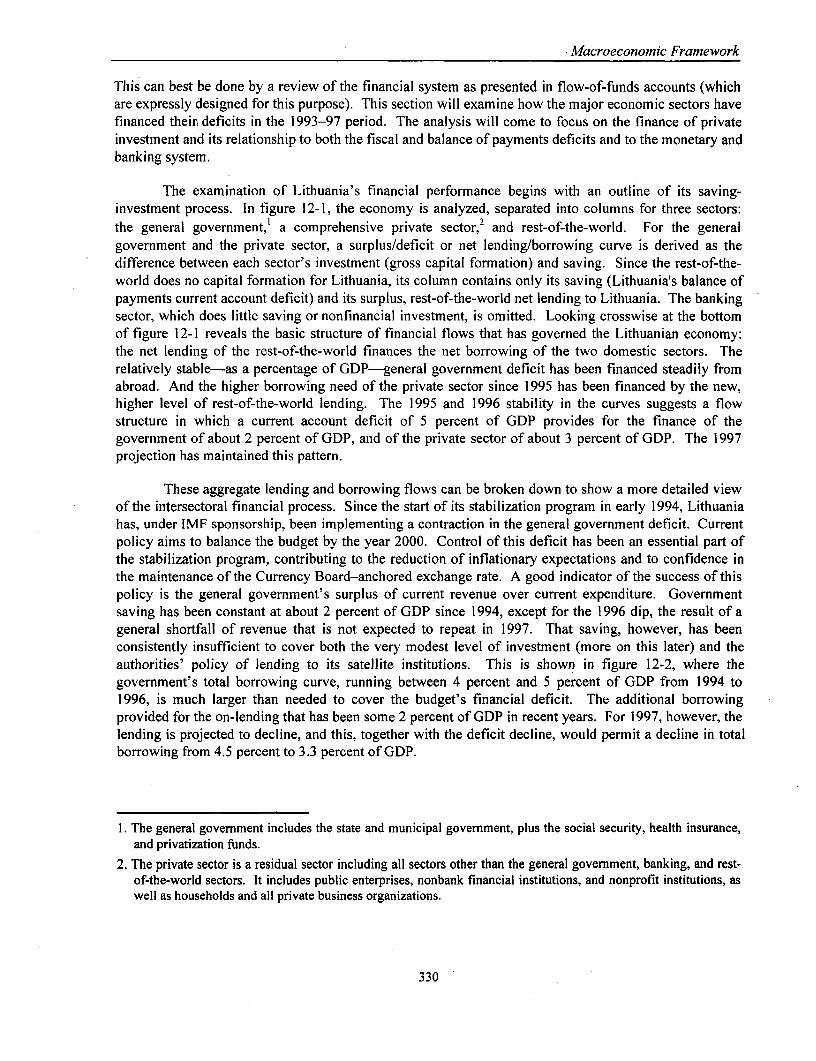
Macroeconomic Framework
This can best be done by a review of the financial system as presented in flow-of-funds accounts (whichare expressly designed for this purpose). This section will examine how the major economic sectors havefinanced their, deficits in the 1993-97 period. The analysis will come to focus on the finance of privateinvestment and its relationship to both the fiscal and balance of payments deficits and to the monetary andbanking system.
The examination of Lithuania's financial performance begins with an outline of its saving-investment process. In figure 12-1, the economy is analyzed, separated into columns for three sectors:the general government,1 a comprehensive private sector,2 and rest-of-the-world. For the generalgovernment and the private sector, a surplus/deficit or net lending/borrowing curve is derived as thedifference between each sector's investment (gross capital formation) and saving. Since the rest-of-the-world does no capital formation for Lithuania, its column contains only its saving (Lithuania's balance ofpayments current account deficit) and its surplus, rest-of-the-world net lending to Lithuania. The bankingsector, which does little saving or nonfinancial investment, is omitted. Looking crosswise at the bottomof figure 12-1 reveals the basic structure of financial flows that has governed the Lithuanian economy:the net lending of the rest-of-the-world finances the net borrowing of the two domestic sectors. Therelatively stable-as a percentage of GDP-general government deficit has been financed steadily fromabroad. And the higher borrowing need of the private sector since 1995 has been financed by the new,higher level of rest-of-the-world lending. The 1995 and 1996 stability in the curves suggests a flowstructure in which a current account deficit of 5 percent of GDP provides for the finance of thegovernment of about 2 percent of GDP, and of the private sector of about 3 percent of GDP. The 1997projection has maintained this pattern.
These aggregate lending and borrowing flows can be broken down to show a more detailed viewof the intersectoral financial process. Since the start of its stabilization program in early 1994, Lithuaniahas, under IMF sponsorship, been implementing a contraction in the general government deficit. Currentpolicy aims to balance the budget by the year 2000. Control of this deficit has been an essential part ofthe stabilization program, contributing to the reduction of inflationary expectations and to confidence inthe maintenance of the Currency Board-anchored exchange rate. A good indicator of the success of thispolicy is the general government's surplus of current revenue over current expenditure. Governmentsaving has been constant at about 2 percent of GDP since 1994, except for the 1996 dip, the result of ageneral shortfall of revenue that is not expected to repeat in 1997. That saving, however, has beenconsistently insufficient to cover both the very modest level of investment (more on this later) and theauthorities' policy of lending to its satellite institutions. This is shown in figure 12-2, where thegovernment's total borrowing curve, running between 4 percent and 5 percent of GDP from 1994 to1996, is much larger than needed to cover the budget's financial deficit. The additional borrowingprovided for the on-lending that has been some 2 percent of GDP in recent years. For 1997, however, thelending is projected to decline, and this, together with the deficit decline, would permit a decline in totalborrowing from 4.5 percent to 3.3 percent of GDP.
1. The general government includes the state and municipal government, plus the social security, health insurance,and privatization funds.
2. The private sector is a residual sector including all sectors other than the general government, banking, and rest-of-the-world sectors. It includes public enterprises, nonbank financial institutions, and nonprofit institutions, aswell as households and all private business organizations.
330

1Figure 12-1. Sector Investment, Saving, and Surplus/Deficit(Flow data as percentage of current GDP)
General Government Sector Private Sector Rest-of-the-World Sector
20%
______ Gross Investment--- - Saving 15% \. -
.... Saving (Balance of Payments10%.. 10% 10%. Current Account Deficit)
s5%o t * | § t - Gross Investment ,
…~~~~~5 - -- - Saving 5% I
0% 0 % 0%93 94 95 96 97 93 94 95 96 97 93 94 95 96 97
Surplus/Deficit Surplus/Deficit Surplus(Net Lending/Borrowing) (Net Lending/Borrowing) (Net Lending/Borrowing)
5% 5% 5%.
0%, 1\N1 | I I0% jI i 0%.I I I
:1% -5% 1 -5%93 94 95 96 97 93 94 95 96 97 93 94 95 96 97
Note: 1997 data are projected.
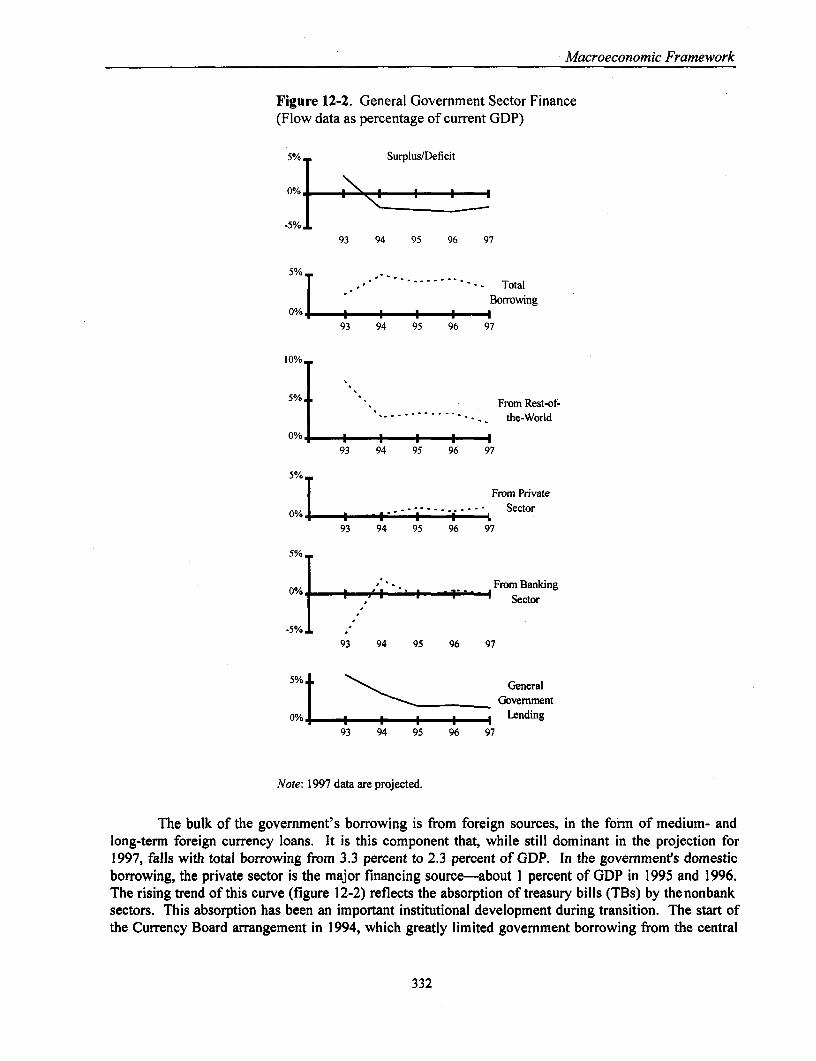
Macroeconomic Framework
Figure 12-2. General Government Sector Finance(Flow data as percentage of current GDP)
5% Surplus/Deficit
0%.
-5%
93 94 95 96 97
5%
- TotalBorroNving
0%.
93 94 95 96 97
10%
5%. - From Rest-of-
' ''''''''' - the-World
0% 93 94 95 96 97
5%
From Privateo% I @ , .-- 1-- ...... 1 - L Sector
93 94 95 96 97
5%..
0%1 . , ^ . From Banking.1 ' ,' ' * * ' Sector
-5% ,93 94 95 96 97
5%. * \ GeneralGovernment
0% I_ I_ I_ I_ I_ Lending
93 94 95 96 97
Note: 1997 data are projected.
The bulk of the government's borrowing is from foreign sources, in the form of medium- andlong-term foreign currency loans. It is this component that, while still dominant in the projection for1997, falls with total borrowing from 3.3 percent to 2.3 percent of GDP. In the government's domesticborrowing, the private sector is the major financing source-about I percent of GDP in 1995 and 1996.The rising trend of this curve (figure 12-2) reflects the absorption of treasury bills (TBs) by thenonbanksectors. This absorption has been an important institutional development during transition. The start ofthe Currency Board arrangement in 1994, which greatly limited government borrowing from the central
332

Macroeconomic Framework
bank, coincided with a short-term government financing need. This stimulated the development of TBauctions managed by the Bank of Lithuania (BoL). The first participants were mainly commercial banks,but later, nonbank instiltutions in the private sector began to participate to the tune of about I percent ofGDP yearly.
]Figure 12-3. Rest-of-the-World Net Lending to Lithuania(Flow data as percentage of current GDP)
Rest-of-the-World Net5% . _ Lending to Lithuania
I____________________ (Balance of PaymentsCurrent Account Deficit)
0% l_ l_ l_ l_ l93 94 95 96 97
10%Total Lendingto Lithuania
5%..
0% . I I '93 94 95 96 97
10%.
5%..
-%i I I I I I To General0% *Government
93 94 95 96 97
10%_
To Private5%.. 'Sector
0%. 93 94 95 96 97
Net Increase in.5%. . v Lithuania's
95 96 97 International
0%. I . Reserves93 94 95 96 97
Note: 1997 data are projected.
333

Macroeconomic Framework
The rest-of-the-world net lending to Lithuania is broken down in figure 12-3. While totalforeign lending rises steadily from 6 percent of GDP in 1994 to 7 percent in 1996, the breakdown of thiscurve reveals the large but rather steady flow to general government (which was seen as government netborrowing on figure 12-2), accompanied by a sharply rising flow to the private sector, running up to 3.7percent of GDP in 1996. Somewhat more than half of the private sector flow takes the form of directforeign investment, concentrated in the services sector and light manufacturing. An improving regulatoryclimate for such investment, as well as the recent economic growth, underpin further rapid growth in theprivate sector flow to 5.6 percent of GDP in the 1997 projection. The remainder of the flow to the privatesector consists primarily of medium- and long-term loans. This flow of about 2 percent of GDP has beenpartially supported by Lithuanian government guarantees (especially in the state-controlled enterprises).A residual pattern-combining the impact of the current account deficit and the inward lending flows-imposes itself on the banking sector's international reserves at the bottom of figure 12-3. This measuresthe overall balance of payments surplus/deficit, and in most years it shows comfortable reserve increasesof 1 percent to 2 percent of GDP. The current stock of gross reserves covers about 2.5 months worth ofimports.4
An analysis of the private sector's financial flows is presented in figure 12-4. It is here, ofcourse, that the bulk of the economy's capital formation takes place, and here that it must be financed. Inorder to separate the business activity of this sector from that of its households, we make the broadassumption that the private saving of Lithuania's households is placed entirely in the sector's acquisitionof money and other financial assets. The rest of the sector's saving thus represents business saving, thefunds retained by enterprises that are used to finance capital formation (the internal finance curve onfigure 12-4). The growth of this estimate of business saving has generally kept pace with the growth ofinvestment since 1994. Nevertheless, there is a wide gap between them that represents a borrowing need,a demand for funds that is met by the rest-of-the-world, banking, and government sectors. The curves forprivate borrowing from these three sectors in figure 12-4 combine into the total private borrowing curve.The steady decline in that flow (as a percent of GDP) from 1993 to 1996 is almost entirely attributable tothe banking sector curve.
In 1993 the flow of private bank credit-swollen by inflationary needs-was 12 percent of GDP,and the primary vehicle in the financing of private investment. But in 1994-96 that flow grew so littlethat, as a percentage of GDP, it declined precipitately down to zero. The stagnation of bank lendingduring the banking crisis in 1996 is understandable, but the deterioration began much earlier.Fortunately, the stable flows from abroad (and from the general government) could partially replace theloss of bank lending. Even in the midst of the banking crisis, about a third of private investment wasfinanced from these flows. Bank lending currently indicates a recovery in 1997; together with anexpected increase in the flow from abroad (especially in direct foreign investment), this would enabletotal borrowing to finance nearly half of private investment.
3. Like several of the economies in transition, since 1993 Lithuania has had a continuously growing trade deficit.By 1995 and 1996, it was up to about 8 percent of GDP. The trade deficit is accompanied by offsetting surplusesin services and transfers, which combine to yield current account deficits of about 6 percent of GDP for 1995 and1996, and which our projection continues in 1997. The movement of the trade deficit, however, sets the patternof movement for the current account as a whole.
4. It should be noted that Lithuania's external position appears quite strong in comparison with such other transitioneconomies as Latvia, Estonia, the Czech Republic, and Poland. Lithuania's exports exceed 40 percent of GDPand are growing strongly. Lithuania's merchandise trade deficit is lower than that of all these countries exceptPoland. External debt is only 12 percent of GDP. And in recent years the exchange rate has been maintainedwith no great difficulty.
334
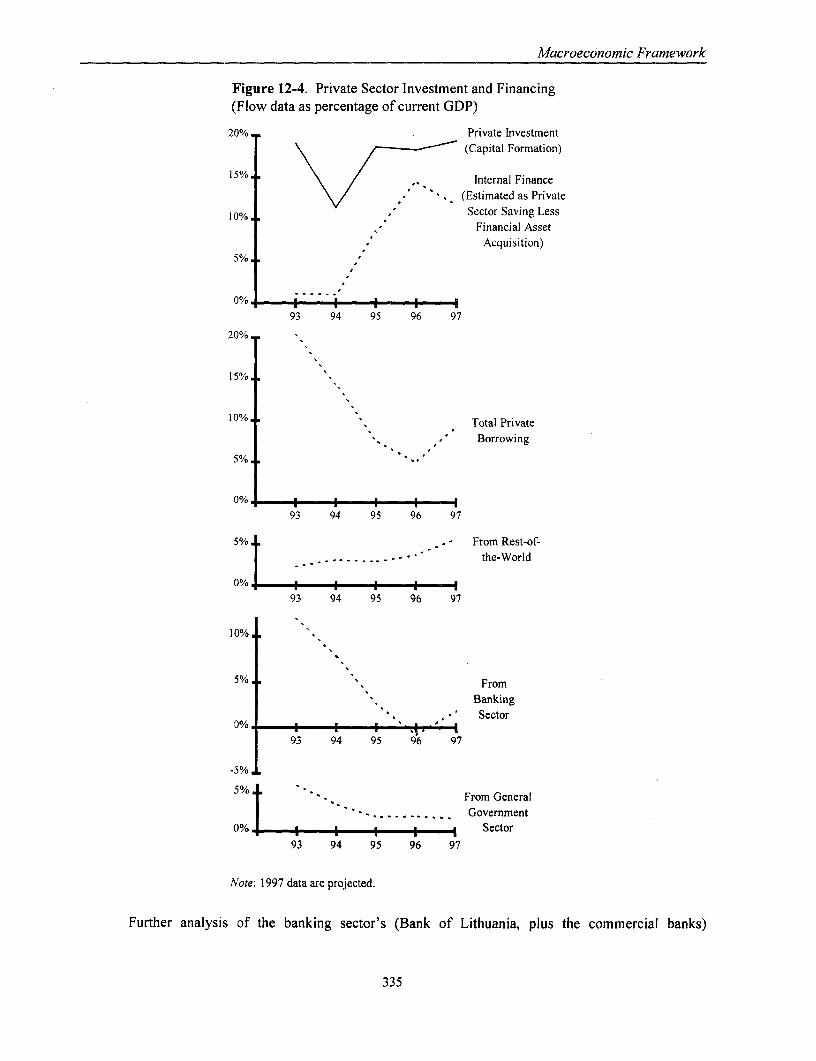
Macroeconomic Framework
Figure 12-4. Private Sector Investment and Financing(Flow data as percentage of current GDP)
20% Private Investment(Capital Formation)
15% \ Internal Finance
(Estimated as Private
10%. Sector Saving LessFinancial Asset
Acquisition)5% .
0% I93 94 95 96 97
20%
15%.
10%. * " Total Private
Borrowing
J%. .
0% M93 94 95 96 97
5% . From Rest-of-, . -. the-World
93 94 95 96 97
10%. "
-% >From
Banking* .. I' Sector
93 94 95 96 97
-5%
:5%. * " .From General. . . . . ........ Government
(%. I Sector93 94 95 96 97
Note: 1997 data are projected.
Further analysis of the banking sector's (Bank of Lithuania, plus the commercial banks)
335
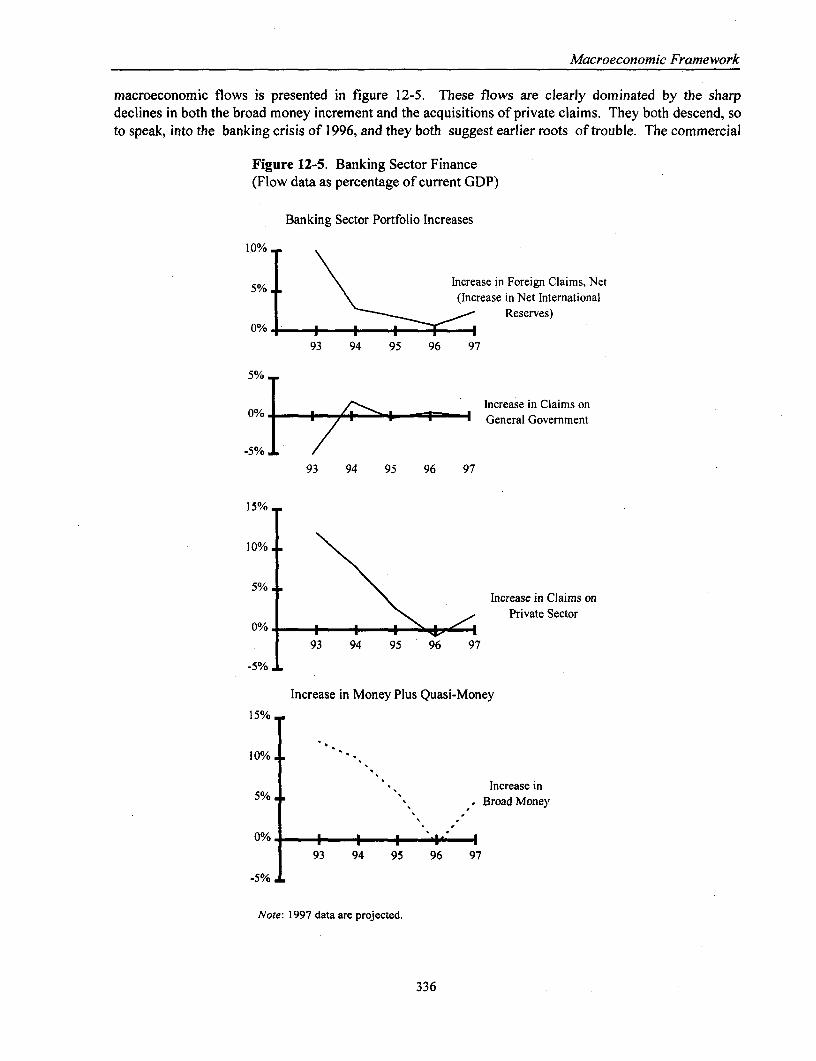
Macroeconomic Framework
macroeconomic flows is presented in figure 12-5. These flows are clearly dominated by the sharpdeclines in both the broad money increment and the acquisitions of private claims. They both descend, soto speak, into the banking crisis of 1996, and they both suggest earlier roots of trouble. The commercial
Figure 12-5. Banking Sector Finance(Flow data as percentage of current GDP)
Banking Sector Portfolio Increases
10%
5% Increase in Foreign Claims, Net\%i I I I (Increase in Net International
Reserves)0%,
93 94 95 96 97
5%
I Increase in Claims on0%. General Government
-5% 193 94 95 96 97
15%
10%.
5%..Increase in Claims on
0%\ ________________ Private Sector
93 94 95 96 97
-5% 1
Increase in Money Plus Quasi-Money
15%
10%.
Increase in
Broad Money
0%. I I + 'I' I93 94 95 96 97
-5%
Note: 1997 data are projected.
336

Macroeconomic Framework
banking system of Lithuania is a very recent creation, dating only from the late 1980s. The system hasbeen highly concentraited in a few state-controlled banks. Before the crisis, management had littleexperience in commercial bank operation; bank capital bases were thin; political intervention in lendingdecisions was common; and many loans were nonperforming. The central bank was not a vigoroussupervisor; its attention was focused on international reserve management. The rise in currency outsidebanks in 1994 and 1995 suggests eroding confidence in the banks. In these years, a number of thesmaller banks entered bankruptcy proceedings. In the fall of 1995, both liquidity and solvency problemssurfaced. In December, the Bank of Lithuania suspended the operations of Innovation Bank, thecountry's largest, and the crisis began. During 1996, a quarter of existing household deposits left thesystem, interest rates on TBs nearly doubled, and significant outflows of foreign exchange occurred. Thereserve outflows resulted in a contraction in broad money, which was accompanied by a credit crunch inbank lending. All of this lies behind the two sharply declining curves in figure 12-5. The governmentand the Bank of Lithuania are still deep in the process of restoring the banking system to health.Nevertheless, the rise in private bank borrowing in early 1997 suggests that the banks will be able torespond to credit needs to some extent in 1997, and these indications have also been put into the 1997projections in figure 12-5.
The sector accouants discussed above can be placed in matrix form for a given year, as in table 12-1, to show the horizontal balances of the borrowing and lending flows, as well as the vertical sectoraccount balances. Witlh each of its flows expressed as a percentage of the current GDP, table 12-1reveals the financial flow structure of the economy's macro financial system. Data for 1995 were used toavoid the unusual credit flows of the 1996 banking crisis. The table contains some notable features. Thegross investment total of 21.3 percent of GDP is a respectable figure, but one that needs to be higher.5
Table 12-1. Flow-of-Funds Matrix, 1995(actuals as percentage of current GDP)
General Banking Private Rest-of-government sector sector the-world TotalU S U S U S U S U S
Investment 2.6a 18.7 21.3Saving 0.2a 15.3 5.8 21.3
Surplus/deficitb -2.3 -3.4 5.8AFin. AFin. AFin. AFin. AFin. AFin. AFin. AFin. AFin. AFin.assets liab. assets liab. assets liab. assets liab. assets liab.
AForeign claims 1.8 1.8 1.8 1.8AGeneral
governmentdebt 4.1 -0.3 1.2 3.3 4.1 4.1
APrivate credit 1.9 2.7 7.6 2.9 7.6 7.6AMoney and
quasi money 5.7 5.7 5.7 5.7AMisc. and
discrepencies 0.2 -1.5 2.7 1.4 1.4 1.4Total 5.8 5.8 4.2 4.2 25.6 25.6 7.6 7.6 43.2 43.2
a. Figure is adjusted downward by 1.3 to be more representative of five recent years.b. Sector net lending/borrowing.
5. The gross investment of general government of 3.9 percent of GDP in 1995 is unusually high, although dismalfor international standards, and in table 12-1 it has been lowered to 2.6 percent, a figure more representative ofthe recent period.
337
Macroeconomic Framework
With the rest-of-the-world saving at 5.8 percent and government saving at 0.2 percent, the estimatedprivate sector saving is 15.3 percent, and our crude estimate of internal finance is 8.4 percent, a somewhatmodest support to the private sector's investment of 18.7 percent of GDP. The basic surplus/deficitstructure thus shows the rest-of-the-world surplus of 5.8 percent financing the general government deficitof -2.3 percent and the somewhat larger private sector deficit of-3.4 percent, a relationship seen in figure12-1.
Sector Policy and the Quasi-Public-Sector Deficit
To put the Lithuanian economy on a path of rapid and sustainable growth, it is necessary, inter alia, toeliminate the most serious fiscal imbalances in sectors of the economy that are still dependent on thegovernment, such as banking, energy, agriculture, and social security. This can be seen in the aggregateas the elimination of the deficit of a broadly defined quasi-public sector. This aggregative view is takenhere in order to consider the effects of sectoral policy on the general government budget and themacroeconomy as a whole. In this section, the major parts of this deficit are identified and, wherepossible, estimated.
The root causes of the expanded operating deficit of the quasi-public sector lie in two interrelatedareas. The first is the formal budget of the general government. The ongoing stabilization program has,since 1994, called for a reduction in the general government deficit. As noted above, this effort has keptthe deficit under 3 percent of GDP and is projected to maintain this level in 1997. But as inflation taxrevenues receded, less funding was available to finance items such as subsidized heating, enterprise taxarrears, and cheap agricultural credit. In effect, tighter expenditure policies were shifting expendituresfrom the general government budget to other sectors.
A major example of expenditure shifting is found in the energy sector. In order to reduce directconsumer subsidies for heating, the government forced the state-owned Lithuanian Power Company(LPC) to sell below cost and to create a liability against the state for the difference. That liability hasbeen estimated at about Lt 800 million, or 3 percent of 1996 GDP, and it grows at about 1 percent of GDPeach year. In effect, government expenditures have been transformed into an LPC deficit.
The second root cause lies within the banking sector. The 1994 establishment of the CurrencyBoard procedures, together with the EFF-related debt ceilings, considerably restricted generalgovernment's borrowing options. In response, a new form of expenditure shifting arose: informalpolitical intervention to direct bank credit allocations toward state-controlled or state-favored enterprises,regardless of their ability to repay. Such intervention was facilitated by the state's role in bank ownership(the government owns at least a minority holding in banks covering 95 percent of the deposit totals, andfully controls banks accounting for about half of those deposits) and by a less than strict enforcement ofbanking regulations. This practice added a large new layer of loans, now classified or defaulted. Thegeneral government was, in effect, disbursing the capital stock of the banking system in order to shiftenterprise subsidies away from the fiscal budget.
As of the summer of 1997, the quasi-public-sector deficit included a range of disparate elementsfrom various sectors, such as the losses of LPC and the newly decentralized district heating companies;different forms of payment arrears; government bond issues in support of bank capital and ascompensation for deposit losses; several restitution and compensation schemes (such as allowances forapartment renters) in buildings expropriated during Soviet times; contingent expenses implicit in a largearray of government guarantees; and the remaining forms of agricultural subsidy. Below, estimates aremade of the aggregate government expenditures and the deficit that would result if those elements were
338
Macroeconomic Framework
brought iito the formal fiscal accounts. The implications of this aggregate of added expenditures willthen be considered in the context of the country's projected macroeconomic outlook.
BANKING SECTOR. The restructuring of the banking system has been under way since the crisisof early 1996. The BoL faced a situation in which about three-quarters of the system's liabilities were ininsolvent or seriously undercapitalized banks. By late 1996, the government had decided on a plan torecapitalize, restructure, and then privatize two of the three state-controlled banks-the State CommercialBank and the Savings Bank. The private banks, several of which were under moratorium (Innovation,Litimpex, and Vakaru), were required to recapitalize with private funds to meet prudential regulations orwere liquidated. In parallel, both the regulations and the intensity of supervision have been strengthened.Two main features of the banking industry restructuring process involved government financing: therecapitalization of state-controlled banks and the compensation of depositors in liquidated banks.
By the time the 1996 banking crisis broke out, the State Commercial Bank had been insolvent forat least a year. The bank soon lost more than a third of its deposits and had to receive liquidity supportfrom the BoL, and in the second half of that year, from the government (mainly through orderingbudgetary organizations to transfer their deposits to the bank). In late 1996, the government finallyrecapitalized the bank, contributing Lt 165 million, primarily through an issue of ten-year governmentbonds that would replace the nonperforming bank portfolio. Some Lt 78 million in "bad" loans was alsotransferred to the state-owned "work-out" unit (Turto Bank). The State Savings Bank-holding a fifth ofthe system's deposits- has a similar story. A disastrous loss in 1995 drained more than 75 percent of itscapital. The bank was recapitalized by the government with a capital contribution of Lt 40 million, acombination of government bonds and a convertible loan. The liquidation of the Innovation Bank, a large(15 percent of total deposits) private bank that had been under moratorium since December 1995, hasraised the issue of depositor compensation in the liquidation of private banks. At the time, the Seimashad quickly passed a law pledging a full state guarantee for all Innovation's creditors. After unsuccessfulattempts at rehabilitation, in April 1997 the Seimas approved a law for the bank's liquidation. The lawcalls for a write-off of government deposits; the cash compensation of private clients during 1997 and1998 at a cost of about Lt 100 million; and the issuance of bonds (Lt 275 million) to compensate allothers, to be redeemed in 1999-2002. Seimas has also passed legislation creating a partial protectionscheme for deposits in private and state-controlled banks. The scheme has yet to be fully funded,however, which leaves the government in the role of deposit insurer.
Our estimate of the banking sector's portion of the quasi-public-sector deficit consists primarilyof assembling the estimates of cash outflows for depositor payoffs in 1997 and 1998 (Lt 148 and Lt 177million, respectively) and the recapitalization-bond servicing and payoffs in later years. Some Lt 250million in bonds will fall due in 2006 and in the decade following. The resulting series starts at Lt 225million and tapers to Lt 50 million after the year 2000 (see table 12-2). Although the total cost of bankrestructuring is estimated ito be over Lt I billion (3.2 percent of 1997 GDP), the financial devices adoptedhave spread the cost over the next ten to twenty years.
ENERGY SECTOR. The largest element in the quasi-public-sector deficit is that associated withthe energy sector. Three problems must be addressed to eliminate this portion of the deficit: (i) therestoration of the financial viability of LPC and Lithuanian Gas prior to privatization, (ii) thestrengthening of payments discipline among energy consumers; and (iii) the elimination of budgetarysubsidies for energy, except for necessary support of low-income households.
The newly established Energy Pricing Commission, in June 1997, approved price increases of 10percent for electricity and 25 percent for district heating and the elimination of preferential pricing for
339

Macroeconomic Framework
agricultural and industrial customers, measures designed to bring prices to cost-recovery levels. Inaddition, the government made a large (Lt 776 million) financial settlement with LPC in 1997 in relationto prior unpaid production subsidies that involved the takeover of LPC debt and the cancellation of LPCtax arrears. (These measures, together with the decentralization of district heating, should restore LPC toprofitability by 1998.)
Table 12-2. The Quasi-Public-Sector Deficit(Lt million)Item 1997 1998 1999 2000 2001 2002 2003 2004 2005 2006 2007Energy sector 750 500 480 400 370 300 270 250 250 250 250Bank refonn 225 200 35 35 35 35 55 55 55 300 0Municipal gov't. 300 300 200 200 200 200 200 200 200 200 200
Total 1,275 1,000 715 635 605 535 525 505 505 750 450Memo: revenue from
improved taxadministration - 200 400 600 100 - - - - -
Source: Staff estimates.
Nonpayment of energy bills has been a serious financial problem for LPC and Lithuanian Gas forseveral years, and it has caused arrears from LPC to Lithuanian Gas, and consequent delays in paymentsto foreign gas companies. State and municipal budgetary authorities are a major part of the problem.Consumer energy arrears to LPC and Lithuanian Gas were 1 percent of GDP at the end of 1995. During1996, measures were introduced to deal with delinquent customers, including increased use of cutoffs andimproved budgeting for budgetary organizations, and arrears dropped by half. But by March 1997, thearrears had risen again, to 0.8 percent of GDP. In 1997, the government made arrangements to pay LPCdirectly on behalf of municipalities whose debts exceeded 30 days of billing and to remove the necessaryamounts from their budgetary transfers. Other disciplinary measures included fining the heads ofdelinquent budgetary organizations and the disconnection of customers. In addition, Lt 100 million thatcan be used to clear the energy arrears of budgetary organizations was included in the budget. It isexpected that the impact of such measures will substantially reduce energy arrears in the second half of1997, which will improve the cash flow to LPC and Lithuanian Gas. (In the first quarter of 1997, LPCwas able to clear its arrears with Lithuanian Gas, which, in turn, was able to reduce its arrears to foreignsuppliers.) Also, the increase in energy prices to cost-recovery levels should remove the need for furtherproducer subsidies in the government budget. These increases, however, will simultaneously createadditional social safety net needs for low-income consumers. The 1997 budget contains Lt 200 millionto address this need.
Our estimate of the energy sector's contribution to the quasi-public-sector deficit-to coverremaining producer subsidies and energy arrears settlements-thus starts at Lt 750 million for 1997 (2percent of projected GDP). It drops to Lt 500 million in 1998, and tapers steadily down to Lt 250 millionafter 2003 (see table 12-2).
MUNICIPAL GOVERNMENT. The rationalization and modernization of the system of municipalfinances will play a significant role in placing Lithuania's quasi-public accounts on a sustainable path.About a quarter of the consolidated general government expenditures takes place at the municipal level,and such key public services as public utilities, education, and health are primarily the responsibility oflocal government. Although municipalities have the power to collect fees for the services they provide,the critical element in balancing their budgets is currently the revenue that they receive as a transfer from
340
Macroeconomic Framework
the central government. Recent years have seen a steady restriction of these transfers, forcing servicereductions and the postponement of urgently needed infrastructure investment. The reform of municipalfinance that began in 1993-94 has slowed. The authorities are considering some major changes,including ending revenue sharing under the personal and corporate income taxes, paired with theelimination of state transfers, an arrangement that would initially favor municipal governments. Such keyissues as the degree of inidependent revenue authority and the nature of available borrowing authority ofmunicipalities, however, remain undecided.
Meanwhile, the municipalities have resorted to the buildup of arrears as a means of finance. InApril 1997, their arrears for electricity and heat were the equivalent of 86 days and 190 days worth ofbilling, respectively. They also have allowed arrears to build up in the forwarding of their income taxwithholdings to the state. Added financial pressure will result as the state forces the municipalities todischarge energy arrears.
The transfer of the district heating system from LPC to municipal ownership and control in mid-1997 will be an additional financial burden for municipalities. The losses of the LPC heating business in1996 were some Lt 420 million, the bulk of it in district heating. Even with the 25 percent price increasesprojected-and if these are implemented-it will probably take some time before losses of this size areerased. The operating efficiency of municipal control remains to be seen. In addition, the renovation ofdistrict heating, badly needed as an energy conservation measure, will be a major financing problem.
Unfortunately, from the many uncertainties surrounding the financial framework, only a crudeestimate can be made for this component of the quasi-public-sector deficit. Table 12-2 shows thatmunicipalities will need Lt 300 million in 1997 and 1998 to cover transfer losses and district heatinglosses. The subsequent amounts of Lt 200 million are for continuing district heating losses and therestoration of the service level (through minimum investment outlays) to that of recent years.
AGRICULTURAL SECTOR. The thrust of the agricultural reform program is threefold:rationalization of the existing agricultural support mechanisms, increasing the role of the private sector inagriculture, and further opening the sector to international trade. It is the first of these, with its focus onthe agricultural subsidy programs, that is most closely tied to the quasi-public-sector deficit. Thegovernment's agricultural subsidy program has been the main mechanism for the transfer of massiveamounts of financial resources to agriculture.
In 1996, the government began the reduction of subsidies with a 5 percent real reduction inagricultural subsidy expenditures. For 1997, in the context of the new Rural Support Fund (RSF), whichwill now encompass all subsidy and public agriculture-related investment programs, a variety of reformshave been made. Fewer products are eligible for support, support prices are reduced in real terms, andlimits on the volume of production that will be eligible are being tightened. These steps will continue thereduction of budgetary subsidy expenditures in real terms. At the same time, a second component of theRSF, its targeted investment programs, will be expanding. Subsidized credit through the state-controlledAgricultural Bank will be cliscontinued and replaced by a system of competitively allocated capital grants,which will target high-quality seed production, cooling tanks for dairy products, and a range of programsthat focus on infrastructure and agricultural services.
It is not possible at this stage to estimate the effect of all these changes on the governmentbudget. On the whole, the reforms seem most likely to be a reorganization of the existing expendituresfor agriculture rather than a reduction. It appears that the subsidy reductions will be roughly balanced byadded expenditures for the new investment programs. This process of budgetary transformation will, in
341
Macroeconomic Framework
effect, gradually reduce the share of the quasi-public-sector deficit attributable to agriculture within theformal budget. For this reason, an estimate for agriculture has not been included in table 12-2.
CONTINGENCIES. A new savings restitution plan (SRP) is under consideration to compensatestate bank depositors for losses incurred during 1991 and 1992. The compensation is to be financed fromprivatization revenue as it becomes available in coming years. As planned, the SRP does not place anyburden on the formal budget, but the overall compensation is large, perhaps 10 percent of 1996 GDP.Privatization revenue will appear slowly, and public pressure may mount to make the disbursementsquickly. Rapid SRP payments would constitute a large additional increase in the quasi-public-sectordeficit, and the effects would pose a serious new threat to macroeconomic balance.
A second contingency is the future financial state of the social insurance fund (SoDra). Thecurrent financial position of SoDra is not strong, and projections indicate deficits after 2000 as theproportion of the elderly in the population grows. The government is planning a number of near-termremedial steps, including increasing the retirement age, reducing pension indexation, and improvingsocial security tax coverage and the timeliness of tax payments. These steps should solve SoDra'simmediate financial problems. In the medium term, a framework for private pensions is underconsideration, which might involve a reduction in SoDra's revenue. The program is still in the planningstage, however, and will take some time to implement and take effect.
Table 12-2 assembles the estimated components of the quasi-public-sector deficit. Estimates,although rough, have been possible for the banking, energy, and municipal government sectors. Asexplained above, estimates were not possible for the agricultural sector, and are not included for thecontingencies. The total series starts atLt 1.3 billion in 1997, about 3.5 percent of the current GDP, andtapers down to Lt 0.6 billion in three years, less than 2 percent of GDP. In other words, the estimatedquasi-public-sector deficit is more than half again as large as the budgeted deficit represented in theformal accounts of the state. The rapid decline results from the early concentration of structural reformexpenditures in banking, and in the energy sector, of expenditures for the cleanup of arrears and forproducer subsidy programs that have not yet been eliminated.
A Policy Choice: Two Macroeconomic Scenarios for Lithuania
Two contrasting longer-term views of Lithuania's future were proposed at the start of this chapter. Thefirst one, representing the impact of continuing, moderate policy action, projects an economy growing inreal terms at 3 percent yearly. The second view projects the impact of more vigorous and rapidimplementation of the sectoral reforms. The growth rate in this scenario is 6 percent annually. The keyfactor in the projections causing the difference in growth rates is the size and efficiency of the economy'sinvestment. In the one case, private investment responds weakly given the persisting constraints in theprivate sector environment. In the other case, private investment responds with confidence to the newprofit possibilities inherent in the reforms, and investment not only grows faster, but also is able toincorporate increased efficiencies. To explore the implications of these two contrasting views, thissection develops two projection scenarios for Lithuania that look a decade ahead, through 2007.
The two projections are derived from the World Bank's RMSM-X model, adapted to Lithuania'scurrent situation. This model is not to be understood as an endogenous-growth econometric model.Rather, each projection begins with assumed growth rates for major economic variables such asproduction, investment, and exports. These assumptions are essentially judgmental projections. Makinguse of these assumptions, the model carries the base period national accounts into the future. In thecontext of RMSM-X, such projections of the government budget, the balance of payments, and the
342

Macroeconomic Framework
monetary accounts, together with the basic national accounts, permit the derivation of the private sectorand its finance. This, in lurn, permits an examination of the consistency of patterns of saving, investment,and finance (especially external finance) over the term of the projection.
A Moderate Growth Outl,ok
The moderate-growth scenario is summarized in table 12-3. The real GDP growth rate is assumed to be 3percent yearly, in contrast to the 6 percent real growth rate of the high-growth projection. This lowergrowth scenario is seen to be the result of slower progress in the reduction of the quasi-public-sectordeficit and in such grow'th-related policy areas as privatization, the business environment, and pensionand security market reform. A key factor in setting the 3 percent growth rate is the similar growth rate ofgross domestic investment, a pace that maintains-but does not increase-its 21 percent of GDPproportion throughout the projection. A number of elements will retard investment. The slow pace ofpolicy reform and the moderate fiscal tightness suggest a slow development of business confidence inmacroeconomic stability, and bank lending rates will remain high. Needed infrastructure improvementswill lag as government investment falls from its current rate of 2.6 percent of GDP to 2 percent over thedecade. With only a moderate growth in overall investment, and weak structural reform performance, theproductivity improvements essential for the modernization of Lithuania's economy will not appear. Thisis symbolized in the projection by the incremental capital output ratio (ICOR) rise from 5.8 to 6.8 overthe decade. Nevertheless, while not stellar, an annual growth rate of 3 percent-the rate of recentyears-can be regarded as quite satisfactory; it maintains a per capita consumption growth rate of 2.8percent in the moderate projection.
A problem portrayed in this projection is a lingering annual inflation rate of some 18 percent overthe next decade. The Currency Board arrangement that was adopted in 1994 has undoubtedly beeneffective in reducing inflationary expectations, but the government plans to withdraw from thisarrangement in 1998 to facilitate more flexibility in central bank policy. Meanwhile, substantialinflationary forces remain, Lack of sector-based structural reform, in particular, keeps the fiscal accountsin a persistent and substantial deficit (4-5 percent of annual GDP). The inflation requires a steady yearlydevaluation of 15 percent in the US$/litas exchange rate (from the present 4.0 to 18.0 in 2007) tomaintain the present level of the real effective exchange rate. Some loss of monetary credibilityundoubtedly results.
With respect to external trade, the projection assumes a continuation of the current robust growthin real exports to the West until the millennium, tapering off to an annual growth rate of 3 percent by theend of the forecast period. Real exports to the East also continue their strong growth into 1998, but falloff more rapidly than exports to the West, reaching a 3 percent growth rate by 2007. Modest economicgrowth, coupled with robuLst growth in exports, yields a rise in the ratio of exports to GDP from 52percent to 61 percent over the forecast period. Imports are expected to increase at a more moderate pace,resulting from the slower real GDP expansion, and one positive consequence of this scenario is that theresource-balance deficit (exports - imports) declines from -8.2 to -2.4 percent of GDP over the forecastperiod.
Yet the outflow of net factor income (especially that of debt servicing) will grow rapidly enoughto preclude any real improvement in the current account deficit, which will decline as a share of GDPfrom about 8 percent to 5 percent in 2007. Thus, the rest-of-the-world will continue to be a major lenderto Lithuania, supplying an inflow of some 7 percent of GDP annually, eventually pushing the debt/GDPratio from under 15 percent in 1996 to over 40 percent by the end of the forecast period. The projectionassumes a continuing-and more than satisfactory-growth in international reserves (including those of
343
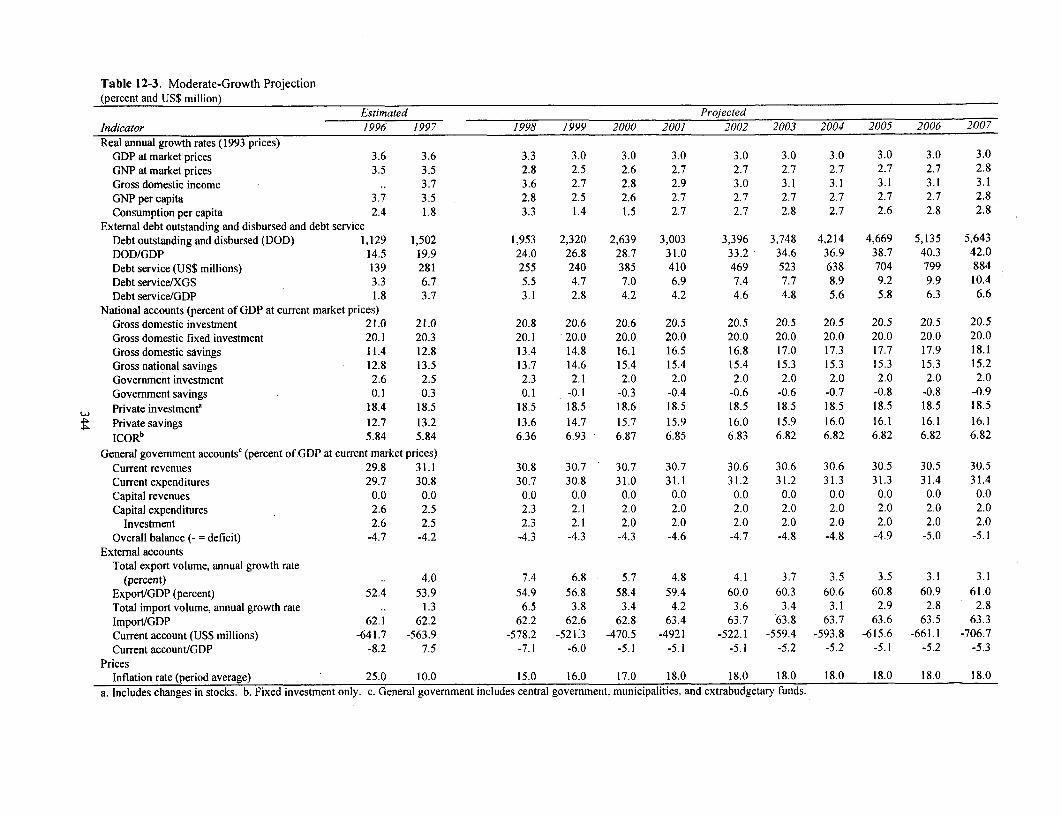
Table 12-3. Moderate-Growth Projection(percent and US$ million)
Estinated Projected
Indicator 1996 1997 1998 1999 2000 2001 2002 2003 2004 2005 2006 2007
Real annual growth rates (1993 prices)GDP at market prices 3.6 3.6 3.3 3.0 3.0 3.0 3.0 3.0 3.0 3.0 3.0 3.0
GNP at market prices 3.5 3.5 2.8 2.5 2.6 2.7 2.7 2.7 2.7 2.7 2.7 2.8
Gross domestic income .. 3.7 3.6 2.7 2.8 2.9 3.0 3.1 3.1 3.1 3.1 3.1
GNP per capita 3.7 3.5 2.8 2.5 2.6 2.7 2.7 2.7 2.7 2.7 2.7 2.8
Consumption per capita 2.4 1.8 3.3 1.4 1.5 2.7 2.7 2.8 2.7 2.6 2.8 2.8
External debt outstanding and disbursed and debt serviceDebtoutstanding and disbursed (DOD) 1,129 1,502 1,953 2,320 2,639 3,003 3,396 3,748 4,214 4,669 5,135 5,643
DOD/GDP 14.5 19.9 24.0 26.8 28.7 31.0 33.2 34.6 36.9 38.7 40.3 42.0
Debt service (US$ millions) 139 281 255 240 385 410 469 523 638 704 799 884
Debt service/XGS 3.3 6.7 5.5 4.7 7.0 6.9 7.4 7.7 8.9 9.2 9.9 10.4
Debt service/GDP 1.8 3.7 3.1 2.8 4.2 4.2 4.6 4.8 5.6 5.8 6.3 6.6
National accounts (percent of GDP at current market prices)Gross domestic investment 21.0 21.0 20.8 20.6 20.6 20.5 20.5 20.5 20.5 20.5 20.5 20.5
Gross domestic fixed investment 20.1 20.3 20.1 20.0 20.0 20.0 20.0 20.0 20.0 20.0 20.0 20.0
Gross domestic savings 11.4 12.8 13.4 14.8 16.1 16.5 16.8 17.0 17.3 17.7 17.9 18.1
Gross national savings 12.8 13.5 13.7 14.6 15.4 15.4 15.4 15.3 15.3 15.3 15.3 15.2
Government investment 2.6 2.5 2.3 2.1 2.0 2.0 2.0 2.0 2.0 2.0 2.0 2.0
Government savings 0.1 0.3 0.1 -0.1 -0.3 -0.4 -0.6 -0.6 -0.7 -0.8 -0.8 -0.9
,, Private investmenta 18.4 18.5 18.5 18.5 18.6 18.5 18.5 18.5 18.5 18.5 18.5 18.5
> Private savings 12.7 13.2 13.6 14.7 15.7 15.9 16.0 15.9 16.0 16.1 16.1 16.1
ICORb 5.84 5.84 6.36 6.93 6.87 6.85 6.83 6.82 6.82 6.82 6.82 6.82
General government accountsc (percent of.GDP at current market prices)Current revenues 29.8 31.1 30.8 30.7 30.7 30.7 30.6 30.6 30.6 30.5 30.5 30.5
Current expenditures 29.7 30.8 30.7 30.8 31.0 31.1 31.2 31.2 31.3 31.3 31.4 31.4
Capital revenues 0.0 0.0 0.0 0.0 0.0 0.0 0.0 0.0 0.0 0.0 0.0 0.0
Capital expenditures 2.6 2.5 2.3 2.1 2.0 2.0 2.0 2.0 2.0 2.0 2.0 2.0
Investment 2.6 2.5 2.3 2.1 2.0 2.0 2.0 2.0 2.0 2.0 2.0 2.0
Overall balance (- = deficit) -4.7 -4.2 -4.3 -4.3 -4.3 -4.6 -4.7 -4.8 -4.8 -4.9 -5.0 -5.1
External accountsTotal export volume, annual growth rate
(percent) 4.0 7.4 6.8 5.7 4.8 4.1 3.7 3.5 3.5 3.1 3.1
Export/GDP (percent) 52.4 53.9 54.9 56.8 58.4 59.4 60.0 60.3 60.6 60.8 60.9 61.0
Total import volume, annual growth rate .. 1.3 6.5 3.8 3.4 4.2 3.6 3.4 3.1 2.9 2.8 2.8
Import/GDP 62.1 62.2 62.2 62.6 62.8 63.4 63.7 63.8 63.7 63.6 63.5 63.3
Current account (US$ millions) -641.7 -563.9 -578.2 -521.3 -470.5 -4921 -522.1 -559.4 -593.8 -615.6 -661.1 -706.7
Current account/GDP -8.2 7.5 -7.1 -6.0 -5.1 -5.1 -5.1 -5.2 -5.2 -5.1 -5.2 -5.3
PricesInflation rate (period average) 25.0 10.0 15.0 16.0 17.0 18.0 18.0 18.0 18.0 18.0 18.0 18.0
a. Includes changes in stocks. b. Fixed investment only. c. General government includes central government, municipalities, and extrabudgetary funds.

Macroeconomic Framework
the deposit money banks) of 2 percent of GDP yearly. The stock of international reserves, as expressedin months of imports, will grow from 2.2 to 4.5 months.
The fiscal policy expressed in the projection is only moderately tight; the current generalgovernment deficit of some 2.5 percent of GDP continues through the decade. The considerableresistance in Lithuania to raising taxes-despite their low level in international comparisons-is reflectedin current revenues that remain at about 30 percent of GDP despite an upward creep of currentexpenditures from 30 percent to 31 percent. Government saving declines continuously, from near zero to-0.9 percent of GDP. Lending operations, largely a reflection of the passing on of government borrowingfrom abroad, have been maintained. In order to keep government borrowing down to 5 percent of GDP,however, capital expenditures have been rationed. They start at the already very modest level of 2.6percent of GDP, and soon decline to 2 percent. In effect, the failure of the current budget to generatesavings is hindering the government investment effort (see table 12-3). Also, any eventual privatizationrevenue (capital revenue) is assumed to be directly passed through to beneficiaries of compensationschemes (as currently determined by law), and thus is not reflected in the budget.
We turn now to the private sector and the financing of the main portion of the economy'sinvestment. In 1995, private sector investment was about 19 percent of GDP. As explained above, thegrowth of private investment is moderate in this projection, and its percentage of GDP remainsunchanged over the decade; the growth of saving behaves in the same manner. With the large currentaccount deficit-that is, the large rest-of-the-world annual saving of 5.3 percent of GDP-the domesticsaving available to the private sector is only 16.0 percent of GDP (see table 12-4). By our crude estimate,the portion of this amount that comprises internal business financing might be some 7 percent of GDP,while the capital formation to be financed is nearly 19 percent. If this is so, private sector borrowing tofinance such real investment would have to be about 12 percent of GDP. In the moderate projection, theestimated proportion of private borrowing to private investment thus rises from a reasonable 41 percent in1995 to a quite large 63 percent in 2007. This projection can be characterized as a heavy-borrowingscenario.
That borrowing and lending relationship becomes clear if the implicit flow-of-funds accounts areexamined in matrix formaLt with the banking sector represented, as in table 12-4. The line for the issue ofgeneral government debt (5.1 percent of GDP) shows that 2.3 percent is absorbed by the rest-of-the-world and I percent by tlhe private sector. The remaining 1.8 percent of GDP is taken by the bankingsector. Similarly, of the private credit issue of 11.6 percent of GDP that is necessary to finance privatesector investment, 4.9 percent is absorbed by the rest-of-world, 2.2 percent represents on-lending fromgovernment, and the remaining 4.5 percent is bank borrowing. In this projection, the borrowing needsare sufficiently high that even with the large flow from abroad (2.3 percent and 4.9 percent, stemminglargely from the current account deficit of 5.3 percent of GDP), major borrowing needs have to be met bythe banking sector (1.8 percent of GDP for government and 4.5 percent of GDP for the private sector).The projection thus assumes that the banking sector will be restored to health over the next few years andwill be able to accommodate these major credit demands.
If we compare the financial flow structure at the end of the projection (table 12-4 for the year2007) with that at the start (table 12-1 for 1995), we can see how that structure evolves over the decade.The lines for investment, saving, and surplus and deficit are not greatly changed. The moderate-growthscenario maintains a structure in which the balance of payments current account deficit provides a majorrest-of-the-world surplus that finances the deficits of the general government and the private sector. Butthe borrowing and lending structure does change. Borrowing grows substantially-for the government,from 4.1 percent of GDP to 5.1 percent, and for the private sector, from 7.6 percent of GDP to 11.6
345
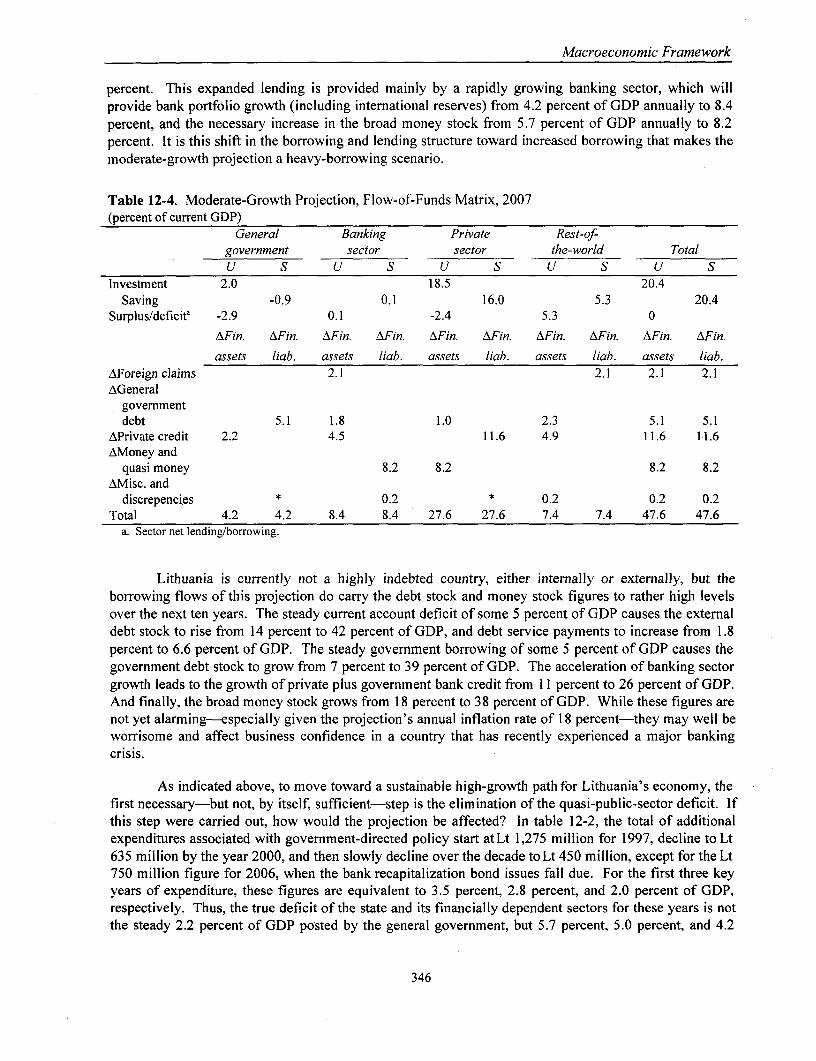
Macroeconomic Framework
percent. This expanded lending is provided mainly by a rapidly growing banking sector, which willprovide bank portfolio growth (including international reserves) from 4.2 percent of GDP annually to 8.4percent, and the necessary increase in the broad money stock from 5.7 percent of GDP annually to 8.2percent. It is this shift in the borrowing and lending structure toward increased borrowing that makes themoderate-growth projection a heavy-borrowing scenario.
Table 12-4. Moderate-Growth Projection, Flow-of-Funds Matrix, 2007(percent of current GDP)
General Banking Private Rest-of-government sector sector the-world TotalU S U S U S U S U S
Investment 2.0 18.5 20.4Saving -0.9 0.1 16.0 5.3 20.4
Surplus/deficita -2.9 0.1 -2.4 5.3 0AFin. AFin. AFin. AFin. AFin. AFin. AFin. AFin. AFin. AFin.
assets liab. assets liab. assets liab. assets liab. assets liab.AForeign claims 2.1 2.1 2.1 2.1AGeneral
governmentdebt 5.1 1.8 1.0 2.3 5.1 5.1
APrivate credit 2.2 4.5 11.6 4.9 11.6 11.6AMoney and
quasi money 8.2 8.2 8.2 8.2AMisc. and
discrepencies * 0.2 * 0.2 0.2 0.2Total 4.2 4.2 8.4 8.4 27.6 27.6 7.4 7.4 47.6 47.6
a. Sector net lending/borrowing.
Lithuania is currently not a highly indebted country, either internally or externally, but theborrowing flows of this projection do carry the debt stock and money stock figures to rather high levelsover the next ten years. The steady current account deficit of some 5 percent of GDP causes the externaldebt stock to rise from 14 percent to 42 percent of GDP, and debt service payments to increase from 1.8percent to 6.6 percent of GDP. The steady government borrowing of some 5 percent of GDP causes thegovernment debt stock to grow from 7 percent to 39 percent of GDP. The acceleration of banking sectorgrowth leads to the growth of private plus government bank credit from I I percent to 26 percent of GDP.And finally, the broad money stock grows from 18 percent to 38 percent of GDP. While these figures arenot yet alarming-especially given the projection's annual inflation rate of 18 percent-they may well beworrisome and affect business confidence in a country that has recently experienced a major bankingcrisis.
As indicated above, to move toward a sustainable high-growth path for Lithuania's economy, thefirst necessary-but not, by itself, sufficient-step is the elimination of the quasi-public-sector deficit. Ifthis step were carried out, how would the projection be affected? In table 12-2, the total of additionalexpenditures associated with government-directed policy start atLt 1,275 million for 1997, decline to Lt635 million by the year 2000, and then slowly decline over the decade to Lt 450 million, except for the Lt750 million figure for 2006, when the bank recapitalization bond issues fall due. For the first three keyyears of expenditure, these figures are equivalent to 3.5 percent, 2.8 percent, and 2.0 percent of GDP,respectively. Thus, the true deficit of the state and its financially dependent sectors for these years is notthe steady 2.2 percent of GDP posted by the general government, but 5.7 percent, 5.0 percent, and 4.2
346
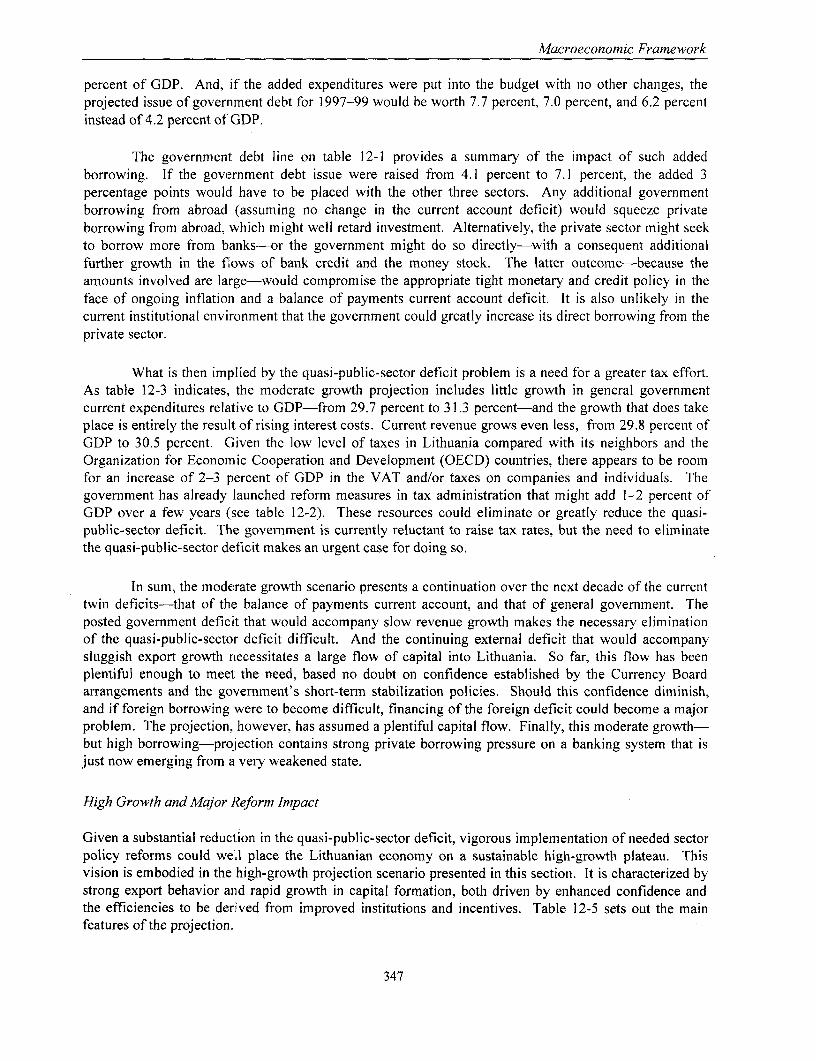
Macroeconomic Framework
percent of GDP. And, if the added expenditures were put into the budget with no other changes, theprojected issue of government debt for 1997-99 would be worth 7.7 percent, 7.0 percent, and 6.2 percentinstead of 4.2 percent of GDP.
The government debt line on table 12-1 provides a summary of the impact of such addedborrowing. If the government debt issue were raised from 4.1 percent to 7.1 percent, the added 3percentage points would have to be placed with the other three sectors. Any additional governmentborrowing from abroad (assuming no change in the current account deficit) would squeeze privateborrowing from abroad, which might well retard investment. Alternatively, the private sector might seekto borrow more from banks-or the government might do so directly-with a consequent additionalfurther growth in the flows of bank credit and the money stock. The latter outcome-because theamounts involved are large-would compromise the appropriate tight monetary and credit policy in theface of ongoing inflation and a balance of payments current account deficit. It is also unlikely in thecurrent institutional environment that the government could greatly increase its direct borrowing from theprivate sector.
What is then implied by the quasi-public-sector deficit problem is a need for a greater tax effort.As table 12-3 indicates, the moderate growth projection includes little growth in general governmentcurrent expenditures relative to GDP-from 29.7 percent to 31 .3 percent-and the growth that does takeplace is entirely the result of rising interest costs. Current revenue grows even less, from 29.8 percent ofGDP to 30.5 percent. (jiven the low level of taxes in Lithuania compared with its neighbors and theOrganization for Economic Cooperation and Development (OECD) countries, there appears to be roomfor an increase of 2-3 ,oercent of GDP in the VAT and/or taxes on companies and individuals. Thegovernment has already launched reform measures in tax administration that might add 1-2 percent ofGDP over a few years (see table 12-2). These resources could eliminate or greatly reduce the quasi-public-sector deficit. The government is currently reluctant to raise tax rates, but the need to eliminatethe quasi-public-sector deficit makes an urgent case for doing so.
In sum, the moderate growth scenario presents a continuation over the next decade of the currenttwin deficits-that of the balance of payments current account, and that of general government. Theposted government deficit that would accompany slow revenue growth makes the necessary eliminationof the quasi-public-sector deficit difficult. And the continuing external deficit that would accompanysluggish export growth necessitates a large flow of capital into Lithuania. So far, this flow has beenplentiful enough to meet the need, based no doubt on confidence established by the Currency Boardarrangements and the government's short-term stabilization policies. Should this confidence diminish,and if foreign borrowing were to become difficult, financing of the foreign deficit could become a majorproblem. The projection, however, has assumed a plentiful capital flow. Finally, this moderate growth-but high borrowing-projection contains strong private borrowing pressure on a banking system that isjust now emerging from a very weakened state.
High Growth and Major Reform Impact
Given a substantial reduction in the quasi-public-sector deficit, vigorous implementation of needed sectorpolicy reforms could well place the Lithuanian economy on a sustainable high-growth plateau. Thisvision is embodied in the high-growth projection scenario presented in this section. It is characterized bystrong export behavior and rapid growth in capital formation, both driven by enhanced confidence andthe efficiencies to be derived from improved institutions and incentives. Table 12-5 sets out the mainfeatures of the projection.
347
Table 12-5. High-Growth Projection(percent and US$ million)
Estimated Projected
Indicator 1996 1997 1998 1999 2000 2001 2002 2003 2004 2005 2006 2007
Real annual growth rates (1993 prices)GDP at market prices 3.6 3.6 4.0 4.5 5.0 5.5 6.0 6.0 6.0 6.0 6.0 6.0GNP at market prices 3.5 3.5 3.5 4.0 4.6 5.2 5.8 5.9 5.9 6.0 6.0 6.0Gross domestic income 3.5 4.4 4.4 4.9 5.5 6.1 6.1 6.1 6.1 6.2 6.2GNP per capita 3.7 3.5 3.5 4.0 4.6 5.2 5.8 5.9 5.9 6.0 6.0 6.0Consumptionpercapita 2.4 1.8 2.9 2.3 2.7 3.7 5.2 5.1 5.3 5.8 6.0 6.0
External debt outstanding and disbursed and debt serviceDebt outstanding and disbursed (DOD) 1,129 1,461 1,887 2,223 2,449 2,666 2,864 2,936 3,054 3,170 3,294 3,426DOD/GDP 14.5 18.9 22.6 24.7 25.1 25.3 25.0 23.6 22.6 21.6 20.6 19.8Debt service (US$ millions) 139 282 255 237 385 405 439 466 542 536 551 554Debt service/XGS 3.3 6.6 5.4 4.5 6.6 6.3 6.2 6.0 6.3 5.7 5.3 4.9Debt service/GDP 1.8 3.6 3.0 2.6 4.0 3.8 3.8 3.7 4.0 3.6 3.4 3.2
National accounts (percent of GDP at current market prices)Gross domestic investment 21.0 21,5 22.0 22.5 23.0 23.5 23.5 23.5 23.5 23.5 23.5 23.5Gross domestic fixed investment 20.1 20.8 21.4 21.9 22.5 23.0 23.0 23.0 23.0 23.0 23.0 23.0Gross domestic savings 11.4 13.0 14.5 16.4 18.4 19.8 20.5 21.3 21.9 22.3 22.5 22.7Gross national savings 12.8 13.9 14.8 16.2 17.7 18.8 19.2 19.8 20.2 20.5 20.5 20.6Govermment investment 2.6 2.5 2.6 2.8 2.9 3.1 3.2 3.4 3.6 3.6 3.6 3.6Government savings 0.1 0.4 0.6 1.3 1.7 2.1 2.3 2.6 2.7 2.8 2.8 2.8
w Private investmenta 18.4 19.0 19.4 19.8 20.1 20.5 20.3 20.1 19.9 19.9 19.9 19.9
°° Private savings 12.7 13.5 14.2 15.0 16.0 16.7 16.9 17.2 17.5 17.7 17.7 17.9
ICORb 5.84 5.84 5.38 4.59 4.50 4.18 3.92 3.91 3.91 3.91 3.91 3.91
General government accountsC (percent of GDP at current market prices)Current revenues 29.8 30.9 31.1 31.4 31.7 31.9 32.1 32.3 32.4 32.4 32.4 32.4Current expenditures 29.7 30.5 30.5 30.1 29.9 29.9 29.8 29.7 29.7 29.6 29.6 29.6Capital revenues 0.0 0.0 0.0 0.0 0.0 0.0 0.0 0.0 0.0 0.0 0.0 0.0Capital expenditures 2.6 2.5 2.6 2.8 2.9 3.1 3.2 3.4 3.6 3.6 3.6 3.6
Investment 2.6 2.5 2.6 2.8 2.9 3.1 3.2 3.4 3.6 3.6 3.6 3.6Overall balance (- deficit) -4.7 -4.2 -3.9 -3.5 -3.2 -2.9 -2.8 -2.8 -2.7 -2.7 -2.7 -2.6
External accountsTotal export volume, annual growth rate .. 6.5 7.3 7.3 7.7 7.5 7.5 7.5 7.6 7.6 6.9 6.9Export/GDP 52.4 53.8 54.7 56.2 57.7 58.8 59.6 60.5 61.5 62.5 63.1 63.8Total import volume, annual growth rate .. 4.2 6.1 4.8 5.2 5.9 6.4 6.4 6.7 7.3 6.8 6.8Import/GDP 62.1 62.2 62.2 62.3 62.3 62.5 62.6 62.7 63.0 63.7 64.1 64.6Current account (US$ millions) -641.7 -592.4 -599.5 -566.7 -518.3 -495.2 -486.5 -457.1 -434.8 -438.3 -466.1 -488.6Current account/GDP -8.2 -7.6 -7.2 -6.3 -5.3 -4.7 -4.2 -3.7 -3.2 -3.0 -2.9 -2.8
PricesInflation rate (period average) 25.0 12.3 10.0 8.5 7.5 7.0 6.5 6.0 5.5 5.0 5.0 5.0
a. Includes changes in stocks. b. Fixed investment only. c. General government includes central government, municipalities, and extrabudgetary funds.

Macroeconomic Framework
In the high-growth projection, real annual GDP growth rises from the current 3.6 percent to 6percent by 2002, and remains at 6 percent to the end of the projection period in 2007. Gross investmentfollows an identical path. Both GDP and investment grow at double the rates in the moderate projection.This high rate of investment will be a direct result of energetic sectoral reforms, although a simplequantitative translation is not possible. Nevertheless, for a number of reasons the policy impact oninvestment is assumed to be large. The increased pace of privatization, a more favorable (andaccountable) private sector development environment (through better tax administration, judicial systems,and mechanisms for corporate governance), sounder and more efficient financial systems (both inbanking and in security markets), and the development of longer-term sources of funding from banks andpension-based investment funds can trigger a major, permanent improvement in confidence. This, inturn, could drive an increase in investment, and in its efficiency. The major improvements in efficiencyare symbolized by the ICOR drop from 5.8 to 3.9 over the projection decade. In parallel, real per capitaconsumption attains an annual 6 percent growth rate, in contrast to the 2.8 percent annual rate of themoderate-growth scenario, making the overall economic framework more socially sustainable.
Furthermore, in the high-growth scenario, it is assumed that inflation continues to decline, withthe annual rate falling steadily from the current 12 percent to 5 percent by 2007. This decline (and thelessening current account deficit discussed below) crea.es a much easier situation for the monetaryauthorities. The real effective exchange rate can be kept constant with only a moderate devaluation of theUS$/litas exchange rate, from 4 to 6.75, in sharp contrast with the previous scenario. In turn, theauthorities will be able to maintain lower long-term interest rates, further encouraging investment.
Both exports and imports rise more rapidly in the high-growth scenario. Export volume grows to7.5 percent annually, remains there through 2005, and ends the forecast period at 6.9 percent yearly, overdouble the rate used in the moderate-growth scenario. Despite this difference, the proportion of exportsto GDP rises from 52.4 percent to 63.8 percent, only 2 percentage points higher than the moderate-growthsetting. This is the result of the cumulative effect of the increased output of the economy. Imports growmore slowly, and end the forecast period at 64.6 percent of GDP, only 1.3 percentage points higher thanthe moderate-growth scenario. Consequently, the current account deficit falls steadily, from -8.2 percentof GDP in 1996 to -2.8 lpercent of GDP in 2007, in marked contrast to the virtually unwavering -5.2percent current account deficit of the moderate-growth projection.
The lower current account deficit in this projection, coupled with the increased output of theeconomy, elicits a drastically lower level of required international financing. As a consequence, theproportion of external debt to GDP rises from 14 percent to only 20 percent over the projection period,half the level of the moderate-growth scenario. Not surprisingly, the proportion of debt service paymentsto GDP increases from 1.8 percent to only 3.2 percent, approximately half the 6.6 percent level of themoderate-growth scenario.
In fiscal policy, a tighter stance is presented in the high-growth scenario. Current expendituresare kept level at 29.7 percent of GDP, in contrast to a growth to 31.4 percent in the moderate-growthprojection. VAT increases boost current revenues from 29.8 percent of GDP to 32.4 percent, nearly 2.0percent more than in the earlier scenario (see tables 12-3 and 12-5). The upshot is a rise in generalgovernment saving to 2.8 percent of GDP, which is available to finance the growth in governmentinvestment from 2.6 percent to 3.6 percent of GDP. Finally, the general government deficit tapers offsharply in the high-growtlh projection, from the initial -2.5 percent of GDP to about -1.0 percent from2001 to 2007. The government deficit, like the balance of payments current account deficit, isconsiderably smaller here than in the moderate projection.
349
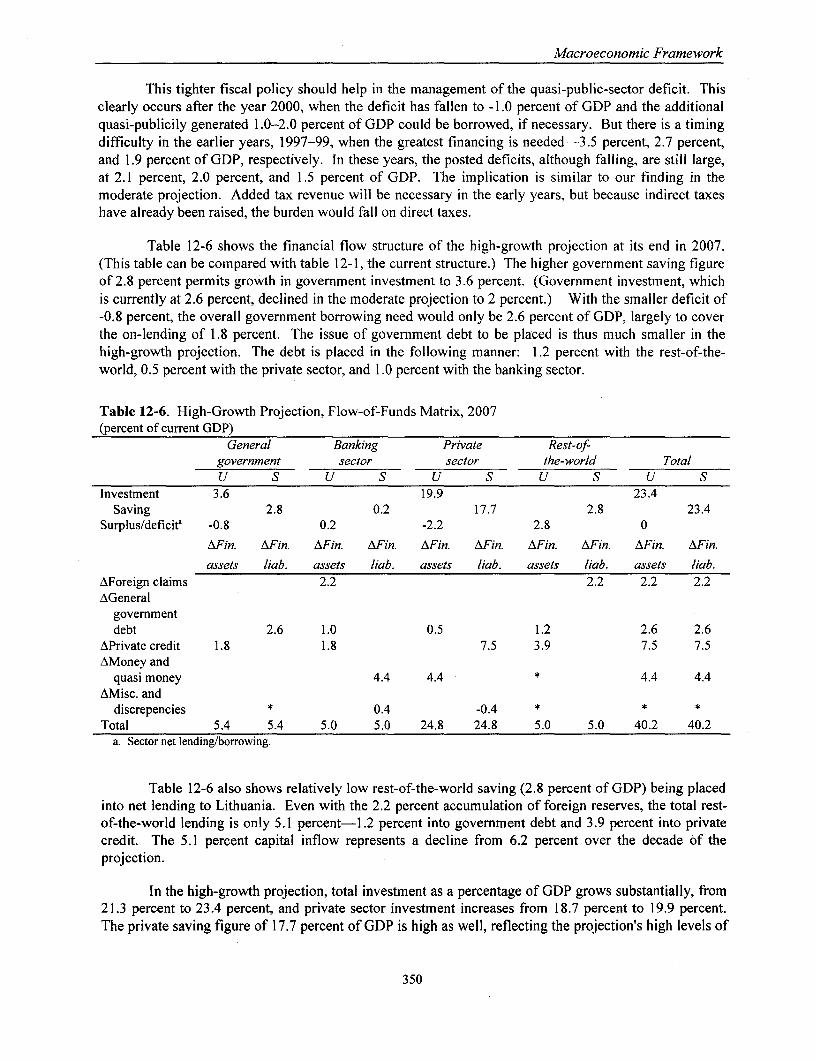
Macroeconomic Framework
This tighter fiscal policy should help in the management of the quasi-public-sector deficit. Thisclearly occurs after the year 2000, when the deficit has fallen to -1.0 percent of GDP and the additionalquasi-publicily generated 1.0-2.0 percent of GDP could be borrowed, if necessary. But there is a timingdifficulty in the earlier years, 1997-99, when the greatest financing is needed-3.5 percent, 2.7 percent,and 1.9 percent of GDP, respectively. In these years, the posted deficits, although falling, are still large,at 2.1 percent, 2.0 percent, and 1.5 percent of GDP. The implication is similar to our finding in themoderate projection. Added tax revenue will be necessary in the early years, but because indirect taxeshave already been raised, the burden would fall on direct taxes.
Table 12-6 shows the financial flow structure of the high-growth projection at its end in 2007.(This table can be compared with table 12-1, the current structure.) The higher government saving figureof 2.8 percent permits growth in government investment to 3.6 percent. (Government investment, whichis currently at 2.6 percent, declined in the moderate projection to 2 percent.) With the smaller deficit of-0.8 percent, the overall government borrowing need would only be 2.6 percent of GDP, largely to coverthe on-lending of 1.8 percent. The issue of government debt to be placed is thus much smaller in thehigh-growth projection. The debt is placed in the following manner: 1.2 percent with the rest-of-the-world, 0.5 percent with the private sector, and 1.0 percent with the banking sector.
Table 12-6. High-Growth Projection, Flow-of-Funds Matrix, 2007(percent of current GDP)
General Banking Private Rest-of-government sector sector the-world TotalU S U S U S U S U S
Investment 3.6 19.9 23.4Saving 2.8 0.2 17.7 2.8 23.4
Surplus/deficita -0.8 0.2 -2.2 2.8 0AFin. AFin. AFin. AFin. AFin. AFin. AFin. AFin. AFin. AFin.
assets liab. assets liab. assets liab. assets liab. assets liab.AForeign claims 2.2 2.2 2.2 2.2AGeneral
governmentdebt 2.6 1.0 0.5 1.2 2.6 2.6
APrivate credit 1.8 1.8 7.5 3.9 7.5 7.5AMoney and
quasi money 4.4 4.4 * 4.4 4.4AMisc. and
discrepencies * 0.4 -0.4 * * *Total 5.4 5.4 5.0 5.0 24.8 24.8 5.0 5.0 40.2 40.2
a. Sector net lending/borrowing.
Table 12-6 also shows relatively low rest-of-the-world saving (2.8 percent of GDP) being placedinto net lending to Lithuania. Even with the 2.2 percent accumulation of foreign reserves, the total rest-of-the-world lending is only 5.1 percent-1.2 percent into government debt and 3.9 percent into privatecredit. The 5.1 percent capital inflow represents a decline from 6.2 percent over the decade of theprojection.
In the high-growth projection, total investment as a percentage of GDP grows substantially, from21.3 percent to 23.4 percent, and private sector investment increases from 18.7 percent to 19.9 percent.The private saving figure of 17.7 percent of GDP is high as well, reflecting the projection's high levels of
350

Macroeconomic Framework
profits. Our crude estimate of business saving, or inside financing, is also high, at 12.8 percent of GDP,so that by 2007 only about a third of the private real investment has to be financed by borrowing. Thisproportion of borrowing would leave businesses in a much sounder financial position than the nearly two-thirds proportion at the end of the moderate projection. With the volume of private borrowing falling inthis projection to 7.5 percent, and even with less foreign lending available, the private sector's call on thebanking system is only 1.8 percent of GDP, a decline from 2.7 percent at the start of the projection. Thebanking system thus expands much more slowly than in the earlier projection, and the stock of domesticbank credit rises only to some 20 percent of GDP. Similarly, monetary expansion is more modest: theannual increment falls over the projection period from 5.7 percent of GDP to 4.4 percent, and the stock ofmoney rises to only 32 percent of GDP. In this high-growth scenario, with its smaller key deficits, morecomfortable, less demanding use is made of the financial system.
The broad purpose of our two projection scenarios has been to map out two plausible, policy-determined paths for the Lithuanian economy. As a final contrast and summary of the endpoints of thetwo projection paths, tables 12-4 and 12-6 can be compared. The high-growth projection carriesinvestment to 23.4 percent of GDP, the moderate projection to 20.4 percent. The surplus/deficit structurediffers sharply, with the high-growth rest-of-the-world surplus at 2.8 percent of GDP (rather than 5.3percent) and the government deficit at -0.8 percent of GDP (rather than -2.9 percent). In the high-growthprojection, government borrowing is smaller, at 2.6 percent of GDP (rather than 5.1 percent), and so isprivate borrowing, at 7.5 percent of GDP (rather than 11.6 percent), and the smaller demand forborrowing by both sectors in the high-growth projection reduces the flow of bank credit to the two sectorsto 5.0 percent of GDP (rather than 8.4 percent), and the money stock increment to 4.4 percent of GDP(rather than 8.2 percent). The high-growth scenario is a low-deficit, low-borrowing scenario. It willleave the financial system, and ultimately the economy, in a far healthier position.
Some Concluding Policy ]Recommendations
The purpose of this chapter has been to place the sector reform proposals of this volume in amacroeconomic context and to consider the macromanagement policies that would support theeffectiveness of the reforrn proposals. The central macropolicy task is the elimination of the quasi-public-sector deficit in the near future. Once this is achieved, vigorous implementation of the sectorreforms can place Lithuania on a high-growth plateau. In this context, the projections have shown theimportance of improved government revenue performance, a firm growth path for exports, and therestoration of the health of the banking system as the key macro areas needed to support the reforms.
ELIMINATION OF T]HE QUASI-PUBLIC-SECTOR DEFICIT. The estimates of the quasi-public-sectordeficit for 1997-99 of 3.5 percent, 2.8 percent, and 2 percent of GDP, which then continue on at about1.5 percent of GDP, confirm the large size of that sector's deficit. In neither of our projections couldthese early years be properly managed by increased general government borrowing-improved revenueperformance would be necessary in either case. General government current revenue is now 29.8 percentof GDP. This would need to be raised by 3 percentage points of GDP in 1997-99 to finance the quasi-public-sector deficit. This is not an unreasonable increase given Lithuania's low level of taxation relativeto OECD countries (especially in income and profits taxes). It is too soon for Lithuania to be consideringgeneral tax reduction.
EXPORT SUST-AINABILITY. Lithuania's merchandise exports were up 21 percent and exportvolume was up 13 percent in 1996. The question is, will such rapid growth continue? Indicators thatsuggest sustainability of exports-such as the high and growing export-to-GDP ratio and the lack ofpersistent pressures on the exchange rate in either direction-appear favorable for Lithuania. Our high-
351

Macroeconomic Framework
growth projection thus assumed a continuous growth in annual export volume of 7 percent, which was animportant cause of the reduction in the current account deficit. Continuing export growth is a major forceimpelling Lithuania's progress on the rapid growth path.
HEALTH OF THE BANKING SYSTEM. The Lithuanian banking system-restructured andprivatized-will still have had very little experience in commercial banking as a business; that is, inmaking viable and regular short-term business loans. This commercial bank function will need supportand strengthening. As the projections show, the growing borrowing needs of the private sector will bemet largely by the banks. If the banking system is unable to extend the credit demanded over the nextdecade, would-be borrowers may well not be able to finance desired investment. A high-growth path willrequire a properly functioning commercial banking system.
352

Distributors of COLOMBIA GERMANY Tel: (525) 624-2800 POLAND Fax: (94 1) 432104Intloenace LUra. UNO-Verlag ISRAEL Fax: (52 5) 624-2822 Intemabsonal Publishing Service E-mail: [email protected] orld Bank Carrera 6 No. 51-21 Poppelsdorfer Allee 55 Yozmot Literature Ltd. E-mail: [email protected] Ul. Piekna 31/37Apartado Aereo 34270 53115 Bonts PO. BEox 56055 00-677 Warzawa SWEDENPublications Santafe de Bogagd. D.C. Tel: (49 228) 949020 3 Yohanan Hasandlar Street Mundi-Prensa Mexico S.A. de C.V Tel: (482) 628-6089 Wennergren-Williams AB
Prices and credit tem afrm Tel: (57 1)285-2798 Pus: (49 228) 217492 Tl Aeie 815600cRoPnc,11ClnaCaheoc Fx 4 )6175 .Bx10country to country. Coansur frou Fax (57 1)285-2798 E-mail: unoveragatol.com Fl: (972 3) 5285-397 065 Mexico, O-F. E-mait: books%ipsikp.atrm.cm.pt S171 25 Solos(scal distributor before placing an COTE DOIVOIRE GHANA Fax: (52 5) 514-8799 PORTUGAL Fax: (46 8) 27-00-71order. Center d'Edtion et de Diafusion Atricaines Epp Boaks Services R.O.Y lntemational Livraria Postugal E-mail: [email protected]
(CEDA) P.O. 13os 44 P0 Box 13056 NEPAL Aparlads 2681, Rua Os Caseso 70-74ARGENTINA 04 B.P 541 TUC Tel AvPl 61130 Eveaest Media Intemational Services (P) Lid. 1200 Lisbon SWITZERLANDOficina det Libro Intemicional Abidjan 04 Accra Tel: (972 3) 5461423 GPO Box 5443 Tel: (1) 347-4982 Librairie Payot Service InstoutionnelAv. Cordoba 1877 Tel: (225)246510-246511 Fax. (972 3)5461442 Kathmandu Fax: (1) 3470264 Cotes-de-Monibenon301120 Buenos Aires Fax: (225) 25 0567 GREECE 0-mail: [email protected] Tel: (977 1)472 152 1002 LausanneTel: (54 1) 815-8354 Papasosiriou S.A. Fax: (9771) 224 431 ROMANIA Tel: (41 21) 341-3229Fax: (541) 815-8156 CYPRUS 35, SItoumara Str. Paletinian AuthoritytMiddle East Compani De Libraril Bucuresti S A. Fax: (41 21) 341-3235E-miail: [email protected] CerterforAppledResearch 106 82Athens Index Inlormation Services NETHERLANDS Str Lipscani no. 26, sector 3
Cypers Cog lege search Tel. (301) 364-1826 PO.B. 19502 Jerusalem De LindeboormVOr-Publikaties Bucharest ADECO Van Diermen EdgionsTechniquesAUSRALA, IJI PAUANEW GUINEA, 6,DCgerus Strleget,Egm Fax: (30 1) 364-8254 Tel: (972 2) 6271219 PO, B3oo 252, 7480 AE Haaksbergen Tel: (40 1) 6130045 Ch.rde Lassez 41SOLOMON ISLANDS, VANUATU, AND P Box 2006 Fax (972 2) 6271634 Tel (31 53) 574-0004 Fax (40 1) 312 4000 CH1807 BlonaySOLMON ISAD,VNAU N 0 o ~HAITI Fas: (31 53) 572-9296 Tel: (41 21) 943 2673
SAMOA ~~~~~~~~~~Noicasiuur Ca infOduasiIAYEmiloidbnwodoiev RUSSIAN FEDERATION Fax: (41 21) 943 3605D.A. Infonition Seivices Tel- (357 2) 44-1730 ClueDfsinITALY E-mail lindeboo @wodtdonline.ni RSIsAtesv FesEAO Ma.(126)9330648 Whltehorse Road T (35721730 5, Rue Capois Licosa Commissionaria Sansoni SPA ladalelalos <Ves Mir>648Wtv e Road CP2i7viDucaDiCaabnFaa: (357 2)46-2051 C P 257 9a, Kolpachniy Pereulok THAILANDVictoria CZEC BLIC Port-au-Prince Casolla Postale 552 EBSCO NZ Ltd. Moscow 101831 Central Books DistributionVeL(6t3392tO7a 77 CZECHREPULI Tel:(509)239260 50125Fireze PriNtewMailet Bag9094Tel: (7095) 917 7o49 306 Siom RsadTel: (61(392107777 ~~~~LIStS, NIS Prode)nia Fax: (509) 23 4858 Tel: )55( 645-415 Nem Market Fa 75)9705 sga 00Fax: (61) 39210 7780 Havelksea 22Fa:(564-7SIGPR;1,ANCHA
E-mail: service ~dadirect.om au Fax: (55) 641-257 Ackland SINGAPORE; 1~,WAuckland; Tel: (662))235-5400E-mail:[email protected] 13000 Prague 3 HONG KONG, CHINA; MACAD F-mail: Tel: (649)524-8119 MYANMAR; BRUNEI Fax: (682)237-8321Tel: (420 2) 2423 1486 Asia 2000 Ltd. Fax (64 9) 524 8067 A R; BRUNEI
AUSrIldanCo Fax: (428 2) 2423 1114 Sales & Circalatios Department JAMAICA 4 aln udn Qd#40 RNDD&TBGWellrbsrggasse 26 DENMARK ~~~~~~~~~~~~Seabird Hoase, unit 1101 -02 lan Randle Poblishems LId. NIGERIA 41KlugPdigRa 0-3AND THE CARRIBBEANWeihburggasse 26 DENMARK 22-28 Wyndham Street, Central Golden Wheel BuildingGoles hee Baidin SylemlicsStuiesLtdAG1011oWiendCo SamfuNdsLitMatur R modnos utit t0- 206 Old Hope Road, Kingston 6 Universiy Press Limted Singapore 349316 eel Build Lt
Tel: (43 1) 512-47-31-0 Rosenoems AMt 11 Tel: (852) 2530-1409 Tel: 876-927-20865 Three Crowns Building Jericho Tel: (65) 741-5166 SI. Augustine Shoppiog CenterFax: (43 1( 512-47-3129 DK-1970 Frederiksberg C Fax: (852) 2526-1107 Fax: 876-977-0243 Private Mail Bag 5 Faa: (65) 742-9356 Eastem Main Road, St. Augustine
Tel: (45 31) 351942 E-maif: [email protected] E-mail: [email protected] lbadan E-mail: [email protected] Trinidad & Tobago, West IndiesBANGLADESH Faa: (45 31) 357822 Tel: (234 22) 41-1356 Tel: (068) 645-8466Micro NdusHxies Devebpmen3 HUNGARY JAPAN Fax (234 22) 41-2056 SLOVENIA Fax: (868) 645-8467
Assistance Society (MIDAS) ECUADOR Euro Ino Service 3-13 Hongo 3-chome Bunkyo-ku NORWAY Dunaiska esta EHouse 5, Road 16 Libn Murndi Margdszgeti Europa Haz Tokyo 113 NIClntoAYS 1narl Vesln u UGANDADha*rmnch RtArea Libreria Intemacienal H-I 138 Budapest Tki 113 NC loaA DepabsmentT sk512ASteTsiad 1230k oe saidDhaka 1208 PsO. Bu 17-01-3029 Tea: (36 1) 3S0 80 24, 350 80 25 Fax: (91 3) 38180864 N-066OleornePTel: (386061(t133983C4746132 12U30POoKIN OMTel: (880 2) 326427 Juan LessMeri85 Fax: (36 1)E350 90 32 Fax (81 3164-: (386 61) 133480 30 30 Boa 9697, Midnoini BidaFalx: (8002)811168 OLeo E-mail: eurminlorsailmalOuo.# E-mail: orders2 sv3-ebs.co.ip Tel: (47 22) 97-4500 E-mail: repanssk(@geestsik.oi P.ot 16/4 Jinja Rd.
Qulfto Faa (47 22) 97-4545 KampalaBELGIUM Tel: (5932)521-6086 (593 2) 544t85 INDIA KENYA SOUTH AFRICA, BOTSWANA Tel: (256 41) 251 467Jean De Lannoy ~~Fax: (593 2) 504-209 Allied Pubrishems LId. Alrica Bask Service (E.A.) Ltd. PAKISTAN Par single titles: Faa: (256 41) 251 400Jebticacoes D ecnicas La temacionays L'da E-mail: libdmul @ibirimandi.coreec 751 Mount Road 0uaren Haose, MCangano SIree Mirza Bask Agency Oxford Univerady Press Southem Africa 0-mail: gus4sw9luganda.comA Bus eixot Mad, -600202 PO. Box 45245 65, Shahrah-e-Fuaid-e-Azam Vaosc Boulevard, Gandt.oodTel: (32 2 55 38-5169 Raiz de Castlla 763, Edit. Expocolor Tel: (91 44) 852-3938 Nairobi LKahno 54000 PO. Box 121109, N5 City7463 UNITED KINGDOMFax: (322) 5380841 Primer piso, Of,62 Fax: (91 44( 852-0649 Tel: (2542)(223 641 Tel: (92 42) 735 3601 Caipe loan Micrineo Ltd.
Fax: (254 2) 330 272 Fan: (92 42) 576 3714 Tel: (27 21) 59564400 PO. BooS3, Alasn, Hampshire GU34 2P0BmAZIL:potmateEpt.uo.b Oslro Fx(2)801 a:92)570 INDONESIA Fan: (27 21) 595 4430 EnglandPBRAZILues leorcastemaciosai LIds TeVFax: (593 2) 507-383; 253-091 Pt. Indir Limfled KOREA, REPUBLIC OF Oxford Universly Press E-mal: oxford) oup co1za Tel: (44 1420) 86848PubkaCANADesA Tmic lnemaconas Lda. E-maO: cF deu( impsa2) t.e6 ec Jabara orobudar 20 Dae(on Trading Cs. Ltd. S Bangalame lawn Fe: (44 1420) 89889Rua Peishto Gomide, 209 P0. Boo 181 PO. Boa 34, Youida, 706 Seaun Bldg Sharae Faisal Fore sbscriptio orders: E-mail: [email protected] ak01409 San Paulo, SP EGYPT, ARAB REPUBLIC OF JakaDa 10320 44-6 Youido-Dong, Yeongchengpo-Ku P0 Boo 13833 Chtemational Suhscripttan ServiceTel: (5511) 259-6644 Al Ahrrarn Dist7ibut(o Agency Tel: (62 21) 390-4290 Seoul Karachi-75350 PO. Boo 41005 The Stationery OfficeFax: (5511) 25-6690 Ai Galaa Street Fax: (62 21) 38904289 Tel: (82 2) 785-1631/4 ele: (92 21) 446307 Craighall 51 Nine Elms LaesE-mail: [email protected] Cro Fax: (82 2) 784-0315 Faa: (92 21) 4547640 Johannesburg 2024 Lond: (SW 5 0; S
Tel: (202)578-6083 IRAN E-mail: odppak@TheOfficeanet Tel: (27 11) 880-1449 Tel: (44 171) 873-8400CANADA Fax: (202(578-6833 Ketab Sara Cs. Publishers LEBANON Fax: (27 11) 800-0248 Faa: (44 171) 873-8242Renoau Publiahing Ce. Lidc Kaled Eseamboli Ava., 6th Street Librairie du Liban Psi Boask Corporation E-mail: siobr isacosaa5369 Caaotek Road Thre Middle East Observer Delafrooz Alley Na. 6 PO. Boa 11-9232 Aziz Chambers 21, Queen's Road VENEZUELAOPsawa, Ostario KIJ qf 41, Sherd Street P.O. Box 15745-733 Beirut Lahore SPAIN Tecnsi-Cienia Libros, SOP.elt: (613) 745F2665 Cairo Tehran 15117 Tel: (961 9)217 944 Tel: (92 42) 636 3222; 6362085 Mundi-Prensa Libros, SA. CentroCidadComerciatlTarsnco
Fax: (613) 745-7660 Tel: (20 2)3 83-9732 Tel: (98 21) 8717819- 8716104 Faa: (961 9(217 434 Fax: (92 42) 636 2328 Castello37 Nivel 02, CaracasE-mail: order 1 d0 [email protected] Fax: (20 2)1393-9732 Fax: (98 21) 8712479 E-mail: [email protected] 78001 Madrid Tel: (58u2) 950 5547: 50350016
E-mail: ketab-sara@neda nettir MALAYSIA Tel: (34 1) 431-3399 Fa: (582) 959 5630CHINA FINLAND University of Malaya Conpertmiye PERU Fax: (34 1) 575-3995Chis Financiul & Ecoemic Akateemien Kir)akauppa KEnhab Publishers Bookskop, Liml7ed Eddorial DOsarroltl SA E-mail: [email protected] ZAMBIAPublisbieg House PO. Boa 128 PO. Baa 19575-511 P0. Baa 1127 Apaoado 3824, Lima I University BAB kslap, Universgy at ZambiaB DaFs Sin Dng Je FIN-00101 Helsinki Tehran Jalan Patai Bamu Tel: (51 14) 285380 MnSdi-PrLnsa Barcelona Great East Head CaspabsBoijing Tel: (358 0( 121 4410 Tel: (98 21) 259-3723 59700 Kuala Lomprir Fax (51 14) 206628 Coasell deo Gen, 391 Po. Boa 32379Tel: (86 10) 6333-8257 Fanx:(358 0) 12140 435 Fax: (98 21) 258-3723 Tel: (60 3) 756-5000100 Brcelona Lusak
Faa: (66 15) 6401-736s E-mail: skalilaas@stackmaoo Faxs: (60 3) 755-4424 PHILIPPINES Tel: (3493488-3492 Tel (260 1) 252 576Fax: (86 6401-7365 E-mail:akalilaus~tockmarin fi IRELAND E-malt: umkoop Atm net.my Intematissal Booksisrce Ceoiter Inc. Fax: (34 3( 487-7659 Fax: (200 1(253 952
China Book limpen Centre PRANCE Goyeroimenl Supplies Agenicy I 127-A Anlipols St, Barangay, Venezuela E-miail: bsrcelonaslmaadiprsssa.easP.O Baa 2825 W
5orld Bank Publirations O0ig an ISaldthair MEXICO Makali City ZIMBABWE
Beijing 06 enedds4-5 Harcoud Rosad INFOTEC Tlo (03 2( 900 6501: 6505: 6507 SRI LANKA, THE MALDIVES Academic and Boabab Boaks (Pot) Ltd7516,aeu Pds n Dubrin 2 Av. San Femandos Na. 37 Faa: (63 2) 89161741 Lake House Boakhohp 4 Conald Road, Oranileside75el: (3P14ads 56 Tel- (353 1( 661-31 11 Cal. Todolto Goerra 100, Sir Chittampalarm Garsiloor lJawatha p0. Baa 567Fel: (33 1) 40-69-30-5695 Faa (353 1( 475-2670 14050 Mnxico, 0 F. Celamba 2 Harare
Fax: (33 1) 40-69-30-68 ~~~~~~~~~~~~~~~~~~~~~~~~Tel (04 1( 32105 Tot: 263 4755035Fax- 2634781913
THE WORLD BANK
1818 H Street, N.W.
Washington, D.C. 20433 USA
Telephone: 202-477-1234
Facsimile: 202-477-6391
Telex: MCI 64145 WORLDBANK
MCI 248423 WORIDBANK
World Wide Web: http://www.worldbanlk.or-g/
E-mail: [email protected]
ISBN 0-8213-4327-0