Hyundai, Chennai
30
© Confederation of Indian Industry HYUNDAI MOTOR INDIA LIMITED HYUNDAI MOTOR INDIA LIMITED © Confederation of Indian Industry 1 19th National Award for Excellence in Energy Management 2018 29, 30 & 31 August 2018, Hyderabad Team : Balan, Energy Manager Ragunathan, Energy Manager Selvanathan, ME Energy Engg
-
Upload
khangminh22 -
Category
Documents
-
view
5 -
download
0
Transcript of Hyundai, Chennai
© Confederation of Indian Industry
HYUNDAI MOTOR INDIA LIMITEDHYUNDAI MOTOR INDIA LIMITED
© Confederation of Indian Industry1
19th National Award for Excellence in Energy Management 2018 29, 30 & 31 August 2018, Hyderabad
Team :� Balan, Energy Manager
� Ragunathan, Energy Manager
� Selvanathan, ME Energy Engg
© Confederation of Indian Industry
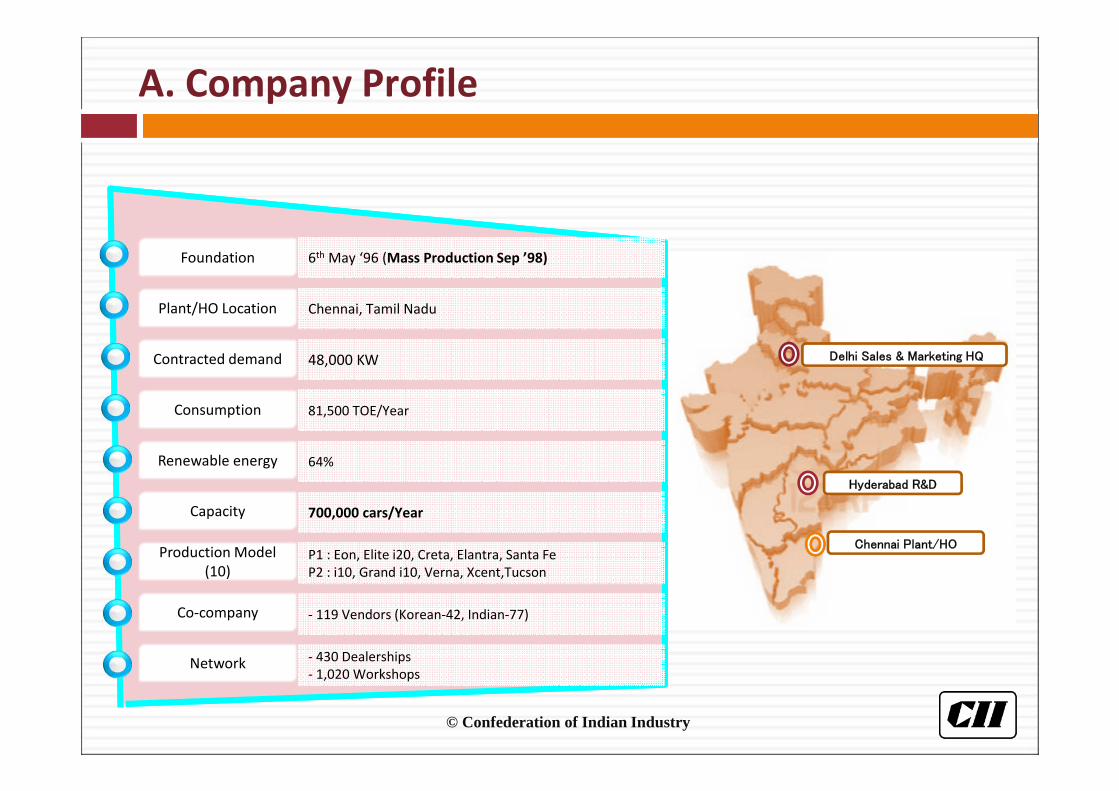
A. Company Profile
Chennai Plant/HO
Delhi Sales & Marketing HQ
Hyderabad R&D
Plant/HO LocationPlant/HO Location Chennai, Tamil Nadu
FoundationFoundation 6th May ‘96 (Mass Production Sep ’98)
Contracted demandContracted demand 48,000 KW
Renewable energyRenewable energy 64%
CapacityCapacity 700,000 cars/Year
Production Model
(10)
Production Model
(10)P1 : Eon, Elite i20, Creta, Elantra, Santa Fe
P2 : i10, Grand i10, Verna, Xcent,Tucson
Co-companyCo-company - 119 Vendors (Korean-42, Indian-77)
ConsumptionConsumption 81,500 TOE/Year
NetworkNetwork - 430 Dealerships
- 1,020 Workshops

© Confederation of Indian Industry
A. Company Layout
Phase I
Phase II
Eng III

© Confederation of Indian Industry
B. Process Flow
PRESS SHOP
BODY SHOP PAINT SHOP
ASSEMBLY SHOP
TRANSMISSION SHOP
ENGINE SHOPAL FOUNDRY
COMPLETE CAR
Passenger Car
Power Train
© Confederation of Indian Industry
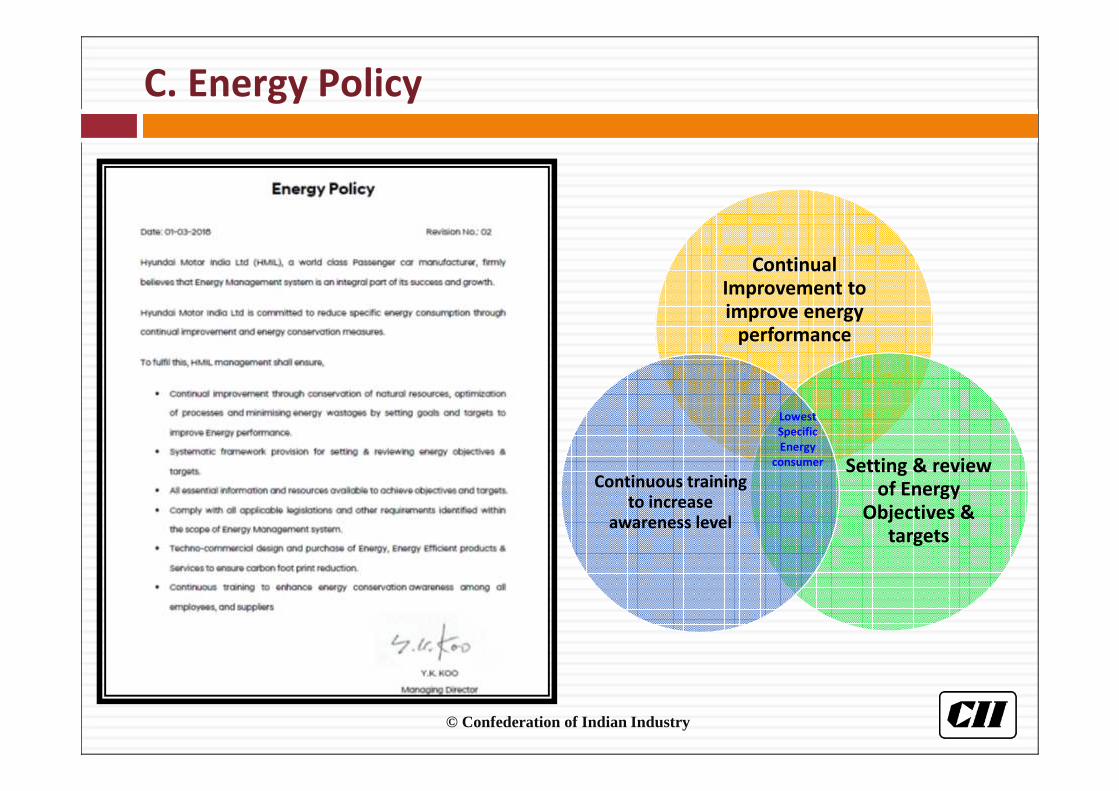
C. Energy Policy
Continual Improvement to improve energy
performance
Setting & review of Energy
Objectives & targets
Continuous training to increase
awareness level
Lowest
Specific
Energy
consumer
© Confederation of Indian Industry
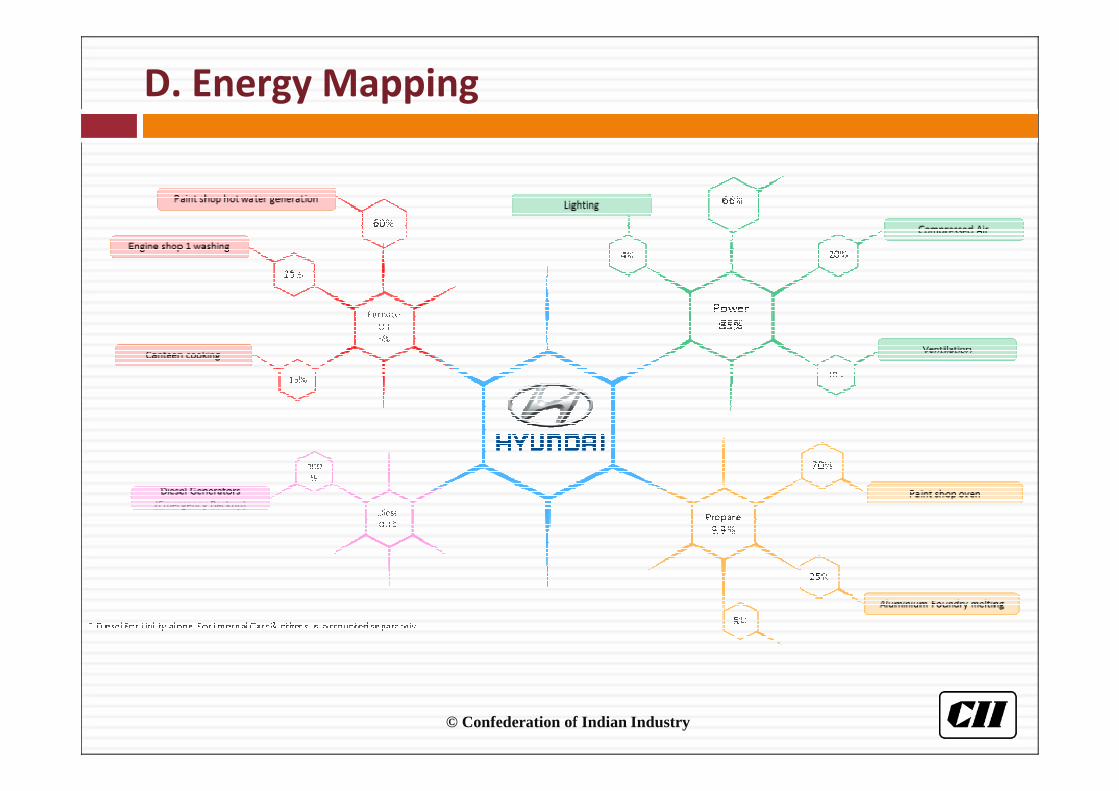
D. Energy Mapping

© Confederation of Indian Industry
1. Sp. Energy Consumption in last 3 years
Electrical
Energy
Thermal
Energy
100 X97 X
95 X
89X
2015 2016 2017 2018
CUMULATIVE IN KWH /CAR
3% ↓
2% ↓6% ↓
Major Projects carried out:
� 100% Illumination through LED
� Chiller optimization
� Energy Efficient Screw Compressor
� Coolant circulation system optimization
� Intelligent flow control for compressed air
pressure control
100 Y
98.3Y96.8Y
92Y
2015 2016 2017 2018
CUMULATIVE IN MILLION KCAL/CAR
1.7% ↓
1.5% ↓4.8% ↓
Major Projects carried out:
� Waste Heat recovery through Regenerative
Thermal Oxidizer
� Oven Temperature optimization
� Energy Efficient Boiler with O₂ trimmer, Auto
blowdown, Rotary cup burner
� Propane reduction through cross linked polymer

© Confederation of Indian Industry
2. Information on Competitors, National & Global benchmark
Global
Benchmark(in KgOE/car)
National
Benchmark(in KgOE/car)
120.2
118.4117.8
116.4
2017 HMI Actual Hyundai Global best Headquarters taget 2018 Actual
(Jan~July'18)
KgOE/car
1.5% ↓
2.1% ↓
3.1% ↓
120.2
118.7
117.2
116.4
2017 HMI Actual Competitor's best Internal Target 2018 Actual
(Jan~July'18)
KgOE/car
1.3% ↓
2.5% ↓
3.1% ↓

© Confederation of Indian Industry
� Major Energy Saving Activities Glimpse
9

© Confederation of Indian Industry
3a. Energy Saving projects implemented in FY 2015-16
S. NO Major ProjectInvestment
Rs Lakhs
Annual Savings
KWH
1 ALF#2 Compressor Installation near supply end 33 20,20,541
2 Engine-3 Model Change, power saving mode in chillers - 9,25,170
3 Touch up booth Elimination in Assy#2 - 9,00,680
4 VFD for Shop ventilation # 1 & # 2 5 8,80,680
5 CCS CHILLER & COOLING WATER LINE PUMP CUT-OFF DURING NON PRODUCTION TIME - 6,25,741
6 Localized Alf#2 Compressor operation in Sundays to cater PT needs, instead of Compressor -2. - 6,15,374
7 Base coat Compressor Pressure OpLmizaLon from 8 bar→6 bar and one compressor reducLon - 5,28,378
8 CCS PUMP OPTIMIZATION IN NON OPERATING AND IDLE HOURS - 4,49,189
9 Interior booth automation – automatic switch off 0.2 3,76,643
10 Shaving Machine idle Time reduction during CF models(4 Nos) - 3,26,578
11 CCS Motor Idle time Elimination in Sundays and Non Working Days by PLC program with Gantry loader - 3,00,952
12 3 Chiller Operation to 2 Chiller Operation by Cooling towers pipeline Interconnection - 2,88,980
13 Controlling Airleak with the Ultrasonic airleak detector & Sunday compressor running time reduction - 2,62,414
14 High Pressure Pump Switch Off During Non-Operation Of Robot - 2,36,892
15 PTED process pump switching off in break time in I and II shift. - 2,16,021

© Confederation of Indian Industry
3b. Energy Saving projects implemented in FY 2016-17
S. NO Major Project PowerInvestment
Rs Lakhs
Annual Savings
KWH / Kg of fuel
1 LED installations - HPC Electricity 323 63,37,837
2 Compressed air elimination for Bio aeration process in WWTP 2 & STP 2. Electricity 6 9,18,918
3 Base compressor operation optimization Electricity - 8,76,031
4 Shop floor Roof light switch off automation Electricity 1.15 4,57,546
5 Head line OP ( 10-180 ) Hydraulic motor energy saving provision Electricity - 4,06,351
6 Air Handlnig unit to wall mounting for wax line A - Energy saving Electricity - 2,89,425
7 Engine block line - Hydraulic motors -ES Electricity - 2,72,685
8 Touch up Booth 3 -Elimination Electricity - 2,25,867
9 Booth velocity optimization during holiday cleaning Electricity - 2,15,487
10 Work duct #1 re-circulation pump elimination Electricity - 2,11,680
11 Switch off Work deck 1 -ASU during holidays Electricity - 2,03,926
12 New Fuel efficient boiler # 2 -F.O reduction Furnace Oil 188 1,87,429
13 Steam line elimination in Engine Assy Furnace Oil 1.42 1,43,703
14Magnetic resonator + Low bake clear implementation
T/C oven temp reduction (175 à165ºC)Propane 7.48 65650

© Confederation of Indian Industry
3c. Energy Saving projects implemented in FY 2017-18
S. NO Major Project PowerInvestment
Rs Lakhs
Annual Savings
KWH / Kg of fuel
1 LPC (Low Power consumption) LED installation in shop floor Electricity
638
54,05,405
2 HPC (High Power consumption) LED installation in shop floor Electricity 20,19,595
3 Chiller optimization through cooling tower capacity enhancement Electricity 40 13,26,960
4 Replacement of Plant # 1 Screw compressor (SC) # 2 (62 NM3/Min.) Electricity 73 7,14,420
5 Cylinder block –Sub coolant tank filter pump energy saving Electricity - 5,68,079
6 Energy consumption reduction during facility maintenance. Electricity - 4,75,246
7Washing Machine Power Consumption reduction
in idle cycle - 40 secElectricity - 2,69,304
8 Compressed air leakage arresting through ZLL Electricity - 2,65,405
9 ED chiller pump & compress switch off during winter Electricity - 2,51,712
10 Chiller Cut off – 2 nos. in Jan & Chiller Cut off – 2 nos. in Feb: 150 KW Electricity - 1,68,000
11 A/S DR LINE HEMMING MOTOR ENERGY SAVING Electricity - 1,59,840
12 Compressed Air optimization by reducing IFC setting pressure Electricity - 1,52,842
13 Switch Off ED Preheat Burner During Holidays After Last Car Propane - 36,792
14 Paint Skid attachment modification Propane - 55,631

© Confederation of Indian Industry
4. Innovative Projects implemented
AFTER
� Return line nozzle removed.
� Motor power consumption drastically reduced by 20%
BEFORE
� High Pressure Return line flow restricted by nozzle, during idle
Cycle time. (Total Cycle time : 56 Secs, Washing cycle time: 16
Secs & Idle cycle time : 40 Secs)
� Leading to motor power consumption high during idle cycle
EFFECTIVENESSIMPL.
DATE 25.05.2018� Energy Saving : 280,120 KWH/Year
4.1 Washing Machine Power Consumption optimization
© Confederation of Indian Industry
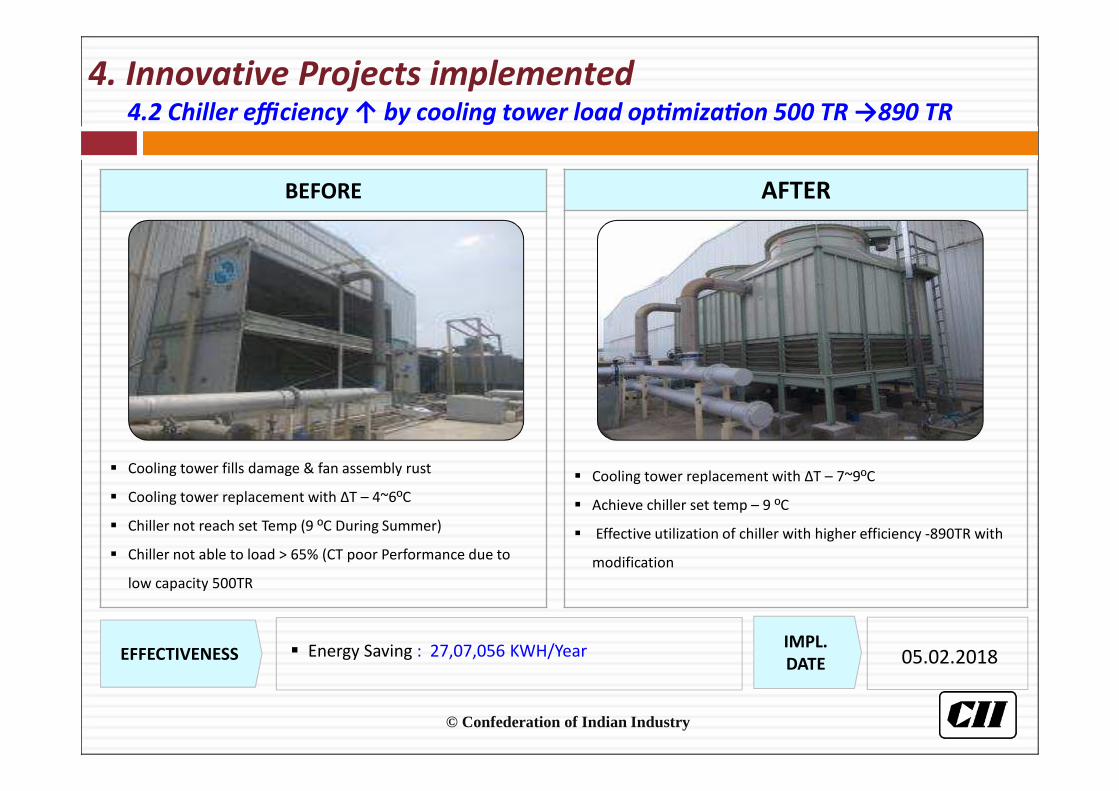
4. Innovative Projects implemented
AFTER
� Cooling tower replacement with ΔT – 7~9ºC
� Achieve chiller set temp – 9 ºC
� Effective utilization of chiller with higher efficiency -890TR with
modification
BEFORE
� Cooling tower fills damage & fan assembly rust
� Cooling tower replacement with ΔT – 4~6ºC
� Chiller not reach set Temp (9 ºC During Summer)
� Chiller not able to load > 65% (CT poor Performance due to
low capacity 500TR
EFFECTIVENESSIMPL.
DATE 05.02.2018� Energy Saving : 27,07,056 KWH/Year
4.2 Chiller efficiency ↑ by cooling tower load op5miza5on 500 TR →890 TR

© Confederation of Indian Industry
4. Innovative Projects implemented
AFTER
� Skid weight reduction 20.90kgs /skids.
� Revised paint curing schedule : 140C X 15 Mins
� Propane expected saving : 6.60 kg/car reduction
� Total saving in propane : 0.31kg/car.
BEFORE
� Common standardization of Skid through PA & RBI model
modification
� Existing paint curing schedule : 160ºC X 10 mins
� Propane usage : 6.91 kg /car
EFFECTIVENESSIMPL.
DATE 15.12.2017� Energy Saving : 142 Tons/ Year
4.3 Propane consumption optimization in Paint shop Oven
© Confederation of Indian Industry
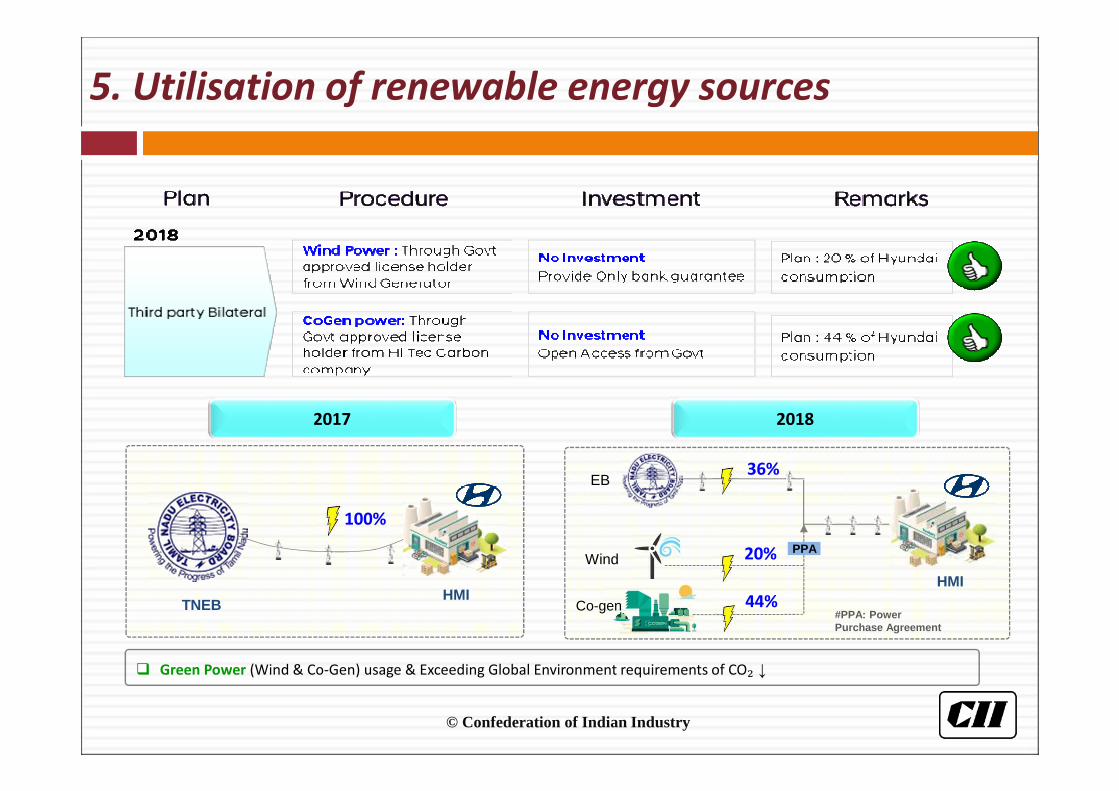
5. Utilisation of renewable energy sources
� Green Power (Wind & Co-Gen) usage & Exceeding Global Environment requirements of CO₂ ↓
PPA
100%
36%EB
Wind
Co-gen
2017
TNEBHMI
HMI
#PPA: Power Purchase Agreement
2018
20%
44%
© Confederation of Indian Industry
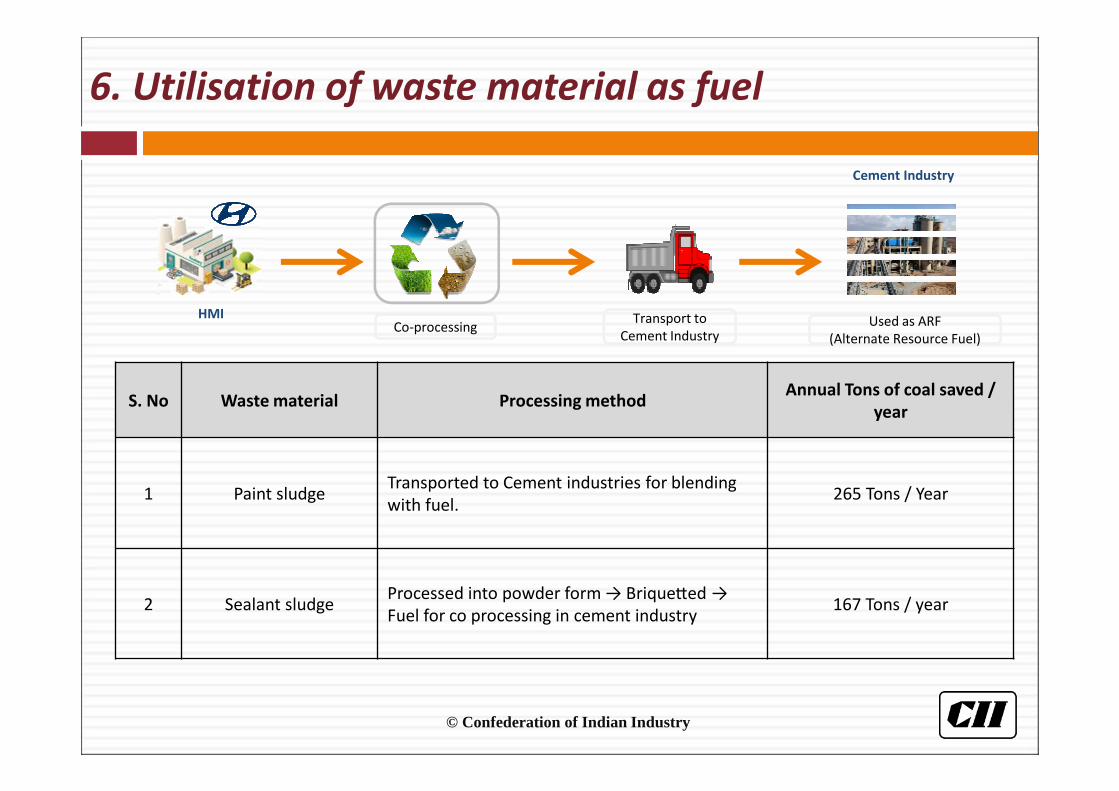
6. Utilisation of waste material as fuel
S. No Waste material Processing methodAnnual Tons of coal saved /
year
1 Paint sludgeTransported to Cement industries for blending
with fuel.265 Tons / Year
2 Sealant sludgeProcessed into powder form → BriqueUed →
Fuel for co processing in cement industry167 Tons / year
Co-processing Transport to
Cement IndustryUsed as ARF
(Alternate Resource Fuel)
HMI
Cement Industry
© Confederation of Indian Industry
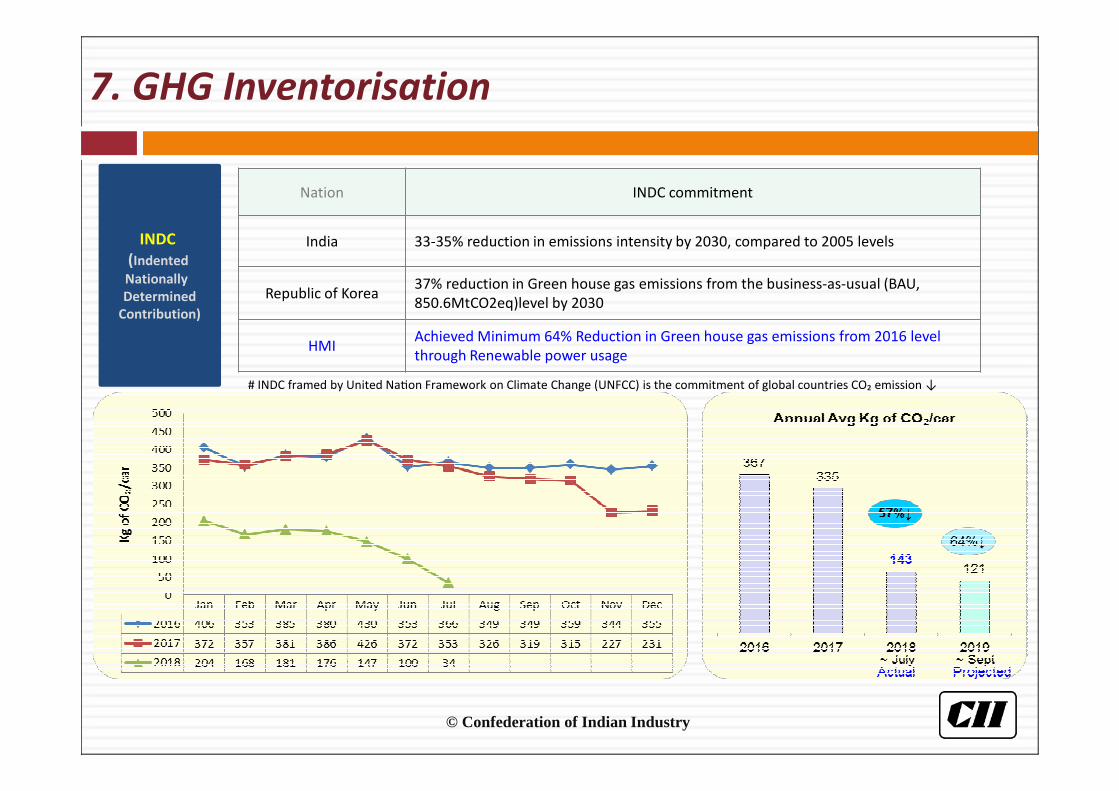
7. GHG Inventorisation
INDC
(Indented
Nationally
Determined
Contribution)
# INDC framed by United NaLon Framework on Climate Change (UNFCC) is the commitment of global countries CO₂ emission ↓
Nation INDC commitment
India 33-35% reduction in emissions intensity by 2030, compared to 2005 levels
Republic of Korea37% reduction in Green house gas emissions from the business-as-usual (BAU,
850.6MtCO2eq)level by 2030
HMIAchieved Minimum 64% Reduction in Green house gas emissions from 2016 level
through Renewable power usage

© Confederation of Indian Industry
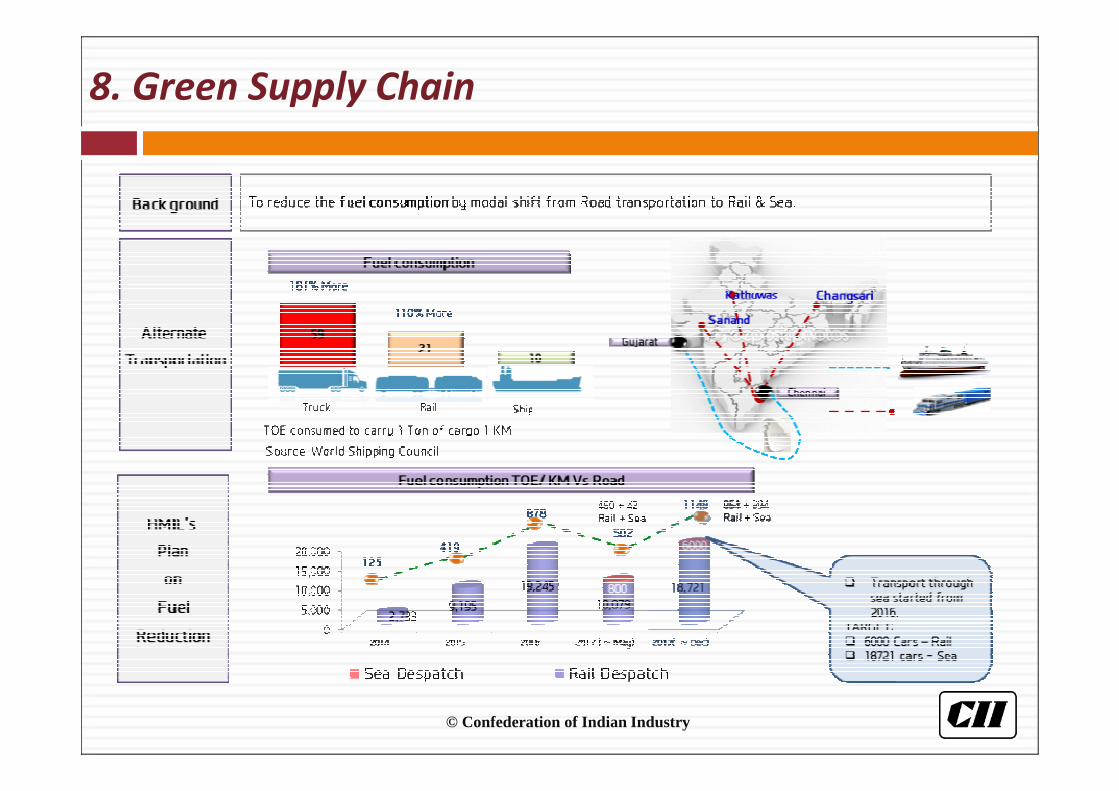
8. Green Supply Chain
Identify Movement
intensive Parts
Identify methods to
reduce burden
1. Remove unnecessary
items on the way
2. Open additional gates
Move parts closer
1. Enhance lineside storage
• Space for more Gravity
feeding Conveyor
2. Supply vs. Assy sequence
synchronization
Increase feeding quantity
1. Optimize loose stuffing
2. Change packing material
Reduce bin size for same
quantity1. Systemized feeding techniques
2. Similar job activities to be
identified
3. Identifying unproductive
activities
Job reallocation
Target :
877 km/day
Actual :
984 km/day
2015 2016 2017
884
9
829
6 741
9
In Kms/day In Kms/day
6% �
(553 Kms)11 % �
(877 Kms)
In Kms/day
(121 %) (112%)
TREND 2017 PLAN Vs ACT ACHIEVEMENT
© Confederation of Indian Industry
8. Green Supply Chain
© Confederation of Indian Industry
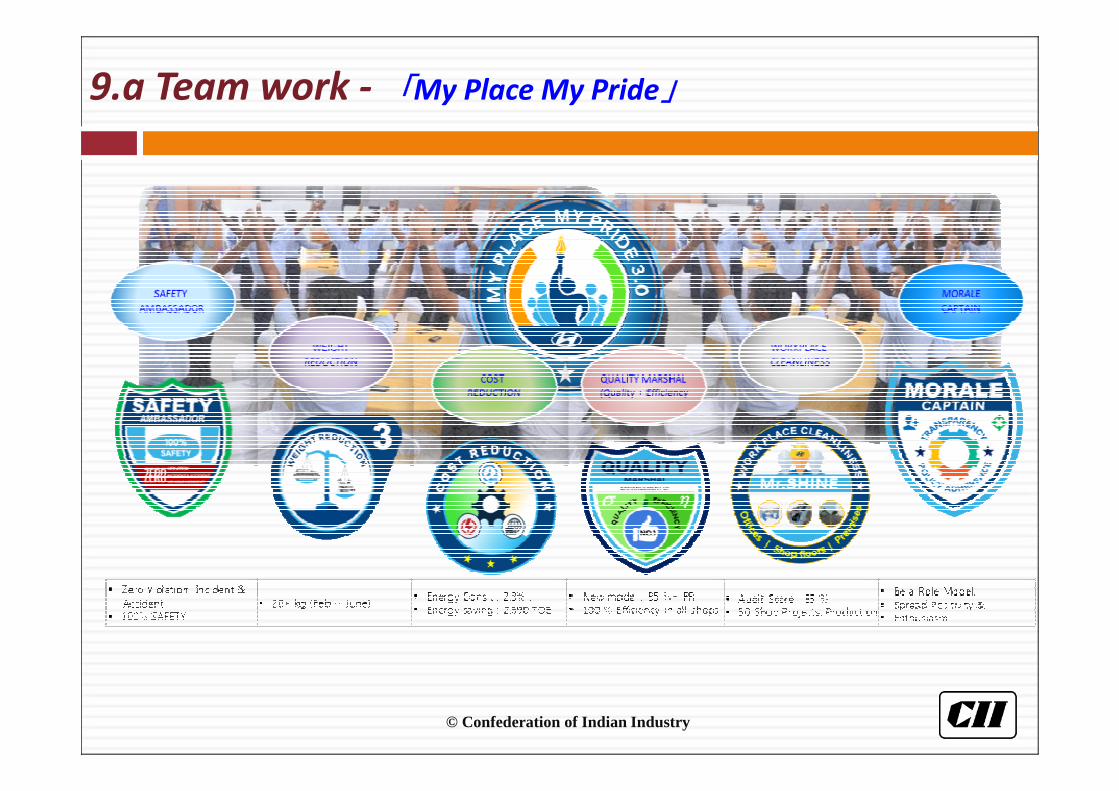
9.a Team work - 「My Place My Pride」
© Confederation of Indian Industry
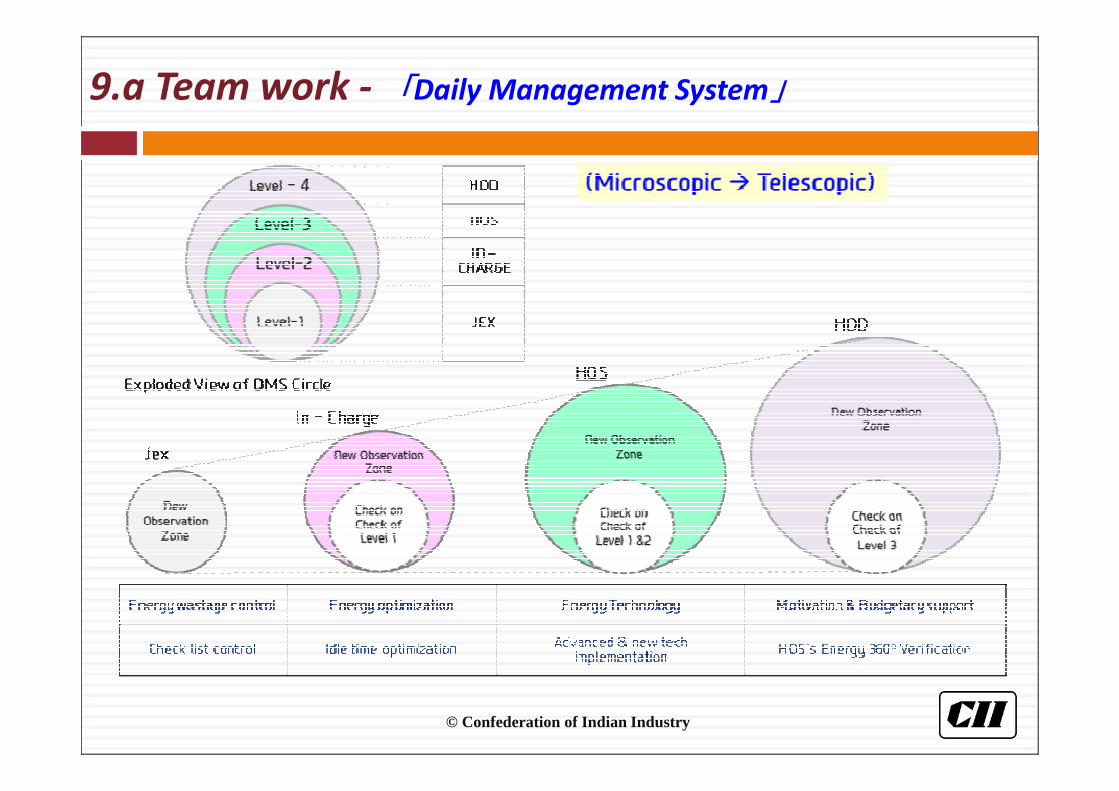
9.a Team work - 「Daily Management System」

© Confederation of Indian Industry
9.b Employee Involvement - 「Awareness」
Employee Awareness & Idea Generation
Drawing
Competition
for employee
Children
© Confederation of Indian Industry
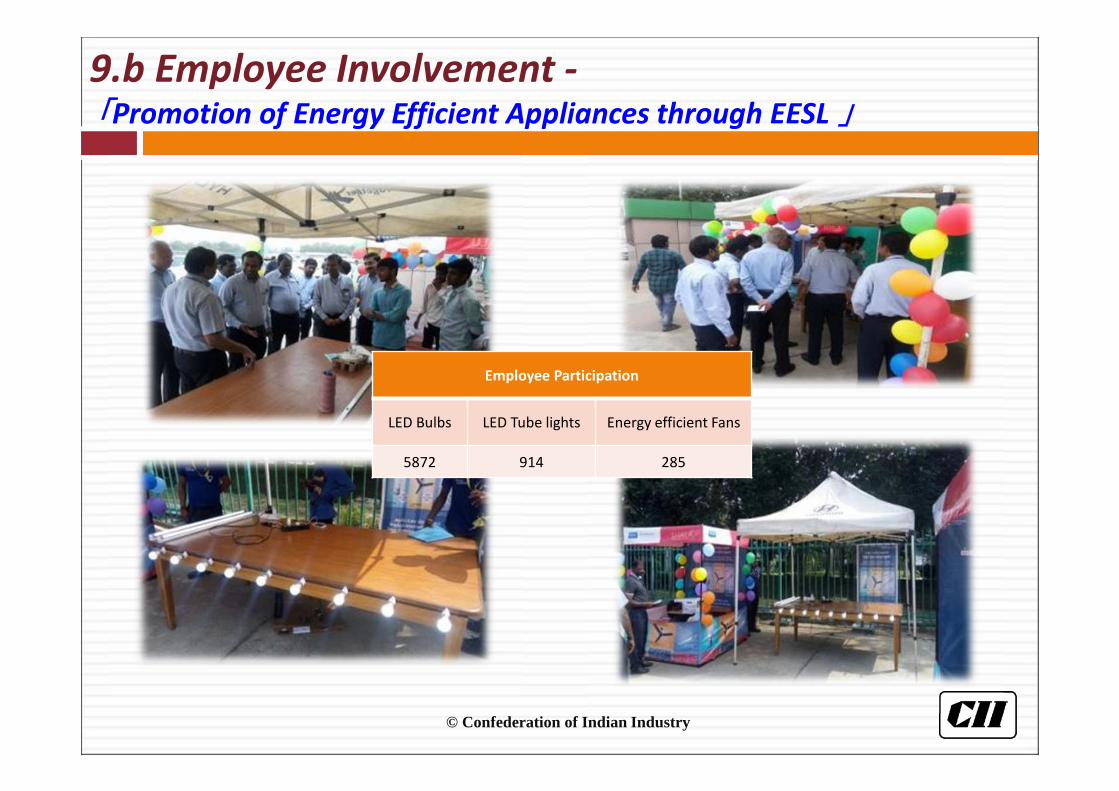
9.b Employee Involvement -「Promotion of Energy Efficient Appliances through EESL 」
Employee Participation
LED Bulbs LED Tube lights Energy efficient Fans
5872 914 285
© Confederation of Indian Industry
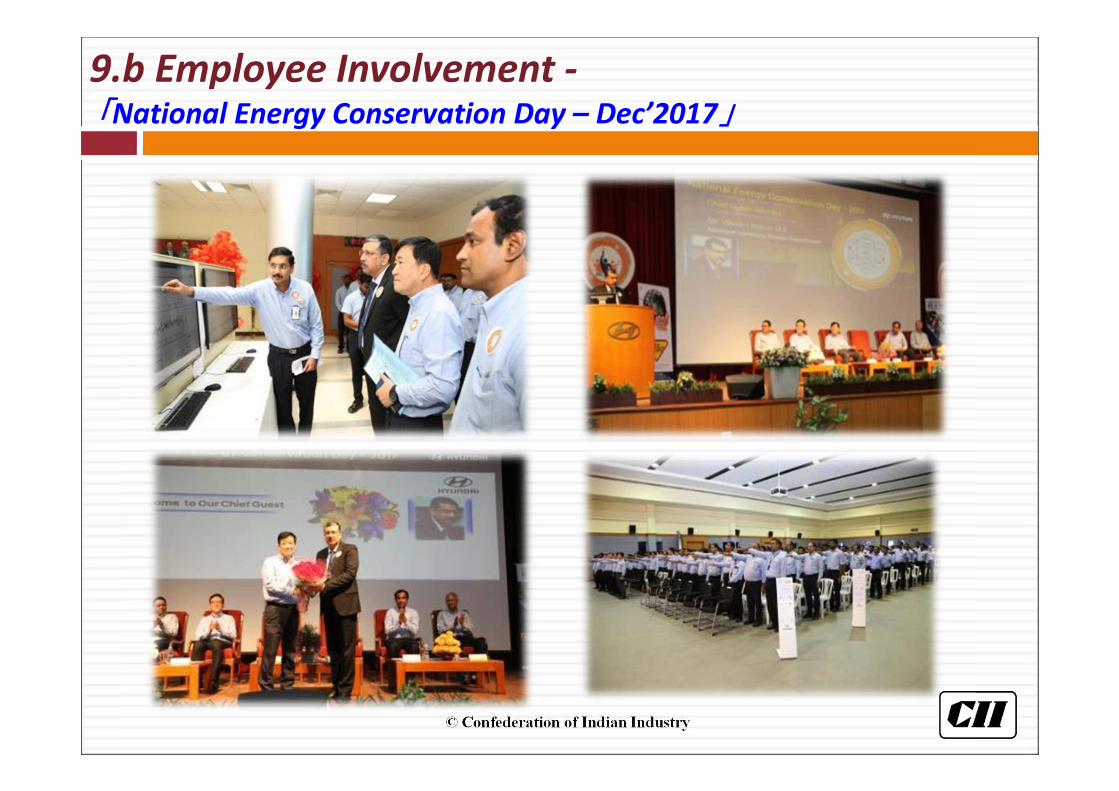
9.b Employee Involvement -「National Energy Conservation Day – Dec’2017」
© Confederation of Indian Industry
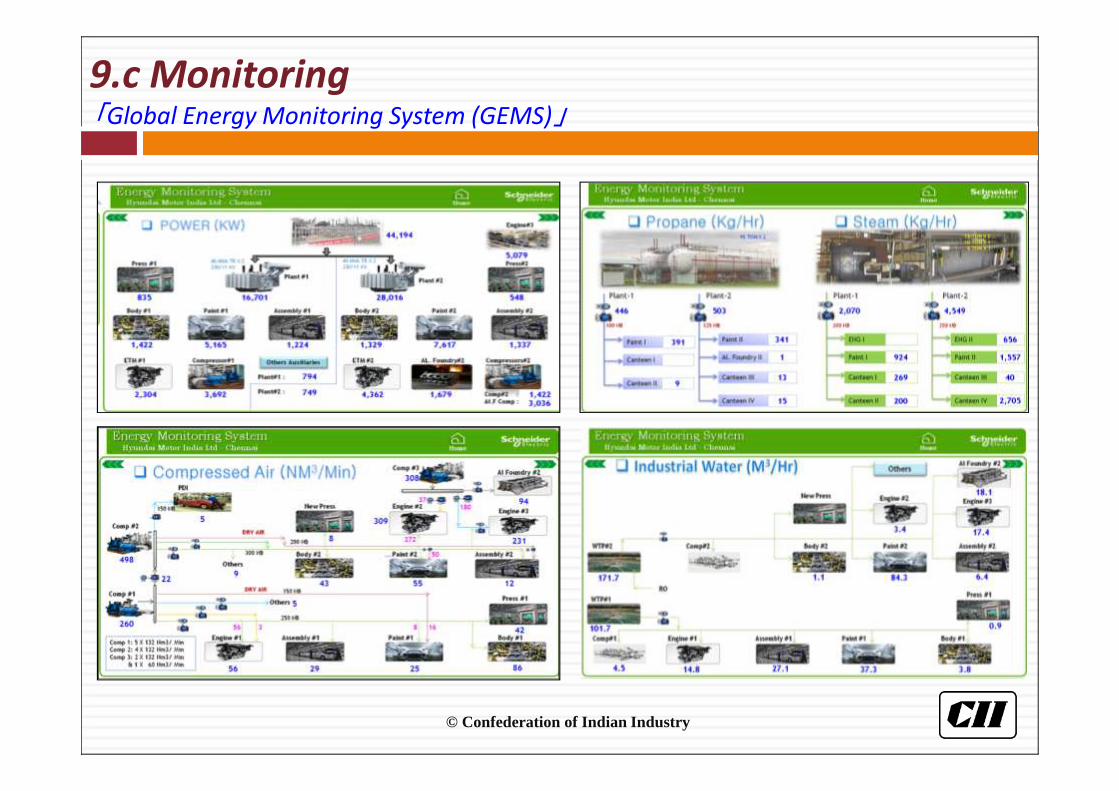
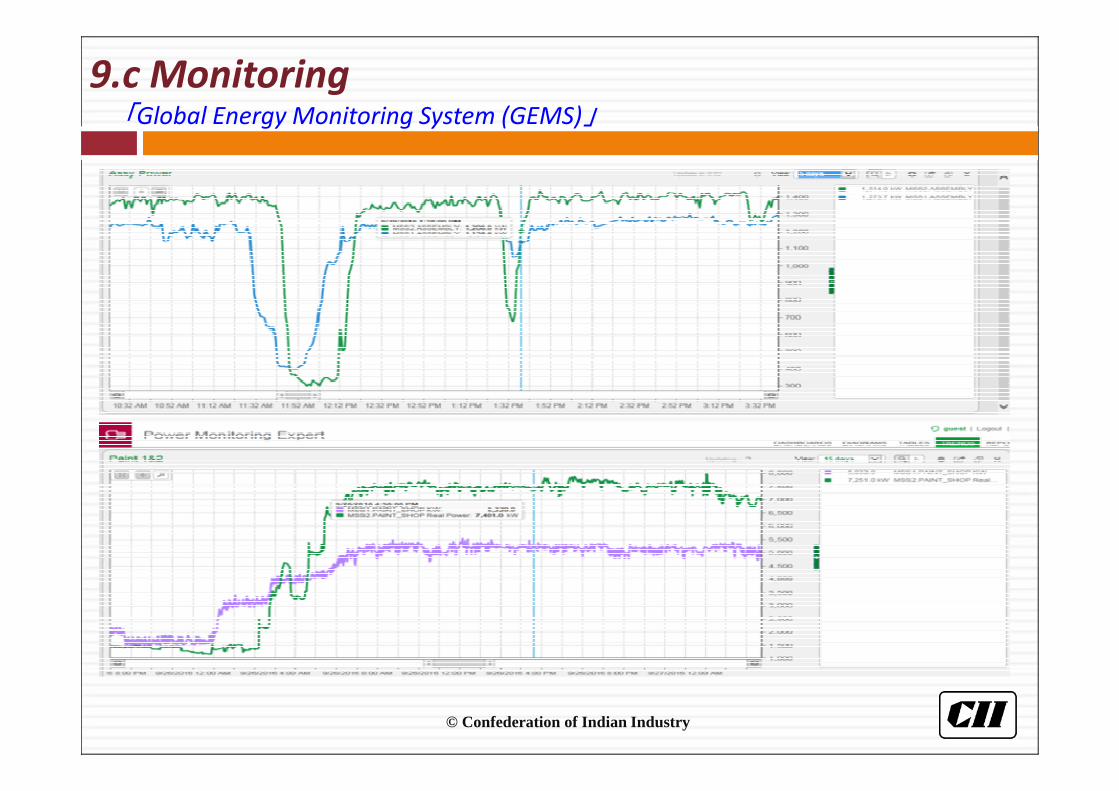
9.c Monitoring「Global Energy Monitoring System (GEMS)」
© Confederation of Indian Industry
9.c Monitoring「Global Energy Monitoring System (GEMS)」

© Confederation of Indian Industry
10. Implementation of ISO 50001「 Energy Management System (EnMS)」
Energy
Objectives
Till Dec’ 2017
Energy
Objectives
ISO 14001
Energy
Objectives
ISO 14001 ISO 50001
From Jan’2018
# HMI standardized its energy practices through ISO 50001
© Confederation of Indian Industry
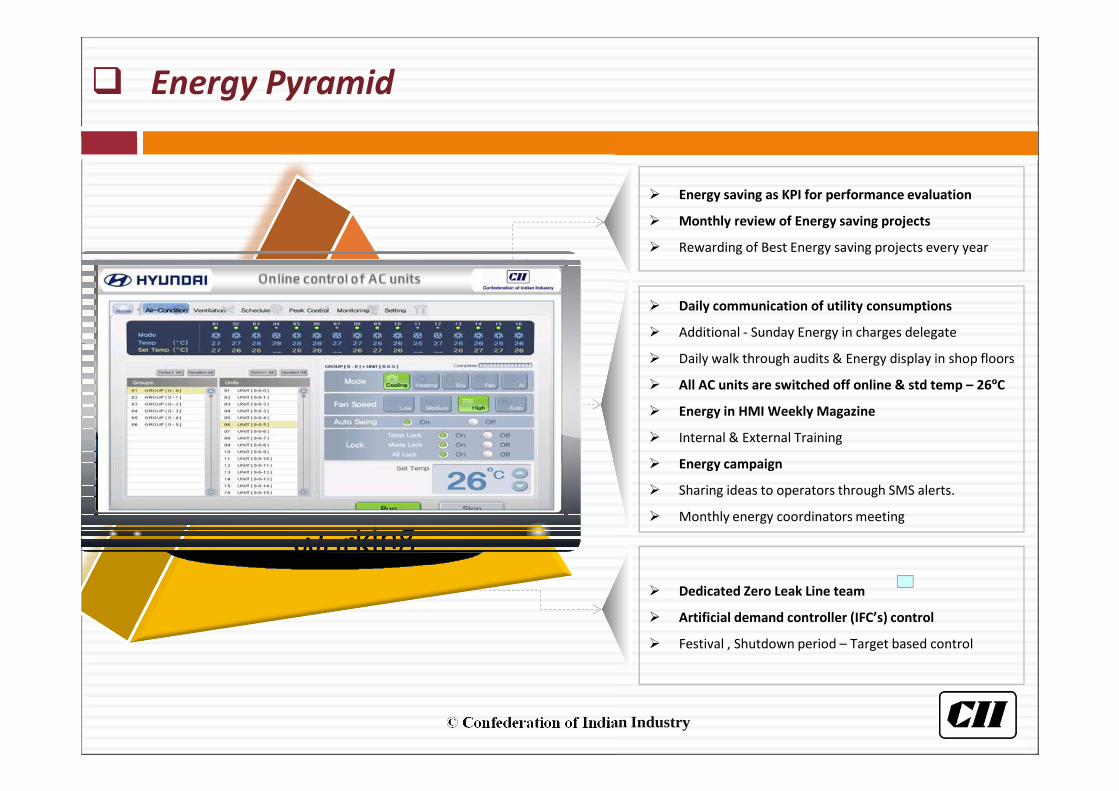
� Energy Pyramid
� Daily communication of utility consumptions
� Additional - Sunday Energy in charges delegate
� Daily walk through audits & Energy display in shop floors
� All AC units are switched off online & std temp – 26ºC
� Energy in HMI Weekly Magazine
� Internal & External Training
� Energy campaign
� Sharing ideas to operators through SMS alerts.
� Monthly energy coordinators meeting
� Energy saving as KPI for performance evaluation
� Monthly review of Energy saving projects
� Rewarding of Best Energy saving projects every year
� Dedicated Zero Leak Line team
� Artificial demand controller (IFC’s) control
� Festival , Shutdown period – Target based control

© Confederation of Indian Industry
Awarded as Global Best SEC in HMC Group
30
HMI2 & HMI1 Ranked first &
Second in global rating for
Specific energy consumption