Hydrometeorology of the Amazon in ERA-40
11
Hydrometeorology of the Amazon in ERA-40 ALAN K. BETTS AND JOHN H. BALL Atmospheric Research, Pittsford, Vermont PEDRO VITERBO ECMWF, Reading, United Kingdom AIGUO DAI NCAR,* Boulder, Colorado JOSÉ MARENGO CPTEC-INPE, Cachoeira Paulista, Sa ˜o Paulo, Brazil (Manuscript received 24 November 2004, in final form 2 March 2005) ABSTRACT The hydrometeorology of the Amazon basin in the ERA-40 reanalysis for 1958–2001 is compared with observations of precipitation, temperature, and streamflow. After 1979, the reanalysis over the Amazon has a small cool bias of the order of 0.35 K, and a small low bias of precipitation of the order of 0.3 mm day 1 . In the early years (1958–72), there is a large upward drift in reanalysis precipitation and runoff associated with an upward drift in the atmospheric water vapor in the analysis, and a somewhat smaller downward drift of temperature as precipitation increases. In the presatellite data, there are inhomogeneities in the radiosonde and surface synoptic data, and there were problems with the variational analysis of humidity once satellite radiances were introduced. Approximate bias corrections can be made for precipi- tation and runoff on an annual basis, but this also removes some of the interannual variability. The reanalysis runoff–precipitation relationship is similar to the observed streamflow–precipitation relation, on an annual water-year basis. Compared to observations, ERA-40 precipitation for the Amazon is low by about 1.3 mm day 1 in the rainy season, and high by a smaller amount in the dry season. The precipitation bias produces a temperature bias in ERA-40 of the opposite sign on the annual time scale. The reanalysis has a small cold temperature bias after 1967, but on an annual time scale it reproduces the interannual variability of the observations. Although the biases in temperature and precipitation in recent decades are small, the difficulties with the analysis of atmospheric water vapor lead to large uncertainty in long-term trends of the water cycle. 1. Introduction One of the objectives of the Large-Scale Biosphere– Atmosphere Experiment (LBA) is to assess how the Amazon functions as part of the climate system (Silva Dias et al. 2002). Data covering the entire Amazon basin are sparse, so we depend on models both for data synthesis and to quantify the energy and water cycle. LBA is a component of the Global Energy and Water Cycle Experiment (GEWEX), which has the aim of improving our ability to simulate both water and energy exchange processes in global climate and weather mod- els. One critical question for climate studies is whether the interannual variability and decadal drifts of the wa- ter cycle are well-represented in reanalyses. On a global scale, Trenberth and Guillemot (1998) have evaluated the atmospheric moisture and hydrological cycle in the first National Centers for Environmental Prediction– National Center for Atmospheric Research (NCEP– NCAR) reanalysis (Kalnay et al. 1996). Costa and Fo- * The National Center for Atmospheric Research is sponsored by the U.S. National Science Foundation. Corresponding author address: Alan K. Betts, Atmospheric Re- search, 58 Hendee Lane, Pittsford, VT 05763. E-mail: [email protected] 764 JOURNAL OF HYDROMETEOROLOGY VOLUME 6 © 2005 American Meteorological Society JHM441
Transcript of Hydrometeorology of the Amazon in ERA-40
Hydrometeorology of the Amazon in ERA-40
ALAN K. BETTS AND JOHN H. BALL
Atmospheric Research, Pittsford, Vermont
PEDRO VITERBO
ECMWF, Reading, United Kingdom
AIGUO DAI
NCAR,* Boulder, Colorado
JOSÉ MARENGO
CPTEC-INPE, Cachoeira Paulista, Sao Paulo, Brazil
(Manuscript received 24 November 2004, in final form 2 March 2005)
ABSTRACT
The hydrometeorology of the Amazon basin in the ERA-40 reanalysis for 1958–2001 is compared withobservations of precipitation, temperature, and streamflow. After 1979, the reanalysis over the Amazonhas a small cool bias of the order of �0.35 K, and a small low bias of precipitation of the order of �0.3mm day�1. In the early years (1958–72), there is a large upward drift in reanalysis precipitation and runoffassociated with an upward drift in the atmospheric water vapor in the analysis, and a somewhat smallerdownward drift of temperature as precipitation increases. In the presatellite data, there are inhomogeneitiesin the radiosonde and surface synoptic data, and there were problems with the variational analysis ofhumidity once satellite radiances were introduced. Approximate bias corrections can be made for precipi-tation and runoff on an annual basis, but this also removes some of the interannual variability. Thereanalysis runoff–precipitation relationship is similar to the observed streamflow–precipitation relation, onan annual water-year basis. Compared to observations, ERA-40 precipitation for the Amazon is low byabout 1.3 mm day�1 in the rainy season, and high by a smaller amount in the dry season. The precipitationbias produces a temperature bias in ERA-40 of the opposite sign on the annual time scale. The reanalysishas a small cold temperature bias after 1967, but on an annual time scale it reproduces the interannualvariability of the observations. Although the biases in temperature and precipitation in recent decades aresmall, the difficulties with the analysis of atmospheric water vapor lead to large uncertainty in long-termtrends of the water cycle.
1. Introduction
One of the objectives of the Large-Scale Biosphere–Atmosphere Experiment (LBA) is to assess how theAmazon functions as part of the climate system (SilvaDias et al. 2002). Data covering the entire Amazon
basin are sparse, so we depend on models both for datasynthesis and to quantify the energy and water cycle.LBA is a component of the Global Energy and WaterCycle Experiment (GEWEX), which has the aim ofimproving our ability to simulate both water and energyexchange processes in global climate and weather mod-els. One critical question for climate studies is whetherthe interannual variability and decadal drifts of the wa-ter cycle are well-represented in reanalyses. On a globalscale, Trenberth and Guillemot (1998) have evaluatedthe atmospheric moisture and hydrological cycle in thefirst National Centers for Environmental Prediction–National Center for Atmospheric Research (NCEP–NCAR) reanalysis (Kalnay et al. 1996). Costa and Fo-
* The National Center for Atmospheric Research is sponsoredby the U.S. National Science Foundation.
Corresponding author address: Alan K. Betts, Atmospheric Re-search, 58 Hendee Lane, Pittsford, VT 05763.E-mail: [email protected]
764 J O U R N A L O F H Y D R O M E T E O R O L O G Y VOLUME 6
© 2005 American Meteorological Society
JHM441
ley (1999), using data from the same reanalysis, suggestthat the atmospheric transport of water vapor throughthe Amazon basin has decreased in the 20 yr, 1976–96.Roads et al. (2002) analyze the water and energy bud-gets for the continental-scale experiments using the sec-ond NCAR/U.S. Department of Energy (DOE) re-analysis. Zeng (1999) discusses the seasonal cycle andinterannual variability from the NASA Goddard EarthObserving System reanalysis (GEOS-1). Marengo(2005) uses the NCEP–NCAR reanalysis, together withprecipitation and streamflow data, to describe the hy-drometeorology of the Amazon during recent decades.This paper addresses the limited task of describing thehydrometeorology over the Amazon in the recent Eu-ropean Centre for Medium-Range Weather Forecasts(ECMWF) reanalysis. In a separate paper (Betts andViterbo 2005), we use the model data to analyze thecoupling of the land surface, the boundary layer, andthe cloud fields over the Amazon, extending the workof Betts (2004).
This paper is one of several using the recent ECMWFreanalysis (Simmons and Gibson 2000) to study differ-ent river basins. This was designated ERA-40, althoughit was extended to cover the 45 yr from September 1957to August 2002. The analysis system uses a recent ver-sion of the model physics, including the land surfacescheme described in Van den Hurk et al. (2000), and a3D variational assimilation system. The horizontalresolution of the spectral model is triangular truncationat TL-159, and there are 60 levels in the vertical, includ-ing a well-resolved boundary layer and stratosphere.Documentation of the Integrated Forecast System,cycle 23r4, and a summary and discussion of the obser-vations available at different times during the 40-yr re-analysis can be found online at http://www.ecmwf.int/research/era/. Surface energy and water budgets, andnear-surface and subsurface variables averaged overriver basins, are computed and archived (Kållberg et al.2004) during the analysis cycle at an hourly time scale.Two earlier papers have assessed the systematic biasesin temperature and the surface energy and water bud-gets of ERA-40 for the Mississippi and MackenzieRiver basins (Betts et al. 2003a,b).
2. Data sources
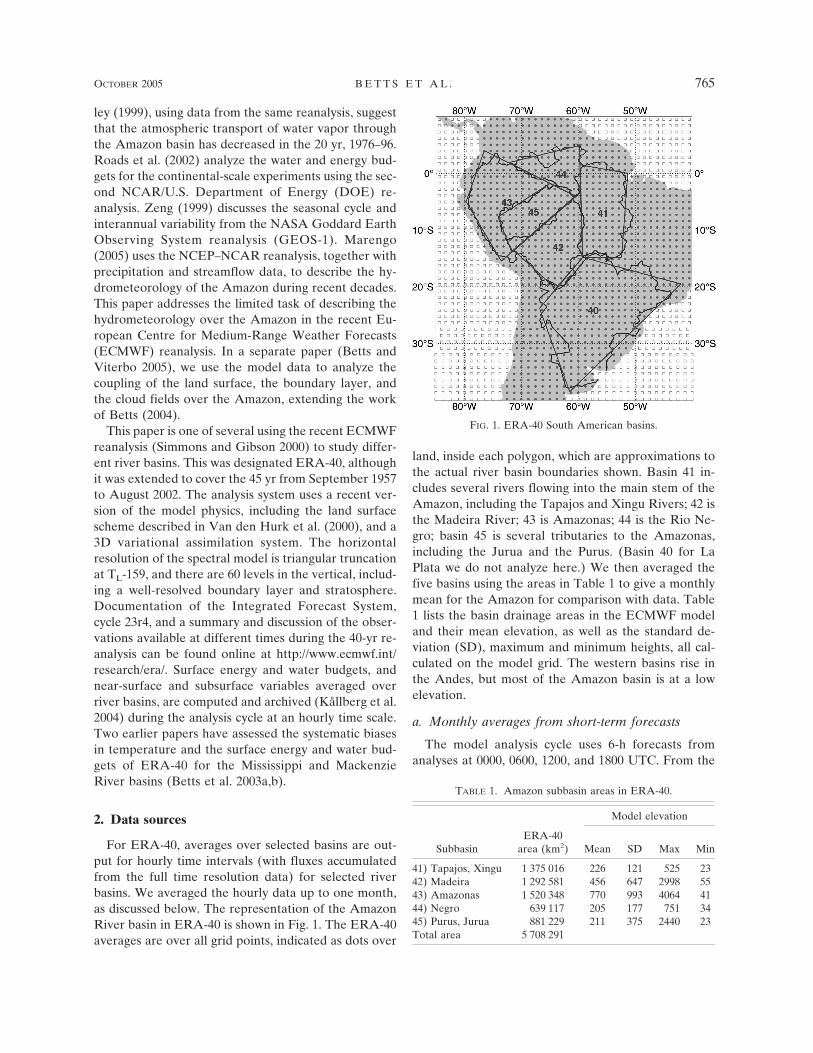
For ERA-40, averages over selected basins are out-put for hourly time intervals (with fluxes accumulatedfrom the full time resolution data) for selected riverbasins. We averaged the hourly data up to one month,as discussed below. The representation of the AmazonRiver basin in ERA-40 is shown in Fig. 1. The ERA-40averages are over all grid points, indicated as dots over
land, inside each polygon, which are approximations tothe actual river basin boundaries shown. Basin 41 in-cludes several rivers flowing into the main stem of theAmazon, including the Tapajos and Xingu Rivers; 42 isthe Madeira River; 43 is Amazonas; 44 is the Rio Ne-gro; basin 45 is several tributaries to the Amazonas,including the Jurua and the Purus. (Basin 40 for LaPlata we do not analyze here.) We then averaged thefive basins using the areas in Table 1 to give a monthlymean for the Amazon for comparison with data. Table1 lists the basin drainage areas in the ECMWF modeland their mean elevation, as well as the standard de-viation (SD), maximum and minimum heights, all cal-culated on the model grid. The western basins rise inthe Andes, but most of the Amazon basin is at a lowelevation.
a. Monthly averages from short-term forecasts
The model analysis cycle uses 6-h forecasts fromanalyses at 0000, 0600, 1200, and 1800 UTC. From the
FIG. 1. ERA-40 South American basins.
TABLE 1. Amazon subbasin areas in ERA-40.
Model elevation
SubbasinERA-40
area (km2) Mean SD Max Min
41) Tapajos, Xingu 1 375 016 226 121 525 2342) Madeira 1 292 581 456 647 2998 5543) Amazonas 1 520 348 770 993 4064 4144) Negro 639 117 205 177 751 3445) Purus, Jurua 881 229 211 375 2440 23Total area 5 708 291
OCTOBER 2005 B E T T S E T A L . 765

0000 and 1200 UTC analyses, forecasts were extendedto 36 h. Monthly averages were constructed from twice-daily segments of the 0–12, 12–24, and 24–36-h fore-casts, verifying at the same time. We shall mostly showmonthly means from pairs of 0–12-h forecasts (FX)from the 0000 and 1200 UTC analyses, and only showthe 24–36-h FX in a discussion of the spinup of themodel precipitation and evaporation. We also con-structed monthly averages from the four 6-hourly seg-ments of the analysis cycle, which we shall use to showthe modification of soil moisture in the analysis cycle.For a few years (1958, 1973, 1989–94), which were at thebeginning of the separate ERA-40 analysis streams, ba-sin averages of the 0600 and 1800 UTC 6-h forecastswere not archived, so we do not have a complete waterbudget for the analysis cycle. Fortunately, combiningthe two 0–12-h forecasts from 0000 and 1200 UTC givesalmost the same daily precipitation fluxes as combiningthe four 0–6-h forecasts, so we use these.
b. Distribution of vegetation in ERA-40
The land-surface scheme in ERA-40 has separatetiles for high (i.e., forests) and low-vegetation classesthat are treated differently (Van den Hurk et al. 2000).In ERA-40, each grid square has a fraction and type ofboth high and low vegetation. Table 2 shows the modelvegetation classes in the Amazon basin (with their iden-tifying numbers in square brackets) and their distribu-tion by class and basin. Basins 41, 44, and 45 are morethan 90% forested, while basins 42 and 43 have about15% low vegetation.
c. Amazon basin estimates of temperature,precipitation, and river flow
The observations available to evaluate the model arelimited, since data is sparse. Our monthly temperaturetime series is from Jones and Moberg (2003), and ourprimary monthly precipitation time series is from Chen
et al. (2002): these were area-averaged over the Ama-zon basin by Dai et al. (2004). We have a separateestimate of annual precipitation from Marengo(2004, 2005), who used 164 stations across the Amazonbasin to derive a mean precipitation for the period1970–98. Both precipitation time series have similarmean values: 5.8 mm day�1 for the corresponding pe-riod of 1970–98, but they differ significantly in theirtotal precipitation for some years. For streamflow, weused the data from Marengo (2005) derived fromstreamflow measurements at Obidos, which have amean of 2.6 mm day�1 for the period 1970–98.
3. Comparison of ERA-40 water budget withobservations
The concept behind renanalysis is to use one recent“frozen” data assimilation system to cover the entireperiod, in contrast to operational analyses in which themodeling system is revised on a frequent basis (as im-proved numerical or data assimilation schemes andphysical parameterizations are introduced, along withincreases in resolution). However, although the modelis frozen, the data going into the reanalysis has changedmarkedly over the years from 1958 to 2001, and this hasa major impact on the analyses. There are three impor-tant epochs in ERA-40: 1958–72, “before satellitedata,” when the upper-air analysis depends on thesounding data; 1973–86, starting with the assimilation ofthe radiances from the first satellite infrared channelson the Vertical Temperature Profiler Radiometer(VTPR) and from late 1978 infrared and microwavesounders from the Television and Infrared Observa-tional Satellite Operational Vertical Sounder (TOVS)suite of instruments; 1987–2001, with the addition ofinformation of radiances from the satellite microwavechannels of the Special Sensor Microwave Imager(SSM/I) to the atmospheric water vapor assimilationover the ocean.
As satellites are replaced, they are compared duringtheir overlap period, and bias corrections are intro-duced for each satellite. However, these corrections donot remove all the inhomogeneities in the record.There are changes in the conventional data: in particu-lar, there are very few Brazilian radisosondes north of20°S before May 1966. In addition, there are fundamen-tal problems in ERA-40 in the variational analysis overthe tropical oceans in areas of high-density observa-tions, such as satellite radiances (Troccoli and Kållberg2004), which impact precipitation over the tropicaloceans, as well as over land. Aerosols from volcaniceruptions, such as Pinatubo in 1991/92, affect the infra-red emission, and have not been properly accounted
TABLE 2. Distribution of vegetation across the Amazon inERA-40 as % of basin.
Basin 41 42 43 44 45
High vegetation 94 85 83 93 97Deciduous broadleaf [5] 3Evergreen broadleaf [6] 80 5 78 91 97Interrupted forest [19] 14 77 5 2
Low vegetation 6 15 17 7 3Crops/mixed farming [1] 1 2 5 0 0Short grass [2] 0 3 4 0 0Tall grass [7] 4 9 7 6 3Tundra [9] 0Deciduous shrubs [17] 0
766 J O U R N A L O F H Y D R O M E T E O R O L O G Y VOLUME 6
for. In the next sections, we show how the model pre-cipitation has changed markedly with time, and how itis closely related to the atmospheric moisture analysis.
a. Change of ERA-40 Amazon annual precipitationand runoff with time
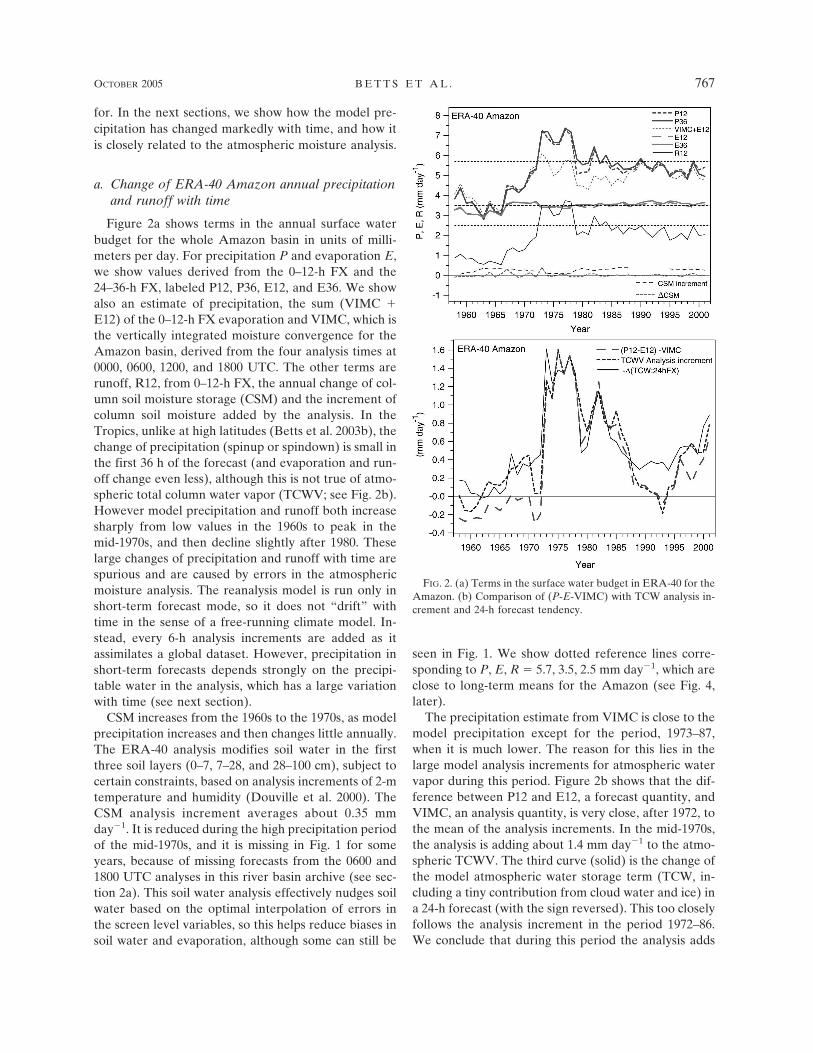
Figure 2a shows terms in the annual surface waterbudget for the whole Amazon basin in units of milli-meters per day. For precipitation P and evaporation E,we show values derived from the 0–12-h FX and the24–36-h FX, labeled P12, P36, E12, and E36. We showalso an estimate of precipitation, the sum (VIMC �E12) of the 0–12-h FX evaporation and VIMC, which isthe vertically integrated moisture convergence for theAmazon basin, derived from the four analysis times at0000, 0600, 1200, and 1800 UTC. The other terms arerunoff, R12, from 0–12-h FX, the annual change of col-umn soil moisture storage (CSM) and the increment ofcolumn soil moisture added by the analysis. In theTropics, unlike at high latitudes (Betts et al. 2003b), thechange of precipitation (spinup or spindown) is small inthe first 36 h of the forecast (and evaporation and run-off change even less), although this is not true of atmo-spheric total column water vapor (TCWV; see Fig. 2b).However model precipitation and runoff both increasesharply from low values in the 1960s to peak in themid-1970s, and then decline slightly after 1980. Theselarge changes of precipitation and runoff with time arespurious and are caused by errors in the atmosphericmoisture analysis. The reanalysis model is run only inshort-term forecast mode, so it does not “drift” withtime in the sense of a free-running climate model. In-stead, every 6-h analysis increments are added as itassimilates a global dataset. However, precipitation inshort-term forecasts depends strongly on the precipi-table water in the analysis, which has a large variationwith time (see next section).
CSM increases from the 1960s to the 1970s, as modelprecipitation increases and then changes little annually.The ERA-40 analysis modifies soil water in the firstthree soil layers (0–7, 7–28, and 28–100 cm), subject tocertain constraints, based on analysis increments of 2-mtemperature and humidity (Douville et al. 2000). TheCSM analysis increment averages about 0.35 mmday�1. It is reduced during the high precipitation periodof the mid-1970s, and it is missing in Fig. 1 for someyears, because of missing forecasts from the 0600 and1800 UTC analyses in this river basin archive (see sec-tion 2a). This soil water analysis effectively nudges soilwater based on the optimal interpolation of errors inthe screen level variables, so this helps reduce biases insoil water and evaporation, although some can still be
seen in Fig. 1. We show dotted reference lines corre-sponding to P, E, R � 5.7, 3.5, 2.5 mm day�1, which areclose to long-term means for the Amazon (see Fig. 4,later).
The precipitation estimate from VIMC is close to themodel precipitation except for the period, 1973–87,when it is much lower. The reason for this lies in thelarge model analysis increments for atmospheric watervapor during this period. Figure 2b shows that the dif-ference between P12 and E12, a forecast quantity, andVIMC, an analysis quantity, is very close, after 1972, tothe mean of the analysis increments. In the mid-1970s,the analysis is adding about 1.4 mm day�1 to the atmo-spheric TCWV. The third curve (solid) is the change ofthe model atmospheric water storage term (TCW, in-cluding a tiny contribution from cloud water and ice) ina 24-h forecast (with the sign reversed). This too closelyfollows the analysis increment in the period 1972–86.We conclude that during this period the analysis adds
FIG. 2. (a) Terms in the surface water budget in ERA-40 for theAmazon. (b) Comparison of (P-E-VIMC) with TCW analysis in-crement and 24-h forecast tendency.
OCTOBER 2005 B E T T S E T A L . 767

TCWV, which is rained out in the first 24 h, whichincreases the model precipitation.
b. Comparison of ERA-40 precipitation and runoffwith observations for water years
The next two figures compare ERA-40 annual pre-cipitation and runoff with data for the Amazon. Ouryear is now the “water year,” running from Septemberto August, with the water year ending in August 1959labeled as 1959. Figure 3 (upper) shows (left-handscale) both annual precipitation and the bias of ERA-40 from the Dai et al. (2004) observational record (off-set by the 44-yr mean of 5.7 mm), and (right-hand scale)atmospheric total column water vapor. It is clear thatchanges in the model precipitation over the Amazonand the bias from observations are both closely corre-lated with changes in TCWV in the analysis, whichshows a large increase from the 1960s to the mid-1970s.The pattern of the TCWV analysis increments in Fig. 2bis also similar to the pattern of TCWV in Fig. 3a for theperiod 1973–86.
Figure 3b shows the regression lines for annual P andR and the bias of P from the observations againstTCWV. These large changes in TCWV during the pe-riod of ERA-40 are due to humidity analysis errors, notto real circulation changes (Troccoli and Kållberg2004). The large 1972/73 discontinuity occurs with theintroduction of the humidity radiance channel on thefirst VTPR satellite. There was a fundamental problemin the variational analysis of humidity over the tropicaloceans in areas of high-density satellite radiance obser-vations. Troccoli and Kållberg (2004) propose amethod to correct oceanic precipitation, which showssignificant but smaller changes with time, linked to theoverall usage of remote sensing information. The timetrends shown here over the Amazon can also be seen athigh latitudes over the Mackenzie River basin (Betts etal. 2003b). The smaller discontinuity in ERA-40 be-tween 1966 and 1967 in Amazonian P and TCWV (andE in Fig. 2a) may be linked to a major change in theconventional data. Before May 1966, there are very fewBrazilian radiosondes in ERA-40 north of 20°S (al-though there is pilot balloon data), and the Braziliansurface synoptic data are not included before January1967.
However, since the bias of the model precipitationfrom observations appears linearly related to TCWV(lower curve in Fig. 3b), a linear correction, based onthe slope of the regression lines in Fig. 3b, will removemuch of the model bias in annual P and E. Noting thatat TCWV � 44.8 kg m�2, the model precipitation biasis zero (from the Dai et al. 2004 mean, representative of
the period after 1980), we applied these corrections tothe reanalysis annual precipitation and runoff
Pc � P � 0.40 × �TCWV � 44.8� �1�
Rc � R � 0.32 × �TCWV � 44.8�. �2�
For the recent period, 1980–2001, mean analysis TCWV� 44.1 kg m�2, so (1) increases precipitation by about0.3 mm day�1, bringing the model precipitation intoagreement with the Dai et al. mean for this period.
Figure 4a shows P, R, Pc, Rc corrected using (1), (2)together with observed annual precipitation, Pobs, fromDai et al. (2004) and precipitation and Amazon stream-flow, Sobs, from Marengo (2005). The correction re-moves the large spurious model changes between thedecades, but the residual annual variability of Pc, Rc isnot that well correlated with the observed Amazon an-nual precipitation and streamflow. We also show forcomparison the Southern Oscillation index (SOI), de-fined as the difference in sea level pressure betweenTahiti and Darwin (Trenberth 1984). Many previous
FIG. 3. (a) Annual precipitation, precipitation bias, and totalcolumn water vapor in ERA-40; (b) regression of annual precipi-tation, precipitation bias, and runoff against mean total columnwater vapor.
768 J O U R N A L O F H Y D R O M E T E O R O L O G Y VOLUME 6
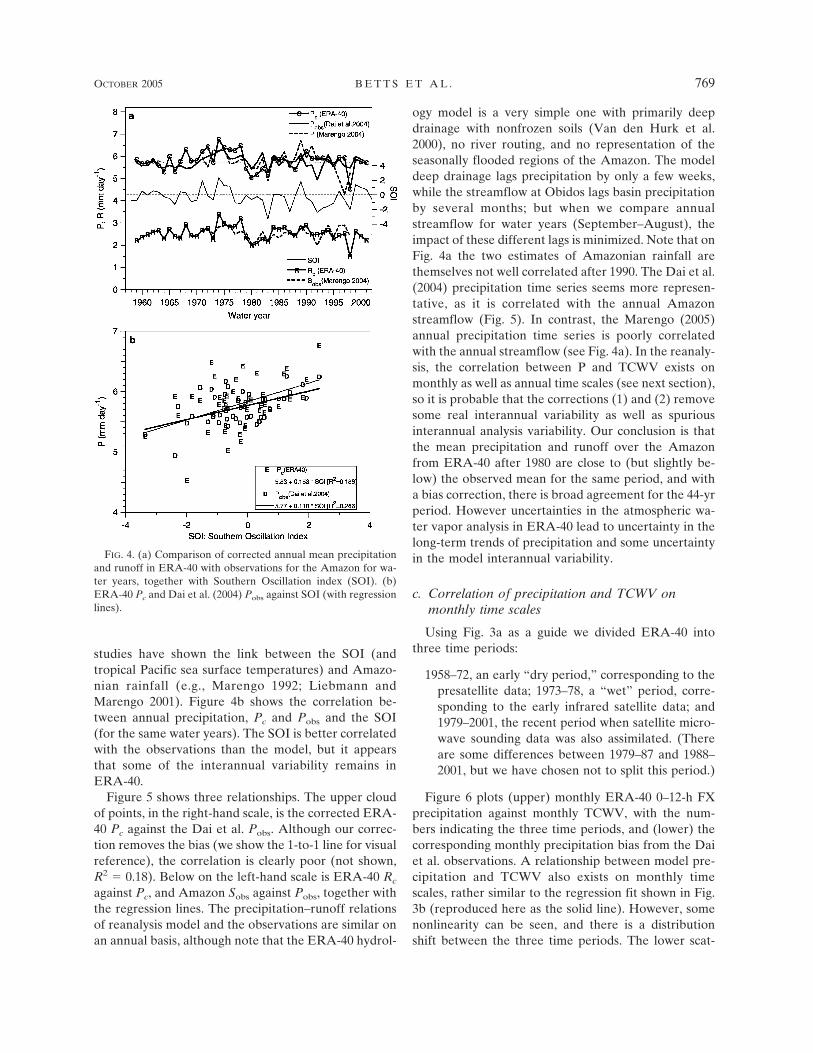
studies have shown the link between the SOI (andtropical Pacific sea surface temperatures) and Amazo-nian rainfall (e.g., Marengo 1992; Liebmann andMarengo 2001). Figure 4b shows the correlation be-tween annual precipitation, Pc and Pobs and the SOI(for the same water years). The SOI is better correlatedwith the observations than the model, but it appearsthat some of the interannual variability remains inERA-40.
Figure 5 shows three relationships. The upper cloudof points, in the right-hand scale, is the corrected ERA-40 Pc against the Dai et al. Pobs. Although our correc-tion removes the bias (we show the 1-to-1 line for visualreference), the correlation is clearly poor (not shown,R2 � 0.18). Below on the left-hand scale is ERA-40 Rc
against Pc, and Amazon Sobs against Pobs, together withthe regression lines. The precipitation–runoff relationsof reanalysis model and the observations are similar onan annual basis, although note that the ERA-40 hydrol-
ogy model is a very simple one with primarily deepdrainage with nonfrozen soils (Van den Hurk et al.2000), no river routing, and no representation of theseasonally flooded regions of the Amazon. The modeldeep drainage lags precipitation by only a few weeks,while the streamflow at Obidos lags basin precipitationby several months; but when we compare annualstreamflow for water years (September–August), theimpact of these different lags is minimized. Note that onFig. 4a the two estimates of Amazonian rainfall arethemselves not well correlated after 1990. The Dai et al.(2004) precipitation time series seems more represen-tative, as it is correlated with the annual Amazonstreamflow (Fig. 5). In contrast, the Marengo (2005)annual precipitation time series is poorly correlatedwith the annual streamflow (see Fig. 4a). In the reanaly-sis, the correlation between P and TCWV exists onmonthly as well as annual time scales (see next section),so it is probable that the corrections (1) and (2) removesome real interannual variability as well as spuriousinterannual analysis variability. Our conclusion is thatthe mean precipitation and runoff over the Amazonfrom ERA-40 after 1980 are close to (but slightly be-low) the observed mean for the same period, and witha bias correction, there is broad agreement for the 44-yrperiod. However uncertainties in the atmospheric wa-ter vapor analysis in ERA-40 lead to uncertainty in thelong-term trends of precipitation and some uncertaintyin the model interannual variability.
c. Correlation of precipitation and TCWV onmonthly time scales
Using Fig. 3a as a guide we divided ERA-40 intothree time periods:
1958–72, an early “dry period,” corresponding to thepresatellite data; 1973–78, a “wet” period, corre-sponding to the early infrared satellite data; and1979–2001, the recent period when satellite micro-wave sounding data was also assimilated. (Thereare some differences between 1979–87 and 1988–2001, but we have chosen not to split this period.)
Figure 6 plots (upper) monthly ERA-40 0–12-h FXprecipitation against monthly TCWV, with the num-bers indicating the three time periods, and (lower) thecorresponding monthly precipitation bias from the Daiet al. observations. A relationship between model pre-cipitation and TCWV also exists on monthly timescales, rather similar to the regression fit shown in Fig.3b (reproduced here as the solid line). However, somenonlinearity can be seen, and there is a distributionshift between the three time periods. The lower scat-
FIG. 4. (a) Comparison of corrected annual mean precipitationand runoff in ERA-40 with observations for the Amazon for wa-ter years, together with Southern Oscillation index (SOI). (b)ERA-40 Pc and Dai et al. (2004) Pobs against SOI (with regressionlines).
OCTOBER 2005 B E T T S E T A L . 769
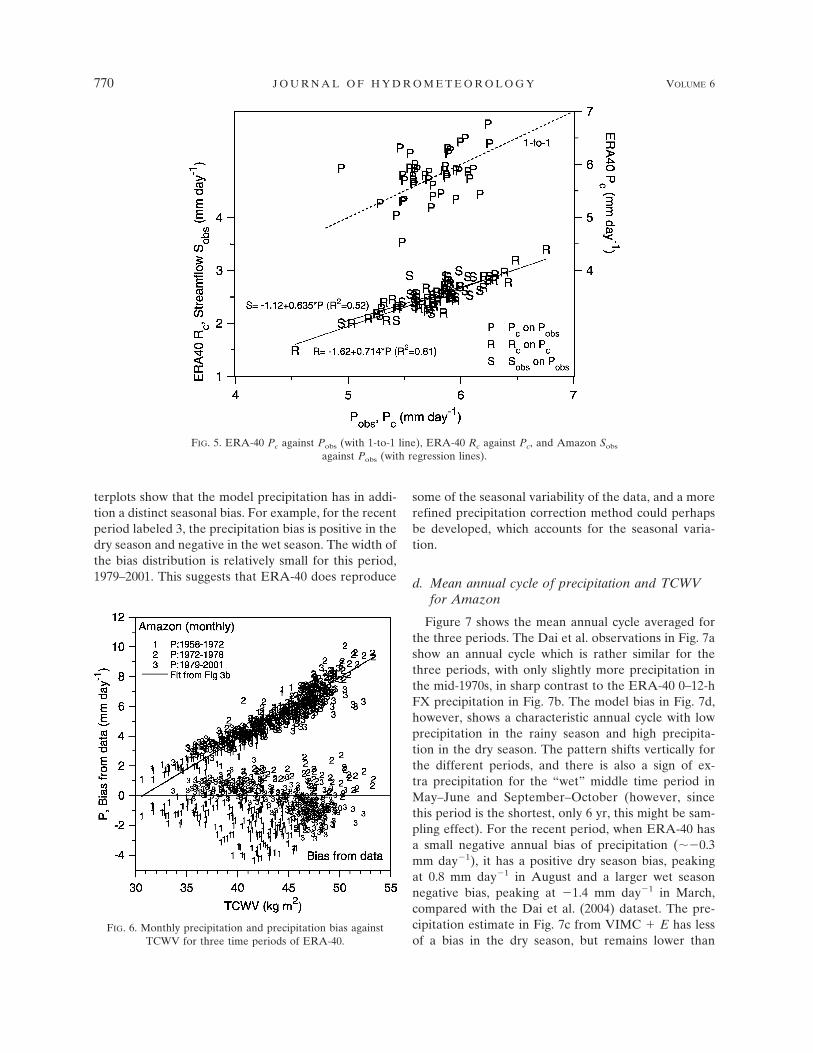
terplots show that the model precipitation has in addi-tion a distinct seasonal bias. For example, for the recentperiod labeled 3, the precipitation bias is positive in thedry season and negative in the wet season. The width ofthe bias distribution is relatively small for this period,1979–2001. This suggests that ERA-40 does reproduce
some of the seasonal variability of the data, and a morerefined precipitation correction method could perhapsbe developed, which accounts for the seasonal varia-tion.
d. Mean annual cycle of precipitation and TCWVfor Amazon
Figure 7 shows the mean annual cycle averaged forthe three periods. The Dai et al. observations in Fig. 7ashow an annual cycle which is rather similar for thethree periods, with only slightly more precipitation inthe mid-1970s, in sharp contrast to the ERA-40 0–12-hFX precipitation in Fig. 7b. The model bias in Fig. 7d,however, shows a characteristic annual cycle with lowprecipitation in the rainy season and high precipita-tion in the dry season. The pattern shifts vertically forthe different periods, and there is also a sign of ex-tra precipitation for the “wet” middle time period inMay–June and September–October (however, sincethis period is the shortest, only 6 yr, this might be sam-pling effect). For the recent period, when ERA-40 hasa small negative annual bias of precipitation (��0.3mm day�1), it has a positive dry season bias, peakingat 0.8 mm day�1 in August and a larger wet seasonnegative bias, peaking at �1.4 mm day�1 in March,compared with the Dai et al. (2004) dataset. The pre-cipitation estimate in Fig. 7c from VIMC � E has lessof a bias in the dry season, but remains lower than
FIG. 6. Monthly precipitation and precipitation bias againstTCWV for three time periods of ERA-40.
FIG. 5. ERA-40 Pc against Pobs (with 1-to-1 line), ERA-40 Rc against Pc, and Amazon Sobs
against Pobs (with regression lines).
770 J O U R N A L O F H Y D R O M E T E O R O L O G Y VOLUME 6
observed in the rainy season. VIMC � E has less of aspread for the three periods than the model P, primarilybecause (VIMC�E) � P from 1973 to 1986 (Fig. 2a),when the model TCWV analysis increments are large(Fig. 2b).
4. Temperature comparison
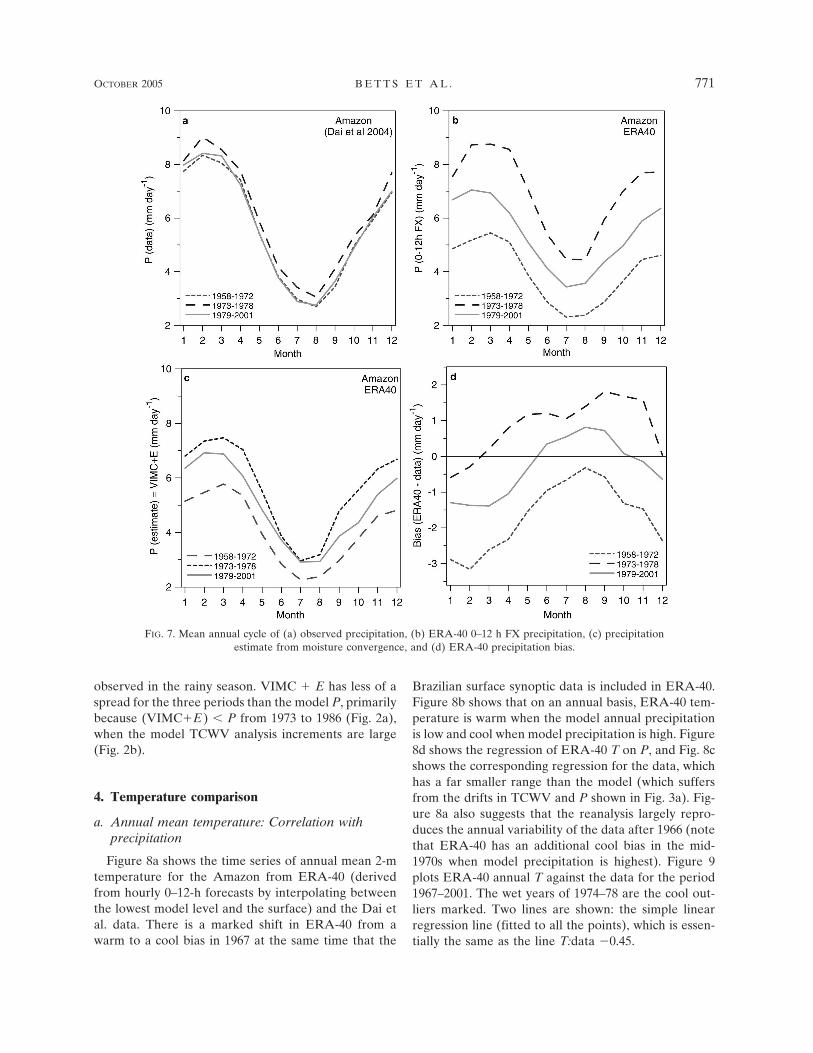
a. Annual mean temperature: Correlation withprecipitation
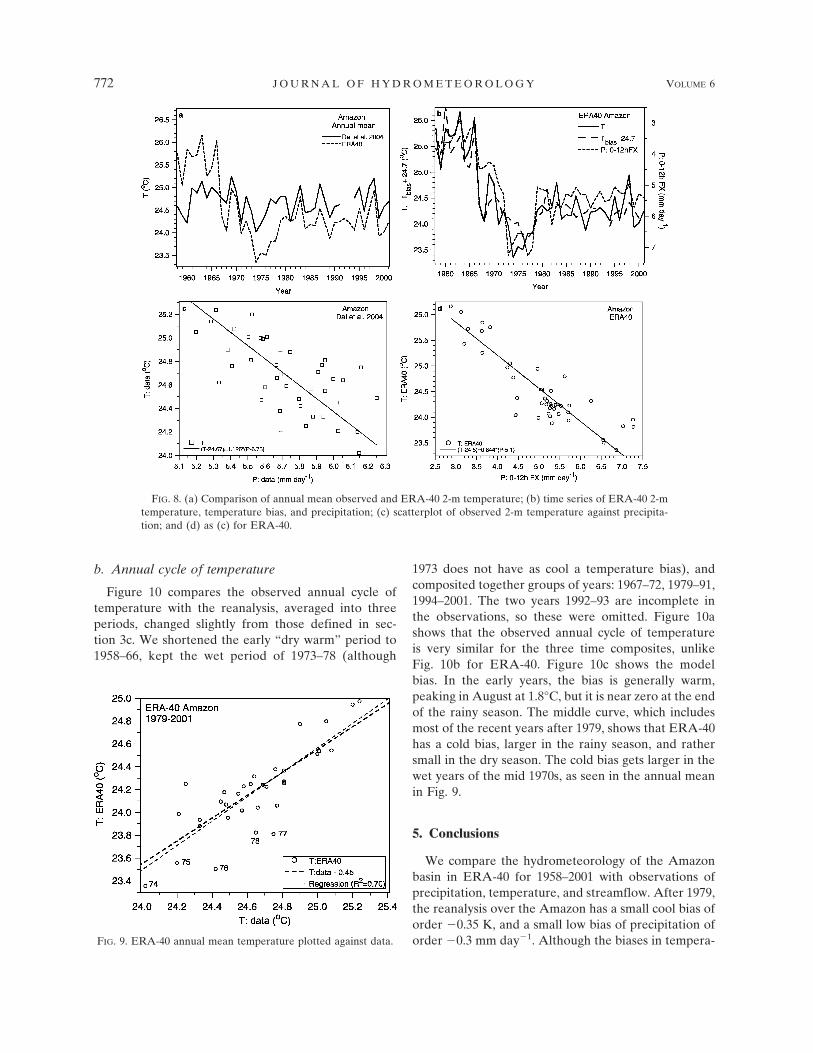
Figure 8a shows the time series of annual mean 2-mtemperature for the Amazon from ERA-40 (derivedfrom hourly 0–12-h forecasts by interpolating betweenthe lowest model level and the surface) and the Dai etal. data. There is a marked shift in ERA-40 from awarm to a cool bias in 1967 at the same time that the
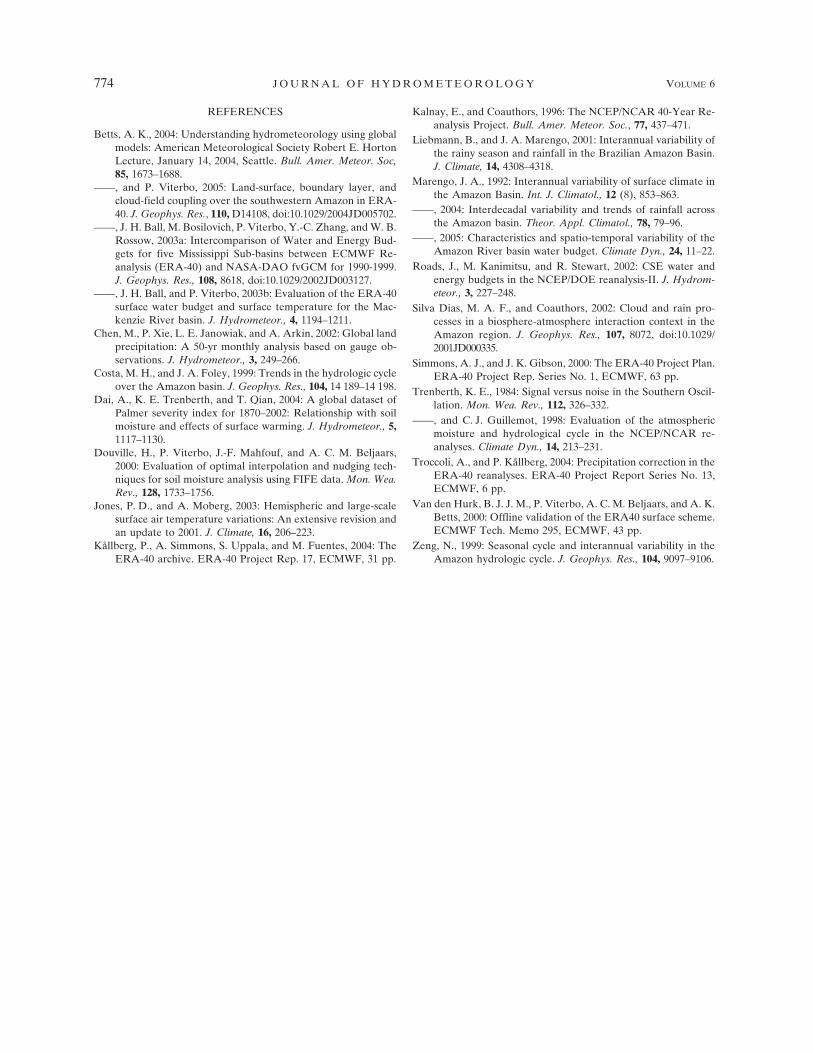
Brazilian surface synoptic data is included in ERA-40.Figure 8b shows that on an annual basis, ERA-40 tem-perature is warm when the model annual precipitationis low and cool when model precipitation is high. Figure8d shows the regression of ERA-40 T on P, and Fig. 8cshows the corresponding regression for the data, whichhas a far smaller range than the model (which suffersfrom the drifts in TCWV and P shown in Fig. 3a). Fig-ure 8a also suggests that the reanalysis largely repro-duces the annual variability of the data after 1966 (notethat ERA-40 has an additional cool bias in the mid-1970s when model precipitation is highest). Figure 9plots ERA-40 annual T against the data for the period1967–2001. The wet years of 1974–78 are the cool out-liers marked. Two lines are shown: the simple linearregression line (fitted to all the points), which is essen-tially the same as the line T:data �0.45.
FIG. 7. Mean annual cycle of (a) observed precipitation, (b) ERA-40 0–12 h FX precipitation, (c) precipitationestimate from moisture convergence, and (d) ERA-40 precipitation bias.
OCTOBER 2005 B E T T S E T A L . 771
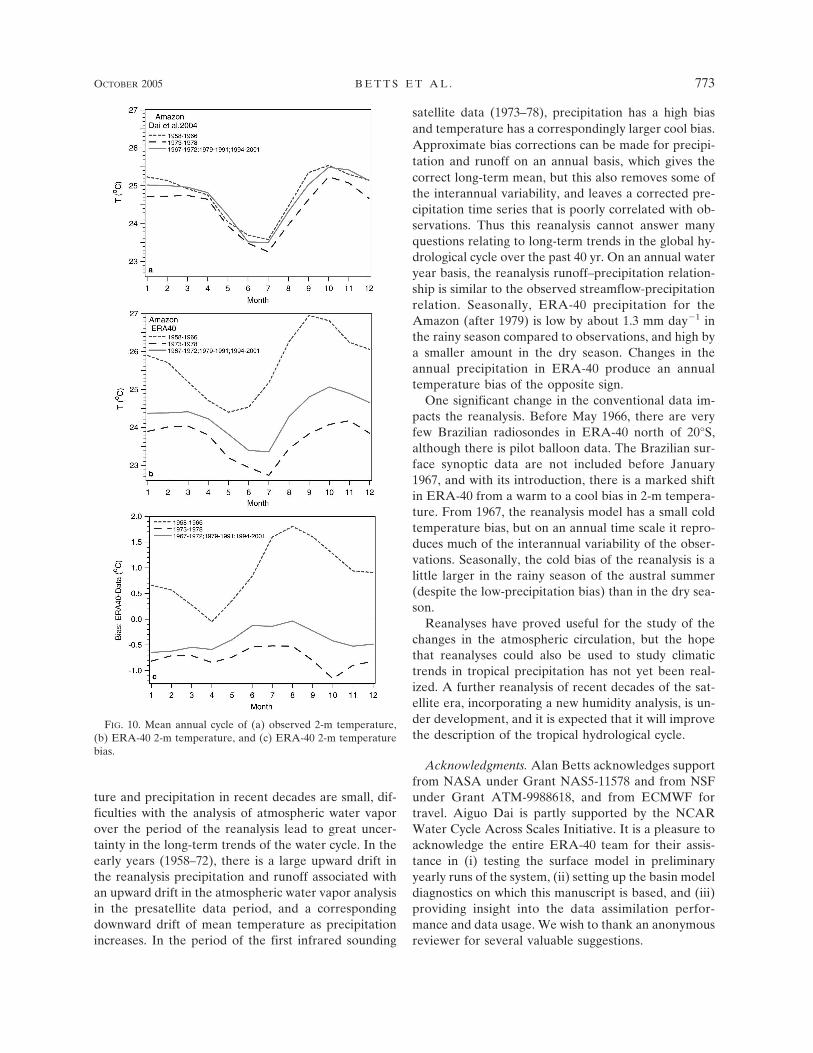
b. Annual cycle of temperature
Figure 10 compares the observed annual cycle oftemperature with the reanalysis, averaged into threeperiods, changed slightly from those defined in sec-tion 3c. We shortened the early “dry warm” period to1958–66, kept the wet period of 1973–78 (although
1973 does not have as cool a temperature bias), andcomposited together groups of years: 1967–72, 1979–91,1994–2001. The two years 1992–93 are incomplete inthe observations, so these were omitted. Figure 10ashows that the observed annual cycle of temperatureis very similar for the three time composites, unlikeFig. 10b for ERA-40. Figure 10c shows the modelbias. In the early years, the bias is generally warm,peaking in August at 1.8°C, but it is near zero at the endof the rainy season. The middle curve, which includesmost of the recent years after 1979, shows that ERA-40has a cold bias, larger in the rainy season, and rathersmall in the dry season. The cold bias gets larger in thewet years of the mid 1970s, as seen in the annual meanin Fig. 9.
5. Conclusions
We compare the hydrometeorology of the Amazonbasin in ERA-40 for 1958–2001 with observations ofprecipitation, temperature, and streamflow. After 1979,the reanalysis over the Amazon has a small cool bias oforder �0.35 K, and a small low bias of precipitation oforder �0.3 mm day�1. Although the biases in tempera-FIG. 9. ERA-40 annual mean temperature plotted against data.
FIG. 8. (a) Comparison of annual mean observed and ERA-40 2-m temperature; (b) time series of ERA-40 2-mtemperature, temperature bias, and precipitation; (c) scatterplot of observed 2-m temperature against precipita-tion; and (d) as (c) for ERA-40.
772 J O U R N A L O F H Y D R O M E T E O R O L O G Y VOLUME 6
ture and precipitation in recent decades are small, dif-ficulties with the analysis of atmospheric water vaporover the period of the reanalysis lead to great uncer-tainty in the long-term trends of the water cycle. In theearly years (1958–72), there is a large upward drift inthe reanalysis precipitation and runoff associated withan upward drift in the atmospheric water vapor analysisin the presatellite data period, and a correspondingdownward drift of mean temperature as precipitationincreases. In the period of the first infrared sounding
satellite data (1973–78), precipitation has a high biasand temperature has a correspondingly larger cool bias.Approximate bias corrections can be made for precipi-tation and runoff on an annual basis, which gives thecorrect long-term mean, but this also removes some ofthe interannual variability, and leaves a corrected pre-cipitation time series that is poorly correlated with ob-servations. Thus this reanalysis cannot answer manyquestions relating to long-term trends in the global hy-drological cycle over the past 40 yr. On an annual wateryear basis, the reanalysis runoff–precipitation relation-ship is similar to the observed streamflow-precipitationrelation. Seasonally, ERA-40 precipitation for theAmazon (after 1979) is low by about 1.3 mm day�1 inthe rainy season compared to observations, and high bya smaller amount in the dry season. Changes in theannual precipitation in ERA-40 produce an annualtemperature bias of the opposite sign.
One significant change in the conventional data im-pacts the reanalysis. Before May 1966, there are veryfew Brazilian radiosondes in ERA-40 north of 20°S,although there is pilot balloon data. The Brazilian sur-face synoptic data are not included before January1967, and with its introduction, there is a marked shiftin ERA-40 from a warm to a cool bias in 2-m tempera-ture. From 1967, the reanalysis model has a small coldtemperature bias, but on an annual time scale it repro-duces much of the interannual variability of the obser-vations. Seasonally, the cold bias of the reanalysis is alittle larger in the rainy season of the austral summer(despite the low-precipitation bias) than in the dry sea-son.
Reanalyses have proved useful for the study of thechanges in the atmospheric circulation, but the hopethat reanalyses could also be used to study climatictrends in tropical precipitation has not yet been real-ized. A further reanalysis of recent decades of the sat-ellite era, incorporating a new humidity analysis, is un-der development, and it is expected that it will improvethe description of the tropical hydrological cycle.
Acknowledgments. Alan Betts acknowledges supportfrom NASA under Grant NAS5-11578 and from NSFunder Grant ATM-9988618, and from ECMWF fortravel. Aiguo Dai is partly supported by the NCARWater Cycle Across Scales Initiative. It is a pleasure toacknowledge the entire ERA-40 team for their assis-tance in (i) testing the surface model in preliminaryyearly runs of the system, (ii) setting up the basin modeldiagnostics on which this manuscript is based, and (iii)providing insight into the data assimilation perfor-mance and data usage. We wish to thank an anonymousreviewer for several valuable suggestions.
FIG. 10. Mean annual cycle of (a) observed 2-m temperature,(b) ERA-40 2-m temperature, and (c) ERA-40 2-m temperaturebias.
OCTOBER 2005 B E T T S E T A L . 773
REFERENCES
Betts, A. K., 2004: Understanding hydrometeorology using globalmodels: American Meteorological Society Robert E. HortonLecture, January 14, 2004, Seattle. Bull. Amer. Meteor. Soc,85, 1673–1688.
——, and P. Viterbo, 2005: Land-surface, boundary layer, andcloud-field coupling over the southwestern Amazon in ERA-40. J. Geophys. Res., 110, D14108, doi:10.1029/2004JD005702.
——, J. H. Ball, M. Bosilovich, P. Viterbo, Y.-C. Zhang, and W. B.Rossow, 2003a: Intercomparison of Water and Energy Bud-gets for five Mississippi Sub-basins between ECMWF Re-analysis (ERA-40) and NASA-DAO fvGCM for 1990-1999.J. Geophys. Res., 108, 8618, doi:10.1029/2002JD003127.
——, J. H. Ball, and P. Viterbo, 2003b: Evaluation of the ERA-40surface water budget and surface temperature for the Mac-kenzie River basin. J. Hydrometeor., 4, 1194–1211.
Chen, M., P. Xie, L. E. Janowiak, and A. Arkin, 2002: Global landprecipitation: A 50-yr monthly analysis based on gauge ob-servations. J. Hydrometeor., 3, 249–266.
Costa, M. H., and J. A. Foley, 1999: Trends in the hydrologic cycleover the Amazon basin. J. Geophys. Res., 104, 14 189–14 198.
Dai, A., K. E. Trenberth, and T. Qian, 2004: A global dataset ofPalmer severity index for 1870–2002: Relationship with soilmoisture and effects of surface warming. J. Hydrometeor., 5,1117–1130.
Douville, H., P. Viterbo, J.-F. Mahfouf, and A. C. M. Beljaars,2000: Evaluation of optimal interpolation and nudging tech-niques for soil moisture analysis using FIFE data. Mon. Wea.Rev., 128, 1733–1756.
Jones, P. D., and A. Moberg, 2003: Hemispheric and large-scalesurface air temperature variations: An extensive revision andan update to 2001. J. Climate, 16, 206–223.
Kållberg, P., A. Simmons, S. Uppala, and M. Fuentes, 2004: TheERA-40 archive. ERA-40 Project Rep. 17, ECMWF, 31 pp.
Kalnay, E., and Coauthors, 1996: The NCEP/NCAR 40-Year Re-analysis Project. Bull. Amer. Meteor. Soc., 77, 437–471.
Liebmann, B., and J. A. Marengo, 2001: Interannual variability ofthe rainy season and rainfall in the Brazilian Amazon Basin.J. Climate, 14, 4308–4318.
Marengo, J. A., 1992: Interannual variability of surface climate inthe Amazon Basin. Int. J. Climatol., 12 (8), 853–863.
——, 2004: Interdecadal variability and trends of rainfall acrossthe Amazon basin. Theor. Appl. Climatol., 78, 79–96.
——, 2005: Characteristics and spatio-temporal variability of theAmazon River basin water budget. Climate Dyn., 24, 11–22.
Roads, J., M. Kanimitsu, and R. Stewart, 2002: CSE water andenergy budgets in the NCEP/DOE reanalysis-II. J. Hydrom-eteor., 3, 227–248.
Silva Dias, M. A. F., and Coauthors, 2002: Cloud and rain pro-cesses in a biosphere-atmosphere interaction context in theAmazon region. J. Geophys. Res., 107, 8072, doi:10.1029/2001JD000335.
Simmons, A. J., and J. K. Gibson, 2000: The ERA-40 Project Plan.ERA-40 Project Rep. Series No. 1, ECMWF, 63 pp.
Trenberth, K. E., 1984: Signal versus noise in the Southern Oscil-lation. Mon. Wea. Rev., 112, 326–332.
——, and C. J. Guillemot, 1998: Evaluation of the atmosphericmoisture and hydrological cycle in the NCEP/NCAR re-analyses. Climate Dyn., 14, 213–231.
Troccoli, A., and P. Kållberg, 2004: Precipitation correction in theERA-40 reanalyses. ERA-40 Project Report Series No. 13,ECMWF, 6 pp.
Van den Hurk, B. J. J. M., P. Viterbo, A. C. M. Beljaars, and A. K.Betts, 2000: Offline validation of the ERA40 surface scheme.ECMWF Tech. Memo 295, ECMWF, 43 pp.
Zeng, N., 1999: Seasonal cycle and interannual variability in theAmazon hydrologic cycle. J. Geophys. Res., 104, 9097–9106.
774 J O U R N A L O F H Y D R O M E T E O R O L O G Y VOLUME 6