HYDROLOGICAL STUDY OF COASTAL WATERS OF MANGALORE: PRE AND POST MONSOON SCENARIO.
13
IRJMST Volume 5 Issue 4 [Year 2014] Online ISSN 2250 - 1959 International Research Journal of Management Science & Technology http://www.irjmst.com Page 23 HYDROLOGICAL STUDY OF COASTAL WATERS OF MANGALORE: PRE AND POST MONSOON SCENARIO. 1 Madhavi.K and 2 Gangadhara Gowda. 1 Assistant professor Department of Aquatic Environment Management, College of Fishery Science, Muthukur, Andhra Pradesh, India -524344. 2 Professor and Head, Department of Aquatic Environment Management, College of Fisheries, Mangalore, Karnataka, India – 575002 Abstract Hydrological study of physico-chemical parameters are of utmost importance, as it is having lot of influence on the composition, density and relative abundance of planktonic communities which are finally going to decide the fate of productivity of coastal waters. Air temperature, water temperature, pH, salinity, dissolved oxygen, ammonium-N, nitrite-N, nitrate-N, phosphate-P and silicate-Si were observed and analysed to understand the hydrology of Mangalore coastal waters during the pre- monsoon (Feb. 2013 to May 2013) and post-monsoon (Oct.2013 to Jan.2014)seasons. Introduction Coastal ecosystems play an important role in the global biogeochemical cycles of macronutrients. Despite their relatively small volume, they contribute disproportionately to global primary production. Coastal margins that are influenced by major rivers are an important source of dissolved and particulate material to the ocean and to global biogeochemical fluxes. The Mangalore coast which is situated at the western part of the Indian peninsula stretching to about 22 Kms of Coastal district of Dakshina Kannada, Karnataka. Coastal waters off Mangalore provide for a multi-species fishery, and the area is known as one of the largest upwelling systems in the world.
-
Upload
independent -
Category
Documents
-
view
2 -
download
0
Transcript of HYDROLOGICAL STUDY OF COASTAL WATERS OF MANGALORE: PRE AND POST MONSOON SCENARIO.
IRJMST Volume 5 Issue 4 [Year 2014] Online ISSN 2250 - 1959
International Research Journal of Management Science & Technology http://www.irjmst.com Page 23
HYDROLOGICAL STUDY OF COASTAL WATERS OF MANGALORE:
PRE AND POST MONSOON SCENARIO.
1Madhavi.K and 2Gangadhara Gowda.
1 Assistant professor Department of Aquatic Environment Management,
College of Fishery Science, Muthukur, Andhra Pradesh, India -524344.
2 Professor and Head, Department of Aquatic Environment Management,
College of Fisheries, Mangalore, Karnataka, India – 575002
Abstract
Hydrological study of physico-chemical parameters are of utmost importance, as
it is having lot of influence on the composition, density and relative abundance of
planktonic communities which are finally going to decide the fate of productivity of
coastal waters. Air temperature, water temperature, pH, salinity, dissolved oxygen,
ammonium-N, nitrite-N, nitrate-N, phosphate-P and silicate-Si were observed and
analysed to understand the hydrology of Mangalore coastal waters during the pre-
monsoon (Feb. 2013 to May 2013) and post-monsoon (Oct.2013 to Jan.2014)seasons.
Introduction
Coastal ecosystems play an important role in the global biogeochemical cycles of
macronutrients. Despite their relatively small volume, they contribute disproportionately
to global primary production. Coastal margins that are influenced by major rivers are an
important source of dissolved and particulate material to the ocean and to global
biogeochemical fluxes. The Mangalore coast which is situated at the western part of the
Indian peninsula stretching to about 22 Kms of Coastal district of Dakshina Kannada,
Karnataka. Coastal waters off Mangalore provide for a multi-species fishery, and the area
is known as one of the largest upwelling systems in the world.
IRJMST Volume 5 Issue 4 [Year 2014] Online ISSN 2250 - 1959
International Research Journal of Management Science & Technology http://www.irjmst.com Page 24
Materials and Methods
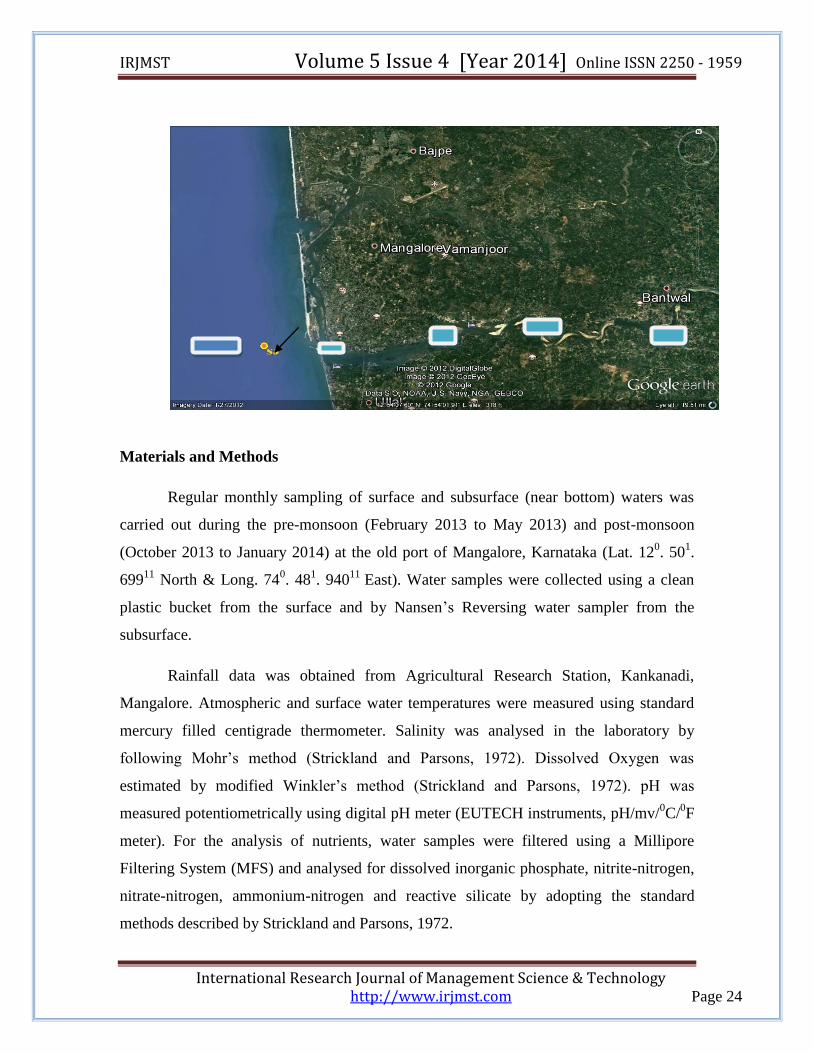
Regular monthly sampling of surface and subsurface (near bottom) waters was
carried out during the pre-monsoon (February 2013 to May 2013) and post-monsoon
(October 2013 to January 2014) at the old port of Mangalore, Karnataka (Lat. 120. 50
1.
69911
North & Long. 740. 48
1. 940
11 East). Water samples were collected using a clean
plastic bucket from the surface and by Nansen’s Reversing water sampler from the
subsurface.
Rainfall data was obtained from Agricultural Research Station, Kankanadi,
Mangalore. Atmospheric and surface water temperatures were measured using standard
mercury filled centigrade thermometer. Salinity was analysed in the laboratory by
following Mohr’s method (Strickland and Parsons, 1972). Dissolved Oxygen was
estimated by modified Winkler’s method (Strickland and Parsons, 1972). pH was
measured potentiometrically using digital pH meter (EUTECH instruments, pH/mv/0C/
0F
meter). For the analysis of nutrients, water samples were filtered using a Millipore
Filtering System (MFS) and analysed for dissolved inorganic phosphate, nitrite-nitrogen,
nitrate-nitrogen, ammonium-nitrogen and reactive silicate by adopting the standard
methods described by Strickland and Parsons, 1972.
IRJMST Volume 5 Issue 4 [Year 2014] Online ISSN 2250 - 1959
International Research Journal of Management Science & Technology http://www.irjmst.com Page 25
Results and Discussion
Rainfall
It is the most important cyclic phenomenon in tropical countries as it brings
important changes in the hydrographical characteristics of an aquatic environment. The
total annual rainfall received in the study area was 3526 mm, minimum precipitation was
observed in the month of March (24.9 mm) and maximum in the month of June (1483.2
mm).
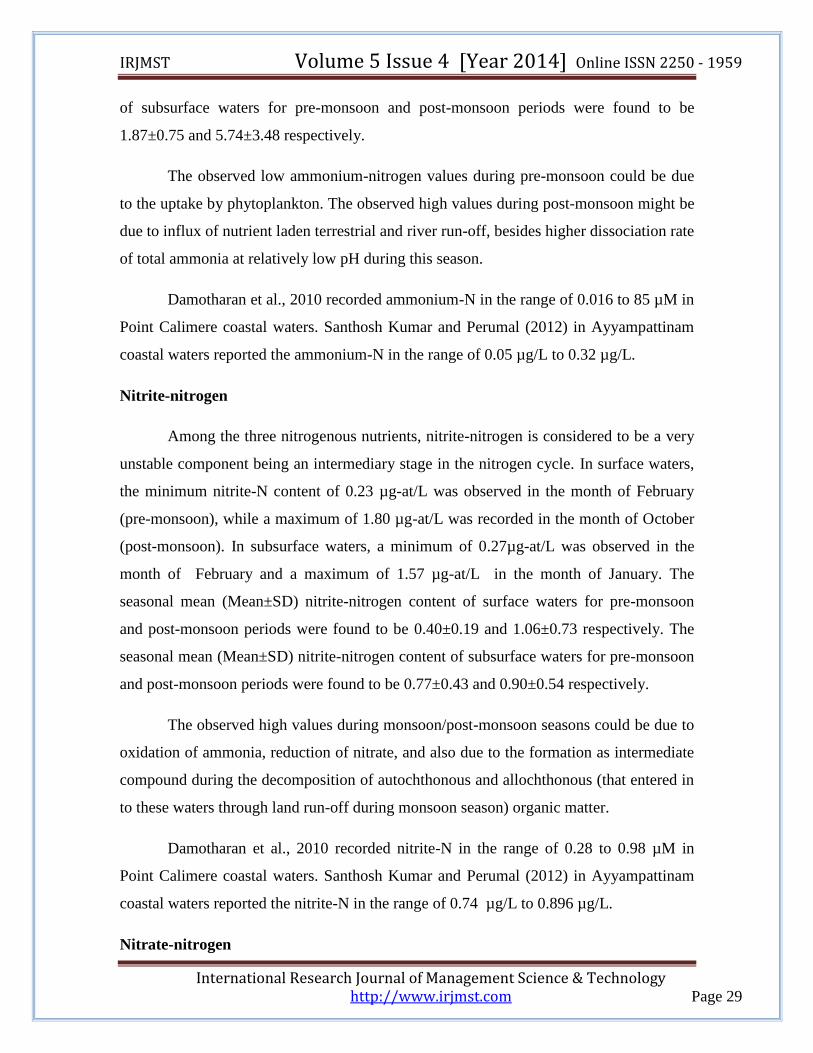
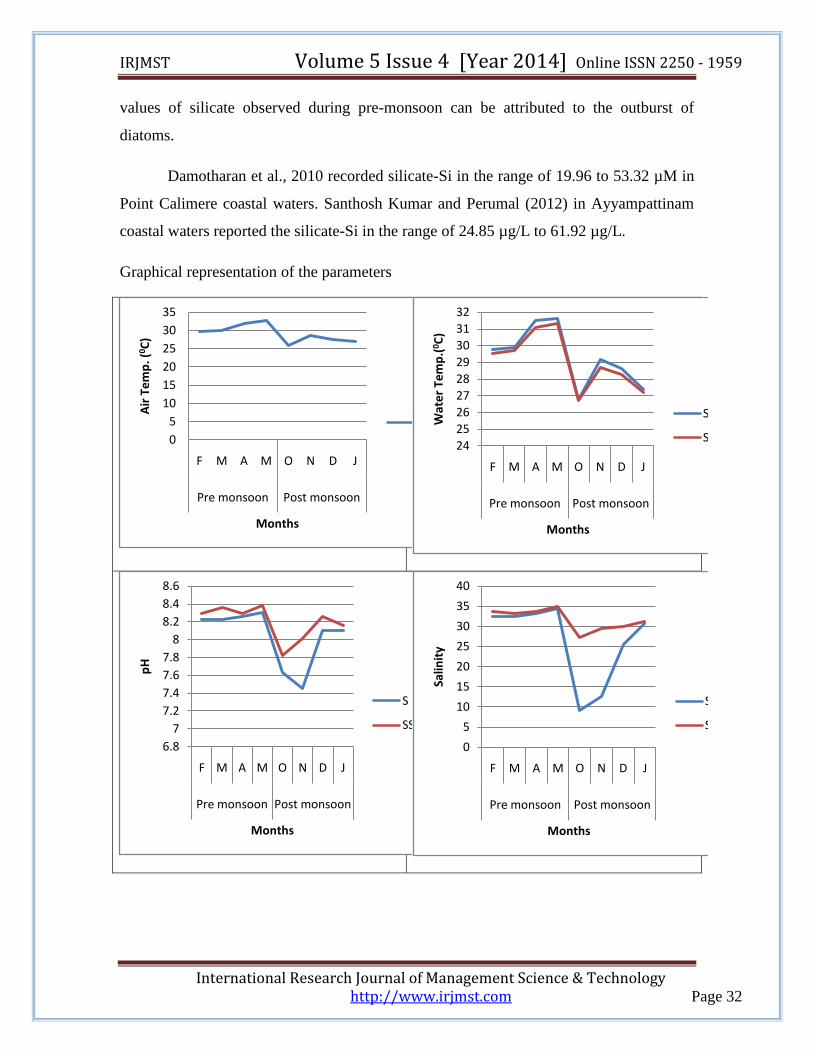
Air Temperature
The minimum air temperature of 25.90C was observed in the month of October
(post-monsoon), while a maximum temperature of 32.80C was recorded in the month of
May (pre-monsoon). The seasonal mean (Mean±SD) air temperature values for pre-
monsoon and post-monsoon seasons were found to be 31.15±1.49 and 27.23±1.13
respectively.
The fluctuation in the air temperature was closely related to the seasonal changes
in the insolation, wind and precipitation, so, highest temperatures were observed during
pre-monsoon and low values during monsoon post-monsoon.
Damotharan et al., 2010 observed air temperature in the range of 23.50C to 28.2
0C
in Point Calimere coastal waters.
Water Temperature
It is well known that water temperature influences organisms directly on the
physiological parameters and indirectly through change in the physicochemical properties
of water. Therefore, water temperature becomes an important factor to record in the
environmental studies. In surface waters, the minimum water temperature of 26.80C was
observed in the month of October- (post-monsoon), while a maximum temperature of
31.60C was recorded in the month of May (pre-monsoon). In subsurface waters, a
minimum of 26.70C was observed in the month of October (post-monsoon) and a
maximum of 31.30C in the month of May. The seasonal mean (Mean±SD) surface water
IRJMST Volume 5 Issue 4 [Year 2014] Online ISSN 2250 - 1959
International Research Journal of Management Science & Technology http://www.irjmst.com Page 26
temperature values for pre-monsoon and post-monsoon seasons were found to be
30.70±0.98 and 28.00±1.10 respectively. The seasonal mean (Mean±SD) subsurface
water temperature values pre-monsoon and post-monsoon seasons were found to be
30.40±0.93 and 27.73±0.93 respectively.
The temperature values for the entire period of observation reflect to a great
extent the climatic variations. A trend in temperatures of Air > Surface > Subsurface
(Pre-monsoon) and Surface > Subsurface > Air (Post-monsoon) was observed. The
recorded high pre-monsoon and low monsoonal and post-monsoonal values can be
ascribed to meteorological phenomenon i.e high solar radiation and precipitation
respectively. In Kalpakkam coastal waters, Sahu et al., 2012 observed, surface water
temperature in the range from 26.00C (august) to 31.8
0C (May) indicated an annual
variability of about 5.80C.
Damotharan et al., 2010 observed water temperature in the range of 24.00C to
29.50C in Point Calimere coastal waters. Santhosh Kumar and Perumal (2012) in
Ayyampattinam coastal waters reported the water temperature in the range of 25.50C to
33.40C.
pH
pH is known as master variable in water, since many properties, processes and
reactions are pH dependent. In surface waters, the minimum pH of 7.45 was observed in
the month of November (post-monsoon), while a maximum pH of 8.31 was recorded in
the month of May (pre-monsoon). In subsurface waters, a minimum of 7.82 was observed
in the month of October and a maximum of 8.38 in the month of May. The seasonal
mean (Mean±SD) pH values of surface waters for pre-monsoon and post-monsoon
periods were found to be 8.26±0.04 and 7.82±0.33 respectively. The seasonal mean
(Mean±SD) pH values of subsurface waters for pre-monsoon and post-monsoon periods
were found to be 8.33±0.05 and 8.06±0.19 respectively.
IRJMST Volume 5 Issue 4 [Year 2014] Online ISSN 2250 - 1959
International Research Journal of Management Science & Technology http://www.irjmst.com Page 27
The bottom water pH was found to be, by and large higher than that of the surface
water. By and large, the marginal change observed in pH of coastal waters from one
month to the other may be due to the excessive buffering activity of sea water.
The observed pre-monsoon maximum pH could be attributed to high rate of
evaporation under high temperature conditions. The observed post-monsoon minima can
be ascribed to rainfall, resultant freshwater mixing.
Damotharan et al., 2010 observed pH in the range of 7.8 to 8.3 in Point Calimere
coastal waters. Santhosh Kumar and Perumal (2012) in Ayyampattinam coastal waters
reported the pH in the range of 7.8 to 8.2.
Salinity
Salinity is a dynamic indicator of the nature of the exchange system. The salinity
distribution with in coastal water ways reflects the relative influx of fresh water supplied
by rivers. In surface waters, minimum salinity of 9.12 psu was observed in the month of
October- (post-monsoon), while a maximum pH of 34.36 psu was recorded in the month
of May (pre-monsoon). In subsurface waters, a minimum of 27.12 psu was observed in
the month of October and a maximum of 34.99 psu in the month of May. The seasonal
mean (Mean±SD) salinity values of surface waters for pre-monsoon and post-monsoon
periods were found to be 33.15±0.88 and 19.47±10.29 respectively. The seasonal mean
(Mean±SD) salinity values of subsurface waters for pre-monsoon and post-monsoon
periods were found to be 33.90±0.79 and 29.43±1.73 respectively. The recorded higher
values during pre-monsoon season could be attributed to low amount of rainfall, higher
rate of evaporation. Damotharan et al., 2010 recorded salinity in the range of 26 to 35 psu
in Point Calimere coastal waters. Smitha et al. (2010) observed an annual variation of
24.45 to 36.72 ppt in coastal waters of Kalpakkam. Santhosh Kumar and Perumal (2012)
in Ayyampattinam coastal waters reported the salinity in the range of 23 ppt to 35 ppt.
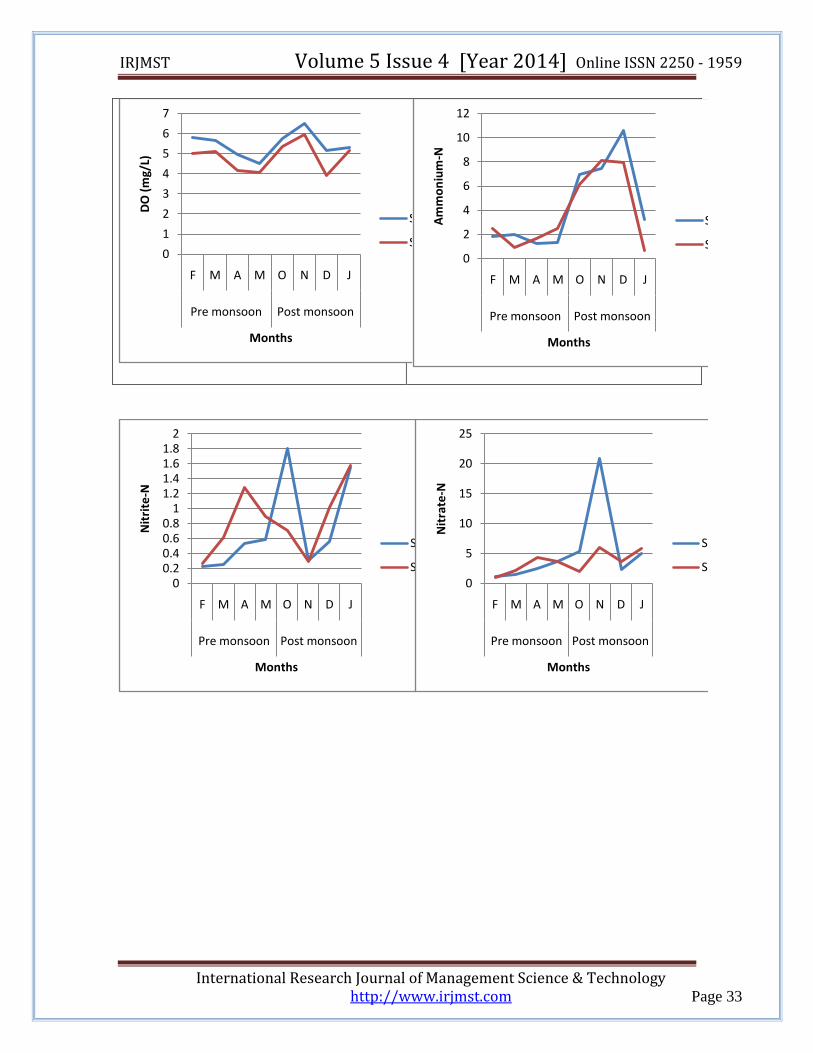
Dissolved Oxygen (DO)
IRJMST Volume 5 Issue 4 [Year 2014] Online ISSN 2250 - 1959
International Research Journal of Management Science & Technology http://www.irjmst.com Page 28
Dissolved oxygen is an important characteristic of water and its concentration in
water is an indicator of prevailing water quality and ability of water body to support a
well-balanced aquatic life.
In surface waters, the minimum dissolved oxygen content of 4.52 mg/L was
observed in the month of May (pre-monsoon), while a maximum of 6.52 mg/L was
recorded in the month of November (post-monsoon). In subsurface waters, a minimum of
3.92 mg/L was observed in the month of December and a maximum of 5.94 mg/L in the
month of November. The seasonal mean (Mean±SD) DO content of surface waters for
pre-monsoon and post-monsoon periods were found to be 5.23±0.60 and 5.69±0.61
respectively. The seasonal mean (Mean±SD) DO content of subsurface waters for pre-
monsoon and post-monsoon periods were found to be 4.59±0.55 and 5.09±0.85
respectively.
The observed high post-monsoonal values might be due to the cumulative effects
of higher wind velocity, increased turbulence coupled with heavy rainfall during
monsoon. High biological activity during pre-monsoon can lead to low dissolved oxygen
concentration, besides, low solubility of dissolved oxygen under high temperature and
salinity conditions.
Damotharan et al., 2010 recorded oxygen in the range of 3.15 to 5.24 mg/L in
Point Calimere coastal waters. Santhosh Kumar and Perumal (2012) in Ayyampattinam
coastal waters reported the salinity in the range of 3.6 ml/L to 5.2 ml/L.
Ammonium-nitrogen
In surface waters, the minimum ammonium-N content of 1.26 µg-at/L was
observed in the month of April (pre-monsoon), while a maximum of 10.56 µg-at/L was
recorded in the month of December (post-monsoon). In subsurface waters, a minimum of
0.70 µg-at/L was observed in the month of January and a maximum of 8.14 µg-at/L in
the month of November. The seasonal mean (Mean±SD) ammonium-nitrogen content of
surface waters for pre-monsoon and post-monsoon periods were found to be 1.61±0.38
and 7.03±3.01 respectively. The seasonal mean (Mean±SD) ammonium-nitrogen content
IRJMST Volume 5 Issue 4 [Year 2014] Online ISSN 2250 - 1959
International Research Journal of Management Science & Technology http://www.irjmst.com Page 29
of subsurface waters for pre-monsoon and post-monsoon periods were found to be
1.87±0.75 and 5.74±3.48 respectively.
The observed low ammonium-nitrogen values during pre-monsoon could be due
to the uptake by phytoplankton. The observed high values during post-monsoon might be
due to influx of nutrient laden terrestrial and river run-off, besides higher dissociation rate
of total ammonia at relatively low pH during this season.
Damotharan et al., 2010 recorded ammonium-N in the range of 0.016 to 85 µM in
Point Calimere coastal waters. Santhosh Kumar and Perumal (2012) in Ayyampattinam
coastal waters reported the ammonium-N in the range of 0.05 µg/L to 0.32 µg/L.
Nitrite-nitrogen
Among the three nitrogenous nutrients, nitrite-nitrogen is considered to be a very
unstable component being an intermediary stage in the nitrogen cycle. In surface waters,
the minimum nitrite-N content of 0.23 µg-at/L was observed in the month of February
(pre-monsoon), while a maximum of 1.80 µg-at/L was recorded in the month of October
(post-monsoon). In subsurface waters, a minimum of 0.27µg-at/L was observed in the
month of February and a maximum of 1.57 µg-at/L in the month of January. The
seasonal mean (Mean±SD) nitrite-nitrogen content of surface waters for pre-monsoon
and post-monsoon periods were found to be 0.40±0.19 and 1.06±0.73 respectively. The
seasonal mean (Mean±SD) nitrite-nitrogen content of subsurface waters for pre-monsoon
and post-monsoon periods were found to be 0.77±0.43 and 0.90±0.54 respectively.
The observed high values during monsoon/post-monsoon seasons could be due to
oxidation of ammonia, reduction of nitrate, and also due to the formation as intermediate
compound during the decomposition of autochthonous and allochthonous (that entered in
to these waters through land run-off during monsoon season) organic matter.
Damotharan et al., 2010 recorded nitrite-N in the range of 0.28 to 0.98 µM in
Point Calimere coastal waters. Santhosh Kumar and Perumal (2012) in Ayyampattinam
coastal waters reported the nitrite-N in the range of 0.74 µg/L to 0.896 µg/L.
Nitrate-nitrogen
IRJMST Volume 5 Issue 4 [Year 2014] Online ISSN 2250 - 1959
International Research Journal of Management Science & Technology http://www.irjmst.com Page 30
In surface waters, the minimum nitrate-N content of 1.17µg-at/L was observed in
the month of February (pre-monsoon), while a maximum of 20.93 µg-at/L was recorded
in the month of November (post-monsoon). In subsurface waters, a minimum of 0.96µg-
at/L was observed in the month of February and a maximum of 5.98 µg-at/L in the
month of November. The seasonal mean (Mean±SD) nitrate-nitrogen content of surface
waters pre-monsoon and post-monsoon periods were found to be 2.17±1.10 and
8.42±8.44 respectively. The seasonal mean (Mean±SD) nitrate-nitrogen content of
subsurface waters pre-monsoon and post-monsoon periods were found to be 2.80±1.52
and 4.38±1.85 respectively.
The recorded high values of nitrate during post-monsoon season could be mainly
due to the organic materials received from the catchment area, by way of terrestrial and
river run-off. The recorded low values of nitrate during pre-monsoon season could be
attributed to phytoplankton growth, sedimentation and denitrification.
Damotharan et al., 2010 recorded nitrate-N in the range of 3.54 to 7.05 µM in
Point Calimere coastal waters. Santhosh Kumar and Perumal (2012) in Ayyampattinam
coastal waters reported the nitrate-N in the range of 3.21 µg/L to 6.34 µg/L.
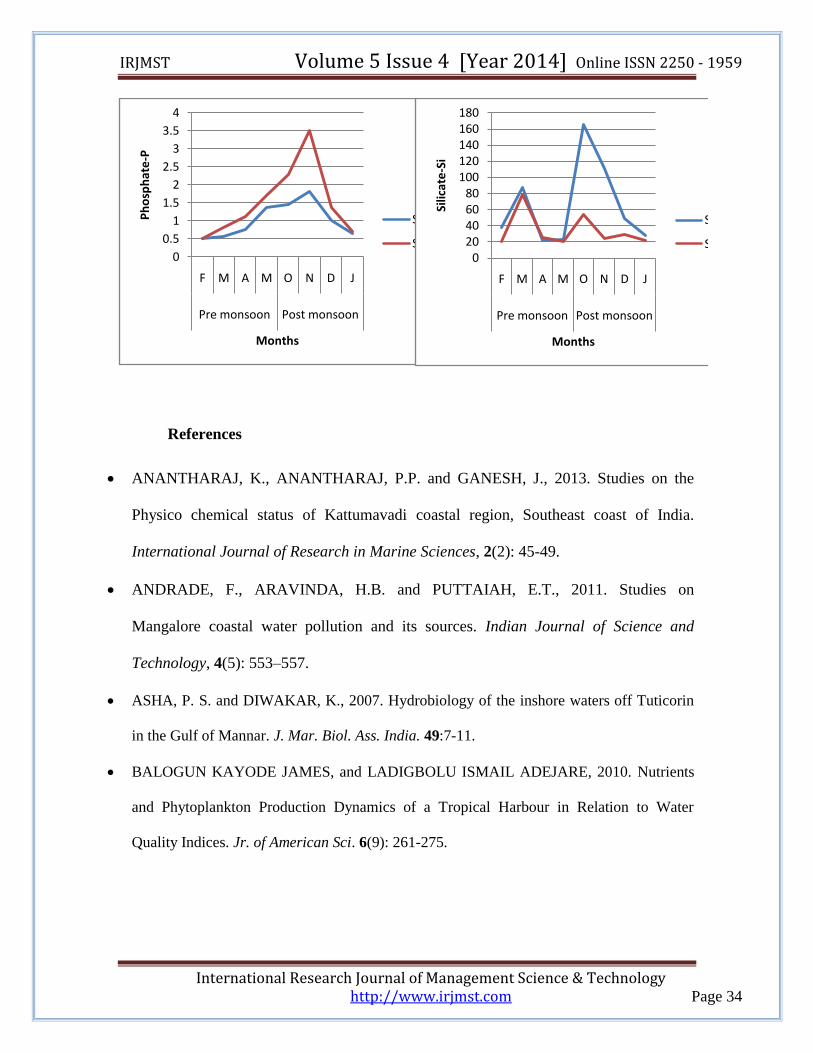
Phosphate-phosphorus
Phosphate concentration in coastal waters depend upon its concentration in the
freshwater that mixed with the seawater with in the sea-land interaction zone,
phytoplankton uptake, addition through localized upwelling and replenishment as a result
of microbial decomposition of organic matters. In surface waters, the minimum
phosphate content of 0.51 µg-at/L was observed in the month of February (pre-monsoon),
while a maximum of 1.83 µg-at/L was recorded in the month of November (post-
monsoon). In subsurface waters, a minimum of 0.51µg-at/L was observed in the month of
February and a maximum of 3.52 µg-at/L in the month of November. The seasonal mean
(Mean±SD) phosphate-phosphorus content of surface waters for pre-monsoon and post-
monsoon periods were found to be 0.80±0.39 and 1.24±0.51 respectively. The seasonal
mean (Mean±SD) phosphate-phosphorus content of subsurface waters for pre-monsoon
and post-monsoon periods were found to be 1.04±0.51 and 1.97±1.22 respectively.
IRJMST Volume 5 Issue 4 [Year 2014] Online ISSN 2250 - 1959
International Research Journal of Management Science & Technology http://www.irjmst.com Page 31
The observed higher monsoonal values can be attributed to regeneration and
release of total phosphorus from bottom mud (which is the major source of this nutrient)
in to the water column by turbulence and mixing due to the impact of precipitation.
Damotharan et al., 2010 recorded phosphate-P in the range of 0.2 to 2.8 µM in
Point Calimere coastal waters. Santhosh Kumar and Perumal (2012) in Ayyampattinam
coastal waters reported the phosphate-P in the range of 0.22 µg/L to 1.16 µg/L.
Silicate-silicon
The spatio-temporal variation of silica in coastal water is influenced by several
factors, more importantly the proportional physical mixing of sea water with freshwater,
adsorption of reactive silicate onto sedimentary particles, chemical interaction with clay
minerals, co-precipitation with humic compounds, and biological removal by
phytoplankton, especially by diatoms and silicoflagellates. The entry of silicate mainly
takes place through land drainage rich with weathered silicate material.
In surface waters, the minimum silicate content of 21.67 µg-at/L was observed in
the month of April (pre-monsoon), while a maximum of 165.00 µg-at/L was recorded in
the month of October (post-monsoon). In subsurface waters, a minimum of 19.85µg-at/L
was observed in the month of May and a maximum of 78.20 µg-at/L in the month of
March. The seasonal mean (Mean±SD) silicate-silicon content of surface waters for pre-
monsoon and post-monsoon periods were found to be 42.47±30.73 and 88.00±62.06
respectively. The seasonal mean (Mean±SD) silicate-silicon content of subsurface waters
for pre-monsoon and post-monsoon periods were found to be 35.93±28.27 and
31.98±14.91 respectively.
The observed high post-monsoonal values may be due to heavy inflow of
monsoonal freshwater derived from land drainage carrying silicate leached out from the
rocks. Further, due to the turbulent nature of water, during monsoon season, the silicate
from the bottom sediment might have been exchanged with overlying water. The minimal
IRJMST Volume 5 Issue 4 [Year 2014] Online ISSN 2250 - 1959
International Research Journal of Management Science & Technology http://www.irjmst.com Page 32
values of silicate observed during pre-monsoon can be attributed to the outburst of
diatoms.
Damotharan et al., 2010 recorded silicate-Si in the range of 19.96 to 53.32 µM in
Point Calimere coastal waters. Santhosh Kumar and Perumal (2012) in Ayyampattinam
coastal waters reported the silicate-Si in the range of 24.85 µg/L to 61.92 µg/L.
Graphical representation of the parameters
0
5
10
15
20
25
30
35
F M A M O N D J
Pre monsoon Post monsoon
Air
Te
mp
. (0 C
)
Months
S
24
25
26
27
28
29
30
31
32
F M A M O N D J
Pre monsoon Post monsoon
Wat
er
Tem
p.(
0 C)
Months
S
SS
6.8
7
7.2
7.4
7.6
7.8
8
8.2
8.4
8.6
F M A M O N D J
Pre monsoon Post monsoon
pH
Months
S
SS
0
5
10
15
20
25
30
35
40
F M A M O N D J
Pre monsoon Post monsoon
Salin
ity
Months
S
SS
IRJMST Volume 5 Issue 4 [Year 2014] Online ISSN 2250 - 1959
International Research Journal of Management Science & Technology http://www.irjmst.com Page 33
0
1
2
3
4
5
6
7
F M A M O N D J
Pre monsoon Post monsoon
DO
(m
g/L)
Months
S
SS0
2
4
6
8
10
12
F M A M O N D J
Pre monsoon Post monsoon
Am
mo
niu
m-N
Months
S
SS
00.20.40.60.8
11.21.41.61.8
2
F M A M O N D J
Pre monsoon Post monsoon
Nit
rite
-N
Months
S
SS0
5
10
15
20
25
F M A M O N D J
Pre monsoon Post monsoon
Nit
rate
-N
Months
S
SS
IRJMST Volume 5 Issue 4 [Year 2014] Online ISSN 2250 - 1959
International Research Journal of Management Science & Technology http://www.irjmst.com Page 34
References
ANANTHARAJ, K., ANANTHARAJ, P.P. and GANESH, J., 2013. Studies on the
Physico chemical status of Kattumavadi coastal region, Southeast coast of India.
International Journal of Research in Marine Sciences, 2(2): 45-49.
ANDRADE, F., ARAVINDA, H.B. and PUTTAIAH, E.T., 2011. Studies on
Mangalore coastal water pollution and its sources. Indian Journal of Science and
Technology, 4(5): 553–557.
ASHA, P. S. and DIWAKAR, K., 2007. Hydrobiology of the inshore waters off Tuticorin
in the Gulf of Mannar. J. Mar. Biol. Ass. India. 49:7-11.
BALOGUN KAYODE JAMES, and LADIGBOLU ISMAIL ADEJARE, 2010. Nutrients
and Phytoplankton Production Dynamics of a Tropical Harbour in Relation to Water
Quality Indices. Jr. of American Sci. 6(9): 261-275.
0
0.5
1
1.5
2
2.5
3
3.5
4
F M A M O N D J
Pre monsoon Post monsoon
Ph
osp
hat
e-P
Months
S
SS0
20406080
100120140160180
F M A M O N D J
Pre monsoon Post monsoon
Silic
ate
-Si
Months
S
SS
IRJMST Volume 5 Issue 4 [Year 2014] Online ISSN 2250 - 1959
International Research Journal of Management Science & Technology http://www.irjmst.com Page 35
DAMOTHARAN, P., PERUMAL, N.V. and ARUMUGAM, M., 2010. Seasonal
variation of physico-chemical characteristics in Point Calimere coastal waters
(Southeast coast of India). Middle-East Journal of Scientific research, 6(4): 333–339.
JUSTIC, D., RABALAIS, N.N. and TURNER, R.E., 1995. Stoichiometric nutrient
balance and origin of coastal eutrophication. Marine Pollution Bulletin, 30(1):41-46.
KANNATHASAN, A. and RAJENDRAN, K. 2010. The physico-chemical
characteristics of Nagapattinam south east coast, Bay of Bengal in India. International
J. Recent Sci. Res., 7: 160-162.
SAHU, G., SATPATHY, K.K., MOHANTY, A.K. and SARKAR, S.K., 2012.
Variations in community structure of phytoplankton in relation to physico-chemical
properties of coastal waters, southeast coast of India. Indian Journal of Geo-Marine
Sciences, 41(3): 223–241.
SANTHOSH KUMAR, C. and PERUMAL, P., 2012. Studies on phytoplankton
characteristics in Ayyampattinam coast, India. J. Environ. Biol., 33: 585–589.
SMITHA ACHARY, M., SAHU, G., MOHANTY, A.K., SAMATARA, M.K.,
PANIGRAHY, S.N., SELVANAYAGAM, M., SATPATHY, K.K., PRASAD, M.V.R.
and PANIGRAHY, R.C., 2010. Phytoplankton abundance and diversity in the coastal
waters of Kalpakkam, East coast of India in relation to the environmental variables. The
Bioscan, 2:553–568.