Petrophysical Evaluation of Shaly Sand Reservoirs in Palouge ...
Upload
univ-rennes1Category
view
0download
0
Journal of Hydrology 509 (2014) 42–54
Contents lists available at ScienceDirect
Journal of Hydrology
journal homepage: www.elsevier .com/locate / jhydrol
Hydrological behavior of a deep sub-vertical fault in crystallinebasement and relationships with surrounding reservoirs
0022-1694/$ - see front matter � 2013 Elsevier B.V. All rights reserved.http://dx.doi.org/10.1016/j.jhydrol.2013.11.023
⇑ Corresponding author. Address: Université Rennes 1 – CNRS, OSUR GéosciencesRennes, 263 avenue du Général Leclerc, 35000 Rennes, France. Tel.: +33 2 23 23 5469; fax: +33 2 23 23 60 90.
E-mail address: [email protected] (C. Roques).
C. Roques a,⇑, O. Bour a, L. Aquilina a, B. Dewandel b, S. Leray a, JM. Schroetter c, L. Longuevergne a,T. Le Borgne a, R. Hochreutener a, T. Labasque a, N. Lavenant a, V. Vergnaud-Ayraud a, B. Mougin c
a Université Rennes 1-CNRS, OSUR-Géosciences Rennes, avenue du Général Leclerc, 35000 Rennes, Franceb BRGM, Water Dept., New Water Resource & Economy Unit, 1039, Rue de Pinville, 34 000 Montpellier, Francec BRGM, French Regional Geological Survey of French Brittany, Rennes Atalante Beaulieu 2 rue de Jouanet, 35700 Rennes, France
a r t i c l e i n f o
Article history:Received 24 April 2013Received in revised form 31 October 2013Accepted 15 November 2013Available online 25 November 2013This manuscript was handled by CorradoCorradini, Editor-in-Chief, with theassistance of Aldo Fiori, Associate Editor
Keywords:HydrogeologyCrystalline rocksLineamentFault zoneLarge scale pumping testSustainable groundwater resource
s u m m a r y
Crystalline-rock aquifers generally yield limited groundwater resources. However, some highly produc-tive aquifers may be encountered, typically near tectonic discontinuities. In this study, we used a multi-disciplinary experimental field approach to investigate the hydrogeological behavior of a sub-verticalpermeable fault zone identified by lineament mapping. We particularly focused our investigations onthe hydrogeological interactions with neighboring reservoirs.
The geometry of the permeable domains was identified from geological information and hydraulic testinterpretations. The system was characterized under natural conditions and during a 9-week large-scalepumping test. We used a combination of piezometric analysis, flow logs, groundwater dating and tracertests to describe the interactions between permeable domains and the general hydrodynamical behav-iors.
A clear vertical compartmentalization and a strong spatial heterogeneity of permeability are high-lighted. Under ambient conditions, the vertical permeable fault zone allows discharge of deep groundwa-ter flows within the superficial permeable domain. The estimated flow across the total length of the faultzone ranged from 170 to 200 m3/day. Under pumping conditions, hydrological data and groundwater dat-ing clearly indicated a flow inversion. The fault zone appears to be highly dependent on the surroundingreservoirs which mainly ensure its recharge. Groundwater fluxes were estimated from tracer tests inter-pretation. This study demonstrates the hydrogeological capacities of a sub-vertical fault aquifer in a crys-talline context. By describing the hydrological behavior of a fault zone, this study provides importantconstrain about groundwater management and protection of such resources.
� 2013 Elsevier B.V. All rights reserved.
1. Introduction
Crystalline rocks cover large areas throughout the world ofabout 35% of the continental surface (Amiotte Suchet et al., 2003;Blatt and Jones, 1975) and may constitute a crucial water resourcefor vast population. The porosity and permeability of primary crys-talline rocks are extremely low, but their hydraulic properties canbe greatly modified as a result of secondary physical processes(unloading, tectonic activities, etc.) and/or geochemical processessuch as weathering and fluid circulation (Bahat, 1999; Caineet al., 1996; Evans et al., 1997; Henriksen and Braathen, 2005;Taylor and Howard, 2002, 1999). Various conceptual models ofhydrogeological compartmentalization in crystalline rock aquifers
have been proposed (Chilton and Foster, 1995; Dewandel et al.,2006; Maréchal and Wyns, 2004; Taylor and Howard, 1999; Wynset al., 2004). They usually consist of two main reservoirs: (1) a layerof alterites (<15 m bgs), identified as a specific reservoir with arelatively high porosity and storage, highly sensitive to rainfallrecharge; (2) a superficial fractured zone, of various thicknessand which may be characterized by relatively dense sub-horizontaland sub-vertical fracturing. This fractured reservoir has in generala higher permeability although well yields are typically limited toless than 10 m3/h.
However, highly productive zones have been locally highlightedin regions exposed to past or current tectonic activity, such as Brit-tany. In practice, although controversial (Gleeson and Novakowski,2009), hydrogeologists often use fracture outcropping analysis or‘‘lineaments’’ mapping to determine drilling localization, especiallywhen such lineaments result from extensive tectonic activity(Gleeson and Novakowski, 2009; Henriksen and Braathen, 2005;Sander, 2006; Singhal and Gupta, 2010). Many factors must be

C. Roques et al. / Journal of Hydrology 509 (2014) 42–54 43
considered to ensure the viability of the resource such as rocklithology affected by tectonic activity, stress fields and intensityof deformation. Such factors and fluid flow processes determinefault zone permeability (Caine et al., 1996; Evans et al., 1997;Gleeson and Novakowski, 2009; Goddard and Evans, 1995). Fewhydrogeological studies examined relationships between linea-ments structures, hydrogeological flow organization and produc-tivity wells (Fernandes and Rudolph, 2001; Henriksen andBraathen, 2005; Holland and Witthüser, 2011; Richard et al.,2002; Sander, 2006). Fault zones may act as conduits, barriers, oras combined conduit-barrier systems that enhance or impede fluidflow (Bense and Person, 2006; Caine et al., 1996) but can alsosignificantly influence groundwater flow, spring discharge, andwater-table elevations (Apaydin, 2010; Gleeson and Novakowski,2009; Melchiorre et al., 1999).
In some cases, aquifers near highly conductive fault zones andwith relatively high production rates for crystalline rocks (from20 to 100 m3/h) have been described: Ploemeur aquifer, Brittany(Le Borgne et al., 2006a; Leray et al., 2013; Ruelleu et al., 2010),the New Hampshire Bedrock Aquifer (Richard et al., 2002), Crystal-line Rock Aquifers in New England (Harte et al., 2008) and in theLimpopo Province of South Africa (Holland and Witthüser, 2011).
The hydrodynamic functioning of fault structures in variousgeological contexts has been investigated in several studies. In sed-imentary media, Bense and Person (2006), Bense et al., (2003)showed the important effects of the geometry and anisotropy ofa fault zone on its hydraulic properties. Numerical studies, suchas those by Anderson and Bakker (2008), also highlighted the influ-ence of a vertical fault on groundwater flow. In the crystalline con-text, some studies have described the permeability architectureand hydrogeological functioning of fault zones for groundwater re-sources (Boutt et al., 2010; Caine and Tomusiak, 2003; Evans et al.,1997; Ganerod et al., 2008; Stober and Bucher, 1999) or hydrocar-bon entrapment (Aydin, 2000). However, very few studies haveanalyzed the hydrological functioning of faults in a water abstrac-tion context. In this context, aquifer yields will mainly depend onthe ability of interactions between the fault and the surroundingreservoirs to allow recharge and water availability. On the otherhand, groundwater abstraction from a deep resource will undoubt-edly modify the hydrodynamic gradients and lead to mixingbetween the different reservoirs. The hydrogeological influence ofdeep fault zones on overlaying reservoirs is poorly known and isapparently difficult to characterize by field studies (Banwartet al., 1994; Carucci et al., 2012; Folch and Mas-Pla, 2008; Gannonet al., 2011; Sophocleous, 2002). This question has been tackled outonly through few numerical studies, which have reported thehydrological efficiency of fault zones to act as preferential flowzone that enhances recharge processes from surrounding reser-voirs (Folch and Mas-Pla, 2008; Leray et al., 2013).
The first aim of this study is to characterize the hydrodynamicfunctioning of a sub-vertical permeable fault zone in crystallinebasement from a large-scale field experiment. The main objectivesare to (i) describe the architecture of the aquifer system, (ii) definethe flow organization between the permeable zones and rechargeprocesses towards the deep fault zone under natural and pumpingconditions and (iii) characterize the origin of groundwater andmixing processes due to groundwater abstraction. The experimentis carried out on a specific field site in Brittany (Western France),identified by lineament observation (Carn-Dheilly and Thomas,2008), where a permeable fault zone at more than 100 m depthis able to provide about 100 m3/h according to air-lift flowmeasurements.
We first describe the characteristics of the groundwater systemunder ambient conditions to highlight the hydrologic functioningof deep structures at the catchment scale. We then describe a9-week large-scale pumping test that was carried out to identify
the hydraulic properties of the aquifer system. During this test,various complementary experiments and measurements were con-ducted to investigate flow interactions between the different reser-voirs and to identify mixing processes. Finally, the combinedanalyses from this multidisciplinary experiment are used to devel-op a hydrogeological conceptual model of a sub-vertical fault zonein crystalline context.
2. Geological and hydrogeological setting
The experimental site of Saint-Brice en Coglès is located in theMancellian Domain of the ‘‘Massif Armoricain’’, in Brittany(France), where it constitutes the north western French part ofthe Cadomian and Variscan orogenies (Fig. 1a). This formationoutcrops from western to central Europe and is mainly composedof low to high grade (migmatite) metamorphic rocks, with regio-nal-scale magmatic intrusions (Cadomian granodiorites). TheMancellian Domain is limited in the north by the English Channel,and to the south by the North Armorican Shear Zone (NASZ). Themain lithologies encountered are Precambrian (Brioverian) sedi-mentary rocks (Fig. 1a), composed of alternating series of argil-lites/siltites and sandstones. These sedimentary rocks have beenaffected by low grade metamorphism which has formed a meta-morphic aureole around the Cadomian granodiorites on a regio-nal-scale (Ballèvre et al., 2009; Brun et al., 2001; Chantraineet al., 2001; Cogné and Wright, 1980). The most important defor-mation zone corresponds to a major ESE-WNW dextral strike-slipshear zone, the NASZ attributed to hercynian orogeny. SecondarySW–NE reverse faults are also found around this main shear zone.These terrains have been affected by Pyrenean and Alpine oroge-nies that have generated a diffuse deformation characterized byhalf-graben basins (Rennes basin, Landéan basin, etc.) andNW–SE sub-vertical faults (Grellet et al., 1993; Van Vliet-Lanoëet al., 1997).
The Saint-Brice en Coglès site is located in the epimetamor-phism zone of a large Cadomian pluton (Fougère granite). Therocks consist of Brioverian sediments metamorphosed into horn-fels schists. The vicinity of the site is characterized by parallelextensional N–S normal faults that form localized extensionalbasins (Geological map, BRGM (Dadet et al., 1984), Fig. 1b).
Local geological structures were imaged by carrying out astructural analysis including landscape, geological mapping andgeophysical (electric and seismic tomographies) analysis. Sub-vertical faults and extensional graben structures were clearlyidentified (Fig. 2a). In addition, three deep boreholes (MFT20,MFT80 and, F3) were drilled using ‘‘Down Hole Air Hammer’’ dril-ling method. Another deep borehole (FC4, 250 m), which has beenentirely cored, has been drilled along a profile perpendicular tothe orientation of the main accident lineament (Fig. 2b). Theborehole characteristics are detailed in Table 1. Several shallowboreholes (labeled T in Fig. 2b) were also drilled to characterizethe shallow weathered compartment. The first 10 m containedhighly weathered material with high clay and sand contents.Examination of the cores revealed that the Brioverian rocks werehighly deformed and fractured, and intruded by metric aplites,pegmatites and quartz veins, oriented N 50� to N 70�. Particularly,in the vicinity of the fault outcropping, the Brioverian rocks areaffected by horizontal fractures, characterized by a densitydecrease with depth, to an average of about 40–50 m. The mainfault zone was identified in each borehole as a highly fracturedand productive zone, ranging from a few meters thick (see coresampling in Fig. 2c) to 15 m in the outcropping part of the bore-hole (Tables 1 and 2). The fault typically dips by 70� to the NNW(Fig. 2c). Wells were completed with a slotted casing in the deepproductive zones.

Fig. 1. (a) Location map and regional geological map. Star symbol indicates the Saint-Brice en Coglès Field site, 48�250N 1�220W, alt. 90 m a.s.l. (modified from Chantraine,(Chantraine et al., 2001)). (b) Local geological map with main lineaments identified (modified Dadet, (Dadet et al., 1984) & IGN�).
44 C. Roques et al. / Journal of Hydrology 509 (2014) 42–54
3. Materials and methods
3.1. Field experiment
The interactions between the fault zone and the other hydro-logic domains were described and quantified by investigating thesite under natural conditions and during a large-scale pumpingtest. A packer was placed 80 m below the ground surface in bore-hole F3 to ensure that pumping was carried out deep within the
fault zone. As a result, water abstraction occurred principally fromthe fault zone at 110 m below ground surface (Table 1). Pumpinglasted for two months (63 days) at a flow rate of about 45 m3/h.During the pumping test, total rainfall was limited to 40 mm,and potential evapotranspiration was 90 mm (information avail-able from Saint Mars-sur-la-Futaie weather station-48�26’N0�58’W, 30 km north-east of the Saint-Brice site). Complementaryexperiments and analyses carried out are described in thefollowing.

Fig. 2. Geological conceptual model of the Saint-Brice en Coglès field site. (a) Conceptual geological structure in a 3D diagram representation, (b) local geological map andboreholes location and (c) cross-section of the structure perpendicular to the main identified lineament.
Table 1Borehole descriptions.
Well X (LAMB93) Y (LAMB93) Z (a.s.l.) Depth (m) Geology Slotted zone (m) Main fracture depth (m)
F3 376280 6822515 93.53 216 Brioverian bed rock 30–216 110; 135;160; 169; 180; 192FC4 376252 6822521 95.1 250 Brioverian bed rock 40–250 160; 204; 235MFT20 376286 6822500 93.68 20 Brioverian bed rock 10–20 –MFT80 376305 6822511 91.14 80 Brioverian bed rock 30–80 52; 69T1 376350 6822537 88.22 6 Alluvial deposits (wetland) 1–6 –T2 376353 6822504 88.27 8 Alluvial deposits (wetland) 2–6 –T3 376329 6822490 89.57 6 Alterites 3–6 –T4 376255 6822496 95.55 8 Alterites 4–8 –T5 376294 6822485 93.54 7 Alterites 4–7 –T6 376314 6822530 89.63 7 Alterites 2–6.5 –T7 376273 6822531 93.02 9 Alterites 5–9 –T8 376389 6822521 88.06 3 Alluvial deposits (wetland) 0.5–3 –
Table 2Transmissivity results obtained by modeling borehole flow profiles using Paillet solutions (Paillet, 1998).
Well Depth of fault zone (m) Ambient flowrate (L/mn) Total transmissivity (m2/s) Fractured zone transmissivity (m2/s) Part of total productivity (%)
FC4 235 3.5 1.3 � 10�3 9.8 � 10�4 75F3 90–116 3.5 1.8 � 10�3 8.8 � 10�4 50MFT80 48–53 2 7.9 � 10�4 5.9 � 10�4 75
C. Roques et al. / Journal of Hydrology 509 (2014) 42–54 45

46 C. Roques et al. / Journal of Hydrology 509 (2014) 42–54
3.2. Water level monitoring and analysis
Water levels were recorded using a pressure sensor with baro-metric compensation (STS� and Schlumberger� pressure trans-mitters). The altitude of the well was determined by differentialGPS. The estimated uncertainty for the absolute water level mea-surements was about a centimeter. The mean hydraulic parame-ters of the system under pumping conditions were determinedfrom classic analytical models. In addition, a logarithmic derivativemethod of drawdown measurement was used to analyze flowregimes (Bourdet and Ayoub, 1989; Renard et al., 2008; Spaneand Wurstner, 1993). This method also permitted identificationof flow behaviors and an estimation of the system’s transmissivitybased on Cooper and Jacob’s approximation (Renard et al., 2008).
3.3. High resolution flow and temperature logging
Structural heterogeneity of fractured rocks induces flow parti-tioning within the aquifer system. To examine preferential flowpath and fracture connectivity we used high-resolution flow log-ging (Heat Pulse Flowmeter, Geovista�) under ambient and pump-ing conditions (Le Borgne et al., 2006b; Paillet, 1998). Single-borehole flowmeter tests provide information on the main inflowor outflow zones in a well and measure the prevailing ambientflow conditions in the absence of pumping (Le Borgne et al.,2006b; Paillet, 1998). During a pumping test, cross-borehole flow-meter tests (pumping in a given well and measurement in another)are based on the observation that transient flow during pumping ina given aquifer modifies the hydraulic head distribution with timein the different permeable domains and produces measurablechanges in the vertical flow profiles. The connectivity and hydrau-lic properties of the main flow paths can be identified by transitoryflow measurements (Le Borgne et al., 2006b; Paillet, 1998).
To define flow paths and origin of the water, temperature log-ging was also used with a multi-parameter Hydrolab probe(OTT�) and Ocean seven 303 CTD (Idronaut�). Differences inhydraulic heads between the fractures in a borehole, under ambi-ent conditions or during pumping, will modify the temperatureprofile with respect to the geothermic gradient. Therefore thesetemperature profiles are very useful to identify hydraulic connec-tions between compartments and their evolution through time(Anderson, 2005; Bense et al., 2008; Chatelier et al., 2011).
3.4. Tracer tests
To identify transfer time distribution and to characterizegroundwater flows within the main transmissive fault zone, tracertests were performed between observation wells and the pumpedborehole. Tracer breakthrough concentrations were monitored inthe pumped well (F3) within the upper casing and below the pumpwith a flow-through field fluorometer developed by the Universityof Neuchâtel (Schnegg and Costa, 2007; Schnegg and Flynn, 2002).The fluorometers had been previously calibrated with tracer andlocal fresh water in the laboratory. To optimize injection, we iden-tified the main fractured part of the fault zone connected to thepumped well (F3) in each observation wells (MFT80 and FC4). Ura-nine tracer solution was injected in front of the main inflow zoneand we checked that no tracer solution remained in the boreholeafter the injection by logging concentration through boreholedepth.
3.5. Geochemistry and groundwater dating
To identify water origin and estimate mixing processes, we ana-lyzed geochemistry and groundwater dating data under ambientand pumping conditions. The apparent ages of water samples were
determined by measuring Chlorofluorocarbons (CFCs) concentra-tions. These anthropogenic gases provide information on ground-water resident times up to 50 years and can give information onmixing processes between different water sources during flowchanges (Ayraud et al., 2008; Busenberg and Plummer, 1992; Cookand Solomon, 1997; Cook et al., 2005; Jaunat et al., 2012). Waterswere sampled in stainless-steel ampoules after discarding at leastthree ampoule volumes, and ensuring that there was no contact ofthe water with atmospheric gases.
Groundwater CFCs concentrations were measured by the Geo-sciences Rennes Laboratory (Labasque, 2006). Water samples weredegassed by N2 stripping and then injected into a gas chromato-graph equipped with an electron capture detector (GC–ECD). TheCFC concentration obtained by chromatographic analysis was con-verted to the atmospheric mixing ratio (pptv – Parts per Trillion byVolume) by applying a solubility function (modified Henry’s Lawfor trace gases (Ayraud et al., 2008; Bu and Warner, 1995; Warnerand Weiss, 1985; Weiss and Price, 1980)). The CFC atmosphericmixing ratios were then compared with the atmospheric evolutioncurve (Walker et al., 2000) to determine the apparent rechargeyear, and thus the apparent age of the groundwater. Analyticaluncertainty for the CFC concentrations was estimated (Labasque,2006) at around 3% for recent water (<20 years) and 5% for oldwater (between 55 and 30 years).
Major and trace elements were analyzed by ion chromatogra-phy (Dionex DX-100) and ICP-MS HP 4500 at the GeosciencesRennes Laboratory following standard laboratory methods. Theanalytical uncertainty for major anions and cations was about 2%.
4. Results
4.1. Ambient flow condition
Fig. 3 shows the evolution of hydraulic head in the main bore-holes representative of the fractured domains (FC4, F3, MFT80and MFT20) and in the upper weathered reservoir (Ti). The seasonalevolution of hydraulic head is similar in all the aquifer system witha fast response to rainfall during the recharge periods and a classicdischarge regime observed during summer.
The hydraulic head gradient mostly follows the topography andindicates groundwater flow towards the outcropping of the faultzone and discharge into the river (FC4-F3-MFT80 in Fig. 2b andc). Measurements of the hydraulic gradient with depth revealed ahigher hydraulic head in the deeper boreholes (Fig. 3). This sug-gests a definite vertical compartmentalization of the aquifer sys-tem. The three boreholes intersecting the permeable fault zoneshow similar hydraulic responses, with a potential upward flow,according to the hydraulic gradient analysis. The MFT20 well,located at the edge of the weathered and the fractured bed rock,remains under the influence of the fault zone. The sub-surfaceaquifer situated within the upper weathered part (Ti boreholes),appears to be much less influenced by the deep structure.
The fault domain responds quickly to rainfall even though it islocally covered by the sub-surface reservoir with lower hydraulichead. This suggests that the bed rock domain can respond rapidlyto recharge. The recharge area is certainly along strike and up topo-graphic gradient through favorable deep fractured zones.
A typical variation of flow rate with depth is shown in Fig. 4. Allflow profiles obtained under ambient conditions reveal upwardflow, implying that hydraulic head is higher in the deep fractures(235 m for FC4) than in the upper fractures (45 m for FC4). FC4 pro-file in ambient conditions show a major inflow zone at 245 m deepand a major outflow zone at 49 m deep (Fig. 4a). No other contrib-uting fractures can be detected, either because of the limit ofdetection of the tool, or simply because of the lack of any hydraulic
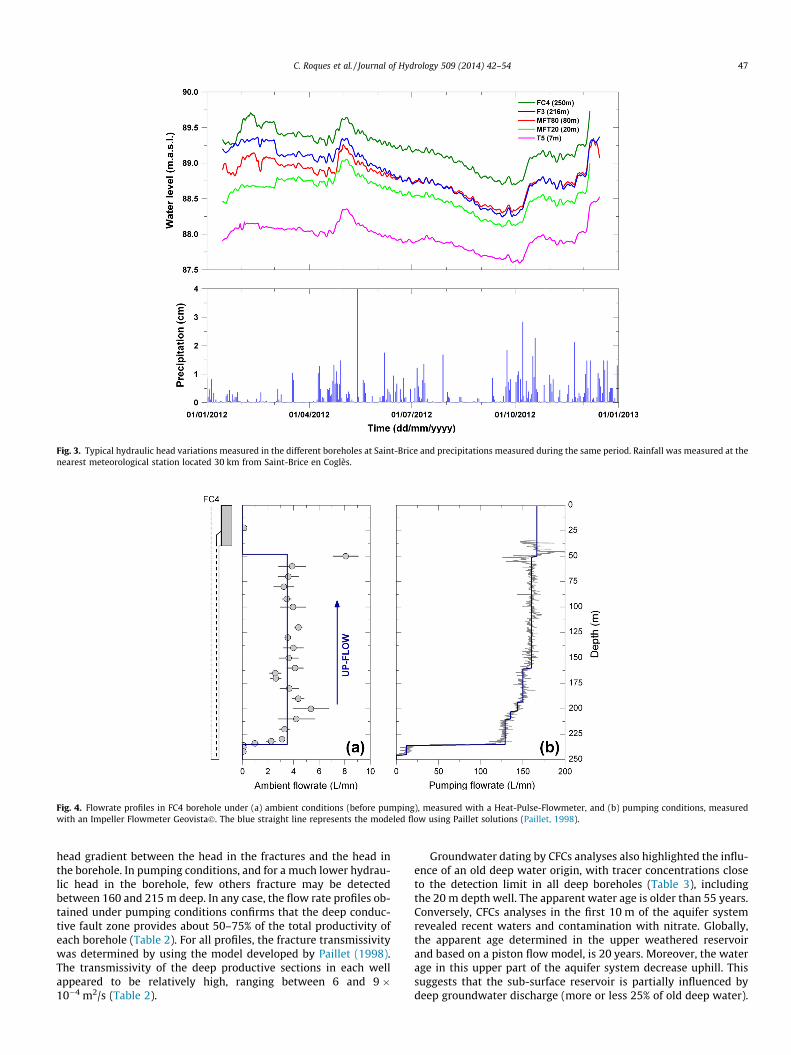
Fig. 3. Typical hydraulic head variations measured in the different boreholes at Saint-Brice and precipitations measured during the same period. Rainfall was measured at thenearest meteorological station located 30 km from Saint-Brice en Coglès.
Fig. 4. Flowrate profiles in FC4 borehole under (a) ambient conditions (before pumping), measured with a Heat-Pulse-Flowmeter, and (b) pumping conditions, measuredwith an Impeller Flowmeter Geovista�. The blue straight line represents the modeled flow using Paillet solutions (Paillet, 1998).
C. Roques et al. / Journal of Hydrology 509 (2014) 42–54 47
head gradient between the head in the fractures and the head inthe borehole. In pumping conditions, and for a much lower hydrau-lic head in the borehole, few others fracture may be detectedbetween 160 and 215 m deep. In any case, the flow rate profiles ob-tained under pumping conditions confirms that the deep conduc-tive fault zone provides about 50–75% of the total productivity ofeach borehole (Table 2). For all profiles, the fracture transmissivitywas determined by using the model developed by Paillet (1998).The transmissivity of the deep productive sections in each wellappeared to be relatively high, ranging between 6 and 9 �10�4 m2/s (Table 2).
Groundwater dating by CFCs analyses also highlighted the influ-ence of an old deep water origin, with tracer concentrations closeto the detection limit in all deep boreholes (Table 3), includingthe 20 m depth well. The apparent water age is older than 55 years.Conversely, CFCs analyses in the first 10 m of the aquifer systemrevealed recent waters and contamination with nitrate. Globally,the apparent age determined in the upper weathered reservoirand based on a piston flow model, is 20 years. Moreover, the waterage in this upper part of the aquifer system decrease uphill. Thissuggests that the sub-surface reservoir is partially influenced bydeep groundwater discharge (more or less 25% of old deep water).

Table 3CFC and SF6 concentrations converted into atmospheric concentration (PPTV, (Bu andWarner, 1995; Warner and Weiss, 1985)).
Well SF6 (pptv) CFC-12 (pptv) CFC-11 (pptv) CFC-113 (pptv)
F3 0 50.13 6.03 14.47FC4 0 19.85 5.83 31.04MFT20 0.87 48.29 6.64 21.48MFT80 0.5 52.93 5.11 24.22T’s (mean) 2.79 458.79 271.52 56.66
Fig. 6. Diagnostic plot in Log scales showing drawdown (blue straight line)normalized by flow rate (s/Q), and its derivative (blue point symbol) measuredduring the long term pumping test in F3. (For interpretation of the references tocolor in this figure legend, the reader is referred to the web version of this article.)
48 C. Roques et al. / Journal of Hydrology 509 (2014) 42–54
To summarize, three main hydraulic domains were highlightedat the Saint-Brice en Coglès site: (1) the fault zone which has ahigher transmissivity, (2) the surrounding domain affected by sec-ondary fractures less transmissive and (3) the upper weatheredpart of the aquifer system, restricted to the first 10 m. Under ambi-ent conditions, the hydrogeological system is clearly driven by thedischarge from a deep groundwater system towards the upper partof the aquifer system and the local stream.
4.2. Pumping condition
4.2.1. Evolution of hydraulic heads and diagnostic plotDuring the 63-days pumping experiment, the hydraulic heads
in the different boreholes were recorded (Fig. 5). All wells locatedin or near the sub-vertical fault zone, including the shallow piez-ometers in the sub-surface weathered domain, reacted quickly topumping. During the first 10 days, drawdown was limited to afew meters and was similar in all boreholes. This suggests a goodconnection between the upper and lower domains of the aquifersystem. After 10 days of pumping, drawdown has exceeded thedepth of the sub-surface wells (<10 m deep), due to desaturationof the upper weathered reservoir around the pumping well. Asobserved in all deep boreholes, drawdown increased significantlyduring the last 50 days of pumping (Fig. 5).
Fig. 6 displays the normalized drawdown (s/Q) of pumping wellF3 and its derivative through time in a log–log diagram. The evolu-tion of the derivative curve provides information on flow behaviorsand on boreholes effects such as wellbore storage and skin effects.Such diagnostic curves can be used to interpret different flowregimes (Bourdet et al., 1983; Renard et al., 2008), e.g. doubleporosity, leakage effect, no-flows boundaries, etc. Here, consideringthe specific geometry of the aquifer system, we assumed that flowregimes can be described through a simple model developed for
Fig. 5. Drawdown in the pumping well (F3, blue triangle dots), in observation wellsintersecting the fault zone aquifer (FC4, MFT80 and MFT20, gray points) andobservation wells located in the shallow aquifer (T1, T2, T3, T5, T6 and T7, blacklines). (For interpretation of the references to color in this figure legend, the readeris referred to the web version of this article.)
fracture or strip aquifer embedded in lower permeable block(Butler and Liu, 1991; Escobar and Hernández, 2010; Gringarten,1996; Moench, 1984; Rafini and Larocque, 2009; Tiab, 2005). Suchfracture models involve generally three characteristic flowregimes: the early local response of the fault zone, a period oftransition controlled by the geometrical fault zone properties atlarger scale and finally the global hydraulic response of the system.
Flow behaviors can be detailed as follow through derivativedescription: (Fig. 6). (1) After the first early-time where the draw-down response is influenced by wellbore storage and skin effects, ashort radial flow response is observed. This reflects the behavior ofthe local permeable fault zone, where water was principallyextracted from the local fracture storage and eventually fed byproximal matrix storage and/or local leakage from overlaying aqui-fers. The constant derivative value suggests a transmissivityaround 10�3 m2 s�1. The derivative decrease between 0.1 and1 day can be the consequence of preferential leaky flows from shal-lower reservoir. (2) Between 1 and 30 days of pumping, the draw-down derivative curve is characterized by a transitory period witha strong increase (derivative slope of 1/2). This derivative increasecan be interpreted as double porosity behavior for which lateralinflows from surrounding reservoirs supply the permeable faultat larger scale. The fault geometry can also influence the draw-down during this transitory period which induces linear flowregime. (3) Finally, the system reached a radial flow conditionduring the last month of pumping, where the whole system wassolicited indicating that the major flow comes from surroundinglow-permeability domains (Butler and Liu, 1991). The normalizedconstant derivative of 0.18 m at the end of the test implies a globaltransmissivity of the aquifer system about 10�4 m2 s�1.
4.2.2. Flowmeter test and temperature loggingFlow and temperature logs under natural and pumping condi-
tions are presented for MFT80 in Fig. 7. Other observation wellsyielded similar results. Under ambient conditions, upward flowswere identified (Fig. 7a1), implying that the hydraulic head in thedeeper part of the fault zone was higher than in the upper partof the aquifer domain. During pumping, downward flows weremeasured, indicating a greater decrease of the hydraulic head inthe fault zone. Downward flow could be even 3 times greater thanthe previous upward flow, which implied a clear inversion of flowbetween the hydraulic permeable domains (Fig. 7b1). Nevertheless,the downward borehole flows slowed down after a few days, inconjunction with the decrease in head gradient between the twocompartments (Fig. 7c1).

Fig. 7. Flow and temperature profiles under ambient (grey lines) and pumping conditions (after 9 and 63 days of pumping) in observation well (MFT80).
C. Roques et al. / Journal of Hydrology 509 (2014) 42–54 49
Temperature logs (Fig. 72), carried out under ambient condi-tions and during pumping in all observation wells, showed a cleartemperature decrease of about 0.2–1 �C with pumping. The homo-geneity of the profiles, with lower temperatures than under ambi-ent conditions, suggests that the deep aquifer domain was fed bycolder water coming from the sub-surface domain (Fig. 7b2 andc2). This confirms that pumping is initiated within the fault zoneat depth and that the upper aquifer domain is supplying the deeperstructure.
4.2.3. Pumping test modelingThe hydraulic parameters of the aquifer system were evaluated
by fitting the drawdown data with classic analytical models. Differ-ent solutions were applied to interpret the dataset at differenttimes (Fig. 8) in view to characterize the two main flow behaviorsinvolved during the test, previously characterized by the derivative
interpretation: (1) the fault storage response, supported by leakyflow from the weathered part of the aquifer system (<10 days ofpumping) and (2) the global double porosity response of the aqui-fer system during long term pumping.
For the first 10 days of pumping, the double porosity analyticalsolution according to Moench’s model (Moench, 1984) was used tomodel the local fault zone response. This model is based on theconcept of a fracture embedded within blocks of lower permeabil-ity, characterized by matrix storage. Solutions are presented inequations 19 and 20 from the Moench paper of 1984 and plottedfor the early time in MFT80 for both drawdown and its derivativein Fig. 8a. Quadratic head losses were estimated by a variable ratepumping test at 2.5 � 104 m�5 s2. Hydraulic parameters deducedfrom all wells are listed in Table 4. These parameters confirm that,during the first days of pumping, flow is controlled by a relativelyhigh transmissive (T1 = 7 � 10�4 m2 s�1 fault zone embedded in

Fig. 8. Drawdown (s) evolution with time and its derivative (s’) during pumping. Observations come from MFT80 observation well. Moench and Boulton (modified Hunt)analytical models were used to fit both drawdown and derivative curves. In (a) only the first ten days were fitted while in (b) Moench’s model was fitted to pumping resultsobtained at later times.
Table 4Pumping test results for pumping well F3 and observation wells MFT80, FC4 and MFT20. RMSE is calculated over the analyzed part of the pumping test. Bold values arerepresentative of the global aquifer system parameters.
Wells Analytical models Fault aquifer Blocks parameters Superficial aquifer Error
T (m2/s) S (dless) Kb (m/s) Sb (1/m) T0 (m2/s) Sy (dless) kV (m/s) RMSE (m)
F3 Moench early time 7.00E�04 – 2.47E�08 2.62E�04 – – – 0.98Hunt early time 4.79E�04 – – – 8.13E�05 – – 0.55Moench global 1.05E�04 7.00E�03 – – – – – 0.95
MFT80 Moench early time 7.38E�04 7.00E�04 1.34E�09 1.15E�05 – – – 0.59Hunt early time 4.84E�04 1.80E�03 – – 8.10E�05 0.02 1.09E�07 0.37Moench global 9.03E�05 1.75E�03 1.28E�08 1.18E�03 – – – 0.56
FC4 Moench early time 6.25E�04 8.40E�04 8.47E�10 9.84E�06 – – – 0.93Hunt early time 3.87E�04 1.61E�03 – – 6.94E�05 0.02 8.00E�08 0.21Moench global 1.13E�04 1.61E�03 8.15E�09 6.53E�04 – – – 0.57
MFT20 Moench early time 6.02E�04 1.05E�02 3.35E�08 2.62E�04 – – – 0.69Hunt early time 7.27E�04 1.17E�02 – – 5.79E�05 0.05 8.04E�07 0.19Moench global 9.78E�05 7.00E�03 6.33E�08 3.07E�03 – – – 0.57
50 C. Roques et al. / Journal of Hydrology 509 (2014) 42–54
lower permeability blocks (Kb = 2 � 10�8 m s�1. A strong fractureskin value (set to 1) was required to model the first times of bothdrawdown and derivative, which suggest a strong delay contribu-tion between surrounding blocks to the fractured zone (Moench,1984).
We also used the ‘‘Two Aquifer-System’’ model developed byHunt and Scott (2007) to characterize drainage flows from weath-ered reservoir to the fractured domain. This model assumes ascreened well in an aquifer overlain by an aquitard and an uncon-fined aquifer which may represent here the upper weathered res-ervoir. A mean transmissivity of T1 = 5 � 10�4 m2 s�1 for thedeeper aquifer domain, and transmissivity and porosity estimatesof 6 � 10�5 m2 s�1 and 2% respectively, for the superficial aquiferwas required to fit both drawdowns and derivatives (plot inFig. 8a, results in Table 4).
For modeling the hydraulic behavior of the hydrological systemat global scale after the first 8 h of pumping, Moench’s model(Moench, 1984) proved to be the simplest and most efficient modelto reproduce the data (Fig. 8b). The estimated transmissivity of thefractured system is T1 = 10�4 m2 s�1 s�1, embedded within a reser-voir (matrix) with a lower permeability of Kb = 2 � 10�8 m s�1 anda relatively high specific storage of Sb = 10�3 m�1. A high value offracture skin is still necessary to reproduce the transitory flowregime observed during transitory pumping times (Fig. 6). Thetransmissivity deduced for long times pumping tends to thetransmissivity of the global permeable system (Butler and Liu,1991).
Note that the estimation of storativity in adjacent blocks basedon Moench’s model is relatively large. However, storativity is ingeneral difficult to estimate in heterogeneous crystalline rocks(Burbey, 2003; Le Borgne et al., 2006a; Meier et al., 1998; Neuman,1979). This higher value may also reflect the fact that only twomain compartments (fracture and matrix) were used in the model,whereas several capacitive domains, including a superficial one inthe weathered rocks, may actually be involved in the response topumping.
4.2.4. Geochemistry and groundwater datingChemical analyses of major ions revealed Na-Si-HCO3 in water
from the fault zone and Na-Mg-HCO3 SO4–Cl, characteristic ofanthropogenic activities, in water from the shallower weathereddomain. A clear evolution of groundwater chemistry was observedduring pumping, due to the mixing of water of different origins. Inparticular, mixing with the upper weathered reservoir was clearlyapparent during the first ten days of pumping. The geochemicalresponse after a longer period was dependent both on shallowerand ‘‘matrix’’ contributions and modified by reactivity processes.Description of geochemical evolution will require a much moredetailed analysis and will be published in another article (Roqueset al., ‘‘In Preparation’’). Our main focus here is to highlight changesin the apparent age of groundwater, using conservative anthropo-genic tracers such as CFCs to highlight the mixing processes.
The evolution of groundwater apparent age was deduced fromthe CFC-12 and CFC-113 concentrations in samples taken at the
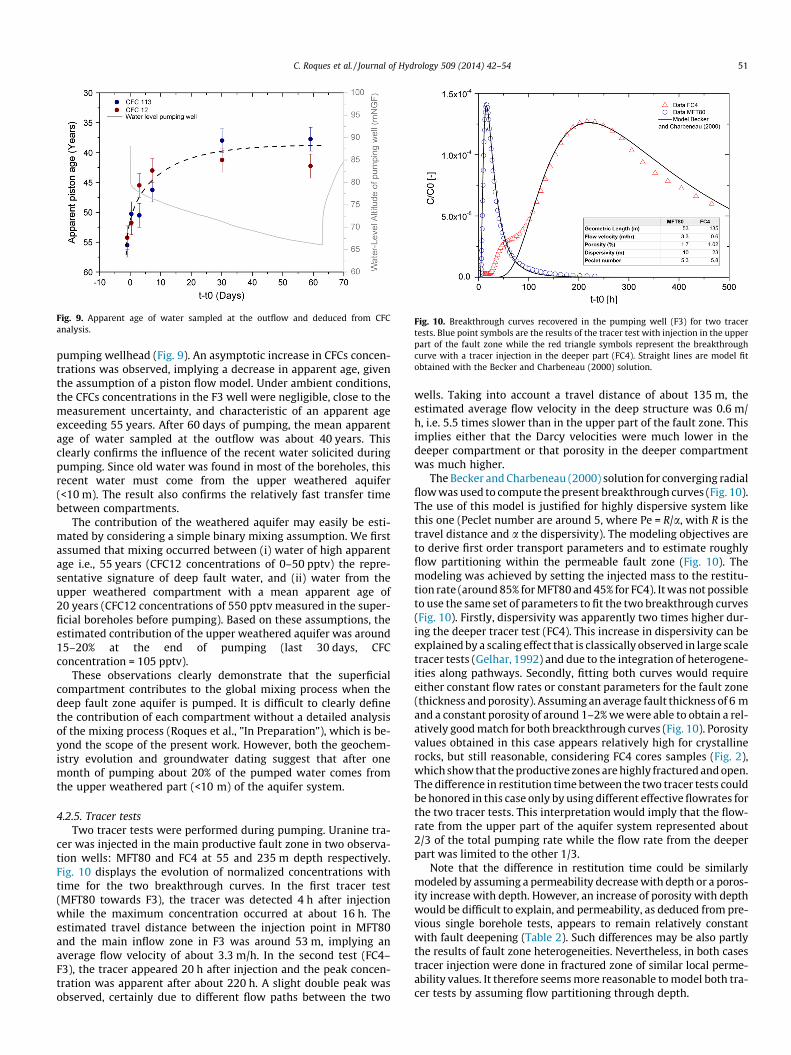
Fig. 9. Apparent age of water sampled at the outflow and deduced from CFCanalysis.
Fig. 10. Breakthrough curves recovered in the pumping well (F3) for two tracertests. Blue point symbols are the results of the tracer test with injection in the upperpart of the fault zone while the red triangle symbols represent the breakthroughcurve with a tracer injection in the deeper part (FC4). Straight lines are model fitobtained with the Becker and Charbeneau (2000) solution.
C. Roques et al. / Journal of Hydrology 509 (2014) 42–54 51
pumping wellhead (Fig. 9). An asymptotic increase in CFCs concen-trations was observed, implying a decrease in apparent age, giventhe assumption of a piston flow model. Under ambient conditions,the CFCs concentrations in the F3 well were negligible, close to themeasurement uncertainty, and characteristic of an apparent ageexceeding 55 years. After 60 days of pumping, the mean apparentage of water sampled at the outflow was about 40 years. Thisclearly confirms the influence of the recent water solicited duringpumping. Since old water was found in most of the boreholes, thisrecent water must come from the upper weathered aquifer(<10 m). The result also confirms the relatively fast transfer timebetween compartments.
The contribution of the weathered aquifer may easily be esti-mated by considering a simple binary mixing assumption. We firstassumed that mixing occurred between (i) water of high apparentage i.e., 55 years (CFC12 concentrations of 0–50 pptv) the repre-sentative signature of deep fault water, and (ii) water from theupper weathered compartment with a mean apparent age of20 years (CFC12 concentrations of 550 pptv measured in the super-ficial boreholes before pumping). Based on these assumptions, theestimated contribution of the upper weathered aquifer was around15–20% at the end of pumping (last 30 days, CFCconcentration = 105 pptv).
These observations clearly demonstrate that the superficialcompartment contributes to the global mixing process when thedeep fault zone aquifer is pumped. It is difficult to clearly definethe contribution of each compartment without a detailed analysisof the mixing process (Roques et al., "In Preparation"), which is be-yond the scope of the present work. However, both the geochem-istry evolution and groundwater dating suggest that after onemonth of pumping about 20% of the pumped water comes fromthe upper weathered part (<10 m) of the aquifer system.
4.2.5. Tracer testsTwo tracer tests were performed during pumping. Uranine tra-
cer was injected in the main productive fault zone in two observa-tion wells: MFT80 and FC4 at 55 and 235 m depth respectively.Fig. 10 displays the evolution of normalized concentrations withtime for the two breakthrough curves. In the first tracer test(MFT80 towards F3), the tracer was detected 4 h after injectionwhile the maximum concentration occurred at about 16 h. Theestimated travel distance between the injection point in MFT80and the main inflow zone in F3 was around 53 m, implying anaverage flow velocity of about 3.3 m/h. In the second test (FC4–F3), the tracer appeared 20 h after injection and the peak concen-tration was apparent after about 220 h. A slight double peak wasobserved, certainly due to different flow paths between the two
wells. Taking into account a travel distance of about 135 m, theestimated average flow velocity in the deep structure was 0.6 m/h, i.e. 5.5 times slower than in the upper part of the fault zone. Thisimplies either that the Darcy velocities were much lower in thedeeper compartment or that porosity in the deeper compartmentwas much higher.
The Becker and Charbeneau (2000) solution for converging radialflow was used to compute the present breakthrough curves (Fig. 10).The use of this model is justified for highly dispersive system likethis one (Peclet number are around 5, where Pe = R/a, with R is thetravel distance and a the dispersivity). The modeling objectives areto derive first order transport parameters and to estimate roughlyflow partitioning within the permeable fault zone (Fig. 10). Themodeling was achieved by setting the injected mass to the restitu-tion rate (around 85% for MFT80 and 45% for FC4). It was not possibleto use the same set of parameters to fit the two breakthrough curves(Fig. 10). Firstly, dispersivity was apparently two times higher dur-ing the deeper tracer test (FC4). This increase in dispersivity can beexplained by a scaling effect that is classically observed in large scaletracer tests (Gelhar, 1992) and due to the integration of heterogene-ities along pathways. Secondly, fitting both curves would requireeither constant flow rates or constant parameters for the fault zone(thickness and porosity). Assuming an average fault thickness of 6 mand a constant porosity of around 1–2% we were able to obtain a rel-atively good match for both breackthrough curves (Fig. 10). Porosityvalues obtained in this case appears relatively high for crystallinerocks, but still reasonable, considering FC4 cores samples (Fig. 2),which show that the productive zones are highly fractured and open.The difference in restitution time between the two tracer tests couldbe honored in this case only by using different effective flowrates forthe two tracer tests. This interpretation would imply that the flow-rate from the upper part of the aquifer system represented about2/3 of the total pumping rate while the flow rate from the deeperpart was limited to the other 1/3.
Note that the difference in restitution time could be similarlymodeled by assuming a permeability decrease with depth or a poros-ity increase with depth. However, an increase of porosity with depthwould be difficult to explain, and permeability, as deduced from pre-vious single borehole tests, appears to remain relatively constantwith fault deepening (Table 2). Such differences may be also partlythe results of fault zone heterogeneities. Nevertheless, in both casestracer injection were done in fractured zone of similar local perme-ability values. It therefore seems more reasonable to model both tra-cer tests by assuming flow partitioning through depth.
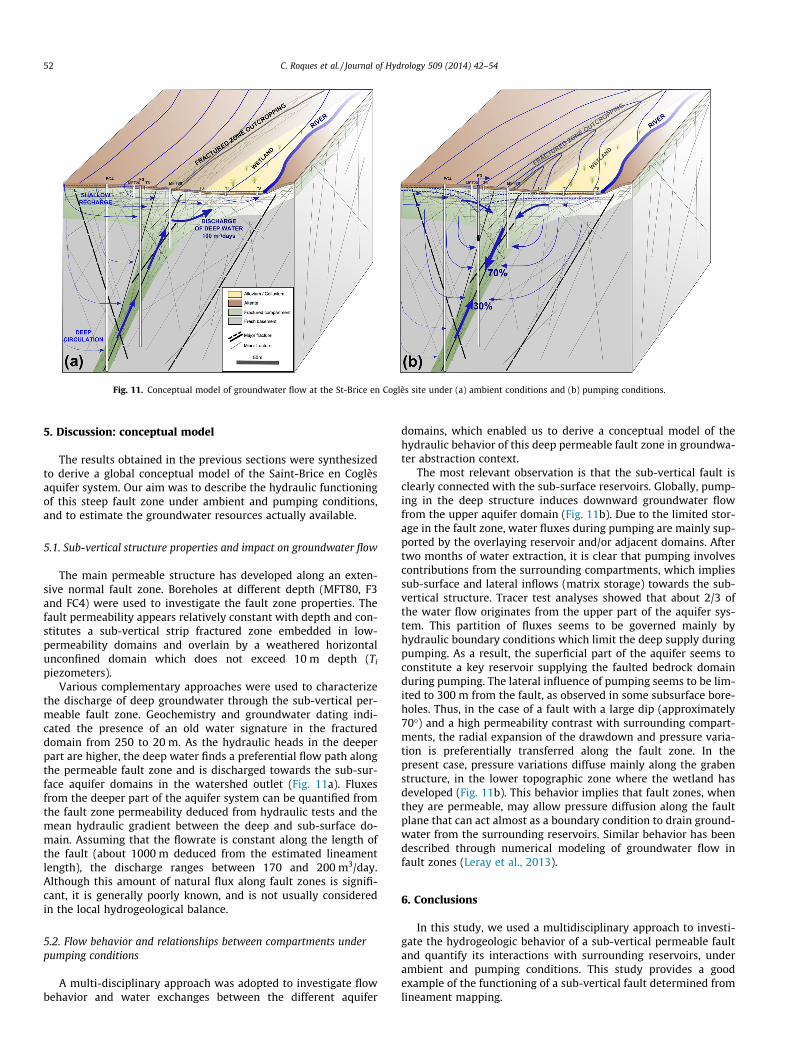
Fig. 11. Conceptual model of groundwater flow at the St-Brice en Coglès site under (a) ambient conditions and (b) pumping conditions.
52 C. Roques et al. / Journal of Hydrology 509 (2014) 42–54
5. Discussion: conceptual model
The results obtained in the previous sections were synthesizedto derive a global conceptual model of the Saint-Brice en Coglèsaquifer system. Our aim was to describe the hydraulic functioningof this steep fault zone under ambient and pumping conditions,and to estimate the groundwater resources actually available.
5.1. Sub-vertical structure properties and impact on groundwater flow
The main permeable structure has developed along an exten-sive normal fault zone. Boreholes at different depth (MFT80, F3and FC4) were used to investigate the fault zone properties. Thefault permeability appears relatively constant with depth and con-stitutes a sub-vertical strip fractured zone embedded in low-permeability domains and overlain by a weathered horizontalunconfined domain which does not exceed 10 m depth (Ti
piezometers).Various complementary approaches were used to characterize
the discharge of deep groundwater through the sub-vertical per-meable fault zone. Geochemistry and groundwater dating indi-cated the presence of an old water signature in the fractureddomain from 250 to 20 m. As the hydraulic heads in the deeperpart are higher, the deep water finds a preferential flow path alongthe permeable fault zone and is discharged towards the sub-sur-face aquifer domains in the watershed outlet (Fig. 11a). Fluxesfrom the deeper part of the aquifer system can be quantified fromthe fault zone permeability deduced from hydraulic tests and themean hydraulic gradient between the deep and sub-surface do-main. Assuming that the flowrate is constant along the length ofthe fault (about 1000 m deduced from the estimated lineamentlength), the discharge ranges between 170 and 200 m3/day.Although this amount of natural flux along fault zones is signifi-cant, it is generally poorly known, and is not usually consideredin the local hydrogeological balance.
5.2. Flow behavior and relationships between compartments underpumping conditions
A multi-disciplinary approach was adopted to investigate flowbehavior and water exchanges between the different aquifer
domains, which enabled us to derive a conceptual model of thehydraulic behavior of this deep permeable fault zone in groundwa-ter abstraction context.
The most relevant observation is that the sub-vertical fault isclearly connected with the sub-surface reservoirs. Globally, pump-ing in the deep structure induces downward groundwater flowfrom the upper aquifer domain (Fig. 11b). Due to the limited stor-age in the fault zone, water fluxes during pumping are mainly sup-ported by the overlaying reservoir and/or adjacent domains. Aftertwo months of water extraction, it is clear that pumping involvescontributions from the surrounding compartments, which impliessub-surface and lateral inflows (matrix storage) towards the sub-vertical structure. Tracer test analyses showed that about 2/3 ofthe water flow originates from the upper part of the aquifer sys-tem. This partition of fluxes seems to be governed mainly byhydraulic boundary conditions which limit the deep supply duringpumping. As a result, the superficial part of the aquifer seems toconstitute a key reservoir supplying the faulted bedrock domainduring pumping. The lateral influence of pumping seems to be lim-ited to 300 m from the fault, as observed in some subsurface bore-holes. Thus, in the case of a fault with a large dip (approximately70�) and a high permeability contrast with surrounding compart-ments, the radial expansion of the drawdown and pressure varia-tion is preferentially transferred along the fault zone. In thepresent case, pressure variations diffuse mainly along the grabenstructure, in the lower topographic zone where the wetland hasdeveloped (Fig. 11b). This behavior implies that fault zones, whenthey are permeable, may allow pressure diffusion along the faultplane that can act almost as a boundary condition to drain ground-water from the surrounding reservoirs. Similar behavior has beendescribed through numerical modeling of groundwater flow infault zones (Leray et al., 2013).
6. Conclusions
In this study, we used a multidisciplinary approach to investi-gate the hydrogeologic behavior of a sub-vertical permeable faultand quantify its interactions with surrounding reservoirs, underambient and pumping conditions. This study provides a goodexample of the functioning of a sub-vertical fault determined fromlineament mapping.

C. Roques et al. / Journal of Hydrology 509 (2014) 42–54 53
Our results suggest that sub-vertical fault and sub-surface res-ervoirs are highly dependent on each other. Under ambient condi-tions, the fault allows the discharge of regional old water intosuperficial aquifer domains. The natural discharge rate of the faultzone is estimated to be around 170–200 m3/day. Although rela-tively low, this value should be taken into account when estimat-ing water fluxes, hydrologic budget and solute transport at thewatershed scale. During the early stages of pumping, the hydrolog-ical system is dependent on storage from the sub-surface reservoir.Once the upper weathered reservoir has become mainly unsatu-rated, the system acts as a classic dual porosity medium with ahighly transmissive structure embedded in lower permeable com-partments. Thus, this high permeability fault zone appears to be anefficient thin permeable domain that permits rapid diffusion ofpressure but is strongly dependent on sub-surface and adjacentdomains of higher storativity. All field measurements suggest thatunder pumping conditions, most of the flow comes from superficialdomains and from the vicinity of the fault zone, with a rechargearea located at the surface mainly along the fault zone. Moreover,such steep fault zones, although of relatively high transmissivity,remain relatively limited in terms of groundwater yield. In thisstudy, the pumping test was carried out for 2 months at a flow-rateof 45 m3/h, but the piezometric analysis indicates that this ratewas certainly too high to be sustainable. A better estimate of sus-tainable flowrate would be around 20–30 m3/h. This is a muchlower value than some other fault zone aquifers, such as gentlydipping fault zones which may provide higher groundwaterresources (Le Borgne et al., 2006a; Ruelleu et al., 2010). Thisdifference confirms the role of the dip of the fault-zone that maygreatly increase borehole yield in some circumstances (Lerayet al., 2013).
Acknowledgments
Most funding came from the CASPAR project in collaborationwith OSUR and BRGM and co-funded by the French Water Agencyof Loire-Brittany (AELB), the Regional of Council of French Brittany,the Department of Ile-et-Vilaine, the City of Rennes and the FrenchMinistry for Education and Research. We also wish to thank theEuropean Interreg IV project Climawat, which partly funded someof the experiments. We want to thank Matthew Becker and anon-ymous reviewer for their very constructive and encouraging com-ments. We would also like to thank Nicolas Guihéneuf for his helpto interpret our tracer test results. We thank all the people whowere involved in the project: Odile Hénin, Martine Bouhnik-LeCoz, Patrice Petitjean, Patricia Madec, Hélène Pauwels, Flora Lucas-sou, Jean-Pierre Jegou, Eric Palvadeau, Antoine Armandine Les-Landes, Joaquin Jimenez-Martinez, Pascal Goderniaux, ThomasStieglitz, Stéphane Durand, Ghislain Ferre, Olivier Dauteil, ChristianCamerlynck, Pierre-Yves Galibert, Fayçal Rejiba, Philippe Bardy,Antoine Rivera, etc.
References
Amiotte Suchet, P., Probst, J.-L., Ludwig, W., 2003. Worldwide distribution ofcontinental rock lithology: Implications for the atmospheric/soil CO2 uptake bycontinental weathering and alkalinity river transport to the oceans. GlobalBiogeochem. Cycles 17, 1–13.
Anderson, M.P., 2005. Heat as a ground water tracer. Ground water 43, 951–968.Anderson, E.I., Bakker, M., 2008. Groundwater flow through anisotropic fault zones
in multiaquifer systems. Water Resour. Res. 44, 1–11.Apaydin, A., 2010. Relation of tectonic structure to groundwater flow in the
Beypazari region, NW Anatolia, Turkey. Hydrogeol. J. 18, 1343–1356.Aydin, A., 2000. Fractures, faults, and hydrocarbon entrapment, migration and flow.
Mar. Pet. Geol. 17, 797–814.Ayraud, V., Aquilina, L., Labasque, T., Pauwels, H., Molenat, J., Pierson-Wickmann, A.-
C., Durand, V., Bour, O., Tarits, C., Le Corre, P., 2008. Compartmentalization ofphysical and chemical properties in hard-rock aquifers deduced from chemicaland groundwater age analyses. Appl. Geochem. 23, 2686–2707.
Bahat, D., 1999. Mechanism of exfoliation joint formation in granitic rocks,Yosemite National Park. J. Struct. Geol. 21, 85–96.
Ballèvre, M., Bosse, V., Ducassou, C., Pitra, P., 2009. Palaeozoic history of theArmorican Massif: Models for the tectonic evolution of the suture zones.Comptes Rendus Geosci. 341, 174–201.
Banwart, S., Gustafsson, E., Laaksoharju, M., 1994. Fracture zone in crystallinebedrock: initial hydrochemical perturbation during tunnel construction at theÄspö Hard Rock Laboratory, southeastern Sweden. Water Resour. Res. 30, 1747–1763.
Becker, M.W., Charbeneau, R., 2000. First-passage-time transfer functions forgroundwater tracer tests conducted in radially convergent flow. J. Contam.Hydrol. 40, 299–310.
Bense, V.F., Person, M.a., 2006. Faults as conduit-barrier systems to fluid flow insiliciclastic sedimentary aquifers. Water Resour. Res. 42, 1–18.
Bense, V.F., Van den Berg, E.H., Van Balen, R.T., 2003. Deformation mechanisms andhydraulic properties of fault zones in unconsolidated sediments; the RoerValley Rift System, The Netherlands. Hydrogeol. J. 11, 319–332.
Bense, V.F., Person, M.a., Chaudhary, K., You, Y., Cremer, N., Simon, S., 2008. Thermalanomalies indicate preferential flow along faults in unconsolidated sedimentaryaquifers. Geophys. Res. Lett. 35, 1–6.
Blatt, H., Jones, R., 1975. Proportions of exposed igneous, metamorphic, andsedimentary rocks. Geol. Soc. Am. Bull. 86, 1085–1088.
Bourdet, D., Ayoub, J., 1989. Use of pressure derivative in well test interpretation.SPE Form. Eval. 4, 293–302.
Bourdet, D., Whittle, T., Douglas, A., Pirard, Y., 1983. A new set of type curvessimplifies well test analysis. World Oil 196, 95–106.
Boutt, D.F., Diggins, P., Mabee, S., 2010. A field study (Massachusetts, USA) of thefactors controlling the depth of groundwater flow systems in crystallinefractured-rock terrain. Hydrogeol. J. 18, 1839–1854.
Brun, J.-P., Guennoc, P., Truffert, C., Vairon, J., 2001. Cadomian tectonics in northernBrittany: a contribution of 3-D crustal-scale modelling. Tectonophysics 331,229–246.
Bu, X., Warner, M.J., 1995. Solubility of chlorofluorocarbon 113 in water andseawater. Deep Sea Res. Part I Oceanogr. Res. Pap. 42, 1151–1161.
Burbey, T., 2003. Use of time–subsidence data during pumping to characterizespecific storage and hydraulic conductivity of semi-confining units. J. Hydrol.281, 3–22.
Busenberg, E., Plummer, L.N., 1992. Use of chlorofluorocarbons (CCl3F and CCl F2) ashydrologic tracers and age-dating tools: the alluvium and terrace system ofcentral Oklahoma. Water Resour. Res. 28, 2257–2283.
Butler, J.J., Liu, W.Z., 1991. Pumping tests in non-uniform aquifers: the linear stripcase. J. Hydrol. 128, 69–99.
Caine, J.S., Tomusiak, S.R.A., 2003. Brittle structures and their role in controllingporosity and permeability in a complex Precambrian crystalline-rock aquifersystem in the Colorado Rocky Mountain Front Range. GSA Bull. 115, 1410–1424.
Caine, J., Evans, J., Forster, C., 1996. Fault zone architecture and permeabilitystructure. Geology 24, 1025–1028.
Carn-Dheilly, A., Thomas, E., 2008. RAPSODI - Recherche d’aquifères profonds dansle socle du département de l’Ille et Vilaine. Rapport Final – BRGM/RP-56749-FR.
Carucci, V., Petitta, M., Aravena, R., 2012. Interaction between shallow and deepaquifers in the Tivoli Plain (Central Italy) enhanced by groundwater extraction:a multi-isotope approach and geochemical modeling. Appl. Geochem. 27, 266–280.
Chantraine, J., Egal, E., Thiéblemont, D., Le Goff, E., Guerrot, C., Ballèvre, M., Guennoc,P., 2001. The Cadomian active margin (North Armorican Massif, France): asegment of the North Atlantic Panafrican belt. Tectonophysics 331, 1–18.
Chatelier, M., Ruelleu, S., Bour, O., Porel, G., Delay, F., 2011. Combined fluidtemperature and flow logging for the characterization of hydraulic structure ina fractured karst aquifer. J. Hydrol. 400, 377–386.
Chilton, P.J., Foster, S.D.S., 1995. Hydrogeological characterization and water-supplypotential of basement aquifers in tropical Africa. Hydrogeol. J. 3, 36–49.
Cogné, J., Wright, A.E., 1980. L’orogène Cadomien – Geology of Europe fromPrecambrian to the post-Hercynian sedimentary basins. In: 26th Int. Geol.Congr. – BRGM Mem 108, pp. 29–55.
Cook, P., Solomon, D., 1997. Recent advances in dating young groundwater:chlorofluorocarbons, 3H/3He and 85Kr. J. Hydrol. 191, 245–265.
Cook, P., Love, a., Robinson, N., Simmons, C., 2005. Groundwater ages in fracturedrock aquifers. J. Hydrol. 308, 284–301.
Dadet, P., Beurrier, M., Lautridou, J.-P., 1984. Notice explicative de la feuille Saint-Hilaire-Du-Harcouët à 1/50 000. BRGM, Orléans.
Dewandel, B., Lachassagne, P., Wyns, R., Maréchal, J.C., Krishnamurthy, N.S., 2006. Ageneralized 3-D geological and hydrogeological conceptual model of graniteaquifers controlled by single or multiphase weathering. J. Hydrol. 330, 260–284.
Escobar, F.H., Hernández, D.P., 2010. Pressure and pressure derivative analysis forlong naturally fractured reservoirs using the TDS technique. DYNA 77, 102–114.
Evans, J.P., Forster, C.B., Goddard, J.V., 1997. Permeability of fault-related rocks, andimplications for hydraulic structure of fault zones. J. Struct. Geol. 19, 1393–1404.
Fernandes, A., Rudolph, D., 2001. The influence of Cenozoic tectonics on thegroundwater-production capacity of fractured zones: a case study in Sao Paulo,Brazil. Hydrogeol. J. 9, 151–167.
Folch, A., Mas-Pla, J., 2008. Hydrogeological interactions between fault zones andalluvial aquifers in regional flow systems. Hydrol. Process. 22, 3476–3487.
Ganerod, G.V., Braathen, A., Willemoes-Wissing, B., 2008. Predictive permeabilitymodel of extensional faults in crystalline and metamorphic rocks; verificationby pre-grouting in two sub-sea tunnels, Norway. J. Struct. Geol. 30, 993–1004.

54 C. Roques et al. / Journal of Hydrology 509 (2014) 42–54
Gannon, J.P., Burbey, T.J., Bodnar, R.J., Aylor, J., 2011. Geophysical and geochemicalcharacterization of the groundwater system and the role of Chatham Fault ingroundwater movement at the Coles Hill uranium deposit, Virginia, USA.Hydrogeol. J. 20, 45–60.
Gelhar, L., 1992. A critical review of data on field-scale dispersion in aquifers. WaterResour. Res. 28, 1955–1974.
Gleeson, T., Novakowski, K., 2009. Identifying watershed-scale barriers togroundwater flow: lineaments in the Canadian Shield. Geol. Soc. Am. Bull.121, 333–347.
Goddard, J.V., Evans, J.P., 1995. Chemical changes and fluid-rock interaction in faultsof crystalline thrust sheets, northwestern Wyoming, USA. J. Struct. Geol. 17,533–547.
Grellet, B., Combes, P., Granier, T., Philip, H., 1993. Sismotectonique de la Francemétropolitaine dans son cadre géologique et géophysique. Mem. N.S. SGF 164,1–2.
Gringarten, E., 1996. 3-D geometric description of fractured reservoirs. Math. Geol.28, 881–893.
Harte, P., Robinson, G., Ayotte, J., Flanagan, S., 2008. Framework for EvaluatingWater Quality of the New England Crystalline Rock Aquifers. US Geol. Surv.Open-File Rep. 2008–1282 47.
Henriksen, H., Braathen, A., 2005. Effects of fracture lineaments and in-situ rockstresses on groundwater flow in hard rocks: a case study from Sunnfjord,western Norway. Hydrogeol. J. 14, 444–461.
Holland, M., Witthüser, K.T., 2011. Evaluation of geologic and geomorphologicinfluences on borehole productivity in crystalline bedrock aquifers of LimpopoProvince, South Africa. Hydrogeol. J. 19, 1065–1083.
Hunt, B., Scott, D., 2007. Flow to a well in a two-aquifer system. J. Hydrol. Eng. 12,146–155.
Jaunat, J., Huneau, F., Dupuy, A., Celle-Jeanton, H., Vergnaud-Ayraud, V., Aquilina, L.,Labasque, T., Le Coustumer, P., 2012. Hydrochemical data and groundwaterdating to infer differential flowpaths through weathered profiles of a fracturedaquifer. Appl. Geochem. 27, 2053–2067.
Labasque, T., 2006. Analyse des CFC dans les eaux souterraines. Géosciences Rennes,Cahiers techniques de Géosciences Rennes, Rennes.
Le Borgne, T., Bour, O., Paillet, F., Caudal, J., 2006a. Assessment of preferential flowpath connectivity and hydraulic properties at single-borehole and cross-borehole scales in a fractured aquifer. J. Hydrol. 328, 347–359.
Le Borgne, T., Paillet, F., Bour, O., Caudal, J.-P., 2006b. Cross-borehole flowmeter testsfor transient heads in heterogeneous aquifers. Ground Water 44, 444–452.
Leray, S., de Dreuzy, J.-R., Bour, O., Bresciani, E., 2013. Numerical modeling of theproductivity of vertical to shallowly dipping fractured zones in crystalline rocks.J. Hydrol. 481, 64–75.
Maréchal, J., Wyns, R., 2004. Vertical anisotropy of hydraulic conductivity in thefissured layer of hard-rock aquifers due to the geological structure ofweathering profiles. J. Geol. Soc. India 5, 545–550.
Meier, P.M., Carrera, J., Sánchez-Vila, X., 1998. An evaluation of Jacob’s method forthe interpretation of pumping tests in heterogeneous formations. Water Resour.Res. 34, 1011–1025.
Melchiorre, E.B., Criss, R.E., Davisson, M.L., 1999. Relationship between seismicityand subsurface fluids, central Coast Ranges, California. J. Geophys. Res. 104,921–939.
Moench, F., 1984. Double-Porosity Models for a Fissured Groundwater ReservoirWith Fracture Skin. Water Resour. Res. 20, 831–846.
Neuman, S.P., 1979. Perspective on ‘‘Delayed yield’’. Water Resour. Res. 15, 899–908.
Paillet, F.L., 1998. Flow modeling and permeability estimation using borehole flowlogs in heterogeneous fractured formations. Water Resour. Res. 34, 997–1010.
Rafini, S., Larocque, M., 2009. Insights from numerical modeling on thehydrodynamics of non-radial flow in faulted media. Adv. Water Resour. 32,1170–1179.
Renard, P., Glenz, D., Mejias, M., 2008. Understanding diagnostic plots for well-testinterpretation. Hydrogeol. J. 17, 589–600.
Richard, B., Moore, B., Schwarz, G.E., Clark, S.F., Walsh, G.J., Degnan, J.R., 2002.Factors Related to Well Yield in the Fractured-Bedrock Aquifer of NewHampshire. US Geol. Surv. Prof. Pap. 1660, 1–51.
Ruelleu, S., Moreau, F., Bour, O., Gapais, D., Martelet, G., 2010. Impact of gentlydipping discontinuities on basement aquifer recharge: an example fromPloemeur (Brittany, France). J. Appl. Geophys. 70, 161–168.
Sander, P., 2006. Lineaments in groundwater exploration: a review of applicationsand limitations. Hydrogeol. J. 15, 71–74.
Schnegg, P., Costa, R., 2007. Tracer tests made easier with field fluorometers. Bull.d’Hydrogéologie 20, 20–21.
Schnegg, P., Flynn, R., 2002. Online field fluorometers for hydrogeological tracertests. Isot. und Tracer der Wasserforschung, Tech. Univ. Bergakademie Freiberg,Wissenschaftliche Mitteilungen. Inst. für Geol. 19, 29–36.
Singhal, B., Gupta, R., 2010. Applied Hydrogeology of Fractured Rocks, second ed.Springer.
Sophocleous, M., 2002. Interactions between groundwater and surface water: thestate of the science. Hydrogeol. J. 10, 52–67.
Spane, F., Wurstner, S., 1993. DERIV: A computer program for calculating pressurederivatives for use in hydraulic test analysis. Ground Water 31, 814–822.
Stober, I., Bucher, K., 1999. Deep groundwater in the crystalline basement of theBlack Forest region. Appl. Geochem. 14, 237–254.
Taylor, R.G., Howard, K.W.F., 1999. Lithological evidence for the evolution ofweathered mantles in Uganda by tectonically controlled cycles of deepweathering and stripping. CATENA 35, 65–94.
Taylor, R., Howard, K., 2002. A tectono-geomorphic model of the hydrogeology ofdeeply weathered crystalline rock: evidence from Uganda. Hydrogeol. J. 8, 279–294.
Tiab, D., 2005. Analysis of pressure derivative data of hydraulically fractured wellsby the Tiab’s Direct Synthesis technique. J. Pet. Sci. Eng. 49, 1–21.
Van Vliet-Lanoë, B., Bonnet, S., Hallegouët, M., Laurent, M., 1997. Neotectonic andseismic activity in the Armorican and Cornubian Massifs: regional stress fieldwith glacio-isostatic influence? J. Geodyn. 24, 219–239.
Walker, S.J., Weiss, R.F., Salameh, P.K., 2000. Reconstructed histories of the annualmean atmospheric mole fractions for the halocarbons CFC-11 CFC-12, CFC-113,and carbon tetrachloride. J. Geophys. Res. 105, 14285.
Warner, M.J., Weiss, R.F., 1985. Solubilities of chlorofluorocarbons 11 and 12 inwater and seawater. Deep Sea Res. Part A. Oceanogr. Res. Pap. 32, 1485–1497.
Weiss, R.F., Price, B.A., 1980. Nitrous oxide solubility in water and seawater. Mar.Chem. 8, 347–359.
Wyns, R., Baltassat, J., Lachassagne, P., Legchenko, A., Vairon, J., 2004. Application ofproton magnetic resonance soundings to groundwater reserve mapping inweathered basement rocks (Brittany, France). Bull. la Société Géologique Fr.175, 21–34.
Copyright © 2022 FDOKUMEN