Hydrodynamics of a Large-scale Mixed-Cell Raceway (MCR): Experimental studies
12
Hydrodynamics of a Large-scale Mixed-Cell Raceway (MCR): Experimental studies Rodrigo A. Labatut a, * , James M. Ebeling b , Rajesh Bhaskaran c , Michael B. Timmons a a Department of Biological and Environmental Engineering, Cornell University, Riley Robb Hall, Ithaca, NY 14853, USA b Aquaculture Systems Technology, PO Box 15827, New Orleans, LA 70175, USA c Department of Mechanical and Aerospace Engineering, Cornell University, Grumman Hall, Ithaca, NY 14853, USA Received 14 February 2007; accepted 3 April 2007 Abstract The Mixed-cell Raceway (MCR) is a design that intends to combine the best characteristics of circular tanks and linear raceways in a single production system. The conceptual idea is to convert traditional linear raceways into a series of hydraulically separated cells, each of which behaves as an individual circular tank. The MCR can take advantage of the solids removal ability of circular tanks and can be managed as either a partial reuse or intensive recirculation system. This study investigated the hydrodynamics of a large-scale (90 m 3 ) MCR composed of three in-series 5.5 m 5.5 m mixed-cells (1 m water depth). Water velocity measure- ments of the entire tank were used to generate velocity-magnitude contours and vector plots, investigate the distribution of water velocities, and evaluate the self-cleaning characteristics and related management issues of an MCR. The grand mean of the water velocities of the three MCR in-series cells was 16.5 cm/s (16.1, 15.5, and 17.8 cm/s for cell 1, cell 2, and cell 3, respectively). Results showed that water velocities decreased somewhat in a linear manner from the tank bottom to the top, i.e., 18.9, 15.8 and 14.7 cm/s, and in the same way from the periphery (21.9 cm/s) to the center of the cells (3.7 cm/s). Analyses indicated that these water velocities were in the optimum range to promote fish health and condition as well as to achieve tank self- cleaning. For a water exchange rate of 1.7 volumes per hour and an operating head of 1.36 m in the jet port manifolds, the power requirements of the MCR reached 8.9 W/m 3 . Contour and vector velocity plots showed that the mixed-cells develop a well-defined rotational pattern around the center drain. Also, strategically located water jets directed across the width of the MCR were able to limit the rotational flow to each cell and create the required counter-rotational pattern between adjacent cells. Velocity vectors showed a relatively low turbulence in the corners of the cells, even in the middle cell (cell 2) that had solid-walls on only two sides. Velocity vectors and contour plots also suggested an absence of dead volumes or short-circuiting within the cells, indicating that adequate mixing was being attained in the MCR. # 2007 Elsevier B.V. All rights reserved. Keywords: Aquaculture; Mixed-cell Raceway; Design; Hydrodynamics; Water velocity; Measurement; RAS 1. Introduction Uniform water quality, rapid solids removal and ease of husbandry and maintenance tasks are among the most sought-after characteristics of an aquaculture tank. Linear raceways are one of the most popular tank designs for fish production, mainly because they utilize the footprint area much more efficiently and allow easier handling and sorting of fish than circular tanks. Raceways operate as plug-flow reactors (PFR), i.e., water enters one end, flows longitudinally through the tank, and exits the other end. However, a problem of operating in plug-flow mode is that there is minimal mixing or diffusion ahead or behind the flow path www.elsevier.com/locate/aqua-online Aquacultural Engineering 37 (2007) 132–143 * Corresponding author. Tel.: +1 607 351 2700. E-mail address: [email protected] (R.A. Labatut). 0144-8609/$ – see front matter # 2007 Elsevier B.V. All rights reserved. doi:10.1016/j.aquaeng.2007.04.001
Transcript of Hydrodynamics of a Large-scale Mixed-Cell Raceway (MCR): Experimental studies
Hydrodynamics of a Large-scale Mixed-CellRaceway (MCR): Experimental studies
Rodrigo A. Labatut a,*, James M. Ebeling b, Rajesh Bhaskaran c, Michael B. Timmons a
aDepartment of Biological and Environmental Engineering, Cornell University, Riley Robb Hall, Ithaca, NY 14853, USAbAquaculture Systems Technology, PO Box 15827, New Orleans, LA 70175, USA
cDepartment of Mechanical and Aerospace Engineering, Cornell University, Grumman Hall, Ithaca, NY 14853, USA
Received 14 February 2007; accepted 3 April 2007
Abstract
TheMixed-cell Raceway (MCR) is a design that intends to combine the best characteristics of circular tanks and linear raceways
in a single production system. The conceptual idea is to convert traditional linear raceways into a series of hydraulically separated
cells, each of which behaves as an individual circular tank. The MCR can take advantage of the solids removal ability of circular
tanks and can be managed as either a partial reuse or intensive recirculation system. This study investigated the hydrodynamics of a
large-scale (90 m3) MCR composed of three in-series 5.5 m � 5.5 m mixed-cells (�1 m water depth). Water velocity measure-
ments of the entire tank were used to generate velocity-magnitude contours and vector plots, investigate the distribution of water
velocities, and evaluate the self-cleaning characteristics and related management issues of an MCR.
The grand mean of thewater velocities of the threeMCR in-series cells was 16.5 cm/s (16.1, 15.5, and 17.8 cm/s for cell 1, cell 2,
and cell 3, respectively). Results showed that water velocities decreased somewhat in a linear manner from the tank bottom to the
top, i.e., 18.9, 15.8 and 14.7 cm/s, and in the same way from the periphery (21.9 cm/s) to the center of the cells (3.7 cm/s). Analyses
indicated that these water velocities were in the optimum range to promote fish health and condition as well as to achieve tank self-
cleaning. For a water exchange rate of 1.7 volumes per hour and an operating head of 1.36 m in the jet port manifolds, the power
requirements of the MCR reached 8.9 W/m3. Contour and vector velocity plots showed that the mixed-cells develop a well-defined
rotational pattern around the center drain. Also, strategically located water jets directed across the width of the MCR were able to
limit the rotational flow to each cell and create the required counter-rotational pattern between adjacent cells. Velocity vectors
showed a relatively low turbulence in the corners of the cells, even in the middle cell (cell 2) that had solid-walls on only two sides.
Velocity vectors and contour plots also suggested an absence of dead volumes or short-circuiting within the cells, indicating that
adequate mixing was being attained in the MCR.
# 2007 Elsevier B.V. All rights reserved.
Keywords: Aquaculture; Mixed-cell Raceway; Design; Hydrodynamics; Water velocity; Measurement; RAS
1. Introduction
Uniform water quality, rapid solids removal and ease
of husbandry and maintenance tasks are among the most
sought-after characteristics of an aquaculture tank.
Linear raceways are one of the most popular tank
designs for fish production, mainly because they utilize
the footprint area much more efficiently and allow
easier handling and sorting of fish than circular tanks.
Raceways operate as plug-flow reactors (PFR), i.e.,
water enters one end, flows longitudinally through the
tank, and exits the other end. However, a problem of
operating in plug-flow mode is that there is minimal
mixing or diffusion ahead or behind the flow path
www.elsevier.com/locate/aqua-online
Aquacultural Engineering 37 (2007) 132–143
* Corresponding author. Tel.: +1 607 351 2700.
E-mail address: [email protected] (R.A. Labatut).
0144-8609/$ – see front matter # 2007 Elsevier B.V. All rights reserved.
doi:10.1016/j.aquaeng.2007.04.001

(Levenspiel, 1999), thus creating gradients of decreas-
ing dissolved oxygen and increasing ammonia along the
longitudinal axis and producing disparity in the
distribution and quality of fish (Watten and Beck,
1987). Therefore, large volumes of water are required to
keep water quality parameters within acceptable levels
(by dilution). Furthermore, linear raceways usually do
not have the appropriate velocities for self-cleaning
(Westers and Pratt, 1977; Timmons et al., 2002), and so
sedimentation and accumulation of uneaten feed and
feces occurs, causing poor overall water quality,
increased mortalities and decreased growth rates. High
water exchange rates and/or the use of structures, such
as baffles (Timmons et al., 2002), can diminish these
effects, but in practice, raceways fail to produce
optimum water velocities recommended for fish health,
muscle tone, and respiration (Timmons et al., 2002;
Totland et al., 1987).
Quite the opposite is the case of circular tanks, where
hydraulic behavior approximates that of a mixed-flow
reactor (MFR). These characteristics have been well
established in traditional circular tanks (Watten and
Beck, 1987) and in more recent studies on the Cornell
circular dual-drain tank (Davidson and Summerfelt,
2004), especially at high fish densities (>80 kg/m3).
Circular tanks also exhibit good self-cleaning and the
capability to maintain optimal velocities for fish health
and conditioning (Davidson and Summerfelt, 2004),
which ultimately leads to improved growth rates and
food conversion efficiencies (Timmons et al., 1998,
2002). Unfortunately, husbandry tasks are not only
more difficult to achieve in circular tanks as compared
to linear raceways, but are less efficient in utilizing the
footprint space.
The Mixed-cell Raceway (MCR) was developed by
Watten et al. (2000) to combine the best characteristics
of circular tanks and linear raceways in a single vessel
design, e.g., uniform water quality, rapid solids
removal, and easier husbandry and maintenance.
Vertical discharge manifolds along the sidewalls of
an MCR allows converting linear raceways into a series
of hydraulically independent mixed-cells, each having a
counter-rotating hydraulic flow pattern to the next cell
and a bottom-center drain that forces each cell to behave
as an individual circular tank.
Residence time distribution (RTD) analyses con-
ducted in a small-scale MCR revealed good mixing
capacity and the absence of dead volumes for exchanges
rates �1.3 volumes per hour. Also, fairly low power
requirements (6.7 W/m3) and were found (Watten et al.,
2000).
In order to better understand the hydraulics of a
commercial size MCR, a large-scale prototype (four
times greater than Watten’s) was constructed at the
Conservation Fund’s Freshwater Institute (Shepherds-
town, WV). The objective of this study was to
characterize fluid flow of this large-scale MCR by
conducting water velocity measurements in the entire
tank.
2. Methods
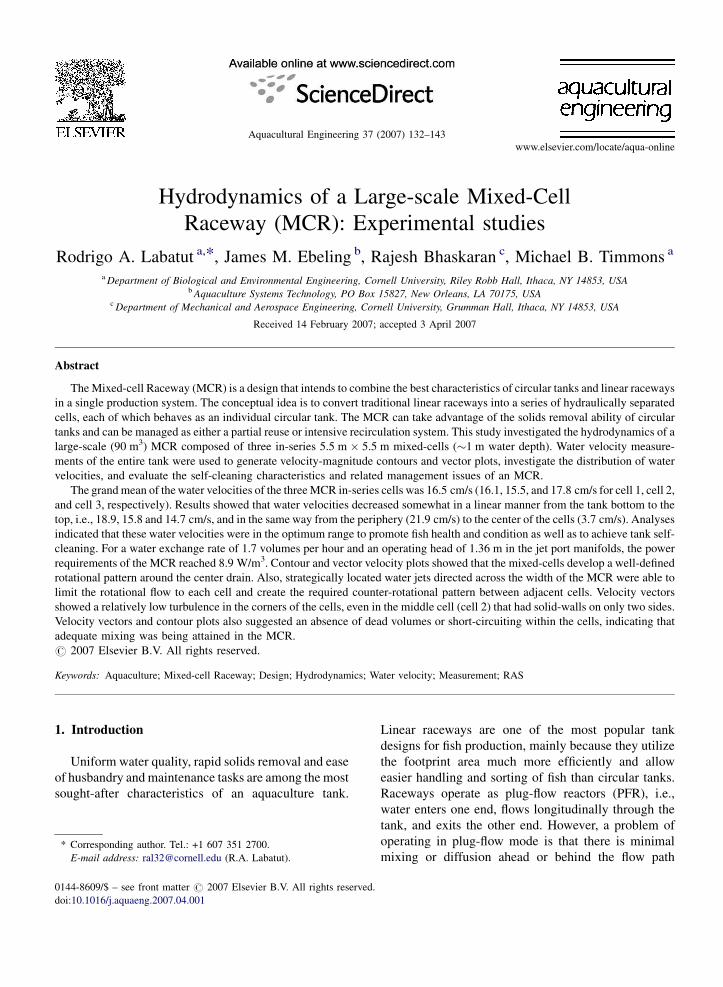
2.1. Tank design and operating conditions
An MCR was built inside a greenhouse and
constructed of structural lumber and lined with a
high-density cross-laminated polyethylene (HDPE)
liner; its dimensions were 5.5 m � 16.5 m � 1.2 m
(width, length, depth, respectively) (Fig. 1). Additional
details on the construction and materials employed for
this MCR are found in Ebeling et al. (2005).
The design concept of an MCR is to create a series of
adjacent square cells each having an independent
rotating hydraulic flow pattern; in this case three cells of
5.5 m � 5.5 m each (with approximate depth of 1 m).
R.A. Labatut et al. / Aquacultural Engineering 37 (2007) 132–143 133
Nomenclature
Ao nozzle cross-sectional area (m2)
Cd coefficient of discharge (dimensionless)
Do nozzle diameter (m)
g acceleration due to gravity (9.81 m/s2)
h hydraulic head (m)
P power required per volume of water (W/
m3)
Q total system flow rate (m3/s)
Qo nozzle discharge flow rate (m3/s)
Uo nozzle discharge velocity (m/s)
UR resultant water velocity (cm/s)
V water volume in the MCR (m3)
Greek symbols
h pump and mechanical efficiency com-
bined (0.7, decimal)
r water density (kg/m3)
Abbreviations
HDPE high-density cross-laminated polyethy-
lene
MCR Mixed-cell Raceway
MFR mixed-flow reactor
PFR plug-flow reactor
RTD residence time distribution
Such hydraulic behavior was produced by vertical jet
port manifolds (Schedule 40 PVC 1 1/2 in. pipe) (Fig. 2)
strategically located at the corners of the end cells and
intersections between adjacent cells (Fig. 3). Of the 10
jet port manifolds distributed along the raceway wall, 8
were single-sided and 2 double-sided. Single-sided
manifolds had five nozzles located on one side only and
were pointed either tangentially or perpendicularly to
the tank wall. The manifolds that pointed perpendicular
to tanks walls created the hydraulic boundary layers that
produced two side-by-side mixed-cells. Additional
double-sided manifold with 10 nozzles (5 on each
side) were used to support creation of mixed-cell flows
rotating in opposite directions; these nozzles were
pointed tangentially to the tank walls (Fig. 3). Nozzles
in the jet port manifolds were positioned every 15.2 cm
starting at 5.1 cm from the tank floor.
Effluent discharge strategy was designed according
to the Cornell dual-drain system design (Timmons et al.,
1998, 2002). Thus, a small percentage of the system’s
flow, i.e., 15%, was removed via a bottom, centrally
located drain in each cell, while the larger percentage,
i.e., 85%, was removed via two upper-side drains
located face to face in each cell’s opposite walls (Fig. 3).
R.A. Labatut et al. / Aquacultural Engineering 37 (2007) 132–143134
Fig. 1. The Mixed-cell Raceway at the greenhouse of the Freshwater Institute; constructed using structural lumber and covered with an HDPE
(black) liner.
Fig. 2. Vertical jet port manifolds arranged along the side walls of the MCR. On the far left, a single-sided manifold composed of five nozzles
directed across thewidth of the raceway. Middle and far right pictures show the double-sidedmanifolds composed of 10 nozzles directed tangentially
to the raceway wall.
Fig. 3. Plan view of the mixed-cell raceway configuration (sump not
shown here). Drawing not to scale.

In the Cornell dual-drain design, the majority of the
solids are removed by the bottom-center flow, while the
upper-side drains should be basically solids free
(Timmons et al., 1998; Summerfelt et al., 2000).
Bottom-center drains consisted of 5-cm orifice plates
secured to a flange at the bottom of each of the three
cells. These orifice plates were connected together by a
Schedule 40 PVC 6 in. (15 cm) drain line installed
along the longitudinal axis of the MCR that discharged
highly concentrated solids and sludge to a settling
sump. The continuous bottom flow rate was controlled
by a standpipe installed at the sump that had two 0.75-
kW pumps to increase bottomwithdrawals as necessary.
The upper-side drains consisted of 458 elbows
positioned 35 cm below the water surface using
Schedule 40 PVC 1 1/2 in. (50 mm) pipes. Flow rates
of the upper-side drains were controlled by six 0.75 kW
pumps independently connected to each pipe. The total
flow rate of the MCR, measured by using an ultrasonic
Doppler flow meter model UFX series (Dynasonics,
Racine, WI), was 152 m3/h (0.042 m3/s). Approxi-
mately 23 m3/h (15%) of this flow were discharged
through the bottom-center drains while 129 m3/h (85%)
were discharged through the upper-side drains.
Water depth was held constant at 1.0 � 0.1 m. Based
on the MCR dimensions and the water depth, the tank
water volume was 91 m3. An MCR is primarily
intended to be operated under recirculating conditions.
Accordingly, potential loading capacity of the system is
primarily based on the water exchange rate, a key
production parameter to establish the system flow rate
required to maintain the usual water control parameters
for specific fish stocking densities, e.g., dissolved
oxygen levels, carbon dioxide, and nitrogenous
compounds. Recent long-term studies performed by
Davidson and Summerfelt (2004) have proven that
water exchange rates of approximately 1.9 volumes per
hour are successful for supporting fish densities as high
as 150 kg/m3 in Cornell dual-drain tanks. In our study,
given the volume of the MCR (91 m3) and the total flow
rate (152 m3/h), the water exchange rate was 1.7
volumes per hour. At this rate, it would be expected that
the MCR could support fish densities similar to those
reported by Davidson and Summerfelt (2004).
2.2. Jet ports design: mixing and water velocities
The rotational flow in the mixed-cells is created by
the action of submerged water jets directed either
tangentially or perpendicularly to the tank wall. Water
jets create a flux of momentum that breaks the inertial
state of the flow field ahead, accelerating the fluid and
creating a turbulent mixing layer at the jet boundary
(Labatut, 2005). This mixing layer entrains some of the
surrounding liquid and creates the swirl pattern that
leads to mixing of the contents (Patwardhan, 2002). The
degree of mixing and the magnitude of the water
velocities in a jet-forced-circulation vessel are influ-
enced by the fluid properties and the configuration,
dimensions, and operating conditions of the system.
Adequate water mixing ensures that the new influent
water is well mixed and uniformly distributed
throughout the tank so that all fish are exposed to the
same, constantly renewing water quality. A recent study
using a residence time distribution (RTD) analysis
revealed high degree of mixing and the absence of dead
volumes when an MCR was subjected to water
exchange rates of 1.3 volumes per hour (Watten
et al., 2000). The authors reported that the uniformity
of water mixing throughout the MCR could be
controlled by the water exchange rate, as the fraction
of active (well mixed) tank volume was found to
decrease significantly ( p < 0.01) at lower rates, i.e., 1.0
volume per hour. This suggests that uniform mixing is
feasible within our MCR considering that the water
exchange rate used in our study (1.7 volumes/h) was
significantly higher than that used by Watten et al.
(2000) (1.3 volumes/h).
In a jet-forced-circulation vessel the water velocity
is a function of several variables, such as acceleration
due to gravity, density and viscosity of the fluid,
geometry, velocity, diameter, number and direction of
the nozzles, and characteristic length and water depth
of the tank/cell. Therefore, a practical approach in
designing jet ports is to hold constant most of the
variables outlined above and focus only on the
influence of the jet port-related variables to the design
variable, i.e., the water velocity. For example, Paul
et al. (1991) reported that the water velocity,
especially in the periphery of a circular tank, is
proportional to the influent water velocity. Timmons
et al. (1998) reported that in circular tanks this
proportionality constant generally varies from 15 to
20%, depending on the design of the inlet structures.
Conversely, Watten et al. (2000) reported that in an
MCR the grand mean of the velocities measured in the
mixed-cells represented 3.7% of the jet velocity. As
reported by Watten et al. (2000) this was substantially
smaller than the value reported for circular tanks and
was attributed by them to the increased drag
associated with forced distortion of circulating cells
within the raceway rectangular boundaries. However,
we should consider also that the proportionality
constant reported by Timmons et al. (1998) was
R.A. Labatut et al. / Aquacultural Engineering 37 (2007) 132–143 135

(probably) applicable only to the highest water
velocities of the tank that are located near the wall,
unlike Watten et al. (2000) who used the grand mean of
velocities within the MCR to obtain this proportionality.
In any case, the proportionality constant could be
considered as an accurate ‘‘design parameter’’ only if
used in a tankwith similar configuration, dimensions and
operating conditions as the tank in which the constant
was obtained; otherwise, the proportionalitymay change,
being no longer applicable to other situations. A
proportionality constant of 3.7% was used in our study
to determine the jet velocity needed to achieve the
required water velocities in the MCR (Watten et al.,
2000). In the field trials, the proportionality constant was
determined in the same way as reported by Watten et al.
(2000), so that comparison was possible.
Tank water velocities should be designed to achieve
self-cleaning and to exercise fish adequately. Timmons
et al. (1998) point out that velocities greater than 15–
30 cm/s are capable to drive settleable solids to the
center drain and maintain self-cleaning in circular
tanks. A more recent study conducted by Davidson and
Summerfelt (2004) in 3.7-m-diameter circular tanks
claimed that ‘optimum’ water velocities for culturing
fish of 12–24 cm body length were in the range of 15–
20 cm/s. A key advantage of the Davidson and
Summerfelt (2004) study is that the determination of
the water velocities was not only based on the ability of
the tanks to achieve self-cleaning, but also on
observations of fish swimming behavior and on the
requirement of providing a water velocity that was at
least 0.5 fish body length per second but less than the
maximum safe non-fatiguing water velocity. Accord-
ingly, the design water velocity for this study was
selected from the range of optimum velocities
suggested by Davidson and Summerfelt (2004). A
velocity of 18 cm/s was picked for the design as being a
midpoint of the suggested range.
Using a proportionality constant of 3.7%, the
required jet velocity to achieve a design water velocity
of 18 cm/s was calculated to be approximately 480 cm/
s. Then, the required hydraulic head to achieve this jet
velocity is computed from the equation described by
Brater and King (1976):
Uo ¼ Cd
ffiffiffiffiffiffiffiffi
2ghp
(1)
where Uo is the nozzle discharge velocity or jet velocity
(m/s), Cd the coefficient of discharge of the nozzles
(0.93, dimensionless) (Labatut, 2005), g the accelera-
tion due to gravity (9.81 m/s2) and h is the hydraulic
head, i.e., pressure head upstream of the nozzles (m).
The Cd of the nozzles was obtained from a series of
flow rate measurements in four jet port manifolds at
different hydraulic heads (Labatut, 2005). The Cd value
of 0.93 reported by Labatut (2005) was consistent with
the values found in literature for this kind of entrance
(Brater and King, 1976). To obtain the actual flow rate
of each nozzle, the flow rate measured in the manifolds
was divided by the number of nozzles, provided that the
flow rate in each of the nozzles was somewhat the same
(Labatut, 2005). Further details of the experiment and
data can be found in Labatut (2005).
By using Eq. (1), a jet velocity of 4.8 m/s, and aCd of
0.93, the required hydraulic head (relative to the water
surface of the raceway) was calculated to be 1.36 m.
A requirement of the system design was to maintain
a water exchange rate of 1.7 volumes per hour, i.e., a
total system flow rate of 152 m3/h. In order to keep a
constant jet velocity and flow rate, Eq. (1) can be
modified to include the nozzle flow rate and nozzle
cross-sectional area and solve for the required nozzle
diameter:
Qo ¼ AoCd
ffiffiffiffiffiffiffiffi
2ghp
(2)
with
Ao ¼pD2
o
4(3)
whereQo is the nozzle discharge flow rate (m3/s), Ao the
nozzle cross-sectional area (m2) and Do is the nozzle
diameter (m).
The calculated nozzle flow rate is 8.46 � 10�4 m3/s,
as obtained by dividing the total flow rate by 50, which
is the number of nozzles in the MCR water distribution
system. Also, to keep the jet velocity constant at 4.8 m/
s, the hydraulic head computed in the previous step
R.A. Labatut et al. / Aquacultural Engineering 37 (2007) 132–143136
Table 1
Design, operational and performance parameters of the MCR
Characteristic Value
MCR water depth (m) 1
MCR volume (m3) 91
MCR total flow rate (m3/h) 152
MCR water exchange rate (volumes/h) 1.7
Cell characteristic length (m) 5.5
Cell diameter-to-depth ratio (m) 5.5:1
Bottom-center flow (%) 15
Surface loading rate at the bottom-center drain
(L/min m2 cell floor)
4.2
Nozzle discharge velocity, i.e., jet velocity (m/s) 4.8
Nozzle diameter (mm) 15
Jet port manifold hydraulic head (m) 1.36
MCR power requirements (W/m3) 8.9

(1.36 m) was used. Finally, the only unknown term
remaining in Eqs. (2) and (3) is the nozzle diameter,
which was calculated to be approximately 15 mm.
Accordingly, power requirements were calculated using
the following equation (Watten et al., 2000):
P ¼hrgQ
hV(4)
where P is the power required per volume of water
(W/m3),1 r the water density (kg/m3),Q the total system
flow rate (m3/s), h the pump and mechanical efficiency
combined (0.7, decimal)2 and V is the water volume in
the MCR (m3).
A summary of the operating conditions and
performance parameters used in this study is shown
in Table 1.
2.3. Velocity measurements and analyses
All velocity measurements within the tanks were
made without fish present. Velocity measurements were
conducted using a SonTek Argonaut-ADV ultrasonic
velocity meter (San Diego, CA) (Fig. 4, left). The
SonTek velocity meter is a single-point, 3D Doppler
current meter designed for shallow water flow
monitoring. It measures velocities within a range of
0.001–4.5 m/s with a resolution of �0.0001 m/s and an
accuracy of�1% of measured velocity (SonTek, 2005).
The Argonaut-ADV probe transmitter generates a short
pulse of sound at a known frequency that is reflected by
fine and dissolved particles suspended in the water
current. The reflected pulse is received by three acoustic
receivers that measure the Doppler shift and converts
the signal into Cartesian velocities. The instrument
reports the magnitude of the x, y and z velocity
components and the resultant velocity-magnitude and
direction in the x–y plane.
Velocities were measured in the three cells over a
0.5 m � 0.5 m horizontal grid at three given depths:
20 cm below the surface (top), 50 cm depth (middle)
and 5 cm off the bottom floor of the tank (bottom)
(Fig. 5). In each cell, a total of 507 (13 � 13 � 3) points
were sampled.
The Argonaut-ADV was mounted on an aluminum
transport system and placed over the tank to allow
moving the probe in both vertical and horizontal
directions across the grid (Fig. 4, right). The probe was
oriented onto a fixed direction for all measurements,
i.e., the orientation was not changed based on the flow
direction. The Argonaut-ADV samples 10 times per
second and produces an average x–y resultant velocity-
magnitude (x–y plane) from the measurements taken
within a user-defined time interval. The time interval
was set for 20 s in our trials; therefore, in each and every
sampling point of the grid, the measurement reported
was the average of 80 samplings. Longer sampling
intervals could have been used, e.g., based upon
R.A. Labatut et al. / Aquacultural Engineering 37 (2007) 132–143 137
Fig. 5. Velocity measurement sampling point grid. Each intersection
(node) in the grid is a sampling point. Each of the three cells has a total
of 169 sampling points per each of the three planes, producing a total
number of 507 sampling points per cell.
Fig. 4. Velocity measurement trials. Left: SonTek Argonaut-ADV velocity meter and laptop used for processing and storing the data. Right:
aluminum-based transport system installed over the MCR to move the probe in vertical and horizontal directions across the sampling point grid.
1 W = J/s = kg m2/s3.2 Value from Watten et al. (2000).
retention time, but it was considered unnecessary and
burdensome given the large number of data that was
collected (>1500 data points).
Experimental data were downloaded into MS
Excel1 (Microsoft Corp.) for processing, plotting,
and analysis, and later exporting into Tecplot 10
(Tecplot Inc.) to create vector and contour velocity
plots of the MCR. A two-way analysis of variance
(ANOVA) was used to evaluate possible velocity
differences between mixed-cells as well as between
depths. Also, water velocities of each mixed-cell at
each depth were averaged at specific radial distances
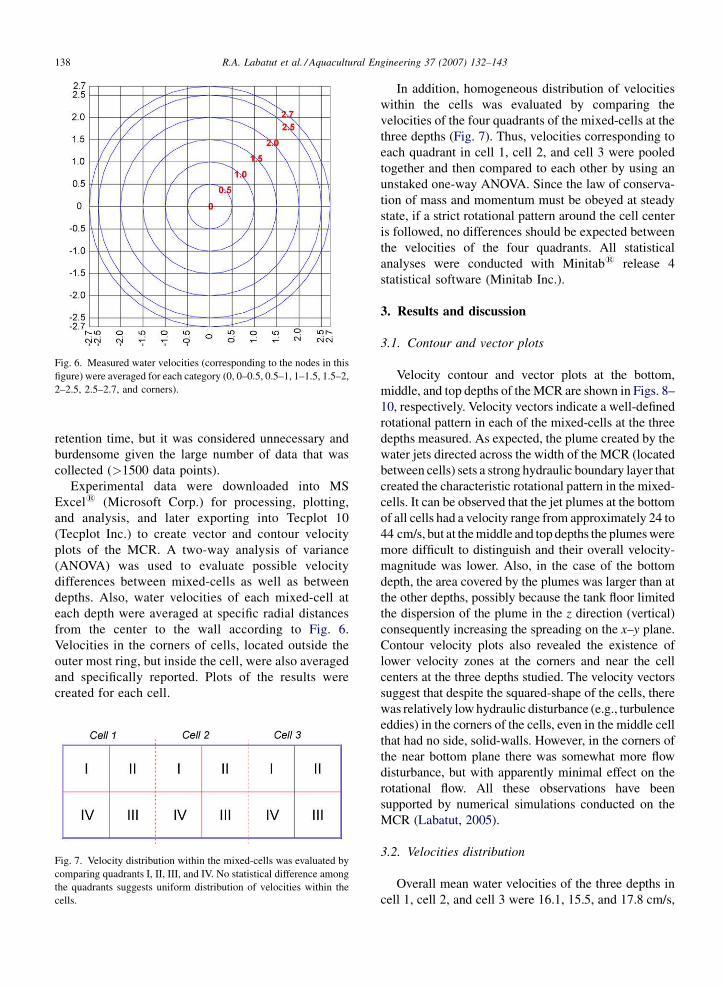
from the center to the wall according to Fig. 6.
Velocities in the corners of cells, located outside the
outer most ring, but inside the cell, were also averaged
and specifically reported. Plots of the results were
created for each cell.
In addition, homogeneous distribution of velocities
within the cells was evaluated by comparing the
velocities of the four quadrants of the mixed-cells at the
three depths (Fig. 7). Thus, velocities corresponding to
each quadrant in cell 1, cell 2, and cell 3 were pooled
together and then compared to each other by using an
unstaked one-way ANOVA. Since the law of conserva-
tion of mass and momentum must be obeyed at steady
state, if a strict rotational pattern around the cell center
is followed, no differences should be expected between
the velocities of the four quadrants. All statistical
analyses were conducted with Minitab1 release 4
statistical software (Minitab Inc.).
3. Results and discussion
3.1. Contour and vector plots
Velocity contour and vector plots at the bottom,
middle, and top depths of theMCR are shown in Figs. 8–
10, respectively. Velocity vectors indicate a well-defined
rotational pattern in each of the mixed-cells at the three
depths measured. As expected, the plume created by the
water jets directed across the width of the MCR (located
between cells) sets a strong hydraulic boundary layer that
created the characteristic rotational pattern in the mixed-
cells. It can be observed that the jet plumes at the bottom
of all cells had a velocity range from approximately 24 to
44 cm/s, but at themiddle and top depths the plumeswere
more difficult to distinguish and their overall velocity-
magnitude was lower. Also, in the case of the bottom
depth, the area covered by the plumes was larger than at
the other depths, possibly because the tank floor limited
the dispersion of the plume in the z direction (vertical)
consequently increasing the spreading on the x–y plane.
Contour velocity plots also revealed the existence of
lower velocity zones at the corners and near the cell
centers at the three depths studied. The velocity vectors
suggest that despite the squared-shape of the cells, there
was relatively low hydraulic disturbance (e.g., turbulence
eddies) in the corners of the cells, even in the middle cell
that had no side, solid-walls. However, in the corners of
the near bottom plane there was somewhat more flow
disturbance, but with apparently minimal effect on the
rotational flow. All these observations have been
supported by numerical simulations conducted on the
MCR (Labatut, 2005).
3.2. Velocities distribution
Overall mean water velocities of the three depths in
cell 1, cell 2, and cell 3 were 16.1, 15.5, and 17.8 cm/s,
R.A. Labatut et al. / Aquacultural Engineering 37 (2007) 132–143138
Fig. 6. Measured water velocities (corresponding to the nodes in this
figure) were averaged for each category (0, 0–0.5, 0.5–1, 1–1.5, 1.5–2,
2–2.5, 2.5–2.7, and corners).
Fig. 7. Velocity distribution within the mixed-cells was evaluated by
comparing quadrants I, II, III, and IV. No statistical difference among
the quadrants suggests uniform distribution of velocities within the
cells.
respectively (Table 2).Although no statistical differences
( p > 0.05) were detected between velocity-magnitudes
of cells 1 and 2, cell 3 did show significant differences
when was compared with cells 1 and 2 ( p < 0.05).
Differences regarding cell 3 can be explained because
unlike cells 1 and 2 that had a water depth of 1 m at the
moment of measurement, cell 3 had a water depth of
0.9 m when it was measured. As stated in this study, any
change in the tank configuration, dimensions or operating
conditions can have an impact on the magnitude of the
water velocities. Accordingly, if cell 3 had had the same
depth (1 m), we would not expect to found significant
differences considering that cell 3 would have had lower
overall velocities.
Also, even though cell 1 had three solid-walls and
cell 2 just two, the fact that no statistical differences
were found between cells 1 and 2 indicated that the
hydraulic boundary layer at the outer portion of the
rotating vortex can be as effective as a solid-wall in
maintaining the rotating fluid flow limited to a cell.
However, dispersion of kinetic energy between cells
cannot be prevented by the hydraulic boundary by
itself, as the jet plumes observed in the velocity
contours appear much less defined and narrower in that
region.
Mean water velocities of the MCR at the bottom,
middle, and top were 18.9, 15.8, and 14.7 cm/s,
respectively (Table 2). Velocity differences between
R.A. Labatut et al. / Aquacultural Engineering 37 (2007) 132–143 139
Fig. 8. Velocity contour and vector (uniform length) plots at the bottom depth of the MCR. From left to right: cell 1, cell 2, and cell 3.
Fig. 9. Velocity contour and vector (uniform length) plots at the middle depth of the MCR. From left to right: cell 1, cell 2, and cell 3.

the three depths were highly significant ( p < 0.01) in all
three mixed-cells.
Higher velocities toward the bottom of the tank are
explained mainly because the five nozzles in the vertical
manifolds were started from 0.34 m below the water
surface, since the highest water velocities in a tank are
normally required near the bottom, i.e., to achieve self-
cleaning. Bottom velocities were on average 1.15
(S.D. = 0.02) times greater than the grand mean water
velocity of the MCR. As long as the velocity gradient is
not too steep to compromise mixing or fish production,
absolutely uniform velocities throughout the z axis are
not considered necessary or practical. Moreover, mean
water velocities in each cell were on the range
recommended by Davidson and Summerfelt (2004) to
improve fish health and condition.
Mean water velocities of cell 1, cell 2, and cell 3
represented 3.37, 3.24, and 3.72%of the inlet jet velocity,
respectively. The higher proportionality constant found
in cell 3 relates back to the fact that this cellwas shallower
than cells 1 and 2. For an equal influent flux of
momentum exerted in the three cells, cell 3 had a lower
mass quantity (water) to accelerate; therefore the final
water velocities observed were higher, and so the
proportionality constant was somewhat proportionally
higher. In general, all proportionality constants were very
close to the design value used in this study (3.7%), which
was reported by Watten et al. (2000). As calculated in
Section 2.2, a pressure head of 1.36 m on the jet port
manifolds was required to achieve the design jet velocity
of 4.8 m/s. The power requirements to achieve the head
and flow rate necessary were 8.9 kW/m3 of the MCR
(Table 1); a higher value than that required by Watten
et al. (2000), i.e., 6.7 kW/m3. However, this difference is
expected considering that in Watten’s study the water
exchange rate usedwas 1.3volumes per hour,while in the
present study it was 1.7, which is the same proportional
difference to the difference in power requirements. In
addition, although our MCR was four times greater in
size/volume than Watten’s, there was no evidence of
R.A. Labatut et al. / Aquacultural Engineering 37 (2007) 132–143140
Fig. 10. Velocity contour and vector (uniform length) plots at the top level of the MCR. From left to right: cell 1, cell 2, and cell 3.
Table 2
Summary of water velocities (cm/s) measured in the MCR
Depth Cell 1 Cell 2 Cell 3 n Mean S.D.
Bottom 18.6 17.5 20.6 507 18.9 12.3
Middle 15.9 14.3 17.0 507 15.8 8.4
Top 13.8 14.7 15.7 507 14.7 7.4
n 507 507 507 1521
Mean 16.1 15.5 17.8 16.5 (grand mean) 9.8
S.D. 9.2 8.9 11.0
Fig. 11. Average water velocities for the bottom, middle, and top
depths of the mixed-cell 1 at radial distance from the cell center to the
wall. Velocities at the cell corners are also shown at the far right of the
graph.

scale-up effects in our study, as the difference in input
power was reflected in higher water velocities in our
MCR, i.e., Watten et al. (2000) found a grand mean of
water velocities of 13 cm/s, while in our study it was
17 cm/s (Table 2). In summary, the differences in power
requirements for the pumping were proportional to both
the lower HRT and to the higher influent momentum,
which ultimately resulted in higher water velocities.
Although, scale-up effects on water velocities for even
larger systems would not be expected, physical limita-
tions of this assumption can be exploredmore thoroughly
by CFD analyses.
Water velocities of each mixed-cell at each depth
were averaged at radial distance from the center to the
wall. Results for cell 1, cell 2, and cell 3 are shown in
Figs. 11–13, respectively.
Through Figs. 11–13, it can be observed that water
velocities in the MCR follow a linear trend (R2 = 0.92),
increasing from the cell center to its wall circumfer-
ential perimeter (i.e., not taking into account the
velocity at the corners) (Eq. (5)). This positive trend has
been also observed in circular tanks (Davidson and
Summerfelt, 2004) and it is typical of fully rotational
flows. Irrotational flows follow just the opposite trend,
i.e., higher velocities towards its axis of rotation.
Figs. 11–13 also show the differences in water velocities
of cells 1 and 2 respect to cell 3 due to the water depth
dissimilarity pointed out earlier:
UR ðcm=sÞ ¼ 5:6 radial position ðmÞ þ 4:0 (5)
where S.D. = 1.68; R2 = 0.92; p < 0.01; n = 21; S.E.
coef. = 0.39.
When the velocity-magnitudes of the three mixed-
cells and three depths were averaged, the grandmean of
water velocities at the cell center and the periphery was
3.7 and 21.9 cm/s, respectively. Davidson and Sum-
merfelt (2004) reported that the optimum rotational
period for a circular tank of similar dimensions of a
single cell (3.7 m diameter) was between 1.0 and
1.3 min/rotation. This range was obtained based on
tank self-cleaning characteristics and optimal velo-
cities for health and condition of fish on the range of
12–24 cm in length. Using the average measured water
velocity of 21.9 cm/s near the cell wall and a diameter
of 5.5 m, the rotational period was 1.3 min/rotation for
the MCR, which was the upper limit suggested by
Davidson and Summerfelt (2004). This is a strong
indicator that an MCR can be used to effectively create
desired circular tank dynamics for characteristic fish
environments.
Homogeneous distribution of velocities within the
cells was evaluated by comparing the pooled velocities
of the three mixed-cells for the four cell quadrants and
assuming complete symmetry among them. This
assumption is supported by an unstacked one-way
ANOVA that indicated the differences between the four
quadrants were not statistically significant ( p > 0.05).
This also suggests that a velocity-uniform rotational
flow was correctly developed around the cell centers
(Table 3). A significant deviation of the rotational flow
from the z axis or a large turbulent dispersion could have
produced differences between the velocities of the
quadrants.
R.A. Labatut et al. / Aquacultural Engineering 37 (2007) 132–143 141
Fig. 12. Average water velocities for the bottom, middle, and top
depths of the mixed-cell 2 at radial distance from the cell center to the
wall. Velocities at the cell corners are also shown at the far right of the
graph.
Fig. 13. Averagewater velocities for the bottom,middle, and top depths
of the mixed-cell 3 at radial distance from the cell center to the wall.
Velocities at the cell corners are also shown at the far right of the graph.
Table 3
Distribution of velocities within the four quadrants of the mixed-cells
Quadrant n Mean S.D. p
I 315 16.8 10.4 0.278
II 315 15.7 7.4
III 315 17.2 10.6
IV 315 16.5 11.0

3.3. Mixing capability
In mixed-cells, the primary rotating flow combined
with the theoretical no-slip condition of the walls
creates a secondary flow with inward radial velocity
component at the bottom and outward radial velocity
component at the tank surface (Timmons et al., 1998;
Schlichting and Gersten, 2000). The rationale behind
this is that the centrifugal force and the radial pressure
gradient (directed inwards) for circulating particles are
in equilibrium at large distances from the wall.
However, when these particles are close to the wall,
their rotational velocity is greatly reduced (i.e., no-slip
condition), which decreases their centrifugal force and
the radial pressure gradient creates the inward radial
flow close to the bottom that for reasons of continuity
rises in axial direction just in the center of the swirl
(Schlichting and Gersten, 2000).
The inward radial flow along the bottom carries
settleable solids to the bottom-center drain and creates
the self-cleaning characteristic in swirl-flow-based
vessels. However, it has been reported that this kind of
flow can create an irrotational zone in a torus-shaped
region about the bottom-center drain with lower
velocities and poor mixing (Timmons et al., 1998).
Since the irrotational zone has lower water velocities and
does not mix well, it can decrease the effective use of the
culture tank by producing short-circuiting of flow and a
stagnant volume in the torus-shaped region. Moreover,
there was a concern that the corners of the cells could
become dead volumes, too. The degree of mixing in the
tank was not measured directly by using an analysis like
RTD (Levenspiel, 1999). However, the velocity data
presented suggests that the entireMCRwas hydraulically
active and attained an adequate degree of mixing. This
observation is supported by Watten et al. (2000) who
found an absence of stagnant regions in an MCR
subjected to 1.3 exchanges per hour, while thisMCRwas
subjected to 1.7 exchanges per hour. Moreover, not only
velocity vector plots show that the rotational flowwas not
affected by the corners, but also the rotationwas extended
across the entire depth of the flow.
Velocity measurements were made without fish
present. The presence of fish could alter the velocity
flow patterns that are presented in this study but it would
also increase the turbulence, which in turn will improve
mixing within the tank.
3.4. Self-cleaning characteristics of the MCR
Davidson and Summerfelt (2004) reported that a
surface loading rate of 5–6 L/min m2 at the bottom-
center drain was required to achieve optimum solids
flushing hydraulics, i.e., self-cleaning, within Cornell
dual-drain culture tanks. In ourMCR study, with 15% of
the flow rate being discharged by the bottom-center
drain, the surface loading rate of each cell was 4.2 L/
min m2 of the cell floor (Table 1). Although this value
was somewhat lower than that recommended by
Davidson and Summerfelt (2004), numerical simula-
tions conducted on the MCR at these operating
conditions suggested that self-cleaning was attainable
in the mixed-cells (Labatut, 2005) under the lower
center drain hydraulic loading rate. Moreover, the
average water velocity at the bottom of the mixed-cells
was 18.9 cm/s (Table 2), which was within the range
recommended by Timmons et al. (1998) and Davidson
and Summerfelt (2004) to promote tank self-cleaning
(see Section 2.2). This suggests that using a single
design criterion, such as the surface loading rate, may
not be adequate to define the hydraulic conditions
required to promote self-cleaning independent of other
parameters. Tank characteristics such as diameter-to-
depth ratio or physical size can influence greatly the
efficiency of the self-cleaning process. The use of CFD
methods will improve substantially the current knowl-
edge about the main factors controlling the efficiency of
different processes to determine the optimal operating
conditions for any particular size and geometry.
4. Conclusions
Water velocities found in the MCR were within the
optimum range recommended to promote fish health
and condition as well as to develop self-cleaning ability
in circular tanks. This effective MCR environment
required a nozzle diameter of 15 mm, a jet velocity of
4.8 m/s, and a jet port manifold head of 1.36 m for the
particular MCR studied. With these settings, the power
requirements of the 91 m3 MCR required 8.9 W/m3 of
water to be operated.
Similarly to circular tanks, MCR water velocities
decreased in a linear manner from the periphery to the
center of the cells. The same decreasing trend in the
water velocities was observed from the tank floor to the
free water surface.
Contour and vector velocity plots showed that the
mixed-cells develop a well-defined rotational pattern
around the bottom-center drain. The hydraulic bound-
ary layer set by the water jets directed across the width
of the MCR is able to limit the rotational flow to each
cell and create the required counter-rotational patterns
between adjacent mixed-cells. Moreover, analyses
demonstrated complete symmetry between the four
R.A. Labatut et al. / Aquacultural Engineering 37 (2007) 132–143142

quadrants of the mixed-cells suggesting that a velocity-
uniform rotational flow was developed around the cell
centers. Velocity vectors show that despite the square-
shape of the cells, there is a relatively low hydraulic
disturbance in the corners of the cells, even in the
middle cell that has no side, solid-walls. Vector and
contour plots also suggested the absence of dead
volumes or short-circuiting within the MCR.
Velocity data analysis based upon comparison of our
large-scale MCR to the study results obtained in a four
times smaller, but similar MCR suggest that there are no
observable effects upon scaling-up of the MCR.
However, caution should be applied in applying these
results to even larger MCR’s. CFD studies seems to be
the evident next step to answer this and other questions
regarding the influence of the size and geometry on tank
hydrodynamics.
Acknowledgements
Special acknowledgements to Gobierno de Chile,
CONICYT for the support that made possible pursuing
my graduate studies at Cornell. Also, I would like to
thank to the Conservation Fund’s Freshwater Institute,
the United States Department of Agriculture, Agricul-
tural Research Service under Cooperative Agreement
number 59-1930-1-130 and Magnolia Shrimp, LLC,
Atlanta, Georgia, for the support and contribution
provided for developing this study.
Part of this research was conducted using the
resources of the Cornell Theory Center, which receives
funding from Cornell University, New York State,
federal agencies, foundations, and corporate partners.
References
Brater, E.F., King, H.W., 1976. Handbook of Hydraulics: For the
Solution of Hydraulic Engineering Problems, 6th ed. McGraw
Hill Co., New York, NY, 604 pp.
Davidson, J., Summerfelt, S.T., 2004. Solids flushing, mixing and
water velocity profiles within large (10 and 150 m3) circular
‘Cornell-type’ dual-drain tanks. Aquacult. Eng. 32, 245–271.
Ebeling, J.M., Timmons, M.B., Joiner, J.A., Labatut, R.A., 2005.
Mixed-cell raceway: engineering design criteria, construction,
hydraulic characterization. North Am. J. Aquacult. 67, 193–201.
Labatut, R.A., 2005. Hydrodynamics of a Mixed-Cell Raceway
(MCR): experimental and numerical analysis. MS Thesis. Cornell
University, Ithaca, NY.
Levenspiel, O., 1999. Chemical Reaction Engineering, 3rd ed. John
Wiley & Sons, Inc., New York, NY, 668 pp.
Patwardhan, W., 2002. CFD modeling of jet mixed tanks. Chem. Eng.
Sci. 57, 1307–1318.
Paul, T.C., Sayal, S.K., Sakhuja, V.S., Dhillon, G.S., 1991. Vortex-
settling basin design considerations. J. Hydraulic Eng. 117, 172–
189.
Schlichting, H., Gersten, K., 2000. Boundary-layer Theory, 8th ed.
Springer, Berlin, 801 pp.
SonTek, 2005. SonTek Argonaut ADV—performance specifications.
http://www.sontek.com/download/brochure/arg-adv.pdf (retrieved
on September 29, 2006).
Summerfelt, S.T., Davidson, J., Timmons, M.B., 2000. Hydrody-
namics in the ‘Cornell-type’ dual-drain tank. In: Libey, G.S.,
Timmons, M.B. (Eds.), Proceedings of the Third International
Conference on Recirculating Aquaculture, Virginia Polytechnic
Institute and State University, Roanoke, VA, July 22–23, pp. 160–
166.
Timmons, M.B., Summerfelt, S.T., Vinci, B.J., 1998. Review of
circular tank technology and management. Aquacult. Eng. 18,
51–69.
Timmons, M.B., Ebeling, J.M., Wheaton, F.W., Summerfelt, S.T.,
Vinci, B.J., 2002. Recirculating Aquaculture Systems. NRAC
Publication No. 01-002, 2nd ed. Northeastern Regional Aqua-
culture Center, Cayuga Aqua Ventures, Ithaca, NY, 769 pp.
Totland, G., Kryvi, H., Jodestol, K., Christiansen, E., Tangeras, A.,
Slinde, E., 1987. Growth and composition of swimming muscle of
adult Atlantic salmon (Salmo salar L.) during long-term sustained
swimming. Aquaculture 66, 299–313.
Watten, B., Beck, L., 1987. Comparative hydraulics of a rectangular
cross-flow rearing unit. Aquacult. Eng. 6, 127–140.
Watten, J.W., Honeyfield, D.C., Schwartz, M.F., 2000. Hydraulic
characteristics of a rectangular mixed-cell rearing unit. Aquacult.
Eng. 24, 59–73.
Westers, H., Pratt, K., 1977. Rational design for hatcheries of intensive
salmonid culture, based on metabolite characteristics. Prog. Fish
Cult. 39, 7–165.
R.A. Labatut et al. / Aquacultural Engineering 37 (2007) 132–143 143