Hydrochemistry of Wet Atmospheric Precipitation Over an Urban Area in Northern Indo-Gangetic Plains
18
Hydrochemistry of Wet Atmospheric Precipitation Over an Urban Area in Northern Indo-Gangetic Plains Kunwar P. Singh & Vinod K. Singh & Amrita Malik & Neha Sharma & Ramesh C. Murthy & Ranjan Kumar Received: 31 May 2006 / Accepted: 22 August 2006 / Published online: 14 December 2006 # Springer Science + Business Media B.V. 2006 Abstract Rain water samples were collected to study the chemical composition of wet atmospheric precip- itation (first event) over the Lucknow city in the northern Indo-gangetic alluvial plains. The samples were collected in the month of July, 2005 from different sites. The wet precipitation samples were analyzed for pH, EC, major ions (HCO 3 , Cl − , SO 2 4 , NO 3 , PO 3 4 ,F − , Na + ,K + , Ca 2+ , Mg 2+ , NH þ 4 ) and heavy metals (As, Cd, Al, Co, Cr, Cu, Fe, Mn, Mo, Ni, Hg, Pb, Se, Sn, Ti, V, Zn). The pH values of wet precipitation samples ranged between 6.5 and 8.7. The analysis of linear regression applied to the set of studied variables and computation of neutralization factors showed that neutralization occurred in precip- itation samples and Ca 2+ had the maximum neutral- ization capacity. It was found that Cl − , SO 2 4 , Ca 2+ , Mg 2+ , Na + and K + in the precipitation samples originated mainly from crustal/anthropogenic sources in the region. On an average Fe, and Al accounted for >72% of the total concentration of trace metals in the wet precipitation samples followed by Zn (>10%). Enrichment factors calculated for heavy metals over reference background level in seawater and Earth’ s crust showed relatively higher enrichment of Zn. The principal component analysis (PCA) identified the possible sources of ionic species and heavy metals in the wet precipitation samples. Keywords Wet precipitation . Major ions . Trace metals . Composition . Enrichment Principal component analysis 1 Introduction High population growth and increased energy con- sumption during last few decades have resulted in elevated atmospheric pollutants load in India. Annual emissions of SO 2 (4437.2 Gg) and NO 2 (3235.5 Gg) in India estimated for 1995 have been reported to increase by 29% and 34%, respectively during 1997 (Streets, Tsai, Akimoto, & Oka, 2001). Chemical pollutants, such as oxides of sulphur and nitrogen, salts, metals, and organics etc. emitted to the atmosphere from natural and anthropogenic sources, generally remain present in the atmosphere as adsorbed on to the particulate matter or in their vapour forms, are scavenged by precipitation through dissolution when come in contact with the falling rain droplets. Wet atmospheric precipitation is one of the most effective mechanisms for removal of both the particulate as well as gaseous pollutants from the Environ Monit Assess (2007) 131:237–254 DOI 10.1007/s10661-006-9472-6 K. P. Singh (*) : V. K. Singh : A. Malik : N. Sharma : R. C. Murthy : R. Kumar Environmental Chemistry Section, Industrial Toxicology Research Centre, Post Box 80, Mahatma Gandhi Marg, Lucknow 226 001, India e-mail: [email protected]
-
Upload
independent -
Category
Documents
-
view
1 -
download
0
Transcript of Hydrochemistry of Wet Atmospheric Precipitation Over an Urban Area in Northern Indo-Gangetic Plains
Hydrochemistry of Wet Atmospheric PrecipitationOver an Urban Area in Northern Indo-Gangetic Plains
Kunwar P. Singh & Vinod K. Singh &
Amrita Malik & Neha Sharma &
Ramesh C. Murthy & Ranjan Kumar
Received: 31 May 2006 /Accepted: 22 August 2006 / Published online: 14 December 2006# Springer Science + Business Media B.V. 2006
Abstract Rain water samples were collected to studythe chemical composition of wet atmospheric precip-itation (first event) over the Lucknow city in thenorthern Indo-gangetic alluvial plains. The sampleswere collected in the month of July, 2005 fromdifferent sites. The wet precipitation samples wereanalyzed for pH, EC, major ions (HCO�
3 , Cl−, SO2�
4 ,NO�
3 , PO3�4 , F−, Na+, K+, Ca2+, Mg2+, NHþ
4 ) andheavy metals (As, Cd, Al, Co, Cr, Cu, Fe, Mn, Mo,Ni, Hg, Pb, Se, Sn, Ti, V, Zn). The pH values of wetprecipitation samples ranged between 6.5 and 8.7.The analysis of linear regression applied to the set ofstudied variables and computation of neutralizationfactors showed that neutralization occurred in precip-itation samples and Ca2+ had the maximum neutral-ization capacity. It was found that Cl−, SO2�
4 , Ca2+,Mg2+, Na+ and K+ in the precipitation samplesoriginated mainly from crustal/anthropogenic sourcesin the region. On an average Fe, and Al accounted for>72% of the total concentration of trace metals in thewet precipitation samples followed by Zn (>10%).Enrichment factors calculated for heavy metals over
reference background level in seawater and Earth’scrust showed relatively higher enrichment of Zn. Theprincipal component analysis (PCA) identified thepossible sources of ionic species and heavy metals inthe wet precipitation samples.
Keywords Wet precipitation .Major ions .
Trace metals . Composition . EnrichmentPrincipal component analysis
1 Introduction
High population growth and increased energy con-sumption during last few decades have resulted inelevated atmospheric pollutants load in India. Annualemissions of SO2 (4437.2 Gg) and NO2 (3235.5 Gg)in India estimated for 1995 have been reported toincrease by 29% and 34%, respectively during 1997(Streets, Tsai, Akimoto, & Oka, 2001). Chemicalpollutants, such as oxides of sulphur and nitrogen,salts, metals, and organics etc. emitted to theatmosphere from natural and anthropogenic sources,generally remain present in the atmosphere asadsorbed on to the particulate matter or in theirvapour forms, are scavenged by precipitation throughdissolution when come in contact with the fallingrain droplets. Wet atmospheric precipitation is one ofthe most effective mechanisms for removal of boththe particulate as well as gaseous pollutants from the
Environ Monit Assess (2007) 131:237–254DOI 10.1007/s10661-006-9472-6
K. P. Singh (*) :V. K. Singh :A. Malik :N. Sharma :R. C. Murthy :R. KumarEnvironmental Chemistry Section,Industrial Toxicology Research Centre,Post Box 80, Mahatma Gandhi Marg,Lucknow 226 001, Indiae-mail: [email protected]
atmosphere. The scavenging of the atmosphericpollutants affects the chemical composition and thepH of precipitation (Al-Khashman, 2005). The hydro-chemistry of precipitation, although emanate from aseries of complex in-cloud and below-cloud atmo-spheric chemical reactions, is largely influenced byatmospheric emissions having direct relevance withthe natural and anthropogenic activities in a region,and thus, helps to understand the chemical state of theatmosphere both, in which the rain-bearing cloudshave formed and that beneath the clouds throughwhich rain droplets travel. It reveals the undergoingregional processes and activities as well as the natureand extent of trans-boundary movement and transportof several persistent organic pollutants of globalconcern (UNEP, 2002). Thus, wet precipitation canbe responsible both for reduction of the atmosphericload of pollutants as well as contamination of the re-ceiving compartments (soil, water, vegetation) on theearth. The local sources largely influence the chemicalcomposition of wet precipitation, which varies fromsite to site and region to region (U. C. Kulshrestha,M. J. Kulshrestha, Sekar, Sastry, & Vairamani, 2003).The chemical composition of wet precipitation at a sitedepends on local emissions, pollutants transport, eleva-tion above sea level and precipitation drop size.Anthropogenic sources mainly related with emissionsof sulphur and nitrogen, which are precursor of H2SO4
and HNO3 may alter the precipitation chemistry toacidic nature. In poorly buffered watersheds, acidifi-cation caused by acidic precipitation may adverselyaffect the ecosystems. The rainwater acidity valuedepends on the neutralization produced by certaincompounds, such as ammonia, calcium andmagnesiumcarbonates and hydroxides present in atmosphere(Flues, Hamma, Lemes, Dantas, & Fornaro, 2002).However, in temperate climates the dust particles inthe atmosphere, which carry basic cations, play animportant role towards neutralization of the precipita-tion acidity. In India, soil is a major contributor ofparticulates in the atmosphere (Khemani et al., 1985;Mahadevan, Negi, & Meenakshy, 1989).
Heavy metals constitute another group of pollut-ants, which interact with the wet precipitation. Inaddition to natural sources (such as dusty storms,volcanic eruptions, etc.), heavy metals originatemainly from metal refining, fossil fuel combustion,vehicular exhausts, and other anthropogenic activities,and stay in environment until removed by some
mechanism, such as dry deposition, scavenging andrain wash out (Hou, Takamatsu, Koshikawa, &Hosomi, 2005). These metals remain present in theatmosphere as aerosols and, to a lesser extent, asgases. Relatively high solubility and reactivity ofheavy metals emitted by combustion processes due tosmaller size of their carrier particles make themeasily soluble in rain water, especially at low pH.Trace metals in rainwater have been recognized asmajor pollutants in forests (Matschullat, Kritzer, &Maenhaut, 1995). However, precipitation chemistryand contamination of rainwater by atmospheric pol-lutants is of growing concern both on regional as wellas global scales (Galloway, Likens, & Hawley, 1984).
In India, during last about two decades, a fewstudies have been conducted on chemical compositionof rainwater in different parts of the country (Agarwal& Singh, 2001; Handa, Kumar, & Goel, 1982; Khare,Goel, Patel, & Behari, 2004; Khemani et al., 1987,1994; Naik, Khemani, Momin, & Rao, 1988; Naiket al., 1994; Naik, Momin, Rao, Safai, & Ali, 2002;Pillai et al., 2001; Satsangi et al., 1998).
Hydrochemistry of precipitation can provide infor-mation about the prevailing state of the atmosphericenvironment of study area, nature and type of sourcesthat contribute to the precipitation chemistry, atmo-spheric transport of pollutants and their potentialimpacts on the ecosystems of the receiving area.
The purpose of the present study is to characterizethe wet atmospheric precipitation (first event) forchemical composition over urban area of Lucknow inalluvial Indo-gangetic plains, with a view to gain aninitial understanding of the first event rainwatercomposition, identifying major chemical species, andto identify the possible sources of the studied ions andchemical elements in the region.
2 Experimental
2.1 Study area
Lucknow, situated on the banks of the Gomti River, isthe state capital of Uttar Pradesh, in the northern partof India (26° 45′ to 27° N latitude; 80° 50′ to 81° 05′E longitude) at an altitude of 123 m (above mean sealevel). The city covering an area of about 400 km2 hasa population of about 3.5 million (Census, 2001). Thetown is encompassed by agricultural land on its
238 Environ Monit Assess (2007) 131:237–254

outskirts, orchards, and different types of industrialunits such as metals based, chemicals, pharmaceu-ticals, brick-kilns, etc. Most of the atmosphericemissions in the study area are generated mainly bythe diesel and petrol powered vehicles, and fossilfuels combustion. In a peripheral area of about100 km around the city, there are heavy industrialtownships, known for heavy industries of fertilizers,pesticides, chemicals, tanneries, distilleries, sugarmills, coal-fired thermal power station, etc. Moreover,the city has significant number of mobile sources ofpollution, such as about 749,830 petrol and dieseldriven light and heavy vehicles.
The region, experiences three distinct seasons,winter from November to February, summer from
March to June, and monsoon from July to October.The average annual rainfall in the region amount toabout 852 mm and the major fraction of precipitationis received during the monsoon (June–September)months. The region receives precipitation due tomerging of both the southwest and northwest mon-soons in the third week of June and continues up toSeptember–October. Winters are cold with minimumtemperature approaching 4 °C. The summers are hotexperiencing temperature up to 48 °C with dusty hotwinds and dry storms across the region. The atmo-sphere is loaded with dust by the time the monsoonsets on. Therefore, the first monsoon precipitationwashes away the atmospheric dust load cleaning theatmosphere.
1
2
3
4 567
8
910
11
1213
141516
17
1819
2021 22
23
24
25
26
2728
29
30
31
3233
3435 36
37
38
39
40
41
42434445 46
47
48
49
50
80.86 80.89 80.92 80.95 80.98 81.01
26.74
26.76
26.78
26.8
26.82
26.84
26.86
26.88
26.9
26.92
Lucknow
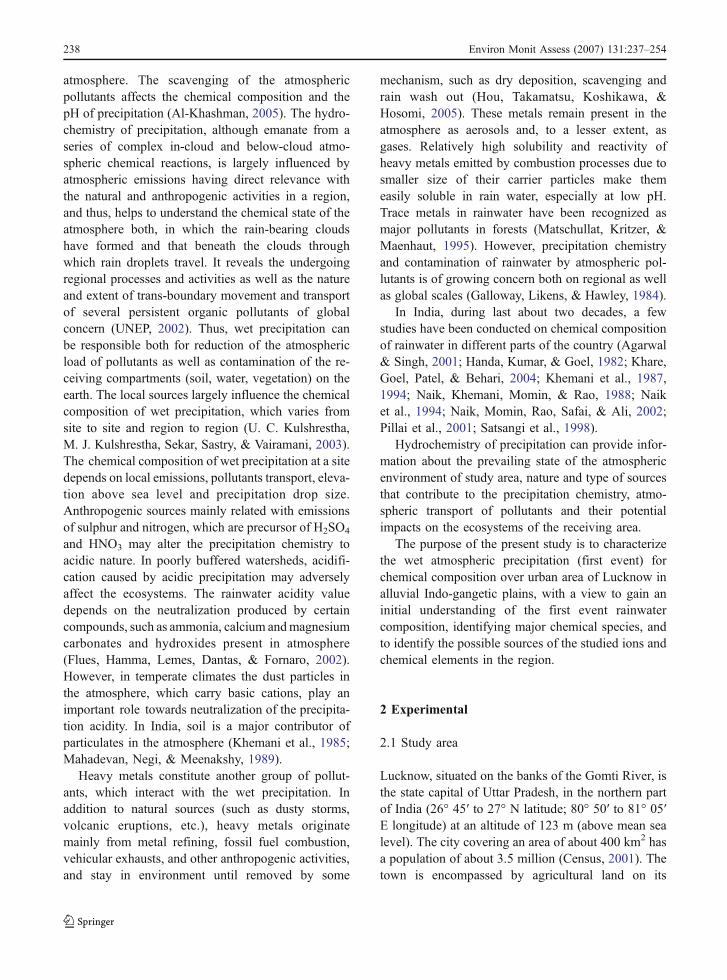
IndiaFigure 1 Map showing thesampling network in thestudy area.
Environ Monit Assess (2007) 131:237–254 239
2.2 Collection of precipitation samples
A sampling network for collection of rainwatersamples was comprised of total 50 locations in theLucknow city (Figure 1). The network was designedin such a way as to cover areas representing the semi-urban at the outskirts of the town, highly populated inthe old congested city, industrial zones, near high-ways and newly established colonies through out thetown. First monsoon precipitation water samples(single event on a given day or as multiple events ina day) were collected from all the 50 sites at about10 m height above the ground. The wet only eventswere collected manually using a large diameter PVCfunnel (diameter 50 cm) fitted to a 5-l high densitypolyethylene container. The sampling funnel wasuncovered only during precipitation events therebyavoiding contribution from dry fall out. The samplingbottles and funnels were thoroughly washed withdetergent and HNO3, and then rinsed with deionizedwater and dried before use (Al-Khashman, 2005). Thesample collectors were deployed just before onset ofrainfall and were withdrawn immediately after theywere filled. All the samples in air-tight containerswere immediately transferred to the laboratory, wherepH and electrical conductivity (EC) were measuredimmediately on arrival of the samples in the labora-tory. pH measurements were performed using cali-brated pH-meter (model 744, Metrohm, Switzerland),while electrical conductivity was measured with aconductivity meter (model 162A, ThermoOrion,
USA). Subsequently, all the samples were filteredthrough a pre-washed Whatman filter No. 41 (Singhet al., 2001) in to pre-cleaned polypropylene bottlesafter preconditioning the filter and filter device byrinsing with 20 ml de-ionized water. Filters were pre-washed with 200 ml de-ionized water and dried at100 °C to remove the inorganic contaminants (Bagchi& Haddad, 1986). The filter blanks showed nocontamination. The filtered samples were stored atlow temperature (4 °C) in a refrigerator until analyzedfor other parameters. All the samples were analyzedwithin a period of seven days. The sample collectionand storage containers first washed with detergent andrepeatedly washed with de-ionized water. These werestored in this water for 24 h. The measured waterconductivity was found within 2 μS/cm (ASTM,1996).
2.3 Chemical analysis
All the samples were analyzed for major inorganicions, viz. bicarbonate (HCO�
3 ), chloride (Cl−), sul-phate (SO2�
4 ), nitrate (NO�3 ), phosphate (PO3�
4 ),fluoride (F−), sodium (Na+), potassium (K+), calcium(Ca2+), magnesium (Mg2+), and ammonium (NHþ
4 ).Major anions viz. SO2�
4 , NO�3 , PO3�
4 , and F− wereanalyzed usingmodular IonChromatograph (Metrohm,Switzerland) having a Metrohm IC-709 program-mable pump, Metrohm IC-733 separation centre,Metrohm IC-753 suppressor module and a MetrohmIC-732 conductivity detector. The separation was
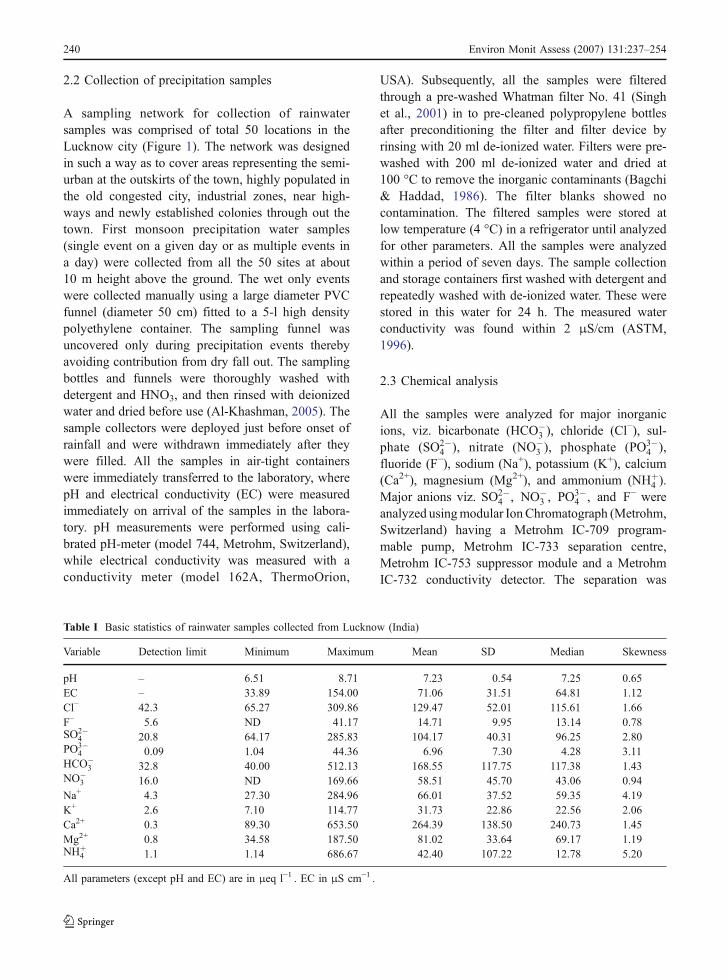
Table I Basic statistics of rainwater samples collected from Lucknow (India)
Variable Detection limit Minimum Maximum Mean SD Median Skewness
pH – 6.51 8.71 7.23 0.54 7.25 0.65EC – 33.89 154.00 71.06 31.51 64.81 1.12Cl− 42.3 65.27 309.86 129.47 52.01 115.61 1.66F− 5.6 ND 41.17 14.71 9.95 13.14 0.78SO2�
4 20.8 64.17 285.83 104.17 40.31 96.25 2.80PO3�
4 0.09 1.04 44.36 6.96 7.30 4.28 3.11HCO�
3 32.8 40.00 512.13 168.55 117.75 117.38 1.43NO�
3 16.0 ND 169.66 58.51 45.70 43.06 0.94Na+ 4.3 27.30 284.96 66.01 37.52 59.35 4.19K+ 2.6 7.10 114.77 31.73 22.86 22.56 2.06Ca2+ 0.3 89.30 653.50 264.39 138.50 240.73 1.45Mg2+ 0.8 34.58 187.50 81.02 33.64 69.17 1.19NHþ
4 1.1 1.14 686.67 42.40 107.22 12.78 5.20
All parameters (except pH and EC) are in μeq l−1 . EC in μS cm−1 .
240 Environ Monit Assess (2007) 131:237–254

achieved on a metrosep anion dual column with aneluent composed of mixed sodium carbonate(1.3 mmol l−1) and sodium bicarbonate (2.0 mmoll−1). The flow rate was kept 1.0 ml min−1 with aninjection volume of 20 μl. Cl− was analysed using ionmeter (ThermoOrion). Bicarbonate was determinedtitrimetrically (APHA, 2002). Among the majorcations and heavy metals, Na and K were analyzedusing AAS (model Analyst 300, Perkins Elmer,USA), while Ca, Mg, and heavy metals (As, Cd, Al,Co, Cr, Cu, Fe, Mn, Mo, Ni, Hg, Pb, Se, Sn, Ti, V,Zn) were determined using ICP-AES (model IRIS-Intrepid II.XDL.Duo, Thermoelectron Corporation,USA). Ammonium (NHþ
4 ) was determined by ionchromatograph (Metrohm, Switzerland) using metro-sep cation 1–2 column with an eluent tartaric acid(4 mmol l−1) and dipicolinic acid (0.75 mmol l−1).The minimum detection limits (MDL) for differentionic species and metals as obtained for the methodsfollowed here are given in Tables I and IX, respec-tively. All chemicals and reagents used were ofanalytical grade. For all the ions, standard solutionswere prepared from commercially available standards(E-Merck) of 1,000 ppm and working standards wereprepared in double distilled water. All analysis wereperformed in triplicate and mean values are reported.
2.4 Data quality
The analytical data quality was ensured throughcareful standardization, procedural blank measure-ments, and spiked and duplicate samples. Thelaboratory also regularly participates in nationalprogram on analytical quality control (AQC). Basedon the principle of electro-neutrality, the quality ofchemical analysis, to some extent, may be assessed bythe ionic balance considering all the major ions in asingle sample. The percent error (E%) may beexpressed as;
E% ¼P
Cations�PAnions
PCationsþP
Anionsð1Þ
where ∑Cations is the sum of the concentration(μeq l−1) of all major cations (Ca2+, Mg2+, Na+, K+,NHþ
4 ), and ∑Anions is the sum of concentration (μeql−1) of all major anions (HCO�
3 , Cl−, SO2�
4 , NO�3 , F
−,PO3�
4 ) determined in a sample.
Precision and accuracy of the ionic species andmetal analysis data were ensured through repeatedanalysis of synthetically prepared (spiked) solutionsin double distilled water and the results were found tobe within ±5% of the respective spiked concentrationvalues. Operational conditions were adjusted to yieldoptimal determination. Quantification of metals wasbased on calibration curves of standard solutions ofmetals (Merck, India). The precision of the analyticalprocedures expressed as the relative standard devia-tion (RSD) ranged between 5% to 10%. The precisionfor the analysis of standard solution was better than5%. Recoveries of the major ionic species and metalsfrom the spiked water samples were found to bebetween 95%–104%. In all the analysis, blanks wererun and corrections were applied to the results, ifnecessary.
2.5 Principal components analysis
In order to determine the influence of natural andanthropogenic sources on hydro-chemistry of theatmospheric wet precipitation in the study area,principal component analysis (PCA) was applied tothe data set of chemical variables. The PCA, a datareduction method helps to reduce the larger data setscomprised of several correlated variables in to smallernumber of uncorrelated principal components (PCs),thus, extracting the latent information hidden in thedata set, allowing for better explanation and interpre-tation of the data (Singh, Malik, Mohan, & Sinha,2004). PCA technique extracts the eigenvalues andeigenvectors from the covariance matrix of originalvariables. Assuming a linear model to explain theobserved data variance using a reduced number ofcomponents, PCA decomposes the X matrix of nsam=rows (samples) and nvar=columns (variables) as (K. P.Singh, Malik, V. K. Singh, & Sinha, 2006; Tauleret al., 2004):
xij ¼XF
f¼1
aif � bf j þ eij ð2Þ
where, aif and bfj are the elements of the scores andloadings matrices A and B of (nsam x F) and (nvar x F)dimensions, respectively and eij is the error term ofthe element xij of the X data array and F is the numberof components (factors) extracted. The PCs arethe uncorrelated (orthogonal) variables, obtained by
Environ Monit Assess (2007) 131:237–254 241

multiplying the original correlated variables with theeigenvector, which is a list of coefficients (loadings orweightings). Thus, the PCs are weighted linearcombinations of the original variables. PC providesinformation on the most meaningful parameters,which describe whole data set affording data reduc-tion with minimum loss of original information (K. P.Singh, Malik, Mohan, Sinha, & V. K. Singh, 2005a).In Eq. (2), xij is the measured concentration of j th
variable in ith sample in data matrix X. The aif (scoreof component f on row i) is the contribution ofcontamination source f in sample i. The bfj (loading ofjth variable on f th component) is the contribution of j th
variable in f th contamination source, and eij is theresidual in sample i, variable j of xij not modeled bythe F environmental contamination sources. Thisequation suggests that the measured concentrationsare a weight (scores, aif) sum of a reduced number ( f )of main environmental contributions defined by aparticular chemical composition (loadings, bfj), apartfrom noise (multiple small unknown contributions)and experimental error defined by eij. The weights orscores aif, describe the distribution of main contam-ination sources among the samples and the loadingsbfj, identify the chemical composition of thesecontamination sources.
Here, the PCA was applied separately to the datasets of major ions (Cl, F, HCO3, SO4, PO4, NO3, Na,
K, Ca, Mg, and NH4), and metals (Al, Co, Cr, Fe,Mn, Ni, Pb, Sn, Ti, V, and Zn) standardized throughz-scale transformations (Singh et al., 2006). Thez-scaled variables (Zij) corresponding to the measuredraw variables (xij) are expressed as;
Zij ¼xij � xj� �
s jð3Þ
where xj is the arithmetic mean concentration ofvariable j, and σj is the standard deviation of variable jfor all samples included in this analysis. Standardiza-tion tends to minimize the influence of difference ofvariance of variables and eliminates the influence ofdifferent units of measurement and renders the datadimensionless (Singh, Malik, & Sinha, 2005b).Following the criteria of Cattell and Jaspers (1967),PCs with eigenvalue >1 were retained. A PC havingan eigenvalue higher than unity means that it containsmore information than one original variable, so thedecrease of dimensionality is ensured (K. P. Singh,Malik, & V. K. Singh, 2005c). PCA of the normalized(z-transformed) variables was performed to extractsignificant PCs and to further reduce the contributionof variables with minor significance, these PCs weresubjected to varimax rotation (raw) generating vari-factors (VFs). All computations were performed usingExcel 97 and Statistica 7.1 software. All values of
R2 = 0.9732
200
300
400
500
600
700
800
900
1000
1100
1200
200 400 600 800 1000 1200 1400
Sum of cations (µeq/l)
Sum
of a
nion
s (µ
eq/l)
Figure 2 Linear regressionplot of the cations andanions sum.
242 Environ Monit Assess (2007) 131:237–254

variables measured below their detection limits (ND)were replaced with values equal to half of therespective detection limits before performing PCA.
3 Results and Discussion
3.1 Major ions
3.1.1 Ionic balance
The ionic ratio (∑Cations/∑Anions) and ionic balance[Eq. (1)] determined in a sample indicates the complete-ness as well as correctness of the performed analysis. Ifall the major ions (cations and anions) are included inchemical analysis, the ionic ratio (∑Cations/∑Anions)is expected to be close to 1. The ionic ratio for all the50 samples varied between 0.84 and 1.15 with a meanvalue of 0.99. It suggests for inclusion of all the majorions in the sample, thus, completeness of the analysis.Moreover, the percent error (E%) computed [Eq. (1)]for all the 50 samples was within 10%. Theacceptable range of error in rainwater analysis data(USEPA) is up to 30%–60% (for sum of ions 50–100 μeq l−1), and 15%–30% for the samples havingionic sum >100 μeq l−1 (Rastogi & Sarin, 2005).Further, a linear regression was performed betweenthe sum of cations (Na+, K+, Ca2+, Mg2+, NHþ
4 ) andanions (HCO�
3 , Cl−, SO2�
4 , NO�3 , PO
3�4 , F−) in each
of the sample to check the quality of data (Figure 2).A high value of the regression coefficient (r2=0.97)between the ionic sums indicated for a good quality ofthe data.
3.1.2 Ionic composition
The univariate statistics of the hydro-chemical data(n=50) of wet precipitation at Lucknow is shown inTable I. It is evident that the average relativeabundance of various ionic species (μeq l−1) inprecipitation followed the order: Ca2þ > HCO�
3 >
Cl� > SO2�4 > Mg2þ > Naþ > NO�
3 >NHþ4 >Kþ >
F� > PO3�4 ; whereas, the category wise abundance
were in the order, Ca2þ > Mg2þ > Naþ > Kþ >
NHþ4 for cations; and HCO�
3 > Cl� > SO2�4 >
NO�3 > F� > PO3�
4 for the anions. Further, the meanpercent contribution of individual cations and anionsin precipitation are shown in Figure 3. It may benoted that among the cations, Ca2+ alone contributed
to about 53% of the total cationic strength of wetprecipitation (Figure 3a), whereas among the anions,HCO�
3 made up about 35% of total anionic strength(Figure 3b). Overall mean ionic representation inmonsoon precipitation samples (Figure 3c) suggeststhat Ca2+ contributed highest (28%) followed by
Ca53%
K7% Na
14%NH4
9%
Mg17%
HCO3
35%
SO4
22%PO4
1%
F3%
NO3
12%
Cl27%
K3%
Na7% NO3
6%
Ca28%
Mg8%
NH4
4% Cl13%
HCO3
17%SO4
11%
F2%
PO4
1%
a
b
c
Figure 3 Percent contribution of individual ions to the (a) totalcationic, (b) total anionic, and (c) total ionic composition ofprecipitation.
Environ Monit Assess (2007) 131:237–254 243

HCO�3 (17%), Cl− (13%), and SO2�
4 (11%). Contri-butions of other ionic species were each with <10%.Dominance of Ca2+ in rainwater in other parts ofcountry has also been reported (Kulshrestha et al.,2003; Mouli, Mohan, & Reddy, 2005, Saxena,Sharma, Kulshrestha, & Srivastava, 1991; Singhet al., 2001). The standard deviation (SD) pertainingto various variables show a higher dispersion of thevalues around the mean, thus, indicates greatervariation in hydro-chemical composition of theprecipitation. Positive values of skewness computedfor all the variables suggest for their asymmetricfrequency distribution with tail extending towardsmore positive values. The concentrations of differentions have been compared with that observed for other
parts of the country and world (Table II). The widecompositional variations reported in various studies,in addition to the regional differences and anthropo-genic sources, may also be attributed to the differencein sampling methods, experimental designs, sampletreatment (such as filtration using membranes ofdifferent porosities) and chemical analysis. Theconcentrations of measured ions in this study aregenerally higher than reported by others. However,Balachandran and Khillare (2001) have reportedrelatively higher levels of NHþ
4 , NO�3 and SO2�
4 inthe rainwater of Delhi and higher levels of Mg2+, Na+,NO�
3 and SO2�4 have also been reported in the
rainwater of Jordan (Al-Khashman, 2005) as com-pared to our observations.
Table II Concentration of major ions (μeq l−1) in rainwater at different geographical locations
Area Ca2+ Mg2+ Na+ K+ NH+4 Cl− NO�
3 SO2�4 References
Lucknow, India 264.4 81.0 66.0 31.7 42.4 129.5 58.5 104.2 This studyTirupati, India 156.5 60.9 36.4 38.1 21.1 34.5 42.3 135.1 Mouli et al. (2005)Bhubaneswar, India 20.2 5.2 15.0 1.8 18.7 18.0 10.0 19.1 R. Das, S. N. Das, and Misra (2005)*Bhubaneswar, India 11.9 3.8 10.5 1.9 17.5 10.7 9.1 16.6 Das et al. (2005)**Delhi, India 180.6 44.4 44.0 20.2 82.2 43.2 109.0 131.3 Balachandran and Khillare (2001)Gopalpura, India 152.6 94.3 20.7 3.5 48.1 38.2 42.9 19.3 Satsangi et al. (1998)Jordan 192.1 133.6 85.1 51.1 43.0 121.5 63.7 121.5 Al-Khashman (2005)Jordan 108.1 30.7 50.0 11.1 14.8 37.0 75.5 62.1 Al-Momani (2003)Ankara, Turkey 71.4 9.3 15.6 9.8 86.4 20.4 29.2 48.0 Topcu, Incecik, and Atimtay (2002)Singapore 21.7 7.5 31.1 3.9 17.3 22.1 16.8 58.7 Balasubramanian, Victor, and Chun (2001)
*Values for site-1; **values for site-2
Figure 4 Frequencydistribution of pH valuesof wet precipitation.
244 Environ Monit Assess (2007) 131:237–254
3.1.3 Variation of pH
Frequency distribution of pH of the precipitationsamples collected for the first monsoon rain is shownin Figure 4. The pH of the rainwater ranged between6.5 and 8.5 with an average value of 7.23±0.53. It isevident that 44% of the samples had pH below 7.0and another 48% between 7.0 and 8.0. Only remain-ing 8% of the samples had pH>8.0. Thus, all theprecipitation samples had pH in the basic range ascompared to the reference value of 5.6 for cloud water(Charlson & Rhode, 1982). Basic pH of early rainshas also been reported earlier (Mouli et al., 2005).Higher pH of early rains may be due to presence ofhigh amount of acid neutralizing substances in theatmosphere. In northern India, the monsoon sets aftera long dry summer period characterized by dustywinds, thus loading the atmosphere with high sus-pended matter, mainly having origin in soils for rainscavenging and neutralize the rainwater acidity.Earlier studies have also reported alkaline pH ofrainwater in different parts of India (Khemani et al.,1985; Mahadevan et al., 1989; Satsangi et al., 1998;Saxena, Kulshrestha, Kumar, Kumari, & Srivastava,1996). Since, the precipitation pH < 4.8 are generallyinterpreted as anthropogenic influence, the rainwaterpH values in alkaline range, thus suggested for astrong influence of alkaline soil dust on precipitationin the region.
3.1.4 Acidification and neutralization potentials
Presence of H2SO4, HNO3 and organic acids mainlydetermine the acidification potential of wet precipita-tion (Kaya & Tuncel, 1997), whereas, their neutrali-zation occurs due to presence of basic substances such
as NH3, MgCO3 and CaCO3. Therefore, the pH ofprecipitation depends on the relative abundance ofthese acidic and basic species and chemical reactionsamong them in the atmosphere. The significant (P<0.01) correlations between NHþ
4 , Ca2+, Mg2+ andSO2�
4 suggest that these alkaline species act as aneutralizing agent for the rainwater acidity in thestudied region. Ca2+, Mg2+, NHþ
4 react with H2SO4
and HNO3 to form their salts of NO�3 and SO2�
4 .Linear regression (r=0.58, significant at P<0.01)between the sum of (NO�
3 þ SO2�4 ) and (Ca2þþ
NHþ4 þMg2þ) also indicates the same. Since, pH
values of the precipitation in our case were rela-tively high, extent of neutralization reactions in theatmosphere was determined through computing theneutralization factors (NFs) for the alkaline species(NHþ
4 , Mg2+ and Ca2+) following the equation(Possanzini, Buttni, & Dipalo, 1988);
NFxi ¼ Xi
SO4½ � þ NO3½ � ð4Þ
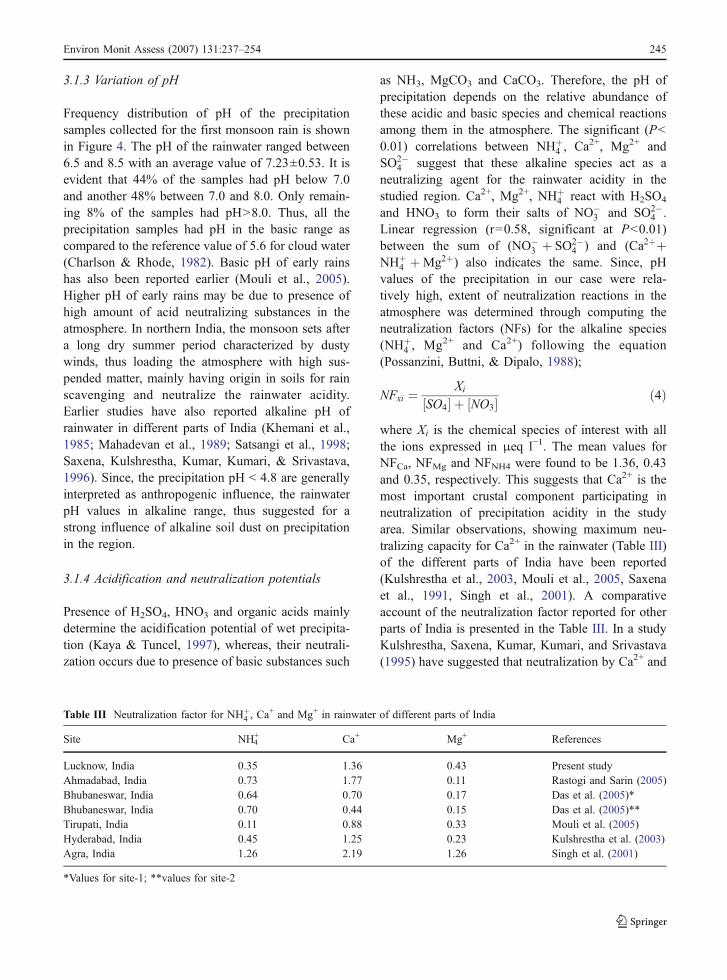
where Xi is the chemical species of interest with allthe ions expressed in μeq l−1. The mean values forNFCa, NFMg and NFNH4 were found to be 1.36, 0.43and 0.35, respectively. This suggests that Ca2+ is themost important crustal component participating inneutralization of precipitation acidity in the studyarea. Similar observations, showing maximum neu-tralizing capacity for Ca2+ in the rainwater (Table III)of the different parts of India have been reported(Kulshrestha et al., 2003, Mouli et al., 2005, Saxenaet al., 1991, Singh et al., 2001). A comparativeaccount of the neutralization factor reported for otherparts of India is presented in the Table III. In a studyKulshrestha, Saxena, Kumar, Kumari, and Srivastava(1995) have suggested that neutralization by Ca2+ and
Table III Neutralization factor for NHþ4 , Ca
+ and Mg+ in rainwater of different parts of India
Site NH+4 Ca+ Mg+ References
Lucknow, India 0.35 1.36 0.43 Present studyAhmadabad, India 0.73 1.77 0.11 Rastogi and Sarin (2005)Bhubaneswar, India 0.64 0.70 0.17 Das et al. (2005)*Bhubaneswar, India 0.70 0.44 0.15 Das et al. (2005)**Tirupati, India 0.11 0.88 0.33 Mouli et al. (2005)Hyderabad, India 0.45 1.25 0.23 Kulshrestha et al. (2003)Agra, India 1.26 2.19 1.26 Singh et al. (2001)
*Values for site-1; **values for site-2
Environ Monit Assess (2007) 131:237–254 245

Mg2+ is a below cloud process, whereas by NHþ4 is an
in cloud process. Further, in aerosols Ca2+ and Mg2+
are predominantly coarse mode particles and NHþ4
exists in fine mode. Since this study represents thecomposition of first rainfall events in the study areaand composition of the initial rainfall is largelycontrolled by the washout processes it may be con-cluded that neutralization by soil derived elementsdominated the neutralization phenomenon of the firstrainfall events in the study area. Thus, it is evident thatthe relatively high pH values of precipitation, as ob-served are not due to low acidity of rain water, but dueto higher neutralization reactions in the atmosphere.
Nature of inorganic salts formed due to neutraliza-tion reactions in the atmosphere was also determinedthrough performing multi-linear regression (MLR) onmajor acidic (SO2�
4 and NO�3 ) and basic (Ca2+, NHþ
4 )species. In MLR model, Ca2+ and NHþ
4 were taken asindependent and SO2�
4 and NO�3 as dependent
variables. The MLR results are presented inTable IV. As evident, in the wet precipitation, 94.3%of SO2�
4 and 36.3% of NO�3 are explained by the two
independent variables (Ca2+ and NHþ4 ). This further
suggests that out of 94.3% of explained SO2�4 , 47.8%
appear as CaSO4 and 46.4% as (NH4)2SO4. It fur-ther suggests that out of total 36.3% of explainedNO�
3 , 20.5% may exist as Ca(NO3)2 and 15.8% asNH4NO3. The MLR model also supports that neu-tralization of acidity in wet precipitation is rela-tively more related to CaCO3 as compared to NHþ
4 .Dominance of Ca2+ in acidity neutralization processof rainwater was also reported under other studies(Migliavacca, Teixeira,Wiegand,Machado,& Sanchez,2005; Samara, Tsitouridou, & Balafotis, 1992). Con-tributions of ammonium sulphate and ammoniumnitrate as revealed by MLR indicates application ofnitrogenous fertilizers [(NH4)2SO4 and NH4NO3] inthe study area and subsequent release of ammonia tothe atmosphere (Kaya & Tuncel, 1997; Saxena et al.,1996).
3.1.5 Marine contribution
To evaluate the marine contribution in wet precipita-tion, enrichment factors (EFs) for selected ionicspecies (Cl−, SO2�
4 , K+, Ca2+ and Mg2+) in rainwaterwere computed as;
EFi ¼ Xi=NaRainXi=NaSeawater
ð5Þ
where Xi is the ion of interest. The EF values ofvarious major ions are presented in Table V. Asevident from the above relation, EF value of 1 or lesswould imply no enrichment, thus no contributionfrom any source other than sea origin, whereas, a va-lue of numerator higher than denominator would im-ply enrichment of particular species, thus contributionfrom non-sea sources. From the Table V, it may benoted that all the ionic species (Cl−, SO2�
4 , K+, Ca2+
and Mg2+) show considerable enrichment in precipi-tation in the study area.
The EF values of different ions were used forcomputing the marine (sea-salt) and non-marine (non-sea salt) contributions for each of the ions. The sea-salt (ss) and the non-sea salt (nss) fractions of Ca2+,K+, Mg2+ and SO2�
4 along with the EF are presentedin Table V. On an average, contribution of nss-Ca2+
varied from 98.9% to 99.8%, nss-Mg2+ as 93.3% to99.2% and that of nss� SO2�
4 as 58.7% to 97.8%with a mean value of 99.4%, 96.3% and 91.6%,respectively. This suggests for the dominance ofcrustal/anthropogenic sources of Ca2+, Mg2+ andSO2�
4 . Rastogi and Sarin (2005) have also reportedthe similar pattern for the ss and nss fractions of theseions. Further, the Table VI shows the relation of theions SO2�
4 , Cl−, Ca2+, K+ and Mg2+ with Na+. Valuesof the ratios of the analyzed ions and Na+ higher thanthose corresponding to sea water ratios suggest fortheir crustal/anthropogenic contribution in the wet
Table IV Fractions of SO2�4 and NO�
3 explained by Ca2+ andNHþ
4 in rainwater samples of Lucknow
% explainedby Ca2+
% explainedby NHþ
4
Total explained(%)
SO2�4 47.84 46.41 94.25
NO�3 20.54 15.80 36.33
Table V Enrichment factor (EF), sea salt (ss) and non sea salt(nss) fractions of the major ions
Ion EF Sea salt fraction(%)
Non sea salt fraction(%)
Cl− 1.82 60.01 40.41SO2�
4 14.21 8.41 91.59K+ 2.30 63.98 45.38Ca+ 193.89 0.59 99.41Mg+ 30.94 3.73 96.27
246 Environ Monit Assess (2007) 131:237–254

precipitation. The mean SO2�4
�Naþ (1.78±0.76), Cl−/
Na+ (2.11±0.71), Ca2+/Na+ (4.23±1.79), K+/Na+
(0.52±0.40) and Mg2+/Na+ (1.36±0.76) ratios werehigher than those of sea water revealing that there wascrustal/anthropogenic contribution of these ions in theprecipitation in the studied area. This is furthercorroborated with the values of ss and nss fractions(%) for these ions (Table V). Significant (P<0.01)positive correlation (0.55) between Ca2+ and Mg2+
indicates the common occurrence of these ions fromthe soil/crustal origin. Similarly, significant (P<0.01)positive correlation (0.40–0.50) of SO2�
4 with NHþ4 ,
K+, Ca2+ and Cl− suggests contribution of SO2�4 from
crustal as well as anthropogenic sources, such asautomobile exhaust, incinerators, waste burning andcoal combustion. Kulshrestha et al. (2003) have alsoreported correlation of SO2�
4 with Ca2+ as well asNHþ
4 indicating contribution of SO2�4 in the rainwater
from soil and anthropogenic activities in the rainwaterof Hyderabad (India).
3.1.6 Sulphate–nitrate ratio
Sulphate and nitrate ions, commonly present inprecipitation contribute to the acidity of rainwater.Their concentration in atmosphere, and subsequentlyin the precipitation may indicate the anthropogenicsources in the region. The SO2�
4
�NO�
3 ratios com-puted in the precipitation samples (Table VII) rangedbetween 0.56 and 20.68 with mean value of 3.56(median value 2.03). The values of SO2�
4
�NO�
3 ratiohave been reported to range between 1.3 and 17.2 inother parts of the world (Table VII). In the presentstudy, the SO2�
4
�NO�
3 ratio suggests for a meanrelative abundance of SO2�
4 and NO�3 in the ratio of
about 80 and 20 percent. It is very close to theestimated contribution of H2SO4 (60%–70%) andHNO3 (30%–40%) in the precipitation samples(Al-Momani et al., 1995; Tuncer, Bayar, Yesilyurt,& Tunnel, 2001). The high ratio of 3.56 in this studymay be due to high concentration of SO2�
4 or lowconcentration of NO�
3 . High level of SO2�4 may be
due to fossil fuel combustion in the region. It is worthmentioning here that in the eastern part of State (about350 km from study area), there is a cluster of severalcoal-fired thermal power stations utilizing largequantities of coal. Moreover, a low concentration ofNO�
3 may be expected due to long period of drysummers in the study region with low crop density,and hence, with very small inputs of nitrogenousfertilizers during the pre-monsoon period.
3.1.7 Source contributions of major ions
Principal components analysis (PCA) was performedon the data set comprised of major ions in theprecipitation samples with a view to identify theirpossible sources in the region. Factors with eigenvalue
Table VI Ratio values of the major ion components of rainwater samples and the corresponding values for sea water
SO2�4
�Naþ Cl−/Na+ Ca2+/Na+ K+/Na+ Mg2+/Na+ References
Sea water 0.125 1.16 0.0218 0.227 0.0439 Kulshrestha et al. (2003)Lucknow, India 1.78 2.11 4.23 0.52 1.36 Present studyTirupati, India 3.87 1.08 4.55 1.02 1.68 Mouli et al. (2005)Bhubaneswar, India 1.30 1.17 1.45 0.12 0.36 Das et al. (2005)*Bhubaneswar, India 1.55 1.01 1.06 0.17 0.35 Das et al. (2005)**Hyderabad, India 1.44 2.32 2.86 0.63 0.51 Kulshrestha et al. (2003)Eshidiya, Jordan 1.22 1.24 2.07 0.61 1.50 Al-Khashman (2005)Guaiba, Brazil 2.68 1.00 2.16 0.55 0.81 Migilavacca et al. (2005)Figueira 0.53 0.46 0.89 0.30 0.32 Flues et al. (2002)
*Values for site-1; **values for site-2
Table VII Compared average ratio of SO2�4
�NO�
3 at varioussites in the world
SO2�4
�NO�
3 Sites References
3.56 Lucknow, India Present study1.91 Eshidiya, Jordan Al-Khashman (2005)8.70 Guaiba, Brazil Migilavacca et al. (2005)1.63 Candiota area Migilavacca et al. (2004)5.3 Figueira Flues et al. (2002)1.60 Ankara Topcu et al. (2002)3.5 Singapore Balasubramanian et al. (2001)
Environ Monit Assess (2007) 131:237–254 247

>1 were retained. PCA yielded total four significantfactors explaining about 73% of the total datavariance. Loadings of varimax rotated factors arepresented in Table VIII.
Factor 1 explained about 29.9% of the totalvariance, showed strong positive loadings on Cl−,HCO�
3 , Na+, Ca2+ and Mg2+. All the ions correlated
in this factor have their origin both in marine and soil
sources and this can be termed as a mixed ‘marine-soil’ factor. Na+ and Cl− find their main contributionsin seawater sources. Cl−/Na+ ratio (Table VI) indicat-ed about 60% of Cl− in precipitation contributed bysea-salt and remaining about 40% from non-seasources. Chloride is emitted from various combustionprocesses and chlorination of drinking water in thestudy area. Factor 2 explaining about 17.8% of theremaining variance showed strong positive loadingson K+ and moderate positive loadings on SO2�
4 . Highloadings of K+ indicates influence of increased traffic,construction activities and agricultural tillage practi-ces which enhances the suspension of soil derivedparticles in to the atmosphere (Kulshrestha et al.,2003). Factor 3 explaining about 13.6% of theremaining variance showed strong positive loadingson NHþ
4 and moderate positive loadings on SO2�4 and
PO3�4 . This factor can be termed as ‘anthropogenic’.
Origin of NHþ4 , SO
2�4 and PO3�
4 in the region may beassociated with production and applications of gyp-sum and ammonium phosphate fertilizers in theregion. Part of the (NH4)2SO4 and NH4NO3 fertilizersapplied to soil may convert in to NH3 which mayescape to the atmosphere (Al-Momani et al., 1995;Kaya & Tuncel, 1997). Fourth factor capturing 11.8%of variance had strong positive loadings on NO�
3 andmoderate positive loadings on F−. Common sources
Table VIII Factor loadings matrix (after varimax rotation) formajor ions
Ion PC1 PC2 PC3 PC4
Cl− 0.806 0.132 0.221 0.157F− 0.165 0.465 −0.075 0.638HCO�
3 0.766 0.341 0.176 −0.045SO2�
4 0.218 0.602 0.508 0.088PO3�
4 0.164 0.336 0.511 −0.278NO�
3 0.096 −0.045 0.191 0.814Na+ 0.915 −0.083 0.069 0.094K+ 0.195 0.866 −0.003 0.061Ca2+ 0.752 0.406 −0.145 0.235Mg2+ 0.706 0.453 0.004 −0.178NHþ
4 0.062 −0.032 0.912 0.126Eigenvalue 3.292 1.954 1.499 1.297Ex. var (%) 29.93 17.77 13.63 11.79
Bold faced values are strong (>0.70) loadings; values in italicsare moderate loadings.
Table IX Basic statistics of heavy metals (μg l−1) in rainwater samples collected from Lucknow (India)
Metal Detection limit DF (%) Minimum Maximum Mean SD Median Skewness
Al 0.30 96.0 ND 281.50 56.37 51.91 37.52 2.05As 2.00 4.0 ND 0.15 ND 0.02 ND 5.15Cd 0.10 0.0 ND ND ND ND ND –Co 0.20 50.0 ND 0.42 0.11 0.12 0.05 0.64Cr 0.20 58.0 ND 180.22 9.51 28.80 1.44 4.92Cu 1.00 4.0 ND 12.66 0.37 1.96 0.00 5.69Fe 0.30 72.0 ND 952.23 69.16 151.63 20.00 4.53Hg 0.05 14.0 ND 6.21 0.29 1.18 ND 4.65Mn 0.07 68.0 ND 124.76 6.86 19.24 1.57 5.16Mo 0.40 12.0 ND 2.46 0.17 0.53 0.00 3.26Ni 0.40 60.0 ND 8.26 0.74 1.26 0.60 4.55Pb 1.70 56.0 ND 30.50 1.15 4.34 0.31 6.59Se 1.00 18.0 ND 0.59 0.06 0.10 ND 3.60Sn 2.80 38.0 ND 13.32 0.77 2.34 ND 4.47Ti 0.20 86.0 ND 15.32 2.46 2.87 1.31 2.17V 0.50 100.0 0.74 76.96 7.14 10.55 4.89 6.13Zn 0.10 60.0 ND 463.24 17.62 68.75 1.81 6.00
Lower detection limits were attained through 20–30 times concentration of water samples.DF(%) Percent detection frequency, ND not detected
248 Environ Monit Assess (2007) 131:237–254

of nitrate emissions are mainly from production andapplications of nitrogenous fertilizers, cattle wastesand soil particulates. Association of F− in this factor,which has origin mainly in soil dust, further indicatessoil contributions in atmospheric precipitation. More-over, it may also originate from the coal-basedthermal power plant operating in the region.
3.2 Trace metals
3.2.1 Trace metal concentration
Basic statistics of the trace metals in wet precipitationsamples is presented in Table IX. The relativeabundance of various metals determined in rainwateris in order: Fe > Al > Zn > Cr > V > Mn > Ti >Pb > Sn > Ni > Cu > Hg > Mo > Co > Se. Thus,Fe was the most abundant metal in precipitation. Thetrace metals composition of the precipitation is shownin Figure 5. On an average basis, Fe contributed about40% followed by Al (32.6%), Zn (10.2%), Cr (5.5%),V (4.1%), Mn (3.97%) and Ti (1.42%), while con-tributions of other metals (Pb, Sn, Ni, Cu, Hg, Mo,Co, Se) were <1.0% each. The trace metals inprecipitation samples may originate from marine,crustal and anthropogenic sources. Significant (P<0.01) correlations, Fe–Mn (0.97), Fe–Ni (0.87), Fe–Cu (0.90), Fe–Cr (0.96), Cu–Ni (0.89), Cu–Mn
(0.95), Cu–Cr (0.95), Mn–Cr (0.99), and Mn–Ni(0.90) between various metals suggest their associa-tions and indicate possible similar sources of theirorigin in the region, mainly from the soil crust.Enrichment of metals in precipitation may providesome indication about the source contribution. En-richment is measured in terms of enrichment factor(EF), which is simply the ratio of concentration of atrace metal in precipitation to seawater or crustalconcentration of the same metal.
3.2.2 Trace metals enrichment
In absence of anthropogenic sources, the measuredconcentrations of trace metals in precipitation shouldbe explained by natural sources as well as crustalorigin. However, emissions from various anthropo-genic sources have resulted in drastic increase of tracemetals levels in atmospheric environment. Some tracemetals are enriched in sea-salt aerosols relative to theirconcentrations in sea water (Weisel, Duce, Fasching, &Heaton, 1984). The enrichment factor (EF) of a tracemetal over its reference background level in seawater(EFi,sw) and Earth’s crust (EFi,crust) can providesimple means to assess the contributions of marine,crustal and anthropogenic sources to the trace metalsin precipitation. The EF values for trace metals maybe computed against the seawater (Forestner &
Ti1.42%
V4.13%
Zn10.20%
Pb0.67%
Sn0.45%
Se0.02%
Ni0.43% Mo
0.10%
Mn3.97%
Hg0.17% Cu
0.22%
Co0.06%
Cr5.50%
Al32.63%
Fe40.03%
Figure 5 Percent contribu-tion of individual metals inthe wet precipitation.
Environ Monit Assess (2007) 131:237–254 249

Wittmann, 1983) and crustal background (Turekian &Wedepohl, 1961) levels by the following equations(Migliavacca et al., 2005);
EFi;sw ¼ TMi;Rain
�NaRain
TMi;sw
�NaSw
ð6aÞ
and,
EFi;crust ¼TMi;Rain
�AlRain
TMi;crust
�Alcrust
ð6bÞ
where TMi,Rain, NaRain and AlRain are the measuredconcentrations of a particular trace metal, Na and Alin the precipitation; TMi,sw and NaSw are the concen-trations of the trace metal and Na in seawater, andTMi,crust and Alcrust are the concentrations of tracemetal and Al in the Earth’s crust, respectively.Sodium for seawater and aluminum for the Earth’scrust are considered as the reference background ele-ments in view of their abundance (Migliavacca et al.,2005). The computed EFsw and EFcrust for selected
Figure 6 Enrichment fac-tors of selected trace metalswith reference to (a) seawa-ter (b) crustal material.
250 Environ Monit Assess (2007) 131:237–254

trace metals are shown in Figure 6. It may be notedthat trace metals enrichment from seawater is negligi-bly small, except for Zn. Zinc is known to be a markerelement for burning fossil fuels, smelting non-ferrousmetals, and sprinkling agrochemicals (Kiekens, 1990),and Zn released from such processes can be easilydissolved in rainwater (Halstead, Cunninghame, &Hunter, 2000). Enrichment of Zn in rainwater has beenreported by others, also (Berg, Royset, & Steinnes,1994; Hou et al., 2005). A similar trend has been re-ported for trace metals in precipitation in New Zealand(Halstead et al., 2000).
Considering Al in precipitation from single naturalcrustal origin, an EF value close to unity for any tracemetal would reveal that trace metal origin is predom-inantly crustal. On the other hand, trace metalsexhibiting EF values greater than unity would havesources other than crustal as well. Due to different soiltypes and crustal materials in different parts, the EFvalues of order <10 are not considered resolvable(Kaya & Tuncel, 1997). Therefore, Ti, Fe and Co (EF>10) could be grouped together. Further, from thecomputed EF values (Figure 6), it can be deduced thatall other trace metals (Cr, Cu, Mn, Mo, Ni, Pb, Se, Sn,V and Zn) were mainly derived from anthropogenicsources. Similar results have been reported by otherauthors (Hu & Balasubramanian, 2003; Orlic, Wen,Ng, & Tang, 1999). Thus, it is apparent that particu-late scavenging is the predominant mode by whichtrace metals are incorporated in to precipitation.
3.2.3 Source contributions of trace metals
Principal components analysis (PCA) was performedon the data set of trace metals in the precipitation witha view to identify their possible source contributions.PCA yielded three factors (eigenvalue>1) explainingabout 65.6% of the data variance. Loadings ofvarimax rotated factors are presented in Table X.Factor 1 explaining about 40.2% of the total variancehad strong positive loadings on Cr, Fe, Mn, and Niand moderate positive loadings on Co and Sn. Thehigh loadings for Fe, Mn and Ni indicates soil/crustalcontribution of these elements, where as Cr is,usually, emitted during the fuel combustion (Semb& Pacyna, 1986). Mn has been suggested to beassociated with the mineral aerosols and it is usuallyless soluble than elements of anthropogenic origin
(Kersten, Kriews, & Forster, 1991; Migliavacca et al.,2005). Factor 2 explaining about 15% of the remain-ing variance showed strong positive loadings on Aland Ti and moderate negative loadings on Pb.Metals highlighted in this factor generally have theirorigin in natural sources and to lesser extent, withanthropogenic sources, such as automobile exhaust,coal-fired power plants and steelworks (Migliavaccaet al., 2005). Factor 3 capturing about 10.3% ofvariance had strong negative loadings on Zn andmoderate negative loadings on V. Zn is known to be amarker element for burning fossil fuels, wastes,smelting non-ferrous metals, and sprinkling agro-chemicals (Kiekens, 1990), and Zn released fromsuch processes can be easily dissolved in rainwater(Halstead et al., 2000).
4 Conclusions
Investigation of the chemical composition of the wetatmospheric precipitation samples (first event) col-lected in July, 2005 from the representative sites inLucknow city in the northern Indo-Gangetic alluvialplains revealed the typical alkaline nature of rainwa-ter, which is due to acidity neutralized by the crustal/anthropogenic components, such as Ca2+, Mg2+ andNHþ
4 . Major ions in precipitation have both the sea-salt and non-sea-salt origins. Further, among the ions,
Table X Factor loadings matrix (after varimax rotation) fortrace metals
Trace metal PC1 PC2 PC3
Al 0.045 −0.775 −0.238Co 0.546 0.056 0.374Cr 0.965 0.043 0.000Fe 0.950 −0.131 −0.053Mn 0.975 0.033 −0.005Ni 0.942 0.058 0.083Pb −0.014 −0.572 0.160Sn 0.667 −0.326 0.051Ti −0.021 −0.766 0.164V 0.057 0.067 −0.509Zn −0.014 −0.017 −0.786Eigenvalue 4.420 1.652 1.138Explained var (%) 40.18 15.02 10.35
Bold faced values are strong loadings; values in italics aremoderate loadings.
Environ Monit Assess (2007) 131:237–254 251
Ca2+ made the highest contribution followed byHCO�
3 , Cl− and SO2�
4 ions in the first event rainwater,thus indicating incorporation of materials originatingfrom the soil/anthropogenic activities. The associationof SO2�
4 with Ca2+ and NHþ4 showed the neutraliza-
tion of samples of wet precipitation as CaSO4,NH4NO3 and (NH4)2SO4 and confirmed the originfrom crustal/anthropogenic sources. The ratios ofdifferent components with respect to sea water ratioswere higher indicating the influence of non-marinecontinental sources. The PCA revealed anthropogenicsources of F−, NO�
3 , SO2�4 and K+ suggesting use of
gypsum, ammonium and phosphate fertilizers, cattlewaste, increased traffic, construction activities andagricultural tillage practices. The relative abundanceof various metals determined in rainwater is in theorder: Fe >Al > Zn >Cr >V>Mn>Ti > Pb > Sn >Ni >Cu >Hg >Mo >Co > Se . Further, from the computedEF values with reference to seawater and Earth-crustbackground level suggested anthropogenic sources ofCr, Cu, Mn, Mo, Ni, Pb, Se, Sn, V and Zn. PCAapplied on the metals indicated anthropogenic sourcessuch as fossil fuel combustion and steelworks,smelting non-ferrous metals, use of agrochemicals inthe region.
Acknowledgements The authors thank the Director, Indus-trial Toxicology Research Centre, Lucknow for his keeninterest in this work. Assistance provided by the Sectional staffin sampling and chemical analysis is thankfully acknowledged.
References
Agarwal, M., & Singh, R. K. (2001). Effect of industrialemission on atmospheric wet deposition. Water, Air andSoil Pollution, 130, 481–486.
Al-Khashman, O. A. (2005). Study of chemical composition inwet atmospheric precipitation in Eshidiya area, Jordan.Atmospheric Environment, 39, 6175–6183.
Al-Momani, I. F. (2003). Trace elements in atmosphericprecipitation at northern Jordan measured by ICP-MS:Acidity and possible sources. Atmospheric Environment,37, 4507–4515.
Al-Momani, I. F., Ataman, O. Y., Anwari, M. A., Tuncel, S.,Kosc, C., & Tuncel, G. (1995). Chemical composition ofprecipitation near an industrial area at Izmier, Turkey.Atmospheric Environment, 20, 965–969.
APHA (2002). Standard methods for the examination of waterand waste-water (20th ed.). Washington, DC: AmericanPublic Health Association.
ASTM (1996). Standard guide for preparation of materialused for the collection and preservation of atmosphericwet deposition: D 5012 (v.11.03, pp. 387–391). WestConshohocken, Pennsylvania: ASTM.
Bagchi, R., & Haddad, P. R. (1986). Contamination sources inthe clean-up of samples for inorganic ion analysis. Journalof Chromatograph, 351, 541–547.
Balachandran, S., & Khillare, P. S. (2001) Occurrence of acidrain over Delhi. Environmental Monitoring and Assess-ment, 71, 165–176.
Balasubramanian, R., Victor, T., & Chun, N. (2001). Chemicaland statistical analysis of precipitation in Singapore. Water,Air and Soil Pollution, 130, 451–456.
Berg, T., Royset, O., & Steinnes, E. (1994). Trace elements inatmospheric precipitation at Norwegian background sta-tions (1989–1990) measured by ICP-MS. AtmosphericEnvironment, 28, 3519–3536.
Cattell, R. B., & Jaspers, J. (1967). A general plasmode (No.30-10-5-2) for factor analytic exercises and research.Multivariate Behavioral Research Monographs, 67, 1–212.
Census (2001). Census of India: Final population total. NewDelhi, India: Registrar General & Census Commissioner,Ministry of Home Affairs.
Charlson, R. J., & Rhode, H. (1982). Factors controlling theacidity of natural rainwater. Nature, 295, 683–685.
Das, R., Das, S. N., & Misra, V. N. (2005). Chemicalcomposition of rainwater and dustfall at Bhubaneswar inthe east coast of India. Atmospheric Environment, 39,5908–5916.
Flues, M., Hamma, P., Lemes, M. J. L., Dantas, E. S. K., &Fornaro, A. (2002). Evaluation of the rainwater acidity ofa rural region due to a coal-fired power plant in Brazil.Atmospheric Environment, 36, 2397–2404.
Forestner, U., & Wittmann, G. T. W. (1983). Metal pollution inthe aquatic environment (pp 87). New York BerlinHeidelberg: Springer.
Galloway, J. N., Likens, G. E., & Hawley, M. E. (1984). Aciddeposition: natural versus anthropogenic components.Science, 226, 829–831.
Halstead, M. J. R., Cunninghame, R. G., & Hunter, K. A.(2000). Wet deposition of trace metals to a remote site inFiordland, New Zealand. Atmospheric Environment, 34,665–676.
Handa, B. K., Kumar, A., & Goel, D. K. (1982). Chemicalcomposition of rain water over Lucknow. Mausam, 33,485–488.
Hou, H., Takamatsu, T., Koshikawa, M. K., & Hosomi, M.(2005). Trace metals in bulk precipitation and throughfallin a suburban area of Japan. Atmospheric Environment, 39,3583–3595.
Hu, G. P., & Balasubramanian, R. (2003). Wet deposition oftrace metals in Singapore. Water, Air and Soil Pollution,144, 285–300.
Kaya, G., & Tuncel, G. (1997). Trace element and major ioncomposition of wet and dry deposition in Ankara, Turkey.Atmospheric Environment, 31, 3985–3998.
Khare, P., Goel, A., Patel, D., & Behari, J. (2004). Chemicalcharacterization of rainwater at a developing urbanhabitat of Northern India. Atmospheric Research, 69,135–145.
252 Environ Monit Assess (2007) 131:237–254
Khemani, L. T., Momin, G. A., Naik, M. S., Prakasa Rao, P. S.,Kumar, R., & Ramana Murthy, Bh. V. (1985). Impact ofalkaline particulates on pH of rainwater in India. Water,Air and Soil Pollution, 24, 365–376.
Khemani, L. T., Momin, G. A., Naik, M. S., Rao, P. S. P., Safai,P. D., & Murthy, A. S. R. (1987). Influence of alkalineparticulate on pH of cloud an drain water in India.Atmospheric Environment, 21, 1137–1145.
Khemani, L. T., Momin, G. A., Rao, P. S. P., Pillai, A. G.,Safai, R. D., Mohan, K., et al. (1994). Atmosphericpollutants and their influence on acidification of rainwaterat an industrial location on the west coast of India.Atmospheric Environment, 28, 3145–3154.
Kersten, M., Kriews, M., & Forster, U. (1991). Partitioning oftrace metals released from polluted marine aerosols inNorth Sea water. Marine Chemistry, 36, 165–171.
Kiekens, L. (1990). Zinc. In B. J. Alloway (Ed.) Heavy metalsin soils (pp 261–279). New York: Wiley; Glasgow andLondon: Blackie.
Kulshrestha, U. C., Kulshrestha, M. J., Sekar, R., Sastry, G. S.R., & Vairamani, M. (2003). Chemical characteristics ofrainwater at an urban site of south-central India. Atmo-spheric Environment, 37, 3019–3026.
Kulshrestha, U. C., Saxena, A., Kumar, N., Kumari, K. M., &Srivastava, S. S. (1995). Mass size distribution of aerosolsat a suburban site of Agra. Indian Journal of Radio &Space Physics, 24, 178–183.
Mahadevan, T. N., Negi, B. S., & Meenakshy, V. (1989).Measurements of elemental composition of aerosol matterand precipitation from a remote continental site in India.Atmospheric Environment, 23, 869–874.
Matschullat, J., Kritzer, P., Maenhaut, W. (1995). Geochemicalfluxes in forested acidified catchments. Water, Air and SoilPollution, 85, 859–864.
Migliavacca, D., Teixeira, E. C., Wiegand, F., Machado, A. C.M., & Sanchez, J. (2005). Atmospheric precipitation andchemical composition of an urban site, Guaiba hydrograph-ic basin, Brazil. Atmospheric Environment, 39, 1829–1844.
Mouli, P. C., Mohan, S. V., & Reddy, S. J. (2005). Rainwaterchemistry at a regional representative urban site: Influenceof terrestrial sources on ionic composition. Atmosphericenvironment, 39, 999–1008.
Naik, M. S., Khemani, L. T., Momin, G. A., & Rao, P. S. P.(1988). Measurement of pH and chemical analysis of rainwater in rural area of India. Acta Metallurgica Sinica, 2,91–100.
Naik, M. S., Khemani, L. T., Momin, G. A., Rao, P. S. P., Pillai,A. G., & Safai, P. D. (1994). Variation in the ioniccomposition in convective showers in Pune, India. Tellus,46B, 68–75.
Naik, M. S., Momin, G. A., Rao, P. S. P., Safai, P. D., & Ali, K.(2002). Chemical composition of rainwater around anindustrial region in Mumbai. Current Science, 82(9),1131–1137.
Orlic, I., Wen, X., Ng, T. H., & Tang, S. M. (1999). Two yearsof aerosol pollution monitoring in Singapore: A review.Nuclear Instruments & Methods in Physics Research.Section B, Beam Interactions with Materials and Atoms,150, 457–464.
Pillai, A. G., Naik, M. S., Momin, G. A., Rao, P. S. P., Safai, P.D., Ali, K., et al. (2001). Studies of wet deposition and
dustfall at Pune, India. Water, Air and Soil Pollution, 130,475–480.
Possanzini, M., Buttni, P., & Dipalo, V. (1988). Characteriza-tion of a rural area in terms of dry and wet deposition.Science of the Total Environment, 74, 111–120.
Rastogi, N., & Sarin, M. M. (2005). Chemical characteristics ofindividual rain events from a semi-arid region in India:Three-year study. Atmospheric Environment, 39, 3313–3323.
Samara, C., Tsitouridou, R., & Balafotis, C. H. (1992).Chemical composition of rain in Thessaloniki, Greece, inrelation to meteorological conditions. Atmospheric Envi-ronment, 26B, 359–367.
Satsangi, G. R., Lakhani, A., Khare, P., Singh, S. P., Kumari, K.M., & Srivastava, S. S. (1998). Composition of rain waterat a semi-arid rural site in India. Atmospheric Environ-ment, 32, 3783–3793.
Saxena, A., Kulshrestha, U. C., Kumar, N., Kumari, K. M., &Srivastava, S. S. (1996). Characterization of precipitationat Agra. Atmospheric Environment, 30, 3405–3412.
Saxena, A., Sharma, S., Kulshrestha, U. C., & Srivastava, S. S.(1991). Factors affecting alkaline nature of rain water inAgra (India). Environmental Pollution, 74, 129–138.
Semb, A., & Pacyna, J. M. (1986). Sources of atmospherictransport of toxic trace elements and chlorinated hydro-carbons and their migration through individual environ-mental media. NILU Report 42/86. Lillestorm, Norway:Norwegian Institute for Air Research.
Singh, K. P., Malik, A., Mohan, D., & Sinha, S. (2004).Multivariate statistical techniques for evaluation of spatialand temporal variations in water quality of Gomti River(India)—A case study. Water Research, 38, 3980–3992.
Singh, K. P., Malik, A., Mohan D., Sinha, S., & Singh, V. K.(2005a). Chemometric data analysis of pollutants inwastewater—A case study. Analytica Chimica Acta, 532,15–25.
Singh, K. P.,Malik, A.,& Sinha, S. (2005b).Water quality assess-ment and apportionment of pollution sources of Gomtiriver (India) using multivariate statistical techniques—Acase study. Analytica Chimica Acta, 538, 355–374.
Singh, K. P., Malik, A., & Singh, V. K. (2005c). Chemometricanalysis of hydrochemical data of an alluvial river—Acase study. Water, Air and Soil Pollution, 170, 383–404.
Singh, K. P., Malik, A., Singh, V. K., & Sinha, S. (2006).Multi-way data analysis of soils irrigated with waste-water—A case study. Chemometrics and IntelligentLaboratory Systems, 83, 1–12.
Singh, S. P., Khare, P., Satsangi, G. S., Lakhani, A., Kumari, K.M., & Srivastava, S. S. (2001). Rainwater composition at aregional representative site of a semi-arid region of India.Water, Air and Soil Pollution, 127, 93–108.
Streets, D. G., Tsai, N. Y., Akimoto, H., & Oka, K. (2001).Trends in emissions of acidifying species in Asia, 1985–1997. Water, Air and Soil Pollution, 130, 187–192.
Tauler, R., Lacorte, S., Guillamon, M., Cespedes, R., Viana, P.,& Barcelo, D. (2004). Chemometric modeling of maincontamination sources in surface waters of Portugal.Environmental Toxicology and Chemistry, 23, 565–575.
Topcu, S., Incecik, S., & Atimtay, A. (2002). Chemicalcomposition of rainwater at EMEP station in Ankara,Turkey. Atmospheric Research, 65, 77–92.
Environ Monit Assess (2007) 131:237–254 253

Tuncer, B., Bayar, B., Yesilyurt, C., & Tunnel, G. (2001). Ioniccomposition of precipitation at the central Anatolia(Turkey). Atmospheric Environment, 35, 5989–6002.
Turekian, K. K., & Wedepohl, K. H. (1961). Distribution ofthe elements in some major units of the Earth’s crust.Bulletin of the Geological Society of America, 72, 175–192.
UNEP (2002). Global report on regionally based assessment ofpersistent toxic substances. Geneva, Switzerland: UNEPChemicals.
Weisel, C. P., Duce, R. A., Fasching, J. L., Heaton, R. W.(1984). Estimates of the transport of trace metals from theocean to the atmosphere. Journal of Geophysical Re-search, 89, 11607–11618.
254 Environ Monit Assess (2007) 131:237–254