Everything you need to create training videos is already in ...
Upload
worldagroforestryCategory
view
0download
0
www.elsevier.com/locate/fcr
Field Crops Research 103 (2007) 109–118
Progress and challenge towards reducing wheat spot blotch
threat in the Eastern Gangetic Plains of South Asia:
Is climate change already taking its toll?
R.C. Sharma a,*, E. Duveiller b, G. Ortiz-Ferrara a
a International Maize and Wheat Improvement Center (CIMMYT), Kathmandu, Nepalb CIMMYT, Wheat Program, Mexico, D.F., Mexico
Received 21 February 2007; received in revised form 14 May 2007; accepted 14 May 2007
Abstract
Spot blotch, caused by Cochliobolus sativus, is a serious constraint to wheat production (Triticum aestivum L.) in the warmer plains of South
Asia. Fourteen genotypes were tested in Bangladesh, India and Nepal during 6 years (2000–2005) to determine disease severity and resistance
stability over these years. We analyzed the area under the disease progress curve per day (AUDPC/day) to assess spot blotch severity, and examined
grain yield, 1000-kernel weight (TKW), days to heading, and plant height. Disease severity differed in the 6 years and several genotypes showed
low disease severity in all years. A few genotypes had high grain yield and low disease severity in all years. Genotype Altar-84/Ae. Sq. (224)//Yaco,
with the lowest disease severity and highest 1000-kernel weight (TKW) and grain yield was also the most stable for spot blotch resistance, TKW
and grain yield. Results demonstrated that wheat genotypes with improved spot blotch resistance, high grain yield, acceptable TKW, and plant
height are available as a result of the regional and international collaboration in South Asia. Despite this progress, the challenge lies ahead because
of an apparent tendency of increasing spot blotch overall severity in the region and decreasing TKW over 6 years (2000–2005). Higher, average
night time temperature during the month of March is an indicator showing that wheat crop performance is challenged in two ways—increasing spot
blotch severity and decreasing TKW causing lower yield. The results underline the possible effect of changing climatic factors on disease pressure
and the continuous need to identify new resistance sources to develop more spot blotch resistant wheat for the warmer Eastern Gangetic Plains of
South Asia.
# 2007 Elsevier B.V. All rights reserved.
Keywords: Cochliobolus sativus; Eastern Gangetic plains; Genetic stability; Helminthosporium leaf blight; Resistance; Spot blotch; Wheat
1. Introduction
More than 20 years ago, Saari (1985) recognized that spot
blotch caused by the fungal pathogen Cochliobolus sativus (Ito
& Kurib.) Drechsler ex Dastur [anamorph, Bipolaris sorokini-
ana (Sacc.) Shoem.] was a major constraint to wheat (Triticum
aestivum L.) production in non-traditional, warmer cropping
areas particularly in the Eastern Gangetic Plains (EGP) of
South Asia. The importance of spot blotch also known as foliar
blight or Helminthosporium leaf blight in South Asia was
highlighted early in reports from India (Nema and Joshi, 1973),
Bangladesh (Badaruddin et al., 1994), and Nepal (Devkota,
* Corresponding author at: CIMMYT, Singh Durbar Plaza, P.O. Box 5186,
Kathmandu, Nepal. Tel.: +977 1 4219262; fax: +977 1 4229804.
E-mail address: [email protected] (R.C. Sharma).
0378-4290/$ – see front matter # 2007 Elsevier B.V. All rights reserved.
doi:10.1016/j.fcr.2007.05.004
1994). A Helminthosporium Monitoring Nursery (HMN) was
initiated by CIMMYT (International Maize and Wheat
Improvement Center) in the early 1990s to monitor the stability
of resistance to spot blotch and detect if there were significant
differences in epidemics across warmer wheat growing areas of
the world. In the late 1990s this nursery was sown exclusively at
key sites in South Asia.
While the first set of exotic foliar blight resistant lines tested
in South Asia showed that resistant lines had a less desirable
agronomic type (Dubin et al., 1998), recent reports from the
South Asia indicated substantial improvement in spot blotch
resistance on key cultivars commercially grown in India
(Bhushan et al., 2002), Bangladesh (Siddique et al., 2006), and
Nepal (Sharma and Duveiller, 2006). Besides, a number of
genotypes were recently identified to carry high and stable
foliar blight resistance which is presently used in the wheat
breeding programs in the Eastern Gangetic Plains (EGP)

R.C. Sharma et al. / Field Crops Research 103 (2007) 109–118110
(Sharma et al., 2004a). However, recent yield trials conducted
by breeding centers show that wheat yields in the EGP region
are decreasing (Sharma et al., 2007). This apparently parallels
wheat production statistics of the regional yields which are
reported to be either stagnant or slightly decreasing, except in
Nepal (FAO, 2006). Further evidence supporting this observa-
tion is that due to lower production, India imported three
million tonnes wheat in 2006 (Reuters, 10 May 2006) which
contrasts with the optimism that followed the Green Revolution
and raises concerns among agricultural policy makers
regarding prospects of self-sufficient staple food production
in the near future (Nagarajan, 2005). Stagnant or lower wheat
yields in recent years in the plains of South Asia is considered
partly due to climatic factors including heat stress characterized
by an increasing trend in average temperature during winter
months (Rane et al., 2000; Nagarajan, 2005; Black, 2006;
Sharma et al., 2007). Another factor causing decline in wheat
productivity in rice–wheat system, the most dominant cropping
system in the region, is related to soil fertility and fertilizer use
(Nagarajan, 2005; Tirol-Padre and Ladha, 2006). Nagarajan
(2005) also listed socio-economic and policy related factors
being responsible for recent decline in wheat production in the
Indo-Gangetic plain. A steadily increase of mean March
temperature was observed at five sites in the EGP region in the
past 6 years (Sharma et al., 2007). Since high temperatures also
aggravate spot blotch severity (Nema and Joshi, 1973; de
Lespinay, 2004; Sharma and Duveiller, 2004; Duveiller et al.,
2005) wheat yield losses in the EGP region could be due to
increase in spot blotch epidemic over the recent years, which
could curtail the benefits from progress recently achieved by
local breeders toward incorporating resistance in locally
adapted high yielding varieties. Hence, increased spot blotch
severity due to steadily changing climatic conditions would
worsen the damage already caused by heat with the reduction of
assimilates translocated to the grain. Likewise, climatic change
in South Asia has been observed in terms of a significantly
increasing number in cloudy and foggy days during winter
months (Debi, 2003), which not only reduces solar radiation use
Table 1
Name and origin of wheat genotypes tested in the Helminthosporium Monitoring
Genotype
No. Name/cross
1 SW89-5422
2 Chirya.7 (CS/Th cu//Vee/3/Ald/Pvn/4/Ningmai No. 4/Oleson//A
3 Yangmai-6
4 Chirya.1 (CS/Th cu//Vee/3/Ald/Pvn/4/Ningmai No. 4/Oleson//A
5 K-7
6 Ning 8201
7 K8027
8 Achyut
9 Coq/F61.70/Cndr/3/Oln/4/Pho
10 Prl/Toni
11 Altar-84/Ae. Sq. (224)//Yaco
12 Barkat/Kavkaz
13 Kan/6/Coq/F61.701//Cndr/3/Oln/4/Phos/Mrng/5/Alan/Cno
14 Gourab (=Turaco/Chil)
a Cross identification number.
but also contributes to prolonged hours of 100% relative
humidity in crop canopy, an ideal situation for early
establishment of spot blotch in wheat. Limited data recorded
with the help of a data logger installed in a wheat field confirms
this prolonged periods of high relative humidity in the canopy
(de Lespinay, 2004). Another phenomenon resulting of
anthropic activities and known as the ‘Asian Brown Cloud’
may also have a direct impact on agriculture through reduction
in total solar radiation due to air pollution leading to lower
photosynthetic activity (UNEP and C4, 2002).
The objective of this study was to examine 6-year data from
the regional HMN in South Asia to determine if resistance to
spot blotch had been stable over time and locations in the key
genotypes tested in all 6 years. One specific objective was to
examine if there was a systematic trend in spot blotch severity
and in turn in 1000-kernel weight (TKW) over the past 6 years
and their relationship with temperature. A recent report has
suggested that grain yield loss in the region was associated with
changes in average night time temperature in the month of
March (Sharma et al., 2007) which is also critical for spot
blotch development (Duveiller et al., 2005). Previous studies
suggested that TKW was negatively correlated with spot blotch
severity (Sharma et al., 1997; Dubin et al., 1998) and
temperature during grain filling period (Sharma, 1993).
2. Materials and methods
Fourteen genotypes of spring wheat tested during 6 years
(2000–2005) in the Helminthosporium Monitoring Nursery
sown in South Asia, were analyzed in the present study
(Table 1). These genotypes have diverse origins and many of
them are reported to possess high level of resistance to spot
blotch (Sharma et al., 2004a,b; Dubin et al., 1998). A few
genotypes are advanced breeding lines derived from crosses
involving spot blotch resistant parents. For example, Altar-84/
Ae. sq. (224)//Yaco (#11), Chirya.1 and Chirya.7 are a
synthetic-derived hexaploid wheat using tetraploid durum
(Triticum turgidum (Desf.) Husnot) and the D genome from
Nursery, South Asia, 2000–2005
Origin CIMMYT CIDa
China 72,403
ld/Yangmai No. 4) CIMMYT 66,176
China 239,288
ld/Yangmai No. 4) CIMMYT 52,605
Zambia 231,080
China 95,659
India 141,864
Nepal 355,572
CIMMYT
CIMMYT 8,064
CIMMYT
Bangladesh 459,077
Bangladesh
Bangladesh

R.C. Sharma et al. / Field Crops Research 103 (2007) 109–118 111
diploid Triticum tauschii (Coss.) Schmal. (syn. A. squarrosa)
(Mujeeb-Kazi et al., 1996) that is considered to possess
resistance to spot blotch (Mujeeb-Kazi, 1998). Barkat/Kavkaz
inherits resistance to spot blotch from Kavkaz that possess 1B/
1R translocation.
The experimental sites included three locations in Bangla-
desh (Dinajpur, Jamalpur, and Jessore), six in India (Coochbe-
har, Faizabad, Karnal, Pantnagar, Shillongani and Varanasi),
and three in Nepal (Bhairahawa, Rampur, and Tarahara). All
sites except Pantnagar and Karnal are part of the vast Eastern
Gangetic Plains. However, spot blotch is a serious disease of
wheat at all sites included in this study (Dubin et al., 1998;
Sharma et al., 2004a). Rice–wheat cropping system, the most
dominant rotation in the EGP, was practiced at each site in all
years. The trials were conducted at 8, 7, 7, 11, 12, and 12 sites in
2000, 2001, 2002, 2003, 2004, and 2005, respectively.
At each site, the field trial was sown in a randomized
complete block with two replicates. Plot size was 2 m � 0.5 m,
seeded with two rows using 0.25-m spacing. Spot blotch
severity was visually scored three times for each plot in each
location, using the double-digit scale (00–99) developed as a
modification of Saari and Prescott’s severity scale to assess
wheat foliar diseases (Saari and Prescott, 1975; Eyal et al.,
1987). The first digit (D1) indicates vertical disease progress on
the plant and the second digit (D2) refers to severity measured
as diseased leaf area. For each score, percentage disease
severity was based on the following formula:
Severity percentage ¼�
D1
9
��D2
9
�� 100:
The area under the disease progress curve (AUDPC) was
calculated using the percentage severity estimates correspond-
ing to the three ratings as outlined by Das et al. (1992). The
AUDPC gives a quantitative measure of epidemic development
and disease intensity (Reynolds and Neher, 1997). As outlined
by Reynolds and Neher (1997), the AUDPC was standardized
by dividing by the total number of days in the evaluation period
(AUDPC/day) to directly compare among epidemics of
different lengths for the six wheat growing seasons. After
maturity, plots were individually harvested and threshed. One
thousand randomly taken kernels from each plot were weighed
to measure TKW.
Each year–site combination was considered a unique and
random environment, while genotypic effect was analyzed as
fixed. The test of significance using F-ratios was conducted
according to the procedure outlined by McIntosh (1983) for
analysis of combined experiments. The statistical analysis
included an analysis of variance for each environment using
SAS (2003) software. After confirming the homogeneity of
variance (Gomez and Gomez, 1984, p. 322), a combined
analysis of variance was also conducted. Genotype and
genotype � environment (GGE) biplot analyses for inverse
of AUDPC/day, TKW and grain yield were conducted using
GGE biplot software (Yan and Kang, 2002) to determine
stability and to identify genotypes of interest for disease
resistance and grain yield. GGE biplot is a method of graphical
analysis of multi-environment data (Yan et al., 2000). It is
different from regular biplot that simultaneously displays both
genotypes and environments (Gabriel, 1971). The GGE biplot
is a biplot that displays the main genotype effect (G) and the
genotype � environment interaction (GE) of multi-environ-
ment tests. It is constructed by plotting the first two principal
components (PC1 and PC2, also referred to as primary and
secondary effects, respectively) derived from singular value
decomposition of the environment-centered data. A specific
option in GGE biplot analysis allows comparison among a set
of genotypes with a reference genotype. This method defines
the position of an ‘‘ideal’’ genotype, which will have the
highest average value of all genotypes and be absolutely stable;
that is, it expresses no genotype by environment interaction. A
set of concentric circles are generated using the ideal genotype
as the concentric center. The ideal genotype is used as a
reference to rank the other genotypes. A performance line
passing through the origin of the biplot is used to determine
mean performance of a genotype. The arrow on the
performance line represents increasing mean performance.
However, inverse of AUDPC/day was used in the analysis;
hence the direction of arrow on performance line represents
lower value, i.e. more resistant genotype. A stability line
perpendicular to the performance line is also passing through
the origin of the biplot; the two arrows in opposite directions
represent decrease in stability. A genotype farther form the
biplot origin on either side on the stability line represents
relatively lower stability. A genotype closer to the performance
line is considered more stable than the one placed farther.
Regression analysis was used to detect trends over years in
grain yield, disease severity, TKW, and mean minimum (or
night time) temperature in March. TKW was also regressed
over spot blotch severity in the 6 years to determine disease
effects on this trait. The effects of mean minimum temperature in
March on TKW and disease severity were also estimated using
regression analysis. Linear regression coefficient (b) was used to
infer tendency for a trait; the positive and negative values
representing increasing and decreasing trends, respectively.
3. Results
3.1. Genotype overall performance
There was a significant effect of environment, genotype, and
genotype � environment interaction on days to heading and
maturity, plant height, grain yield, TKW, and spot blotch
measured as severity percentage and AUDPC/day (ANOVA not
presented). The mean disease severity, AUDPC/day, grain yield
and TKW greatly varied in different years underscoring the
effect of environmental conditions. The 14 wheat genotypes
differed significantly for days to heading and maturity, plant
height, grain yield, spot blotch severity, AUDPC/day and TKW
(Table 2).
Mean spot blotch severity ranged from 22.5 to 38.3%
(Table 2). None of the genotypes was highly susceptible to spot
blotch considering that highly susceptible genotypes could
score 100% at the end of the season (Duveiller et al., 2005).

Table 2
Mean values for various traits of the 14 wheat genotypes tested across 57 environments in South Asia
Genotype number Days to Plant
height (cm)
Grain yield
(kg/ha)
Spot blotch 1000-Kernel
weight (g)Heading Maturity Severity (%) AUDPC/day
1 81 117 85 3456 25.8 13.8 38.4
2 79 118 90 3481 22.5 14.4 37.1
3 80 116 94 3173 23.4 15.5 39.0
4 78 115 87 3547 24.5 14.9 38.4
5 76 115 106 3776 31.7 25.8 40.8
6 78 115 85 3177 29.4 19.4 40.5
7 84 120 104 3320 26.9 19.0 39.7
8 80 118 100 3234 27.9 19.7 36.2
9 72 112 92 3609 37.7 26.0 42.7
10 74 114 96 3543 35.5 25.5 39.7
11 78 116 99 3930 23.2 14.2 45.9
12 72 113 88 3621 34.5 26.8 37.9
13 72 112 97 3865 36.7 25.3 37.4
14 71 112 93 3500 38.3 27.2 41.3
LSD0.05 1.4 1.3 2.2 87.4 1.1 0.6 0.7
CV (%) 6.8 4.3 8.8 9.4 13.6 11.7 7.0
R.C. Sharma et al. / Field Crops Research 103 (2007) 109–118112
The ranges of values for grain yield and TKW ranged from
intermediate to high. Most of the genotypes had acceptable
days to heading (<80 days) and maturity (<120 days) and plant
height (<100 cm). Genotype #11 (Altar-84/Ae. sq. (224)//
Yaco) had the highest grain yield and TKW and was among the
most resistant genotypes.
3.2. Stability analysis
The GGE biplot analysis of the 14 wheat genotypes for
inverse of AUDPC/day revealed that Altar-84/Ae. sq. (224)//
Yaco (#11) was the most stable for low spot blotch severity
among the resistant genotypes since it was closest to the point
Fig. 1. GGE biplot showing a comparison of 14 wheat genotypes with an ideal
genotype for inverse of area under disease progress curve per day across 57
environments, South Asia. The environments are hidden (for clarity of the
graph) and treated as random samples of the target environments (refer to
Table 2 for name of the genotypes corresponding to number 1–14).
of ideal genotype (Fig. 1). Several other resistant genotypes that
were relatively more stable included Yangmai-6 (#3),
SW89.5422 (#1), Chirya.7 (#2), Chirya.1 (#4) and K8027 (#7).
The GGE biplot analysis for TKW revealed that all
genotypes except K8027 (#7) were positioned along the mean
line (Fig. 2). However, among the genotypes with high TKW,
Altar-84/Ae. sq. (224)//Yaco (#11) was the most stable by being
closest to the point of ideal genotype. Other two genotypes with
higher and stable TKW were Coq/F61.70//Cndr/3/Oln/4/Pho/
Mrng (#9) and Gourab (#14).
The GGE biplot analysis for grain yield showed that Altar-
84/Ae. sq. (224)//Yaco (#11) was the most stable among higher
yielding lines by being closest to the point of ideal genotype
Fig. 2. GGE biplot showing a comparison of 14 wheat genotypes with an ideal
genotype for 1000-kernel weight 57 environments, South Asia. The environ-
ments are hidden (for clarity of the graph) and treated as random samples of the
target environments (refer to Table 2 for name of the genotypes corresponding
to number 1–14).

Fig. 3. GGE biplot showing a comparison of 14 wheat genotypes with an ideal
genotype for grain yield across 57 environments, South Asia. The environments
are hidden (for clarity of the graph) and treated as random samples of the target
environments (refer to Table 2 for name of the genotypes corresponding to
number 1–14).
Fig. 4. Trend in mean 1000-kernel weight (TKW), area under spot blotch
progress curve per day (AUDPC/day), grain yield and mean minimum tem-
perature in March over 6 years (A), effect of temperature on AUDPC/day, TKW
and grain yield (B), and effect of spot blotch on TKW and grain yield recorded
in the Eastern Gangetic Plains of South Asia in 6 years, 2000–2005.
R.C. Sharma et al. / Field Crops Research 103 (2007) 109–118 113
(Fig. 3). Other high yielding genotypes that were relatively
more stable included Kan/6/Coq/F61.701//Cndr/3/Oln/4/Phos/
Mrng/5/Alan/Cno (#13), K-7 (#5) and Barkat/Kavkaz (#12).
3.3. Yield and disease trend analysis
Regression analysis revealed an increasing trend for AUDPC/
day (b = 2.4, r = 0.96**) over 6 years (Fig. 4A). Thus over years,
average spot blotch severity records increased in all genotypes,
particularly in genotypes #10 and #12–14 from Bangladesh.
There was a decreasing trend for TKW (b = �1.02, r = �0.92*)
and grain yield (b = �139, r = �0.45) in the same period
(Fig. 4A). Mean minimum temperature in the month of March
showed an increasing trend (b = 0.60, r = 0.93**) (Fig. 4A).
Mean maximum temperature in March and minimum and
maximum temperatures in January and February showed a weak
fit in the regression model (values not shown). This increasing
trend in the mean minimum temperature in March over 6 years,
with exception in 2003, was evident at all five key sites in the
region from where the temperature data were analyzed (Fig. 5).
These five sites represent the entire transect of the EGP region
where the HMN trials were evaluated. Even if the mean
maximum temperature showed in general a tendency to increase
(Fig. 5), the regression analysis was better explained by the mean
minimum temperature in March (Fig. 4A). The mean minimum
temperature in March showed a positive relationship with spot
blotch severity (b = 3.22, r = 0.84**), and a negative association
with TKW (b = �1.53, r = �0.88**) and grain yield (b = �197,
r = �0.43) (Fig. 4B). Spot blotch severity showed a negative
association with TKW (b = �0.42, r = �0.93**) and grain yield
(b = �80, r = �0.67) (Fig. 4C).
All 14 genotypes showed an increasing trend in spot blotch
severity and a decreasing trend in TKW over 6 years (Fig. 6).
There were variations in the slope of the regression line and r
value for both spot blotch severity and TKW among the
genotypes. A greater average annual increase in spot blotch
severity was evident on less resistant genotypes like #12
(Barkat/Kavkaz) and #14 (Gourab) (3.0%).
4. Discussion
4.1. Progress towards improving spot blotch resistance
The results from 57 environments confirm the low disease
severity of a few genotypes showing their values in improving
spot blotch resistance of the commercial cultivars in South
Asia. Though not a part of this study, another recent study
conducted at most of these sites in the same years, commercial

Fig. 5. Mean minimum and maximum temperature over 6 years at five sites in
the Eastern Gangetic Plains where the trials were conducted.
R.C. Sharma et al. / Field Crops Research 103 (2007) 109–118114
cultivars had shown much higher disease severity with above
80% on the susceptible check (Sharma et al., 2007). These
results demonstrate that newer wheat genotypes in the region
possess improved resistance over old commercial cultivars, and
confirm previous findings based on data from limited
environments that included several resistant genotypes reported
in this study (Sharma et al., 2004a,b; Joshi et al., 2004). A few
genotypes with lower disease severity (Chirya.7, Yangmai-6
and Chirya.1) had relatively lower grain yield and TKW, and
later maturity compared to genotype #13 which has been
developed in the region. However, the genotype with the
highest grain yield and TKW (#11: Altar-84/Ae. sq. (224)//
Yaco) also had low disease severity. This shows progress in
combining spot blotch resistance and high grain yield, which
was not possible earlier. Dubin et al. (1998) had reported that
high yielding wheat cultivars during early 1990s in India, Nepal
and Bangladesh were susceptible to spot blotch. There are still
high yielding recently developed commercial wheat cultivars in
the region with low to intermediate levels of resistance that
show up to 20% yield loss due to spot blotch (Sharma and
Duveiller, 2006; Siddique et al., 2006). Identification of high
yielding and spot blotch resistant genotypes in this study offers
opportunity to further increase the yield of the commercial
cultivars by improving resistance through selective breeding.
One genotype, K8027 (#7), included in this study, had also
been studied in an earlier study in 1993 and 1994 by Dubin et al.
(1998). They reported that the leading commercial wheat
cultivars of South Asia in early 1990s had much higher spot
blotch severity than K8027, which showed high level of
resistance in their study. This study shows that a few of the
recently developed wheat genotypes have resistance level equal
to or better than K8027, besides showing higher yield and TKW
and earlier maturity. This finding demonstrates that improve-
ment achieved in the region is due to international effort in
improving spot blotch resistance of the wheat cultivars in the
Eastern Gangetic Plains of South Asia. Also, it shows that the
best sources of spot blotch resistance are coming not only from
the wide crosses alone, but also from the traditional hexaploid
wheats.
This study confirms that spot blotch resistant wheat
genotypes are becoming more acceptable agronomically, and
are available for direct use in breeding programs to develop
commercial cultivars. The results further substantiate the
usefulness of the regional spot blotch resistance monitoring
nursery as a vehicle for introducing new sources of spot blotch
resistance that are agronomically acceptable and provide high
and stable yields (Sharma et al., 2004a,b). Even though our
study includes only one of the climatic factors emphasized by
Garrett et al. (2006), nevertheless, our observation on
temperature effect on spot blotch epidemic is factual.
4.2. Challenges
One specific objective of the present work was to examine
any possible drift in spot blotch severity that might have
occurred in the region in the past 6 years. The results confirm a
tendency towards increasing spot blotch severity in the region.
In the same period, there has been a decreasing trend in TKW
and grain yield. TKW is often used as an indicator of resistance/
tolerance by being negatively correlated with spot blotch
severity (Dubin et al., 1998; Sharma et al., 1997, 2004b).
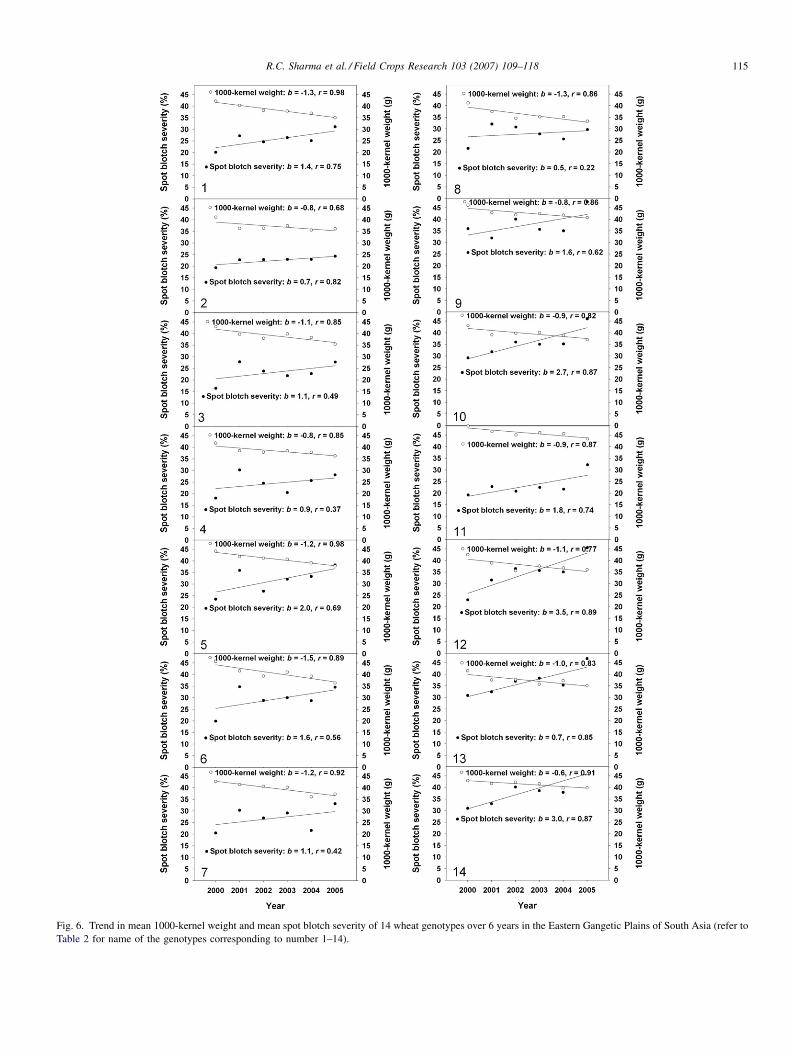
Fig. 6. Trend in mean 1000-kernel weight and mean spot blotch severity of 14 wheat genotypes over 6 years in the Eastern Gangetic Plains of South Asia (refer to
Table 2 for name of the genotypes corresponding to number 1–14).
R.C. Sharma et al. / Field Crops Research 103 (2007) 109–118 115

R.C. Sharma et al. / Field Crops Research 103 (2007) 109–118116
During the period, 2000–2005, there are indications of steadily
slightly increasing trend for average night time temperature in
the month of March in the region. These facts have no doubt
effect on plant physiology as dark respiration would increase,
causing premature plant senescence. Thus confounding effects
may occur between an increase in disease susceptibility and
negative abiotic effects on crop physiology. These effects are
intrinsically linked and very difficult to unravel through the
present study. However, the cumulative and related effects of
crop susceptibility to disease, crop physiology and stresses has
been shown through systematically designed studies conducted
at representative locations in the same region that are in
agreement with this observation (Sharma and Duveiller, 2004;
Duveiller et al., 2005; Rosyara et al., 2007). This supports
general speculations about global warming and its specific
relevance to wheat production environments for the South Asia
region (Black, 2006; Hodson and White, 2007). Temperature
data from five sites in the region shows increasing trend in
average night time temperature at each location in the 6 years
with exception in 2003. Similar trend was present for average
maximum temperature but not at each site. Higher temperature
favors spot blotch severity (Duveiller et al., 1998; de Lespinay,
2004). Also, high temperature during March that coincides with
wheat grain filling period in the Eastern Gangetic Plains of
South Asia reduces TKW (Sharma, 1993). Hence, a same cause
where higher temperature is an indicator, results in a complex
effect operating in opposite directions on spot blotch severity
and TKW in the region. Garrett et al. (2006) has underlined the
intricate interrelationships between plant disease and climate.
Also, because anthropogenic climate change is characterized
by greater increases in Tmin. (minimum temperature) than
Tmax. (maximum temperature), improved understanding of the
temperature response is needed to better quantify and reduce
uncertainties in climate change impact assessments (Lobell
and Ortiz-Monasterio, 2007). CERES (Crop Environment
Resource Synthesis) projections of response to increased
temperature in North America suggested that the apparent
historical importance of Tmin. mainly results from covariation
between temperatures and solar radiation (Lobell and Ortiz-
Monasterio, 2007). In South Asia the ‘Asian Brown Cloud’
effect, signifying hazy sky, has been identified, causing
reduction in solar radiation reaching the crop canopy. As a
result, biomass and yield of irrigated wheat in the January–
March 1999 decreased by an estimated 1–2% depending on
regions using wheat growth simulator (WTGROWS), with
higher effect in Eastern and Western Uttar Pradesh of India
(UNEP and C4, 2002). However, the effect was found to be
limited and differences among wheat growing regions in India
were statistically non-significant. A weak reaction of wheat
yield to 20% radiation reduction from the normal level means
the radiation requirement by the crop is satisfied even under
radiation reduction scenario (UNEP and C4, 2002). Thus, in
South Asia, the effect of average temperature per se (i.e. heat)
combined with the higher relative air humidity during foggy
days in winter are likely to be more significant on wheat spot
blotch severity at regional level than changes in solar
radiation.
A critical analysis shows that a linear increase in spot blotch
severity could in part have caused decrease in TKW,
temperature being another factor for such reduction. This
result confirms a recent observation by Sharma et al. (2007)
who reported increase in spot blotch severity recorded during
six seasons in South Asia on a set of local commercial cultivars.
This finding is also in agreement with the recent reports that the
disease continues to cause substantial grain yield losses on
recently developed moderately resistant wheat cultivars in
Bangladesh (Siddique et al., 2006) and Nepal (Sharma and
Duveiller, 2006). Considering the importance of crop
physiology and the abiotic stresses such as heat in particular
on disease development underlined in earlier studies (Sharma
and Duveiller, 2004; Duveiller et al., 2005), the results of the
present study raise a special concern. They suggest that spot
botch will remain a disease of resource poor farmers who
cannot afford early sowing, live in marginal warmer wheat
growing areas and are in the frontline against higher threats as a
consequence of climate change. Recently, Black (2006)
concluded that heat is going to be a daunting factor to higher
wheat yields in warm regions of the world including South
Asia. The present study supports that increasing night time
temperature in March is associated both with loss in TKW and
increase in spot blotch severity. This demonstrates that
increase in temperature during wheat grain filling could prove
double jeopardy to wheat yield in South Asia—hastening
wheat physiological maturity by reducing the grain filling
period (Sharma, 1993), and increasing spot blotch severity
(Nema and Joshi, 1973; de Lespinay, 2004; Sharma and
Duveiller, 2004; Duveiller et al., 2005). Thus, yield
performance is threatened, should the overall phenomenon
of increasing temperature and disease severity intensify
(Duveiller et al., in press). If crop profitability declines and
heat tolerance in wheat is not satisfactory, biotic constraint like
spot blotch may lead to less acreage grown to wheat in future in
warmer areas, prompting farmers toward crop diversification
(Black, 2006). In the EGP, this may soon translate in a
comparative economic advantage of winter (rabi) maize and
potato over bread wheat, which is already being experienced in
Bangladesh (S. Waddington, CIMMYT, Bangladesh, personal
communication).
None of the wheat genotypes included in the study is highly
susceptible to spot blotch as shown by their low to intermediate
severity scores. Earlier reports have shown that SW89.5422,
Chirya.1, Chirya.7, Yangmai-6, and K-7 show <10% spot
blotch induced losses in grain yield and TKW compared to
>30% in susceptible wheat cultivars from South Asia region
(Sharma et al., 2004a,b; Sharma and Duveiller, 2006). Since all
14 genotypes showed a tendency towards higher spot blotch
severity and lower TKW over the 6-year period, factors other
than wheat genotypes appear to posing challenge towards
future improvement of resistance. All trials reported in this
study were seeded around optimal time (between 20 November
and 10 December) and received standard wheat crop manage-
ment practices. Hence variations in climatic factors, heat in
particular, and their effect on increased disease severity and loss
in TKW are suspected to have major implications. Differences
R.C. Sharma et al. / Field Crops Research 103 (2007) 109–118 117
in virulence in the spot botch-wheat pathosystem are unlikely to
occur since C. sativus isolates represent a continuum of strains
differing in aggressiveness and no race speciation has been
found in this non-specific pathogen as confirmed in several
studies on pathogen diversity (Di Zinno et al., 1998; Maraite
et al., 1998; Ruckstuhl, 1998). Thus, environmental factors
unrelated to pathogen specialization in virulence could have a
major effect. Also, the direct effect of increasing temperature
on multiplication and sporulation rate of the prolific C. sativus
fungus is very well known in vitro and in vivo (Duveiller et al.,
1998). In research in Mexico, Duveiller et al. (1998) showed
that disease severity increased in controlled conditions with
higher temperature, which is supported by a recent study on the
effect of temperature on spot blotch severity (de Lespinay,
2004). This study demonstrates that wheat genotypes with
stable resistance to spot blotch combined with stable grain yield
and TKW and acceptable maturity and plant height are
available in South Asia as a result of international collaboration
over the past 15 years. These genotypes could prove valuable
for wheat breeding programs in the region to improve wheat
yield and spot blotch resistance. The key superior genotypes
could also be valuable for other warm wheat growing areas
where spot blotch is a problem.
The findings also demonstrate that grain yield in the Eastern
Gangetic Plains of South Asia is showing a decreasing trend
and there is an increasing tendency for spot blotch severity in
the past 6 years. The conclusion based on the 6-year data
underlines a potential threat due to climatic change: the
increase in temperature could destabilize wheat productivity in
the heat prone wheat growing environments in South Asia. In
agreement with the conclusion on interaction among climatic
variables and plant disease by Garrett et al. (2006), our results
show that a close monitoring of climatic changes and disease
development, i.e. spot blotch severity observed through a
regional effort like the Helminthosporium Monitoring Nursery,
is fundamental to achieving stability in wheat production in the
region.
Acknowledgments
Financial support for this regional collaborative study in
South Asia was made available to CIMMYT through the
Directorate General for Cooperation and Development (Bel-
gium Government). The authors appreciate the assistance of
Mr. S. Pradhan in preparing the figures and tables. The authors
acknowledge the collaboration of wheat programs in India
(Directorate of Wheat Research, Karnal; Banaras Hindu
University, Varanasi; Narendra Dev University of Agriculture
and Technology, Kumarganj; Uttar Banga Krishi Viswavidya-
laya, Coochbehar; G.B. Pant University of Agriculture and
Technology, Pantnagar; Assam Agricultural University, Shil-
longani), Nepal (National Wheat Research Program, Bhair-
ahawa; Institute of Agriculture and Animal Science, Rampur;
Regional Agricultural Research Station, Tarahara), and
Bangladesh (Regional Agricultural Research Station, Jessore;
Wheat Research Center, Dinajpur; Wheat Research Center,
Jamalpur).
References
Badaruddin, M., Saunders, D.A., Siddique, A.B., Hossain, M.A., Ahmed, M.U.,
Rahman, M.M., Parveen, S., 1994. Determining yield constraints for wheat
production in Bangladesh. In: Saunders, D.A., Hettel, G.P. (Eds.), Wheat in
Heat-stressed Environments: Irrigated, Dry Areas and Rice–Wheat Farming
Systems. CIMMYT, Mexico, D.F., pp. 265–271.
Bhushan, B., Singh, K., Kaur, S., Nanda, G.S., 2002. Inheritance and allelic
relationship of leaf blight resistance genes in three bread wheat varieties in
the adult plant stage. J. Genet. Plant Breed. 56, 69–76.
Black, R., 2006. New crops needed to avoid famines. http://news.bbc.co.uk/2/
hi/science/nature/6200114.stm.
Das, M.K., Rajaram, S., Mundt, C.C., Kronstad, W.E., 1992. Inheritance of slow
rusting resistance to leaf rust in wheat. Crop Sci. 32, 1452–1456.
Debi, S., 2003. The dark white shroud. Himal South Asian. http://www.
himalmag.com/2003/march/essay.htm.
de Lespinay, A., 2004. Selection for stable resistance to Helminthosporium leaf
blights in non-traditional warm wheat areas. M.S. Thesis. Universite
Catholique de Louvain, Louvain-La-Neuve, Belgium.
Devkota, R.N., 1994. Wheat breeding objectives in Nepal: the national testing
system and recent progress. In: Saunders, D.A., Hettel, G.P. (Eds.), Wheat
in Heat-stressed Environments: Irrigated, Dry Areas and Rice–Wheat
Farming Systems. CIMMYT, Mexico, D.F., pp. 216–223.
Di Zinno, T., Longree, H., Maraite, H., 1998. Diversity of Pyrenophora tritici-
repentis isolates from warm wheat growing areas: pathogenicity, toxin
production, and RAPD analysis. In: Duveiller, E., Dubin, H.J., Reeves,
J., McNab, A. (Eds.), Helminthosporium Blights of Wheat: Spot Blotch
and Tan Spot. CIMMYT, Mexico, D.F, pp. 302–311.
Dubin, H.J., Arun, B., Begum, S.N., Bhatta, M., Dhari, R., Goel, L.B., Joshi,
A.K., Khanna, B.M., Malaker, P.K., Pokhrel, D.R., Rahman, M.M., Saha,
N.K., Shaheed, M.A., Sharma, R.C., Singh, A.K., Singh, R.M., Singh,
R.V., Vergas, M., Verma, P.C., 1998. Result of South Asian regional
Helminthosporium leaf blight and yield experiment 1993–1994. In:
Duveiller, E., Dubin, H.J., Reeves, J., McNab, A. (Eds.), Helminthos-
porium Blights of Wheat: Spot Blotch and Tan Spot. CIMMYT, Mexico,
D.F., pp. 182–187.
Duveiller, E., Garcia, I., Franco, J., Toledo, J., Crossa, J., Lopez, F., 1998.
Evaluating spot blotch resistance of wheat: improving disease assessment
under controlled conditions and in the field. In: Duveiller, E., Dubin, H.J.,
Reeves, J., McNab, A. (Eds.), Helminthosporium Blights of Wheat: Spot
Blotch and Tan Spot. CIMMYT, Mexico, D.F., pp. 171–181.
Duveiller, E., Kandel, Y.R., Sharma, R.C., Shrestha, S.M., 2005. Epidemiology
of foliar blights (spot blotch and tan spot) of wheat in the plains bordering
the Himalayas. Phytopathology 95, 248–256.
Duveiller, E., Singh, R.P., Nicol, J.M., in press. Challenges to maintaining
wheat productivity: pests, diseases and potential epidemics. Euphytica,
doi:10.1007/s10681-007-9380-z.
Eyal, Z., Scharen, A.L., Prescott, J.M., van Ginkel, M., 1987. The Septoria
Diseases of Wheat: Concepts and Methods of Disease Management.
CIMMYT, Mexico, D.F..
FAO, 2006. Statistical database. http://www.fao.org (verified February 4, 2006).
Gabriel, K.R., 1971. The biplot graphic display of matrices with application to
principal component analysis. Biometrika 58, 453–467.
Garrett, K.A., Dendy, S.P., Frank, E.E., Rouse, M.N., Travers, S.E., 2006.
Climate change effects on plant disease: genomes to ecosystems. Annu.
Rev. Phytopathol. 44, 489–509.
Gomez, K.A., Gomez, A.A., 1984. Statistical Procedures for Agricultural
Research, 2nd ed. John Wiley & Sons, New York, p. 322.
Hodson, D.P., White, J.W., 2007. Use of spatial analyses for global character-
ization of wheat-based production systems. J. Agric. Sci. 145, 115–125.
Joshi, A.K., Kumar, S., Chand, R., Ortiz-Ferrara, G., 2004. Inheritance of
resistance to spot blotch caused by Bipolaris sorokiniana in spring wheat.
Plant Breed. 123, 213–219.
Lobell, D.B., Ortiz-Monasterio, J.I., 2007. Impacts of days versus night
temperatures on spring wheat yields: a comparison of empirical and CERES
model predictions in three locations. Agron. J. 99, 469–477.
Maraite, H., Di Zinno, T., Longree, H., Daumerie, V., Duveiller, E., 1998.
Fungi associated with foliar blight of wheat in warm areas. In: Duveiller,

R.C. Sharma et al. / Field Crops Research 103 (2007) 109–118118
E., Dubin, H.J., Reeves, J., McNab, A. (Eds.), Helminthosporium Blights
of Wheat: Spot Blotch and Tan Spot. CIMMYT, Mexico, D.F., pp. 293–
300.
McIntosh, M.S., 1983. Analysis of combined experiments. Agron. J. 75, 153–
155.
Mujeeb-Kazi, A., Rosas, V., Roldan, S., 1996. Conservation of the genetic
variation of Triticum tauschii (Coss) Schmalh. (Aegilops squarrosa auct.
non. L.) in synthetic hexaploid wheats (T. turgidum L. s. lat. 3 T. tauschii; 2n
5 6x 5 42, AABBDD) and its potential utilization for wheat improvement.
Genet. Res. Crop Evol. 43, 129–134.
Mujeeb-Kazi, A., 1998. Novel genetic diversity for stress tolerance in the
Triticeae: strategic avenues and applied potentials. In: Duveiller, E., Dubin,
H.J., Reeves, J., McNab, A. (Eds.), Helminthosporium Blights of Wheat:
Spot Blotch and Tan Spot. CIMMYT, Mexico, D.F., pp. 223–229.
Nagarajan, S., 2005. Can India produce enough wheat even by 2020? Curr. Sci.
89, 1467–1471.
Nema, K.G., Joshi, L.M., 1973. Spot-blotch disease of wheat in relation to host
age, temperature and moisture. Indian Phytopathol. 26, 41–48.
Rane, J., Shoran, J., Nagarajan, S., 2000. Heat stress environments and impact
on wheat productivity in India: guestimate of losses. Indian Wheat Newsl. 6,
5–6.
Reuters, 2006. Indian wheat imports ‘half-hearted’. http://www.ibnlive.com/
news/indian-wheat-imports-halfhearted/10079-7.html (verified November
28, 2006).
Reynolds, K.L., Neher, D.A., 1997. Statistical comparison of epidemics. In:
Francl, L.J., Neher, D.A. (Eds.), Exercises in Plant Disease Epidemiology.
APS Press, St. Paul, MN, USA, pp. 34–37.
Rosyara, U.R., Duveiller, E., Pant, K., Sharma, R.C., 2007. Variation in
chlorophyll content, anatomical traits, and agronomic performance of wheat
genotypes differing in spot blotch resistance. Australasian Plant Pathol. 36,
245–251.
Ruckstuhl, M., 1998. Population structure and epidemiology of Bipolaris
sorokiniana in the rice–wheat cropping pattern of Nepal. In: Duveiller,
E., Dubin, H.J., Reeves, J., McNab, A. (Eds.), Helminthosporium Blights
of Wheat: Spot Blotch and Tan Spot. CIMMYT, Mexico, D.F., pp. 88–106.
Saari, E.E., 1985. Distribution and importance of root rot diseases of wheat,
barley and triticale in South and Southeast Asia. In: Villareal, R., Klatt, A.R.
(Eds.), Proceedings of the International Conference on Wheat for More
Tropical Environments, CIMMYT, Mexico, D.F., September 24–28, 1984,
pp. 37–51.
Saari, E.E., Prescott, J.M., 1975. A scale for appraising the foliar intensity of
wheat disease. Plant Dis. Reptr. 59, 377–380.
SAS Institute, 2003. SAS 9.1 for Windows. SAS Institute Inc., Cary, NC, USA.
Sharma, R.C., 1993. Growth periods in relation to seeding time and perfor-
mance of spring wheat. J. Inst. Agric. Anim. Sci. 14, 23–29.
Sharma, R.C., Dubin, H.J., Bhatta, M.R., Devkota, R.N., 1997. Selection for
spot blotch resistance in four spring wheat populations. Crop Sci. 37, 432–
435.
Sharma, R.C., Duveiller, E., 2004. Effect of Helminthosporium leaf blight on
performance of timely and late-seeded wheat under optimal and stressed
levels of soil fertility and moisture. Field Crops Res. 89, 205–218.
Sharma, R.C., Duveiller, E., 2006. Spot blotch continues to cause substantial
grain yield reductions under resource limited farming conditions. J. Phy-
topathol. 154, 482–488.
Sharma, R.C., Duveiller, E., Ahmed, F., Arun, B., Bhandari, D., Bhatta, M.R.,
Chand, R., Chaurasiya, P.C.P., Gharti, D.B., Hossain, M.H., Joshi, A.K.,
Mahto, B.N., Malaker, P.K., Reza, M.A., Rahman, M., Samad, M.A.,
Shaheed, M.A., Siddique, A.B., Singh, A.K., Singh, K.P., Singh, R.N.,
Singh, S.P., 2004a. Helminthosporium leaf blight resistance and agronomic
performance of wheat genotypes across warm regions of South Asia. Plant
Breed. 123, 520–524.
Sharma, R.C., Duveiller, E., Gyawali, S., Shrestha, S.M., Chaudhary, N.K.,
Bhatta, M.R., 2004b. Resistance to Helminthosporium leaf blight and
agronomic performance of spring wheat genotypes of diverse origins.
Euphytica 139, 33–44.
Sharma, R.C., Ortiz-Ferrara, G., Crossa, J., Bhatta, M.R., Sufian, M.A.,
Shoran, J., Ortiz, R., 2007. Genetic improvement and stability of wheat
grain yield assessed through regional trials in the Eastern Gangetic Plains
of South Asia. In: Proceedings of the International Symposium on Wheat
Yield Potential: Challenges to International Wheat Breeding. Ciudad
Obregon, Sonora, Mexico, March 19–24, 2006. CIMMYT, Mexico, D.F.,
abstracts.
Siddique, A.B., Hossain, M.H., Duveiller, E., Sharma, R.C., 2006. Progress in
wheat resistance to spot blotch in Bangladesh. J. Phytopathol. 154, 16–22.
Tirol-Padre, A., Ladha, J.K., 2006. Integrating rice and wheat productivity
trends using the SAS mixed-procedure and meta-analysis. Field Crops Res.
95, 75–88.
UNEP, C4, 2002. The Asian Brown Cloud: Climate and Other Environmental
Impacts. UNEP, Nairobi, 53 pp.
Yan, W., Kang, M.S., 2002. GGE Biplot Analysis: A Graphical Tool for
Breeders, Geneticists, and Agronomists. CRC Press, New York, USA.
Yan, W., Hunt, L.A., Sheng, Q., Szlavnics, Z., 2000. Cultivar evaluation and
mega-environment investigation based on the GGE biplot. Crop Sci. 40,
597–605.
Copyright © 2022 FDOKUMEN