Hydrochemistry and isotope hydrogeology in the Jericho area/Palestine
169
Hydrochemistry and Isotope Hydrogeology in the Jericho Area/ Palestine By Saed Kuzeed Khayat From Nablus, Palestine A thesis for the degree of Doctor of Natural Sciences submitted to the Faculty of Civil Engineering, Geosciences and Environmental Sciences University of Karlsruhe, Germany Date of thesis defence: 14. 12. 2005 Main Supervisor: Prof. Dr. Heinz Hötzl, AGK- Angewandete Geologie/ Uni- Karlsruhe Co-advisors: Prof. Dr. Eng. Olaf Kolditz, University of Tübingen
Transcript of Hydrochemistry and isotope hydrogeology in the Jericho area/Palestine

Hydrochemistry and Isotope Hydrogeology in the Jericho Area/ Palestine
By
Saed Kuzeed Khayat
From Nablus, Palestine
A thesis for the degree of Doctor of Natural Sciences submitted
to the Faculty of Civil Engineering, Geosciences and
Environmental Sciences
University of Karlsruhe, Germany
Date of thesis defence: 14. 12. 2005
Main Supervisor: Prof. Dr. Heinz Hötzl, AGK- Angewandete Geologie/ Uni- Karlsruhe
Co-advisors: Prof. Dr. Eng. Olaf Kolditz, University of Tübingen

I
ABSTRACT
In the arid to semiarid region of the Middle East, with its water scarcity problems
salinisation together with other anthropogenic contaminants is considered as the main
threat to fresh groundwater resources now days. Due to this matter of fact the possible
sources of salinisation and driving mechanisms should be identified, to take a suitable
action to mitigate this phenomenon.
In this study, the natural and anthropogenic salinisation of groundwater in the area
of Jericho (north of the Dead Sea) is investigated to describe the possible main causes
of the groundwater deterioration in this agricultural area, and highlighting a clear basis
for stakeholders to take suitable actions to manage the water resources in more
efficient way.
Chloride and TDS concentrations in the shallow Pleistocene aquifer systems in the
Jericho area indicate a general trend of increasing salinity eastward and southward.
There are some notable exceptions to this trend depending on the wells location and
surrounding activities.
The groundwater quality varies from fresh carbonate groundwater in the springs in
the west with depleted δ13C of -12 to -13%°, to Ca-Cl and Na-Cl brackish water with
more enriched signature that bearing this signatures of δ13C, δ34S of evaporate salts
Leachate. The analyses of major ions, hydrogen and oxygen isotopes as well as
carbons, and sulfur isotopes indicate that primary sources of the salinity are: (1) the
leachate of salts included in the Pleistocene sediments, leading mainly to a brackish
formation, (2) the mixing with seawater, which result from sea ingression in the
Pliocene and partly remaining in the of the terrigenic sediments deposited in that sea,
(3) mixing with ascending brines from the depth, which are mainly the result from the
dissolution of salt bodies. This brackish or salty water arises up under the lowering of
the water pressure in the shallow aquifer by heavy abstraction, through conduits and
capillaries in the Lisan formation. The leaching processes in the Pleistocene Lisan
formation are supported by the low Tritium units and the δ34S Sulphate signatures that
bearing this of the Lisan solid samples. In the eastern part of the study area, where the
more finer and silty formation is predominant, deep saline water in the aquitarde
interface with the upper fresh water forming mixing of brackish water with mixed
isotopes signatures. It is unclear, whether this saline water is residual water from
former Pleistocene Pliocene sea ingression or recent saltwater migration that was
formed due to dissolution of salty rocks in the depth. However, the permeability of the

II
Lisan formation is very low and can be considered as an aquitarde which retained
water for long time in contact with salty rocks and forming this brackish water in situ.
An evidence of agricultural backflow was detected in some wells which were not
highly affected by saline water. The presence of the brine water input with high TDS
may overlap the tracer’ elements that can indicate the agricultural influence in other
wells, which might also be subjected to such kind of anthropogenic pollution. The
isotope signatures of nitrogen and oxygen in nitrate confirm that the aquifer is highly
influenced by leakage of sewage and manure from the septic tanks, which are widely
used in the study area.
Some wells in the west and in the north west part of the study area, adjacent to the
springs system and major fault, show the same water type and δ13C signatures as the
water from the springs with their marine calcareous composition. This can be confirms
that there is a discharge from the calcareous water of the regional mountains aquifer to
the shallow aquifer. These results highly suggesting that the previous concept about
the major fault barrier between the two aquifer is not definitely correct. The fault
system it self serves like a conduit system as it was observed from the ascending
brines. Where there is a kind of barrier this is due to the evidence of extreme low
permeabilities of the young Plio-Pleistocene sediments bordering the fault and the
cretaceous aquifer on the other side of the fault.
A GIS based model for the study area was constructed using the new developed
Geosys program. The model was used to apply several assumption and scenarios for
the mode and mechanism of the contribution of irrigation channels draining water
from Sultan spring to the east. It was noticed that the effective infiltration of about 2%
from the total discharge of Sultan spring through the irrigation channels has also an
effect on the groundwater table in the aquifer. This visualized hydrosystem data can
show the different mechanisms of recharge from each contributor, and the flow mode
in the system , as well as it can be a good tool to trace the mechanism of salinity after
further refining and calibration .

III
DEDICATION
مسم اهللا الرحمن الرحيب
العالمين، رب هللا ومماتي ومحياي ونسكي صالتي إن لق’’
‘‘المسلمين أول وأنا أمرت وبذلك له شريك لا
العظيم اهللا صدق
To the Sole of my father “Kuzeed” who formed part of my vision and taught me the good things
that really matter in life. The happy memory of my father still provides a persistent inspiration for my
journey in this life.
To my mother “Wijdan” who continues to learn, grow and develop,
To my wife “Maysa’a” who has been a source of encouragement, support, and inspiration to me
throughout my study,
To my children “Sara and M. Kuzeed”,
To my Sisters “Soha and Dua’a”,
To my brother “Sari”,
With my love to them all,
Saed

IV
ACKNOWLEDGEMENTS A journey is easier when you travel together. Interdependence is certainly more valuable than
independence. This thesis is the result of 3 years of work whereby I have been accompanied
and supported by many people. It is a pleasant aspect that I have now the opportunity to
express my gratitude for all of them.
The first person I would like to thank is my direct supervisor Prof. Dr. Heinz Hoetzl. I have
been in his project since 2003 when I started my PhD assignment. During these years I have
known him as a sympathetic and principle-centered person. His overly enthusiasm and integral
view on research and his mission for providing 'only high-quality work and not less', has made
a deep impression on me. I owe him lots of gratitude for having me shown this way of
research. He could not even realize how much I have learned from him.
The other one whom I would like to thank is my co-advisor Stefan Geyer who kept an eye
on the progress of my work and always was available when I needed his advises. Besides of
being an excellent advisor, Stefan was as close as a relative and a good friend to me. I am
really glad that I have come to get know Stefan Geyer in my life.
Also, I would like to express my deepest thanks and gratitude to Prof. Dr. Eng. Olaf
Kolditz, who was my entrance to learn the modeling staff, his distinctive personality and the
valuable methods in giving information, make me understanding well the hydro-systems
modeling principles, It was a pleasure to work with him and the other employees of Center for
Applied Geosciences/ Tuebingen.
The Palestinian house that open his arm for me and provide me with all kinds of support
was the PHG- Palestinian Hydrology Group, where I found from my friends Dr. Tamimi and
Dr. Ghanem all what student need from technical, financial and scientific aid in the field.
Special thanks should go to my best promoter and friend Dr. Wasim Ali for his kindness
and almost daily assistance, scientific guidance and support. This man who might forget his
right hand but never forget his Palestine. Wasim Ali never forget his people specially the
students, thus I was not the only Palestinian student whom Wasim Ali has provided help for
him to complete his study in Germany. Thousands regards from Palestine to him.
My deep gratitude to the German Federal Ministry of Science and Research (BMBF) (Dr. S.
Kiefer and Dr. H.J. Metzger) for funding and support my work, and for the Country of
Germany for their continuous support of the Palestinian people.
My colleagues of the UFZ-Environmental Research Center and AGK- Applied Geology/
University of Karlsruhe and PHG- Palestinian Hydrology Group all gave me the feeling of
being at home at work, many thanks for being your colleague. I would also like to thank the
other members of my PhD committee who monitored my work and took effort in reading and
providing me with valuable comments on earlier versions of this thesis. Finally, I am indebted
to everyone who contributed to completing this work whom I have failed to mention.

V
TABLE OF CONTENTS:
CHAPTER 1: INTRODUCTION: BACKGROUND AND PURPOSE OF STUDY 1
1.1. Aim and Scope 1
1.2. Location and Major Features 2
1.3. Land Use 5
1.4. Population 8
1.5. Soil 8
1.6. Climate 9
1.6.1. Temperature and Wind 9
1.6.2. Precipitation 9
1.7. Previous Investigations 11
CHAPTER 2: GEOLOGY AND HYDROGEOLOGY 13
2.1. General Overview 13
2.2. Stratigraphy and Lithology of the West Bank 15
2.3 Geology and Stratigraphy of the Jericho Area 17
2.3.1 Cretaceous Rocks 17
2.3.1.1. Aptian-Albian-Kobar Formation 17
2.3.1.2. Albian-Lower Beit Kahil 17
2.3.1.3. Albian Upper Beit Kahil Formation 18
2.3.1.4. Cenomanian- Yatta Formation 18
2.3.1.5. Cenomanian- Hebron Formation 18

VI
2.3.1.6. Cenomanian-Bethlehem Formation 19
2.3.1.7. Turonian-Jerusalem Formation 19
2.3.1.4. Senonian- Abu Dis Formation 19
2.3.2. Neogene and Quaternary 19
2.3.2.1. Pleistocene Formation 20
2.3.2.2. Holocene Formation 20
2.4. Structural Settings 23
2.4.1. Faults and Folds 23
2.4.2. Joints 25
2.4.3. Karstification 25
2.5. Hydrogeology 25
2.5.1. Hydrogeology of the West Bank 25
2.5.1.1. North Eastern Basin 26
2.5.1.2. Western Basin 26
2.5.1.3. Eastern Basin 26
2.5.2. Hydrogeology of Jericho Area 29
2.5.2.1. Regional Aquifers 29
2.5.2.1.1. The Upper Cretaceous Aquifer 29
2.5.2.1.2. The Jordan Valley [Dead Sea Group] Aquifer 29
2.5.2.1.3. Hydraulic Separation between the Two Aquifers 31
2.5.2.1.4. Perched Water from the Upper Cretaceous Aquifer 31
2.5.2.1.5. Perched Water from the Pleistocene Aquifer 31

VII
2.5.2.5. Wells 31
2.5.2.6. Springs 32
2.6. History of the Hydrogeochemistry in the Study Area 34
2.6.1. The History of Saline Formation in the Rift Valley 34
2.6.2. Previous Hydrochemistry data from Jericho Area 36
2.6.2.1. Springs 36
2.6.2.2. Wells 38
2.5.3. Groundwater Quality Deterioration in the Study Area 39
2.5.3.1. Salinity 39
2.5.3.2. Anthropogenic Pollution 42
Chapter 3: METHODODLOGY 44
3.1. Sampling Time and Site 44
3.2 Detection of Chemical Parameters 44
3.3 Stable Isotopes 47
3.3.1 Nitrogen Isotopes 48
3.3.2 Sulphur Isotopes 50
3.3.3 Carbon Isotopes 51
3.3.4 Tritium Deuterium and Oxygen Isotopes 52
Chapter4: RESULTS AND DISCUSSION 55
4.1 General Hydrochemistry and Tritium 55
4.1.1. Springs and Fresh Water End Member 58
4.1.2. Wells of Wadi Qilt West 61

VIII
4.1.3. Wells of Wadi Qilt East 61
4.1.4. Wells of Wadi Nuwe’meh North 61
4.1.5. East Arab Project Wells 63
4.1.6. Overall Hydrochemical Conditions 63
4.1.7. Salinisation 64
4.1.7.1. Brackish Water Source 64
4.1.7.2. Evaporates and Rock Weathering 65
4.1.8. Anthropogenic Influences 66
4.2. Deuterium and Oxygen Isotopes 68
4.3. Nitrate and Nitrogen Isotopes 74
4.4. Sulphate and Sulphur Isotopes 80
4.5. Carbon Isotopes 86
4.6. Seasonal Variation 94
Chapter 5: GIS BASED HYDRSYSTEM MODEL 96
5.1 Introduction 96
5.1.1 GeoLib 98
5.1.2 MshLib 98
5.1.3 FEMLib 98
5.2 Model Setting 99
5.2.1 Aim of the model 99
5.2.2 GIS Project 100
5.2.2.1 The Layer Formation 101

IX
5.2.2.2 Wadis 102
5.2.2.3 Faults 102
5.2.2.4 Boreholes for Lithological Cross Section 103
5.2.2.5 Water Level 103
5.2.2.6 City Area 103
5.2.2.7 Abstraction Rate 103
5.2.2.8 Wells for Surface Topography 103
5.2.2.9 Sultan Irrigation Network 103
5.2.2.10 Study Area Surfaces 104
5.2.2.11 Interpolated Raster Map 105
5.3 Project Construction 107
5.3.1 Project Elements 107
5.3.1.1 Boundary Conditions 107
5.4 Creating GeoSys Project 111
5.5 Program Processing 114
5.6 First Simulation Results and Discussion 115
5.7 Visualising of Seasonal Variation Effect on Water Level 118
Chapter 6: SUMMARY, CONCLUSIONS AND RECOMMENDATIONS 123
References 130
Appendices

X
LIST OF FIGURES
Figure-1 Location map of the study area 3
Figure-2 Agricultural land near Jericho 4
Figure-3 Wadi Qilt general view 4
Figure-4 Eastern part of Wadi Nuwe’meh 5
Figure-5 Satellite image for the study area showing major land use 7
Figure-6 Monthly rainfall and evaporation in the study area 10
Figure-7 Average annual precipitation rate in Jordan Valley 11
Figure-8 General Geological map of the West Bank 14
Figure-9 Geological map of Jericho area 21
Figure-10 Generalized columnar geological section 22
Figure-11 Structural map for the study area 24
Figure-12 Groundwater basin and exposed aquifers in the West Bank 27
Figure-13 Schematic Hydrogeological cross section in the study area 30
Figure-14 Groundwater level of the Plio-Pleistocene Aquifer 32
Figure-15 Location map of the springs and wells in the study area 33
Figure-16 Chloride concentrations for Dyouk and Sultan Springs(1968-2004)37
Figure-17 Nitrate concentrations for Dyouk and Sultan Springs (1968-2004) 37
Figure-18 Chloride concentrations data from Jericho wells (1968-2004) 38
Figure-19 Nitrate concentrations data from Jericho wells (1968-2004) 39
Figure- 20 Major components of Lisan 41
Figure- 21 Hydrogeological setting of Jericho Aquifer 41
Figure- 22 Possible contaminant sources and surrounding activities 42
Figure- 23 Sampled wells and springs within different geological formations 45
Figure- 24 Collection of Nitrate in the field using resin column 49
Figure-25 Durov Plot diagram 58
Figure-26 Major anions and cations vs. TDS 59
Figure-27 Ions molar ratios 60
Figure-28 Saturation indices 62
Figure-29 K vs. Nitrate 66
Figure-30 Seasonal comparative trends for Deuterium and oxygen isotopes 71
Figure-31 Seasonal variation for Deuterium and oxygen isotopes 71
Figure-32 Isotopic signature of Deuterium and oxygen in dry season 72
Figure-33 Sr/Ca molar ration vs. O-18 73
Figure-34 O-18 vs. NO3/Cl molar ratio 73
Figure-35 N-15 vs. O-18 of Nitrate seasonal variation 77
Figure-36 Groundwater pollution by nitrate sources in Jericho 77

XI
Figure-37 N-15 vs. O-18 isotopic composition of major nitrate sources 78
Figure-38 N-15 vs. O-18 for the groundwater samples 78
Figure-39a, b 1/ [NO3] in mg/l vs. N-15 and O-18 79
Figure-40 Seasonal variation of the S-34 signatures 80
Figure-41 Seasonal variation of O-18 signature of SO4 80
Figure-42 The isotopic signature of sulphate in the groundwater samples 82
Figure-43 Chloride vs. SO4 in mg/l 84
Figure-44 S-34 vs. SO4 in mg/l 85
Figure-45 The main two sources of sulphate in the Jericho aquifer 86
Figure-46 Distribution of cations and anions from different sampling sites 88
Figure-47 The relative increase in HCO3 vs. SI- Calcite 90
Figure-48 SI- Calcite vs. pH 91
Figure-49 The increase of HCO3 vs. slight increase in dolomite 91
Figure-50 C-13 vs. HCO3 in mmol 92
Figure-51 Sr/CO3 vs Rb/CO3 molar ratios 94
Figure-52 C-13 vs. NO3/Ca molar ratio 94
Figure-53.GIS project for the study area 101
Figure-54 Model assumption based on the real lithological profile 102
Figure-55 Wells for the surface topography 104
Figure-56 Study area surfaces 105
Figure-57 Interpolation: raster map for the layers 106
Figure-58 Volumetric model showing initial heads in meters 108
Figure-59 Well data import from EXCEL 109
Figure-60 Digital elevation model of the top surface 110
Figure-61 Display volumes in Tecplot 112
Figure-62 Display prisms and triangulation result 113
Figure-63 Mapping result in Tecplot 114
Figure-64 Wells as geometric data 115
Figure-65 3D view for the hydraulic distribution of the first aquifer layer 116
Figure-66 Haydraulic head distribution at different situations 117
Figure-67 Monthly pumping rates from wells in Jericho 119
Figure-68 First visualized 3D water level under the normal conditions 119
Figure-69 Pumping effect after wet season 120
Figure-70 Pumping effect after dry season 120

XII
LIST OF TABLES __ Page
Table-1 Generalized stratigraphic column of the West Bank 16
Table-2 Generalized Geological columnar section for the Aquifers 28
Table-3 Analytical methods and detection limits for major ions 46
Table-4 Hydrochemical data from sampled Wells and spring in wet season 56
Table-5 Hydrochemical data from Wells and spring in dry season 57
Table-6 Deuterium and O-18 for the groundwater samples 69
Table-7 Nitrate concentration and isotopic signatures of Nitrate 75
Table-8 Sulphate concentrations and the isotopic signatures of sulphate 81
Table-9 Bicarbonate concentration and isotopic signatures of carbonate 87
Table-10 Estimated material Properties for Jericho aquifer 108

CHAPTER 1: INTRODUCTION, BACKGROUND AND PURPOSE OF THE STUDY
1.1. Aims and Scope
The Dead Sea is one of the world's unique geomorphologic features, and is located
within another of the world's great landforms: the Jordan Rift Valley. Unfortunately,
the Dead Sea is suffering from unsustainable exploitation of water and mineral
resources, which cause a dropping of the sea level at a rate of 80 cm to 1 m per year
(Salameh, 2000). In addition, sewage from urbanized areas, especially through land
use and touristic developments, is entering the Dead Sea via the Jordan River and
wadis. Collaborative approaches between the surrounded countries will be critical if
the continuing degradation of the Dead Sea and loss of its unique value is to be halted.
The implications of the Dead Sea on the whole Jordan valley resources and
environment were discussed in many meetings and conferences for the shared
countries. The groundwater resources in the surrounding area were deteriorated
noticeably in the last 50 years. Salts and TDS concentrations in the aquifer systems
along Jordan valley which was covered by Lake Lisan, the ancestor of the Dead Sea,
indicate a general trend of increasing salinity which reach its maximum in the lower
part of Jordan rift valley and threaten the groundwater resources and consequently the
stability of the whole system in the area. The Research Program for Water Resources
Evaluation in the Jordan Rift Basin is a project supported by the German Ministry of
Education and Research (BMBF). More than 12 institutions participate in the joint
research program and work together on one of the main issues in the Middle East
region: water resources.
This work is a part of a joint working group in the mentioned project and aims at
using different new chemical and isotopic techniques for tracing water quality and
possible contaminants at Jericho area catchments area in the lower part of the Jordan
rift valley, considering previous studies and explanations of the salinisation
mechanisms. The final expected output is to understand the sources and the
mechanism of salinity and its rout of entrance in the groundwater system. This concept
will help in constructing an integrative conceptual model for all the regional aquifer
into the rift valley, thus a further comprehensive idea about the salinisation problem
along the edges of the regional aquifers will be a good input tool in any flow model
that might be developed in the future.

1: Introduction 2 This research was held by UFZ-Environmental Research Centre in cooperation with
Karlsruhe University and the help of PHG-Palestine Hydrology Group.
1.2. Location and Major Features
Jericho, town in Palestine is located in the Jordan Valley, north of the Dead Sea and
west of the Jordan River (Fig. 1). From 1967-1996 Jericho was occupied and
administered by Israel. Since 1996 the Jericho become under the civil administration
of the Palestinian, but kept under the military control of the Israel.
The site of ancient Jericho is half a kilometre away from modern Jericho at a depth
of 250 metres below sea level. It lies at latitude 31 52 degrees north and longitude 35
39 degrees east.
The climate of the area is hot and dry in summer and mild in winter, supporting the
growth of such crops as dates, bananas, and citrus fruits. Most of Jericho's agricultural
land is irrigated by small private wells that provide water throughout the year; the city
draws its water for domestic use from an irrigation system originating at the Ayn as
Sultan Spring, which has supplied Jericho with water since ancient times. In addition
to agricultural activities, Jericho has a long-standing tourist industry.
Road traffic from Jerusalem and other cities in northern West Bank converges in
Jericho, and roads continue south to the Dead Sea and the Negev. Also traffic from the
Allenby Bridge crossing on the Jordanian border passes through Jericho as well.
Jericho is the site of the oldest settlement yet to be discovered, with significant
archaeological remains dating back as far as 8000BC. Located about 2 km (about 1
mi) from today's city centre, the settlement included a walled community and a high
tower. Additional findings from the period indicate that there was irrigated agriculture,
revealing the prehistoric shift from nomadic to settled forms of life.
The area of Jericho is considered as semi-arid , however, the area surrounded
Jericho contain several surface water flow that drained from the upper mountains of
Jerusalem and Ramallah through two main wadis, (Wadi Nuwe’meh and Wadi Qilt).
The last wadi (Fig. 3) is a natural protectorate, which has fantastic characteristics, it
also has historical characteristics, its environmental system represents the desert and
depression, it is considered as wetland region and filled of towering mountains and it
is full of springs which cover this region.

Fig. 1: Location map of the Study Area

1: Introduction 4
Thus the region considered as one of the most beautiful regions in Palestine at
which the water flows from the rocks and form small or large waterfalls that feed the
life aspects in Jerusalem wild region.
Fig. 2: Agricultural land near Jericho (photo by Stefan Geyer).
Fig. 3: Wadi Qilt general view.

1: Introduction 5
Wadi Nuwe’meh (Fig. 4) is located to the north western side of Jericho city. Wadi
region considered as wetland region and, it is also a protected and agricultural
grassland region. This wadi is featured by the existence of several springs in the
eastern part of it
Fig. 4: Eastern part of Wadi Nuwe’meh
The study area will be described in further details in the next chapters.
1.3. Land Use
Jericho district has a total area of 35,330 hectares (353,300 dunums). Five major land
use classes can be distinguished in the district. These are Palestinian built-up areas,
Israeli settlements, closed military areas and bases, nature reserves and cultivated
areas (Fig. 5). Of the total area, the Palestinian and Israeli built up areas occupy
approximately 1.7% and 1.5% respectively.
1.3.1. Palestinian built-up areas
There are seven Palestinian built-up areas in the district. The Jericho city is the only
municipality in the district, while Dyouk El-Tahta, Dyouk El-Fuka, Nuwe’meh, Al-
Auja are classified as villages. In addition there are Aqbat Jaber and Ein Al-Sultan
refugee camps (Fig. 5). These areas collectively account for approximately 591

1: Introduction 6
hectares. The Palestinian built-up areas are located on either alluvial and brown soils,
which are considered to be the most suitable soil for agricultural purposes in the
district, or loessial serozems soils which are covered with pasture plants.
1.3.2. Israeli settlements
There are 14 Israeli settlements in the district. These are Gilgal, Netiv Hagedud, Niran,
Yitav, Zori, Na'ma, Elisha', En Hogla, Bet Ha'erava, Lido Yehude, Atraqzia, Mizpe
Yeriho, Vered Yeriho and Almog. These settlements occupy approximately 517.4
hectares of land, and are located on different soil associations. Elisha', for example, is
found on alluvial arid brown soils, while Atraqzia is found on Solonchalks, which is
used for agricultural purposes if intensively managed.
1.3.3. Closed military areas and bases
Closed military areas take up approximately 5,844 hectares in the district. The Israeli
army claims these areas are of security importance and are used for military training
purposes. In addition, there are six military bases with a total area of approximately
265 hectares.
1.3.4. Nature Reserves
Currently, there are four declared nature reserves in the Jericho district with a total
area of about 1,965 hectares, mostly located within the declared closed military area in
the district (Fig. 5). Because of the Israeli government's history of confiscating land
through declaring an area a nature reserve, there is suspicion about the true Israeli
intentions and the environmental importance of the areas currently declared.
1.3.5. Cultivated Areas
The cultivated areas in the Jericho district cover approximately 2419.4 hectares. Due
to the limited rainfall combined with the hot weather, irrigated agriculture is dominant
in the district. The cultivated areas are concentrated in Jericho city, Dyouk, Nuwe’meh
and Al-Auja including the following major types of cultivation (Jericho Agricultural
Station, 1994):
1. Fruit trees: The cultivated fruit trees occupy an area of 771.1 hectares. Most
dominant are bananas and citrus covering an area of 560 and 136.9 hectares
respectively.

1: Introduction 7
2. Field crops and Forages: The total area of the cultivated field crops and forages
occupy approximately 144.5 hectares and include barley, wheat and sudan grass.
3. Vegetables: The total cultivated area amounts approximately to 1,504 hectares,
with 1,026 of the total area located at Jericho city and the rest distributed in
Dyouk, Nuwe’meh and Al-Auja villages. For more information about cultivated areas
see chapter five.
Fig. 5: Satellite image for the study area showing major land use.

1: Introduction 8
1.4. Population
The population of the Jericho district is estimated at around 25,500, representing
approximately 1% of the total population of Palestine. This number includes the two
refugee camps of Ein Al-Sultan and Aqbat Jaber. Jericho city is the only urban area in
the Jericho district and its population represents around 64.2% of the population. The
inhabitants of the refugee camps represent 22.5% while the inhabitants of the villages
represent 13.3% of the total population in the district (PBS, 1994). Population figures
for the year 2002 indicate that around 60% of Jericho city residents were between the
ages of 0-19, 22% are between 20-34 and 10% are between 35-54 (PBS, 2002). These
figures indicate that over than half of the population is dependent and lack self
reliance.
Infant mortality rates have been increasing since 1990, reaching in the West Bank
21 deaths per 1000 live births. Moreover, the life expectancy is approximately 72
years, and the birth rate was estimated at 44 births per 1000 in 1992 (Abu-Libdeh,
1993).
Approximately 68% of the working age population (16-59) in the district has jobs.
Out of this number, 46% is permanently employed, 49% has seasonal employment and
5% has part time employment (PARC & Arab Thought Forum, no. 5, 1994).
1.5. Soil
Despite the small size of West Bank, a variety of soils can be found. The major causes
of this variety are the extreme conditions which form these soils: climate, arid in the
east and wet in the mountainous ridge; variable geology: sedimentary rocks, sand
dunes, alluvium, etc., and different topographic circumstances: topography varying
from 400 masl at the western edge to 1000 masl at the mountain ridge to 410 masl at
the Dead Sea area. Also, physical weathering from both water and wind modifies the
soils.
According to ARIJ (1995), the main soil associations that cover Jericho area is
alluvial arid brown soil which is covers an area of about 6,470 hectares. It is exists
of alluvial fans and plains, formed as a result of erosion of calcareous silty and
clayey materials.

1: Introduction 9
1.6. Climate
1.6.1 Temperature and Wind
In general the climate of the whole Jordan valley is characterized by a hot dry summer
and warm low rain winter. Jericho area can be classified as an arid area, its location
along the feet of the mountains accompanying the Jordan Valley in the west protect it
from the cooler north western Mediterranean wind.
The temperature of the area varies from high temperature in the south that slightly
decreases further to the north. Typically, the temperature reaches its maximum in
August with an average of 38C°, while January considered as the coldest month in the
year with an average of 19C°. The total incoming radiation at the area is extremely
high, which make it a very suitable environment for irrigated and greenhouses
agriculture (ARIJ, 1995).
The area is affected by 2 winds directions allover the day, one that is mainly
coming from the Dead Sea in the morning hours with an average speed of 3 m/sec.
Then it turns gradually to a north west wind with an average speed of 5m/sec. The
maximum wind speed in the area is measured by ARIJ team, 1995 at 15m/sec in
spring time by this northwest winds.
1.6.2 Precipitation
The wet season in the area is starting by the end of October reaching its climax in
January and February. The precipitation in the area is characterized by the short
duration and the low amount.

1: Introduction 10
Fig. 6: Monthly rainfall and evaporation in the Jericho district for 1969-1992
According to the Jericho weather station, the mean annual precipitation in the
study area is approximately 120 mm/yr, of which approximately 60% falls in the three
months of December, January and February (Fig. 6). In general, the Jericho district has
the lowest rain in the region (Fig. 7) and short rainy season ranging between 20-25
rainy days per year (Israeli meteorological service, 1994).
The mean annual relative humidity reach about 50%, with the highest rates in
winter time that reach 75% and the lowest rate in summer that reach 5% when the
temperature is very high.
Accordingly, the evapotranspiration rate in the area is very high that reach 298 mm
in July when solar radiation reach its highest point. Normally, this highly evaporation
exceeds the precipitation during the year (Fig. 6), thus the agriculture in the area is
totally depending on the irrigation (ARIJ, 1995).

1: Introduction 11
Fig. 7: Average annual precipitation rate in mm in the Jordan valley Area (Fifth RTD Framework Program, Dead Sea Project, 2004).
1.7. Previous Investigations
Many previous studies identified the common sources of salinity and groundwater
deterioration in Jericho and vicinity. The common sources of this high salinity rate
was reported by Marie & Vengosh (2001), where they identified the in situ dissolution
of salts within the well from Lisan formation, the apprising of deep brackish water and
anthropogenic effluent as the 3 sources for this phenomenon.
Many other studies referred to the high Ca-Cl and Na-Cl water to the upconning of
deep-seated brine water along the fractures of the Rift Valley or to a current

1: Introduction 12
Mediterranean seawater Flux to the topographically low Rift Valley (Kafri & Arad,
1979).
Vengosh & Rosenthal, 1994 described two main type of the brine water as the main
cause of salinity in the region these are: Ca-chloride brine waters encountered in the
Jordan Dead Sea Rift Valley, in various parts of the Negev and of the Coastal Plain,
and Na-chloride saline water identified in the subsurface of the Negev and in the
southern part of the Coastal Plain. They found that the intensive exploitation of
groundwater in the area has disturbed the natural equilibrium which prevailed between
fresh and saline water. The newly established groundwater flow regimes have
facilitated the migration of saline water bodies, their participation in the active
hydrological cycle and the progressive contamination of fresh groundwater. These
processes which were not anticipated by planners and water resources managers
emphasize that large-scale groundwater exploitation was undertaken without giving
sufficient consideration to the occurrence and subsurface migration of saline water and
brines.
Geophysical surveys of groundwater in the Jericho area (Gropius & Klingbeil,
1999) have suggested that brine occupies the deepest part of the Pleistocene sediments
at a depth of ~80 m, and is overlain by less-saline groundwater. The chemistry of
groundwater in the Jericho area indeed reflects a mixture of these two water sources
(Marie & Vengosh, 2001). However up to now, no fixed data regarding the origin or
driving mechanisms of the saline water in many areas along the valley has been
identified. Also, Farber et al. (2003) conclude that the extensive irrigation over the
flood plains of the Jordan River enhances dissolution and leaching of sediments that
together with underlying brackish waters control the salt content of shallow
groundwater. However up to now, no fixed data regarding the origin, the share of
different sources, or driving mechanisms of the saline water in different areas along
the valley has been identified. Further details about the problem of Salinity and
groundwater deterioration with other anthropogenic contaminants as well as detailed
description of the study area will be described in the coming chapters.

Chapter 2: GEOLOGY AND HYDROGEOLOGY
2.1. General Overview
It forms an active part of the African-Syrian Rift, which extends for about 6000km,
from east Africa through the Red Sea, Wadi Araba, and Dead Sea, Jordan Valley to
south Turkey. Long time before the formation of the Dead Sea Rift, the movement of
the African plate including the Arabian plate to the north caused the formation of the
Syrian Arc Fold Belt, which was named by Krenkel (1924). The Syrian Arc formed in
two stages: the first in the Turonian-Maestrichtian and the second in the Oligocene
(Burdon, 1959; Bandel & Mikbel, 1985; Abed, 2000). It extends in S shape, from
Sinai through Palestine, Jordan to Syria. Two major tectonic events have shaped the
area of the West Bank. The Syrian Arc System folded up the shelf deposits at the end
of the Cretaceous Period and the Red Sea-Aqaba transform fault formed the Dead Sea
Graben from the Miocene (Krenkel, 1924; Rofe & Raffety, 1963 and Andrew, 2000).
The Afro-Arabian tectonic plate remained relatively stable from Precambrian to the
early Cretaceous. The Cretaceous period began with extensional faulting and
volcanism over part of the Levant countries and eastern Mediterranean, and terminated
in compression, inversion, folding and faulting processes, expressed in Israel and the
West Bank by the anticlines of the Syrian Arc (Krenkel 1924) and fault structures,
discerned by lateral thickness variations of the sedimentary section between nil and a
few hundred meters. The formation of the Syrian Arc, manifested in the reactivation of
the pre-existing faults, resulted in the inversion of the late Paleozoic-Turonian lows
and highs (Flexer et al. 1989).
From the late Eocene to Pliocene and recent times two stages of movement between
the African and Arabian plates took place (Girdler, 1983). The first stage detached the
Arabian Shield from the great African Shield in form of an extensional rift system, and
thus initiated the opening of the Red Sea. The second stage was caused by Ocean
spreading in the Gulf of Aden (Quennell, 1956; Gass, 1979; Bayer et al. 1988; Purser
& Hoetzl, 1988). It creates a northward movement of the Arabian plate along a left
lateral transform fault along Aqaba- Dead Sea- Jordan Valley, now called Dead Sea-
Jordan Rift system with pull- apart-basins and transpression zones. It was continued
more or less continuously the last 12 million years with a movement of about
9mm/year. The West Bank is thus located on the Sinai sub-plate to the west of the

2: Geology and Hydrogeology 14
fault. This fault system has a vertical, stepped component, forming the rhomb structure
pull-apart- basins in which the Dead Sea is located. This led to the lowering of the
base level of drainage and deposition of the runoff load (Rofe & Raffety 1963)
Fig. 8: General geological and structural map of the West Bank (modified after Abed Rabbo et al., 1999; Guttman & Zuckerman, 1995; and Qannam, 2000).

2: Geology and Hydrogeology 15
The Jordan Rift, the SSW-NNE Jerusalem (Judean) Anticline, and Nablus Syncline
dominate the structure of the West Bank, where Jerusalem Anticline expresses both
Surif (Hebron) and Ein Qiniya Anticlines. On the limbs of the Jerusalem anticline
there are a number of minor parallel or sub-parallel folds so that the structure can be
considered as an anticlinorium (Fig. 8). The Jerusalem Anticline is asymmetrical, with
a steeply dipping west limb (mean 30°) and a more gently dipping east limb (mean
15°), (Rofe & Raffety 1963).
2.2. Stratigraphy and lithology of the West Bank
Within the West Bank, the outcrops are predominantly carbonate sediments and rocks
of Tertiary and Cretaceous ages. Older rocks cannot be found at the surface though
they are known from the boreholes. The oldest exposed rocks belong to the Albian,
overlain by younger strata of the Cenomanian, Turonian, Senonian and Eocene,
exposed on both flanks of the anticlinal axis in the West Bank.
The exposed rocks (Fig. 8) of the West Bank are:
1. Albian - Lower Cretaceous formations comprising the regional West Bank
groundwater system (Beit Kahil, Yatta formations). The thickness of the
groundwater system in this area ranges from 500-970 meters.
2. Upper Cretaceous formations comprising the regional West Bank groundwater
system (Hebron, Bethlehem and Jerusalem formations). The thickness of the
groundwater system in this area ranges from 190-490 meters
3. Senonian age rocks (Abu Dis formation) are composed mainly of chalks and
marls. The thickness ranges between 0-450m
4. Pleistocene to Eocene rocks overlay the Senonian rocks in the Northern
and Northeastern area of the West Bank, the rocks are composed mainly of
limestone, chalky limestone, chalks, marls, and siltstone, which are of limited
5. extent and thickness
6. Unconsolidated, Quaternary alluvial sediments overlie the major rock
formations
The general stratigraphy of the West Bank and the Israeli and the Palestinian names
of the different geological formations in the West Bank as well as their lithology,
thickness and aquifer potentiality are described and illustrated in Table 1.

Table 1: Generalized stratigraphic column of the West Bank (modified after Braun & Hirsch, 1994; Millennium Engineering Group et al., 2000; Guttman, 2000; Guttman & Zuckerman, 1995; Bartov et al., 1988; and Qannam, 2000)

2: Geology and Hydrogeology 17
2.3. Geology and Stratigraphy of the Jericho Study Area
The Rift Valley faults are the major structure that affects the geology and hydrology of
the whole Rift Valley. The stratigraphy consists of carbonates, chert, chalk, gravels,
and sandstones and evaporates which range in age from the Triassic to Holocene age
in the east near the rift. The ancient Jurassic and Lower Cretaceous formations are
composed mainly of limestone, sandstones and marl layers. The youngest formations
are of Pleistocene to Holocene age (ARIJ, 1997). The following is a description of the
stratigraphy and the characteristics of the geological formations exposed in the study
area, it is based mainly on the studies of Guttman (2006), Guttman (2000), Qannam
(2000), Millennium Engineering Group et al. (2000), and Braun & Hirsch (1994) as
well as the generalized stratigraphic sequence of the West Bank that is shown in Table
1 and the geological map of the Geological Survey of Israel in Fig. 9 and 10.
2.3.1 Cretaceous Rocks
2.3.1.1 Aptian-Albian – Kobar Formation
According to the Israeli nomenclature, this formation is made-up of five sub
formations (Table 1): the Nabi Said, Ein Al Asad, Tammun, Ein Qiniya and Qatana. In
the area of study this formations of are not exposed. Ein Qiniya Formation is made-up
of layers of thin gray to brown, thin to middle grained limestone’s which contains iron
concretions and thin calcite veins. The limestone layers are inter-bedded with horizons
of marl, rich in fossils (Shakhnai 1969 and Millennium Engineering Group et al.
2000). On the other hand the Qatana Formation is composed of yellowish-brown-gray
limestone alternating with layers of yellow marls. The thickness of Ein Qiniya in these
outcrops is about 15 m according to Hirsch (1983), whereas Qatana reaches a
thickness of about 40 m (Hirsch, 1983; and Millennium Engineering Group et al.,
2000). The two formations are part of regional aquiclude, including the Tammun
Formation below them.
2.3.1.2 Albian - Lower Beit Kahil Formation
This formation represents the lower part of the upper Albian (Braun & Hirsch 1994). It
is also not exposed in the study area. It is built of two sub formations, Kefira and
Giva’t Yearim. Kefira, the lower part of this formation, is made-up of limestone with

2: Geology and Hydrogeology 18
thin layers of porous dolomite interchanging with marly limestone. Gray limestone
layers alternating with layers of shale and marl, are typical for the lower part of the
Kefira Formation. On the other hand, Giv’at Yearim, the upper part of the Lower Beit
Kahil Formation, is made-up of gray to brown dolomite with clayey and marly
limestone. The marly uppermost part of Ein Yorqe’am is equivalent to Moza marl
(Picard 1938). Generally, the Lower Beit Kahil is considered to be a moderate to good
aquifer, forming the lower part of the Albian aquifer.
2.3.1.3 Albian Upper Beit Kahil Formation
This formation is regarded as the upper part of the upper Albian. It has two sub
formations that are; Soreq and Kesalon (Kuke). The lower part of this formation
(Soreq) consists of porous dolomite, marly dolomite, marl and at times some chert.
The occurrence of the marl in this formation reduces its water bearing capability. On
the other hand, the upper part of this formation (Kesalon) mainly consists of brittle
dolomite and brittle limestone rich in fossils.
2.3.1.4 Cenomanian - Yatta Formation
The Lower Cenomanian Yatta Formation (Beit Meir (Kubm), En yorqe’am (Kuey)
and Moza formations in Israeli literature) overlies the Upper Beit Kahil Formation.
Beit Meir, 50-110 m thick, is composed of limestone, chalky limestone, dolomite,
marl and greenish clay at the bottom. Moza, 10-20 m thick, is composed of yellowish
marly limestone with traces of greenish marl at the bottom. The dolomite of the upper
part of Beit Meir shows some water bearing nature. Sometimes the limestone near the
top, officiates as a local perched aquifer, which explains why a few springs emerge 20
m below the contact of the Yatta Formation with the Hebron Formation (Rofe &
Raffety 1963).
2.3.1.5 Cenomanian - Hebron Formation
The Middle Cenomanian Hebron Formation, Aminadav (Kua) in the Israeli
terminology. This formation is exposed in a very small area to the west of Ein Sultan.
It is composed of brittle karistified gray dolomite, dolomitic limestone and gray
limestone. At its base it is formed of hard dolomite and dolomitic limestone with some
silicification. The lithology is uniform since dolomite and dolomitic limestone are
found throughout the sequence of Hebron Formation. The porosity of this Formation is

2: Geology and Hydrogeology 19
mainly secondary because the rocks are well jointed and karstified. The Hebron
Formation without doubt is the most important aquifer within the West Bank.
2.3.1.6 Cenomanian – Bethlehem Formation
The Upper Cenomanian Bethlehem Formation. This formation exposed in a small part
to the north western of the Jericho area, by the mountains foot. It is built of two
formations: Weradim (Kuw) as its upper part and Avnon (Kuav) as its lower part.
Avnon is made-up of limestone, chalky limestone and marl that act as a confining
aquiclude for the Hebron Formation beneath. The Weradim Formation is made-up of
hard dolomite with some limestone. Bethlehem Formation is frequently highly jointed
and fractured making this formation a good aquifer.
2.3.1.7 Turonian - Jerusalem Formation
This formation is of Turonian age. It is built of three formations (Derorim (Kua),
Shivta (Kush), and Nezer (Kun) formation according to Israeli terminology). In the
western and north western part of the study area only the formations of its upper part
Nezer and Shivta are exposed. Its lithology is characterized by karstified limestone
and dolomite with marl and clay mainly near the bottom. Sometimes occurrence of
chalk is evident on the top of this formation.
2.3.1.8 Senonian – Abu Dis Formation
This formation is part of Senonian age. It composed of Menuha (Kum), Mishash
(Kumi) and Ghareb (Kug) formations (Israeli nomenclatures). This Meshash
formation is mainly exposed in the western part of the Jericho district, near the Sultan
area. It consists of chalk and chert, the chalk usually white but in some areas dark
colored due to the presence of bituminous materials. In general chalk often appears to
be a fracture flow aquifer but because of its clayey nature it is considered as an
aquiclude. The formation is structurally cut by minor faults. According to ARIJ (1995)
the thickness of this formation ranges between 40 and 150 m.
2.3.2 Neogene and Quaternary
The Neogene and Quaternary successions are built mainly of marine and continental
clastic formations, marine and limnic chalk, evaporates and magmatic rocks
(Schulman, 1959). Alluvial formations are of Pleistocene, Holocene to Recent age.
These formations are limited mostly to the Jordan Rift Valley itself. The thickness

2: Geology and Hydrogeology 20
varies between a few hundreds of meters on the rift shoulders to a few thousands in
the deep depo-centers. The sequence is divided into two Groups: the Tiberias Group of
Neogene age at the base and the Dead Sea Group (or the Jordan Valley Group in
Jordan) of Plio-Pleistocene - Holocene age, at the top. The study area as a part of
lower Jordan valley is belonging to the second group. The main formations in this
group are:
2.3.2.1. Plio-Pleistocene formation
This formation composed of 3 sub-formations, these are:
1-Samra Formation: crops out along the western part of the Jordan Valley floor,
at the base of the marly cliffs lining the Jordan River. It was deposited as
marginal sediments along the Jordan Valley. The formation consists of
conglomerates, sandstones and silts and is subdivided into two members:
a) Coarse Clastic member (NQs (b)): which is form as a result of wadis fan
deposites and dominated in the western part of the study area, it consists of gravel
and conglomerate with a thickness that reach 35 meter.
b) Silt member (Qs (a)): this member exists further to east of the coarse clastic
member, it covers a large part of the study area and within Jericho city. It consist
of more fine particle of silt and clay with a thickness that reach 20 meter
The two members show interfingering relationships and both interfinger with the
Lisan Formation this formation cover the major part of the Jericho area west and
inside Jericho city. It includes three local faults of up to 3 kms. long with 35 m
thickness layer in certain unconformity.
2- Lisan formation (Qli): this formation is exposed in the eastern part of the
study area as well as the whole Jordan valley rift and the wadis. It consists
mainly of laminated aragonite-chalk, gypsum and clay with some sandstone
and pebble beds. The section contains hypersaline and brackish fauna. The
Lisan formation acts as an aquiclude.
2.3.2.2. Holocene formation
These formations comprise recent alluvial deposits in the wadis and associated
flood plains of ephemeral streams. These sediments found in the eastern part of
the study area lining and surrounding the Jordan River. In the study area this
formation have five members that varied in its lithology from one location to

2: Geology and Hydrogeology 21
another (Fig. 9 and 10), these members are consist of: conglomerate (Q1), Gravel
(Q2), Stream (Q3), Soil (Q4) and Sabha soil (Q5).
Fig. 9: A geological and structural map of Jericho Area -see legend in figure 10- (modified after the Geological Survey of Israel 1973; Hirsch 1983; and Rofe & Raffety 1963).

Fig. 10: Generalized columnar geological Section indicating various formations in the study area. (Modified from Geological Survey of Isreal, 1973)

2: Geology and Hydrogeology 23
2.4 Structural setting
2.4.1. Faults and Folds
The major structural element of the study area is the Jordan Dead Sea – Jordan Rift
system structure that was formed since the Miocene age during the last 12 mill. years
(section 2.1). There are evidences of younger faulting from the Pleistocene to the
present age. In upper crustal levels longitudinal strike-slip and normal faults are the
most prominent elements controlling the whole Dead Sea basin structure, but
transverse faults that extend across the basin are also important. This significant fault
in the study area is of SE NW trend, formed by a large pull-apart that formed between
the left stepping the study area of Jericho and Arava strike-slip faults that extend north
and south of the whole lower Jordan Rift, (Figs. 9 and 11, Quennell, 1958, 1959; Neev
& Hall, 1979; Garfunkel et al., 1981; Garfunkel, 1981; Kashai & Crocker, 1987;
Purser & Hoetzl, 1988; Ten Brink & Ben- Avraham, 1989). The pull-apart forms a
deep trough, mostly some 8 km wide, between the extensions of these major strike-slip
faults. These structures are embedded in a wider depression which comprises the
entire width of the transform valley, 13 to 17 km, and whose marginal zones, on the
two sides of the pull-apart, were shaped by gravitation normal faulting.
The western marginal zone, 4-5 km wide, extends from near the study area to the
Wadi Araba in the south and comprises several blocks down-faulted few kilometers.
Mesozoic sections drilled in these blocks confirm the pattern of facies changes and
erosive unconformities of the adjacent area on the west (which trend obliquely to the
transform). This proves that the marginal blocks were not displaced laterally, so that
transform motion took place east of them. The marginal zone east of the pull-apart is
quite narrow, often less than 2 km wide. Thus in cross section the whole Dead Sea
basin including the study area has an overall asymmetric structure, with its deepest
portion, comprising the pull-apart, being closer to the eastern border fault (Ben-
Avraham, 1992). This asymmetry is present all along the basin, and it is expressed in
the bathymetry of the Dead Sea.
A number of minor faults cut across the Rift, resulting in the separation between the
southern and northern basins. A step-fault structure can be identified mainly on the
western side of the study area . There are sets of faults facing away from the Rift to the
west and northwest of the area. The fault on the western side is normal and cuts some

2: Geology and Hydrogeology 24
structures surrounding the area such as the Buqei'a Syncline, the Auja Monocline, the
Mousa Syncline, Mar Saba Anticline, Hebron Anticline and Al Far’a Anticline. The
beds of the western side dip strongly towards the Rift. The mountainous region of the
West Bank (west of the study area) constitutes a relatively large symmetrical anticline,
on which secondary structures of different ages are formed. The principal fold
structures in this block are the Anabta, Al Far’a, Ramallah, Mar Saba, Hebron and
Bani Na'im Monoclines (Fig. 8). The axes of these structures trending north-northeast,
south southeast. Between these anticline structures, there are wide synclines such as
the Nablus-Beit Qad and Buqei'a Synclines. Fault structures are concentrated in the
area between Ramallah and the Hebron Monoclines. They trend east-west. On the
western margins of the Dead Sea, faults trend north-northwest, while the faults of the
Al Far’a and Malih Grabens trend northwest-southeast.
Fig. 11: Structural map for study area showing major faults, anticlines and synclines.

2: Geology and Hydrogeology 25
2.4.2 Joints
According to Rofe & Raffety (1963), the joints in the West Bank, part of which is the
Jericho lower Jordan valley area, are either a result of shrinking or the varying
competency of individual beds within a formation. The shrinking joints are supposed
to originate from the dolomitization of limestone, reduces the volume by about 12 %
(Pettijohn, 1957 & Schlumberger, 2002), that assist the occurrence of the fairly well
develop joints in the dolomite limestone of the Lower Beit Kahil, Hebron and
Jerusalem formations, all of which are wholly or partially dolomitic. On the other
hand, brittle beds of Yatta, Bethlehem and Jerusalem formations are highly jointed,
perhaps due to their brittleness, whereas the marly and chalky beds of these formations
are less affected.
2.4.3. Karstification
Generally, limestone’s and other soluble rocks at or near the surface that have been
modified by corrosive solution of limestone characterize karst regions. Surface sinks;
sparse streams, subsurface caverns and deep water tables are typical features in such
areas (Legrand & Stringfield 1973). Karstification is a result of the widening of the
joints and fractures, through the dissolution of the carbonate rocks, by CO2- rich
percolating water. As the solubility of the dolomite is less and slower than that of the
limestone, karst is less developed in the dolomite than in limestone and only minorly
developed in marl (Milanovic 1981). The dominance of the jointed and fractured
carbonates rocks, limestone and dolomite, in the West Bank suggests the possible
existence of karst caves. According to Arkin (1980), fractures and Karstification are
common features of the West Bank. In The study area there are several karst features
to be seen. Caves are common in the mountains, particularly in the Hebron-
Cenomanian formation to the west of the study area. The caves are also common
among the houses and they are used for animal keeping.
2.5. Hydrogeology
2.5.1. Hydrogeology of the West Bank The Following description of hydrogeology of the West Bank is based mainly on
(Qannam, 2000; PHG, 2003; and Guttman, 2006). Groundwater, derived from the
shallow and deep water bearing formations of the Mountain Aquifer, represents the
main source of domestic water in the entire West Bank. Based on the direction of

2: Geology and Hydrogeology 26
hydraulic drainage of the Mountain Aquifer, it was divided and named to three main
groundwater basins; Western, North-Eastern and Eastern Basin. The approximate
boundaries between the three basins are shown are Fig. 1 2. Only the Eastern Basin
lies entirely in the West Bank while the other two basins are shared with Israel. About
80-90 % of the recharge areas for the North-Eastern and Western basins lie within the
West Bank (WWS, 2002 and Libiszewski, 1995), but the groundwater flows
westwards towards the Mediterranean and northwards towards Bisan and Marj Ibn
Amer.
2.5.1.1. North-Eastern Basin
There are several estimates for the recharge and storage capacity of this basin.
According to Sturm et al. (1996) this basin has a total area of 700 km2 out of which
650 km2 are within the boundaries of the West Bank, while Elmusa (1996) estimated
500-590 km2. The dominant direction of water movement is northeastwards along the
plunge of Nablus-syncline. Different estimations for the safe yield of this basin are
assumed to be 130 Mill. m3/yr (Schwarz 1982), 140 Mill m3/yr (Gvirtzman 1994 and
Wolf 1995), and 145 Mill. m3/yr according to Oslo 2 Accords (1995). Out of this
yield the Palestinians use 25 Mill. m3/yr around Jenin and 17 Mill. m3/yr from east
Nablus springs, the rest is being utilized by the Israelis (Oslo 2 Accords 1995).
2.5.1.2. Western Basin (Yarkon-Taninim in Israel)
This basin has a recharge area of 1800 km2 of which 1400 km2 are in the West Bank,
whereas its storage area, about 2500 km2, lies almost completely in Israel (Sturm et al.
1996). Gvirtzman (1994) and Oslo 2 Accords (1995) estimated the potential yield of
this basin to be 360 Mill. m3/yr, while Wolf (1995) estimated it by 320 Mill. m3/yr.
According to Oslo 2 Accord (1995), the Palestinians use 20 Mill. m3/yr from wells in
addition to 2 Mill. m3/yr from springs near Nablus, while the rest is utilized by the
Israelis. The flow direction in this basin is westward towards the Mediterranean Sea.
Groundwater from this basin is discharged by the springs of Ras Al-Ayin (Rosh
Ha’ayen), which feeds Al-Auja (Yarqun) River and AlTimsah (Tanninim) springs.
2.5.1.3. Eastern Basin
The direction of the water flow of this basin is eastwards toward the Jordan River and
the Dead Sea. Naturally this basin is drained by several groups of springs in the West
Bank, whereas a small fraction of its water discharges into the Jordan River and the
Dead Sea and a negligible amount leaks to Israel. The recharge area of this basin

2: Geology and Hydrogeology 27
encompasses over 2200 km2 and the storage area over 2000 km2 (Gvirtzman, 1994).
This basin lies almost entirely in the West Bank. Estimates of the safe yield (or
extraction potential) of this basin are not well determined; 100 Mill. m3/yr (Elmusa
1996 and Gvirtzman 1994), 125 Mill. m3/yr (Wolf 1995) and 172 Mill. m3/yr (Oslo 2
Accords 1995). According to Oslo 2 Accords (1995), the 172 Mill. m3/yr is shared as
follows: 24 Mill. m3/yr utilized by the Palestinians from wells, 30 Mill. m3/yr utilized
by the Palestinians from springs, 40 Mill. m3/yr used by the Israelis and 78 Mill.
m3/yr to be developed in the future. According to the surface and subsurface
hydrological divisions of the West Bank, Jericho area is part of the Jerusalem
Ramallah sub-basin and accordingly part of the Eastern Basin (Fig. 1 2).
Fig. 12: Groundwater basins and exposed aquifers in the West Bank / Palestine (modified after ARIJ 1995 and Husary et al. 1996).

Table 2: Generalzed Geological coulomnar section indicating the aquifere characteristics of various formation in the study area (modified after Marie, 2001)
Period Age Group Formation name Thickness
(m) Simplified Lithology
classification
Palestinian Israeli 200-300 ConglomeatesLisan Lisan sandstone
Aquifer/ Aquiclude Quaternary Pliocene-Pliestocene Dead Sea
Samra Samra and clay Taqiye Ghareb Mishash Senonian-Paleocene Mt.
Scopus Abu Dis
Menuha
100-300 Chalk Aquiclude
Nezer Limestone Shivta Limestone Turonian
Derorim Marl Jerusalem
Weradim Dolomite Betlehem Kefar Shaul Limestone Upper Hebron Amendav
200-300
Dolomite
Aquifer
Yatta
Moza/Ein Yorqe'am, Beit
Meir
Marl Aquiqluse
Kisalon Dolomite Upper Biet Kahil Soreq Dolomie and
Marl
Upper Cretaceous
Cenomanian
Lower
Givat Ye'arim Dolomite Lower Biet
Kahil Kefira
200-270
Marly Limestone
Aquifer
Qatana Qatana Marl Ein Qinya Ein Qinya Marly Limestone
Lower Cretaceous Albian
Judea
Tamun Tamun Marl AquilqludeAquitard

2: Geology and Hydrogeology 29
2.5.2. Hydrogeology of Jericho Area
2.5.2.1 Regional Aquifers
The aquifer potentiality of the geological formations of the Jericho area as well as
Jerusalem Ramallah sub-basin is represented in Table 2. The whole sub-basin is
mainly fed by inflows of excess water from the surface runoff across the wadis and the
neighboring aquifers, namely the lower Cretaceous Kurnub sandstone aquifer and the
Albian to Turonian limestone and dolomite aquifer, also known as the lower and upper
aquifer. The annual precipitation amount in the main recharge zones for the aquifer in
Jerusalem and Ramallah mountains is about 540mm (Marie, 2001). The main local
aquifer systems in the study area are (Fig. 13):
2.5.2.1.1. The upper Cretaceous carbonate aquifer: this aquifer is of Cenomanian to
Turonian age. Composed of karstified rocks, and characteristic of the aquifer
system and represent one of the most important water resources in the region. The
thickness of the upper Cretaceous aquifer ranges between 170m in the western part
of the study area and 200m in the upper Jerusalem area. The aquifer is divided into
two sub-aquifers. A lower confined sub-aquifer includes the Kefira and the Givat
Yearim Formations [Lower Beit Kahil Fm.] and an upper sub-aquifer that includes
the Aminadav [Hebron Fm.], Veradim [Bet-Lehem Fm.] and Bina Formations
[Jerusalem Fm.] (Table2). The outlets of this sub-aquifer are in the Jericho springs
and Wadi Qilt Springs and Wadi Nuwe’meh Springs in the lower part of Wadi
Makuk, close to the Jericho Fault.
2.5.2.1.2. The Jordan Valley deposits [Dead Sea Group:] Two Dead Sea group
aquifers are located in the Jericho area these are:
a) The Holocene or sub-recent Alluvial aquifer: is distributed mainly in the Jordan
Valley and neighboring areas. It is built up of sub-recent terrigenous deposits
formed along the outlets of major wadis. These alluvial fans are still under
accumulation after large floods and consist of debris from all neighboring
lithologies and are deposited according to their transport energy. The transport
normally takes place along alternating channels. Thus permeable horizons alternate
with impermeable lithologies within the deposits. The total thickness is maximum
near the rift margins can reach up to high values, thinning out towards the centre of

2: Geology and Hydrogeology 30
the rift basin. The alluvial aquifer often directly overlies the Pleistocene gravel
aquifer and by that is hydraulically interconnected with this aquifer.
b) Pleistocene Lisan Samra aquifer: This includes three members [Samra coarse
clastic, Samra silt and Lisan] of the Pleistocene Samra aquifer are a lateral facies
succession from terrestrial/fluvial, to deltaic/limnic and limnic/brackish lake
environments. They reflect the Pleistocene depositional conditions of the Lisan
Lake. Lisan, the marl, gypsum and silt lacustrine unit is generally considered an
aquiclude, void of exploitable water. It is distributed mainly towards the middle of
the graben. Samra formation consists of two members: A silt member underlying
or interfingering with Lisan and a coarse clastic member further to the West that
predominantly consists of gravel, interbedded with clay, sand and marl horizons.
The natural recharge by rain is almost negligible. Therefore, the aquifer is mainly
fed by inflows of excess water from neighboring aquifers, namely the lower
Cretaceous Kurnub sandstone aquifer and the Albian to Turonian limestone and
dolomite aquifer, also know as the lower and upper aquifer and from runoff in the
wadis on the Eastern slopes of the West Bank. The aquifer supplies agriculture in
the Jordan Valley between Jericho and Fari’a Graben.
Fig. 13: Schematic hydrogeological cross section in the study area. Modified from (Exact, 2000 and Rosenthal, 1978).

2: Geology and Hydrogeology 31
2.5.2.1.3. Hydraulic separation between the two aquifers
In the west of the Jericho , faulted blocks of the impermeable Senonian chalk (Mt.
Scopus group in Israeli literature) prevent lateral flow of groundwater from the Upper
Cretaceous aquifer to the Plio-Pleistocene shallow aquifer system (Golani, 1972).
However, the water from the Upper Cretaceous aquifer leak into the Plio-Pleistocene
aquifer along the Dead Sea (Yechieli et al. 1995).
2.5.2.1.4. Perched water tables of the Cenomanian-Turonian aquifer
The water level along Ramallah anticlinal axes is about +450 m and declines eastward
in the direction of the Jericho area to level about -300 and -350 in the lower and upper
sub-aquifer. This large decline is a result of the long distance between the recharge
area and the wells, the gradient and the permeability. These wells also react to
fluctuation of replenishment. The water levels raised 2 - 2.5 years after the very rainy
year 1992.
2.5.2.1.5. Perched water table of Pleistocene aquifer
The Plio-Pleistocene aquifer shows piesometric level variation between -300 to -337
(Fig. 1 4, Marie, 1997). The groundwater flow from west to east and also toward
southeast. Water level show general decrease toward east. The changes in aquifer
hydraulic properties from west to east, as well as the high abstraction rate are the main
results for the decline in the groundwater level.
2.5.2.5. Wells
A large number of active boreholes have been drilled in the study area (Fig. 15),
mostly at two locations. The first location is located along the foothills and on the
mountain tops exploit water from the Regional upper Cretaceous Aquifers. The wells
tap water from the calcareous aquifers and are characterized by low to moderate
discharge [100-300 m3/h] and by deep static water levels (Guttman, 2006). These
wells are located close to the recharge area and suffer from large water level
fluctuation that sometimes [especially during drought periods] influence their
discharge. The water is characterized by low salinity. The second group of wells is
located in the Jordan Valley abstract water from the Jordan Valley deposits. The wells
are shallower than the first group. The average depth is around 100 meter. Their
discharge is also smaller than the discharge of the first group and is only some tens of
cubic meters /hr (ARIJ, 1995). The Jordan Valley deposits receive water from

2: Geology and Hydrogeology 32
different sources such as lateral flows from the surrounding mountainous aquifers,
infiltration of precipitation and flood water, irrigation return flows and ascending of
saline water from deep aquifers. Therefore, the groundwater in the Jordan Valley
deposit contains saline water. As mentioned in previous section, the water level
dropped and these saline water flows towards the pumped wells raising the salinity of
the water (Guttman, 2006).
Fig. 14: Groundwater level of the Plio-Pleistocene Aquifer (Marie, 1997).
2.5.2.6 Springs
The springs in the study area (Fig. 15) are discharges from the upper Cretaceous
aquifer. The springs are strongly related to the Auja Monocline, NW-SE trending rift
faults and joints, where the faults and joints may represent a zone of higher
permeability and consequently preferred flow of the groundwater which is tapped by
an old caustic shaft in the wadi bottom, which now forms the spring outlet (WOLFER
1998). All of the springs discharge fresh water with 8 to 14meq/l total dissolved ions.

2: Geology and Hydrogeology 33
According to their geographic distribution and discharge behavior, the springs in the
study area can be divided into two groups:
1- The Eastern Slope springs of Wadi Qilt (Ein Qilt, Ein Fawwar, Ein Fara,): this
group of springs is located in Wadi Qilt and its tributaries. These wadis are
deeply incised canyons and only here the Turonian aquifer is exposed and
spring outflow occurs. The springs discharging in this area are characterized
by an immediate response to precipitation and a highly fluctuating discharge
pattern.
Fig. 15: Location map of springs and wells in the study area. The Cenomanian mountain aquifer wells are located to the west of the Jericho fault whereas the Pleistocene well further to the east inside Jericho plain.
2- Jordan Valley springs: The springs located in the Jordan Valley are related to
the Samia Fault (Duyuk Spring, Nuwe’meh Spring and Shosha Spring) or to a
NW-SE trending Rift faults (Ein El Sultan). Due to various step faults close to
the Jordan Valley the base of the Uppermost Aquifer is exposed. These
springs discharge at a constant rate. The fluctuations in the discharge pattern

2: Geology and Hydrogeology 34
depend on the precipitation rate in the recharge zone (WOLFER 1998). The
main springs of this group are described as follow:
a) Sultan Spring: Sultan is located 2km NW of Jericho and discharges at
an elevation of -215m a.s.l. The spring was used for 10,000 years for
domestic water supply of Jericho. The outflow of the spring is
structurally controlled by a large SW-NE trending normal fault
postulated by WOLFER (1998) and the spring can be classified as a
fault spring. The mean annual discharge of Ein El Sultan is
ca.5, 600,000m³/year (ARIJ 1995, Israeli Hydrological Survey data
base).
b) Duyuk Spring, Nuwe’meh Spring and Shosha Spring: discharges at
the margin of the Eastern Slopes 3.7km NW of Ein Sultan. The
system consists of three springs emerging at -110m a.s.l (Toll et al.,
2006). The outflow of these is collected in a concrete channel and
water is used by farmers for irrigation purposes. The average annual
discharge of Duyuk spring is 5,000,000 m3/year, while the average
annual discharge for Nuwe’meh spring is ca. 2,700,000 m3/year and
for Shosha is about 668,000 m3/year (Israeli Hydrological Survey).
2.6. History of Hydrogeochemistry in the Study Area
2.6.1. The history saline waters formation in the Jordan Rift Valley
In the study area, during several major phases of the geological history, brines were
formed which endanger all groundwater reservoirs of the Dead Sea-Jordan Rift
system. During the Late Proterozoic-Early Cambrian, a major evaporative phase
occurred in the Middle East (Stoecklin 1968). Later, the Triassic was characterized by
large-scale marine oscillations and due to alternations of normal shelf and intertidal
hypersaline to brackish environments; thick layers of Upper Triassic gypsum [and
locally of halite] were laid down both west- and east of the present-day Jordan River
(Zak, 1963; Bandel and Khoury, 1981). During the Mio-Pliocene, brines were mainly
generated by the post-Messinian ingression of seawater which dissolved evaporites
previously deposited on the dried-up Mediterranean Sea bed and in the erosive
channels incised into the adjoining coastal areas (Rosenthal et al., 1999). During the

2: Geology and Hydrogeology 35
Pleistocene, fluvio-lacustrine conditions prevailed in the Jordan Valley and the fresh
water Samra Lake developed. This lake became progressively saline, probably as the
result of dissolution and flushing of salts from the previous hypersaline Sdom Sea
(Picard, 1943) resulting in the saline Lisan Lake. From the Pleistocene onwards, the
Lisan Lake became more and more saline by evaporation and by subsequent flushing
of evaporites. At present, the remnant of this period is the Dead Sea. Thus, during four
major periods, the rock sequences were flushed of previously formed brines and
evaporites and were made ready for the following generations of liquids.
The following major scenarios of brine formation and of salinisation of
groundwater’s are considered (Rosenthal, 2006):
1. Seawater penetrated from the Mediterranean Sea into the Rift, and was
subsequently confined (Mazor and Mero, 1969; Kafri and Arad, 1979; Gat et al.,
1969). The later up flow of brines was assumed to be controlled by the movement
of blocks as a result of tectonic processes. Bergelson et al. (1999) outlined a
schematic hydrochemical evolution of the saline springs in the region of Lake
Tiberias according to which seawater was evaporated to generate an “original
brine”, which was later diluted to yield the “Sea of Galilee brine”. It was suggested
that the “original brine” is represented by the thermo saline springs of Tiberias. The
groundwater’s emerging in the springs of Fuliya and Tabgha were assumed to be
dilution products of the “Sea of Galilee brine”.
2. The Mg-rich brines, emerging from the springs along the western shore of the Dead
Sea were thought to represent residual brines derived from evaporated Pliocene
seawater which was trapped in the primordial Sdom depression within the Rift
(Rosenthal, 1988; Starinsky, 1974). The Ca-chloride composition of these brines
was attained by subsequent dolomitization of limestone and became confined and
pressurized in an unexplained manner. Ca-chloride brine is known from a thick
sequence of evaporites in wildcat well Zemah 1 located close to the southern shores
of the Lake (Simon and Mero, 1992). Based on δ11B studies, Vengosh et al. (1994)
considered these Rift brines as the main source of salts in the contemporary Dead
Sea water.
3. Ablation of post-halite evaporites which were identified in the rock-sequence
penetrated by borehole Zemah 1 (Flexer et al., 2000). There is geological and
geophysical evidence for the existence of similar evaporite bodies at other places

2: Geology and Hydrogeology 36
along the Rift. Considering evidence as to the presence of bittern salts (Bender,
1974; Raab, 1998), ablation of such bodies creates Mg-rich brines such as
encountered along the eastern and southern shore of Lake Tiberias. The Ca-rich
brines encountered along the western littoral of Lake Tiberias and elsewhere in the
Rift, could be the result of Mg removal by dolomitization.
4. Mixing of two different evaporation brines of seawater was proposed by Klein-Ben
David et al. (2004). In their dual-mode evaporation scenario, the salinity of one end
member was controlled by the rates of inflow and outflow of seawater. The second
end member was generated, when evaporative loss exceeded the inflow of seawater.
When the total evaporation rate from the surface of the shrinking water body
equalled seawater supply, the mixing process came to a halt.
2.6.2. Hydrochemical data from Jericho area in the previous three decades.
Along the last three decades, the main significant groundwater quality problems in the
area were the increase of salinity and nitrate. These two problems vary according to
the aquifer type and the activities surrounding the pumping well. The springs to the
west still have relatively higher quality than the groundwater from the wells in the
east. Although, along the past years until these days these wells and springs were
subjected to various fluctuated content of pollutants, this fluctuation depend on several
factors like the annual precipitation rate for each year, the annual pumping rate, the
season of the groundwater sampling and the activities surround the well.
2.6.2.1. Springs:
The springs show relatively steady fluctuated trends of chloride (Fig. 1 6). In the last
three years these trends show a slight increase in salinity. The springs show also an
increase in nitrate trend which show the high significant values in the last five years
(Fig. 1 7). Dyouk spring locate within a populated area of Bedouins with their animals
and agricultural activities, while Sultan spring is locate directly in between populated
area, tourism and agricultural activities.

2: Geology and Hydrogeology 37
0,0
10,0
20,0
30,0
40,0
50,0
60,0
19681970
19721974
19761978
19801982
19841986
19881991
19931995
1999sh 2003
Year
[Cl]
in m
g/l
Ein DyoukEin Sultan
Fig. 16: Chloride concentration for the Dyouk and Sultan springs during the period 1968 to 2004 (PWA, 2004).
0,0
10,0
20,0
30,0
40,0
50,0
60,0
1982
1983
1984
1985
1986
1988
1989
1991
1992
1993
1994
1995
1998sh
1999s
h
2000sh
2003
2004
Year
[NO
3] m
g/l
Ein DyoukEin Sultan
Fig. 17: Nitrate concentration for the Dyouk and Sultan springs during the period 1968 to 2004 (PWA, 2004).

2: Geology and Hydrogeology 38
2.6.2.2. Wells:
There are nearly 61 shallow borehole distributed within Jericho plan area. These wells
are undergoes various salinisation processes which will be discussed later on. The
salinity increased in the area significantly within the last years especially in the wells
of Arab Project (Musa Alami) in the east (Fig. 1 8) where salinity reach it maximum
values. The nitrate also shows such significant increase for nearly most of the wells
(Fig. 19). This increase was varied according to well location and has no trend like in
chloride content. The sources and mechanisms of salinisation and pollution by nitrate
will be discussed later in this report.
0
200
400
600
800
1000
1200
1400
1600
1800
2000
1989 1991 1992 1993 1995 1997 2003 2004
Year
[Cl]
mg/
l
Musa Alami 66
Awni Hijazi 52
Fahed Hismeh 15
Fahmi Nahas 47
Basil Huissieni 18
Basil Huissieni 20
Sa'id Allaeddin 62
Mussah A'lami 1 67
Fig. 18: Chloride concentration in the groundwater samples from some wells in Jericho area during the period 1989 to 2004 (PWA, 2004).

2: Geology and Hydrogeology 39
Fig. 19: Nitrate concentration in the groundwater samples from some wells in Jericho area during the period 1989 to 2004 (PWA, 2004).
2.6.3 Description for the groundwater quality deterioration problem in Jericho area
2.6.3.1. Salinity In general, the Lisan formation is a major source of soil and water salinity in the
Jordan Valley. The permeability of the Lisan formation is in general very low and
considered as an aquiclude. However, because of a laminated structure of alternative
marl and gravel layers, of embedded sand and silt beds up to 30 cm, and of evaporitic
materials as gypsum and other salts (Fig. 2 0), an extended network of pathways for
water has been formed resulting in higher porosity and permeability (Salameh, 2002).
Moreover, the Lisan and Samra formation is horizontally interfingering along the
Jericho aquifer system.
The transmission properties show that the aquifer varies from low potential (less
than 10m2/day) to fair potential (between 10 and 50m2/day) (Aliewi et al., 2001). The
shallow aquifer consisting of alternating marl and gravel layers and in direct contact

2: Geology and Hydrogeology 40
with the Lisan layers, receives Lisan leachate water which leads to increase in their
salinity. The steep dip of the aquifers along the Jordan Valley has caused deep
circulation of the recharging groundwater bringing it into contact with the salty
formations at depth. Some water confined with the thin compact lime stones lenses
which surrounded with the layers of tiny valved marl and shales, this water keep in
contact with gypsum and halite salts for long period of time and finally resulting in
high saline and relatively old water or (Evolved Connate Water). Recent drilling in the
Pleistocene aquifer has shown that salinity increases with depth in which finer
formation of Samra are present. Salinity data obtained from one well in Jericho shows
that the chloride content increases from 380mg/l at 30m depth to over 2000mg/l at
162m depth.
The other possible sources of the salinity may originate from flushing of soluble
salts from the soil zone by excess of irrigation water (Eliewi et al., 2001).
Fig. 21 shows the fresh water/saline water interaction in Jericho eastern wells. The
water quality in the aquifer becomes deteriorated due to the encroachment of saline
water which welled up from the previous mentioned confined fringes and lenses of the
alluvial fans into the heavily pumped areas and this has led eventually to the
abandonment of several wells in the Jordan Valley. Owing to the heavy pumping in
the Jordan Valley a considerable decline of water table levels has been observed. The
principle result is an increase of groundwater salinity (Marie, 2001). It has been
observed that high chloride concentrations prevail in the heavy pumping areas (1000–
2000 mg/l), whereas sulphate shows values between (200->300 mg/l).

2: Geology and Hydrogeology 41
Much lower concentrations are seen in the areas near the wadis. At distance from
the heavy pumping areas the salinity was measured at 500–1000 mg/l.
Fig. 21: Hydrogeological setting of Jericho Aquifer (Eliewi et al., 2001).
Fig. 20: Major component of Lisan formation (Landmann, 2001).

2: Geology and Hydrogeology 42
In this study, sulphur and oxygen isotope analyses of dissolved sulphates are used
to assess the role of Lisan evaporates in the salinisation process by tracing the
groundwater sulphate sources according to their isotopic composition.
2.6.3.2. Anthropogenic pollutants The shallow Pleistocene aquifer in the area is subjected to many potential hazardous
pollutants, which are mainly, of anthropogenic origins.
Often water pollution is associated with images of point source pollution like oil
spills or raw sewage and toxic chemicals spewing from pipes at industrial facilities
and sewage systems. Although point source discharges still produce some pollution,
most of them are controlled by imposing specific permit conditions. The lack of such
rules in the area make it an open yard to all kind of hazardous and anthropogenic
pollutants, where open dumping sites, illegal waste water collection facilities and
septic tanks are widely distributed within an area (Fig. 2).
Fig. 22: The study area and possible sources of contamination from the surrounding activities.
0 2 Kilometers
N

2: Geology and Hydrogeology 43
Non-point sources deliver pollutants to water-bodies in a dispersed manner rather than
from a discrete pipe or other conveyance. Non-point sources include atmospheric
deposition, contaminated sediments, and many land activities that generate polluted
runoff and leaching, such as agriculture (pesticides and fertilisers), logging, and onsite
sewage disposal. Less frequently cited sources include atmospheric deposition, in-
place contaminants, and natural sources. In Jericho area a lot of polluted activities are
noticed. The used of huge and unaccountable amount of fertilizers in agriculture is
widely common in the area. No restrictions or monitoring system is adopted in these
chemical uses. The other main type of pollution in the study area is this of septic
origin. Jericho populated area is suffering from lack of good sanitary system and most
of the houses in the area still using a septic tank for sewage disposal. The raising in
nitrate level in the groundwater from the study area might be an indication of such
pollution to be occurring.
In this study, these potential sources and the other point and non-point sources in
the area will be traced using different isotopic and Hydrochemical tracers.

CHAPTER 3: METHODOLOGY
3.1. Sampling time and site
The plan of groundwater sampling and selection of the samples sites was based on
providing a supplement analyses for tracers which had not been previously used in the
study area to characterize chemical and isotopic signature of both fresh and saline
groundwater and its variation with location.
Two times sampling of 21 water samples from springs and wells were collected, the
first time at the end of October/2003 (dry season) and the second time at the end of
March/2004 (wet season). Two water samples are belonging to the Sultan and Dyouk
springs in the western and north western side of the study area, in addition to one
closed well. Two wells are located to the north of the study area within alluvial Samra
formation of Wadi Nuwe’meh, 10 wells are distributed along Wadi Qilt (5 west of the
wadi and 5 east of the wadi), while the rest of the wells locate more to the east of the
area. Sampling localities are shown in Fig. 23.
3.2. Determination of Chemical Parameters
Onsite measurements for physicochemical parameters (pH, temperature, m-value and
redox potential) were done. All the samples were tested for the Cations and Anions as
well as for some trace elements. The samples were filtered with 0, 45+0, 2 µm
Cellulose-Acetate-Filters and filled in 2x 60 ml HDPE bottles (cations and anions). In
order to stabilizing the anion and cations were acidified using HgCl2 for prolonged
preservation of nitrate. The Mercury Chloride is highly dissolve in water, the chemical
formula for the reaction of Mercury Chloride in water is given as:
HgCl2 + H2O ⇔HgO + 2HCl (1)
The Hydrochloric acid, keep the water sample in acidic media, thus prevent any
bacterial growth. Moreover, the resulted inorganic mercury has been reported to have
effects at concentrations of the metal in the bacterial culture medium of 5 µg/liter.
Therefore, Mercuric chloride is used as a topical antiseptic or disinfectant agent.
Mercury is bound to the cell walls or cell membranes of microorganisms, apparently
to a limited number of binding sites. This means that effects are related to cell density
as well as to the concentration of mercury in the substrate.

Fig. 23: Map of the study area in Jericho and its vicinity, shown are the sampled wells and springs within different geological formations.

2: Methodology 46
Table 3: Illustration for the analytical methods, and detection limits.
Messgröße Methode/Technik RSA* [%]
Detection limits [mg/l]
Ca2+ ICP-AES+ ≤1 0,03 Mg2+ ICP-AES ≤1 0,04 K+ ICP-AES ≤1 0,3 Na+ ICP-AES ≤1 0,4 Mn
(II,IV,VI,VII) ICP-MS# ≤5 0,05
Fe (II,III) ICP-AES ≤5 0,05 B3+ ICP-AES ≤1 0,04 NH4
+ Photometrie ≤2 0,01 Ba2+ ICP-AES ≤1 0,01 Sr2+ ICP-AES ≤1 0,01 Si4+ ICP-AES ≤1 0,09 Cl- IC$ ≤1 0,07 SO4
2- IC ≤1 0,12 HCO3
- Titration Br- IC ≤1 0,18 NO3
- IC ≤1 0,12 NO2
- IC ≤1 0,05 PO4
2- (P2O5) Photometrie ≤1 0,05 Rb+ ICP-MS ≤4 6
+ICP-AES: Inuctive-Coupled-Atom Emission spectroscopy #ICP-MS: Inuctive-Coupled-Mass spectroscopy $IC: Ions chromatography *RSA: relative Standartabweichung (Die RSA ist abhängig von der spezifischen
Elementkonzentration in der Wasserprobe. Mit zunehmender Annäherung an die Elementspezifische Nachweisgrenze (RSA>33%) wird die RSA geräteunabhängig mit <10% angegeben.)
ICP-AES: Insofern die Konzentration der Einzelelemente oberhalb des mittleren Konzentrationsbereiches der ICP-AES liegt, wird die Probe soweit verdünnt, dass die Konzentration sich innerhalb dieses Bereiches befindet. Die RSA beträgt 0,5-1%.
ICP-MS: IC: Bei IC-Messungen beträgt die RSA ≤2%. [Quelle: persönliche Kommunikation mit Dr. Wennrich (2005): Departmentleiter Analytik
UFZ Leipzig-Halle GmbH]
These effects are often irreversible, and mercury at low concentrations represents a
major hazard to microorganisms (Komura et al., 1971).
Because samples were collected in the agricultural seasons all the sampled wells were in operation for a long period, thus no further water purging was necessary before sampling, and the samples were collected immediately. The collected samples then were kept and cooled until measurement. The concentration of cations were measured using Indutive Coupled Plasma – Atom adsorption spectrometry (ICP-AES) and for Anions using Ions chromatography (IC) at the UFZ Department for Analysis in Leipzig (Table 1).

2: Methodology 47
3.3. Stable Isotopes
Isotopes of an element have the same number of protons but a different number of
neutrons. Elements have predominant isotopes and less abundant isotopes. The
standard notation for identifying different isotopes is to write the sum number of
protons and neutrons in the upper left corner of the symbol of the element. The term
stable isotopes simply refer to isotopes that are no radioactive forms of an element.
The ratio of the heavier isotopes to that of the lighter isotopes in a substance can
provide useful information because the slight differences in the mass of the isotopes
cause slight differences in their behaviors.
Stable isotopes are measured as the ratio compared with the most abundant isotope
of a given element. Isotope ratios are quantified as δ values in which
δ = [(RSAMPLE-RSTANDARD)/RSTANDARD] 1000‰ (2)
R is defined as D/H for δ D values and 18O/16O for δ 18O values. These δ values are
relative in nature and represent the positive or negative deviation from the reference
standard material for each element, each of the elements has its own reference
standard, which in this study was as follow (Clark and Fritz, 1997):
- Stable isotopes of (18O/16O) Vienna Standard Mean Ocean Water (VSMOW).
- Stable isotopes (13C/12C) Pee Dee Belemnite (VPDB).
-Stable isotopes of nitrogen (15N/14N) atmospheric nitrogen.
- Stable isotopes of sulphur (34S/32S) Canyon Diablo Troilite standard (VCDT).
Values are expressed as δ-value as part per thousand or per mil (‰) difference
from the standard reference.
For example, if δ X value of +10 per mil means that it has 10 parts per thousand
(one percent) more δ X than the standard reference. Positive δ values are said to be
“enriched” or “heavy”, while a negative δ values are said to be “depleted” or “light”.
Several steps in the element cycle and transfer actions of the element in nature can
modify the stable isotope composition in different chemical compounds. These
changes, called fractionation, occur as a result of physical and chemical reactions.

2: Methodology 48
Isotopic effects (caused by slight differences in the mass of two isotopes) in any
chemical reaction tend to keep the same isotopic signature of the starting material.
These isotopes effect mean that, depending on its origin, the same compound may
have different isotopic compositions depending on the starting material of the reaction.
Therefore, stable isotopes provide a useful tool in identifying the sources of
groundwater contamination. The isotopic composition of the potential contaminant
sources must be distinguishable. Thus the major potential sources of groundwater
contamination in the hydrosphere can be assigned using isotopic ratios as a tracing
tool.
3.3.1. Nitrogen Isotopes
The nitrogen stable isotope ratio analysis was conducted on water samples to identify
the possible sources of nitrate in the groundwater. The nitrogen test provides a
measurement of the ratio of the two most abundant isotopes of nitrogen14N and 15N.
The nitrogen isotopes 15N and 14N constitute an isotope pair. The lighter isotope 14N
is significantly more abundant in the environment than 15N. In the atmosphere there is
one atom of 15N per 273 atoms of 14N (Drever, 1997). The ratio of the heavier isotope
to that of the lighter isotope in a substance provide useful information because the
slight difference in the mass of the isotopes are caused by special processes.
Denitrification of nitrogen compounds, for example, causes the nitrate of the starting
material to become isotopically heavier. Volatilization of ammonia results in the loss
of lighter isotope to the atmosphere, and ammonia that remains behind become
isotopically heavier (Mook, 2001).
In the study area many sources can cause a rising in the nitrate values in the
groundwater, these sources including the sewage and manure, fertilizers and
pesticides, where many related anthropogenic activities were recorded . The nitrogen
as well as the oxygen isotopes in the nitrate compound is a useful tool to differentiate
between each possible source.
For this purpose, bottles of 1.5 l of water were taken for isotope analyses; samples
with high nitrate were collected using ion exchange resins (Fig. 24).

2: Methodology 49
Fig. 24: Collection of nitrate in the field using ion exchange resins column (right side of the picture over the carton box)
This alternate method concentrates the NO3- or NH4
+ on anion or cation exchange
resins. Collection of nitrate on anion exchange resins eliminates the need to send large
quantities of chilled water back to the laboratory, eliminates the need for hazardous
preservatives, makes it easier to archive samples, and allows analysis of extremely low
concentrations. Anion resin has the capacity of 1.2 meq/L so 5 mL can hold 6 meq or
6,000 M of NO3. The cation resin, 50WX has the capacity of 1.7 meq/mL, so 5 mL
will retain 8.5 meq. The anion column will also fill up with other anions besides NO3.
The relative selectivity for SO4 and Cl and NO3 is 15, 2.3, and 8 (higher number
means greater selectivity). But when trying to determine which anions will fill the
column first, so the concentration also has been taken into account. There is no
specific formula that allowed predicting the exact behavior of the column with low-
nitrate waters. The resin is washed using silver oxide until there is < 0.5 ppm of nitrate
in rinse water. Silver nitrate was rinsed with distilled water to remove nitrate. About
500 grams of resulted silver oxide was put in a 4 L flask. Stir and shacked the silver in
distilled water. The residual silver was removed by pouring the rinse water through

2: Methodology 50
large paper filters and captures the water in a flask. NaCl was added to the rinse water
to precipitate the silver as silver chloride. This water was filtered through 0.45 micron
filters and then discarded. It takes about 30 rinses for the silver to be "nitrate free".
Initially, the nitrate concentration of the rinsed water was high. Gradually, after many
rinses, the nitrate concentrations become equilibrate around 2 ppm.
Sample-size requirements are in the range of 10-100 µM of N; however sample
size requirements also vary between laboratories. In addition to measuring the d15N
value of nitrate, a few labs are able to measure the d18O value as well. Samples were
measured using isotope ratio mass spectrometry (IRMS). IRMS separates the ions of
the element (14N/15N) on the basis of their differing mass/charge ratio. Sample
preparation consists of converting solid or liquid material to a gas (N2) and isolating
the particular gas that must be analyzed.
3.3.2. Sulphur isotopes
Sulphur isotopes are used in hydrology to trace natural and anthropogenic sources of
sulphur in particular, to study the cycling of sulphur in agricultural watersheds, the
sources of salinity in coastal aquifers or sedimentary strata, groundwater
contamination by landfill leachate plumes, and acid mine drainage. It provides a
measurement for the ratio of the two most abundant Sulphur isotopes 34S and 32S
where the last one is lighter and more abundant in the environment (Kendall et al.,
1992).
To assess the importance of the possible influence of the lithological formation
from Lisan and Samra on the isotope composition of dissolved sulphate in the studied
aquifer, the sulphur isotope composition of two solid samples from Samra in Wadi
Nuwe’meh north (J04-Y and J04-Z), and 4 solid samples from Lisan in Wadi Qilt east
and south (J04-X, J04-I, J03-Z, and J04-Q) were also analyzed. For that, samples were
eluted with distilled water (100g/500ml) at room temperature, and then filtered with a
Millipore’s filter of 0.45µm pore size. Major anions of elutes and water samples were
analyzed by HP liquid chromatography. Concentrations of the major cations of these
solutions were determined by ICP-OES, and the trace elements were analyzed by ICP-
MS. For sulphur isotope analysis the dissolved sulphate was precipitated as BaSO4 by
the addition of barium chloride, the sulphate precipitate was then filtered, washed and

2: Methodology 51
dried. The sulphur isotopic composition was determined with a mass spectrometer
(Finningan Mat delta C) coupled with an elemental analyzer (Carlo Erba 1108).δ-
Notation is expressed in terms of δ34S per mil (%°) relative to the Vienna Canyon
Diablo Troilite (VCDT) standard. The isotope ratios were calculated using NBS-127,
IAEA-S1, IAEA-S2, IAEA-S3 and internal laboratory standards for calibration.
Reproducibility of the samples calculated from standards systematically interspersed
in the analytical batches is 70.2%; the error of a double measurement is 0.4%°.
3.3.3. Carbon isotopes
δ 13C values are used to understand the biogeochemical reactions controlling alkalinity
in watersheds.
The primary reactions that produce DIC (Dissolved Inorganic Carbon) are
commonly related to the dissolution of biogenic soil C02 by infiltrating rain water
forming carbon acid, where the carbonic acid causes a weathering of carbonate
minerals and silicate minerals in the soil and rocks. The reactions produce DIC
identical in δ13C to the composition of the reacting carbonate, carbonic acid or an
intermediate signature between them. Consequently, without further information, DIC
produced solely by the reaction of weathering of carbonate minerals is identical to
DIC produced in equal amounts from the soil weathering reactions (Kendall et al.,
1992). Because δ13C analysis provides information on the origins of dissolved
inorganic carbon in the groundwater it can also be used to aid in discriminating the
sources of recharge to a groundwater System, depending in the aquifer composition,
particularly the carbonate sediment of a specific aquifer. Carbon isotopes are also
useful tracers of seasonal and discharge related contributions of different hydrological
flow paths to stream flow (shallow vs. deep flow-paths).
The carbonate from water samples was transferred to BaCO3 in an alkalic pH>12,
as in the same sample which was used for sulphur isotopes. In the lab the mount in
carbonate materials are measured by reacting 100% water-free phosphoric acid
(H3PO4) at 25oC with BaCO3, to convert it to free CO2. according the reaction:
3BaCO3 + 2 H3PO4 ⇒ Ba3(PO4)2 + 3 CO2 + 3 H2O (3)

2: Methodology 52
As long as all the CO2 is recovered, there is no fractionation of 13C. The 13C/12C –ratio of the gas is the same as in the sample. The CO2 gas then runs through
the IRMS and measured.
3. 3.4. Tritium Deuterium and Oxygen isotopes
Oxygen has three stable isotopes, 16O, 17O, and 18O; hydrogen has two stable isotopes, 1H and 2H (deuterium), and one radioactive isotope, 3H (tritium). Oxygen and
hydrogen are found in many forms in the earth’s hydrosphere, biosphere, and
geosphere. Oxygen is the most abundant element in the earths crust. Hydrogen also is
common in the biosphere and is a constituent of many minerals bund in the geosphere.
Oxygen and hydrogen combine to form water, thus making their isotopic composition
a powerful tracer for the hydrosphere.
There are nine isotopic configurations for water molecule, which are distinguished
by their mass numbers as well as their characteristics. However, because of the low
abundance of the heavier isotopes, almost all water molecules are of three isotopic
combinations.
Characteristics of three types of water molecules (Hoefs, 1997):
1H216O 2H2
18O 1H218O
density @ 20°C 0.997 1.1051 1.1106
boiling point 100.00 101.42 100.14
vapour pressure @100°C 760 721.60 ?
temperatory density max 3.98 11.24 4.30
Stable isotopes in water (18O and 2H) are affected mainly by meteorological
processes that provide a characteristic fingerprint of their origin (Clark and Fritz,
1997). The isotopes O and H are partitioned among different freshwater reservoirs by
various hydrologic processes such as evaporation from the oceans, rainout, re-
evaporation from terrestrial basins, snow and ice accumulation, and runoff. As water
evaporates, the lighter isotopes, 16O and 1H are preferentially removed and the
remaining reservoir becomes enriched in the heavier isotopes, 18O and 2H.
Condensation of water vapor causes the reverse effect. The heavier molecules
condense more efficiently leaving the residual vapor in the cloud depleted in 18O and

2: Methodology 53
2H. Because of their dose relationship and the abundance and importance of water on
the planet, O and H and their isotopic fractionation characteristics are usually
considered together. As a result of fractionation, waters develop unique isotopic
compositions that can be indicative of their source or the processes that formed them.
Isotopic composition differs for sea water, polar ice, atmospheric water vapor, and
meteoric water.
Models of oxygen/hydrogen isotopic fractionation have been developed and refined
over the last 50 years. Models of isotopic variability take into account vapor pressure,
humidity, temperature, altitude, rainout and moisture content, evaporation and solute
concentration, and combinations of them. Craig (1961) showed that 18O and 2H behave
predictably and that 18O and 2H in fresh waters correlate on a global scale. He
developed a “global meteoric water line“that defines the worldwide fresh surface
water relationship between 18O and 2H by the equation:
δ 2H=8 δ 18O+10%° SMOW (4)
Craig‘s (1961) observation only has application globally because it represents an
average of many local and regional meteoric water lines, which are individually
affected by varying climate and geographic factors. A local meteoric water line, based
on analyses of surface water samples from the recharge area of Jerusalem and
Ramallah mountains (Abu Dees meteorological station) which done by the UFZ
isotopic hydrogeology department in cooperation with Al-Quds University, is
represented by the equation:
δ 2H=8 δ 18O+19.5%° SMOW (5)
Tritium, 3H, the radioactive isotope of Hydrogen, is a short-lived isotope of
hydrogen with a half-life of 12.32 years. Tritium concentrations are represented in
tritium units (TU). One tritium unit is equal to one molecule of 3H per 1018 molecules
of 1H and has an activity of 0.118 Bq/kg (3.19pCi/kg). The large pulse of tritium, that
entered the hydrologic cycle from the middle of 1950 to early 1960’s during atomic
bomb test in the atmosphere, could be used to establish the age of groundwater
recharge. High levels of tritium (>~30 TU) indicate water that was recharged during
the late 1950s or early 1960’s; moderate concentrations indicate modern recharge;
levels close to detection (~1 TU) are likely submodern or paleo-groundwaters that
have mixed with shallow modern groundwater’s (Clark and Fritz, 1997). Rough
general guidelines are:

2: Methodology 54
<0.8 TU submodern (prior to 1950’s)
0.8 - 4 TU m of submodern and modern
5 - 15 TU modern (<5 to 10 years)
15 - 30 TU some bomb tritium
>30 TU recharge in the 1960‘s to 1970‘s
>50 TU recharge in the 1960‘s (Bomb Tritium)
Samples were collected in 60 ml polyethylene bottles. Gas Source Isotope Ratio
Mass Spectrometry (IRMS) was used to determine the hydrogen and oxygen isotope
ratios of collected groundwater samples. Oxygen isotope ratios were measured by the
Carbon Dioxide Equilibration Syringe method proposed by Matsui (1980), in which
carbon dioxide is equilibrated with CO2 (Epstein & Mayeda, 1953) (to Gl.-M2: H218O +
C16O2 ↔ H216O + C18O2) and then isolated from water vapor and other trace gases prior
to injection into the mass spectrometer. Gehre et al. (1996) method was used to
prepare samples for deuterium analysis in the mass spectrometer. This method
involves reducing sample water into elemental hydrogen through use of a Heated
Chromium Furnace packed with oxidizable material at 850°C. The resulted H2 was
measured in Isotope Ratio Mass Spectrometer (IRMS) of delta S type (Fa. Finnigan MAT,
USA). Data quality was checked through an internal laboratory calibration of standards
(Coplen et al., 1991).
Samples for tritium were collected in 500ml bottles. Distillation of samples under
N2-atmosphaere, then NaO2 in electrolysis cells was added as batch process
electrolytically decomposes: Enrichment (T for instance 15-18-fach) heavy H2-
Isotope in the arrears (D, T) (Taylor, 1983; Rozanski & Groening, 2004). PbCl2 was
added on the produced NaOH. A distillation process was adopted until drying , water
after addition of Ultima gold radiometric detection over 1000 min in liquid
scintillation spectrometer Quantulus 1220 Canberra luggage pool of broadcasting
corporations 2770 TR/SL (EG&G Wallac, Finland). By this method, Tritium emits
beta decay electrons, which excites the solvent. The solvent transfers its energy to the
solute, which emits light photon pulses which are detected and counted.

CHAPTER 4: RESULTS AND DISCUSSION
4.1 General Hydrochemistry and Tritium
The hydro-chemical data for both wet and dry seasons are shown in tables 4 and 5. The
major cations and anions concentrations of the groundwater from springs and wells in the
region are plotted on a Durov diagram in Figure 25.
There are no significant differences in ions concentrations between wet and dry
seasons. However, the groundwater samples in the period of wet season shows slight
increase in TDS, which might refer to the wash out effect of the older water stored in the
aquifer during the dry season.
In both seasons all the major anions and cations show an increasing trend with water
path from west to east (Fig. 26). Mg, K, Na, and Br show a good linear correlation with
the TDS and all follow the west-east pattern, while Ca, Sr, B, SO4, HCO3 show a
relatively low correlation, and nitrate shows very poor correlation (Fig. 26g) which
indicates a source different from all the other elements.
In general the data reflect distinctive end-members of fresh water to west and saline
water further to the east.

Well Name Well Code pH Eh korr
[mV] T
[°C] Cond
[mS/cm] Li Na K Mg Ca Fe NH4 B Ba Sr Ru Cl Br SO4 NO3 HCO3 PO4 Si TDS
Arab Project66 19-14-66 7.37 580.21256 26.4 5.36 0.1648 559 78.3 198 168.1 0.0333 0 1.023 0.1028 3.173 0.06 1405 11.5 285 38 409.31 0.01 8.51 3165.95
Arab Project67 19-14/067 7.14 472.49219 26.1 6.23 0.1897 668 102.9 219.7 163.2 0.0447 0 1.313 0.1513 2.753 0.07 1725 13.9 221 51 405.04 0 7.94 3582.51
Arab Project73 19-14/073 7 470.49219 26.1 4.11 0.1337 357.6 75.1 158.9 123.9 0.0738 0.001 0.945 0.2113 1.729 0.05 1014 7.1 111 48 386.13 0.01 7.56 2292.55
Fahmi Nahas48 19-13/048 7.15 446.72923 23.7 1.538 0.037 112.7 14.68 66.4 89.8 0.0103 0 0.2666 0.0683 1.896 0.01 240 1.6 82.7 61 317.81 0.05 6.89 996.007
Fahmi Nahas47 19-13/047 7.1 450.3817 23 1.483 0.0343 109.5 12.07 63.3 89.7 0 0.018 0.2633 0.0624 2.054 0.01 228 1.2 82.2 71.5 322.69 0.05 7.45 990.155
Sabiru Rantizi 19-13/006 7.01 459.10207 23.3 2.38 0.0334 160.7 7.75 91.1 163 0 0.02 0.32 0.1242 3.415 0.01 452 2 153 100 342.21 0.01 8.8 1484.55
Fahed Hishmi 19-13/015 7.11 433.98355 24.5 2.46 0.0747 212.9 37.34 101 103.9 0.1163 0.02 0.4659 0.0978 1.775 0.03 513 4.5 62.1 50 337.33 0.3 6.77 1431.73
Zuhdi Hashwa 19-13/052 7.1 376.4496 24 2.78 0.0629 216 27.95 115.4 128 0.1531 0 0.527 0.0885 3.358 0.02 556 3.4 194 79 349.53 0.05 7.14 1680.79
Salah Arouri 19-14/012 7.16 485.89034 24.6 1.325 0.0299 89.3 10.86 60.2 87.7 0.0188 0 0.2168 0.0592 1.814 0.01 195 1.1 64.5 70 342.21 0.3 7.32 931.3
Basil Husaini20 19-13/020 7.3 509.4496 24 1.6 0.0363 138.6 14.82 63 82.8 <0.01 0 0.3908 0.0732 1.366 0.01 243 1.6 120 65 317.2 0.06 6.2 1055
Basil Husaini18 19-13/018 7.5 498.5175 25 1.189 0.0249 83.1 9.2 49.72 86.4 <0.01 0 0.2262 0.0414 1.226 0.01 166 0.5 71.4 52 292.8 0.1 6.75 820.514
Ibrahim Daek NW 7.07 437.35639 24.1 3.3 0.0881 311 39.32 127.3 126.7 0.0303 0.169 0.746 0.1514 2.241 0.03 764 5.9 189 47 369.05 0.05 6.86 1990.26
Ein Sultan AC/61 7.39 541.15269 21.1 0.678 0 25.79 2.678 27.88 83.9 0.0328 0 0.0486 0.0334 0.1176 0 48.7 0.5 24.1 48 266.57 0.165 4.43 533.46
Ein Dyouk AC/60 7.33 485.2459 21 0.678 0 26.29 2.688 28.25 85.9 0.0241 0.054 0.0467 0.0314 0.117 0 44.6 0.5 23.8 55 293.41 0.215 4.473 565.88
Awni Hijazi 19-14/052 7.01 489.42429 25.1 3.04 0.0791 285.7 34.12 117.3 115.6 0.3821 0.054 0.4702 0.1657 2.654 0.03 695 6.5 76.5 50 417.85 0.08 8.16 1810.79
Saeed Aladeen 19-14/062 6.96 391.05145 25.5 2.57 0.0492 208.1 21.16 94.8 125.8 <0.01 0.01 0.2717 0.0739 1.032 0.02 566 5.6 43.5 20 393.45 0.2 6.36 1486.9 Mohammed
Masri 19-14/38 6.95 375.95824 25.6 2.42 0.0538 201.8 19.04 97.5 140.1 0.0591 0 0.3059 0.1054 1.116 0.02 527 6.2 44 10.5 403.21 0.06 6.87 1458.01
Samed 19-14/26a 7.12 405.4496 24 1.222 0.0102 58.3 5.56 58.5 116.9 0.0117 0 0.1042 0.0641 0.4578 0.01 130 0.9 20.9 41 412.97 0.03 6.48 852.339
Arab Project69 19-13/069 6.99 395.39898 26.2 4.12 0.1292 508 75 148.9 112.1 0.0148 0 0.786 0.1561 1.809 0.05 1054 11 109 43 415.41 0.012 7.39 2486.86
Awn Hijazi 19-14/37 6.91 499.77182 25.8 3.67 0.0934 355.2 47.14 157.4 157.2 0.0185 0 0.595 0.1432 1.867 0.04 916 8.4 117 49.5 383.69 0.01 8.22 2202.54
Saleem Nimmari 19-13/49 7.29 507.4496 24 1.89 0.0776 183.8 50.1 76.2 71.9 <0.01 0 0.519 0.126 1.126 0.03 335 1.8 66.2 75 385.52 0.12 7.49 1255.27
Qasir Hisham 19-13/003 7.05 393.5854 26 3.43 0.0636 306.3 27.63 123.7 163.6 0.0219 0 0.3349 0.0355 1.42 0.02 890 11.9 52.6 23.5 349.53 0 9.31 1960.08
Bail Hussaini22 19-13/22 6.97 349.42429 25.1 3.15 0.0885 266.4 42.26 135.6 133.7 0.0223 0.01 0.648 0.1219 2.178 0.03 693 4.2 222 50 344.65 0.1 7.64 1902.64Mahmud
Akramawi 19-13/50a 6.7 284.54281 23.9 2.18 0.0617 149.7 33.47 92.8 119.5 0.4029 0.17 0.3775 0.1162 1.946 0.03 385 2 109 54 406.26 0.14 8.28 1363.17
Bail Hussaini21 19-13/21 7.14 418.30577 26.3 2.83 0.0789 263.7 36.26 118.2 117.4 <0.01 0.03 0.586 0.1265 1.764 0.03 722 5.7 172 95 349.53 0.023 7.11 1889.69
Table 4: Hydrochemical data in mg/l of the wells and springs from Jericho-Palestine in wet season (March, 2004).

Site Well Code pH Eh korr
[mV] T [ °C]
Cond [mS/cm] Li Na K Mg Ca Fe NH4 B Ba Sr Ru Cl Br SO4 NO3 HCO3 PO4 Si TDS
Arab Project66 19-14/066 7.04 357.02614 26.6 5.39 0.1744 577 82.6 213.7 186.1 0.084 0.01 1.078 0.099 3.56 N D
1423 15.7 300.9 29.69 439.2 0.035 8.8 3282.01
Arab Project67 19-14/067 6.99 319.21256 26.4 5.84 0.1909 639 104.1 220.8 167.3 0.868 0 1.32 0.1534 2.843 N D
1638 14 183.4 38.86 366.61 0.043 8.36 3385.98
Arab Project73 19-14/073 6.99 328.21256 26.4 3.89 0.1397 359.3 79.6 164.6 128.3 <0.05 0 0.973 0.2205 1.833 N D
1000 7.6 95.9 40.41 405.65 0.016 7.97 2292.6
Fahmi Nahas48 19-13/048 7.18 424.3817 23 1.471 <0.07 113.6 15.38 69.9 91.5 <0.05 0 0.2566 0.0651 2.003 N D
238 2.5 70 41.67 347.7 0 7.3 999.907
Fahmi Nahas47 19-13/047 7.2 421.56812 22.8 1.454 <0.07 116.3 12.42 66.6 93.7 <0.05 0.006 0.2671 0.0673 2.144 N D
225 2.2 77.2 43.73 355.02 0 7.96 1002.67
Sabiru Rantizi 19-13/006 6.88 331.19528 23.2 2.33 <0.07 158.6 7.95 93.5 173.4 <0.05 0 0.3118 0.1269 3.553 N D
414 2.5 117.6 62 376.37 0.301 9.23 1419.22
Fahed Hishmi 19-13/015 7.08 338.89034 24.6 2.35 0.0751 214.4 38.47 101.4 99.5 0 0.002 0.476 0.0893 1.732 N D
504 5.3 60.8 33.24 378.81 0.001 6.99 1445.43
Zuhdi Hashwa 19-13/052 7.15 343.00886 23.4 2.59 <0.07 207.4 28.32 113.9 127.7 <0.05 0.005 0.4956 0.0713 3.579 N D
536 4.1 166 46.55 369.05 0 7.43 1610.67
Salah Arouri 19-14/012 7.14 375.75454 22.6 1.279 <0.07 92.3 11.17 63.3 88.4 <0.05 0.001 0.2083 0.054 1.887 N D
187 1.9 59.2 40.54 417.85 0 7.74 971.603
Basil Husaini20 19-13/020 7.16 425.72923 23.7 1.16 <0.07 148.3 17.01 73.4 92 0.4107 0.007 0.4115 0.0838 1.607 N D
264 2.5 110.1 49.38 349.53 0.005 6.99 1116.02
Basil Husaini18 19-13/018 7.2 409.22059 22.1 1.146 <0.07 81.5 9.63 52.2 87.7 <0.05 0.004 0.216 0.0353 1.3 N D
162 2.2 58.6 29.08 304.39 0 7.05 795.886
Ibrahim Daek NW 7 371.26318 24.2 3.23 0.0875 315.1 39.52 130 131.7 <0.05 0.008 0.734 0.126 2.259 N D
750 6.2 167.7 29.68 376.37 0 6.98 1956.52
Iron Factory 19-13/26a 7.22 219.79713 24.7 1.939 <0.07 104.8 16.7 97.6 130 <0.05 0.005 0.2302 0.3069 4.308 N D
406 2.5 90 70.13 259.25 0 10.69 1192.54
Ein Sultan AC/061 7.56 471.96627 21.3 0.637 <0.07 22.83 2.503 30.08 79.1 <0.05 0.005 0.0406 0.0301 0.1253 N D
34.4 1 17.2 42.46 295.24 0.095 4.757 530.125
Ein Dyouk AC/060 7.14 507.2459 21 0.637 <0.07 23.15 2.471 29.81 81.5 0.1126 0.015 0.0407 0.0342 0.1324 N D
34.9 0.5 16.7 29.07 287.31 0.097 4.785 510.543
Awni Hijazi 19-14/052 6.88 446.23787 25.3 3.11 0.0832 300.2 35.78 124.3 122 <0.05 0.012 0.4954 0.1649 2.853 N D
745 7.2 72.1 34.07 380.03 0 8.17 1832.44
Saeed Aladeen 19-14/062 6.89 465.07676 24.4 2.72 <0.07 230 24.18 109.9 140.7 <0.05 0.016 0.295 0.079 1.19 N D
656 8.7 40.6 5.18 364.17 0.088 6.87 1587.83Mohammed
Masri 19-14/038 6.8 345.05145 25.5 2.27 <0.07 176.6 19.42 102.1 128.1 <0.05 0.031 0.294 0.1076 1.166 N D
499 6.1 39.6 7.5 380.03 0 7.27 1367.18
Samed 19-14/26a 7.2 410.54281 23.9 1.233 <0.07 64.5 6.37 64.2 117.9 <0.05 0.017 0.1239 0.0603 0.525 N D
121 1.7 22.6 15.97 437.37 0 7.04 859.517
Arab Project69 19-13/069 7.02 345.30577 26.3 4.05 0.1371 460.1 79.6 140 116.7 <0.05 0.017 0.818 0.16 1.961 N D
1041 10.9 103.8 24.51 418.46 0.012 7.85 2406.16
Abdallah Araikat 19-14/049 6.68 306.05145 25.5 2.47 <0.07 210 15.34 105.7 131.2 0.1426 0.024 0.2927 0.1571 1.127 N D
528 5.8 92.7 30.58 364.78 0.004 7.12 1492.83
Table 5: Hydrochemical data in mg/l of the wells and springs from Jericho-Palestine in dry season (October, 2003).

4: Results and discussion______________________ ______________58
4.1.1 Springs and Fresh Water End Member
Springs in the west are characterized by Ca-Mg-CO3 water with a low degree of
mineralization (~548 mg TDS/l). Tritium units in the groundwater from the springs are
4.5 TU, while for the adjacent Samed well is 1 TU. These springs, which correspond
to the fresh end-member, show low Cl content with molar ratios of B/Cl (0.0033-
0.0039, Fig. 27b), Na/Cl (~1, Fig. 27c), Br/Cl (0.0065-0.013, Fig. 27d), Mg/Cl (~1.2
Fig. 27a), SO4/Cl (~0.18 Fig. 27e) and Sr/Ca (7.2-7.4*10-4 ). The groundwater shows
an over saturation index with dolomite and calcite, while it shows an under saturation
index for gypsum and aragonites (Fig. 28 a, b, c, d).
Fig. 25: Durov Plot suggests simple mixing or dissociation, the trend of water from fresh Ca-Mg-CO3 water in the springs and wells to the west goes to NA-Mg-Cl water to the east.

4: Results and discussion___________________________ _____59
Fig. 26: Major anions and cations vs. TDS in mg/l, for the wells and springs of Jericho area (October, 2004). Salinity increase in one trend from west to east of the area. Mg, K, Na, and Br show a good linear relation, while Ca, Sr, B, SO4, and HCO3 show relatively low correlations, and nitrate shows very poor one with scattered nitrate values.

4: Results and discussion___________________________ _____60
Fig. 27: Ions molar ratios for the wells and springs of Jericho area. The wells in the east have a stable molar ratio for most of the anions and cations.

4: Results and discussion___________________________ _____61
4.1.2 Wells of Wadi Qilt West
The groundwater from wells in the west of Wadi Qilt show intermediate values
between the fresh and saline end members with a water type of (Mg-Na-Ca-Cl-HCO3).
However the ion concentrations, mainly chloride is much lower than the eastern wells,
and sometime show values that are close to these in the fresh end-member of the
springs. Tritium units in the groundwater from these wells are between 3.3-3.9 TU.
The ionic molar ratios for these wells lay between those of the two mentioned end-
members. It shows lower saturation indices for dolomite and calcite than those of the
springs, while the saturation indices for anhydrite and gypsum were higher. These
wells contain relatively high carbonate, boron and nitrate values.
4.1.3 Wells of Wadi Qilt East The hydrochemistry of the wells further to the east show a close trend to those in the
west region, with more TDS as well as major ion concentrations. The area is
characterized by overlapping Lisan and Samra layers. Tritium units in the groundwater
from these wells are lower than the wells to the west with values between 2-3.5 TU. It
has the same saturation indices of dolomite and calcite as the rest of Wadi Qilt wells to
the west, and a much higher one for gypsum and anhydrite (Fig. 28). Even though the
chloride concentrations for these wells are higher (500-900 mg/l and TDS >2100
mg/l), the molar ratios for ions are much lower. Most of the molar ratios start to take
on stable trends when reaching these wells (Fig. 27).
4.1.4 Wadi Nuwe’meh North The analysis of the wells in this area north of Jericho, show high chloride content
(600 -700 mg/l) as well as high concentration of major anions and cations relative to
wells in the west and Wadi Qilt west. This area is characterized by the dominance of
Samra formation with high hydraulic conductivity. The water type is Mg-Na-Cl-HCO3
the same as that for wells in the west, where both have surplus Mg which originates
from dolomite dissolution that leaching through wadi runoff from the dolomitic
limestone formation adjacent to the west. All chemical parameters in the groundwater
from these wells are under-saturated with regard to different minerals. The molar
ratios for the major ions are close to those in the eastern wells. Tritium units in the
groundwater from these wells are around 1.5 TU.

4: Results and discussion___________________________ _____62
0 800 1600 2400 3200 4000
TDS (mg/l)
-3.0
-2.6
-2.2
-1.8
-1.4
-1.0
si_A
nhyd
rite D
D
DII
J
J
J
I
I
I
JJ
AA
DCC
A
DC
0 800 1600 2400 3200 4000
TDS (mg/l)
-1.0
-0.4
0.2
0.8
1.4
2.0
si_D
olom
ite D
DDII
J
J
JIII J
J
A
A DC
C
A
D
C
0 800 1600 2400 3200 4000
TDS (mg/l)
-1.0
-0.6
-0.2
0.2
0.6
1.0
si_C
alci
te D
DDII
JJ
JIIIJ
J
A
A
DC
C
A
D
C
0 800 1600 2400 3200 4000
TDS (mg/l)
-5.0
-4.6
-4.2
-3.8
-3.4
-3.0
si_G
ypsu
m
D
D
DII
J
J
J
I
I
I
JJ
AA
DCC
A
DC
LegendLegendA Springs and Jericho WestI Wadi Qilt WestJ Wadi Qilt EastC Jericho NorthD Arab Project East
Fig. 28: Saturation indices for dolomite, calcite, gypsum and anhydrite vs. TDS for the groundwater samples from Jericho area. Figures show different trends for each mineral, where the wells to the east show higher SI with respect to TDS.
(a) (b)
(c) (d)

4: Results and discussion___________________________ _____63
4.1.5 East Arab Project Wells (brackish end-member)
The groundwater from Arab Project wells in the east of Jericho shows the highest
salinity in the area, with a Chloride content of more than 1800 mg/l for well 19-14/067
and a TDS value of 3664 mg/l. This highly saline water is of the Na-Mg-Cl and Mg-
Ca-Cl type. The SO4 concentration is 320 mg/l. The groundwater from these wells is
highly saturated with dolomite and relatively saturated with calcite, while the
saturation indices for gypsum and anhydrite are relatively higher than the rest of the
wells but still undersaturated (Fig. 28). Carbonate concentration of 440 mg/l (Fig. 26h)
is relatively high. The groundwater from these wells shows low tritium units which
were below detection limit of <0.6 TU for well 19-14/067.
4.1.6. Overall Hydrochemical Conditions
The chemical data for all of the springs and wells shows a gradual increase for the
major elements from west of the area to east along the water flow path. The
groundwater salinity varies from fresh Ca-Mg-CO3 water in the west to high saline
Na-Mg-Cl and Mg-Ca-Cl water in the east (EC >5000µS) differentiating two
distinctive end-members. The molar ratios for most of the elements tend to be stable in
the east and Wadi Qilt east. Some wells in the Wadi Qilt west which show less
chloride content also show high boron and nitrate values. While those wells to the
north show less anthropogenic indicators but higher chloride content.
The linear correlation in the Durov diagram (Fig. 25) also suggests a type of
dissolution or simple mixing that increases with distance from west to east and to the
north. The water type varies along the mentioned paths. It is of Ca-Mg-HCO3 water in
the spring water and Mg-Na-Ca-Cl-HCO3 water for the pumped wells in the west and
middle of the studied area, but the water becomes more saline to the east and the Mg-
Ca-Cl and Na-Mg-Cl water type becomes the most dominant. The variability in
bromide and nitrate concentrations depend on well location and agricultural/domestic
activities around the borehole. The groundwater mineralization do not really reflect
the previous spatial trend for the major elements; this is due to variation in the ion
input along the water path (Fig. 2 8).The groundwater from wells further to the east
(19-14/67) with ³H below detection must have been recharged prior to 1952 and can
be considered as sub-modern or older water. Most of the other groundwater samples
show tritium units between 0.8 to ~4.5 which reflect a sub-modern and modern
recharge (Clark, 1997). These values could reflect a mixing process between two

4: Results and discussion___________________________ _____64
water of different age, where the tritium units differentiate two different age end-
members of old to modern and sub-modern recharged water that represent this mixing.
The groundwater in the western springs and wells of an alluvial aquifer comprise
mixtures of recharge from the past few years only (less than 5 years), where the data
show a TU of 4-6 which are bearing the precipitation value (~ 6 TU) . It seams that the
tritium level declines with increased distance along the water path through wadis, and
emphasize that the mechanism of recharge is not related to direct infiltration of rainfall
but of infiltrated run off along the wadis that drained from the Jerusalem-Ramallah
Mountains (the main recharge point). In general, the variation in salinity within
Jericho can be one or combinations of multi-sources of salinity and pollutants.
4.1.7. Salinisation
According to hydrochemical analysis salinisation process could be defined as having
two main causative factors, as follows:
4.1.7.1. Brackish Water Source:
There is a good evidence of brackish water evolution further to the east of the study
area. It is believed that the overexploitation of the wells to the east of the Jericho area
has resulted in upwelling from deeper brackish water which confined in aquiclude.
This water could be salt leachate brackish water that mainly formed as a result of long
contact with the salty rocks, or deep old brine water which derived from residual Lisan
lake water that entrapped in the interstices of the sediments in the Pleistocene age.
This water coexists deeply in a confined aquiclude chamber within the Lisan
formation. However, its source, direction and location are not well identified (section
2.6.1.). The analysis of samples from wells in the east show highly saline Ca-Cl and
Na-Cl brackish water. The Na/ (Na+Cl) ratio which is less than 0.5 in combination
with a high TDS of >500 suggest a reverse softening and a mixing of brackish water in
the east with the discharging and uploading fresh water from the west. Moreover, the
trend of a continuous increment of salinity from the west to the middle of the area
demonstrated as steady ratios for Na/Cl and B/Cl in the east group with a molar ratio
~0.5 and 0.0026 (Fig. 27b, 27c). The low tritium concentration from the study wells
emphasizes the presence of such a mixing process. The lower tritium units between
<0.6-1 in the wells to the east might reflect a mixing of recent age water infiltrated
from wadis run off with a deep old water characterized by high salinity. This evidence

4: Results and discussion___________________________ _____65
could be made clearer by further studies of the rare earth elements concentration and
isotopic signature analysis.
4.1.7.2. Evaporites and in situ Rock Weathering:
Generally, all the wells and springs show HCO3/SiO2 ratio of >10 and TDS>500
which suggests carbonate weathering along the water path. The Mg/(Ca+Mg) ratios,
which is over 0.5 in most cases (Fig. 27c), indicates a Mg rich leachate by wadi run
off from the dolomitic limestone’s formation in the north west and south west of the
area. In addition to calcite precipitation, especially for the wells in the east, where the
Ca/ (Ca+SO4) ratios were between 0.75 and 0.95, there is surplus calcium from the
suggest Ca-Cl brine beside gypsum or carbonate dissolution of the Lisan layer. The
Results show two main effects. These are mainly the effect of dissolution of salts from
Samra layers and the dolomite limestone formations further to the west and the effect
of Lisan layer and its gypsum and calcite to the east and north. Fig. 28 shows that the
groundwater in the west is oversaturated with respect to dolomite and calcite and
becomes less saturated further to the east of Wadi Qilt and Nuwe’meh north. This
trend changes for the wells to the east where another input of Mg-rich salts raising the
saturation indices for dolomite and calcite in a trend that increases until it reaches the
brackish water end-member at eastern Arab Project wells. The Ca as well as HCO3
concentrations decrease by precipitation of other minerals such as aragonites.
Relatively high SO4 concentrations in the east, in parallel with low saturation index of
gypsum, indicate gypsum dissolution. Moreover, the increase in ion content, mainly
Mg from a suggested brackish water source to the east, favored a process of
dolomitization of the calcite and aragonite that dominating the entire sequence. Sr/Ca
molar ratio which is between 0.0025 and 0.0155 emphasizes the dolomitization
process (Sass and Starinsky, 1997).
Except the springs that show relatively fresh water, the ratios of Na/Cl (0.4 east-0.7
west) Mg/Cl (0.18 east-0.5 west) and SO4/Cl (0,015 east-0.15 west) shows ratios
which are even less than the Lisan leaching ratios which have values of (0.54, 0.23,
0.05) respectively (Salameh, 2002) and much lower than sea water ratios (Na/Cl 0.86,
SO4/Cl 0.135). While the Br/ Cl (0.006 east-0.014 west) was higher than that of sea
water ratio which is ~0.0016. Although the groundwater from many of the studied
wells show different Br/Cl molar ratios that might also be affected by dissolution of
salts, the variation between the mentioned value and those from the wells is mainly
due to more Br input which suggests that it originated from two sources: 1) Halite

4: Results and discussion___________________________ _____66
dissolution from the evaporitic Lisan layer with different Br/Cl molar ratio than brine
or seawater, 2) the anthropogenic influent of bromide which is used widely in the form
of methyl bromide within this agricultural area.
4.1.8. Anthropogenic Influences:
The greatest anthropogenic effect on the groundwater quality in the Jericho area is the
agricultural effects which have 4 main agricultural practice indicators. These are: 1)
Bromide which is injected as a fumigant to the land as a methyl bromide gas. 2)
Pesticides. 3) NO3 from nitrogen fertilizers and animal manure. 4) Potassium,
magnesium and calcium which might appear in surplus amounts due to irrigation back
flow through the soil to the groundwater. The wells in the middle and west of Jericho
area are susceptible to agricultural influence. This is more clearly present in the east,
even though the high Chloride content and the influence of natural evaporites there
make this indicator less unambiguous.
Fig. 29: Potassium versus Nitrate in the groundwater samples from Jericho area: Iron Factory used as sewage indicator end member and Arab Project 67 as agricultural end member. Most of the wells are mainly affected by sewage influences.
Fig. 29 makes this picture clearer. The area Iron Factory was taken as an end-
member for the sewage input, because it is a non-agricultural area, and a lot of nitrate
salts which is used in the salts path for hardening the iron steal (sodium nitrate), is
excreted to the septic tank as well as other human sewage. Moreover, this area is
located in the most far south eastern point with flow direction. Therefore, it is
expected that the groundwater in this area also received the nitrate flushed out from

4: Results and discussion___________________________ _____67
the recharge stream along whole area. Moreover, it was noticed that there is some
septic tanks from houses and factory distributed surround the area. On the other hand,
the Arab projects wells, where there is an extensive agriculture was taken as the other
end member. There were two different trend lines for the two end-members. Other
groundwater samples show a mixing from the two influences in between. Nitrate
values varied with activities and location. The NO3 values increase significantly in the
wells in agricultural and animal farm areas or within the stream of septic tanks (eg.
Sabiru Rantizi well 19-14/06). This well is next to an animal farm and in an area that
has wide agricultural activities and uses pesticides application. The same values are
shown by the Iron factory well which taps the alluvial fans of the Wadi Qilt
interfingering with Lisan formation in the east south of Jericho, has no surrounded
agricultural activities. The well also as mentioned above received the flushed water
out of the whole Wadi stream. The main reason for highly nitrate level is the wide use
of septic tanks. Unsuitable location of septic tanks in this area could be hazardous,
especially as the area is mainly formed by marls and gypsum layers.
The Lisan formation as an aquiclude has highly consolidated sands and evaporates
with a lot of solution conduits in the evaporates, where the pollutants can easily pass
through and reach the alluvial aquifer. The continuous input of potassium in the
groundwater from wells to the east might reflect an agricultural source. Potassium is
added as an element within synthetic fertilizers compounds, where it is elaborated to
absorb by the plants, or infiltrate through the soil profile to the groundwater. Another
additional source of Potassium can be through the suggested brine water described in
the previous section, that up welled from the Arab Project wells in the east of Jericho.
The pesticides also might contain a lot of nitrogenous compounds from which an
additional amount of nitrate can be infiltrate to the groundwater.
The pollution of groundwater by the nitrate from fertilizers has low evidence in the
region, samples for pesticides in groundwater was taken in the same study shows no
synthetic fertilizers or pesticides. This might be referred to the complicated structure
of these chemicals which make it have long persistence in the upper soil environment
without further oxidation reaction or hydrolyses for the chemical particles, more
detailed information about the usage of nitrogen chemical and its effect on the
groundwater in the study area is described in section 4. 3.

4: Results and discussion___________________________ _____68
4. 2. Deuterium and Oxygen Isotopes
The local precipitation line (δD = 8.1 δ18O + 19.5) (Fig. 30 and 31) from the
precipitation of the main recharge area at the Palestine eastern mountains of
Jerusalem-Ramallah (Abu Dees Station), shows a nearly closed slope to the
Mediterranean Meteoric Water Line δD = 8 δ18O + 22 (Gat and Dansgaard, 1972),
suggesting nearly the same evaporation trend of the precipitation during the storm
events. Although the data (Table 6) show no significant variation in δ18O signature
between 2 sampling times in dry and wet season. However, the isotopic signature for
deuterium exhibits a slight shifting toward more enriched signatures (Figs.30 and 31).
In dry season the isotopic signatures of δD and δ18O for the springs fall nearly on
the local precipitation line, indicating no further evaporation of the recharged water
and confirm more direct infiltration without any alteration. The values for the
Pleistocene wells distributed in Jericho plain have more enriched values. These values
are distributed along a mixing line that has been calculated between ’Arab project well
67’ as a brackish water end member and ‘Samed’ well to the west as fresh end
member. The heavier (less negative) isotopic signature in the wells of Arab project in
the east shows also a high Cl- content, where the wells of less saline wells in the west
shows more depleted signatures at the same line. There were some scattered values
distributed around, most of these values also show low chlorine content. The seasonal
variation of enriched deuterium signatures (Fig. 30) put forward two possibilities: One
is the variation within rain events but this is not possible in the area because there is
no seasonal rain and all the precipitation events occur in winter under the same
conditions. The other possibility is related to a fractionation process which only
effects on deuterium. Such process was defined by Coplen and Hanshaw (1973) as
‘ultrafiltration’. Hoefs (2004) shows that the hydrogen isotopes fractionation is
affected by the absorption of water on mineral surfaces due to the tendency for clay
and shales to act as semi permeable membranes.
The fractionation of hydrogen isotopes occur during this process in such a way
that the residual water will be enriched in deuterium due to the preferential adsorption
of lighter hydrogen isotopes, this process has no effect on the oxygen isotopes (Fig.
30). During the continuous recharge in wet season the increasing of hydraulic pressure
flush out the residual older water

4: Results and discussion___________________________ _____69
Table 6: δ2H and δ18O values for groundwater samples of the Jericho area in wet and dry seasons (March, 2004 and October, 2003 respectively).
Dry Season (October , 2003) Wet Season (March, 2004) Site Well Code
TDS δ18O δ 2H TDS δ18O δ 2H
Arab Project66 (East) 19-14/066 3282.01 -5.39 -26.1 3165.95 -5.4 -23.5
Arab Project67 (East) 19-14/067 3385.98 -5.29 -25.4 3582.51 -5.28 -22.6
Arab Project73 (East) 19-14/073 2292.6 -5.36 -26.7 2292.55 -5.39 -23.2
Fahmi Nahas48 (Qilt West) 19-13/048 999.907 -5.38 -26.2 996.007 -5.39 -23.6
Fahmi Nahas47 (Qilt West) 19-13/047 1002.67 -5.39 -26 990.155 -5.41 -24
Sabiru Rantizi (Qilt East) 19-13/006 1419.22 -5.5 -26.7 1484.55 -5.55 -25.9
Fahed Hishmi (Qilt East) 19-13/015 1445.43 -5.46 -26.3 1431.73 -5.44 -23.8
Zuhdi Hashwa (Qilt East) 19-13/052 1610.67 -5.44 -26.6 1680.79 -5.44 -24.1
Salah Arouri (Qilt West) 19-14/012 971.603 -5.5 -25.9 931.3 -5.51 -24.1
Basil Husaini20 (Qilt West) 19-13/020 1116.02 -5.27 -26.6 1055 -5.28 -23.9
Basil Husaini18 (Qilt West) 19-13/018 795.886 -5.48 -27.7 820.514 -5.44 -23.7
Ibrahim Daek (Qilt East) NW 1956.52 -5.23 -26.4 1990.26 -5.22 -23.4
Iron Factory (Qilt East) 19-13/26a 1192.54 -5.52 -27 N D N D N D
Ein Sultan (West) AC/061 530.125 -5.87 -28.1 533.46 -5.96 -26.1
Ein Dyouk (West) AC/060 510.543 -5.87 -28.1 565.88 -5.96 -26.2
Awni Hijazi (East) 19-14/052 1832.44 -5.5 -27.7 1810.79 -5.48 -24.8
Saeed Aladeen (North) 19-14/062 1587.83 -5.54 -27.6 1486.9 -5.55 -25.1
Mohammed Masri (North) 19-14/038 1367.18 -5.54 -27.3 1458.01 -5.52 -25.7
Samed (West) 19-14/26a 859.517 -5.56 -27.8 852.339 -5.52 -24.6
Arab Project69 (East) 19-13/069 2406.16 -5.54 -28.3 2486.86 -5.52 -23.6
Abdallah Araikat (North) 19-14/049 1492.83 -5.54 -25.7 N D N D N D
Awn Hijazi 19-14/37 N D* N D N D 1832.44 -5.27 -22.8
Saleem Nimmari 19-13/49 N D N D N D 1587.83 -5.51 -24.1
Qasir Hisham 19-13/003 N D N D N D 1367.18 -5.49 -24
Bail Hussaini22 19-13/22 N D N D N D 859.517 -5.27 -23.4
Mahmud Akramawi 19-13/50a N D N D N D 2406.16 -5.45 -23.9
Bail Hussaini21 19-13/21 N D N D N D 1492.83 -5.22 -23.1
*N D: no data available (no sample was taken).

4: Results and discussion___________________________ _____70
This water which sampled in the wet season, which is enriched in deuterium by
Ultrafiltration process washed out along the aquifer, replaced by the new recharge
water in the upper layer. On the other hand, Gat (1998) suggests what is named
Isotope Transfer Function (ITF) effect as a main cause for modifying the isotopic
composition in arid environment and wet lands with surface runoff. The behaviors of
isotopes show that the rain fall in the top of the mountains and along the wadis is
partitioned into singular fluxes of surface run off. The water infiltrates through soil
and sinkholes at different distances from the main recharge point into the ground.
The isotopic signature is shifted due to such processes as a result of evaporation
during runoff and due to the selective utilization of rainfall with different isotopic
signatures, which are varying with distance. δ 2H and δ18O for the springs in the west
indicates different recharge and infiltration mechanisms compared to other wells in the
lower plain Dead Sea Group. The springs, as described in the section of hydrogeology,
are an outcrop of the regional mountain aquifer through rain water that infiltrated to
the Upper Cretaceous aquifer, where the shallow Pleistocene aquifer is mainly fed
through the infiltrated surface water runoff that drained through wadis from the same
recharge area of the springs. Normally the drained water through wadis runoff runs for
a long distance and infiltrats in the shallow Samra aquifer or alluvial fan layer in the
lower plain of the study area. The shifting from the local meteoric water line for the
shallow wells (Fig. 32) caused mainly by the climate of the area which characterized
by low humidity and highly evaporation rate in the lower and warmer area of Jericho
plain, thus the isotopes undergoes further fractionation through evaporation in the run
of path and tends to be more enriched. The signature for the springs fell directly on the
LMWL (the same as the precipitation signatures), while wells have shifted signatures
that forming a semi-linear trend closed to that of calculated mixing line from fresh
water in the west to brackish water in the east. The primary shifting in the wells
groundwater signatures can be explained by the Isotope Transfer Function (ITF)
according to Gat (1998), due to the high evaporation from drainage draught in the
wadis as well as the irrigation channels in this semi-arid area. This ITF effect can be
distinguished from the normal evaporation effect, which normally occurs as gradual
deviation in the isotopic signatures from the LMWL forming a new slope of ~5. While
in the study area the surface run off cut a long distance through wadis, where part of it
infiltrated to the upper mountain aquifer, and the remained part (isotopic heavier due
to evaporation) feed the shallow aquifer at different distances forming a shifted line.

4: Results and discussion___________________________ _____71
Fig. 30: Seasonal comparative trends for isotopic signatures of δ 2H and δ18O the trend shows nearly no significant change in δ18O and a shifting in δ 2H toward more enriched values in the wet season due to the process of ultrafiltration, (Hoefs, 2004).
Fig. 31: Seasonal variation of groundwater isotopic signatures around LMWL, the shifted δ 2H values located as a parallel line on the left of LMWL, where the dry season samples located in a separate line to the right of the LMWL, this line shifting is depend on the process of ultrafiltration which effect only on the hydrogen but not Oxygen isotopes .

4: Results and discussion___________________________ _____72
Fig. 32: Isotopic signature of the wells and springs in dry season. The signature for the springs fell directly on the LMWL, while wells have shifted signatures that forming a semi linear trend close to that of calculated mixing line from fresh water in the west to brackish water in the east. The primary shifting in the groundwater signatures of the wells can be explained by the Isotope Transfer Function (ITF) according to Gat (1998), which mean that all the wells are fed by the surface runoff water which was exposed to evaporation along the drainage path (water origin either from precipitation runoff from the upper mountains through wadis or spring discharge through the irrigation channels).
The shifting in isotopic composition of oxygen and hydrogen formed a parallel line
to that of meteoric water line. This trend also goes toward more positive isotope ratios
in the eastern wells and fitting the calculated brackish water mixing line between the 2
end members, which suggest an effect of salts and brackish water in the east. Even
though, the figure shows different scattered values which have more enriched oxygen
isotopes signatures. These enriched signatures reflect those wells that coincident
within intensive agricultural activities and effected by irrigation backflow that
contains heavier water due to further evaporation process and/or the presence of
agricultural pollutants.

4: Results and discussion___________________________ _____73
Fig. 33: Sr/Ca molar ratio vs. δ18O suggest three inputs to the groundwater, the brackish water cause the main significant effect on δ18O signature, most of the wells undergo a mixing between the three end members.
Fig. 34: δ18O vs. NO3/Cl molar ratio shows two separate trends, one is an anthropogenic effect and the other salinisation effect.

4: Results and discussion___________________________ _____74
Fig. 33 shows the relation between the molar ratios of Sr/Ca versus δ18O, and the
distribution of the groundwater samples between three end members. The figure
shows that the δ18O values were mainly affected by the brackish water evolution to the
east, where the enriched δ18O signatures were combined with high Sr/Ca molar ratio
close to these of brines which is ~1*10-², while the fresh water end member of
‘Samed’ well shows a Sr/Ca ratio of 2.6 *10-³ which is close to fresh water ratio of
2-4*10-³ (Siemann and Schramm, 2002). Even though some other wells show the
same signatures between the end members triangular, this can be referred to a mixing
from other anthropogenic sources and salts leachate of Lisan layers.
Fig. 34 is emphasizing the anthropogenic effect on the groundwater. It shows two
different trends. One trend is bearing the calculated mixing line with brackish water
and salts, and the other trend represents the anthropogenic effect with most of the
scattered enriched values. The most important characteristic for these scattered wells
is the low amount of chloride which means low evidence of brackish water exposure,
thus the other minor anthropogenic influences is clearly expressed. These wells also
show a highly content of boron, nitrate and bromide. All of these indicators beside the
enriched δ18O values suggest a different heavy water input from sewage and irrigation
backflow.
4.3. Nitrogen Isotopes
Nitrate concentrations, δ15Nnitrate and δ18Onitrate for groundwater samples taken in both
wet and dry season are shown in Table 7. The nitrate concentrations vary spatially
depending on the well location and surrounding activities, ranging between 10 to 100
mg/l in the wet season and from 7 to 72 mg/l in dry season. Both samples series show
no significant change in the isotopic signature, where the values scattered nearly
around the same trend line and shows the same behavior with the same sources more
or less (Fig. 35). The δ15Nnitrate values ranged from +3.0 to +15.78 ‰. Oxygen isotope
ratios of nitrate were around +3.3 to +8.5 ‰. Two of the samples exceed this range
where they show signatures of +13.9 ‰ and +14.7 ‰. These two anomalous
signatures belong to the samples which have very low nitrate values. Nitrate in the
environment has various sources, including atmospheric deposition, soil organic
nitrification, fertilizer, sewage and manure. Nitrate from each of these sources is
typically characterized by a distinct isotopic signature.

4: Results and discussion___________________________ _____75
Table 7: Nitrate concentrations, δ15Nnitrate and δ18Onitrate for groundwater samples of the Jericho area.
Dry Season Wet Season Location Well Name Well Code
Nitrate (mg/l) δ15Nnitrate δ18Onitrate Nitrate (mg/l) δ15Nnitrate δ18Onitrate
West spring Ein Dyouk AC/060 29.07 10.48 ‰ 3.9 ‰ 55 10.1 3.9
West spring Ein Sultan AC/061 42.46 10.08 ‰ 3.3 ‰ 48 9.8 4
JerichoNorth Saeed Aladeen 19-14/062 5.18 10.12 ‰ 13.9 ‰ 20 12.7 10
JerichoNorth Mohammed Masri 19-14/038 7.5 2.99 ‰ 14.7 ‰ 10.5 3 13
Jericho West Samed 19-14/26a 15.97 15.78 ‰ 8.5 ‰ 41 11.3 6.4
Jericho East Abdallah Araikat 19-14/049 30.58 8.14 ‰ 3.4 ‰ N D N D N D
Jericho East Awni Hijazi 19-14/052 34.07 9.99 ‰ 4.9 ‰ 50 8.9 4
Qilt West Basil Husaini 19-13/018 29.08 8.29 ‰ 5.2 ‰ 52 7.7 4.8
Qilt West Basil Husaini 19-13/020 49.38 6.89 ‰ 3.4 ‰ 65 6.8 3.9
Qilt West Fahmi Nahas 19-13/047 43.73 6.94 ‰ 3.8 ‰ 71 6.6 3.8
Qilt West Fahmi Nahas 19-13/048 41.67 7.42 ‰ 3.8 ‰ 61 7.1 4.3
Qilt West Salah Arouri 19-14/012 40.54 8.47 ‰ 4.3 ‰ 70 7.5 4
Qilt West Sabiru Rantizi 19-13/006 72.71 9.29 ‰ 2.3 ‰ 100 8.2 2.8
Qilt East Zuhdi Hashwa 19-13/052 46.55 7.7 ‰ 4.3 ‰ 79 7.6 6
Qilt East Fahed Hishmi 19-13/015 33.24 8.5 ‰ 4.8 ‰ 50 7.5 4
Jericho East Arab Project 19-13/069 24.51 10.9 ‰ 7.3 ‰ 43 10.2 7.2
Qilt East Iron Factory 19-13/26a 70.13 9.64 ‰ 5.2 ‰ N D N D N D
Qilt East Ibrahim Daek NW 29.68 6.59 ‰ 4.9 ‰ 47 5.9 4.2
Jericho East Arab Project 19-14/067 38.86 7.42 ‰ 4.5 ‰ 51 7 6.2
Jericho East Arab Project 19-14/073 40.41 7.37 ‰ 3.9 ‰ 48 7.1 4.5
Jericho East Arab Project 19-14/066 29.69 9.25 ‰ 5.7 ‰ 38 9 -3.3
Qilt East Awn Hijazi 19-14/37 N D* N D N D 49.5 6.1 2.8
Qilt East Saleem Nimmari 19-13/49 N D N D N D 75 8.1 4.1
JerichoNorth Qasir Hisham 19-13/003 N D N D N D 23.5 8.6 7.8
Qilt East Bail Hussaini22 19-13/22 N D N D N D 50 7.1 4.4
Qilt East Mahmud Akramawi 19-13/50a N D N D N D 54 7.9 5.1
Qilt East Bail Hussaini21 19-13/21 N D N D N D 95 10.3 4.2
*N D: no data available (no sample was taken)

4: Results and discussion___________________________ _____76
Typical δ15Nnitrate values for chemical fertilizers range from –4 to +4‰, for human
and animal waste it has a wide range between +7 and more than +30‰, and from less
than –10 to +4‰ for soil nitrate. δ18Onitrate values for atmospheric deposition is > +25
‰. While for chemical fertilizers this is about +18 to +22‰, and for human and
animal waste and soil nitrate it ranges from -10 to +10‰ (Fig. 36) (Fritz and
Clark,1997). Hence, the isotopic composition of nitrate constitutes a useful tracer for
determining its sources, provided that, no alteration of isotopic ratios by
biogeochemical reactions, such as denitrification has occurred.
Except two wells in the north, most of the isotopic signatures for the sampled wells
and springs suggest sewage or manure as a main source responsible for the higher
nitrate concentrations, with δ15N values > +7‰, and δ18Onitrate between +3‰ and +6‰.
Samples also show a slight denitrification process where this process was significant
in the Samed well (Fig. 37, 38). This was clear for the samples of dry season and
mainly might refer to the period of sampling which was held by the end of summer,
where there was nearly no recharge and thus the groundwater is stored in the reservoir
for the months of the dry season. The values in Fig. 39 a. and b. show a slight increase
in δ15Nnitrate with decrease of [NO3-], whereas δ18Onitrate also shows the same increment
trend with decreasing [NO3-]. These combined trends favored the presence of slight
denitrification within the aquifer, where the heavy isotopes 15N and 18O are
preferentially retained in the remaining nitrate (Böttcher et al., 1991). Sewage is
considered as a direct source of nitrate as it contains a high amount of urea and other
organic and inorganic nitrogenous compounds. Manure in the presence of aerobic
condition in shallow aquifers is also another source of nitrate which originates by
oxidation process. The presence of many animal farms especially in Wadi Qilt east
and Ein Dyouk area confirm this suggestion, because of using animal manure as
natural fertilizers (Fig. 36). The wells in the north show relatively small nitrate
concentrations, and much higher δ18Onitrate values (Fig. 38b.). This might indicate a
different (non-continuous) nitrate sources, in which nitrate might persist for a long
time within the groundwater of these wells. The isotopic signature shown by these
wells bearing the signature of chemical fertilizers, even though these signatures
become more depleted than this of the fertilizers signatures due to a mixing with other
signature of different sources such as sewage. Moreover, the source which yielding
lower nitrate concentrations could also represent the residual nitrate from bacterial
denitrification of sewage or manure, which give these high δ18O values above +12‰.

4: Results and discussion___________________________ _____77
Fig. 35: δ15Nnitrate vs. δ18Onitrate, from the water samples of dry and wet season show more or less the same trend.
Fig. 36: Groundwater pollution by nitrate sources in Jericho area.

4: Results and discussion___________________________ _____78
Fig. 37: δ15Nnitrate vs. δ18Onitrate, isotopic composition of major nitrate sources (Clark, 1997)
Fig. 38: δ15Nnitrate vs. δ18Onitrate, most of the isotopic signatures lay within the range of sewage and manure with slight denitrification process. 2 wells show a mixing signature of fertilizers with other sources

4: Results and discussion___________________________ _____79
Fig. 39 a, b: 1/ρ[NO3] in L/mg vs. δ15Nnitrate and δ18Onitrate, most of the wells and springs show no significant differences within the isotopic signature, except in Samed well where it shows low nitrate level with more enriched signature, which reflect a denitrification process. Jericho Nuwe’meh north wells shows low nitrate concentration with a higher δ18Onitrate signatures which reflect a mixing signature from other sources.
(a)
(b)

4: Results and discussion___________________________ _____80
4. 4. Sulphur Isotopes
The isotopic components of δ34S and δ18O in sulphate from both sampling times, as
well as the concentrations of sulphate are shown in Table 8. The eastern wells show
sulphate concentrations that vary between 100-320 mg/l and chloride concentrations
between 800 to 1800 mg/l, while the wells to the west are less mineralized between
20-90mg/l for sulphate and 100-750 mg/l for chloride. The isotopic signatures show
the same trend in both sampling periods, where no significant differences have been
observed in both period of sampling (Fig. 40 and 41).
-15
-10
-5
0
5
10
15
19-14
/066
19-14/0
67
19-14
/073
19-13
/048
19-13
/047
19-13
/006
19-13
/015
19-13
/052
19-14
/012
19-13
/020
19-13
/018 NWAC/061
AC/060
19-14/05
2
19-14
/062
19-14
/038
19-14
/26a
19-13
/069
Sample Code
d34S
(SO
4)
West SeasonDry Season
0
2
4
6
8
10
12
14
16
18
20
19-14/0
66
19-14/06
7
19-14
/073
19-13
/048
19-13
/047
19-13/0
06
19-13/0
15
19-13/05
2
19-14
/012
19-13
/020
19-13
/018 NW
AC/061
AC/060
19-14
/052
19-14
/062
19-14
/038
19-14/2
6a
19-13/0
69
Well Code
d18O
(SO
4)
Dry SeasonWet Season
Fig. 40: Variation of δ34S in sulphate between wet and dry season.
Fig. 41: Variation of δ18O in sulphate between wet and dry season.

4: Results and discussion___________________________ _____81
Table 8: The concentration of sulphate mg/l, and the isotopic signatures of S and O in dissolved sulphate in groundwater in wet and dry seasons.
Dry Season Wet Season
Site Well Code SO4
-2 (mg/l) δ 34S(SO4) δ 18O(SO4) SO4
-2
(mg/l) δ 34S(SO4) δ18O(SO4)
Arab Project66 (East) 19-14/066 300.9 -9.7 13.5 285 -8.1 13.2
Arab Project67 (East) 19-14/067 183.4 -2.2 12.3 221 -0.8 12
Arab Project73 (East) 19-14/073 95.9 6.0 16.3 111 6 17.8
Fahmi Nahas48 (Qilt West) 19-13/048 70.0 5.7 16.1 82.7 5.9 17.5
Fahmi Nahas47 (Qilt West) 19-13/047 77.2 6.9 16.3 82.2 6.9 17.2
Sabiru Rantizi (Qilt East) 19-13/006 117.6 3.5 16.8 153 2.9 17.7
Fahed Hishmi (Qilt East) 19-13/015 60.8 9.7 17.3 62.1 10.4 18.8
Zuhdi Hashwa (Qilt East) 19-13/052 166.0 -5.9 17.3 194 -7 17.6
Salah Arouri (Qilt West) 19-14/012 59.2 4.6 16.9 64.5 7.2 17.7
Basil Husaini20 (Qilt West) 19-13/020 110.1 3.6 16.8 120 4.5 18
Basil Husaini18 (Qilt West) 19-13/018 58.6 -1.3 17.0 71.4 -1.1 15.9
Ibrahim Daek (Qilt East) NW 167.7 7.7 16.6 189 6.1 17.1
Iron Factory (Qilt East) 19-13/26a 90.0 -5.1 3.3 N D N D N D
Ein Sultan (West) AC/061 17.2 8.7 15.0 24.1 6.7 14.4
Ein Dyouk (West) AC/060 16.7 6.0 9.9 23.8 7.8 9.9
Awni Hijazi (East) 19-14/052 72.1 12.5 14.0 76.5 11.8 15.5
Saeed Aladeen (North) 19-14/062 40.6 6.7 14.9 43.5 5.7 16.2
Mohammed Masri (North) 19-14/038 39.6 5.9 12.0 44 5.2 12.1
Samed (West) 19-14/26a 22.6 10.0 11.3 20.9 9.9 10.8
Arab Project69 (East) 19-13/069 103.8 3.8 13.9 109 5.5 15.1
Abdallah Araikat (North) 19-14/049 92.7 9.5 12.7 N D N D N D
Awn Hijazi 19-14/37 N D N D N D 117 9.8 18.6
Saleem Nimmari 19-13/49 N D N D N D 66.2 10.9 17.8
Qasir Hisham 19-13/003 N D N D N D 52.6 9.6 17.3
Bail Hussaini22 19-13/22 N D N D N D 222 -1.1 15.4
Mahmud Akramawi 19-13/50a N D N D N D 109 -0.2 -3.8
Bail Hussaini21 19-13/21 N D N D N D 172 4.8 17.5
*N D: no data available (no sample was taken)
The δ34S values of sulphate eluted from the Lisan samples J04-X, J03-I, J03-Z and
J04-Q range from 9.8%° to 16.6%°, while δ18O vary around 16%°. In contrast, the

4: Results and discussion___________________________ _____82
sulphate for the two Samra samples J04-Y and J04-Z are more depleted with δ34S
signatures of 6.9 and 9.1 ‰ and 1.4 and 9.1 for δ18O. Most of the samples including
springs and wells range between -2.2 to +12.5‰ in δ34S and +3.3 to +17.3 ‰ in δ18O
which is close to the eluted sulphate from the Lisan and Samra formation (Fig. 42).
However, the wells laying further to the east and south east, particularly the Arab
project wells (highly brackish water signatures), show a high depletion in 34S to -10
‰ in parallel with high sulphate concentrations.
Fig. 42: The isotopic signatures of sulphate in groundwater and in eluates from solid samples. Primary sulphate dissolution from the Lisan and partially Samra formation are enriched in δ34S and δ18O, while disseminated sulphate from secondary gypsum and oxidized pyrite has more depleted signatures.
The isotopic signatures of sulphate from groundwater samples could be signatures
of Lisan, Samra and flooding water. High sulphate concentration in the groundwater
from the Pleistocene aquifer is mainly a result of Lisan sediment dissolution which
contributes to the system in a form of salt leachate (Marie, 2001).

4: Results and discussion___________________________ _____83
The in situ water rock interaction is considered one of the main contributors in the
process of salinisation, where the isotopic signature of δ34SSULPHATE and δ18OSULPHATE
for the most of samples are coincident within the range of the solid samples signature
(Fig. 42). These reflect dissolution of sulphate from Lisan gypsum and anhydrite. The
seepage water from the upper surface runoff and irrigation back flow infiltrates
through the Lisan and Samra layers forming a saline leachate (relatively less chloride
contents) that contains sulphate with positive δ34SSULPHATE signatures (Fig. 43).
However, some wells in the eastern part of the study area shows more depleted
sulphur signatures which reach -10‰. These depleted signatures show an additional
sulphate source.
Gavrieli et al. (1998), reported a range between 14-28‰ in δ34S signature for the
primary gypsum layer in Lisan, and more depleted δ34S signature for the disseminated
secondary gypsum within the layers of the Lisan, which reach -26 ‰. Thus the
obtained depleted values in this study could be mixed signatures between these
sulphates from the two gypsum sources. Farber et al. (1989), also suggested a mixing
between two different sulphate sources with mixed δ34S signatures in the southern
Jordan valley, they distinguish between a hypersaline brine with a signature of 6-10‰
and a sulphate rich groundwater of >200 mg/l with depleted signature of -17‰ in
Wadi Malih further to the north of Jericho. However, the results from the
groundwater in Jericho don't reflect any influence or a mixing between such two
sources.
In the west and middle of Jericho data show positive signatures, bearing the
signatures of eluted solid samples of Lisan but with relatively low chloride content
and high Na/Cl, Br/Cl molar ratios (Khayat et al., 2005), that couldn’t reflect the
presence of the suggested saline effluent. Moreover, the groundwater which show
more depleted δ34S signatures in the east contain a relatively high chloride content of
more than 1800mg/l and SO4 concentration reach to 320 mg/l with Br/Cl, Na/Cl molar
ratios of .006 and 0.4 respectively (Khayat et al., 2005). These different signatures in
the west and the east of the study area and the differences in solutes contents and
molar ratios suggest two different inputs of sulphate to the system with a degree of
mixing between them (Fig. 43). In such case the isotopic signatures couldn't definitely
confirm the sources of any estimated sulphate rich brine.

4: Results and discussion___________________________ _____84
0 80 160 240 320 400
SO4 (mg/l)
0
400
800
1200
1600
2000
Cl (
mg/
l)D
D
D
II
JJ J
II
I
J
J
AA
DC
C
A
D
C
LegendLegend
A Springs and Jericho West
I Wadi Qilt West
J Wadi Qilt East
C Jericho North
D Arab Project East
Fig. 43: Chloride vs. SO4-2 in mg/l. The figure shows related to chloride content
two different sources for sulphate.
The relation between sulphate and δ34S (Fig. 44) can appraise these two inputs,
where some of the signatures especially from those wells of Arab project have high
depleted values with high sulphate content.
This contradictory relation, in which sulphate values getting higher and are
relatively depleted in δ34S signatures, reflect a mixing signature of the secondary
gypsum and primary gypsum dissolution, which could be leached upward under heavy
abstraction, and upper surface leachate of primary gypsum. The previous
hydrochemical study shows that the water samples from some of the eastern wells
were relatively enriched with iron (Khayat et al., 2005), which can give an indication
for additional possible source of sulphate that originate from pyrite oxidation source
(Clark, 1997). The groundwater in the wells to the east might interact with deeper
pyrite rich water (highly chloride content), which is in contact with the deep salty
rocks or in aquiclude chamber for a prolonged period of time. This water is welling up
from an anoxic environment holding the sulphide, which is oxidized to sulphate in the
shallow environment of the upper aquifer. The given depleted signatures of
δ 34SSULPHATE and δ 18OSULPHATE in some wells to the east, suggest a sulphate that is
Primary Gypsum surface seepage
Pyrite Oxidation and Secondary Gypsum

4: Results and discussion___________________________ _____85
derived from disseminated secondary gypsum and/or from other sulphur compounds
coning up from a deep anoxic environment and being oxidized in the shallow aquifer.
Both of the above mentioned sources give the indication about an interaction
between the upper groundwater layer and a deeper saline layer.
On the other hand, the seepage water from the upper surface runoff and irrigation
back flow infiltrate within the Lisan and Samra layers forming a saline leachate
(relatively less chloride contents) that contains sulphate with positive δ34SSULPHATE
signatures (Fig. 45).
Fig. 44: δ 34SSULPHATE vs. [SO4]-1. The depleted δ 34SSULPHATE values indicate pyrite oxidation while the enriched δ 34SSULPHATE values indicate sulphate from primary gypsum in Lisan and Samra formations.

4: Results and discussion___________________________ _____86
Fig. 45: Illustration for the main two different sources or contribution mechanisms of sulphate into the groundwater from Pleistocene aquifer in Jericho area.
4. 5. Carbon Isotopes (13C/12C)
The concentrations of bicarbonate, as well as the isotopic signatures of δ13C in
dissolved inorganic carbonate from groundwater in wet and dry seasons are shown in
Table 9. The atmosphere is the smallest global reservoir of carbon. Craige and Keeling
(1963), and Friedli et al. (1986), identified the isotopic signature δ13C of atmospheric
CO2 about -6.4‰. This value nowadays has been changed to slightly more negative
values due to the burning of fossil fuel.
Normally when water infiltrates to the subsurface it equilibrates with soil CO2
which produces from the plant root respiration and bacteria oxidation. The soil CO2
has normally a higher partial pressure than atmospheric CO2 and gives the CO2 a
significant depleted isotope signature, which follows the photosynthesis of plants and
the resulting carbon.
In most cases this signature is around -25‰ because plants with C-4 cycle of
photosynthesis is outweighed. In regions where predominantly C-3 plants like grass or
maize is growing the CO2 has a δ13C signature of around -16‰ (Kalin, 1996).

4: Results and discussion___________________________ _____87
Table 9: The concentration of HCO3, Sr and Rb in mg/l, and the isotopic signatures of δ13C in dissolved inorganic carbonate from groundwater in wet and dry seasons.
Dry Season Wet Season Site Well Code CO3
-2
(mg/l) δ 13C(CO3)
CO3-2
(mg/l) δ 13C(CO3)
Sr
(mg/l)
Rb
(mg/l)
Arab Project66 (East) 19-14/066 439,2 -9,56 409,31 -9,3 3,173 0,06
Arab Project67 (East) 19-14/067 366,61 -9,1 405,04 -9,6 2,753 0,07
Arab Project73 (East) 19-14/073 405,65 -10,2 386,13 -10,2 1,729 0,05
Fahmi Nahas48 (Qilt West) 19-13/048 347,7 -10,2 317,81 -11,3 1,896 0,01
Fahmi Nahas47 (Qilt West) 19-13/047 355,02 -10,7 322,69 -10,7 2,054 0,01
Sabiru Rantizi (Qilt East) 19-13/006 376,37 -10,5 342,21 -10,2 3,415 0,01
Fahed Hishmi (Qilt East) 19-13/015 378,81 -9,7 337,33 -10 1,775 0,03
Zuhdi Hashwa (Qilt East) 19-13/052 369,05 -9,84 349,53 -9,4 3,358 0,02
Salah Arouri (Qilt West) 19-14/012 417,85 -10,6 342,21 -10,4 1,814 0,01
Basil Husaini20 (Qilt West) 19-13/020 349,53 -9,3 317,2 -10,8 1,366 0,01
Basil Husaini18 (Qilt West) 19-13/018 304,39 -10,7 292,8 -11,3 1,226 0,01
Ibrahim Daek (Qilt East) NW 376,37 -9,8 369,05 -10,1 2,241 0,03
Iron Factory (Qilt East) 19-13/26a 259,25 -8,9 N D N D 4,308 N D
Ein Sultan (West) AC/061 295,24 -12,4 266,57 -12,8 0,1176 BDL**
Ein Dyouk (West) AC/060 287,31 -12,7 293,41 -13 0,117 BDL**
Awni Hijazi (East) 19-14/052 380,03 -10,2 417,85 -10,6 2,654 0,03
Saeed Aladeen (North) 19-14/062 364,17 -11,1 393,45 -12,5 1,032 0,02
Mohammed Masri (North) 19-14/038 380,03 -11,6 403,21 -12,1 1,116 0,02
Samed (West) 19-14/26a 437,37 -12,1 412,97 -12,8 0,4578 0,01
Arab Project69 (East) 19-13/069 418,46 -9,57 415,41 -9,2 1,809 0,05
Abdallah Araikat (North) 19-14/049 364,78 -11,9 N D N D 1,127 ND
Awn Hijazi 19-14/37 N D* N D 383,69 -10,9 1,867 0,04
Saleem Nimmari 19-13/49 N D N D 385,52 -9,7 1,126 0,03
Qasir Hisham 19-13/003 N D N D 349,53 -12,1 1,42 0,02
Bail Hussaini22 19-13/22 N D N D 344,65 -10 2,178 0,03
Mahmud Akramawi 19-13/50a N D N D 406,26 -7,4 1,946 0,03
Bail Hussaini21 19-13/21 N D N D 349,53 -9,8 1,764 0,03 *N D: no data available (no sample was taken) **BDL: below detection limit.

4: Results and discussion___________________________ _____88
Dissolution of soil CO2 in the infiltrating rain water normally produces carbonic
acid, thus lowering the pH, and increases the weathering capacity of the soil water;
mainly it dissolves the soil limestone according to the following formulas:
CO2 + H2O + CaCO3 Ca2 +2HCO3 (5)
Marine carbonates have δ13C content similar to the reference VPDB with a
signature of ~0‰. The carbonate signature of the infiltrated water within the soil
profile will have a δ13C signature according to their origin (marine, caliche, soil). The
signature of the soil varies as mentioned above according to area condition and the
vegetation. The Jerusalem Ramallah mountain area (the Upper Cretaceous formation
west of the study area) is considered as fertile area with a lot of precipitation and high
soil organics. In such case the carbonate isotopes signature for the infiltrated water in
the soil profile from this area is originated from marine (~0‰), caliche (~ -7‰),
organic (~ -22‰) or an intermediate signature by mixing of these sources (~ -12‰).
This signature can be found in the groundwater samples of the springs freshwater end
member.
Fig. 46: Distribution of cations and anions from different sampling sites.

4: Results and discussion___________________________ _____89
Kaline (1996) and El-Naser & Subah (2000) were measuring and investigation the
groundwater system on the eastern side of the Jordan River using δ13C and δ14C. They
estimated the δ13C of soil CO2 in the Jordan valley area, as a semi-arid region between
-12 to -16%° (Kalin, 1996), while the δ13C in the sediments around Dead Sea showed
values of ~0 to +1 (El-Naser & Subah, 2000). Therefore, the isotopic signature for the
infiltrated runoff water that feed the shallow Pleistocene aquifer is a function of
(marine carbonate sediments ~+1‰, soil CO2 ~ -16‰ or an intermediate signature by
mixing of these sources (~ -8 ± 1 ‰). This signature reflect the isotopic signature of
δ13C in the brackish water end member of Arab project wells in the east which was
also between -9 to -7‰. The δ13C(DIC) signature influenced by various factors
according to the system condition where the dissolution of minerals occur. In an open
system more exchange of CO2 between the DIC and the soil atmosphere occurs,
whereas if the dissolution take place under closed system, then the δ13C will be
depleted by DIC from the carbonate mineral source. The combination of Pco2,
concentration of DIC and δ13C (DIC) can provide an indication of recharge conditions
(Clarck & Fritz, 1997). In an open system more exchange of CO2 between the DIC
and the soil atmosphere occures, whereas if the dissolution takes place under closed
system, then the δ13C will be depleted by DIC from the carbonate mineral source. The
combination relation between the Pco2, concentration of DIC and δ13C (DIC) can provide
an indication of recharge conditions (Clarck & Fritz, 1997).
In the study area, the isotopic signatures δ13C (DIC) for the springs were about -12‰
which bearing the carbonate mineral signature, whereas the HCO3 values for these
samples were the highest in proportion to other TDS from the same sample with a
portion of 75% of TDS (Fig. 46). The recharge for the springs, as shown in section
4.2., has different infiltration mechanism: as a direct outcrop from the upper mountain
aquifer, where the groundwater infiltrate directly through the soil and reach the deep
saturated zone before it begins desolving calcite, where CO2 lost occurs, as it needed
for the dissolution process) and HCO3 is produced (Equ. 5). There will be no CO2 soil
replinishment at this deep aquifer as the dessolution proceed, and the ammount of
dissolution and the final DIC concentration is lower. This can be shown by the high
mineralization of groundwater from the springs and the high pH as well. This process
also can confirm the karstification character of the upper mountain aquifer, where the
infiltartion process to the water table is fast.

4: Results and discussion___________________________ _____90
“Samed” well 19-14/26a and the north Nuwe’meh wells, very adjacent to the
springs system in the west, show also the same trend with higher HCO3- with δ13C
signatures close to these from the springs with calcareous effect (Figs.46 and 50),
which emphasize that there is a leakage from the calcareous water of the mountains
aquifer, that feed the spring, to the shallow aquifer. This suggests strongly the
contribution of the irrigation backflow from the channels drained from Sultan spring
or means that the method of Golani (1972) about the impervious fault is not definitely
correct (See section 2.5.2.2).
Fig. 47: The relative increase in HCO3 vs. the decrease of calcite saturation from west to east, the increase of the HCO3 caused mainly by the brine water source in the east in addition to the dissolution of calcite, which act as a buffer for the system.
The samples from the shallow aquifer further to the east show different behavior
with regard to carbon system. The shallow nature of the aquifer makes its unsaturated
zone typical for gas and aqueous phases to be coexist. Much more calcite can be
dissolved due to continuous replenishment of CO2 and some HCO3 released, thus the
DIC equilibrium concentration from these wells is much higher. This dissolution
continues slightly along the flow path from the wells in the Wadi Qilt West to the
Arab Project wells in the east faced by additional HCO3 of the brine water source (Fig.
47). The pH gradually gets lower and lower due to CO2 replenishment (Fig. 48). The
additional input of salts which are coming from Lisan Leachate with the δ13C
signature of -9 to -7‰, and mainly rich in Mg, Na and Cl, initiate other mineralization
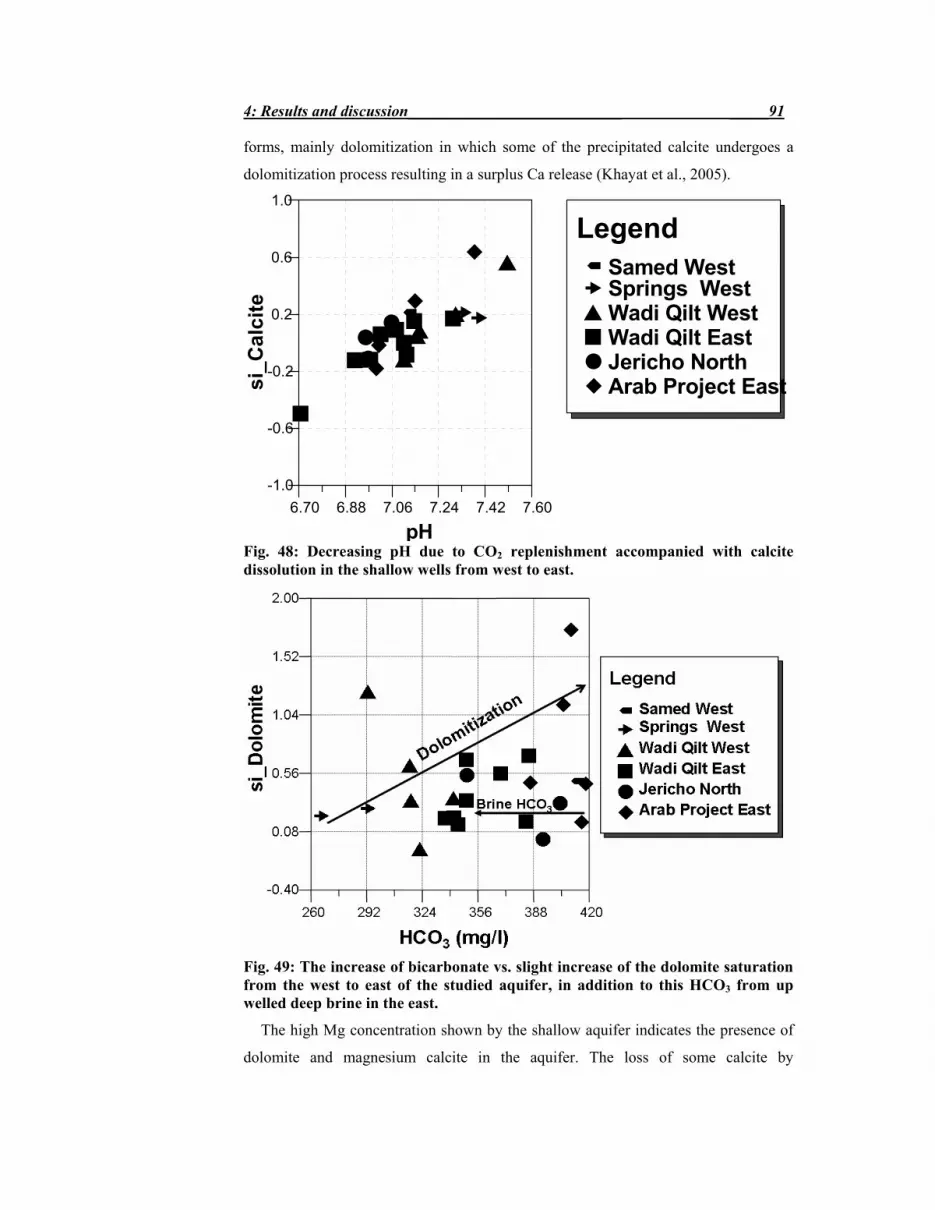
4: Results and discussion___________________________ _____91
forms, mainly dolomitization in which some of the precipitated calcite undergoes a
dolomitization process resulting in a surplus Ca release (Khayat et al., 2005).
6.70 6.88 7.06 7.24 7.42 7.60
pH
-1.0
-0.6
-0.2
0.2
0.6
1.0
si_ C
alc i
teE
E
E AA
DDDA
A
A
DGG
ECC
F
ED
DC
D
D
D
LegendLegendF Samed WestG Springs WestA Wadi Qilt WestD Wadi Qilt EastC Jericho NorthE Arab Project East
Fig. 48: Decreasing pH due to CO2 replenishment accompanied with calcite dissolution in the shallow wells from west to east.
Fig. 49: The increase of bicarbonate vs. slight increase of the dolomite saturation from the west to east of the studied aquifer, in addition to this HCO3 from up welled deep brine in the east.
The high Mg concentration shown by the shallow aquifer indicates the presence of
dolomite and magnesium calcite in the aquifer. The loss of some calcite by

4: Results and discussion___________________________ _____92
dolomitization (Equ. 6) has a minor effect on the δ 13C (DIC) , the gain of dolomite add
carbonate with δ 13C~0‰ to the DIC pool which is lead to dilution of DIC and give
the above this typical δ 13C (DIC) signature for the infiltrated water in the shallow
aquifer (Fig. 49 & 50).
Ca2++Mg2++2HCO3-+CaCO3-+OH-⇒Ca2++HCO3+CaMg(CO3)2 +H2O (6)
Many factors play a role in the changes of DIC pool; these are mainly related to the
suggested sources of salinity described in the previous section, the lithological
formation of Lisan and Samra with brackish Leachate, in addition to anthropogenic
influences in this agricultural and populated area. However it is difficult to show the
importance of the last factor on the carbonate system in the area.
Fig. 50: δ13C vs. bicarbonate in mmol/l, the figure shows two main signatures the depleted one which is represented in the calcareous water from the spring and affected the adjacent wells and more enriched signature which is bearing this signature of brine Leachate in sedimentary aquifer.
In this study, trace elements, rubidium and strontium (alkaline earth metals), were
also used to differentiate between the effects of carbonate minerals transformations
and salt Leachates (Table 9).
The NO3 was also used as an indicator for the anthropogenic influences within the
aquifer. Rubidium is the twenty-third most abundant element in the Earth's crust. It

4: Results and discussion___________________________ _____93
occurs in the minerals pollucite, carnallite, leucite and lepidolite, from which it is
recovered commercially, as well as potassium minerals and brackish waters which
also contain this element.
The Rb normally precipitates in a very late stage of the evaporation sequence
forming the above mentioned minerals. The presence of free Rb in the groundwater
can give an indication of the dissolution of the salts minerals in the groundwater
(Saline Water). On the other hand, strontium comprises about 0.025 percent of the
Earth's crust. Although it is widely distributed with calcium, and carbonate minerals,
there are only two principal ores of strontium alone, celestite (SrSO4) and strontianite
(SrCO3).
The presence of high strontium in the groundwater can give an indication of
elaborated Sr due to demineralization of carbonate minerals. Rb/CO3 and Sr/CO3
molar ratios were used to trace the effect of mineral salts Leachates which mainly has
a highly Rb/CO3 ratio in relative to higher Sr/CO3 resulted from carbonate minerals
transformations (Fig. 51).
The NO3/ Ca molar ratio vs. δ13C was also used to trace the anthropogenic
influences on the carbon system of the groundwater (Fig. 52); the elaborating Ca also
can give an indication about the carbonate minerals dissolution.
Obviously, 3 main factors affect the carbon system in the Pleistocene aquifer:
- The influence of calcareous rock (Cenomanian formation), which affects mainly
the springs and adjacent wells in the west and north. This is characterized by low
Sr/CO3 molar ration and depleted δ13C ≈-12‰ (Fig. 51).
- The anthropogenic influence indicated by the low pH value and high NO3/Rb
molar ratio and δ13C between -10 and -11‰ (Figs. 48 and 52).
- The salts leachate influence, mainly in the eastern wells, with a high Rb/CO3
molar ratio and δ13C ≈ -7‰ (Fig. 51).
- The mineral transformation influences (dissolution, dolomitization), which is
characterized by high Sr/CO3 molar ratio and δ13C ≈ -9‰ (Fig. 51).

4: Results and discussion___________________________ _____94
Fig. 52: δ13C vs. NO3/Ca molar ratio, the figure shows two trends with different NO3 content.
4. 6. Seasonal Variation
The goals of the two seasons sampling study have been to done for measurements
quality assurance as well as to evaluate seasonal trends in major minor and trace
Fig. 51: Sr/CO3 vs. Rb/CO3 molar ratios, the figure shows the mixing between three main factors that control the carbon system in the aquifer.

4: Results and discussion___________________________ _____95
element geochemistry in addition to isotopic signatures, with the focus on
understanding the behavior of different tracers in the groundwater. The preliminary
results shown in this study indicate that the majority of chemical constituents,
including parameters such as pH and specific conductivity, remained fairly constant
throughout this study. These data suggests that the groundwater has not been
influenced by seasonal variations in the local water table heights, and that the “time
dependent” oxidation reduction reactions of primary sulphur and nitrogen compounds
has no big role in variations in groundwater chemical contents in the sampled
groundwater.
The isotopic signatures behave always the same except the signatures of deuterium
and the isotopes of nitrate. The seasonal variation of enriched deuterium signatures
put forward possibility of a fractionation process which only effects on deuterium.
Such process is defined as ‘ultrafiltration’. Hoefs (2004) shows that the hydrogen
isotopes fractionation is affected by the absorption of water on mineral surfaces due to
the tendency for clay and shales to act as semi permeable membranes. The
fractionation of hydrogen isotopes occur during this process in such a way that the
residual water will be enriched in deuterium due to its preferential adsorption. During
the continuous recharge in wet season the increasing of hydraulic pressure pushing the
older water to the zone of the water uptake. This water which is enriched in deuterium
by ultrafiltration process drilled out along the aquifer, replaced by the new recharge
water.
The isotopic signatures of nitrate show in some wells a slight denitrification
process. In the Samed well where this effect could be observed, less than 10% of the
total nitrate content was denitrified. This process could clearly be identified by the
samples of the dry season samples, where there was nearly no recharge and thus the
groundwater is persist in the reservoir for the months of the dry season.

CHAPTER 5: GIS BASED HYDROSYSTEM MODEL
5.1. Introduction
The implementations of analytical and numerical methods involving geometrical
description of geo-systems with the application of numerical meshes were used to
obtain solutions to a mathematical model of groundwater flow or solute transport.
Innovative application of CAD-Systems in combination with computer aided
modeling of such systems provides a user friendly powerful tool for the often complex
geometrical descriptions necessary for comprehensive modeling of the dominant
processes.
Numerical modeling has been the primary tool for analyzing the interaction of
groundwater and surface water since the mid-1960s. Most models continue to use a
simple Darcy calculation (where discharge = hydraulic conductivity * hydraulic
gradient * cross-sectional area) as well as highly idealized stream geometry, to
transfer water (seepage) through the stream sediments based on head differences
between the surface water and groundwater.
More efficient methods were also developed in the beginning of sixties, where the
finite volume was initially applied to the flow of the fluids in petroleum reservoirs.
This method was applied then to the groundwater flow and solutes transport in the
middle of sixties (Aschroft et al., 1962; Remson et al., 1965).
By the early of 1970's the finite element method was first used to solve
groundwater flow and solute transport problem (Zienkiewicz et al., 1966; Price et al.,
1968; Zienkiewicz et al., 1971). With finite element method, irregular shape boundary,
an-isotropic and heterogeneous aquifer properties can easily incorporated to the
numerical model.
Cooley (1983) developed a finite-element code that was used by Winter (1983) to
evaluate the dynamic groundwater flow conditions caused by nonuniform areal
distribution of recharge directly adjacent to surface-water bodies. Using the model for
2-dimensional vertical sections, the study indicated that recharge is initially focused
directly adjacent to the surface water. These near-shore flow paths cause increased
flow where groundwater seeps into the surface water, and may cause flow to reverse
where surface water seeps out to groundwater prior to recharge. Tracy & Marino
(1987) developed a Galerkin finite-element code for simulating the interaction of

5: GIS Based Hydrosystem Model _____97
surface water with a variably saturated groundwater system. The model solves for the
transient position of surface-water stage and the distribution of the phreatic surface
(water table) in the porous medium, as well as providing estimates of seepage rates.
Numerical models have been used as routine analytical tools for numerous field
studies in virtually every conceivable hydrogeologic setting and for virtually all scales
of systems.
The application of Geographical Information Systems (GIS) in combination with
computer aided modeling of Hydrosystem becomes more and more important for a
detailed process simulation. Hydrosystem in subsurface are very complex systems
described by many parameters with spatial data distributions, and their realistic
modeling is based on precise calculations, which absolutely need precise located data.
The advantage of Geographical Information Systems is that they are able to analyze,
edit, and manage such definite geographic located data.
The section for Geohydrology and Hydroinformatics of the Center for Applied
Geoscience at the University of Tübingen concerns with the software engineering of
ROCKFLOW. This model enables to calculate complex flow and transport processes
of one and more fluid phases in subsurface hydrosystems by the use of finite element
and finite volume methods.
The finite element program ROCKFLOW has been developed to simulate complex
flow and transport processes of one and more fluid phases in subsurface
hydrosystems, combining coupled modules with the method of automatic grid
adaptation (Kolditz et al., 1998).
The numerical model used for the simulations is the FE Simulator GeoSys/
RockFlow (Kolditz et al., 2003) which are programmed in C and C++ according to
object oriented software concepts (Beinhorn & Kolditz, 2004 and Kolditz and Bauer,
2003). The numerical approach is based on the Galerkin finite element method using
governing equations given above.
Time derivatives are evaluated by a finite difference scheme. The iterative coupling
between the discretized flow and transport equations is realized by a Picard iteration
scheme, i.e. actual densities of a new iteration step are calculated from the field
variables of the previous iteration step. The code has been tested against benchmarks
given in (Kolditz et al., 1998).

5: GIS Based Hydrosystem Model _____98
Basic modules of GeoSys/ RockFlow are the GeoLib, MshLib, and FEMLib, which
can be connected via a Graphical User Interface (GUI). These components are
described below as:
5.1.1 GeoLib
Geometric objects of the GeoLib are points, polylines, surfaces, volumes which form
domains. All these geometric entities are implemented as C++ classes: CGLPoint,
CGLPolyline, CGLSurface, CGLVolume, and CGLDomain. Instances of these objects
can alternatively be stored in vectors and lists for convenience and specific purposes.
A detailed description of the implementation of GeoObjects is given in Kalbacher et
al. (2003b).
5.1.2 MshLib
Currently, the following build-in mesh generators can be used: PrisGen (Kalbacher et
al., 2003a), TetMesh (Manabe et al., 2003) as well as open and commercial systems
such as gmsh (2004) and gOcad (2004).
The resulting mesh geometry can be manipulated using mesh operations like the
mapping operation.
Here a surface object (SFCObj) is being used to relate mesh data to a surface data
file such as top or bottom of an additional operation of the MshLib is vertical mesh
refinement. All these operations of the MshLib are controlled via GUI.
5.1.3 FEMLib
The FEMLib contains independent units necessary to set up and solve the finite
element problem.
As a result of the numerical approximation method described, two sets of algebraic
equations were derived. The general form of this equation is:
(1)
where i; j denote different processes, with Ai system matrix of process i, t time, x
coordinates, ui solution vector (primary variable) of process i, bi RHS vector of process
i. Dependence of process i on process j means coupling, and dependence of system
matrix on solution itself means non-linearity.

5: GIS Based Hydrosystem Model _____99
5.2. Model Setting
5.2. 1. Aim of the model
The study area (Figs. 18 & 53) included in the GIS project was described in further
details in chapter 2.
The Deuterium, Oxygen and Carbon isotopes data in a previous study (see chapter
4.) suggest two possible mechanisms of recharge, the first is the direct diffuse surface
infiltration and the infiltration of the water run off in wadis. The data also show that
there is a leakage from the Upper Cretaceous aquifer to the Pleistocene one. This
leakage could be through the major fault system which separate between Cretaceous
and Pleistocene formations, or it caused by an infiltration from irrigation network
drained from Sultan spring that also fed by the upper cretaceous aquifer system with
CaCO3 rich water to the west of the area. Moreover, the tritium units reflect a recent
groundwater age in the west boreholes in relation to old water age (prior to 1956) of
the eastern Arab Project wells. The other sampled wells within the area show in
between values. However, the mode of this suggested mixing between the two
possible recharge points is still not well known.
A modeling routine was carried out in order to suggest alternatives for a better
understanding of the mechanism of recharge and the mixing mode between the
possible recharge sources in the aquifer as well as, to build different hydrological
scenarios to estimate the effects of the pumping rates and water demand on the water
level with respect to abstracted quantity and the time of the year, thus to maintain a
sustainable exploitation of the groundwater resources in the study area. The model is
constructed as a building block for more future studies about the solutes transport and
distribution, which allow to visualizing and further understanding for the mechanism
of salinisation. For this purposes, the model will still need further calibration and
validation.
The geology of the area is part of the Jordan rift valley geology (see chapter 2). The
Pleistocene age formation dominates in Jericho area characterized mainly by Lisan
and Samra formations. The sedimentary sequences within the Lisan and Samra
formations are covering the study area.
Pleistocene formation is grouped into two main lithological alternative
heterogeneous sequences of the gravel and marl. The last with low hydraulic

5: GIS Based Hydrosystem Model _____100
conductivity and considered as an aquiclude layer, while the gravel and sandstones
layer have good hydraulic properties and thus forming a good aquifer media. Despite
the fact that from the geological point of view, this alternative sequence varied all over
the area, which mean that both lithological units coincident in a lenses each cover a
limited part in the profile, where each layer forming certain drained filling via which
they partially hydraulically connected. Although 7 alternatives hydraulically
connected layers of the mentioned formations were assumed. This assumption based
mainly on a real lithological profile for 12 wells in the area using the lithological data
that obtained from the Palestinian Water Authorities (PWA), (Khayat et al., 2005).
Each similar layer was assumed to be connected by a type of aquifer or aquiclude,
according to the hydraulic properties of each layer.
GeoSys/RockFlow scientific modeling software (Kolditz et al., 2004) is used in
developing a numerical groundwater flow model within the Pleistocene shallow
aquifer system. Based on the groundwater model the recharge mechanisms and the
mixing mode between different water sources and water types in the study area are
considered.
5.2. 2. GIS Project
Based on the groundwater model the recharge mechanisms and the mixing mode
between different water sources and water types in the study area are considered. The
hydrogeological conceptual model of the study area is converted to (GIS Project)
shape files using the ArcGIS software. All required data for modeling, such as aquifer
geometry, boundary conditions, material properties, well positions and pumping rates
etc. are kept in the GIS project.
These data can be directly imported to GeoSys for modeling purposes (Kalbacher et
al., 2003; Chen et al., 2003).
The study area in the GIS project is shown in the Figure 53:

5: GIS Based Hydrosystem Model _____101
Fig. 53: The modeled area in GIS project, noting he cross section A-A’ which shown in Fig. 54.
The GIS project consists of several shape files or layers, these are:
5.2. 2. 1. The layers formations
The alternative layers structure of Marl and Gravel for the first 160 m depth in the
Lisan and Samra of the Pleistocene formation were converted to a shape files, where
each shape file represent one layer elevation for 12 wells distributed in the area. The
minimum layer elevation was set to be 0.5 m especially in the area where the layer
forming a closed lenses. (Fig. 54).

5: GIS Based Hydrosystem Model _____102
5.2. 2. 2. Wadis
The study area is drained eastwards toward Jordan River by two major wadis; Wadi
Qilt in the South of the area and Wadi Nuwe’meh in the north. In addition the Sultan
Spring irrigation network, which covers a part of the area, has to be considered. These
wadis represent the line recharge of the flooding surface runoff. (Fig. 53).
Fig. 54: Hydraulic conceptual model assumption based on the real lithological profile for some wells, the assumed connection layer with brown color represent the marl Aquiclude and with blue represent the gravel and lime stones Aquifer.
5.2. 2. 3. Faults
The study area is highly affected by faults especially in the western part.
Marl
Top Soil
Gravel
Clay
Limestones
Limestones with marl
Marl
Top Soil
Gravel
Clay
Limestones
Limestones with marlAquiclude
Aquifer
Marl
Top Soil
Gravel
Clay
Limestones
Limestones with marl
Marl
Top Soil
Gravel
Clay
Limestones
Limestones with marlAquiclude
Aquifer

5: GIS Based Hydrosystem Model _____103
These faults to the west are responsible on the spring's system mainly Sultan spring
and also act as a barrier between the Upper Cretaceous aquifer and the shallow
Pleistocene aquifer. The inferred old fault to the east defined by (Rotstein, 1991) also
suggested in the study as a barrier boundary that prevent groundwater seepage to the
Jordan River for certain distance (Fig. 53).
5.2. 2. 4. Boreholes for lithological cross section
More than 60 wells were drilled in the Jericho plan area. The majority of these wells
are private wells, which have been drilled for agricultural purposes, 12 of these wells
were used to describe the lithological formation of the upper most 100-170 meter of
the aquifer. (Fig. 53).
5.2. 2. 5. Water Level
Several water level measurements for many previous years were taken and are used in
constructing a water level contour map in the shallow aquifer system.
5.2. 2. 6. City Area
The city area is characterized by low agricultural activities and low abstraction rate,
relative to the surrounded agricultural lands.
5.2. 2. 7. Abstraction rates
Several abstraction rates measurements were taken from the working wells in the area
in m3/hr; the average daily of wells operation is 8 hrs/day, thus long term estimation
for the system output in this aspect was also calculated.
5.2. 2. 8. Wells for the surface topography
The surface elevations for the wells were used also for the surface topography all over
the whole model area. (Fig. 55)
5.2. 2. 9. Sultan irrigation network
Depending on the irrigation network that drained from sultan spring, a shape file that
covers the irrigation channels area was created.

5: GIS Based Hydrosystem Model _____104
Fig. 55: Wells used for the surface topography, depending on the wells Z-value. These elevations values for the wells help in doing the surface interpolation process using Arc GIS program for surface layer geometry.
5.2. 2. 10. The study area surfaces
Despite the modeled area were divided into 4 surfaces to facilitate the processes of
geometric model building (Fig. 56). Although, the surface separation can be used to
allow to give each area its specific properties according to the structural material and
the surrounding activities which can effect on system input or output, thus it allows for
more easier data handling in each surface, in addition this division can help in solving
the problem of different spatial conditions and solutes or contaminant distribution,
with which a further improvement and studies based in this model can be conducted in
the future. The first surface is the city area surface, the second is the north surface that
extends from Wadi Nuwe’meh to Wadi Qilt, and the third one is the area further to the
south of Wadi Qilt. The area surrounding Sultan spring to the west with coarse Samra
was assigned as a fourth area.
For example, the surface no. 1 of the Jericho city is the higher populated area in the
model that contains a lot of anthropogenic activities and septic tanks effluent. Where
surface no. 2 contain the highest number of pumping wells that effect on the water
level and the wells of Arab Project with the higher salinity. The layer further to the
south of Wadi Qilt has finer formation of Lisan aquiclude, and so on.

5: GIS Based Hydrosystem Model _____105
Fig. 56: study area surfaces
5.2. 2. 11. Interpolated Raster map for layers
Interpolation is a mathematical method of creating missing data. An image can be
increased from 100 pixels to 200 pixels through interpolation. By this process a
computing new intermediate data values between existing data values. In this case
the data from the wells and the seven layers elevation were used to create in-between
data to build construct a continuous topographical surface, within a defined domain.
The file of assumed layers elevation as well as the wells elevations for surface
layer were imported for the process of layers interpolation using ArcGIS program, by
which a topographical surface map for each layer were constructed with different
elevation. Figure 52 shows the interpolated layers within the interpolation domain of
the modeled area.
The colors represent the spatial distribution of the elevation data for each layer
surface within the interpolation domain (Fig. 57).
Surface 1 Surface 2
Surface 3
Surface 4

5: GIS Based Hydrosystem Model _____106
Fig. 57: Interpolated raster map for the seven layers, showing the spatial distribution for the elevation data.
Surface layer Layer 1
Layer 2 Layer 3
Layer 4 Layer 5
Layer 6 Layer 7

5: GIS Based Hydrosystem Model _____107
5. 3. Project Construction
5. 3. 1. Project Elements
5. 3. 1. 1. Boundary Condition
The geographical boundaries for the modeled area are set as: Wadi Nuwe’meh in the
north; few kilometers from the Wadi Qilt to the south Jericho faults in the west and
Hugla fault in the east.
It is assumed that there is no water movement from the north to the south or vice
versa, depending on the fact that the water direction in this sub-basin is from west to
the east and south east. Therefore the only active model boundaries were assumed to
be those in the west and in the east.
- West boundary: No hydraulic connection between the Upper Cretaceous aquifer
to the west of the fault and the shallow aquifer to the east of the fault was assumed,
except for the recharge generated by Sultan spring and the surface run off of the wadis
from the precipitation of the upper mountain.
Fixed head were assigned at the beginning of the wadis entrance to the system.
- East boundary: It was estimated that the eastern fault shown in figure 53 on that
extend until reaching Ein Hugla Spring area, act as barrier for groundwater flow
toward Jordan River (Rotstein, 1991). The only amount of water that reaches the river
is this of the wadis surface runoff. A fixed head were assigned near this boundary.
• Initial Head
Water levels measurements from the years 2002-2003 (PWA, 2001) were used as
an initial reference head data for comparing eventually with the model results (Fig.
58).
• Material parameters
The material properties used for the different layers are shown in Table 10. It was
assumed that the hydraulic properties for the western surface near the spring have
higher Kx and Kz values than the surfaces further to the east. The data were estimated
according to Guttman (1998), and Hobler et al. (1996). An intermediate values were
set from different formations for the aquifer and the aquiclude, due to heterogeneous
content of the layers (i.e. gravel with small size pebble, gravel with black clay, and
marl with sand…etc).

5: GIS Based Hydrosystem Model _____108
X
192000
194000
196000
198000
200000
Y138000
140000
142000
Z
-400
-350
-300
-250
-320-315
-310
-310
-305
-325
-291
-285
-285
Y
Z
X
Frame 001 ⏐ 01 Mar 2005 ⏐
Fig. 58: 3D volumetric model showing the groundwater initial head in meters. Y refer to north direction, X east direction and Z is the elevation according to Palestinian coordinates.
Table 10: Estimated material properties.
Hydraulic Conductivities
For Sultan
Surface in the west
For the aquifer as a whole
Aquiclude layers Aquiclude layer Sy(-) 0.1
Kx 1.0 E-9 m/s 1.0E-6 m/s Ss(1/m) 1.0E-5
Kz 1.0E-12 m/s 1.0E-9 m/s
Aquifer layers Aquifer layers
Kx 1.0E-4 m/s 1.0E-2 m/s
Kz 1.0E-6 m/s 1.0E-5 m/s

5: GIS Based Hydrosystem Model _____109
• Source Terms
In general, source terms are the system input or output within the model domain.
These sources can be described as the points, surfaces or lines from which the material
such as water, solutes or pollutants can enter and get out from the model area. In the
study area, for a simple flow model the source terms are:
• Pumping wells
Values of time dependent pumping rate were taken from around 44 wells. Well data
can be directly imported e.g. from EXCEL files (Fig. 59).
Fig. 59: Well data import from EXCEL tables.

5: GIS Based Hydrosystem Model _____110
• Springs irrigation network
For the spring the discharge is around 4.6 MCM, only 3.2 MCM is assumed to be
drained to the open irrigation canals, and the rest is piped for domestic purposes
(ARIJ, 1995). The first drained water for irrigation in the open canals exposed to
evaporation and infiltration to the groundwater by which it might effect on the water
level. Fig. 60 shows a digital elevation model for the top surface of the modeled area
where the irrigation network with the identified grid nodes of the finite element
meshes is also displayed.
X
192000
194000
196000
198000
200000
Y
7000138000
139000140000
141000142000
Z
300
280
260
240
X Y
ZF ram e 0 0 1 ⏐ 2 5 F eb 2 0 0 5 ⏐
Fig. 60: Digital elevation model of the top surface of the model domain with Sultan spring irrigation area.
• Line recharge by wadis
The estimated annual distribution of the recharge for Wadi Nuwe’meh was
assumed to be 4 MCM while for Wadi Qilt it assumed to be 5 MCM (section 2.5.2.6.)
• Area recharge by precipitation
The annual precipitation rate for the study area is about 166 mm/yr (section 1.6.2.).
• Area discharge by evaporation
The annual potential evaporation rate is about 2120 mm/yr (section 1.6.2.).

5: GIS Based Hydrosystem Model _____111
5.4. Creating a GeoSys Project
This is the first step when we start a new project in GeoSys. All the data reference
needed for the model like geometry data, meshing data, processing data, are stored in
one project file to keep the connection between the project and its data components.
Import of GIS data (SHP files)
SHP file means ArcGIS data format. It is prepared by using the features of digitizing
in ArcGIS. There are three major types for 2D model: point, plotline, and polygon.
Geometry
A separate GEO view was created to view geometry data. This will be the same
process for viewing meshing data, material group, processing data, etc. This will be
done by simply going to menu 2D View, and click on GEO View to create it directly.
The type of geometry data to be displayed can be switched on, whether it is points,
polylines, and point or line components from plotline, surface, TIN from the surface,
label from those features could be done depending on the selection. The geometric
model was created step by step as follow:
1- Creating Point view: where points are the basic element of all other geometry
types. It can be used point to define the following 1-D geometry elements:
Source term, boundary condition. The red points show that they are double
points, and we need to remove those points because of inconsistency based on
our setting of tolerance.
2- Creating Polylines: Plotline are important geometry object, they can be used
to define the following 2-D geometric elements:
• boundary of a model domain
• boundary to assign boundary condition
• Line structures.
3- Surfaces: Surfaces are closed plotline, i.e. the last point of plotline is
connected to the first one. A surface can be used as a 2-D domain boundary.
One surface could be created from one closed plotline (polygon) or from
several polylines which form a closed area. In our case, each surface is created
from one closed plotline.

5: GIS Based Hydrosystem Model _____112
4- Layer surfaces: Vertical surfaces can be created from two vertical layer
polylines. Those surfaces are converted to TINs.
5- Creation TINs for Surfaces: TINs (triangulated irregular networks) a surface
representation derived from irregularly spaced points and breakline features.
Each sample point has an x, y coordinate and a z value or surface value. can
be used for a discrete geometric description of surfaces and then for volumes
as well.
6- Creating layers volumes: this by selecting the two consequent surfaces, then
creating the volume which is filling in between. Then using Write TEC
function in Geo Sys the prepared volumes are exported and displayed by Tec
plot program (Fig. 61)
7- Meshing: the general steps for the hybrid meshing procedure in this
application are:
• Create a triangulation based on surfaces (SFC) for the 2-D surface
water model. The surfaces must be topologically consistent,
• Create line elements for the 1-D wadis model based on the
triangulation,
• Create prismatic elements for the 3-D subsurface model,
-4 0 0
-3 5 0
-3 0 0
-2 5 0
Z
1 9 2 0 0 0
1 9 4 0 0 0
1 9 6 0 0 0
1 9 8 0 0 0
2 0 0 0 0 0
X1 3 7 5 0 0
1 4 0 0 0 0
1 4 2 5 0 0Y
X Y
ZF ra m e 0 0 1 ⏐ 1 6 J a n 2 0 0 5 ⏐ | | | | | | | | | | | | | | | | | | | | | | | | |
Fig. 61: Display created volumes in Tec plot program, noting the filling between layers (displayed as blocked lateral surfaces).

5: GIS Based Hydrosystem Model _____113
Fig. 62: Display triangulation and prisms result, noting the triangular items all over the surface of the model domain.
8- Triangulation: is method of surveying in the location of an object may be
calculated from the known locations of two other objects. Creating a triangle
from the three items, the angles and sides of the triangle can be measured and
the location of the unknown object is calculated algebraically.
9- Prisms: Prism elements can be generated from triangles while extending these
to the vertical direction. (Fig. 62).
10- Lines: Line elements can be created along polylines. To this purpose the edges
of triangles along these polylines are used. Therefore, the polylines intended
for generating line elements must be parts of the surfaces which were used for
the triangulation. Creating polylines for line elements was done by using
drawing tool in GeoSys or Import SHP file for wadis
11- Mapping: Surface mapping is the process of making the mesh conform to
stratigraphic irregularities, i.e. thickness and orientation of the mesh slices can
be deformed. Different data types can be used. Mapping result in Tec plot is
shown in Figure 63.

5: GIS Based Hydrosystem Model _____114
Fig. 63: mapping result in Tec plot, the first map showing the mesh that conforms to the stratigraphic thickness for different layers.
5. 5. Program Processing
This includes:
− Create FEM View
− Create Processes
− Write PCS File
− Defining Boundary Conditions
The surface for boundary condition is created from layer surfaces. One layer
surface consists of two layer polylines. TINs are also created inside the surface.
− Defining Material Groups.
− Link MAT groups with MSH data
− Defining Source of Terms: Well data were imported from EXCEL files which
converted to CSV files. The imported wells shown in Figure 59. The wells then
converted as geometric data using Geosys (Fig. 64).

5: GIS Based Hydrosystem Model _____115
Fig. 64: Wells as geometric data using Geosys, showing the wells distributed in the surfaces.
5. 6. First simulation results and discussion
The numerical simulation is based on the 3D structural and hydraulic model described
in previous sections. The simulations started from an undisturbed situation without
pumping and irrigation activities taking into account the regional groundwater flow
only. Fig. 65 shows the groundwater head distribution in meters of the first (from top)
aquifer layer considering the differences in k values for Sultan spring and remaining
area. The resulted head are bearing more or less the initial head shown in Fig. 58. In
order to assess the rule of the sultan irrigation network and its effect on the
groundwater table. The successively data of all pumping wells and irrigation from
Sultan spring are included in the simulation. The recharge input from the wadis runoff
was switched off, in order to recognize how the infiltration from the Sultan irrigation
network only would effect on the groundwater table.

5: GIS Based Hydrosystem Model _____116
Fig. 65: 3D view of the groundwater head distribution in meters of the first aquifer layer (undisturbed situation without pumping and irrigation), the colors represent elevation of the groundwater level in this layer. Y refer to the north direction, X east direction and Z the elevation in meters.
The overall irrigation from Sultan spring is calculated to 3.024 MCM/year.
Irrigation network input was modeled as a homogeneous infiltration rate, and the
linear recharge from the wadis were neglected. Different scenarios for the percentage
of effective infiltration were tested. Figure 66 shows simulation results for the taken
assumptions which assumed to highlight the hydraulic functioning from each
contributor.
Figure 66a depicts the groundwater level if pumping only is taken into account.
Local hydraulic head lowering is observed. Figure 66b depicts the groundwater level
if homogeneous irrigation only is taken into account. A rise of groundwater is
resulting from this area water source.
Figures 66c and d, illustrates the hydraulic head distribution for different
assumption of infiltration rates (2 and 10% of irrigation rate respectively).
Qualitatively, these modeling results fit very well to the measured data. There is a
groundwater lowering in the central northern part and a rising in the central southern
part of the investigated Jericho area. However the absolute deviations of hydraulic
head from the undisturbed situation are overestimated.

5: GIS Based Hydrosystem Model _____117
Fig. 66: Hydraulic head distribution in meters, in the upper aquifer taking into account: (a) pumping wells only, (b) irrigation from Sultan spring only, (c) pumping and irrigation (10% infiltration rate) and (d) pumping and irrigation (2% infiltration rate).
The water level as expected have its higher values to the west near the spring
recharge and begin to decrease under the heavy abstraction from the wells further to
the east. The conceptual model shows that the irrigation backflow from the irrigation
network which drained from sultan spring can effected with uncertain limit on the
groundwater table. The data of hydrochemistry and isotopes reflect also a possible
mixing between the water from the regional mountains aquifer (that the springs
drained from) and the shallow aquifer. The assumption shown in Figure 66c shows the
effect of 10% infiltration from the irrigation backflow in the presence of well

5: GIS Based Hydrosystem Model _____118
pumping. This assumption seems to be far from the actual situation if we considered
also the other water input from the wadis flood, in which the water level will be over
the reference limits. Assumption in Figure 59d can be more closed to real situation if
we take into account the additional input from the wadis flood. The water heads in Fig
66d represent by the large depression in the zone of pumping can be replenished to
certain extend by the wadis input. Moreover, it seams that the assumption of system
closure from the east is not totally correct. It should be taking into account that some
of water from the irrigation network is escape by surface runoff to go to the wadis and
Jordan River; this can be noticed by the relatively higher water level near the eastern
border. At this part the model need further calibration to assume the hydraulic
functioning of the wadis and how far exactly the irrigation backflow play a role in the
system recharge as well. At this stage, and under the given model parameters, further
application on the model were adopted, where the effect of the pumping rates for
different seasons on the water level were visualized.
5. 7. Visualizing the seasonal Variation of the water level
There are two major agricultural seasons in Jericho, connected to the beginning of
crop irrigation with a large abstraction rate from the agricultural wells. One of this
begins by the end of September (dry season) and the second is by the beginning of
February (wet season). Figure 67 illustrates the shifting in the pumping rate during the
agricultural months in Jericho (figure was drawn using Geosys program).
The groundwater level in Jericho is highly affected by the seasonal pumping rate
from the agricultural boreholes. This effect can be located more sharply during the dry
season by the end of October after a long period of summer time. Monthly based
pumping rate were imported as an excel file to the program (Fig. 59). Then running
the simulation according to the data update, the first visualized water level under the
normal conditions without extreme pumpage is shown in Figure 68.
The visualized water level after the wet season of February is shown in Figure 69,
and the water level after the pumping in the dry season of October is also shown in
Figure 70.

5: GIS Based Hydrosystem Model _____119
Fig. 67: Monthly pumping rates from the wells in Jericho area. Each red line represents a pumping well, on X-axis the month of the year and on Y-axis the pumping rate in cubic meter/s.
Fig. 68: Visualized water level under the normal conditions without extreme pumpage activity, using Palestinian coordinates. X refers to east direction, Y to north and Z to the elevation the water head on meter.

5: GIS Based Hydrosystem Model _____120
Fig. 69: Pumping effect on the groundwater table after the wet season of February
Fig. 70: Pumping effect on the groundwater table after the dry season of October

5: GIS Based Hydrosystem Model _____121
These assumed results under the previous mentioned model parameters show the
effect of the seasonal water pumping on the water head of the shallow aquifer in
Jericho, the water level dropped in the first agricultural season which come directly
after the replenishment of the aquifer causes water level decreasing (Fig. 69). The
pumping process in the second agricultural season which come directly after the dry
season cause further decrement in the water head, as there was no replenishment after
the first pumping time (Fig. 70).
This small application on the model (with its roughly calibrated parameters)
visualized for a certain extend the effect of the major extensive pumping act at
different times from the aquifer. However this model still subjected to further refining
process to have clearer picture about the mixing rate from different recharge sources.
Where further investigations of the hydraulic regime are necessary, in particular: the
hydraulic functioning of wadis in feeding the system and the diffusive mode of
recharge from the wadis to the groundwater table, and the local distributions of
irrigation network, effective infiltration, evaporation from it still need to be calibrated
taking into account surface water runoff (Beinhorn and Kolditz, 2005). The model
depending on the above mentioned variable inputs and outputs should be calibrated
and validated with the actual hydraulic situation in the study area.
Moreover, different expectation scenarios can be considered after refining this
model to see the expected fluctuation in the water availability and demand depending
on the future surrounding conditions. These scenarios can give a good idea to put
forward a certain system for the pumping quota and water use.
A solute transport model also can be done using this primary conceptual model to
visualize the spatial distribution of the saline and fresh water, and the mixing between
them using a skimming model, by which different salinity measurement should be
taken from a working pumping well in order to tracking the saline-fresh water
interaction within the aquifer, where the salinity gradient is also fluctuated depending
on many factors and conditions of recharge and abstraction rate.
Based on the concept of this model, as a model based on the groundwater
movement through the porous media of the shallow layers (top 100-200m) with
different lithological formations, an improved solute transport model can give more
clearer picture about the rule of sedimentary rocks dissolution (the rock-water
interaction) in the process of salinity. Such model can aid also in describing the

5: GIS Based Hydrosystem Model _____122
chemical reactions within the aquifer mainly the processes of mineralization and
dissolution of minerals. It also can show the movement of different anthropogenic
contaminants through the surface to the groundwater. By which, the susceptibility of
the aquifer to different anthropogenic activities can be assessed.

CHAPTER 6: SUMMARY AND CONCLUSIONS
The high salinity in the shallow Pleistocene aquifer in the Jericho plain area is a
function of 3 main contributing sources. The hydro-chemical and isotopic data
appraise these contributions clearly. The hydrochemical data show: 1) the evolution of
calcium chloride in the wells to the east which are relatively rich in Mg, strontium, Fe
in parallel with low molar ratio with relation to chloride for most of the elements
compared to sea water reflect a reverse softening and a mixing of brackish water. 2)
The continuous increment in the molar ration of the major solutes to chloride, bearing
the same ration from Lisan elution which confirms the mentioned in situ dissolution of
rocks as an additional source of salinity. The increase of Mg, Ca and HCO3 as well as
most of the other elements in the eastern part of Jericho area due to the brine effect
enhanced the process of mineralization in the eastern part of the aquifer. The high Mg
input in the eastern part favored a process of calcite dolomitization. By which the
calcium is elaborated in surplus amounts and forming Ca-Cl brackish water. 3) The
anthropogenic effect from sewage and agriculture were clear influences in the wells
that have low chloride content, but by no means low brackish water effect, this lower
chloride with higher molar ratios, and high Br and nitrate suggest the input of different
water that contains pollutants.
This water may result from agricultural back flow or sewage effluent. The
lithological formation of the area has a two edge effect on the salinity increment in the
area, one is the in situ weathering of the rock, the other is the structure of the
formation which consists of gravel and marl from the highly trans-missive Samra layer
with coarse gravel and high hydraulic conductivity, and the Lisan layer with fine silts
and low hydraulic conductivity but with a highly fractured structure. Both serve as a
good media for pollutant transmission and storage.
The isotopes analysis of (deuterium, nitrogen15, carbone13 and sulfur34) give a
more clear picture about the possible sources of salinity, in addition, it confirms the
results of hydrochemical data, and it helps in tracing the mode, the tracks and the
source of salinity and pollutants in the groundwater within the Jericho area.
δ15Nnitrate and δ18Onitrate values show that most of the groundwater samples from the
wells and springs in Jericho area were mainly influenced by nitrate and derived from
septic tanks. Sewage appeared to be the cause for increasing nitrate concentrations
observed in most of the wells and springs in Jericho. The following factors highly

6: Summary and Conclusion __________ ______________124
suggested manures as an additional source of nitrate in the groundwater, these are: the
aerobic condition for most of the sampled shallow wells, the presence of animal farms
especially in Wadi Qilt east and Ein Dyouk area, and the addition of the animal
manure as a natural fertilizers directly to the land.
Less evidence of fertilizers nitrate was shown, but this could vary according to the
seasonal application of the pesticides and its chemical composition. Long persistence
of the nitrate within the groundwater reservoir for the dry season months (sampling
time) gives a good chance for the beginning of slight denitrification process within the
aquifer. δ15Nnitrate and δ18Onitrate values in the northern wells have other sources of
nitrate in addition to sewage, as the nitrate concentrations for these wells are low and
exhibit high δ15Nnitrate and δ18Onitrate signatures. This signature might reflect a mixing
signature between chemical fertilizers and the residual nitrate from bacterial
denitrification or from the sewage.
The isotopic signature of deuterium and δ18O from water give the following
indications: (1) In general there is no seasonal variation between dry and wet season
except in deuterium in which the flushed water is enriched deuterium with due to
ultrafiltration process. (2) Fitting the springs signatures with LMWL emphasize that
the recharge area for the springs is different from those for the other wells in the lower
plain with no further evaporation. (3) While most of the other wells show different
infiltration zones through wadis, these wells which are often exposed to
overexploitation, distributed around a calculated brackish water mixing line, reflect a
salty water influence. (4) The other scattered depleted δ18O signature can reflect less
effect from brackish water with less chloride and salinity content, thus the
susceptibility of these wells to anthropogenic contaminants was easier to indicate
rather than those with highly saline content. The enriched δ18O signatures for these
wells with the low salinity suggest the effect of water irrigation backflow with heavier
isotopic signatures. It was registered that many of the pumping wells are connected
directly to fertilizer container in which pumped water is mixed with the chemicals and
then applied directly to irrigate the farms. This in addition to highly boron, bromide
and nitrate contents, which also suggests a sewage and manure influence from animal
farms and septic tanks which are widely used in the area.
The raising of sulphate in groundwater in the Pleistocene aquifer in lower Jordan
valley (Jericho area) mainly caused by disseminated and leached gypsum from Lisan
and Samra layers that cover the area. There are two different sources or contribution

6: Summary and Conclusion __________ ______________125
mechanisms for sulphate into the groundwater in the area, these are: (1) surface
seepage leachate with the positive δ34SSULPHATE signatures of primary gypsum, and (2)
upwelling brackish water which rise up under heavy abstraction (especially in the
eastern wells), with the negative δ34SSULPHATE signatures, and highly sulphate contents.
The highly sulphate content in the groundwater from the eastern wells, in parallel
with negative δ34SSULPHATE signature give also the signature of sulphate that originate
from pyrite oxidation which is transported by up welling groundwater under heavy
abstraction and oxidized in the aerobic environment in the upper layer. This result can
also emphasize the assumption of Rosenthal and Möller (2006) (section 2.6.1), the
signatures of deep brine source and the high Mg and Ca-chloride values may result
from residual deep brine coincident on low depth. However, the signatures obtained in
the Jericho area don’t really go with other illustration described by them in section
2.6.1, which might be restricted to other area in the rift.
Two main contradictory inputs effect on the carbonate system and the water quality
in the aquifer as a whole which also represent the two main end members of fresh and
saline water. The first is the fresh carbonate rich water in the west, where the major
fault systems, which bordering the Jericho plain area in the west, seem to play also a
role in the water system feeding. The δ13C data emphasize that there is a leakage from
the calcareous water of the Upper Cretaceous aquifer, which feed the spring, to the
shallow aquifer in the plain area. This leakage is clearer in the west and north area
wells, where there is a mixing from this leaked fresh carbonate rich water with that
water which feed the Pleistocene aquifer through the infiltration of the wadis run off.
On the other hand, the brackish leachate from the wells to the east with high TDS
including bicarbonate considered as the second end member that effect on the
carbonate system. This brine water normally is of Cl-Na-Ca type and also rich by Mg
and K as well as other elements. The presence of high carbonate and Mg input from
the brackish water in the east creates a suitable environment for dolomitization of
calcite. The anthropogenic influence in between play as an additive factor that effect
on the carbon system in the aquifer system. This exacerbates to quietly differentiate
the anthropogenic effect from the brackish effect from the east.
As overall result, the isotopic data as well as hydrochemical data appraise two main
aspects:

6: Summary and Conclusion __________ ______________126
1. The aspect of the recharge mechanism: as mentioned above the isotopes data of
carbon, oxygen and deuterium emphasize a two recharge mechanisms for the
Pleistocene aquifer system in Jericho plain area, by which one is the surface run
off that feed the wells through the wadis, mainly Qilt and Nuwe’meh, and the
second is that of the upper mountain aquifer leakage which enter the Pleistocene
aquifer through the major fault system in the west of the plain. The water quality
of some wells in the west as well as the isotopic signatures indicates such type of
admixing between the two aquifer but obviously at certain limit. This finding of
different sources mixing should be taken into account by planners and remediation
specialist, the highly variation in water quality between the two aquifers put many
questions about the possibility of the saline shallow aquifer remediation through
inducing a type artificial recharge from the upper fresh aquifer or increasing the
mixing rate between the two aquifers in a certain ways.
2. The aspect of salinity sources: the data shows that the high salinity in the shallow
Pleistocene aquifer in Jericho plain area is mainly influenced by a slat leachate
brackish water that mainly formed as a result of long contact with the salty rocks,
or an old deep water that formed as the residual brines derived from evaporated
Pliocene seawater and/or of brines resulting from solution of salts bodies in large
depth, and is entrapped in the interstices of the sediments during the Pleistocene
age. The presence of Mg and Ca-chloride rich water in the groundwater samples
of the wells in the east of study area, is emphasize the same water type that
described by Rosenthal and Möller (2006); Rosenthal (1988); Starinsky (1974), in
the western shore of the Dead Sea, which reflect this residual old brine or a rich
halite salts bodies (section 2.6.1). This water is coexisting deeply in a confined
aquiclude chamber in the Lisan formation. This brackish water rising up under
heavy abstraction due to pressure difference through conduits and vein in the
Lisan formation. This assumption was approved by the low tritium units in the
brackish groundwater samples in the eastern wells, as well as the depleted 34SSULPHATE signatures. The exact age for this water as well as its sources can be
investigated using 14C or 81Kr. This problem should be taken into account by the
planners as the main aspects that deteriorate the water quality in the shallow
aquifer. This means that a lot of measurements and procedures should be adopted
to prevent the evidences of interaction between this deep saline water and the
upper fresh layers.

6: Summary and Conclusion __________ ______________127
3. The aspect of pollution by sanitary systems and agriculture: the nitrate isotopes
data approved that the main source of water deterioration by the anthropogenic
pollution is the leakage from the septic tank. The sewage system in Jericho is not
well developed; more conscious about the water disposing manners can help as
well as the constructing of well sealed sewage network. The other anthropogenic
pollution is that coming from agricultural residues. The processes of pesticides
and fertilizers adoption in the agricultural lands should be monitored.
The GIS based model was constructed roughly as a basic conceptual model for the
top 100-200 m layers in the shallow aquifer. This model can be considered as a
primary basic flow model for further investigation or improvement, and still need
more calibration and validation. However, some scenarios to test different recharge
contribution and discharge events to and from the water system were adopted in the
model. The model suggest by assumption different scenarios for the mode and
mechanism of the contribution from the irrigation channels drained from sultan spring
on the water table. It was noticed that the effective infiltration coefficient of about 2%
from the irrigation channels has a noticeable effect on the groundwater level in the
aquifer. This visualized hydrosystem data can also interpretate the presence of mixing
between different recharge sources shown by the hydrochemistry and isotopes results.
The other assumption adopted is that which appraising the effect of the two main
annual heavy abstraction events on the groundwater level. The visualized results show
the fluctuation in the water level between the two abstraction events where the water
table is increased noticeably after that rain event which come directly after summer
time. The model also appraises the effect of the well pumping on the water level
especially this pumping in the period after the dry season in October. This results
indeed reflect many big problems within the area. These problems are related mainly
to water quantity which represented by the fluctuation in the groundwater level with
respect to uncalculated recharge and discharge amount. The other problem is related to
the quality, which represented by salinity raising and anthropogenic contaminant in
this susceptible aquifer. It was noticed that the water quality become more deteriorated
in the groundwater located further to the east of the study area where the formation
become more finer and silty with more aquiclude like formations. The runoff water
from the wadis has a relatively good quality and recharges by infiltration diffusively
through the layers Lisan and Samra. On this way it dissolves salt minerals and evolves
to a saline leachate. Moreover the heavy abstraction enhances the upwelling of salts

6: Summary and Conclusion __________ ______________128
rich water confined in the deeper aquiclude formations formation to the upper fresh
percolated water in the upper layers.
The above mentioned mechanisms of water salinisation can be faced by several
remediation practices, organizing, and management tools, whether it must be adopted
separately according to the groundwater quality and quantity for each well or
collectively for the aquifer as a whole to achieve the higher efficient sustainable yield.
This tools should also stand to special criteria’s that taking into considerations both the
sustainable water resources development and the special big water demands for this
agricultural area. The main measurements that can be done in this regard as follow:
• The abstraction rates from each well should be calculated as a part of the
aquifer as a whole depending on the amount of recharge for each year and
the season of abstraction event.
• Storage dams or water retention structures on main wadis should be
constructed.
• Feasibility and technical studies for artificial recharge of aquifers from
seasonal runoff or treated wastewater for either seasonal storage or barrier
for salt water intrusion especially in the eastern area.
• preventing the floodwaters from escaping to the Jordan River through
efficient water exploitation.
There are a variety of options that can be adopted to manage salinity depending on
the management objectives and the local biophysical environment. A combination of
these options is needed to address salinity problems at both the farm and catchment’s
levels. Some land-use changes will be required at a catchment’s scale and
improvements may take a long time to generate outcomes, so in some cases living
with and adapting to salinity will be unavoidable.
In addition to quantifying and identifying the sources of pollution and salinities that
impaired groundwater qualities of the aquifer, which has already done within this
study, it is also more necessary to adopt the following remediation steps:
1. Establishing a pollution potential source and load reduction targets necessary to
achieve groundwater system restoration in this limited resources area.
2. Recommendations for continuous baseline and future water quality monitoring

6: Summary and Conclusion __________ ______________129
programs to assess the environmental impacts to water quality changes.
3. Establishing a well designed and prepared sewage collection networks within
the city, and dumping the widely used septic tanks.
4. Recommendations for designing and constructing water quality treatment
facilities in the region, that dealing with the wastewater problem.
5. Recommendations for oversight and support of improved water quality
modeling efforts in the area that consist of a number of tools for a better
understanding of the salinity and pollution problems.
6. Recommendations for establishing and integrated remediation programs to
achieve those targets in cooperation with related governmental and non-
governmental institutes.
7. Raising the local environmental conscious in the communities of the region,
through integrated environmental and related socioeconomic activities.
8. Recommendations for establishing an integrated best management practice in
specific agricultural and urban areas where appropriate.
9. Expedite development of salinity based water quality criteria for different water
aspects of use.
Moreover, further investigations are still needed to for a better qualifying the
potential pollution using e.g. isotopic tracers to trace the water from irrigation run off
and synthetic pesticides commonly used in the area. The Cl- isotope investigations
could be an additional assisting tool to identify different sources of chloride which
could be another good tracer to differentiate anthropogenic chloride from other natural
sources.
Further modeling work in the area will be also an support, building different sorts
of skimming and transient models which can provide more understanding for the
saline water movement and fresh saline water interaction between water bodied in the
aquifer. This can be combined with the suggested managements and remediation
programs.

References:
1) ABDEEN, Z. & ABU-LIBDEH, H. (1993) Palestinian Population Handbook, Part 1. Jerusalem, the West Bank and Gaza Strip. Jerusalem: Planning and Research Centre Publications
2) ABED, A. M. (2000): Geology, Environment and Water of Jordan. Jordanian Geological Association Publications Amman, Jordan. 570 pp (in Arabic).
3) ABED RABBO, A., SCARPA, D.J., QANNAM, Z., ABDUL JABER, Q. and YOUNGER, P. (1999): Springs in the West Bank - water quality and chemistry. Palestinian Hydrology Group and Newcastle University, CMS Ltd., Palestine.
4) ALIEWI, A. S., MACKAY R., JAYYOUSI A., NASEREDDIN, K., MUSHTAHA, A. and YAQUBI, A. (2001) Numerical Simulation of the Movement of Saltwater under Skimming and Scavenger Pumping in the Pleistocene Aquifer of Gaza and Jericho Areas, Palestine. Transport in Porous Media Vol. 43, P.:195–212, 2001. Kluwer Academic Publishers, Netherlands.
5) ANDREW, I.J. (2000): Geology and geography of Jordan – a tourist’s guide. (http://www.andrewsi.freeserve.co.uk/jordan-geology.htm, 06.02.2002).
6) ARKIN, Y. (1980): A survey of karst phenomena – western Judean mountains. Geological Survey of Israel, Rep. MM5/80, 30 p.
7) ARIJ (Applied Research Institute-Jerusalem): Water Resources. Chapter 8 in: The Status of the Environment in the West Bank. ARIJ, Jerusalem, 1997. pp.: 95-107.
8) ARIJ (Applied Research Institute-Jerusalem): Environmental Profile for the West Bank, Volume 2: Jericho District. ARIJ, Jerusalem, 1995.
9) ASCHROFT, G., Marsh, D. D., Evans, D. D. and Boersma L. (1962): Numerical method for solving the diffusion equation: 1. horizontal flow in semi-finite media soil. Science Society of America Proceedings, Vol.9, No.2, pp.97-156.
10) BANDEL, K. and Khoury, H. (1981): Lithostratigraphy of the Triassic in Jordan. Facies4, 1-26, Erlangen.
11) BARTOV, Y., ARKIN, Y., LEWY, Z. and MIMRAN, Y. (1981, reprinted 1988): Regional stratigraphy of Israel, A guide for geological mapping. Geological Survey of Israel-Ministry of Energy and Infrastructure, Jerusalem.

References __________ ______________131
12) BAYER, H.-J., Hotzl, H., Jado, A. R., Roscher, B. & Voggenreiter, W. 1988. Sedimentary and structural evolution of the northwest Arabian Red Sea margin. Tectonophysics, 153, 137-152.
13) BEINHORN, M., GUTTMAN J. S., SAUTER M., TOLL M., KOLDITZ O., (2004). Groundwater modeling of the shallow aquifer in the Jericho area. In 5th Int Symposium on the Eastern Mediterranean Geology, Thessaloniki, Greece, pp. 1483-1486.
14) BEINHORN M and KOLDITZ O (2005): Overland Flow, theory and implementation, GeoSys – Preprint [2005-02], GeoSystems Research, Center for Applied Geosciences, University of Tübingen.
15) BEINHORN M and KOLDITZ O (2004): Object-oriented approach to preprocessing and process modeling in water resources, application to the Jericho area. In Proceedings of the 15th International Conference on Computational Methods in Water Resources (CMWR XV), Chapel Hill, NC, USA, Elsevier, pp. 1067-1077.
16) BEN-AVRAHAM, Z. 1992. Development of asymmetric basins along continental transform faults. Tectonophysics, 215, 209-220.
17) BRAUN, M. and HIRSCH, F. (1994): Mid Cretaceous (Albian-Cenomanian) carbonate platforms in Israel. Cuadernos de Geologia Iberica, 18: 59-81.
18) BURDON, D. (1959): Handbook of the Geology of Jordan; East of the Rift by A. M. Quennell. Govt. Hashemite Kingdom of Jordan, 82pp.
19) BÖTTCHER, J., STREBEL, O., VOERKELIUS, S. & SCHMIDT, H.-L. (1990) Using isotope fractionation of nitrate nitrogen and nitrate-oxygen for evaluation of microbial denitrification in a sandy aquifer. J. Hydrol. 114: 413-424.
20) CANTER LARRY W., 1996, Nitrate in Groundwater. Lewis Publishers, Inc., New York; (September 1996).
21) CARPENTER, A., 1978. Origin and chemical evolution of brines in sedimentary basins. Oklahoma Geological Survey Circular 39, 60±77.
22) CHEN C and KOLDITZ O (2005) A DEM based structural approach and TIN technology for terrain modeling, GeoSys – Preprint [2005-01], GeoSystems Research, Center for Applied Geosciences, University of Tübingen.
23) CHEN C, KHAYAT S and KOLDITZ O (2005): Development of a GIS based hydrosystem model for the Jericho area, Part 2: Structure model. GeoSys-Preprint [2005-4], GeoSystemsResearch, Center for Applied Geosciences, University of Tübingen, in preparation.
24) CUI CHEN, ALI SAWARIEH, THOMAS KALBACHER, MARTIN BEINHORN, WENGING WANG AND OLAF KOLDITZ (2004): A GIS

References __________ ______________132
based 3D Hydrosystem Model Application to the Zarqa Ma’in – Jiza areas in Central Jordan (accepted by Journal of Environmental Hydrology).
25) CLARK, I.D. and FRITZ, P. (1997) Environmental Isotopes in Hydrogeology: Lewis Publishers, New York, USA, 328pp.
26) CLARK, I., FRITZ, P.: Nitrogen Cycling in Rural Watershed, Chapter 6 In: Environmental isotopes in hydrogeology. Lewis Publishers, Boca Raton, FL, 1997, pp.: 148-151.
27) COOLEY, R.L., (1983) Some new procedures for numerical solution of variably saturated flow problems. Water Resour. Res., 19: 1271-1285.
28) COPLEN, T.B., WILDMAN, J.D., AND CHEN, J., (1991). Improvements in the gaseous hydrogen-water equilibration technique for hydrogen isotope ratio analysis, Analyt. Chem., 63:910-912.
29) COPLEN, T.B. and HANSHAW, B.B., (1973): Ultrafiltration by a compacted clay membrane, I. Oxygen and hydrogen isotopic fractionation. Geochim. Cosmochim. Acts, 37, 2295-2310.
30) CRAIG, H., (1963) The isotopic geochemistry of water and carbon in geothermal areas. In: E. Tongiorgi, (ED.), Nuclear Geology on Geothermal Areas, Spoleto, 1963. Consiglio Nazionale delle Ricerche, Laboratorio di Geologia Nucleare, Pisa: 17-53).
31) CRAIG, H., (1961): Isotopic variation in meteoric waters. Science 133: 1702-1703.
32) DREVER, J.I., (1997) The Geochemistry of Natural Waters, Prentice Hall Inc., 436p
33) ELMUSA, SH.S. (1996): Negotiation water: occupied Palestinian territories and the Palestinians. Institute for Palestine Studies, USA.
34) El-NASER H.; SUBAH A., (2000): Using hydrochemistry and environmental isotopes to define the groundwater system of the Ain Maghara Spring, Jordan. The Quarterly Journal of Engineering Geology and Hydrogeology, Volume 33, Number 1, 1 January 2000, pp. 87-96(10).
35) EXACT (1999): Overview of Middle East Water Resources - Water Resources of Palestinian, Jordanian and Israeli Interest. - compiled by U.S. Geological Survey for Executative Action Team, 44 p.; Washington
36) EUROPEAN COMMISSION FIFTH RTD FRAMEWORK PROGRAMM, DEAD SEA BASIN, (2004): Physiographic and Climate. (Link:http://www.deadseaproject.org/deadseaproject/DeadSeaProjectLink.htm

References __________ ______________133
37) FARBER, E., VENGOSH, A., GAVRIELI, I., MARIE, A., BULLEN, T.D., MAYER, B., HOLZMAN, R., SEGAL, M., and SHAVIT, U. (2003) Hydrochemistry and Isotope Geochemistry of the Lower Jordan River: Constraints for the Origin and Mechanisms of Salinization. Geochimica et Cosmochimica Acta, Vol. 68, Issue 9, 1 May 2004, P.: 1989-2006.
38) FLEXER, A., YELLIN-DROR, A., KRONFELD, E., ROSENTHAL, E., BEN-AVRAHAM, Z., ARZSTEIN, PP., DAVIDSON, L., (2000): A Neogene salt body as the primary source of the salinity in Lake Kinneret. Archiv Hydrobiol Spec Issue Adv Limnol 55:69-85.
39) FLEXER, A., GILAT, A., HIRSCH, F., HONIGSTEIN, A.S., ROSENFELD, A., AND RUEFFER, T. (1989): Late Cretaceous evolution of the Judean Mountains as indicated by ostracods. Terra Nova, 1: 349-358.
40) FRIEDLI, H.,H. LÖTSCHER, H. OESCHGER, U. SIEGENTHALER,AND B. STAUFFER. (1986). Ice core record of the 13CY2C ratio of atmospheric CO, in the past two centuries. Nature 324: 237-238.
41) FRITZ, P., AND FONTES, J. C., EDS: Handbook of Environmental Isotope Geochemistry, vol. 2B: The Terrestrial Environment, Elsvier Science, Amesterdam, pp. 361-425.
42) GASS, I. G. (1979): Evolutionary model for the Pan-African crystalline basement. In: Evolution and mineralization of the Arabian-Nubian Shield. Bulletin of the Institute of Applied Geology, Jeddah, 1, 11-20.
43) GAT, J.R. (1998): Modification of the isotopic composition of meteoric waters at the land-biosphere- atmosphere interface: In: Isotope Techniquesin the Study of Environmental Change, IAEA,Vienna, Austria, 153-164.
44) GAT, J. and DANSGARD, W. (1972): "Stable isotope survey of the freshwater occurences in Israel and the Northern Jordan Rift Valley." Journal of Hydrology, vol. 16 (177-212p.),
45) GAT, JR., MAYOR, E., TSUR, Y. (1969): The stable isotope composition of mineral waters in the Jordan Rift Valley. J. Hydrol. 7:334-352
46) GAVRIELI, I., STEIN, M., KOLODNY, Y., AND SPIRO, B. (1998): Sulfur Isotopes in Gypsum as indicator for Paleolimnological conditions of Lake Lisan, the Dead Sea Rift Valley. Am. Geophys. U. Annul. Fall Meet., San Francisco, December, 1998, p. F521.
47) GAVRIELI, I., YECHIELI, Y., HALICZ, L., SPIRO, B., BEIN, A. AND EFRON, D. (2001): The sulfur system in anoxic subsurface brines and its implication on brine evolutionary pathways: The Ca-chloride brines in the Dead Sea area. Earth Planet. Sci. Lett. 186, 199-213.

References __________ ______________134
48) GEOLOGICAL SURVEY OF ISRAEL (1999): Geological map of Israel- 1:200000, 4 sheets.
49) GEOLOGICAL SURVEY OF ISRAEL (1973): Geological map of Jericho- 1:50000, 2 sheets.
50) GARFUNKEL, Z., ZAK, I. AND FREUND R. (1981): Active faulting in the Dead Sea Rift. In: Freund R. and Garfunkel I. (ed.) The Dead Sea Rift. Tectonophysics V. 80. 1-26pp.
51) GOLANI, U., 1972. Groundwater resources in Jericho region. Tech. rep., Tahal Report HR/72/016 (in hebrew).
52) GUTTMAN, J. (2006): Geology and Hydrogeology of the Jordan Valley – Multi-lateral project, project 02WT9719 within the framework of the German-Israeli-Jordanian-Palestinian joint research program for the sustainable utilization of aquifer systems. (In progress).
53) GUTTMAN, J. (2000): Sub-project B - Hydrogeology of the Eastern Aquifer in the Judea Hills and Jordan Valley – Multi-lateral project, project 02WT9719 within the framework of the German-Israeli-Jordanian-Palestinian joint research program for the sustainable utilization of aquifer systems. Mekorot report no. 468. (unpublished).
54) GUTTMAN, J. and ZUKERMAN, CH. (1995). A model of the flow in the Eastern Basin of the Mountains of Judea and Samaria from the Far’ah to the Judean Desert. Water Planning for Israel, Inc (Tahal), Tel Aviv. (unpublished report).
55) GVIRTZMAN, H. (1994): Groundwater Allocation in Judea and Samaria, In: Water and Peace in the Middle East, Issac, J. and Shuval, H., Elsevier, Amsterdam.
56) GROPIUS, M.; KLINGBEIL, R. (1999): Modelling of Groundwater Flow Between the Cretaceous Mountain Aquifer Systems and the Jordan-Dead Sea Area. Diploma work, Eberhard-Karls University/ Tübingen.
57) HIRSCH, F. (1983): The geological map of Israel, 1:50,000, Sheet 11-III - Bet Guvrin. Explanatory notes. Geological Survey of Israel.
58) HOBLER, M & Al. (1993). Groundwater Resources of Northern Jordan - Vol. 3. Structural Features of the Main. Library of Water Authority of Jordan, Amman, Jordan.
59) HOEFS, J. (2004): Stable isotope geochemistry; 5th ed., Springer-Verlag, 2004. 244p.
60) HUSARY, S.; NAJJAR, T. and ELIEWI, A. (1995): Analysis of secondary source rainfall data from the northern West Bank. PHG, Jerusalem. (unpublished).
61) HÜNBER, H. 1986. Isotope effects of nitrogen in the soil and biosphere. In: P. Fritz and J. Ch. Fontes (eds.), Handbook of

References __________ ______________135
Environmental Geochemistry IA, Elsevier Science Publ., Amsterdam, New York: 361-426.
62) KAFRI, U., AND ARAD, A. (1979), Current subsurface intrusion of Mediterranean Sea water, a possible source of groundwater salinity in the Rift Valley system, Israel: Journal of Hydrology, v. 44, p. 267–287.
63) KALBACHER, T., WANG, W., MCDERMOTT, C., KOLDITZ, O., TANIGUCHI, T. (2003): Development and application of a CAD interface for fractured rock. J Environmental Geology, in print.
64) KALIN, R. (1996): Manual of mathematical model. Laboratory and Quality Dept. of Water Authority of Jordan. (Unpublished).
65) KASHAI, E.L., CROCKER, P.F. (1987). Structural geometry and evolution of the Dead Sea–Jordan rift system as deduced from new subsurface data. Tectonophysics 141: 33–60.
66) KENDAL, C., DOCTOR, D. (2004), Stable Isotope Application in Hydrologic Studies. In: Drever, J. I. (ed.): Surface and groundwater, weathering and soils: ‘Treatise on Geochemistry’ V.5, Elservier Pergamon., Oxford, 2004, pp.: 319-364.
67) KENDALL, C., ARAVENA, R., (2000): Nitrate isotopes in groundwater systems. In: Environmental tracers in subsurface hydrology. Chapter 9. Cook, P. and Herczeg, A. L., Eds. Kluwer Academic Press, Dordrecht, 2000. pp.: 261-298.
68) KENDALL, C. (1998): Tracing nitrogen sources and cycling in catchments, chapter 16, In: Kendall C. and McDonnell, J. J., (ed.) Isotope tracers in catchment hydrology, Elsevier, Amesterdam, 1998, pp.: 519-576.
69) KENDALL, C., SKLASH, M.G., BULLEN, T.D. (1995). "Isotope Tracers of Water and Solute Sources in Catchments", In: Solute Modelling in Catchment Systems, John Wiley & Sons, New York, pp. 261- 303.
70) KHAYAT, S., HOETZL, H., GEYER, S. & ALI, W. (2005): Hydrochemical investigation of water from the Pleistocene wells and springs, Jericho area/ Palestine. Hydrogeology Journal, Springer Publisher. Online First, 26.Jan.2005.
71) KHAYAT, S., ALI, W., GEYER, S., AND HÖTZL, H. (2005): Development of a GIS based hydrosystem model for the Jericho area, Part 1: Data base. Technical report, Applied Geology, University of Karlsruhe (Unpublished).
72) KLEIN-BENDAVID O., SASS E., KATZ A. (2004): The evolution of marine evaporitic brines in inland.
73) KOLDITZ, O., AND KHAYAT, S. (2005): Development of a GIS based hydrosystem model for the Jericho area, Part 3: Groundwater model.

References __________ ______________136
GeoSys-Preprint [2005-5], GeoSystemsResearch, Center for Applied Geosciences, University of Tübingen, in preparation.
74) KOLDITZ, O., DE JONGE, J., BEINHORN, M., XIE, M., KALBACHER, T., WANG, W., BAUER, S., MCDERMOTT, CI., CHEN, C., GRONEWOLD, J., BEYER, C., KEMMLER, D., WALSH, R., AND LEGEYDA, D. (2004), Open Source – Software Design Proposal. Technical Report, GeoSys –Preprint [2004-25], GeoSystemsResearch, Center for Applied Geosciences, University of Tübingen .
75) KOLDITZ, O., DE JONGE, J., BEINHORN, M., XIE M., KALBACHER, T., WANG, W., BAUER, S., MCDERMOTT CH., KAISER C.I., KOHLMEIER R., (2003), ROCKFLOW – Theory and User Manual, release 3.9. Technical Report, Groundwater Modeling Group, Center for Applied Geosciences, University of Tübingen & Institute of Fluid Mechanics, University of Hannover, 2003. GeoSys– Preprint, [2003-37], Center of Applied Geosciences, Geohydrology/HydroInformatics, University of Tübingen.
76) KOLDITZ, O., HABBAR, A., KAISER, R., SCHULZE-RUHFUS, M. & THORENZ, C. (1998): ROCKFLOW - Theory and Users Manual. Release 3.2, Institut für Strömungsmechanik und Elektronisches Rechnen im Bauwesen, Universität Hannover, 1998.
77) KOMURA, I., AND IZAKI, K. (1971), Mechanisn of mercuricchloride resistance in microorganisms. I. Vaporization of a mercury compound from mercuric chloride by multiple drug resistant strains of Escherichia coli. J. Biochem. (Tokyo) 70:885-893.
78) KRENKEL, E. (1924): Der Syrische Bogen. Mineral., 9: 274-281 and 10: 301-313.
79) LANDMANN, G., ABU QUDAIRA, G.M., SHAWABKEH, K. & WREDE, V., (2001): Geochemistry of Lisan Formation in Jordan and implications on palaeoclimate. The 7th Jordanian Geological Conference, Amman, Abstracts, 136.
80) LEGRAND, H.E. and STRINGFIELD, V.T. (1973): Karst hydrology – review. Journal of Hydrology, 20. North-Holland Publishing Company, Amsterdam: 97-120.
81) LIBISZEWSKI, S. (1995): Water disputes in the Jordan Basin Region and their role in the resolution of the Arab-Israeli conflict, ENCOP Occasional Paper No. 3. Center for Security Policy and conflict Research, Zurich; Swiss Peace Foundation Berne, Zurich. ISBN: 3-905641-36-4.
82) MARIE, A. AND VENGOSH, A. (2001) Sources of salinity in groundwater from Jericho area, Jordan valley. J. Groundwater. 39, 240-248.

References __________ ______________137
83) MATSUI, E., (1980), A simple method using a disposable syringe to prepare samples for d18O measurements in water samples. Analytica Chimica Acta 120, 423–425.
84) MAZOR, E. (1997): Chemical and isotopic groundwater hydrogeology, the applied approach, 2nd Edition. Marcel Dekker, Inc., New York.
85) MILANOVIC, P.T. (1981): Karst hydrogeology. Water Resources Publications.
86) MILLENNIUM ENGINEERING GROUP -CH2M HILL / MONTGOMERY WATSON / ARABTECH JORDANEH (2000): West Bank water resources, program 2 and Bethlehem 2000 project – Groundwater management modeling.
87) MOOK WILLEM G., DE VRIES J. J., 2003, VOLUME I: Introduction - Theory, Methods, and Review. In: Environmental Isotopes in the Hydrological Cycle Principles and Applications. International Atomic Energy Agency, Vienna, Austria, 2004, pp.:89-120. [http://www.iaea.org/programmes/ripc/ih/volumes/volumes.htm]
88) NEEV, D., AND HALL, J. K., (1979), Geophysical investigations in the Dead Sea: Sedimentary Geology, v. 23, p. 209–238.
89) OSLO 2 ACCORDS (1995): Article 40 - Water and sewage, Taba. (unpublished)
90) PCBS - PALESTINIAN CENTRAL BUREAU OF STATISTICS (2002): Small area populations, 1997-2010, Ramallah, Palestine. (unpublished).
91) PETTIJOHN, F.J. (1957). Sedimentary rocks, 2nd Edition. Harper Brothers, New York: 718 p.
92) PHG-Palestinian Hydrology Group-Jerusalem, Water Quality and Hydrogeology of the Eastern Aquifers Bordering the Jordan Valley-Jericho District, technical report (1999).
93) PICARD, L. (1943): Structure and evolution of Palestine with comparative notes on neighbouring countries. Bull.Geol.Dept.Hebrew Univ.Jerusalem, 4, 1-143
94) PICARD, L. (1938): The geology of new Jerusalem. Bull. of the Geol. Dept Hebrew Univ. Jerusalem, 2, 1.
95) PWA - PALESTINIAN WATER AUTHORITY (2003): Wells of the Jericho area and Jordan Rift Valley– Wells lithological profiles and groundwater data. Palestinian Water Authority- Water Data Bank Section. Personal communication.
96) QANNAM, Z. and MERKEL, B. (2002): Hydrogeology, hydrochemistry and contamination sources in Wadi Al Arroub driange basin, Palestine. Freiberger Forschungshefte- Selected contribution to applied geology

References __________ ______________138
in the Jordan Rift Valley, C 494, Techinsche Universität Bergakademie Freiberg, Germany. ISBN: 3-86012-162-6: 111-123.
97) QUENNELL, A.M. (1956): Tectonics of the Dead Sea Rift. Proc. 20th. Int. Geol. Congress. Mexico, Ass. Deserv. Geol. Afrricanos, 385-403.
98) QUENNELL, A.M. (1951): The geology and mineral resources of former Transjordan. Colon. Geol. Min. Resource. 2. 2.
99) REMSON, I., APPEL, C.A. AND WEBSTER, R.A. (1965): Groundwater model solved by digital computer. Journal of the hydraulics Division, American Society of Civil Engineers, Vol.91, No. HY3, pp 133-147.
100) ROFE and RAFFETY (1963): Jerusalem District water supply, Geological and Hydrological Report. Hashemite Kingdom of Jordan Central Water Authority. (unpublished).
101) ROSENTHAL E., AND FLEXER A., (2006): The Hydrochemical History of the Jordan Rift Valley– Multi-lateral project, project 02WT9719 within the framework of the German-Israeli-Jordanian-Palestinian joint research program for the sustainable utilization of aquifer systems. (In progress).
102) ROSENTHAL, E. (1988): Hydrochemistry of groundwater at unique outlets of the Bet- Shean-Harod multiple aquifer system. J Hydrol 97:75-87
103) ROSENTHAL, E., VENGOSH, A. (1994): Saline Groundwater in Israel: Ist on the Water Crisis in the Country. - Journal of Hydrology 156; (1994), p. 389-430; Amsterdam.
104) ROSENTHAL E., WEINBERGER G., KRONFELD J. (1999): Groundwater salinization caused by residual Neogene and Pliocene sea water – an example from the Judea Group aquifer, southern Israel. Groundwater 37: 261-270
105) ROTSTEIN,Y., BARTOV,Y., AND HOFSTETTER, A., (1991): Active compressional tectonics in the Jericho area, the Dead Sea Rift: Tectonophysics, v. 198, p. 239–259.
106) ROZANSKI, K., GRÖNING, M., (2004): Tritium assay in water samples using electrolytic enrichment and liquid scintillation spectrometry. TECDOC-1401, IAEA, pp. 195-217
107) SALAMEH, E. AND EL-NASER, H. (2000): Changes in the Dead Sea level and their impacts on the surrounding groundwater bodies. Acta Hydrochimica et Hydrobiologica 28, 24-33.
108) SALAMEH, E. (2002): Sources of water salinities in the Jordan Valley area/Jordan. Acta Hydrochimica Et Hydrobiologica vol. 29: 329-362.
109) SALAMEH, E. (1996): Water quality degredation in Jordan: impacts on enviromnent, economy and future generating resource base.

References __________ ______________139
Friedrich Ebert Stiftungs, and Royal Society for Conservation of Nature, Amman, Jordan. 179pp.
110) SASS, E.; STARINSKY, A. (1979). Behaviour of strontium in subsurface calcium chloride brines: Southern Israel and Dead Sea rift valley. Geochimica et Cosmochimica Acta, vol. 43, Issue 6, pp.885-895.
111) SCHLUMBERGER, (2002): Oilfield glossary, 29.03.2002. (www.glossary.oilfield.slb.com/Display.cfm?Term=dolomitization).
112) SCHULMAN, N., (1959): The geology of the central Jordan Valley. Bull. Res. Coun. Israel 8G[2-3]: 63-90.
113) SCHWARZ, J. (1982): Water resources in Judea, Samaria and Gaza Strip; View on the present and the future, ed. by D. Elazar. American Enterprise Institute for Public Policy Res. Washington.
114) SHARMA, T. AND CLAYTON, R.N. (2000) Measurement of 0-18/0-16 ratios of total oxygen of carbonates, Geochimica et Cosmochimica Acta 29(12), 1347-1353.
115) SHACHNAI, E. (1969): Lower Cretaceous stratigraphy of the Bet El (Ramallah) Mountain. Israel Journal of Earth Sciences, Vol. 18, No. 3-4: 169p.
116) SIEMANN, MG, SCHRAMM, M. (2002) Henry’s and non-Henry’s law behaviour of Br in simple marine systems. Geochim Cosmochim Acta 66:1387–1399.
117) SILVA, S.R., KENDALL, C., WILKINSON, D.H., ZIEGLER, A.C., CHANG, C.C.Y., AND AVANZINO, R.J.: Anew method for collection of nitrate from fresh water and the analysis of nitrogen and oxygen isotope ratios. J. Hydrol. 228, pp.: 22-36 (2000).
118) SIMPSON, B., CARMI, I., 1983. The hydrology of the Jordan River (Israel): hydrographic and isotopic investigations. J. Hydrol. 62, 225±242.
119) STARINSKY, A. (1997): The evolution of brines along the Dead Sea Rift. In The Dead Sea Rift as a Unique Global Site. Proc. 13th meeting German Israeli Foundation for Scientifc Research and Development, February 1997, Dead Sea, Israel.
120) STARINSKY, A. (1974): Relationships between Ca-chloride brines and sedimentary rocks in Israel. PhD thesis, Dept. of Geology, Hebrew University, Jerusalem
121) STOECKLIN, J. (1968). Salt deposits of the Middle East. In: R.B. Mattox [ed]. International Conference of Saline Deposits, 1962. Geol. Soc Amer. Spec. Pap. 88:157-181

References __________ ______________140
122) STURM, C., RIBBE, L. and SCHWABE, C. (1996): Water resources management in the West Bank, Palestine - Final Report. ASA Program 1996. Carl Duisberg Gesellschaft e. V., Berlin. ( http://www.tt.fh-koeln.de/publi/westba97.pdf, 02-04-2002).
123) TAYLOR, C.B., AND W. ROETHER, (1982): A uniform scale for reporting low-level tritium measurements in water, Int. J. Appl. Radiat. Isot., 33, 377-382, 1982.
124) TEN BRINK, U.S., AND Z. BEN-AVRAHAM, (1999): The anatomy of a pull-apart basin: seismic reflection observations of the Dead Sea basin, Tectonics, v. 8, pp. 333-350, 1989.
125) TRACY, J.C., AND M.A. MARINO, (1987). Solute Movement Through Root soil Environment, J. Irrig. and Drain. Engrg., ASCE, 115 (4), pp. 608-625.
126) TURI, B., 1986. Stable isotope geochemistry of travertine’s. In: Fritz P., Fontes, J.C. (Eds.), Handbook of Environmental Isotope Geochemistry, Vol. 2, Elsevier, Amsterdam, pp.207±239.
127) VENGOSH, A. & E. ROSENTHAL, (1994): Saline groundwater in Israel: it’s bearing on the water crisis in the country. Journal of Hydrology 156, 389-430.
128) VENGOSH, A., STARINSKY, A., KOLODNY, Y., CHIVAS, A. R., (1994). Boron isotope geochemistry of thermal springs from the northern Rift Valley, Israel. J. Hydrol. 162, 155±169.
129) VOGEL, J., AND EHHALT, C. (1963). The use of the carbon isotopes in groundwater studies. Radioisotopes in Hydrology, 383-395.
130) WENNRICH, R., (2005): The analytical methods, and detection limits for major and minor ions. Department of chemical analysis, UFZ Leipzig-Halle GmbH. [Personal communication].
131) WINTER, T.C., (1983). The Interaction of Lakes with Variably Saturated Porous Media, Water Resour. Res., 19 (5), pp. 1203-1218.
132) WOLF, A.T. (1995): Hydro-politics along the Jordan River - scarce water and its impact on the Arab-Israeli conflict. United Nations University Press. The United Nations University. Tokyo, Japan: 383 p.
133) WOLFER, J. (1998): Hydrogeological Investigations along the Jerusalem-Jericho Transsect (Wadi el Qilt), Israel, West Bank. - Diploma Thesis, University of Karlsruhe.
134) WWS – WOODROW WILSON SCHOOL OF PUBLIC AND INTERNATIONAL AFFAIRS – PRINCETON UNIVERSITY (2002): Water rights in the Jordan Valley – Geography and water resources, WWS 401C. (www.wws.princeton.edu/~wws401c, 02-04-2002).

References __________ ______________141
135) ZAK, I. (1963) Remarks on the stratigraphy and tectonics of the Triassic of Makhtesh Ramon. Isr. J. Earth Sci. 12:87-89.
136) ZIENKIEWICZ, O. C., MEYER, P., AND CHEUNG, Y. K. (1966): Solution of anisotropic seepage problems by finite elements. Proceedings American Society of Civil Engineers, Vol. 92 EMI, pp. 111-120.
137) ZIENKIEWICZ, O.C. (1971): The finite element method in engineering science, Mc Graw- Hill, London.

APENDIXES

Datenblatt : Palästina Berechnung der Kohlenstoff-Spezies nach Quentinschwarz=Eingabe
rot= Berechnung ; blau = Beispiel XXXXXXXXXXXXXXXXXXXXXXXXXXXXXXXXXXXXXXXXXXXXXXXXXXXXXXXXXXXXXXXXXXXXXXXXXXXXXXXXXXXXXXXXXXXXXXXXXXXXXXXXXXXXXXXXXXXXXXXX XXXXXXXXXXXXXXXXXXXXXXXXXXXXXXSampleID Site Well Code Date Project Geology Lithology Reference Zone Y X z Y_nig x_nig Head Density pHJ03-01 Arab Project6 19-14/066 10/29/03 100 197310 140660 -309.880005 7.04J04-01 Arab Project6 19-14-66 3/21/04 100 197310 140660 -309.880005 7.37J03-02 Arab Project6 19-14/067 10/29/03 200 197010 140560 -308 6.99J04-02 Arab Project6 19-14/067 3/21/04 200 197010 140560 -308 7.14J03-03 Arab Project7 19-14/073 10/29/03 100 197030 141050 -305 6.99J04-03 Arab Project7 19-14/073 3/21/04 100 197030 141050 -305 7J03-04 Fahmi Nahas419-13/048 10/31/03 100 195310 139660 -285 7.18J04-04 Fahmi Nahas419-13/048 3/21/04 100 195310 139660 -285 7.15J03-05 Fahmi Nahas419-13/047 10/31/03 100 194850 139880 -278.299988 7.2J04-05 Fahmi Nahas419-13/047 3/22/04 100 194850 139880 -278.299988 7.1J03-06 Sabiru Rantizi19-13/006 10/31/03 100 195500 139580 -288 6.88J04-06 Sabiru Rantizi19-13/006 3/22/04 100 195500 139580 -288 7.01J03-07 Fahed Hishmi 19-13/015 10/31/03 100 196100 139510 -292.686005 7.08J04-07 Fahed Hishmi 19-13/015 3/22/04 100 196100 139510 -292.686005 7.11J03-08 Zuhdi Hashwa19-13/052 10/31/03 100 195880 139670 -289 7.15J04-08 Zuhdi Hashwa19-13/052 3/22/04 100 195880 139670 -289 7.1J03-09 Salah Arouri 19-14/012 10/31/03 100 195380 140010 -282 7.14J04-09 Salah Arouri 19-14/012 3/22/04 100 195380 140010 -282 7.16J03-10 Basil Husaini219-13/020 10/31/03 100 194320 139480 -270 7.16J04-10 Basil Husaini219-13/020 3/22/04 100 194320 139480 -270 7.3J03-11 Basil Husaini119-13/018 10/31/03 100 193770 139750 -260 7.2J04-11 Basil Husaini119-13/018 3/23/04 100 193770 139750 -260 7.5J03-12 Ibrahim Daek NW 10/30/03 100 195389 138800 -306 7J04-12 Ibrahim Daek IBRAIN DEK 3/23/04 100 195389 138800 -306 7.07J03-13 Iron Factory 19-13/26a 10/30/03 100 195389 138800 7.22J03-14 Ein Sultan AC/061 10/31/03 200 192200 141950 -215 7.56J04-14 Ein Sultan AC/61 3/23/04 200 192200 141950 -215 7.39J03-15 Ein Dyouk AC/060 10/31/03 200 190050 144660 -115 7.14J04-15 Ein Dyouk AC/60 3/23/04 200 190050 144660 -115 7.33J03-16 Awni Hijazi 19-14/052 10/31/03 100 195680 140980 -282 6.88J04-16 Awni Hijazi 19-14/052 3/23/04 100 195680 140980 -282 7.01J03-17 Saeed Aladee19-14/062 10/31/03 200 193380 142630 -240 6.89J04-17 Saeed Aladee19-14/062 3/23/04 200 193380 142630 -240 6.96J03-18 Mohammed M19-14/038 10/31/03 100 193450 142530 -244 6.8J04-18 Mohammed M19-14/38 3/23/04 100 193450 142530 -244 6.95J03-19 Samed 19-14/26a 10/31/03 200 192572 141833 -233 7.2J04-19 Samed 19-14/26a 3/24/04 200 192572 141833 -233 7.12J03-20 Arab Project619-13/069 11/1/03 200 196950 139250 -315 7.02J04-20 Arab Project619-13/069 3/24/04 200 196950 139250 -315 6.99J03-21 Abdallah Araik19-14/049 11/1/03 100 195930 141630 -275 6.68J04-22 Awn Hijazi 19-14/37 3/24/04 196120 141060 -287.4 6.91J04-23 Saleem Nimm19-13/49 3/24/04 195530 139480 -290 7.29J04-24 Qasir Hisham 19-13/003 3/24/04 194155 143795 7.05J04-25 Bail Hussaini219-13/22 3/25/04 194250 138500 -272 6.97J04-26 Mahmud Akra19-13/50a 3/25/04 195810 139380 -290 6.7J04-27 Bail Hussaini219-13/21 3/26/04 194960 138560 -279 7.14J003-Z Jericho Süd 1 Lisan 10/30/03 100J003-I Jericho Qilt 80Lisan 11/1/03 100J003-X Jericho Süd 1 Lisan 10/30/03 100J003-P Fertiliser chemFertilizer 10/30/03J004-Q Lisan Lisan 3/30/04 100J004-Z Samara Samara 3/30/04J004-Y Samara Samara 3/30/04J004-X Lisan Lisan 3/30/04 100

Datenblatt : Palästinaschwarz=Eing
rot= BerechnuXXXXXXXXXXXXXXXXXXXXXXXXXXXXXXSampleID Site Well CodeJ03-01 Arab Project6 19-14/066J04-01 Arab Project6 19-14-66J03-02 Arab Project6 19-14/067J04-02 Arab Project6 19-14/067J03-03 Arab Project7 19-14/073J04-03 Arab Project7 19-14/073J03-04 Fahmi Nahas419-13/048J04-04 Fahmi Nahas419-13/048J03-05 Fahmi Nahas419-13/047J04-05 Fahmi Nahas419-13/047J03-06 Sabiru Rantizi19-13/006J04-06 Sabiru Rantizi19-13/006J03-07 Fahed Hishmi 19-13/015J04-07 Fahed Hishmi 19-13/015J03-08 Zuhdi Hashwa19-13/052J04-08 Zuhdi Hashwa19-13/052J03-09 Salah Arouri 19-14/012J04-09 Salah Arouri 19-14/012J03-10 Basil Husaini219-13/020J04-10 Basil Husaini219-13/020J03-11 Basil Husaini119-13/018J04-11 Basil Husaini119-13/018J03-12 Ibrahim Daek NWJ04-12 Ibrahim Daek IBRAIN DEKJ03-13 Iron Factory 19-13/26aJ03-14 Ein Sultan AC/061J04-14 Ein Sultan AC/61J03-15 Ein Dyouk AC/060J04-15 Ein Dyouk AC/60J03-16 Awni Hijazi 19-14/052J04-16 Awni Hijazi 19-14/052J03-17 Saeed Aladee19-14/062J04-17 Saeed Aladee19-14/062J03-18 Mohammed M19-14/038J04-18 Mohammed M19-14/38J03-19 Samed 19-14/26aJ04-19 Samed 19-14/26aJ03-20 Arab Project619-13/069J04-20 Arab Project619-13/069J03-21 Abdallah Araik19-14/049J04-22 Awn Hijazi 19-14/37J04-23 Saleem Nimm19-13/49J04-24 Qasir Hisham 19-13/003J04-25 Bail Hussaini219-13/22J04-26 Mahmud Akra19-13/50aJ04-27 Bail Hussaini219-13/21J003-Z Jericho Süd 1 Lisan J003-I Jericho Qilt 80Lisan J003-X Jericho Süd 1 Lisan J003-P Fertiliser chemFertilizerJ004-Q Lisan Lisan J004-Z Samara SamaraJ004-Y Samara SamaraJ004-X Lisan Lisan
2fache Korreknicht korregier1. Korrektur grau hinterlegt = Mesung ANA-UFZ-Leipzig, sonst MesunEh-2 Eh Eh-1 pks(4,3) pks (4.3) GW Lf [25°C] Spurenelemente mg/l2fache Korreknicht korregier1. KorrekturEh-2 Eh Eh-1 pks(4,3) pks (4.3) GW Lf [25°C] Li Li Na+ Na (AAS)
XXXXXXXXXXXXXXXXXXXXXXXXXXXXXXXXXXXXXXXXXXXXXXXXXXXXXXXXXXXXXXXXXXXXXXXXXXXXXXXXXXXXXXXXXXXXXXXXXXXXXXXXXXXXXXXXXXXXXXXXXXXXXXXXXXXXXXXXXXXXpe Eh korr [V] Eh-gem [mV] Eh 1korr [mV] m-Wert [mmo Alkalinity [mm pks4.3 [mg/l HT [in °C] Depth [m u GOCond [mS/cm]Li Na
0.35702614 152 357.02614 7.22 7.28 444.13824 26.6 85 5.39 0.1744 5770.58021256 375 580.21256 6.74 6.8 414.8544 26.4 85 5.36 0.1648 5590.31921256 114 319.21256 6.02 6.08 370.92864 26.4 73 5.84 0.1909 6390.47249219 267 472.49219 6.66 6.72 409.97376 26.1 73 6.23 0.1897 6680.32821256 123 328.21256 6.66 6.72 409.97376 26.4 80 3.89 0.1397 359.30.47049219 265 470.49219 6.34 6.4 390.4512 26.1 80 4.11 0.1337 357.60.4243817 216 424.3817 5.71 5.77 352.01616 23 57 1.471 -0.07 113.6
0.44672923 239 446.72923 5.22 5.28 322.12224 23.7 57 1.538 0.037 112.70.42156812 213 421.56812 5.83 5.89 359.33712 22.8 74 1.454 -0.07 116.30.4503817 242 450.3817 5.3 5.36 327.00288 23 74 1.483 0.0343 109.5
0.33119528 123 331.19528 6.18 6.24 380.68992 23.2 57 2.33 -0.07 158.60.45910207 251 459.10207 5.62 5.68 346.52544 23.3 57 2.38 0.0334 160.70.33889034 132 338.89034 6.22 6.28 383.13024 24.6 63 2.35 0.0751 214.40.43398355 227 433.98355 5.54 5.6 341.6448 24.5 63 2.46 0.0747 212.90.34300886 135 343.00886 6.06 6.12 373.36896 23.4 160 2.59 -0.07 207.40.3764496 169 376.4496 5.74 5.8 353.8464 24 160 2.78 0.0629 216
0.37575454 167 375.75454 6.86 6.92 422.17536 22.6 65 1.279 -0.07 92.30.48589034 279 485.89034 5.62 5.68 346.52544 24.6 65 1.325 0.0299 89.30.42572923 218 425.72923 5.74 5.8 353.8464 23.7 83 1.16 -0.07 148.30.5094496 302 509.4496 5.22 5.28 322.12224 24 83 1.6 0.0363 138.6
0.40922059 200 409.22059 5 5.06 308.70048 22.1 90 1.146 -0.07 81.50.4985175 292 498.5175 4.82 4.88 297.71904 25 90 1.189 0.0249 83.1
0.37126318 164 371.26318 6.18 6.24 380.68992 24.2 3.23 0.0875 315.10.43735639 230 437.35639 6.06 6.12 373.36896 24.1 3.3 0.0881 3110.21979713 13 219.79713 4.26 4.32 263.55456 24.7 1.939 -0.07 104.80.47196627 262 471.96627 4.86 4.92 300.15936 21.3 0.637 -0.07 22.830.54115269 331 541.15269 4.38 4.44 270.87552 21.1 0.678 0 25.790.5072459 297 507.2459 4.72 4.78 291.61824 21 0.637 -0.07 23.150.4852459 275 485.2459 4.82 4.88 297.71904 21 0.678 0 26.29
0.44623787 240 446.23787 6.24 6.3 384.3504 25.3 82 3.11 0.0832 300.20.48942429 283 489.42429 6.86 6.92 422.17536 25.1 82 3.04 0.0791 285.70.46507676 258 465.07676 5.98 6.04 368.48832 24.4 120 2.72 -0.07 2300.39105145 185 391.05145 6.46 6.52 397.77216 25.5 120 2.57 0.0492 208.10.34505145 139 345.05145 6.24 6.3 384.3504 25.5 110 2.27 -0.07 176.60.37595824 170 375.95824 6.62 6.68 407.53344 25.6 110 2.42 0.0538 201.80.41054281 203 410.54281 7.19 7.25 442.308 23.9 120 1.233 -0.07 64.50.4054496 198 405.4496 6.78 6.84 417.29472 24 120 1.222 0.0102 58.3
0.34530577 140 345.30577 6.87 6.93 422.78544 26.3 132 4.05 0.1371 460.10.39539898 190 395.39898 6.82 6.88 419.73504 26.2 132 4.12 0.1292 5080.30605145 100 306.05145 5.98 6.04 368.48832 25.5 90 2.47 -0.07 2100.49977182 294 499.77182 6.3 6.36 388.01088 25.8 3.67 0.0934 355.20.5074496 300 507.4496 6.34 6.4 390.4512 24 1.89 0.0776 183.80.3935854 188 393.5854 5.74 5.8 353.8464 26 3.43 0.0636 306.3
0.34942429 143 349.42429 5.66 5.72 348.96576 25.1 3.15 0.0885 266.40.28454281 77 284.54281 6.66 6.72 409.97376 23.9 2.18 0.0617 149.70.41830577 213 418.30577 5.74 5.8 353.8464 26.3 2.83 0.0789 263.7
114540114540114540114540
-0.1 333-0.1 10.5-0.1 71.4-0.1 161

Datenblatt : Palästinaschwarz=Eing
rot= BerechnuXXXXXXXXXXXXXXXXXXXXXXXXXXXXXXSampleID Site Well CodeJ03-01 Arab Project6 19-14/066J04-01 Arab Project6 19-14-66J03-02 Arab Project6 19-14/067J04-02 Arab Project6 19-14/067J03-03 Arab Project7 19-14/073J04-03 Arab Project7 19-14/073J03-04 Fahmi Nahas419-13/048J04-04 Fahmi Nahas419-13/048J03-05 Fahmi Nahas419-13/047J04-05 Fahmi Nahas419-13/047J03-06 Sabiru Rantizi19-13/006J04-06 Sabiru Rantizi19-13/006J03-07 Fahed Hishmi 19-13/015J04-07 Fahed Hishmi 19-13/015J03-08 Zuhdi Hashwa19-13/052J04-08 Zuhdi Hashwa19-13/052J03-09 Salah Arouri 19-14/012J04-09 Salah Arouri 19-14/012J03-10 Basil Husaini219-13/020J04-10 Basil Husaini219-13/020J03-11 Basil Husaini119-13/018J04-11 Basil Husaini119-13/018J03-12 Ibrahim Daek NWJ04-12 Ibrahim Daek IBRAIN DEKJ03-13 Iron Factory 19-13/26aJ03-14 Ein Sultan AC/061J04-14 Ein Sultan AC/61J03-15 Ein Dyouk AC/060J04-15 Ein Dyouk AC/60J03-16 Awni Hijazi 19-14/052J04-16 Awni Hijazi 19-14/052J03-17 Saeed Aladee19-14/062J04-17 Saeed Aladee19-14/062J03-18 Mohammed M19-14/038J04-18 Mohammed M19-14/38J03-19 Samed 19-14/26aJ04-19 Samed 19-14/26aJ03-20 Arab Project619-13/069J04-20 Arab Project619-13/069J03-21 Abdallah Araik19-14/049J04-22 Awn Hijazi 19-14/37J04-23 Saleem Nimm19-13/49J04-24 Qasir Hisham 19-13/003J04-25 Bail Hussaini219-13/22J04-26 Mahmud Akra19-13/50aJ04-27 Bail Hussaini219-13/21J003-Z Jericho Süd 1 Lisan J003-I Jericho Qilt 80Lisan J003-X Jericho Süd 1 Lisan J003-P Fertiliser chemFertilizerJ004-Q Lisan Lisan J004-Z Samara SamaraJ004-Y Samara SamaraJ004-X Lisan Lisan
ng UFZ-HDG Halle, wenn nicht anders angegeben, Hauptelemente mit IC gemesssen!!Ammonium (mg/l) Spurenelemen
K+ K Mg2+ Mg Ca2+ Ca Mn Fe NH4 B Ba Sr Cr As (AAS)XXXXXXXXXXXXXXXXXXXXXXXXXXXXXXXXXXXXXXXXXXXXXXXXXXXXXXXXXXXXXXXXXXXXXXXXXXXXXXXXXXXXXXXXXXXXXXXXXXXXXXXXXXXXXXXXXXXXXXXXXXXXXXXXXXXXXXXXXXXXK Mg Ca Mn Fe NH4 B Ba Sr Rb
82.6 213.7 186.1 0.0206 0.084 0.01 1.078 0.099 3.5678.3 198 168.1 -0.009 0.0333 0 1.023 0.1028 3.173 0.06
104.1 220.8 167.3 -0.01 0.868 0 1.32 0.1534 2.843102.9 219.7 163.2 0.009 0.0447 0 1.313 0.1513 2.753 0.0779.6 164.6 128.3 -0.01 -0.05 0 0.973 0.2205 1.83375.1 158.9 123.9 0.009 0.0738 0.001 0.945 0.2113 1.729 0.05
15.38 69.9 91.5 -0.01 -0.05 0 0.2566 0.0651 2.00314.68 66.4 89.8 0 0.0103 0 0.2666 0.0683 1.896 0.0112.42 66.6 93.7 -0.01 -0.05 0.006 0.2671 0.0673 2.14412.07 63.3 89.7 0 0 0.018 0.2633 0.0624 2.054 0.017.95 93.5 173.4 -0.01 -0.05 0 0.3118 0.1269 3.5537.75 91.1 163 0 0 0.02 0.32 0.1242 3.415 0.01
38.47 101.4 99.5 -0.01 0 0.002 0.476 0.0893 1.73237.34 101 103.9 0 0.1163 0.02 0.4659 0.0978 1.775 0.0328.32 113.9 127.7 -0.01 -0.05 0.005 0.4956 0.0713 3.57927.95 115.4 128 0 0.1531 0 0.527 0.0885 3.358 0.0211.17 63.3 88.4 -0.01 -0.05 0.001 0.2083 0.054 1.88710.86 60.2 87.7 -0.009 0.0188 0 0.2168 0.0592 1.814 0.0117.01 73.4 92 0.2183 0.4107 0.007 0.4115 0.0838 1.60714.82 63 82.8 -0.009 -0.01 0 0.3908 0.0732 1.366 0.019.63 52.2 87.7 -0.01 -0.05 0.004 0.216 0.0353 1.39.2 49.72 86.4 -0.009 -0.01 0 0.2262 0.0414 1.226 0.01
39.52 130 131.7 -0.01 -0.05 0.008 0.734 0.126 2.25939.32 127.3 126.7 -0.009 0.0303 0.169 0.746 0.1514 2.241 0.0316.7 97.6 130 0.0218 -0.05 0.005 0.2302 0.3069 4.308
2.503 30.08 79.1 -0.01 -0.05 0.005 0.0406 0.0301 0.12532.678 27.88 83.9 -0.009 0.0328 0 0.0486 0.0334 0.1176 -0.0052.471 29.81 81.5 -0.01 0.1126 0.015 0.0407 0.0342 0.13242.688 28.25 85.9 -0.009 0.0241 0.054 0.0467 0.0314 0.117 -0.00535.78 124.3 122 -0.01 -0.05 0.012 0.4954 0.1649 2.85334.12 117.3 115.6 0.049 0.3821 0.054 0.4702 0.1657 2.654 0.0324.18 109.9 140.7 -0.01 -0.05 0.016 0.295 0.079 1.1921.16 94.8 125.8 0 -0.009 -0.01 0.01 0.2717 0.0739 1.032 0.0219.42 102.1 128.1 -0.01 -0.05 0.031 0.294 0.1076 1.16619.04 97.5 140.1 0.0206 0.0591 0 0.3059 0.1054 1.116 0.026.37 64.2 117.9 -0.01 -0.05 0.017 0.1239 0.0603 0.5255.56 58.5 116.9 -0.009 0.0117 0 0.1042 0.0641 0.4578 0.0179.6 140 116.7 -0.01 -0.05 0.017 0.818 0.16 1.961
75 148.9 112.1 -0.009 0.0148 0 0.786 0.1561 1.809 0.0515.34 105.7 131.2 -0.01 0.1426 0.024 0.2927 0.1571 1.12747.14 157.4 157.2 -0.009 0.0185 0 0.595 0.1432 1.867 0.0450.1 76.2 71.9 -0.009 -0.01 0 0.519 0.126 1.126 0.03
27.63 123.7 163.6 -0.009 0.0219 0 0.3349 0.0355 1.42 0.0242.26 135.6 133.7 -0.009 0.0223 0.01 0.648 0.1219 2.178 0.0333.47 92.8 119.5 0.0428 0.4029 0.17 0.3775 0.1162 1.946 0.0336.26 118.2 117.4 -0.009 -0.01 0.03 0.586 0.1265 1.764 0.03
1334.5 145.4 4020 #WERT! #WERT! #WERT! 29.15 0.2565 39.5 0.03166.3 754 2855 0.2005 #WERT! 5 5.2 1.139 183.42770 836 3420 #WERT! #WERT! 1 165.75 0.1595 58.6
151375 70.9 43.95 241.5 419.5 2 0.927 0.155 0.67253.72 44.5 156 -0.01 -0.1 0.38 0.33 17.141.28 4.66 18.2 -0.01 -0.1 0.06 0.02 0.12.65 10.3 10.7 -0.01 -0.1 0.11 0.05 0.321.88 20.7 74.8 -0.01 -0.1 0.28 0.23 9.62

Datenblatt : Palästinaschwarz=Eing
rot= BerechnuXXXXXXXXXXXXXXXXXXXXXXXXXXXXXXSampleID Site Well CodeJ03-01 Arab Project6 19-14/066J04-01 Arab Project6 19-14-66J03-02 Arab Project6 19-14/067J04-02 Arab Project6 19-14/067J03-03 Arab Project7 19-14/073J04-03 Arab Project7 19-14/073J03-04 Fahmi Nahas419-13/048J04-04 Fahmi Nahas419-13/048J03-05 Fahmi Nahas419-13/047J04-05 Fahmi Nahas419-13/047J03-06 Sabiru Rantizi19-13/006J04-06 Sabiru Rantizi19-13/006J03-07 Fahed Hishmi 19-13/015J04-07 Fahed Hishmi 19-13/015J03-08 Zuhdi Hashwa19-13/052J04-08 Zuhdi Hashwa19-13/052J03-09 Salah Arouri 19-14/012J04-09 Salah Arouri 19-14/012J03-10 Basil Husaini219-13/020J04-10 Basil Husaini219-13/020J03-11 Basil Husaini119-13/018J04-11 Basil Husaini119-13/018J03-12 Ibrahim Daek NWJ04-12 Ibrahim Daek IBRAIN DEKJ03-13 Iron Factory 19-13/26aJ03-14 Ein Sultan AC/061J04-14 Ein Sultan AC/61J03-15 Ein Dyouk AC/060J04-15 Ein Dyouk AC/60J03-16 Awni Hijazi 19-14/052J04-16 Awni Hijazi 19-14/052J03-17 Saeed Aladee19-14/062J04-17 Saeed Aladee19-14/062J03-18 Mohammed M19-14/038J04-18 Mohammed M19-14/38J03-19 Samed 19-14/26aJ04-19 Samed 19-14/26aJ03-20 Arab Project619-13/069J04-20 Arab Project619-13/069J03-21 Abdallah Araik19-14/049J04-22 Awn Hijazi 19-14/37J04-23 Saleem Nimm19-13/49J04-24 Qasir Hisham 19-13/003J04-25 Bail Hussaini219-13/22J04-26 Mahmud Akra19-13/50aJ04-27 Bail Hussaini219-13/21J003-Z Jericho Süd 1 Lisan J003-I Jericho Qilt 80Lisan J003-X Jericho Süd 1 Lisan J003-P Fertiliser chemFertilizerJ004-Q Lisan Lisan J004-Z Samara SamaraJ004-Y Samara SamaraJ004-X Lisan Lisan
Wasserprobennte mg/l IC : Anionen/Kationen (mgl/l)
Al F- Cl- Br- I SO42- NO3- NO2- C(HCO3) mg/ C(CO3) mg/L PO43- P SiXXXXXXXXXX XXXXXXXXXXXXXXXXXXXXXXXXXXXXXXXXXXXXXXXXXXXXXXXXXXXXXXXXXXXXXXXXXXXXXXXXXXXXXXXXXXXXXXXXXXXXXXXXXXXXXXXXXXXXXXXXXXXXXXXX
F Cl Br I SO4 NO3 HCO3 CO3 PO4 P Si-0.2 1423 15.7 300.9 29.69 439.2 0.474 0.035 0.01142105 8.8-0.2 1405 11.5 285 38 409.31 0.939 0.01 0.00326316 8.51-0.2 1638 14 183.4 38.86 366.61 0.358 0.043 0.01403158 8.36-0.2 1725 13.9 221 51 405.04 0.566 0 0 7.94-0.2 1000 7.6 95.9 40.41 405.65 0.358 0.016 0.00522105 7.97-0.2 1014 7.1 111 48 386.13 0.352 0.01 0.00326316 7.56-0.2 238 2.5 70 41.67 347.7 0.362 0 0 7.3-0.2 240 1.6 82.7 61 317.81 0.316 0.05 0.01631579 6.89-0.2 225 2.2 77.2 43.73 355.02 0.384 0 0 7.96-0.2 228 1.2 82.2 71.5 322.69 0.28 0.05 0.01631579 7.45-0.2 414 2.5 117.6 62 376.37 0.216 0.301 0.09822105 9.23-0.2 452 2 153 100 342.21 0.266 0.01 0.00326316 8.8-0.2 504 5.3 60.8 33.24 378.81 0.355 0.001 0.00032632 6.99-0.2 513 4.5 62.1 50 337.33 0.341 0.3 0.09789474 6.77-0.2 536 4.1 166 46.55 369.05 0.404 0 0 7.43-0.2 556 3.4 194 79 349.53 0.351 0.05 0.01631579 7.14-0.2 187 1.9 59.2 40.54 417.85 0.383 0 0 7.740.44 195 1.1 64.5 70 342.21 0.345 0.3 0.09789474 7.32-0.2 264 2.5 110.1 49.38 349.53 0.338 0.005 0.00163158 6.990.44 243 1.6 120 65 317.2 0.452 0.06 0.01957895 6.2-0.2 162 2.2 58.6 29.08 304.39 0.311 0 0 7.050.44 166 0.5 71.4 52 292.8 0.639 0.1 0.03263158 6.75-0.2 750 6.2 167.7 29.68 376.37 0.312 0 0 6.980.32 764 5.9 189 47 369.05 0.36 0.05 0.01631579 6.86-0.2 406 2.5 90 70.13 259.25 0.323 0 0 10.69-0.2 34.4 1 17.2 42.46 295.24 0.622 0.095 0.031 4.7570.2 48.7 0.5 24.1 48 266.57 0.381 0.165 0.05384211 4.43
-0.2 34.9 0.5 16.7 29.07 287.31 0.229 0.097 0.03165263 4.7850.2 44.6 0.5 23.8 55 293.41 0.364 0.215 0.0701579 4.473
-0.2 745 7.2 72.1 34.07 380.03 0.242 0 0 8.17-0.2 695 6.5 76.5 50 417.85 0.356 0.08 0.02610526 8.16-0.2 656 8.7 40.6 5.18 364.17 0.226 0.088 0.02871579 6.870.29 566 5.6 43.5 20 393.45 0.29 0.2 0.06526316 6.36-0.2 499 6.1 39.6 7.5 380.03 0.189 0 0 7.27-0.2 527 6.2 44 10.5 403.21 0.287 0.06 0.01957895 6.87-0.2 121 1.7 22.6 15.97 437.37 0.471 0 0 7.04-0.2 130 0.9 20.9 41 412.97 0.37 0.03 0.00978947 6.48-0.2 1041 10.9 103.8 24.51 418.46 0.399 0.012 0.00391579 7.85-0.2 1054 11 109 43 415.41 0.371 0.012 0.00391579 7.39-0.2 528 5.8 92.7 30.58 364.78 0.14 0.004 0.00130526 7.12-0.2 916 8.4 117 49.5 383.69 0.275 0.01 0.00326316 8.22-0.2 335 1.8 66.2 75 385.52 0.553 0.12 0.0391579 7.49-0.2 890 11.9 52.6 23.5 349.53 0.341 0 0 9.31-0.2 693 4.2 222 50 344.65 0.27 0.1 0.03263158 7.64-0.2 385 2 109 54 406.26 0.154 0.14 0.04568421 8.28-0.2 722 5.7 172 95 349.53 0.404 0.023 0.00750526 7.11-0.2 #WERT! 5500 91 #WERT! 0.404 3.75-0.2 70.5 707.5 653 #WERT! #WERT! 30.45-0.2 77.5 24175 91 #WERT! 1.7235 6.945-0.2 #WERT! 1796.5 236000 250500 70875 8.531.7 882.66 6.21 20.19 10.8
0.48 2.46 0.14 10.4 4.280.93 94.91 0.63 18.27 3.961.7 390.61 3.68 33.6 11.6

Datenblatt : Palästinaschwarz=Eing
rot= BerechnuXXXXXXXXXXXXXXXXXXXXXXXXXXXXXXSampleID Site Well CodeJ03-01 Arab Project6 19-14/066J04-01 Arab Project6 19-14-66J03-02 Arab Project6 19-14/067J04-02 Arab Project6 19-14/067J03-03 Arab Project7 19-14/073J04-03 Arab Project7 19-14/073J03-04 Fahmi Nahas419-13/048J04-04 Fahmi Nahas419-13/048J03-05 Fahmi Nahas419-13/047J04-05 Fahmi Nahas419-13/047J03-06 Sabiru Rantizi19-13/006J04-06 Sabiru Rantizi19-13/006J03-07 Fahed Hishmi 19-13/015J04-07 Fahed Hishmi 19-13/015J03-08 Zuhdi Hashwa19-13/052J04-08 Zuhdi Hashwa19-13/052J03-09 Salah Arouri 19-14/012J04-09 Salah Arouri 19-14/012J03-10 Basil Husaini219-13/020J04-10 Basil Husaini219-13/020J03-11 Basil Husaini119-13/018J04-11 Basil Husaini119-13/018J03-12 Ibrahim Daek NWJ04-12 Ibrahim Daek IBRAIN DEKJ03-13 Iron Factory 19-13/26aJ03-14 Ein Sultan AC/061J04-14 Ein Sultan AC/61J03-15 Ein Dyouk AC/060J04-15 Ein Dyouk AC/60J03-16 Awni Hijazi 19-14/052J04-16 Awni Hijazi 19-14/052J03-17 Saeed Aladee19-14/062J04-17 Saeed Aladee19-14/062J03-18 Mohammed M19-14/038J04-18 Mohammed M19-14/38J03-19 Samed 19-14/26aJ04-19 Samed 19-14/26aJ03-20 Arab Project619-13/069J04-20 Arab Project619-13/069J03-21 Abdallah Araik19-14/049J04-22 Awn Hijazi 19-14/37J04-23 Saleem Nimm19-13/49J04-24 Qasir Hisham 19-13/003J04-25 Bail Hussaini219-13/22J04-26 Mahmud Akra19-13/50aJ04-27 Bail Hussaini219-13/21J003-Z Jericho Süd 1 Lisan J003-I Jericho Qilt 80Lisan J003-X Jericho Süd 1 Lisan J003-P Fertiliser chemFertilizerJ004-Q Lisan Lisan J004-Z Samara SamaraJ004-Y Samara SamaraJ004-X Lisan Lisan
Oxi
C(CO2aq) mg(mg/l) IsotopeXXXXXXXXXXXXXXXXXXXXXXXXXXXXXXXXXXXXXXXXXXXXXXXXXXXXXXXXXXXX XXXXXXXXXX XXXXXXXXXXXXXXXXXXXXXXXXXXXXXXXXXXXXXXXXXXXXXXXXXXSIO2 CO2 18O 2H corrected O18Corr. D 13C(DIC) 18O(DIC) 34S(SO4) 18O(SO4) 34S(S-2) N-15 (NO3) O-18(NO3)
18.8571429 49.72 -5.39 -26.1 -5.25045234 -24.8459699 -9.56 -9.7 13.5 9.25 5.718.2357143 22 -5.4 -23.5 -5.28073594 -22.7122382 -9.3 -8.1 13.2 -3.317.9142857 46.64 -5.4 -5.29 -25.4 -5.16953433 -24.2736661 -9.1 -2.2 12.3 7.42 4.517.0142857 36.08 -5.28 -22.6 -5.16959367 -21.8728481 -9.6 -0.8 12 7 6.217.0785714 53.24 -5.28 -5.36 -26.7 -5.21245933 -25.3831252 -10.2 6 16.3 7.37 3.9
16.2 49.72 -5.39 -23.2 -5.26030983 -22.3388179 -10.2 6 17.8 7.1 4.515.6428571 33 -5.39 -5.38 -26.2 -5.07342528 -23.7029171 -10.2 5.7 16.1 7.42 3.814.7642857 31.68 -5.39 -23.6 -5.22580682 -22.4586899 -11.3 5.9 17.5 7.1 4.317.0571429 32.12 -5.39 -5.39 -26 -5.07360199 -23.4062004 -10.7 6.9 16.3 6.94 3.815.9642857 36.96 -5.41 -24 -5.24845511 -22.8730907 -10.7 6.9 17.2 6.6 3.819.7785714 69.08 -5.41 -5.5 -26.7 -5.23441427 -24.5122381 -10.5 3.5 16.8 9.29 2.318.8571429 46.2 -5.55 -25.9 -5.38754785 -24.7302478 -10.2 2.9 17.7 8.2 2.814.9785714 42.68 -5.55 -5.46 -26.3 -5.26826182 -24.6357731 -9.7 9.7 17.3 8.5 4.814.5071429 35.64 -5.44 -23.8 -5.2943918 -22.8108114 -10 10.4 18.8 7.5 415.9214286 36.08 -5.44 -5.44 -26.6 -5.22732556 -24.8609951 -9.84 -5.9 17.3 7.7 4.3
15.3 37.4 -5.44 -24.1 -5.28655603 -23.0728348 -9.4 -7 17.6 7.6 616.5857143 44 -5.44 -5.5 -25.9 -5.13844728 -23.0084754 -10.6 4.6 16.9 8.47 4.315.6857143 33.44 -5.51 -24.1 -5.34190729 -22.922612 -10.4 7.2 17.7 7.3 4.614.9785714 34.76 -5.51 -5.27 -26.6 -4.98341386 -24.2048144 -9.3 3.6 16.8 6.89 3.413.2857143 22.44 -5.28 -23.9 -5.13365575 -22.8864273 -10.8 4.5 18 6.8 3.915.1071429 28.16 -5.28 -5.48 -27.7 -5.11731551 -24.6875768 -10.7 -1.3 17 8.29 5.214.4642857 13.2 -5.44 -23.7 -5.27386453 -22.4868079 -11.3 -1.1 15.9 7.7 4.814.9571429 50.16 -5.44 -5.23 -26.4 -5.06174608 -24.9473417 -9.8 7.7 16.6 6.59 4.9
14.7 42.24 -5.22 -23.4 -5.08778952 -22.5197872 -10.1 6.1 17.1 5.9 4.222.9071429 21.56 -5.52 -27 -5.26626385 -25.0477606 -8.9 -5.1 3.3 9.64 5.210.1935714 12.76 -5.87 -28.1 -4.70182067 -18.3593402 -12.4 8.7 15 10.08 3.39.49285714 16.72 -5.96 -26.1 -5.76394463 -24.493606 -12.8 6.7 14.4 9.8 410.2535714 32.12 -5.96 -5.87 -28.1 -4.71043933 -18.3429935 -12.7 6 9.9 10.48 3.9
9.585 21.12 -5.96 -26.2 -5.76923048 -24.6333535 -13 7.8 9.9 10.1 3.917.5071429 66.44 -5.96 -5.5 -27.7 -5.3387881 -26.3239736 -10.2 12.5 14 9.99 4.917.4857143 54.12 -5.48 -24.8 -5.34801256 -23.92765 -10.6 11.8 15.5 8.9 414.7214286 63.36 -5.48 -5.54 -27.6 -5.36614783 -26.14332 -11.1 6.7 14.9 10.12 13.913.6285714 57.64 -5.55 -25.1 -5.40849132 -24.1213242 -12.5 5.7 16.2 12.7 1015.5785714 81.4 -5.55 -5.54 -27.3 -5.32787279 -25.5916046 -11.6 5.9 12 2.99 14.714.7214286 60.72 -5.52 -25.7 -5.36748412 -24.6334926 -12.1 5.2 12.1 1315.0857143 39.6 -5.52 -5.56 -27.8 -4.93916833 -22.8953837 -12.1 10 11.3 15.78 8.513.8857143 44.88 -5.52 -24.6 -5.31574368 -23.0844275 -12.8 9.9 10.8 11.3 6.416.8214286 51.04 -5.52 -5.54 -28.3 -5.41961856 -27.0936325 -9.57 3.8 13.9 10.9 7.315.8357143 54.56 -5.52 -23.6 -5.41186968 -22.8805482 -9.2 5.5 15.1 10.2 7.215.2571429 102.08 -5.54 -25.7 -5.33170781 -24.0210158 -11.9 9.5 12.7 8.14 3.417.6142857 61.16 -5.27 -22.8 -5.12744421 -21.8517433 -10.9 9.8 18.6 6.1 2.8
16.05 27.72 -5.51 -24.1 -5.38292131 -23.1912779 -9.7 10.9 17.8 8.1 4.119.95 -5.49 -24 -5.35640072 -23.0756809 -12.1 9.6 17.3 8.6 7.8
16.3714286 -5.27 -23.4 -5.11998011 -22.4022957 -10 -1.1 15.4 7.1 4.417.7428571 -5.45 -23.9 -5.2894443 -22.76262 -7.4 -0.2 -3.8 7.9 5.115.2357143 -5.22 -23.1 -5.08819611 -22.2230034 -9.8 4.8 17.5 10.3 4.2
#DIV/0! #DIV/0! 13.1 16.34#DIV/0! #DIV/0! 12.1 15.17#DIV/0! #DIV/0! -5.1 11.89#DIV/0! #DIV/0!
16.4 16.66.9 1.49.1 9.19.8 15.5

Datenblatt : Palästinaschwarz=Eing
rot= BerechnuXXXXXXXXXXXXXXXXXXXXXXXXXXXXXXSampleID Site Well CodeJ03-01 Arab Project6 19-14/066J04-01 Arab Project6 19-14-66J03-02 Arab Project6 19-14/067J04-02 Arab Project6 19-14/067J03-03 Arab Project7 19-14/073J04-03 Arab Project7 19-14/073J03-04 Fahmi Nahas419-13/048J04-04 Fahmi Nahas419-13/048J03-05 Fahmi Nahas419-13/047J04-05 Fahmi Nahas419-13/047J03-06 Sabiru Rantizi19-13/006J04-06 Sabiru Rantizi19-13/006J03-07 Fahed Hishmi 19-13/015J04-07 Fahed Hishmi 19-13/015J03-08 Zuhdi Hashwa19-13/052J04-08 Zuhdi Hashwa19-13/052J03-09 Salah Arouri 19-14/012J04-09 Salah Arouri 19-14/012J03-10 Basil Husaini219-13/020J04-10 Basil Husaini219-13/020J03-11 Basil Husaini119-13/018J04-11 Basil Husaini119-13/018J03-12 Ibrahim Daek NWJ04-12 Ibrahim Daek IBRAIN DEKJ03-13 Iron Factory 19-13/26aJ03-14 Ein Sultan AC/061J04-14 Ein Sultan AC/61J03-15 Ein Dyouk AC/060J04-15 Ein Dyouk AC/60J03-16 Awni Hijazi 19-14/052J04-16 Awni Hijazi 19-14/052J03-17 Saeed Aladee19-14/062J04-17 Saeed Aladee19-14/062J03-18 Mohammed M19-14/038J04-18 Mohammed M19-14/38J03-19 Samed 19-14/26aJ04-19 Samed 19-14/26aJ03-20 Arab Project619-13/069J04-20 Arab Project619-13/069J03-21 Abdallah Araik19-14/049J04-22 Awn Hijazi 19-14/37J04-23 Saleem Nimm19-13/49J04-24 Qasir Hisham 19-13/003J04-25 Bail Hussaini219-13/22J04-26 Mahmud Akra19-13/50aJ04-27 Bail Hussaini219-13/21J003-Z Jericho Süd 1 Lisan J003-I Jericho Qilt 80Lisan J003-X Jericho Süd 1 Lisan J003-P Fertiliser chemFertilizerJ004-Q Lisan Lisan J004-Z Samara SamaraJ004-Y Samara SamaraJ004-X Lisan Lisan
Berechnungen:m-Wert : Titration auf pH4.3 Titrat.-Säure T in K log kwm-Wert: Titration auf pH 4.3 Titr. Säure
°KXXXXXXXXXXXXXXXXXXXXXXXXXXXX T in K log kw 1N-15(NH3) ³H(TU) X Vol. (ml) Skalenteile (H Normalität C(CO2aq) moC(CO2aq) mmC(HCO3) mol/C(HCO3) mm C(CO3) mol/L C(CO3) mmol/L
0.6 -999 50 1819 0.16 0.0011 1.13 0.0072 7.2 0 0.0079 299.75 13.94140.7 -999 50 170 1.6 0.0005 0.5 0.0067 6.71 0 0.0156 299.55 13.9479
1 -999 50 1520 0.16 0.0011 1.06 0.006 6.01 0 0.006 299.55 13.94791 -999 50 168 1.6 0.0008 0.82 0.0066 6.64 0 0.0094 299.25 13.9577
0.9 -999 50 1680 0.16 0.0012 1.21 0.0066 6.65 0 0.006 299.55 13.94790.8 -999 50 160 1.6 0.0011 1.13 0.0063 6.33 0 0.0059 299.25 13.95773.4 -999 50 1442 0.16 0.0007 0.75 0.0057 5.7 0 0.006 296.15 14.06083.6 -999 50 132 1.6 0.0007 0.72 0.0052 5.21 0 0.0053 296.85 14.03723.5 -999 50 1472 0.16 0.0007 0.73 0.0058 5.82 0 0.0064 295.95 14.0675
3 -999 50 134 1.6 0.0008 0.84 0.0053 5.29 0 0.0047 296.15 14.06083.8 -999 50 1560 0.16 0.0016 1.57 0.0062 6.17 0 0.0036 296.35 14.0543.7 -999 50 142 1.6 0.0011 1.05 0.0056 5.61 0 0.0044 296.45 14.05072.7 -999 50 1570 0.16 0.001 0.97 0.0062 6.21 0 0.0059 297.75 14.00722.5 -999 50 140 1.6 0.0008 0.81 0.0055 5.53 0 0.0057 297.65 14.01052.9 -999 50 1530 0.16 0.0008 0.82 0.006 6.05 0 0.0067 296.55 14.04733.1 -999 50 145 1.6 0.0009 0.85 0.0057 5.73 0 0.0058 297.15 14.02723.5 -999 50 1730 0.16 0.001 1 0.0068 6.85 0 0.0064 295.75 14.07433.8 -999 50 142 1.6 0.0008 0.76 0.0056 5.61 0 0.0057 297.75 14.00723.3 -999 50 1450 0.16 0.0008 0.79 0.0057 5.73 0 0.0056 296.85 14.03724.1 -999 50 132 1.6 0.0005 0.51 0.0052 5.2 0 0.0075 297.15 14.02723.6 -999 50 1265 0.16 0.0006 0.64 0.005 4.99 0 0.0052 295.25 14.09133.5 -999 50 122 1.6 0.0003 0.3 0.0048 4.8 0 0.0106 298.15 13.99392.1 -999 50 1560 0.16 0.0011 1.14 0.0062 6.17 0 0.0052 297.35 14.02052.2 -999 50 153 1.6 0.001 0.96 0.006 6.05 0 0.006 297.25 14.02383.5 -999 50 1079 0.16 0.0005 0.49 0.0042 4.25 0 0.0054 297.85 14.00394.3 -999 50 1230 0.16 0.0003 0.29 0.0048 4.84 0 0.0104 294.45 14.11874.3 -999 50 111 1.6 0.0004 0.38 0.0044 4.37 0 0.0063 294.25 14.12554.5 -999 50 1195 0.16 0.0007 0.73 0.0047 4.71 0 0.0038 294.15 14.1294.5 -999 50 122 1.6 0.0005 0.48 0.0048 4.81 0 0.0061 294.15 14.129
2 -999 50 1200 0.21 0.0015 1.51 0.0062 6.23 0 0.004 298.45 13.9842.4 -999 50 173 1.6 0.0012 1.23 0.0068 6.85 0 0.0059 298.25 13.99061.6 -999 50 1150 0.21 0.0014 1.44 0.006 5.97 0 0.0038 297.55 14.01381.6 -999 50 163 1.6 0.0013 1.31 0.0065 6.45 0 0.0048 298.65 13.97741.5 -999 50 1200 0.21 0.0019 1.85 0.0062 6.23 0 0.0031 298.65 13.9774
1 -999 50 167 1.6 0.0014 1.38 0.0066 6.61 0 0.0048 298.75 13.97411 -999 50 1380 0.21 0.0009 0.9 0.0072 7.17 0 0.0078 297.05 14.0305
1.4 -999 50 171 1.6 0.001 1.02 0.0068 6.77 0 0.0062 297.15 14.02720.9 -999 50 1320 0.21 0.0012 1.16 0.0069 6.86 0 0.0067 299.45 13.95120.8 -999 50 172 1.6 0.0012 1.24 0.0068 6.81 0 0.0062 299.35 13.95442.6 -999 50 1150 0.21 0.0023 2.32 0.006 5.98 0 0.0023 298.65 13.97741.4 -999 50 159 1.6 0.0014 1.39 0.0063 6.29 0 0.0046 298.95 13.96750.8 -999 50 160 1.6 0.0006 0.63 0.0063 6.32 0 0.0092 297.15 14.02721.4 50 145 1.6 0.0009 0.92 0.0057 5.73 0 0.0057 299.15 13.9612.3 50 143 1.6 0.0011 1.11 0.0057 5.65 0 0.0045 298.25 13.9906
1 50 168 1.6 0.0025 2.54 0.0067 6.66 0 0.0026 297.05 14.030550 145 1.6 0.0008 0.76 0.0057 5.73 0 0.0067 299.45 13.9512

Datenblatt : Palästinaschwarz=Eing
rot= BerechnuXXXXXXXXXXXXXXXXXXXXXXXXXXXXXXSampleID Site Well CodeJ03-01 Arab Project6 19-14/066J04-01 Arab Project6 19-14-66J03-02 Arab Project6 19-14/067J04-02 Arab Project6 19-14/067J03-03 Arab Project7 19-14/073J04-03 Arab Project7 19-14/073J03-04 Fahmi Nahas419-13/048J04-04 Fahmi Nahas419-13/048J03-05 Fahmi Nahas419-13/047J04-05 Fahmi Nahas419-13/047J03-06 Sabiru Rantizi19-13/006J04-06 Sabiru Rantizi19-13/006J03-07 Fahed Hishmi 19-13/015J04-07 Fahed Hishmi 19-13/015J03-08 Zuhdi Hashwa19-13/052J04-08 Zuhdi Hashwa19-13/052J03-09 Salah Arouri 19-14/012J04-09 Salah Arouri 19-14/012J03-10 Basil Husaini219-13/020J04-10 Basil Husaini219-13/020J03-11 Basil Husaini119-13/018J04-11 Basil Husaini119-13/018J03-12 Ibrahim Daek NWJ04-12 Ibrahim Daek IBRAIN DEKJ03-13 Iron Factory 19-13/26aJ03-14 Ein Sultan AC/061J04-14 Ein Sultan AC/61J03-15 Ein Dyouk AC/060J04-15 Ein Dyouk AC/60J03-16 Awni Hijazi 19-14/052J04-16 Awni Hijazi 19-14/052J03-17 Saeed Aladee19-14/062J04-17 Saeed Aladee19-14/062J03-18 Mohammed M19-14/038J04-18 Mohammed M19-14/38J03-19 Samed 19-14/26aJ04-19 Samed 19-14/26aJ03-20 Arab Project619-13/069J04-20 Arab Project619-13/069J03-21 Abdallah Araik19-14/049J04-22 Awn Hijazi 19-14/37J04-23 Saleem Nimm19-13/49J04-24 Qasir Hisham 19-13/003J04-25 Bail Hussaini219-13/22J04-26 Mahmud Akra19-13/50aJ04-27 Bail Hussaini219-13/21J003-Z Jericho Süd 1 Lisan J003-I Jericho Qilt 80Lisan J003-X Jericho Süd 1 Lisan J003-P Fertiliser chemFertilizerJ004-Q Lisan Lisan J004-Z Samara SamaraJ004-Y Samara SamaraJ004-X Lisan Lisan
log k1 k1 log k2 k2 (a(OH)-a(H))/fa(H) a(OH) (a(H)*f1)/(k1*f(H)) I(25)in mol/l log f1 f1 f2 f(H)I(25)in mol/l
log k1 k1 log k2 k2 Wert Ionenaktivität Ionenaktivität Wert für c(CO I aus IonenbilaIonenstärke log f1 Exponent exp*log (f1*2) f(H)(a(OH)-a(H))/fa (H) a(OH) (a(H)*f1)/(k1*f Ionenstärke I(25)in mol/l
-6.3426 0 -10.3158 0 0 0 0 0.157 0.0984 0.0892 -0.2106 0.6157 0.3791 0.7847-6.3436 0 -10.3175 0 0 0 0 0.074 0.0923 0.0887 -0.2102 0.6163 0.3798 0.785-6.3436 0 -10.3175 0 0 0 0 0.176 0.0969 0.0967 -0.2166 0.6072 0.3687 0.7793-6.3452 0 -10.32 0 0 0 0 0.124 0.099 0.1031 -0.2215 0.6004 0.3605 0.7749-6.3436 0 -10.3175 0 0 0 0 0.182 0.0676 0.0644 -0.1873 0.6498 0.4222 0.8061-6.3452 0 -10.32 0 0 0 0 0.178 0.0666 0.068 -0.1911 0.6441 0.4148 0.8025-6.3626 0 -10.3478 0 0 0 0 0.131 0.0346 0.0244 -0.1281 0.7446 0.5544 0.8629-6.3585 0 -10.3414 0 0 0 0 0.139 0.0341 0.0255 -0.1304 0.7406 0.5484 0.8606-6.3639 0 -10.3497 0 0 0 0 0.126 0.0348 0.0241 -0.1275 0.7456 0.556 0.8635-6.3626 0 -10.3478 0 0 0 0 0.158 0.0337 0.0246 -0.1285 0.7439 0.5533 0.8625-6.3614 0 -10.346 0 0 0 0 0.254 0.0575 0.0386 -0.154 0.7014 0.4919 0.8375-6.3608 0 -10.345 0 0 0 0 0.188 0.0566 0.0394 -0.1553 0.6993 0.489 0.8362-6.3533 0 -10.3332 0 0 0 0 0.157 0.045 0.0389 -0.1546 0.7005 0.4908 0.837-6.3539 0 -10.3341 0 0 0 0 0.146 0.0458 0.0407 -0.1574 0.6961 0.4845 0.8343-6.3603 0 -10.3441 0 0 0 0 0.135 0.054 0.0429 -0.1605 0.691 0.4774 0.8312-6.3567 0 -10.3386 0 0 0 0 0.149 0.0553 0.046 -0.165 0.6839 0.4678 0.827-6.3651 0 -10.3516 0 0 0 0 0.146 0.0325 0.0212 -0.1209 0.757 0.5731 0.8701-6.3533 0 -10.3332 0 0 0 0 0.136 0.0319 0.0219 -0.1227 0.7539 0.5684 0.8683-6.3585 0 -10.3414 0 0 0 0 0.138 0.037 0.0192 -0.1161 0.7655 0.586 0.8749-6.3567 0 -10.3386 0 0 0 0 0.098 0.0339 0.0265 -0.1326 0.737 0.5431 0.8585-6.3682 0 -10.3563 0 0 0 0 0.129 0.0298 0.019 -0.1155 0.7665 0.5875 0.8755-6.3511 0 -10.3297 0 0 0 0 0.062 0.0298 0.0197 -0.1173 0.7634 0.5827 0.8737-6.3556 0 -10.3368 0 0 0 0 0.185 0.0616 0.0535 -0.1747 0.6688 0.4473 0.8178-6.3562 0 -10.3377 0 0 0 0 0.158 0.061 0.0546 -0.1761 0.6666 0.4444 0.8165-6.3528 0 -10.3323 0 0 0 0 0.115 0.0466 0.0321 -0.1432 0.719 0.517 0.848-6.3733 0 -10.364 0 0 0 0 0.059 0.0223 0.0105 -0.0898 0.8132 0.6613 0.9018-6.3746 0 -10.3659 0 0 0 0 0.087 0.0233 0.0112 -0.0923 0.8086 0.6538 0.8992-6.3752 0 -10.3669 0 0 0 0 0.155 0.0226 0.0105 -0.0898 0.8132 0.6613 0.9018-6.3752 0 -10.3669 0 0 0 0 0.1 0.0239 0.0112 -0.0923 0.8086 0.6538 0.8992-6.3495 0 -10.327 0 0 0 0 0.242 0.0569 0.0515 -0.1722 0.6727 0.4525 0.8202-6.3505 0 -10.3288 0 0 0 0 0.18 0.0545 0.0503 -0.1707 0.675 0.4556 0.8216-6.3545 0 -10.335 0 0 0 0 0.241 0.0554 0.045 -0.1636 0.6861 0.4707 0.8283-6.3484 0 -10.3252 0 0 0 0 0.203 0.0499 0.0426 -0.1601 0.6917 0.4785 0.8317-6.3484 0 -10.3252 0 0 0 0 0.297 0.049 0.0376 -0.1525 0.7039 0.4955 0.839-6.3478 0 -10.3244 0 0 0 0 0.209 0.0522 0.0401 -0.1564 0.6977 0.4867 0.8353-6.3573 0 -10.3395 0 0 0 0 0.125 0.0361 0.0204 -0.1191 0.7602 0.5779 0.8719-6.3567 0 -10.3386 0 0 0 0 0.15 0.0353 0.0202 -0.1186 0.761 0.5791 0.8723-6.3441 0 -10.3183 0 0 0 0 0.169 0.0662 0.0671 -0.19 0.6456 0.4168 0.8035-6.3447 0 -10.3192 0 0 0 0 0.182 0.0675 0.0682 -0.1912 0.6438 0.4145 0.8024-6.3484 0 -10.3252 0 0 0 0 0.389 0.0521 0.0409 -0.1576 0.6957 0.4839 0.8341-6.3468 0 -10.3226 0 0 0 0 0.221 0.0714 0.0608 -0.1833 0.6558 0.43 0.8098-6.3567 0 -10.3386 0 0 0 0 0.099 0.0351 0.0313 -0.1418 0.7215 0.5205 0.8494-6.3457 0 -10.3209 0 0 0 0 0.161 0.0664 0.0568 -0.1787 0.6627 0.4392 0.8141-6.3505 0 -10.3288 0 0 0 0 0.197 0.0617 0.0522 -0.173 0.6714 0.4507 0.8194-6.3573 0 -10.3395 0 0 0 0 0.382 0.0465 0.0361 -0.1501 0.7078 0.501 0.8413-6.3441 0 -10.3183 0 0 0 0 0.132 0.0566 0.0469 -0.1661 0.6822 0.4653 0.8259

Datenblatt : Palästinaschwarz=Eing
rot= BerechnuXXXXXXXXXXXXXXXXXXXXXXXXXXXXXXSampleID Site Well CodeJ03-01 Arab Project6 19-14/066J04-01 Arab Project6 19-14-66J03-02 Arab Project6 19-14/067J04-02 Arab Project6 19-14/067J03-03 Arab Project7 19-14/073J04-03 Arab Project7 19-14/073J03-04 Fahmi Nahas419-13/048J04-04 Fahmi Nahas419-13/048J03-05 Fahmi Nahas419-13/047J04-05 Fahmi Nahas419-13/047J03-06 Sabiru Rantizi19-13/006J04-06 Sabiru Rantizi19-13/006J03-07 Fahed Hishmi 19-13/015J04-07 Fahed Hishmi 19-13/015J03-08 Zuhdi Hashwa19-13/052J04-08 Zuhdi Hashwa19-13/052J03-09 Salah Arouri 19-14/012J04-09 Salah Arouri 19-14/012J03-10 Basil Husaini219-13/020J04-10 Basil Husaini219-13/020J03-11 Basil Husaini119-13/018J04-11 Basil Husaini119-13/018J03-12 Ibrahim Daek NWJ04-12 Ibrahim Daek IBRAIN DEKJ03-13 Iron Factory 19-13/26aJ03-14 Ein Sultan AC/061J04-14 Ein Sultan AC/61J03-15 Ein Dyouk AC/060J04-15 Ein Dyouk AC/60J03-16 Awni Hijazi 19-14/052J04-16 Awni Hijazi 19-14/052J03-17 Saeed Aladee19-14/062J04-17 Saeed Aladee19-14/062J03-18 Mohammed M19-14/038J04-18 Mohammed M19-14/38J03-19 Samed 19-14/26aJ04-19 Samed 19-14/26aJ03-20 Arab Project619-13/069J04-20 Arab Project619-13/069J03-21 Abdallah Araik19-14/049J04-22 Awn Hijazi 19-14/37J04-23 Saleem Nimm19-13/49J04-24 Qasir Hisham 19-13/003J04-25 Bail Hussaini219-13/22J04-26 Mahmud Akra19-13/50aJ04-27 Bail Hussaini219-13/21J003-Z Jericho Süd 1 Lisan J003-I Jericho Qilt 80Lisan J003-X Jericho Süd 1 Lisan J003-P Fertiliser chemFertilizerJ004-Q Lisan Lisan J004-Z Samara SamaraJ004-Y Samara SamaraJ004-X Lisan Lisan
(2k2*f(H))/(f2* (a(H)*f2)/(f(H)*k2) Kationen- /Anionenbilanzen
Wert für c (COWert für c(CO3) Fehler (%) Summen Kationen Summen Anionen Kationen mmol/l(2k2*f(H))/(f2* (a(H)*f2)/(f(H) x % mg/l mmol/l meq/l meq% mg/l mmol/l meq/l meq% Na+ K+
0.0022 911.5874 -9999 0.8412 1073.2374 41.101 55.2071 100 2208.7754 51.1448 54.286 100 25.0979 2.11250.0047 428.7107 -9999 -0.9325 1016.4012 39.0914 52.0731 100 2149.5523 50.0706 53.0534 100 24.3149 2.00260.002 1005.7659 -9999 1.0901 1144.9393 44.1826 58.0905 100 2241.042 54.9215 56.8377 100 27.7947 2.6624
0.0028 704.2268 -9999 -1.636 1166.2007 45.2347 58.944 100 2416.306 58.5945 60.9047 100 29.0561 2.63170.0018 1113.2433 -9999 1.2975 742.8814 28.0315 38.5911 100 1549.7232 36.5978 37.6025 100 15.6285 2.03580.0019 1080.0918 -9999 -0.5742 726.1661 27.4824 37.6725 100 1566.3853 36.946 38.1077 100 15.5546 1.92070.0021 945.6291 -9999 6.1897 299.8747 10.7988 16.4978 100 700.032 13.8398 14.5745 100 4.9413 0.39340.002 990.1581 -9999 4.297 292.7645 10.5417 16.0266 100 703.2423 13.8388 14.7061 100 4.9021 0.3754
0.0022 908.8693 -9999 6.2821 299.3344 10.7861 16.4529 100 703.334 13.6978 14.5079 100 5.0587 0.31760.0018 1135.1839 -9999 3.3878 284.4683 10.228 15.6242 100 705.6863 13.7388 14.6003 100 4.7629 0.30870.0012 1717.4956 -9999 6.9938 446.6399 15.6723 24.5411 100 972.5842 20.0986 21.3328 100 6.8987 0.20330.0016 1264.9432 -9999 1.4583 435.2659 15.3864 23.8671 100 1049.2793 21.5835 23.181 100 6.99 0.19820.0019 1050.4522 -9999 4.604 463.1247 17.2766 24.4473 100 982.3053 21.6564 22.2953 100 9.3258 0.98390.0021 972.9692 -9999 5.0509 464.5576 17.2708 24.5239 100 967.1689 21.5072 22.1657 100 9.2605 0.9550.0022 898.1537 -9999 1.8863 488.7709 17.968 26.4074 100 1121.904 23.6947 25.4296 100 9.0213 0.72430.002 979.8699 -9999 0.2167 498.6958 18.3955 26.8876 100 1182.0973 24.7447 26.7713 100 9.3954 0.7148
0.0019 1072.0761 -9999 2.67 264.9303 9.4256 14.8058 100 706.673 13.413 14.0357 100 4.0148 0.28570.0021 975.4716 -9999 2.4873 257.6076 9.1285 14.3349 100 673.6929 12.9555 13.6391 100 3.8843 0.27770.002 1016.9256 -9999 6.0142 340.3699 12.518 18.3822 100 775.6496 15.1447 16.2966 100 6.4506 0.435
0.0029 691.5006 -9999 2.4639 307.2869 11.3378 16.4516 100 747.7116 14.4023 15.6604 100 6.0287 0.3790.0021 961.802 -9999 8.0979 239.5053 8.4119 13.262 100 556.381 10.6598 11.275 100 3.545 0.24630.0044 450.5772 -9999 4.6626 236.7021 8.326 13.0207 100 583.8116 11.1045 11.8606 100 3.6146 0.23530.0017 1187.9431 -9999 2.2963 626.4545 23.6927 32.8475 100 1330.062 29.6217 31.3728 100 13.706 1.01070.002 1008.2158 -9999 -0.3159 614.6131 23.2806 32.1933 100 1375.6463 30.4227 32.3974 100 13.5276 1.0056
0.0025 789.6938 -9999 5.1397 364.5419 12.697 20.7687 100 828.003 17.7958 18.7381 100 4.5585 0.42710.0043 466.9705 -9999 7.486 139.372 4.4419 7.9908 100 390.753 6.6863 6.8778 100 0.993 0.0640.0029 687.9085 -9999 7.225 144.9552 4.5947 8.1518 100 388.5048 6.7925 7.0532 100 1.1218 0.06850.0016 1236.5402 -9999 10.912 142.0026 4.5084 8.1125 100 368.5407 6.3365 6.5162 100 1.007 0.06320.0025 791.5992 -9999 5.2284 147.9354 4.686 8.311 100 417.9442 7.2268 7.4851 100 1.1435 0.06870.0013 1544.1509 -9999 3.1127 593.9985 22.5 31.2702 100 1238.442 28.6276 29.3822 100 13.0579 0.91510.0017 1155.2557 -9999 1.3378 564.7602 21.3854 29.7225 100 1246.0321 28.1337 28.9377 100 12.4271 0.87260.0013 1583.5519 -9999 3.7014 513.1287 18.9398 27.472 100 1074.7047 25.0826 25.5109 100 10.0043 0.61840.0015 1334.1141 -9999 1.3577 457.7031 16.8954 24.3977 100 1029.1953 23.2822 23.7441 100 9.0518 0.54120.001 1979.4749 -9999 5.4924 434.9586 15.875 23.8004 100 932.219 20.9067 21.3221 100 7.6816 0.4967
0.0014 1379.9124 -9999 5.0994 466.9904 17.0587 25.0712 100 991.0166 22.1742 22.6383 100 8.7777 0.4870.0022 914.0291 -9999 13.6083 260.6062 8.8194 14.9072 100 598.911 11.0928 11.3359 100 2.8056 0.16290.0018 1098.3465 -9999 9.7371 246.3888 8.2472 14.0368 100 605.9498 11.3214 11.5458 100 2.5359 0.14220.0019 1030.9887 -9999 1.8029 807.287 31.098 40.3488 100 1598.8729 37.8321 38.9196 100 20.013 2.03580.0018 1102.3328 -9999 3.7868 854.28 33.2944 42.7638 100 1632.5849 38.5019 39.6431 100 22.0966 1.91820.0008 2563.5766 -9999 4.5529 471.0247 17.4464 25.5917 100 1021.8013 22.3953 23.3628 100 9.1344 0.39230.0015 1373.286 -9999 4.007 727.8714 27.4229 38.4269 100 1474.6683 34.2432 35.4661 100 15.4502 1.20560.0029 685.4356 -9999 4.2098 391.3588 14.5326 20.0069 100 863.9122 17.6895 18.3905 100 7.9948 1.28130.002 1006.6222 -9998 1.4726 632.4069 23.5792 33.4285 100 1327.671 31.905 32.4583 100 13.3232 0.7066
0.0016 1256.6199 -9998 1.1977 588.6923 21.9407 31.4239 100 1313.9526 28.3623 30.6801 100 11.5876 1.08080.0008 2596.9719 -9997 3.0016 406.9128 14.5366 21.9632 100 956.2597 19.5428 20.6831 100 6.5115 0.8560.0024 849.5213 -9997 -4.0712 545.2439 20.5186 28.8361 100 1344.4415 29.4858 31.2836 100 11.4702 0.9274

Datenblatt : Palästinaschwarz=Eing
rot= BerechnuXXXXXXXXXXXXXXXXXXXXXXXXXXXXXXSampleID Site Well CodeJ03-01 Arab Project6 19-14/066J04-01 Arab Project6 19-14-66J03-02 Arab Project6 19-14/067J04-02 Arab Project6 19-14/067J03-03 Arab Project7 19-14/073J04-03 Arab Project7 19-14/073J03-04 Fahmi Nahas419-13/048J04-04 Fahmi Nahas419-13/048J03-05 Fahmi Nahas419-13/047J04-05 Fahmi Nahas419-13/047J03-06 Sabiru Rantizi19-13/006J04-06 Sabiru Rantizi19-13/006J03-07 Fahed Hishmi 19-13/015J04-07 Fahed Hishmi 19-13/015J03-08 Zuhdi Hashwa19-13/052J04-08 Zuhdi Hashwa19-13/052J03-09 Salah Arouri 19-14/012J04-09 Salah Arouri 19-14/012J03-10 Basil Husaini219-13/020J04-10 Basil Husaini219-13/020J03-11 Basil Husaini119-13/018J04-11 Basil Husaini119-13/018J03-12 Ibrahim Daek NWJ04-12 Ibrahim Daek IBRAIN DEKJ03-13 Iron Factory 19-13/26aJ03-14 Ein Sultan AC/061J04-14 Ein Sultan AC/61J03-15 Ein Dyouk AC/060J04-15 Ein Dyouk AC/60J03-16 Awni Hijazi 19-14/052J04-16 Awni Hijazi 19-14/052J03-17 Saeed Aladee19-14/062J04-17 Saeed Aladee19-14/062J03-18 Mohammed M19-14/038J04-18 Mohammed M19-14/38J03-19 Samed 19-14/26aJ04-19 Samed 19-14/26aJ03-20 Arab Project619-13/069J04-20 Arab Project619-13/069J03-21 Abdallah Araik19-14/049J04-22 Awn Hijazi 19-14/37J04-23 Saleem Nimm19-13/49J04-24 Qasir Hisham 19-13/003J04-25 Bail Hussaini219-13/22J04-26 Mahmud Akra19-13/50aJ04-27 Bail Hussaini219-13/21J003-Z Jericho Süd 1 Lisan J003-I Jericho Qilt 80Lisan J003-X Jericho Süd 1 Lisan J003-P Fertiliser chemFertilizerJ004-Q Lisan Lisan J004-Z Samara SamaraJ004-Y Samara SamaraJ004-X Lisan Lisan
Kationen meq/lMg2+ Ca2+ NH4 + Ba2+ Sr2+ Fe(II,III) Al(III) Si(II,IIII) B3+ Mn (II,IV,VII) Na+ K+ Mg2+ Ca2+
8.7906 4.6432 0.0006 0.0007 0.0406 0.0015 0 0.3133 0.0997 0.0004 25.0979 2.1125 17.5812 9.28648.1448 4.1941 0 0.0007 0.0362 0.0006 0 0.303 0.0946 -0.0002 24.3149 2.0026 16.2896 8.38829.0827 4.1742 0 0.0011 0.0324 0.0155 0 0.2976 0.1221 -0.0002 27.7947 2.6624 18.1654 8.34839.0374 4.0719 0 0.0011 0.0314 0.0008 0 0.2827 0.1215 0.0002 29.0561 2.6317 18.0749 8.14376.7709 3.2011 0 0.0016 0.0209 -0.0009 0 0.2837 0.09 -0.0002 15.6285 2.0358 13.5418 6.40226.5364 3.0913 0.0001 0.0015 0.0197 0.0013 0 0.2691 0.0874 0.0002 15.5546 1.9207 13.0728 6.18262.8754 2.2829 0 0.0005 0.0229 -0.0009 0 0.2599 0.0237 -0.0002 4.9413 0.3934 5.7507 4.56592.7314 2.2405 0 0.0005 0.0216 0.0002 0 0.2453 0.0247 0 4.9021 0.3754 5.4628 4.4812.7396 2.3378 0.0003 0.0005 0.0245 -0.0009 0 0.2834 0.0247 -0.0002 5.0587 0.3176 5.4792 4.67562.6039 2.238 0.001 0.0005 0.0234 0 0 0.2652 0.0244 0 4.7629 0.3087 5.2077 4.4763.8462 4.3263 0 0.0009 0.0406 -0.0009 0 0.3286 0.0288 -0.0002 6.8987 0.2033 7.6923 8.65273.7474 4.0669 0.0011 0.0009 0.039 0 0 0.3133 0.0296 0 6.99 0.1982 7.4949 8.13374.1711 2.4825 0.0001 0.0007 0.0198 0 0 0.2488 0.044 -0.0002 9.3258 0.9839 8.3422 4.96514.1547 2.5923 0.0011 0.0007 0.0203 0.0021 0 0.241 0.0431 0 9.2605 0.955 8.3093 5.18464.6853 3.1861 0.0003 0.0005 0.0408 -0.0009 0 0.2645 0.0458 -0.0002 9.0213 0.7243 9.3706 6.37234.747 3.1936 0 0.0006 0.0383 0.0027 0 0.2542 0.0487 0 9.3954 0.7148 9.494 6.3872
2.6039 2.2056 0.0001 0.0004 0.0215 -0.0009 0 0.2755 0.0193 -0.0002 4.0148 0.2857 5.2077 4.41122.4763 2.1881 0 0.0004 0.0207 0.0003 0 0.2606 0.0201 -0.0002 3.8843 0.2777 4.9527 4.37623.0193 2.2954 0.0004 0.0006 0.0183 0.0074 0 0.2488 0.0381 0.004 6.4506 0.435 6.0387 4.59082.5915 2.0659 0 0.0005 0.0156 -0.0002 0 0.2207 0.0361 -0.0002 6.0287 0.379 5.1831 4.13172.1473 2.1881 0.0002 0.0003 0.0148 -0.0009 0 0.251 0.02 -0.0002 3.545 0.2463 4.2945 4.37622.0452 2.1557 0 0.0003 0.014 -0.0002 0 0.2403 0.0209 -0.0002 3.6146 0.2353 4.0905 4.31145.3476 3.2859 0.0004 0.0009 0.0258 -0.0009 0 0.2485 0.0679 -0.0002 13.706 1.0107 10.6952 6.57195.2365 3.1612 0.0094 0.0011 0.0256 0.0005 0 0.2442 0.069 -0.0002 13.5276 1.0056 10.4731 6.32244.0148 3.2435 0.0003 0.0022 0.0492 -0.0009 0 0.3806 0.0213 0.0004 4.5585 0.4271 8.0296 6.4871.2374 1.9736 0.0003 0.0002 0.0014 -0.0009 0 0.1693 0.0038 -0.0002 0.993 0.064 2.4747 3.94711.1469 2.0933 0 0.0002 0.0013 0.0006 0 0.1577 0.0045 -0.0002 1.1218 0.0685 2.2937 4.18661.2262 2.0334 0.0008 0.0002 0.0015 0.002 0 0.1703 0.0038 -0.0002 1.007 0.0632 2.4525 4.06691.1621 2.1432 0.003 0.0002 0.0013 0.0004 0 0.1592 0.0043 -0.0002 1.1435 0.0687 2.3241 4.28645.1131 3.0439 0.0007 0.0012 0.0326 -0.0009 0 0.2909 0.0458 -0.0002 13.0579 0.9151 10.2262 6.08784.8252 2.8842 0.003 0.0012 0.0303 0.0068 0 0.2905 0.0435 0.0009 12.4271 0.8726 9.6503 5.76854.5208 3.5105 0.0009 0.0006 0.0136 -0.0009 0 0.2446 0.0273 -0.0002 10.0043 0.6184 9.0415 7.0213.8996 3.1387 0.0006 0.0005 0.0118 -0.0002 0 0.2264 0.0251 -0.0002 9.0518 0.5412 7.7993 6.27744.1999 3.1961 0.0017 0.0008 0.0133 -0.0009 0 0.2588 0.0272 -0.0002 7.6816 0.4967 8.3998 6.39224.0107 3.4955 0 0.0008 0.0127 0.0011 0 0.2446 0.0283 0.0004 8.7777 0.487 8.0214 6.9912.6409 2.9416 0.0009 0.0004 0.006 -0.0009 0 0.2506 0.0115 -0.0002 2.8056 0.1629 5.2818 5.88322.4064 2.9167 0 0.0005 0.0052 0.0002 0 0.2307 0.0096 -0.0002 2.5359 0.1422 4.8128 5.83335.7589 2.9117 0.0009 0.0012 0.0224 -0.0009 0 0.2795 0.0757 -0.0002 20.013 2.0358 11.5179 5.82346.1251 2.7969 0 0.0011 0.0206 0.0003 0 0.2631 0.0727 -0.0002 22.0966 1.9182 12.2501 5.59384.348 3.2735 0.0013 0.0011 0.0129 0.0026 0 0.2535 0.0271 -0.0002 9.1344 0.3923 8.696 6.5469
6.4747 3.9222 0 0.001 0.0213 0.0003 0 0.2926 0.055 -0.0002 15.4502 1.2056 12.9494 7.84433.1345 1.7939 0 0.0009 0.0129 -0.0002 0 0.2666 0.048 -0.0002 7.9948 1.2813 6.269 3.58785.0884 4.0818 0 0.0003 0.0162 0.0004 0 0.3314 0.031 -0.0002 13.3232 0.7066 10.1769 8.16375.578 3.3358 0.0006 0.0009 0.0249 0.0004 0 0.272 0.0599 -0.0002 11.5876 1.0808 11.1559 6.6717
3.8174 2.9815 0.0094 0.0008 0.0222 0.0072 0 0.2948 0.0349 0.0008 6.5115 0.856 7.6347 5.96314.8622 2.9291 0.0017 0.0009 0.0201 -0.0002 0 0.2531 0.0542 -0.0002 11.4702 0.9274 9.7244 5.8583

Datenblatt : Palästinaschwarz=Eing
rot= BerechnuXXXXXXXXXXXXXXXXXXXXXXXXXXXXXXSampleID Site Well CodeJ03-01 Arab Project6 19-14/066J04-01 Arab Project6 19-14-66J03-02 Arab Project6 19-14/067J04-02 Arab Project6 19-14/067J03-03 Arab Project7 19-14/073J04-03 Arab Project7 19-14/073J03-04 Fahmi Nahas419-13/048J04-04 Fahmi Nahas419-13/048J03-05 Fahmi Nahas419-13/047J04-05 Fahmi Nahas419-13/047J03-06 Sabiru Rantizi19-13/006J04-06 Sabiru Rantizi19-13/006J03-07 Fahed Hishmi 19-13/015J04-07 Fahed Hishmi 19-13/015J03-08 Zuhdi Hashwa19-13/052J04-08 Zuhdi Hashwa19-13/052J03-09 Salah Arouri 19-14/012J04-09 Salah Arouri 19-14/012J03-10 Basil Husaini219-13/020J04-10 Basil Husaini219-13/020J03-11 Basil Husaini119-13/018J04-11 Basil Husaini119-13/018J03-12 Ibrahim Daek NWJ04-12 Ibrahim Daek IBRAIN DEKJ03-13 Iron Factory 19-13/26aJ03-14 Ein Sultan AC/061J04-14 Ein Sultan AC/61J03-15 Ein Dyouk AC/060J04-15 Ein Dyouk AC/60J03-16 Awni Hijazi 19-14/052J04-16 Awni Hijazi 19-14/052J03-17 Saeed Aladee19-14/062J04-17 Saeed Aladee19-14/062J03-18 Mohammed M19-14/038J04-18 Mohammed M19-14/38J03-19 Samed 19-14/26aJ04-19 Samed 19-14/26aJ03-20 Arab Project619-13/069J04-20 Arab Project619-13/069J03-21 Abdallah Araik19-14/049J04-22 Awn Hijazi 19-14/37J04-23 Saleem Nimm19-13/49J04-24 Qasir Hisham 19-13/003J04-25 Bail Hussaini219-13/22J04-26 Mahmud Akra19-13/50aJ04-27 Bail Hussaini219-13/21J003-Z Jericho Süd 1 Lisan J003-I Jericho Qilt 80Lisan J003-X Jericho Süd 1 Lisan J003-P Fertiliser chemFertilizerJ004-Q Lisan Lisan J004-Z Samara SamaraJ004-Y Samara SamaraJ004-X Lisan Lisan
Kationen meq%/lNH4 + Ba2+ Sr2+ Fe(II,III) Al(III) Si(II,IIII) B3+ Mn (II,IV,VII) Na+ K+ Mg2+ Ca2+ NH4 + Ba2+
0.0006 0.0014 0.0813 0.0038 0 0.9398 0.0997 0.0024 45.4613 3.8266 31.846 16.8211 0.001 0.00260 0.0015 0.0724 0.0015 0 0.9089 0.0946 -0.0011 46.6938 3.8457 31.2821 16.1085 0 0.00290 0.0022 0.0649 0.0389 0 0.8928 0.1221 -0.0012 47.8472 4.5832 31.2708 14.3712 0 0.00380 0.0022 0.0628 0.002 0 0.848 0.1215 0.0011 49.2945 4.4648 30.6645 13.816 0 0.00370 0.0032 0.0418 -0.0022 0 0.8512 0.09 -0.0012 40.4978 5.2753 35.0903 16.5898 0 0.0083
0.0001 0.0031 0.0395 0.0033 0 0.8074 0.0874 0.0011 41.2889 5.0985 34.7012 16.4115 0.0001 0.00820 0.0009 0.0457 -0.0022 0 0.7796 0.0237 -0.0012 29.9511 2.3843 34.8574 27.6756 0 0.00570 0.001 0.0433 0.0005 0 0.7358 0.0247 0 30.5874 2.3426 34.0856 27.9599 0 0.0062
0.0003 0.001 0.0489 -0.0022 0 0.8501 0.0247 -0.0012 30.7467 1.9306 33.3025 28.4184 0.002 0.0060.001 0.0009 0.0469 0 0 0.7957 0.0244 0 30.4843 1.9758 33.3312 28.6481 0.0064 0.0058
0 0.0018 0.0811 -0.0022 0 0.9858 0.0288 -0.0012 28.1106 0.8285 31.3446 35.258 0 0.00750.0011 0.0018 0.078 0 0 0.9398 0.0296 0 29.2872 0.8305 31.4025 34.0793 0.0046 0.00760.0001 0.0013 0.0395 0 0 0.7465 0.044 -0.0012 38.1465 4.0245 34.1234 20.3093 0.0005 0.00530.0011 0.0014 0.0405 0.0052 0 0.723 0.0431 0 37.7613 3.8941 33.8826 21.1411 0.0045 0.00580.0003 0.001 0.0817 -0.0022 0 0.7935 0.0458 -0.0012 34.162 2.7428 35.4848 24.1305 0.001 0.0039
0 0.0013 0.0766 0.0069 0 0.7625 0.0487 0 34.9432 2.6586 35.3101 23.7553 0 0.00480.0001 0.0008 0.0431 -0.0022 0 0.8266 0.0193 -0.0012 27.1164 1.9295 35.1737 29.7936 0.0004 0.0053
0 0.0009 0.0414 0.0008 0 0.7818 0.0201 -0.0011 27.0969 1.9376 34.55 30.5287 0 0.0060.0004 0.0012 0.0367 0.0184 0 0.7465 0.0381 0.0258 35.0916 2.3666 32.8505 24.9742 0.0021 0.0066
0 0.0011 0.0312 -0.0004 0 0.6622 0.0361 -0.0011 36.6452 2.3039 31.5049 25.1146 0 0.00650.0002 0.0005 0.0297 -0.0022 0 0.7529 0.02 -0.0012 26.7307 1.8571 32.3822 32.9984 0.0017 0.0039
0 0.0006 0.028 -0.0004 0 0.7209 0.0209 -0.0011 27.7606 1.8071 31.4154 33.1118 0 0.00460.0004 0.0018 0.0516 -0.0022 0 0.7455 0.0679 -0.0012 41.726 3.0771 32.5601 20.0072 0.0014 0.00560.0094 0.0022 0.0512 0.0014 0 0.7326 0.069 -0.0011 42.02 3.1237 32.5318 19.6387 0.0291 0.00680.0003 0.0045 0.0983 -0.0022 0 1.1417 0.0213 0.0026 21.949 2.0565 38.6622 31.2347 0.0013 0.02150.0003 0.0004 0.0029 -0.0022 0 0.508 0.0038 -0.0012 12.4273 0.8011 30.9693 49.3955 0.0035 0.0055
0 0.0005 0.0027 0.0015 0 0.4731 0.0045 -0.0011 13.7613 0.8402 28.1374 51.3583 0 0.0060.0008 0.0005 0.003 0.005 0 0.511 0.0038 -0.0012 12.4124 0.779 30.2309 50.1307 0.0102 0.00610.003 0.0005 0.0027 0.0011 0 0.4777 0.0043 -0.0011 13.7593 0.8272 27.9646 51.5752 0.036 0.0055
0.0007 0.0024 0.0651 -0.0022 0 0.8726 0.0458 -0.0012 41.7582 2.9264 32.7029 19.4685 0.0021 0.00770.003 0.0024 0.0606 0.0171 0 0.8715 0.0435 0.0058 41.8106 2.9359 32.4682 19.4078 0.0101 0.0081
0.0009 0.0012 0.0272 -0.0022 0 0.7337 0.0273 -0.0012 36.4165 2.2511 32.9118 25.5567 0.0032 0.00420.0006 0.0011 0.0236 -0.0004 0 0.6792 0.0251 -0.0011 37.1009 2.2181 31.9672 25.7297 0.0023 0.00440.0017 0.0016 0.0266 -0.0022 0 0.7764 0.0272 -0.0012 32.275 2.0868 35.2928 26.8576 0.0072 0.0066
0 0.0015 0.0255 0.0026 0 0.7337 0.0283 0.0024 35.0112 1.9423 31.9944 27.8847 0 0.00610.0009 0.0009 0.012 -0.0022 0 0.7519 0.0115 -0.0012 18.8202 1.0929 35.431 39.4657 0.0063 0.0059
0 0.0009 0.0104 0.0005 0 0.6921 0.0096 -0.0011 18.066 1.013 34.2873 41.5574 0 0.00670.0009 0.0023 0.0448 -0.0022 0 0.8384 0.0757 -0.0012 49.6002 5.0455 28.5458 14.4325 0.0023 0.0058
0 0.0023 0.0413 0.0007 0 0.7892 0.0727 -0.0011 51.6712 4.4855 28.646 13.0807 0 0.00530.0013 0.0023 0.0257 0.0064 0 0.7604 0.0271 -0.0012 35.6929 1.533 33.9798 25.5822 0.0052 0.0089
0 0.0021 0.0426 0.0008 0 0.8779 0.055 -0.0011 40.2067 3.1375 33.6988 20.4136 0 0.00540 0.0018 0.0257 -0.0004 0 0.7999 0.048 -0.0011 39.9601 6.4044 31.3343 17.9329 0 0.00920 0.0005 0.0324 0.001 0 0.9943 0.031 -0.0011 39.8557 2.1139 30.4437 24.4213 0 0.0015
0.0006 0.0018 0.0497 0.001 0 0.8159 0.0599 -0.0011 36.8753 3.4395 35.5013 21.2312 0.0018 0.00560.0094 0.0017 0.0444 0.018 0 0.8843 0.0349 0.0051 29.6475 3.8975 34.7614 27.1503 0.0429 0.00770.0017 0.0018 0.0403 -0.0004 0 0.7593 0.0542 -0.0011 39.7773 3.216 33.723 20.3158 0.0058 0.0064

Datenblatt : Palästinaschwarz=Eing
rot= BerechnuXXXXXXXXXXXXXXXXXXXXXXXXXXXXXXSampleID Site Well CodeJ03-01 Arab Project6 19-14/066J04-01 Arab Project6 19-14-66J03-02 Arab Project6 19-14/067J04-02 Arab Project6 19-14/067J03-03 Arab Project7 19-14/073J04-03 Arab Project7 19-14/073J03-04 Fahmi Nahas419-13/048J04-04 Fahmi Nahas419-13/048J03-05 Fahmi Nahas419-13/047J04-05 Fahmi Nahas419-13/047J03-06 Sabiru Rantizi19-13/006J04-06 Sabiru Rantizi19-13/006J03-07 Fahed Hishmi 19-13/015J04-07 Fahed Hishmi 19-13/015J03-08 Zuhdi Hashwa19-13/052J04-08 Zuhdi Hashwa19-13/052J03-09 Salah Arouri 19-14/012J04-09 Salah Arouri 19-14/012J03-10 Basil Husaini219-13/020J04-10 Basil Husaini219-13/020J03-11 Basil Husaini119-13/018J04-11 Basil Husaini119-13/018J03-12 Ibrahim Daek NWJ04-12 Ibrahim Daek IBRAIN DEKJ03-13 Iron Factory 19-13/26aJ03-14 Ein Sultan AC/061J04-14 Ein Sultan AC/61J03-15 Ein Dyouk AC/060J04-15 Ein Dyouk AC/60J03-16 Awni Hijazi 19-14/052J04-16 Awni Hijazi 19-14/052J03-17 Saeed Aladee19-14/062J04-17 Saeed Aladee19-14/062J03-18 Mohammed M19-14/038J04-18 Mohammed M19-14/38J03-19 Samed 19-14/26aJ04-19 Samed 19-14/26aJ03-20 Arab Project619-13/069J04-20 Arab Project619-13/069J03-21 Abdallah Araik19-14/049J04-22 Awn Hijazi 19-14/37J04-23 Saleem Nimm19-13/49J04-24 Qasir Hisham 19-13/003J04-25 Bail Hussaini219-13/22J04-26 Mahmud Akra19-13/50aJ04-27 Bail Hussaini219-13/21J003-Z Jericho Süd 1 Lisan J003-I Jericho Qilt 80Lisan J003-X Jericho Süd 1 Lisan J003-P Fertiliser chemFertilizerJ004-Q Lisan Lisan J004-Z Samara SamaraJ004-Y Samara SamaraJ004-X Lisan Lisan
Anionen mmol/lSr2+ Fe(II,III) Al(III) Si(II,IIII) B3+ Mn (II,IV,VII) Cl- F- Br- NO3- SO42- PO43- HCO3- CO32-
0.1472 0.0068 0 1.7024 0.1806 0.0044 40.141 -0.0105 0.1965 0.4788 3.1325 0.0004 7.1981 0.00790.1391 0.0029 0 1.7454 0.1817 -0.002 39.6333 -0.0105 0.1439 0.6129 2.967 0.0001 6.7082 0.01560.1117 0.0669 0 1.537 0.2102 -0.002 46.2059 -0.0105 0.1752 0.6267 1.9093 0.0005 6.0084 0.0060.1066 0.0034 0 1.4386 0.206 0.0018 48.6601 -0.0105 0.174 0.8225 2.3007 0 6.6383 0.00940.1084 -0.0058 0 2.2057 0.2332 -0.0031 28.2087 -0.0105 0.0951 0.6517 0.9984 0.0002 6.6483 0.0060.1048 0.0088 0 2.1432 0.232 0.0028 28.6037 -0.0105 0.0889 0.7741 1.1556 0.0001 6.3283 0.00590.2771 -0.0136 0 4.7257 0.1439 -0.0072 6.7137 -0.0105 0.0313 0.6721 0.7287 0 5.6985 0.006
0.27 0.0029 0 4.5914 0.1539 0 6.7701 -0.0105 0.02 0.9838 0.861 0.0005 5.2086 0.00530.2974 -0.0136 0 5.167 0.1502 -0.0072 6.347 -0.0105 0.0275 0.7053 0.8037 0 5.8185 0.00640.3001 0 0 5.0925 0.1559 0 6.4316 -0.0105 0.015 1.1532 0.8558 0.0005 5.2886 0.00470.3305 -0.0091 0 4.0168 0.1175 -0.0048 11.6784 -0.0105 0.0313 0.9999 1.2243 0.0032 6.1684 0.00360.3266 0 0 3.9378 0.124 0 12.7504 -0.0105 0.025 1.6128 1.5928 0.0001 5.6085 0.00440.1617 0 0 3.0536 0.1801 -0.0048 14.2172 -0.0105 0.0663 0.5361 0.633 0 6.2084 0.00590.1652 0.0212 0 2.9483 0.1757 0 14.4711 -0.0105 0.0563 0.8064 0.6465 0.0032 5.5285 0.00570.3094 -0.0085 0 3.0049 0.1736 -0.0045 15.1199 -0.0105 0.0513 0.7508 1.7282 0 6.0484 0.00670.2851 0.0255 0 2.8361 0.1813 0 15.6841 -0.0105 0.0426 1.2741 2.0197 0.0005 5.7285 0.00580.2909 -0.0151 0 5.5832 0.1301 -0.008 5.275 -0.0105 0.0238 0.6538 0.6163 0 6.8482 0.00640.2888 0.0059 0 5.4536 0.1399 -0.0074 5.5007 0.0232 0.0138 1.129 0.6715 0.0032 5.6085 0.00570.1995 0.1 0 4.0611 0.2071 0.1405 7.4471 -0.0105 0.0313 0.7964 1.1462 0.0001 5.7285 0.00560.1895 -0.0027 0 4.0249 0.2197 -0.0065 6.8547 0.0232 0.02 1.0483 1.2493 0.0006 5.1986 0.00750.2237 -0.0169 0 5.6774 0.1507 -0.0089 4.5698 -0.0105 0.0275 0.469 0.6101 0 4.9887 0.00520.2149 -0.0034 0 5.5366 0.1607 -0.0082 4.6827 0.0232 0.0063 0.8387 0.7433 0.0011 4.7987 0.01060.157 -0.0068 0 2.2695 0.2067 -0.0036 21.1566 -0.0105 0.0776 0.4787 1.7459 0 6.1684 0.0052
0.1589 0.0042 0 2.2758 0.2143 -0.0033 21.5515 0.0168 0.0738 0.758 1.9676 0.0005 6.0484 0.0060.4735 -0.0108 0 5.4972 0.1025 0.0124 11.4528 -0.0105 0.0313 1.1311 0.937 0 4.2489 0.00540.0358 -0.028 0 6.3579 0.047 -0.0148 0.9704 -0.0105 0.0125 0.6848 0.1791 0.001 4.8387 0.01040.0329 0.018 0 5.8039 0.0551 -0.0131 1.3738 0.0105 0.0063 0.7741 0.2509 0.0017 4.3689 0.00630.0373 0.0621 0 6.2993 0.0464 -0.0146 0.9845 -0.0105 0.0063 0.4688 0.1739 0.001 4.7088 0.00380.0321 0.013 0 5.748 0.052 -0.0128 1.2581 0.0105 0.0063 0.887 0.2478 0.0023 4.8087 0.00610.2083 -0.0072 0 2.7904 0.1465 -0.0038 21.0155 -0.0105 0.0901 0.5495 0.7506 0 6.2284 0.0040.2038 0.0575 0 2.9321 0.1463 0.0195 19.6051 -0.0105 0.0814 0.8064 0.7964 0.0008 6.8482 0.00590.0989 -0.0081 0 2.6708 0.0993 -0.0043 18.5049 -0.0105 0.1089 0.0835 0.4227 0.0009 5.9684 0.00380.0966 -0.0018 0 2.7841 0.103 -0.0044 15.9661 0.0153 0.0701 0.3226 0.4529 0.0021 6.4483 0.00480.1118 -0.0094 0 3.2623 0.1143 -0.005 14.0762 -0.0105 0.0763 0.121 0.4123 0 6.2284 0.00310.1016 0.0106 0 2.9265 0.1129 0.0097 14.866 -0.0105 0.0776 0.1693 0.4581 0.0006 6.6083 0.00480.0804 -0.015 0 5.0437 0.0769 -0.0079 3.4133 -0.0105 0.0213 0.2576 0.2353 0 7.1681 0.00780.0744 0.0037 0 4.9303 0.0687 -0.0076 3.6671 -0.0105 0.0113 0.6612 0.2176 0.0003 6.7682 0.00620.1109 -0.0055 0 2.0778 0.1875 -0.0029 29.3653 -0.0105 0.1364 0.3953 1.0806 0.0001 6.8582 0.00660.0966 0.0015 0 1.8456 0.17 -0.0025 29.732 -0.0105 0.1377 0.6935 1.1348 0.0001 6.8082 0.00620.1005 0.0249 0 2.9713 0.1058 -0.0046 14.8942 -0.0105 0.0726 0.4932 0.9651 0 5.9784 0.00230.1109 0.0022 0 2.2846 0.1432 -0.0028 25.8392 -0.0105 0.1051 0.7983 1.218 0.0001 6.2884 0.00460.1285 -0.0022 0 3.9983 0.24 -0.0053 9.4499 -0.0105 0.0225 1.2096 0.6892 0.0013 6.3183 0.00920.097 0.0029 0 2.9744 0.0927 -0.0032 25.1058 -0.0105 0.1489 0.379 0.5476 0 5.7285 0.0057
0.1582 0.0032 0 2.5966 0.1907 -0.0034 19.5487 -0.0105 0.0526 0.8064 2.3112 0.0011 5.6485 0.00450.2022 0.0821 0 4.0263 0.159 0.0231 10.8604 -0.0105 0.025 0.8709 1.1348 0.0015 6.6583 0.00260.1396 -0.0016 0 2.6333 0.188 -0.0037 20.3667 -0.0105 0.0713 1.5322 1.7906 0.0002 5.7285 0.0067

Datenblatt : Palästinaschwarz=Eing
rot= BerechnuXXXXXXXXXXXXXXXXXXXXXXXXXXXXXXSampleID Site Well CodeJ03-01 Arab Project6 19-14/066J04-01 Arab Project6 19-14-66J03-02 Arab Project6 19-14/067J04-02 Arab Project6 19-14/067J03-03 Arab Project7 19-14/073J04-03 Arab Project7 19-14/073J03-04 Fahmi Nahas419-13/048J04-04 Fahmi Nahas419-13/048J03-05 Fahmi Nahas419-13/047J04-05 Fahmi Nahas419-13/047J03-06 Sabiru Rantizi19-13/006J04-06 Sabiru Rantizi19-13/006J03-07 Fahed Hishmi 19-13/015J04-07 Fahed Hishmi 19-13/015J03-08 Zuhdi Hashwa19-13/052J04-08 Zuhdi Hashwa19-13/052J03-09 Salah Arouri 19-14/012J04-09 Salah Arouri 19-14/012J03-10 Basil Husaini219-13/020J04-10 Basil Husaini219-13/020J03-11 Basil Husaini119-13/018J04-11 Basil Husaini119-13/018J03-12 Ibrahim Daek NWJ04-12 Ibrahim Daek IBRAIN DEKJ03-13 Iron Factory 19-13/26aJ03-14 Ein Sultan AC/061J04-14 Ein Sultan AC/61J03-15 Ein Dyouk AC/060J04-15 Ein Dyouk AC/60J03-16 Awni Hijazi 19-14/052J04-16 Awni Hijazi 19-14/052J03-17 Saeed Aladee19-14/062J04-17 Saeed Aladee19-14/062J03-18 Mohammed M19-14/038J04-18 Mohammed M19-14/38J03-19 Samed 19-14/26aJ04-19 Samed 19-14/26aJ03-20 Arab Project619-13/069J04-20 Arab Project619-13/069J03-21 Abdallah Araik19-14/049J04-22 Awn Hijazi 19-14/37J04-23 Saleem Nimm19-13/49J04-24 Qasir Hisham 19-13/003J04-25 Bail Hussaini219-13/22J04-26 Mahmud Akra19-13/50aJ04-27 Bail Hussaini219-13/21J003-Z Jericho Süd 1 Lisan J003-I Jericho Qilt 80Lisan J003-X Jericho Süd 1 Lisan J003-P Fertiliser chemFertilizerJ004-Q Lisan Lisan J004-Z Samara SamaraJ004-Y Samara SamaraJ004-X Lisan Lisan
Anionen meq/l Anionen meq%/lCl- F- Br- NO3- SO42- PO43- HCO3- CO32- Cl- F- Br- NO3- SO42- PO43-
40.141 -0.0105 0.1965 0.4788 6.2651 0.0011 7.1981 0.0158 73.9437 -0.0194 0.362 0.8821 11.5409 0.00239.6333 -0.0105 0.1439 0.6129 5.934 0.0003 6.7082 0.0313 74.7045 -0.0198 0.2713 1.1552 11.185 0.000646.2059 -0.0105 0.1752 0.6267 3.8186 0.0014 6.0084 0.0119 81.2945 -0.0185 0.3083 1.1027 6.7184 0.002448.6601 -0.0105 0.174 0.8225 4.6015 0 6.6383 0.0189 79.8955 -0.0173 0.2856 1.3505 7.5552 028.2087 -0.0105 0.0951 0.6517 1.9968 0.0005 6.6483 0.0119 75.0182 -0.028 0.253 1.7332 5.3102 0.001328.6037 -0.0105 0.0889 0.7741 2.3112 0.0003 6.3283 0.0117 75.0601 -0.0276 0.2332 2.0315 6.0648 0.00086.7137 -0.0105 0.0313 0.6721 1.4575 0 5.6985 0.0121 46.0644 -0.0722 0.2147 4.6111 10.0002 06.7701 -0.0105 0.02 0.9838 1.7219 0.0016 5.2086 0.0105 46.0361 -0.0716 0.1362 6.6898 11.7089 0.01076.347 -0.0105 0.0275 0.7053 1.6074 0 5.8185 0.0128 43.7483 -0.0726 0.1898 4.8613 11.0794 0
6.4316 -0.0105 0.015 1.1532 1.7115 0.0016 5.2886 0.0093 44.0512 -0.0721 0.1029 7.8982 11.7224 0.010811.6784 -0.0105 0.0313 0.9999 2.4486 0.0095 6.1684 0.0072 54.744 -0.0493 0.1467 4.6873 11.478 0.044612.7504 -0.0105 0.025 1.6128 3.1856 0.0003 5.6085 0.0089 55.0034 -0.0454 0.108 6.9574 13.7425 0.001414.2172 -0.0105 0.0663 0.5361 1.2659 0 6.2084 0.0118 63.7678 -0.0472 0.2975 2.4045 5.678 0.000114.4711 -0.0105 0.0563 0.8064 1.293 0.0095 5.5285 0.0114 65.286 -0.0475 0.2541 3.6381 5.8333 0.042815.1199 -0.0105 0.0513 0.7508 3.4563 0 6.0484 0.0135 59.4578 -0.0414 0.2018 2.9523 13.5917 015.6841 -0.0105 0.0426 1.2741 4.0393 0.0016 5.7285 0.0117 58.5854 -0.0393 0.159 4.7592 15.0882 0.0059
5.275 -0.0105 0.0238 0.6538 1.2326 0 6.8482 0.0128 37.583 -0.075 0.1694 4.6583 8.782 05.5007 0.0232 0.0138 1.129 1.343 0.0095 5.6085 0.0115 40.3305 0.1698 0.1009 8.2774 9.8465 0.06957.4471 -0.0105 0.0313 0.7964 2.2924 0.0002 5.7285 0.0113 45.6973 -0.0646 0.192 4.8869 14.0668 0.0016.8547 0.0232 0.02 1.0483 2.4985 0.0019 5.1986 0.0151 43.7712 0.1479 0.1279 6.6941 15.9546 0.01214.5698 -0.0105 0.0275 0.469 1.2201 0 4.9887 0.0104 40.5305 -0.0934 0.2442 4.1597 10.8215 04.6827 0.0232 0.0063 0.8387 1.4866 0.0032 4.7987 0.0213 39.4809 0.1953 0.0528 7.071 12.5343 0.0266
21.1566 -0.0105 0.0776 0.4787 3.4917 0 6.1684 0.0104 67.436 -0.0336 0.2473 1.5258 11.1297 021.5515 0.0168 0.0738 0.758 3.9352 0.0016 6.0484 0.012 66.5223 0.052 0.2279 2.3397 12.1467 0.004911.4528 -0.0105 0.0313 1.1311 1.8739 0 4.2489 0.0108 61.12 -0.0562 0.167 6.0361 10.0005 00.9704 -0.0105 0.0125 0.6848 0.3581 0.003 4.8387 0.0207 14.109 -0.1531 0.182 9.9567 5.207 0.04361.3738 0.0105 0.0063 0.7741 0.5018 0.0052 4.3689 0.0127 19.4771 0.1493 0.0887 10.9757 7.1143 0.07390.9845 -0.0105 0.0063 0.4688 0.3477 0.0031 4.7088 0.0076 15.1082 -0.1616 0.096 7.195 5.3361 0.0471.2581 0.0105 0.0063 0.887 0.4955 0.0068 4.8087 0.0121 16.8081 0.1406 0.0836 11.8507 6.6204 0.0907
21.0155 -0.0105 0.0901 0.5495 1.5012 0 6.2284 0.0081 71.5246 -0.0358 0.3067 1.8701 5.1092 019.6051 -0.0105 0.0814 0.8064 1.5928 0.0025 6.8482 0.0119 67.7492 -0.0364 0.2811 2.7867 5.5043 0.008718.5049 -0.0105 0.1089 0.0835 0.8453 0.0028 5.9684 0.0075 72.5373 -0.0413 0.4268 0.3275 3.3136 0.010915.9661 0.0153 0.0701 0.3226 0.9057 0.0063 6.4483 0.0097 67.2427 0.0643 0.2952 1.3585 3.8145 0.026614.0762 -0.0105 0.0763 0.121 0.8245 0 6.2284 0.0063 66.0167 -0.0494 0.3581 0.5673 3.867 014.866 -0.0105 0.0776 0.1693 0.9161 0.0019 6.6083 0.0096 65.6676 -0.0465 0.3428 0.748 4.0468 0.00843.4133 -0.0105 0.0213 0.2576 0.4706 0 7.1681 0.0157 30.11 -0.0929 0.1877 2.2721 4.151 03.6671 -0.0105 0.0113 0.6612 0.4352 0.0009 6.7682 0.0123 31.7617 -0.0912 0.0976 5.7272 3.769 0.0082
29.3653 -0.0105 0.1364 0.3953 2.1612 0.0004 6.8582 0.0133 75.4512 -0.027 0.3505 1.0157 5.5531 0.00129.732 -0.0105 0.1377 0.6935 2.2695 0.0004 6.8082 0.0124 74.9992 -0.0266 0.3473 1.7494 5.7248 0.001
14.8942 -0.0105 0.0726 0.4932 1.9301 0.0001 5.9784 0.0047 63.7518 -0.0451 0.3107 2.111 8.2615 0.000525.8392 -0.0105 0.1051 0.7983 2.4361 0.0003 6.2884 0.0092 72.8562 -0.0297 0.2964 2.251 6.8688 0.00099.4499 -0.0105 0.0225 1.2096 1.3784 0.0038 6.3183 0.0184 51.385 -0.0572 0.1225 6.5773 7.495 0.0206
25.1058 -0.0105 0.1489 0.379 1.0952 0 5.7285 0.0114 77.3479 -0.0324 0.4589 1.1677 3.3742 019.5487 -0.0105 0.0526 0.8064 4.6223 0.0032 5.6485 0.009 63.7178 -0.0343 0.1713 2.6284 15.0661 0.010310.8604 -0.0105 0.025 0.8709 2.2695 0.0044 6.6583 0.0051 52.5084 -0.0509 0.121 4.2107 10.9728 0.021420.3667 -0.0105 0.0713 1.5322 3.5812 0.0007 5.7285 0.0135 65.1034 -0.0337 0.228 4.8976 11.4477 0.0023

Datenblatt : Palästinaschwarz=Eing
rot= BerechnuXXXXXXXXXXXXXXXXXXXXXXXXXXXXXXSampleID Site Well CodeJ03-01 Arab Project6 19-14/066J04-01 Arab Project6 19-14-66J03-02 Arab Project6 19-14/067J04-02 Arab Project6 19-14/067J03-03 Arab Project7 19-14/073J04-03 Arab Project7 19-14/073J03-04 Fahmi Nahas419-13/048J04-04 Fahmi Nahas419-13/048J03-05 Fahmi Nahas419-13/047J04-05 Fahmi Nahas419-13/047J03-06 Sabiru Rantizi19-13/006J04-06 Sabiru Rantizi19-13/006J03-07 Fahed Hishmi 19-13/015J04-07 Fahed Hishmi 19-13/015J03-08 Zuhdi Hashwa19-13/052J04-08 Zuhdi Hashwa19-13/052J03-09 Salah Arouri 19-14/012J04-09 Salah Arouri 19-14/012J03-10 Basil Husaini219-13/020J04-10 Basil Husaini219-13/020J03-11 Basil Husaini119-13/018J04-11 Basil Husaini119-13/018J03-12 Ibrahim Daek NWJ04-12 Ibrahim Daek IBRAIN DEKJ03-13 Iron Factory 19-13/26aJ03-14 Ein Sultan AC/061J04-14 Ein Sultan AC/61J03-15 Ein Dyouk AC/060J04-15 Ein Dyouk AC/60J03-16 Awni Hijazi 19-14/052J04-16 Awni Hijazi 19-14/052J03-17 Saeed Aladee19-14/062J04-17 Saeed Aladee19-14/062J03-18 Mohammed M19-14/038J04-18 Mohammed M19-14/38J03-19 Samed 19-14/26aJ04-19 Samed 19-14/26aJ03-20 Arab Project619-13/069J04-20 Arab Project619-13/069J03-21 Abdallah Araik19-14/049J04-22 Awn Hijazi 19-14/37J04-23 Saleem Nimm19-13/49J04-24 Qasir Hisham 19-13/003J04-25 Bail Hussaini219-13/22J04-26 Mahmud Akra19-13/50aJ04-27 Bail Hussaini219-13/21J003-Z Jericho Süd 1 Lisan J003-I Jericho Qilt 80Lisan J003-X Jericho Süd 1 Lisan J003-P Fertiliser chemFertilizerJ004-Q Lisan Lisan J004-Z Samara SamaraJ004-Y Samara SamaraJ004-X Lisan Lisan
Quantitative Charakterisierung der Wässer bezgl. Kat-/AnionenQuantitative Charakterisierung der Wässer bezgl. Kat-/AnionenNa+ (mg/l) K+ (mg/l) Mg2+ (mg/l) Ca2+ (mg/l) Cl- (mg/l) SO42- (mg/l) NO3- (mg/l)mg/l mg/l mg/l mg/l mg/l mg/l mg/l
HCO3- CO32- Na K Mg Ca Cl SO4 NO313.2596 0.0291 577 82.6 213.7 186.1 1423 300.9 29.6912.6443 0.059 559 78.3 198 168.1 1405 285 3810.5712 0.021 639 104.1 220.8 167.3 1638 183.4 38.8610.8994 0.031 668 102.9 219.7 163.2 1725 221 5117.6804 0.0317 359.3 79.6 164.6 128.3 1000 95.9 40.4116.6065 0.0308 357.6 75.1 158.9 123.9 1014 111 4839.099 0.0828 113.6 15.38 69.9 91.5 238 70 41.67
35.4183 0.0716 112.7 14.68 66.4 89.8 240 82.7 6140.1055 0.0882 116.3 12.42 66.6 93.7 225 77.2 43.7336.2227 0.0639 109.5 12.07 63.3 89.7 228 82.2 71.528.915 0.0337 158.6 7.95 93.5 173.4 414 117.6 62
24.1945 0.0382 160.7 7.75 91.1 163 452 153 10027.8461 0.0531 214.4 38.47 101.4 99.5 504 60.8 33.2424.942 0.0513 212.9 37.34 101 103.9 513 62.1 50
23.7849 0.0529 207.4 28.32 113.9 127.7 536 166 46.5521.3979 0.0437 216 27.95 115.4 128 556 194 7948.7913 0.0909 92.3 11.17 63.3 88.4 187 59.2 40.5441.1211 0.0843 89.3 10.86 60.2 87.7 195 64.5 7035.1515 0.0691 148.3 17.01 73.4 92 264 110.1 49.3833.1961 0.0962 138.6 14.82 63 82.8 243 120 6544.2456 0.0919 81.5 9.63 52.2 87.7 162 58.6 29.0840.4597 0.1796 83.1 9.2 49.72 86.4 166 71.4 5219.6616 0.0331 315.1 39.52 130 131.7 750 167.7 29.6818.6695 0.037 311 39.32 127.3 126.7 764 189 4722.6751 0.0575 104.8 16.7 97.6 130 406 90 70.1370.3534 0.3014 22.83 2.503 30.08 79.1 34.4 17.2 42.4661.941 0.18 25.79 2.678 27.88 83.9 48.7 24.1 48
72.2621 0.1171 23.15 2.471 29.81 81.5 34.9 16.7 29.0764.2438 0.1621 26.29 2.688 28.25 85.9 44.6 23.8 5521.1977 0.0275 300.2 35.78 124.3 122 745 72.1 34.0723.6653 0.041 285.7 34.12 117.3 115.6 695 76.5 5023.3956 0.0295 230 24.18 109.9 140.7 656 40.6 5.1827.1575 0.0407 208.1 21.16 94.8 125.8 566 43.5 2029.2108 0.0295 176.6 19.42 102.1 128.1 499 39.6 7.529.1907 0.0423 201.8 19.04 97.5 140.1 527 44 10.563.2335 0.1385 64.5 6.37 64.2 117.9 121 22.6 15.9758.6207 0.1068 58.3 5.56 58.5 116.9 130 20.9 4117.6215 0.0342 460.1 79.6 140 116.7 1041 103.8 24.5117.1738 0.0312 508 75 148.9 112.1 1054 109 4325.5895 0.02 210 15.34 105.7 131.2 528 92.7 30.5817.7306 0.0258 355.2 47.14 157.4 157.2 916 117 49.534.3566 0.1002 183.8 50.1 76.2 71.9 335 66.2 7517.6488 0.035 306.3 27.63 123.7 163.6 890 52.6 23.518.411 0.0293 266.4 42.26 135.6 133.7 693 222 50
32.1918 0.0248 149.7 33.47 92.8 119.5 385 109 5418.3115 0.043 263.7 36.26 118.2 117.4 722 172 95

Datenblatt : Palästinaschwarz=Eing
rot= BerechnuXXXXXXXXXXXXXXXXXXXXXXXXXXXXXXSampleID Site Well CodeJ03-01 Arab Project6 19-14/066J04-01 Arab Project6 19-14-66J03-02 Arab Project6 19-14/067J04-02 Arab Project6 19-14/067J03-03 Arab Project7 19-14/073J04-03 Arab Project7 19-14/073J03-04 Fahmi Nahas419-13/048J04-04 Fahmi Nahas419-13/048J03-05 Fahmi Nahas419-13/047J04-05 Fahmi Nahas419-13/047J03-06 Sabiru Rantizi19-13/006J04-06 Sabiru Rantizi19-13/006J03-07 Fahed Hishmi 19-13/015J04-07 Fahed Hishmi 19-13/015J03-08 Zuhdi Hashwa19-13/052J04-08 Zuhdi Hashwa19-13/052J03-09 Salah Arouri 19-14/012J04-09 Salah Arouri 19-14/012J03-10 Basil Husaini219-13/020J04-10 Basil Husaini219-13/020J03-11 Basil Husaini119-13/018J04-11 Basil Husaini119-13/018J03-12 Ibrahim Daek NWJ04-12 Ibrahim Daek IBRAIN DEKJ03-13 Iron Factory 19-13/26aJ03-14 Ein Sultan AC/061J04-14 Ein Sultan AC/61J03-15 Ein Dyouk AC/060J04-15 Ein Dyouk AC/60J03-16 Awni Hijazi 19-14/052J04-16 Awni Hijazi 19-14/052J03-17 Saeed Aladee19-14/062J04-17 Saeed Aladee19-14/062J03-18 Mohammed M19-14/038J04-18 Mohammed M19-14/38J03-19 Samed 19-14/26aJ04-19 Samed 19-14/26aJ03-20 Arab Project619-13/069J04-20 Arab Project619-13/069J03-21 Abdallah Araik19-14/049J04-22 Awn Hijazi 19-14/37J04-23 Saleem Nimm19-13/49J04-24 Qasir Hisham 19-13/003J04-25 Bail Hussaini219-13/22J04-26 Mahmud Akra19-13/50aJ04-27 Bail Hussaini219-13/21J003-Z Jericho Süd 1 Lisan J003-I Jericho Qilt 80Lisan J003-X Jericho Süd 1 Lisan J003-P Fertiliser chemFertilizerJ004-Q Lisan Lisan J004-Z Samara SamaraJ004-Y Samara SamaraJ004-X Lisan Lisan
C(HCO3) (mg NH4 (mg/l) PO43- (mg/l) ges.P. (mg/l) Mn (mg/l) Fe (mg/l)mg/l mg/l mg/l mg/l mg/l mg/lHCO3 NH4 PO4 P Mn Fe molality Ca MMg MK Mna TDS
439.2 0.01 0.035 0.0114 0.0206 0.084 0.0578 0.1095 0.0526 0.6252 3282.0128409.31 0 0.01 0.0033 -0.009 0.0333 0.047 0.0913 0.0225 3165.9534366.61 0 0.043 0.014 -0.01 0.868 0.0452 0.0983 0.0576 0.6015 3385.9814405.04 0 0 0 0.009 0.0447 0.0392 0.087 0.0253 3582.5067405.65 0 0.016 0.0052 -0.01 -0.05 0.0567 0.12 0.0722 0.554 2292.6046386.13 0.001 0.01 0.0033 0.009 0.0738 0.048 0.1015 0.0298 2292.5513347.7 0 0 0 -0.01 -0.05 0.17 0.2141 0.0586 0.736 999.9067
317.81 0 0.05 0.0163 0 0.0103 0.0919 0.112 0.0154 996.0068355.02 0.006 0 0 -0.01 -0.05 0.1842 0.2158 0.05 0.797 1002.6684322.69 0.018 0.05 0.0163 0 0 0.0934 0.1086 0.0129 990.1546376.37 0 0.301 0.0982 -0.01 -0.05 0.1852 0.1647 0.0174 0.5907 1419.2241342.21 0.02 0.01 0.0033 0 0 0.11 0.1014 0.0054 1484.5451378.81 0.002 0.001 0.0003 -0.01 0 0.0873 0.1467 0.0692 0.656 1445.4301337.33 0.02 0.3 0.0979 0 0.1163 0.0669 0.1071 0.0246 1431.7265369.05 0.005 0 0 -0.01 -0.05 0.1054 0.1549 0.0479 0.5967 1610.6749349.53 0 0.05 0.0163 0 0.1531 0.074 0.11 0.0166 1680.7931417.85 0.001 0 0 -0.01 -0.05 0.2091 0.2468 0.0542 0.7611 971.6033342.21 0 0.3 0.0979 -0.009 0.0188 0.0991 0.1121 0.0126 931.3005349.53 0.007 0.005 0.0016 0.2183 0.4107 0.1541 0.2027 0.0584 0.8662 1116.0196317.2 0 0.06 0.0196 -0.009 -0.01 0.0803 0.1007 0.0147 1054.9985
304.39 0.004 0 0 -0.01 -0.05 0.2394 0.2349 0.0539 0.7757 795.8863292.8 0 0.1 0.0326 -0.009 -0.01 0.1109 0.1053 0.0121 820.5138
376.37 0.008 0 0 -0.01 -0.05 0.0777 0.1264 0.0478 0.6478 1956.5165369.05 0.169 0.05 0.0163 -0.009 0.0303 0.0589 0.0975 0.0187 1990.2594259.25 0.005 0 0 0.0218 -0.05 0.1416 0.1753 0.0373 0.398 1192.5449295.24 0.005 0.095 0.031 -0.01 -0.05 1.0169 0.6376 0.066 1.0234 530.125266.57 0 0.165 0.0538 -0.009 0.0328 0.1838 0.1007 0.006 533.4601287.31 0.015 0.097 0.0317 -0.01 0.1126 1.0327 0.6228 0.0642 1.0228 510.5432293.41 0.054 0.215 0.0702 -0.009 0.0241 0.1799 0.0975 0.0058 565.8795380.03 0.012 0 0 -0.01 -0.05 0.0724 0.1217 0.0435 0.6213 1832.4405417.85 0.054 0.08 0.0261 0.049 0.3821 0.0582 0.0974 0.0176 1810.7923364.17 0.016 0.088 0.0287 -0.01 -0.05 0.0949 0.1222 0.0334 0.5406 1587.8334393.45 0.01 0.2 0.0653 -0.009 -0.01 0.0781 0.0971 0.0135 1486.8983380.03 0.031 0 0 -0.01 -0.05 0.1135 0.1492 0.0353 0.5457 1367.1776403.21 0 0.06 0.0196 0.0206 0.0591 0.0891 0.1022 0.0124 1458.007437.37 0.017 0 0 -0.01 -0.05 0.4309 0.3869 0.0477 0.822 859.5172412.97 0 0.03 0.0098 -0.009 0.0117 0.149 0.123 0.0073 852.3386418.46 0.017 0.012 0.0039 -0.01 -0.05 0.0496 0.0981 0.0693 0.6815 2406.1599415.41 0 0.012 0.0039 -0.009 0.0148 0.039 0.0853 0.0267 2486.8649364.78 0.024 0.004 0.0013 -0.01 0.1426 0.1099 0.146 0.0263 0.6133 1492.826383.69 0 0.01 0.0033 -0.009 0.0185 0.0636 0.105 0.0196 2202.5396385.52 0 0.12 0.0392 -0.009 -0.01 0.0557 0.0973 0.0398 1255.2709349.53 0 0 0 -0.009 0.0219 0.0736 0.0917 0.0127 1960.0779344.65 0.01 0.1 0.0326 -0.009 0.0223 0.0663 0.1109 0.0215 1902.645406.26 0.17 0.14 0.0457 0.0428 0.4029 0.0875 0.112 0.0251 1363.1725349.53 0.03 0.023 0.0075 -0.009 -0.01 0.0586 0.0972 0.0185 1889.6854
00000000


![Colin Dexter - The Dead of Jericho [EnglishOnlineClub.com].pdf](https://static.fdokumen.com/doc/165x107/633b367e7b8e0525470c6f24/colin-dexter-the-dead-of-jericho-englishonlineclubcompdf.jpg)