Hybrid models for PHM deployment techniques in railway
10
Hybrid models for PHM deployment techniques in railway Diego Galar, Roberto Villarejo, Carl-Anders Johansson and Uday Kumar Luleå University of Technology, Division of Operation and Maintenance Engineering 97187 Luleå, Sweden Telephone +46920491000 [email protected] , [email protected], [email protected] , [email protected] Luis Berges Coauthor Zaragoza University (Higher Polytechnic Centre), Division of Design and Production Engineering María de Luna, 3 Campus Rio Ebro 50018 Zaragoza (Spain) [email protected] Phone: +34 976-76-1898 Abstract Many railway assets exhibit increasing wear and tear of equipment during operation. Prognostics are viewed as an add-on capability to diagnosis; they assess the current health of a system and predict its remaining life based on features that capture the gradual degradation in the operational capabilities of a system. Prognostics are critical to improve safety, plan successful missions, schedule maintenance, reduce maintenance cost and down time. Unlike fault diagnosis, prognosis is a relatively new area and became an important part of Condition-based Maintenance (CBM) of systems. Currently, there are many prognostic techniques; their usage must be tuned for each application. The prognostic methods can be classified as being associated with one or more of the following two approaches: data-driven and model-based. Each of these approaches has its own advantages and disadvantages, and consequently, they are often used in combination in many applications called hybrid. A hybrid model could combine some or all of model types (data-driven, and phenomenological), so that more complete information allows for more accurate recognition of the fault state. This approach is especially relevant in railway where the maintainer and operator know some of the failure mechanisms, but the complexity of the infrastructure and rolling stock is huge so no way to develop a complete model based approach that is why development of hybrid models becomes necessary to estimate RUL of railway systems in a more accurate way. The paper address this process of data aggregation into the hybrid model in order to get RUL values within logical confidence intervals so railway assets life cycle can be managed and optimized. 1. Introduction The Tenth International Conference on Condition Monitoring and Machinery Failure Prevention Technologies
-
Upload
independent -
Category
Documents
-
view
0 -
download
0
Transcript of Hybrid models for PHM deployment techniques in railway
Hybrid models for PHM deployment techniques in railway
Diego Galar, Roberto Villarejo, Carl-Anders Johansson and Uday Kumar Luleå University of Technology, Division of Operation and Maintenance Engineering
97187 Luleå, Sweden Telephone +46920491000
[email protected], [email protected], [email protected], [email protected]
Luis Berges Coauthor
Zaragoza University (Higher Polytechnic Centre), Division of Design and Production Engineering
María de Luna, 3 Campus Rio Ebro
50018 Zaragoza (Spain) [email protected]
Phone: +34 976-76-1898
Abstract
Many railway assets exhibit increasing wear and tear of equipment during operation. Prognostics are viewed as an add-on capability to diagnosis; they assess the current health of a system and predict its remaining life based on features that capture the gradual degradation in the operational capabilities of a system. Prognostics are critical to improve safety, plan successful missions, schedule maintenance, reduce maintenance cost and down time. Unlike fault diagnosis, prognosis is a relatively new area and became an important part of Condition-based Maintenance (CBM) of systems. Currently, there are many prognostic techniques; their usage must be tuned for each application. The prognostic methods can be classified as being associated with one or more of the following two approaches: data-driven and model-based. Each of these approaches has its own advantages and disadvantages, and consequently, they are often used in combination in many applications called hybrid. A hybrid model could combine some or all of model types (data-driven, and phenomenological), so that more complete information allows for more accurate recognition of the fault state. This approach is especially relevant in railway where the maintainer and operator know some of the failure mechanisms, but the complexity of the infrastructure and rolling stock is huge so no way to develop a complete model based approach that is why development of hybrid models becomes necessary to estimate RUL of railway systems in a more accurate way. The paper address this process of data aggregation into the hybrid model in order to get RUL values within logical confidence intervals so railway assets life cycle can be managed and optimized. 1. Introduction
The Tenth International Conference on Condition Monitoring and Machinery Failure Prevention Technologies
2
A railway vehicle is a complex electromechanical vehicle comprised of several complex systems. Each of these systems is built from components which over time may fail. When a component does fail, it is difficult to identify the failed component because the effects or problems that the failure has on the system are often neither obvious in terms of their source nor unique. The ability to automatically diagnose problems that have occurred or will occur in the locomotive systems has a positive impact on minimizing locomotive downtime. Previous attempts to diagnose problems occurring in a locomotive have been performed by experienced personnel who have in-depth individual training and experiences in working with locomotives. Typically, these experienced individuals use available information that has been recorded in a log. Looking through the log, the experienced individuals use their accumulated experiences and training in mapping incidents occurring in locomotive systems to problems that may be causing the incidents. If the incident-problem scenario is simple, then this approach works fairly well. However, if the incident-problem scenario is complex, then it is very difficult to diagnose and correct any failures associated with the incidents. Currently, computer-based systems are being used to automatically diagnose problems in a locomotive in order to overcome some of the disadvantages associated. With relying completely on experienced personnel. Typically, a computer-based system utilizes a mapping between the observed symptoms of the failures and the equipment problems using techniques such as table look ups, a symptom-problem matrices, and production rules. These techniques work well for simplified systems having simple mappings between symptoms and problems. However, complex equipment and process diagnostics seldom have such simple correspondences. In addition, not all symptoms are necessarily present if a problem has occurred, thus making other approaches more cumbersome. The above mentioned approaches either take a considerable amount of time before failures are diagnosed, or provide less than reliable results, or are unable to work well in complex systems. There is a need to be able to quickly and efficiently determine the cause of any failures occurring in the locomotive systems, while minimizing the need for human intervention. The present paper proposes a hybrid approach for railway vehicle health assessment. The system is useful for identifying locomotive systems problems and proposing remedial measures to repair or correct the problems. On-board diagnostic systems, however, do not presently communicate with a rail carrier’s maintenance or scheduling centres. Consequently, those centres do not have direct access to systems data from remote locomotives which would be helpful in optimizing locomotive maintenance scheduling and route planning while minimizing locomotive downtime arising from unexpected breakdowns. Accordingly, it is especially desirable to avoid faults resulting in unscheduled shutting down or slowing down vehicle operation, since such shutdowns or slowdowns are costly and highly inconvenient (1). It is also desirable to provide a way of predicting faults and dealing with predicted faults before they occur. In one aspect, the proposed methodology comprises a method of predicting vehicle breakdown comprising monitoring from track side (provided by the infrastructure manager) and on-board systems whose data are transmitted from a Vehicle to a remote
The Tenth International Conference on Condition Monitoring and Machinery Failure Prevention Technologies
3
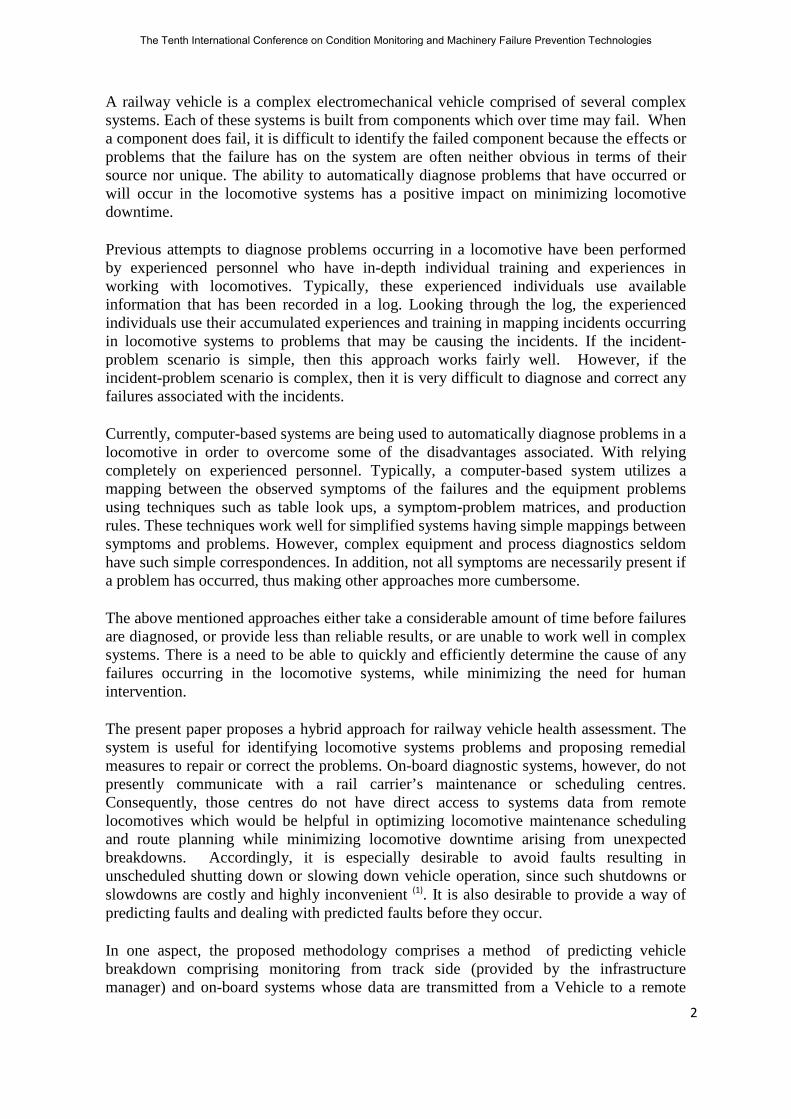
location; determining whether any of the monitored data is out of a predetermined range; calculating trends for monitored data determined to be out of range; identifying any system fault; and predicting which, if any, locomotive system(s) must be corrected to avoid vehicle failure and when such system(s) is/are likely to fail unless corrected. The method should predict either operating distance or operating time prior to failure. 2. Disparate data sources for railway health assessment Railway infrastructure, such as railroads, has a direct impact in the shutdown or slowdown of railway vehicles. The condition and maintenance of these assets is critical to the effectiveness, efficiency and security of a train. Any improvement in the condition or maintenance management of linear assets and the technology involved in maintenance tasks can have a substantial influence on the operation of the corresponding rolling stock using this railroad. Therefore, there is a need of integration between railroad information and rolling stock to get an accurate health assessment of the vehicles in order to check how probable is a shutdown or slowdown (2). However, for railroads and rolling stock, much information needs to be captured and analyzed to assess the overall condition of the whole system, i.e. infrastructure plus vehicles. Examples of information that can be collected include track availability, use of track time, track condition, performance history, and the worked performed. Measurements of the condition of a linear asset such as track typically include continuous and spot measurements from automatic inspection vehicles, visual inspections from daily walking inspections, and records of in-services failures. Examples of conditions measured by automatic inspection vehicles include geometry car measurements (deviation from design curves, geometry exceptions to railroad standards, vehicle ride quality exceptions), rail measurements, gage restraint measurements, track deflection and stiffness measurements, clearance measurements, and substructure measurements.
Figure 1: Physical parameters monitored in linear assets by OPTRAM software
The Tenth International Conference on Condition Monitoring and Machinery Failure Prevention Technologies

4
The information regarding a railroad is usually collected and maintained, for example, in a set of track charts or line books (see figure 1 above). A track chart is the linear representation of all infrastructure assets along a linear asset based upon a maker posts and offset measurement system. Updating the track charts generally occurs on an ad hoc basis, so discrepancies, missing facilities, and incorrect location information are common. Even with a complete accurate map of the corridor, rail, ties, and other corridor assets do not bear any physical characteristics that lead to easy identification. Furthermore, problem areas for targeted maintenance often times do not obey discrete physical boundaries such as beginning and end of a rail section. Additionally, the development of a variety of track condition indicators such as geometry cars, rail defect detection equipment and gage restraint management systems have resulted in a significant amount of new and useful information for track maintenance. A large amount of information provided over a large area quickly leads to information overload. Moreover, much of the data that is collected about tracks and rolling stocks is dispersed across independent systems that are difficult to access and are not correlated. If the data from each of these independent systems is combined into a common correlated data system, this system could provide a rich new set of information that greatly adds to the value of the individuals systems. A simple example is that it is common for facilities like railroads to collect work records of where work has been done. Railroads also typically measure the quality of their tracks to see where work needs to be done. However, these two data sets remain in separate and individual systems. By combining the data into a location correlated data set, i.e. metadata (figure 3), the quality and/or the effectiveness of the work being performed can be analyzed by comparing the track quality from before and after the work at the location where the work was completed.
Figure 2: Metadata for maintenance railway knowledge extraction
The Tenth International Conference on Condition Monitoring and Machinery Failure Prevention Technologies
5
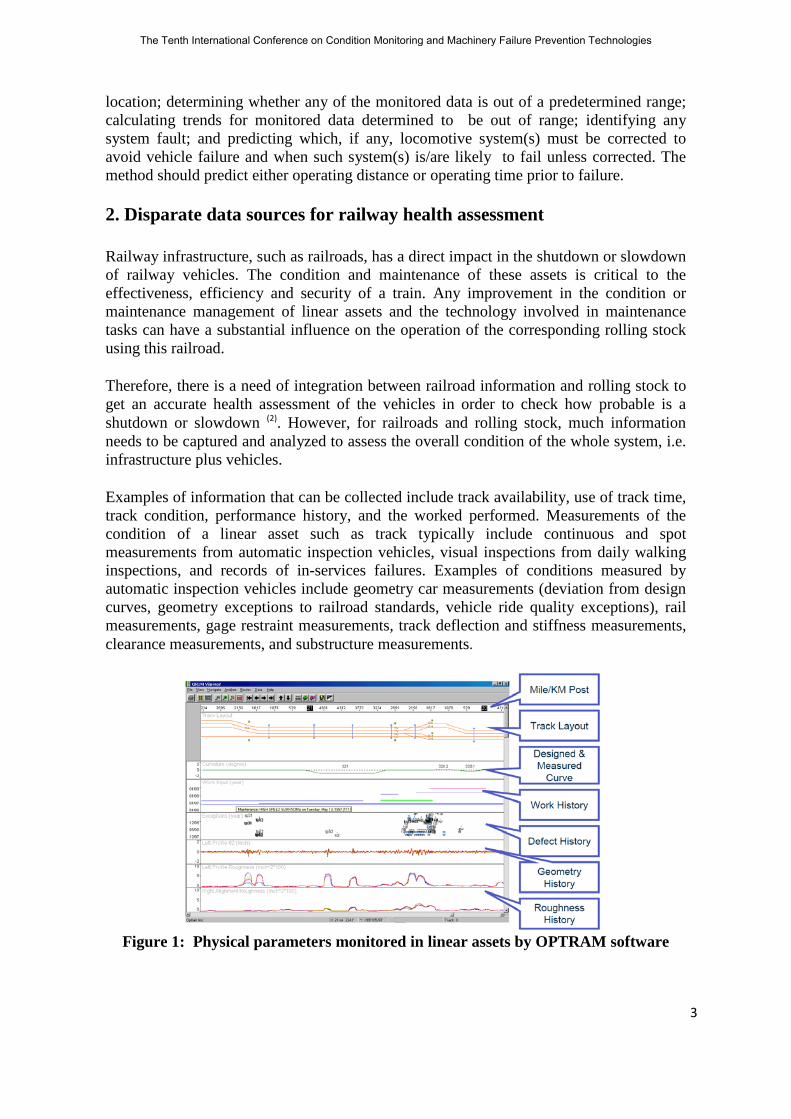
3. Information fusion and data mining in railway However, even facilities that have recognized the value of combining data sets in order to mine useful information must implement expensive and usually inflexible custom software to extract the knowledge that they need(3). Consequently, it is difficult to experiment with new ideas. The cost and effort involved introducing new analysis tools is often prohibitive and results in the tools never being built. Accordingly, there is a need for an improved system and method for analysing data about railway. It is only with a unified perspective on all the relevant data within a single, accurate format that the people that work with track and rolling stock information can begin to analyse those data. The system should answer the questions like what should be worked on and why? Such a system should equip the user with the knowledge and understanding of infrastructure's and vehicle´s condition and configuration, so maintenance resources could be targeted to only those areas needing work. The system should also provide the information needed to plan and evaluate opportunities for such things as facility upgrades and expansions. An effective maintenance management system results in direct savings on both maintenance programs and capital expenditures. The proposed methodology provides the tools for analysing railway data from a prognosis point of view, It will provide a unified view and tool for collecting, viewing and analysing linear asset’s and train´s condition and performance over time. Accordingly, data may be imported from many different independent sources into a common location correlated data set. The data set may be stored in a database that will be able to store tons of data regarding the linear asset and corresponding vehicles. This integration will provide an enterprise class foundation for the analysis tool set and greatly reduces the efforts and risks regarding the development of analysis tools.
Figure 3: Existing interfaces to collect relevant information for data mining
The Tenth International Conference on Condition Monitoring and Machinery Failure Prevention Technologies
6
The developed mining system will provide and collect information. A central data store can integrate information regarding the railroad and vehicle. For a railroad, the database can integrate railway information encompassing the following areas: Layout-Configuration of rail line elements along a rail route including aspects such as number o nines, curvature of track, and location of bridges, tunnels, signals, turnouts, drainage, cuts and fills; Inventory-Track component description such as type of tie, rail, fastener, ballast and installation date; also description of structures such as bridges and culverts; Condition-Location and date of track condition information such as rail breaks, ultrasonic/x-rays defects, rail wear, rail corrugation, track geometry measurements, ground penetrating radar scans, drainage, ballast, subgrade; Maintenance Input-Location and date of maintenance action taken, including aspects such as rail break repair, rail grinding, tamping, ballast cleaning, and tie replacement; Traffic-Accounting of annual tonnage, axle loads, frequency of usage, maximum train speeds, and types of traffic; Weather-Seasonal precipitation and temperature ranges; Cost Information, Cost of items such as train delays, maintenance, and track components; and Analysis Geometry changes with time, rate of tie replacement. The central data store may be derived from a variety of data sources and may provide information to multiple system users. The central data store may also be enhanced to dynamically interact with other information servers (e.g., through client-server database standards, middleware, or multi-tier architecture).The reason for this interaction relies on information fusion with rolling stock. Meanwhile most of the information collected in the server or “cloud” is off line and corresponds to interventions, condition of track etc.. the rolling stock is generating on line data sent to the cloud where is fused with track side data and can potentially warn the operator about imminent shutdowns or slowdowns. Referring now to Figure 3, a central computer server (cloud) eventually connected to the railway control centre, will provide a repository for all data related to the linear asset, such as layout, inventory, condition and maintenance input, traffic, weather, cost information, and analysis data. Data inputs are collected from multiple sources. For example, in the context of a railroad, data may be collected from including existing computer systems, paper records (e.g., maps), track experts (e.g., Track Inspectors, Track Supervisors, District Engineer), inspection equipment (e.g., Geometry Car, Sperry Rail Flaw Detector Car, Ground Penetrating Radar, etc.), and sensors (e.g., traffic and weather). The central server (cloud) will maintain and store this data in the central working data store. The central server and working data store may employ forward and store, search and retrieve and other protocol common in the art for maintaining and accessing data store data. Simultaneously, a user interface should provide an analysis tool by its ability to integrate all the data about track condition and weather, with rolling stock condition (provided by on board systems). This should produce a prognosis about shutdowns or potential slowdowns with risk consequences in terms of costs. This integration should also have the ability to optimize maintenance management both in vehicles and infrastructure proposing proper corrective actions as a result of rule extraction provided by the data mining of such cloud (4).
4. Prognosis: Achilles heel in health assessment
The Tenth International Conference on Condition Monitoring and Machinery Failure Prevention Technologies

7
There are two basic risks in railway: Shutdown and slowdown the system. These risks are materialised in economical loses and the only way to save that money is to perform a proper prognosis by no just diagnosis. For this purpose, there are three basic ways to model how faults develop: using symbols, using data, and using mathematical formulations based on physical principles. 4.1 Symbolic models A symbolic model uses empirical relationships described in words (and sometimes numbers as well) rather than as mathematical or statistical relationships. For example, a semantic description may be a rule for determining whether a fault exists under a set of conditions. These models that can be found in work orders and maintenance reports, handwritten by maintenance crew, are good for general descriptions of causal relationships, but verbal descriptions are not effective for detailed descriptions of complicated dependencies and time varying behaviour. This information is usually off line information mostly recorded in the CMMS systems, (5) and gives important hints to create the context or scenario where the fault is developing in order to identify the real fault and distinguish it from false alarms. The integration of work orders from both rolling stock and infrastructure is essential to reproduce the exact scenarios where the shutdown can occurs and predict it beforehand in order to apply preventive actions.
Figure 4: Integration of symbolic data sources from both rolling stock and infrastructure
4.2 Data-driven models A data-driven model relies on relationships derived from training data gathered from the system. Condition monitoring systems typically use thresholds for features in time series data, spectral band thresholds (usually from vibration signals), temperatures, lubricant analyses, and other observable condition indicators, under the assumption of steady-state operating conditions. A data-driven approach considers a condition indicator signal to be a set of random variables from a stochastic process represented by probability distributions. There are plenty of methods which have been developed for monitoring and fault diagnosis of equipment components and process equipment, using a combination of process measurements and indirect measurements related to faults (such as vibrations and
The Tenth International Conference on Condition Monitoring and Machinery Failure Prevention Technologies
8
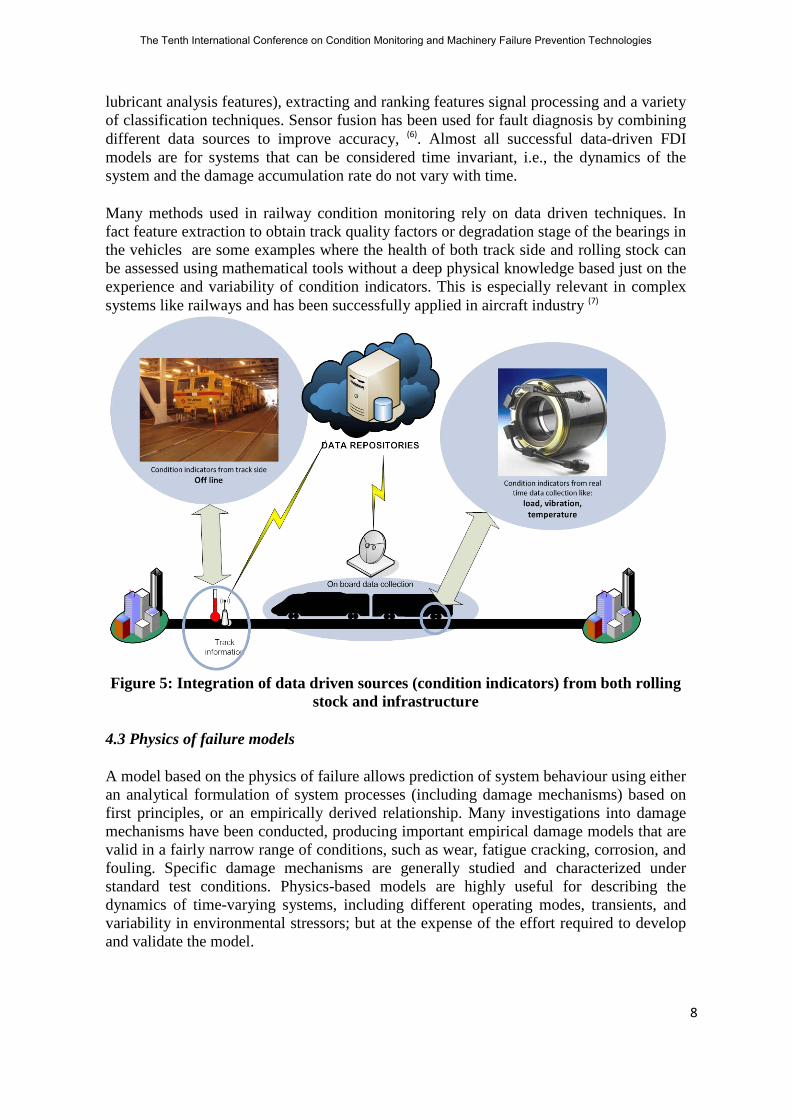
lubricant analysis features), extracting and ranking features signal processing and a variety of classification techniques. Sensor fusion has been used for fault diagnosis by combining different data sources to improve accuracy, (6). Almost all successful data-driven FDI models are for systems that can be considered time invariant, i.e., the dynamics of the system and the damage accumulation rate do not vary with time. Many methods used in railway condition monitoring rely on data driven techniques. In fact feature extraction to obtain track quality factors or degradation stage of the bearings in the vehicles are some examples where the health of both track side and rolling stock can be assessed using mathematical tools without a deep physical knowledge based just on the experience and variability of condition indicators. This is especially relevant in complex systems like railways and has been successfully applied in aircraft industry (7)
Figure 5: Integration of data driven sources (condition indicators) from both rolling
stock and infrastructure
4.3 Physics of failure models A model based on the physics of failure allows prediction of system behaviour using either an analytical formulation of system processes (including damage mechanisms) based on first principles, or an empirically derived relationship. Many investigations into damage mechanisms have been conducted, producing important empirical damage models that are valid in a fairly narrow range of conditions, such as wear, fatigue cracking, corrosion, and fouling. Specific damage mechanisms are generally studied and characterized under standard test conditions. Physics-based models are highly useful for describing the dynamics of time-varying systems, including different operating modes, transients, and variability in environmental stressors; but at the expense of the effort required to develop and validate the model.
The Tenth International Conference on Condition Monitoring and Machinery Failure Prevention Technologies
9
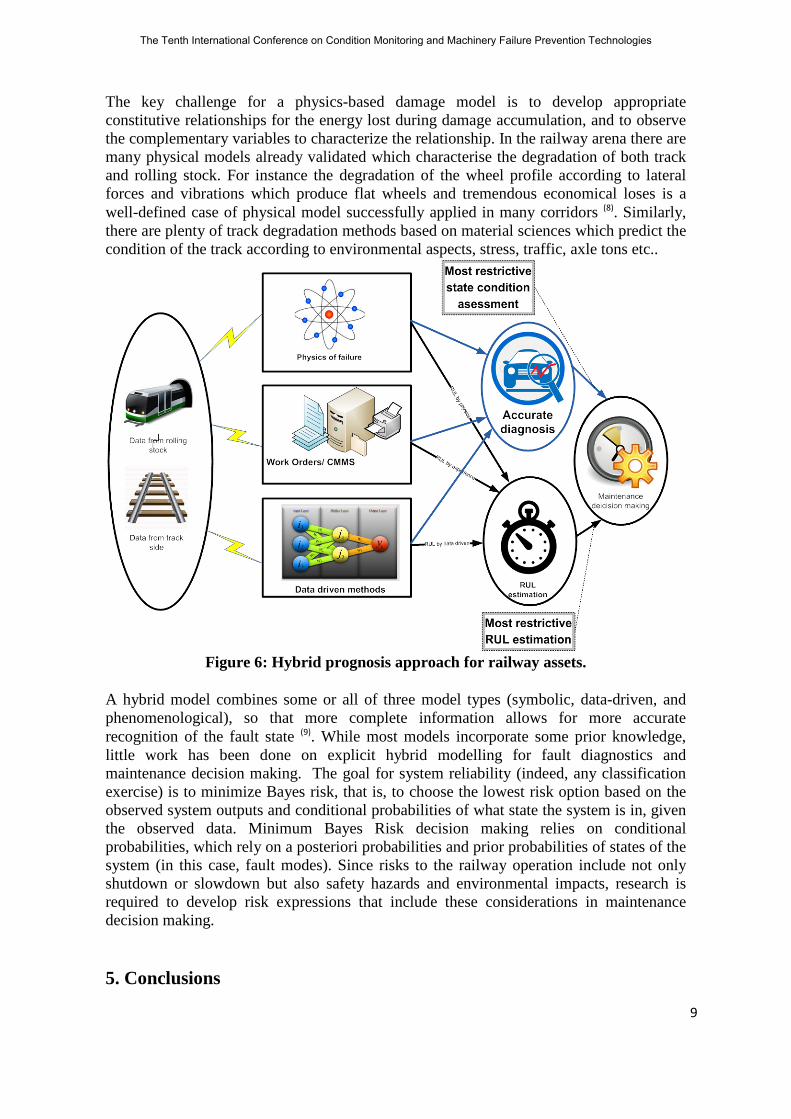
The key challenge for a physics-based damage model is to develop appropriate constitutive relationships for the energy lost during damage accumulation, and to observe the complementary variables to characterize the relationship. In the railway arena there are many physical models already validated which characterise the degradation of both track and rolling stock. For instance the degradation of the wheel profile according to lateral forces and vibrations which produce flat wheels and tremendous economical loses is a well-defined case of physical model successfully applied in many corridors (8). Similarly, there are plenty of track degradation methods based on material sciences which predict the condition of the track according to environmental aspects, stress, traffic, axle tons etc..
Figure 6: Hybrid prognosis approach for railway assets.
A hybrid model combines some or all of three model types (symbolic, data-driven, and phenomenological), so that more complete information allows for more accurate recognition of the fault state (9). While most models incorporate some prior knowledge, little work has been done on explicit hybrid modelling for fault diagnostics and maintenance decision making. The goal for system reliability (indeed, any classification exercise) is to minimize Bayes risk, that is, to choose the lowest risk option based on the observed system outputs and conditional probabilities of what state the system is in, given the observed data. Minimum Bayes Risk decision making relies on conditional probabilities, which rely on a posteriori probabilities and prior probabilities of states of the system (in this case, fault modes). Since risks to the railway operation include not only shutdown or slowdown but also safety hazards and environmental impacts, research is required to develop risk expressions that include these considerations in maintenance decision making. 5. Conclusions
The Tenth International Conference on Condition Monitoring and Machinery Failure Prevention Technologies

10
In summary, Hybrid Model-Based Approach to Dynamic System Modelling with Damage Accumulation Phenomenological modelling and data-driven models have been successfully combined to relate process features to damage accumulation in time-varying railway equipment. New approaches have been developed for modelling damage mechanisms, for classes of faults that occur in components and systems, and the approach will be tested on existing systems that are critical to the safe and reliable operation of current railway assets. Process modelling will be combined with damage modelling. Constitutive relationships will be based first on physical phenomena, and found using standard system identification methods. Alternatively, if physics are not well understood or the process is not completely observable, then an empirical relationship will be derived using data-driven methods.
References
1. T J Wilmering, A V Ramesh, ‘Assessing the Impact of Health Management Approaches on System Total Cost of Ownership’, IEEE Aerospace Conference, Big Sky, Montana. Mar. 2005
2. F Camci, G S Valentine, K Navarra, ‘Methodologies for integration of PHM systems with maintenance data’. In: IEEE Aerospace Conference 2007.
3. D Galar, A Gustafson, B Tormos, L Berges, 2012, ‘Maintenance decision making based on different types of data fusion’, Eksploatacja i niezawodnosc – Maintenance and Reliability, Vol 14, No 2, pp 135-144. 2012.
4. S Létourneau, C Yang, C Drummond, E Scarlett, J Valdés, M Zaluski,. ‘A Domain Independent Data Mining Methodology for Prognostics’, Conference Proceedings: Essential Technologies for Successful Prognostics, 59th Meeting of the Machinery Failure Prevention Technology Society. Virginia Beach, Virginia, USA. April 18-21, 2005.
5. A W Labib, ‘A decision analysis model for maintenance policy selection using a CMMS’, Journal of Quality in Maintenance Engineering, Vol. 10 Iss: 3, pp.191 – 202, 2004
6. M A Schwabacher, ‘A Survey of Data-Driven Prognostics’, Infotech@Aerospace, paper number: AIAA 2005-7002. Arlington, Virginia. 26 - 29 September 2005
7. E R Brown, N N McCollom, E E Moore, A Hess, ‘ Prognostics and healt management: a data-driven approach to supporting the F-35 lightning II’. In: IEEE Aerospace Conference. 2007.
8. M Palo, H Schunnesson, U Kumar, P O Larsson-Kraik, D Galar, ‘Insight-Non-Destructive Testing and Condition Monitoring’ 54 (8), 451-455. 2012.
9. D Galar, M Palo, A Van Horenbeek, L Pintelon, ‘Integration of disparate data sources to perform maintenance prognosis and optimal decision making’. Insight: non-Destructive Testing and Condition Monitoring, 54 (8), 440-445. 2012.
The Tenth International Conference on Condition Monitoring and Machinery Failure Prevention Technologies