
Hybrid Energy System Model in Matlab/Simulink Based on ...
23
Citation: Möller, M.C.; Krauter, S. Hybrid Energy System Model in Matlab/Simulink Based on Solar Energy, Lithium-Ion Battery and Hydrogen. Energies 2022, 15, 2201. https://doi.org/10.3390/en15062201 Academic Editor: Carlo Roselli Received: 14 February 2022 Accepted: 10 March 2022 Published: 17 March 2022 Publisher’s Note: MDPI stays neutral with regard to jurisdictional claims in published maps and institutional affil- iations. Copyright: © 2022 by the authors. Licensee MDPI, Basel, Switzerland. This article is an open access article distributed under the terms and conditions of the Creative Commons Attribution (CC BY) license (https:// creativecommons.org/licenses/by/ 4.0/). energies Article Hybrid Energy System Model in Matlab/Simulink Based on Solar Energy, Lithium-Ion Battery and Hydrogen Marius C. Möller * and Stefan Krauter Faculty of Computer Science, Electrical Engineering and Mathematics, Electrical Energy Technology-Sustainable Energy Concepts (EET-NEK), Paderborn University, Warburger Str. 100, 33098 Paderborn, Germany; [email protected] * Correspondence: [email protected] Abstract: In this work, a model of an energy system based on photovoltaics as the main energy source and a hybrid energy storage consisting of a short-term lithium-ion battery and hydrogen as the long-term storage facility is presented. The electrical and the heat energy circuits and resulting flows have been modelled. Therefore, the waste heat produced by the electrolyser and the fuel cell have been considered and a heat pump was considered to cover the residual heat demand. The model is designed for the analysis of a whole year energy flow by using a time series of loads, weather and heat profile as input. This paper provides the main set of equations to derive the component properties and describes the implementation into MATLAB/Simulink. The novel model was created for an energy flow simulation over one year. The results of the simulation have been verified by comparing them with well-established simulation results from HOMER Energy. It turns out that the novel model is well suited for the analysis of the dynamic system behaviour. Moreover, different characteristics to achieve an energy balance, an ideal dimensioning for the particular use case and further research possibilities of hydrogen use in the residential sector are covered by the novel model. Keywords: hydrogen energy system; electrolyser; fuel cell; PV system; heat demand; renewable energies; modelling; Simulink; HOMER energy 1. Introduction Due to the rapidly increasing global warming issues caused by the emission of green- house gases into the atmosphere from burning oil, gas and coal, there is a need for alterna- tive technologies to satisfy the world’s energy demand, with the focus now being shifted to environmentally friendly technologies [1]. One promising approach for the success of the energy change can be hydrogen, when it is produced by renewable energy sources (RES) [2]. While hydrogen is already being used in the mobility sector [3], it is as yet to be employed within the residential sector. This sector is responsible for 26.5% of the total energy demand in Germany which is predominantly covered by fossil energy sources [4,5]. Moreover, the highest energy demand in Germany occurs during winter which coincides with low photovoltaic (PV) generation. This leads to the necessity of long-term energy storage systems such as hydrogen, which are charged during the summer by usage of high excess energy produced, for example, via PV. PV is already widely installed, as more than 1.7 million PV systems have been installed in Germany as of the end of 2020 [6]. However, the degree of PV autoconsumption is around 35% on average due to the volatility of the energy production [7]. The residual energy is fed into the external energy grid. Nonetheless, the high number of PV systems installed with grid connections leads to a burden of the grids during periods with high PV overproduction (e.g., on midday in summer), which becomes even more critical as the number of PV systems increases. This phenomenon contributes to the slow expansion of renewable energy systems Energies 2022, 15, 2201. https://doi.org/10.3390/en15062201 https://www.mdpi.com/journal/energies
-
Upload
khangminh22 -
Category
Documents
-
view
1 -
download
0
Transcript of Hybrid Energy System Model in Matlab/Simulink Based on ...
�����������������
Citation: Möller, M.C.; Krauter, S.
Hybrid Energy System Model in
Matlab/Simulink Based on Solar
Energy, Lithium-Ion Battery and
Hydrogen. Energies 2022, 15, 2201.
https://doi.org/10.3390/en15062201
Academic Editor: Carlo Roselli
Received: 14 February 2022
Accepted: 10 March 2022
Published: 17 March 2022
Publisher’s Note: MDPI stays neutral
with regard to jurisdictional claims in
published maps and institutional affil-
iations.
Copyright: © 2022 by the authors.
Licensee MDPI, Basel, Switzerland.
This article is an open access article
distributed under the terms and
conditions of the Creative Commons
Attribution (CC BY) license (https://
creativecommons.org/licenses/by/
4.0/).
energies
Article
Hybrid Energy System Model in Matlab/Simulink Based onSolar Energy, Lithium-Ion Battery and HydrogenMarius C. Möller * and Stefan Krauter
Faculty of Computer Science, Electrical Engineering and Mathematics, Electrical Energy Technology-SustainableEnergy Concepts (EET-NEK), Paderborn University, Warburger Str. 100, 33098 Paderborn, Germany;[email protected]* Correspondence: [email protected]
Abstract: In this work, a model of an energy system based on photovoltaics as the main energysource and a hybrid energy storage consisting of a short-term lithium-ion battery and hydrogen as thelong-term storage facility is presented. The electrical and the heat energy circuits and resulting flowshave been modelled. Therefore, the waste heat produced by the electrolyser and the fuel cell havebeen considered and a heat pump was considered to cover the residual heat demand. The modelis designed for the analysis of a whole year energy flow by using a time series of loads, weatherand heat profile as input. This paper provides the main set of equations to derive the componentproperties and describes the implementation into MATLAB/Simulink. The novel model was createdfor an energy flow simulation over one year. The results of the simulation have been verified bycomparing them with well-established simulation results from HOMER Energy. It turns out that thenovel model is well suited for the analysis of the dynamic system behaviour. Moreover, differentcharacteristics to achieve an energy balance, an ideal dimensioning for the particular use case andfurther research possibilities of hydrogen use in the residential sector are covered by the novel model.
Keywords: hydrogen energy system; electrolyser; fuel cell; PV system; heat demand; renewableenergies; modelling; Simulink; HOMER energy
1. Introduction
Due to the rapidly increasing global warming issues caused by the emission of green-house gases into the atmosphere from burning oil, gas and coal, there is a need for alterna-tive technologies to satisfy the world’s energy demand, with the focus now being shiftedto environmentally friendly technologies [1]. One promising approach for the success ofthe energy change can be hydrogen, when it is produced by renewable energy sources(RES) [2].
While hydrogen is already being used in the mobility sector [3], it is as yet to beemployed within the residential sector. This sector is responsible for 26.5% of the totalenergy demand in Germany which is predominantly covered by fossil energy sources [4,5].Moreover, the highest energy demand in Germany occurs during winter which coincideswith low photovoltaic (PV) generation. This leads to the necessity of long-term energystorage systems such as hydrogen, which are charged during the summer by usage of highexcess energy produced, for example, via PV.
PV is already widely installed, as more than 1.7 million PV systems have been installedin Germany as of the end of 2020 [6]. However, the degree of PV autoconsumption is around35% on average due to the volatility of the energy production [7]. The residual energy is fedinto the external energy grid. Nonetheless, the high number of PV systems installed withgrid connections leads to a burden of the grids during periods with high PV overproduction(e.g., on midday in summer), which becomes even more critical as the number of PV systemsincreases. This phenomenon contributes to the slow expansion of renewable energy systems
Energies 2022, 15, 2201. https://doi.org/10.3390/en15062201 https://www.mdpi.com/journal/energies
Energies 2022, 15, 2201 2 of 23
in Germany: An increase in the share of renewable energy with grid connection impliesfurther investment from grid operators in additional transmission and distribution capacityas well as in grid stabilising measures [8]. Since the implementation of such measures isvery time consuming, short-term solutions are preferable.
With the increase of renewable energy share, a transition from a predominantly cen-tralised to a decentralised energy supply is performed [9]. Not only decentralised pro-duction but also decentralised long-term energy storage should be considered to reducethe necessity of grid expansion. A degree of self-sufficiency of up to 100% by usage ofdecentralised long-term storages would lead to an expansion of PV systems which are notinfluenced by these constraints. However, the intermittent nature and the uncertainty ofproduction of RES necessitates the usage of efficient and sufficient seasonal storage systemsin order to store the overproduction for use during periods of low energy production [10].Hydrogen is especially well suited for long-term energy storage due to its inherent highenergy density and its long lifetime as a storage device (compared to batteries) [11].
In literature, some research has already been carried out on this topic but with a focuson specific partial aspects of hybrid, hydrogen-based energy systems. In [12], the authorspresented a hybrid energy system including RES as energy supply, an alkaline electrolyser,a proton exchange membrane fuel cell (PEMFC) and a hydrogen storage. They focused onthe analysis of the system dynamics with the aim to improve self-sufficiency by reducinggrid interaction. Within that energy system a Li-ion battery and a heating system have notbeen considered. Due to the lack of short-term energy storage, they used the hydrogenstorage to store the amount of hydrogen produced by the electrolyser within one day anddirectly reconverted the hydrogen by usage of a fuel cell as soon as the energy productionwith RES was less than the energy demand. In [13], a Simulink model of an energy systemconsisting of a PV system, a PEM electrolyser and a hydrogen storage system has beenpresented. The model was created for the analysis of system dynamics and was thereforeused for short-term analysis. It also did not consider a fuel cell and real load profiles. In [14],the authors compared different meta-heuristic methods to optimally design an isolatedhydrogen-based microgrid. The model was good enough for energy evaluation. However,the model also did not consider short-term energy storage, which is important in termsof dealing with rapid load peaks for ensuring a high degree of self-sufficiency. In [15], ahydrogen-based energy system model created in Simulink was presented. The authors useda time horizon of 24 h with focus on the power management system and the control system.They analysed the suitability of a hydrogen-based energy system consisting of hydrogen asthe only energy storage type for stand-alone systems. However, the load profile did notcontain rapid peaks which should not be covered by a fuel cell in terms of lifetime [16]. Innone of the literature found, with focus on hybrid, hydrogen-based energy systems, werethe heating sector and thus the overall energy demand of a household considered. Whendealing with the attempt to increase the self-sufficiency of a household, the heating systemplays an important role, especially in terms of stand-alone systems which shall be fullysupplied by RES. An energy system model including a hybrid energy storage consisting ofa Li-ion battery and hydrogen has hardly been considered so far.
Within this paper, a model of a decentralised energy system whose energy demandis mainly covered via photovoltaics even during winter by including sufficient storagefacilities is presented. The aim is to minimise the grid load by achieving low or even zerogrid interaction, which is realised by the use of decentralised long-term energy storage.The model consists of an electrolyser, which produces hydrogen in case of PV overproduc-tion (overproduction = present PV generation—autoconsumption), and the hydrogen issubsequently stored in a hydrogen tank via a compressor. If the energy demand exceedsthe energy provided by the PV system, a fuel cell is used for reconversion of hydrogen.To guarantee fast reactions to rapid load changes and to avoid comparatively high energylosses that arise when only using hydrogen as a storage medium, the system has to beextended by a short-term lithium-ion battery. Such a system can provide autonomy forelectricity over the whole year.
Energies 2022, 15, 2201 3 of 23
The model was created in Matlab/Simulink [17] and was designed for the analysisof real data series over an entire year with a time resolution of 15 min. A representativedataset recorded in Switzerland in 2012 was used as the household load profile [18]. Theload profile originally had a time resolution of one second which was converted to a timeresolution of 15 min by averaging the values. The irradiance and temperature profile havebeen granted by the Deutscher Wetterdienst (DWD) with a time resolution of one hour [19].The data used were recorded in 2015 in Wuerzburg (Germany). The given resolution wasconverted to a time resolution of 15 min using linear interpolation. As the heating systemwas also considered, a synthetic heat demand profile was generated using the referenceload profiles from the VDI 4655 standard [20]. Using the temperature profile for 2015 andan Excel tool created by Hessen [21], which uses the reference load profiles from the VDI6455 standard, a heating demand profile with a 15 min time resolution was generated.
This work shows the development of a model that has been designed to analyse thepossibilities of a household system fully powered by a PV system considering hybrid energystorage composed of a lithium-ion battery and hydrogen. The focus of the research is basedon the analysis of the kind and size of components required under different scenarios andan analysis as to what extent and under which conditions such a system is price-competitivewith a conventional energy supply. The impact of different operating modes on the overallenergy balance is also a subject of the investigation. Due to a time resolution of 15 min anda total timeframe of one year, a detailed analysis of the energy flows which is based on realdata rather than synthetic profiles is possible.
The paper is organised as followed: Section 2 introduces the architecture of the entireenergy system, Section 3 describes the model components mathematically and graphicallyand Section 4 specifies the configuration of the components used for the test case. InSection 5, the Simulink model is verified and compared to the results delivered by HOMEREnergy Simulation [22] for the same system dimensioning and finally Section 6 concludesthe findings.
2. Input Data
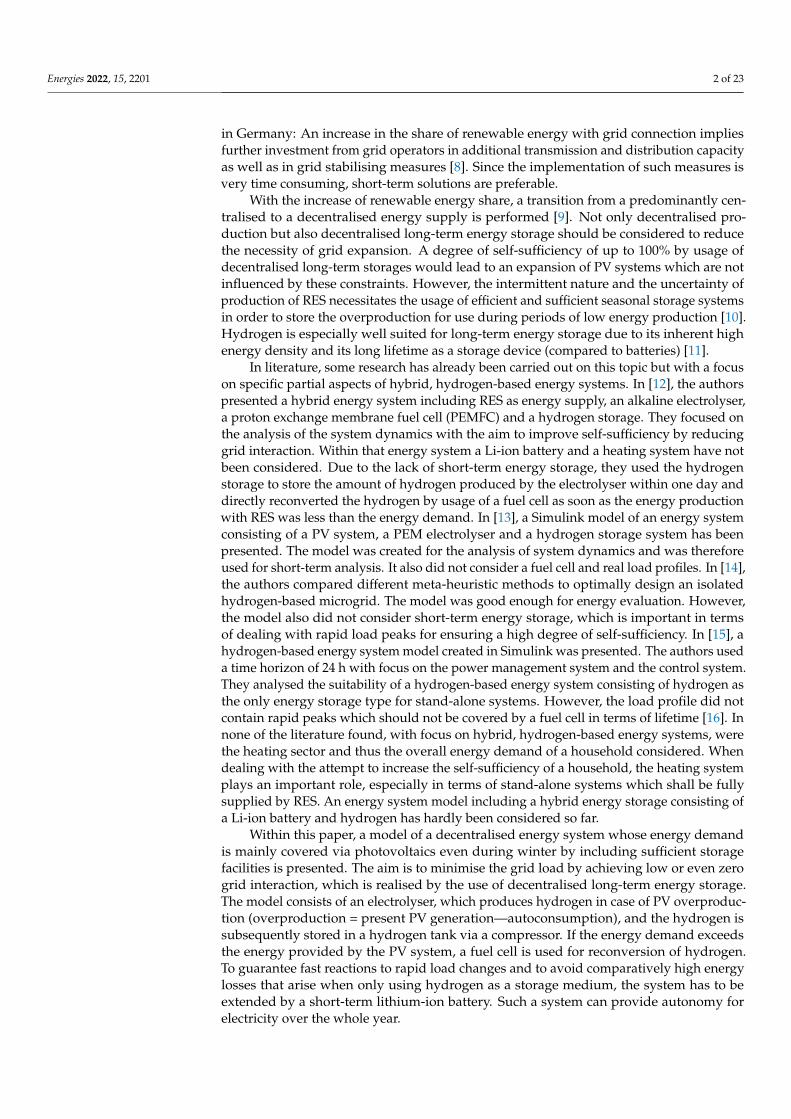
Figure 1 shows the weather data used as input for the simulation. The trend of theambient temperature and the wind speed is shown in Figure 1 (left). The data have beenaveraged for every day within the applied time period to achieve a better visualisation of thetrend. The temperature curve has an arithmetic mean of 11.07 ◦C and a standard deviationof 7.44. The wind speed trend is used for calculation of the probable cell temperature of thePV modules to achieve more realistic PV energy yields. The wind speed has an arithmeticmean of 3.26 m
s and a standard deviation of 1.76. The curve of the global horizontalirradiance is shown in Figure 1 (right). The curve shows an irradiance value for every day,which was achieved by calculating the arithmetic mean of all sunshine hours within thespecific day.
Energies 2022, 15, x FOR PEER REVIEW 4 of 24
Figure 1. Input temperature and wind speed data (daily averaged values) (left) and input global
and diffuse irradiance (daily averaged values) (right).
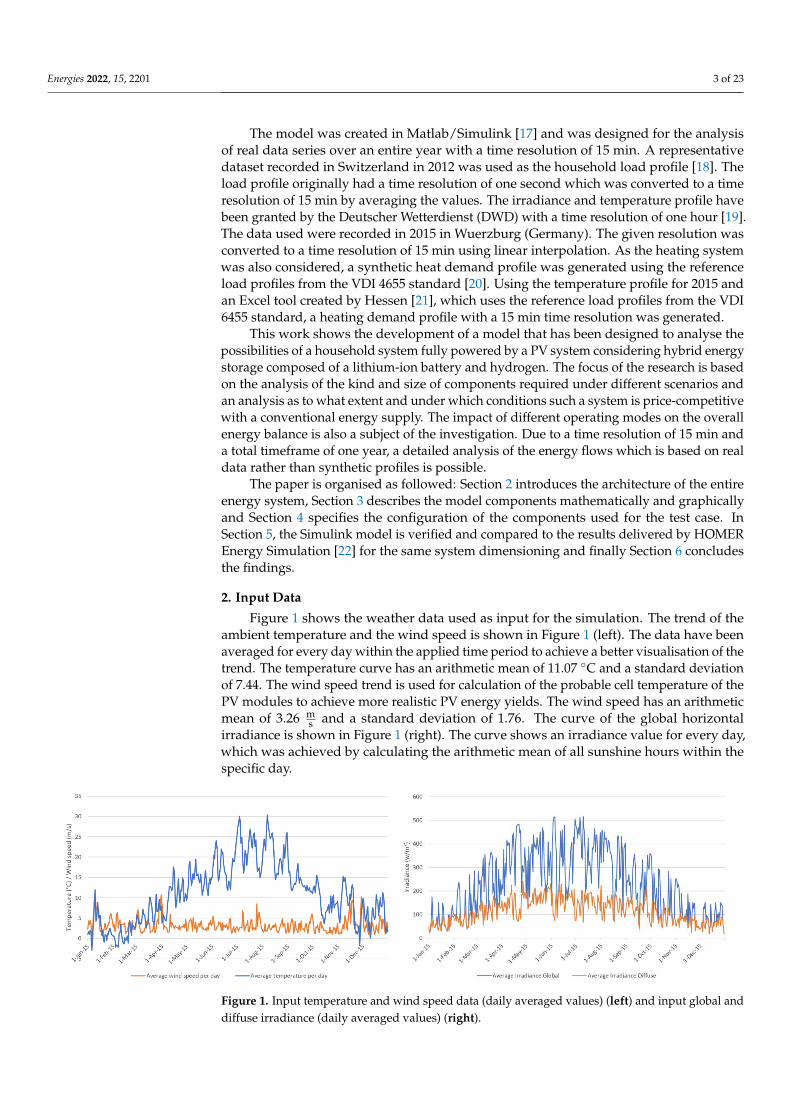
Figure 2. Input heat demand profile (left) and electrical load curve (right) over one year.
3. System Architecture and Control System
Within this section, the hybrid energy system, the functions of the individual com-
ponents and the control procedure are qualitatively described. The core elements of the
energy system model are a fuel cell (FC), an electrolyser, a lithium-ion battery, a hydrogen
storage tank and a PV system.
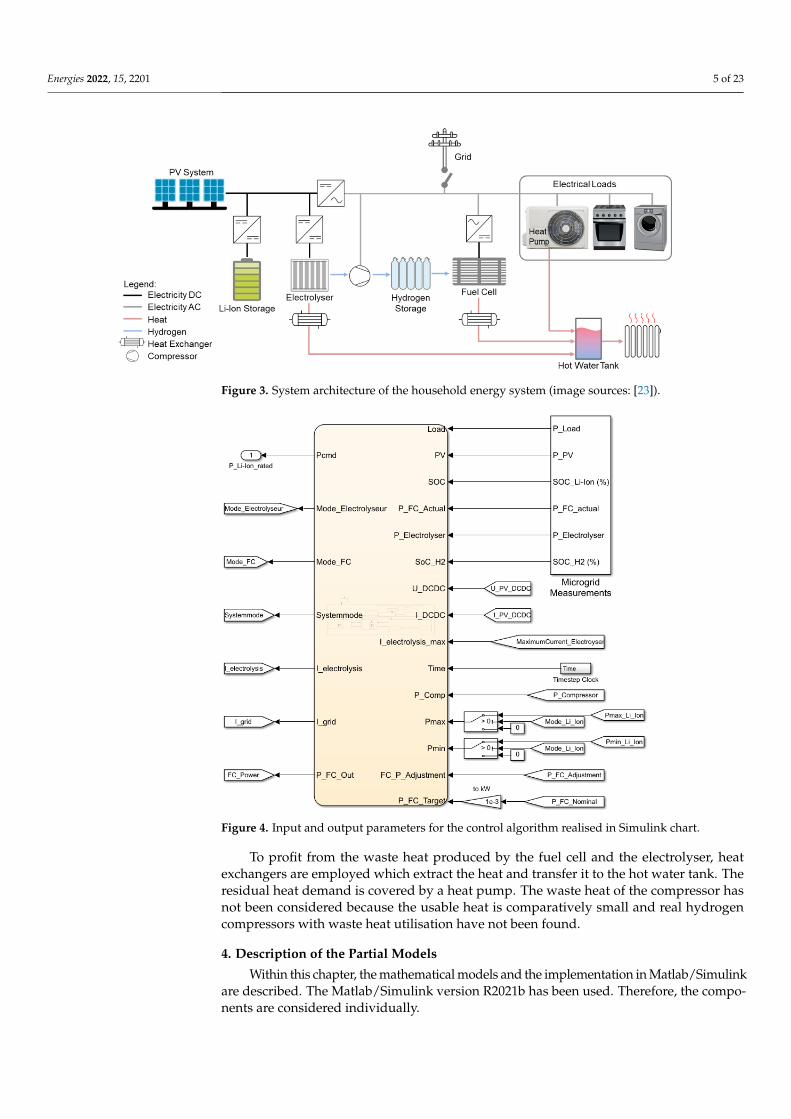
Figure 3 shows the architecture of the proposed energy system. The PV system serves
as the main energy source. With an inverter, the produced solar energy can directly be
used for the electrical loads in the household (direct consumption). The surplus energy is
stored in the lithium-ion battery by passing a DC/DC converter as a charge controller, and
the energy is transferred back to the household grid via an inverter in case of less energy
production than demand. If the lithium-ion battery is fully charged and the solar energy
still exceeds the electricity demand, the electrolyser is switched on and hydrogen is pro-
duced by the surplus energy. After passing a compressor, the hydrogen is stored inside
the hydrogen tank. In case of high electricity demand in combination with low energy
production and an empty lithium-ion battery, the fuel cell is switched on. The fuel cell
operates at constant power and acts as an electricity supplier for electrical loads. Since
only the lithium-ion battery can deal with load peaks, the fuel cell switches on even before
the lithium-ion battery is completely empty. So, the lithium-ion battery works as a buffer
and is also charged by the residual energy delivered by the fuel cell in case of lower energy
consumption than is delivered by the fuel cell and as long as the state of charge (SoC) of
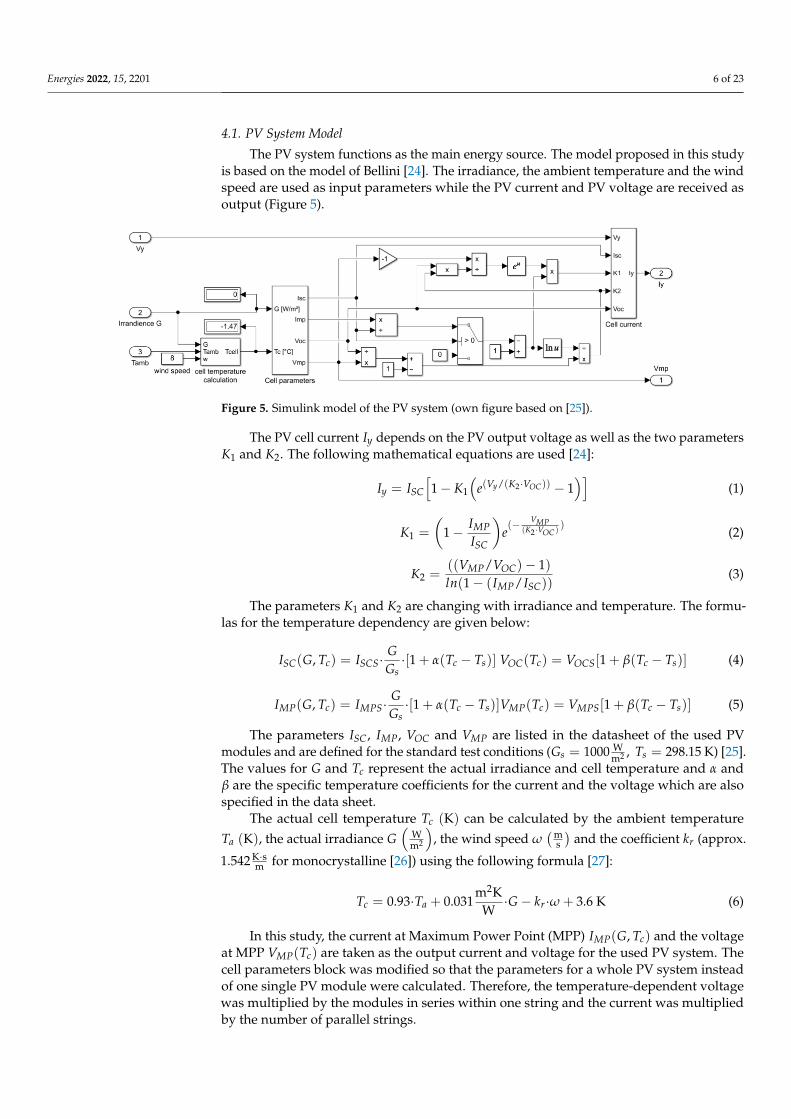
the lithium-ion battery does not reach a predefined state. A simple control algorithm via
Simulink chart is used to control the energy flow. Figure 4 shows the input and output
parameters that are involved in the control algorithm, which has been qualitatively de-
scribed before.
Figure 1. Input temperature and wind speed data (daily averaged values) (left) and input global anddiffuse irradiance (daily averaged values) (right).
Energies 2022, 15, 2201 4 of 23
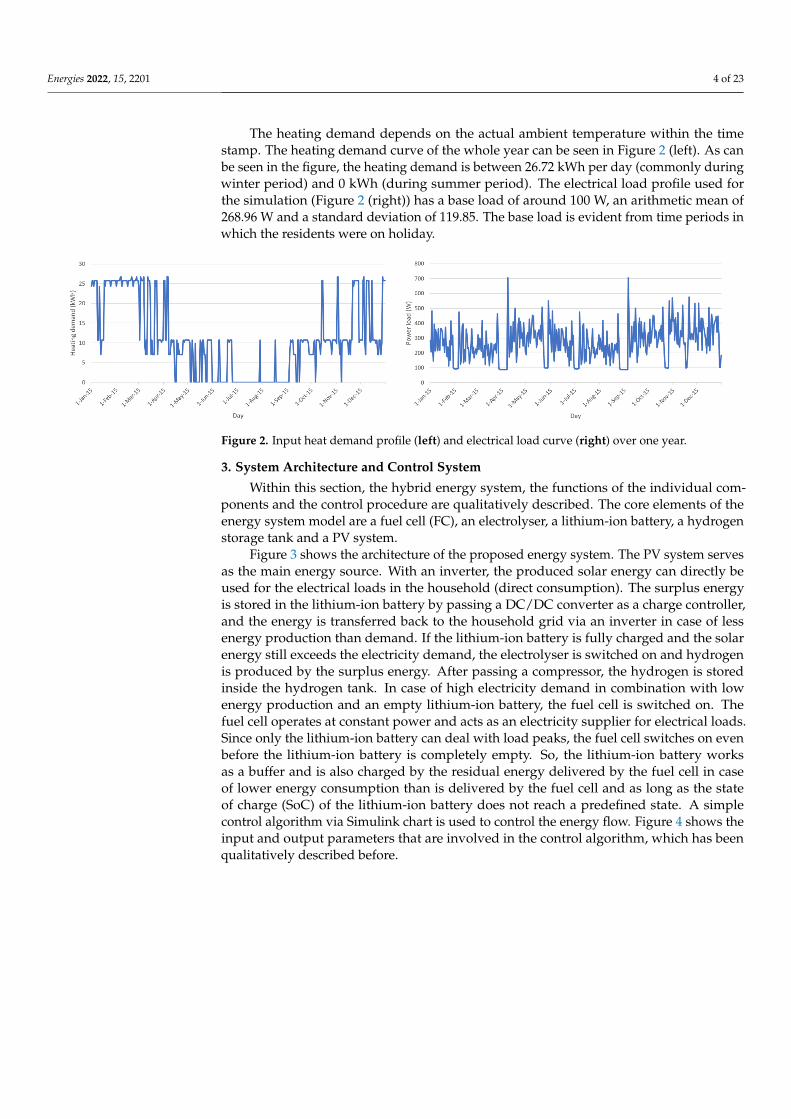
The heating demand depends on the actual ambient temperature within the timestamp. The heating demand curve of the whole year can be seen in Figure 2 (left). As canbe seen in the figure, the heating demand is between 26.72 kWh per day (commonly duringwinter period) and 0 kWh (during summer period). The electrical load profile used forthe simulation (Figure 2 (right)) has a base load of around 100 W, an arithmetic mean of268.96 W and a standard deviation of 119.85. The base load is evident from time periods inwhich the residents were on holiday.
Energies 2022, 15, x FOR PEER REVIEW 4 of 24
Figure 1. Input temperature and wind speed data (daily averaged values) (left) and input global
and diffuse irradiance (daily averaged values) (right).
Figure 2. Input heat demand profile (left) and electrical load curve (right) over one year.
3. System Architecture and Control System
Within this section, the hybrid energy system, the functions of the individual com-
ponents and the control procedure are qualitatively described. The core elements of the
energy system model are a fuel cell (FC), an electrolyser, a lithium-ion battery, a hydrogen
storage tank and a PV system.
Figure 3 shows the architecture of the proposed energy system. The PV system serves
as the main energy source. With an inverter, the produced solar energy can directly be
used for the electrical loads in the household (direct consumption). The surplus energy is
stored in the lithium-ion battery by passing a DC/DC converter as a charge controller, and
the energy is transferred back to the household grid via an inverter in case of less energy
production than demand. If the lithium-ion battery is fully charged and the solar energy
still exceeds the electricity demand, the electrolyser is switched on and hydrogen is pro-
duced by the surplus energy. After passing a compressor, the hydrogen is stored inside
the hydrogen tank. In case of high electricity demand in combination with low energy
production and an empty lithium-ion battery, the fuel cell is switched on. The fuel cell
operates at constant power and acts as an electricity supplier for electrical loads. Since
only the lithium-ion battery can deal with load peaks, the fuel cell switches on even before
the lithium-ion battery is completely empty. So, the lithium-ion battery works as a buffer
and is also charged by the residual energy delivered by the fuel cell in case of lower energy
consumption than is delivered by the fuel cell and as long as the state of charge (SoC) of
the lithium-ion battery does not reach a predefined state. A simple control algorithm via
Simulink chart is used to control the energy flow. Figure 4 shows the input and output
parameters that are involved in the control algorithm, which has been qualitatively de-
scribed before.
Figure 2. Input heat demand profile (left) and electrical load curve (right) over one year.
3. System Architecture and Control System
Within this section, the hybrid energy system, the functions of the individual com-ponents and the control procedure are qualitatively described. The core elements of theenergy system model are a fuel cell (FC), an electrolyser, a lithium-ion battery, a hydrogenstorage tank and a PV system.
Figure 3 shows the architecture of the proposed energy system. The PV system servesas the main energy source. With an inverter, the produced solar energy can directly beused for the electrical loads in the household (direct consumption). The surplus energyis stored in the lithium-ion battery by passing a DC/DC converter as a charge controller,and the energy is transferred back to the household grid via an inverter in case of lessenergy production than demand. If the lithium-ion battery is fully charged and the solarenergy still exceeds the electricity demand, the electrolyser is switched on and hydrogenis produced by the surplus energy. After passing a compressor, the hydrogen is storedinside the hydrogen tank. In case of high electricity demand in combination with lowenergy production and an empty lithium-ion battery, the fuel cell is switched on. Thefuel cell operates at constant power and acts as an electricity supplier for electrical loads.Since only the lithium-ion battery can deal with load peaks, the fuel cell switches on evenbefore the lithium-ion battery is completely empty. So, the lithium-ion battery worksas a buffer and is also charged by the residual energy delivered by the fuel cell in caseof lower energy consumption than is delivered by the fuel cell and as long as the stateof charge (SoC) of the lithium-ion battery does not reach a predefined state. A simplecontrol algorithm via Simulink chart is used to control the energy flow. Figure 4 shows theinput and output parameters that are involved in the control algorithm, which has beenqualitatively described before.
Energies 2022, 15, 2201 5 of 23Energies 2022, 15, x FOR PEER REVIEW 5 of 24
Figure 3. System architecture of the household energy system (image sources: [23]).
Figure 4. Input and output parameters for the control algorithm realised in Simulink chart.
To profit from the waste heat produced by the fuel cell and the electrolyser, heat
exchangers are employed which extract the heat and transfer it to the hot water tank. The
residual heat demand is covered by a heat pump. The waste heat of the compressor has
not been considered because the usable heat is comparatively small and real hydrogen
compressors with waste heat utilisation have not been found.
4. Description of the Partial Models
Within this chapter, the mathematical models and the implementation in
Matlab/Simulink are described. The Matlab/Simulink version R2021b has been used.
Therefore, the components are considered individually.
Figure 3. System architecture of the household energy system (image sources: [23]).
Energies 2022, 15, x FOR PEER REVIEW 5 of 24
Figure 3. System architecture of the household energy system (image sources: [23]).
Figure 4. Input and output parameters for the control algorithm realised in Simulink chart.
To profit from the waste heat produced by the fuel cell and the electrolyser, heat
exchangers are employed which extract the heat and transfer it to the hot water tank. The
residual heat demand is covered by a heat pump. The waste heat of the compressor has
not been considered because the usable heat is comparatively small and real hydrogen
compressors with waste heat utilisation have not been found.
4. Description of the Partial Models
Within this chapter, the mathematical models and the implementation in
Matlab/Simulink are described. The Matlab/Simulink version R2021b has been used.
Therefore, the components are considered individually.
Figure 4. Input and output parameters for the control algorithm realised in Simulink chart.
To profit from the waste heat produced by the fuel cell and the electrolyser, heatexchangers are employed which extract the heat and transfer it to the hot water tank. Theresidual heat demand is covered by a heat pump. The waste heat of the compressor hasnot been considered because the usable heat is comparatively small and real hydrogencompressors with waste heat utilisation have not been found.
4. Description of the Partial Models
Within this chapter, the mathematical models and the implementation in Matlab/Simulinkare described. The Matlab/Simulink version R2021b has been used. Therefore, the compo-nents are considered individually.
Energies 2022, 15, 2201 6 of 23
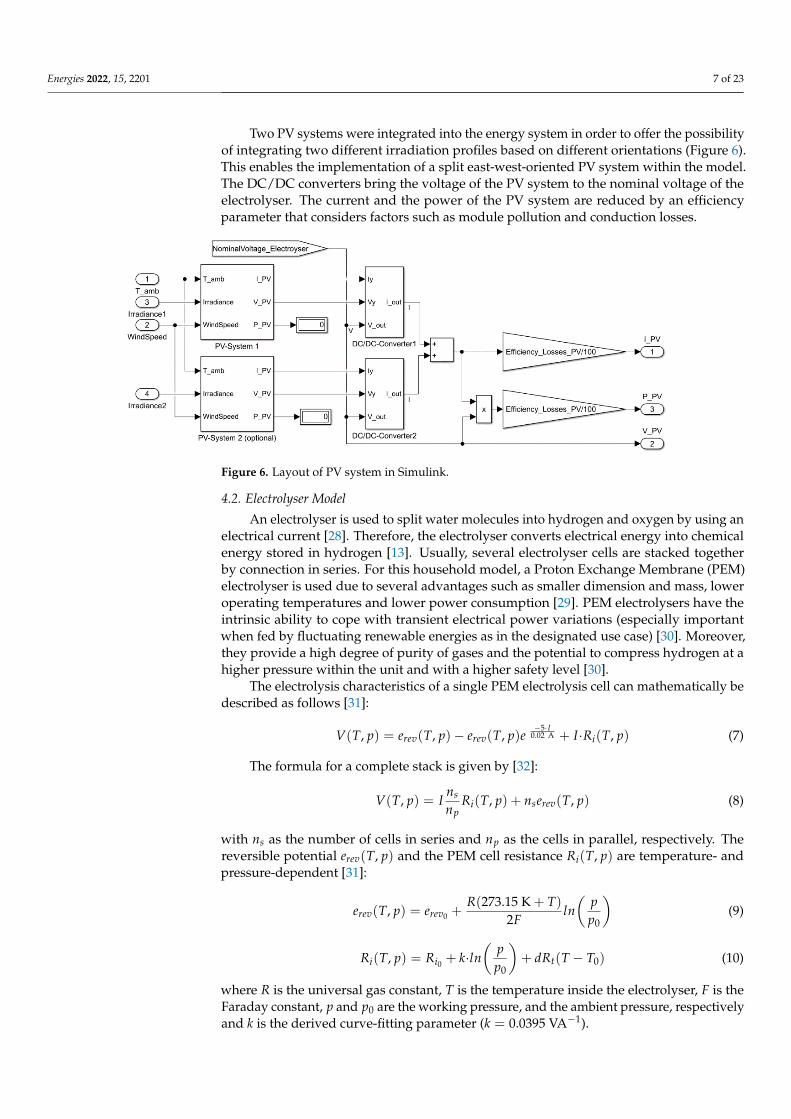
4.1. PV System Model
The PV system functions as the main energy source. The model proposed in this studyis based on the model of Bellini [24]. The irradiance, the ambient temperature and the windspeed are used as input parameters while the PV current and PV voltage are received asoutput (Figure 5).
Energies 2022, 15, x FOR PEER REVIEW 6 of 24
4.1. PV System Model
The PV system functions as the main energy source. The model proposed in this
study is based on the model of Bellini [24]. The irradiance, the ambient temperature and
the wind speed are used as input parameters while the PV current and PV voltage are
received as output (Figure 5).
Figure 5. Simulink model of the PV system (own figure based on [25]).
The PV cell current 𝐼𝑦 depends on the PV output voltage as well as the two param-
eters 𝐾1 and 𝐾2. The following mathematical equations are used [24]:
𝐼𝑦 = 𝐼𝑆𝐶 [1 − 𝐾1 (𝑒(𝑉𝑦/(𝐾2∙𝑉𝑂𝐶)) − 1)] (1)
𝐾1 = (1 −𝐼𝑀𝑃
𝐼𝑆𝐶) 𝑒
(−𝑉𝑀𝑃
(𝐾2∙𝑉𝑂𝐶)) (2)
𝐾2 =((𝑉𝑀𝑃/𝑉𝑂𝐶) − 1)
𝑙𝑛(1 − (𝐼𝑀𝑃/𝐼𝑆𝐶)) (3)
The parameters 𝐾1 and 𝐾2 are changing with irradiance and temperature. The for-
mulas for the temperature dependency are given below:
𝐼𝑆𝐶(𝐺, 𝑇𝑐) = 𝐼𝑆𝐶𝑆 ∙𝐺
𝐺𝑠∙ [1 + 𝛼(𝑇𝑐 − 𝑇𝑠)] 𝑉𝑂𝐶(𝑇𝑐) = 𝑉𝑂𝐶𝑆[1 + 𝛽(𝑇𝑐 − 𝑇𝑠)] (4)
𝐼𝑀𝑃(𝐺, 𝑇𝑐) = 𝐼𝑀𝑃𝑆 ∙𝐺
𝐺𝑠∙ [1 + 𝛼(𝑇𝑐 − 𝑇𝑠)] 𝑉𝑀𝑃(𝑇𝑐) = 𝑉𝑀𝑃𝑆[1 + 𝛽(𝑇𝑐 − 𝑇𝑠)]
(5)
The parameters 𝐼𝑆𝐶 , 𝐼𝑀𝑃 , 𝑉𝑂𝐶 and 𝑉𝑀𝑃 are listed in the datasheet of the used PV
modules and are defined for the standard test conditions (𝐺𝑠 = 1000W
m2 , 𝑇𝑠 = 298.15 K)
[25]. The values for 𝐺 and 𝑇𝑐 represent the actual irradiance and cell temperature and 𝛼
and 𝛽 are the specific temperature coefficients for the current and the voltage which are
also specified in the data sheet.
The actual cell temperature 𝑇𝑐 (K) can be calculated by the ambient temperature
𝑇𝑎 (K), the actual irradiance 𝐺 (W
m2), the wind speed 𝜔 (m
s) and the coefficient 𝑘𝑟 (ap-
prox. 1.542K∙s
m for monocrystalline [26]) using the following formula [27]:
𝑇𝑐 = 0.93 ∙ 𝑇𝑎 + 0.031m2K
W∙ 𝐺 − 𝑘𝑟 ∙ 𝜔 + 3.6 K (6)
In this study, the current at Maximum Power Point (MPP) 𝐼𝑀𝑃(𝐺, 𝑇𝑐) and the voltage
at MPP 𝑉𝑀𝑃(𝑇𝑐) are taken as the output current and voltage for the used PV system. The
cell parameters block was modified so that the parameters for a whole PV system instead
of one single PV module were calculated. Therefore, the temperature-dependent voltage
was multiplied by the modules in series within one string and the current was multiplied
by the number of parallel strings.
Two PV systems were integrated into the energy system in order to offer the possi-
bility of integrating two different irradiation profiles based on different orientations (Fig-
ure 6). This enables the implementation of a split east-west-oriented PV system within the
model. The DC/DC converters bring the voltage of the PV system to the nominal voltage
Figure 5. Simulink model of the PV system (own figure based on [25]).
The PV cell current Iy depends on the PV output voltage as well as the two parametersK1 and K2. The following mathematical equations are used [24]:
Iy = ISC
[1 − K1
(e(Vy/(K2·VOC)) − 1
)](1)
K1 =
(1 − IMP
ISC
)e(− VMP
(K2 ·VOC))
(2)
K2 =((VMP/VOC)− 1)ln(1 − (IMP/ISC))
(3)
The parameters K1 and K2 are changing with irradiance and temperature. The formu-las for the temperature dependency are given below:
ISC(G, Tc) = ISCS·GGs
·[1 + α(Tc − Ts)] VOC(Tc) = VOCS[1 + β(Tc − Ts)] (4)
IMP(G, Tc) = IMPS·GGs
·[1 + α(Tc − Ts)]VMP(Tc) = VMPS[1 + β(Tc − Ts)] (5)
The parameters ISC, IMP, VOC and VMP are listed in the datasheet of the used PVmodules and are defined for the standard test conditions (Gs = 1000 W
m2 , Ts = 298.15 K) [25].The values for G and Tc represent the actual irradiance and cell temperature and α andβ are the specific temperature coefficients for the current and the voltage which are alsospecified in the data sheet.
The actual cell temperature Tc (K) can be calculated by the ambient temperatureTa (K), the actual irradiance G
(Wm2
), the wind speed ω
(ms)
and the coefficient kr (approx.
1.542 K·sm for monocrystalline [26]) using the following formula [27]:
Tc = 0.93·Ta + 0.031m2K
W·G − kr·ω + 3.6 K (6)
In this study, the current at Maximum Power Point (MPP) IMP(G, Tc) and the voltageat MPP VMP(Tc) are taken as the output current and voltage for the used PV system. Thecell parameters block was modified so that the parameters for a whole PV system insteadof one single PV module were calculated. Therefore, the temperature-dependent voltagewas multiplied by the modules in series within one string and the current was multipliedby the number of parallel strings.
Energies 2022, 15, 2201 7 of 23
Two PV systems were integrated into the energy system in order to offer the possibilityof integrating two different irradiation profiles based on different orientations (Figure 6).This enables the implementation of a split east-west-oriented PV system within the model.The DC/DC converters bring the voltage of the PV system to the nominal voltage of theelectrolyser. The current and the power of the PV system are reduced by an efficiencyparameter that considers factors such as module pollution and conduction losses.
Energies 2022, 15, x FOR PEER REVIEW 7 of 24
of the electrolyser. The current and the power of the PV system are reduced by an effi-
ciency parameter that considers factors such as module pollution and conduction losses.
Figure 6. Layout of PV system in Simulink.
4.2. Electrolyser Model
An electrolyser is used to split water molecules into hydrogen and oxygen by using
an electrical current [28]. Therefore, the electrolyser converts electrical energy into chem-
ical energy stored in hydrogen [13]. Usually, several electrolyser cells are stacked together
by connection in series. For this household model, a Proton Exchange Membrane (PEM)
electrolyser is used due to several advantages such as smaller dimension and mass, lower
operating temperatures and lower power consumption [29]. PEM electrolysers have the
intrinsic ability to cope with transient electrical power variations (especially important
when fed by fluctuating renewable energies as in the designated use case) [30]. Moreover,
they provide a high degree of purity of gases and the potential to compress hydrogen at
a higher pressure within the unit and with a higher safety level [30].
The electrolysis characteristics of a single PEM electrolysis cell can mathematically
be described as follows [31]:
𝑉(𝑇, 𝑝) = 𝑒𝑟𝑒𝑣(𝑇, 𝑝) − 𝑒𝑟𝑒𝑣(𝑇, 𝑝)𝑒 −5∙𝐼
0.02 A + 𝐼 ∙ 𝑅𝑖(𝑇, 𝑝) (7)
The formula for a complete stack is given by [32]:
𝑉(𝑇, 𝑝) = 𝐼𝑛𝑠
𝑛𝑝𝑅𝑖(𝑇, 𝑝) + 𝑛𝑠𝑒𝑟𝑒𝑣(𝑇, 𝑝) (8)
with 𝑛𝑠 as the number of cells in series and 𝑛𝑝 as the cells in parallel, respectively. The
reversible potential 𝑒𝑟𝑒𝑣(𝑇, 𝑝) and the PEM cell resistance 𝑅𝑖(𝑇, 𝑝) are temperature- and
pressure-dependent [31]:
𝑒𝑟𝑒𝑣(𝑇, 𝑝) = 𝑒𝑟𝑒𝑣0+
𝑅(273.15 K + 𝑇)
2𝐹𝑙𝑛 (
𝑝
𝑝0) (9)
𝑅𝑖(𝑇, 𝑝) = 𝑅𝑖0+ 𝑘 ∙ 𝑙𝑛 (
𝑝
𝑝0) + 𝑑𝑅𝑡(𝑇 − 𝑇0) (10)
where 𝑅 is the universal gas constant, 𝑇 is the temperature inside the electrolyser, 𝐹 is
the Faraday constant, 𝑝 and 𝑝0 are the working pressure, and the ambient pressure, re-
spectively and 𝑘 is the derived curve-fitting parameter (𝑘 = 0.0395 VA−1).
The production rate of hydrogen can be calculated according to Faraday’s law. The
production rate of hydrogen inside an electrolyser cell is directly proportional to the trans-
fer rate of electrons at the electrodes [28]. This is equivalent to the electrical current in the
circuit. The formula for the hydrogen production rate is [26,29]:
𝑣𝐻2(m3
s) =
𝑣𝑚∙𝑁𝑐∙𝐼
2𝐹 with 𝑣𝑚(
m3
mol) =
𝑅(273.15 K+𝑇)
𝑝 (11)
Figure 6. Layout of PV system in Simulink.
4.2. Electrolyser Model
An electrolyser is used to split water molecules into hydrogen and oxygen by using anelectrical current [28]. Therefore, the electrolyser converts electrical energy into chemicalenergy stored in hydrogen [13]. Usually, several electrolyser cells are stacked togetherby connection in series. For this household model, a Proton Exchange Membrane (PEM)electrolyser is used due to several advantages such as smaller dimension and mass, loweroperating temperatures and lower power consumption [29]. PEM electrolysers have theintrinsic ability to cope with transient electrical power variations (especially importantwhen fed by fluctuating renewable energies as in the designated use case) [30]. Moreover,they provide a high degree of purity of gases and the potential to compress hydrogen at ahigher pressure within the unit and with a higher safety level [30].
The electrolysis characteristics of a single PEM electrolysis cell can mathematically bedescribed as follows [31]:
V(T, p) = erev(T, p)− erev(T, p)e−5·I
0.02 A + I·Ri(T, p) (7)
The formula for a complete stack is given by [32]:
V(T, p) = Ins
npRi(T, p) + nserev(T, p) (8)
with ns as the number of cells in series and np as the cells in parallel, respectively. Thereversible potential erev(T, p) and the PEM cell resistance Ri(T, p) are temperature- andpressure-dependent [31]:
erev(T, p) = erev0 +R(273.15 K + T)
2Fln(
pp0
)(9)
Ri(T, p) = Ri0 + k·ln(
pp0
)+ dRt(T − T0) (10)
where R is the universal gas constant, T is the temperature inside the electrolyser, F is theFaraday constant, p and p0 are the working pressure, and the ambient pressure, respectivelyand k is the derived curve-fitting parameter (k = 0.0395 VA−1).
Energies 2022, 15, 2201 8 of 23
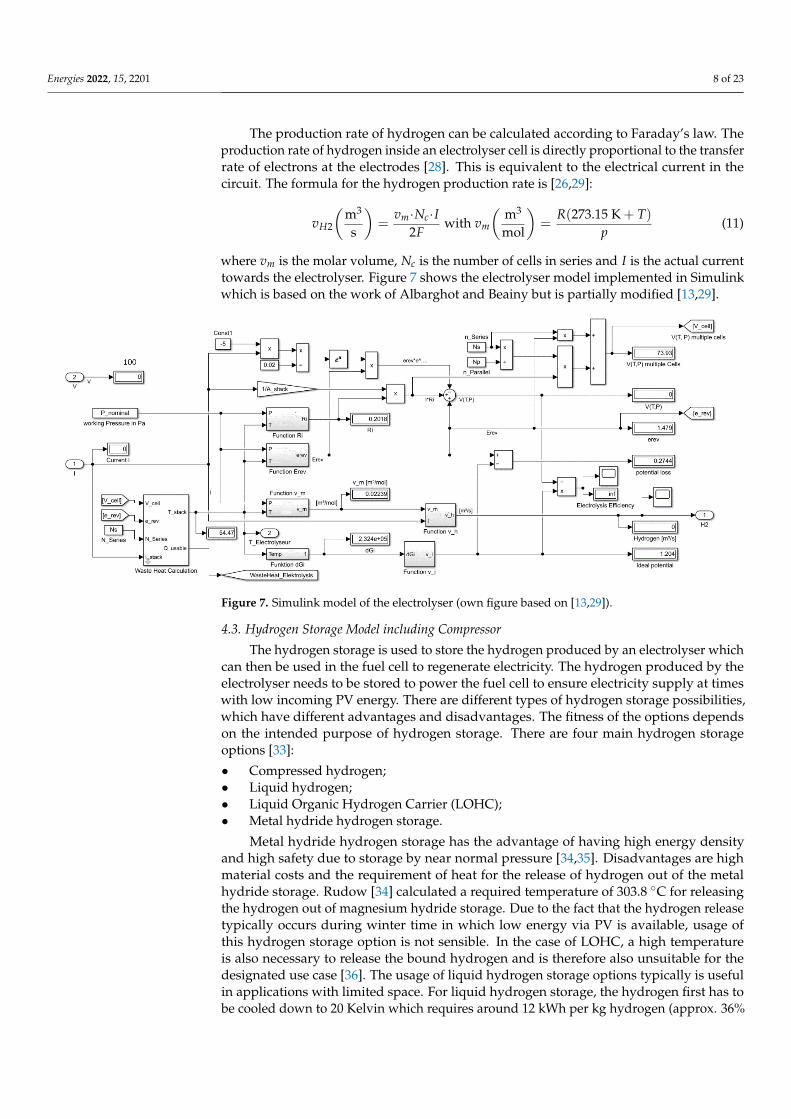
The production rate of hydrogen can be calculated according to Faraday’s law. Theproduction rate of hydrogen inside an electrolyser cell is directly proportional to the transferrate of electrons at the electrodes [28]. This is equivalent to the electrical current in thecircuit. The formula for the hydrogen production rate is [26,29]:
vH2
(m3
s
)=
vm·Nc·I2F
with vm
(m3
mol
)=
R(273.15 K + T)p
(11)
where vm is the molar volume, Nc is the number of cells in series and I is the actual currenttowards the electrolyser. Figure 7 shows the electrolyser model implemented in Simulinkwhich is based on the work of Albarghot and Beainy but is partially modified [13,29].
Energies 2022, 15, x FOR PEER REVIEW 8 of 24
where 𝑣𝑚 is the molar volume, 𝑁𝑐 is the number of cells in series and 𝐼 is the actual cur-
rent towards the electrolyser. Figure 7 shows the electrolyser model implemented in Sim-
ulink which is based on the work of Albarghot and Beainy but is partially modified [13,29].
Figure 7. Simulink model of the electrolyser (own figure based on [13,29]).
4.3. Hydrogen Storage Model including Compressor
The hydrogen storage is used to store the hydrogen produced by an electrolyser
which can then be used in the fuel cell to regenerate electricity. The hydrogen produced
by the electrolyser needs to be stored to power the fuel cell to ensure electricity supply at
times with low incoming PV energy. There are different types of hydrogen storage possi-
bilities, which have different advantages and disadvantages. The fitness of the options
depends on the intended purpose of hydrogen storage. There are four main hydrogen
storage options [33]:
• Compressed hydrogen;
• Liquid hydrogen;
• Liquid Organic Hydrogen Carrier (LOHC);
• Metal hydride hydrogen storage.
Metal hydride hydrogen storage has the advantage of having high energy density
and high safety due to storage by near normal pressure [34,35]. Disadvantages are high
material costs and the requirement of heat for the release of hydrogen out of the metal
hydride storage. Rudow [34] calculated a required temperature of 303.8 °C for releasing
the hydrogen out of magnesium hydride storage. Due to the fact that the hydrogen release
typically occurs during winter time in which low energy via PV is available, usage of this
hydrogen storage option is not sensible. In the case of LOHC, a high temperature is also
necessary to release the bound hydrogen and is therefore also unsuitable for the desig-
nated use case [36]. The usage of liquid hydrogen storage options typically is useful in
applications with limited space. For liquid hydrogen storage, the hydrogen first has to be
cooled down to 20 Kelvin which requires around 12 kWh per kg hydrogen (approx. 36%
of the total 𝐻2 energy content) [33] and is therefore also not suitable for the designated
use case in which energy must be used sparingly.
Compressed hydrogen, on the other hand, is characterised by a lower energy require-
ment than other options. When compressing from 10 bar to 500 bar, for example, approx.
4 kWh per kg of hydrogen is required, which corresponds to around 12% of the H2 en-
ergy content and is therefore significantly less than the energy required for storage as liq-
uid hydrogen [34]. However, compressed hydrogen requires more space, which,
Figure 7. Simulink model of the electrolyser (own figure based on [13,29]).
4.3. Hydrogen Storage Model including Compressor
The hydrogen storage is used to store the hydrogen produced by an electrolyser whichcan then be used in the fuel cell to regenerate electricity. The hydrogen produced by theelectrolyser needs to be stored to power the fuel cell to ensure electricity supply at timeswith low incoming PV energy. There are different types of hydrogen storage possibilities,which have different advantages and disadvantages. The fitness of the options dependson the intended purpose of hydrogen storage. There are four main hydrogen storageoptions [33]:
• Compressed hydrogen;• Liquid hydrogen;• Liquid Organic Hydrogen Carrier (LOHC);• Metal hydride hydrogen storage.
Metal hydride hydrogen storage has the advantage of having high energy densityand high safety due to storage by near normal pressure [34,35]. Disadvantages are highmaterial costs and the requirement of heat for the release of hydrogen out of the metalhydride storage. Rudow [34] calculated a required temperature of 303.8 ◦C for releasingthe hydrogen out of magnesium hydride storage. Due to the fact that the hydrogen releasetypically occurs during winter time in which low energy via PV is available, usage ofthis hydrogen storage option is not sensible. In the case of LOHC, a high temperatureis also necessary to release the bound hydrogen and is therefore also unsuitable for thedesignated use case [36]. The usage of liquid hydrogen storage options typically is usefulin applications with limited space. For liquid hydrogen storage, the hydrogen first has tobe cooled down to 20 Kelvin which requires around 12 kWh per kg hydrogen (approx. 36%
Energies 2022, 15, 2201 9 of 23
of the total H2 energy content) [33] and is therefore also not suitable for the designated usecase in which energy must be used sparingly.
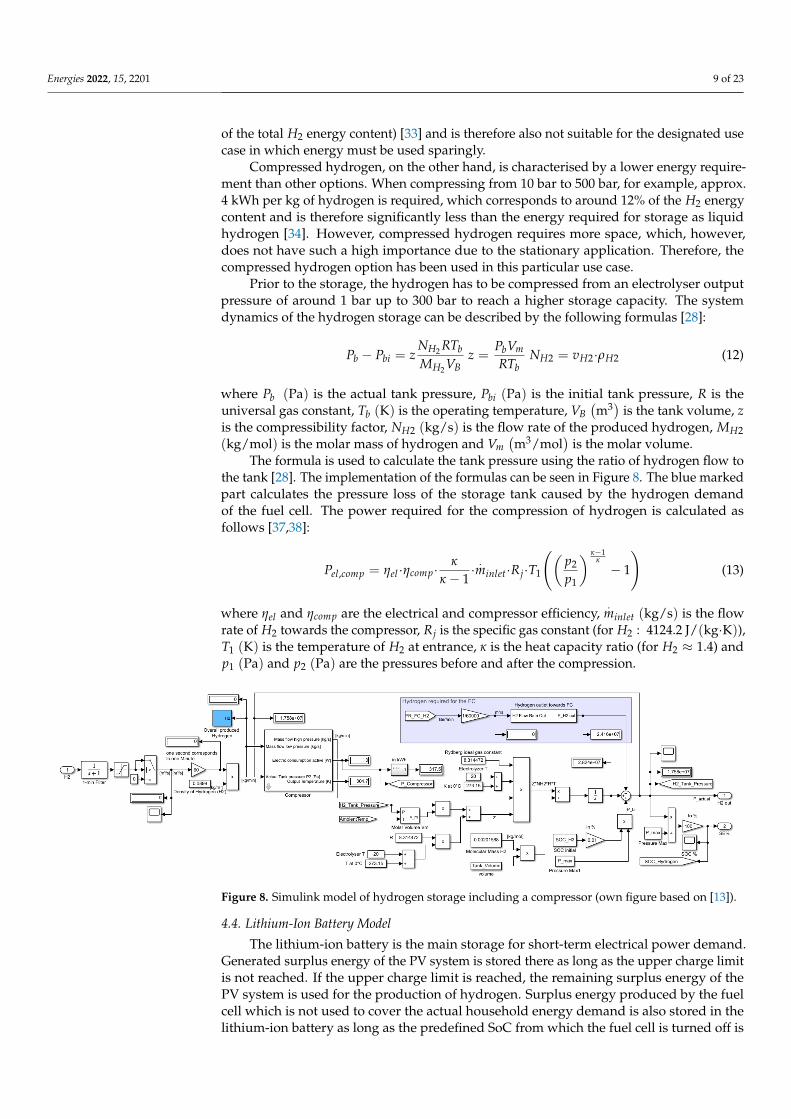
Compressed hydrogen, on the other hand, is characterised by a lower energy require-ment than other options. When compressing from 10 bar to 500 bar, for example, approx.4 kWh per kg of hydrogen is required, which corresponds to around 12% of the H2 energycontent and is therefore significantly less than the energy required for storage as liquidhydrogen [34]. However, compressed hydrogen requires more space, which, however,does not have such a high importance due to the stationary application. Therefore, thecompressed hydrogen option has been used in this particular use case.
Prior to the storage, the hydrogen has to be compressed from an electrolyser outputpressure of around 1 bar up to 300 bar to reach a higher storage capacity. The systemdynamics of the hydrogen storage can be described by the following formulas [28]:
Pb − Pbi = zNH2 RTb
MH2 VBz =
PbVm
RTbNH2 = vH2·ρH2 (12)
where Pb (Pa) is the actual tank pressure, Pbi (Pa) is the initial tank pressure, R is theuniversal gas constant, Tb (K) is the operating temperature, VB
(m3) is the tank volume, z
is the compressibility factor, NH2 (kg/s) is the flow rate of the produced hydrogen, MH2(kg/mol) is the molar mass of hydrogen and Vm
(m3/mol
)is the molar volume.
The formula is used to calculate the tank pressure using the ratio of hydrogen flow tothe tank [28]. The implementation of the formulas can be seen in Figure 8. The blue markedpart calculates the pressure loss of the storage tank caused by the hydrogen demandof the fuel cell. The power required for the compression of hydrogen is calculated asfollows [37,38]:
Pel,comp = ηel ·ηcomp·κ
κ − 1· .minlet·Rj·T1
((p2
p1
) κ−1κ
− 1
)(13)
where ηel and ηcomp are the electrical and compressor efficiency,.
minlet (kg/s) is the flowrate of H2 towards the compressor, Rj is the specific gas constant (for H2 : 4124.2 J/(kg·K)),T1 (K) is the temperature of H2 at entrance, κ is the heat capacity ratio (for H2 ≈ 1.4) andp1 (Pa) and p2 (Pa) are the pressures before and after the compression.
Energies 2022, 15, x FOR PEER REVIEW 9 of 24
however, does not have such a high importance due to the stationary application. There-
fore, the compressed hydrogen option has been used in this particular use case.
Prior to the storage, the hydrogen has to be compressed from an electrolyser output
pressure of around 1 bar up to 300 bar to reach a higher storage capacity. The system
dynamics of the hydrogen storage can be described by the following formulas [28]:
𝑃𝑏 − 𝑃𝑏𝑖 = 𝑧𝑁𝐻2𝑅𝑇𝑏
𝑀𝐻2𝑉𝐵 𝑧 =
𝑃𝑏𝑉𝑚
𝑅𝑇𝑏 𝑁𝐻2 = 𝑣𝐻2 ∙ 𝜌𝐻2
(12)
where 𝑃𝑏 (Pa) is the actual tank pressure, 𝑃𝑏𝑖 (Pa) is the initial tank pressure, 𝑅 is the
universal gas constant, 𝑇𝑏 (K) is the operating temperature, 𝑉𝐵 (m3) is the tank volume,
𝑧 is the compressibility factor, 𝑁𝐻2 (kg s⁄ ) is the flow rate of the produced hydrogen, 𝑀𝐻2
(kg mol⁄ ) is the molar mass of hydrogen and 𝑉𝑚 (m3 mol⁄ ) is the molar volume.
The formula is used to calculate the tank pressure using the ratio of hydrogen flow
to the tank [28]. The implementation of the formulas can be seen in Figure 8. The blue
marked part calculates the pressure loss of the storage tank caused by the hydrogen de-
mand of the fuel cell. The power required for the compression of hydrogen is calculated
as follows [37,38]:
𝑃𝑒𝑙,𝑐𝑜𝑚𝑝 = 𝜂𝑒𝑙 ∙ 𝜂𝑐𝑜𝑚𝑝 ∙𝜅
𝜅 − 1∙ �̇�𝑖𝑛𝑙𝑒𝑡 ∙ 𝑅𝑗 ∙ 𝑇1 ((
𝑝2
𝑝1)
𝜅−1𝜅
− 1) (13)
where 𝜂𝑒𝑙 and 𝜂𝑐𝑜𝑚𝑝 are the electrical and compressor efficiency, �̇�𝑖𝑛𝑙𝑒𝑡 (kg s⁄ ) is the
flow rate of 𝐻2 towards the compressor, 𝑅𝑗 is the specific gas constant (for H2: 4124.2 J/
(kg ∙ K)), 𝑇1 (K) is the temperature of 𝐻2 at entrance, 𝜅 is the heat capacity ratio (for
H2 ≈ 1.4) and 𝑝1 (Pa) and 𝑝2 (Pa) are the pressures before and after the compression.
Figure 8. Simulink model of hydrogen storage including a compressor (own figure based on [13]).
4.4. Lithium-Ion Battery Model
The lithium-ion battery is the main storage for short-term electrical power demand.
Generated surplus energy of the PV system is stored there as long as the upper charge
limit is not reached. If the upper charge limit is reached, the remaining surplus energy of
the PV system is used for the production of hydrogen. Surplus energy produced by the
fuel cell which is not used to cover the actual household energy demand is also stored in
the lithium-ion battery as long as the predefined SoC from which the fuel cell is turned
off is not reached. The stored energy is used to cover the energy demand within time
periods of insufficient PV supply (such as during night time, cloud cover or very high
energy demand) and during occurrence of rapid load changes during periods of time
where the fuel cell is activated. Since the lithium-ion battery has less storage capacity than
the hydrogen tank, it is therefore only used for short-term energy demand. The key pa-
rameter which has to be considered for energy autonomous operation is the maximum
energy provided during the considered time period. This parameter depends on house-
hold’s electrical loads and the energy usage preferences of the fitted household.
Figure 8. Simulink model of hydrogen storage including a compressor (own figure based on [13]).
4.4. Lithium-Ion Battery Model
The lithium-ion battery is the main storage for short-term electrical power demand.Generated surplus energy of the PV system is stored there as long as the upper charge limitis not reached. If the upper charge limit is reached, the remaining surplus energy of thePV system is used for the production of hydrogen. Surplus energy produced by the fuelcell which is not used to cover the actual household energy demand is also stored in thelithium-ion battery as long as the predefined SoC from which the fuel cell is turned off is
Energies 2022, 15, 2201 10 of 23
not reached. The stored energy is used to cover the energy demand within time periods ofinsufficient PV supply (such as during night time, cloud cover or very high energy demand)and during occurrence of rapid load changes during periods of time where the fuel cell isactivated. Since the lithium-ion battery has less storage capacity than the hydrogen tank, itis therefore only used for short-term energy demand. The key parameter which has to beconsidered for energy autonomous operation is the maximum energy provided during theconsidered time period. This parameter depends on household’s electrical loads and theenergy usage preferences of the fitted household.
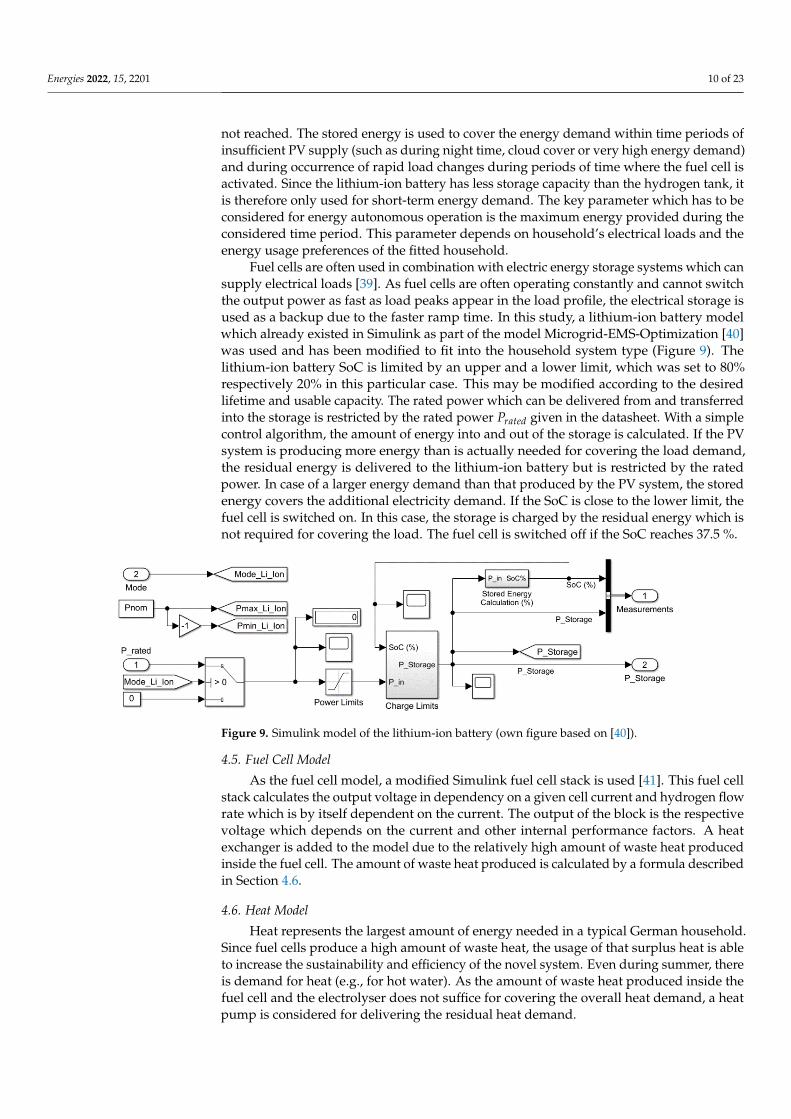
Fuel cells are often used in combination with electric energy storage systems which cansupply electrical loads [39]. As fuel cells are often operating constantly and cannot switchthe output power as fast as load peaks appear in the load profile, the electrical storage isused as a backup due to the faster ramp time. In this study, a lithium-ion battery modelwhich already existed in Simulink as part of the model Microgrid-EMS-Optimization [40]was used and has been modified to fit into the household system type (Figure 9). Thelithium-ion battery SoC is limited by an upper and a lower limit, which was set to 80%respectively 20% in this particular case. This may be modified according to the desiredlifetime and usable capacity. The rated power which can be delivered from and transferredinto the storage is restricted by the rated power Prated given in the datasheet. With a simplecontrol algorithm, the amount of energy into and out of the storage is calculated. If the PVsystem is producing more energy than is actually needed for covering the load demand,the residual energy is delivered to the lithium-ion battery but is restricted by the ratedpower. In case of a larger energy demand than that produced by the PV system, the storedenergy covers the additional electricity demand. If the SoC is close to the lower limit, thefuel cell is switched on. In this case, the storage is charged by the residual energy which isnot required for covering the load. The fuel cell is switched off if the SoC reaches 37.5 %.
Energies 2022, 15, x FOR PEER REVIEW 10 of 24
Fuel cells are often used in combination with electric energy storage systems which
can supply electrical loads [39]. As fuel cells are often operating constantly and cannot
switch the output power as fast as load peaks appear in the load profile, the electrical
storage is used as a backup due to the faster ramp time. In this study, a lithium-ion battery
model which already existed in Simulink as part of the model Microgrid-EMS-Optimiza-
tion [40] was used and has been modified to fit into the household system type (Figure 9).
The lithium-ion battery SoC is limited by an upper and a lower limit, which was set to
80% respectively 20% in this particular case. This may be modified according to the de-
sired lifetime and usable capacity. The rated power which can be delivered from and
transferred into the storage is restricted by the rated power 𝑃𝑟𝑎𝑡𝑒𝑑 given in the datasheet.
With a simple control algorithm, the amount of energy into and out of the storage is cal-
culated. If the PV system is producing more energy than is actually needed for covering
the load demand, the residual energy is delivered to the lithium-ion battery but is re-
stricted by the rated power. In case of a larger energy demand than that produced by the
PV system, the stored energy covers the additional electricity demand. If the SoC is close
to the lower limit, the fuel cell is switched on. In this case, the storage is charged by the
residual energy which is not required for covering the load. The fuel cell is switched off if
the SoC reaches 37.5 %.
Figure 9. Simulink model of the lithium-ion battery (own figure based on [40]).
4.5. Fuel Cell Model
As the fuel cell model, a modified Simulink fuel cell stack is used [41]. This fuel cell
stack calculates the output voltage in dependency on a given cell current and hydrogen
flow rate which is by itself dependent on the current. The output of the block is the re-
spective voltage which depends on the current and other internal performance factors. A
heat exchanger is added to the model due to the relatively high amount of waste heat
produced inside the fuel cell. The amount of waste heat produced is calculated by a for-
mula described in Section 4.6.
4.6. Heat Model
Heat represents the largest amount of energy needed in a typical German household.
Since fuel cells produce a high amount of waste heat, the usage of that surplus heat is able
to increase the sustainability and efficiency of the novel system. Even during summer,
there is demand for heat (e.g., for hot water). As the amount of waste heat produced inside
the fuel cell and the electrolyser does not suffice for covering the overall heat demand, a
heat pump is considered for delivering the residual heat demand.
The waste heat is extracted by using heat exchangers which have two separate circles,
one towards the appropriate component and the second towards the hot water storage.
Due to the decision of using a PEM fuel cell with an operating temperature of in the vi-
cinity of 60 °C, water can be used as a media in the circle towards the fuel cell and also for
the second circle towards the household water storage tank. The PEM electrolyser typi-
cally operates at temperatures of around 60 °C, so water can be used as a media in both
cycles. The temperatures of the fuel cell and the electrolyser are high enough to be used
Figure 9. Simulink model of the lithium-ion battery (own figure based on [40]).
4.5. Fuel Cell Model
As the fuel cell model, a modified Simulink fuel cell stack is used [41]. This fuel cellstack calculates the output voltage in dependency on a given cell current and hydrogen flowrate which is by itself dependent on the current. The output of the block is the respectivevoltage which depends on the current and other internal performance factors. A heatexchanger is added to the model due to the relatively high amount of waste heat producedinside the fuel cell. The amount of waste heat produced is calculated by a formula describedin Section 4.6.
4.6. Heat Model
Heat represents the largest amount of energy needed in a typical German household.Since fuel cells produce a high amount of waste heat, the usage of that surplus heat is ableto increase the sustainability and efficiency of the novel system. Even during summer, thereis demand for heat (e.g., for hot water). As the amount of waste heat produced inside thefuel cell and the electrolyser does not suffice for covering the overall heat demand, a heatpump is considered for delivering the residual heat demand.
Energies 2022, 15, 2201 11 of 23
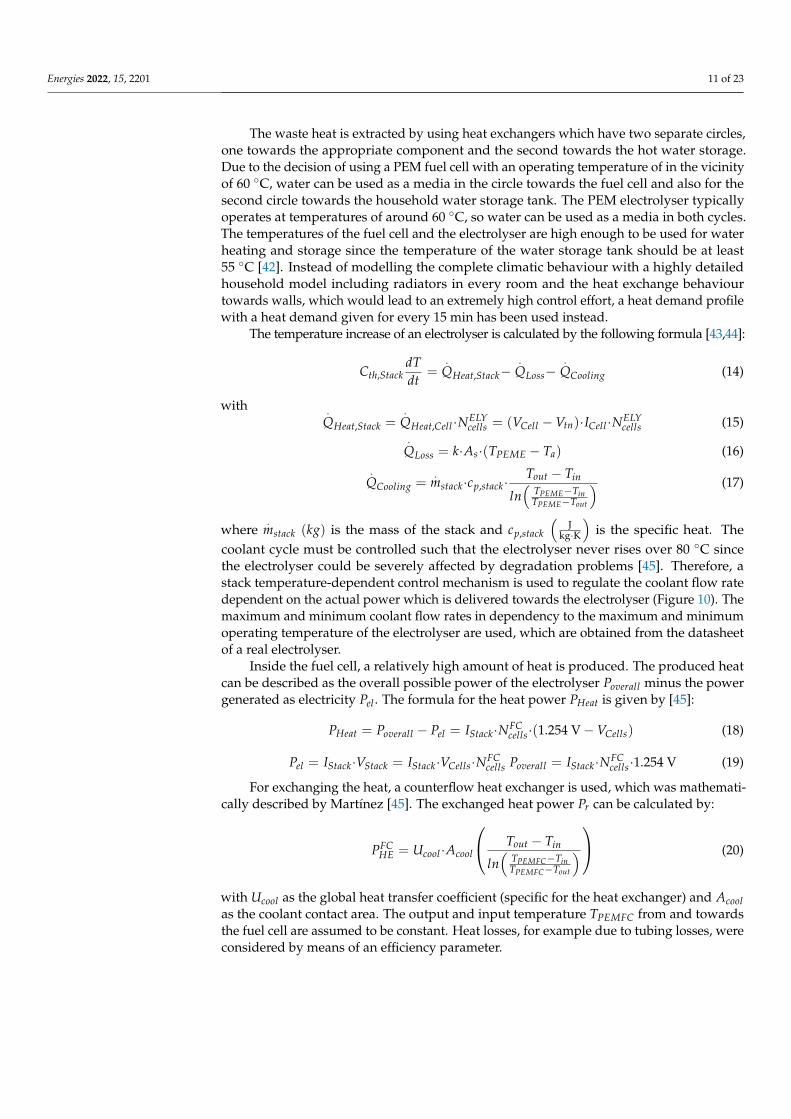
The waste heat is extracted by using heat exchangers which have two separate circles,one towards the appropriate component and the second towards the hot water storage.Due to the decision of using a PEM fuel cell with an operating temperature of in the vicinityof 60 ◦C, water can be used as a media in the circle towards the fuel cell and also for thesecond circle towards the household water storage tank. The PEM electrolyser typicallyoperates at temperatures of around 60 ◦C, so water can be used as a media in both cycles.The temperatures of the fuel cell and the electrolyser are high enough to be used for waterheating and storage since the temperature of the water storage tank should be at least55 ◦C [42]. Instead of modelling the complete climatic behaviour with a highly detailedhousehold model including radiators in every room and the heat exchange behaviourtowards walls, which would lead to an extremely high control effort, a heat demand profilewith a heat demand given for every 15 min has been used instead.
The temperature increase of an electrolyser is calculated by the following formula [43,44]:
Cth,StackdTdt
=.
QHeat,Stack−.
QLoss−.
QCooling (14)
with .QHeat,Stack =
.QHeat,Cell ·NELY
cells = (VCell − Vtn)·ICell ·NELYcells (15)
.QLoss = k·As·(TPEME − Ta) (16)
.QCooling =
.mstack·cp,stack·
Tout − Tin
ln(
TPEME−TinTPEME−Tout
) (17)
where.
mstack (kg) is the mass of the stack and cp,stack
(J
kg·K
)is the specific heat. The
coolant cycle must be controlled such that the electrolyser never rises over 80 ◦C sincethe electrolyser could be severely affected by degradation problems [45]. Therefore, astack temperature-dependent control mechanism is used to regulate the coolant flow ratedependent on the actual power which is delivered towards the electrolyser (Figure 10). Themaximum and minimum coolant flow rates in dependency to the maximum and minimumoperating temperature of the electrolyser are used, which are obtained from the datasheetof a real electrolyser.
Inside the fuel cell, a relatively high amount of heat is produced. The produced heatcan be described as the overall possible power of the electrolyser Poverall minus the powergenerated as electricity Pel . The formula for the heat power PHeat is given by [45]:
PHeat = Poverall − Pel = IStack·NFCcells·(1.254 V − VCells) (18)
Pel = IStack·VStack = IStack·VCells·NFCcells Poverall = IStack·NFC
cells·1.254 V (19)
For exchanging the heat, a counterflow heat exchanger is used, which was mathemati-cally described by Martínez [45]. The exchanged heat power Pr can be calculated by:
PFCHE = Ucool ·Acool
Tout − Tin
ln(
TPEMFC−TinTPEMFC−Tout
) (20)
with Ucool as the global heat transfer coefficient (specific for the heat exchanger) and Acoolas the coolant contact area. The output and input temperature TPEMFC from and towardsthe fuel cell are assumed to be constant. Heat losses, for example due to tubing losses, wereconsidered by means of an efficiency parameter.
Energies 2022, 15, 2201 12 of 23
Energies 2022, 15, x FOR PEER REVIEW 12 of 24
for every 15-min step within one whole year. Therefore, a table for COP values at different
ambient temperatures and a sink side temperature of 55 °C as reference is used [46].
Figure 10. Calculation of waste heat generated by the electrolyser including coolant flow rate control
and operating temperature calculation of the electrolyser (some parts based on [41–43]).
Figure 11. Calculation of waste heat energy supplied by the heat exchanger.
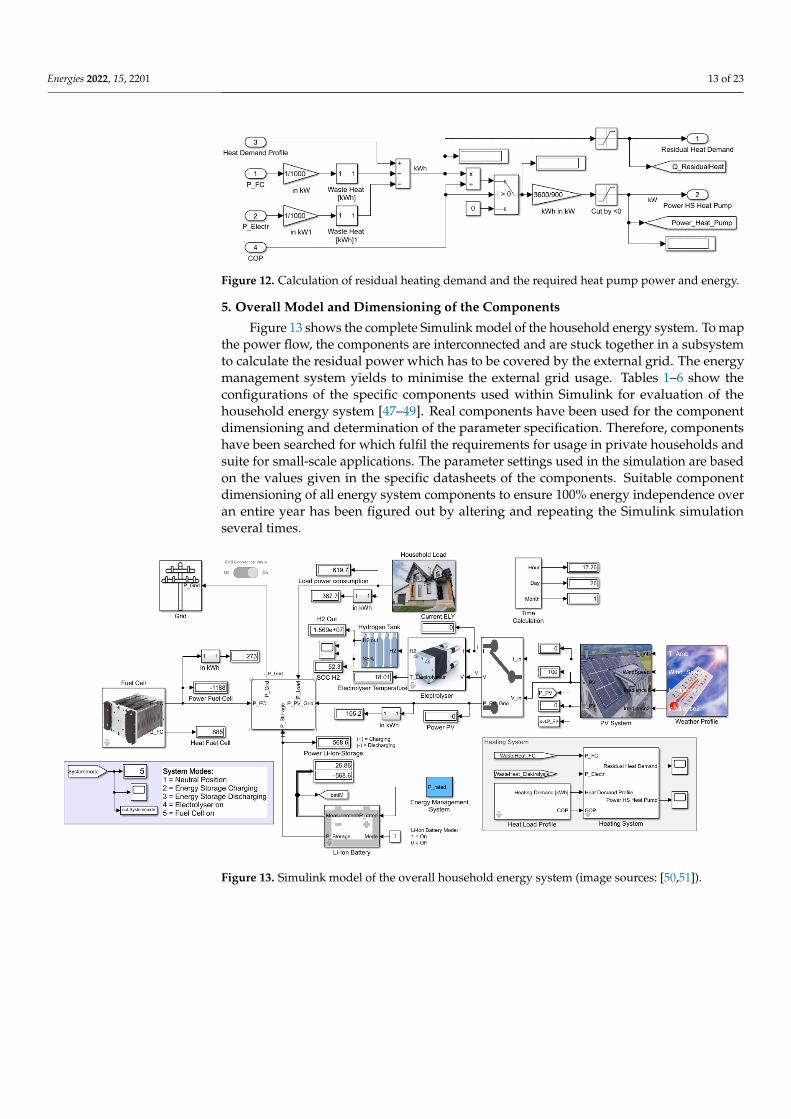
Figure 12. Calculation of residual heating demand and the required heat pump power and energy.
5. Overall Model and Dimensioning of the Components
Figure 13 shows the complete Simulink model of the household energy system. To
map the power flow, the components are interconnected and are stuck together in a sub-
system to calculate the residual power which has to be covered by the external grid. The
energy management system yields to minimise the external grid usage. Tables 1–6 show
the configurations of the specific components used within Simulink for evaluation of the
Figure 10. Calculation of waste heat generated by the electrolyser including coolant flow rate controland operating temperature calculation of the electrolyser (some parts based on [41–43]).
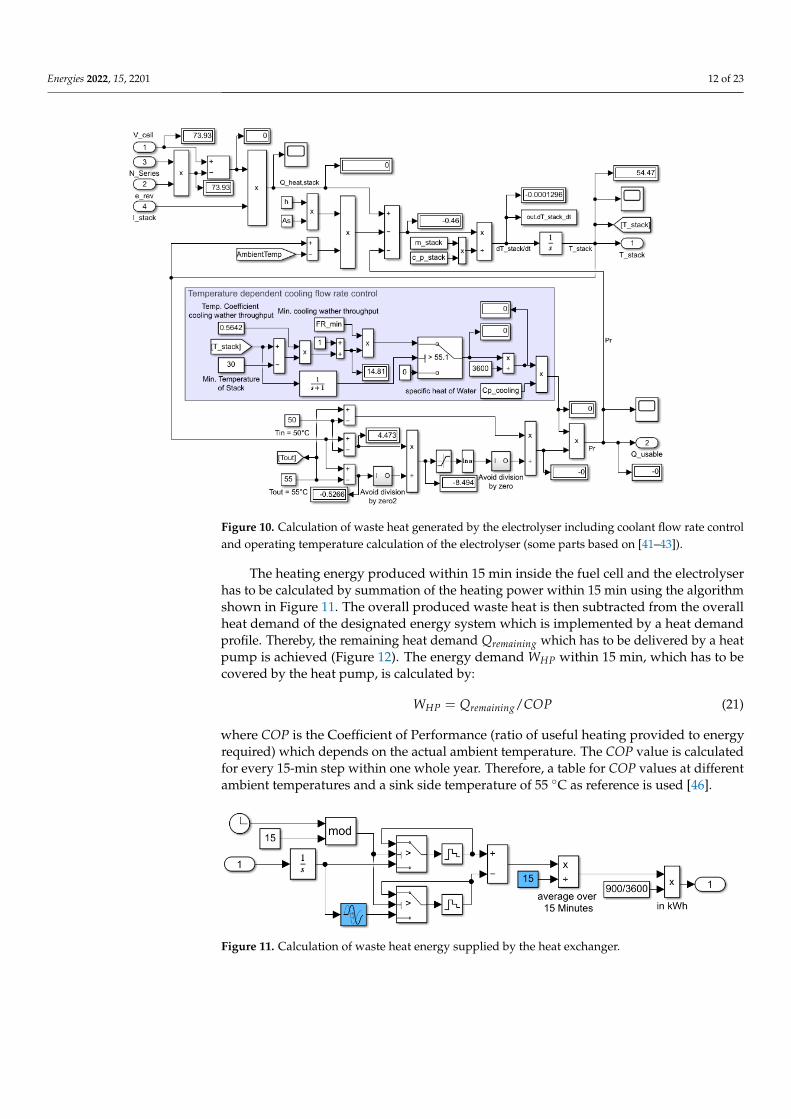
The heating energy produced within 15 min inside the fuel cell and the electrolyserhas to be calculated by summation of the heating power within 15 min using the algorithmshown in Figure 11. The overall produced waste heat is then subtracted from the overallheat demand of the designated energy system which is implemented by a heat demandprofile. Thereby, the remaining heat demand Qremaining which has to be delivered by a heatpump is achieved (Figure 12). The energy demand WHP within 15 min, which has to becovered by the heat pump, is calculated by:
WHP = Qremaining/COP (21)
where COP is the Coefficient of Performance (ratio of useful heating provided to energyrequired) which depends on the actual ambient temperature. The COP value is calculatedfor every 15-min step within one whole year. Therefore, a table for COP values at differentambient temperatures and a sink side temperature of 55 ◦C as reference is used [46].
Energies 2022, 15, x FOR PEER REVIEW 12 of 24
for every 15-min step within one whole year. Therefore, a table for COP values at different
ambient temperatures and a sink side temperature of 55 °C as reference is used [46].
Figure 10. Calculation of waste heat generated by the electrolyser including coolant flow rate control
and operating temperature calculation of the electrolyser (some parts based on [41–43]).
Figure 11. Calculation of waste heat energy supplied by the heat exchanger.
Figure 12. Calculation of residual heating demand and the required heat pump power and energy.
5. Overall Model and Dimensioning of the Components
Figure 13 shows the complete Simulink model of the household energy system. To
map the power flow, the components are interconnected and are stuck together in a sub-
system to calculate the residual power which has to be covered by the external grid. The
energy management system yields to minimise the external grid usage. Tables 1–6 show
the configurations of the specific components used within Simulink for evaluation of the
Figure 11. Calculation of waste heat energy supplied by the heat exchanger.
Energies 2022, 15, 2201 13 of 23
Energies 2022, 15, x FOR PEER REVIEW 12 of 24
for every 15-min step within one whole year. Therefore, a table for COP values at different
ambient temperatures and a sink side temperature of 55 °C as reference is used [46].
Figure 10. Calculation of waste heat generated by the electrolyser including coolant flow rate control
and operating temperature calculation of the electrolyser (some parts based on [41–43]).
Figure 11. Calculation of waste heat energy supplied by the heat exchanger.
Figure 12. Calculation of residual heating demand and the required heat pump power and energy.
5. Overall Model and Dimensioning of the Components
Figure 13 shows the complete Simulink model of the household energy system. To
map the power flow, the components are interconnected and are stuck together in a sub-
system to calculate the residual power which has to be covered by the external grid. The
energy management system yields to minimise the external grid usage. Tables 1–6 show
the configurations of the specific components used within Simulink for evaluation of the
Figure 12. Calculation of residual heating demand and the required heat pump power and energy.
5. Overall Model and Dimensioning of the Components
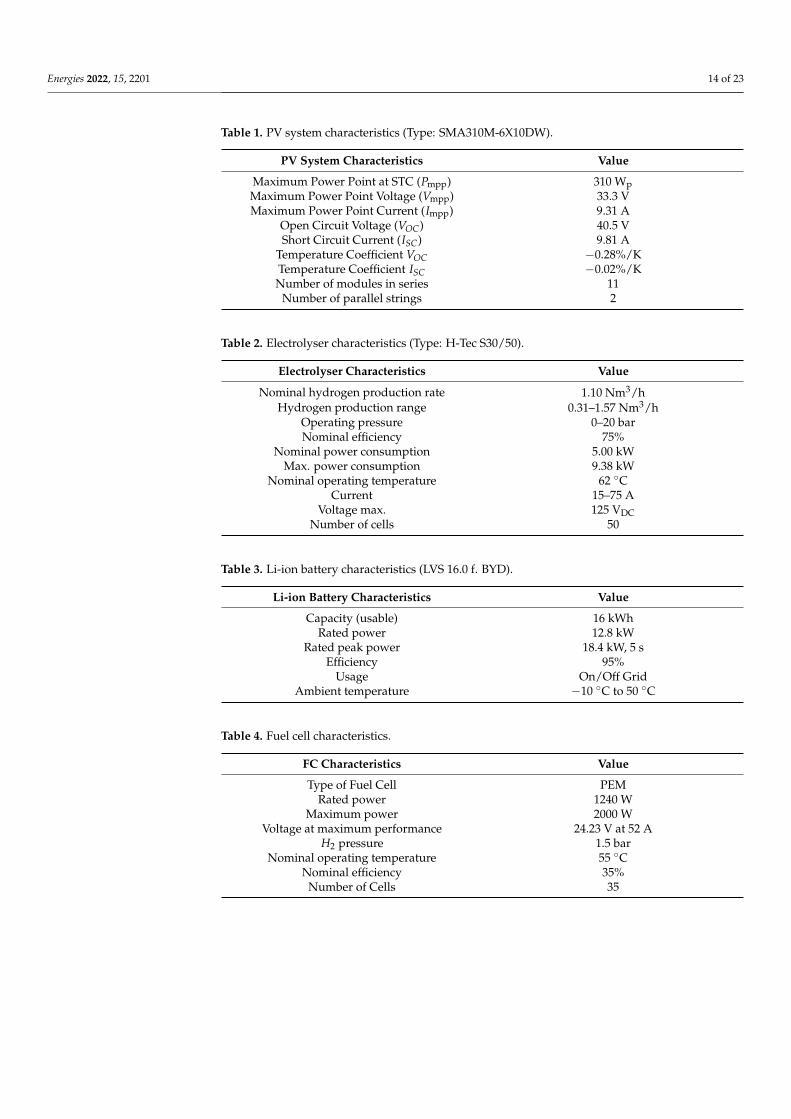
Figure 13 shows the complete Simulink model of the household energy system. To mapthe power flow, the components are interconnected and are stuck together in a subsystemto calculate the residual power which has to be covered by the external grid. The energymanagement system yields to minimise the external grid usage. Tables 1–6 show theconfigurations of the specific components used within Simulink for evaluation of thehousehold energy system [47–49]. Real components have been used for the componentdimensioning and determination of the parameter specification. Therefore, componentshave been searched for which fulfil the requirements for usage in private households andsuite for small-scale applications. The parameter settings used in the simulation are basedon the values given in the specific datasheets of the components. Suitable componentdimensioning of all energy system components to ensure 100% energy independence overan entire year has been figured out by altering and repeating the Simulink simulationseveral times.
Energies 2022, 15, x FOR PEER REVIEW 13 of 24
household energy system [47–49]. Real components have been used for the component
dimensioning and determination of the parameter specification. Therefore, components
have been searched for which fulfil the requirements for usage in private households and
suite for small-scale applications. The parameter settings used in the simulation are based
on the values given in the specific datasheets of the components. Suitable component di-
mensioning of all energy system components to ensure 100% energy independence over
an entire year has been figured out by altering and repeating the Simulink simulation
several times.
Figure 13. Simulink model of the overall household energy system (image sources: [50,51]).
Table 1. PV system characteristics (Type: SMA310M-6X10DW).
PV System Characteristics Value
Maximum Power Point at STC (𝑃mpp) 310 Wp
Maximum Power Point Voltage (𝑉mpp) 33.3 V
Maximum Power Point Current (𝐼mpp) 9.31 A
Open Circuit Voltage (𝑉𝑂𝐶) 40.5 V
Short Circuit Current (𝐼𝑆𝐶) 9.81 A
Temperature Coefficient 𝑉𝑂𝐶 −0.28%/K
Temperature Coefficient 𝐼𝑆𝐶 −0.02%/K
Number of modules in series 11
Number of parallel strings 2
Figure 13. Simulink model of the overall household energy system (image sources: [50,51]).
Energies 2022, 15, 2201 14 of 23
Table 1. PV system characteristics (Type: SMA310M-6X10DW).
PV System Characteristics Value
Maximum Power Point at STC (Pmpp) 310 WpMaximum Power Point Voltage (Vmpp) 33.3 VMaximum Power Point Current (Impp) 9.31 A
Open Circuit Voltage (VOC) 40.5 VShort Circuit Current (ISC) 9.81 A
Temperature Coefficient VOC −0.28%/KTemperature Coefficient ISC −0.02%/KNumber of modules in series 11
Number of parallel strings 2
Table 2. Electrolyser characteristics (Type: H-Tec S30/50).
Electrolyser Characteristics Value
Nominal hydrogen production rate 1.10 Nm3/hHydrogen production range 0.31–1.57 Nm3/h
Operating pressure 0–20 barNominal efficiency 75%
Nominal power consumption 5.00 kWMax. power consumption 9.38 kW
Nominal operating temperature 62 ◦CCurrent 15–75 A
Voltage max. 125 VDCNumber of cells 50
Table 3. Li-ion battery characteristics (LVS 16.0 f. BYD).
Li-ion Battery Characteristics Value
Capacity (usable) 16 kWhRated power 12.8 kW
Rated peak power 18.4 kW, 5 sEfficiency 95%
Usage On/Off GridAmbient temperature −10 ◦C to 50 ◦C
Table 4. Fuel cell characteristics.
FC Characteristics Value
Type of Fuel Cell PEMRated power 1240 W
Maximum power 2000 WVoltage at maximum performance 24.23 V at 52 A
H2 pressure 1.5 barNominal operating temperature 55 ◦C
Nominal efficiency 35%Number of Cells 35
Energies 2022, 15, 2201 15 of 23
Table 5. Household characteristics.
Household Characteristics Value
Electricity demand 2350 kWh/aHeat demand 4000 kWh/a
Living area 160 m2
Dimensions surface area 9 m × 9 mKfW efficiency 40
(≤ 25 kWh
m2·a
)
Table 6. Hydrogen tank characteristics.
Hydrogen Tank Characteristics Value
Maximum tank pressure 300 barTank volume (at 1 bar) 5 m3
Initial SoC 60%
6. Verification and Data Analysis
The validity of the energy system modelled in Simulink was analysed using a single-family house. Therefore, the energy system was rebuilt in HOMER Energy (HE) to becompared. HE provides a wide range of components for basic energy system modellingwith focus on energy balance and profitability analysis. To evaluate the plausibility of thedeveloped energy system model, the magnitudes of the energy and hydrogen generationand the consumption are compared, respectively.
For the initial verification of the data, a PV system with rated power of 6820 kWp(22 modules of which 11 modules were in series connection 2 parallel strings) and thecharacteristics described in Table 1 was used. Wuerzburg (Germany) was employed asthe model location due to the availability of a one-year weather and irradiation profile inhourly time resolution provided by the DWD [19]. The year 2015 was taken as the yearof interest. The elevation angle was set to 45◦ with a direct orientation towards the south(azimuth angle = 0◦). DWD provides global and diffuse irradiation profiles measured fora horizontal plane only. Due to this, the irradiation profile for an inclined plane had tobe calculated first, using the formulas described by Quaschning [52]. The positioning ofthe PV system was assumed as ideally, having no shadowing during the whole year. Togenerate realistic data, losses due to pollution, conduction losses, etc. have been consideredby introducing an efficiency parameter, which was set to 90%.
For evaluation, the overall load of the household system for each month and a 1 hresolution for an average day within this month were recorded by running the simulation.This profile has been taken as input profile at HE for achieving an equal load within bothmodels. In total, 3832 kWh has been calculated as the overall load during one year. A6.8 kWp PV system, a 5 kW electrolyser and a 1.24 kW fuel cell have been integrated into theHE model. With these assumptions, the Simulink model calculated PV energy productionof 7314.60 kWh for the whole year whereas HE calculated 7538 kWh.
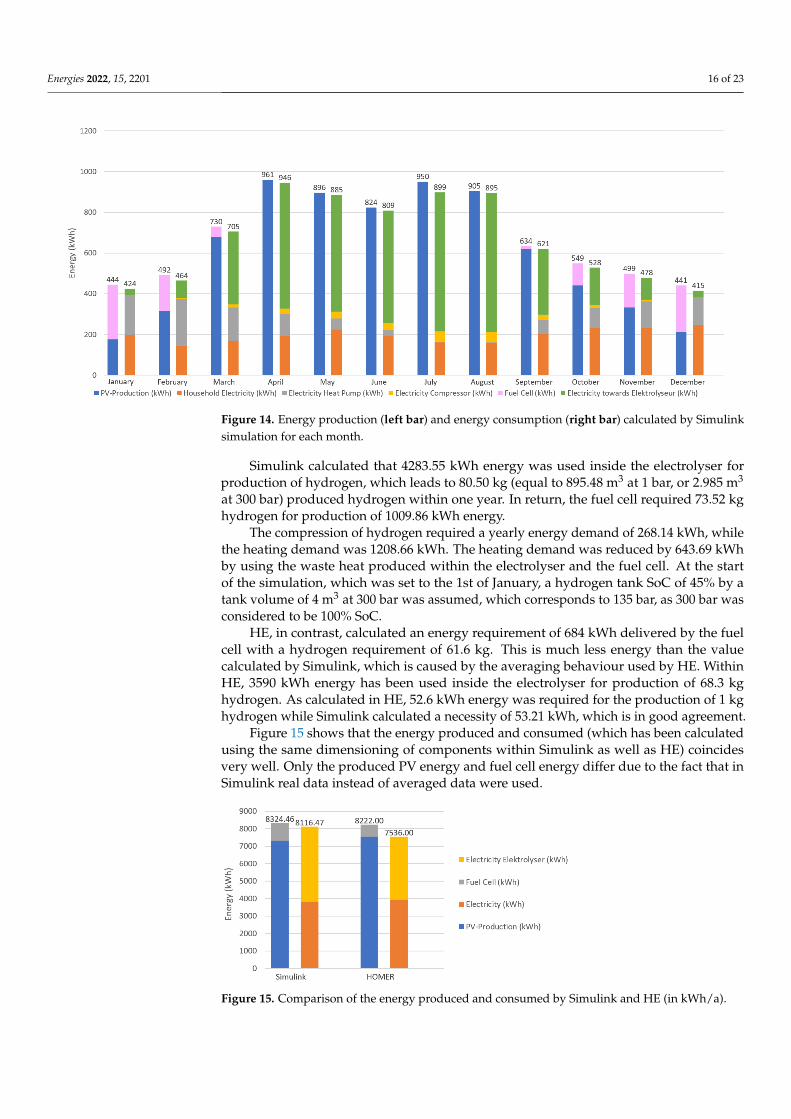
Figure 14 shows the produced energy within each month (left bar) compared to theenergy demand for every month (right bar). From October to March, the energy producedby the fuel cell is relatively high, while the energy required in these months is unneglectablyhigher than during the summer because of the higher heating demand. The green barshows the surplus energy which is used in the electrolyser to produce hydrogen.
Energies 2022, 15, 2201 16 of 23
Energies 2022, 15, x FOR PEER REVIEW 15 of 24
6. Verification and Data Analysis
The validity of the energy system modelled in Simulink was analysed using a single-
family house. Therefore, the energy system was rebuilt in HOMER Energy (HE) to be
compared. HE provides a wide range of components for basic energy system modelling
with focus on energy balance and profitability analysis. To evaluate the plausibility of the
developed energy system model, the magnitudes of the energy and hydrogen generation
and the consumption are compared, respectively.
For the initial verification of the data, a PV system with rated power of 6820 kWp (22
modules of which 11 modules were in series connection 2 parallel strings) and the char-
acteristics described in Table 1 was used. Wuerzburg (Germany) was employed as the
model location due to the availability of a one-year weather and irradiation profile in
hourly time resolution provided by the DWD [19]. The year 2015 was taken as the year of
interest. The elevation angle was set to 45° with a direct orientation towards the south
(azimuth angle = 0°). DWD provides global and diffuse irradiation profiles measured for
a horizontal plane only. Due to this, the irradiation profile for an inclined plane had to be
calculated first, using the formulas described by Quaschning [52]. The positioning of the
PV system was assumed as ideally, having no shadowing during the whole year. To gen-
erate realistic data, losses due to pollution, conduction losses, etc. have been considered
by introducing an efficiency parameter, which was set to 90%.
For evaluation, the overall load of the household system for each month and a 1 h
resolution for an average day within this month were recorded by running the simulation.
This profile has been taken as input profile at HE for achieving an equal load within both
models. In total, 3832 kWh has been calculated as the overall load during one year. A
6.8 kWp PV system, a 5 kW electrolyser and a 1.24 kW fuel cell have been integrated into
the HE model. With these assumptions, the Simulink model calculated PV energy pro-
duction of 7314.60 kWh for the whole year whereas HE calculated 7538 kWh.
Figure 14 shows the produced energy within each month (left bar) compared to the
energy demand for every month (right bar). From October to March, the energy produced
by the fuel cell is relatively high, while the energy required in these months is unneglec-
tably higher than during the summer because of the higher heating demand. The green
bar shows the surplus energy which is used in the electrolyser to produce hydrogen.
Figure 14. Energy production (left bar) and energy consumption (right bar) calculated by Simulink
simulation for each month.
Simulink calculated that 4283.55 kWh energy was used inside the electrolyser for
production of hydrogen, which leads to 80.50 kg (equal to 895.48 m3 at 1 bar, or 2.985 m³
Figure 14. Energy production (left bar) and energy consumption (right bar) calculated by Simulinksimulation for each month.
Simulink calculated that 4283.55 kWh energy was used inside the electrolyser forproduction of hydrogen, which leads to 80.50 kg (equal to 895.48 m3 at 1 bar, or 2.985 m3
at 300 bar) produced hydrogen within one year. In return, the fuel cell required 73.52 kghydrogen for production of 1009.86 kWh energy.
The compression of hydrogen required a yearly energy demand of 268.14 kWh, whilethe heating demand was 1208.66 kWh. The heating demand was reduced by 643.69 kWhby using the waste heat produced within the electrolyser and the fuel cell. At the startof the simulation, which was set to the 1st of January, a hydrogen tank SoC of 45% by atank volume of 4 m3 at 300 bar was assumed, which corresponds to 135 bar, as 300 bar wasconsidered to be 100% SoC.
HE, in contrast, calculated an energy requirement of 684 kWh delivered by the fuelcell with a hydrogen requirement of 61.6 kg. This is much less energy than the valuecalculated by Simulink, which is caused by the averaging behaviour used by HE. WithinHE, 3590 kWh energy has been used inside the electrolyser for production of 68.3 kghydrogen. As calculated in HE, 52.6 kWh energy was required for the production of 1 kghydrogen while Simulink calculated a necessity of 53.21 kWh, which is in good agreement.
Figure 15 shows that the energy produced and consumed (which has been calculatedusing the same dimensioning of components within Simulink as well as HE) coincidesvery well. Only the produced PV energy and fuel cell energy differ due to the fact that inSimulink real data instead of averaged data were used.
Energies 2022, 15, x FOR PEER REVIEW 16 of 24
at 300 bar) produced hydrogen within one year. In return, the fuel cell required 73.52 kg
hydrogen for production of 1009.86 kWh energy.
The compression of hydrogen required a yearly energy demand of 268.14 kWh, while
the heating demand was 1208.66 kWh. The heating demand was reduced by 643.69 kWh
by using the waste heat produced within the electrolyser and the fuel cell. At the start of
the simulation, which was set to the 1st of January, a hydrogen tank SoC of 45% by a tank
volume of 4 m3 at 300 bar was assumed, which corresponds to 135 bar, as 300 bar was
considered to be 100% SoC.
HE, in contrast, calculated an energy requirement of 684 kWh delivered by the fuel
cell with a hydrogen requirement of 61.6 kg. This is much less energy than the value cal-
culated by Simulink, which is caused by the averaging behaviour used by HE. Within HE,
3590 kWh energy has been used inside the electrolyser for production of 68.3 kg hydrogen.
As calculated in HE, 52.6 kWh energy was required for the production of 1 kg hydrogen
while Simulink calculated a necessity of 53.21 kWh, which is in good agreement.
Figure 15 shows that the energy produced and consumed (which has been calculated
using the same dimensioning of components within Simulink as well as HE) coincides
very well. Only the produced PV energy and fuel cell energy differ due to the fact that in
Simulink real data instead of averaged data were used.
Figure 15. Comparison of the energy produced and consumed by Simulink and HE (in kWh/a).
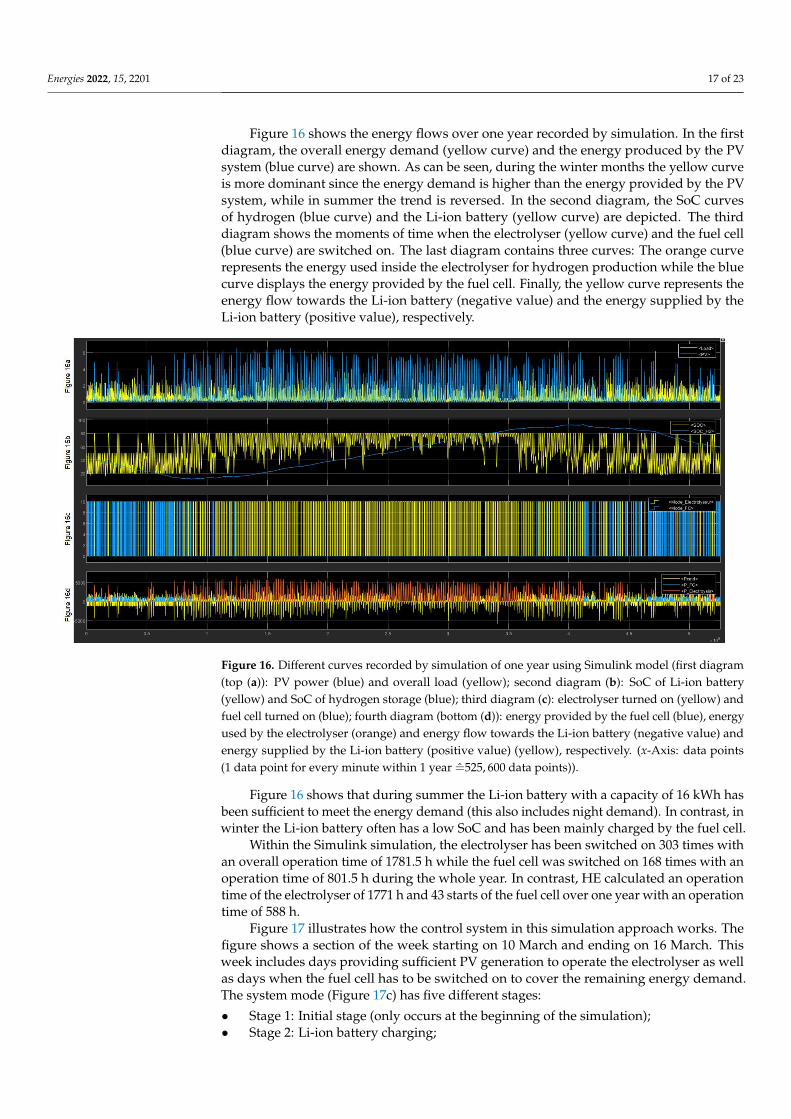
Figure 16 shows the energy flows over one year recorded by simulation. In the first
diagram, the overall energy demand (yellow curve) and the energy produced by the PV
system (blue curve) are shown. As can be seen, during the winter months the yellow curve
is more dominant since the energy demand is higher than the energy provided by the PV
system, while in summer the trend is reversed. In the second diagram, the SoC curves of
hydrogen (blue curve) and the Li-ion battery (yellow curve) are depicted. The third dia-
gram shows the moments of time when the electrolyser (yellow curve) and the fuel cell
(blue curve) are switched on. The last diagram contains three curves: The orange curve
represents the energy used inside the electrolyser for hydrogen production while the blue
curve displays the energy provided by the fuel cell. Finally, the yellow curve represents
the energy flow towards the Li-ion battery (negative value) and the energy supplied by
the Li-ion battery (positive value), respectively.
Figure 15. Comparison of the energy produced and consumed by Simulink and HE (in kWh/a).
Energies 2022, 15, 2201 17 of 23
Figure 16 shows the energy flows over one year recorded by simulation. In the firstdiagram, the overall energy demand (yellow curve) and the energy produced by the PVsystem (blue curve) are shown. As can be seen, during the winter months the yellow curveis more dominant since the energy demand is higher than the energy provided by the PVsystem, while in summer the trend is reversed. In the second diagram, the SoC curvesof hydrogen (blue curve) and the Li-ion battery (yellow curve) are depicted. The thirddiagram shows the moments of time when the electrolyser (yellow curve) and the fuel cell(blue curve) are switched on. The last diagram contains three curves: The orange curverepresents the energy used inside the electrolyser for hydrogen production while the bluecurve displays the energy provided by the fuel cell. Finally, the yellow curve represents theenergy flow towards the Li-ion battery (negative value) and the energy supplied by theLi-ion battery (positive value), respectively.
Energies 2022, 15, x FOR PEER REVIEW 17 of 24
Figure 16. Different curves recorded by simulation of one year using Simulink model (first diagram
(top (a)): PV power (blue) and overall load (yellow); second diagram (b): SoC of Li-ion battery (yel-
low) and SoC of hydrogen storage (blue); third diagram (c): electrolyser turned on (yellow) and fuel
cell turned on (blue); fourth diagram (bottom (d)): energy provided by the fuel cell (blue), energy
used by the electrolyser (orange) and energy flow towards the Li-ion battery (negative value) and
energy supplied by the Li-ion battery (positive value) (yellow), respectively. (x-Axis: data points (1
data point for every minute within 1 year =̂ 525600 data points)).
Figure 16 shows that during summer the Li-ion battery with a capacity of 16 kWh has
been sufficient to meet the energy demand (this also includes night demand). In contrast,
in winter the Li-ion battery often has a low SoC and has been mainly charged by the fuel
cell.
Within the Simulink simulation, the electrolyser has been switched on 303 times with
an overall operation time of 1781.5 h while the fuel cell was switched on 168 times with
an operation time of 801.5 h during the whole year. In contrast, HE calculated an operation
time of the electrolyser of 1771 h and 43 starts of the fuel cell over one year with an oper-
ation time of 588 h.
Figure 17 illustrates how the control system in this simulation approach works. The
figure shows a section of the week starting on 10 March and ending on 16 March. This
week includes days providing sufficient PV generation to operate the electrolyser as well
as days when the fuel cell has to be switched on to cover the remaining energy demand.
The system mode (Figure 17c) has five different stages:
• Stage 1: Initial stage (only occurs at the beginning of the simulation);
• Stage 2: Li-ion battery charging;
• Stage 3: Li-ion battery discharging;
• Stage 4: Electrolyser switched on;
• Stage 5: Fuel cell switched on.
As can be seen in the first graph of the figure, during the sunshine hours of the first
day of the week, the PV power is significantly higher than the power of the load. First, the
Li-ion battery is fully charged up to the specified maximum SoC until late morning (Figure
17b). The electrolyser is then switched on to produce hydrogen using surplus PV energy.
The electrolyser operates until the load exceeds the PV generation (Figure 17a). The power
supplied to the electrolyser can be seen in Figure 17d. During the evening and night hours,
the load is covered by the Li-ion battery. On the second day, the procedure is the same.
Due to high loads in the night from the second to the third day, the Li-ion battery is
Figure 16. Different curves recorded by simulation of one year using Simulink model (first diagram(top (a)): PV power (blue) and overall load (yellow); second diagram (b): SoC of Li-ion battery(yellow) and SoC of hydrogen storage (blue); third diagram (c): electrolyser turned on (yellow) andfuel cell turned on (blue); fourth diagram (bottom (d)): energy provided by the fuel cell (blue), energyused by the electrolyser (orange) and energy flow towards the Li-ion battery (negative value) andenergy supplied by the Li-ion battery (positive value) (yellow), respectively. (x-Axis: data points(1 data point for every minute within 1 year =̂525, 600 data points)).
Figure 16 shows that during summer the Li-ion battery with a capacity of 16 kWh hasbeen sufficient to meet the energy demand (this also includes night demand). In contrast, inwinter the Li-ion battery often has a low SoC and has been mainly charged by the fuel cell.
Within the Simulink simulation, the electrolyser has been switched on 303 times withan overall operation time of 1781.5 h while the fuel cell was switched on 168 times with anoperation time of 801.5 h during the whole year. In contrast, HE calculated an operationtime of the electrolyser of 1771 h and 43 starts of the fuel cell over one year with an operationtime of 588 h.
Figure 17 illustrates how the control system in this simulation approach works. Thefigure shows a section of the week starting on 10 March and ending on 16 March. Thisweek includes days providing sufficient PV generation to operate the electrolyser as wellas days when the fuel cell has to be switched on to cover the remaining energy demand.The system mode (Figure 17c) has five different stages:
• Stage 1: Initial stage (only occurs at the beginning of the simulation);• Stage 2: Li-ion battery charging;
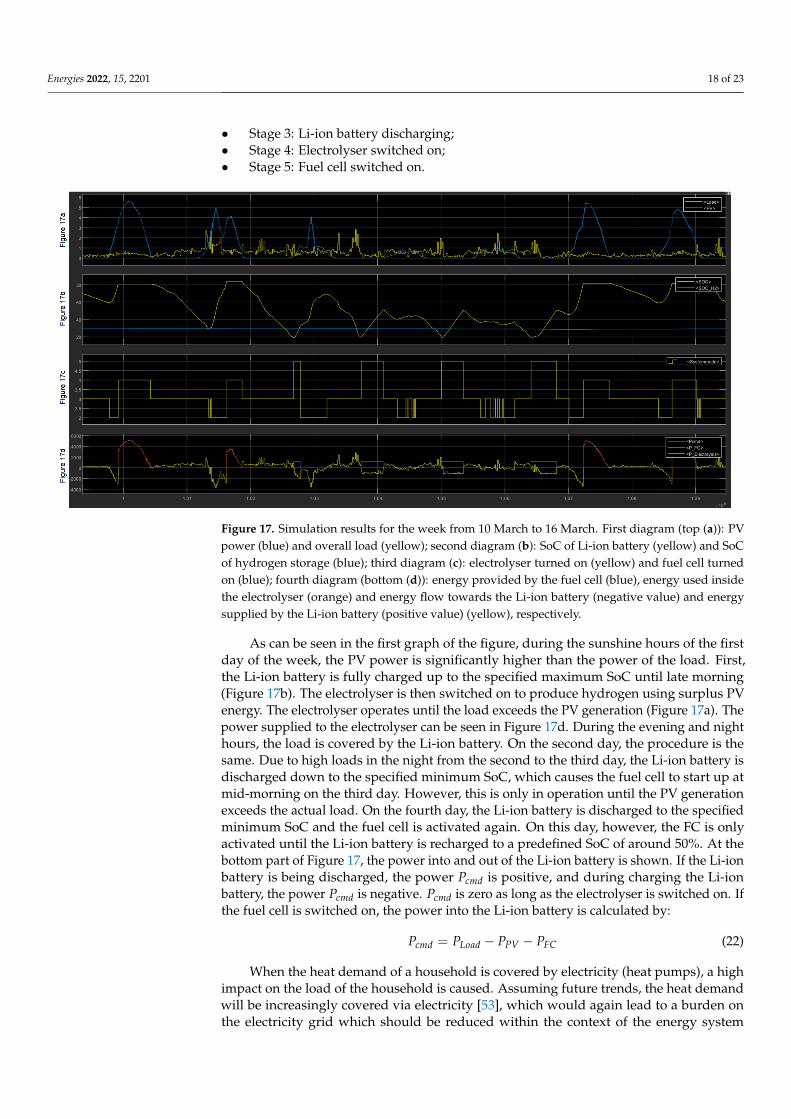
Energies 2022, 15, 2201 18 of 23
• Stage 3: Li-ion battery discharging;• Stage 4: Electrolyser switched on;• Stage 5: Fuel cell switched on.
Energies 2022, 15, x FOR PEER REVIEW 18 of 24
discharged down to the specified minimum SoC, which causes the fuel cell to start up at
mid-morning on the third day. However, this is only in operation until the PV generation
exceeds the actual load. On the fourth day, the Li-ion battery is discharged to the specified
minimum SoC and the fuel cell is activated again. On this day, however, the FC is only
activated until the Li-ion battery is recharged to a predefined SoC of around 50%. At the
bottom part of Figure 17, the power into and out of the Li-ion battery is shown. If the Li-
ion battery is being discharged, the power 𝑃𝑐𝑚𝑑 is positive, and during charging the Li-
ion battery, the power 𝑃𝑐𝑚𝑑 is negative. 𝑃𝑐𝑚𝑑 is zero as long as the electrolyser is
switched on. If the fuel cell is switched on, the power into the Li-ion battery is calculated
by:
𝑃𝑐𝑚𝑑 = 𝑃𝐿𝑜𝑎𝑑 − 𝑃𝑃𝑉 − 𝑃𝐹𝐶 (22)
Figure 17. Simulation results for the week from 10 March to 16 March. First diagram (top (a)): PV
power (blue) and overall load (yellow); second diagram (b): SoC of Li-ion battery (yellow) and SoC
of hydrogen storage (blue); third diagram (c): electrolyser turned on (yellow) and fuel cell turned
on (blue); fourth diagram (bottom (d)): energy provided by the fuel cell (blue), energy used inside
the electrolyser (orange) and energy flow towards the Li-ion battery (negative value) and energy
supplied by the Li-ion battery (positive value) (yellow), respectively.
When the heat demand of a household is covered by electricity (heat pumps), a high
impact on the load of the household is caused. Assuming future trends, the heat demand
will be increasingly covered via electricity [53], which would again lead to a burden on
the electricity grid which should be reduced within the context of the energy system ap-
proach. When endeavouring for energy autonomy of households, the heat demand should
be considered as is it has been done in this approach. However, taking the heat demand
into account leads to a significant increase in hydrogen storage and production require-
ments. The hydrogen demand increases from 24.07 kg to 73.52 kg (205% increase) when
the heat demand of 4000 kWh/a is considered. In return, 91.07 kg hydrogen instead of
80.50 kg hydrogen has been produced when neglecting the heat demand. In the example
presented, a well-insulated house with a correspondingly low heat demand of 4000 kWh/a
was selected. If the heat demand of the household has to be doubled to 8000 kWh/a, the
hydrogen demand would increase to 161.23 kg, which corresponds to an increase of 119%
(in comparison to a heat demand of 4000 kWh/a).
Figure 17. Simulation results for the week from 10 March to 16 March. First diagram (top (a)): PVpower (blue) and overall load (yellow); second diagram (b): SoC of Li-ion battery (yellow) and SoCof hydrogen storage (blue); third diagram (c): electrolyser turned on (yellow) and fuel cell turnedon (blue); fourth diagram (bottom (d)): energy provided by the fuel cell (blue), energy used insidethe electrolyser (orange) and energy flow towards the Li-ion battery (negative value) and energysupplied by the Li-ion battery (positive value) (yellow), respectively.
As can be seen in the first graph of the figure, during the sunshine hours of the firstday of the week, the PV power is significantly higher than the power of the load. First,the Li-ion battery is fully charged up to the specified maximum SoC until late morning(Figure 17b). The electrolyser is then switched on to produce hydrogen using surplus PVenergy. The electrolyser operates until the load exceeds the PV generation (Figure 17a). Thepower supplied to the electrolyser can be seen in Figure 17d. During the evening and nighthours, the load is covered by the Li-ion battery. On the second day, the procedure is thesame. Due to high loads in the night from the second to the third day, the Li-ion battery isdischarged down to the specified minimum SoC, which causes the fuel cell to start up atmid-morning on the third day. However, this is only in operation until the PV generationexceeds the actual load. On the fourth day, the Li-ion battery is discharged to the specifiedminimum SoC and the fuel cell is activated again. On this day, however, the FC is onlyactivated until the Li-ion battery is recharged to a predefined SoC of around 50%. At thebottom part of Figure 17, the power into and out of the Li-ion battery is shown. If the Li-ionbattery is being discharged, the power Pcmd is positive, and during charging the Li-ionbattery, the power Pcmd is negative. Pcmd is zero as long as the electrolyser is switched on. Ifthe fuel cell is switched on, the power into the Li-ion battery is calculated by:
Pcmd = PLoad − PPV − PFC (22)
When the heat demand of a household is covered by electricity (heat pumps), a highimpact on the load of the household is caused. Assuming future trends, the heat demandwill be increasingly covered via electricity [53], which would again lead to a burden onthe electricity grid which should be reduced within the context of the energy system
Energies 2022, 15, 2201 19 of 23
approach. When endeavouring for energy autonomy of households, the heat demandshould be considered as is it has been done in this approach. However, taking the heatdemand into account leads to a significant increase in hydrogen storage and productionrequirements. The hydrogen demand increases from 24.07 kg to 73.52 kg (205% increase)when the heat demand of 4000 kWh/a is considered. In return, 91.07 kg hydrogen insteadof 80.50 kg hydrogen has been produced when neglecting the heat demand. In the examplepresented, a well-insulated house with a correspondingly low heat demand of 4000 kWh/awas selected. If the heat demand of the household has to be doubled to 8000 kWh/a, thehydrogen demand would increase to 161.23 kg, which corresponds to an increase of 119%(in comparison to a heat demand of 4000 kWh/a).
7. Conclusions
The scope of this study was to present a verified hybrid energy system model createdin Simulink which can be used to prospectively size future similar energy systems wherehydrogen in combination with a Li-ion battery shall be used as the energy storage type.The comparison with HOMER Energy shows that the Simulink model developed calculatesrealistic solutions and therefore can be used to give profound suggestions for the sizingof such energy systems. With such a Simulink model, profitability analyses and lifetimeanalyses are possible. The consideration of 365 days plays an important role in order tomake statements about the system sizing. Since the system components influence eachother, it is only possible to analyse the direct influence of different parameter variations onthe basis of such a simulation via the implementation of complex parameter studies. Thesestudies will be focussed in future research work.
The energy system was verified by usage of an energy balance which is typical fora single-family house but can be individually scaled up by combining different inputdatasets and appropriately adjusting the component sizing, assuming that a commonelectrolyser, fuel cell and hydrogen tank are used. The simulation via Simulink showedthat the consideration of the household heat demand greatly enlarges the required amountof decentralised stored hydrogen when aiming for an energy-independent operation.
8. Discussion
The simulation based on the presented Simulink model allows a more detailed andmeaningful analysis of energy systems due to its significantly higher resolution comparedto HOMER Energy. Due to the usually strong fluctuating load, temperature and irradiationprofiles, a simulation with a resolution of 15 min allows a more precise statement aboutthe suitability and sizing of various components than is possible using monthly averagedvalues such as the commonly used modelling approach in HOMER Energy. The Simulinkmodel is therefore preferable for analysing the system behaviour. Furthermore, Simulinkenables the introduction of direct component dependencies such as the integration of thewaste heat generated by the FC and the electrolyser into the heating system and the directconjunction of the FC and the hydrogen storage, which are not considered in HOMEREnergy. Moreover, with Simulink, a more precise and specifically tailored control algorithmfor every component which has a significant impact on the energy balance is feasible.
By simulation using Simulink, it can be seen whether the chosen component dimen-sioning and key parameters are suitable for guaranteeing off-grid operation. Therefore, theinput parameters can be changed according to their own energy usage preferences and thedesignated location.
The simulation was performed by usage of a 15 min resolution, whereby the inputdatasets had to be averaged, and, as a result, sudden rapid changes in the datasets havebeen neglected. Ramp-up and start-up times of the components thereby have not beenconsidered, while they are neglectable in the considered time scale. A higher resolution ofthe entire input data failed due to the weather and solar irradiance datasets that were onlyavailable in hourly resolution. Therefore, input datasets with a much higher resolutionrecorded by us will be involved in future research to achieve more realistic solutions.
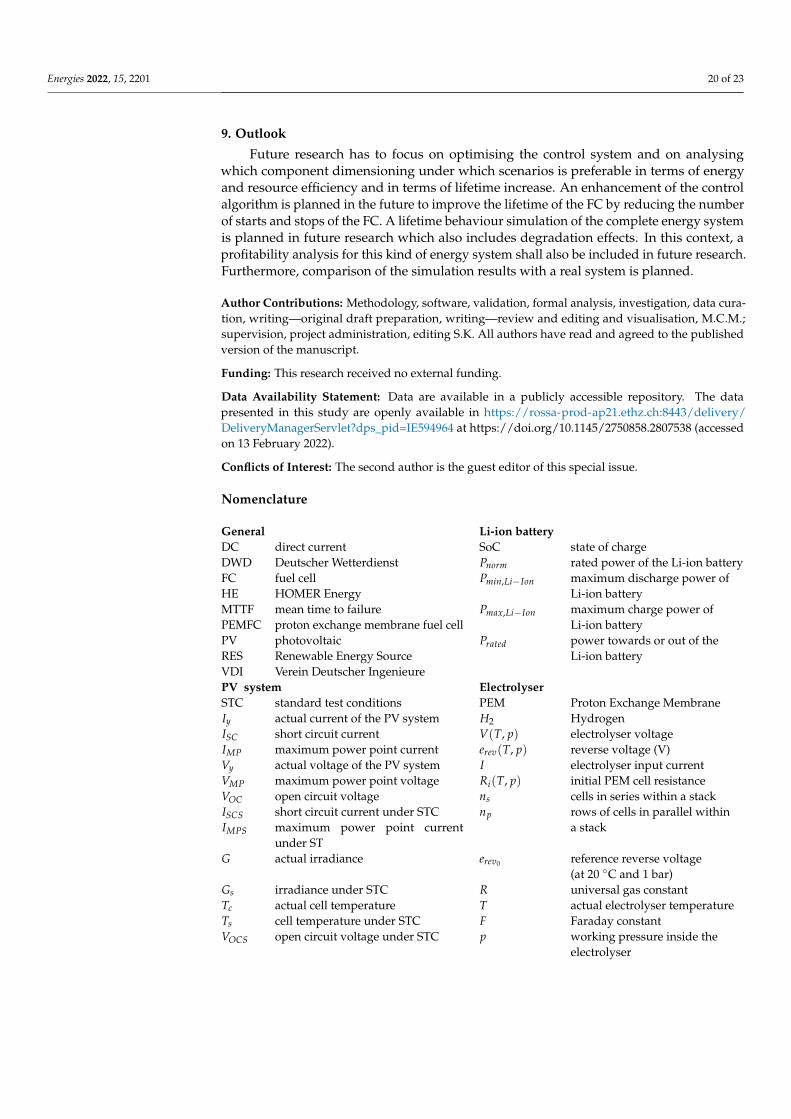
Energies 2022, 15, 2201 20 of 23
9. Outlook
Future research has to focus on optimising the control system and on analysingwhich component dimensioning under which scenarios is preferable in terms of energyand resource efficiency and in terms of lifetime increase. An enhancement of the controlalgorithm is planned in the future to improve the lifetime of the FC by reducing the numberof starts and stops of the FC. A lifetime behaviour simulation of the complete energy systemis planned in future research which also includes degradation effects. In this context, aprofitability analysis for this kind of energy system shall also be included in future research.Furthermore, comparison of the simulation results with a real system is planned.
Author Contributions: Methodology, software, validation, formal analysis, investigation, data cura-tion, writing—original draft preparation, writing—review and editing and visualisation, M.C.M.;supervision, project administration, editing S.K. All authors have read and agreed to the publishedversion of the manuscript.
Funding: This research received no external funding.
Data Availability Statement: Data are available in a publicly accessible repository. The datapresented in this study are openly available in https://rossa-prod-ap21.ethz.ch:8443/delivery/DeliveryManagerServlet?dps_pid=IE594964 at https://doi.org/10.1145/2750858.2807538 (accessedon 13 February 2022).
Conflicts of Interest: The second author is the guest editor of this special issue.
Nomenclature
General Li-ion batteryDC direct current SoC state of chargeDWD Deutscher Wetterdienst Pnorm rated power of the Li-ion batteryFC fuel cell Pmin,Li−Ion maximum discharge power ofHE HOMER Energy Li-ion batteryMTTF mean time to failure Pmax,Li−Ion maximum charge power ofPEMFC proton exchange membrane fuel cell Li-ion batteryPV photovoltaic Prated power towards or out of theRES Renewable Energy Source Li-ion batteryVDI Verein Deutscher IngenieurePV system ElectrolyserSTC standard test conditions PEM Proton Exchange MembraneIy actual current of the PV system H2 HydrogenISC short circuit current V(T, p) electrolyser voltageIMP maximum power point current erev(T, p) reverse voltage (V)Vy actual voltage of the PV system I electrolyser input currentVMP maximum power point voltage Ri(T, p) initial PEM cell resistanceVOC open circuit voltage ns cells in series within a stackISCS short circuit current under STC np rows of cells in parallel withinIMPS maximum power point current
under STa stack
G actual irradiance erev0 reference reverse voltage(at 20 ◦C and 1 bar)
Gs irradiance under STC R universal gas constantTc actual cell temperature T actual electrolyser temperatureTs cell temperature under STC F Faraday constantVOCS open circuit voltage under STC p working pressure inside the
electrolyser
Energies 2022, 15, 2201 21 of 23
VMPS maximum power point voltageunder STC
p0 ambient pressure
α Temperature coefficient of Ri0 reference cell resistancethe current (at 20 ◦C and 1 bar)
β temperature coefficient of the vH2 hydrogen production rate inside thevoltage electrolyser
ω wind speed vm molar volumekr PV module technology dependent
coefficientNc number of cells of the electrolyser
stackk derived curve fitting parameter
Hydrogen storage Heat exchanger electrolyserLOHC Liquid Organic Hydrogen Carrier Cth,Stack thermal capacitance of the
electrolyserPb actual hydrogen tank pressure
.QHeat,Stack total emerging waste heat powerpro-
duced inside the electrolyserPbi initial hydrogen tank pressureNH2 flow rate of the produced hydrogen
.QLoss total heat loss due to natural convec-
tion and radiationTb operating temperature during
hydrogen storage procedure
.QCooling heat extracted from the stack by the
cooling systemMH2 molar mass of hydrogen
.QHeat,Cell emerging waste heat inside one elec-
trolyser cellVB hydrogen tank volumez compressibility factor NELY
cells number of electrolyser cellsVm molar volume VCell cell voltage of the electrolyserρH2 density of hydrogen Vtn reversible voltage of the electrolyserPel,comp power for the compression of ICell cell current of the electrolyser
hydrogenηel electrical efficiency k heat transfer coefficient between the
air and the stack surface areaηcomp compressor efficiency As lateral surface of the electrolyserκ capacity ratio Ta ambient temperature.
minlet flow rate of H2 towards the.
mstack massmass of the electrolyser stackcompressor
Rj specific gas constant of H2 cp,stack specific heat of the electrolyser stackT1 temperature of H2 at entrance TPEME electrolyser stack temperaturep1 pressures before the compressionp2 pressures after the compressionHeat exchanger fuel cell Heat pumpNFC
cells number of FC cells WHP energy demand of the heat pumpPHeat heat power generated in the fuel cell
stackQremaining remaining energy demand covered
by the heat pumpPoverall total power available in the fuel to-
wards the FCCOP Coefficient of Performance
Pel electrical power output of the FCIStack FC stack currentVStack FC stack voltageVCells FC cell voltagePFC
HE exchanged heat power by the heatexchanger
Ucool global heat transfer coefficientAcool coolant contact areaTPEMFC FC stack temperatureTout coolant cycle output temperatureTin coolant cycle input temperature

Energies 2022, 15, 2201 22 of 23
References1. Sarita, K.; Devarapalli, R.; Rai, P. Modeling and control of dynamic battery storage system used in hybrid grid. Energy Storage
2020, 2, e146. [CrossRef]2. Hydrogen Council. How Hydrogen Empowers the Energy Transition. Available online: https://hydrogencouncil.com/wp-
content/uploads/2017/06/Hydrogen-Council-Vision-Document.pdf (accessed on 13 February 2022).3. Heusser, D.; Klebsch, W.; Appel, A. VDE Faktencheck—Wasserstoff in der Mobilität. Available online: https://www.vde.com/
resource/blob/2026534/7034547d679353fd570b79bd96a2286e/vde-faktencheck-wasserstoff-in-der-mobilitaet-data.pdf (accessedon 13 February 2022).
4. Umweltbundesamt. Energieverbrauch Privater Haushalte. Available online: https://www.umweltbundesamt.de/daten/private-haushalte-konsum/wohnen/energieverbrauch-privater-haushalte#hochster-anteil-am-energieverbrauch-zum-heizen (accessedon 7 December 2021).
5. Umweltbundesamt. Energieverbrauch Nach Energieträgern und Sektoren. Available online: https://www.umweltbundesamt.de/daten/energie/energieverbrauch-nach-energietraegern-sektoren#allgemeine-entwicklung-und-einflussfaktoren (accessed on7 December 2021).
6. Wirth, H. Aktuelle Fakten zur Photovoltaik in Deutschland. Fraunhofer ISE, 2021. Available online: https://www.ise.fraunhofer.de/de/veroeffentlichungen/studien/aktuelle-fakten-zur-photovoltaik-in-deutschland.html (accessed on 13 February 2022).
7. Luthander, R.; Lingfors, D.; Munkhammar, J.; Widén, J. Self-consumption enhancement of residential photovoltaics with batterystorage and electric vehicles in communities. In Proceedings of the ECEEE Summer Study on Energy Efficiency, Hyères, France,11 May 2015.
8. Krauter, S. Simple and effective methods to match photovoltaic power generation to the grid load profile for a PV based energysystem. Sol. Energy 2018, 159, 768–776. [CrossRef]
9. Brisbois, M.C. Decentralised energy, decentralised accountability? Lessons on how to govern decentralised electricity transitionsfrom multi-level natural resource governance. Glob. Transit. 2020, 2, 16–25. [CrossRef]
10. Boulmrharj, S.; Khaidar, M.; Bakhouya, M.; Ouladsine, R.; Siniti, M.; Zine-dine, K. Performance Assessment of a Hybrid Systemwith Hydrogen Storage and Fuel Cell for Cogeneration in Buildings. Sustainability 2020, 12, 4832. [CrossRef]
11. Bose, T.K.; Agbossou, K.; Kolhe, M.; Hamelin, J. Case study—Stand-alone energy systems based on hydrogen production. InHydrogen Implementing Agreement; International Energy Agency: Paris, France, 2003.
12. Villa Londono, J.E.; Mazza, A.; Pons, E.; Lok, H.; Bompard, E. Modelling and Control of a Grid-Connected RES-Hydrogen HybridMicrogrid. Energies 2021, 14, 1540. [CrossRef]
13. Albarghot, M.; Sasi, M.; Rolland, L. MATLAB/Simulink modelling and experimental results of a PEM electrolyzer powered by asolar panel. In Proceedings of the IEEE Electrical Power and Energy Conference (EPEC), Ottawa, ON, Canada, 12–14 October2016; pp. 1–6.
14. Mohseni, S.; Brent, A.C.; Burmester, D. A comparison of metaheuristics for the optimal capacity planning of an isolated,battery-less, hydrogen-based micro-grid. Appl. Energy 2019, 259, 114224. [CrossRef]
15. Trifkovic, M.; Sheikhzadeh, M.; Nigim, K. Modeling and control of a renewable hybrid energy system with hydrogen storage.IEEE Trans. Control Syst. Technol. 2013, 22, 169–179. [CrossRef]
16. Bonitz, S. Zur Lebensdauerabschätzung von Brennstoffzellen mit den Methoden der Betriebsfestigkeit. Ph.D. Dissertation,Technische Universität Clausthal, Clausthal-Zellerfeld, Germany, 2016.
17. MATLAB; Version 9.11 (R2021b); The MathWorks Inc.: Natick, MA, USA, 2021.18. Kleiminger, W.; Beckel, C. ECO data set (Electricity Consumption & Occupancy)—A Research Project of the Distributed Systems
Group. 2016. ETH Zürich. Available online: https://rossa-prod-ap21.ethz.ch:8443/delivery/DeliveryManagerServlet?dps_pid=IE594964 (accessed on 7 December 2021).
19. Deutscher Wetterdienst (DWD)—Climate Data Center. Available online: https://opendata.dwd.de/climate_environment/CDC/(accessed on 7 December 2021).
20. Energiewandlung, V.F. VDI 4655—Reference load profiles of single-family and multi-family houses for the use of CHP systems.Tech. Guidel. 2008, 11, 123.
21. Heesen, H. Synthese von Strom-und Wärmeprofilen nach VDI 4655. Hochschule Trier. 2020. Available online: umwelt-campus.de/energietools (accessed on 7 December 2021).
22. HOMER Energy LLC. HOMER (Hybrid Optimization of Multiple Energy Resources) Software. Version 3.14.5. Available online:https://www.homerenergy.com/products/pro/index.html (accessed on 13 February 2022).
23. Matthes, I. Brandenburger Erzeugt Eigenen Strom Mit Wasserstoff. Available online: https://www.moz.de/nachrichten/wirtschaft/energie-brandenburger-erzeugt-eigenen-strom-mit-wasserstoff-50383121.html (accessed on 6 February 2022).
24. Bellini, A.; Bifaretti, S.; Iacovone, V.; Cornaro, C. Simplified model of a photovoltaic module. In Proceedings of the AppliedElectronics, Pilsen, Czech Republic, 9–10 September 2009; pp. 47–51.
25. Ayaz, R.; Nakir, I.; Tanrioven, M. An Improved Matlab-Simulink Model of PV Module considering Ambient Conditions. Int. J.Photoenergy 2014, 11, 315893. [CrossRef]
26. Tamizhmani, G.; Ji, L.; Tang, Y.; Petacci, L.; Osterwald, C. Photovoltaic module thermal/wind performance: Long-term monitoringand model development for energy rating. In Proceedings of the NCPV and Solar Program Review Meeting, Denver, CO, USA, 1June 2003; pp. 936–939.

Energies 2022, 15, 2201 23 of 23
27. Kalogirou, S. Photovoltaik Systems. Solar Energy Engineering: Processes and Systems; Academic Press: New York, NY, USA, 2009; pp.481–538.
28. Al-Refai, M.A. Matlab/Simulink Simulation of Solar Energy Storage System. World Academy of Science, Engineering andTechnology. Int. J. Electr. Comput. Eng. 2014, 8, 297–302.
29. Wang, C. Modeling and Control of Hybrid Wind/Photovoltaic/Fuel Cell Distributed Generation Systems. Ph.D. Thesis, TheMontana State University, Bozeman, MT, USA, 2006.
30. Smith, A.F.G.; Newborough, M. Low-cost polymer electrolysers and electrolyser implementation scenarios for carbon abatement.Rep. Carbon Trust. ITM-Power 2004, 11, 451.
31. Beainy, A.; Karami, N.; Moubayed, N. Simulink Model for a PEM Electrolyzer Based on an Equivalent Electrical Circuit. InProceedings of the International Conference on Renewable Energies for Developing Countries, Beirut, Lebanon, 26–27 November2014; pp. 145–149.
32. Atlam, O.; Kolhe, M. Equivalent electrical model for a proton exchange membrane (PEM) electrolyser. Energy Convers. Manag.2011, 52, 2952–2957. [CrossRef]
33. Stolzenburg, K. Speicheroptionen für Wasserstoff, 7. In Energie-Effizienz-Netzwerktreffen “Wasserstofftechnologien—Entwicklung undPerspektiven”; Mariko/Leer: Oldenburg, Germany, 2019.
34. Rudow, F. Wasserstoffspeicherung im Metallhydrid. Zürich, Rämibühl Mathematisch-Naturwissenschaftliches Gymnasium.Available online: http://fdchemie.pbworks.com/f/Wasserstoffspeicherung%20im%20Metallhydrid%20-%20Florian%20Rudow.pdf (accessed on 3 March 2022).
35. TüV Süd—Speicherung von Wasserstoff. Available online: https://www.tuvsud.com/de-de/indust-re/wasserstoff-brennstoffzellen-info/wasserstoff/speicherung-von-wasserstoff (accessed on 3 March 2022).
36. Brückner, N.; Obesser, K.; Bösmann, A.; Teichmann, D.; Arlt, W.; Dungs, J.; Wasserscheid, P. Evaluation of Industrially appliedheat-transfer fluids as liquid organic hydrogen carrier systems. ChemSusChem 2014, 7, 229–235. [CrossRef] [PubMed]
37. Jordan, T. Skript zur Vorlesung über Wasserstofftechnologie; Institut für Kern-und Energietechnik, Forschungszentrum KarlsruheGmbH: Karlsruhe, Germany, 2007.
38. Ingenieurkurse.de. Isentrope Zustandsänderung. Available online: https://www.ingenieurkurse.de/thermodynamik/uebungsaufgaben/2-hauptsatz-der-thermodynamik/einfache-zustandsaenderungen-des-idealen-gases/isentrope-zustandsaenderung.html (accessed on 7 December 2021).
39. Motapon, S.N.; Dessaint, L.A.; Al-Haddad, K. A robust H2-consumption-minimization-based energy management strategy for afuel cell hybrid emergency power system of more electric aircraft. IEEE Trans. Ind. Electron. 2014, 61, 6148–6156. [CrossRef]
40. LeSage, J. Microgrid Energy Management System (EMS) Using Optimization. Available online: https://github.com/jonlesage/Microgrid-EMS-Optimization (accessed on 7 December 2021).
41. MathWorks. Fuel Cell Stack. Available online: https://de.mathworks.com/help/physmod/sps/powersys/ref/fuelcellstack.html(accessed on 7 December 2021).
42. Hausjournal. Die Optimale Temperatur für Heizung und Warmwasser. Available online: https://www.hausjournal.net/heizung-warmwasser-temperatur (accessed on 7 December 2021).
43. Ottosson, A. Integration of Hydrogen Production via Water Electrolysis at a CHP Plant. Master’s Thesis, Luleå University ofTechnology, Department of Engineering Sciences and Mathematics, Luleå, Sweden, 2021.
44. Rincon-Castrillo, E.D.; Bermudez-Santaella, J.R.; Vera-Duarte, L.E.; Garcia-Pabon, J.J. Modeling and simulation of an electrolyserfor the production of HHO in Matlab-Simulink. Respuestas 2018, 24, 6–15. [CrossRef]
45. Martinez, P.; Serra, M.; Costa-Castellò, R. Modeling and control of HTPEMFC based Combined Heat and Power for confortcontrol. In Proceedings of the 22nd IEEE International Conference on Emerging Technologies and Factory Automation (ETFA),Turin, Italy, 12–15 September 2017; pp. 1–6.
46. Lombardi, P.; Arendarski, B.; Suslov, K.; Shamarova, N.; Sokolnikova, P.; Pantaleo, A.M.; Komarnicki, P. A Net-Zero EnergySystem Solution for Russian Rural Communities. In Proceedings of the E3S Web of Conference, Online, 5 May 2018; p. 69.
47. Sunman. Datasheet eArc SMA310M-6X10DW. Available online: https://greenakku.de/download/Datenblatt_Sunman_310.pdf(accessed on 7 December 2021).
48. BYD. Datasheet BATTERY-BOX PREMIUM LVS 16.0. Available online: https://cdn.webshopapp.com/shops/264724/files/383278967/byd-b-box-lvs-datenblatt-2-0-de-inutec.pdf (accessed on 7 December 2021).
49. H-Tec Systems. Datasheet H-TEC Series-S. Available online: https://www.hannovermesse.de/apollo/hannover_messe_2021/obs/Binary/A1089304/H-TEC%20SYSTEMS%20Datenblatt%20SERIES%20S30%20DE.PDF (accessed on 7 December 2021).
50. ElringKlinger Kommt Mit Neuen Produkten Zur IAA. Available online: https://www.electrive.net/2018/09/14/elringklinger-kommt-mit-neuen-produkten-zur-iaa/ (accessed on 6 January 2022).
51. H-Tec Systems. Elektrolyse-Stacks SERIES S30. Available online: https://www.h-tec.com/produkte/ (accessed on 6January 2022).
52. Quaschning, V. Regenerative Energiesysteme. Technologie—Berechnung—Klimaschutz; Updated and Extended Circulation; Hanser:München, Germany, 2019.
53. Fraunhofer IWES/IBP. Wärmewende 2030. In Schlüsseltechnologien zur Erreichung der Mittel-und Langfristigen Klimaschutzziele imGebäudesektor; Auftrag von Agora Energiewende: Kassel, Germany, 2017.