Human Services Management (HSM) Certificate Program ...
285
Clark University Clark Digital Commons School of Professional Studies Master’s Papers 5-2017 Human Services Management (HSM) Certificate Program Expansion to Western Massachuses Feasibility Study Paul Campbell Clark University Patrick Deschenes Clark University Maria Pacheco Clark University Bradley Paul Clark University Elizabeth Vium Clark University See next page for additional authors Follow this and additional works at: hps://commons.clarku.edu/sps_masters_papers Part of the Business and Corporate Communications Commons , Family, Life Course, and Society Commons , Health Policy Commons , Human Resources Management Commons , Information Security Commons , Management Information Systems Commons , Marketing Commons , Nonprofit Administration and Management Commons , Public Administration Commons , Public Health Commons , Social Media Commons , and the Sociology of Culture Commons is Capstone is brought to you for free and open access by the Master’s Papers at Clark Digital Commons. It has been accepted for inclusion in School of Professional Studies by an authorized administrator of Clark Digital Commons. For more information, please contact [email protected], [email protected]. Recommended Citation Campbell, Paul; Deschenes, Patrick; Pacheco, Maria; Paul, Bradley; Vium, Elizabeth; and Zhang, Jing, "Human Services Management (HSM) Certificate Program Expansion to Western Massachuses Feasibility Study" (2017). School of Professional Studies. 14. hps://commons.clarku.edu/sps_masters_papers/14
-
Upload
khangminh22 -
Category
Documents
-
view
0 -
download
0
Transcript of Human Services Management (HSM) Certificate Program ...

Clark UniversityClark Digital Commons
School of Professional Studies Master’s Papers
5-2017
Human Services Management (HSM) CertificateProgram Expansion to Western MassachusettsFeasibility StudyPaul CampbellClark University
Patrick DeschenesClark University
Maria PachecoClark University
Bradley PaulClark University
Elizabeth VittumClark University
See next page for additional authors
Follow this and additional works at: https://commons.clarku.edu/sps_masters_papersPart of the Business and Corporate Communications Commons, Family, Life Course, and
Society Commons, Health Policy Commons, Human Resources Management Commons,Information Security Commons, Management Information Systems Commons, MarketingCommons, Nonprofit Administration and Management Commons, Public AdministrationCommons, Public Health Commons, Social Media Commons, and the Sociology of CultureCommons
This Capstone is brought to you for free and open access by the Master’s Papers at Clark Digital Commons. It has been accepted for inclusion in Schoolof Professional Studies by an authorized administrator of Clark Digital Commons. For more information, please contact [email protected],[email protected].
Recommended CitationCampbell, Paul; Deschenes, Patrick; Pacheco, Maria; Paul, Bradley; Vittum, Elizabeth; and Zhang, Jing, "Human ServicesManagement (HSM) Certificate Program Expansion to Western Massachusetts Feasibility Study" (2017). School of ProfessionalStudies. 14.https://commons.clarku.edu/sps_masters_papers/14

AuthorPaul Campbell, Patrick Deschenes, Maria Pacheco, Bradley Paul, Elizabeth Vittum, and Jing Zhang
This capstone is available at Clark Digital Commons: https://commons.clarku.edu/sps_masters_papers/14

Capstone Project
Clark University School of Professional Studies and Providers’ Council
Human Services Management (HSM) Certificate Program Expansion to Western Massachusetts
Feasibility Study
By:
Paul Campbell
Patrick Deschenes
Maria Pacheco
Bradley Paul
Elizabeth Vittum
Jing Zhang
Submitted in partial fulfillment of the requirements for
MPA 3999 Capstone Project: School of Professional Studies
April 26, 2017

2
Acknowledgements
The Human Services Management (HSM) Certificate Program Expansion to Western
Massachusetts Capstone team would like to acknowledge both the Providers’ Council and the
Clark University School of Professional Studies for their commitment toward improving and
strengthening the human services sector in Massachusetts. We commend both institutions for
recognizing the need to provide critical and affordable growth and development opportunities for
staff working in this sector, with the ultimate goal of ensuring quality and care for vulnerable
populations. We would like to thank Ella Froggatt and Michael Weekes of the Providers’
Council for their time, patience and responsiveness towards us during this research project. We
would especially like to thank our Capstone Advisor, Mary Piecewicz, for sharing her time,
expertise and guidance throughout the semester.

3
Table of Contents
Executive Summary………….…………………………………………………………………....4
Chapter 1: Introduction…………………………………………………………………………....7
Chapter 2: Information and Trends in the Human Services Industry…….…………………...…16
Chapter 3: Methods and Market Information……………………………………………………45
Chapter 4: Results and Reflection……………………………………………………………….71
Chapter 5: Summary Conclusion………………………………………………………………...78
References………………………………………………………………………………………..80
Appendix A: Pre-work and Interview Questions………………………………………………...84
Appendix B: Project Charter……………………………………………………………………..90
Appendix C: Survey Tool………………………………………………………………………100
Appendix D: Survey Report - Member Organizations…………………………………………105
Appendix E: Survey Report - Nonmember Organizations……………………………….…….143
Appendix F: Final Presentation Slides…………………………………………………….……181
Appendix G: National Center for Charitable Statistics Data………………………………...…230
Appendix H: U.S. Census Data…………………………………………………………………246
Appendix I: Additional Charts and Figures…………………………………………………….247

4
Executive Summary
One of the most popular cost-savings programs that the Providers’ Council currently
offers its members is a Certificate in Nonprofit Human Service Management (HSM) provided in
partnership with Clark University and Suffolk University. As human services providers are
struggling to hire and retain qualified staff, the need to provide professional development
opportunities to help grow and expand a skilled health and human services workforce is a critical
issue facing nonprofit organizations and communities in Massachusetts. This feasibility study
examines the viability of Providers’ Council and Clark University expanding its HSM Certificate
Program to organizations and staff located in western Massachusetts. Potential benefits to the
Providers’ Council include sustained interest and growth in its membership. Similarly, Clark
University could potentially expand its student base and profit margin by operating in a new
region of the state.
The research used to write this feasibility study includes a detailed analysis of current
information and trends in the human services industry, a study of existing and potential markets
in relation to the expansion, and a survey of top executives from both Providers’ Council
Member and nonmember organizations to determine their interest. A summary of findings and
salient points discovered through this study include:
● Among possible participating organizations in a western Massachusetts HSM program,
counties in western Massachusetts combined to have more human service nonprofit
organizations than in Worcester County (1,196 vs 1,107) and a similar rate of
organizations (14.40 per 10,000 residents) to the greater Boston area (14.91). Based on
these figures, there is a significant potential consumer base for the program.
● Providers’ Council Member Organizations generate more revenue than other human
service nonprofits in the state. 86% generate more than $500,000 of revenue annually
compared to 22% of 501(3)(c) organizations in western Massachusetts and 17% of all
human service nonprofits in the state. This finding indicates that Member organizations
5
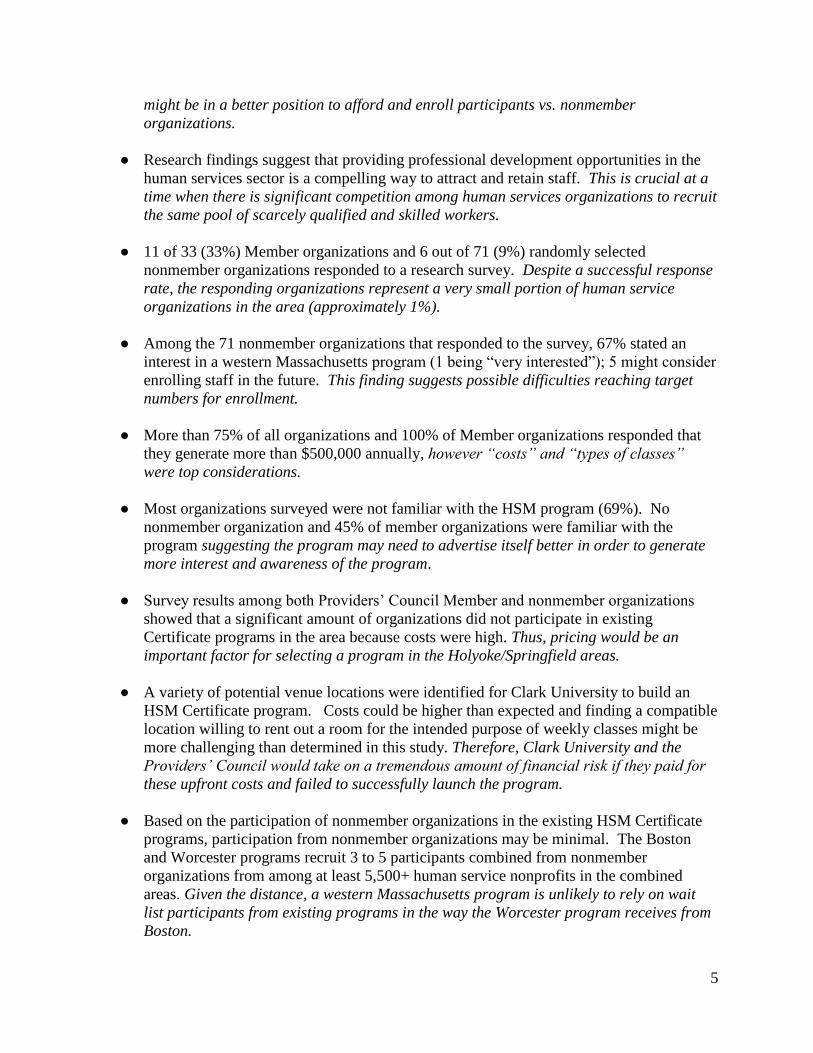
might be in a better position to afford and enroll participants vs. nonmember
organizations.
● Research findings suggest that providing professional development opportunities in the
human services sector is a compelling way to attract and retain staff. This is crucial at a
time when there is significant competition among human services organizations to recruit
the same pool of scarcely qualified and skilled workers.
● 11 of 33 (33%) Member organizations and 6 out of 71 (9%) randomly selected
nonmember organizations responded to a research survey. Despite a successful response
rate, the responding organizations represent a very small portion of human service
organizations in the area (approximately 1%).
● Among the 71 nonmember organizations that responded to the survey, 67% stated an
interest in a western Massachusetts program (1 being “very interested”); 5 might consider
enrolling staff in the future. This finding suggests possible difficulties reaching target
numbers for enrollment.
● More than 75% of all organizations and 100% of Member organizations responded that
they generate more than $500,000 annually, however “costs” and “types of classes”
were top considerations.
● Most organizations surveyed were not familiar with the HSM program (69%). No
nonmember organization and 45% of member organizations were familiar with the
program suggesting the program may need to advertise itself better in order to generate
more interest and awareness of the program.
● Survey results among both Providers’ Council Member and nonmember organizations
showed that a significant amount of organizations did not participate in existing
Certificate programs in the area because costs were high. Thus, pricing would be an
important factor for selecting a program in the Holyoke/Springfield areas.
● A variety of potential venue locations were identified for Clark University to build an
HSM Certificate program. Costs could be higher than expected and finding a compatible
location willing to rent out a room for the intended purpose of weekly classes might be
more challenging than determined in this study. Therefore, Clark University and the
Providers’ Council would take on a tremendous amount of financial risk if they paid for
these upfront costs and failed to successfully launch the program.
● Based on the participation of nonmember organizations in the existing HSM Certificate
programs, participation from nonmember organizations may be minimal. The Boston
and Worcester programs recruit 3 to 5 participants combined from nonmember
organizations from among at least 5,500+ human service nonprofits in the combined
areas. Given the distance, a western Massachusetts program is unlikely to rely on wait
list participants from existing programs in the way the Worcester program receives from
Boston.
6
Based on these findings, it is the professional recommendation of the HSM Certificate
Capstone Team to use caution before finalizing plans to expand this program to western
Massachusetts. In addition to the concern over the high cost of the program and other costs
associated with entering into a new region - including marketing, renting of space, and hiring of
additional professional instructors - further studies should help determine if there might be the
necessary recruitment figures needed to successfully launch this project. As not many
organizations were aware of the HSM Certificate program initially, conducting a marketing and
awareness campaign might be considered as a first step in this process, followed by a second
survey to a wider sampling of organizations to more accurately project a successful launch.
Lastly, finding ways to make the program more financially viable and affordable for the many
nonprofits in the area that are in need of such a program is recommended.

7
Clark University HSM Capstone Project
Feasibility Plan
Chapter One: Introduction
Background Information
The Massachusetts Council of Human Service Providers, Inc. (Providers' Council) is a
statewide association of primarily nonprofit private, community-based, care-giving organizations
that provide human services, health, education and vocational supports. The Council offers high
quality public policy research, advocacy, communication and information, education and
training, research and cost saving programs to add value to their members and helps them build
capacity to remain competitive in the industry as well as achieve their objectives. The Council
was founded in 1975 to influence and direct public policy change to support community-based
services. As the state's largest human services trade association, it is widely recognized as the
official voice of the private provider industry. The Council is a membership organization that
receives its primary support from its members and its business partners.
Clark University, located in Worcester, Massachusetts, was founded in 1887 as a liberal
arts-based research university offering both undergraduate and graduate level programs. Well
known for being at the forefront of higher education, Clark is a national leader with a long
history of establishing significant partnerships that help to “break down boundaries between
academia and society, and more deeply attuning students’ learning experiences to the profound
changes taking place in the world today” (Clark, 2017). Clark’s School of Professional Studies
(SPS) offers graduate programs that include a Master of Science in Professional Communication,
Master of Science in Information Technology, Master of Public Administration, and a Certificate
of Advanced Graduate Study, all designed to help students prepare for and take advantage of the

8
changing workplace.
One of the most popular cost-savings programs that the Providers’ Council currently
offers its members is a Certificate in Nonprofit Human Service Management (HSM) Program
provided in partnership with Clark University and Suffolk University. The year-long, graduate-
level certificate program is intended for nonprofit agency staff working in program management,
human resources, administration, and finance capacities. Current participants in the Worcester
and Boston area programs include program managers, residence directors, project managers,
office managers, executive directors, and staff accountants. Registration is open to employees of
Providers’ Council members and non-member nonprofit organizations, and experienced
professionals who would like to enter the nonprofit sector. Clark’s School of Professional
Studies has been offering the HSM Certificate Program since 2005 and has graduated more than
100 future leaders from this program. This feasibility project is being conducted to determine
whether or not the HSM Certificate Program can be successfully expanded to nonprofit
organizations and their employees located in western Massachusetts.
Statement of the Problem
The need to provide professional development opportunities to help grow and expand a
qualified health and human services workforce is a critical issue facing nonprofit organizations
and communities not only locally in Massachusetts but nationally. The growing population of
elderly and people with disabilities is driving the number of people in need of long term services
and supports. Exacerbating this issue is the shortage of qualified and available direct care
workers who are able to provide these services. The increase in demand for services coupled
with the shortage of workers makes it critical for organizations to find ways to retain existing
staff and attract and train new ones.
9
The first group of stakeholders affected by this issue and project are nonprofit
organizations located in western Massachusetts who currently do not have access to a
conveniently located HSM Certificate Program for their staff, therefore potentially negatively
impacting their development and growth. Human services employers find themselves with an
overwhelming number of vacant positions due to the current workforce crisis. According to the
Providers’ Council publication “Who Will Care? The Workforce Crisis in Human Services”,
employers noted that being consistently understaffed impacts their ability to “preserve consistent
therapeutic relationships with clients and consumers; maintain proper staff/client ratios; meet
contractual or compliance obligations; protect the organization’s financial health; expand
services in the community; and provide staff with necessary professional development and
supports to foster job satisfaction.” Employers also indicated their struggle with finding
applicants with the required skills, education or credentials to fill open positions (Citino, 2017).
Therefore, this HSM Certificate program is critical for providers located in western
Massachusetts in order to ensure that their staff have access to employee-sponsored or subsidized
professional development opportunities and is one way that they can look to build capacity and
attract and retain qualified staff.
A second stakeholder group includes health and human services employees, who are
faced with a myriad of burdens resulting from the current workforce shortages including being
“overwhelmed and overburdened.” According to employers, prolonged staff vacancies lead to
“staff stress, burnout, and frustration, which in turn lead to reduced productivity and ultimately
staff turnover” (Citino, 2017). Additionally, the majority of human services workers receive
lower wages than their counterparts in health care settings, and that, coupled with the physically
and emotionally demands of most human services jobs, is more likely to cause them to lose

10
satisfaction with their work and seek employment elsewhere. Employees of these organizations
are in need of opportunities to enhance their skills and feel valued in their work. Having access
to employer-sponsored professional development opportunities as well as tuition assistance that
will allow them to pursue advanced training or degrees is one way to attract and retain a satisfied
workforce.
The third stakeholder group involved in this issue includes the Providers’ Council and
Clark University. The purpose of the Council is to share information and provide resources to
their nonprofit members to help them improve their organizations. Nevertheless, the Council
cannot enable every member to have the opportunity to send staff to an HSM programs due to
geographic barriers. Currently, the Council only offers this program in two different locations:
Suffolk University, located in eastern Massachusetts and Clark University, located in central
Massachusetts. Thus, organizations located in western Massachusetts cannot obtain this
attractive continuing education opportunity for its employees. By expanding the HSM
Certificate Program to western Massachusetts, Providers’ Council will sustain and grow its
membership. Similarly, Clark University has this unique opportunity to expand its student base
and profit margin. Because there is no HSM Certificate Program in western Massachusetts,
failing to extend this program to western Massachusetts could potentially result in missed
opportunities to grow profits and recruit additional students who might likely matriculate into
one of Clark’s graduate level programs after completing the HSM Certificate program.
According to the analysis above, this issue affects nonprofit organizations and their
employees in western Massachusetts, the Providers’ Council and Clark University. Thus, these
stakeholder groups are interested in the issue and want to address it as soon as possible.
However, to address this problem, these groups need to collaborate. The interested non-profit

11
organizations need to support the program by providing useful input and advice about where and
when the program will be best received by their employees. They will also have to be committed
to help subsidize the program through membership fees and recruiting employees to apply and
attend this program. The Providers’ Council needs to find opportunities to establish a new
program in the western Massachusetts so that it can provide more choices for its members and
grow its’ base of support. Clark University will need to find an optimum and financially feasible
approach to expand its course offering as well as the number of potential candidates who are
willing and able to matriculate into one of its graduate programs. Only through the collaboration
of these different groups will the program be established smoothly and create a win-win-win
scenario for all groups involved.
Purpose of this Capstone Project
The Providers’ Council and Clark University’s School of Professional Studies is
interested in expanding its highly successful HSM Certificate program to member and
nonmember organizations located in western, Massachusetts. The purpose of this Capstone
Project is to conduct a feasibility study to determine if Clark’s School of Professional Studies
and the Providers’ Council can establish a western Massachusetts site for the HSM program
based on cost and desirability of the program to member and nonmember organizations in the
region. As there is no HSM Certificate Program in western Massachusetts despite the number of
nonprofits in the area, short-term outcomes for this project included:
● A needs assessment for a Certificate program in greater Springfield/Holyoke area;
● The construction of a financial model for a yearlong program; and
● The development of a high-level feasibility plan with risks, constraints, assumptions and
measures of success for launch in fall 2018.

12
As mentioned previously, the Providers’ Council is a statewide association working
primarily with nonprofit organizations working in the health and human services industry. Due to
their close connection with these organizations, they detected the extensive need for a program
that provides professional development opportunities and linkages to higher education for staff in
the areas of management, human resources, administration and finance. As their main goal is to
improve the human services industry, the HSM Certificate Program has historically served as a
springboard for many employees of the industry to advance their knowledge, skills and careers.
Participants are offered preparation for career growth opportunities, a strengthening of a
professional network among the participants, and credit waivers towards a Master’s in Public
Administration at top colleges in the area at a lower cost.
The Providers’ Council wishes to partner with Clark University to explore the potential
of offering the program in western Massachusetts, particularly in the Springfield/Holyoke area.
The potential expansion of the Human Services Management Program to western Massachusetts
would occur in the fall of 2018 and would involve both the Providers’ Council and the Clark
University School of Professional Studies. The Providers’ Council was instrumental in initiating
this project and Ella Froggatt, Manager of Member Engagement, as the main contact person.
Providers’ Council President, Michael Weekes, has also been closely involved. Mary Piecewicz,
Director of the MPA Program/HSM Certificate Program, has been the main contact at Clark
University as well as the Capstone Advisor for this project.
Description and Vision of HSM Certificate Program
The proposed HSM Certificate Program expansion will be an exact replication of the
Worcester-based program but will be held in the Springfield/Holyoke area: The program will
consist of a year-long, graduate-level certificate program that has been specifically designed for

13
mid-career professionals working in nonprofit organizations located in western Massachusetts.
Recognizing the skills that are necessary for workers to excel in human services management,
the HSM program will include six blocks of classes in the following key subject areas:
● Nonprofit Human Service Management
● Strategic Marketing
● Development for Nonprofits
● Research Methods and Outcomes
● Financial Management
● Ethics and Leadership
Classes will begin in September of 2018 and end June 2019 and will meet once a week
from 9 a.m. to 4 p.m.in the Springfield/Holyoke area. According to the Providers’ Council,
benefits of this program for participants will include:
● Academic training specific to management, evaluation, administration, and finance
responsibilities in a human service nonprofit
● Preparation for career growth opportunities
● A professional network among the participants
● Potential graduate credit waivers to a Master in Public Administration program
Benefits of this program for employers will include:
● Educational curriculum that addresses a HHS organization's needs
● Great employee benefit for committed staff
● May help retain critical staff
● Can increase the capacity of the organization
● Can develop new leadership candidates

14
Registration will be open to employees of Providers’ Council members and non-member
nonprofit organizations, and experienced professionals who currently work in the nonprofit
sector. Agencies sponsoring employee's’ participation in the program will commit to paying the
agency application fee and employees’ tuition, giving enrolled employees paid time off to attend
classes and adjusting work requirements as necessary. In return, students will commit to
attending all classes, completing all assignments, doing program evaluations and remaining with
their current employer for at least one year after completing the program.
Students with a bachelor’s degree who successfully complete the Certificate program
may be eligible to transfer credits toward a Master in Public Administration graduate degree. The
Providers’ Council strives to offer this important program to its western Massachusetts members
at an incredible value; less than the cost of one graduate class, as another way to help prepare
future leaders in human services.
The goal of the expansion program is to enroll 15-17 participants from 33 Providers’
Council member organizations and other nonmember nonprofit human services organizations
from western Massachusetts. Furthermore, both the Providers’ Council and Clark University
would like to see 20% of those who complete the program matriculate into the Master’s of Public
Administration Program in year one; 25% in year two; and one third by the fifth year of the
program.
The mission of the Providers’ Council is to promote a healthy, productive and diverse
human services industry. Consistent with this mission, the vision for the HSM Certificate
Program is to offer high quality education to mid-level professionals in the nonprofit industry
thereby enabling potential growth in participants’ careers and ability to deliver high quality and
accessible services that meet the existing needs of members and clients of this industry.

15
Significance of the Capstone Project
If the Providers’ Council and Clark University are successful in their expansion efforts of
the HSM Certificate Program to western Massachusetts, long-term outcomes for this project
include a viable and sustainable revenue stream for SPS, an extended reach for Providers’
Council, and an increase in the number of professional and leadership development opportunities
for the health and human services workforce. With the current workforce crisis in human
services, establishing a successful Certificate Program is the region is critical to future status of
the health and human services organizations and workforce in the region.
Subsequent Chapters
The following chapters in this feasibility study will examine the current trends in the
health and human services and professional development industries as it pertains to the program,
methods and market information that help determine the need and desired location of the
potential new program, an examination of our findings and suggestions, and lastly,
recommendations for implementation of the western Massachusetts HSM Certificate expansion.

16
Chapter Two: Information and Trends in Human Services Industry
Primary Source Data & Study Methodology
The National Center for Charitable Statistics (NCCS) makes national data on human
service populations and organizations available; organized by state and county. The NCCS is an
organization whose “mission is to develop and disseminate high quality data on nonprofit
organizations and their activities for use in research on the relationships between the nonprofit
sector, government, the commercial sector, and the broader civil society.” (NCCS, n.d.).
Data obtained from NCCS is the basis for the majority of this chapter. Some data has
been compiled and presented in an easily comparable format by NCCS while some data is “raw”
and required additional processing for the purposes of this study. “Working closely with the IRS
and other government agencies, private sector service organizations, and the scholarly
community, NCCS builds compatible national, state, and regional databases and develops
uniform standards for reporting on the activities of charitable organizations” (NCCS, n.d.).
Study Areas
This beginning of this chapter focuses on NCCS data within Massachusetts at the state
and county levels. In order to make comparisons between the existing certificate program in
Worcester and Boston and a proposed program in Springfield or Holyoke, this study combined
county data into three study areas: “Western Massachusetts”, “Worcester County” and “Eastern
Massachusetts”. A map of these areas are shown in Figure 1. Western Massachusetts is defined
by this study as the combination of Berkshire, Franklin, Hampshire and Hampden Counties.
Eastern Massachusetts is defined as Middlesex, Suffolk and Norfolk Counties. Worcester
County stands alone and is not combined with any other county.
Figure 1 - Study Area Map

17
The study areas chosen are similar in geographic area to one another and have a similar
distance to the certificate program existing or proposed within the study area. Worcester County
and Western Massachusetts have similar populations estimated in 2015 (802,688 and 826,364
respectively) while both are much smaller than the counties in the Eastern Massachusetts study
area (3,059,283).
Feasibility
The feasibility of providing a certificate program in western Massachusetts should
consider five main factors: 1) the population of human services needs in the area which drives
the demand for human service organizations, 2) the number and size of human services
organizations in the area which drives the demand for a certificate program, 3) the trends and
factors driving the need for a well trained workforce within the human service industry, 4) trends
and evidence in professional development and workforce training that demonstrate the positive

18
impact the program will have for organizations and employees from western Massachusetts, and
lastly, 5) a market and cost analysis to determine overall interest and viability. This chapter will
focus on information and trends associated with these factors and assess the possible effect they
have on the feasibility of a certificate program.
Population Data Reflecting Need of Human Services Organizations in Massachusetts
Using data from the US Census and NCCS, we compared the number of human
organizations within each area relative to the population and found that western Massachusetts
has a similar ratio of human service organizations than eastern Massachusetts and more than
Worcester County despite the similar population. This may reflect a higher need for human
service nonprofits in western Massachusetts than Worcester County and a similar need to eastern
MA.
Study Area Population (2015 Estimate) # of Human Service Nonprofits per
10,000 People
Western
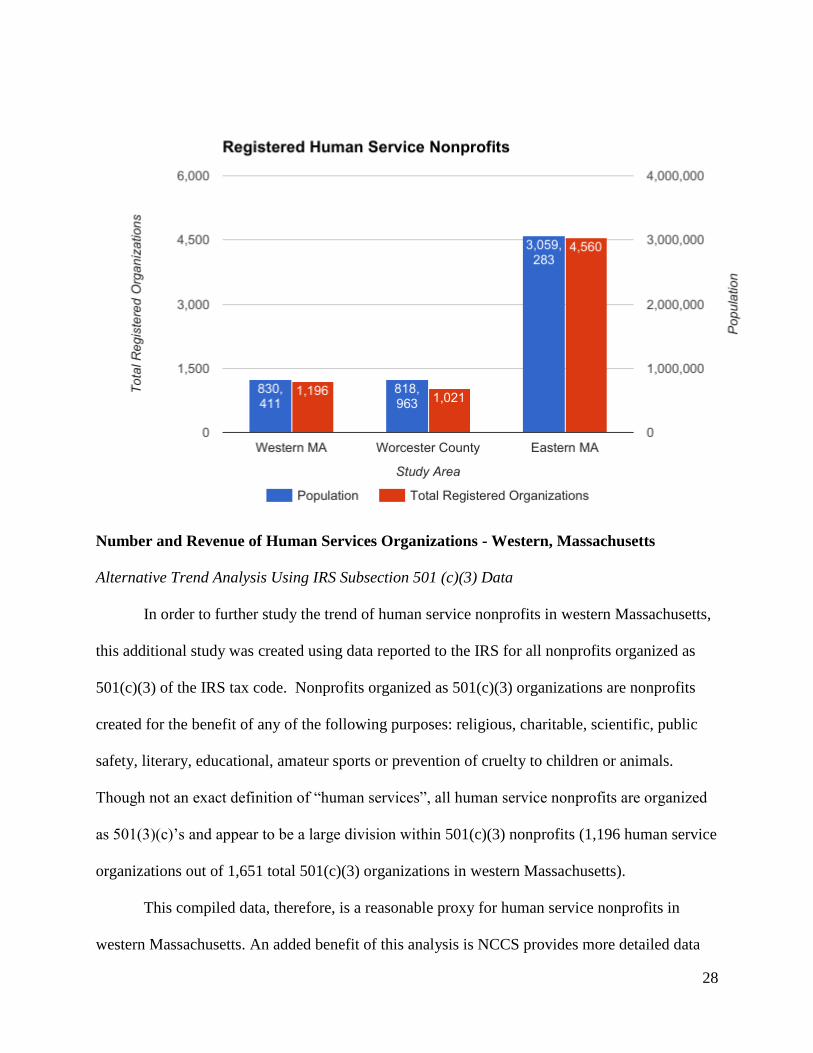
Massachusetts
830,411 14.40
Worcester County 818,963 12.47
Eastern MA 3,059,283 14.91
The Clark program in Worcester relies on overflow participants from the Suffolk
program in Boston. Though eastern Massachusetts has a similar ratio of organizations than
western Massachusetts, the total number of organizations in eastern Massachusetts outnumber
western Massachusetts by nearly 4 to 1 in 2016 (1196 to 4560) (see Appendix G, Figure #18).
Both have more total organizations than in Worcester County (1021). Given the geographic
distance between western Massachusetts and the Boston area, it’s unlikely a program in western

19
Massachusetts would benefit from overflow from Boston in the way the Worcester program
benefits. Feasibility for a western Massachusetts program conservatively should expect
participation from those counties alone.
NCCS has compiled the human service populations within Massachusetts using US
Census Bureau data from 2009 to 2013 (See Appendix I, Figure #21) and comparisons between
study areas are summarized below:
Poverty Rate
Western Massachusetts 11.1 to 17.2
Worcester County 11.0
Eastern MA 6.4 to 19.6
Massachusetts (total) 11.0
Childhood Poverty Rate
Western Massachusetts 12.7 to 28.0
Worcester County 15.2
Eastern MA 7.2 to 28.2
Massachusetts (total) 15.0
Senior Poverty Rate
Western Massachusetts 6.8 to 10.2

20
Worcester County 8.6
Eastern MA 7.0 to 18.7
Massachusetts (total) 9.0
The poverty rate is equal or higher (11.1 to 17.2) among western Massachusetts Counties
than Worcester County (11.0) and the state average (11.0). Eastern Massachusetts varies
between 6.4 (Norfolk County) to 19.6 (Suffolk County). The childhood poverty rate varies being
lower in Hampshire County (12.7) than the state average (15.0) to much higher in Hampden
County (28.0). Worcester County (15.0) is at state average and eastern Massachusetts has
similar wide variability to western Massachusetts (7.2 to 28.2). Lastly, the senior poverty rate in
western Massachusetts (6.8 to 10.2) and Worcester County (8.6) are nearly the state average
(9.0) while eastern Massachusetts has a wide variability (7.0 to 18.7). Given these three
measures of poverty, western Massachusetts appears to be at or higher than poverty rates
elsewhere where a certificate program exists.
Number and Revenue of Human Services Organizations - Nationally
In order to compare the number of organizations within each study area and how they
have changed over time, this study used data from NCCS that classifies all nonprofits based on
their National Taxonomy of Exempt Entities classification. According to NCCS (NCCS, n.d.):
The National Taxonomy of Exempt Entities (NTEE) offers a definitive
classification system for nonprofit organizations recognized as tax exempt under
the Internal Revenue Code. The broad range of their activities includes health,
human services, arts and culture, education, research, and advocacy. The use of
NTEE is key to illuminating the diversity of the nonprofit sector
Human Services organizations are one of ten NTEE Major Groups:
1. Arts, Culture and Humanities
2. Education
3. Environment and Animals
4. Health
5. Human Services

21
6. International, Foreign Affairs
7. Public, Societal Benefit
8. Religion Related
9. Mutual/Membership Benefit
10. Unknown, Unclassified
Within Human Services (#5) are 8 Major Groups which combine to define all human service
nonprofits:
1. Public Protection: Crime & Delinquency Prevention, Legal
Administration & Service
2. Employment/Jobs
3. Food, Nutrition & Agriculture
4. Housing/Shelter
5. Public Safety, Disaster Preparedness & Relief
6. Recreation, Leisure, Sports, Athletics
7. Youth Development
8. Human Services Multipurpose & Other
Registered nonprofit organizations are required to file, and make public, their annual
financial information including total revenue and total assets to the IRS. NCCS compiles this
information and makes it available, organizing it several variables such as NTEE group, location,
revenue level, etc. Private nonprofits are required to file their financial information regardless of
financial status while public nonprofits are not required to report revenue if they are generating
less than $50,000 annually. It is assumed in this study that the number of registered
organizations not reporting their income indicates they have generated less than $50,000. See
the limitations section of this report for further details. A recent study on the state of nonprofits
nationally using this data found that there were 232,385 registered human services nonprofits in
2013, double the amount in 1995 and that total revenues for these organizations were $200
billion in 2013, triple the 1995 amount (Norris-Tirrell 2014).

22
Number of Human Service Nonprofits by
NTEE Group - Nationally, 2013 (Norris-Tirrell 2014)
NTEE Category # of Registered
Organizations
% of Total
Category
# of
Organizations
Filing Form
990
Total Revenue Total Revenue
of Total
Category
Crime 12,176 5% 6,266 $7,173,878,476 4%
Employment 6,566 3% 4,077 14,878,158,406 7%
Food 7,724 3% 4,070 10,348,535,859 5%
Housing 23,787 10% 17,510 22,072,832,824 11%
Public Safety 12,642 5% 6,929 2,430,140,593 1%
Recreation 64,208 28% 30,020 14,400,961,529 7%
Youth Development 27,996 12% 8,594 6,883,231,228 3%
Human Services 77,286 33% 43,270 122,635,151,726 61%
Total 232,385 120,736 200,822,890,641
Human Service Nonprofit Revenue (Nationally - 2013)
Level of Total
Revenue
# of Registered
Organizations
% of Total
Organizations
Total Revenue reported
on Form 990
% of Total
Revenues
< $100,000 140,496 64.9% $1,990,344,997 <1%
$100,000 - $249,999 24,965 11.5% $3,849,756,802 1.9%
$250,000 - $499,999 15,383 7.1% $5,322,659,906 2.6%
$500,000 - $999,999 11,863 5.5% $8,215,093,885 4.1%
$1 - $5,000,000 16,069 7.4% $34,618,838,853 17.2%
$5 - $10,000,000 3,493 1.6% $24,330,446,426 12.1%
$10 - $100,000,000 4,032 1.8% $93,433,446,673 46.3%
Over $100,000,000 143 <1% $30,028,674,962 14.9%
23
Number and Revenue of Human Service Organizations - Massachusetts
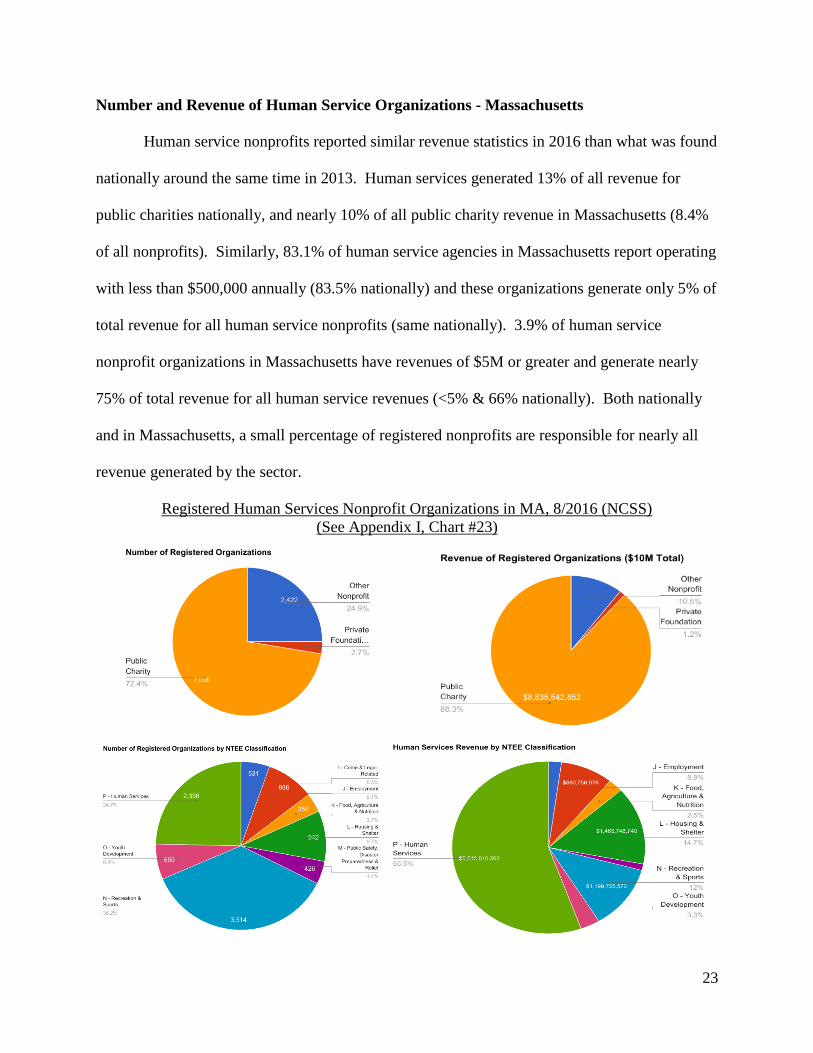
Human service nonprofits reported similar revenue statistics in 2016 than what was found
nationally around the same time in 2013. Human services generated 13% of all revenue for
public charities nationally, and nearly 10% of all public charity revenue in Massachusetts (8.4%
of all nonprofits). Similarly, 83.1% of human service agencies in Massachusetts report operating
with less than $500,000 annually (83.5% nationally) and these organizations generate only 5% of
total revenue for all human service nonprofits (same nationally). 3.9% of human service
nonprofit organizations in Massachusetts have revenues of $5M or greater and generate nearly
75% of total revenue for all human service revenues (<5% & 66% nationally). Both nationally
and in Massachusetts, a small percentage of registered nonprofits are responsible for nearly all
revenue generated by the sector.
Registered Human Services Nonprofit Organizations in MA, 8/2016 (NCSS)
(See Appendix I, Chart #23)

24
To understand how the human service sector in Massachusetts is changing, we compared
the total number of nonprofits in the state along with their revenue over two, 5-year time-periods
between 2006 and 2016. We compared these numbers statewide to the numbers reported within
the study areas of this feasibility report. A summary of the findings includes:
1. Statewide Trends
a. While the total number of organizations statewide fell -5.01% from 2006 to 2011,
the total revenue reported increased by 4.26% and total assets grew by nearly 19%
over the same time-period.
b. There was massive growth between 2011 and 2016. Total number of
organizations statewide grew at 9.22% and revenues and assets grew at more than
triple that rate (30.05% and 33.48%)
2. Comparison between study areas (western Massachusetts, Worcester County, eastern
MA)
a. The total number of organizations decreased at a higher rate in western
Massachusetts (-7.21%) than statewide (-5.01%) or Worcester County/eastern
Massachusetts (-4.69% and -3.01%) from 2006 to 2011
b. Total number of organizations also grew at a smaller rate in western

25
Massachusetts (8.04%) during the same time-period than elsewhere. This may
suggest that organizations in western Massachusetts are more affected by
economic downturns than elsewhere in the state
c. However, during the same time-period, western Massachusetts grew in revenue at
a rate (5.59%) higher than statewide (4.26%) while revenues declined in
Worcester County and eastern Massachusetts. This may suggest that the
organizations in western Massachusetts remaining during economic downturns
are capable of generating revenue; implying there may be a steady need for
human services in the area.
d. The growth in revenue (19.39%) and assets (15.72%) reported in western
Massachusetts between 2011 and 2016 were around half the growth rate
statewide, Worcester County and eastern Massachusetts.
e. Largest growths and decreases over time occur with organizations who do not
report their revenue (assumed to be less than $50,000 annually).

26
3. Limitations to reported data:
a. Not too much else can be considered by looking at variations between years and
levels of revenue due to limitations of the data. While the overall growth in this
time-period is positive, it’s not clear from this data if it’s due to new organizations
being created, existing organizations operating under different levels of revenue,
or a combination of both
b. Total Revenue data is only provided as totals by state and by county. Data is
unavailable to determine, for example, how many organizations within western
Massachusetts operate at a specific amount. An additional analysis was required
for this purpose. See Alternative Trend Analysis section of this report for further
information.
Summary of Human Service Nonprofit Data (Charts)

27
28
Number and Revenue of Human Services Organizations - Western, Massachusetts
Alternative Trend Analysis Using IRS Subsection 501 (c)(3) Data
In order to further study the trend of human service nonprofits in western Massachusetts,
this additional study was created using data reported to the IRS for all nonprofits organized as
501(c)(3) of the IRS tax code. Nonprofits organized as 501(c)(3) organizations are nonprofits
created for the benefit of any of the following purposes: religious, charitable, scientific, public
safety, literary, educational, amateur sports or prevention of cruelty to children or animals.
Though not an exact definition of “human services”, all human service nonprofits are organized
as 501(3)(c)’s and appear to be a large division within 501(c)(3) nonprofits (1,196 human service
organizations out of 1,651 total 501(c)(3) organizations in western Massachusetts).
This compiled data, therefore, is a reasonable proxy for human service nonprofits in
western Massachusetts. An added benefit of this analysis is NCCS provides more detailed data
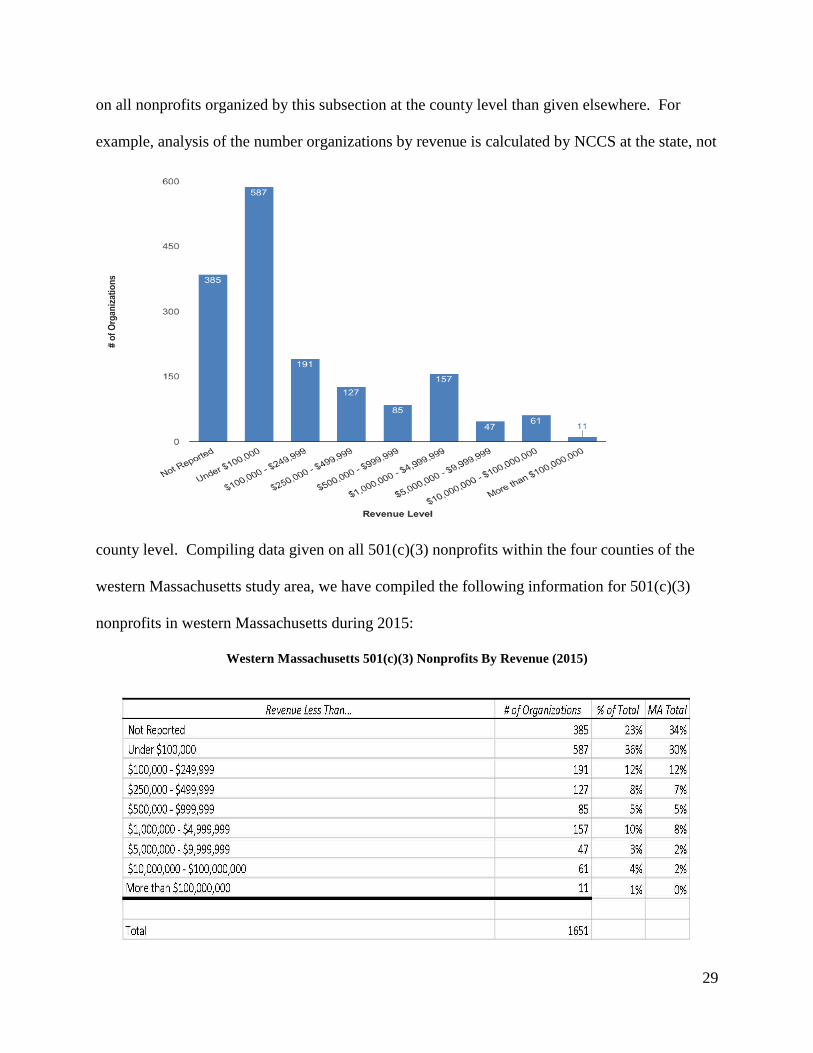
29
on all nonprofits organized by this subsection at the county level than given elsewhere. For
example, analysis of the number organizations by revenue is calculated by NCCS at the state, not
county level. Compiling data given on all 501(c)(3) nonprofits within the four counties of the
western Massachusetts study area, we have compiled the following information for 501(c)(3)
nonprofits in western Massachusetts during 2015:
Western Massachusetts 501(c)(3) Nonprofits By Revenue (2015)

30
This analysis found that organizations in western Massachusetts, sorted by total revenue
in 2015, report revenue similarly to percentages elsewhere in Massachusetts. Within western
Massachusetts, 59% of organizations operate with less than $100,000 which is below the number
found in Massachusetts statewide (64.3%). See Appendix I, Figure 24 for a list of top 40, 501
(3)(c) Organizations in western Massachusetts by Revenue (2015).
Providers’ Council Member Organization’s Revenue
Similar analysis was done for twenty-eight member organizations of the Providers’
Council. Four of these organization revenues had unknown revenues, possibly due to the public
name of the organization not being the name under which they file taxes. In addition, four
organizations within these twenty-eight had multiple organizations with similar names (i.e.
“United Service Organizations USO Council of Pioneer Valley” versus “United Way of Pioneer
Valley”). These additional organizations had revenue in 2015 ranging from $636K to $12.5M
however their revenue was not considered as part of this analysis.
Provider Council Member Organizations - 2015 Revenue (Western Massachusetts)

31
A significant number of organizations within Providers’ Council (86%) generate over
$500,000 in revenue during 2015. This is a substantially higher percentage of organizations than
the total revenue generated by human service nonprofits in western Massachusetts during 2016
(22%) and statewide (17%).
Trends in Human Services Industry Driving Need for Professional Development
Growth in Human Services Workforce
The human services industry in Massachusetts has seen unprecedented growth in the size
of its workforce over the past twelve years. Originally projected to increase by 37% over this
time-period, the industry has actually seen an astounding 58% increase in the number of
available jobs that have grown
from 104,045 in 2004 to almost
164,000 in 2014 (Citino, 2017).
The human services sector - a
subset of the health care and
social assistance sector in
Massachusetts - is the fastest
growing sector in its category and
32
accounts for 27 percent of all health care and social assistance sector jobs in the Commonwealth
and represents 4.4 percent of all total employment in Massachusetts. Despite the economic
downturn experienced over the past twelve years in Massachusetts, employment in the health
care and social assistance sector has grown over 25% compared to an increase in overall
employment growth of 3.6 percent statewide.
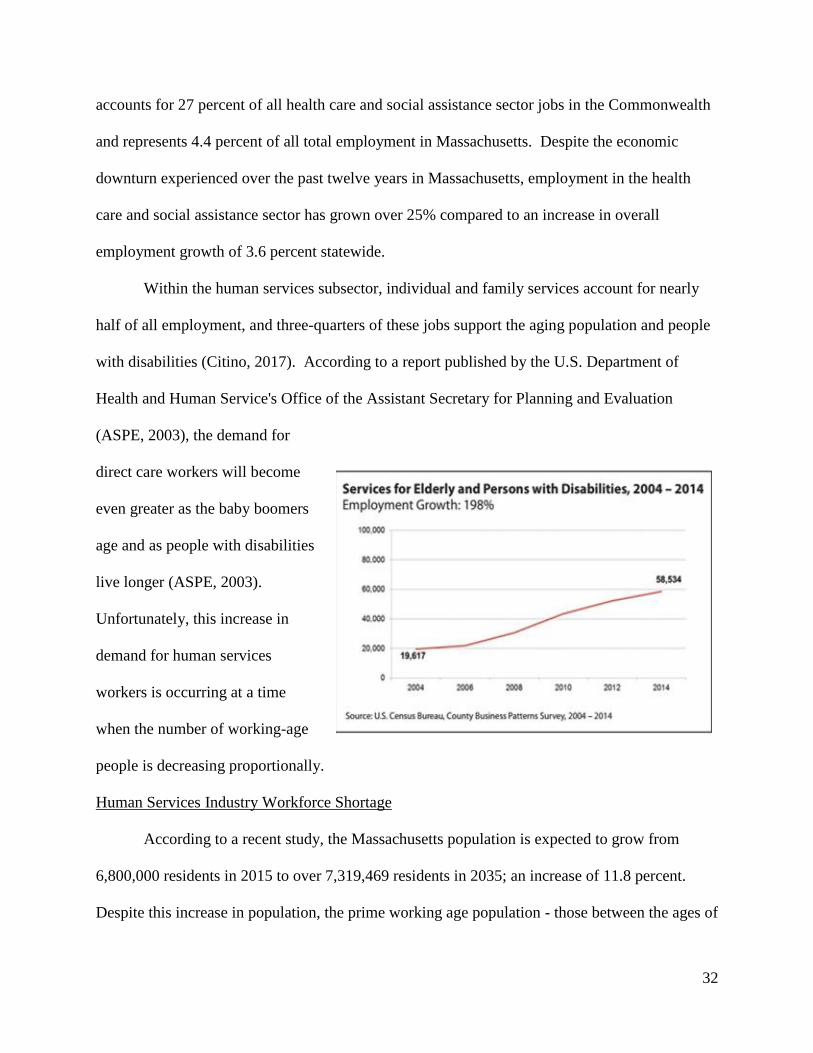
Within the human services subsector, individual and family services account for nearly
half of all employment, and three-quarters of these jobs support the aging population and people
with disabilities (Citino, 2017). According to a report published by the U.S. Department of
Health and Human Service's Office of the Assistant Secretary for Planning and Evaluation
(ASPE, 2003), the demand for
direct care workers will become
even greater as the baby boomers
age and as people with disabilities
live longer (ASPE, 2003).
Unfortunately, this increase in
demand for human services
workers is occurring at a time
when the number of working-age
people is decreasing proportionally.
Human Services Industry Workforce Shortage
According to a recent study, the Massachusetts population is expected to grow from
6,800,000 residents in 2015 to over 7,319,469 residents in 2035; an increase of 11.8 percent.
Despite this increase in population, the prime working age population - those between the ages of

33
20 to 64 - is only expected to grow 1.2% during the same time-period. In fact, despite this slight
increase, the prime working-age population with labor force participation rates over 60% will
decrease by over 40,000 available workers (Citino, 2017).
Massachusetts Projections Employment (2014-2024)
and Prime Working-Age Population (2015-2025)
*This table illustrates the increase in employment vs. the decrease in working age people,
keeping in mind that not all people of prime working-age are in the labor force.
Employment 2014 Employment 2024 Change Percent
3,570,423 3,775,176 204,753 5.7%
Population 20-64
2015
Population 20-64
2025
Change Percent
4,144,773 4,107,983 -36,790 -.09%
Source:Massachusetts Department of Labor and Workforce Development. Long-term occupational projections. 2014-2024.
Retrieved from: http://lmi2.detma.org/Lmi/projections.asp#Long-Term%20 Occupational%20 Projections.
UMass Donahue Institute. Population Estimates Program. Retrieved from: http://pep.donahue-institute.org
As a result, the projected number of Massachusetts residence in the workforce will most
certainly not meet the demand for the projected number of employment positions. Even with
older adults remaining in the workforce longer, there will still be a shortage of available workers
to meet the demand for the number of jobs available in the state.
For the human services industry, a workforce crisis is growing as vacant positions
negatively impact quality of services and quality of care for some of the Commonwealth’s most
vulnerable citizens. Human services providers are struggling to hire and retain qualified staff
and recent studies have shown that “72 percent report that it has become increasingly more
challenging to fill job openings over the past three years, and 56 percent report that it has been
difficult or extremely difficult to fill openings over the past 12 months” (Citino, 2017).
Provider organizations report several factors that challenge them in hiring and retaining

34
qualified staff including that “81 percent of employers report that applicants lack required skills
and 63 percent report that applicants lack required education or credentials.” Additionally, low
wages and competition with other human services organizations or government agencies (that
frequently pay higher wages than the human services sector) are other factors.
Impact of Workforce Crisis
The workforce crisis in the human services industry has far reaching implications.
Prolonged staff vacancies leave existing staff feeling stressed and overwhelmed, less productive,
and more inclined to leave their position. In the article titled Voluntary Turnover in Nonprofit
Human Service Organizations: The Impact of High Performance Work Practices, the struggle
for existing staff when turnover is high is well explained: “client demand is not going to diminish
and services cannot simply be reduced when an employee chooses to leave; the other employees
in the organization have to take up the slack in client services created by the departure.” In
addition to existing staff burnout, voluntary turnover is also extremely costly for organizations
who must spend large sums of money recruiting, selecting, and developing new employees. Most
importantly, large staff vacancies impact quality of care and quality of services for clients
(Citino, 2017).
Addressing the Workforce Shortage: Ways to Retain and Attract Qualified Workforce
According to the U.S. Office of Health and Human and the Department of Labor, several
recommendations should be adopted in order to retain and attract a qualified human services
workforce and address the demand for, and lack of supply, of these workers that will only
continue to grow more dire in the coming years. These recommendations include: 1) Finding
new sources of workers; 2) Initial and continuing education of workers; 3) Compensation,
benefits, and career advancement; and lastly 4) working conditions and job satisfaction.

35
Providing new and existing human services workers with a more robust array of professional
development opportunities will therefore help satisfy many, if not all, of these recommendations.
Trends in Professional Development/Skills Training for Human Services Workforce
As the previous section indicates, as the non-profit human services industry grows in
Massachusetts there is increased demand for highly skilled and competent employees.
Organizations such as the Providers’ Council and its affiliates offer comprehensive professional
development programs like the Human Service Management Certificate Program. Taking part in
these professional training programs directly increase both employee competency and overall job
satisfaction (Thaler, 2016), which translates into a more effective and efficient organization
overall. Professional development trainings, “help in the development of leadership in
organizations, robust organizational structure, and in better integration of strategy (Jha,
Bhattacharyya & Fernandes, 2016).” The trend of providing effective training for the nonprofit
human service industry is growing not only in the United States but globally as well, allowing
for agencies worldwide to feel the benefits of a competent trained workforce.
One of the biggest overarching trends in professional development within the human
service sector is organizations partnering with other agencies. This practice is taken directly from
trends within the for-profit sector. Many for-profit organizations recognize that partnering with
other organizations, both from within and outside of their sector, actually improve employee
competency and knowledge by increasing resources at their disposal and opportunities for them
to work together (Wiesen, n.d.). Erin Wiesen, in Trends in Human Services; Professional
Development, Competition for Funding and Staff Positions in the Field, writes, “Just as human
services agencies collaborate to pool resources, staff, and ideas; it may be beneficial for
collegiate entities to partner the same way.” This trend was recognized and adopted by many

36
non-profit organizations including Providers’ Council, Clark University and Suffolk University
to create a mutually beneficial partnership that promotes all organization's missions. The Human
Service Management Certificate Program is a culmination of this partnership and collaboration.
A negative trend in the non-profit human service industry that is affecting professional
development is the growing fiscal strain many organizations are experiencing. Due to the global
economic crises in the last decade, many non-profit and publicly funded organizations are
experiencing limited monetary resources. The shrinking public and governmental support are
causing many non-profits to restructure and reevaluate their organizational strategy (Mataira,
2014). This could be seen as a detriment to the HSM Certificate Program, with limited resources,
many organizations are focusing their monetary resources on activities that further their mission
statement, rather than “superfluous” activities such as trainings and professional development.
However, many nonprofits that have survived the recent economic crises have learned
from their mistakes and are reorganizing their organizations to promote stability and
sustainability in the face of limited governmental and public funding (Mataira, 2014), with other
organizations following their lead. One of the ways organizations are improving their
sustainability and longevity is through leadership training and professional development
(Mataira, 2014). With organizations training their leadership and management through programs
such as the HSM Certificate Program, the organization reaps long-term benefits from the deep
insights and innovative ideas of these trainings. In Human Resource Development Management
and Training as Antecedents for Strategy Integration, the authors state, “The concept of
leadership was about integration and mobilization of individuals at different levels of the
organization.” Through leadership and management training these individuals learn new
techniques and skills to develop social technologies that help their personal careers, the

37
sustainability of their organization, and also the populations they serve (Mataira, 2014). By
having the leaders and management of these agencies engage in trainings they can disseminate
their learnings throughout their organizations.
To fully understand the benefits of quality professional development and training, the
project team looked at what trends have been creating the future of successful professional
development programs. In an article, Designing Professional Development that Works, a
research team identified six factors to successful professional development based on empirically
based evidence regarding growing trends within professional trainings. These factors are dealing
with the form of the training, the duration, type of participation, content focus, coherence, and
active learning (Birman, 2000). Many of these aspects are interrelated and complement one
another. If these aspects are done well they can create a highly effective and successful training
program.
The research team found the literature expressed that traditional forms of training tended
to be less effective than “reformed” trainings, such as online or alternative trainings. However,
they went on to discuss that the true effectiveness of a training is the engagement of participants
in learning activities, meaningful practices and relevant content that they can apply to their job.
The research team’s analysis showed that when traditional trainings incorporate these active
learning practices they are equally as effective as reformed trainings (Birman, 2000). The next
aspect that contributes to success is the duration of the training. The longer the training, the more
content is able to be covered, more active learning can happen, and more opportunity for the
knowledge to be applied in the job and then reevaluated in training.
In the research team’s analysis of the most successful type of participation they found
that collective participation increased the amount of knowledge acquired as well as the ability to

38
apply it to real-world scenarios. Collective participation (or a cohort group) allows for
professionals from similar backgrounds to come together and learn from one another's
experiences, improving the overall competency of all participants. In Human Resource
Development Management and Training as Antecedent for Strategy Integration, the authors
write, “The practice.. encouraged individuals to be proactive and to be team players.” The skills
learned from this cohesive teamwork translates directly into the participants jobs as well. The
next factor to a successful training is content and how relevant it is to those engaged in the
training. The research showed that if the content of the course was tailored to the backgrounds
and experiences of the participants the more the meaningful learning it became. Due to the
“human service management” aspect of the HSM Certificate Program we can be assured that
many of the individuals in the program come from similar backgrounds in the human service
industry, allowing for the content to be relevant to all involved.
The most powerful indicator of learning benefits from professional development is the
amount of active learning that the participants are engaged in. Active learning encourages
participants to “become engaged in meaningful discussion, planning, and practice as part of the
professional development activity” (Birman, 2000). Active learning consists of leading
discussions, planning lessons, group activities, case studies, and practicing simulated events. The
final aspect that makes an effective training is the coherence of learning content and the real-
world application. Research has shown that when the content of a training is more relevant to
policies and professional experiences that the participants face on a daily basis in their jobs, the
more likely the training and learning is going to be beneficial for them. Successfully
implementing these trends in professional development training, such as the Human Service
Management Certification Program, correlates directly to an educated, competent workforce.

39
To go in further detail with the trends and factors that create a successful professional
development our project team looked at global trends as well. A study done by the Australian
Institute for Teaching and School Leadership (AITSL) found 50 examples of innovative training
models in 10 separate countries. These original trainings were analyzed in terms of features of
innovation in their models. The AITSL found sixteen distinct features that fostered innovation
within these training models. The features the AITSL found were as follows; collaborative,
individual, face-to-face, remote, required, offered, self-directed, facilitated, situated,
personalized, intensive, sustained, formal, informal, certificated, and incentivized (Goddard,
2014). It should be noted that the importance of these features is how they are combined and
used together.
Some of the most innovative and successful companies utilized combinations of these
features that seem incongruous and counter intuitive, however these combinations deliver some
of the most unprecedented results. For example, Pixar University uses a method that combines
individual, self-directed, personalized, situated, offered and incentivized factors. This means that
the individuals engaged with this training pursued their own projects and other trainings, while
also actively contributing to the knowledge base and intellectual capital of Pixar University. Due
to the self-directed training style, the employees easily align their own motivations and needs
with Pixar’s organization's culture (Goddard, 2014). These results may be seen as limitations to
successfully implementing a “traditional” professional develop model in Western Massachusetts.
However, as previously stated, the effectiveness of these trainings is how these features are
combined and utilized.
Using the features AITSL found in the professional development programs we can
categorize the Human Service Management Certification program as collaborative, face-to-face,

40
offered, facilitated, situated, intensive, formal, and certificated. The HSM Certificate Program
takes “traditional” learning and adds a collaborative and team aspect to the learning. The strong
cohort aspect of this learning environment has been shown to improve vital skills that can be
easily translated to the workplace. Some of the tangible benefits of the cohort model are it is
student-centered, allowing for the participant to be a student and a teacher, effectively allowing
the students to explore areas and topics that are relevant to the individual (4 Ways Cohort
Models Benefit Graduate Students, 2015). With the most useful benefit of the
collaborative/cohort model is the building of a professional network and relationships with other
professionals (4 Ways Cohort Models Benefit Graduate Students, 2015). These relationships
allow the participants to successfully improve their career development and future advancement.
Another unique feature of the HSM Certification Program is that it will be an offered, or
voluntary, professional development opportunity for employees of human service programs.
Much like the training at Pixar University, by allowing for employees to choose whether or not
they would like to be involved with this program it will foster a greater sense of self-agency and
self-direction, directly resulting in positive contributions to the participant’s organization
(Goddard, 2014).
Online vs. Classroom
Professional development offers an opportunity to advance one’s career, learn new skills,
and improve the capabilities of an organization. To engage in additional training such as this
while balancing a full-time job is no easy task. Students in this position have to find time to
incorporate course work with their normal work routine. This aspect alone is why there can be
contention between whether online or classroom programs would be the best option for a
working professional. People tend to learn in different ways so determining the best option is

41
untimely up to the person, their style of learning, and their availability. However, with online
learning and traditional classroom learning there are a variety of benefits and faults that should
be considered when determined the right approach to take for the collective group.
Classroom programs for some offer an experience that can be more effective as they
apply to all of the senses. Being in a classroom you can see and listen to the instructor, observe
presentations, and engage in face-to-face group discussions (Lunce). People that need this type
of interaction feel that they can focus better and have a more effective style of learning. Beyond
this a student can also form relationships with other students around them which could come in
useful in the future. This program is catered towards working professionals in the field of human
services, so while attending this program in a classroom they can network with others in their
field. This networking could be very useful because the students enrolled in the potential western
Massachusetts program live and interact in the same location. Their organizations could
therefore potentially work together for similar causes where they might not have before (Lunce,
2006).
Traditional education also assists students in establishing a productive schedule and an
enhanced sense of discipline. By having to physically arrive on location and take time out of the
day a student now has to keep alert and focused in order to grasp the material being taught
(Lunce, 2006). With online classes, there is the potential to get behind in work and wait to the
last minute in order to address assignments. Classroom education is not perfect in regard to this,
but for a working professional who is taking the time to improve their education and career they
will have extra motivation to remain ahead. By establishing a schedule that works students may
even be able to function better at work because they are must remain organized in order to meet
fulfill their new academic obligations away from work.

42
Classroom programs certainly have their advantage for a number of reasons and may
prove to be more effective than online learning occasionally. However, online learning has taken
a significant step forward over time and is considered particularly useful by some. For one thing
taking online classes allows for a lot of flexibility. A person with pre-existing time commitments
such as work or family may found this more appealing. You can mold the classes around your
schedule instead of being forced to take time out of your busy day to attend a class. This actually
sounds like something that might be an appealing option for working human service
professionals. With their jobs being essential not only to them but those in the public that rely on
their availability it makes sense that having flexibility to attend a program in this manner would
work. There would be no need to worry about getting somewhere in time, dealing with traffic,
parking the car, or leaving work early (Milligan, 1999). From first impressions, it would appear
that an online program would work perfectly with the desired demographic.
Online learning has been increasingly getting better as new and innovative platforms
have enabled interaction in a totally new way. Videos allow for a student to see the content and
learn at their own pace while still feeling connected to material. In many ways, the quality of an
online course can even be better than a traditional classroom. All the material posted by the
instructor is directly tied into the message of the course with zero room for any other
distractions. Where in traditional classrooms an instructor could be tired or sick and a lecture
could fall off into another topic, online courses are prepared in advance and maintain the utmost
quality (Milligan, 1999). Taking an online course allows the student to concentrate only on the
essential material instead of dealing with the distractions of a classroom.
Another benefit to online learning is that it can be very economically efficient. Money
spent on tuition and books are one thing, but a student doesn’t have to worry about spending
43
money on extra materials or driving to class. A lot of information can be made available online
too which could even rule out the need for purchasing books. There are also economic
advantages for the institution conducting the courses. No money needs to be spent on renting
classroom space or worrying about utilities. Just paying the instructor and properly enrolling
students’ takes stress away from any other economic tangibles that could occur while conducting
a course. The only necessary thing that does become a concern though is whether the product is
of high quality and garners the student’s attention.
In order to create the best online course an instructor needs to make sure that there is a
level of connection between themselves and the students. Without face-to-face interactions
conversations with the instructors will usually consist of emails and comments on assignments. If
a student slips in their performance it is up to them to approve their situation and if they are
unsure of something it is up to them to reach out for help. While this is also true for classroom
learning, it becomes increasingly difficult for online learning because sometimes things are
better explained in person than through an email. Tutoring and assistance for online programs
also becomes a challenge especially if there is no office to meet with the instructor for help. This
places a lot of responsibility on the instructor to diligently maintain the course and make
adjustments when necessary in order to better cater to the students perspective (Milligan, 1999).
Professional development for working employees can be a difficult thing to manage
which is why deciding on which style of learning is usually based on what works for them. There
are benefits and faults to both classroom programs and online programs. The institution
conducting the program has to find the route to take that best works for them but what will also
attract the most potential students. For professionals in the field of human services in particular
time and resources can be limited in which option than can take if they are able to enroll in a

44
course at all. Likewise, an institution conducting the course has to operate within its means and
therefore must go with an approach that suits the audience they are catering to. Instructors surely
have they own preference like the students but while they may have say it is largely up to higher
powers which dictate which a class will be in a classroom or online.
The whole point of professional development is to provide additional education to current
and potential leaders. People in this position need to be facilitators within their occupation and be
able to manage multiple tasks. They also need to be able to interact and deal with multiple
people, personalities, and situations. For human services professionals, in particular their job is
all about helping people and working to improve human needs within their individual area of
focus. Through human service job postings in the western Massachusetts most regardless of level
will indicate that being able to interact with others from diverse backgrounds is a primary
requirement (indeed). In addition to that, skills such as being able to work together as well in
groups are quintessential for success.
The human service profession is one where interaction and working with others is an
essential component to the job. Working will certainly be a challenge to balance while attending
professional development training, but classroom learning might be better suited for these types
of students instead of online. Even with all the benefits that online presents it still does not have
the level of interaction and group work that would be better suited for employees in the field of
human services. Being able to take directly from experience in the class and apply to their jobs is
something that will aid greatly in the overall performance of the organizations they represent.
This is something that is lost on online learners because your education is dependent on how you
go about completing the work at your own pace. Interaction with classmates is possible online,
but you’re unlikely to have as successful results as you would get in the classroom.

45
Chapter Three: Methods and Market Research
Methodology
To create a feasibility plan for the Human Service Management Certification program in
Western Massachusetts, our project team, with the input of Ella Froggatt at the Providers’
Council and Mary Piecewicz from Clark University, conducted a two-pronged research
approach. The first aspect of our research was primary source research, which included lit
reviews from academic sources, in depth financial analysis, and finding locations and pricing for
where the HSM program would be held. The second aspect was a survey which allowed the
project team to get input from the projected target market in western Massachusetts, this survey
would be used to support or deny claims found in the primary source research. By utilizing both
the direct survey and the primary source research the project team was able to create realistic and
accurate feasibility predictions and recommendations for Clark University and the Providers’
Council regarding the expansion of the HSM Program into Western Massachusetts.
To begin our project the research team conducted thorough and comprehensive primary
research. This research included exploring trends within the nonprofit sector (from a national
level to Western Massachusetts), trends within professional development programs, Western
Massachusetts nonprofit organizations’ finances, and potential locations for the HSM program.
This primary source research created the general framework for the direct market research, as
well as gave us complementary data to support or refute what we found in the survey. By having
the primary source research, it allowed for a more full and extensive feasibility plan regarding
the Western Massachusetts HSM Program.
In order to directly evaluate the market for the want and need for the Human Services
Management Certificate Program in Western Massachusetts our project team created, distributed
46
and analyzed a comprehensive survey for human service non-profit organizations in the
Springfield and Holyoke area. We began working on this survey by conducting preliminary
research about the Human Services Management Certificate Program, human service nonprofits
in Western Massachusetts and the Providers’ Council. This research was followed by an
interview with Ella Froggatt from Providers’ Council to gather input from our main stakeholder.
From the research and the interview with the Providers’ Council we created our survey
questions. These questions ranged in topics from the number of staff in the organization, to the
challenges the organization faces with providing employee development programs. We further
developed and strengthened the survey with input from both the Providers’ Council, their editor,
and Mary Piecewicz at Clark (see Appendix C for full survey). The next step of our survey was
to get approval from the Internal Review Board, or IRB. The IRB process is in place to ensure
there are no ethical or moral issues with the questions or format of the survey and usually takes a
week to receive approval.
During the IRB approval process we compiled a list of 71 randomly selected non-profit
organizations in the human services sector within the Springfield and Holyoke area. The survey
was to be distributed by the research team to these organizations as soon as the IRB approved
our questionnaire. Additionally, the Providers’ Council would take the lead in distributing the
survey to 33 Providers’ Council member organizations from the same catchment area. It should
be noted that in order to avoid duplication, the project team identified PC members from the
catchment area as listed on their website and cross-checked with our random list.
We submitted our survey/questionnaire to IRB on Friday, March 10th. Our project team
expected a response within the week in order to distribute the survey on Friday, March 17th. On
Tuesday, March 14th the project team learned from the IRB that a change was needed on a

47
section of our questionnaire, which delayed our ability to distribute the survey on the planned
date. The survey with the IRB edits was once again submitted to the board for approval. On
Monday, March 20th we received full IRB approval, and the survey was distributed to our
randomly selected organizations as well as the PC member organizations. The survey would be
open for a week, from March 20th to the 27th. The survey was distributed en masse to
nonmember organizations on Monday, March 20th, from a Clark email of one of our project
team members. The Providers’ Council distributed the survey to member organizations on the
same day through an individual personalized email from Ella Froggatt. A reminder email was
sent by the project team on Thursday, March 23rd and by Ella Froggatt on Wednesday, March
22nd through the PC’s weekly e-newsletter. After the responses were collected on Monday,
March 27th, our project team analyzed the survey results. Our research team received additional
survey responses after our deadline of Monday, March 27th, but for the purposes of our analysis
we only focused at the results from March 20th to the 27th.
For valid and useful data, the research team was aiming for a response rate between 10-
20% from both member and nonmember organization. Out of the 104 surveys sent out, three
nonmember email addresses were invalid and the survey email “bounced,” making the total
number of surveys distributed 101. In total, there were responses from 11 member organizations
and 6 nonmember organizations, making the overall response rate around 16%, with a 33%
response rate from member organizations and around 6% from nonmembers. Sixteen
organizations responded to our survey, 11 Providers’ Council members, making up around 65%
of the responses, and 6 nonmember organizations, making up around 35% of responses.
The results were compiled and analyzed by our research team. Each question was broken
down by member and nonmember organizations in order to have more specific and applicable

48
data. Below is a summary of our total results, for both member and nonmember organization.
○ Service Population
■ Children and Families - 9 Organizations
■ Mental Health - 8 Organizations
■ Developmental Disabilities - 8 Organization
■ Substance Abuse - 6 Organizations
■ Homelessness - 5 Organizations
■ Elders - 4 Organizations
■ Veterans - 4 Organizations
■ Incarceration - 2 Organizations
■ Domestic Violence - 2 Organizations
■ Other - 1 Organization
○ Revenue
■ Estimated Total Revenue (Q33)
● Less than $500,000 - 0 members, 4 nonmembers (23.53% Total)
● $500,000 - $1M - 4 members, 1 nonmembers (29.41% Total)
● $1M - $100M - 7 members, 1 nonmembers (47.06% Total)
● Greater than $100M - 0 members, 0 nonmembers (0% Total)
● No Answer - 0 members, 0 nonmembers
○ Staff Positions
■ Less than 10 - 0 members, 4 nonmembers (23.53% Total)
■ 10 - 50 - 3 members, 0 nonmembers (17.65% Total)
■ 50 - 100 - 2 members, 0 nonmembers (11.76% Total)
■ More than 100 - 6 members, 2 nonmembers (47.06% Total)
■ No Answer - 0 members, 0 nonmembers
○ Interest in professional development
■ What challenges are there with development? (Q12)
● Order of importance (All Organizations)
○ High Costs (5)
○ Availability of local programs (3)
○ Scheduling for coverage (2)
○ Tuition Reimbursement (1)
○ Obtaining paid time off from work (0)
○ Other (0)
■ Do your organization offer incentives for higher education? (Q16)
● Yes - 5 members, 1 nonmembers (35.29% Total)
● No - 6 members, 5 nonmembers (64.71% Total)
○ Interest in the program
■ Were you familiar with HSM Certificate program? (Q19)
● Yes - 5 members, 0 nonmembers (31.25% Total)
● No - 6 members, 5 nonmembers (68.75% Total)
● No answer - 0 members, 1 nonmembers
■ Has anyone in your organization participated in the HSM Certificate
program? (Q21)
● Yes - 2 members, 0 nonmembers (40% Total)

49
● No - 3 members, 0 nonmembers (60% Total)
● No answer - 6 members, 6 nonmembers
■ Has anyone in your organization participated in a program similar to the
HSM Certificate program? (Q23)
● Yes - 0 members, 0 nonmembers (0% Total)
● No - 0 members, 3 nonmembers (100% Total)
● No answer - 11 members, 3 nonmembers
■ How interested are you in a Western Massachusetts Program? (Q4)
● Very Interested - 4 members, 1 nonmembers (29.41% Total)
● Interested - 7 members, 3 nonmembers (58.82% Total)
● Not Interested - 0 members, 2 nonmembers (11.76% Total)
● No Answer - 0 members, 0 nonmembers
■ Would you consider enrolling staff in future years? (Q6)
● Yes - 2 members, 2 nonmembers (25.00% Total)
● No - 0 members, 1 nonmembers (6.25% Total)
● Maybe - 8 members, 3 nonmembers (68.75% Total)
● No Answer - 1 members, 0 nonmembers
■ Factors influencing decision to enroll staff? (Q10)
● Order of importance - Member Organizations (mean value; least to
most important)
○ Transportation (1.67)
○ Schedule (3.09)
○ Length of Program (3.10)
○ Distance (3.80)
○ Types of Classes within program (3.90)
○ Cost (4.50)
● Order of importance - Nonmember Organizations (mean)
○ Length of Program (1.40)
○ Transportation (2.50)
○ Distance (3.50)
○ Types of Classes within program (3.50)
○ Schedule (3.80)
○ Cost (5.00)
After completing the analysis of our survey the research team had some observations
about the results. The first is the relatively small sample size of the survey. Out of the 1196
registered human service nonprofits in Western Massachusetts, we sent the survey to 101
organizations and got a response from 16, which is only around 1% of the total human service
nonprofits in our target area. However, the categories of “service population” came directly from
the Providers’ Council website, meaning that all the organizations surveyed were in the human

50
service sector and our survey was not cross contaminated with any other nonprofit sectors.
Out of the organizations we surveyed 75% of them make more than $500,000 per year in
revenue, and 100% of the Provider Council member organizations make more than $500,000 per
year. This percentage of organizations making more than $500,000 is high. In Western
Massachusetts, only 22% of human service nonprofits make more than half a million and only
17% statewide. These results tell us that these are large organizations, which is further supported
by the results that 59% of the responding organizations have 50 or more staff members. In these
large organizations about a third, 35%, offer incentives for professional development, citing the
availability and cost of local programs as the top reason for offering incentives.
Within the organizations that responded the interest for a Human Service Management
Certification Program is high, nearly a third of the organization's (29%) were interested and 25%
would consider enrolling staff in the future. However, most of the organizations, 69%, were
unfamiliar with the HSM Program from Providers’ Council, with Providers’ Council members
being the only organizations familiar with the HSM Program. Although 50% of the responding
Providers’ Council members had a staff member enroll in the HSM Program.
Market Information
The Providers’ Council currently offers the Worcester and Boston HSM Certificate
Program through Suffolk and Clark University respectively. At this present moment, ten
organizations within Providers’ Council, eight of which are based in Worcester, are enrolled in
the program at Clark University. The existing program in Worcester is mostly made up of
member organizations with a few (two to three) employees from non-member organizations.
Currently, thirteen organizations are also participating in the program through Suffolk
University. According to recent data collected, the Suffolk program runs at full capacity with the

51
overflow sent to Clark.
This program, according to the Providers’ Council, have been beneficial to both the
employees participating in the program and the organizations employing them. Employees tend
to stay with their organization's longer and often earn promotions within the organization. The
30% discount available to these employees encourages them to pursue the Master’s program
after they graduate from the certificate program. A supportive network which is established
between students and staff encourages learning beyond the classroom which ultimately allows
for the improvement of aspects across their organizations.
Despite these successes of the programs, however, Providers’ Council finds that dropout
rates are continuous in the Clark program. A number of students, two or three on average, drop
out of this program because they don’t consider the difficulty of the program or neglect the issue
of transportation and the time and effort involved with commuting. These dropout rates
highlighted the need for a program in western Massachusetts. Without a campus in the
Springfield area, Clark University lacks the physical infrastructure in Western Massachusetts
required to run a program. Classroom space, computers and access to the internet would need to
be acquired or leased. Possible infrastructure could be leased from other universities or
municipalities including community centers or public libraries. Clark utilizes their campus for
the Worcester program while Suffolk enters agreements with municipalities to conduct the
Boston area program. Lastly, instructors for a Western Massachusetts program are needed;
preferably instructors located in the Springfield area.
Information on Competitors
The main competition for the HSM program in Western Massachusetts are existing colleges
or universities in the area. These institutions include private colleges, much like Clark

52
University, community and technical colleges as well as state universities. These degrees cover a
wide range of human services topics and fields of study. Some of the degrees found were greatly
similar to that which Clark University offers, with the bulk of the coursework focusing on
management, organizational development and nonprofit administration. Some of these programs
were Masters in Management or MBAs with a concentration in nonprofit work, while others
were general human services programs. Amongst the competition, some certificate programs are
available. For example, the Supervision and Leadership in the Helping Professions is a
certificate program offered through Holyoke Community College.
Despite the many similarities between programs, several of the degrees in Human
Services Management were only targeting undergraduate students or individuals just aiming to
enter the human services industry. In addition, many of the course work which these programs
offer have a different focus from the HSM program available through Clark University. The
main focus of their courses were on sociology and psychology coursework with an opportunity
to take some management or administration class as electives.
The length of the program also stood out as a significant difference between the HSM
program and existing programs in the western Massachusetts area. Many colleges promote the
length of their programs to be of around 20 months, considering a full course load during every
semester. In this respect, the most significant difference was the potential credit waivers to a
Master in Public Administration program available to HSM graduate. None of many of the
competing courses offered across western Massachusetts offered students the option to
potentially transfer course credits from prior certificate or licensing programs. These main
competitors to the potential HSM program in western Massachusetts are mainly located within a
20-mile radius of the cities Holyoke and Springfield. Other locations such as Amherst were also
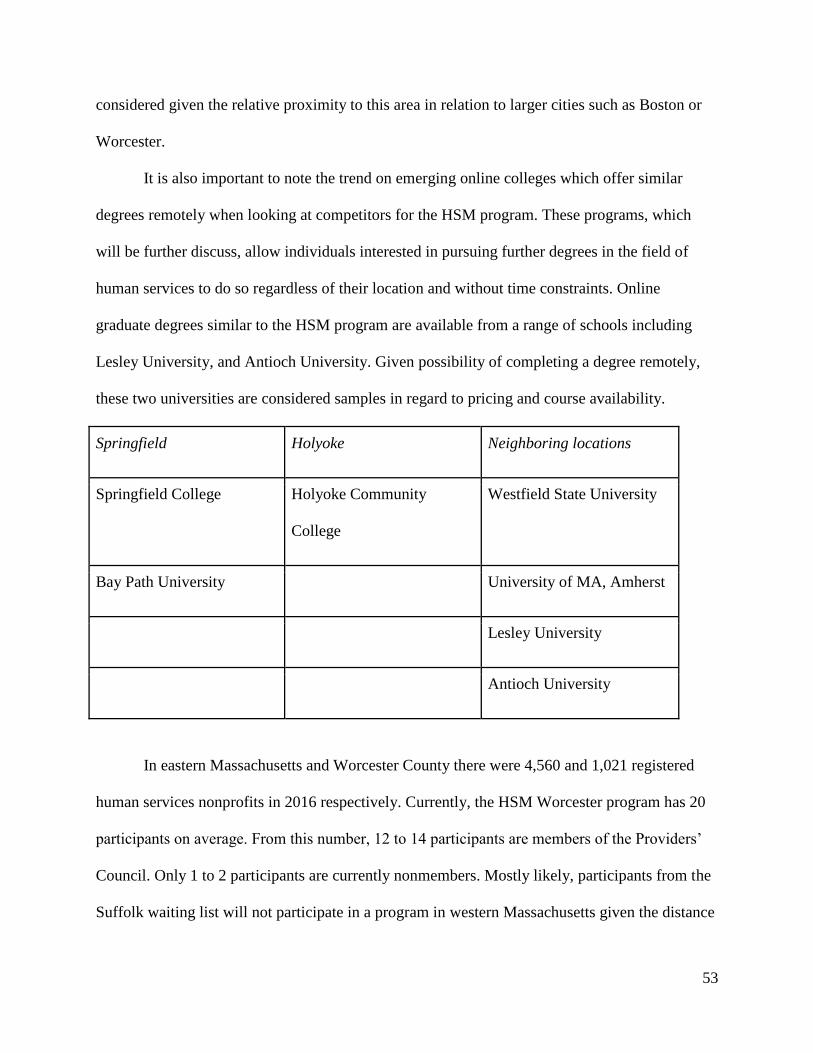
53
considered given the relative proximity to this area in relation to larger cities such as Boston or
Worcester.
It is also important to note the trend on emerging online colleges which offer similar
degrees remotely when looking at competitors for the HSM program. These programs, which
will be further discuss, allow individuals interested in pursuing further degrees in the field of
human services to do so regardless of their location and without time constraints. Online
graduate degrees similar to the HSM program are available from a range of schools including
Lesley University, and Antioch University. Given possibility of completing a degree remotely,
these two universities are considered samples in regard to pricing and course availability.
Springfield Holyoke Neighboring locations
Springfield College Holyoke Community
College
Westfield State University
Bay Path University University of MA, Amherst
Lesley University
Antioch University
In eastern Massachusetts and Worcester County there were 4,560 and 1,021 registered
human services nonprofits in 2016 respectively. Currently, the HSM Worcester program has 20
participants on average. From this number, 12 to 14 participants are members of the Providers’
Council. Only 1 to 2 participants are currently nonmembers. Mostly likely, participants from the
Suffolk waiting list will not participate in a program in western Massachusetts given the distance

54
from the greater Boston area. In 2016, there were 1,196 registered Human Service nonprofits in
the western Massachusetts region. Providers’ Council currently has thirty-three organizations
located within this region. Developing a successful program in Western Massachusetts would
require significant interest from these organizations. Participation from non-member
organizations would be required as well to make the program fiscally viable for Clark
University. Given an estimate based on participation rate among member and nonmember
organizations for existing programs in Boston and Worcester an average of 17 Western
Massachusetts participants are needed in order to keep this program going.
With these numbers in consideration, and the analysis of the programs the competition is
offering it can be predicted that there is enough market to support the HSM program alongside
the competition. The noted growth of the industry in this region of 8.0% between 2011 and 2016
might indicate the need for more programs like the HSM in the area. As well this region
demonstrated a significantly larger revenue of $1.2M than the $0.9M obtained by the Worcester
county despite having only a few dozen more registered Human Services nonprofits. Considering
the target population that HSM possesses the length of the program might be an influencing
factor when deciding on a program to pursue. Many of the individuals looking at programs like
the HSM program are currently working full time at an organization in the Human Services
industry already. Often they do not possess the time or have the availability to pursue a full
course load for two years at a time. The HSM program offers a shorter solution for those
interested in furthering their education without having to commit to a multiple year degree. Data
collected from the survey also indicates that there is enough potential marketed for existing
programs and the HSM program in the future. The majority of the participants noted how no one
in their organization had completed a program like the HSM. Only one participant noted its
55
organization sending someone to the HSM program prior to the survey. In addition, the main
concern a lot of the organizations have is the cost of a graduate program or certificate, however
many offer incentives were offered by a plethora of participants, which could ultimately
encourage employees to participate in this program.
Cost Comparison within Market
Survey results showed that a significant amount of organizations did not participate in
existing certificate programs in the area because costs were highly elevated. Thus, pricing would
be an important factor for selecting a program in the Holyoke/Springfield areas. Overall, the
Providers’ Council aims to provide individuals with the least expensive and highest quality
program, with the certificate program usually costing less than a graduate class. The current cost
for members stands between $2,900 and $,3900 depending on the school of attendance while for
nonmembers the cost may vary between $5650 and $6450. For those HSM graduates looking to
pursue a Master's degree after their completion of the program, a 30% tuition discount is offered.
However, upon further investigation of programs offered in the area, several competitors might
offer similar programs at lower rates.
Holyoke Community College, for programs such as Supervision and Leadership in the
Helping Professions Certificate and the Human Services program, provide different pricing for
Massachusetts Residents ($178/credit), New England Regional ($190/credit), and Non-
residents/International ($384/credit). This pricing could be generally beneficial for the HSM
target audience as most individuals are Massachusetts residents, making this option a strong
competitor for a potential HSM program in western Massachusetts. Bay Path University offers a
Master in Science in Nonprofit Management and Philanthropy. Tuition is significantly higher
than community colleges with each credit costing $675. Online courses are comparable to Bay

56
Path University, but significantly cheaper than other options, with Antioch University charging
$650 per semester hour with other fees depending on the types of classes to be taken. Despite the
online universities providing a cheaper alternative, student potentially attending these classes
would not have the opportunity to learn from peers in their fellow industry nor will they be able
to build a strong network. This difference in the learning style might be a setback for those
attempting to improve their organization through changes happening in the industry.
Larger local universities provide similar programs at an elevated price which, depending on the
residential status of the student, may be comparable to the HSM program. Westfield State
University offers a Master’s Degree in Public Administration with a Concentration in Nonprofit
Management. Springfield College offers a MBA in Nonprofit Management. The scheduling of
this MBA program in Springfield is comparable to the HSM program as classes only meet once a
month during an extended weekend, making it convenient for organizations struggling with
coverage or scheduling. The pricing is not comparable to other programs in the area with the
Springfield College program costing $5,616 and the Westfield State University charging $970
annually for instate students and $7,050 annually out of state. It is important to note that many of
the prices might be higher in comparison because these programs are Master's degrees rather
than certificate program.
Advertisement and Promotion of the HSM program
Providers’ Council is the entity directly in charge of informing potential individuals about
the opening of this new HSM program in Western Massachusetts. Initially in-depth information
may be easily accessed through their website, including pricing, objectives and benefits that this
program might bring for its participants. Aside from this information available on the website,
Providers’ Council relies heavily on social media to inform the public on upcoming events and

57
the opening of new programs such as the HSM. They usually post statuses and tweet on
Facebook and Twitter. They also rely on a significant amount of direct solicitation of both
members and nonmembers of the Providers’ Council. They send out a weekly e-newsletter for
the entirety of the application process for the two prior programs in Boston and Worcester, an
action they intend to continue in the opening of future program. Finally, they as their committees
to share the information with their staff as well. Normally their efforts focus on members as they
constitute the bulk of organizations that send employees to the existing HSM program, but they
also count with more than 900 non-members contact information in their mailing list. The
possibility of a promotional campaign if the Western Massachusetts program were to launch
exist, with an in-person gathering for member and nonmember health and human service
organizations to talk about the program possibly taking place through the application process as
well. Their sales strategy would not divert from their existing one. They usually market both
programs together, with the option to select the program of preference in the application.
Providers’ Council generates direct marketing to HR managers and CEOs/Executive Directors to
send staff. They also do many 1-off blasts to over 2000 member and nonmember contacts in our
constant contact list. Survey data showed that even members of Providers’ Council, more than
50% are not aware of the existence of this program and the learning opportunities this
organization provides for its members. No nonmembers noted being aware of the HSM program,
which indicates the need of promoting and marketing this program prior to its opening so it may
continue to be economically feasible and attendance does not drop below the required rate.
Start-up Capital
After researching community centers, schools, libraries, and hotels in Holyoke area, it
was determined that the Holyoke Public Library and Holyoke Community College’s Picknelly

58
Adult & Family Education Center can provide space for Clark University to build an HSM
program. Below is the analysis and comparison of these two locations in Holyoke.
Room Space: the classroom should be big enough to contain 20-25 students to take a
class together. The Holyoke Public Library has a Community Meeting Room that can meet this
need. Also, Holyoke Community College’s Picknelly Adult & Family Education Center has a
double classroom, which would accommodate the necessary number of students. Thus, both
locations have the space to accommodate the program.
Facilities: basic facilities in the classroom should include a computer, a projector,
Internet access, etc. The Holyoke Public Library has a projector for videos or PowerPoint
presentations, as well as WiFi. However, it does not include a computer to connect to the
projector. The person who runs the program should bring their own laptop, and if it is an Apple
computer, he or she will need to bring the necessary adapter to connect to the projector. The
classroom at Holyoke Community College’s Picknelly Adult & Family Education Center
includes two computers, projectors, audio capabilities, screens, and whiteboards. Two screens
can be "joined" so the presentation displays on both. The center can also provide large easel pads
and markers if needed. The center also has a copier machine, though they do not provide free
copy paper.
Transportation: The Holyoke Public Library is located at 250 Chestnut Street, Holyoke,
MA. It is near to Route 91, so it would be convenient for teachers or students. The public library
has a big parking lot, which would ease participant's pressure to find a parking location. Besides,
bus routes number B23, P20, P21, R24, and X90 also serve the library. It only takes 10 minutes
to walk from the Holyoke train station to the public library. Holyoke Community College’s
Picknelly Adult & Family Education Center is located at 206 Maple Street, Holyoke, MA. It is
59
also near to Route 91, and bus numbers B23, B48, R24, P20, P21, R24, R29, R52, and X90 go
there. Additionally, people only need to walk ten minutes from the center to the train station.
Rental Fee:Because HSM is a nonprofit program, the tuition would not be so high.
Except the salary of the professor, the classroom use fee would be the most cost of the program.
Thus, a lower fee would be a vital factor to reduce the program cost. After researching the cost,
the Holyoke Public Library could provide free meeting room space for a non-profit as long as it
is used during library hours. After hours, there is a charge of $75.00/hour depending on
custodian availability. As the HSM program is a nonprofit, and classes take place during the
library hours, the program could use the library’s meeting room for free. However, one important
thing to consider is that the room may not be available all the time, it must be instability. If the
public library needs to use the room temporarily during the HSM class time, that would cause a
significant problem. As for Holyoke Community College’s Picknelly Adult & Family Education
Center, the total cost to rent the space is $150 per day (for full day), $75 per half day. Although it
would be more expensive than Holyoke Public Library, it would be more stable because the
HSM program would pay for the room and, therefore, has guaranteed access to it.
Upon inquiring potential availability from public libraries, community centers and
religious associations in the Springfield area, it would be advisable to look at the Western
Springfield public library and the Community Foundation of Western Massachusetts as two
potential spaces to rent in the event of the HSM certificate program opening in this region.
The Community Foundation of Western Massachusetts and the Western Springfield both
offer a variety of classroom spaces, which could cater to the 20 to 25 students the HSM is
looking to enroll in its first year. Both facilities have classrooms with adaptable spaces, from
conference rooms to a more traditional classroom setup, which would be utilized for the

60
program. These classroom spaces are fully equipped with a projector system and Internet access.
The Community Foundation is currently open for rental spaces during business days from
8:30am to 5pm, without a possibility of extending rental hours or renting the space during the
weekend. The West Springfield Public Library, has two different schedules throughout the year
which could increase the difficulty of renting a room from their facilities on weekends. However,
they are regularly open on business days from 9am to 8-9pm on business days.
The Western Springfield Public library is located at 200 Park St. West Springfield MA.
This is located less than five minutes away from Route 91. If using public transportation, the G1
line may be utilized to get from the Springfield Bus Terminal to the Western Springfield Public
library. Parking should not be an issue as visitors are allowed to utilize the parking facilities
offered by the library. The Community Foundation of Western Massachusetts is currently
located on Tower Square. This location is less than 6 minutes away from an exit of Route 91 and
less than five blocks away from the Springfield Bus Terminal. Transportation and parking might
experience a change once the facilities are moved to a new location. Currently parking is
available at close parking garages but the move might heighten the difficulty to find available
parking.
The most significant difference between these two facilities would be the cost to rent the
space. The Community Foundation of Western Massachusetts does not currently charge for the
rental of their classroom spaces by a nonprofit organization. Upon further inquiry, issues might
arise with the fees if the program should interfere with existing meetings or times of occupancy.
No extra fees are charged for overtime as extended hours are not allowed. The Western
Springfield public library does charge for the use of their facilities, the fee averages between
$100 to $150 per hour of use of the facility. Given the estimate start date of the program would

61
not be until Fall 2018, neither facility was able to fully estimate the total cost or availability of
their facilities so far in advance.
Wants and Needs
Western Massachusetts is a unique region of the state for a variety of reasons. The four
counties of Hampden, Hampshire, Franklin, and Berkshire cover a large portion of the state, but
their overall population is significantly smaller compared to central and eastern Massachusetts.
Despite the lower population, the amount of nonprofit human services here are comparable to the
other regions (Keating). Clearly the people of this region suffer from the same issues as
anywhere else, but the reason for the extra need in human services could have a lot to do with the
demographics and geographical disadvantages it faces.
Springfield the largest city in the region with a population around 155,000 deals with
many challenges that are often found in urban communities. These challenges raise the need for
increased assistance in the form of skilled human service professionals. For one thing, recent
records indicate that over 30% of the population if the city lives under the poverty line.
Compared to the national average of 13.5% this is an alarming concern. Even with government
aid citizens depend on the necessary assistance of various human service organizations. A few
other interesting statistics indicated that 16% of residents under the age of 65 live with a
disability, only 76% have at least a high school diploma or higher, and 10% of residents are new
to the country. Figures such as this signify a city that needs professional assistance in order to
assist its many residents (U.S. Census).
Unemployment is also an issue within the region and one that many human services
organizations focus their work on. As of January 2017, the unemployment rate within all of
Massachusetts was at 3.2% which is very respectable in comparison to the nation at 4.9%.

62
Massachusetts is known to have a higher cost of living compared to many other states which
makes it even more difficult for unemployed and low-income people (Keating). Western
Massachusetts appears to have a slightly higher rate of unemployment went compared to the rest
of the state. Springfield Massachusetts in particular has an unemployment rate of 5.2%, Holyoke
at 4.4%, and Chicopee is at 3.7% (U.S Department of Labor). Although all these are relatively
low they are still higher than the state average
and present an area where human services can
focus on improving. Things have gotten better
recently though as shown by the adjacent figure
which indicates that the unemployment rate has
shrunk notable within a year. It seems that the
region at least in the more urban areas is
improving in terms of employment. This is
great news for residents in the area, but that
doesn’t mean specialists are any less needed
than before. Maintaining this trend and
assisting those that need it is still an ever-important issue.
Geographically speaking a city like Springfield does not represent the norm for the region
but it is certainly not an anomaly. Smaller cities like Holyoke, Chicopee, Westfield,
Northampton, and Pittsfield all deal with similar concerns. Apart from these communities most
the region is far more rural and spread thin in terms of population per square mile. Of the four
counties Hampden, Hampshire, Franklin, and Berkshire the population per square mile for each
is 751, 300, 102, and 142 respectively. In comparison to the entire state which has a population

63
per square mile of 840 and its densest county Suffolk which has a population per square mile of
12,416, western Massachusetts is small in terms of population (Indexmundi, 2013). This is in its
own way a very real disadvantage for the people that live in this rural environment. Access to
public transportation, retaining the younger college aged population, and of course adequate jobs
are just a few of the issues concerning rural western Massachusetts (Johnson).
Access to adequate human services is very important in western Massachusetts and with
changing trends and technology professional development is both needed and wanted. In any
field, professional growth can be achieved through experience and higher education. Human
service jobs are shown to vary significantly in terms of the necessary qualifications. Positions
range from just needing a high school education to a master’s degree with years of experience.
Looking through job searching sites will reveal this type of variety in western Massachusetts
(indeed.com). For positions in management, supervisor roles, and specialists’ jobs a master’s
degree is often encouraged. Theoretically employees should be interested in improving their
careers and earning potential so more education would be appealing. However, what truly bodes
well for a certificate program is that employers are also interested in having employees with a
higher education which makes it even more vital.
A factor that is a concern though is that many frequently available positions that need to
be filled are usually lower level entry positions with minimal pay. The expansion of the
certificate program is geared towards college educated professionals looking to gain additional
training and possibly ease into a master’s program. The segment of already employed human
service professionals in this region that would qualify for the program is substantially smaller
than the total number of nonprofit human service workers. This would be expected though as
higher up positions are less in number so the amount of people looking for management training

64
would also be less in comparison.
Professional development is not something that is for everyone or every organization.
Although it would make sense that additional training can only be a good thing some
organizations and people cannot devote the time and money needed to put their employees
through a program like this. Providers’ Council members would have the best deal and initially
would be most likely to enroll. If interest is there from outside members it would be logical that
the more financially secure organizations are better prepared to enroll employees. Nonprofit
human services are not typically known to have a large amount of disposable income so sending
employees for additional development even if the organization needs it could pose a problem
(Keating). Regardless, western Massachusetts is an area in need of human services and
professional development for those employees will only increase their effectiveness.
Risks
With any business venture, there are numerous risks that come with it. Whether positive
or negative they remain obstacles which will need to be addressed and handled accordingly.
Expanding a human service management certificate program into the area of western
Massachusetts offers multiple possibilities and obstacles that will ultimately determine the
feasibility of such an expansion. While some risks can be overcome, and worked around, others
can pose a significant detriment to the continuation of such an expansion. Expansion in theory
would benefit those in need of additional training, but it is not something that takes the priority
away from a measured and thoughtful approach to its feasibility.
Positive risks from expansion to the program are those that that contribute to the appeal
of its feasibility. For one thing offering professional development in human service management
would improve the quality and function of the nonprofit human service organizations in the

65
region. These organizations provide services that are critical to the welfare of those who are in
need. With additional training, professionals can come away with new approaches to their jobs
and an insight to the latest skills and technologies of the field. Having the courses geared towards
management will contribute to the growth of leaders in local organizations. By lifting your
people up and giving them the opportunity to achieve more they reward you with motivation and
loyalty (Selden). That motivation and loyalty will be a very appealing factor for nonprofit human
service organizations in western Massachusetts.
Human services encompass a wide variety of issues such as homelessness, immigration,
poverty, rehabilitation, education, and many more. Like any other area of the country, western
Massachusetts suffers from many of these issues. Organizations here require professionals with
the proper education and experience to perform their jobs well. Although the certificate program
is geared toward already employed human services professionals, these people could be inspired
to branch out on their own. While improving the quality of existing nonprofits is the goal the
specialized training may lead to the creation of additional nonprofits that the area needs (Selden).
To keep up with the pressing need for human services this would be a benefit to the region.
Western Massachusetts has a unique makeup of urban cities and desolate farm towns leaving the
area noticeably smaller in terms of population than the rest of the state. This calls for human
service organizations which can traverse the region adequately assisting all the people who live
there. Expanding the program could provide individuals the skills needed to branch out and
create these additional organizations.
An expansion to the human service management certificate program can also do a lot for
relations between the Providers’ Council and its members. The council does incredible work for
the nonprofit human service organizations that it works with. However, by only offering classes

66
in eastern Massachusetts and Worcester County the members in western Massachusetts are left
out of a suitable location to attend the program. Expanding the program gives council members
from all over the state the ability to enroll with the location closest to them. This also gives the
opportunity for additional non-members a chance to take part in the program. These nonmembers
can walk away from this professional development experience and bring to their organizations a
positive outlook of the Providers’ Council, perhaps even leading to membership.
There are also positive risks for Clark University being the institution conducting the
program. Quality coursework and direction from the instructors will help to show the best
aspects of additional education at Clark. For the University, this will provide a new opportunity
to reach prospective students for their School of Professional Studies. The certificate program is
an excellent opportunity for those with an interest in pursuing a master’s degree. Financially
speaking it puts those who participate at an advantage over those who matriculate through the
traditional approach. With a master’s degree, human service professionals will be in a greater
position to succeed as leaders for their organizations. Clark University itself will be able to
increase its network of graduates as well as establish a successful feeder program for its School
of Professional Studies.
The current political climate of the country has put Clark University and other institutions
of higher learning in a difficult position. A recent survey was conducted and found that 4 out of
10 U.S. colleges have experienced a decline in international applicants for the upcoming 2017
fall semester. Of those colleges surveyed about 75% expressed concerns about future enrollment
(Bendix). The survey was conducted in response to fears regarding the current presidential
administration’s rhetoric and actions against foreign nationals entering the country. Regardless of
political beliefs there is no denying the apprehension a foreign student may have about coming to

67
the United States due to the uncertainty of their visa status. With this in mind it becomes an even
greater priority for Clark to find additional areas to recruit students. Expanding the human
service management certificate program into western Massachusetts could be this new area.
With all the positives risks that could come with expansion it is also important not to
forget the very real negative risks that come along with such a move. Clark University along
with the Providers’ Council will take on a tremendous amount of financial risk if the program
were to fail in western Massachusetts. Monetarily there will need to be a room rented for classes
as well as compensation to the adjunct instructors. If the program were to not meet the
requirements for enrollment this would amount to a financial loss and a failure. Success depends
on a variety of factors working together and the hope that the need for professional development
will encourage enough human services professionals to enroll in the program.
Securing the proper facility for the classes is a necessity as it must remain accessible with
Clark’s budget, equipped with technology (wifi, projector, etc.), and easily accessible for
prospective students. Locations for the western Massachusetts program are centered on the cities
of either Springfield or Holyoke. These cities are the largest in the area and therefore have the
best access to public transportation as well as being in close proximity to highways. However,
there is still the risk of not being able to secure the facility that meets all of Clark’s needs and
those of the prospective students. Costs could be higher than expected and finding a compatible
location willing to rent out a room for the intended purpose of weekly classes might be a
considerable challenge.
There also remains the risk of being able to secure the right instructors for the course.
With Clark University being in Worcester Massachusetts this presents a problem for instructors
already employed by Clark to transport themselves to western Massachusetts to teach courses.

68
Even instructors who live outside of Worcester closer towards western Massachusetts still would
be faced with the extra hindrance of commuting to a new location. Looking to hire adjunct
instructors that are located closer to the agreed upon facility would be the best option. This still
will also come with an additional set of risks associated with hiring new employees. Finding
instructors to teach the courses and securing the necessary funds to employ them could be all for
nothing if enrollment in the program does not meet the minimum qualifications.
There are also risks beyond anyone's control which could stop the expansion from
happening altogether. Those in a position of power at Clark such as the dean or provost might
feel compelled to stop Clark’s involvement with the expansion if they see it as a financial loss.
The program if approved already faces a difficult test by just securing an appropriate number of
students to sign up. However, before that obstacle can even be faced the approval remains the
ultimate decision of those in charge within the university. They will need to be convinced that
forgoing this expansion would be a loss to the university’s growth, outreach, and possible
graduate students. Only with proper research and solid backing data will administrators feel
comfortable with approving this expansion and allocating the necessary resources and personnel
to the region.
There are always risks that come along with expansion regardless if they are positive or
negative. The chance to provide an excellent opportunity for human service professionals will
always appear great in theory but the reality requires having to deal with numerous challenges
along the way. Additional education is certainly needed for an area of the state that has many
human service needs and a considerable number of nonprofits for its population (Keating). If the
program is approved and money, facilities, and instructors are secured all that is left will be
proper advertising and placing trust in human services professionals to seek out higher education.

69
That is ultimately the biggest risk that comes with this expansion. The data may say the program
is needed, human service professionals surveyed may say they want it, but the risk resides in how
many people will actually enroll.
Constraints and Assumptions
Due to the fact that the Human Service Management Certificate Program and its
curriculum format is already established at two other locations, it is relatively easy to retrofit the
program to a Western Massachusetts location. The overall budget for the Western Massachusetts
program will be slightly higher than the HSM program at Clark. The increase of the budget will
be a direct result of the need to rent an appropriate space and the salary for six Western
Massachusetts adjunct professors.
There is little risk due to the uncontrolled growth of the program at the Western
Massachusetts location, as the number of participants in the certificate program is capped at 25
individuals. Providers’ Council and Clark University have already stated they need to enroll 17
participants in the HSM Certificate Program, assuming a typical dropout rate of two students per
year, for a total number of at least 15 participants who complete the program. With the program
set up for a maximum number of participants of 25 there is little to no risk associated with
unexpected growth of the program. In the past, when the Worcester or Suffolk programs have
surpassed their maximum number of students, the overflow was placed in the closest program. It
could be assumed that if the Western Massachusetts location has over 25 students the remainder
will be relocated to the Worcester location. This strategy, however, comes with its own risks.
Historically the locations that get the overflow students have a higher dropout rate. Dropout rates
are due to the participants not anticipating the difficulty of the program or distance and
transportation issues. The excess students coming from Western Massachusetts might have
70
higher dropout rates as a result of the commute and transportation.
The goal for Clark University is to make this Western Massachusetts program a feeder
program into Clark’s MPA program. Matriculation from the Clark and Suffolk programs into
Master’s level programs is approximately 20-25% and varies between the two programs. As
previously stated, enrollment goals for year one of the Western Massachusetts HSM Program are
17 participants who will be needed to run the program. It is assumed that there will be a 20%
matriculation rate for those who complete the program within year 1, a 25% matriculation rate in
year 2, and a 33% MPA enrollment by the 5th year of running the Western Massachusetts
program.

71
Chapter Four: Results and Reflection
Results
The process involved with putting together this report required collaboration between all
Capstone team members working on various areas of research. Our findings helped us to learn
more about the topic of nonprofit human services, trends in the industry, the need of and interest
in professional development, and its application to a possible expansion of the HSM Certificate
program within western Massachusetts. The feasibility of such a move conducted by the
Providers’ Council and Clark University is the basis of our research and report. Along the way,
we encountered and projected a number of limitations and salient issues to go along with our
findings.
With the feasibility of expansion being the overall purpose of our research, it is important
to note that while we feel confident in our findings and final analysis, there were a number of
limitations to conducting the report. The first issue we had existed with data from the National
Center for Charitable Statistics or NCCS. For one thing, most cumulative data is at a state and
county level only which prevents more in-depth analysis. Also, when researching the changes to
the number of organizations by revenue for any given year, there was no distinguishing between
whether or not those changes came from new organizations or existing organizations with
fluctuating revenue levels or a combination of both. While determining the geographic study
areas, our data fails to account for whether someone participated in a program in a region outside
of where they lived and worked or if they were outside of the counties within each study area.
Another limitation found when conducting the feasibility report was that not all
organizations are required to report their revenue on an IRS form 990. Nonprofit organizations
are required to file their financial information only on a certain set of criteria. All private

72
nonprofits, regardless of financial status, are required to make this information public but that is
not necessarily the case for public nonprofits. If revenue is less than or equal to $50,000 a form
990-N is required, revenue less than $200,000 and assets less than $500,000 a form 990-EZ is
required or 990, and if revenue is greater than or equal to $200,000 or total assets greater than or
equal to $500,000 a form 990 is used. The problem resides with the filing requirements for a
form 990-N because it is assumed that revenues not reported are generating less than $50,000
annually. This a problem while conducting feasibility because in 2016, 3,330 organizations did
not report their income and about 75% of them filed a form 990-N.
We also encountered some limitations when it came to Providers’ Council data. Many
estimates were based on the participation among Member organizations and assessed from
anecdotal evidence given to us by collaborating Providers’ Council and Clark University
officials. There can be a certain level of skepticism from this because it may not the absolute
final or official information. The purveyors of this data are very closely tied to this project and
are reliable sources, but unforeseen and adjusted data is also expected even if the overall
message and outcome is the same.
Aside from the feasibility report’s limitations, we did come across many valuable
findings and salient issues in regard to our research. When it comes to expansion, one thing is for
sure, and it is that any program existing in western Massachusetts is going to have to rely heavily
on participation among Providers’ Council members in order for it to be feasible. Research
shows that both the Boston and Worcester programs only get about 3 to 5 participants total,
among both programs, from nonmember organizations. With at least 5,500 human service
nonprofits in these combined regions, there is a huge segment of the human service nonprofit
community not enrolling in a Providers’ Council Certificate program. Essentially, the
73
overwhelming majority of people that enroll in the program belong to nonprofits that are
Members, and it appears that most Member organizations generate larger revenues than
nonmembers. In fact, in western Massachusetts, 86% of Providers’ Council members generate
over $500,000 compared to only 22% of all western Massachusetts nonprofits and only 17% of
Massachusetts nonprofits.
There is also the unlikelihood of the western Massachusetts program relying on wait list
participants from Suffolk or Worcester programs. This has been a benefit for the Worcester
program as it pulls from people who were unable to get into the Suffolk program due to
overcrowding. Boston, being the large metropolis, draws in the bulk of participants due to its
population, transportation, and numerous nonprofits within the area. A western Massachusetts
program would only work for those that live and work in the area exclusively due to the distance.
A drive from Boston to Worcester is a lot more feasible than a drive from Boston to Springfield.
As there is not a wait list for Worcester, it is likely that any interest for the western
Massachusetts program will come from those residing within that part of the state.
In order to justify the expansion of the HSM program, we also examined some notable
trends within the industry. There appears to have been and continues to be a substantial growth
in the number of human services industry jobs. A direct result of this is the large number of
aging baby boomer population and people with disabilities living longer. On a positive note, this
trend illustrates the tremendous strides that our society has made in the field and in supporting
those in the community in need of services and supports. However, it is increasing the need for
organizations and workers to take care of these aging people that is and will continue to be an
issue and challenge. This workforce crisis, along with the growing need for HS jobs, also creates
competition for organizations to attract and retain qualified and skilled employees that can

74
provide this physically and emotionally demanding work.
The number of working-age people is simply not keeping pace with the number of jobs
needing to be filled in the human services sector. One solution for nonprofit human services
organizations is to provide employees with subsidized opportunities to advance their skills and
education. This professional development can help employees feel valued by their organizations
and hopefully more satisfied with their job. Providing a wide array of professional development
options is one way to attract and retain employees, but it is certainly challenging within a career
field that is overworked and underpaid. It seems that to satisfy both the need for growth and the
need for financial accommodations that a certain balance between the two needs to be reached in
order to benefit both human service professionals and the people they help.
Beyond just the trends in the human service industry there are also growing trends within
professional development all together. The need for professional development is increasing in all
fields as population grows, technology advances, and new needs are encountered. Also growing
is the number and styles of innovative training models used to enhance this professional
development. In regard to human services the human service management program takes a
“traditional” learning/training model and adds a cohort aspect which is shown to improve
effectiveness and long term learning and applications. However, with the economic downturn
many nonprofits are focusing their resources not on trainings but other core aspects of their
organization. The high cost of the human service management program from the Providers’
Council it does not look like many organizations would be interested as desired and needed for
success of said program.
The uncertainty of the programs sustainability in western Massachusetts was exemplified
through the results of the survey our group conducted among member and nonmember

75
organization in the region. Through the survey all member organizations that replied indicated
that they were interested in the program while only 60% of all replying nonmember
organizations were interested. This does seem to align with data from the Boston and Worcester
program locations. The results of the survey also showed as predicted by trends in the industry
that high costs were the number one factor in apprehension for enrolling in the program. These
results were true in both member and nonmember organization indicated that even organizations
which generated larger revenue still found the price to be steep. Additional factors of concern in
the region were distance, scheduling, and availability of local programs. These all were indicated
by staff as something could potentially be an obstacle in pursuing professional development.
While challenges are certainly present they are not insurmountable. Interest is there and
research indicates that additional experience and training is needed for professionals in the
industry. There are concerns though in terms of the sustainability of the program in this region of
the state. Financial means to attend this program as it’s currently designed and the limited pool
of potential participants are things to keep aware of. The feasibility report provided has taken
every measure to be thorough, unbiased, and accurate. Limitations although present do not take
away from the legitimacy of our findings and final consensus.
Reflections
The first thing that we learned from the capstone project was that developing and retaining
staff were rated as top issues for both member and nonmember nonprofit organizations. The
competition among nonprofit organization is for talent. Outstanding professional staff play vital
roles in the development of organizations regardless of department. Developing staff helps
organizations cultivate more skills among their employees, which develops the organization as a
whole. Additionally, developing staff also helps to retain employees. Providing training for

76
employees makes employees feel valued and believe that they could contribute more to the
organization. Further, they will have the sense of belonging and will be willing to stay and work
in the organization. Retaining staff also brings benefits to organizations. The most important
benefit would be to cut the cost of staff recruiting and training. If an organization does not retain
staff, it has to spend time and money to recruit qualified employees. Also, the normal work may
be affected by the lack of staff during the recruiting time.
Another thing that we learned from this capstone was the critical need for this type of
program. After researching the HSM program, we found that the HSM program can not only
deliver useful knowledge, but also bring participants unique benefits. Students who participate in
the HSM program will have opportunities to transfer to a graduate level of program. At the same
time, they obtain a 30% discount on their graduate tuition. Another benefit is that participants
will find the HSM program is an immediate professional network with which to grow and learn.
The HSM program provides a platform for participants who come from different nonprofit
organizations to have an opportunity to meet and discuss. Students can learn from each other and
obtain what they cannot learn from class. Additionally, staff who complete the HSM program
will seem more committed and better able to assume leadership roles within their organizations.
According to the survey of nonprofit organizations, education level of employees who work in
nonprofit organizations is relativity low. Thus, staff who graduate from the HSM program or
other higher education program will be able to contribute more to their organizations and will
stand out among other less educated employees.
Additionally, the majority of respondents were not familiar with the HSM Certificate
program prior to our survey. During the survey, we found that 68.75% of the surveyed
organizations said they were not familiar with the HSM Certificate Program. However,

77
according to the survey, 88.23% of the total surveyed organizations are interested or very
interested in the HSM program in western Massachusetts. So, from the survey we found a large
potential market for the HSM program in western Massachusetts. However, the problem is how
do we let people know about the existence of the HSM program, the benefits of the program and
any other useful information about the program, so that we could rapidly occupy this potential
market. Thus, we should give more consideration to advertising strategies of the HSM program
for the further studies.
Further, we found that Springfield was preferred over the Holyoke location. According to
the survey, 63.64% of total surveyed organizations preferred the location of Springfield and only
36.36% of total surveyed organizations preferred the location of Holyoke. One possible reason
for this result is the majority of nonprofit organizations are located in or near Springfield. This
result indicated to us that we should do more work on location choices in Springfield than in
Holyoke. It would be perfect if we found a location in Springfield on the Holyoke side of the
city.

78
Chapter Five: Summary and Conclusion
After inquiring upon industry trends and the skills needed in this industry, a program like
the HSM program presents organizations with a unique mixture of coursework, networking
possibilities and potential credits towards graduate programs in the area. In addition, based on
our findings from the survey performed amongst western Massachusetts nonprofit organization,
the team feels that there is enough market potential to expand the HSM program to the western
Massachusetts region. However, due to the fee structure and revenue, as well as the cost being a
major issue for surveyed organizations, we are not optimistic about the ability of the Providers’
Council to recruit the number of students from western Massachusetts needed to make the
program financially viable.
One of the most significant findings from the survey was the lack of knowledge both
Members and nonmembers had regarding the existing HSM program in other regions. Most
organizations (69% overall) responding to the survey weren’t familiar with the program (83%
among nonmembers, 55% among members). In addition, the majority of participants have not
had employees attend a certificate or graduate program that equates the HSM Certificate
program. Given these two factors, our team wants to stress the need for proper marketing and
advertisement of this expansion of the program. Future studies should focus on Providers’
Council members, to better gauge their interest and level of commitment since our findings
indicate that feasibility of the program will probably heavily rely on Member organizations.
However, the program can not solely rely on Member organizations to consistently provide
students for the program given that they represent a small percentage of nonprofits in the area.
Providers’ Council should also gather revenue information from nonmembers to potentially
target their efforts towards those with higher revenue. These organizations will have the

79
possibility to send individuals to the HSM program or could potentially provide incentives such
as tuition reimbursement which could make it more feasible for employees to participate.
The team recommends that Providers’ Council conduct an awareness campaign in the
region to both Member and nonmember organizations, and then re-administer the survey to
obtain more information and a greater sense of the needs in the area. With more information
available from survey participants, potential nonprofits might be able to see the benefits that the
program offers against other local programs and provide a more concrete answer on their future
participation. After this survey is administered and both members and nonmembers demonstrate
a higher interest for the program, advertising campaigns can be better directed towards these
interested parties. The team encourages the Providers’ Council to hold promotional events both
in Holyoke and Springfield in the months prior to any potential start date. These events would
demonstrate the seriousness of the program and including prior participants of the Boston or
Worcester HSM programs might also heighten networking aspect behind the program.
Western Massachusetts has a plethora of universities and colleges offering programs
similar to the HSM Certificate program. When comparing costs between programs, the level of
the program and the length of the program, the HSM Certificate has existing competition in the
area providing similar services. The second suggestion our team wants to deliver is potentially
shifting the price of the program. Restructuring of both Member and nonmember costs would
make the program more viable in the long run. Interest for the program is there, but the high cost
remains an obstacle especially for nonmember organizations with fewer employees or nonprofits
with smaller revenue. By increasing advertising and lowering costs, the program has a greater
potential for sustaining enrollment.

80
References
4 Ways Cohort Models Benefit Graduate Students. (2015, June 24). Retrieved April 12, 2017,
from http://education.gsu.edu/4-ways-cohorts-models-benefit-graduate-students/
About Clark. (2017, April 03). Retrieved February 15, 2017, from
http://www.clarku.edu/about-clark
Bendix, A. (2017, March 13). A Pause in International Students? The Atlantic. Retrieved from
https://www.theatlantic.com/education/archive/2017/03/a-pause-in-international-
students/519435/
Birman, B. F., Desimone, L., Porter, A. C., & Garet, M. S. (2000). Designing Professional
Development That Works. Educational Leadership, 28-33.
Citino, C., Goodman, M., Ph.D., Weekes, M., & Yelenak, B. (2017). Who Will Care? The
Workforce Crisis in Human Services. (pp. 1-29, Rep.). Massachusetts Council of Human
Services Providers, Inc.
Goddard, C., Hannon, V., Peterson, A., & Temperley, J. (2014). Global Trends in Professional
Learning and Performance & Development. Australian Institute for Teaching and School
Leadership.
Indeed.com. (2017, March 27). Human Services Springfield, MA. Job Search. Retrieved from
https://www.indeed.com/q-human-services-l-Springfield,-MA-jobs.html
Indexmundi. (2010). Massachusetts Population per square mile, 2010 by County. Retrieved from
https://www.indexmundi.com/facts/united-states/quick-facts/massachusetts/population-
density#map
Jha, S., Bhattacharyya, S., & Fernandes, C. (2016). Human Resource Development Management
& Training as Antecedents for Strategy Integration. The Indian Journal of Industrial
81
Relations, 52(1), 129-144.
Johnson, A. (2015, January 15). What does Western Massachusettsss Want? Boston Globe.
Retrieved from https://www.bostonglobe.com/news/politics/2015/01/15/what-does-
western-mass-want/8AroV0oRo03Za05XRzuS9O/story.html
Keating, E., & Pradhan, G. (2012, June). Passion & Purpose Revisited: Massachusetts’s
Nonprofits and the Last Decades Financial Roller Coaster. The Boston Foundation.
Retrieved from http://www.tbf.org/news-and-
events/news/2012/june/~/media/TBFOrg/Files/Reports/PP2012Final.pdf
Lunce, L. (2006). Simulations: Bringing the benefits of situated learning to the traditional
classroom. Journal of Applied Educational Technology,3. Retrieved from
http://citeseerx.ist.psu.edu/viewdoc/download?doi=10.1.1.93.8969&rep=rep1&type=pdf
Mataira, P. J., Morelli, P. T., Matsuoka, J. K., & Uehara-Mcdonald, S. (2014). Shifting the
paradigm: New directions for non-profits and funders in an era of diminishing resources.
Social Business, 4(3), 231-244. doi:10.1362/204440814x14103454934212
Milligan, C. (1999, December). Delivering Staff and Professional Development Using Virtual
Learning Environments. Joint Information Systems Committee. Retrieved from
http://www.icbl.hw.ac.uk/jtap-573/573r2.pdf
National Center for Charitable Statistics | NCCS. (n.d.). Retrieved March 11, 2017, from
http://nccs.urban.org/
Norris-Tirrell, D. (2014). The Changing Role of Private, Nonprofit Organizations in the
Development and Delivery of Human Services in the United States. Journal of Health
and Human Services Administration, 37(3), 304-324. Retrieved February 15, 2017, from
http://spaef.org/article/1559/

82
Providers’ Council. (n.d.). Retrieved February 15, 2017, from http://www.providers.org/
Selden, S. C., & Sowa, J. E. (2015). Voluntary Turnover in Nonprofit Human Service
Organizations: The Impact of High Performance Work Practices. Human Service
Organizations Management, Leadership & Governance, 39(3), 182-207.
doi:10.1080/23303131.2015.1031416
Thaler, J., Spraul, K., Helmig, B., & Franzke, H. (2016). Satisfaction with and Success of
Employee Training from a Public Service Motivation Perspective. International Journal
of Public Administration, 40(1), 1-11. doi:10.1080/01900692.2015.1072212
U.S. Census Bureau. (2016). Springfield, Massachusetts. Retrieved from
https://www.census.gov/quickfacts/table/PST045216/2567000,00
U.S. Department of Health and Human Services, Office of the Assistant Secretary for Planning
and Evaluation | ASPE - (2003, May 14). Retrieved March 3, 2017, from website:
https://aspe.hhs.gov/basic-report/future-supply-long-term-care-workers-relation-aging-
baby-boom-generation
U.S Department of Labor. (2017, January). Local Area Unemployment Statistics. Retrieved from
https://data.bls.gov/timeseries/LASST250000000000003
U.S. Department of Labor. (2016). Springfield, Massachusetts. Retrieved from
https://www.bls.gov/regions/new-england/ma_springfield_mn.htm
Wiesen, E. M. (n.d.). Trends in Human Services: Professional Development, Competition for
Funding, and Staff Positions in the Field (Master's thesis). Nebraska: Concordia
University.
evittum
Typewritten Text

Appendix A
Pre-work and Interview Questions
84
Appendix A
Pre-Work Prior to Preliminary Meeting with
Ella Blythe Froggatt, Manager of Member Engagement at Providers’ Council
&
Interview Questions and Responses
HSM Capstone Team: Paul Campbell, Patrick Deschenes, Maria Pacheco, Bradley Paul,
Elizabeth Vittum, Jing Zhang
First Meeting: February 10th at 1:00 PM; Liz, Jing and Maria will conduct interview
1. Define Objectives for Capstone Project to Communicate to Client:
The Massachusetts Council of Human Service Providers, Inc (Providers’ Council) is interested in
expanding its Certificate in Nonprofit Human Service Management (HSM) program, offered in
partnership with Clark University, to member and nonmember organizations located in western,
Massachusetts. The goal of this Capstone Project is to conduct a feasibility study to determine if
Clark’s School of Professional Studies (SPS) and the Provider’s Council can establish a western
mass site for the HSM program.
Current State: There is no certificate program in western Massachusetts despite the number of
nonprofits in the area.
Future State/Outcome: A viable and sustainable revenue stream for SPS, an extended reach for
Provider’s Council, and an increase in the number of professional and leadership development
opportunities for the health and human services workforce.
Objectives One: Conduct a needs assessment for a certificate program in greater
Springfield/Holyoke area
Objective Two: Construct the financial model for yearlong program
Objective Three: Develop a high level feasibility plan with risks, constraints, assumptions and
measures of success for launch in fall 2018
2. Review History of Client and HSM Certificate Program:
The Massachusetts Council of Human Service Providers, Inc. (Providers' Council) is a statewide
association of primarily nonprofit private, community-based, care-giving organizations that
provide human services, health, education and vocational supports. The Council offers high
quality public policy research, advocacy, communication and information, education and
training, research and cost saving programs to add value to our members and to help them reach
their objectives.
The Council was founded in 1975 to influence and direct public policy change to support
community-based services. As the state's largest human services trade association, it is widely

85
recognized as the official voice of the private provider industry. The Council is a membership
organization that receives its primary support from its members and its business partners.
The Massachusetts Council of Human Service Providers, Inc (Providers’ Council) currently
offers a Certificate in Nonprofit Human Service Management (HSM) Program in partnership
with Clark University and Suffolk University. This year-long, graduate-level certificate
program is intended for nonprofit agency staff working in program management, human
resources, administration, and finance capacities. Current participants in the Worcester and
Boston area programs include program managers, residence directors, project managers, office
managers, executive directors, and staff accountants. Registration is open to employees of
Providers’ Council members and non-member nonprofit organizations, and experienced
professionals who would like to enter the nonprofit sector.
Clark’s School of Professional Studies has been offering the HSM Certificate Program since
2005. Clark University’s College of Professional and Continuing Education has graduated more
than 100 future leaders.
http://providers.org/pages/certificate-in-nonprofit-human-service-management
3. Define mission, vision, and core values of Providers’ Council:
The Council is governed by a diverse board of directors who are committed to the values of the
corporation, which represent our broader community of diverse caregivers. The Board supports
the Council's mission: to promote a healthy, productive and diverse human services industry. Its
core values of fairness, respect and dignity for the disenfranchised - are the cornerstone to its
history of sustainable community-based solutions. The organizational values of the Council
follow:
● We are committed to the delivery of high quality, accessible, community-based
services that meet the needs of clients and consumers.
● We seek to serve the public and human service providers by identifying opportunities
and taking action in those areas where provider self-interest and public interest are
supportive of one another.
● We believe the public, clients and consumers are best served through private
community-based care supported by fair and adequate funding.
● We are committed to promoting integrity, credibility and responsibility in the human
services industry.
● We value results and success.
● We are dedicated to the development and maintenance of a diverse membership,
representative of human service providers.
4. Research trends relevant to industry (professional development for Human Service
Professionals):
The nonprofit sector has seen continued growth throughout the recession of 2008-09. While
wages and employment within the for-profit sector decreased, nonprofit wages and employment
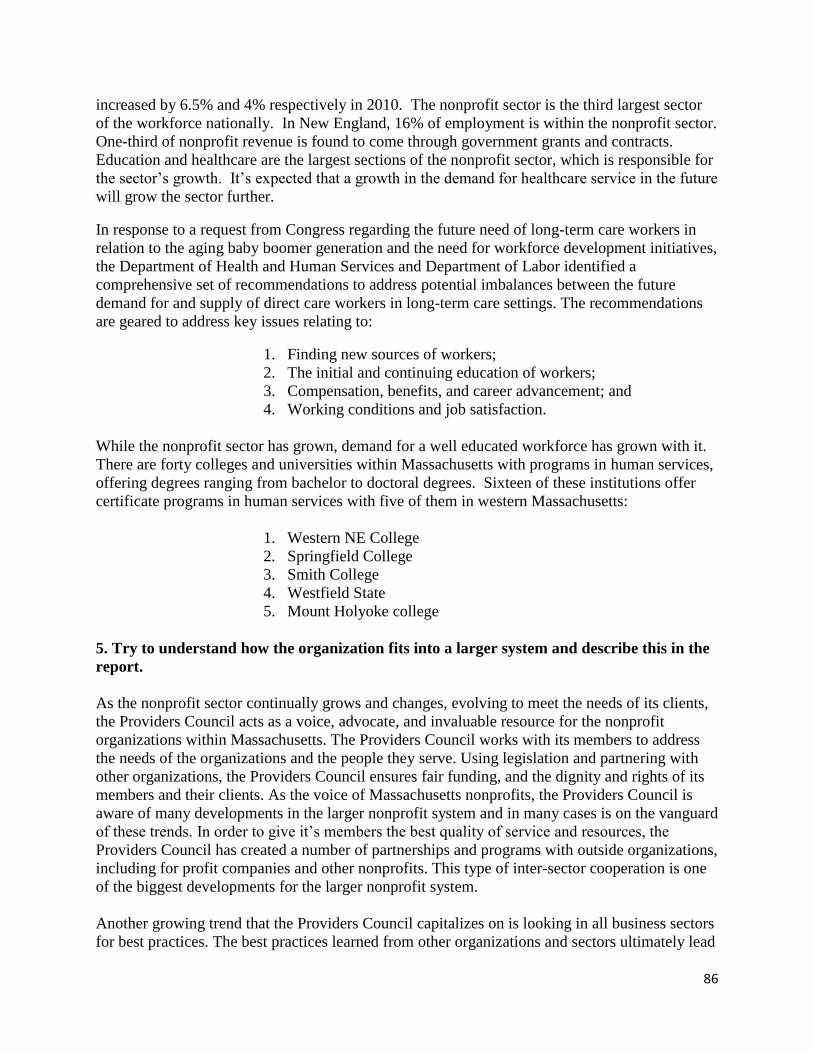
86
increased by 6.5% and 4% respectively in 2010. The nonprofit sector is the third largest sector
of the workforce nationally. In New England, 16% of employment is within the nonprofit sector.
One-third of nonprofit revenue is found to come through government grants and contracts.
Education and healthcare are the largest sections of the nonprofit sector, which is responsible for
the sector’s growth. It’s expected that a growth in the demand for healthcare service in the future
will grow the sector further.
In response to a request from Congress regarding the future need of long-term care workers in
relation to the aging baby boomer generation and the need for workforce development initiatives,
the Department of Health and Human Services and Department of Labor identified a
comprehensive set of recommendations to address potential imbalances between the future
demand for and supply of direct care workers in long-term care settings. The recommendations
are geared to address key issues relating to:
1. Finding new sources of workers;
2. The initial and continuing education of workers;
3. Compensation, benefits, and career advancement; and
4. Working conditions and job satisfaction.
While the nonprofit sector has grown, demand for a well educated workforce has grown with it.
There are forty colleges and universities within Massachusetts with programs in human services,
offering degrees ranging from bachelor to doctoral degrees. Sixteen of these institutions offer
certificate programs in human services with five of them in western Massachusetts:
1. Western NE College
2. Springfield College
3. Smith College
4. Westfield State
5. Mount Holyoke college
5. Try to understand how the organization fits into a larger system and describe this in the
report.
As the nonprofit sector continually grows and changes, evolving to meet the needs of its clients,
the Providers Council acts as a voice, advocate, and invaluable resource for the nonprofit
organizations within Massachusetts. The Providers Council works with its members to address
the needs of the organizations and the people they serve. Using legislation and partnering with
other organizations, the Providers Council ensures fair funding, and the dignity and rights of its
members and their clients. As the voice of Massachusetts nonprofits, the Providers Council is
aware of many developments in the larger nonprofit system and in many cases is on the vanguard
of these trends. In order to give it’s members the best quality of service and resources, the
Providers Council has created a number of partnerships and programs with outside organizations,
including for profit companies and other nonprofits. This type of inter-sector cooperation is one
of the biggest developments for the larger nonprofit system.
Another growing trend that the Providers Council capitalizes on is looking in all business sectors
for best practices. The best practices learned from other organizations and sectors ultimately lead

87
to better employees, with quicker access to jobs and better job skill development. These skills
learned from the best practices directly translate into better support and care for the people
served. The Providers’ Council has taken both these trends in the larger nonprofit system and
partnered with both Clark University and Suffolk University to create the Human Service
Management Certificate Program. This program is where current Providers’ Council members
can come to learn new skills and create connections that will allow them to continue to be on the
frontline of the nonprofit sector.
Interview Questions Developed for Interview with Providers’ Council and Responses:
Questions:
1. Will the information that the Providers’ Council be sharing with the HSM team be
considered confidential? If so, we will need to sign a confidentiality form.
Confidentiality form to be signed so list of members can be shared.
2. Is the overview and objectives listed above what you envision for this project? Do
you have anything to clarify or add?
Yes, further additions might be added by Michael but nothing for now.
3. What are the enrollment goals for year one through five of the Western MA HSM
Program? What are the completion goals? Do you have goals for the number of
graduates you would like to see matriculate on to a Master’s level programs?
The Clark Program aims to enroll 17 participants in the HSM Certificate Program, assuming a
typical dropout rate of two students per year, for a total number of at least 15 participants who
complete the program. Matriculation from the Clark and Suffolk programs into Master’s level
programs is approximately 20-25% and varies between the two programs.
Enrollment goals for year one of the Western MA HSM Program are 15 participants who will be
needed to run the program. There will be a 20% goal for those who complete the program to
matriculate to Clark’s MPA program within year 1; 25% in year 2; and ⅓ by 5th year.
4. Do you have any special considerations for where the program might be held or
offered? Should the program definitely be held in Springfield or Holyoke?
The preference will be to offer the program in Springfield where there is a greater concentration
of Providers’ Council member organizations. Ella will send member map of where organizations
are located. Holyoke would be a second option for program location.
5. Do you anticipate the program will mirror what is currently being offered in other
regions of the state? e.g., Will the western mass program be open to Providers’
Council members and non-member organizations, etc.?

88
Yes, we anticipate the program will be the same as Clark’s current program. The western MA
program will be offered to both member and nonmember organizations.
6. What percentage of Worcester- and Boston-based organizations participate in the
certificate program membership? What percentage of non-member organizations
enroll in the program?
10 organizations participate at Clark; 8 organizations are Worcester-based
13 organizations participate in the Suffolk Program
All organizations are Members, very rare for nonmembers to enroll staff (2-3 in the past years_
Organizations join Providers Council because of the certificate program and the lower cost/value
of the program for staff.
7. What are some of the successes of the current HSM Program?/What are some of the
failures?
Successes:
● Employees stay at organization longer, move up within the organization faster, and
establish their careers once they finish program. (HSM Program contract requires staff to
stay at least one year at their organization once they complete the program.)
● More people are continuing with the MPA program b/c of a 30% discount in tuition
offered by Clark and Suffolk Universities.
● Networking with students and staff from other organizations is also an important reason
staff participate in the program. Learning how other organizations are being run in
addition to networking and discussing common issues and ideas is a good incentive.
● Staff use knowledge gained to make improvement within their own organization such as
grant writing, money saving tips, utilizing class projects, etc.
Failures:
● Suffolk is more popular and always runs at full capacity. Overflow gets sent to
Worcester,
● Dropout rates are continuous in Worcester b/c people from Boston don’t anticipate the
difficulty of the program or distance/transportation issues. Students from outlying towns
might have higher dropout rates because of commuting.
8. How many Providers’ Council member and nonmember organizations are located
in Western Massachusetts and is there a list or map of where the organizations are
located?
33 members in Western-Springfield
Nonmember organizations- Ella would not be distributing to nonmembers but would be
comfortable with the team sharing the survey with other organizations that are not members.
This would increase awareness of the Providers’ Council and potential increase membership and
participation. She will provide a list of members so we can contact nonmembers; this is sensitive
information and would require confidentiality agreement to be signed. (Note, this information
was not actually able to be shared).

89
9. We will be developing a survey for provider organization in order to conduct a
needs assessment for the certificate program. Will you be responsible for
distributing the survey to both member and non member organizations? What do
you anticipate will be the turnaround time for receiving completed surveys? Are
there specific questions you’d like us to ask provider organizations as part of the
needs assessment?
The Survey should be worked on with Ella and distributed by PC in order to make the clients
more comfortable responding. She will need to see survey before it gets sent out. An overview
of the program will be needed. Information pamphlet was just release which includes costs and
we should highlight benefits including cost savings for participants.
10. Would you consider charging a higher membership fee for provider organizations
who participate in the western Massachusetts certificate program if we find that
extra expenses (e.g. rent) warrant an increase?
Ella would not consider more than $500 increase. Mary feels strongly that the program be
offered at the current price of Worcester program with no increase.
11. Do you have any additional thoughts, questions, or information for us?
None shared.
evittum
Typewritten Text
evittum
Typewritten Text

Appendix B
Project Charter
90
Appendix B
School of Professional Studies
Project Charter School of Professional Studies and Providers’ Council
Human Service Management (HSM) Certificate Program Expansion to Western Massachusetts Project
Project Team:
Paul Campbell
Patrick Deschenes
Maria Pacheco
Bradley Paul
Elizabeth Vittum
Jing Zhang
91
Table of Contents
TABLE OF CONTENTS 2Error! Bookmark not defined.
GLOSSARY OF TERMS IN A PROJECT CHARTER 3Error! Bookmark not defined.
1 Error! Bookmark not defined.
1.1 93
1.2 93
1.3 93
2 93
2.1 93
2.2 94
2.2.1 94
3 94
4 94
5 95
6 95
7 95
8 95
8.1 95
8.2 96
9 96
10 97
11 98

92
Glossary of Terms in a Project Charter This glossary defines key terms used in this document. Although some of the terms will have slightly different definitions outside of this project, this glossary defines the meaning within this initiative. Assumption – An item taken to be factual even though that fact has not been confirmed. Wherever possible the accuracy of assumptions is validated during the project Constraint – An unchangeable condition that impacts the project. Contingency – An activity, budget or time period that is held in reserve in order to minimise the impact that a risk has on the project if that risk is realised Major Stakeholder – One of the key interested parties and decision makers in the project. Mitigation – An activity that is undertaken to minimise the impact and /or the likelihood of occurrence of an adverse risk or to maximise the impact and /or the likelihood of occurrence of a positive risk Project Charter – This document. The document that authorises the project and sets out the framework for what is to be done and how it is to be managed. Project Manager – The person responsible for the management of the execution of all work items. Required End State – The definition of what constitutes a completed project. Risk – An uncertainty that may impact the project in either a positive or negative manner if it occurs. Scope – The sum of the changes to be made in order to achieve the Required End State. Steering Committee – The group of people responsible for making major decisions on the project.

93
1 Project Overview
1.1 Introduction
The Massachusetts Council of Human Service Providers, Inc (Providers’ Council) is interested in expanding its Certificate in Nonprofit Human Service Management (HSM) program, offered in partnership with Clark University, to member and non-member organizations located in Western Massachusetts. The goal of this Capstone Project is to conduct a feasibility study to determine if Clark’s School of Professional Studies (SPS) and the Provider’s Council can establish a Western Massachusetts site for the HSM program.
1.2 Major Stakeholders
Major Stakeholders of this project include: Capstone Group Members, Ella Froggatt/ Provider’s Council, Mary Piecewicz/ Clark University, IRB Approval Board, Potential HSM Certificate Participants
1.3 Document Purpose
The purpose of this project charter is to outline the following:
o The desired end state. o The project scope. o Assumptions, constraints and risks. o Communications and structure. o Roles and responsibilities.
2 Project End State and Scope
2.1 Required End State
Current State: There is no certificate program in Western Massachusetts despite the number of nonprofits in the area. End State: A viable and sustainable revenue stream for SPS, an extended reach for Provider’s Council, and an increase in the number of professional and leadership development opportunities for the health and human services workforce, having the Western Massachusetts HSM Program be a feeder into the Clark MPA Masters Program. Objectives One: Conduct a needs assessment for a certificate program in greater Springfield/Holyoke area using Qualtrics Survey Tool Objective Two: Construct the financial model for a yearlong program

94
Objective Three: Develop a high level feasibility plan with risks, constraints, assumptions and measures of success for launch in fall 2018
2.2 Project Scope
Work Area In Scope Out of Scope
Needs Assessment/ Survey
Holyoke/Springfield, Identify Non-Profit Providers Council Members and Local Non-Profit Non-Members, Finding Need for Transportation, Finding Need for Classroom Location
Outside of Western Massachusetts, Identify For-Profit Members, Finding New Instructors, Finding New Curriculum,
Financial Model Start up Costs, Instructors, Location Rental, etc.
Feasibility Plan Risks, Constraints, Assumptions, Measures of Success
Recommendations Next Steps for Implementation
Detailed Implementation Plan
2.2.1 Change Management
3 Assumptions Assumptions include: Each project team member will do their allotted work on time and to their highest standards. If a group member is struggling, that group member will reach out to the rest of the group for help. If the client is not communicating with the group, the group will find alternative communication channels and/or alternative solutions. The group will get IRB approval for survey. The group will have full participation with organizations for the survey, and will assume at least a 10% response rate. All group members will come to the meetings on time (if they cannot make it on time they will let other group members know at least a day in advance).
4 Constraints

95
Constraints include: Time within the semester for project; time constraints for group members (both to complete work and to attend group meetings); surveying a large number of nonprofits through a secondary party; meeting only once a week; other priorities conflicting with the project. Distribution of survey will be by a third party (Providers’ Council) and the team has no control of over the response rate. Also, if there are technical issues, the respondents will notify Providers’ - hence slowing down the time that the project team can address any issues.
5 Risks Lapses or failures to communicate (both intergroup and between group and client); not getting enough survey results from organizations to effectively analyze; not getting support from stakeholders; not completing the project. Positive risks include that the final deliverable will be useful for project team members to include in their portfolios for job applications; and long-term networking between project team members.
6 Communication Strategy
▪ In-Group Communication: Group Text messages, Group Emails, Google Docs, Weekly Meetings; Monthly Team Status Reports (2/28 and 3/31)
▪ Client Communication: Conference Calls
▪ Organizations Participating in Research Aspect of Project: Survey (to be approved and distributed by Providers’ Council to member organizations and distributed to non-member organizations by HSM team).
7 Project Structure Client Contact: Ella Froggatt, Providers’ Council Project Advisor: Mary M. Piecewicz Project Manager: Liz Vittum Project Team: Paul Campbell, Patrick Deschenes, Maria Pacheco, Bradley Paul, Elizabeth Vittum, Jing (Jenny)Zhang
8 Steering Committee and Stakeholder Commitments
8.1 Steering Committee (if applicable)

96
o Project team members
o Ella Froggatt/Providers' Council o Mary Piecewicz/Clark University School of Professional Studies
8.2 Stakeholder Commitments
o The Providers’ Council agrees to respond and/or signoff on any requests
or questions submitted by project team within three business days of submission. These will include the project charter and needs assessment survey. If it is anticipated that a signoff will not occur within three business days, than the Providers’ Council will communicate that and provide an estimate of extended time period.
o The Providers’ Council commits to distributing and collecting surveys to provider organizations in Western Massachusetts. Completed surveys will be provided to project team members within two days of receipt.
o The Providers’ Council will have a representative attend final project presentation.
o IRB will approve your survey in a timely fashion (within 2 to 3 weeks). o The project team will deliver final paper on time for the scheduled
presentation.
9 Roles & Responsibilities/RASCI Chart Responsibility Assignment Matrix (RAM) for Team Project Deliverables: A = Accountable I= Input
Date
Due
Team Member Task/Deliverable
Liz Pau
l
Bradl
ey
Pat Jing Maria Ella %
Complete
2/10 Assignment 1: Prior to
First Meeting with Client
100%
2/10 Assignment 2: Guide to
Pre-Assessment Phase
of Consultation
A I I I I I 100%
2/15 Assignment 3: Project
Charter
I A A I I I 100%
2/15 Confidentiality
Agreement
A I I I I I 100%
2/24 Survey/Needs
Assessment Developed
& Upload to Qualtrics
A I I I I A 100%

97
2/24 - 3/10 IRB Application &
Approval Process
I I I I I A 100%
3/20 - 3/24 Survey Distribution (5
day response time);
Survey Reminder Email
(3 days in)
I I I I I I A 100%
2/15-3/24 Research/Trends I I I A I I 100%
T- 5:00 Weekly Meetings A A A A A A 75%
3/3, 4/3 Assignment 4:
Monthly Team Status
Reports
A I I I I I 100 %
4/4 Analyze Results A A A A A A 100%
4/21 Assignment 5: Self-
Evaluation/
Assignment 6: Peer
Evaluation
A A A A A A 100%
3/24-4/11 Assignment 7:
Analyze Surveys;
Develop Financial Model
and Feasibility
Plan/Final Report
I A I I A I 100%
4/12-4/17 Develop Presentation I I A A I I 100%
4/18 Dry Run of Presentation A A A A A A 100%
4/21 Self-Reflection/Lessons
Learned
A A A A A A 100%
4/26 - 12
PM -1 PM
Assignment 8: Defense A A A A A A 100%
10 Measures of Success This section of the project charter should detailed measurements that will indicate that the project is a success. The following table provides examples of measures of success that teams can decide are appropriate for their projects.

98
Project Performance Dimensions by Project Success Factor
Project Outcomes Measure of Success
Agreements Met schedule expectations
Completed roles and responsibilities on time
Finished project on time
IRB Approval
Client Success Client(s) satisfied
Deliverables used by client
Western Mass HSM program is launched in Fall 2018
Project Team Team members experienced personal growth
Highly satisfied and motivated team
Team highly loyal to project
Capstone grade B+ or better
11 Stakeholder Sign-off
This project charter has been signed off by the following stakeholders: ___________________ _________________ _______________ Michael Weekes President/CEO Date Providers’ Council __________________ _________________ _______________ Ella Froggatt Manager of Member Date Engagement Providers’ Council ____________________ _________________ _______________

99
Mary Piecewicz Captsone Advisor Date Clark University
Project Teams Members: ___________________ _________________ _______________ Paul Campbell HSM Project Member 2/15/17 ___________________ _________________ _______________ Patrick Deschenes HSM Project Member 2/15/17 ___________________ _________________ _______________ Maria Pacheco HSM Project Member 2/15/17 ___________________ _________________ _______________ Bradley Paul HSM Project Member 2/15/17 ___________________ _________________ _______________ Jing Zhang HSM Project Member 2/15/17
___________________ _________________ _______________ Elizabeth Vittum HSM Project Member 2/15/17
evittum
Typewritten Text

Appendix C
Survey Tool

100
Appendix C: Survey Tool
FINAL SURVEY - Submitted to IRB on 2/24/17
Providers’ Council Survey
Are you wondering how to develop staff? Are you looking for opportunities to strengthen staff skills and
create leadership opportunities? Do you want to retain qualified staff in order to remain competitive in the
growing health and human services industry? The Providers’ Council in partnership with Clark University is
conducting a survey to see if there is enough interest in western Massachusetts to hold the Certificate
Program in Nonprofit Human Service Management Program in Springfield or Holyoke. Right now, the
program runs at Suffolk University in Boston and at Clark University in Worcester. To learn more visit:
http://providers.org/pages/certificate-in-nonprofit-human-service-management
Agencies sponsoring employees’ participation in the program commit to paying the agency application fee
and employees’ tuition, giving enrolled employees paid time off to attend classes and adjusting work
requirements as necessary. In return, students commit to attending all classes, completing all assignments,
doing program evaluations and remaining with their current employer for at least one year after completing
the program. Classes run from September to June one day a week from 9 a.m. to 4:30 p.m.
The program includes classes on:
-Nonprofit Human Service Management
-Strategic Marketing
-Development for Nonprofits
-Research Methods and Outcomes
-Financial Management
-Ethics and Leadership
Students with a bachelor’s degree who successfully complete the certificate program may be eligible to
transfer credits toward a Master in Public Administration graduate degree. The Providers’ Council strives to
offer this important program to its members at an incredible value; less than the cost of one graduate class, as
another way to help prepare future leaders in human services. We anticipate that pricing for the western
Massachusetts Certificate Program to be:
Clark University: Member Price Non-Member Price
$2,900 $5,650
The purpose of this five minute survey is to determine the interest of Providers’ Council member and
nonmember organizations in participating and enrolling interested staff in a HSM certificate program should
it be offered and located in the region. Your response is critical in helping us ensure that the programs and
trainings we developed are aligned to your needs.
Qualtrics is a secure survey tool under the oversight of the IT Department at Clark University. This survey is
completely anonymous. The records of this study will be kept in a locked cabinet in Jonas Clark hall in Clark
University for a period of 90 days. Any report of this research that is made available to the public will not
include your name or any other individual information by which you could be identified.

101
Taking part in this study is completely voluntary. If you choose to be in the study you can withdraw at any
time without consequences of any kind. Participating in this study does not mean that you are giving up any
of your legal rights and you will not be asked for any personal information that could connect the answers
back you. No information you provide will be able to be traced back to you. Please do not provide identifying
information about yourself on this service. Any question may be left unanswered.
This survey is conducted under Clark University and the supervision of Mary M. Piecewicz, who may be
contacted at [email protected]. If you have questions or want a copy or summary of the study results
you may contact the researchers at: Elizabeth Vittum ([email protected]) , Bradley Paul
([email protected]), Maria Pacheco ([email protected]) , Jing Zhang ([email protected]) , Pat
Deschenes ([email protected]), Paul Campbell ([email protected])
Please submit your responses by March 24th, 2017.
Thank you for your time.
1. There is currently no Provider’s Council Nonprofit Human Service Management (HSM) Certificate
Program offered in Western Massachusetts. How interested would your organization be in enrolling staff in
the certificate program if it were held in Springfield or Holyoke and beginning September 2018?
a. Highly likely
b. Likely
c. Not likely
2. If not likely:
a) Would you consider enrolling staff in future years? Yes No Maybe
b) Please explain any other reasons (be specific) _________________
3. Please rate the following factors that would influence your decision in enrolling staff in the HSM
certificate program: (1-most important, 5-least important)
___ Cost
___ Distance
___ Types of classes within program
___ Schedule (weekday; 9 a.m.-4:30 p.m.)
___ Length of Program (Sept. - June)
___ Transportation
4. What challenge do you or your staff have in pursuing professional development opportunities?
Check all that apply
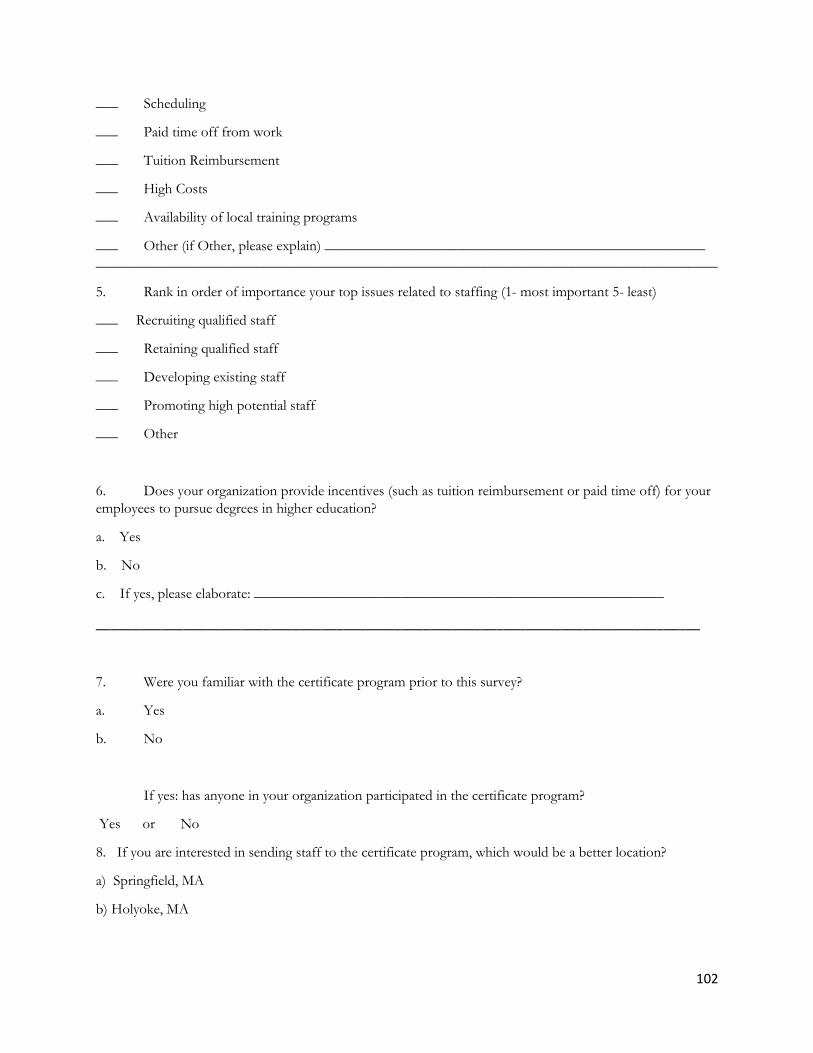
102
___ Scheduling
___ Paid time off from work
___ Tuition Reimbursement
___ High Costs
___ Availability of local training programs
___ Other (if Other, please explain) ____________________________________________________
_____________________________________________________________________________________
5. Rank in order of importance your top issues related to staffing (1- most important 5- least)
___ Recruiting qualified staff
___ Retaining qualified staff
___ Developing existing staff
___ Promoting high potential staff
___ Other
6. Does your organization provide incentives (such as tuition reimbursement or paid time off) for your
employees to pursue degrees in higher education?
a. Yes
b. No
c. If yes, please elaborate: ________________________________________________________
___________________________________________________________________________________
7. Were you familiar with the certificate program prior to this survey?
a. Yes
b. No
If yes: has anyone in your organization participated in the certificate program?
Yes or No
8. If you are interested in sending staff to the certificate program, which would be a better location?
a) Springfield, MA
b) Holyoke, MA

103
9. Please list any other comments, questions, or concerns regarding the Providers’ Council Certificate
Program being held in western Massachusetts:
__________________________________________________________________________________
___________________________________________________________________________________
Background Information:
10. Is your organization a member of the Providers’ Council?
Yes No
11. What is your position? Check all that apply:
a. President or CEO
b. Head of Human Resources or Training Department
c. Other (Please specify:_________________________)
12. Which of the following best describes your service population? (Select all that apply)
a. Intellectual and/or Developmental Disabilities;
c. Mental Health
d. Children and Families
e. Elderly or Senior Citizens
f. Veterans
g. Homeless
h. Substance Abuse/ Addiction
i. People who are incarcerated or just released
k. Domestic Violence
l. Other (please specify)___________________
13. What is your organization’s estimated total annual revenue?
a. Less than $500,000
b. Between $500,000 - $1 Million
c. Between $1 Million - $10 Million
d. Between $10 Million - $50 Million
e. Greater than $50 Million

104
14. Approximately how many staff positions does your organization employ?
a. Less than 100
b. 100-250
c. 250-1,000
d. Greater than 1,000
evittum
Typewritten Text
evittum
Typewritten Text

Appendix D
Survey Report - Member Organizations
Member Organization Report
HSM Western MA Survey
March 28th 2017, 3:38 pm MDT
Appendix D
105

Q4 - There is currently no Provider’s Council Nonprofit Human Service Management (HSM) Certificate Program offered in Western Massachusetts. How interested would your organization be in enrolling staff in the certificate program if it were held in Springfield or Holyoke and beginning September 2018?
106

Q4 - There is currently no Provider’s Council Nonprofit Human Service Management (HSM) Certificate Program offered in Western Massachusetts. How interested would your organization be in enrolling staff in the certificate program if it were held in Springfield or Holyoke and beginning September 2018?
# Answer % Count
1 Very interested 36.36% 4
2 Interested 63.64% 7
3 Not interested 0.00% 0
Total 100% 11
107

Q6 - Would you consider enrolling staff in future years?
108

Q6 - Would you consider enrolling staff in future years?
# Answer % Count
1 Yes 20.00% 2
2 Maybe 80.00% 8
3 No 0.00% 0
Total 100% 10
109

Q8 - Please explain any further reasons
Please explain any further reasons
Would need to be the right person that has already demonstarted a commitment to the organization. The program does sound interesting and like a great opportunity to provide staff development for up and coming leaders
We are a small agency and are interested in this program, but do not have a staff member who is interested at this time. We have enrolled staff in Worcester location before.
cost
small staff. while turnover isn't high, it's unclear who would be on staff and a good match for this program 2+ years away.
110

Q10 - Please rate the following factors that would influence your decision in enrolling staff in the HSM certificate program(With 0 signifying the lowest importance to 5 signifying the most importance.) Field Minimum Maximum Mean Std
Deviation Variance Count
Cost 3.00 5.00 4.50 0.67 0.45 10
Distance 1.00 5.00 3.80 0.98 0.96 10
Types of classes within program
3.00 5.00 3.90 0.70 0.49 10
Schedule (weekday; 9 a.m.-4:30 p.m.)
0.00 5.00 3.09 1.44 2.08 11
Transporation
0.00 4.00 1.67 1.49 2.22 9
Length of the program (Sept-June)
1.00 4.00 3.10 0.83 0.69 10
111

Q12 - What challenge do you or your staff encounter when pursuing professional development opportunities? Check all that apply
112
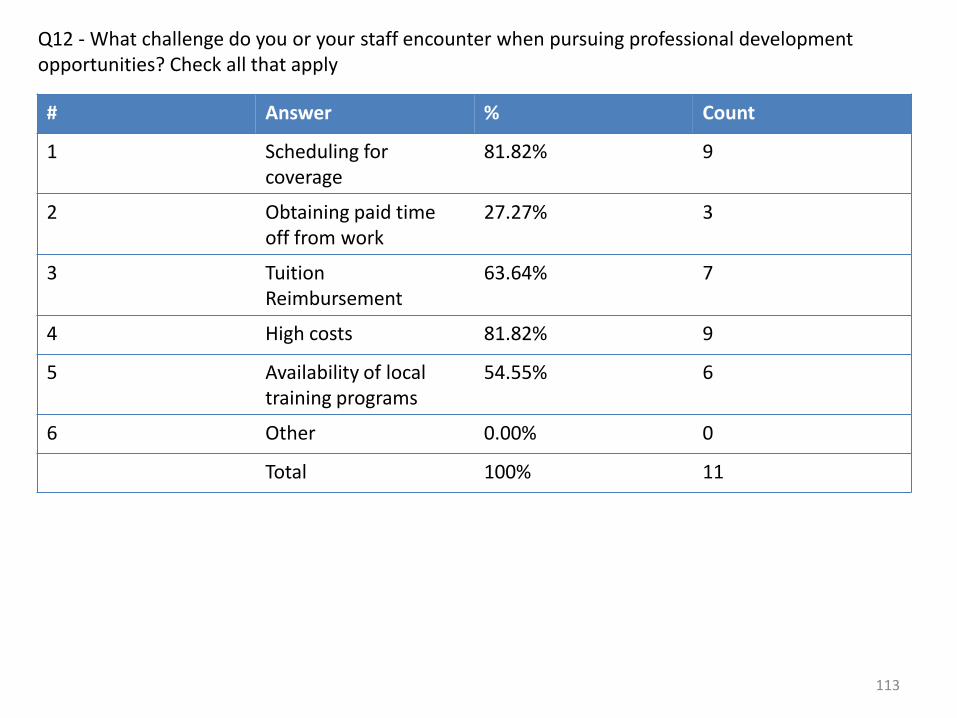
Q12 - What challenge do you or your staff encounter when pursuing professional development opportunities? Check all that apply
# Answer % Count
1 Scheduling for coverage
81.82% 9
2 Obtaining paid time off from work
27.27% 3
3 Tuition Reimbursement
63.64% 7
4 High costs 81.82% 9
5 Availability of local training programs
54.55% 6
6 Other 0.00% 0
Total 100% 11
113
Q12 - What challenge do you or your staff encounter when pursuing professional development opportunities? Check all that apply
Other
114

Q14 - Rate in order your top issues related to staffing: (With 0 signifying the lowest importance to 5 signifying the most importance.)
Field Minimum Maximum Mean Std Deviation
Variance Count
Recruiting qualified staff
3.00 5.00 4.00 0.89 0.80 10
Retaining qualified staff
3.00 5.00 4.29 0.88 0.78 7
Developing existing staff
3.00 5.00 3.75 0.66 0.44 8
Promoting high potential staff
1.00 5.00 2.70 1.49 2.21 10
115

Q16 - Does your organization provide incentives (i.e tuition reimbursement or paid time off) for your employees to pursue degrees in higher education?
116

Q16 - Does your organization provide incentives (i.e tuition reimbursement or paid time off) for your employees to pursue degrees in higher education?
# Answer % Count
1 Yes 45.45% 5
2 No 54.55% 6
Total 100% 11
117

Q17 - Please elaborate on these incentives:
Please elaborate on these incentives:
We offer a tuition reimbursement in the amount of $2500.00 per fiscal year; we offer 3 weeks paid vacation each year
Mostly time off or flexibility with their schedule. We have a very small program to assist with costs associated with pursuing higher education.
tuition reimbursement after 1 year with us for Bachelors, eligible after 5 years toward graduate degree.
we provide up to $500 per semester
tuition reimbursement
118

Q19 - Were you familiar with the HSM Certificate program prior to this survey?
119

Q19 - Were you familiar with the HSM Certificate program prior to this survey?
# Answer % Count
1 Yes 45.45% 5
2 No 54.55% 6
Total 100% 11
120
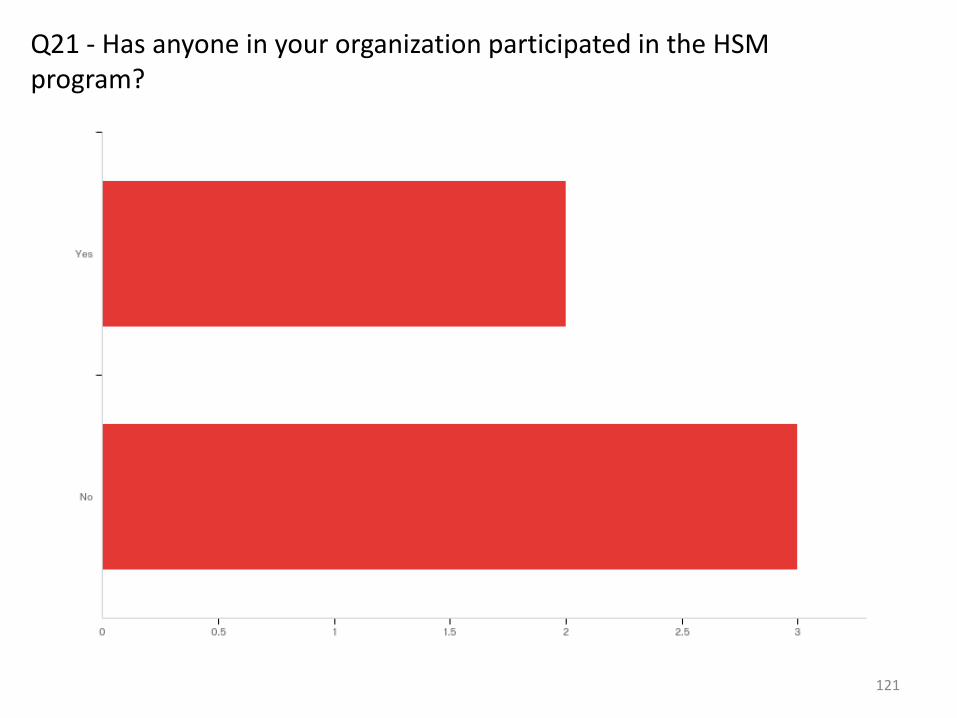
Q21 - Has anyone in your organization participated in the HSM program?
121
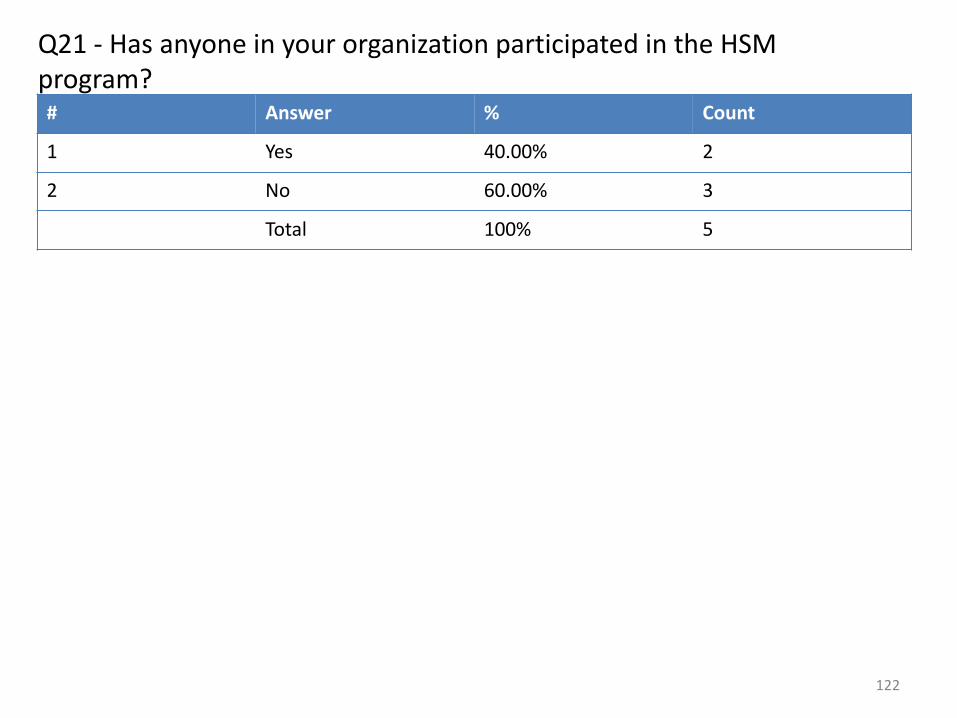
Q21 - Has anyone in your organization participated in the HSM program? # Answer % Count
1 Yes 40.00% 2
2 No 60.00% 3
Total 100% 5
122

Q23 - Has anyone in your organization participated in a program similar to the HSM?
123
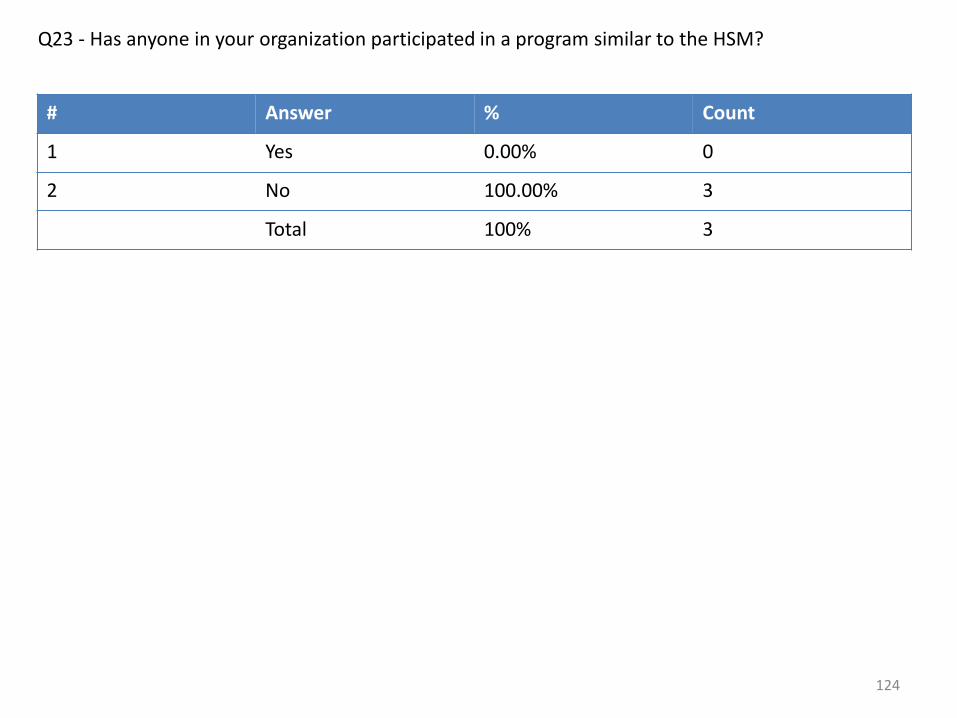
Q23 - Has anyone in your organization participated in a program similar to the HSM?
# Answer % Count
1 Yes 0.00% 0
2 No 100.00% 3
Total 100% 3
124

Q24 - If you are interested in sending staff to the certificate program, which would be a better location?
125

Q24 - If you are interested in sending staff to the certificate program, which would be a better location? # Answer % Count
1 Holyoke 36.36% 4
2 Springfield 63.64% 7
Total 100% 11
126

Q25 - Please list any other comments, questions, or concerns regarding the Providers’ Council Certificate Program being held in western Massachusetts: Please list any other comments, questions, or concerns regarding the Provid...
Holyoke or Spfld bot fine. I am interested in how this would qualify for credits towards local popular programs at BayPath and WSU
considering attendance for myself also
none
a great opportunity! thanks for looking into it coming westward!
127

Q27 - Is your organization a member of the Provider's Council
128

Q27 - Is your organization a member of the Provider's Council
# Answer % Count
1 Yes 100.00% 11
Total 100% 11
129

Q29 - What is your current position?
130

Q29 - What is your current position?
# Answer % Count
1 President or CEO 9.09% 1
2 Head of Human Resources or Training Department
45.45% 5
3 Other 45.45% 5
Total 100% 11
131

Q29 - What is your current position?
Other
asst program director
Coordinator
Program Director
Program Director
132

Q31 - Which of the following best describes your service population? (Select all that apply)
133

Q31 - Which of the following best describes your service population? (Select all that apply) # Answer % Count
1 Intellectual and/or Developmental Disabilities
54.55% 6
2 Mental Health 54.55% 6
3 Children and Family 54.55% 6
4 Elders/senior citizens 27.27% 3
5 Veterans 18.18% 2
6 Homeless 36.36% 4
7 Substance Abuse/ Addiction
45.45% 5
8 People who are incarcerated or recently released
18.18% 2
134

Q31 - Which of the following best describes your service population? (Select all that apply) # Answer % Count
9 Domestic Violence 18.18% 2
10 Other 9.09% 1
Total 100% 11
135

Q31 - Which of the following best describes your service population? (Select all that apply) Other
HIV+
136
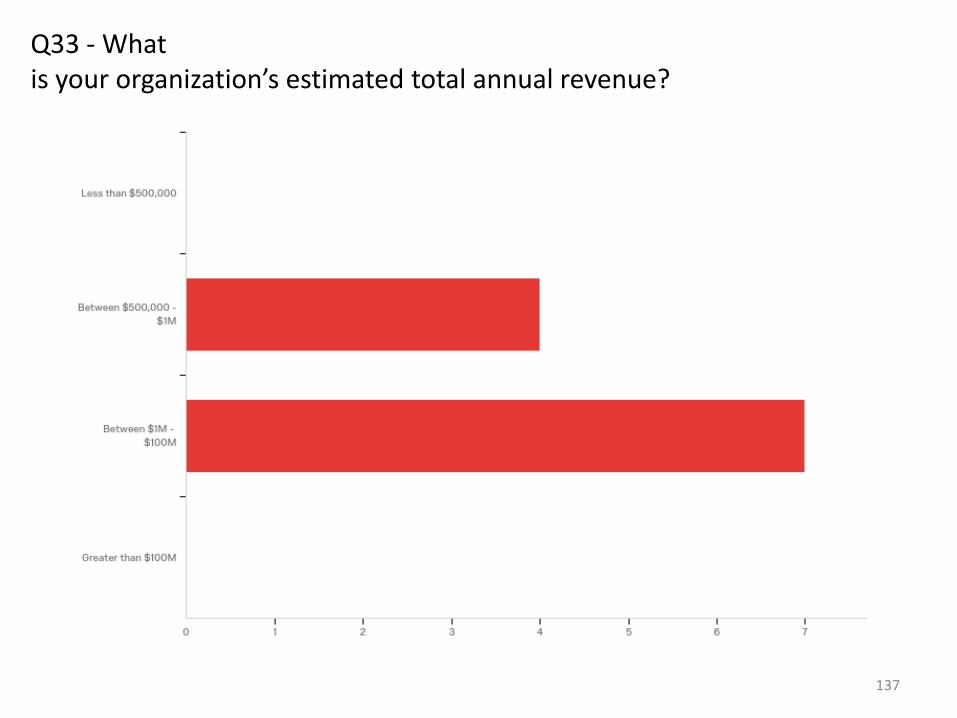
Q33 - What is your organization’s estimated total annual revenue?
137
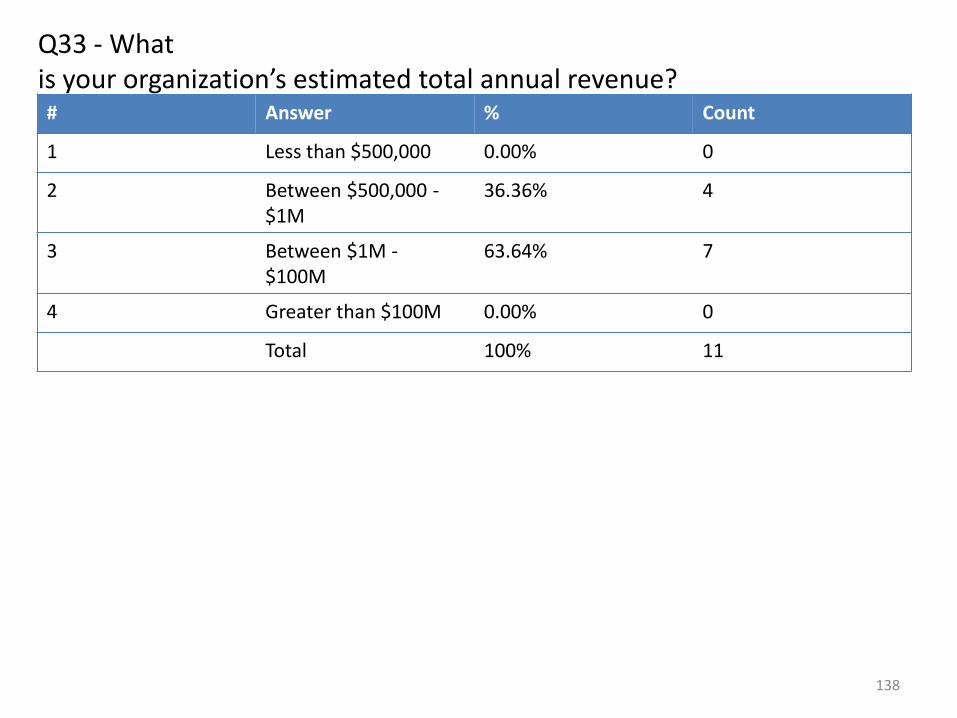
Q33 - What is your organization’s estimated total annual revenue? # Answer % Count
1 Less than $500,000 0.00% 0
2 Between $500,000 - $1M
36.36% 4
3 Between $1M - $100M
63.64% 7
4 Greater than $100M 0.00% 0
Total 100% 11
138
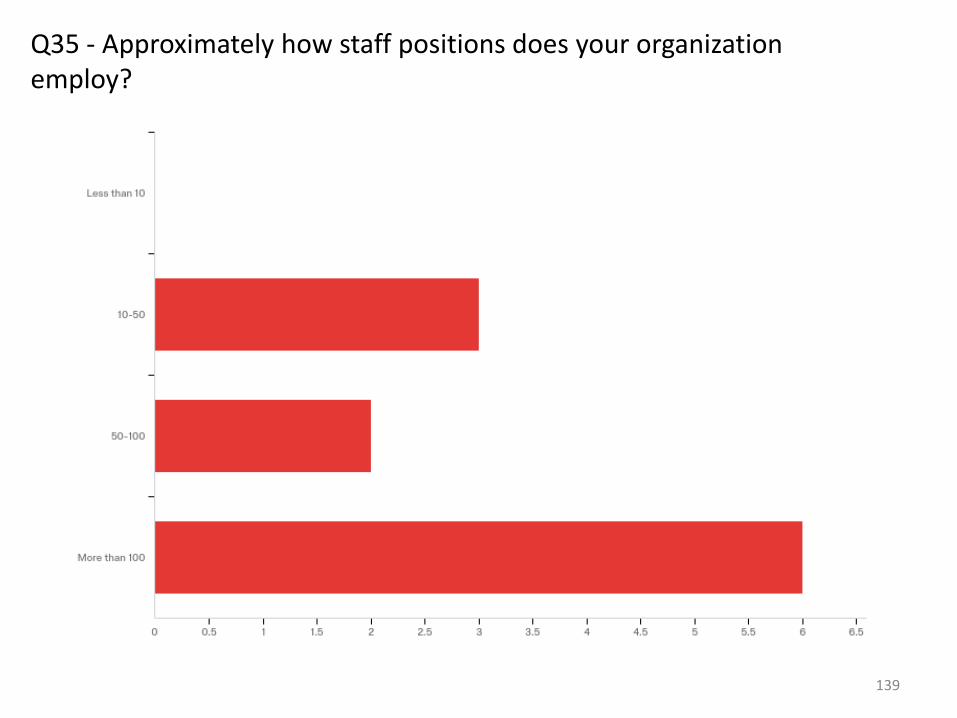
Q35 - Approximately how staff positions does your organization employ?
139

Q35 - Approximately how staff positions does your organization employ? # Answer % Count
1 Less than 10 0.00% 0
2 10-50 27.27% 3
3 50-100 18.18% 2
4 More than 100 54.55% 6
Total 100% 11
140

Q17 - Topics
141

Q17 - Topics
Answer % Count
Unknown 100.00% 2
Total 100% 2
142
evittum
Typewritten Text

Appendix E
Survey Report - Nonmember Organizations

Nonmember Organization Report
HSM Western MA Survey
March 28th 2017, 3:43 pm MDT
Appendix E
143

Q4 - There is currently no Provider’s Council Nonprofit Human Service Management (HSM) Certificate Program offered in Western Massachusetts. How interested would your organization be in enrolling staff in the certificate program if it were held in Springfield or Holyoke and beginning September 2018?
144

Q4 - There is currently no Provider’s Council Nonprofit Human Service Management (HSM) Certificate Program offered in Western Massachusetts. How interested would your organization be in enrolling staff in the certificate program if it were held in Springfield or Holyoke and beginning September 2018?
# Answer % Count
1 Very interested 0.00% 0
2 Interested 60.00% 3
3 Not interested 40.00% 2
Total 100% 5
145

Q6 - Would you consider enrolling staff in future years?
146
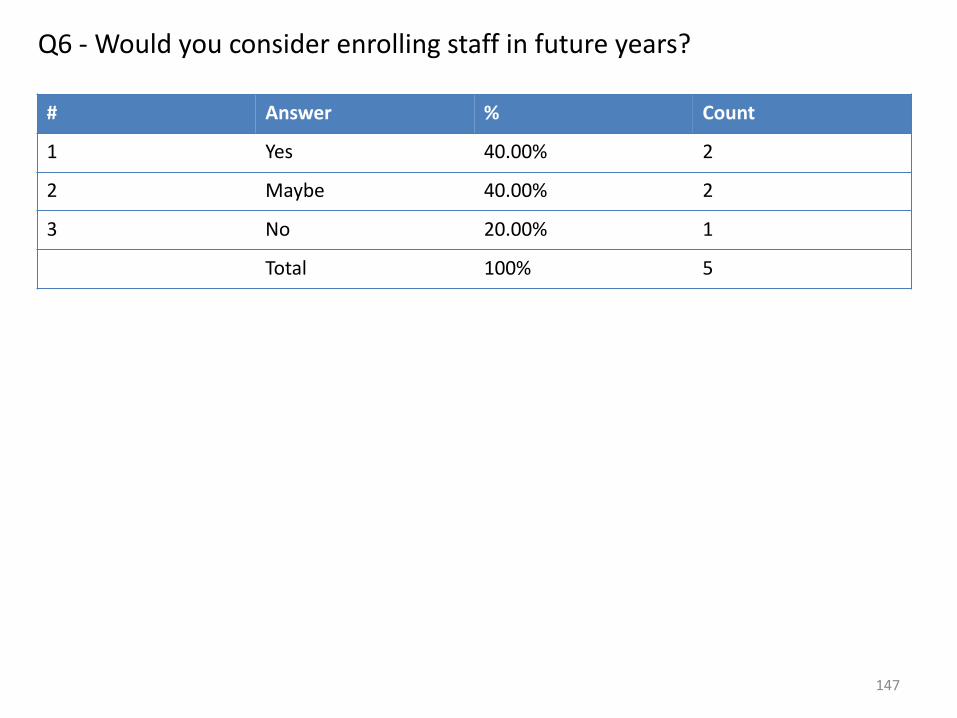
Q6 - Would you consider enrolling staff in future years?
# Answer % Count
1 Yes 40.00% 2
2 Maybe 40.00% 2
3 No 20.00% 1
Total 100% 5
147
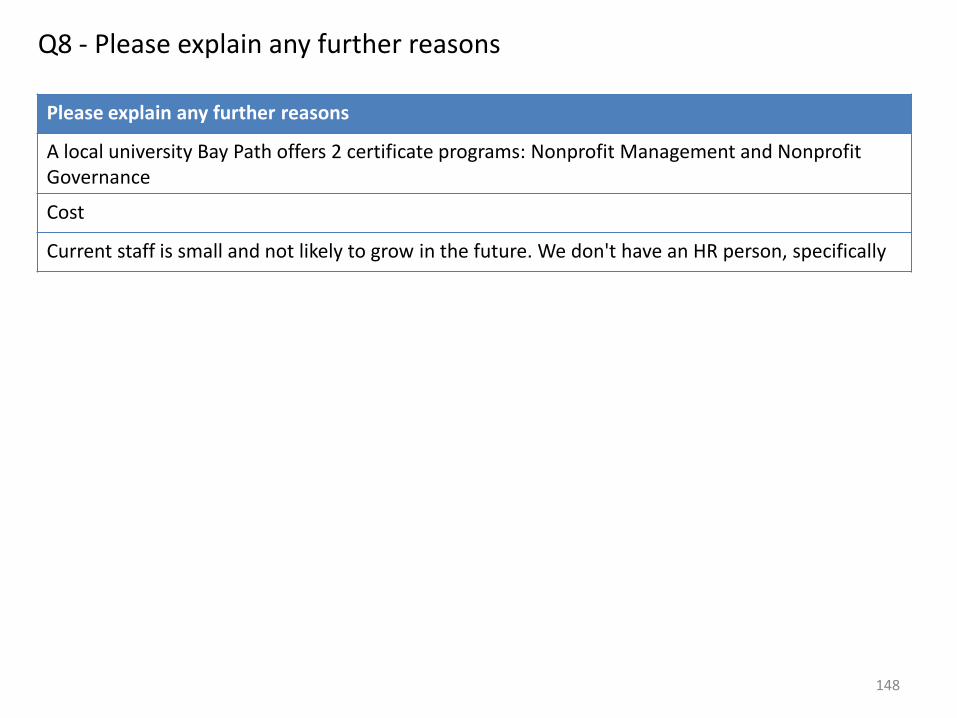
Q8 - Please explain any further reasons
Please explain any further reasons
A local university Bay Path offers 2 certificate programs: Nonprofit Management and Nonprofit Governance
Cost
Current staff is small and not likely to grow in the future. We don't have an HR person, specifically
148

Q10 - Please rate the following factors that would influence your decision in enrolling staff in the HSM certificate program(With 0 signifying the lowest importance to 5 signifying the most importance.) Field Minimum Maximum Mean Std
Deviation Variance Count
Cost 5.00 5.00 5.00 0.00 0.00 5
Distance 4.00 5.00 4.33 0.47 0.22 3
Types of classes within program
1.00 5.00 3.33 1.70 2.89 3
Schedule (weekday; 9 a.m.-4:30 p.m.)
3.00 5.00 4.00 1.00 1.00 4
Transporation
1.00 4.00 2.50 1.50 2.25 2
Length of the program (Sept-June)
1.00 3.00 1.50 0.87 0.75 4
149

Q12 - What challenge do you or your staff encounter when pursuing professional development opportunities? Check all that apply
150

Q12 - What challenge do you or your staff encounter when pursuing professional development opportunities? Check all that apply
# Answer % Count
1 Scheduling for coverage
40.00% 2
2 Obtaining paid time off from work
0.00% 0
3 Tuition Reimbursement
20.00% 1
4 High costs 80.00% 4
5 Availability of local training programs
60.00% 3
6 Other 0.00% 0
Total 100% 5
151

Q12 - What challenge do you or your staff encounter when pursuing professional development opportunities? Check all that apply
Other
152

Q14 - Rate in order your top issues related to staffing: (With 0 signifying the lowest importance to 5 signifying the most importance.)
Field Minimum Maximum Mean Std Deviation
Variance Count
Recruiting qualified staff
1.00 5.00 3.75 1.64 2.69 4
Retaining qualified staff
1.00 5.00 3.67 1.89 3.56 3
Developing existing staff
3.00 5.00 4.00 1.00 1.00 2
Promoting high potential staff
1.00 4.00 1.75 1.30 1.69 4
153

Q16 - Does your organization provide incentives (i.e tuition reimbursement or paid time off) for your employees to pursue degrees in higher education?
154

Q16 - Does your organization provide incentives (i.e tuition reimbursement or paid time off) for your employees to pursue degrees in higher education?
# Answer % Count
1 Yes 20.00% 1
2 No 80.00% 4
Total 100% 5
155
Q17 - Please elaborate on these incentives:
Please elaborate on these incentives:
Tuition reimbursement
156

Q19 - Were you familiar with the HSM Certificate program prior to this survey?
157

Q19 - Were you familiar with the HSM Certificate program prior to this survey?
# Answer % Count
1 Yes 0.00% 0
2 No 100.00% 4
Total 100% 4
158

Q21 - Has anyone in your organization participated in the HSM program?
159

Q21 - Has anyone in your organization participated in the HSM program? # Answer % Count
1 Yes 0.00% 0
2 No 0.00% 0
Total 100% 0
160

Q23 - Has anyone in your organization participated in a program similar to the HSM?
161

Q23 - Has anyone in your organization participated in a program similar to the HSM?
# Answer % Count
1 Yes 0.00% 0
2 No 0.00% 0
Total 100% 0
162

Q24 - If you are interested in sending staff to the certificate program, which would be a better location?
163

Q24 - If you are interested in sending staff to the certificate program, which would be a better location? # Answer % Count
1 Holyoke 40.00% 2
2 Springfield 60.00% 3
Total 100% 5
164

Q25 - Please list any other comments, questions, or concerns regarding the Providers’ Council Certificate Program being held in western Massachusetts: Please list any other comments, questions, or concerns regarding the Provid...
NA
165

Q27 - Is your organization a member of the Provider's Council
166

Q27 - Is your organization a member of the Provider's Council
# Answer % Count
1 No 100.00% 5
Total 100% 5
167

Q29 - What is your current position?
168

Q29 - What is your current position?
# Answer % Count
1 President or CEO 60.00% 3
2 Head of Human Resources or Training Department
20.00% 1
3 Other 20.00% 1
Total 100% 5
169
Q29 - What is your current position?
Other
Director of Commuity Engagement
170
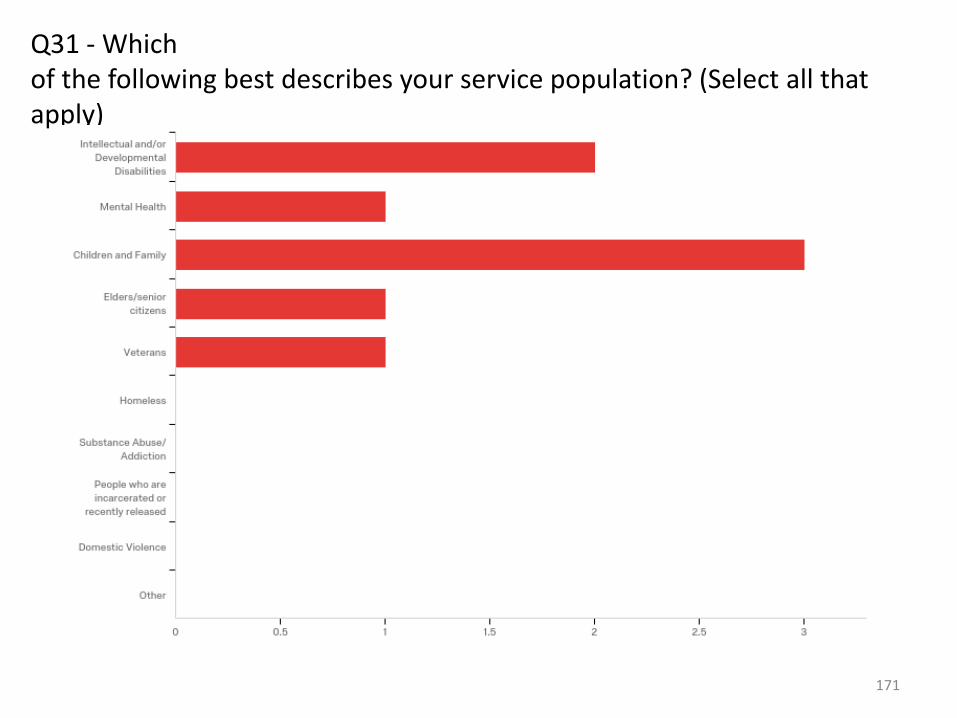
Q31 - Which of the following best describes your service population? (Select all that apply)
171

Q31 - Which of the following best describes your service population? (Select all that apply) # Answer % Count
1 Intellectual and/or Developmental Disabilities
40.00% 2
2 Mental Health 20.00% 1
3 Children and Family 60.00% 3
4 Elders/senior citizens 20.00% 1
5 Veterans 20.00% 1
6 Homeless 0.00% 0
7 Substance Abuse/ Addiction
0.00% 0
8 People who are incarcerated or recently released
0.00% 0
172

Q31 - Which of the following best describes your service population? (Select all that apply) # Answer % Count
9 Domestic Violence 0.00% 0
10 Other 0.00% 0
Total 100% 5
173

Q31 - Which of the following best describes your service population? (Select all that apply) Other
174

Q33 - What is your organization’s estimated total annual revenue?
175
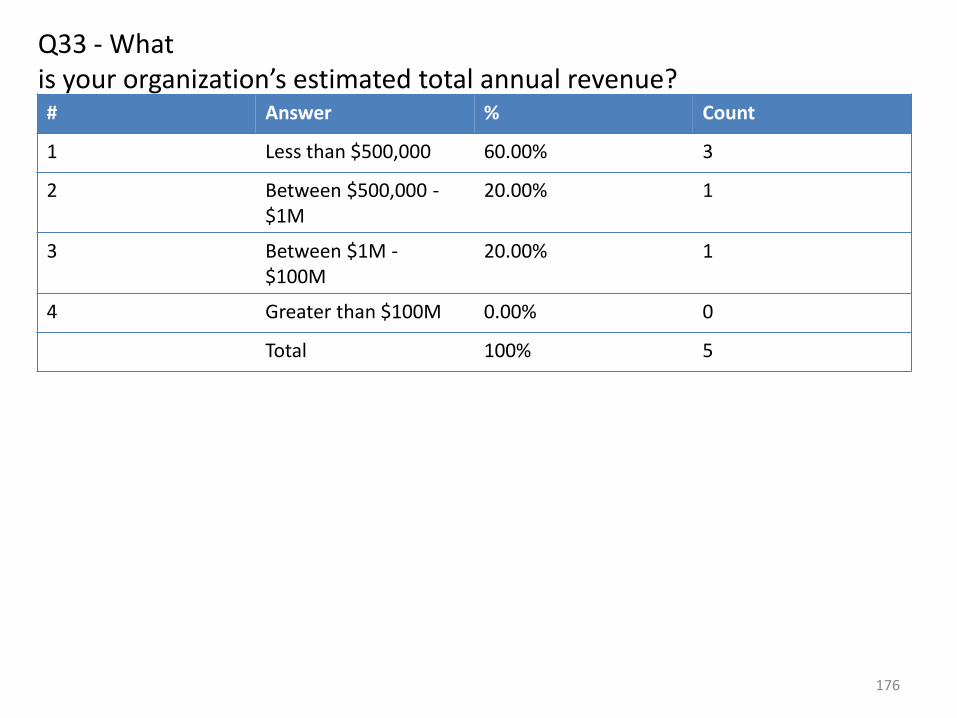
Q33 - What is your organization’s estimated total annual revenue? # Answer % Count
1 Less than $500,000 60.00% 3
2 Between $500,000 - $1M
20.00% 1
3 Between $1M - $100M
20.00% 1
4 Greater than $100M 0.00% 0
Total 100% 5
176

Q35 - Approximately how staff positions does your organization employ?
177

Q35 - Approximately how staff positions does your organization employ? # Answer % Count
1 Less than 10 60.00% 3
2 10-50 0.00% 0
3 50-100 0.00% 0
4 More than 100 40.00% 2
Total 100% 5
178

Q17 - Topics
179

Q17 - Topics
Answer % Count
Total 100% 0
180
evittum
Typewritten Text

Appendix F
Final Presentation Slides

HSM Certificate Expansion to Western
Massachusetts Capstone Project April 26, 2017
By:
Paul Campbell
Patrick Deschenes
Maria Pacheco
Bradley Paul
Elizabeth Vittum
Jing Zhang
evittum
Typewritten Text
Appendix F
Introduction
Introduction, Background of the Project, Statement of Problem

Introduction
• Massachusetts Council of Human Services Providers (Providers’ Council) •State’s largest human services trade association •Recognized as official voice of private provider industry
•Clark University and School of Professional Studies (SPS) •Liberal arts-based research university •National leader in establishing partnerships to “break down barriers between academia and society” •SPS Program offers graduate programs that help students prepare for changing workplace
3

Background of Project
• Certificate in Nonprofit Human Services Management (HSM)
•Offered by the Providers’ Council in partnership with Clark University (Central MA) and Suffolk University (Eastern MA)
•Year-long graduate-level certificate program
•Prepares human services employees for leadership roles in industry
•Providers’ Council and Clark interested in possible HSM Certificate expansion to Western MA nonprofit organizations and employees
4

Statement of the Problem
• Growing population in need of long term services & supports
• Workforce crisis in Human
Services industry • Critical need to retain and
attract qualified and skilled staff
• No HSM Certificate
Program in Western MA
5
Western MA
Nonprofits
Providers’
Council & Clark
SPS
Human
Services
Employees
from Western
MA

Goals and Purpose of Project
Purpose, Goals, Vision & Significance of Project

Purpose of Capstone Project
•Capstone Project will help determine if HSM Certificate Program can be successfully expanded to western Massachusetts’ organizations and employees
• Short Term Outcomes
• Needs assessment for a Certificate Program in Springfield/Holyoke area
• Construction of a financial model for year-long program (Clark SPS only)
• Development of high-level feasibility plan (risks, constraints, assumptions and measures of success) for a successful launch in fall 2018
7

Goals and Vision
• Enrollment Goals
• 15-17 participants enrolled in year 1
• 20% matriculate into Clark’s MPA in year 1
• 25% enroll in MPA in year 2
• One third enroll in MPA in year 3
• Vision •To offer high quality education to mid-level professionals in the nonprofit industry •Ensure delivery of high quality and accessible services to meet the needs of clients in HS industry
8
Significance of Project
• Long-Term Outcomes
• A viable and sustainable revenue stream for SPS
• Extended reach for Providers’ Council
• Increase in professional and leadership development opportunities for nonprofit workforce
• Address a critical need for nonprofit organizations in response to current workforce crisis
9
Description of Project Process
Research on Information & Trends and Market Information Methodology

Study Areas

Human Service Populations (US Census Bureau, 2009-2013)
Study Area Population Poverty Rate Child Poverty Senior Poverty
Western MA 826,500 11.1 - 17.2 12.7 - 28.0 6.8 - 10.2
Worcester County 803,000 11.0 15.2 8.6
Eastern MA 2,935,500 6.4 - 19.6 7.2 - 28.2 7.0 - 18.7
Massachusetts 6,605,000 11.0 15.0 9.0
12
Study Area Population (2015) Median Income # of Organizations
Western MA 830,500 $48,500 - $61,000 14.40
Worcester County 819,000 $65,000 12.47
Eastern MA 3,060,000 $53,500 - $85,000 14.91
Massachusetts 6,795,000 $67,000 14.30 Organizations per 10,000 People

Number and Size of Human Services
Organizations
● 3 to 4 times more population & organizations in E.Mass
● 4 to 6 times the revenue
● 7 to 8 times the assets

Revenue of Human Services Organizations
Massachusetts, 2016 - All Human Services

Revenue of Human Services Organizations
Western MA, 2016 - 501(3)(c) Foundations

Revenue of Human Services Organizations
Public Providers’ Council Members, 2016
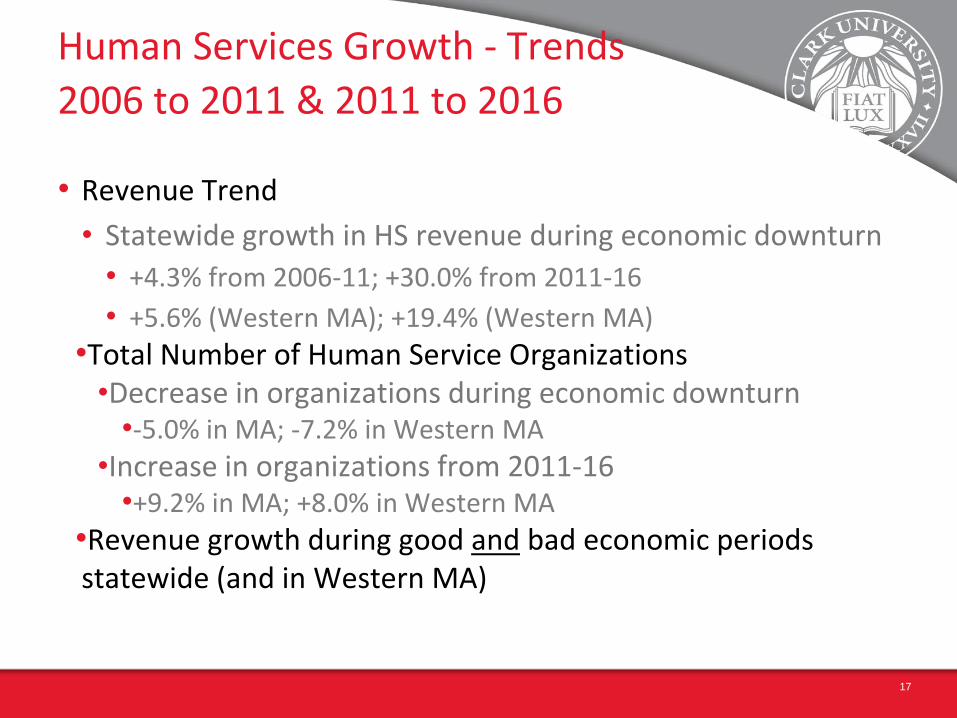
Human Services Growth - Trends
2006 to 2011 & 2011 to 2016
• Revenue Trend
• Statewide growth in HS revenue during economic downturn
• +4.3% from 2006-11; +30.0% from 2011-16
• +5.6% (Western MA); +19.4% (Western MA)
•Total Number of Human Service Organizations •Decrease in organizations during economic downturn
•-5.0% in MA; -7.2% in Western MA
•Increase in organizations from 2011-16 •+9.2% in MA; +8.0% in Western MA
•Revenue growth during good and bad economic periods statewide (and in Western MA)
17

Trends Driving Need for Professional
Development ● Human Services =
4.4% of Total MA Employment
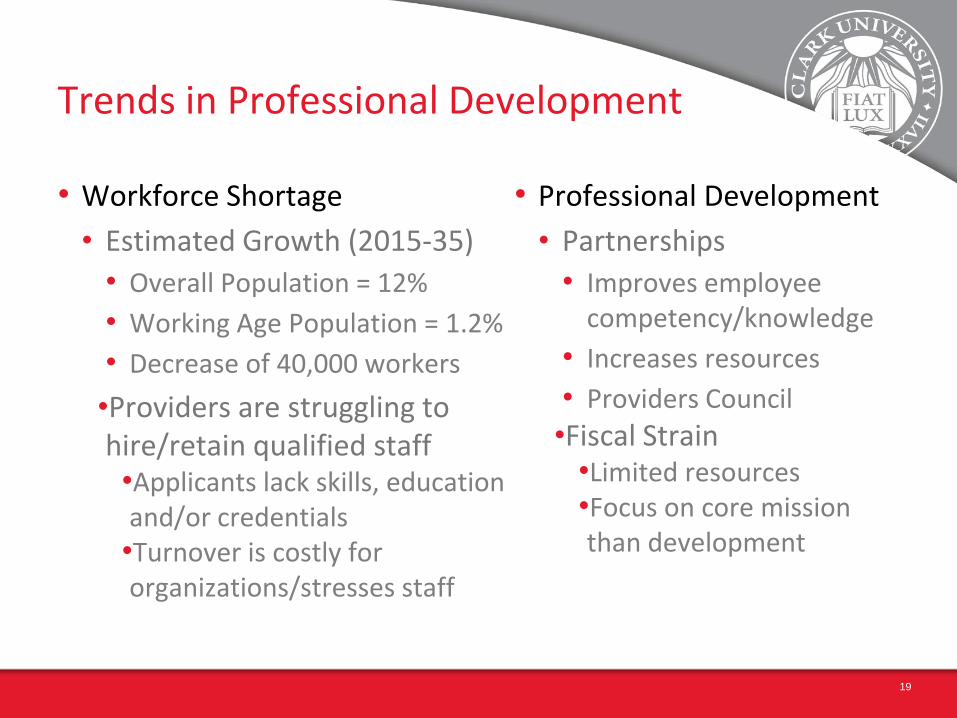
Trends in Professional Development
• Workforce Shortage
• Estimated Growth (2015-35)
• Overall Population = 12%
• Working Age Population = 1.2%
• Decrease of 40,000 workers
•Providers are struggling to hire/retain qualified staff •Applicants lack skills, education and/or credentials •Turnover is costly for organizations/stresses staff
• Professional Development
• Partnerships
• Improves employee competency/knowledge
• Increases resources
• Providers Council
•Fiscal Strain •Limited resources •Focus on core mission than development
19

Methods and Market Information

Methodology
• Primary Source Research •Literature Reviews •In Depth Financial Analysis •Scouting Locations and Prices
• Survey •Direct Market Research •Used to Support or Deny Primary Source Research
21

Primary Source Research
Methodology
• Exploration of Non Profit Sector • Focus from National to Western Mass
• Trends within Professional Development • Global and National Trends
• Western Massachusetts Non Profit Organization’s Financials
• Potential Locations for HSM Program
22

Survey Methodology
• Survey Creation • IRB Approval • Distribution
•104 Identified Human Service Non-Profit Organizations •33 Providers’ Council Member Organizations •71 Non Providers Council Members
•Analysis
23

Survey Conclusions
• Even though survey size was small, it showed an accurate snapshot of human service organizations
• Large Organizations • Only a third offer incentives for professional
development • The interest is there, but the outreach is not • Cost is the biggest obstacle for professional development
24
Survey Limitations
• IRB Delay • Providers’ Council Individualized Emailed vs Non Member
Mass Email • Invalid Organization Emails • Small Sample Size
25

Market Information
•The main competition for the HSM program are existing private
colleges, community and technical colleges as well as state
universities in the area
•Focus on management, organizational development and nonprofit
administration
•Certificate programs are available such as the Supervision and
Leadership in the Helping Professions
•Emerging online colleges which offer similar degrees remotely
26

Market Information
•The length of the program stood out as a significant difference
•Many colleges promote the length of their programs to be of
around 20 months
•Many of the individuals programs are currently working full time
at an organization in the Human Services industry already
•None offered students the option to potentially transfer course
credits from prior certificate or licensing programs
27

Market Information: Cost Comparison
•The current cost for members is $2,900 while for nonmembers the cost is $5650
28

Market Information
• Providers’ Council is the entity directly in charge of informing potential
individuals about the opening of this new HSM program in Western MA.
• In-depth information may be easily accessed through their website, including
pricing, objectives and benefits that this program might bring for its participants.
• Provider’s Council relies heavily on social media to inform the public on
upcoming events and the opening of new programs such as the HSM.
• A weekly e-newsletter is sent out for the entirety of the application process for
the two prior programs in Boston and Worcester, an action they intend to
continue in the opening of future program.
29

Financial Factors
• Holyoke Locations
• Holyoke Public Library
• Holyoke Community College’s Picknelly Adult & Family Education Center
• Springfield Locations
• The Community Foundation of Western MA
• Western Springfield Public Library
30

Results and Reflection
Salient Issues

Limitation of the Feasibility Report
• Data Gathering
• National Center for Charitable Statistics (NCCS):
• Most cumulative data is at a state and county level only
• Failed to account for what region a person actually did program
• Changes to the number of organizations by revenue
•Not all organizations must report their revenue
•Private/Public (Public guidelines)
•Providers’ Council Data
•Estimates were assessed from anecdotal evidence given to us by collaborating officials
32

Findings
• Program will need to rely on Providers’ Council members in order for it to be feasible. •Boston and Worcester programs only get about 3 to 5 participants total, among both programs, from nonmember organizations •Providers’ Council members appear to generate larger revenues than nonmembers
•Unlikelihood of the western Massachusetts program relying on wait list participants from Suffolk or Worcester programs. •Boston area too far away •No wait list in Worcester
33

Survey Results
• All member organizations were interested in program while only 60% of nonmember organizations were interested •Aligns with data from the Boston and Worcester program locations
•High costs were the number one factor in apprehension for enrolling in the program •Aligns with trends in industry
•Scheduling or coverage, high cost, and availability of local programs were all a barrier for professional development
34

Reflection
• Developing and retaining staff were rated as top issues for both member and nonmember nonprofit organizations
• Present need for this type of program in the industry • Respondents were not familiar with the HSM Certificate
program prior to our survey but, the majority were interest in an expansion to Western Massachusetts
• Financial means to attend this program as it’s currently
designed and the limited pool of potential participants are issues to keep aware of
35

Recommendations
Summary Conclusion

Recommendations
• Conducting an awareness and advertising campaign
37
survey promotional
events
awareness
benefits
comparison
seriousness
networking

Recommendations
• Potentially shifting the price of the program
38

Implications for Professional
Development

Implications for Professional
Development
• A significant takeaway was learning more about the workforce crisis that stands to cripple the health and human services
industry now and in the coming decades and how I can utilize this knowledge in my own professional work. (Liz)
• I learned about how to estimate demand for any service and thought the lessons learned in this feasibility report is
something we can apply to any industry; both for- or non-profits (Paul)
• What I learned from this capstone is that I realized the importance of finance in a program. It is essential for us to do a
detailed research about the cost of the product before we begin to establish the program. We should consider all parties
which are involved in the program. Additionally, how to price a product is another important factor for a program. We
should make sure that the program will make profit in the long run, also, we need to consider if the consumers accept the
price we make.(Jenny)
• One of the most significant things I learned from this project is the need for understanding the market. Despite a program
already existing in a relatively similar area, it is not always feasible to conduct an expansion which immediately mimics
what has been done with previous openings. It is pivotal to first look at the trends and peculiarities of the industry in order
to understand the specific needs for a product or service at a particular time. Although is it difficult to fully predict the
success of an expansion, it is important to that all these factors into consideration before investing in new ventures. (Maria)
• One thing in particular that stood out to me was accessing the difficulty behind the logistics of an expansion. Taking into
account all the various factors that can arise and measures that need to be taken it truly is not a simple procedure. Only
through careful planning and stable data can the success of an expansion be measured and even then luck and right timing
sometimes play just as big a factor. (Patrick)
• (Bradley)
40

Acknowledgements

Acknowledgements
The Human Services Management (HSM) Certificate Expansion to Western
Massachusetts Capstone team would like to acknowledge both the Providers’ Council
and the Clark University School of Professional Studies for their commitment toward
improving and strengthening the human services sector in Massachusetts. We commend
both institutions for recognizing the need to provide critical and affordable growth and
development opportunities for staff working in this sector, with the ultimate goal of
ensuring quality and care for vulnerable populations. We would like to thank Ella
Froggatt and Michael Weekes of the Providers’ Council for their time, patience and
responsiveness towards us during this research project. We would especially like to
thank our Capstone Advisor, Mary Piecewicz, for sharing her time, expertise and
guidance throughout the semester.
42

Thank You!

HSM Certificate Expansion to Western
Massachusetts Capstone Project April 26, 2017
By:
Paul Campbell
Patrick Deschenes
Maria Pacheco
Bradley Paul
Elizabeth Vittum
Jing Zhang
evittum
Typewritten Text
evittum
Typewritten Text
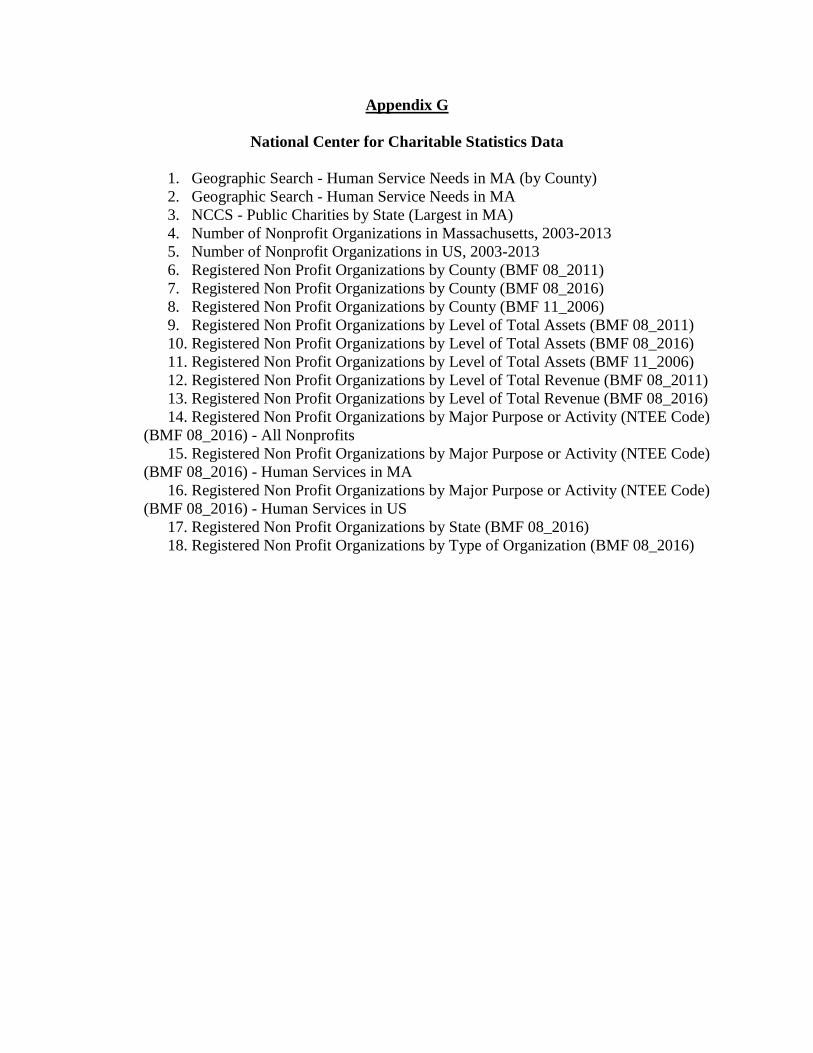
Appendix G
National Center for Charitable Statistics Data
1. Geographic Search - Human Service Needs in MA (by County)
2. Geographic Search - Human Service Needs in MA
3. NCCS - Public Charities by State (Largest in MA)
4. Number of Nonprofit Organizations in Massachusetts, 2003-2013
5. Number of Nonprofit Organizations in US, 2003-2013
6. Registered Non Profit Organizations by County (BMF 08_2011)
7. Registered Non Profit Organizations by County (BMF 08_2016)
8. Registered Non Profit Organizations by County (BMF 11_2006)
9. Registered Non Profit Organizations by Level of Total Assets (BMF 08_2011)
10. Registered Non Profit Organizations by Level of Total Assets (BMF 08_2016)
11. Registered Non Profit Organizations by Level of Total Assets (BMF 11_2006)
12. Registered Non Profit Organizations by Level of Total Revenue (BMF 08_2011)
13. Registered Non Profit Organizations by Level of Total Revenue (BMF 08_2016)
14. Registered Non Profit Organizations by Major Purpose or Activity (NTEE Code)
(BMF 08_2016) - All Nonprofits
15. Registered Non Profit Organizations by Major Purpose or Activity (NTEE Code)
(BMF 08_2016) - Human Services in MA
16. Registered Non Profit Organizations by Major Purpose or Activity (NTEE Code)
(BMF 08_2016) - Human Services in US
17. Registered Non Profit Organizations by State (BMF 08_2016)
18. Registered Non Profit Organizations by Type of Organization (BMF 08_2016)

3/6/2017 Geographic Search
http://nccsweb.urban.org/PubApps/geoSearch2.php?drillGeo=4&q=MA&ntee1=IJKLMNOP 1/2
Back Overview Search Again
Log InRegisterFeedbackMy ProfileHome
Geographic SearchNumber found: 14 Click on name to learn more about the location or choose 'Search Again' from the menu above.
Name Population
MedianHouseholdIncome
PovertyRate
Numberof
Children
ChildPovertyRate
Numberof
Childrenin
Poverty
Numberof
Seniors
SeniorPovertyRate
Numberof
Seniorsin
Poverty Drill Down
Barnstable County(Massachusetts) 215,449 60,526 9.2 36,310 14.5 5,282 55,489 6.5 3,623 Zip Codes
Census Tracts
Berkshire County(Massachusetts) 130,545 48,450 12.3 24,775 19.0 4,706 25,073 8.2 2,059 Zip Codes
Census Tracts
Bristol County(Massachusetts) 549,870 55,298 12.1 120,441 16.8 20,203 80,388 10.7 8,598 Zip Codes
Census Tracts
Dukes County (Massachusetts) 16,739 66,288 10.0 3,177 12.8 406 2,898 9.4 274 Zip Codes Census Tracts
Essex County (Massachusetts) 750,808 67,311 11.0 170,835 15.8 26,950 109,049 9.2 10,050 Zip Codes Census Tracts
Franklin County(Massachusetts) 71,408 53,663 11.9 13,785 16.3 2,246 11,404 8.0 916 Zip Codes
Census Tracts
Hampden County(Massachusetts) 465,144 49,094 17.2 108,343 28.0 30,386 67,406 10.2 6,856 Zip Codes
Census Tracts
Hampshire County(Massachusetts) 159,267 61,227 11.1 26,100 12.7 3,311 21,088 6.8 1,424 Zip Codes
Census Tracts
Middlesex County(Massachusetts) 1,522,533 82,090 7.9 320,847 9.0 29,024 203,273 7.5 15,327 Zip Codes
Census Tracts
evittum
Typewritten Text
Appendix G.1

3/6/2017 Geographic Search
http://nccsweb.urban.org/PubApps/geoSearch2.php?drillGeo=4&q=MA&ntee1=IJKLMNOP 2/2
Name Population
MedianHouseholdIncome
PovertyRate
Numberof
Children
ChildPovertyRate
Numberof
Childrenin
Poverty
Numberof
Seniors
SeniorPovertyRate
Numberof
Seniorsin
Poverty Drill Down
Nantucket County(Massachusetts) 10,224 85,478 10.3 2,143 15.4 329 1,278 11.9 153 Zip Codes
Census Tracts
Norfolk County(Massachusetts) 677,296 84,916 6.4 151,278 7.2 10,854 100,460 7.0 6,987 Zip Codes
Census Tracts
Plymouth County(Massachusetts) 497,386 75,092 7.5 117,557 9.8 11,575 72,407 6.0 4,330 Zip Codes
Census Tracts
Suffolk County(Massachusetts) 735,701 53,540 19.6 128,293 28.2 36,213 78,150 18.7 14,613 Zip Codes
Census Tracts
Worcester County(Massachusetts) 802,688 65,223 10.8 184,166 15.2 28,006 105,417 8.6 9,111 Zip Codes
Census Tracts
Note: Demographic data are from the U.S. Census Bureau, American Communities Survey 20092013.
Counties

3/6/2017 Geographic Search
http://nccsweb.urban.org/PubApps/geoSearch2.php 1/1
Back Overview Search Again
Log InRegisterFeedbackMy ProfileHome
Geographic SearchNumber found: 1 Click on name to learn more about the location or choose 'Search Again' from the menu above.
Name Population
MedianHouseholdIncome
PovertyRate
Numberof
Children
ChildPovertyRate
Numberof
Childrenin
Poverty
Numberof
Seniors
SeniorPovertyRate
Numberof
Seniorsin
Poverty Drill Down
Massachusetts (Massachusetts) 6,605,058 66,866 11.0 1,408,050 14.9 209,308 933,780 9.0 84,234 Counties
Note: Demographic data are from the U.S. Census Bureau, American Communities Survey 20092013.
evittum
Typewritten Text
Appendix G.2

3/6/2017 NCCS Public Charities by State
http://nccsweb.urban.org/PubApps/showOrgsByCategory.php?group=state&sample=0&filter=MA 1/2
Log InRegisterFeedbackMy ProfileHome
Public Charities by State State = MAMassachusetts Number of organizations reporting assets or income: 13,156. GrossReceipts=$188,159,734,168. Assets=$256,623,581,304
Largest Organizations (by Gross Receipts) (MA)
Profile Form990 Organization Gross Receipts Total Assets
1 President and Fellows of HarvardCollege (Boston, MA) 83,181,439,574 72,763,619,000
2 Partners Healthcare System Inc(Boston, MA) 10,625,521,687 13,371,605,172
3 Fidelity Investments CharitableGift Fund (Boston, MA) 6,981,562,844 10,282,142,229
4 Umass Memorial Health Care Inc(Worcester, MA) 2,759,187,032 2,152,708,574
5 Harvard Management PrivateEquity Corporation (Boston, MA) 2,589,355,187 11,792,283,918
6 Trustees for Harvard University(Cambridg, MA) 2,203,725,918 1,066,926,424
7 Harvard Pilgrim Health Care Inc(Wellesley, MA) 2,142,477,807 878,795,837
8 University Health Network(Longmeadow, MA) 1,883,283,807 1,795,960,199
9 Trustees of Tufts College (Medford,MA) 1,880,302,730 2,981,550,363
10 Childrens Hospital Corporation(Boston, MA) 1,793,772,617 4,026,419,766
Largest Organizations (by Total Assets) (MA)
Profile Form990 Organization Gross Receipts Total Assets
1 President and Fellows of HarvardCollege (Boston, MA) 83,181,439,574 72,763,619,000
2 Partners Healthcare System Inc 10,625,521,687 13,371,605,172
evittum
Typewritten Text
Appendix G.3.
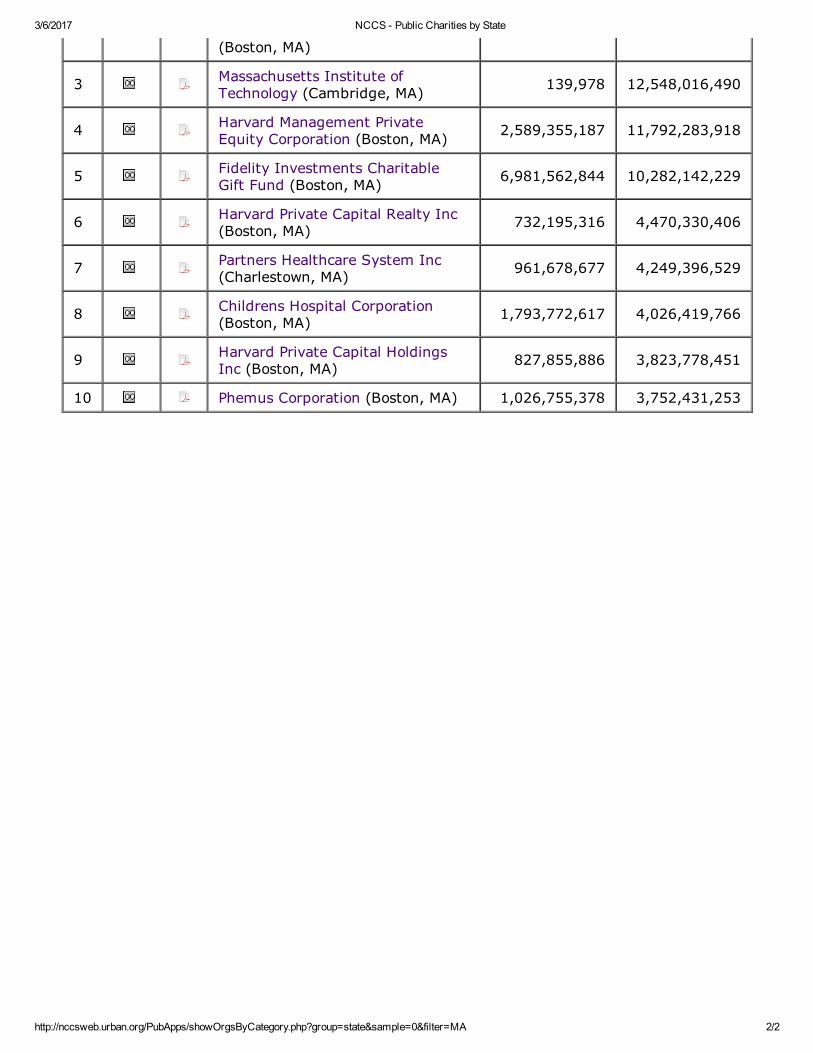
3/6/2017 NCCS Public Charities by State
http://nccsweb.urban.org/PubApps/showOrgsByCategory.php?group=state&sample=0&filter=MA 2/2
(Boston, MA)
3 Massachusetts Institute ofTechnology (Cambridge, MA) 139,978 12,548,016,490
4 Harvard Management PrivateEquity Corporation (Boston, MA) 2,589,355,187 11,792,283,918
5 Fidelity Investments CharitableGift Fund (Boston, MA) 6,981,562,844 10,282,142,229
6 Harvard Private Capital Realty Inc(Boston, MA) 732,195,316 4,470,330,406
7 Partners Healthcare System Inc(Charlestown, MA) 961,678,677 4,249,396,529
8 Childrens Hospital Corporation(Boston, MA) 1,793,772,617 4,026,419,766
9 Harvard Private Capital HoldingsInc (Boston, MA) 827,855,886 3,823,778,451
10 Phemus Corporation (Boston, MA) 1,026,755,378 3,752,431,253

3/4/2017 NCCS US/State Profiles
http://nccsweb.urban.org/PubApps/profile1.php?state=MA 1/1
Log InRegisterFeedbackMy ProfileHome
NCCS > Statistics > Profiles You can click on items in blue such as '501(c)(3) Public Charities' to get more detailed reports.
Number of Nonprofit Organizations in Massachusetts, 2003 2013 2003 2013
Number of Orgs.
Percent of AllOrgs.
Number of Orgs.
Percent of AllOrgs.
Pct.Change
All Nonprofit Organizations 34,256 100.0% 33,722 100.0% 1.6%
501(c)(3) Public Charities 19,876 58.0% 22,718 67.4% 14.3%
501(c)(3) Private Foundations 4,164 12.2% 3,515 10.4% 15.6%
Other 501(c) Nonprofit Organizations 10,216 29.8% 7,489 22.2% 26.7%
Small community groups and partnerships, etc. Unknown NA Unknown NA NA
501(c)(3) Public Charities 19,876 58.0% 22,718 67.4% 14.3%
501(c)(3) Public Charities Registered with the IRS(including registered congregations) 19,876 58.0% 22,718 67.4% 14.3%
Reporting Public Charities 8,694 25.4% 12,356 36.6% 42.1%
Operating Public Charities 7,621 22.2% 10,699 31.7% 40.4%
Supporting Public Charities 1,073 3.1% 1,657 4.9% 54.4%
NonReporting, or with less than $25,000 in GrossReceipts 11,182 32.6% 10,362 30.7% 7.3%
Congregations (about half are registered with IRS)* Unknown 0.0% Unknown 0.0% NA
501(c)(3) Private Foundations 4,164 12.2% 3,515 10.4% 15.6%
Private Grantmaking (NonOperating) Foundations 3,948 11.5% 3,292 9.8% 16.6%
Private Operating Foundations 216 0.6% 223 0.7% 3.2%
Other 501(c) Nonprofit Organizations 10,216 29.8% 7,489 22.2% 26.7%
Civic leagues, social welfare orgs, etc. 1,850 5.4% 1,275 3.8% 31.1%
Fraternal beneficiary societies 1,866 5.4% 1,198 3.6% 35.8%
Business leagues, chambers of commerce, etc. 1,398 4.1% 1,178 3.5% 15.7%
Labor, agricultural, horticultural orgs 1,836 5.4% 1,273 3.8% 30.7%
Social and recreational clubs 1,463 4.3% 1,211 3.6% 17.2%
Post or organization of war veterans 835 2.4% 627 1.9% 24.9%
All Other Nonprofit Organizations 968 2.8% 727 2.2% 24.9%
Note: Excludes outofscope organizations. "Reporting" public charities include all organizations filing IRS Form 990, 990EZ or990PF. "Supporting" public charities include a small number of "mutual benefit" charities as well.Sources: IRS Business Master Files 11/2003 and 10/2013 (with modifications by the National Center for Charitable Statistics atthe Urban Institute to exclude foreign and governmental organizations). pcm2: 23.
evittum
Typewritten Text
Appendix G.4
evittum
Typewritten Text

3/4/2017 NCCS US/State Profiles
http://nccsweb.urban.org/PubApps/profile1.php?state=US 1/1
Log InRegisterFeedbackMy ProfileHome
NCCS > Statistics > Profiles You can click on items in blue such as '501(c)(3) Public Charities' to get more detailed reports.
Number of Nonprofit Organizations in the United States, 2003 2013 2003 2013
Number of Orgs.
Percent of AllOrgs.
Number of Orgs.
Percent of AllOrgs.
Pct.Change
All Nonprofit Organizations 1,369,123 100.0% 1,406,786 100.0% 2.8%
501(c)(3) Public Charities 783,811 57.2% 945,393 67.2% 20.6%
501(c)(3) Private Foundations 103,387 7.6% 96,759 6.9% 6.4%
Other 501(c) Nonprofit Organizations 481,925 35.2% 364,634 25.9% 24.3%
Small community groups and partnerships, etc. Unknown NA Unknown NA NA
501(c)(3) Public Charities 783,811 57.2% 945,393 67.2% 20.6%
501(c)(3) Public Charities Registered with the IRS(including registered congregations) 783,811 57.2% 945,393 67.2% 20.6%
Reporting Public Charities 267,209 19.5% 356,475 25.3% 33.4%
Operating Public Charities 231,584 16.9% 308,945 22.0% 33.4%
Supporting Public Charities 35,625 2.6% 47,530 3.4% 33.4%
NonReporting, or with less than $25,000 in GrossReceipts 516,602 37.7% 588,918 41.9% 14.0%
Congregations (about half are registered with IRS)* Unknown 0.0% Unknown 0.0% NA
501(c)(3) Private Foundations 103,387 7.6% 96,759 6.9% 6.4%
Private Grantmaking (NonOperating) Foundations 99,107 7.2% 91,554 6.5% 7.6%
Private Operating Foundations 4,280 0.3% 5,205 0.4% 21.6%
Other 501(c) Nonprofit Organizations 481,925 35.2% 364,634 25.9% 24.3%
Civic leagues, social welfare orgs, etc. 119,772 8.7% 82,197 5.8% 31.4%
Fraternal beneficiary societies 99,082 7.2% 62,398 4.4% 37.0%
Business leagues, chambers of commerce, etc. 71,054 5.2% 61,980 4.4% 12.8%
Labor, agricultural, horticultural orgs 58,477 4.3% 45,493 3.2% 22.2%
Social and recreational clubs 56,335 4.1% 45,812 3.3% 18.7%
Post or organization of war veterans 34,172 2.5% 29,868 2.1% 12.6%
All Other Nonprofit Organizations 43,033 3.1% 36,886 2.6% 14.3%
Note: Excludes outofscope organizations. "Reporting" public charities include all organizations filing IRS Form 990, 990EZ or990PF. "Supporting" public charities include a small number of "mutual benefit" charities as well.Sources: IRS Business Master Files 11/2003 and 10/2013 (with modifications by the National Center for Charitable Statistics atthe Urban Institute to exclude foreign and governmental organizations). pcm2: 893.
evittum
Typewritten Text
Appendix G.5
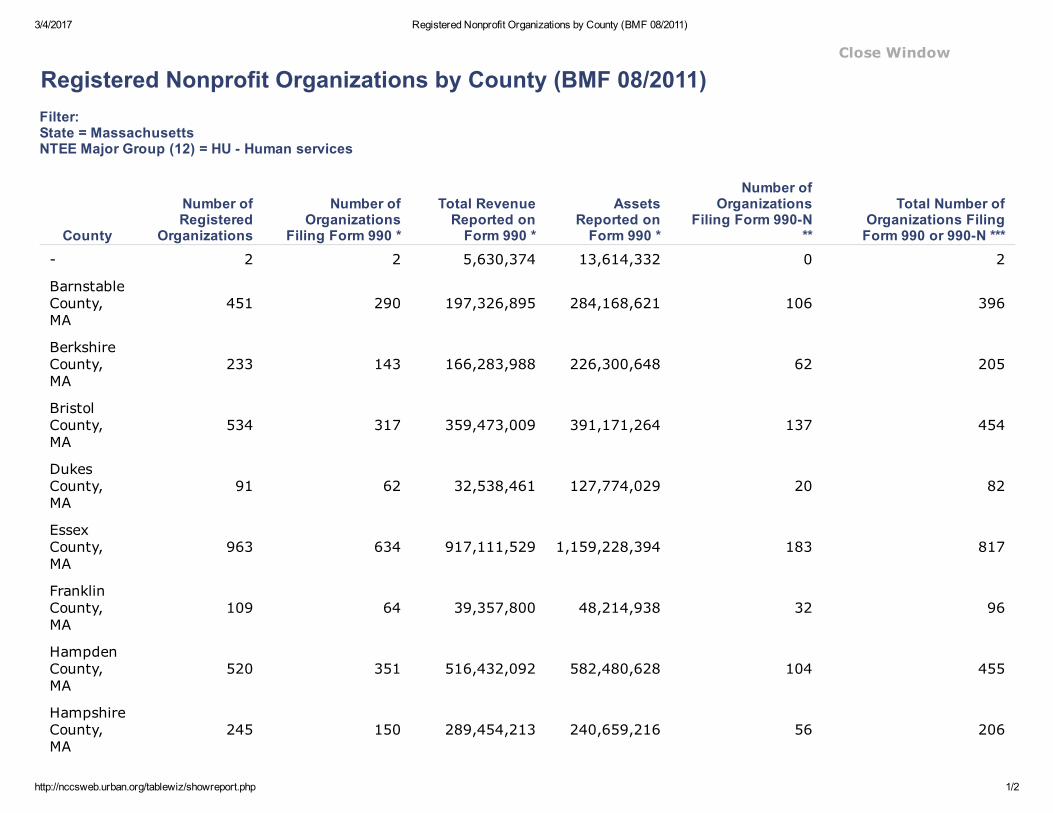
3/4/2017 Registered Nonprofit Organizations by County (BMF 08/2011)
http://nccsweb.urban.org/tablewiz/showreport.php 1/2
Close Window
Registered Nonprofit Organizations by County (BMF 08/2011)Filter:State = MassachusettsNTEE Major Group (12) = HU Human services
County
Number ofRegistered
Organizations
Number ofOrganizations
Filing Form 990 *
Total RevenueReported onForm 990 *
AssetsReported onForm 990 *
Number ofOrganizations
Filing Form 990N**
Total Number ofOrganizations FilingForm 990 or 990N ***
2 2 5,630,374 13,614,332 0 2
BarnstableCounty,MA
451 290 197,326,895 284,168,621 106 396
BerkshireCounty,MA
233 143 166,283,988 226,300,648 62 205
BristolCounty,MA
534 317 359,473,009 391,171,264 137 454
DukesCounty,MA
91 62 32,538,461 127,774,029 20 82
EssexCounty,MA
963 634 917,111,529 1,159,228,394 183 817
FranklinCounty,MA
109 64 39,357,800 48,214,938 32 96
HampdenCounty,MA
520 351 516,432,092 582,480,628 104 455
HampshireCounty,MA
245 150 289,454,213 240,659,216 56 206
evittum
Typewritten Text
Appendix G.6

3/4/2017 Registered Nonprofit Organizations by County (BMF 08/2011)
http://nccsweb.urban.org/tablewiz/showreport.php 2/2
County
Number ofRegistered
Organizations
Number ofOrganizations
Filing Form 990 *
Total RevenueReported onForm 990 *
AssetsReported onForm 990 *
Number ofOrganizations
Filing Form 990N**
Total Number ofOrganizations FilingForm 990 or 990N ***
MiddlesexCounty,MA
1,960 1,257 1,546,167,571 2,112,630,881 419 1,676
NantucketCounty,MA
47 37 22,868,309 189,806,127 8 45
NorfolkCounty,MA
917 578 835,247,022 1,366,742,355 213 791
PlymouthCounty,MA
576 334 325,612,636 310,110,152 155 489
SuffolkCounty,MA
1,310 892 1,800,996,643 3,808,164,132 236 1,128
WorcesterCounty,MA
935 549 638,854,020 1,005,119,475 242 791
Total 8,893 5,660 7,693,354,562 11,866,185,192 1,973 7,633
Citation: Internal Revenue Service, Exempt Organizations Business Master File ()The Urban Institute, National Center for Charitable Statistics, http://nccsweb.urban.org/
Notes: * Includes organizations that filed financial information on Form 990, 990EZ or 990PF within 24 months of the BMF release date, asreported in NCCS Core Files and IRS Business Master Files (excludes 990N ePostcard filers).** Includes organizations that reported zero ($0) revenue and zero assets on a Form 990, 990EZ, 990PF and, since 2008, 990NePostcard within 24 months of the BMF release date, as reported in NCCS Core Files and IRS Business Master Files.*** Includes all organizations that filed a Form 990, 990EZ, 990PF and, since 2008, 990N ePostcard within 24 months of the BMFrelease date, as reported in NCCS Core Files and IRS Business Master Files.Organizations based in the U.S. Territories and Puerto Rico and other 'outofscope' organizations (see NCCS Data Guide, p.21) areexcluded.

3/3/2017 Registered Nonprofit Organizations by County (BMF 08/2016)
http://nccsweb.urban.org/tablewiz/showreport.php 1/2
Close Window
Registered Nonprofit Organizations by County (BMF 08/2016)Filter:State = MassachusettsNTEE Major Group (12) = HU Human services
County
Number ofRegistered
Organizations
Number ofOrganizations
Filing Form 990 *
Total RevenueReported onForm 990 *
AssetsReported onForm 990 *
Number ofOrganizations
Filing Form 990N**
Total Number ofOrganizations FilingForm 990 or 990N ***
BarnstableCounty,MA
499 312 246,163,936 339,443,493 145 457
BerkshireCounty,MA
262 152 185,640,358 248,727,646 88 240
BristolCounty,MA
609 347 458,547,569 567,753,507 212 559
DukesCounty,MA
91 64 41,763,716 156,853,118 22 86
EssexCounty,MA
1,039 662 1,361,994,190 1,809,277,412 277 939
FranklinCounty,MA
120 65 44,252,116 51,319,783 42 107
HampdenCounty,MA
538 349 575,419,140 679,015,055 139 488
HampshireCounty,MA
276 156 402,370,918 291,152,155 86 242
evittum
Typewritten Text
Appendix G.7

3/3/2017 Registered Nonprofit Organizations by County (BMF 08/2016)
http://nccsweb.urban.org/tablewiz/showreport.php 2/2
County
Number ofRegistered
Organizations
Number ofOrganizations
Filing Form 990 *
Total RevenueReported onForm 990 *
AssetsReported onForm 990 *
Number ofOrganizations
Filing Form 990N**
Total Number ofOrganizations FilingForm 990 or 990N ***
MiddlesexCounty,MA
2,185 1,351 1,914,952,843 2,823,361,777 616 1,967
NantucketCounty,MA
51 40 41,928,113 226,190,263 8 48
NorfolkCounty,MA
979 618 863,484,286 1,736,618,551 263 881
PlymouthCounty,MA
647 350 469,053,180 713,814,509 200 550
SuffolkCounty,MA
1,396 922 2,533,133,241 4,962,135,214 321 1,243
WorcesterCounty,MA
1,021 557 866,347,520 1,233,513,463 363 920
Total 9,713 5,945 10,005,051,126 15,839,175,946 2,782 8,727
Citation: Internal Revenue Service, Exempt Organizations Business Master File ()The Urban Institute, National Center for Charitable Statistics, http://nccsweb.urban.org/
Notes: * Includes organizations that filed financial information on Form 990, 990EZ or 990PF within 24 months of the BMF release date, asreported in NCCS Core Files and IRS Business Master Files (excludes 990N ePostcard filers).** Includes organizations that reported zero ($0) revenue and zero assets on a Form 990, 990EZ, 990PF and, since 2008, 990NePostcard within 24 months of the BMF release date, as reported in NCCS Core Files and IRS Business Master Files.*** Includes all organizations that filed a Form 990, 990EZ, 990PF and, since 2008, 990N ePostcard within 24 months of the BMFrelease date, as reported in NCCS Core Files and IRS Business Master Files.Organizations based in the U.S. Territories and Puerto Rico and other 'outofscope' organizations (see NCCS Data Guide, p.21) areexcluded.

3/4/2017 Registered Nonprofit Organizations by County (BMF 11/2006)
http://nccsweb.urban.org/tablewiz/showreport.php 1/2
Close Window
Registered Nonprofit Organizations by County (BMF 11/2006)Filter:State = MassachusettsNTEE Major Group (12) = HU Human services
County
Number ofRegistered
Organizations
Number ofOrganizations
Filing Form 990 *
Total RevenueReported onForm 990 *
AssetsReported onForm 990 *
Number ofOrganizations
Filing Form 990N**
Total Number ofOrganizations FilingForm 990 or 990N ***
16 4 5,815,704 11,207,004 0 4
BarnstableCounty,MA
494 274 178,296,667 205,120,740 7 281
BerkshireCounty,MA
238 127 162,833,541 218,397,521 9 136
BristolCounty,MA
626 295 304,385,686 279,527,936 8 303
DukesCounty,MA
87 54 26,773,043 103,522,566 2 56
EssexCounty,MA
993 585 757,798,174 926,769,055 18 603
FranklinCounty,MA
123 63 45,181,027 50,832,425 1 64
HampdenCounty,MA
567 334 542,043,930 561,833,831 7 341
HampshireCounty,MA
265 135 207,917,900 198,175,657 5 140
evittum
Typewritten Text
Appendix G.8

3/4/2017 Registered Nonprofit Organizations by County (BMF 11/2006)
http://nccsweb.urban.org/tablewiz/showreport.php 2/2
County
Number ofRegistered
Organizations
Number ofOrganizations
Filing Form 990 *
Total RevenueReported onForm 990 *
AssetsReported onForm 990 *
Number ofOrganizations
Filing Form 990N**
Total Number ofOrganizations FilingForm 990 or 990N ***
MiddlesexCounty,MA
1,964 1,169 1,331,701,689 1,939,545,819 34 1,203
NantucketCounty,MA
51 35 22,826,821 116,228,519 1 36
NorfolkCounty,MA
922 520 791,407,388 1,215,186,019 18 538
PlymouthCounty,MA
604 298 280,464,790 264,384,596 8 306
SuffolkCounty,MA
1,431 888 2,071,628,355 3,100,374,742 33 921
WorcesterCounty,MA
981 519 650,077,784 794,318,320 27 546
Total 9,362 5,300 7,379,152,499 9,985,424,750 178 5,478
Citation: Internal Revenue Service, Exempt Organizations Business Master File ()The Urban Institute, National Center for Charitable Statistics, http://nccsweb.urban.org/
Notes: * Includes organizations that filed financial information on Form 990, 990EZ or 990PF within 24 months of the BMF release date, asreported in NCCS Core Files and IRS Business Master Files (excludes 990N ePostcard filers).** Includes organizations that reported zero ($0) revenue and zero assets on a Form 990, 990EZ, 990PF and, since 2008, 990NePostcard within 24 months of the BMF release date, as reported in NCCS Core Files and IRS Business Master Files.*** Includes all organizations that filed a Form 990, 990EZ, 990PF and, since 2008, 990N ePostcard within 24 months of the BMFrelease date, as reported in NCCS Core Files and IRS Business Master Files.Organizations based in the U.S. Territories and Puerto Rico and other 'outofscope' organizations (see NCCS Data Guide, p.21) areexcluded.

3/4/2017 Registered Nonprofit Organizations by Level of Total Assets (BMF 08/2011)
http://nccsweb.urban.org/tablewiz/showreport.php 1/2
Close Window
Registered Nonprofit Organizations by Level of Total Assets (BMF 08/2011)Filter:State = MassachusettsNTEE Major Group (12) = HU Human services
Level ofTotalAssets
Number ofRegistered
Organizations
Number ofOrganizations
Filing Form 990 *
Total RevenueReported onForm 990 *
AssetsReported onForm 990 *
Number ofOrganizations
Filing Form 990N**
Total Number ofOrganizations FilingForm 990 or 990N ***
A. Lessthan
$100,0004,913 2,357 200,957,763 81,319,306 1,973 4,330
B.$100,000249,999
871 839 176,401,883 137,245,263 0 839
C.$250,000499,999
591 575 235,351,298 205,645,124 0 575
D.$500,000999,999
507 492 319,703,239 353,416,597 0 492
E. $15mil. 899 885 1,752,464,655 2,118,822,321 0 885
F. $510mil. 265 256 1,261,706,470 1,790,832,257 0 256
G. $10100 mil. 254 248 3,477,952,856 5,693,228,230 0 248
H. Morethan $100
mil.8 8 268,816,398 1,485,676,094 0 8
NotReported 585 0 0 0 0 0
Total 8,893 5,660 7,693,354,562 11,866,185,192 1,973 7,633
evittum
Typewritten Text
Appendix G.9

3/4/2017 Registered Nonprofit Organizations by Level of Total Assets (BMF 08/2011)
http://nccsweb.urban.org/tablewiz/showreport.php 2/2
Citation: Internal Revenue Service, Exempt Organizations Business Master File ()The Urban Institute, National Center for Charitable Statistics, http://nccsweb.urban.org/
Notes: * Includes organizations that filed financial information on Form 990, 990EZ or 990PF within 24 months of the BMF release date, asreported in NCCS Core Files and IRS Business Master Files (excludes 990N ePostcard filers).** Includes organizations that reported zero ($0) revenue and zero assets on a Form 990, 990EZ, 990PF and, since 2008, 990NePostcard within 24 months of the BMF release date, as reported in NCCS Core Files and IRS Business Master Files.*** Includes all organizations that filed a Form 990, 990EZ, 990PF and, since 2008, 990N ePostcard within 24 months of the BMFrelease date, as reported in NCCS Core Files and IRS Business Master Files.Organizations based in the U.S. Territories and Puerto Rico and other 'outofscope' organizations (see NCCS Data Guide, p.21) areexcluded.

3/3/2017 Registered Nonprofit Organizations by Level of Total Assets (BMF 08/2016)
http://nccsweb.urban.org/tablewiz/showreport.php 1/2
Close Window
Registered Nonprofit Organizations by Level of Total Assets (BMF 08/2016)Filter:State = MassachusettsNTEE Major Group (12) = HU Human services
Level ofTotalAssets
Number ofRegistered
Organizations
Number ofOrganizations
Filing Form 990 *
Total RevenueReported onForm 990 *
AssetsReported onForm 990 *
Number ofOrganizations
Filing Form 990N**
Total Number ofOrganizations FilingForm 990 or 990N ***
A. Lessthan
$100,0002,843 2,395 195,408,606 82,185,829 309 2,704
B.$100,000249,999
937 899 205,404,846 146,902,275 0 899
C.$250,000499,999
597 581 205,743,351 207,147,618 0 581
D.$500,000999,999
545 533 326,150,094 383,670,910 0 533
E. $15mil. 932 920 1,661,888,943 2,209,063,290 0 920
F. $510mil. 292 289 1,634,280,744 2,038,150,627 0 289
G. $10100 mil. 313 309 4,543,339,761 7,311,273,432 0 309
H. Morethan $100
mil.19 19 1,232,834,781 3,460,781,965 0 19
NotReported 3,235 0 0 0 2,473 2,473
Total 9,713 5,945 10,005,051,126 15,839,175,946 2,782 8,727
evittum
Typewritten Text
Appendix G.10

3/3/2017 Registered Nonprofit Organizations by Level of Total Assets (BMF 08/2016)
http://nccsweb.urban.org/tablewiz/showreport.php 2/2
Citation: Internal Revenue Service, Exempt Organizations Business Master File ()The Urban Institute, National Center for Charitable Statistics, http://nccsweb.urban.org/
Notes: * Includes organizations that filed financial information on Form 990, 990EZ or 990PF within 24 months of the BMF release date, asreported in NCCS Core Files and IRS Business Master Files (excludes 990N ePostcard filers).** Includes organizations that reported zero ($0) revenue and zero assets on a Form 990, 990EZ, 990PF and, since 2008, 990NePostcard within 24 months of the BMF release date, as reported in NCCS Core Files and IRS Business Master Files.*** Includes all organizations that filed a Form 990, 990EZ, 990PF and, since 2008, 990N ePostcard within 24 months of the BMFrelease date, as reported in NCCS Core Files and IRS Business Master Files.Organizations based in the U.S. Territories and Puerto Rico and other 'outofscope' organizations (see NCCS Data Guide, p.21) areexcluded.

3/4/2017 Registered Nonprofit Organizations by Level of Total Assets (BMF 11/2006)
http://nccsweb.urban.org/tablewiz/showreport.php 1/2
Close Window
Registered Nonprofit Organizations by Level of Total Assets (BMF 11/2006)Filter:State = MassachusettsNTEE Major Group (12) = HU Human services
Level ofTotalAssets
Number ofRegistered
Organizations
Number ofOrganizations
Filing Form 990 *
Total RevenueReported onForm 990 *
AssetsReported onForm 990 *
Number ofOrganizations
Filing Form 990N**
Total Number ofOrganizations FilingForm 990 or 990N ***
A. Lessthan
$100,0003,718 2,209 190,136,790 75,286,383 178 2,387
B.$100,000249,999
811 776 173,625,768 124,811,160 0 776
C.$250,000499,999
537 519 207,814,342 184,468,570 0 519
D.$500,000999,999
464 453 306,168,586 328,101,145 0 453
E. $15mil. 900 889 1,902,689,334 2,094,375,500 0 889
F. $510mil. 236 234 1,414,395,540 1,650,720,285 0 234
G. $10100 mil. 217 216 3,015,570,696 5,058,595,980 0 216
H. Morethan $100
mil.4 4 168,751,443 469,065,727 0 4
NotReported 2,475 0 0 0 0 0
Total 9,362 5,300 7,379,152,499 9,985,424,750 178 5,478
evittum
Typewritten Text
Appendix G.11

3/4/2017 Registered Nonprofit Organizations by Level of Total Assets (BMF 11/2006)
http://nccsweb.urban.org/tablewiz/showreport.php 2/2
Citation: Internal Revenue Service, Exempt Organizations Business Master File ()The Urban Institute, National Center for Charitable Statistics, http://nccsweb.urban.org/
Notes: * Includes organizations that filed financial information on Form 990, 990EZ or 990PF within 24 months of the BMF release date, asreported in NCCS Core Files and IRS Business Master Files (excludes 990N ePostcard filers).** Includes organizations that reported zero ($0) revenue and zero assets on a Form 990, 990EZ, 990PF and, since 2008, 990NePostcard within 24 months of the BMF release date, as reported in NCCS Core Files and IRS Business Master Files.*** Includes all organizations that filed a Form 990, 990EZ, 990PF and, since 2008, 990N ePostcard within 24 months of the BMFrelease date, as reported in NCCS Core Files and IRS Business Master Files.Organizations based in the U.S. Territories and Puerto Rico and other 'outofscope' organizations (see NCCS Data Guide, p.21) areexcluded.

3/4/2017 Registered Nonprofit Organizations by Level of Total Revenue (BMF 08/2011)
http://nccsweb.urban.org/tablewiz/showreport.php 1/2
Close Window
Registered Nonprofit Organizations by Level of Total Revenue (BMF 08/2011)Filter:State = MassachusettsNTEE Major Group (12) = HU Human services
Level ofTotal
Revenue
Number ofRegistered
Organizations
Number ofOrganizations
Filing Form 990 *
Total RevenueReported onForm 990 *
AssetsReported onForm 990 *
Number ofOrganizations
Filing Form 990N**
Total Number ofOrganizations FilingForm 990 or 990N ***
A. Lessthan
$100,0005,045 2,532 95,104,451 672,164,371 1,962 4,494
B.$100,000249,999
1,056 999 159,170,649 433,631,939 0 999
C.$250,000499,999
641 616 218,573,434 635,703,822 0 616
D.$500,000999,999
483 472 337,893,952 949,246,145 0 472
E. $15mil. 705 687 1,533,236,317 4,005,356,729 0 687
F. $510mil. 146 142 996,062,133 1,482,297,192 0 142
G. $10100 mil. 169 165 3,597,594,117 3,323,788,286 0 165
H. Morethan $100
mil.5 5 755,719,509 282,564,880 0 5
NotReported 643 42 0 81,431,828 11 53
Total 8,893 5,660 7,693,354,562 11,866,185,192 1,973 7,633
evittum
Typewritten Text
Appendix G.12

3/4/2017 Registered Nonprofit Organizations by Level of Total Revenue (BMF 08/2011)
http://nccsweb.urban.org/tablewiz/showreport.php 2/2
Citation: Internal Revenue Service, Exempt Organizations Business Master File ()The Urban Institute, National Center for Charitable Statistics, http://nccsweb.urban.org/
Notes: * Includes organizations that filed financial information on Form 990, 990EZ or 990PF within 24 months of the BMF release date, asreported in NCCS Core Files and IRS Business Master Files (excludes 990N ePostcard filers).** Includes organizations that reported zero ($0) revenue and zero assets on a Form 990, 990EZ, 990PF and, since 2008, 990NePostcard within 24 months of the BMF release date, as reported in NCCS Core Files and IRS Business Master Files.*** Includes all organizations that filed a Form 990, 990EZ, 990PF and, since 2008, 990N ePostcard within 24 months of the BMFrelease date, as reported in NCCS Core Files and IRS Business Master Files.Organizations based in the U.S. Territories and Puerto Rico and other 'outofscope' organizations (see NCCS Data Guide, p.21) areexcluded.
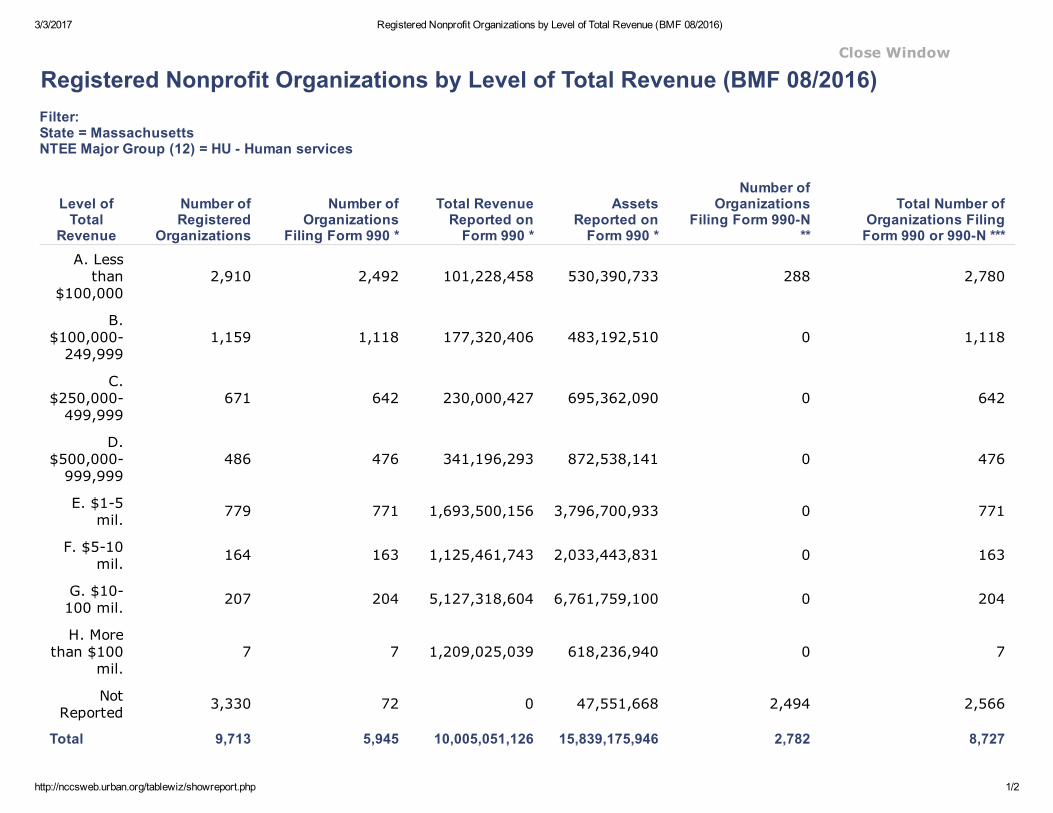
3/3/2017 Registered Nonprofit Organizations by Level of Total Revenue (BMF 08/2016)
http://nccsweb.urban.org/tablewiz/showreport.php 1/2
Close Window
Registered Nonprofit Organizations by Level of Total Revenue (BMF 08/2016)Filter:State = MassachusettsNTEE Major Group (12) = HU Human services
Level ofTotal
Revenue
Number ofRegistered
Organizations
Number ofOrganizations
Filing Form 990 *
Total RevenueReported onForm 990 *
AssetsReported onForm 990 *
Number ofOrganizations
Filing Form 990N**
Total Number ofOrganizations FilingForm 990 or 990N ***
A. Lessthan
$100,0002,910 2,492 101,228,458 530,390,733 288 2,780
B.$100,000249,999
1,159 1,118 177,320,406 483,192,510 0 1,118
C.$250,000499,999
671 642 230,000,427 695,362,090 0 642
D.$500,000999,999
486 476 341,196,293 872,538,141 0 476
E. $15mil. 779 771 1,693,500,156 3,796,700,933 0 771
F. $510mil. 164 163 1,125,461,743 2,033,443,831 0 163
G. $10100 mil. 207 204 5,127,318,604 6,761,759,100 0 204
H. Morethan $100
mil.7 7 1,209,025,039 618,236,940 0 7
NotReported 3,330 72 0 47,551,668 2,494 2,566
Total 9,713 5,945 10,005,051,126 15,839,175,946 2,782 8,727
evittum
Typewritten Text
Appendix G.13

3/3/2017 Registered Nonprofit Organizations by Level of Total Revenue (BMF 08/2016)
http://nccsweb.urban.org/tablewiz/showreport.php 2/2
Citation: Internal Revenue Service, Exempt Organizations Business Master File ()The Urban Institute, National Center for Charitable Statistics, http://nccsweb.urban.org/
Notes: * Includes organizations that filed financial information on Form 990, 990EZ or 990PF within 24 months of the BMF release date, asreported in NCCS Core Files and IRS Business Master Files (excludes 990N ePostcard filers).** Includes organizations that reported zero ($0) revenue and zero assets on a Form 990, 990EZ, 990PF and, since 2008, 990NePostcard within 24 months of the BMF release date, as reported in NCCS Core Files and IRS Business Master Files.*** Includes all organizations that filed a Form 990, 990EZ, 990PF and, since 2008, 990N ePostcard within 24 months of the BMFrelease date, as reported in NCCS Core Files and IRS Business Master Files.Organizations based in the U.S. Territories and Puerto Rico and other 'outofscope' organizations (see NCCS Data Guide, p.21) areexcluded.
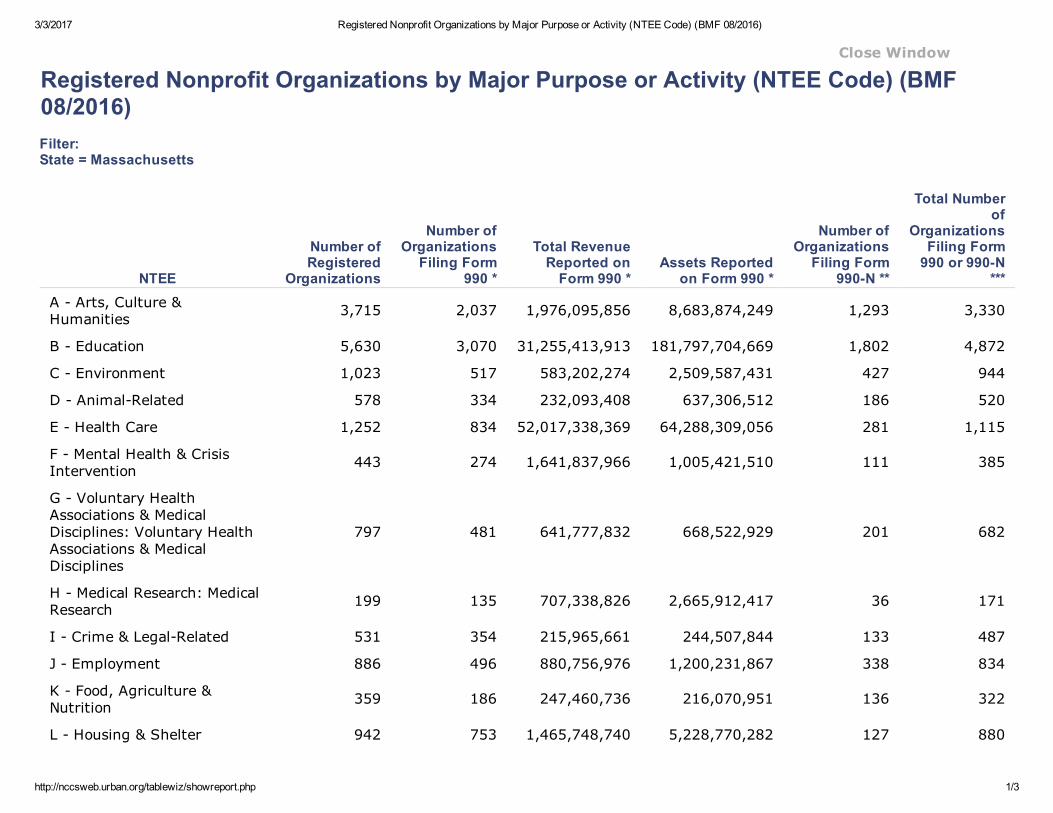
3/3/2017 Registered Nonprofit Organizations by Major Purpose or Activity (NTEE Code) (BMF 08/2016)
http://nccsweb.urban.org/tablewiz/showreport.php 1/3
Close Window
Registered Nonprofit Organizations by Major Purpose or Activity (NTEE Code) (BMF08/2016)Filter:State = Massachusetts
NTEE
Number ofRegistered
Organizations
Number ofOrganizations
Filing Form990 *
Total RevenueReported onForm 990 *
Assets Reportedon Form 990 *
Number ofOrganizations
Filing Form990N **
Total Numberof
OrganizationsFiling Form990 or 990N
***A Arts, Culture &Humanities 3,715 2,037 1,976,095,856 8,683,874,249 1,293 3,330
B Education 5,630 3,070 31,255,413,913 181,797,704,669 1,802 4,872
C Environment 1,023 517 583,202,274 2,509,587,431 427 944
D AnimalRelated 578 334 232,093,408 637,306,512 186 520
E Health Care 1,252 834 52,017,338,369 64,288,309,056 281 1,115
F Mental Health & CrisisIntervention 443 274 1,641,837,966 1,005,421,510 111 385
G Voluntary HealthAssociations & MedicalDisciplines: Voluntary HealthAssociations & MedicalDisciplines
797 481 641,777,832 668,522,929 201 682
H Medical Research: MedicalResearch 199 135 707,338,826 2,665,912,417 36 171
I Crime & LegalRelated 531 354 215,965,661 244,507,844 133 487
J Employment 886 496 880,756,976 1,200,231,867 338 834
K Food, Agriculture &Nutrition 359 186 247,460,736 216,070,951 136 322
L Housing & Shelter 942 753 1,465,748,740 5,228,770,282 127 880
evittum
Typewritten Text
Appendix G.14

3/3/2017 Registered Nonprofit Organizations by Major Purpose or Activity (NTEE Code) (BMF 08/2016)
http://nccsweb.urban.org/tablewiz/showreport.php 2/3
NTEE
Number ofRegistered
Organizations
Number ofOrganizations
Filing Form990 *
Total RevenueReported onForm 990 *
Assets Reportedon Form 990 *
Number ofOrganizations
Filing Form990N **
Total Numberof
OrganizationsFiling Form990 or 990N
***M Public Safety, DisasterPreparedness & Relief 426 227 119,874,294 355,483,440 158 385
N Recreation & Sports 3,514 2,148 1,199,755,572 2,207,723,375 1,011 3,159
O Youth Development 659 276 326,678,644 646,906,082 254 530
P Human Services 2,396 1,505 5,548,810,503 5,739,482,105 625 2,130
Q International, ForeignAffairs & National Security 650 359 1,657,619,250 1,911,349,248 213 572
R Civil Rights, Social Action& Advocacy 279 112 109,972,142 132,765,189 99 211
S Community Improvement& Capacity Building 2,392 1,359 1,310,646,108 2,843,047,349 760 2,119
T Philanthropy, Voluntarism& Grantmaking Foundations 3,537 3,062 9,355,345,366 34,765,929,542 270 3,332
U Science & Technology 246 124 2,394,935,219 2,438,554,940 86 210
V Social Science 98 56 86,968,282 457,218,473 25 81
W Public & Societal Benefit 1,521 553 898,764,403 15,454,042,050 808 1,361
X ReligionRelated 3,954 430 248,087,821 693,672,535 452 882
Y Mutual & MembershipBenefit 1,376 551 4,273,788,667 9,213,627,275 742 1,293
Z Unknown 99 24 7,710,077 8,017,497 38 62
Total 37,502 20,257 119,403,986,905 346,014,038,817 10,612 30,869
Citation: Internal Revenue Service, Exempt Organizations Business Master File ()The Urban Institute, National Center for Charitable Statistics, http://nccsweb.urban.org/
Notes: * Includes organizations that filed financial information on Form 990, 990EZ or 990PF within 24 months of the BMF release date, asreported in NCCS Core Files and IRS Business Master Files (excludes 990N ePostcard filers).
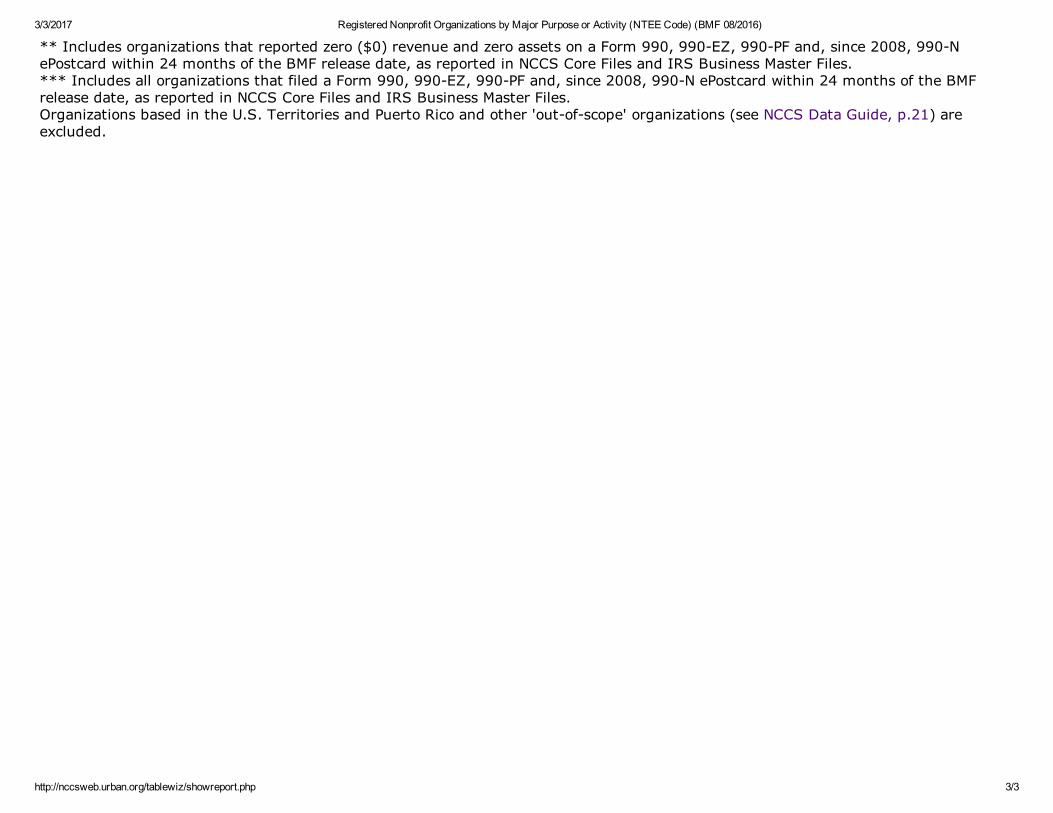
3/3/2017 Registered Nonprofit Organizations by Major Purpose or Activity (NTEE Code) (BMF 08/2016)
http://nccsweb.urban.org/tablewiz/showreport.php 3/3
** Includes organizations that reported zero ($0) revenue and zero assets on a Form 990, 990EZ, 990PF and, since 2008, 990NePostcard within 24 months of the BMF release date, as reported in NCCS Core Files and IRS Business Master Files.*** Includes all organizations that filed a Form 990, 990EZ, 990PF and, since 2008, 990N ePostcard within 24 months of the BMFrelease date, as reported in NCCS Core Files and IRS Business Master Files.Organizations based in the U.S. Territories and Puerto Rico and other 'outofscope' organizations (see NCCS Data Guide, p.21) areexcluded.
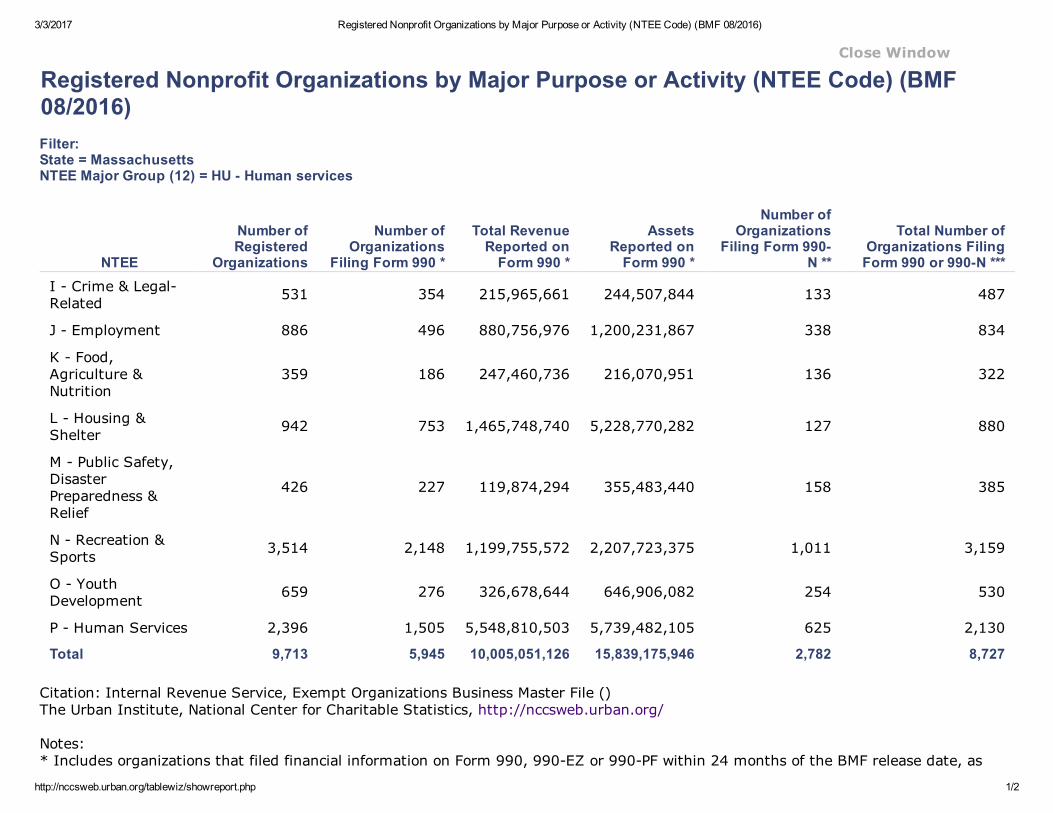
3/3/2017 Registered Nonprofit Organizations by Major Purpose or Activity (NTEE Code) (BMF 08/2016)
http://nccsweb.urban.org/tablewiz/showreport.php 1/2
Close Window
Registered Nonprofit Organizations by Major Purpose or Activity (NTEE Code) (BMF08/2016)Filter:State = MassachusettsNTEE Major Group (12) = HU Human services
NTEE
Number ofRegistered
Organizations
Number ofOrganizations
Filing Form 990 *
Total RevenueReported onForm 990 *
AssetsReported onForm 990 *
Number ofOrganizations
Filing Form 990N **
Total Number ofOrganizations FilingForm 990 or 990N ***
I Crime & LegalRelated 531 354 215,965,661 244,507,844 133 487
J Employment 886 496 880,756,976 1,200,231,867 338 834
K Food,Agriculture &Nutrition
359 186 247,460,736 216,070,951 136 322
L Housing &Shelter 942 753 1,465,748,740 5,228,770,282 127 880
M Public Safety,DisasterPreparedness &Relief
426 227 119,874,294 355,483,440 158 385
N Recreation &Sports 3,514 2,148 1,199,755,572 2,207,723,375 1,011 3,159
O YouthDevelopment 659 276 326,678,644 646,906,082 254 530
P Human Services 2,396 1,505 5,548,810,503 5,739,482,105 625 2,130
Total 9,713 5,945 10,005,051,126 15,839,175,946 2,782 8,727
Citation: Internal Revenue Service, Exempt Organizations Business Master File ()The Urban Institute, National Center for Charitable Statistics, http://nccsweb.urban.org/
Notes: * Includes organizations that filed financial information on Form 990, 990EZ or 990PF within 24 months of the BMF release date, as
evittum
Typewritten Text
Appendix G.15

3/3/2017 Registered Nonprofit Organizations by Major Purpose or Activity (NTEE Code) (BMF 08/2016)
http://nccsweb.urban.org/tablewiz/showreport.php 2/2
reported in NCCS Core Files and IRS Business Master Files (excludes 990N ePostcard filers).** Includes organizations that reported zero ($0) revenue and zero assets on a Form 990, 990EZ, 990PF and, since 2008, 990NePostcard within 24 months of the BMF release date, as reported in NCCS Core Files and IRS Business Master Files.*** Includes all organizations that filed a Form 990, 990EZ, 990PF and, since 2008, 990N ePostcard within 24 months of the BMFrelease date, as reported in NCCS Core Files and IRS Business Master Files.Organizations based in the U.S. Territories and Puerto Rico and other 'outofscope' organizations (see NCCS Data Guide, p.21) areexcluded.

3/3/2017 Registered Nonprofit Organizations by Major Purpose or Activity (NTEE Code) (BMF 08/2016)
http://nccsweb.urban.org/tablewiz/showreport.php 1/2
Close Window
Registered Nonprofit Organizations by Major Purpose or Activity (NTEE Code) (BMF08/2016)Filter:NTEE Major Group (12) = HU Human services
NTEE
Number ofRegistered
Organizations
Number ofOrganizations
Filing Form 990 *
Total RevenueReported onForm 990 *
Assets Reportedon Form 990 *
Number ofOrganizations
Filing Form990N **
Total Number ofOrganizations
Filing Form 990 or990N ***
I Crime & LegalRelated 21,132 9,843 9,814,134,382 10,597,320,063 8,954 18,797
J Employment 32,667 15,865 38,531,933,745 48,946,245,593 14,423 30,288
K Food,Agriculture &Nutrition
18,274 8,544 16,415,840,756 15,011,222,746 7,593 16,137
L Housing &Shelter 33,673 22,140 27,808,311,545 94,856,283,886 7,859 29,999
M Public Safety,DisasterPreparedness &Relief
23,360 12,319 3,718,190,445 10,862,749,984 8,948 21,267
N Recreation &Sports 117,969 50,504 36,170,459,032 59,796,797,310 51,534 102,038
O YouthDevelopment 41,934 10,114 8,663,757,011 17,602,057,847 24,683 34,797
P Human Services 99,665 47,714 137,320,933,175 197,435,120,901 35,910 83,624
Total 388,674 177,043 278,443,560,091 455,107,798,330 159,904 336,947
Citation: Internal Revenue Service, Exempt Organizations Business Master File ()The Urban Institute, National Center for Charitable Statistics, http://nccsweb.urban.org/
Notes: * Includes organizations that filed financial information on Form 990, 990EZ or 990PF within 24 months of the BMF release date, asreported in NCCS Core Files and IRS Business Master Files (excludes 990N ePostcard filers).
evittum
Typewritten Text
Appendix G.16

3/3/2017 Registered Nonprofit Organizations by Major Purpose or Activity (NTEE Code) (BMF 08/2016)
http://nccsweb.urban.org/tablewiz/showreport.php 2/2
** Includes organizations that reported zero ($0) revenue and zero assets on a Form 990, 990EZ, 990PF and, since 2008, 990NePostcard within 24 months of the BMF release date, as reported in NCCS Core Files and IRS Business Master Files.*** Includes all organizations that filed a Form 990, 990EZ, 990PF and, since 2008, 990N ePostcard within 24 months of the BMFrelease date, as reported in NCCS Core Files and IRS Business Master Files.Organizations based in the U.S. Territories and Puerto Rico and other 'outofscope' organizations (see NCCS Data Guide, p.21) areexcluded.
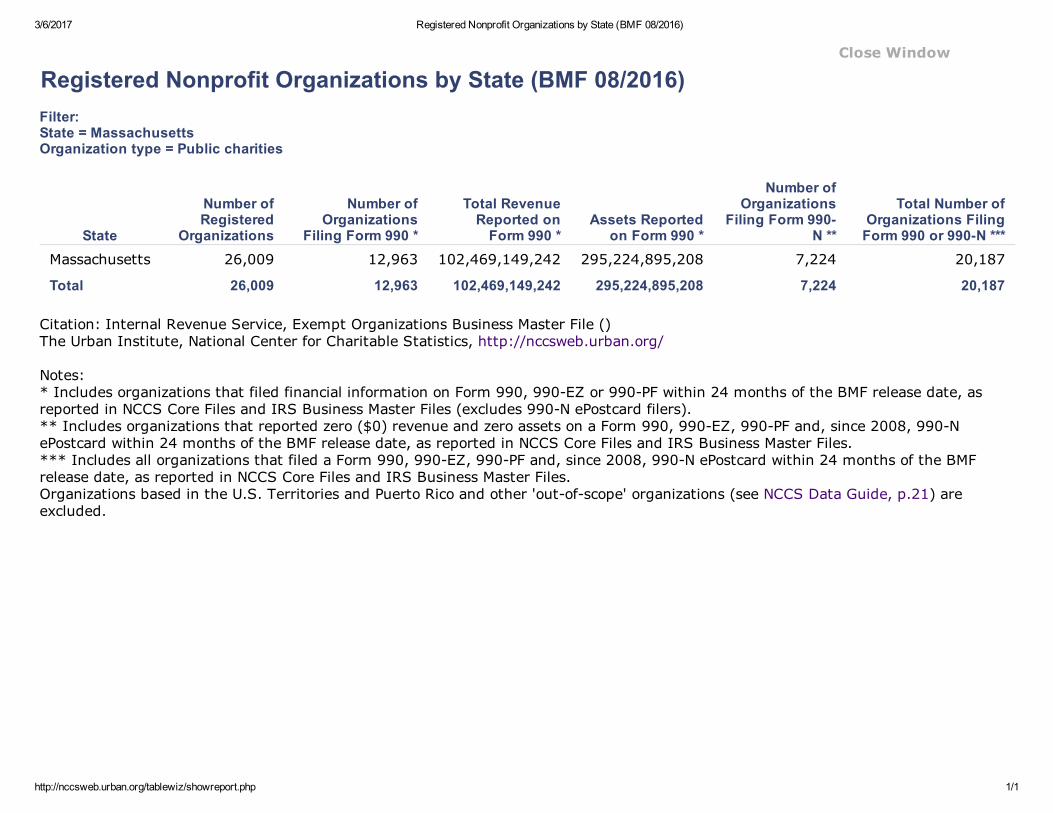
3/6/2017 Registered Nonprofit Organizations by State (BMF 08/2016)
http://nccsweb.urban.org/tablewiz/showreport.php 1/1
Close Window
Registered Nonprofit Organizations by State (BMF 08/2016)Filter:State = MassachusettsOrganization type = Public charities
State
Number ofRegistered
Organizations
Number ofOrganizations
Filing Form 990 *
Total RevenueReported onForm 990 *
Assets Reportedon Form 990 *
Number ofOrganizations
Filing Form 990N **
Total Number ofOrganizations FilingForm 990 or 990N ***
Massachusetts 26,009 12,963 102,469,149,242 295,224,895,208 7,224 20,187
Total 26,009 12,963 102,469,149,242 295,224,895,208 7,224 20,187
Citation: Internal Revenue Service, Exempt Organizations Business Master File ()The Urban Institute, National Center for Charitable Statistics, http://nccsweb.urban.org/
Notes: * Includes organizations that filed financial information on Form 990, 990EZ or 990PF within 24 months of the BMF release date, asreported in NCCS Core Files and IRS Business Master Files (excludes 990N ePostcard filers).** Includes organizations that reported zero ($0) revenue and zero assets on a Form 990, 990EZ, 990PF and, since 2008, 990NePostcard within 24 months of the BMF release date, as reported in NCCS Core Files and IRS Business Master Files.*** Includes all organizations that filed a Form 990, 990EZ, 990PF and, since 2008, 990N ePostcard within 24 months of the BMFrelease date, as reported in NCCS Core Files and IRS Business Master Files.Organizations based in the U.S. Territories and Puerto Rico and other 'outofscope' organizations (see NCCS Data Guide, p.21) areexcluded.
evittum
Typewritten Text
Appendix G.17

3/3/2017 Registered Nonprofit Organizations by Type of Organization (BMF 08/2016)
http://nccsweb.urban.org/tablewiz/showreport.php 1/1
Close Window
Registered Nonprofit Organizations by Type of Organization (BMF 08/2016)Filter:State = MassachusettsNTEE Major Group (12) = HU Human services
Type ofOrganization
Number ofRegistered
Organizations
Number ofOrganizations
Filing Form 990 *
Total RevenueReported onForm 990 *
Assets Reportedon Form 990 *
Number ofOrganizations
Filing Form 990N**
Total Number ofOrganizations FilingForm 990 or 990N ***
OtherNonprofit 2,422 1,370 1,052,859,174 2,148,242,225 920 2,290
PrivateFoundation 261 216 116,649,100 742,100,304 9 225
PublicCharity 7,030 4,359 8,835,542,852 12,948,833,417 1,853 6,212
Total 9,713 5,945 10,005,051,126 15,839,175,946 2,782 8,727
Citation: Internal Revenue Service, Exempt Organizations Business Master File ()The Urban Institute, National Center for Charitable Statistics, http://nccsweb.urban.org/
Notes: * Includes organizations that filed financial information on Form 990, 990EZ or 990PF within 24 months of the BMF release date, asreported in NCCS Core Files and IRS Business Master Files (excludes 990N ePostcard filers).** Includes organizations that reported zero ($0) revenue and zero assets on a Form 990, 990EZ, 990PF and, since 2008, 990NePostcard within 24 months of the BMF release date, as reported in NCCS Core Files and IRS Business Master Files.*** Includes all organizations that filed a Form 990, 990EZ, 990PF and, since 2008, 990N ePostcard within 24 months of the BMFrelease date, as reported in NCCS Core Files and IRS Business Master Files.Organizations based in the U.S. Territories and Puerto Rico and other 'outofscope' organizations (see NCCS Data Guide, p.21) areexcluded.
evittum
Typewritten Text
Appendix G.18
evittum
Typewritten Text
evittum
Typewritten Text

Appendix H
US Census Data
19. Springfield, MA, Area Economic Surmmary: Unemployment Rates
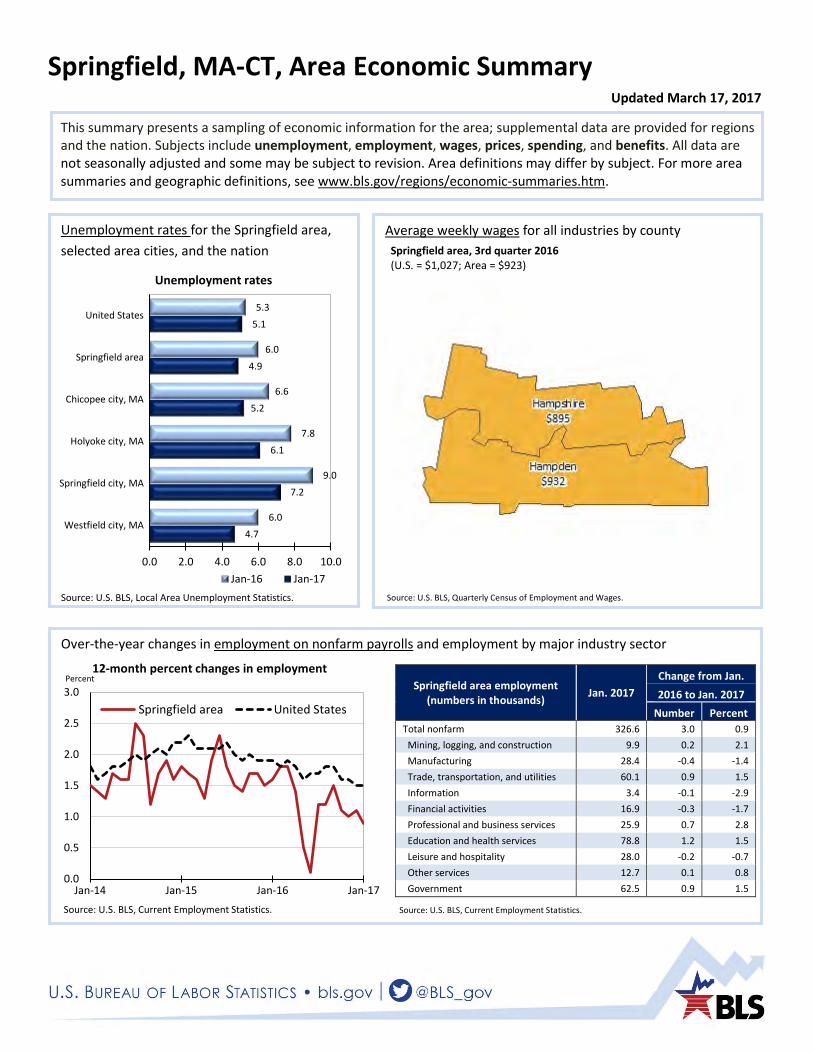
Springfield, MA-CT, Area Economic Summary
www.bls.gov/ro6 •
Over-the-year changes in employment on nonfarm payrolls and employment by major industry sector
Source: U.S. BLS, Current Employment Statistics.
Average weekly wages for all industries by county
Unemployment rates for the Springfield area, selected area cities, and the nation
0.0
0.5
1.0
1.5
2.0
2.5
3.0
Jan-14 Jan-15 Jan-16 Jan-17
Percent
Springfield area United States
Source: U.S. BLS, Current Employment Statistics.
12-month percent changes in employment
This summary presents a sampling of economic information for the area; supplemental data are provided for regions and the nation. Subjects include unemployment, employment, wages, prices, spending, and benefits. All data are not seasonally adjusted and some may be subject to revision. Area definitions may differ by subject. For more area summaries and geographic definitions, see www.bls.gov/regions/economic-summaries.htm.
4.7
7.2
6.1
5.2
4.9
5.1
6.0
9.0
7.8
6.6
6.0
5.3
0.0 2.0 4.0 6.0 8.0 10.0
Westfield city, MA
Springfield city, MA
Holyoke city, MA
Chicopee city, MA
Springfield area
United States
Jan-16 Jan-17Source: U.S. BLS, Local Area Unemployment Statistics.
Unemployment rates
Springfield area, 3rd quarter 2016 (U.S. = $1,027; Area = $923)
Source: U.S. BLS, Quarterly Census of Employment and Wages.
Springfield area employment (numbers in thousands) Jan. 2017
Change from Jan. 2016 to Jan. 2017
Number Percent Total nonfarm 326.6 3.0 0.9 Mining, logging, and construction 9.9 0.2 2.1 Manufacturing 28.4 -0.4 -1.4 Trade, transportation, and utilities 60.1 0.9 1.5 Information 3.4 -0.1 -2.9 Financial activities 16.9 -0.3 -1.7 Professional and business services 25.9 0.7 2.8 Education and health services 78.8 1.2 1.5 Leisure and hospitality 28.0 -0.2 -0.7 Other services 12.7 0.1 0.8 Government 62.5 0.9 1.5
Updated March 17, 2017
evittum
Typewritten Text
evittum
Typewritten Text
Appendix H

Average hourly wages for selected occupations
Over-the-year changes in the selling prices received by producers for selected industries nationwide
-4.0
-3.0
-2.0
-1.0
0.0
1.0
2.0
3.0
4.0
Feb-14 Feb-15 Feb-16 Feb-17
Percent
General freight truckingHospitalsFabricated pipe and pipe fitting mfg
12-month percent changes in PPI
Source: U.S. BLS, Producer Price Index.
Over-the-year change in the prices paid by urban consumers for selected categories
Average annual spending and percent distribution for selected categories
2.6
0.0
15.8
2.7
0.0
15.2
0.02.04.06.08.0
10.012.014.016.018.0
All Items Food Energy
Northeast regionU.S. city average
Source: U.S. BLS, Consumer Price Index.
Housing$20,81735.3%
Trans-portation
$9,02615.3%Food
$6,88211.7%
Personal insurance &
pensions$7,10312.0%
Healthcare$4,3287.3%
All other$10,82018.3%
Source: U.S. BLS, Consumer Expenditure Survey.
Total:
Occupation Springfield area
United States
Total, all occupations $23.83 $23.23
General and operations managers 51.50 57.44
Registered nurses 35.18 34.14
Accountants and auditors 35.01 36.19
Construction laborers 22.54 17.57
Bus drivers, school or special client 17.43 14.70
Customer service representatives 16.85 16.62
Team assemblers 15.61 15.17
Personal care aides 12.75 10.48
Retail salespersons 12.18 12.67
Cashiers 10.78 10.09
Waiters and waitresses 10.75 11.07
Cooks, fast food 10.21 9.43
Source: U.S. BLS, Occupational Employment Statistics, May 2015.
Employer costs per hour worked for wages and selected employee benefits by geographic division
Over-the-year changes in wages and salaries
-2.0
0.0
2.0
4.0
6.0
8.0
10.0
12.0
Dec-13 Dec-14 Dec-15 Dec-16
Percent
New England United States
12-month percent changes in ECI
Source: U.S. BLS, Employment Cost Index.
Private industry, December 2016
New England (1)
United States
Total compensation $39.27 $32.76 Wages and salaries 27.61 22.83 Total benefits 11.66 9.93
Paid leave 2.90 2.28 Vacation 1.51 1.17
Supplemental pay 1.10 1.15 Insurance 3.23 2.63 Retirement and savings 1.54 1.31 Legally required benefits 2.89 2.56
(1) New England includes CT, MA, ME, NH, RI, and VT. Source: U.S. BLS, Employer Costs for Employee Compensation.
12-month percent change in CPI-U, February 2017
Northeast Region average annual expenditures 2015
$58,976
New England Information Office • [email protected] • https://www.bls.gov/regions/new-england • 617-565-2327
evittum
Typewritten Text
evittum
Typewritten Text
Appendix I
Additional Charts & Figures - NCCS Data
20. Total Revenue of Human Service Nonprofits in MA / Comparison between Western
Massachusetts, Worcester County, Eastern MA
21. Human Services Populations within Massachusetts / Population Comparisons
22. Certificate Program Participation Estimate
23. Registered Nonprofit Organizations by Major Purpose or Activity (NTEE Code) (BMF
08_2016) - Human Services in MA
24. Western Massachusetts 501(3)(c) Organizations by Total Revenue - 2015 / Top 40
Organizations
25. Berkshire County 501(3)(c) Organizations by Total Revenue - 2015 / Top 10
Organizations
26. Hampden County 501(3)(c) Organizations by Total Revenue - 2015 / Top 10
Organizations
27. Franklin County 501(3)(c) Organizations by Total Revenue - 2015 / Top 10
Organizations
28. Hampshire County 501(3)(c) Organizations by Total Revenue - 2015 / Top 10
Organizations
29. Provider Council Western Massachusetts Members - Total Revenue 2015
30. Provider Council Organizations by Total Revenue - 2015

Total Revenue of Human Services Nonprofits in Massachusetts
2016 % Increase 2011 % Increase 2006
Not Reported (Assumed Less than $50,000) 3,330 417.88% 643 -74.30% 2,502 A. Less than $100,000 2,910 -42.32% 5,045 30.77% 3,858
B. $100,000-249,999 1,159 9.75% 1,056 13.30% 932 C. $250,000-499,999 671 4.68% 641 13.25% 566 D. $500,000-999,999 486 0.62% 483 -2.42% 495
E. $1-5 mil. 779 10.50% 705 3.07% 684 F. $5-10 mil. 164 12.33% 146 -14.62% 171
G. $10-100 mil. 207 22.49% 169 12.67% 150 H. More than $100 mil. 7 40.00% 5 25.00% 4
Total 9,713 9.22% 8,893 -5.01% 9,362
Total Revenue Reported $ 10,005,051,126 30.05% $ 7,693,354,562 4.26% $ 7,379,152,499 Total Assests Reported $ 15,839,175,946 33.48% $ 11,866,185,192 18.84% $ 9,985,424,750
Comparison between Western MA*, Worcester County, Eastern MA**
2016 % Increase 2011 % Increase 2006
Total Registered Human Service NonprofitsWestern MA 1,196 8.04% 1107 -7.21% 1193
Worcester County 1,021 9.20% 935 -4.69% 981Eastern MA 4,560 8.91% 4,187 -3.01% 4,317
Total Revenue ReportedWestern MA $ 1,207,682,532 19.39% $ 1,011,528,093 5.59% $ 957,976,398
Worcester County $ 866,347,520 35.61% $ 638,854,020 -1.73% $ 650,077,784 Eastern MA $ 5,311,570,370 27.00% $ 4,182,411,236 -0.29% $ 4,194,737,432
Total Assets ReportedWestern MA $ 1,270,214,639 15.72% $ 1,097,655,430 6.65% $ 1,029,239,434
Worcester County $ 1,233,513,463 22.72% $ 1,005,119,475 26.54% $ 794,318,320 Eastern MA $ 9,522,115,542 30.66% $ 7,287,537,368 16.51% $ 6,255,106,580
Population 2015 Estimate Organizations per 10,000 Residents (2015 estimate)Western MA 830,411 14.40
Worcester County 818,963 12.47Eastern MA 3,059,283 14.91
*Western MA Counties include: Berkshire, Franklin, Hampden & Hampshire Counties** Eastern MA Counties Include: Suffolk, Norfolk & Middlesex Counties
evittum
Typewritten Text
Appendix I.20
evittum
Typewritten Text

Human Services Populations within Massachusetts(US Census Bureau, 2009-2013)
Name Population Median Household IncomePoverty
RateNumber of
ChildrenChild Poverty
RateNumber of Children in
PovertyNumber of
Seniors Senior Poverty Rate Number of Seniors in Poverty
Barnstable County (Massachusetts) 215,449 60,526 9.2 36,310 14.5 5,282 55,489 6.5 3,623Berkshire County (Massachusetts) 130,545 48,450 12.3 24,775 19 4,706 25,073 8.2 2,059Bristol County (Massachusetts) 549,870 55,298 12.1 120,441 16.8 20,203 80,388 10.7 8,598Dukes County (Massachusetts) 16,739 66,288 10 3,177 12.8 406 2,898 9.4 274Essex County (Massachusetts) 750,808 67,311 11 170,835 15.8 26,950 109,049 9.2 10,050Franklin County (Massachusetts) 71,408 53,663 11.9 13,785 16.3 2,246 11,404 8 916Hampden County (Massachusetts) 465,144 49,094 17.2 108,343 28 30,386 67,406 10.2 6,856Hampshire County (Massachusetts) 159,267 61,227 11.1 26,100 12.7 3,311 21,088 6.8 1,424Middlesex County (Massachusetts) 1,522,533 82,090 7.9 320,847 9 29,024 203,273 7.5 15,327Nantucket County (Massachusetts) 10,224 85,478 10.3 2,143 15.4 329 1,278 11.9 153Norfolk County (Massachusetts) 677,296 84,916 6.4 151,278 7.2 10,854 100,460 7 6,987Plymouth County (Massachusetts) 497,386 75,092 7.5 117,557 9.8 11,575 72,407 6 4,330Suffolk County (Massachusetts) 735,701 53,540 19.6 128,293 28.2 36,213 78,150 18.7 14,613Worcester County (Massachusetts) 802,688 65,223 10.8 184,166 15.2 28,006 105,417 8.6 9,111Total (Massachusetts) 6,605,058 66,866 11 1,408,050 14.9 209,308 933,780 9 84,234
Population Comparisons
Western MA 826,364 48,450-61,227 11.1-17.2 173,003 12.7-28 40,649 124,971 6.8-10.2 11,255Worcester County 802,688 65,223 11 184,166 15.2 28,006 105,417 8.6 9,111Eastern MA 2,935,530 53,540-84,916 6.4-19.6 600,418 7.2-28.2 76,091 381,883 7-18.7 36,927Massachusetts (Total) 6,605,058 66,866 11 1,408,050 15 209,308 933,780 9 84,234
evittum
Typewritten Text
Appendix I.21
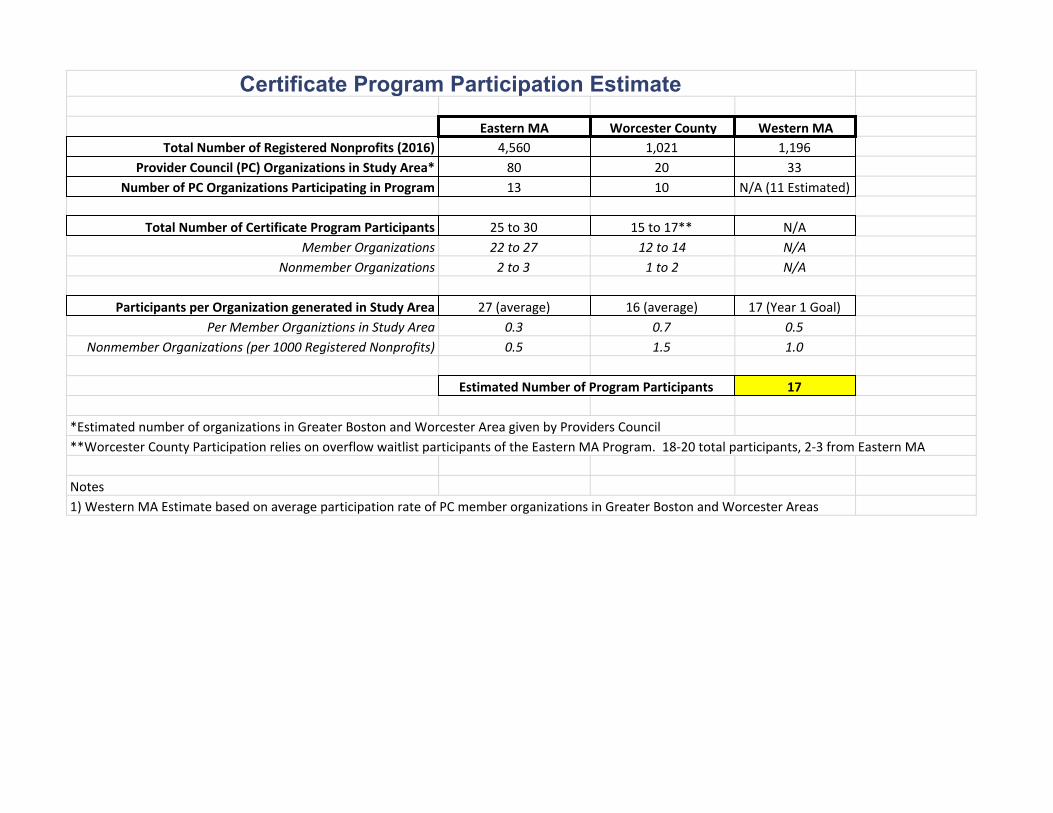
Certificate Program Participation Estimate
Eastern MA Worcester County Western MATotal Number of Registered Nonprofits (2016) 4,560 1,021 1,196
Provider Council (PC) Organizations in Study Area* 80 20 33Number of PC Organizations Participating in Program 13 10 N/A (11 Estimated)
Total Number of Certificate Program Participants 25 to 30 15 to 17** N/AMember Organizations 22 to 27 12 to 14 N/A
Nonmember Organizations 2 to 3 1 to 2 N/A
Participants per Organization generated in Study Area 27 (average) 16 (average) 17 (Year 1 Goal)Per Member Organiztions in Study Area 0.3 0.7 0.5
Nonmember Organizations (per 1000 Registered Nonprofits) 0.5 1.5 1.0
Estimated Number of Program Participants 17
*Estimated number of organizations in Greater Boston and Worcester Area given by Providers Council**Worcester County Participation relies on overflow waitlist participants of the Eastern MA Program. 18-20 total participants, 2-3 from Eastern MA
Notes1) Western MA Estimate based on average participation rate of PC member organizations in Greater Boston and Worcester Areas
evittum
Typewritten Text
Appendix I.22

Registered Nonprofit Organizations by Major Purpose or Activity
(NTEE Code) (BMF 08/2016)State = MassachusettsNTEE Major Group (12) = HU - Human services
NTEE Number of Registered Organizations% of Total Category
Number of Organizations Filing Form 990 *
Total Revenue Reported on Form 990 *
% of Total Category
Assets Reported on Form 990 *
Number of Organizations Filing Form 990-N **
Total Number of Organizations Filing Form 990 or 990-N ***
I - Crime & Legal-Related 531 5% 354 $215,965,661 2% 244,507,844 133 487J - Employment 886 9% 496 $880,756,976 9% 1,200,231,867 338 834K - Food, Agriculture & Nutrition 359 4% 186 $247,460,736 2% 216,070,951 136 322L - Housing & Shelter 942 10% 753 $1,465,748,740 15% 5,228,770,282 127 880M - Public Safety, Disaster Preparedness & Relief 426 4% 227 $119,874,294 1% 355,483,440 158 385N - Recreation & Sports 3,514 36% 2,148 $1,199,755,572 12% 2,207,723,375 1,011 3,159O - Youth Development 659 7% 276 $326,678,644 3% 646,906,082 254 530P - Human Services 2,396 25% 1,505 $5,548,810,503 55% 5,739,482,105 625 2,130Total (Human Services) 9,713 5,945 10,005,051,126 15,839,175,946 2,782 8,727Total Nonprofits in MA 37,502 20,257 119,403,986,905 346,014,038,817 10,612 30,869
Type of Organization (Among Human Services) Number of Registered OrganizationsNumber of Organizations
Filing Form 990 *Total Revenue Reported on
Form 990 *Assets Reported on
Form 990 *Number of Organizations
Filing Form 990-N **Total Number of Organizations
Filing Form 990 or 990-N ***Other Nonprofit 2,422 1,370 $1,052,859,174 11% 2,148,242,225 920 2,290Private Foundation 261 216 $116,649,100 1% 742,100,304 9 225Public Charity 7,030 4,359 $8,835,542,852 88% 12,948,833,417 1,853 6,212Total 9713 (25.9% of Total Nonprofits) 5,945 $10,005,051,126 (8.4%) 15839175946 (4.6%) 2,782 8,727
evittum
Typewritten Text
Appendix I.23

Revenue Less Than… # of Organizations % of Total MA Total Not Reported 385 23% 34% Under $100,000 587 36% 30% $100,000 - $249,999 191 12% 12% $250,000 - $499,999 127 8% 7% $500,000 - $999,999 85 5% 5% $1,000,000 - $4,999,999 157 10% 8% $5,000,000 - $9,999,999 47 3% 2% $10,000,000 - $100,000,000 61 4% 2%More than $100,000,000 11 1% 0%
Total 1651
Top 40 Organizations 2015 Revenue CountyUniversity Health Network $ 1,773,538,379 HampdenTrustees of the Smith College $ 923,411,997 HampshireAmherst College Trustees $ 908,803,345 HampshireWilliams College $ 496,503,251 BerkshireSterling & Francine Clark Art Inst $ 310,927,452 BerkshireMercy Hospital Inc $ 278,294,338 HampdenTrustees of Mount Holyoke College $ 248,785,147 HampshireStavros Center for Independent Living Inc $ 223,613,133 HampshireSpringfield College $ 184,546,512 HampdenTrustees of Deerfield Academy $ 164,126,717 FranklinWestern New England University $ 159,480,830 HampdenHampshire College Trustees $ 95,941,598 HampshireCenter for Human Development Inc $ 89,580,764 HampdenBerkshire School Inc $ 80,862,793 BerkshireAmerican International College $ 80,487,164 HampdenNorthfield Mount Hermon School $ 78,915,622 FranklinBay Path University $ 76,107,117 HampdenNew England Farm Workers Council Inc $ 65,684,770 HampdenBehavioral Health Network Inc $ 65,259,786 HampdenHap Inc $ 61,206,524 HampdenServicenet Inc $ 52,467,824 HampshireWilliston Northampton School $ 51,862,786 HampshireSisters of Providence Health System Inc $ 50,772,021 HampdenCollege of Our Lady of the Elms $ 44,883,212 HampdenKripalu Center for Yoga & Health Inc $ 42,733,039 BerkshireHarold Grinspoon Foundation Grinspoon Harold Et AL Ttee $ 41,415,166 HampdenAllen-Chase Foundation Eaglebrook School $ 34,370,529 FranklinGandara Mental Health Center Inc $ 33,250,616 HampdenValley Opportunity Council Inc $ 31,220,344 HampdenBerkshire County Arc Inc $ 31,148,687 BerkshireWilbraham & Monson Academy $ 30,942,563 HampdenCommunity Foundation of Western Massachusetts $ 30,915,555 HampdenHillcrest Educational Centers Inc $ 29,987,124 BerkshireAssociation for Community Living Inc $ 29,072,524 HampdenHolyoke Health Center Inc $ 28,156,648 HampdenGreater Springfield Senior Services Inc $ 27,559,859 HampdenHistoric Deerfield Inc $ 27,137,465 FranklinClinical & Support Options Inc $ 26,185,791 Hampshire
evittum
Typewritten Text
Appendix I.24

Community Action of the Franklin Hampshire and North Quabbin Region $ 25,394,113 FranklinWestmass Eldercare Inc $ 24,797,086 HampdenNonotuck Resource Associates $ 24,683,446 HampshireMiss Halls School Inc $ 23,834,269 BerkshireBrien Center for Mental Health & Subtance Abuse Services $ 22,599,948 BerkshireEastern States Exposition $ 22,006,317 HampdenCommunity Enterprises Inc $ 19,331,137 HampshireGuidewire Inc $ 19,107,878 HampdenCarson Center for Human Services Inc $ 18,414,764 HampdenCaring Health Center Inc $ 17,762,363 HampdenSisters of Providence Care Ctrs Inc Manager of Financial Reporting Mt St Vincent $ 17,750,000 HampdenMulticultural Community Service of the Pioneer Valley Inc $ 16,312,787 Hampden
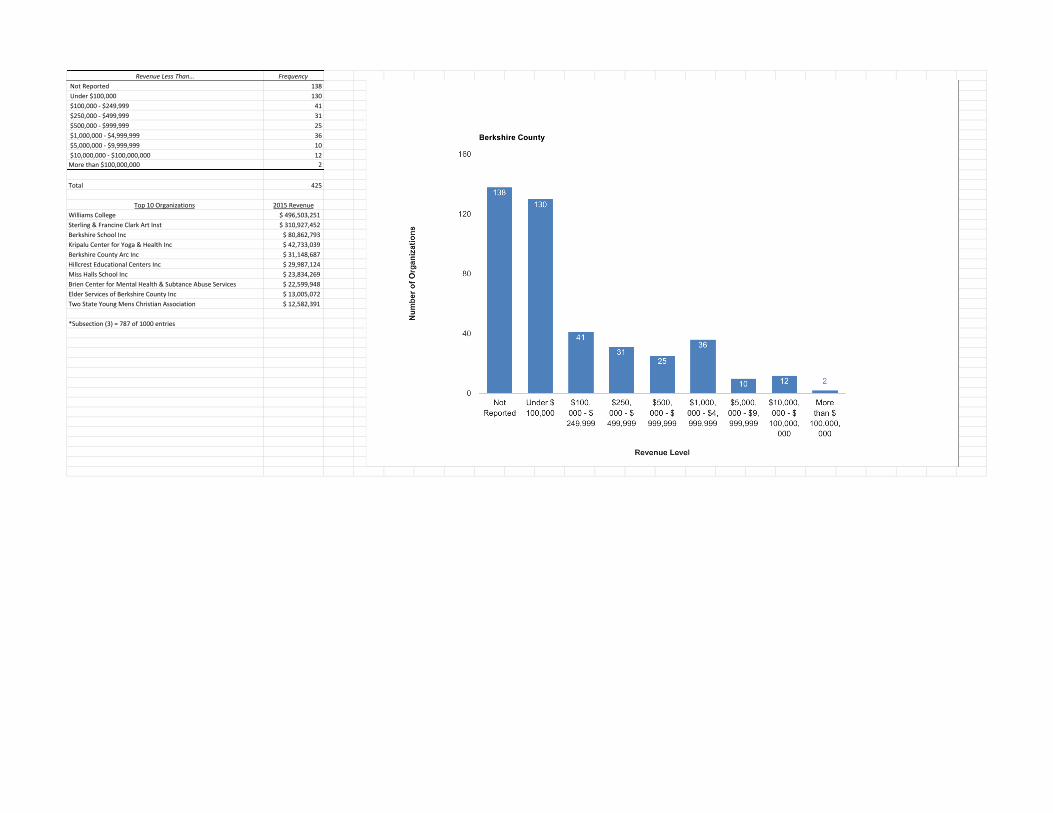
Revenue Less Than… Frequency Not Reported 138 Under $100,000 130 $100,000 - $249,999 41 $250,000 - $499,999 31 $500,000 - $999,999 25 $1,000,000 - $4,999,999 36 $5,000,000 - $9,999,999 10 $10,000,000 - $100,000,000 12More than $100,000,000 2
Total 425
Top 10 Organizations 2015 RevenueWilliams College $ 496,503,251 Sterling & Francine Clark Art Inst $ 310,927,452 Berkshire School Inc $ 80,862,793 Kripalu Center for Yoga & Health Inc $ 42,733,039 Berkshire County Arc Inc $ 31,148,687 Hillcrest Educational Centers Inc $ 29,987,124 Miss Halls School Inc $ 23,834,269 Brien Center for Mental Health & Subtance Abuse Services $ 22,599,948 Elder Services of Berkshire County Inc $ 13,005,072 Two State Young Mens Christian Association $ 12,582,391
*Subsection (3) = 787 of 1000 entries
evittum
Typewritten Text
Appendix I.25
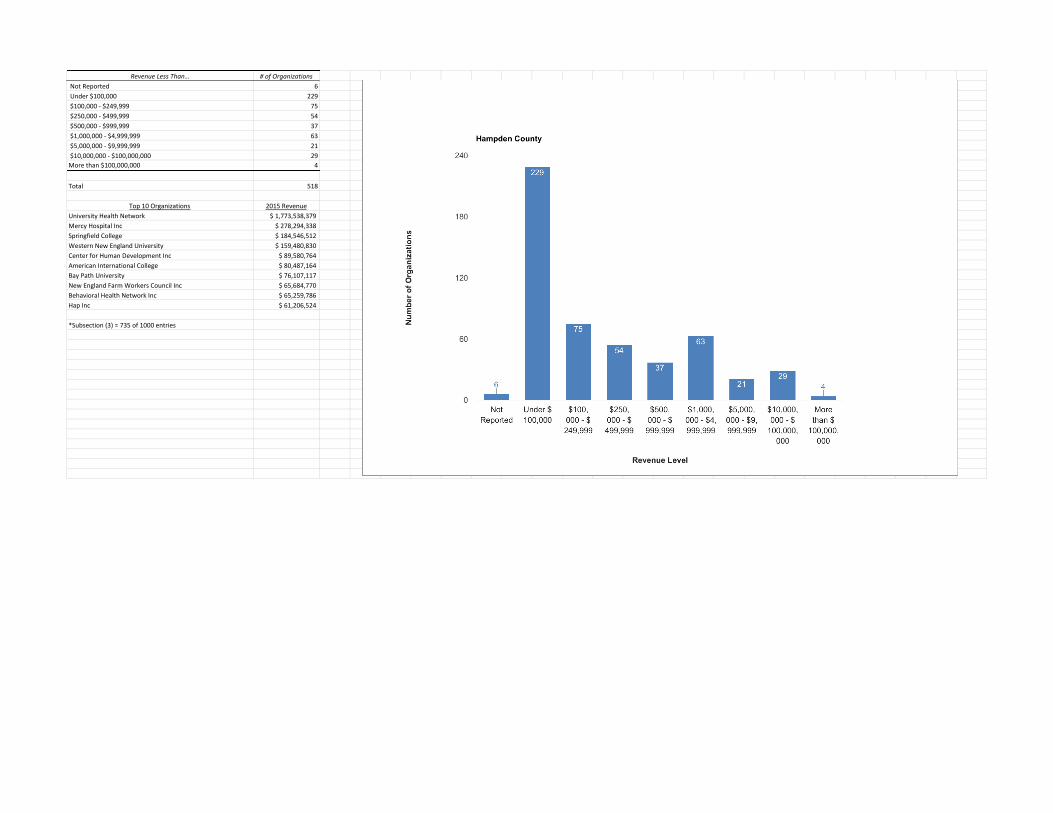
Revenue Less Than… # of Organizations Not Reported 6 Under $100,000 229 $100,000 - $249,999 75 $250,000 - $499,999 54 $500,000 - $999,999 37 $1,000,000 - $4,999,999 63 $5,000,000 - $9,999,999 21 $10,000,000 - $100,000,000 29More than $100,000,000 4
Total 518
Top 10 Organizations 2015 RevenueUniversity Health Network $ 1,773,538,379 Mercy Hospital Inc $ 278,294,338 Springfield College $ 184,546,512 Western New England University $ 159,480,830 Center for Human Development Inc $ 89,580,764 American International College $ 80,487,164 Bay Path University $ 76,107,117 New England Farm Workers Council Inc $ 65,684,770 Behavioral Health Network Inc $ 65,259,786 Hap Inc $ 61,206,524
*Subsection (3) = 735 of 1000 entries
evittum
Typewritten Text
Appendix I.26

Revenue Less Than… # of Organizations Not Reported 82 Under $100,000 81 $100,000 - $249,999 25 $250,000 - $499,999 9 $500,000 - $999,999 7 $1,000,000 - $4,999,999 17 $5,000,000 - $9,999,999 4 $10,000,000 - $100,000,000 6More than $100,000,000 1
Total 232
Top 10 Organizations 2015 RevenueTrustees of Deerfield Academy $ 164,126,717 Northfield Mount Hermon School $ 78,915,622 Allen-Chase Foundation Eaglebrook School $ 34,370,529 Historic Deerfield Inc $ 27,137,465 Community Action of the Franklin Hampshire and North Quabbin Region $ 25,394,113 Life Path Inc $ 15,900,345 Stoneleigh-Burnham School $ 11,498,656 Center for Responsive Schools Inc $ 9,112,916 The Bement School Inc $ 8,415,501 Community Health Center of Franklin County Incorporated $ 5,934,143
*Subsection (3) = 399 of 534 entries
evittum
Typewritten Text
Appendix I.27

Revenue Less Than… # of Organizations Not Reported 159 Under $100,000 147 $100,000 - $249,999 50 $250,000 - $499,999 33 $500,000 - $999,999 16 $1,000,000 - $4,999,999 41 $5,000,000 - $9,999,999 12 $10,000,000 - $100,000,000 14More than $100,000,000 4
Total 476
Top 10 Organizations 2015 Revenue Trustees of the Smith College $ 923,411,997 Amherst College Trustees $ 908,803,345 Trustees of Mount Holyoke College $ 248,785,147 Stavros Center for Independent Living Inc $ 223,613,133 Hampshire College Trustees $ 95,941,598 Servicenet Inc $ 52,467,824 Williston Northampton School $ 51,862,786 Clinical & Support Options Inc $ 26,185,791 Nonotuck Resource Associates $ 24,683,446 Community Enterprises Inc $ 19,331,137
*Subsection (3) = 797 of 1000 entries
evittum
Typewritten Text
Appendix I.28

Organization Tax Period City State NTEE Rule Date IRS Subsection Total Revenue Total AssetsRiverbrook Residence 2015 Stockbridge MA P73 - Group Homes 1997 03 $ 2,067,806 $ 3,297,317 Berkshire Area Health and education Center 2015 Pittsfield MA E1920 - Health Care: Support N.E.C. 1980 03 $ 726,548 $ 687,410 Berkshire Country Arc* - - - - - - $ - $ - LifePath (Life Path Inc) 2015 Turners Falls MA P81 - Senior Centers 1975 03 $ 15,886,458 $ 5,527,448 Amherst Survival center (Survival Center Inc) 2015 North Amherst MA P60 - Emergency Assistance 1980 03 $ 1,805,796 $ 3,254,898 Valley Educational Association (Valley Educational Associates Inc) 2015 Hatfield MA J30 - Vocational Rehabilitation 1982 03 $ 2,543,527 $ 313,420 Safe passage Inc. 2015 Northampton MA P43 - Family Violence Shelters 1980 03 $ 1,329,093 $ 1,245,115 ServiceNet (Servicenet Inc) 2015 Northampton MA F30 - Mental Health Treatment 1974 03 $ 52,354,250 $ 22,060,762 Tapestry (Tapestry Health Systems Inc) 2015 Florence MA E42 - Family Planning 1973 03 $ 10,742,168 $ 1,253,665 Community Adolescent resource and Education Center 2015 Holyoke MA P30 - Children & Youth Services 1988 03 $ 1,549,763 $ 436,859 Community Enterprises inc. (1) 2015 Northampton MA J30 - Vocational Rehabilitation 1976 03 $ 19,305,067 $ 6,350,900 Western MA training Consortium 2015 Holyoke MA P20 - Human Service Organizations 1975 03 $ 7,574,053 $ 2,558,585 Sunshine Village 2015 Chicopee MA P82 - Developmentally Disabled Centers 1968 03 $ 10,956,390 $ 5,662,069 United Way of Pioneer Valley (2) 2015 Springfield MA T70 - Federated Giving Programs 1971 03 $ 6,582,129 $ 8,541,467 YMCA Western MA (Berkshire Family YMCA Inc Pittsfield MA) (3) (4) 2015 Pittsfield MA P27 - Young Mens or Womens Associations 1944 03 $ 2,461,868 $ 3,375,403 Multicultural Community Services 2015 Springfield MA P82 - Developmentally Disabled Centers 1979 03 $ 16,312,787 $ 5,626,050 Center for Human Development 2015 Springfield MA F30 - Mental Health Treatment 1972 03 $ 87,666,596 $ 29,021,905 Martin Luther King Jr Family Services Inc 2015 Springfield MA P28 - Neighborhood Centers 1978 03 $ 1,606,199 $ 1,032,978 Square One* - - - - - - $ - $ - Human Resources Unlimited 2015 Springfield MA J30 - Vocational Rehabilitation 1970 03 $ 8,983,598 $ 12,199,449 Springfield Jewish Community Center 2015 Springfield MA P28 - Neighborhood Centers 1953 03 $ 5,193,384 $ 9,753,317 River Valley Counseling Center 2014 Holyoke MA F32 - Community Mental Health Centers 1976 03 $ 1,641,595 $ 1,696,384 Association for Community Living 2015 Springfield MA P73 - Group Homes 1954 03 $ 28,674,965 $ 16,274,039 Boys and Girls Club Center 2015 Springfield MA O23 - Boys & Girls Clubs 1935 03 $ 1,133,741 $ 4,746,913 Children’s Study Home 2015 Springfield MA P76 - Homes for Children & Adolescents 1923 03 $ 7,660,468 $ 8,034,467 Urban League Springfield 2015 Springfield MA P22 - Urban League 1934 03 $ 1,532,816 $ 1,676,210 New North Citizen’s council Inc.* - - - - - - $ - $ - South End Community Center* - - - - - - $ - $ -
(1) Community Action Enterprises Inc Harmon Personnel Services 2015 Greenfield MA S20 - Community & Neighborhood Development 2008 03 $ 1,191,338 $ 206,812 (2) United Service Organizations USO Council of Pioneer Valley 2015 Chicopee MA W30 - Military & Veterans Organizations 1954 03 $ 636,422 $ 121,855 (3) YMCA of Greater Springfield 2015 Springfield MA P27 - Young Mens or Womens Associations 1923 03 $ 12,564,700 $ 12,572,114 (4) YMCA of Greater Westfield Inc Westfield 2015 Westfield MA P27 - Young Mens or Womens Associations 1942 03 $ 2,717,729 $ 9,501,075
*Organization couldn't be found on NCCS database. It's possible the organization is registered under a different name than the one provided by Providers Council
evittum
Typewritten Text
Appendix I.29

Revenue Less Than… Frequency% of Total Western MA MA Total Unknown 4 14% 23% 34% Under $100,000 0 0% 36% 30% $100,000 - $249,999 0 0% 12% 12% $250,000 - $499,999 0 0% 8% 7% $500,000 - $999,999 1 4% 5% 5% $1,000,000 - $4,999,999 10 36% 10% 8% $5,000,000 - $9,999,999 5 18% 3% 2% $10,000,000 - $100,000,000 8 29% 4% 2%More than $100,000,000 0 0% 1% 0%
Total 28
evittum
Typewritten Text
Appendix I.30

CONFIDENTIAL
Pro Forma Financials
Clark University School of Professional Studies and Providers’ Council
Human Services Management (HSM) Certificate Program Expansion to Western Massachusetts
Feasibility Study
By:
Paul Campbell
Patrick Deschenes
Maria Pacheco
Bradley Paul
Elizabeth Vittum
Jing Zhang

Start-Up Costs:
The cost of HSM program includes instructor fees, travel reimbursements, the classroom
fee, and overhead.
Instructor: Clark University pays $3,000 for a professor to teach one module, which is
seven weeks long. The whole HSM program includes six modules. Thus, Clark University needs
to recruit six professors to teach these modules. The total cost for instructors would be $18,000
($3,000 x 6 = $18,000).
Travel Reimbursement: Clark University hopes to recruit instructors, who live in
western Massachusetts. Therefore it would pay less for travel reimbursement. Assuming that
Clark University indeed recruits teachers near to the HSM program school, travel
reimbursements would be a zero. However, if Clark University is unable to recruit any teachers
in western Massachusetts, it would have to pay travel reimbursements for teachers. Assuming
that the highest travel reimbursements for one class is $50. The HSM program includes 42
classes (7 classes per module x 6 modules = 42 classes). The total travel reimbursement expense
would be a maximum of $2,100 ($50 x 42 = $2,100).
Classroom Use Fee: According to the data, which we collected from location research
in Springfield and Holyoke, the minimum rent would be a zero. That would be a case if we chose
to hold the class at the Community Foundation in Springfield or the Public Library in Holyoke.
If Clark University is not willing to go with a free space due to the possibility of time conflicts, it
could rent space at the public library in Springfield or at the community college in Holyoke.
Classroom space at the Springfield public library could be rented for $100-$150 per hour.
Assuming that the HSM program needs 3 hours to finish one class, the rental fee for one class
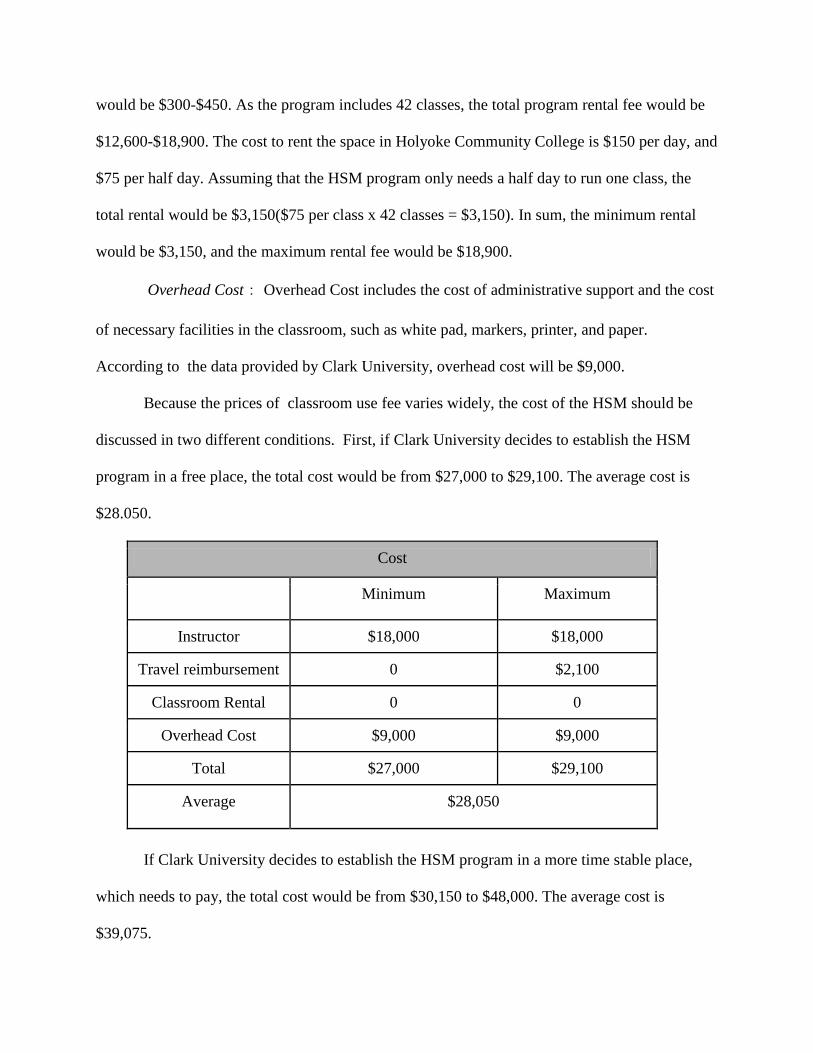
would be $300-$450. As the program includes 42 classes, the total program rental fee would be
$12,600-$18,900. The cost to rent the space in Holyoke Community College is $150 per day, and
$75 per half day. Assuming that the HSM program only needs a half day to run one class, the
total rental would be $3,150($75 per class x 42 classes = $3,150). In sum, the minimum rental
would be $3,150, and the maximum rental fee would be $18,900.
Overhead Cost: Overhead Cost includes the cost of administrative support and the cost
of necessary facilities in the classroom, such as white pad, markers, printer, and paper.
According to the data provided by Clark University, overhead cost will be $9,000.
Because the prices of classroom use fee varies widely, the cost of the HSM should be
discussed in two different conditions. First, if Clark University decides to establish the HSM
program in a free place, the total cost would be from $27,000 to $29,100. The average cost is
$28.050.
Cost
Minimum Maximum
Instructor $18,000 $18,000
Travel reimbursement 0 $2,100
Classroom Rental 0 0
Overhead Cost $9,000 $9,000
Total $27,000 $29,100
Average $28,050
If Clark University decides to establish the HSM program in a more time stable place,
which needs to pay, the total cost would be from $30,150 to $48,000. The average cost is
$39,075.
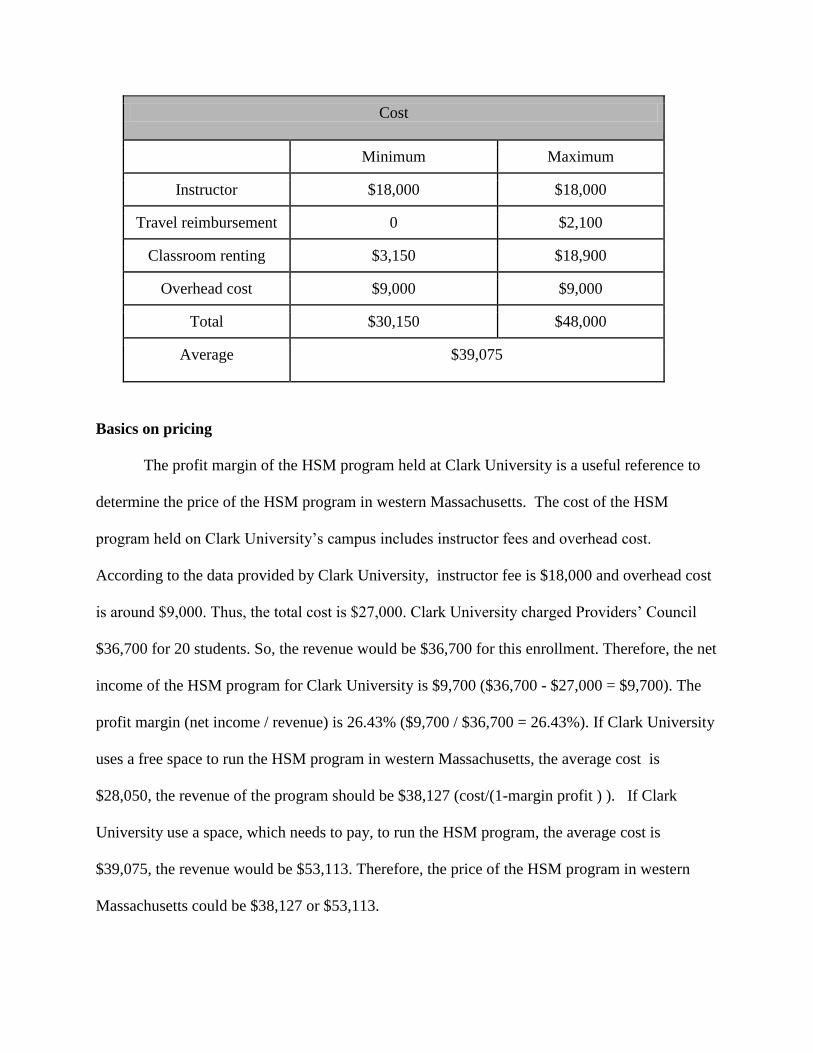
Cost
Minimum Maximum
Instructor $18,000 $18,000
Travel reimbursement 0 $2,100
Classroom renting $3,150 $18,900
Overhead cost $9,000 $9,000
Total $30,150 $48,000
Average $39,075
Basics on pricing
The profit margin of the HSM program held at Clark University is a useful reference to
determine the price of the HSM program in western Massachusetts. The cost of the HSM
program held on Clark University’s campus includes instructor fees and overhead cost.
According to the data provided by Clark University, instructor fee is $18,000 and overhead cost
is around $9,000. Thus, the total cost is $27,000. Clark University charged Providers’ Council
$36,700 for 20 students. So, the revenue would be $36,700 for this enrollment. Therefore, the net
income of the HSM program for Clark University is $9,700 ($36,700 - $27,000 = $9,700). The
profit margin (net income / revenue) is 26.43% ($9,700 / $36,700 = 26.43%). If Clark University
uses a free space to run the HSM program in western Massachusetts, the average cost is
$28,050, the revenue of the program should be $38,127 (cost/(1-margin profit ) ). If Clark
University use a space, which needs to pay, to run the HSM program, the average cost is
$39,075, the revenue would be $53,113. Therefore, the price of the HSM program in western
Massachusetts could be $38,127 or $53,113.

Pro Forma Financials
Actually, whether Clark University will make profits, lose money or just reach the break-
even point, highly depends on the negotiation with Providers’ Council about how much it will
pay to Clark University for the HSM program. If Providers’ Council only pays Clark University
the cost, Clark University will reach the break-even point. If it pays less than the cost, Clark
University will lose money in the HSM program. If it pays more than cost, Clark University will
make profit from the HSM program.
In three years, Clark University will get stable revenues form Providers’ Council, because
it signs a contract with Providers’ Council to build the HSM program. If the rental, instructor
salaries, overhead cost, and travel reimbursements stay the same, the cost of the HSM program
will not change. Therefore, profit will be the same in three years. If the cost changes, Clark
University should re-negotiate with Providers’ Council about how much it should pay for the
HSM program.