Human Plasma N -Glycoproteome Analysis by Immunoaffinity Subtraction, Hydrazide Chemistry, and Mass...
11
Human Plasma N-Glycoproteome Analysis by Immunoaffinity Subtraction, Hydrazide Chemistry, and Mass Spectrometry Tao Liu, Wei-Jun Qian, Marina A. Gritsenko, David G. Camp II, Matthew E. Monroe, Ronald J. Moore, and Richard D. Smith* Biological Sciences Division and Environmental Molecular Sciences Laboratory, Pacific Northwest National Laboratory, Richland, Washington 99354 Received July 7, 2005 The enormous complexity, wide dynamic range of relative protein abundances of interest (over 10 orders of magnitude), and tremendous heterogeneity (due to post-translational modifications, such as glycosylation) of the human blood plasma proteome severely challenge the capabilities of existing analytical methodologies. Here, we describe an approach for broad analysis of human plasma N-glycoproteins using a combination of immunoaffinity subtraction and glycoprotein capture to reduce both the protein concentration range and the overall sample complexity. Six high-abundance plasma proteins were simultaneously removed using a pre-packed, immobilized antibody column. N-linked glycoproteins were then captured from the depleted plasma using hydrazide resin and enzymatically digested, and the bound N-linked glycopeptides were released using peptide-N-glycosidase F (PNGase F). Following strong cation exchange (SCX) fractionation, the deglycosylated peptides were analyzed by reversed-phase capillary liquid chromatography coupled to tandem mass spectrometry (LC-MS/ MS). Using stringent criteria, a total of 2053 different N-glycopeptides were confidently identified, covering 303 nonredundant N-glycoproteins. This enrichment strategy significantly improved detection and enabled identification of a number of low-abundance proteins, exemplified by interleukin-1 receptor antagonist protein (∼200 pg/mL), cathepsin L (∼1 ng/mL), and transforming growth factor beta 1 (∼2 ng/mL). A total of 639 N-glycosylation sites were identified, and the overall high accuracy of these glycosylation site assignments as assessed by accurate mass measurement using high-resolution liquid chromatography coupled to Fourier transform ion cyclotron resonance mass spectrometry (LC-FTICR) is initially demonstrated. Keywords: human plasma • mass spectrometry • proteomics • N-glycosylation • immunoaffinity subtraction Introduction Human blood plasma possesses significant potential for disease diagnosis and therapeutic monitoring. For example, protein abundance changes in plasma may provide direct information on physiological and metabolic states of disease and drug response. As a result, the potential discovery of novel candidate protein biomarkers from plasma using high-through- put proteomic technologies has fostered a “gold-rush” enthu- siasm in the biomedical research community. 1-4 However, characterization of the blood plasma proteome is analytically challenging for a number of reasons. One of the analytical challenges of characterizing the plasma proteome stems from the wide range of concentrations among constituent proteins. For example, many of the cytokines and tissue leakage proteins that could be important indicators of changes in physiological states are present at <1 pg/mL concentrations, while serum albumin, the major carrier and transport protein in plasma, is present at a concentration of ∼45 mg/mL. Moreover, 99% of the plasma protein mass is distributed across only 22 proteins. 1,5 Global proteome profiling of human plasma using either two-dimensional gel electrophoresis (2DE) or single-stage liquid chromatography coupled to tandem mass spectrometry (LC- MS/MS) has proven to be challenging because of the dynamic range of detection of these techniques. This detection range has been estimated to be in the range of 4 to 6 orders of magnitude, and allows identification of only the relatively abundant plasma proteins. A variety of depletion strategies for removing high-abundance plasma proteins, 6-8 as well as advances in high resolution, multidimensional nanoscale LC have been demonstrated to improve the overall dynamic range of detection. Reportedly, the use of a high efficiency two- dimensional (2-D) nanoscale LC system allowed more than 800 plasma proteins to be identified without depletion. 9 Another characteristic feature of plasma that hampers pro- teomic analyses is its tremendous complexity; plasma contains not only “classic” plasma proteins, but also cellular “leakage” proteins that can potentially originate from virtually any cell * To whom correspondence should be addressed. Biological Sciences Division, Pacific Northwest National Laboratory, P.O. Box 999, MSIN: K8- 98, Richland WA, 99352. E-mail: [email protected]. 2070 Journal of Proteome Research 2005, 4, 2070-2080 10.1021/pr0502065 CCC: $30.25 2005 American Chemical Society Published on Web 10/26/2005
-
Upload
independent -
Category
Documents
-
view
0 -
download
0
Transcript of Human Plasma N -Glycoproteome Analysis by Immunoaffinity Subtraction, Hydrazide Chemistry, and Mass...

Human Plasma N-Glycoproteome Analysis by Immunoaffinity
Subtraction, Hydrazide Chemistry, and Mass Spectrometry
Tao Liu, Wei-Jun Qian, Marina A. Gritsenko, David G. Camp II, Matthew E. Monroe,Ronald J. Moore, and Richard D. Smith*
Biological Sciences Division and Environmental Molecular Sciences Laboratory, Pacific Northwest NationalLaboratory, Richland, Washington 99354
Received July 7, 2005
The enormous complexity, wide dynamic range of relative protein abundances of interest (over 10orders of magnitude), and tremendous heterogeneity (due to post-translational modifications, such asglycosylation) of the human blood plasma proteome severely challenge the capabilities of existinganalytical methodologies. Here, we describe an approach for broad analysis of human plasmaN-glycoproteins using a combination of immunoaffinity subtraction and glycoprotein capture to reduceboth the protein concentration range and the overall sample complexity. Six high-abundance plasmaproteins were simultaneously removed using a pre-packed, immobilized antibody column. N-linkedglycoproteins were then captured from the depleted plasma using hydrazide resin and enzymaticallydigested, and the bound N-linked glycopeptides were released using peptide-N-glycosidase F (PNGaseF). Following strong cation exchange (SCX) fractionation, the deglycosylated peptides were analyzedby reversed-phase capillary liquid chromatography coupled to tandem mass spectrometry (LC-MS/MS). Using stringent criteria, a total of 2053 different N-glycopeptides were confidently identified,covering 303 nonredundant N-glycoproteins. This enrichment strategy significantly improved detectionand enabled identification of a number of low-abundance proteins, exemplified by interleukin-1 receptorantagonist protein (∼200 pg/mL), cathepsin L (∼1 ng/mL), and transforming growth factor beta 1 (∼2ng/mL). A total of 639 N-glycosylation sites were identified, and the overall high accuracy of theseglycosylation site assignments as assessed by accurate mass measurement using high-resolution liquidchromatography coupled to Fourier transform ion cyclotron resonance mass spectrometry (LC-FTICR)is initially demonstrated.
Keywords: human plasma • mass spectrometry • proteomics • N-glycosylation • immunoaffinity subtraction
Introduction
Human blood plasma possesses significant potential fordisease diagnosis and therapeutic monitoring. For example,protein abundance changes in plasma may provide directinformation on physiological and metabolic states of diseaseand drug response. As a result, the potential discovery of novelcandidate protein biomarkers from plasma using high-through-put proteomic technologies has fostered a “gold-rush” enthu-siasm in the biomedical research community.1-4 However,characterization of the blood plasma proteome is analyticallychallenging for a number of reasons.
One of the analytical challenges of characterizing the plasmaproteome stems from the wide range of concentrations amongconstituent proteins. For example, many of the cytokines andtissue leakage proteins that could be important indicators ofchanges in physiological states are present at <1 pg/mLconcentrations, while serum albumin, the major carrier and
transport protein in plasma, is present at a concentration of∼45 mg/mL. Moreover, 99% of the plasma protein mass isdistributed across only 22 proteins.1,5
Global proteome profiling of human plasma using eithertwo-dimensional gel electrophoresis (2DE) or single-stage liquidchromatography coupled to tandem mass spectrometry (LC-MS/MS) has proven to be challenging because of the dynamicrange of detection of these techniques. This detection rangehas been estimated to be in the range of 4 to 6 orders ofmagnitude, and allows identification of only the relativelyabundant plasma proteins. A variety of depletion strategies forremoving high-abundance plasma proteins,6-8 as well asadvances in high resolution, multidimensional nanoscale LChave been demonstrated to improve the overall dynamic rangeof detection. Reportedly, the use of a high efficiency two-dimensional (2-D) nanoscale LC system allowed more than 800plasma proteins to be identified without depletion.9
Another characteristic feature of plasma that hampers pro-teomic analyses is its tremendous complexity; plasma containsnot only “classic” plasma proteins, but also cellular “leakage”proteins that can potentially originate from virtually any cell
* To whom correspondence should be addressed. Biological SciencesDivision, Pacific Northwest National Laboratory, P.O. Box 999, MSIN: K8-98, Richland WA, 99352. E-mail: [email protected].
2070 Journal of Proteome Research 2005, 4, 2070-2080 10.1021/pr0502065 CCC: $30.25 2005 American Chemical SocietyPublished on Web 10/26/2005

or tissue type in the body.1 In addition, the presence of anextremely large number of different immunoglobulins withhighly variable regions makes it challenging to distinguishamong specific antibodies on the basis of peptide sequencesalone. Thus, with the limited dynamic range of detection forexisting proteomic technologies, it often becomes necessaryto reduce sample complexity to effectively measure the less-abundant proteins in plasma. Pre-fractionation techniques thatcan reduce plasma complexity prior to 2DE or 2-D LC-MS/MS analyses include depletion of immunoglobulins,7 ultrafil-tration (to prepare the low molecular weight protein fraction),10
size exclusion chromatography,5 ion exchange chromatogra-phy,5 liquid-phase isoelectric focusing,11,12 and the enrichmentof specific subsets of peptides, e.g., cysteinyl peptides,13-15 andglycopeptides.16,17
The enrichment of N-glycopeptides is of particular interestfor characterizing the plasma proteome because the majorityof plasma proteins are believed to be glycosylated. The changesin abundance and the alternations in glycan composition ofplasma proteins and cell surface proteins have been shown tocorrelate with cancer and other disease states. In fact, numer-ous clinical biomarkers and therapeutic targets are glycosylatedproteins, such as the prostate-specific antigen for prostatecancer, and CA125 for ovarian cancer. N-glycosylation (thecarbohydrate moiety is attached to the peptide backbone viaasparagine residues) is particularly prevalent in proteins thatare secreted and located on the extracellular side of the plasmamembrane, and are contained in various body fluids (e.g., bloodplasma).18 More importantly, because the N-glycosylation sitesgenerally fall into a consensus NXS/T sequence motif in whichX represents any amino acid residue except proline,19 this motifcan be used as a sequence tag prerequisite to aid in confidentvalidation of N-glycopeptide identifications.
Recently, Zhang et al.16 developed an approach for specificenrichment of N-linked glycopeptides using hydrazide chem-istry. In this study, we build on this approach by couplingmulticomponent immunoaffinity subtraction with N-glycopep-tide enrichment for comprehensive 2-D LC-MS/MS analysisof the human plasma N-glycoproteome. A conservativelyestimated dynamic range of detection of >108 was achievedby effectively reducing the protein concentration range andoverall sample complexity. This overall dynamic range ofdetection enabled confident identification of 303 nonredundantN-glycoproteins, many of which represented low abundancesecreted and extracellular proteins. The accurate mass mea-surements provided by Fourier transform ion cyclotron reso-nance mass spectrometry (FTICR) for LC-MS were used toconfirm the number of N-glycosylation site(s) in glycopeptides.
Materials and Methods
Immunoaffinity Subtraction Using Multiple Affinity Re-moval System (MARS). The human blood plasma sample wassupplied by Stanford University School of Medicine (Palo Alto,CA); an initial protein concentration of 65 mg/mL of plasmawas determined by BCA Protein Assay (Pierce, Rockford, IL).Approval for the conduct of this programmatic research wasobtained from the Institutional Review Boards of the StanfordUniversity School of Medicine and the Pacific NorthwestNational Laboratory in accordance with federal regulations. Sixhigh-abundant plasma proteinssalbumin, IgG, antitrypsin, IgA,transferrin, and haptoglobinsthat constitute approximately85% of the total protein mass of human plasma were removedin a single step by using the MARS affinity column (Agilent,
Palo Alto, CA) on an Agilent 1100 series HPLC system (Agilent)per the manufacturer’s instruction. A total of 800 µL plasmawas subjected to MARS-depletion. The flow-through fractionswere pooled and desalted using BioMax centrifugal filterdevices with 5 kDa molecular weight cutoffs (Millipore, Bil-lerica, MA), and the total protein amount was determined tobe 7.5 mg by Coomassie Protein Assay (Pierce).
Enrichment of Formerly N-Linked glycopeptides. Hydrazideresin (Bio-Rad, Hercules, CA) was used to capture glycopro-teins, using a method similar to that previously reported16. Theconcentrated MARS flow-through fraction was diluted 10-foldin coupling buffer (100 mM sodium acetate and 150 mM NaCl,pH 5.5) and oxidized in 15 mM sodium periodate at roomtemperature for 1 h in the dark, with constant shaking. Thesodium periodate was subsequently removed by using a pre-packed PD-10 column (Amersham Biosciences, Piscataway, NJ)equilibrated with coupling buffer. The hydrazide resin (1 mLof 50% slurry per 100 µL of plasma) was washed five times withcoupling buffer; the oxidized protein sample was then addedand incubated with the resin overnight at room temperature.Nonglycoproteins were removed by washing the resin brieflythree times with 100% methanol and then three times with 8M urea in 0.4 M NH4HCO3. The glycoproteins were denaturedand reduced in 8 M urea and 10 mM dithiothreitol (DTT) at 37°C for 1 h. Protein cysteinyl residues were alkylated with 20mM iodoacetamide for 90 min at room temperature. Afterwashing with 8 M urea and 50 mM NH4HCO3, respectively, theresin was resuspended as a 20% slurry in 50 mM NH4HCO3
and sequencing grade trypsin (Promega, Madison, WI) wasadded at a 1:100 (w:w) trypsin-to-protein ratio (based on theinitial plasma protein concentration of 65 mg/mL), and thesample was digested on-resin overnight at 37 °C. The trypsin-released peptides were removed by washing the resin exten-sively with three separate solutions: 2 M NaCl, 100% methanol,and 50 mM NH4HCO3. The resin was resuspended as 50% slurryin 50 mM NH4HCO3 and the N-glycopeptides were releasedby incubating the resin with PNGase F (New England Biolabs,Beverly, MA) for 4 h at 37 °C, using a ratio of 1 µL of PNGaseF per 100 µL of plasma. The released deglycosylated peptideswere then cleaned using a SPE C18 column (Supelco, Belle-fonte, PA) per the manufacturer’s instructions and lyophilizedunder vacuum.
Strong Cation Exchange (SCX) Peptide Fractionation.Enriched deglycosylated peptides were reconstituted with 300µL of 10 mM ammonium formate (pH 3.0)/25% acetonitrile andfractionated by strong cation exchange (SCX) chromatographyon a Polysulfoethyl A 200 × 2.1 mm column (PolyLC, Columbia,MD) that was preceded by a 10 × 2.1 mm guard column. Theseparations were performed at a flow rate of 0.2 mL/min usingan Agilent 1100 series HPLC system (Agilent) and mobile phasesconsisting of 10 mM ammonium formate (pH 3.0)/25% aceto-nitrile (A), and 500 mM ammonium formate (pH 6.8)/25%acetonitrile (B). After loading 300 µL of sample onto the column,the gradient was maintained at 100% A for 10 min. Peptideswere then separated by using a gradient from 0 to 50% B over40 min, followed by a gradient of 50-100% B over 10 min. Thegradient was then held at 100% B for 10 min. A total of 30fractions were collected, and each fraction was dried undervacuum. The fractions were dissolved in 30 µL of 25 mM NH4-HCO3 and 10 µL of each fraction was analyzed by capillary LC-MS/MS.
Reversed-Phase Capillary LC-MS/MS Analyses. Peptidesamples were analyzed using a custom-built high-pressure
Human Plasma N-Glycoproteome Analysis research articles
Journal of Proteome Research • Vol. 4, No. 6, 2005 2071

capillary LC system20 coupled online to either a three-dimensional ion trap mass spectrometer (LCQ; ThermoElec-tron, San Jose, CA) or a linear ion trap mass spectrometer (LTQ;ThermoElectron) by way of an in-house-manufactured elec-trospray ionization (ESI) interface. The reversed-phase capillarycolumn was prepared by slurry packing 3-µm Jupiter C18bonded particles (Phenomenex, Torrence, CA) into a 65-cm-long, 150 µm-i.d. × 360 µm-o.d. fused silica capillary (Polymi-cro Technologies, Phoenix, AZ) that incorporated a 2-µmretaining stainless steel screen in an HPLC union (ValcoInstruments Co., Houston, TX). The mobile phase consistedof 0.2% acetic acid and 0.05% TFA in water (A) and 0.1% TFAin 90% acetonitrile/10% water (B). Mobile phases were de-gassed on-line using a vacuum degasser (Jones Chromatogra-phy Inc., Lakewood, CO). After loading 10 µL of peptides ontothe column, the mobile phase was held at 100% A for 20 min.Exponential gradient elution was performed by increasing themobile-phase composition from 0 to 70% B over 150 min, usinga stainless steel mixing chamber. To identify the elutingpeptides, the linear ion trap mass spectrometer was operatedin a data-dependent MS/MS mode (m/z 400-2000), in whicha full MS scan was followed by five MS/MS scans. The five mostintensive precursor ions were dynamically selected in the orderof highest intensity to lowest intensity and subjected tocollision-induced dissociation, using a normalized collisionenergy setting of 35%. A dynamic exclusion duration of 1 minwas used. The temperature of the heated capillary and the ESIvoltage were 200 °C and 2.2 kV, respectively.
MS/MS Data Analysis and Protein Categorization. All MS/MS spectra were searched independently against the humanInternational Protein Index (IPI) database (version 2.29 consist-ing of 41 216 protein entries; available online at http://www.ebi.ac.uk/IPI) and the reversed human IPI protein data-base using SEQUEST (ThermoFinnigan).21 The reversed humanprotein database was created as previously reported22 byreversing the order of the amino acid sequences for eachprotein. The following dynamic modifications were used:carboxamidomethylation of cysteine, oxidation of methionine,and a PNGase F-catalyzed conversion of asparagine to asparticacid at the site of carbohydrate attachment. The false positiveN-glycopeptide identifications were estimated as previouslydescribed22 by dividing the number of NXS/T-motif containingpeptides from the reversed database search by the number ofmotif containing peptides from the normal database search.The percentages of the NXS/T-motif-containing peptides in allin silico tryptic peptides from both the normal and reverseddatabases were determined to be at similar level (∼10%); thus,the number of false positives arising from random hits shouldbe similar from both databases. There is a very small fractionof the peptide identifications (∼0.1%) that overlap in bothdatabase searching results, but the effect of these peptides onthe overall estimation of false positives is insignificant. Severalsets of Xcorr and ∆Cn cutoffs obtained from this probability-based evaluation (with an overall confidence of over 95%) wereused to filter the raw peptide identifications. For example, when∆Cn g 0.1 for the 1+ charge state, then Xcorr g 1.5 for fullytryptic peptides and Xcorr g 2.1 for partially tryptic peptideswere used; for the 2+ charge state, Xcorr g 1.8 for fully trypticpeptides and Xcorr g 3.3 for partially tryptic peptides; and forthe 3+ charge state, Xcorr g 2.6 for fully tryptic peptides andXcorr g 4.2 for partially tryptic peptides. The presence of atleast one NXS/T motif was required for all peptides. In anattempt to remove redundant protein entries in the reported
results, the software ProteinProphet was used as a clusteringtool to group similar or related protein entries into a “proteingroup”.23 All peptides that passed the filtering criteria weregiven an identical probability score of 1, and entered into theProteinProphet program solely for clustering analysis to gener-ate a final list of nonredundant proteins or protein groups.Gene Ontology (GO) component, function, and process termsextracted from text-based annotation files downloaded fromthe European Bioinformatics Institute ftp site: ftp://ftp.ebi-.ac.uk/pub/databases/GO/goa/HUMAN were used to catego-rize the identified proteins,
Assessing the Accuracy of N-Glycosylation Site AssignmentsUsing the Accurate Mass and Time (AMT) Tag Approach. Toaccess the accuracy of N-glycosylation site assignments in theMS/MS identifications, a portion of the enriched deglycosylatedpeptides (without SCX fractionation) were analyzed by LC-FTICR24 using the same LC conditions and the AMT tagapproach.25,26 Briefly, the peptide retention times from eachLC-MS/MS analysis were normalized to a range of 0-1 toprovide normalized elution times (NETs).27 Both the calculatedmass (based on sequences without deamidation of the aspar-agine residues) and observed NET of the identified NXS/T-motif-containing peptides from the LC-MS/MS analyses wereincluded as AMT tags in a database. Features (i.e., peaks withboth a unique mass and elution time) from the LC-FTICRanalysis were identified by matching the measured accuratemass and elution time of each feature to the correspondingAMT tags in the database. A maximum mass error of 5 ppmand a maximum NET error of 5% were used for the matching.The number of N-glycosylation site(s) in each peptide wasconfidently determined by searching the AMT tag databaseusing dynamic deamidation on asparagine residues (0.9840 Daincrement in monoisotopic mass per site).
Results
Proteomic Analysis Strategy. A combination of multicom-ponent immunoaffinity subtraction, N-glycopeptide enrich-ment, SCX fractionation, and LC-MS/MS was employed in thisstudy to effectively improve the dynamic range of detectionand increase the coverage for low-abundance proteins. Theproteomic workflow of this approach is illustrated in Figure 1.First, crude plasma was subjected to high-abundant-proteindepletion in a highly reproducible manner by using the MARScolumn and fully automated LC system (data not shown). Theless-abundant proteins were enriched by pooling all the flow-through fractions from an initial 800 µL of plasma sample. Thehydroxyl groups on adjacent carbon atoms of carbohydrateswere converted to aldehydes using periodate oxidation, andthen the glycoproteins were specifically captured on thehydrazide resin by the formation of covalent hydrazone bondsbetween the newly formed aldehyde groups and the hydrazidegroups on the resin. After in situ tryptic digestion, all nongly-copeptides were removed by extensive washing. PNGase F wasused to specifically release the N-glycosylated peptides (exceptthose peptides carrying an R1 f 3 linked core fucose) fromthe resin, which resulted in converting the asparagine residuespositioned at the glycan attachment to aspartic acid residues.The O-glycosylated peptides that have a Gal â1 f 3GalNAc corecan also be released from the resin by this process. However,due to the lack of an enzyme comparable to PNGase F, all ofthe external monosaccharides must be sequentially removeduntil only the core carbohydrate structure remains on eitherserine or threonine residues, before the final release of those
research articles Liu et al.
2072 Journal of Proteome Research • Vol. 4, No. 6, 2005

peptides using an O-glycosidase. In this study, we focused onthe identification of N-glycoproteins for two reasons: (1)N-glycosylation is particularly prevalent in blood plasma, and(2) the overall specificity of N-glycopeptide capture-and-releaseusing hydrazide chemistry and PNGase F has been welldemonstrated.28 The deglycosylated peptides released by PN-Gase F were further fractionated into 30 fractions using SCXchromatography, and each fraction was analyzed by LC-MS/MS. Prior to SCX fractionation, a portion of the deglycosylatedpeptides were analyzed using LC-FTICR and the AMT tagapproach to assess the accuracy of MS/MS N-glycosylation siteidentifications; the PNGase F-catalyzed deglycosylation reactionconverts each asparagine to aspartic acid residue at the positionof glycan attachment, resulting in a monoisotopic mass incre-ment of 0.9840 Da for each glycosylation site.
Plasma N-Glycoprotein Identifications. Application of thefiltering criteria developed on the basis of reversed databasesearching provided an overall confidence level of >95%, whichresulted in a total of 2053 different N-glycopeptide identifica-tions (including partially tryptic peptides, mis-cleaved trypticpeptides, and differentially oxidized methionine-containingpeptides that span the same glycosylation site(s)); these peptideidentifications can be further collapsed to 610 representativenonredundant sequences. Consistent with previous studies, thefraction of partially tryptic peptide identifications was muchgreater for plasma than that observed for either cell lysates ortissue homogenates.7,10,29 This result is most likely due to thepresence of various endogenous proteases and peptidases inplasma, as well as to either the appearance of differenttruncated proteins from cellular and tissue “leakage” or theremoval of signal peptides.17,22 A total of 303 nonredundantN-glycoprotein identifications were obtained with the majorityof them being extracellular or secreted proteins. Among thesenonredundant identifications, 136 proteins had more than twoN-glycopeptide identifications. The subcellular location andN-glycosylation information of these proteins, the representa-tive nonredundant peptide sequences, the numbers of differentpeptide identifications spanning the same N-glycosylation site-
(s), and N-glycosylation sites, are available online as SupportingInformation Table 1.
A recent study of N-glycoproteins from mouse serum usinghydrazide chemistry28 yielded a total of 93 N-glycoproteinidentifications, while another study identified 47 N-glycopro-teins from human serum using lectin affinity capture.17 Bothstudies used single dimension LC-MS/MS analyses with three-dimensional ion trap (LCQ) mass spectrometers. The presenthuman plasma N-glycoprotein analysis using hydrazide chem-istry yielded a substantially larger set of N-glycoprotein iden-tifications via the combined application of MARS depletion, a2-D LC separation, and new linear ion trap (LTQ) MS instru-mentation. Experiments were conducted to further evaluate theefficiency of each of the three new components that contributeto the overall analysis improvements (Table 1). The resultsindicate that the 2-D LC separation made the greatest contri-bution (3.1-fold improvement). However, the use of new LTQinstrumentation also improved protein indentification by 1.2-fold, presumably due to its higher sensitivity (and to a lesserextent, its faster scan rate). The MARS depletion made a similarmodest contribution (1.2-fold improvement), probably becausethe major component that was removed from the plasmaduring the immunosubtraction, serum albumin, is not normallyglycosylated. Nonetheless, an overall 4.4-fold improvement inglycoprotein identification was achieved via the combinedapplication of multicomponent immunosubtraction, new LTQinstrumentation, and 2-D LC separation.
Figure 2 shows the SCX chromatogram and the LC-MS/MSanalysis of the deglycosylated peptides. A total of 30 fractionswere collected from the SCX separation. Figure 2B shows thebase peak chromatogram of the LC-MS/MS analysis of fraction14, one of the peptide-rich fractions (marked with an arrow inFigure 2A). Instead of being dominated by a few high abun-dance species with broad elution profiles as in previousanalyses of nondepleted plasma using 2D-LC-MS/MS,29 a largenumber of peaks with narrower peak widths were observedfrom the base peak chromatogram, which reflects the effectivelyreduced sample complexity and peptide concentration rangeafter MARS depletion and glycoprotein enrichment. Figure2C,D shows examples of MS scans at LC elution times of 39.41min and 44.83 min, respectively, where almost no intense peaksappeared in the base peak chromatogram (Figure 2B). Frag-mentation of low-abundant ions with m/z ) 638.3 and m/z )923.0 in these two MS spectra resulted in the confidentidentification of two fully tryptic, formerly N-glycosylatedpeptides K.YSVAN*DTGFVDIPKQEK.A (the asterisk indicatesthe N-glycosylation site and the consensus motif is in bold)
Figure 1. Strategy for plasma N-glycoprotein analysis usingimmunoaffinity subtraction, glycoprotein capture, and massspectrometry. Crude plasma (red balls marked with “H” representhigh abundance proteins; blue balls marked with “L” representlow abundance proteins) is first subjected to multicomponentdepletion using the pre-packed MARS column, followed byincubating the flow-through (minus the retained abundant pro-teins) with hydrazide resin. The captured glycoproteins (blue ballsmarked with “G”) are then washed and digested on-resin withtrypsin, and the N-glycopeptides are specifically released fromthe resin by PNGase F. The resulting deglycosylated peptidescan either be identified by 2-D LC-MS/MS or directly analyzedby LC-FTICR to validate the number of glycosylation sites.
Table 1. Evaluation of the Efficiency of MS Instrumentation,LC Separation, and Immunosubtraction that Contribute to theOverall Analysis
MS LC depletion
unique
glycoproteins improvement
LCQ 1D none 69 1.2LTQ 1D none 83
LTQ 1D none 83 1.2LTQ 1D MARS 99
LTQ 1D MARS 99 3.1LTQ 2D MARS 303
LCQ 1D none 69 4.4LTQ 2D MARS 303
Human Plasma N-Glycoproteome Analysis research articles
Journal of Proteome Research • Vol. 4, No. 6, 2005 2073

and R.LQLEAVN*ITDLSENRK.Q that correspond to the twolow-abundant proteins, cathepsin L (Figure 2E, 1 ng/mL) and
interleukin-1 receptor antagonist protein (Figure 2F, 200 pg/mL), respectively.
Figure 2. SCX fractionation and LC-MS/MS analysis. (A) The deglycosylated peptides were separated into 30 fractions using SCXchromatography. (B) Base peak chromatogram of the LC-MS/MS analysis for fraction 14 (marked with arrow in A). (C) MS spectrumfor the peptides eluted at 39.41 min in the base peak chromatogram. (D) MS spectrum for the peptides eluted at 44.83 min in the samebase peak chromatogram. (E) Fragmentation of low-abundance ion with m/z ) 638.3 (marked with asterisk in C) resulted in identificationof the fully tryptic peptide K.YSVAN*DTGFVDIPKQEK.A (asterisk indicates the N-glycosylation site and the consensus motif is in bold)and originates from the low-abundance protein cathepsin L. Fragment ions that matched predicted ions are labeled as b and y ions.(F) This peptide was identified from the fragmentation of low-abundance ion with m/z ) 923.0 (marked with asterisk in D) as the fullytryptic peptide R.LQLEAVN*ITDLSENRK.Q and originated from the low-abundance protein interleukin-1 receptor antagonist protein.
research articles Liu et al.
2074 Journal of Proteome Research • Vol. 4, No. 6, 2005

Recently, our laboratory reported the results of severalstudies that involved comprehensive analysis of human plasmausing various approaches, including albumin depletion, IgGdepletion, and multidimensional and nanoscale separa-tions.9,29,30 Nine-hundred thirty-eight nonredundant plasmaproteins were identified after filtering with a set of criteriadeveloped for human plasma that provides >95% confidencelevel in unique peptide identifications as evaluated usingreversed database searching.30 In the present study, we appliedthe same filtering criteria and attained the same confidencelevel for the identification of N-glycosylated peptides, whichresulted in confident identification of 303 nonredundant N-glycoproteins. Not surprisingly, the overlap of only 123 proteinsbetween the two sets of protein identifications (ref 30 and thework reported here) is relatively low (as shown in Figure 3),because the combination of multicomponent immunoaffinitysubtraction and N-glycopeptide enrichment techniques asapplied in this N-glycoprotein analysis provided an enhanceddynamic range of detection that is not attainable when usingeither a single-component depletion step or improved LCseparations alone, as in our earlier global studies. In comparingthe related studies essentially all of the overlapped N-glyco-protein identifications are relatively abundant “classic” plasmaproteins, e.g., R-1-acid glycoproteins, apolipoproteins, coagula-tion and complement factors, and protease and proteaseinhibitors. Table 2 lists some of the low-abundance proteinsand cytokines identified in this study; a number of them havereported concentrations that range from ng/mL to pg/mL. 31-43
Among the low-abundance proteins are ADAM proteins, growthfactors, cadherins, cathepsins, contactins, integrins, intercel-lular adhesion molecules, receptors for interleukins and othergrowth factors, neural cell adhesion molecules, and proto-oncogene tyrosine-protein kinases. In particular, the concen-tration of interleukin-1 receptor antagonist protein (IL-1ra) has
been reported to be at the pg/mL level. The fact that numerousproteins in the low µg/mL to pg/mL range were identifiedsuggests that the present approach can consistently detectproteins in the low ng/mL concentration range and can achievean overall detection dynamic range of >108, which is of greatsignificance for candidate biomarker discovery based on N-glycosylated proteins.
Although the use of immunoaffinity approaches to removehigh-abundance proteins (especially albumin) may potentiallyremove some other low-abundance proteins of interest due tospecific or nonspecific binding,44 we have been able to confi-dently identify significantly more low-abundance proteins fromthe MARS-depleted plasma sample as a result of the effectivelyreduced protein concentration range. Immunoaffinity subtrac-tion process using the MARS column and fully automatedHPLC system is robust and reproducible chromatographically(data not shown). Moreover, in the LC-MS/MS analyses ofthree independently prepared samples, 66 ( 3 glycoproteinswere identified from the flow-through plasma protein samples,and 26 ( 2 proteins (without glycoprotein enrichment) wereidentified from the bound plasma protein samples, respectively.The overlap of protein identifications in these replicatedexperiments is 90%, which is similar to what we normallyobserve in repeated analysis of less complex samples using iontrap mass spectrometers. In addition, almost all the identifiedMARS-bound plasma proteins are proteins targeted by theantibodies, except that there were a total of 15 differentimmunoglobulins identified (the peptide and protein identi-fications of the MARS-bound proteins are available on line inSupporting Information Table 2). In a recent study on high-abundant protein depletion,45 it was observed that the MARSsystem has no albumin, transferrin, R-1-antitrypsin, or hapto-globin present in the flow-through fraction, and the ELISAresults indicated that depletion of the target proteins is typicallygreater than 98%. In this study, most of the target proteinsexcept for albumin were still identified with multiple N-glycopeptides (Supporting Information Table 1). This observa-tion suggests the presence of these proteins in the sample evenafter >98% depletion, presumably due to the very high initialconcentrations for these proteins. The overall throughput andreproducibility can be further improved by implementingautomated sample processing. Thus, these processes can bereadily incorporated into a quantitative proteomic strategy toenhance detection of low-abundance proteins in various biof-luids for discovering candidate biomarkers. Many plasmaproteins are known to be present in various post-translationallyprocessed forms, particularly differentially glycosylated forms,which increase proteome complexity and heterogeneity. Forexample, in a recent large scale plasma proteome profilingreported by Pieper et al.,5 using extensive pre-fractionation ofthe plasma proteins prior to 2DE separation, 3700 protein spotswere displayed on 2D gels. However, only 325 distinct proteinswere identified by MS, largely due to the presence of thedifferent forms of the same protein that have similar molecularweights, but different isoelectric points (horizontal stripes ongels). However, since it is estimated that there is only anaverage of 3.6 potential N-glycopeptides per protein28 and thehighly heterogeneous oligosaccharides can be removed fromthe enriched glycopeptides, the quantitative measurements ofplasma, by either isotopic labeling16 or direct feature compari-son,28 will greatly benefit from the use of the enriched degly-cosylated peptides due to the largely reduced sample com-plexity and heterogeneity.
Figure 3. Overlap between the identified proteins from thespecifically enriched N-glycopeptides and a previous study basedon global tryptic peptides (ref 30). In the previous study, theglobal tryptic peptides were prepared by digesting the plasmaproteins with and without albumin depletion or IgG depletion,fractionated by SCX chromatography, and analyzed by LC-MS/MS with and without enhanced separation (e.g., longer gradient,smaller i.d. column), which resulted in a total of 938 nonredun-dant protein identifications. In contrast, 303 nonredundant N-glycoproteins were confidently identified from 30 regular LC-MS/MS analyses of the deglycosylated peptides prepared byusing MARS depletion, glycoprotein capture, and SCX fraction-ation.
Human Plasma N-Glycoproteome Analysis research articles
Journal of Proteome Research • Vol. 4, No. 6, 2005 2075

Assessing Accuracy of N-Glycosylation Site AssignmentsUsing LC-FTICR. A total of 639 putative N-glycosylation siteswere identified from the LC-MS/MS analyses. Among thesesites, 225 were annotated in SWISS-PROT as known N-glyco-sylation sites, 300 were annotated as “probable” or “potential”
N-glycosylation sites, and 114 were unknown either becausethe sites were not annotated or because the correspondingproteins did not have a SWISS-PROT entry (Supporting Infor-mation Table 1). Twenty-six peptides had more than oneputative N-glycosylation site. Two peptides were identified with
Table 2. Selected Low-Abundance Proteins and Cytokines Identifieda
protein ID description abbreviation concentration (pg/mL)
IPI00004480 ADAM DEC1 ADAM-DecIPI00376784 ADAMTS-13 protein ADAMTSIPI00004957 angiopoietin-related protein 3 Angiopoietin-like 3IPI00289346 angiopoietin-related protein 5 Angiopoietin-like 5IPI00025852 angiotensin-converting enzyme, somatic
isoformACE 1.20 × 10⁵
IPI00032220 angiotensinogen Angiotensinogen 1.00 × 10³
IPI00005142 basic fibroblast growth factor receptor 1 FGFR-1IPI00003366 BDNF/NT-3 growth factors receptor TRKBIPI00015916 bone-derived growth factor BDGFIPI00024046 cadherin-13 CAD-13IPI00024035 cadherin-6 CAD-6IPI00009938 carcinoembryonic antigen-related cell
adhesion molecule 1CD66a 3.00 × 10⁵
IPI00011229 cathepsin D Cathepsin D 8.90 × 10³
IPI00012887 cathepsin L Cathepsin L 1.10 × 10³
IPI00289819 cation-independent mannose-6-phosphatereceptor
IGF2R
IPI00015102 CD166 antigen ALCAM 1.60 × 10⁴
IPI00024966 contactin 2 CNTN2IPI00292791 contactin 3 (plasmacytoma associated) CNTN3IPI00178854 contactin 4 CNTN4IPI00029751 contactin CNTN1IPI00029193 hepatocyte growth factor activator HGFA 4.00 × 10⁵
IPI00292218 hepatocyte growth factor-like protein HGFL 5.90 × 10⁴
IPI00018305 insulin-like growth factor binding protein 3 IGFBP-3 2.00 × 10⁴
IPI00328531 integrin alpha-1 Integrin alpha 1IPI00218628 integrin alpha-IIB Integrin alpha 2IPI00009465 integrin beta-1 Integrin beta 1 2.10 × 10⁶
IPI00291792 integrin beta-2 Integrin beta 2IPI00220350 integrin beta-3 Integrin beta 3 5.50 × 10⁶
IPI00027422 integrin beta-4 Integrin beta 4IPI00008494 intercellular adhesion molecule-1 ICAM-1 6.30 × 10⁴
IPI00009477 intercellular adhesion molecule-2 ICAM-2IPI00031620 intercellular adhesion molecule-3 ICAM-3 (CD50) 2.00 × 10⁵
IPI00000045 interleukin-1 receptor antagonist protein IL-1ra 2.36 × 10²
IPI00297124 interleukin-6 receptor beta chain IL6R 4.90 × 10⁴
IPI00009243 leptin receptor Leptin R 2.10 × 10⁴
IPI00218795 L-selectin L-SELECTIN 1.70 × 10⁴
IPI00011218 macrophage colony stimulating factor I receptor M-CSF R 2.60 × 10⁴
IPI00009521 macrophage receptor marco MARCOIPI00022296 mast/stem cell growth factor receptor CD117 4.80 × 10³
IPI00024825 megakaryocyte stimulating factor MSFIPI00004457 membrane copper amine oxidase VAP-1 1.20 × 10⁵
IPI00032292 metalloproteinase inhibitor 1 TIMP1 1.40 × 10⁴
IPI00029260 monocyte differentiation antigen CD14 CD14 1.90 × 10⁶
IPI00007244 myeloperoxidase Mpo 1.80 × 10⁵
IPI00299059 neural cell adhesion molecule NCAMIPI00009476 neural cell adhesion molecule 1,
120 kDa isoformNCAM1
IPI00027087 neural cell adhesion molecule L1 NCAMIPI00299594 neuropilin-1 NpnIPI00006114 pigment epithelium-derived factor PEDF 5.00 × 10⁶
IPI00013179 prostaglandin-H2 D-isomerase PGDSIPI00302641 protocadherin FAT 2 PCADIPI00029756 proto-oncogene tyrosine-protein kinase MER C-merIPI00288965 proto-oncogene tyrosine-protein kinase ROS RETIPI00017480 sonic hedgehog protein ShhIPI00021834 tissue factor pathway inhibitor TFPI-1 7.80 × 10⁴
IPI00022462 transferrin receptor protein 1 (CD71 antigen) TfR 5.80 × 10⁵
IPI00000075 transforming growth factor beta 1 TGF-beta 2.30 × 10³
IPI00018136 vascular cell adhesion protein 1 VCAM-1 9.40 × 10⁴
IPI00293565 vascular endothelial growth factor receptor 3 VEGF R3IPI00012792 vascular endothelial-cadherin VE-Cadherin 3.00 × 10⁴
a The plasma protein concentrations are approximate average values based on previous literature (31-44) and product literature from R&D Systems Quantikineimmunoassay Kits (www.rndsystems.com).
research articles Liu et al.
2076 Journal of Proteome Research • Vol. 4, No. 6, 2005
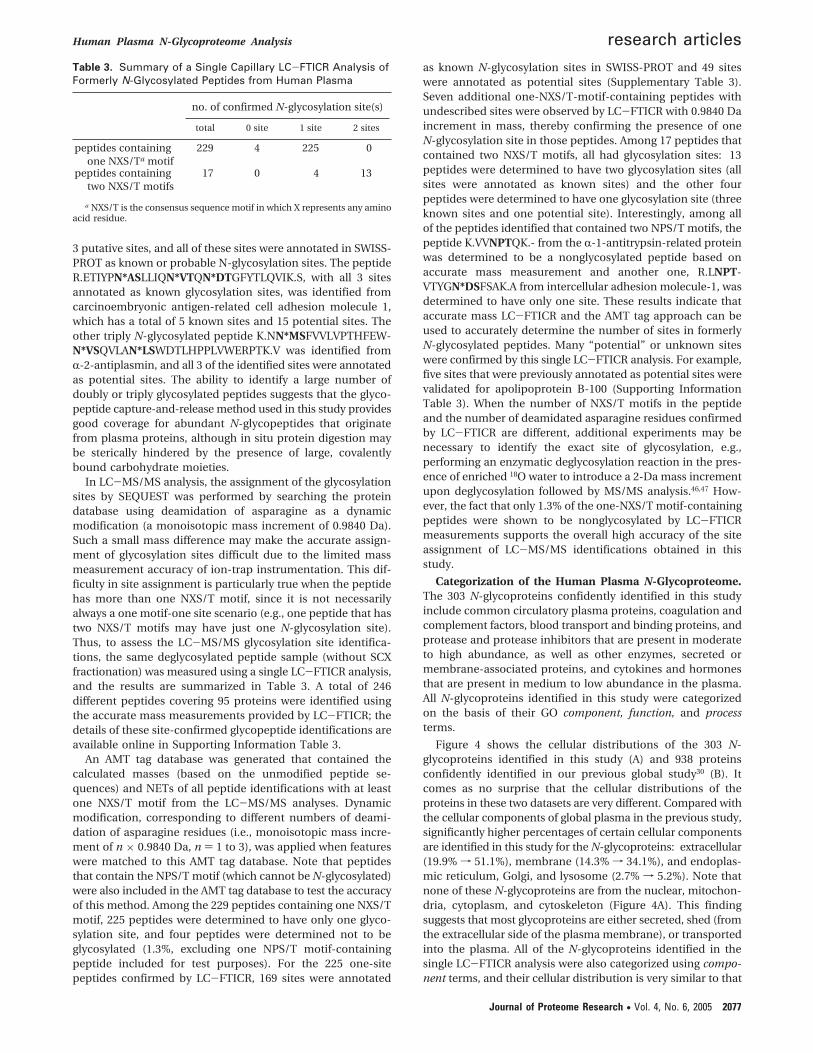
3 putative sites, and all of these sites were annotated in SWISS-PROT as known or probable N-glycosylation sites. The peptideR.ETIYPN*ASLLIQN*VTQN*DTGFYTLQVIK.S, with all 3 sitesannotated as known glycosylation sites, was identified fromcarcinoembryonic antigen-related cell adhesion molecule 1,which has a total of 5 known sites and 15 potential sites. Theother triply N-glycosylated peptide K.NN*MSFVVLVPTHFEW-N*VSQVLAN*LSWDTLHPPLVWERPTK.V was identified fromR-2-antiplasmin, and all 3 of the identified sites were annotatedas potential sites. The ability to identify a large number ofdoubly or triply glycosylated peptides suggests that the glyco-peptide capture-and-release method used in this study providesgood coverage for abundant N-glycopeptides that originatefrom plasma proteins, although in situ protein digestion maybe sterically hindered by the presence of large, covalentlybound carbohydrate moieties.
In LC-MS/MS analysis, the assignment of the glycosylationsites by SEQUEST was performed by searching the proteindatabase using deamidation of asparagine as a dynamicmodification (a monoisotopic mass increment of 0.9840 Da).Such a small mass difference may make the accurate assign-ment of glycosylation sites difficult due to the limited massmeasurement accuracy of ion-trap instrumentation. This dif-ficulty in site assignment is particularly true when the peptidehas more than one NXS/T motif, since it is not necessarilyalways a one motif-one site scenario (e.g., one peptide that hastwo NXS/T motifs may have just one N-glycosylation site).Thus, to assess the LC-MS/MS glycosylation site identifica-tions, the same deglycosylated peptide sample (without SCXfractionation) was measured using a single LC-FTICR analysis,and the results are summarized in Table 3. A total of 246different peptides covering 95 proteins were identified usingthe accurate mass measurements provided by LC-FTICR; thedetails of these site-confirmed glycopeptide identifications areavailable online in Supporting Information Table 3.
An AMT tag database was generated that contained thecalculated masses (based on the unmodified peptide se-quences) and NETs of all peptide identifications with at leastone NXS/T motif from the LC-MS/MS analyses. Dynamicmodification, corresponding to different numbers of deami-dation of asparagine residues (i.e., monoisotopic mass incre-ment of n × 0.9840 Da, n ) 1 to 3), was applied when featureswere matched to this AMT tag database. Note that peptidesthat contain the NPS/T motif (which cannot be N-glycosylated)were also included in the AMT tag database to test the accuracyof this method. Among the 229 peptides containing one NXS/Tmotif, 225 peptides were determined to have only one glyco-sylation site, and four peptides were determined not to beglycosylated (1.3%, excluding one NPS/T motif-containingpeptide included for test purposes). For the 225 one-sitepeptides confirmed by LC-FTICR, 169 sites were annotated
as known N-glycosylation sites in SWISS-PROT and 49 siteswere annotated as potential sites (Supplementary Table 3).Seven additional one-NXS/T-motif-containing peptides withundescribed sites were observed by LC-FTICR with 0.9840 Daincrement in mass, thereby confirming the presence of oneN-glycosylation site in those peptides. Among 17 peptides thatcontained two NXS/T motifs, all had glycosylation sites: 13peptides were determined to have two glycosylation sites (allsites were annotated as known sites) and the other fourpeptides were determined to have one glycosylation site (threeknown sites and one potential site). Interestingly, among allof the peptides identified that contained two NPS/T motifs, thepeptide K.VVNPTQK.- from the R-1-antitrypsin-related proteinwas determined to be a nonglycosylated peptide based onaccurate mass measurement and another one, R.LNPT-VTYGN*DSFSAK.A from intercellular adhesion molecule-1, wasdetermined to have only one site. These results indicate thataccurate mass LC-FTICR and the AMT tag approach can beused to accurately determine the number of sites in formerlyN-glycosylated peptides. Many “potential” or unknown siteswere confirmed by this single LC-FTICR analysis. For example,five sites that were previously annotated as potential sites werevalidated for apolipoprotein B-100 (Supporting InformationTable 3). When the number of NXS/T motifs in the peptideand the number of deamidated asparagine residues confirmedby LC-FTICR are different, additional experiments may benecessary to identify the exact site of glycosylation, e.g.,performing an enzymatic deglycosylation reaction in the pres-ence of enriched 18O water to introduce a 2-Da mass incrementupon deglycosylation followed by MS/MS analysis.46,47 How-ever, the fact that only 1.3% of the one-NXS/T motif-containingpeptides were shown to be nonglycosylated by LC-FTICRmeasurements supports the overall high accuracy of the siteassignment of LC-MS/MS identifications obtained in thisstudy.
Categorization of the Human Plasma N-Glycoproteome.The 303 N-glycoproteins confidently identified in this studyinclude common circulatory plasma proteins, coagulation andcomplement factors, blood transport and binding proteins, andprotease and protease inhibitors that are present in moderateto high abundance, as well as other enzymes, secreted ormembrane-associated proteins, and cytokines and hormonesthat are present in medium to low abundance in the plasma.All N-glycoproteins identified in this study were categorizedon the basis of their GO component, function, and processterms.
Figure 4 shows the cellular distributions of the 303 N-glycoproteins identified in this study (A) and 938 proteinsconfidently identified in our previous global study30 (B). Itcomes as no surprise that the cellular distributions of theproteins in these two datasets are very different. Compared withthe cellular components of global plasma in the previous study,significantly higher percentages of certain cellular componentsare identified in this study for the N-glycoproteins: extracellular(19.9% f 51.1%), membrane (14.3% f 34.1%), and endoplas-mic reticulum, Golgi, and lysosome (2.7% f 5.2%). Note thatnone of these N-glycoproteins are from the nuclear, mitochon-dria, cytoplasm, and cytoskeleton (Figure 4A). This findingsuggests that most glycoproteins are either secreted, shed (fromthe extracellular side of the plasma membrane), or transportedinto the plasma. All of the N-glycoproteins identified in thesingle LC-FTICR analysis were also categorized using compo-nent terms, and their cellular distribution is very similar to that
Table 3. Summary of a Single Capillary LC-FTICR Analysis ofFormerly N-Glycosylated Peptides from Human Plasma
no. of confirmed N-glycosylation site(s)
total 0 site 1 site 2 sites
peptides containingone NXS/Ta motif
229 4 225 0
peptides containingtwo NXS/T motifs
17 0 4 13
a NXS/T is the consensus sequence motif in which X represents any aminoacid residue.
Human Plasma N-Glycoproteome Analysis research articles
Journal of Proteome Research • Vol. 4, No. 6, 2005 2077

of the N-glycoproteins identified in the LC-MS/MS analysis(data not shown).
In the GO function categorization, a large portion of glyco-proteins possess binding activity (27.3%), while two othersignificant portions show receptor activity (11.8%) and trans-porter activity (9.2%). Protease and protease inhibitors arepresent at almost the same level (∼10%). Glycoproteins alsodisplay activities for a variety of enzymes, e.g., kinases andphosphatases (2.0%), transferases (2.0%), and other enzymes(9.5%). Noticeably, 14.1% of the glycoproteins have cytokineand hormone activities, 3.6% of them have structural moleculeactivity, and 0.7% of them have transcription factor activity(Integrin â-4 and Plexin B1). The N-glycoproteins identified inthis study also have been indicated to be involved in variousbiological processesscirculation (1.9%), coagulation and pro-teolysis (13.5%), immune and inflammatory responses anddefensive mechanisms (19.3%), development (9.9%), signaling(12.0%), transcription (1.2%), transport (8.7%), metabolism(12.0%), and cell adhesion, death, mobility and proliferation(21.5%)sthat reflect the major physiological functions of hu-man blood, including immunity, coagulation, inflammation,small molecule transport, and lipid metabolism.
Discussion
Application of multicomponent immunoaffinity subtractionand glycopeptide enrichment methods in combination with2-D LC-MS/MS analyses significantly adds to the number ofN-glycoproteins previously identified in human plasma. Usingthis approach to profile the human plasma N-glycoproteomeresulted in confident identification of 2053 different N-glyco-peptides, covering a total of 303 nonredundant proteins.Furthermore, the overall high accuracy of the LC-MS/MS
N-glycosylation site assignments was assessed by LC-FTICRaccurate mass measurements. An estimated dynamic range ofdetection >108 was achieved due largely to the greatly reducedprotein concentration range and sample complexity; a seriesof low-abundance proteins were identified having concentra-tions ranging from low µg/mL to pg/mL levels (Table 2). Thiswork provides a foundation for quantitative measurements ofthe human plasma proteome using either isotopic labeling or“label-free” MS-intensity measurements of the detected gly-copeptides using highly sensitive LC-FTICR and the AMT tagapproach. A major advantage of this quantitation strategy isthat once an AMT tag database is generated from these MS/MS identifications, a large number of plasma samples derivedfrom various disease states (e.g., clinical plasma samples) ortreatments can be analyzed in a high-throughput manner usingLC-MS, without the need for additional LC-MS/MS measure-ments.25
In addition to effective sample preparation and pre-fractionation techniques (e.g., immunoaffinity subtraction,protein/peptide separation by liquid chromatography, enrich-ment of subsets of peptides), sophisticated and sensitivedetection technologies (e.g., ion mobility spectrometry,48 LC-FTICR) are required to overcome the large protein concentra-tion range and sample complexity of human plasma. Inparticular, the use of high performance LC-FTICR togetherwith specific peptide enrichment techniques offers significantpotential for greatly accelerating the qualitative and quantitativecharacterization of the human plasma proteome, and moreimportantly, the analysis of plasma samples from clinicalstudies. In the case of N-glycosylation, it is still not possible todifferentiate between spontaneous deamidation and enzymaticdeglycosylation as the cause of asparagine to aspartic acidconversion by either LC-MS/MS or LC-FTICR. Additionalsample processing, e.g., the application of an enzymaticdeglycosylation reaction in the presence of enriched 18O water,can be used for the determination of the exact sites ofglycosylation, since a dynamic modification of asparagine witha 2-Da mass increment can be introduced upon deglycosyla-tion. On the other hand, the LC-FTICR measurements can beused to confidently determine the number of glycosylation sitesfor each peptide. In combination, these two techniques canbe used to identify glycosylation sites, as well as differentiatethe sites from the spontaneously deamidated asparagineresidues in the peptide.
Since the majority of diagnostic and clinical markers cur-rently used are glycosylated, the proteomic profiling of N-glycoproteins in human plasma offers significant potential forthe discovery of candidate disease biomarkers and therapeutictargets. In fact, a number of glycoproteins identified in thisstudy are known to be involved in disease processes or havepotential value as tissue-specific or disease-associated bio-markers. These glycoproteins include aminopeptidase N (CD13;is used as a marker for acute myeloid leukemia and plays arole in tumor invasion), attractin (involved in the initialimmune cell clustering during inflammatory response and mayregulate the chemotactic activity of chemokines), carcinoem-bryonic antigen-related cell adhesion molecule 1 (loss of orreduced expression is a major event in colorectal carcinogen-esis), cathepsin D (involved in the pathogenesis of severaldiseases such as breast cancer and possibly Alzheimer’sdisease), cathepsin L (can serve as a marker of bone resorptionand bone density), CD44 antigen (expressed by cells of epi-thelium and highly expressed by carcinomas, and plays an
Figure 4. Comparison of protein categorization using GO com-ponent terms. Major component categories are shown forN-glycoprotein identifications (A) and global protein identifica-tions (B).
research articles Liu et al.
2078 Journal of Proteome Research • Vol. 4, No. 6, 2005

important role in cell migration, tumor growth, and progres-sion), ficolin 3 (expressed in lung and is highly abundant inthe serum of patients with systemic lupus erythematosus),insulin-like growth factor binding protein 3 (associated withan increased risk of endometrial cancer), lysosome-associatedmembrane glycoprotein 1 and 2 (implicated in tumor cellmetastasis), mast/stem cell growth factor receptor (its defectis a cause of gastrointestinal stromal tumor), pregnancy zoneprotein (potential biomarker for ovarian cancer), and tenascinX (plays a role in supporting the growth of epithelial tumorsand associates with congenital adrenal hyperplasia).49 Quan-titation of the relative abundances for these specific glycopro-teins in plasma may provide insight into specific diseasemechanisms, as well as leads for candidate disease biomarkers.In addition to changes in relative abundances, altered glyco-sylation may also correlate with disease. For example, a recentstudy demonstrating elevations in the relative abundance ofGolgi Protein 73 (GP73) in the serum of patients diagnosed withhepatocellular carcinoma further suggests that examination ofthe glycosylation pattern may further increase the specificityof this marker.50 Targeted studies on the changes in glycanstructure may also be required in addition to quantitativeproteomic analyses to illustrate a specific disease mechanismin depth.
Acknowledgment. Portions of this research were sup-ported by the National Institute of General Medical Sciences(NIGMS, Large Scale Collaborative Research Grants U54 GM-62119-02) and the NIH National Center for Research Resources(RR18522). Work was performed in the Environmental Molec-ular Science Laboratory, a U. S. Department of Energy (DOE)national scientific user facility located on the campus of PacificNorthwest National Laboratory (PNNL) in Richland, Washing-ton. PNNL is a multiprogram national laboratory operated byBattelle Memorial Institute for the DOE under contract DE-AC05-76RLO-1830.
Supporting Information Available: The subcellularlocation and N-glycosylation information of these proteins, therepresentative nonredundant peptide sequences, the numbersof different peptide identifications spanning the same N-glycosylation site(s), and N-glycosylation sites (SupportingInformation Table 1), the peptide and protein identificationsof the MARS-bound proteins (Supporting Information Table2), and the details of these site-confirmed glycopeptide iden-tifications (Supporting Information Table 3) are availableonline. This material is available free of charge via the Internetat http://pubs.acs.org.
References
(1) Anderson, N. L.; Anderson, N. G. Mol. Cell. Proteomics 2002, 1,845-867.
(2) Diamandis, E. P. Mol. Cell. Proteomics 2004, 3, 367-378.(3) Hanash, S. Nature 2003, 422, 226-232.(4) Petricoin, E.; Wulfkuhle, J.; Espina, V.; Liotta, L. A. J. Proteome
Res. 2004, 3, 209-217.(5) Pieper, R.; Gatlin, C. L.; Makusky, A. J.; Russo, P. S.; Schatz, C. R.;
Miller, S. S.; Su, Q.; McGrath, A. M.; Estock, M. A.; Parmar, P. P.;Zhao, M.; Huang, S. T.; Zhou, J.; Wang, F.; Esquer-Blasco, R.;Anderson, N. L.; Taylor, J.; Steiner, S. Proteomics 2003, 3, 1345-1364.
(6) Pieper, R.; Su, Q.; Gatlin, C. L.; Huang, S. T.; Anderson, N. L.;Steiner, S. Proteomics 2003, 3, 422-32.
(7) Adkins, J. N.; Varnum, S. M.; Auberry, K. J.; Moore, R. J.; Angell,N. H.; Smith, R. D.; Springer, D. L.; Pounds, J. G. Mol. Cell.Proeomics 2002, 1, 947-955.
(8) Chromy, B. A.; Gonzales, A. D.; Perkins, J.; Choi, M. W.; Corzett,M. H.; Chang, B. C.; Corzett, C. H.; McCutchen-Maloney, S. L. J.Proteome Res. 2004, 3, 1120-1127.
(9) Shen, Y.; Jacobs, J. M.; Camp, D. G. 2nd; Fang, R.; Moore, R. J.;Smith, R. D.; Xiao, W.; Davis, R. W.; Tompkins, R. G. Anal. Chem.2004, 76, 1134-1144.
(10) Tirumalai, R. S.; Chan, K. C.; Prieto, D. A.; Issaq, H. J.; Conrads,T. P.; Veenstra, T. D. Mol. Cell. Proteomics 2003, 2, 1096-1103.
(11) Xiao, Z.; Conrads, T. P.; Lucas, D. A.; Janini, G. M.; Schaefer, C.F.; Buetow, K. H.; Issaq, H. J.; Veenstra, T. D. Electrophoresis 2004,25, 128-133.
(12) Heller, M.; Michel, P. E.; Morier, P.; Crettaz, D.; Wenz, C.; Tissot,J. D.; Reymond, F.; Rossier, J. S. Electrophoresis 2005, 26, 1174-1188.
(13) Liu, T.; Qian, W. J.; Strittmatter, E. F.; Camp, D. G., 2nd; Anderson,G. A.; Thrall, B. D.; Smith, R. D. Anal. Chem 2004, 76, 5345-5353.
(14) Liu, T.; Qian, W. J.; Chen, W. N.; Jacobs, J. M.; Moore, R. J.;Anderson, D. J.; Gritsenko, M. A.; Monroe, M. E.; Thrall, B. D.;Camp, D. G., 2nd; Smith, R. D. Proteomics 2005, 5, 1263-1273.
(15) Gygi, S. P.; Rist, B.; Gerber, S. A.; Turecek, F.; Gelb, M. H.;Aebersold, R. Nat. Biotechnol. 1999, 17, 994-999.
(16) Zhang, H.; Li, X. J.; Martin, D. B.; Aerbersold, R. Nat. Biotechnol.2003, 21, 660-666.
(17) Bunkenborg, J.; Pilch, B. J.; Podtelejnikov, A. V.; Wisniewski, J. R.Proteomics 2004, 4, 454-65.
(18) Roth, J. Chem. Rev. 2002, 102, 285-303.(19) Bause, E. Biochem. J. 1983, 209, 331-6.(20) Shen, Y.; Zhao, R.; Belov, M. E.; Conrads, T. P.; Anderson, G. A.;
Tang, K.; Pasa-Tolic, L.; Veenstra, T. D.; Lipton, M. S.; Smith, R.D. Anal. Chem. 2001, 73, 1766-1775.
(21) Eng, J. K.; McCormack, A. L.; Yates, J. R. 3rd J. Am. Soc. MassSpectrom. 1994, 5, 976-989.
(22) Qian, W. J.; Liu, T.; Monroe, M. E.; Strittmatter, E. F.; Jacobs, J.M.; Kangas, L. J.; Petritis, K.; Camp, D. G. 2nd; Smith, R. D. J.Proteome Res. 2005, 4, 53-62.
(23) Nesvizhskii, A. I.; Keller, A.; Kolker, E.; Aebersold, R. Anal. Chem.2003, 75, 4646-4658.
(24) Gorshkov, M. V.; Pasa-Tolic, L.; Udseth, H. R.; Anderson, G. A.;Huang, B. M.; Bruce, J. E.; Prior, D. C.; Hofstadler, S. A.; Tang, L.;Chen, L.; Willett, J. A.; Rockwood, A. L.; Sherman, M. S.; Smith,R. D. J. Am. Soc. Mass Spectrom. 1998, 9, 692-700.
(25) Smith, R. D.; Anderson, G. A.; Lipton, M. S.; Pasa-Tolic, L.; Shen,Y.; Conrads, T. P.; Veenstra, T. D.; Udseth, H. R. Proteomics 2002,2, 513-523.
(26) Lipton, M. S.; Pasa-Tolic, L.; Anderson, G. A.; Anderson, D. J.;Auberry, D. L.; Battista, J. R.; Daly, M. J.; Fredrickson, J.; Hixson,K. K.; Kostandarithes, H.; Masselon, C.; Markillie, L. M.; Moore,R. J.; Romine, M. F.; Shen, Y.; Stritmatter, E.; Tolic, N.; Udseth,H. R.; Venkateswaran, A.; Wong, K. K.; Zhao, R.; Smith, R. D. Proc.Natl. Acad. Sci. U.S.A. 2002, 99, 11049-11054.
(27) Petritis, K.; Kangas, L. J.; Ferguson, P. L.; Anderson, G. A.; Pasa-Tolic, L.; Lipton, M. S.; Auberry, K. J.; Strittmatter, E.; Shen, Y.;Zhao, R.; Smith, R. D. Anal. Chem. 2003, 75, 1039-1048.
(28) Zhang, H.; Yi, E. C.; Li, X. J.; Mallick, P.; Kelly-Spratt, K. S.;Masselon, C. D.; Camp, D. G. 2nd; Smith, R. D.; Kemp, C. J.;Aebersold, R. Mol. Cell. Proteomics 2005, 4, 144-155.
(29) Qian, W. J.; Jacobs, J. M.; Camp, D. G., 2nd; Monroe, M. E.; Moore,R. J.; Gritsenko, M. A.; Calvano, S. E.; Lowry, S. F.; Xiao, W.;Moldawer, L. L.; Davis, R. W.; Tompkins, R. G.; Smith, R. D.Proteomics 2005, 5, 572-584.
(30) Qian, W. J.; Monroe, M. E.; Liu, T.; Jacobs, J. M.; Anderson, G. A.;Shen, Y.; Moore, R. J.; Anderson, D. J.; Zhang, R.; Calvano, S. E.;Lowry, S. F.; Xiao, W.; Moldawer, L. L.; Davis, R. W.; Tompkins,R. G.; Camp, D. G., 2nd; Smith, R. D. Mol. Cell. Proteomics 2005,4, 700-709.
(31) Draberova, L.; Cerna, H.; Brodska, H.; Boubelik, M.; Watt, S. M.;Stanners, C. P.; Draber, P. Immunology 2000, 101, 279-287.
(32) Hara, I.; Miyake, H.; Yamanaka, K.; Hara, S.; Kamidono, S. Oncol.Rep. 2002, 9, 1379-1383.
(33) Lang, T. H.; Willinger, U.; Holzer, G. J. Lab Clin. Med. 2004, 144,163-166.
(34) Haab, B. B.; Geierstanger, B. H.; Michailidis, G.; Vitzthum, F.;Forrester, S.; Okon, R.; Saviranta, P.; Brinker, A.; Sorette, M.;Perlee, L.; Suresh, S.; Drwal, G.; Adkins, J. N.; Omenn, G.Proteomics 2005, In press.
(35) Shimomura, T.; Kondo, J.; Ochiai, M.; Naka, D.; Miyazawa, K.;Morimoto, Y.; Kitamura, N. J. Biol. Chem. 1993, 268, 22927-22932.
(36) Oh, J. C.; Wu, W.; Tortolero-Luna, G.; Broaddus, R.; Gershenson,D. M.; Burke, T. W.; Schmandt, R.; Lu, K. H. Cancer Epidemiol.Biomarkers Prev. 2004, 13, 748-752.
Human Plasma N-Glycoproteome Analysis research articles
Journal of Proteome Research • Vol. 4, No. 6, 2005 2079

(37) Yamauchi, M.; Mizuhara, Y.; Maezawa, Y.; Toda, G. Pathol. Res.Pract. 1994, 190, 984-992.
(38) Martin, S.; Rieckmann, P.; Melchers, I.; Wagner, R.; Bertrams, J.;Voskuyl, A. E.; Roep, B. O.; Zielasek, J.; Heidenthal, E.; Weich-selbraun, I. et al., J. Immunol. 1995, 154, 1951-1955.
(39) Rivera, M.; Talens-Visconti, R.; Sirera, R.; Bertomeu, V.; Salvador,A.; Cortes, R.; Garcia de Burgos, F.; Climent, V.; Paya, R.; Martinez-Dolz, L.; Sancho-Tello, M. J.; Gonzalez-Molina, A. Eur. J. HeartFail. 2004, 6, 877-882.
(40) Jarkovska, Z.; Rosicka, M.; Krsek, M.; Sulkova, S.; Haluzik, M.;Justova, V.; Lacinova, Z.; Marek, J. Physiol. Res. 2005, In press.
(41) Kamel, A. M.; El-Sharkawy, N. M.; Khalaf, M. R.; Galal, S. H.;Ghelab, F. M.; Ghazaly, T. J. Egypt Natl. Canc. Inst. 2002, 14, 243-249.
(42) Baldus, S.; Heeschen, C.; Meinertz, T.; Zeiher, A. M.; Eiserich, J.P.; Munzel, T.; Simoons, M. L.; Hamm, C. W.; Investigators, C.,Circulation 2003, 108, 1440-1445.
(43) Petersen, S. V.; Valnickova, Z.; Enghild, J. J., Biochem. J. 2003,374, 199-206.
(44) Liotta, L. A.; Ferrari, M.; Petricoin, E., Nature 2003, 425, 905.(45) Zolotarjova, N.; Martosella, J.; Nicol, G.; Bailey, J.; Boyes, B. E.;
Barrett, W. C. Proteomics 2005, 5, 3304-3313.(46) Kuster, B.; Mann, M. Anal. Chem. 1999, 71, 1431-1440.(47) Kaji, H.; Saito, H.; Yamauchi, Y.; Shinkawa, T.; Taoka, M.;
Hirabayashi, J.; Kasai, K.; Takahashi, N.; Isobe, T. Nat. Biotechnol.2003, 21, 667-672.
(48) Shvartsburg, A. A.; Tang, K.; Smith, R. D. Anal. Chem. 2004, 76,7366-7374.
(49) http://us.expasy.org/sprot.(50) Block, T. M.; Comunale, M. A.; Lowman, M.; Steel, L. F.; Romano,
P. R.; Fimmel, C.; Tennant, B. C.; London, W. T.; Evans, A. A.;Blumberg, B. S.; Dwek, R. A.; Mattu, T. S.; Mehta, A. S., Proc. Natl.Acad. Sci. U.S.A. 2005, 102, 779-784.
PR0502065
research articles Liu et al.
2080 Journal of Proteome Research • Vol. 4, No. 6, 2005