Capital Accumulation and Growth in Central Europe, 1920-2006
Upload
independentCategory
view
0download
0
econstor www.econstor.eu
Der Open-Access-Publikationsserver der ZBW – Leibniz-Informationszentrum WirtschaftThe Open Access Publication Server of the ZBW – Leibniz Information Centre for Economics
Nutzungsbedingungen:Die ZBW räumt Ihnen als Nutzerin/Nutzer das unentgeltliche,räumlich unbeschränkte und zeitlich auf die Dauer des Schutzrechtsbeschränkte einfache Recht ein, das ausgewählte Werk im Rahmender unter→ http://www.econstor.eu/dspace/Nutzungsbedingungennachzulesenden vollständigen Nutzungsbedingungen zuvervielfältigen, mit denen die Nutzerin/der Nutzer sich durch dieerste Nutzung einverstanden erklärt.
Terms of use:The ZBW grants you, the user, the non-exclusive right to usethe selected work free of charge, territorially unrestricted andwithin the time limit of the term of the property rights accordingto the terms specified at→ http://www.econstor.eu/dspace/NutzungsbedingungenBy the first use of the selected work the user agrees anddeclares to comply with these terms of use.
zbw Leibniz-Informationszentrum WirtschaftLeibniz Information Centre for Economics
Pfeiffer, Friedhelm; Reuß, Karsten
Working Paper
Human capital investment strategies in Europe
ZEW Discussion Papers, No. 11-033
Provided in Cooperation with:ZEW - Zentrum für Europäische Wirtschaftsforschung / Center forEuropean Economic Research
Suggested Citation: Pfeiffer, Friedhelm; Reuß, Karsten (2011) : Human capital investmentstrategies in Europe, ZEW Discussion Papers, No. 11-033, http://nbn-resolving.de/urn:nbn:de:bsz:180-madoc-31840
This Version is available at:http://hdl.handle.net/10419/45644

Dis cus si on Paper No. 11-033
Human Capital Investment Strategies in Europe
Friedhelm Pfeiffer and Karsten Reuß

Dis cus si on Paper No. 11-033
Human Capital Investment Strategies in Europe
Friedhelm Pfeiffer and Karsten Reuß
Die Dis cus si on Pape rs die nen einer mög lichst schnel len Ver brei tung von neue ren For schungs arbei ten des ZEW. Die Bei trä ge lie gen in allei ni ger Ver ant wor tung
der Auto ren und stel len nicht not wen di ger wei se die Mei nung des ZEW dar.
Dis cus si on Papers are inten ded to make results of ZEW research prompt ly avai la ble to other eco no mists in order to encou ra ge dis cus si on and sug gesti ons for revi si ons. The aut hors are sole ly
respon si ble for the con tents which do not neces sa ri ly repre sent the opi ni on of the ZEW.
Download this ZEW Discussion Paper from our ftp server:
ftp://ftp.zew.de/pub/zew-docs/dp/dp11033.pdf

Das Wichtigste in Kürze
Die Erweiterung und Vertiefung der Europäischen Union schafft neue
Möglichkeiten auch für die Bildungspolitik. Aufgrund der höheren Mobilität nimmt
die Verschränkung von Bildungssystemen und regionalen Arbeitsmärkten zu. Die
Bildungspolitik blickt damit neben den Bildungsinvestitionen und Ergebnisse
innerhalb eines Landes zunehmend auf die Bildungsprozesse in Europa insgesamt.
Dennoch gibt es bislang erst wenige Analysen zu optimalen Investitionsstrategien in
die Humankapitalbildung in Europa, die den ganzen Lebenszyklus umfassen. Die
vorliegende Studie möchte diese Forschungslücke schließen und zum Verständnis
alternativer Investitionsstrategien und ihrer Konsequenzen für die Entwicklung des
Humankapitals in Europa beitragen. Es werden die Wohlfahrtskonsequenzen von
Strategien untersucht, die entweder auf unterschiedliche Altersgruppen, auf
spezifische Bildungsgruppen oder Länder fokussieren.
Als theoretische Grundlage dient ein Modell der Humankapitalbildung, das durch
abnehmende Grenzerträge von Bildungsinvestitionen in einer Periode gekenn-
zeichnet ist, und das dem kumulativen und synergetischen Prozess der Bildung von
Fähigkeiten im Lebenszyklus Rechnung trägt. Die Parameter, die den Aufbau des
Humankapitals sowie die Entwicklung der individuellen Einkommen im Lebens-
zyklus und deren Verteilung steuern, werden für 29 Länder Europas mit Hilfe der
PISA Daten sowie offiziell verfügbarer Statistiken zur Bevölkerung, Alters-
verteilung, Bildungsausgaben, Lebensdauer und Pro-Kopf Einkommen ermittelt.
Humankapitalentwicklung, Einkommen und Lebenserwartung hängen maßgeblich
von den Humankapitalinvestitionen in der Kindheit ab, die aus dem familiären und
schulischen Umfeld resultieren. Im Erwachsenenalter entscheiden die Individuen
über die optimale Höhe ihrer Bildungsinvestitionen.
Die Ergebnisse der unterschiedlichen Bildungsinvestitionsstrategien werden mit
einer Wohlfahrtsfunktion bewertet, in der neben dem Ziel der Effizienz das Ziel der
Gleichheit unterschiedlich gewichtet werden kann. Beispielsweise hat in
skandinavischen im Vergleich zu angelsächsischen Ländern das Ziel der Gleichheit
ein höheres Gewicht. Die Bewertung bezieht jeweils die Humankapitalbildung im
gesamten Lebenszyklus ein, und nicht nur die Ergebnisse von spezifischen
Bildungsstufen, wie etwa der Hochschul- oder Vorschulbildung.
Als Ergebnis zeigt sich unter anderem, dass mehr Bildungsinvestitionen in die
Förderung benachteiligter Kinder bereits in der Vorschulzeit getätigt werden sollten,
wenn das Gleichheitsziel im Vordergrund steht. Auch wenn das Effizienzziel
Priorität hat, verbessern zusätzliche Investitionen in der frühen Lebensphase für alle
Kinder die gesellschaftliche Wohlfahrt. Falls sowohl die Kosten der Ausbildung wie
auch die Bildungsertragsfunktion einheitlich in Europa sind, werden Politiken zur
Verringerung der Ungleichheit von Bildungsinvestitionen effektiver.

Nontechnical Summary
Improving the education of youth is one of the most prominent policy goals in
Europe. While most economists would agree with the aim, the optimal timing and
the optimal quantity of educational investments are in question.
This paper analyses alternative investment policies and their consequences for the
evolution of human capital in Europe based on a model of age dependent skill
formation where the life span depends on investments during childhood. A model is
calibrated for a population living in 29 European countries in the year 2006. In the
study Europe is either the sum of these individual countries or it is a hypothetical
entity constructed from the 29 European countries.
What makes the approach special is the analysis of the returns to education of
alternative educational policies targeted at certain countries, ages or productivity
levels for two counterfactual policy regimes, one regime assuming a single labour
market and the other presupposing the actual state of diversity. In the model,
investments for young individuals under the age of eighteen years are traced back to
the family and teaching environment. In adulthood individuals optimize the amount
of educational investments, given the overall amount of investments in the society.
We analyse the consequences of each investment policy for human capital formation
over the whole life cycle and do not focus on specific developmental stages like
preschool or tertiary education.
The results demonstrate that optimal investment strategies, whether they are oriented
towards age, regions or skill levels, crucially depend on the weights a society puts
on equality. If equality is important enough more investment in Europe are needed
for disadvantaged children during childhood. If the aim of equality is less important,
additional investments need to be directed more generally to people of younger ages.
Furthermore, it turns out that high levels of income inequality and a high skill level
increases the optimal amount of investments, especially during younger adulthood.
In the case where educational costs and skill premia are modelled as homogeneous
in Europa the effectiveness of policies to reduce inequality would be higher.
The findings result from the idea of age depended skill formation with decreasing
learning multiplier over time and decreasing marginal returns to investment in the
skill production function. Further research is needed first for empirically assessing
the skill multiplier from childhood in the different European countries with
improved data. Second, additional research is needed to investigate the welfare
consequences of public and private investment processes and alternative
assumptions about their interdependencies.
Human capital investment strategies in Europe Friedhelm Pfeiffer** and Karsten Reuß*
*ZEW Mannheim
** ZEW Mannheim, University of Mannheim
May 10th
, 2011, comments welcome
Abstract:
The paper analyses alternative investment policies and their consequences for the
evolution of human capital in Europe based on a model of age dependent skill
formation where the life span depends on investments during childhood. What
makes the approach special is the analysis of the returns to education of alternative
educational policies targeted at certain ages, countries, or productivity levels for two
counterfactual policy regimes, one regime assuming the actual state of diversity and
the other a unified Europe. Our results indicate that investments need to be directed
more generally to people of younger ages in Europe. If equality is important enough
additional investment should specifically be directed to disadvantaged individuals
during childhood. Furthermore, high levels of life cycle income inequality and a
high skill level increase the optimal amount of investments during younger
adulthood. In a unified Europe, the effectiveness of policies to reduce inequality
would be higher.
Keywords:
Human capital investment, life cycle skill formation, welfare function, Europe.
JEL-classification: D87, I12, I21, J13
Acknowledgements: We gratefully acknowledge support from the Leibniz Association, Bonn, through the grant “Non-
cognitive Skills: Acquisition and Economic Consequences”. We thank Dominik Wellhäuser for
careful reading and many valuable comments.
Addresses: Friedhelm Pfeiffer, Centre for European Economic Research (ZEW), P.O. Box 103443,
D-68034 Mannheim. Tel.: +49-621-1235-150, E-mail: [email protected].
Karsten Reuß, Centre for European Economic Research (ZEW), P.O. Box 103443,
D-68034 Mannheim. Tel.: +49-621-1235-287, E-mail: [email protected].
1
1. Introduction Economists study the formation of human capital over the life cycle and its welfare
consequences. Teaching is regarded as the major channel for fostering skills and
human capital. According to political rhetoric educational policies overcome market
failure in reaching the optimal amount of investment and in addition equalize
educational opportunities. The European Commission (2010), for instance,
postulates that improving the education of youth is one of the most prominent policy
goals in Europe.
While most economists would agree with the aim, the optimal timing and the
optimal quantity of educational investments are in question. Since deep-seated skills
are created early in the human developmental process (Amor 2003, Blomeyer et al.
2009, 2010, Heckhausen and Heckhausen 2008, Heckman 2007, among others) the
priorities in public educational spending are under scrutiny. The formation of
cognitive skills, such as intelligence, memory power and reasoning, and self-
regulatory skills, such as motivation, delay of gratification and persistence, begins in
early childhood, influenced by parent-child interaction. The level of these skills is
decisive for becoming a productive member of society and for economic
performance as well (see Cunha and Heckman 2007, 2009, Hanushek and
Wössmann 2008, among others).
There exists a bunch of public educational programmes covering preschool, primary
and secondary education in all European countries. Furthermore, governments in
modern European societies are engaged in post-secondary education as well as
training and try to promote lifelong learning (OECD 2010, among others). While
each of these educational programmes receives a great deal of attention in research1,
a comprehensive empirical assessment of the patterns of investment into human
capital during the life-cycle and its welfare implications under different educational
regimes in Europe is still not available2, mainly for three reasons.
First, counterfactual evidence of alternative human capital investments over the life
cycle is scarce due to a lack of longitudinal studies ranging from the cradle to the
grave (see Cunha et al. 2006, among others). Second, policies aiming at fostering
human capital during childhood will reach part of their expected economic impacts
only in the following twenty to forty years (see Pfeiffer and Reuß 2008, among
others). This period is beyond political foresight and children, as a rule have no
voting power. Third, European countries are responsible for educational and labour
1 For instance, policy reforms in secondary or postsecondary education have been studied by Bergh and Fink (2009),
Hunter et al. (2009), Johnson and Turner (2009), Lerner et al. (2008) and Wössmann (2008), among others. 2 Heckman and Jacobs (2009) investigate human capital formation from the viewpoint of skill bias and greater
turbulence in labour markets in Europe. Pfeiffer and Reuß (2008) examine returns to education when skill formation is
age dependent. Their empirical part focuses on Germany.

2
market policies. These policies differ widely in Europe (see Borgloh et al. 2011,
among others) and coordination will take time.
Our contribution to the burgeoning literature on life-span human capital formation is
threefold. We examine welfare implications of alternative educational policies to
foster human capital based on a version of our model of life cycle skill formation
(Pfeiffer and Reuß 2008). We extend this model with respect to several aspects. Life
span now depends on the stream of investments in childhood as is suggested by
research from Friters et al. (2010), among others. Parameters that determined
income inequality and economic productivity can now be independently varied in
the human capital production function. A welfare function assesses the alternative
educational policies with different weights put on equality. For instance equality is
more important in Scandinavian countries, compared to countries within Europe.
The model is calibrated for a population living in 29 European countries in the year
2006.
Another innovative feature of our analysis is the examination of welfare
implications of various educational policies for a counterfactual policy regime. One
policy regime represents the actual status of labour market diversity the other
assumes the hypothetical state of a single labour market in Europe. We analyse
alternative educational investment strategies aligned to specific regions, ages and
productivity levels for each of these two policy regimes.
The study demonstrates that additional investment should be shifted to the young
population with low investments and low productivity if equality within the society
is important in the welfare function. If the aim of equality is less important,
additional investments need to be directed more generally to people of younger ages.
The welfare effects of educational investments are higher in a single labour market if
equality is more important.
The paper is structured as follows. Section two introduces the relevant data and the
considered European countries. Section three discusses the model of skill and human
capital formation and section four the calibration of the functions with the data.
Section five highlights the welfare implications of alternative educational
investment strategies. Section six concludes.
2. Data sources and descriptive findings
In what follows Europe consists either of the following 29 countries: Austria,
Belgium, Bulgaria, Croatia, Czech Republic, Denmark, Estonia, Finland, France,
Germany, Greece, Hungary, Iceland, Ireland, Italy, Latvia, Lithuania, Luxembourg,
Netherlands, Norway, Poland, Portugal, Romania, Slovak Republic, Slovenia, Spain,
Sweden, Switzerland and United Kingdom. Alternatively, Europe is a hypothetical

3
entity constructed from these 29 European countries. Since currently there is no
political entity for these 29 countries and aggregate official statistics are not
available, these have been created from different sources. The 29 European countries
have been selected such that data on educational outcomes and investment costs,
demographics, GDP and the inequality of income are available.3 4
Table 1 displays the population size, age structure (below 18, above 65 years old),
educational expenditures as well as the GDP and income inequality for the
hypothetical Europe as well as the mean, minimum and maximum values for the 29
individual countries. The countries differ significantly in many of the examined
characteristics. For instance, the number of inhabitants varies between 300 000 in
Iceland and 82.4 million in Germany. Overall 508.7 million people live in Europe.
In most European countries the middle-aged group is the largest one. The fraction of
inhabitants below the age of 18 varies between 16.1% (Italy) and 24.9% (Iceland).
In Scandinavian countries and France the fraction is above 20%, whereas in
Germany and Spain, among others, it is less than 17%. This divergent age patterns
have implications for educational policies.
Table 1: Population size, age distribution, educational expenditures, GPD/capita and
income inequality for Europe and the 29 European countries
Population fraction
below 18
fraction
above 65
Public b)
educational
expenditures
GDP/
capita b)
Quintile
Income
Ratio
Europe 508 678 000 18.5% 17.6% 5 631 € 22 329 € 6.05
Mean a)
17 540 620 19.0% 16.6% 5 769 € 23 168 € 4.67
Min. a)
299 891 16.1% 11.9% 1 453 € 8 307 € 3.40
Max. a)
82 437 995 24.9% 20.8% 12 168 € 62 268 € 7.90
Source: OECD.stat (2009), own calculations, see text. a)
These row shows the respective mean,
standard deviation, minimum and maximum values from the 29 countries. b)
Euro, real values
2006.
GDP per capita varies from 8 307 € (Croatia) to 62 268 € in Luxembourg, showing
significant disparities in Europe. European countries have around 18 million
inhabitants on average and the hypothetical European has an average GDP per capita
of 22 329 €. Inequality is measured with the ratio of overall income of the 20
percent of population with the highest income (highest quintile) to the overall
3 GDP per capita is calculated for Euro 2006 values using PPP from OECD.stat (2009). The overall population sizes,
the age structure and measures of income inequality have been taken from Eurostat (2010). 4 Turkey has not been included, although data are available. Turkey has been excluded from the study, because most
of the territory of Turkey belongs to Asia. Since Turkey has a comparatively young and large population, the inclusion
of Turkey would have made a difference.

4
income of the 20 percent of the population with the lowest income (lowest quintile),
taken from Eurostat (2009). Income inequality varies from 3.4 (Denmark) to 7.9
(Latvia). In the hypothetical Europe inequality is as high as 6, much higher than the
simple average of the inequality measurers suggest. Therefore, inequality in the
hypothetical Europe is higher, for instance, than in the US. With respect to average
GDP per capita and inequality the hypothetical Europe is more similar to Greece
than to France, Germany or Sweden, for instance.
These observations would have implications if a unification of educational policy
took place. For instance, educational expenditures presumably would change in case
of a majority rule. Currently annual public educational expenditures (taken from
OECD 2010) differ widely, between 1 453 € per student in Romania and Denmark,
Norway or Luxembourg where expenditures exceed 10 000 € per student.
The measure of educational performance has been taken from PISA scores 2006
(OECD 2006) averaged for math, science and reading and in each of the 29
countries. Table 2 compares the resulting average PISA scores for Europe and
summarizes the mean, and the minimum and maximum values for the 29 European
countries.
Table 2: The distribution of PISA scores for Europe
and the sample of 29 European countries
Percentile 5 10 25 50 75 90 95
Europe 332.7 367.4 426.7 490.7 557.9 607.5 634.9
Mean a)
343.2 375.7 431.2 490.9 553.5 600.8 626.4
Min. a)
263.2 290.9 344.5 407.6 462.3 511.6 538.4
Max. a)
425.5 454.6 504 556.5 606.6 645.9 669.9
Source: Own calculations, see text. a)
These rows show the respective mean, standard deviation,
minimum and maximum values for 29 countries.
The inequality in educational performance in Europe is higher than the country
specific inequality. On average educational performance is high in Finland (556.5)
and the Netherlands (521) and low in Romania (407.6) and Bulgaria (417). As a
rule, the inequality of educational performance is inversely related to the average
PISA score. For instance, the 90-10 PISA ratio is 2 in Romania compared to 1.5 in
Finland. There is a wide variety of educational expenditures per PISA score. For
instance Norway investment is about 25 €, while it is only 5 € in Croatia.

5
3. Skill and human capital formation over the life cycle
The model of human capital formation consists of six equations, introduced in this
section. Equation one and two govern skill development, equation three the
formation of human capital formation from the age of zero to 18. Equation four
governs the transformation of human capital into income, while equation five deals
with the optimal investment into human capital from age 18 to 65. Equation 6
contains the welfare function of the society.
There are two skills and two equations for skill formation, one for cognitive skills, C
tS , and one for non-cognitive or self-regulatory skills, N
tS (see equation 1, 2). These
two difference equations specify skill formation and depreciation on an annual basis
over the life span with individual n, living in country j. It is assumed that returns to
education depend on age. Investment later in life is not able to enhance the skill
level as much as in early childhood, even though the higher skill level may
complement investment. In order to reflect age-dependent processes, two learning
multipliers are added determining the person’s learning aptitude, one for cognitive, C
tl , and one for self-regulatory skills, N
tl , respectively (introduced in Pfeiffer and
Reuß 2008). The learning multipliers depend on age in a way that is regarded to be
consistent with neurobiological and psychological findings from the child
development literature cited in the introduction (see Cunha and Heckman 2007, and
Heckman 2007, among others).
1
, , 1, , 1, , , , 1 1, ,
1 1 1(1 )
3 3 3
k k k j k k
t n j t t n j t n j t n j t t n jS l S S I S
(1, 2)
with 1
1
( 1 )t
as le t
, k=C,N and j=C if k=N, j=N if k=C and , , 0k
t i jS .
The first term of equations (1, 2) represents skill formation with a CES production
function. Next period skills are produced by both types of skills and investment. The
parameter determines the degree of complementarity among skills and investment
and can vary from 1 (complete substitutes) to (complete complements). For
0 the production function is of the Cobb Douglas type. The second part of
equations (1, 2) introduces skill losses. Depreciation of skills is modest in childhood
and accelerates with increasing age, assuming a life span of le years. The life span
depends on the amount of investment (the family environment) during childhood. as
is a parameter introduced to govern the dynamics of deprecation. If as is larger than
1, skill depreciation accelerates towards the end of the life span. In the last period,
the individual loses all skills (and dies). For the analyses a value as=5.85 is used. In
that case, equations (1, 2) imply self-productivity ( 2 1/ 0k kS S ; this is true for 1as )
and direct complementarity ( 2
1/ 0k k j
t t tS I S ) resulting from the CES production

6
function as long as 1 (Cunha and Heckman 2007). A detailed discussion of the
production function is given in Pfeiffer and Reuss (2008).
In the following sections two variants of the model (scenario 1 and 2) are studied.
The formation of human capital in a given year is modelled as a function of
cognitive and self-regulatory skills taking into account that human capital may
accumulate or depreciate, for example, due to technological progress. Hence
, , , , , , 1 1, ,(1 )C N H
t n j A t n j t n j t t n jH S S H , (3)
where C
tS and N
tS are defined in equations (1, 2). Human capital depreciates
according to H
t H t , where H is a parameter that may vary among individuals,
jobs, industries or over time. A high value of H induces an early human capital
maximum (e.g., in sports); a smallH , a later maximum (as, for example, in science).
It is assumed that this basic structure explains human capital formation in all
European countries.
However, the countries differ in their skill premium and their distribution of income
relative to the skill heterogeneity due to differences in the functioning of labour
market and considerations about equity, among others. In one country an individual
with a certain human capital level will therefore earn less than he or she would earn
in another country. Besides that in some countries human capital heterogeneity is
small relative to the income heterogeneity, whereas in other countries it is rather
large. In the model, individual income results from the individual human capital and
the cumulated income of the country as follows:
, ,
*
, , , , , ,
1, ,
1
(1 )
j
j
jj
t n j
Njk
t n j j t n j t n jN
nt n j
n j
H
HY I H
H
H
(4)
with jN being the population of each country j. Two parameters are employed to
model income patterns: j reflects the transformation of human capital into income.
E.g. if 1j , one unit of human capital in the country will earn one Euro. Hence the
sum of human capital in a country will always be the same sum in Euros. For
another example, if 2j , one unit of the human capital will earn two Euros.
Individual income depends on the parameter j . The right hand side of equation (4)
includes the ratio individual to average human capital. For the average individual n,
the terms equal one for any j . For individuals whose human capital differs from the

7
mean, j will either lead to an income above or below the average resulting from the
stock of human capital. If 0j , all individuals in one country will earn the same
amount of money irrespective of their particular skill levels. If 1j , individuals
will earn exactly their level of human capital times j . As lim j , the person
with the highest level of human capital will earn all the income generated in a
country.
Until the age of 18, the investments 1...18, ,
k
i jI are assumed to depend on family
background and teaching. Investments are assumed to vary in such a way that it
explains student performance. The calibration of the parameters is discussed in
section 4. After the age of 18 years individuals are assumed to choose the amount of
investment that maximises their expected lifetime income. They can either invest *
, ,
k
t n jI units into their skills (see equation 5) or earn an income at the labour market
with the available level of human capital. If the available time is invested in
education, no income can be earned. Individuals are assumed to maximize the
following function (5):
* * * *65
, , 1, 2,... 1, 2,... , , , ,*
, , 18
18
* 0.5 *, (arg max
(1 )
( ) )C N C N
t n j t t t t t n j t n jk
t n j t
t
jY CI I I II
r
, (5)
where r=0.02 denotes a discount factor of 2 per cent and parameter Cj represents the
cost of one unit of education for country j. After the age of 65 all investments will be
zero because income cannot be earned anymore after that age. As the number of
people living in each country (Nj) is large and the individual impact is only
marginal, it is assumed that individuals cannot influence the average human capital
level of their country ( jH ) or the sum of human capital in their country (, ,
1
jN
t n j
n
H
).
Under that assumption equation (5) is solved and the individual amount of
investment has been calculated.
To assess alternative educational policies, the following welfare function is used for
our population (Sen et al. 1997):
1
( ) (1 ( ))N
n
i
W Y A Y y
, with (6)
1
1
1
1
1
1( ) 1
Nn
Jn
j
j
yA Y
N
.

8
Aε denotes the Atkinson index (Atkinson 1970), which illustrates the trade-off
between efficiency and equality in educational policy. The index is a discrete
measure of inequality for an income distribution of a population with N European
citizens. The equation 65
18
i t t
t
y r Y
represents the discounted individual income
accumulated over the working life, factor denotes the average human capital of the
population and is a parameter for different degrees of equity preferences in the
society. Assuming 0 , a society does not care about equity at all. For , the
index depends only on the welfare of the poorest individual within the society. The
Atkinson Index is normalized between 0 and 1. If ( ) 0A Y , no inequality is
measured in the distribution, while inequality is at its maximum if ( ) 1A Y .
The society is assumed to maximize function (6) for the life-cycle welfare of the
European population. Educational policies are restricted by scarcity exogenously. In
the case of 0 the society will only maximize the sum of income without
considering inequality. On the other hand, if lim , only the income of the
poorest person in the society is relevant for governing educational policies. In social
reality equity considerations may vary between 0.5 1.5 (Atkinson 1970).
4. Calibration of model parameters
To investigate educational policies in Europe, several model parameters have to be
calibrated with existing data. In order to test the sensitivity of the analysis and to
take policy regimes properly into account, some parameters have been calibrated for
two different cases. In the first one, Europe consists of heterogeneous labour
markets and educational costs, in the second one, a homogeneous labour market and
homogenous educational costs are presumed. In a first step, the PISA-scores for all
individuals i younger than 18 years in each country j have been obtained by a cubic
spline interpolation (De Boor 1978). The PISA-score at age 15 ( 15P ) is assumed to
result from cognitive and self-regulatory skills:
C N
15,i, j P 15,i, j 15,i, jP S S . (7)
Equation (7) explains the potential performance of an individual in performing a
task as a function of her cognitive and self-regulatory skills at the age of 15 years.
Both skills are necessary to complete the task successfully and may interact in
complex ways. A person with a high (low) level of cognitive skills could produce
low (high) results if her motivation is low (high). Performance is modelled by means
of a Cobb Douglas function with equal weights for cognitive and self-regulatory
skills, since the literature provides evidence for both skills to be equally important
(Duckworth and Seligman 2005, Heckman 2007, among others). The factor A is an
adjustment factor for different normalizations of performance scores and their
respective distributions. The model is calibrated to reach the PISA 2006 test score

9
distributions for 29 European countries for a population of 100,000 representative
young Europeans.
Investment levels 0...18, ,
k
i jI are calculated in a way that in each country the PISA
distribution is generated by equation (7). Table 3 shows resulting values for 0 5.
They differ from 0.16 to 2.06 demonstrating the inequality of investments which
stems from the inequalities in the family and teaching environment.
After period 18 investments are assumed to result from equation (5) and the
heterogeneity of income for the same amount of skills from heterogeneous national
labour markets. Based on the investments in young age, the parameter j is
calibrated such that all working individuals between the age of 18 and 65 years
annually produce the GDP of the country (the sum of incomes in each country is
equal to the total GDP). The GDP per capita results from the division of a country’s
GDP by the number of inhabitants. The parameter j is calibrated to match the
observed income inequality in Europe (see table 1).
Table 3: Simulated educational investments 0...18, ,
k
i jI across the percentiles
Percentile 5 10 25 50 75 90 95
0 Europe 0.16 0.27 0.51 1 1.37 1.8 2.06
mean 0.2 0.3 0.54 0.98 1.33 1.73 1.97
Std 0.09 0.11 0.15 0.18 0.24 0.25 0.25
Min 0.03 0.07 0.19 0.5 0.71 1.03 1.22
Max 0.51 0.67 0.97 1.39 1.79 2.17 2.41
Table 4 displays the calibrated parameters6. j indicate how much larger income in a
country is compared to its human capital, j shows how much larger income
inequality is compared to human capital inequality. The factor j is large in high
income countries like Luxembourg (9.77), Norway and Ireland, which have average
levels of investments ( 0...18I being close to 1). The value for j is low in Poland
(1.33), Croatia and Romania.
Croatia’s human capital is only slightly below the average but the GDP per capita is
much lower. Romania, on the other hand, has a low level of human capital leading to
a low income. j is high in countries with low human capital inequalities and high
5 For a more detailed compare Pfeiffer and Reuß (2008).
6 Note that values do not vary much between simulations for different values of . Hence, only the standard case
0 is documented in Table 4.

10
income inequality, which holds in particular for the Baltic countries (e.g., Latvia has
the maximum value of 3.63). j is small in countries with high human capital
inequalities and low income inequality, for instance in Bulgaria ( 1.42j ).
Table 4: Calibrated values of labour market parameters
for heterogeneous European countries
Country j j Europe 3.51 2.71
mean 3.49 2.41
min 1.33 1.42
max 9.77 3.63
If a single European labour market is assumed, there is only one and one for all
countries. The European GDP per capita is 22,367.43 € and the European Quintile
Ratio is 6. This results in 3.51 and 2.71 . The average value of is relatively
high for a homogenous labour market in Europe compared to the average value in
the case of a heterogeneous labour market ( j =2.41). Thus, if Europe is assumed to
have a homogenous labour market, higher inequality may result.
Life span depends on investments. The underlying empirical relationship results
from the following regression for the 29 countries:
log( ) log( / )0 1
le GDP capita (8)
The total population size is used as a weight. The estimated value of 1 is 0.07 and is
significant at the 99% level, uncovering a strong relationship between educational
investment (indicated by GDP per capita) and average life span in the sample of
European countries. All combinations of income and life span that result from the
estimation of parameter 1 in equation (8) yield the function le(I) (see figure 1).
The relationship between investment and le in the model has an impact on two
subsequent calibrations, although it is rather moderate. Life cycle skill formation is
illustrated graphically in Figure 2.
The figure considers all countries and demonstrates their heterogeneity. In the upper
left it shows cognitive skills for a population of 100,000 representative European
individuals of one age cohort for 0 . All individuals are assumed to start with the
same stock of cognitive skills, i.e. a value of 180, but receive divergent investments

11
until the age of 18 years7. As can be seen in this figure, cognitive skills peak in the
early 20s and then decline continuously. The maximum values vary between more
than 700 and less than 400 skill units in the population. Individuals with fewer
educational investments and a lower skill level have a shorter life span.
Figure 1: Relationship between educational investments and life span
The beginning of the decline in cognitive skill depends on the life span. In the case
of self-regulatory skills, all individuals start with the value of 180, too, but skills
peak later, namely between the ages of 50 and 60 years. Because these skills are
assumed to be more malleable throughout childhood (Cunha and Heckman 2007,
Caspi et al. 2005), their heterogeneity resulting from parental investments varies
between less than 300 and more than 1000.
In the lower left part of figure 2, the development of human capital of a European
population cohort is shown across its life span. For given human capital, the figure
shows the incomes that an individual could receive if he or she worked full time
between the ages of 18 and 65 years.
In contrast to skills, income does not only depend on parental investments during
childhood, but also on conditions stemming from the labour market and the general
productivity in a country. In some countries such as Luxembourg and Norway,
income is high relative to human capital, while in others, such as Poland and
Romania it is low.
Human Capital is produced by both cognitive and self-regulatory skills and peaks
between the ages of 40 and 57 years. As individuals with higher skills live longer,
they reach their maximum income later in life. In skill-intensive, high-income
professions income peaks up to 17 years later than in low-income professions.
7 For a discussion of different initial conditions see Pfeiffer and Reuß (2008).

12
Figure 2: Cognitive and noncognitive skills, human capital
and investments in adulthood
In the lower right part of figure 2 the amount of educational investments in
adulthood that individuals choose to maximize their expected lifetime income is
shown. Generally, individuals experience a trade-off: They have to decide to either
start working or invest more in their education.
In early adulthood when returns to education are high, individuals tend to invest
more in their education. The amount decreases with age and becomes negligible
with the time. Individuals with higher human capital tend to invest more in
education at young age, which is in line with the literature (see Pfeiffer and Reuß
2008, among others).
Individuals in countries with a high income inequality also tend to invest more in
education. In Lativa for instance, where income quintile ratio is larger than 7,
individuals invest on average 0.19 educational units per year between the ages of 18
and 65. On the other hand, in countries with a quintile ratio smaller than 4 (e.g.,
Denmark and Switzerland) individuals only invest between 0.05 and 0.07
educational units.

13
5. Alternative Educational Policies
5.1. Alternative Policies and Regimes We study the welfare consequences of three alternative educational policies for two
policy regimes in Europe.
Policy one aims at reducing country heterogeneity within Europe. According to this
policy, each student who is younger than 18 years and comes from a country with
PISA scores below the average PISA score receives the amount of investments that
is needed to reach the European average of educational investments during their first
18 years of life. This amount is greater than zero for all European countries that
invest less than the mean value of educational investments in Europe. The additional
investments differ significantly between countries.
Policy two aims at increasing investments at certain ages while treating students of
all European countries in the same way. In all countries, individuals under the age of
18 receive an additional education investment either in their preschool or their
primary or secondary school. By our definition the preschool investment lasts from
the age of 0 to 5 years, the primary investment from the age of 6 to 11 years and the
secondary investment from the age of 12 to 17 years. The amount of investments is
calculated in a way that balances total discounted costs with the expenditures of
policy one.
Policy three provides educational investments either to the lower, medium or highest
third of the PISA achievement distribution for the first 18 years of life. The
investment is calculated in a way assuring that discounted costs resemble those of
policy one.
The three policies are investigated for two policy regimes. In the first regime,
European labour markets are assumed to be heterogeneous, hence, 29 different
countries with distinct parameters j and j are used in the model. Educational costs
differ in each country. In the second regime, there is one homogeneous European
labour market with one and one . In the second regime educational costs are
assumed to be uniform across Europe. Obviously, these two regimes are idealized
policy regimes. Reality presumably meets the conditions of a market structure which
does not correspond completely to one of the suggested regimes.
5.2. Heterogeneity in European Labour Markets Policy one aims at reaching the average level of educational investments in all
countries. To make such an investment, 0.19% of the total annual European GDP
(42.31 € per capita) has to be spent. For policy two, the investment amounts to
0.51% (preschool), 0.57% (primary) and 0.64% (secondary) of the total annual
14
European GDP (113.00 € to 144.00 € per capita annually). These differences result
from discounting educational spending. All in all, the discounted costs for policy two
lasting for six years are equal to the costs of policy one lasting for 18 years. The
annual spending of policy three is equal to the one for policy one. As investment
costs differ, 0.12 educational units can be invested in the lower and middle third of
the educational distribution, but only investments of 0.11 educational units can be
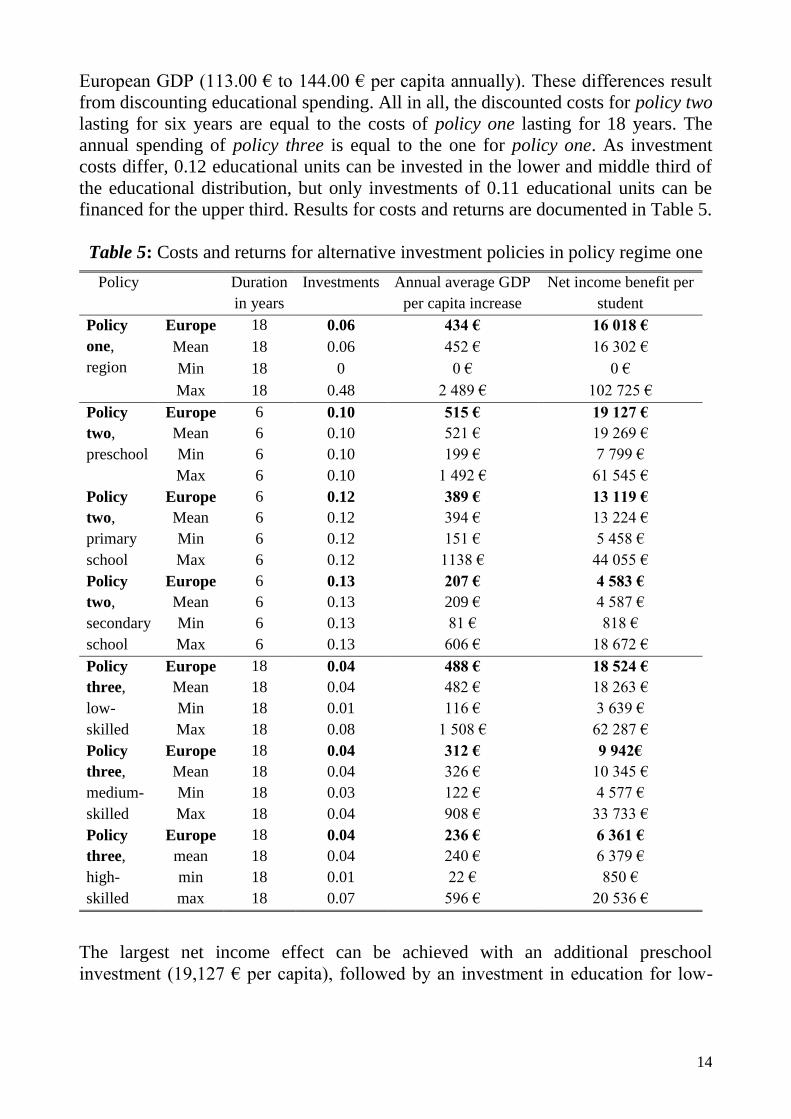
financed for the upper third. Results for costs and returns are documented in Table 5.
Table 5: Costs and returns for alternative investment policies in policy regime one
Policy Duration
in years
Investments
Annual average GDP
per capita increase
Net income benefit per
student
Policy
one,
region
Europe 18 0.06 434 € 16 018 €
Mean 18 0.06 452 € 16 302 €
Min 18 0 0 € 0 €
Max 18 0.48 2 489 € 102 725 €
Policy
two,
preschool
Europe 6 0.10 515 € 19 127 €
Mean 6 0.10 521 € 19 269 €
Min 6 0.10 199 € 7 799 €
Max 6 0.10 1 492 € 61 545 €
Policy
two,
primary
school
Europe 6 0.12 389 € 13 119 €
Mean 6 0.12 394 € 13 224 €
Min 6 0.12 151 € 5 458 €
Max 6 0.12 1138 € 44 055 €
Policy
two,
secondary
school
Europe 6 0.13 207 € 4 583 €
Mean 6 0.13 209 € 4 587 €
Min 6 0.13 81 € 818 €
Max 6 0.13 606 € 18 672 €
Policy
three,
low-
skilled
Europe 18 0.04 488 € 18 524 €
Mean 18 0.04 482 € 18 263 €
Min 18 0.01 116 € 3 639 €
Max 18 0.08 1 508 € 62 287 €
Policy
three,
medium-
skilled
Europe 18 0.04 312 € 9 942€
Mean 18 0.04 326 € 10 345 €
Min 18 0.03 122 € 4 577 €
Max 18 0.04 908 € 33 733 €
Policy
three,
high-
skilled
Europe 18 0.04 236 € 6 361 €
mean 18 0.04 240 € 6 379 €
min 18 0.01 22 € 850 €
max 18 0.07 596 € 20 536 €
The largest net income effect can be achieved with an additional preschool
investment (19,127 € per capita), followed by an investment in education for low-

15
skilled students under 18 years (18,524 €). Supporting low-skilled individuals
instead of low-skilled countries leads to higher net benefits. In the long run, the
largest net income effect (GDP per capita) is about 515 € annually if all cohorts
benefit from the policy. Hence, spending 113 € per capita annually would result in
an increase of 515 € if no crowding out of educational investments took place. The
smallest returns stem from additional investments in secondary education.
Results for inequality are displayed in table 6. The largest effect on the reduction of
inequality is achieved if investments are directed to the low-skilled as intended by
policy three (see table 6). If equality considerations become more important in the
welfare function, supporting the low performing students is a welfare optimizing
strategy.
Table 6: Changes in inequality for policy regime one
Policy before policy after policy change
Policy one, region 6 5.31 -0.69
Policy two, preschool 6 5.53 -0.47
Policy two, primary school 6 5.65 -0.35
Policy two, secondary school 6 5.80 -0.20
Policy three, low-skilled 6 4.92 -1.08
Policy three, medium-skilled 6 5.92 -0.08
Policy three, high-skilled 6 6.30 +0.30
Finally, table 7 summarizes the welfare changes depending on the degree of
inequality aversion in a society. Societies with a zero inequality aversion (ε=0)
should shift more investments to younger children (policy two) while societies with
a greater inequality aversion (ε>0) should support mainly the low performing
students (policy three, low-skilled). Policy one is dominated by either the first
variant of policy two or the first variant of policy three. However, policy one is
always better compared to the second and third variant of policy two and three.
Table 7: Welfare changes in policy regime one depending on inequality aversion
0 0.5 1 1.5
Policy 1 1.45% 1.92% 4.38% 10.82%
Policy 2, preschool 1.73% 2.33% 5.57% 14.35%
Policy 2, primary 1.19% 1.61% 3.83% 9.77%
Policy 2, secondary 0.41% 0.60% 1.54% 4.00%
Policy 3, low-skilled 1.67% 3.08% 10.65% 32.32%
Policy 3, medium-skilled 0.90% 0.89% 0.54% -0.73%
Policy 3, high-skilled 0.58% 0.28% -0.94% -3.30%
16
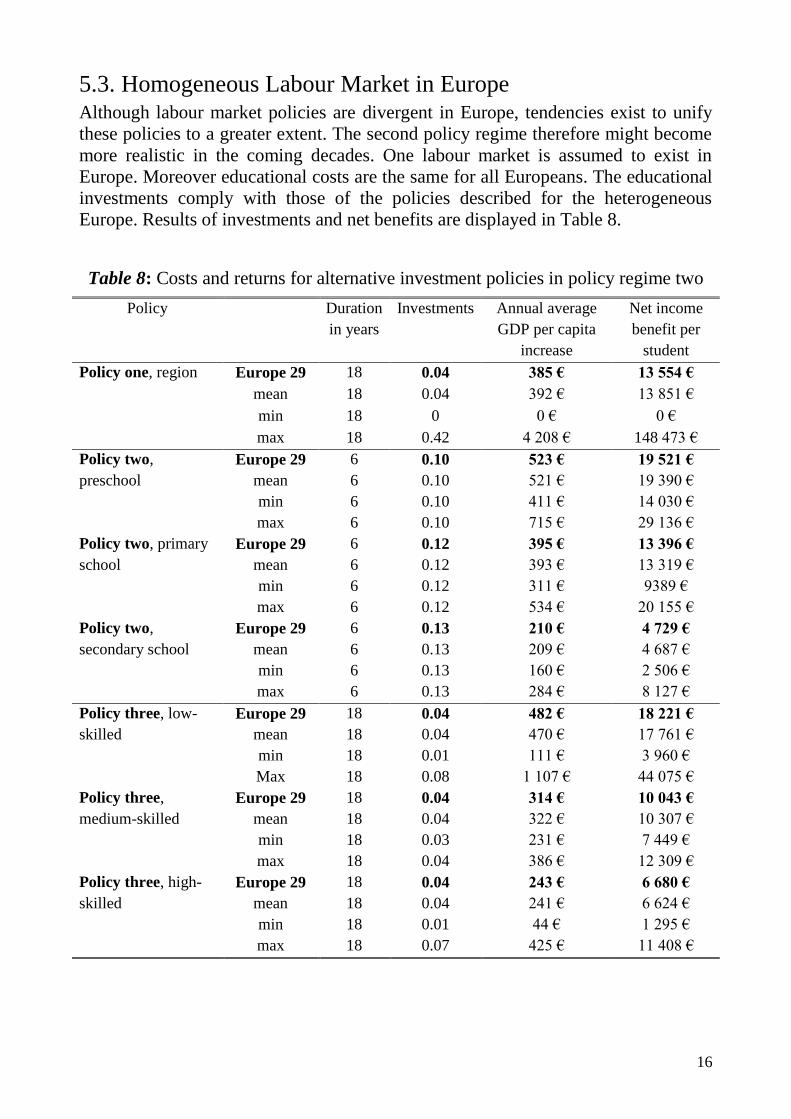
5.3. Homogeneous Labour Market in Europe Although labour market policies are divergent in Europe, tendencies exist to unify
these policies to a greater extent. The second policy regime therefore might become
more realistic in the coming decades. One labour market is assumed to exist in
Europe. Moreover educational costs are the same for all Europeans. The educational
investments comply with those of the policies described for the heterogeneous
Europe. Results of investments and net benefits are displayed in Table 8.
Table 8: Costs and returns for alternative investment policies in policy regime two
Policy Duration
in years
Investments
Annual average
GDP per capita
increase
Net income
benefit per
student
Policy one, region Europe 29 18 0.04 385 € 13 554 €
mean 18 0.04 392 € 13 851 €
min 18 0 0 € 0 €
max 18 0.42 4 208 € 148 473 €
Policy two,
preschool
Europe 29 6 0.10 523 € 19 521 €
mean 6 0.10 521 € 19 390 €
min 6 0.10 411 € 14 030 €
max 6 0.10 715 € 29 136 €
Policy two, primary
school
Europe 29 6 0.12 395 € 13 396 €
mean 6 0.12 393 € 13 319 €
min 6 0.12 311 € 9389 €
max 6 0.12 534 € 20 155 €
Policy two,
secondary school
Europe 29 6 0.13 210 € 4 729 €
mean 6 0.13 209 € 4 687 €
min 6 0.13 160 € 2 506 €
max 6 0.13 284 € 8 127 €
Policy three, low-
skilled
Europe 29 18 0.04 482 € 18 221 €
mean 18 0.04 470 € 17 761 €
min 18 0.01 111 € 3 960 €
Max 18 0.08 1 107 € 44 075 €
Policy three,
medium-skilled
Europe 29 18 0.04 314 € 10 043 €
mean 18 0.04 322 € 10 307 €
min 18 0.03 231 € 7 449 €
max 18 0.04 386 € 12 309 €
Policy three, high-
skilled
Europe 29 18 0.04 243 € 6 680 €
mean 18 0.04 241 € 6 624 €
min 18 0.01 44 € 1 295 €
max 18 0.07 425 € 11 408 €
17
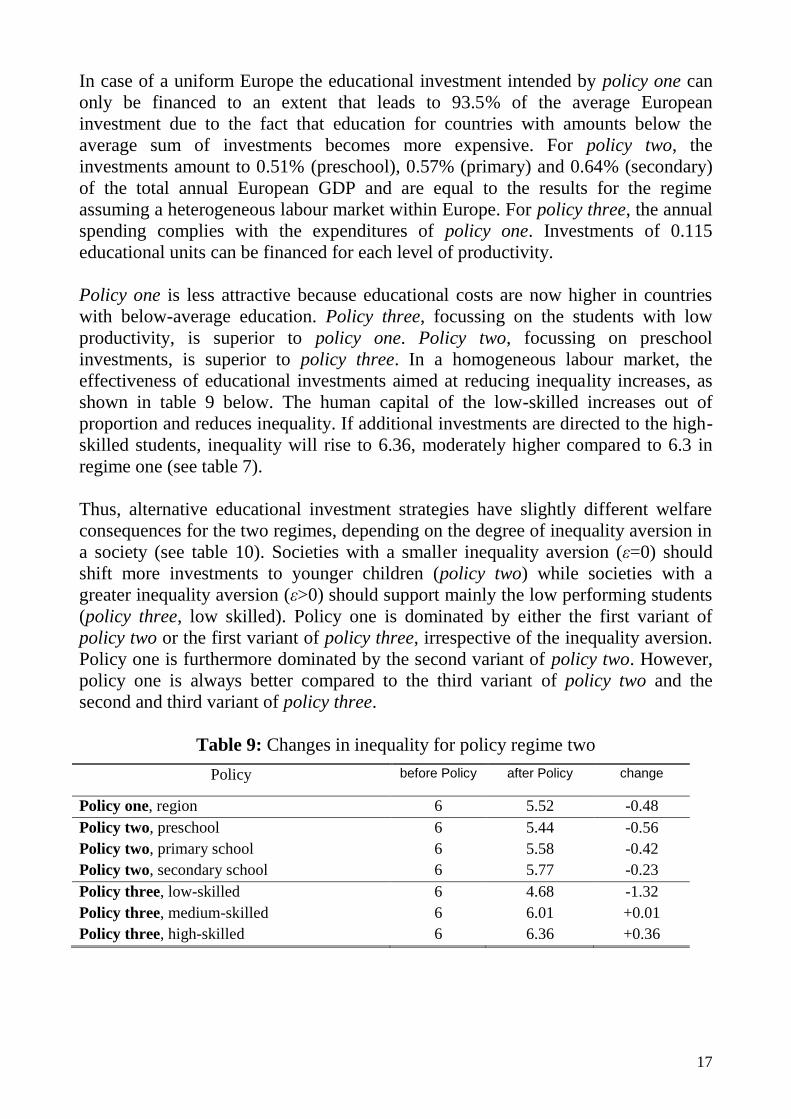
In case of a uniform Europe the educational investment intended by policy one can
only be financed to an extent that leads to 93.5% of the average European
investment due to the fact that education for countries with amounts below the
average sum of investments becomes more expensive. For policy two, the
investments amount to 0.51% (preschool), 0.57% (primary) and 0.64% (secondary)
of the total annual European GDP and are equal to the results for the regime
assuming a heterogeneous labour market within Europe. For policy three, the annual
spending complies with the expenditures of policy one. Investments of 0.115
educational units can be financed for each level of productivity.
Policy one is less attractive because educational costs are now higher in countries
with below-average education. Policy three, focussing on the students with low
productivity, is superior to policy one. Policy two, focussing on preschool
investments, is superior to policy three. In a homogeneous labour market, the
effectiveness of educational investments aimed at reducing inequality increases, as
shown in table 9 below. The human capital of the low-skilled increases out of
proportion and reduces inequality. If additional investments are directed to the high-
skilled students, inequality will rise to 6.36, moderately higher compared to 6.3 in
regime one (see table 7).
Thus, alternative educational investment strategies have slightly different welfare
consequences for the two regimes, depending on the degree of inequality aversion in
a society (see table 10). Societies with a smaller inequality aversion (ε=0) should
shift more investments to younger children (policy two) while societies with a
greater inequality aversion (ε>0) should support mainly the low performing students
(policy three, low skilled). Policy one is dominated by either the first variant of
policy two or the first variant of policy three, irrespective of the inequality aversion.
Policy one is furthermore dominated by the second variant of policy two. However,
policy one is always better compared to the third variant of policy two and the
second and third variant of policy three.
Table 9: Changes in inequality for policy regime two
Policy before Policy after Policy change
Policy one, region 6 5.52 -0.48
Policy two, preschool 6 5.44 -0.56
Policy two, primary school 6 5.58 -0.42
Policy two, secondary school 6 5.77 -0.23
Policy three, low-skilled 6 4.68 -1.32
Policy three, medium-skilled 6 6.01 +0.01
Policy three, high-skilled 6 6.36 +0.36

18
Table 10: Welfare changes in regime one depending on inequality aversion
0 0.5 1 1.5
Policy one, region 1.23% 1.72% 4.38% 12.59%
Policy two, preschool 1.76% 2.57% 7.06% 19.65%
Policy two, primary 1.21% 1.77% 4.81% 13.09%
Policy two, secondary 0.43% 0.66% 1.89% 5.09%
Policy three, low-skilled 1.65% 3.45% 13.58% 44.37%
Policy three, medium-skilled 0.91% 0.90% 0.39% -1.56%
Policy three, high-skilled 0.60% 0.18% -1.58% -4.96%
6. Conclusion
The paper analyses alternative investment policies and their consequences for the
evolution of human capital in Europe based on a model of age dependent skill
formation where the life span depends on investments during childhood. A model is
calibrated for a population living in 29 European countries in the year 2006. In the
study Europe is either the sum of these individual countries or it is a hypothetical
entity constructed from the 29 European countries. What makes the approach special
is the analysis of the returns to education of alternative educational policies targeted
at certain countries, ages or productivity levels for two counterfactual policy
regimes, one regime assuming a single labour market and the other presupposing the
actual state of diversity. In the model, investments for young individuals under the
age of eighteen years are traced back to the family and teaching environment. In
adulthood individuals optimize the amount of educational investments, given the
overall amount of investments in the society.
The results demonstrate that optimal investment strategies, whether they are oriented
towards age, regions or skill levels, crucially depend on the weights a society puts
on equality. If equality is important enough more investment in Europe are needed
for disadvantaged children during childhood. If the aim of equality is less important,
additional investments need to be directed more generally to people of younger ages.
Furthermore, it turns out that high levels of income inequality and a high skill level
increases the optimal amount of investments, especially during younger adulthood.
The findings result from the idea of age depended skill formation with decreasing
learning multiplier over time and decreasing marginal returns to investment in the
skill production function. Further research is needed first for empirically assessing
the skill multiplier from childhood in the different European countries with
improved data. Second, additional research is needed to investigate the welfare
consequences of public and private investment processes and alternative
assumptions about their interdependencies.

19
References
Amor, D. J. (2003), Maximizing Intelligence, New Brunswick, NJ: Transaction
Publishers.
Atkinson, A. B. (1970), On the Measurement of Inequality, Journal of Economic
Theory, 2 (3), 244-263.
Bergh, A. und G. Fink (2009), Higher Education, Elite Institutions and Inequality,
European Economic Review, 53 (3), 376-384.
Blomeyer, D., K. Coneus, M. Laucht and F. Pfeiffer (2009), Initial Risk Matrix,
Home Resources, Ability Development and Children’s Achievement, Journal of
the European Economic Association, 7 (2-3), 638-648.
Borgloh, S., B. U. Wigger, F. Heinemann, A. Kalb, F. Pfeiffer and K. Reuß (2011),
Staatliche Anreize für private Bildungsinvestitionen – Effizienzanalyse,
internationale Trends, Reformmöglichkeiten, Baden-Baden: Nomos.
Castelló-Climent, A. and R. Doménech (2008), Human Capital Inequality, Life
Expectancy and Economic Growth, The Economic Journal, 118 (528), 653-677.
Caspi, A., B. W. Roberts and R. L. Shiner (2005), Personality Development:
Stability and Change, Annual Review of Psychology, 56, 453-484.
Coneus, K., M. Laucht and K. Reuss (2011), The Role of Parental Investments for
Cognitive and Noncognitive Skill Development – Evidence for the First 11
Years of Life, Economics and Human Biology (in press).
Cunha, F., J. J. Heckman, L. Lochner and D. V. Masterov (2006), Interpreting the
Evidence on Life Cycle Skill Formation, in: E. A. Hanushek and F. Welsch
(eds.), Handbook of the Eco-nomics of Education, vol. 1, Amsterdam: Elsevier
Science & Technology, 697-804.
Cunha, F. and J. J. Heckman (2007), The Technology of Skill Formation, The
American Economic Review, 97 (2), 31-47.
Cunha, F. und J. J. Heckman (2009), The Economics and Psychology of Inequality
and Human Development, Journal of the European Economic Association, 7 (2-
3), 320-364.
De Boor, C. (1978), A Practical Guide to Splines, Berlin: Springer-Verlag.
Duckworth, A. L. and M. E. P. Seligman (2005), Self-Discipline Outdoes IQ in
Predicting Aca-demic Performance, Psychological Science, 16 (12), 939-944.
European Commission (2009), Eurostat, http://epp.eurostat.ec.europa.eu/portal/-
page/portal/eurostat/home (retrieved 15.03.2011).
European Commission (2010), Eurostat, http://epp.eurostat.ec.europa.eu/portal/-
page/portal/eurostat/home (retrieved 15.03.2011).

20
European Commission (2010), Europe 2020: A Strategy for Smart, Sustainable and
Inclusive Growth, Brussels, http://eunec.vlor.be/detail_bestanden/doc014%20-
Europe%202020.pdf (retrieved 15.03.2011).
Frijters, P., T. J. Hatton, R. M. Martin, M. A. Shields (2010), Childhood Economic
Conditions and Length of Life: Evidence from the UK Boyd Orr Cohort, 1937-
2005, Journal of Health Economics, 29 (1), 39-47.
Hanushek E. A. and L. Wößmann (2008), The Role of Cognitive Skills in Economic
Development, Journal of Economic Literature, 46 (3), 607-668.
Heckhausen, J. and H. Heckhausen (2008), Motivation and Action, Cambridge:
Cambridge University Press.
Heckman, J. J. (2007), The Economics, Technology and Neuroscience of Human
Capability Formation, Proceedings of the National Academy of Sciences, 104
(3), 132250-132255.
Heckman, J. J. and B. Jacobs (2009): Policies to Create and Destroy Human Capital
in Europe, IZA Discussion Paper, No. 4680, Bonn.
Hunter, B., G. P White and G. Godbey (2006), What Does It Mean to Be Globally
Competent, Journal of Studies in International Education, 10 (3), 267-285.
Johnson, W. R. and S. Turner (2009), Faculty without Students: Resource Allocation
in Higher Education, Journal of Economic Perspectives, 23 (2), 169-189.
Lerner, J., A. Schoar and J. Wang (2008), Secrets of the Academy: The Drivers of
University Endowment Success, Journal of Economic Perspectives, 22 (3), 207-
222.
OECD (2006), Education at Glance 2006, Paris.
OECD (2009), OECD.statExtracts, http://stats.oecd.org/Index.aspx (retrieved
15.03.2011).
OECD (2010), Education at Glance 2010, Paris.
Pfeiffer, F. und K. Reuß (2008), Age-Dependent Skill Formation and Returns to
Education, Labour Economics, 15 (4), 631-646.
Richardson, D. and M. M. D’Ercole (2009), Doing Better for children: The First
OECD Report on Child Well-Being, 3rd
OECD World Forum, 29.10.2009,
http://www.oecd.org/dataoecd/47/50/44120958.pdf (retrieved 15.03.2011).
Sen, A. and J. Foster (1997)2 [1973], On Economic Inequality, Oxford: Clarendon
Press.
Wößmann, L. (2008), How Equal Are Educational Opportunities? Family
Background and Student Achievement in Europe and the United States,
Zeitschrift für Betriebswirtschaft, 78 (1), 45-70.
Copyright © 2022 FDOKUMEN