Barriers to Foreign Direct Investment Under Political Instability

Eesti Pank Bank of Estonia
Foreign Direct Investment and Innovation in Central and Eastern Europe: Evidence from Estonia
Jaan Masso, Tõnu Roolaht, Urmas Varblane
Working Paper Series
5/2010

The Working Paper is available on the Eesti Pank web site at:www.bankofestonia.info/pub/en/dokumendid/publikatsioonid/seeriad/uuringud/
For information about subscription call: +372 668 0998; Fax: +372 668 0954e-mail: [email protected]
ISBN 978-9949-404-85-8ISSN 1406-7161

Foreign Direct Investment and Innovation in Central and Eastern Europe:
Evidence from Estonia
Jaan Masso, Tõnu Roolaht and Urmas Varblane*
Abstract
A growing literature is trying to analyse the productivity gap be-
tween domestic and foreign firms with differences in innovation indica-tors. In our paper we analyse the relationship between inward and out-ward FDI at either company or industry level and the innovation behav-iour of companies in Estonia. We use company-level data from three waves of the Community Innovation Surveys, which are combined with financial data from the Estonian Business Register and FDI data from the balance of payments statistics. For the analysis we apply a structural model involving equations on innovation expenditure, innovation out-come and productivity, and also innovation accounting and propensity score matching approaches. Our results show that the higher innovation output of foreign owned companies vanishes after various company characteristics are controlled for, but there were significant differences in innovation inputs such as the higher use of knowledge sourcing and the lower importance of various impeding factors. Outward investment has a positive influence on innovativeness among both domestic and foreign owned companies.
JEL Code: F10, F23, O30
Keywords: innovation, internationalisation, foreign direct investments, catching-up countries
Authors’ e-mail addresses: [email protected] (corresponding author), [email protected], [email protected]
The views expressed are those of the authors and do not necessarily represent the official views of Eesti Pank
* The article was written during the period that Jaan Masso was a visiting researcher at
Eesti Pank (Bank of Estonia). The authors also acknowledge the financial support given by the Ministry of Education and Research of the Republic of Estonia target financed project No. SF0180037s08 and Estonian Science Foundation grants No. 6853, 8311 and 7405. We are also grateful to Eurostat for providing the 4th Community Innovation Survey microdata to the University of Tartu; however Eurostat has no responsibility for the results or conclusions of the paper. The authors are solely responsible for all errors and omissions.
2
Non-technical summary A growing literature is trying to analyse the productivity gap between do-
mestic and foreign firms with differences in innovation indicators. In our pa-per we analyse the relationship between inward and outward FDI either at the firm or industry level and the innovation behaviour of firms in Estonia, a small catching-up country in the region of Central and Eastern Europe. This region is a good candidate for studying the linkages between FDI and innova-tion: the countries in the region are below the international technological frontier, have weaker domestic knowledge base and they face significant pro-ductivity gaps with the Western European countries, so the entry of multi-nationals with superior technology could be one source for closing these gaps. Estonia could be especially interesting for the study because in relative terms it is one of the largest recipients of inward FDI and a source of outward FDI in the region, and it also has the highest percentage of innovative com-panies in the CEE countries.
The contribution to the literature is also that this paper combines data from three waves of innovation surveys using various methodological approaches. In particular we use company-level data from three waves of the Community Innovation Surveys for the analysis, namely CIS3 for 1998–2000, CIS4 for 2002–2004 and CIS2006 for 2004–2006. The innovation survey data are merged with financial data from the Estonian Business register and inward and outward FDI data from the balance of payments statistics of the Bank of Estonia (the central bank). For the analysis we apply a structural model in-volving equations for innovation expenditure, innovation outcome and pro-ductivity (called the CDM model in the literature). For the estimated know-ledge production function we also apply the innovation accounting frame-work in order to account for the different factors explaining the innovation output gap between domestic and foreign firms. Propensity score matching is used to identify the effect of FDI and internationalisation on various innova-tion inputs and outputs by considering the differences between FDI and non-FDI firms.
Our results show that in most cases no significant differences were found between the levels of expenditure on innovation by companies with differing involvement in inward or outward FDI. Innovation expenditure is negatively affected by a lack of funding, where foreign companies do significantly better. The higher innovation output from the FDI of foreign owned compa-nies perishes after various company characteristics are controlled for, but there were significant differences in innovation inputs, such as higher use of knowledge sourcing by the foreign owned companies. Outward direct invest-ment influences innovativeness positively among both domestic and foreign owned companies. The results also revealed some evidence of the existence

3
of FDI spillover effects, through the positive linkage between FDI presence within one industry or in vertically linked downstream or upstream industries and the productivity or innovativeness of domestic firms. The results seem to imply that the small size of the local market and the lack of local skills limit the incentives of foreign companies to innovate.

4
Contents 1. Introduction.................................................................................................. 5 2. Econometric method .................................................................................. 10 3. Data description and preliminary analysis................................................. 15 4. Results of the econometric analysis........................................................... 20
4.1. Innovation expenditure equation ........................................................ 20 4.2. Innovation output equation ................................................................. 22 4.3. Productivity equation.......................................................................... 28
5. Matching analysis of FDI companies ........................................................ 33 6. Conclusions................................................................................................ 40 References...................................................................................................... 44 Appendix 1: Overview of selected studies on the impact of foreign ownership on innovation................................................................................ 49 Appendix 2: Definitions and summary statistics of variables used in descriptive tables and regression analysis ..................................................... 53 Appendix 3: Econometric model ................................................................... 55

5
1. Introduction It is well documented in the literature that foreign owned companies have
higher productivity than their domestic counterparts (for an example review of the literature see Arnold and Smarzynska Javorcik, 2005); although this may be due to foreign owners investing in more productive companies and sectors, it is also possible that technology is transferred from parents to local subsidiaries. The positive contribution of FDI to home country productivity can occur either through the own-firm effect of increased productivity in companies with foreign owners, or through spill-over effects with increased productivity in non-FDI companies due to the presence of FDI in the same industry, or in downstream and upstream industries. However, as Stiebale and Reize have argued (2005), a better way to estimate the technological per-formance of foreign owned companies relative to domestic companies would be to study not productivity but rather the differences in the innovation input and output indicators such as spending on R&D, or more broadly on various kinds of innovation; the sources of information used for innovation; the pat-terns of cooperation in innovation; and product and process innovations. Al-ternatively, the main reason for the differences in productivity could be dif-ferences in knowledge (Criscuolo et al., 2005) and studying the impact of FDI through a production function approach may tell us little about what the specific mechanisms are, and how knowledge spillovers from foreign to do-mestic companies occur (Knell and Shrolec, 2006). Alternatively again, Vah-ter (2010) explains that most of the literature on FDI spillover effects has treated the transfer between FDI and domestic companies as a kind of a black box with no specific channels of knowledge transfer.
In addition to creating knowledge spillovers, FDI inflow may also affect the work on innovation of local companies through stronger competition, which may either stimulate or impede innovation among local companies given the non-linear relation between competition and innovation (Aghion et al., 2005), while at company level the inflow of FDI may reduce financing constraints and so increase innovativeness. We should stress that both the home- and host-country effects of FDI need to be considered, so we also need to distinguish between foreign and domestic multinationals, as knowledge transfer also occurs from the foreign subsidiaries of multinationals to the home country (Barba Navaretti and Venables, 2004).
Seen from the theoretical perspective and earlier empirical results, the re-lationship between technology, innovation and FDI is ambiguous. Although multinational parents have access to more advanced technologies, they may have an incentive to transfer older technologies to local companies (Almeida and Fernandes, 2006). While in many countries foreign companies do a sig-nificant percentage of total industrial R&D, in most OECD countries foreign

6
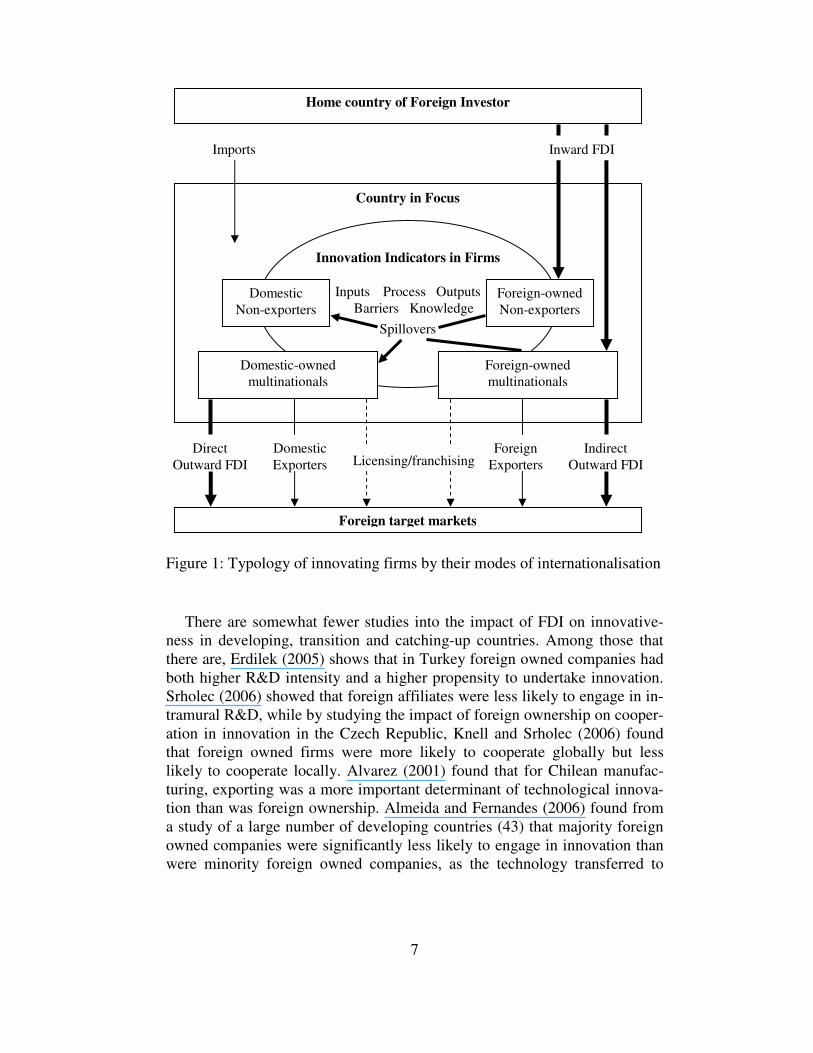
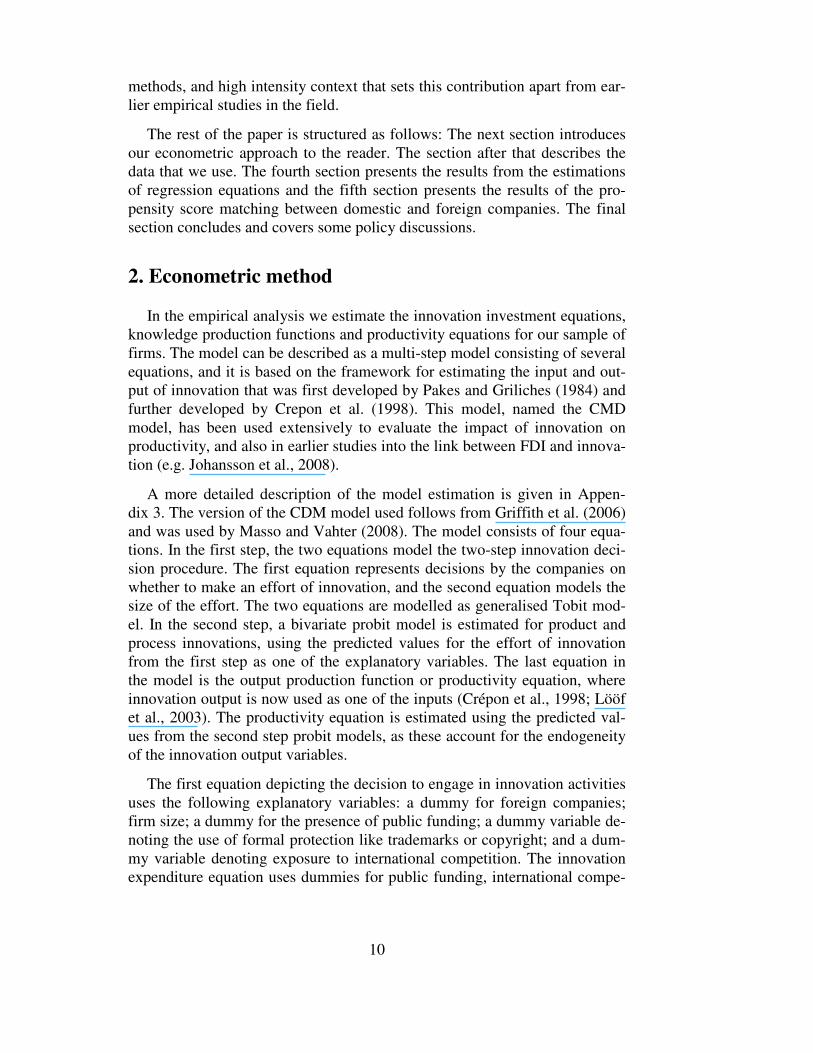
owned companies have lower R&D intensities than do domestic companies (OECD, 2006). While there are advantages in centralising R&D work at the headquarters of multinationals to achieve economies of scale and scope, de-centralisation has an advantage in linkages with local markets, customers and suppliers (Günther et al., 2009). Multinational companies may also tend to limit the spillover of their knowledge to non-affiliated companies in order to protect their ownership advantage (Schrolec, 2008), and so it cannot be taken for granted that FDI enhances innovativeness. In essence there are two strate-gies behind cross-border innovation activities by multinationals, and these are asset exploiting and asset seeking strategies (Narula and Zanfei, 2005). Under the first of these, multinational enterprises exploit company-specific assets in foreign markets through international production; while strategic innovation activities are concentrated in the home country for the reasons already dis-cussed, engineering and design activities may be located close to customers and production so that products can be customized to the needs of local cus-tomers (Dachs and Ebersberger, 2009). Under asset seeking strategies, multi-nationals develop products and processes in host countries to benefit from factors like the availability of a skilled workforce, or knowledge that can be gained from competitors, customers and universities; due to the tacit nature of knowledge such learning assumes that the innovation activities are con-ducted in the host country (Dachs and Ebersberger, 2009). On the other hand several studies have found that foreign companies may be poorly embedded in a local innovation system (Günther et al., 2009). Numerous studies have been undertaken into the effects of foreign ownership on various aspects of innovation by companies in developed countries; a more thorough review of the literature is provided in section two of the present article. If foreign com-panies show a different propensity to innovate than do domestic companies, a high presence of foreign companies could influence the technological perfor-mance of a country (Dachs et al., 2008). Foreign companies may have fewer innovation inputs if they can rely on their internal stock of knowledge, be-cause this would allow them to focus on design and adjusting existing tech-nologies to local conditions rather than on R&D; on the other hand these re-sources may enable them to come up with innovations more easily and thus have a higher innovation output (Dachs et al., 2008). Figure 1 shows a gener-alised summary of firm types, modes of internationalisation and innovation indicators used in the empirical construct; these are based on theoretical con-siderations and earlier studies.
7
Figure 1: Typology of innovating firms by their modes of internationalisation
There are somewhat fewer studies into the impact of FDI on innovative-ness in developing, transition and catching-up countries. Among those that there are, Erdilek (2005) shows that in Turkey foreign owned companies had both higher R&D intensity and a higher propensity to undertake innovation. Srholec (2006) showed that foreign affiliates were less likely to engage in in-tramural R&D, while by studying the impact of foreign ownership on cooper-ation in innovation in the Czech Republic, Knell and Srholec (2006) found that foreign owned firms were more likely to cooperate globally but less likely to cooperate locally. Alvarez (2001) found that for Chilean manufac-turing, exporting was a more important determinant of technological innova-tion than was foreign ownership. Almeida and Fernandes (2006) found from a study of a large number of developing countries (43) that majority foreign owned companies were significantly less likely to engage in innovation than were minority foreign owned companies, as the technology transferred to
Country in Focus
Home country of Foreign Investor
Inward FDI
Innovation Indicators in Firms
Inputs Process Outputs Barriers Knowledge
Domestic Non-exporters
Foreign target markets
Domestic-owned multinationals
Foreign-owned multinationals
Foreign-owned Non-exporters
Indirect Outward FDI
Direct Outward FDI
Domestic Exporters
Foreign Exporters Licensing/franchising
Spillovers
Imports
8
majority foreign owned companies was more mature. Vishwsrao and Boss-hardt (2001) found that in India, foreign owned firms were more likely to adopt new technologies than were domestic firms. Günther et al. (2009) found that while majority foreign owned firms in the five Central and Eastern European (CEE) countries were engaged in R&D and innovation, they built fewer technological linkages with local science institutions, thus limiting the developmental impact of FDI. Srholec (2009) found that foreign ownership increases technology transfer through cooperation in innovation, especially in less developed CEE countries. Thus, in the present paper we aim to contri-bute to the understanding of the role of company internationalisation in the context of a catching-up country. These countries are usually further behind the technological frontier and have weaker domestic knowledge base, and so the question is the extent to which FDI can help to overcome these problems. An overview of the results of the different studies is also given in Appen- dix 1.
The aim of this paper is to study the linkages between inward and outward FDI and the innovation inputs and outputs of domestic and foreign owned companies in Estonia, a small economy in Central and Eastern Europe. This region is a good candidate for studying the impacts of FDI; while these coun-tries were closed to FDI before the onset of transition, since the beginning of transition they have witnessed massive FDI inflows. Even after almost 20 years of transition these countries still face significant productivity gaps with the Western European countries, so the entry of multinationals with superior technology could be one way to close that gap (Günther et al., 2009). Espe-cially interesting for the analysis of linkages between FDI and innovation is Estonia: the country is one of the largest recipients of inward FDI as well as being a source of outward FDI within the region; according to surveys it has one of the highest percentages of innovative firms in the CEE countries1; and, significantly, the differences in productivity between foreign owned and do-mestic firms have decreased over the course of time2 indicating possible knowledge spillover from foreign to local companies.
The first novel contribution of the study to the literature is that it seems to be one of the first studies to use three different waves of the Community In-novation Survey (CIS), specifically CIS3 covering 1998–2000, CIS4 (2002–2004) and CIS2006 (2004–2006). As several firms are represented in all three
1 While the CEE countries mostly belong to the group of countries with a fixed low level
of product innovation and varying low levels of process innovation, Estonia is the only one among all the CEE countries that belongs to the group of countries with high innovativeness dominated by product innovation (Meriküll, 2008).
2 For instance, while in 1997 foreign owned firms were about twice as productive as local firms, in 2006 the difference was only 1.7 times (authors’ own calculations based on Estoni-an Business Register data for the business sector).
9
surveys, we are able to track the companies’ innovative performance over three time points, and also to study the impact of the changing economic en-vironment on the link between FDI and innovativeness. For instance, while 1998–2000 in Estonia saw a recession caused by the Russian crisis that caused GDP growth to drop from 11% in 1997 to 4% in 1998 and to 0.3% in 1999, then 2002–2004 and especially 2004–2006 saw annual average GDP growth rates of 7.6% and 8.9% respectively. When there is rapid growth in GDP, wages and production costs, the motives for both inward and outward FDI change, and the impacts of FDI and innovative activities are also ex-pected to change considerably. The CIS data were merged with the dataset from the Bank of Estonia on companies that have outward FDI and the com-pany-level financial data from the Estonian Business Register in order to give the analysis additional data on the global engagement and financial indicators of companies. Thus we study the effects of both inward and outward FDI on innovation (as was also done by, among others, Criscuolo et al., 2005).
The second contribution is that we combine various approaches to the analysis of linkages between FDI and innovation. The links between innova-tion inputs, innovation outputs and productivity are studied using the model by Crépon et al. (1998), in particular a version of the model developed by Griffith et al. (2006), which allows estimation of the innovation expenditure equation, the knowledge production function (with various innovation output variables as dependent variables) and the productivity equation (production function), with all the equations including company and industry level FDI variables. The contribution of various factors to the differences in the innova-tiveness of foreign and domestic companies is studied with the innovation accounting approach by using the Fairlie (2005) decomposition formulas. Fi-nally we shall also use the propensity score matching (PSM) approach to identify the effect of FDI and internationalisation on various innovation in-puts and outputs by considering the differences between FDI and non-FDI firms, for example the common observations that multinational companies are larger, foreign owners move into certain sectors and so forth. Thus our contribution to the literature is that we study the effects of both inward and outward FDI on innovation (as was done also by Criscuolo et al., 2005), and rather than focusing on one single indicator we analyse the differences in a broad list of indicators covering both innovation inputs and outputs.
Such unique data and methodological triangulation allows us to study a rigorous set of variables that influence international contributions to host country innovativeness, both inputs and outputs, in greater detail. This research offers a novel and intricate look into the holistic and multi-faceted context of innovation in a small catching-up country which has a highly inter-national and open business environment. It is this three-fold approach of data,
10
methods, and high intensity context that sets this contribution apart from ear-lier empirical studies in the field.
The rest of the paper is structured as follows: The next section introduces our econometric approach to the reader. The section after that describes the data that we use. The fourth section presents the results from the estimations of regression equations and the fifth section presents the results of the pro-pensity score matching between domestic and foreign companies. The final section concludes and covers some policy discussions.
2. Econometric method In the empirical analysis we estimate the innovation investment equations,
knowledge production functions and productivity equations for our sample of firms. The model can be described as a multi-step model consisting of several equations, and it is based on the framework for estimating the input and out-put of innovation that was first developed by Pakes and Griliches (1984) and further developed by Crepon et al. (1998). This model, named the CMD model, has been used extensively to evaluate the impact of innovation on productivity, and also in earlier studies into the link between FDI and innova-tion (e.g. Johansson et al., 2008).
A more detailed description of the model estimation is given in Appen- dix 3. The version of the CDM model used follows from Griffith et al. (2006) and was used by Masso and Vahter (2008). The model consists of four equa-tions. In the first step, the two equations model the two-step innovation deci-sion procedure. The first equation represents decisions by the companies on whether to make an effort of innovation, and the second equation models the size of the effort. The two equations are modelled as generalised Tobit mod-el. In the second step, a bivariate probit model is estimated for product and process innovations, using the predicted values for the effort of innovation from the first step as one of the explanatory variables. The last equation in the model is the output production function or productivity equation, where innovation output is now used as one of the inputs (Crépon et al., 1998; Lööf et al., 2003). The productivity equation is estimated using the predicted val-ues from the second step probit models, as these account for the endogeneity of the innovation output variables.
The first equation depicting the decision to engage in innovation activities uses the following explanatory variables: a dummy for foreign companies; firm size; a dummy for the presence of public funding; a dummy variable de-noting the use of formal protection like trademarks or copyright; and a dum-my variable denoting exposure to international competition. The innovation expenditure equation uses dummies for public funding, international compe-
11
tition, cooperation in innovation and formal protection, in addition to several other variables. We have included three ownership variables in the innova-tion expenditure equation: domestic multinationals, which are domestic com-panies with outward investments; foreign companies without outward FDI; and foreign companies with outward FDI. This means that the reference category is domestically owned firms without foreign investments. We also included a vector of variables for impediments to innovation, covering lack of finance, the prohibitive cost of innovation, and a lack of information about technology and markets. Unlike most studies, we did not define as dummies the variables of impediments, cooperation in innovation and information sources, but we followed Criscuolo et al. (2005) by giving each of them four values, 0, 1/3, 2/3 and 1; a higher value indicates that greater importance is attached to that cooperation partner, source of information or impediment to innovation by the company. We think that the advantage of defining the vari-ables in this way is that it takes account of all the information covered in the survey.
The list of explanatory variables in the innovation output equation in-cludes the three ownership variables, firm size, industry dummies, formal protection, public funding and a vector of variables for different sources of information. The innovation output equation also uses variables capturing the horizontal and vertical spillovers from FDI, showing the effects on domestic companies from foreign companies in the same industry and region in ac-cordance with the literature on productivity spillovers from FDI. The foreign market share, given in terms of employment, measures the indirect impact of FDI on innovativeness. Domestic companies, and also other foreign owned companies, may also benefit from the introduction of new products and proc-esses by the foreign affiliates if the firm-specific assets of the foreign com-panies are public goods, meaning that the foreign companies cannot gain all the benefits of their activity in the host country (Caves, 1996). The spillover effects may occur through a diffusion of new technology caused by worker mobility between foreign owned and domestic companies; demonstration ef-fects; or increased incentives to adopt state-of-the art technology as a result of the increased competition in the product markets (Blomström and Kokko, 2003). The degree of horizontal FDI ( ijtHRFDI ) is measured as the share of total employment ( ijtL ) accounted for by foreign owned companies in indus-try j at time t :
��
���
���
���
���
ikkjt
ikijtkjtijt LFORLHRFDI . (1)
The horizontal spillover variable is company-specific, so for each com-pany employment is summed over the other companies in the industry. In ad-
12
dition to the indicators of horizontal spillovers, we also used two measures of FDI presence in backwardly and forwardly linked industries following the formulas by Girma et al. (2006) and using the input-output tables for Estonia for the years 1997, 2000 and 2005. The backward measure of FDI in down-stream industries for industry j at time t is calculated as
ktjk
kjjt HRFDIBRFDI �
� � , (2)
where kj� is the proportion of the output of sector j supplied to industry k . The index for FDI in forwardly linked upstream sectors is:
ktjk
kjjt HRFDIFRFDI �
� , (3)
where kj is the proportion of sector k output supplied to industry j .
The explanatory variables in the productivity equation, or production func-tion, are the log of physical capital per employee; the predicted values of the product and process innovation dummies from step two; a dummy for export-ers; company size; three ownership variables that capture the internal com-pany effect of FDI on productivity; and three variables for horizontal, back-ward and forward spillover effects. The export dummy and the size variable are lagged by two periods in order to account for their likely endogeneity, as more productive companies are more likely to export. Since the list of control variables also includes the capital-labour ratio for capital intensity, we are in fact estimating the effects of innovation on total factor productivity, not on labour productivity. The presence of the company size variable may also give us increasing or decreasing returns to scale. The intensity of competition is measured by the Boone index (profit elasticity measure) from Boone (2008)3. The theory for this is that if the market is more competitive, companies are punished more through lower profits if their efficiency declines. Formally, if profits of company i are measured as it� and marginal cost as itc , then the measure can be estimated from the regression equation
ititiit c � �� ��� loglog , where indicates the percentage increase in profits due to a 1% decrease in marginal costs. The regression was estimated separately for each industry classified by the 2-digit industry codes.
Finally, all the equations include six industry dummies that aggregate the industries according to the OECD technology levels of high-technology man-
3 The most commonly used market-concentration measures, such as the total market
share of the N largest companies or the Herfindal-Hirchmann index, are not particularly use-ful for measuring the intensity of competition, especially in small countries like Estonia where competition in industries with a small number of companies and correspondingly high concentration could come from international markets.
13
ufacturing, high-medium technology manufacturing, low-medium technology manufacturing, low technology manufacturing, knowledge intensive services, and other services. These explanatory variables have been used in earlier studies that apply the CDM model and in the studies into the linkages be-tween innovation and FDI (Griffith et al., 2006; Lööf et al., 2003). The pre-cise definitions of the variables can be found in Appendix 2.
In order to disentangle the role of different factors in the knowledge pro-duction function so as to account for the difference in innovativeness be-tween companies with different owners (domestic versus foreign), we also employ the innovation accounting framework (Mairesse and Mohnen, 2002). More precisely, we use the version of the Oaxaca-Blinder decomposition modified for binary variables (Fairlie, 2005) to decompose the total differ-ence between the proportion of innovating domestic and foreign firms with product or process innovation ( fd YY � , indexes d and f for domestic and foreign respectively) into two components, the characteristics effect and the coefficients effect:
� � � �� � � � � �� �dfddfpdpfd XPXPXPXPYY ,,,, ����� , (4)
where P is the average predicted probability of innovation, and dX and fX represent the characteristics of the domestic and foreign companies respec-tively. The vectors d , f and p refer to the parameters of the knowledge production functions estimated with probit models, with the innovation indi-cator as the dependent variable in the samples of domestic companies, for-eign companies and the pooled model (all companies and the ownership vari-able used in the model) respectively. The characteristics effect (explained part of the innovativeness gap) shows the extent to which the different inno-vativeness of the two groups of companies can be explained by the differ-ences in the values of explanatory variables, for example innovation expendi-ture, knowledge sourcing, cooperation in innovation, firm size and so forth. The coefficients effect, also referred to as the unexplained part of the differ-ence, is due to the differences in the regression parameters of domestic and foreign firms, for example additional expenditure on innovation increases the probability of innovation to different extents in foreign and domestic com-panies. The decomposition was undertaken with the “fairlie” package written by Jann (2008) for Stata.
In addition to the regression analysis, propensity score matching is used to cover the possibility that the comparison group for foreign companies does not consist of all domestic companies, as the literature has argued that only companies with relatively high productivity become international (Markusen, 2002) and foreign companies are selective and may choose to invest in com-

14
panies or sectors with higher levels of productivity and technology. Regres-sion analysis may yield inconsistent results if the foreign ownership variable is correlated with the error term, while it may also be difficult to come up with good instruments for foreign ownership. This selectivity issue is tackled by constructing an appropriate control group from among companies without foreign investments that are as similar as possible to the foreign owned com-panies in several dimensions; this approach is based on the conditional inde-pendence assumption (Rubin, 1977) that conditional on the vector of varia-bles X the outcomes are independent of treatment as participation in treat-ment does not depend on outcome. Usually, propensity score matching, or PSM, (Rosenbaum and Rubin, 1983; Caliendo and Kopeinig, 2005) is used to aggregate the information from a number of variables into a single variable called the propensity score, which shows the estimated probability of a firm being foreign owned, and the firms are matched using this score. Several papers on the impact of FDI have used the PSM (e.g. Falk and Falk, 2006; Lööf and Johansson, 2005). For the matching analysis we used the psmatch2 program written for Stata by Leuven and Sianesi (2003).
The propensity score is estimated with a probit model where the depend-ent variable is a dummy variable (at time t) for foreign owned companies ( tiFDI , , which is then the treatment in our case) and independent variables are included in the vector described above tiX , of observable variables that may affect the choice of whether to invest abroad:
)()1( ,, titi XFFDIP �� (5)
Then each foreign company is paired with its nearest neighbour(s) among the domestic companies in terms of the propensity score. In this way, the counterfactual “what if” has been built. We use nearest neighbour matching, so that the treated firm is matched with the firm from the comparison group that is closest in its propensity score, and a Kernel matching algorithm where the weighted averages of all the companies in the comparison group are used to construct the counterfactual4. The use of several matching algorithms is justified because in small samples the results could be sensitive to the match-ing algorithm used (Heckman et al., 1998). Then, as a following step, the av-erage treatment effect on the treated ( ATT ) is calculated (Caliendo and Kopeinig, 2005) as
controlt
treatedtPSM YYATT �� , (6)
where the first term on the right-hand side is the mean of the outcome varia-ble of the treated firm (for example foreign owned firms) and the second term
4 For Kernel matching, the Epanechnikov kernel has been used, with the bandwidth set at 0.06.
15
is a weighted mean of the outcome variable for the counterfactuals over the same period of time. In the matching analysis we compared firstly foreign owned firms to domestic firms, and secondly domestic multinationals to for-eign owned companies.
3. Data description and preliminary analysis
In this study we use the Estonian Community Innovation Survey data from
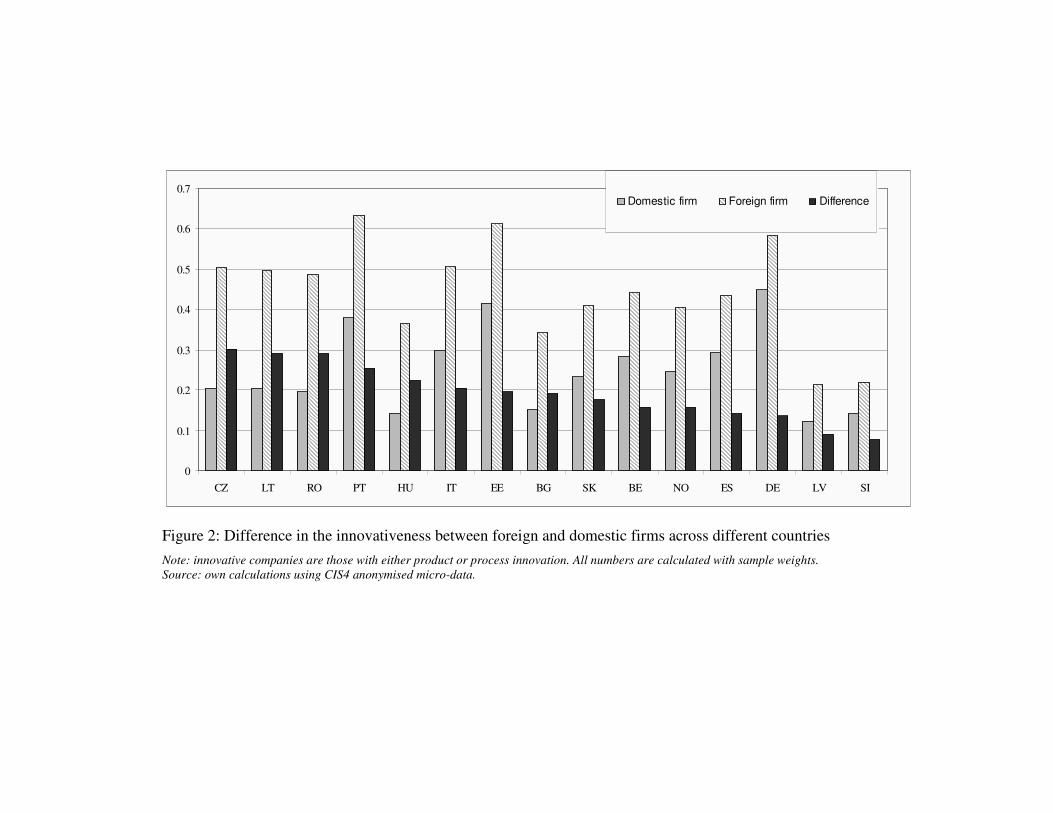
three different waves, CIS3 (covering 1998–2000), CIS4 (2002–2004) and CIS2006 (2004–2006). CIS3 data cover 3,161 companies, CIS4 data cover 1,747 companies and CIS2006 data 1,924 companies. The surveys were con-ducted by Statistics Estonia. The response rates in the surveys were high, 74% in CIS3 and 78% in CIS4, while the EU average was 55% (Terk et al., 2007). Whereas the innovation survey data give only limited information on companies’ global engagement and internationalisation, such as export activi-ties and membership of an enterprise group, the innovation survey data were merged with the dataset of firms that have outward FDI compiled by the Bal-ance of Payments Department of the Bank of Estonia; two updates to the dataset for the years 1995–2002 and 1998–2008 were combined. Thirdly, CIS data were also linked with company level financial data from the Estonian Business Register for all companies for 1995–2006. The descriptive statistics of the variables used in either regression or descriptive analysis can be found in Appendix 1. The main characteristics of the firms’ innovation activities ac-cording to CIS have been covered by Kurik et al. (2002) using the CIS3 re-sults and by Terk et al. (2007) using the CIS4 results. There are several stud-ies on the linkages between FDI and innovation that have used either CIS data on a single country or a small number of countries, but a few studies have also used the Eurostat anonymised CIS micro-data (like Schrolec, 2008; Falk, 2008) that cover company level data for 15 EU and EEA countries in CIS3 and 16 countries in CIS45. Figure 2 shows that according to the Euro-stat anonymsed micro-data in case of all of the European countries covered, foreign companies are more innovative than domestic ones, the differences falling in the range of 5–25 percentage points; foreign companies are most in-novative in Portugal and Estonia, which again motivates the use of Estonian data for our study. Generally in Eastern Europe the differences between the two groups are much larger, which is similar to the results of Falk (2008) on CIS3 data.
5 In CIS4, the dataset includes Belgium, Bulgaria, Czech Republic, Germany, Estonia,
Greece, Spain, Hungary, Italy, Latvia, Lithuania, Portugal, Romania, Slovenia, Slovakia and Norway. CIS3 includes Iceland in addition to these, but excludes Slovenia.
0
0.1
0.2
0.3
0.4
0.5
0.6
0.7
CZ LT RO PT HU IT EE BG SK BE NO ES DE LV SI
Domestic firm Foreign firm Difference
Figure 2: Difference in the innovativeness between foreign and domestic firms across different countries Note: innovative companies are those with either product or process innovation. All numbers are calculated with sample weights. Source: own calculations using CIS4 anonymised micro-data.
17
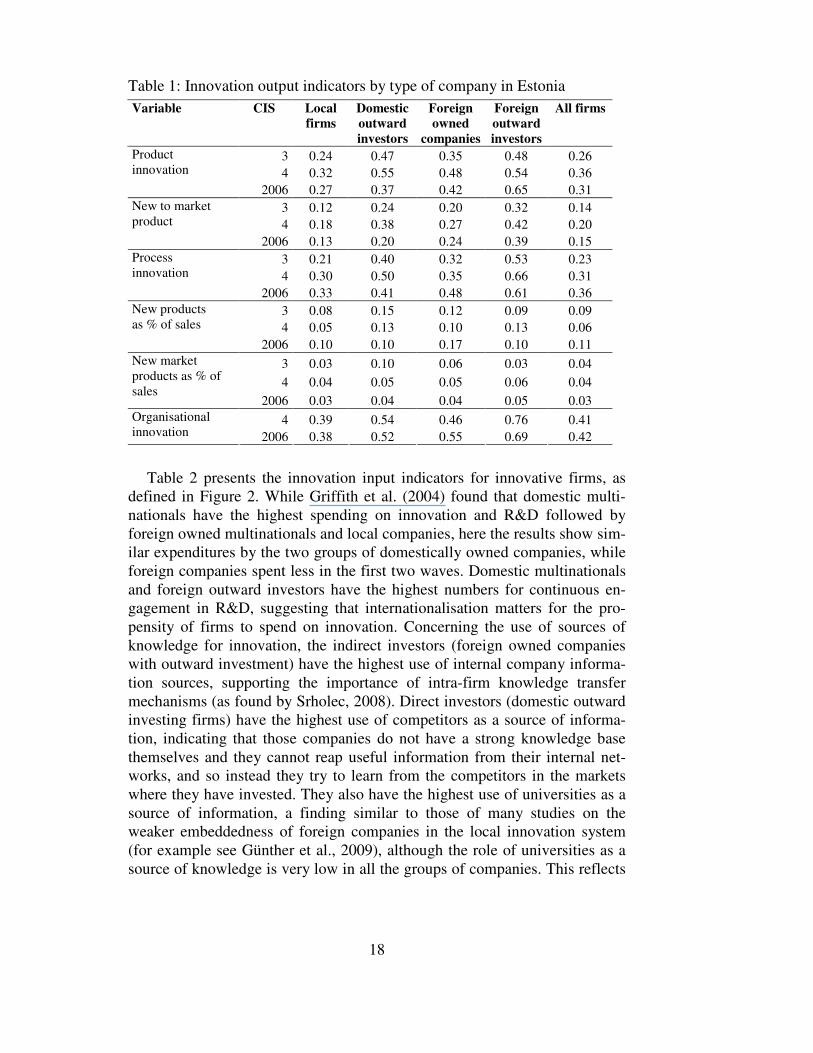
The next tables provide preliminary descriptive evidence on the relation-ship between FDI and innovation inputs and outputs according to Estonian CIS data. Table 1 shows the differences between different groups of compa-nies in terms of various innovation output indicators. For most output indica-tors, domestic multinationals and foreign owned multinationals with outward investments are much more innovative than are simply foreign owned com-panies, while purely local companies are clearly in last place for innovation. Earlier studies have also revealed that direct investors demonstrate relatively high levels of productivity and job creation (Masso et al., 2008). These num-bers are, on the one hand, in accordance with many earlier studies on the higher innovativeness of domestically owned multinationals compared to for-eign owned multinationals (Johansson et al., 2008), while on the other hand they also indicate that the latter group is quite heterogenous in its innovative-ness. One explanation and part of the story in our case is that the foreign owned companies without outward investments are small and medium sized companies belonging to Scandinavian investors and not big multinationals. Given that, we have used here the 4-group classification of the companies in-stead of the classification used by Griffith et al. (2004). When imitative inno-vations which are new to the firm are compared with real innovations which are new to the market, the ranking is the same for radical product innovations that are new to the market, while for asset-exploiting strategies a lower level of novelty in innovation output is expected (Dachs and Ebersberger, 2009); however we can also see that local companies in particular make relatively more innovations that are new only to the firm. The share of radical innova-tions in sales is highest among the domestic multinationals in CIS3. This result is in line with the finding of Sadowski and Sadowski-Rasters (2008) that although foreign companies had a higher frequency of product innova-tions, there was a smaller difference in radical innovations.
18
Table 1: Innovation output indicators by type of company in Estonia
Variable CIS Local firms
Domestic outward investors
Foreign owned
companies
Foreign outward investors
All firms
3 0.24 0.47 0.35 0.48 0.26 4 0.32 0.55 0.48 0.54 0.36
Product innovation
2006 0.27 0.37 0.42 0.65 0.31 3 0.12 0.24 0.20 0.32 0.14 4 0.18 0.38 0.27 0.42 0.20
New to market product
2006 0.13 0.20 0.24 0.39 0.15 3 0.21 0.40 0.32 0.53 0.23 4 0.30 0.50 0.35 0.66 0.31
Process innovation
2006 0.33 0.41 0.48 0.61 0.36 3 0.08 0.15 0.12 0.09 0.09 4 0.05 0.13 0.10 0.13 0.06
New products as % of sales
2006 0.10 0.10 0.17 0.10 0.11 3 0.03 0.10 0.06 0.03 0.04 4 0.04 0.05 0.05 0.06 0.04
New market products as % of sales
2006 0.03 0.04 0.04 0.05 0.03 4 0.39 0.54 0.46 0.76 0.41 Organisational
innovation 2006 0.38 0.52 0.55 0.69 0.42
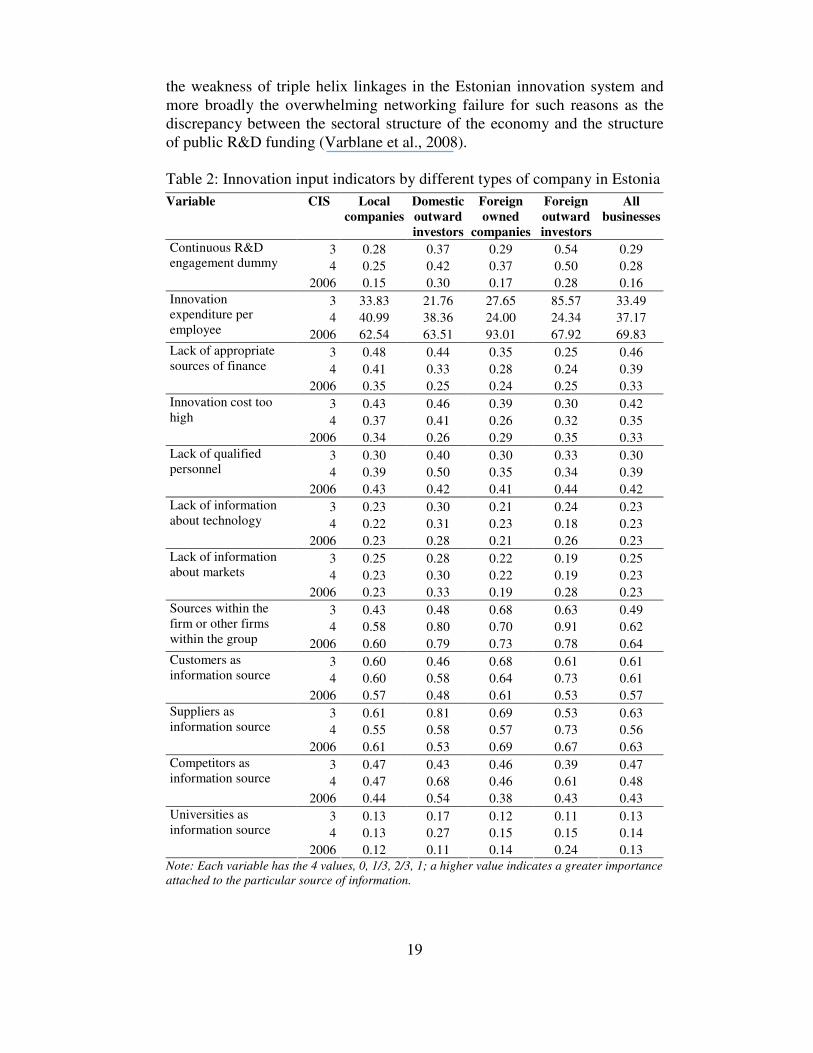
Table 2 presents the innovation input indicators for innovative firms, as defined in Figure 2. While Griffith et al. (2004) found that domestic multi-nationals have the highest spending on innovation and R&D followed by foreign owned multinationals and local companies, here the results show sim-ilar expenditures by the two groups of domestically owned companies, while foreign companies spent less in the first two waves. Domestic multinationals and foreign outward investors have the highest numbers for continuous en-gagement in R&D, suggesting that internationalisation matters for the pro-pensity of firms to spend on innovation. Concerning the use of sources of knowledge for innovation, the indirect investors (foreign owned companies with outward investment) have the highest use of internal company informa-tion sources, supporting the importance of intra-firm knowledge transfer mechanisms (as found by Srholec, 2008). Direct investors (domestic outward investing firms) have the highest use of competitors as a source of informa-tion, indicating that those companies do not have a strong knowledge base themselves and they cannot reap useful information from their internal net-works, and so instead they try to learn from the competitors in the markets where they have invested. They also have the highest use of universities as a source of information, a finding similar to those of many studies on the weaker embeddedness of foreign companies in the local innovation system (for example see Günther et al., 2009), although the role of universities as a source of knowledge is very low in all the groups of companies. This reflects
19
the weakness of triple helix linkages in the Estonian innovation system and more broadly the overwhelming networking failure for such reasons as the discrepancy between the sectoral structure of the economy and the structure of public R&D funding (Varblane et al., 2008).
Table 2: Innovation input indicators by different types of company in Estonia
Variable CIS Local companies
Domestic outward investors
Foreign owned
companies
Foreign outward investors
All businesses
3 0.28 0.37 0.29 0.54 0.29 4 0.25 0.42 0.37 0.50 0.28
Continuous R&D engagement dummy
2006 0.15 0.30 0.17 0.28 0.16 3 33.83 21.76 27.65 85.57 33.49 4 40.99 38.36 24.00 24.34 37.17
Innovation expenditure per employee 2006 62.54 63.51 93.01 67.92 69.83
3 0.48 0.44 0.35 0.25 0.46 4 0.41 0.33 0.28 0.24 0.39
Lack of appropriate sources of finance
2006 0.35 0.25 0.24 0.25 0.33 3 0.43 0.46 0.39 0.30 0.42 4 0.37 0.41 0.26 0.32 0.35
Innovation cost too high
2006 0.34 0.26 0.29 0.35 0.33 3 0.30 0.40 0.30 0.33 0.30 4 0.39 0.50 0.35 0.34 0.39
Lack of qualified personnel
2006 0.43 0.42 0.41 0.44 0.42 3 0.23 0.30 0.21 0.24 0.23 4 0.22 0.31 0.23 0.18 0.23
Lack of information about technology
2006 0.23 0.28 0.21 0.26 0.23 3 0.25 0.28 0.22 0.19 0.25 4 0.23 0.30 0.22 0.19 0.23
Lack of information about markets
2006 0.23 0.33 0.19 0.28 0.23 3 0.43 0.48 0.68 0.63 0.49 4 0.58 0.80 0.70 0.91 0.62
Sources within the firm or other firms within the group 2006 0.60 0.79 0.73 0.78 0.64
3 0.60 0.46 0.68 0.61 0.61 4 0.60 0.58 0.64 0.73 0.61
Customers as information source
2006 0.57 0.48 0.61 0.53 0.57 3 0.61 0.81 0.69 0.53 0.63 4 0.55 0.58 0.57 0.73 0.56
Suppliers as information source
2006 0.61 0.53 0.69 0.67 0.63 3 0.47 0.43 0.46 0.39 0.47 4 0.47 0.68 0.46 0.61 0.48
Competitors as information source
2006 0.44 0.54 0.38 0.43 0.43 3 0.13 0.17 0.12 0.11 0.13 4 0.13 0.27 0.15 0.15 0.14
Universities as information source
2006 0.12 0.11 0.14 0.24 0.13 Note: Each variable has the 4 values, 0, 1/3, 2/3, 1; a higher value indicates a greater importance attached to the particular source of information.

20
Among the different factors impeding innovative activities according to earlier works (e.g. Dachs and Ebersberger, 2009), innovation barriers are more serious for both groups of domestically owned firms than for foreign owned firms; the biggest difference between foreign and domestic firms is found in the lack of financing and the cost of innovation. This fits in with earlier studies showing that Estonian domestically owned firms are financial-ly constrained (Mickiwicz et al., 2006) and that the capital markets are gener-ally less developed, meaning that FDI is important as a supply of funding. For the three groups other than foreign outward investors the problems with funding decreased over time, reflecting the strong inflow of capital in the form of both loans and FDI into Estonia during that period (see for example OECD, 2009). Experience of internationalisation is reducing the severity of these barriers for domestic companies, though at the same time domestic multinationals have the largest problems related to personnel and to informa-tion about technology.
4. Results of the econometric analysis
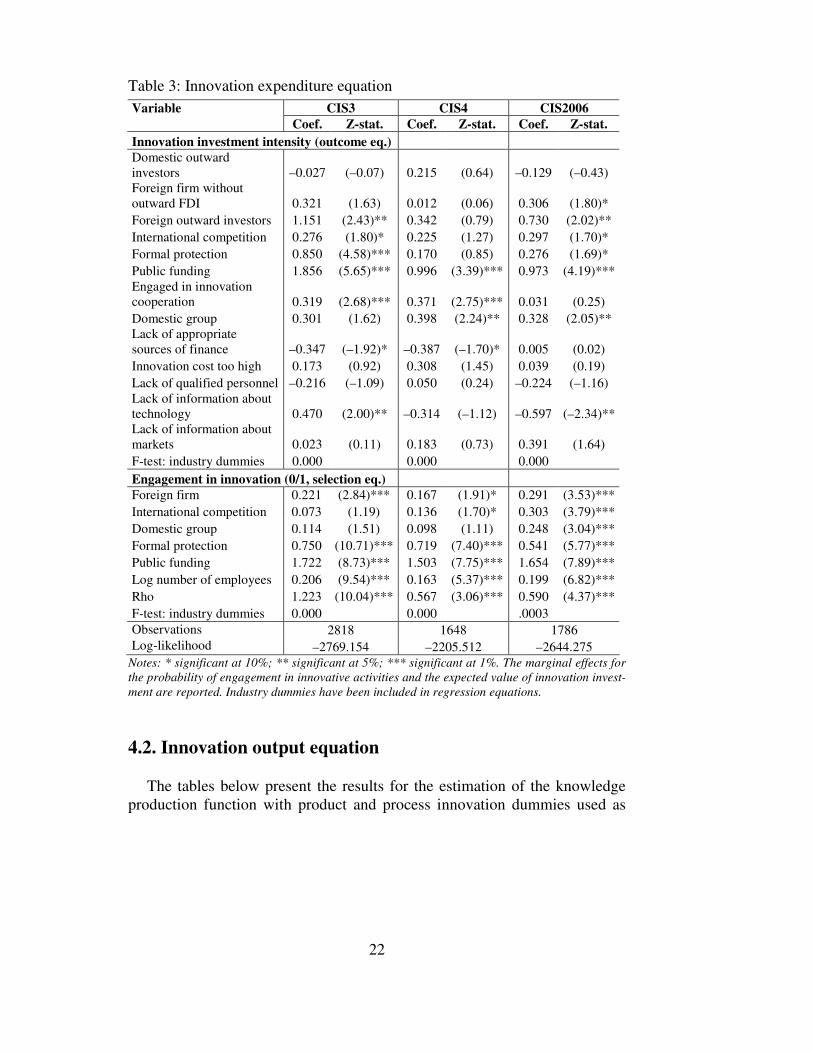
4.1. Innovation expenditure equation Table 3 presents the results of the estimation of the Heckman equation
with a selection model for engagement in innovation and the outcome equa-tion for the intensity of innovation expenditures as log innovation expendi-ture per employee. As we can see, while Johansson et al. (2008) and Dachs et al. (2008) found the likelihood of foreign companies making non-zero inno-vation expenditures to be either lower or insignificantly different from the domestic firms, in our case the parameter is positive.6 Both the engagement in innovation and the size of innovation expenditures increase with the pres-ence of public funding, a result that is similar to earlier results on Estonia (Masso and Vahter, 2008; Knell, 2008) and other countries (OECD, 2009), although the extent of public support for innovation in enterprises has been limited in Estonia; in 2006, for example, only 9% of firms with innovation activities received public funding, a level that was the second lowest in the EU. The finding that both openness to international competition through ex-ports and formal protection only really affect significantly engagement in in-novation and not its intensity, although this did vary between the waves, is similar to the results by Griffith et al. (2006); however Masso and Vahter
6 The parameter becomes insignificant after the dummy for group membership is in-
cluded (this is usually found to have a significant impact on the innovation propensity; OECD, 2009) as FDI firms are almost by definition part of a group of companies (although the correlation between the two dummies in our data is just 0.35); because of this in all re-gressions we used the dummy for domestic companies belonging to groups instead.
21
(2008) used a similar approach for the sample of Estonian manufacturing companies only, and found the variable to be significant in both equations. While operation in a foreign market was found to impact engagement in innovation positively in almost all the countries covered by the cross-country study by the OECD (2009), here it is significant only for the second and third waves, although the parameter is increasing over time. An explanation for the results could be that exports are dominated by labour intensive production, which does not require significant investments in R&D.
Concerning expenditure on innovation, foreign ownership as such has a positive impact only in one of the three waves (similar to Dachs et al., 2008), while foreign outward investors spent more in waves 4 and 2006. While Johansson et al. (2008) found that domestic multinationals outperform other companies in terms of R&D investments, here the variable for this is insignif-icant. Domestic companies that are members of groups also have higher ex-penditure on innovation. One explanation for the many insignificant param-eter estimates could be that the impact of ownership is captured by other ex-planatory variables such as the factors impeding innovation, which, as we saw, affect foreign companies much less, and of which only the lack of finance and the lack of information about technology exert a statistically sig-nificant negative impact on the intensity of spending on innovation. The variable for lack of funding became insignificant during 2004–2006, which can be explained by the improvement in that period in the ability of com-panies to fund expenditures both from internal sources, due to high profits, and from external funding such as improved access to bank loans during a period of strong macroeconomic growth in Estonia. Company size having a strong positive impact on engagement in innovation is in line with earlier studies and the Schumpeterian hypothesis that large companies in concen-trated markets are more likely to innovate, though the causal relationship with innovation could go both ways, as successful innovation may help firms to grow. These results are mostly in line with the earlier studies, like Masso and Vahter (2008) and Knell (2008). Engagement in cooperation in innova-tion leading to an increase in the innovation expenditures seems to be in line with estimates from several other countries (OECD, 1999).
22
Table 3: Innovation expenditure equation
CIS3 CIS4 CIS2006 Variable Coef. Z-stat. Coef. Z-stat. Coef. Z-stat.
Innovation investment intensity (outcome eq.) Domestic outward investors –0.027 (–0.07) 0.215 (0.64) –0.129 (–0.43) Foreign firm without outward FDI 0.321 (1.63) 0.012 (0.06) 0.306 (1.80)* Foreign outward investors 1.151 (2.43)** 0.342 (0.79) 0.730 (2.02)** International competition 0.276 (1.80)* 0.225 (1.27) 0.297 (1.70)* Formal protection 0.850 (4.58)*** 0.170 (0.85) 0.276 (1.69)* Public funding 1.856 (5.65)*** 0.996 (3.39)*** 0.973 (4.19)*** Engaged in innovation cooperation 0.319 (2.68)*** 0.371 (2.75)*** 0.031 (0.25) Domestic group 0.301 (1.62) 0.398 (2.24)** 0.328 (2.05)** Lack of appropriate sources of finance –0.347 (–1.92)* –0.387 (–1.70)* 0.005 (0.02) Innovation cost too high 0.173 (0.92) 0.308 (1.45) 0.039 (0.19) Lack of qualified personnel –0.216 (–1.09) 0.050 (0.24) –0.224 (–1.16) Lack of information about technology 0.470 (2.00)** –0.314 (–1.12) –0.597 (–2.34)** Lack of information about markets 0.023 (0.11) 0.183 (0.73) 0.391 (1.64) F-test: industry dummies 0.000 0.000 0.000 Engagement in innovation (0/1, selection eq.) Foreign firm 0.221 (2.84)*** 0.167 (1.91)* 0.291 (3.53)*** International competition 0.073 (1.19) 0.136 (1.70)* 0.303 (3.79)*** Domestic group 0.114 (1.51) 0.098 (1.11) 0.248 (3.04)*** Formal protection 0.750 (10.71)*** 0.719 (7.40)*** 0.541 (5.77)*** Public funding 1.722 (8.73)*** 1.503 (7.75)*** 1.654 (7.89)*** Log number of employees 0.206 (9.54)*** 0.163 (5.37)*** 0.199 (6.82)*** Rho 1.223 (10.04)*** 0.567 (3.06)*** 0.590 (4.37)*** F-test: industry dummies 0.000 0.000 .0003 Observations 2818 1648 1786 Log-likelihood –2769.154 –2205.512 –2644.275
Notes: * significant at 10%; ** significant at 5%; *** significant at 1%. The marginal effects for the probability of engagement in innovative activities and the expected value of innovation invest-ment are reported. Industry dummies have been included in regression equations. 4.2. Innovation output equation
The tables below present the results for the estimation of the knowledge
production function with product and process innovation dummies used as
23
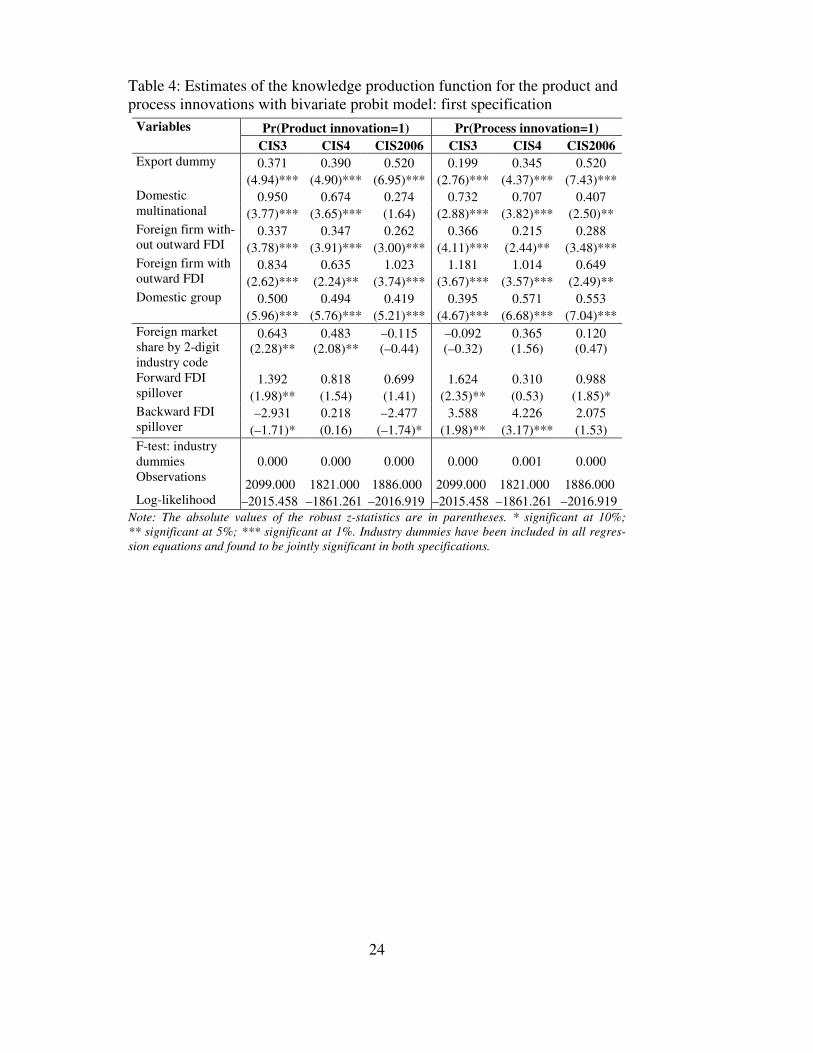
the innovation output variable (as in Griffith et al., 2006).7 We estimated the equation using two specifications, one with only the firm ownership variables and the presence of FDI at industry level (Table 4), and the other with the whole set of explanatory variables (Table 5). In the first specification, all three other groups of companies, including the domestic companies that are members of a group, have a significantly higher innovation output relative to the reference category of local companies. However, once we include other variables in the equation, most of the ownership variables, with the exception of domestic multinationals in CIS 3, cease to be positive and significant; in fact the negative parameter estimates for foreign companies indicate that after several factors have been controlled for they are actually less innovative than are domestic companies. This result contradicts those of Criscuolo et al. (2005), Dachs et al. (2008) and Johansson et al. (2008) among others. It might indicate that the differences between these groups are quite well cap-tured by their different expenditures and knowledge flows.8 Though many of these earlier results were also obtained for relatively small countries, our re-sults could still indicate that in a market as small as Estonia, foreign com-panies may have fewer incentives to innovate. This is also borne out in sur-veys of foreign investors, who have indicated the small size of the market as an impediment to innovation. The dummy for exports is significant in the specification that only uses ownership variables, but becomes insignificant for most waves after other variables are included.
In addition to the “own-firm” effect of FDI discussed earlier, FDI may also impact firm performance and behaviour including innovativeness more indirectly through spillover effects from the presence of FDI in other com-panies in the same industry (horizontal spillovers) or in upstream or down-stream industries (vertical spillovers). Here the horizontal spillover effects are captured by the employment share of other FDI owned businesses in the 2-digit industries. So far only a small number of studies have looked at the impact of FDI spillovers on innovation output. Among those which have, both Bertschek (1995) and Blind and Jungmittag (2006) found that in Ger-many the higher market share of foreign-owned companies was associated with higher propensity to innovate and Girma et al. (2006) found the sector-level impact to be negative on Chinese state-owned enterprises but positive for companies with higher absorptive capacity, such as companies that export or invest in R&D or human capital, or that have previously introduced pro-duct innovations.
7 We also undertook estimations where the innovation output indicator was sales from new products per employee (used in many other studies, like OECD, 2009; Lööf et al., 2003); the results were qualitatively similar.
8 Export dummy, FDI dummies and the company size variable could be quite strongly correlated, creating possible autocorrelation problems; however, if the export dummy is ex-cluded from the model, the size of the estimated coefficient does not change significantly.
24
Table 4: Estimates of the knowledge production function for the product and process innovations with bivariate probit model: first specification
Pr(Product innovation=1) Pr(Process innovation=1) Variables CIS3 CIS4 CIS2006 CIS3 CIS4 CIS2006 0.371 0.390 0.520 0.199 0.345 0.520 Export dummy
(4.94)*** (4.90)*** (6.95)*** (2.76)*** (4.37)*** (7.43)*** 0.950 0.674 0.274 0.732 0.707 0.407 Domestic
multinational (3.77)*** (3.65)*** (1.64) (2.88)*** (3.82)*** (2.50)** 0.337 0.347 0.262 0.366 0.215 0.288 Foreign firm with-
out outward FDI (3.78)*** (3.91)*** (3.00)*** (4.11)*** (2.44)** (3.48)*** 0.834 0.635 1.023 1.181 1.014 0.649 Foreign firm with
outward FDI (2.62)*** (2.24)** (3.74)*** (3.67)*** (3.57)*** (2.49)** Domestic group 0.500 0.494 0.419 0.395 0.571 0.553 (5.96)*** (5.76)*** (5.21)*** (4.67)*** (6.68)*** (7.04)***
0.643 0.483 –0.115 –0.092 0.365 0.120 Foreign market share by 2-digit industry code
(2.28)** (2.08)** (–0.44) (–0.32) (1.56) (0.47)
1.392 0.818 0.699 1.624 0.310 0.988 Forward FDI spillover (1.98)** (1.54) (1.41) (2.35)** (0.53) (1.85)*
–2.931 0.218 –2.477 3.588 4.226 2.075 Backward FDI spillover (–1.71)* (0.16) (–1.74)* (1.98)** (3.17)*** (1.53) F-test: industry dummies 0.000 0.000 0.000 0.000 0.001 0.000 Observations 2099.000 1821.000 1886.000 2099.000 1821.000 1886.000 Log-likelihood –2015.458 –1861.261 –2016.919 –2015.458 –1861.261 –2016.919
Note: The absolute values of the robust z-statistics are in parentheses. * significant at 10%; ** significant at 5%; *** significant at 1%. Industry dummies have been included in all regres-sion equations and found to be jointly significant in both specifications.

25
Table 5: Estimates of the knowledge production function for the product and process innovations with bivariate probit model: second specification
Pr(Product innovation=1) Pr(Process innovation=1) Variables CIS3 CIS4 CIS2006 CIS3 CIS4 CIS2006 0.183 –0.093 –0.056 –0.145 –0.158 –0.175 Export dummy
(1.78)* (–0.78) (–0.51) (–1.50) (–1.42) (–1.63) 0.582 –0.182 –0.122 0.110 0.017 0.031 Domestic
multinational (1.87)* (–0.68) (–0.45) (0.34) (0.06) (0.12) –0.321 –0.103 –0.147 –0.295 –0.366 –0.215 Foreign firm with-
out outward FDI (–2.09)** (–0.81) (–1.23) (–2.12)**
(–2.75)*** (–1.61)
0.081 –0.450 0.331 0.407 0.222 –0.395 Foreign firm with outward FDI (0.22) (–1.30) (0.97) (1.17) (0.83) (–0.91) Domestic group –0.044 –0.330 –0.212 –0.342 –0.207 –0.123 (–0.36) (–2.22)** (–1.78)* (–2.55)** (–1.54) (–1.06)
0.820 0.380 –0.167 –0.165 0.195 0.189 Foreign market share in 2-digit industry (2.18)** (1.23) (–0.47) (–0.39) (0.67) (0.53)
0.542 1.404 0.657 1.321 0.071 1.471 Forward FDI spillover (0.64) (1.75)* (0.92) (1.43) (0.10) (2.33)**
–5.753 –2.238 –3.511 4.634 4.872 2.597 Backward FDI spillover (–2.48)** (–1.23) (–1.89)* (1.99)** (3.08)*** (1.50)
0.277 0.684 0.396 0.513 0.347 0.441 Innovation expenditure (pred.) (2.31)** (4.30)*** (2.80)*** (4.28)*** (2.29)** (2.85)***
0.105 0.355 0.326 –0.619 0.046 0.099 Formal protection (0.71) (2.52)** (2.37)** (–3.92)*** (0.32) (0.68)
1.896 1.223 1.382 1.979 0.911 0.954 Sources within firm or group (7.99)*** (8.69)*** (10.47)*** (8.49)*** (6.21)*** (6.72)***
0.274 0.647 0.546 0.449 0.345 0.298 Competitors (1.35) (3.25)*** (2.93)*** (2.27)** (1.79)* (1.43)
1.288 1.226 1.334 0.131 0.325 0.267 Customers (7.26)*** (7.17)*** (7.83)*** (0.69) (1.74)* (1.40)
0.592 0.240 0.248 1.547 1.627 2.230 Suppliers (3.97)*** (1.58) (1.89)* (10.76)*** (11.51)*** (15.73)***
–0.014 –0.078 –0.114 0.072 0.125 0.098 Log number of employees (–0.31) (–1.68)* (–2.43)** (1.82)* (2.67)*** (2.24)** F-test: industry dummies .0802 .0074 .0171 .0071 .0363 .0475 Observations 2076.000 1463.000 1631.000 2076.000 1463.000 1631.000 Log-likelihood –1184.528 –1047.897 –1143.834 –1184.528 –1047.897 –1143.834 Note: Absolute values of robust z-statistics are in parentheses. * significant at 10%; ** significant at 5%; *** significant at 1%. The t-statistics in parentheses are robust. The coefficients reported are the marginal effects from the probit model on the sample mean values. Industry dummies have been included in all regression equations and found to be jointly significant in both specifications.
26
As the tables show, the correlation between innovativeness and the hori-zontal spillover variable is positive and significant in CIS3, indicating that the presence of FDI in the industry is indeed associated with an increase in innovativeness, possibly due either to the stronger competitive pressure or to the knowledge flows from FDI companies to other companies that result from the flows of people, demonstration effects and other mechanisms that are not nullified by the business-stealing effect. This result is encouraging as it is quite often difficult to find robust evidence for the presence of FDI spill-over effects in productivity regressions (for an example, for Estonia see Vah-ter and Masso, 2007), while the insignificant results could indicate that there is no negative competition effect (as was found by Girma et al., 2006). How-ever, we stress that this is only a correlation here and this is not evidence in favour of the causal effects because FDI is quite likely endogenous, as for-eign presence at industry level may also be affected by the productivity and innovativeness of an industry.9 Concerning vertical spillovers (impact from foreign presence in downstream or upstream industries), there are some sig-nificant estimates for forward spillovers, such as foreign companies helping to upgrade the production operations of their local distributors. Some nega-tive impact can be seen from backward spillovers for product innovations (found also by Girma et al., 2006), but it is more difficult to give an econom-ic interpretation of this, and some positive impact can be seen on process in-novations, where the presence of foreign companies in upstream industries could improve the quality of the intermediate inputs purchased and lower costs.
The other variables in the equations have the expected signs. The pre-dicted intensity of expenditure on innovation exerts a positive impact for both types of technological innovation, something that holds quite well across dif-ferent countries (see OECD, 2009 and Griffith et al., 2006). Customers are important sources of information for product innovation and competitors for both types of innovation, while information sources within the company are significant in all specifications (is similar to the results by Masso and Vahter, 2008 on manufacturing). The positive value for the variable for competitors might show that companies are not able to prevent other companies from ob-taining information about their production processes and that this knowledge spills over to other companies. The protection of innovation using formal methods is more important for product than process innovation, which could be because protection using formal methods is more often applied to product than process innovation. Firm size has an insignificant or negative impact on product and a positive impact on process innovation, so the Schumpeterian
9 A possible solution for tackling these problems is to instrument the presence or entry of
multinationals in the industry using the values of this variable in other countries in the same industry (Haskel et al., 2009; Vahter, 2009).
27
hypothesis is only confirmed for process innovation10, possibly because most product innovations are largely incremental, and thus, do not require large expenditures on R&D that only large companies can afford. On the other hand process innovations in the larger firms may produce significant positive results and improve the competitiveness of the company.
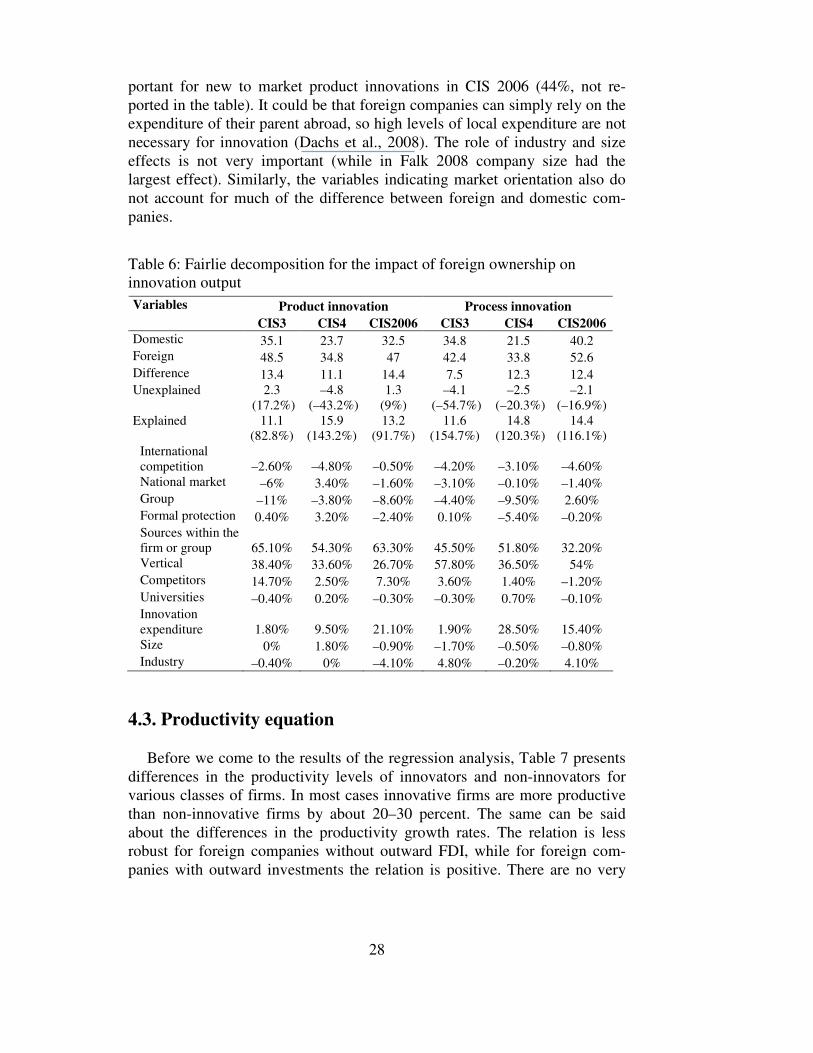
The final table in this section presents the Fairlie decomposition of the im-portance of different factors for explaining the differences between the proba-bilities of foreign and domestic companies innovating. This exercise can be called innovation accounting (Mairesse and Mohnen, 2002)11, and here we employ the methodological approach used by Falk (2008). In this, two binary probit regressions were run for domestic and foreign companies respectively, and the difference was decomposed using the estimated parameters and aver-age values of the explanatory variables in the two groups.12 The main result was that the different explanatory variables for the knowledge production function completely accounted for the innovation gap between foreign and domestic companies, meaning there does not seem to be much role behind the innovation gap for unobserved factors. What is more, in a few cases the difference in innovation output that cannot be explained by the differences in explanatory variables has the opposite sign to the raw difference, meaning that as with the results of the regressions presented above, if foreign and domestic companies have similar characteristics such as innovation expendi-ture and use various of sources of information, domestic companies are more innovative. The explained part of the difference can be further divided into various factors. The use of information within the group is quite important for explaining the higher frequency of product innovations by foreign owned companies (from 32% to up to 65%), while somewhat less so for process in-novations (32–52%); it could be that the somewhat more radical product innovations rely more on specific knowledge within the group while for proc-ess innovations that source is less critical. Differences in expenditure on innovation account for 2–29% of the innovation output gap; this is more im-
10 Although, to be exact, Schumpeter did not state that there should be a positive linear
relationship between innovativeness and company size, rather that in order to reap the bene-fits from innovation a company should have market power that could originate not only from company size but also from intellectual property rights, branding or limited substitutability of product (the authors are grateful to Priit Vahter for this remark).
11 Mairesse and Mohnen (2002) looked at the importance of different factors in account-ing for inter-country differences in the innovation intensity (as a share of innovative sales) of R&D intensive industries of European countries. Criscuolo et al. (2005) used the framework to decompose the differences in the number of patents and the presence of technological in-novations between companies with different global engagements (multinational parent vs do-mestic, multinational affiliate vs domestic, exporter vs domestic). Falk (2008) decomposed the differences between the innovativeness of foreign and domestic companies.
12 The list of explanatory variables was in innovation accounting somewhat different, for example we excluded the FDI spillover variables.
28
portant for new to market product innovations in CIS 2006 (44%, not re-ported in the table). It could be that foreign companies can simply rely on the expenditure of their parent abroad, so high levels of local expenditure are not necessary for innovation (Dachs et al., 2008). The role of industry and size effects is not very important (while in Falk 2008 company size had the largest effect). Similarly, the variables indicating market orientation also do not account for much of the difference between foreign and domestic com-panies.
Table 6: Fairlie decomposition for the impact of foreign ownership on innovation output
Product innovation Process innovation Variables CIS3 CIS4 CIS2006 CIS3 CIS4 CIS2006
Domestic 35.1 23.7 32.5 34.8 21.5 40.2 Foreign 48.5 34.8 47 42.4 33.8 52.6 Difference 13.4 11.1 14.4 7.5 12.3 12.4 Unexplained 2.3
(17.2%) –4.8
(–43.2%) 1.3
(9%) –4.1
(–54.7%) –2.5
(–20.3%) –2.1
(–16.9%) Explained 11.1
(82.8%) 15.9
(143.2%) 13.2
(91.7%) 11.6
(154.7%) 14.8
(120.3%) 14.4
(116.1%) International competition –2.60% –4.80% –0.50% –4.20% –3.10% –4.60% National market –6% 3.40% –1.60% –3.10% –0.10% –1.40% Group –11% –3.80% –8.60% –4.40% –9.50% 2.60% Formal protection 0.40% 3.20% –2.40% 0.10% –5.40% –0.20% Sources within the firm or group 65.10% 54.30% 63.30% 45.50% 51.80% 32.20% Vertical 38.40% 33.60% 26.70% 57.80% 36.50% 54% Competitors 14.70% 2.50% 7.30% 3.60% 1.40% –1.20% Universities –0.40% 0.20% –0.30% –0.30% 0.70% –0.10% Innovation expenditure 1.80% 9.50% 21.10% 1.90% 28.50% 15.40% Size 0% 1.80% –0.90% –1.70% –0.50% –0.80% Industry –0.40% 0% –4.10% 4.80% –0.20% 4.10%
4.3. Productivity equation
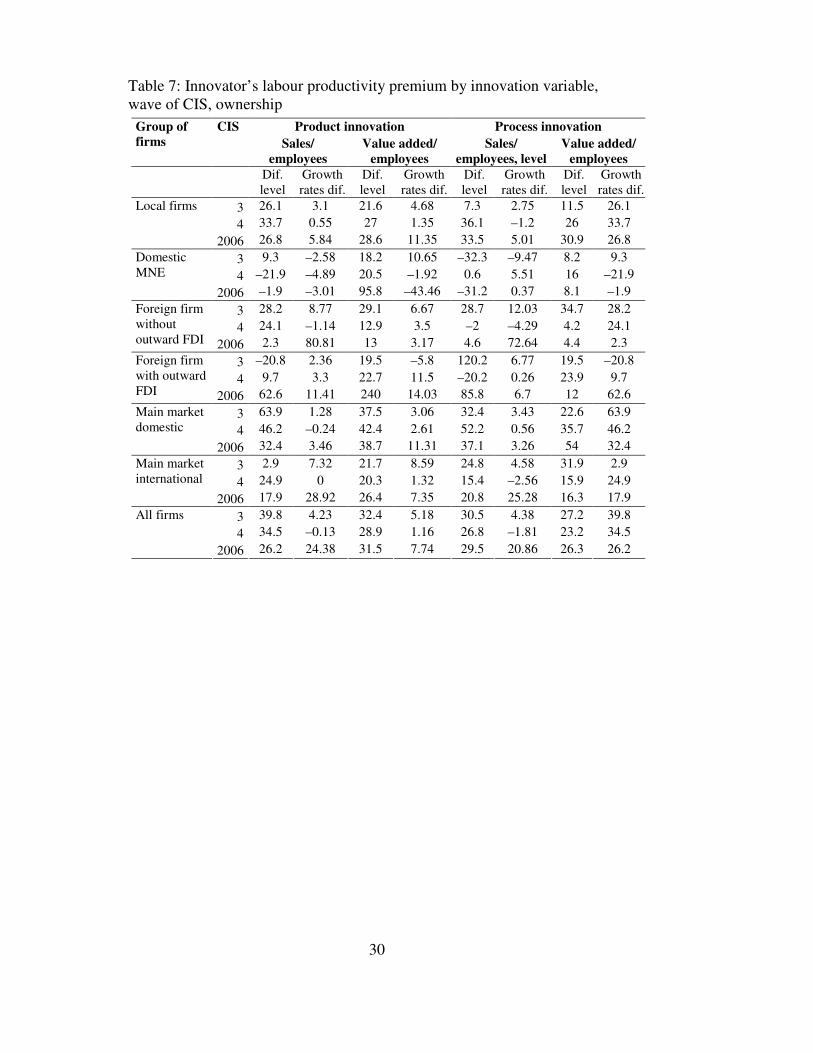
Before we come to the results of the regression analysis, Table 7 presents
differences in the productivity levels of innovators and non-innovators for various classes of firms. In most cases innovative firms are more productive than non-innovative firms by about 20–30 percent. The same can be said about the differences in the productivity growth rates. The relation is less robust for foreign companies without outward FDI, while for foreign com-panies with outward investments the relation is positive. There are no very
29
big differences across the three waves of the CIS survey. The variable for for-eign market orientation showed that in CIS3 (1998–2000) the companies for which the international market was the most important had much higher pro-ductivity growth, while in CIS4 (2002–2004) the difference was much smaller and in many cases favoured companies with domestic market orienta-tion. The difference between the labour productivity growth rates of innova-tive and non-innovative companies fell, especially for the companies oriented to foreign markets. In case of foreign market oriented companies with proc-ess innovations the productivity growth rate actually turned out to be nega-tive. The weaker and less robust impact of innovations on productivity growth in the second period again contributes to the story of a lower impact from innovations during periods of strong economic growth.13
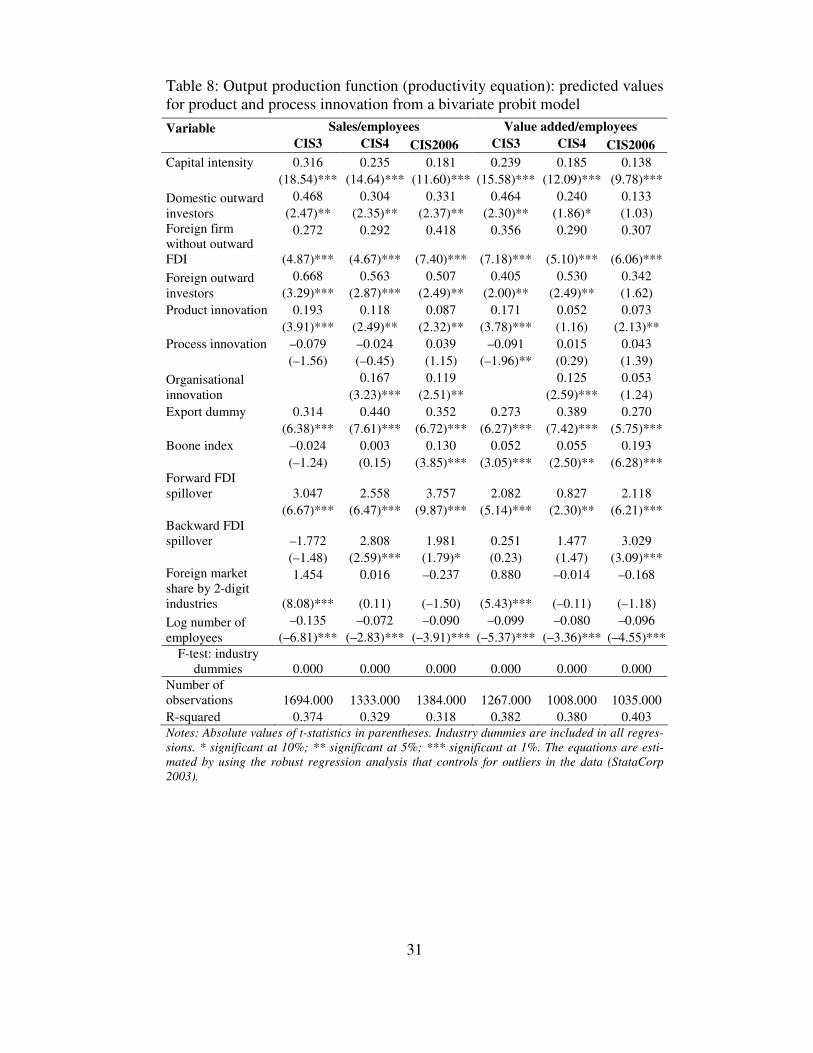
Table 8 presents the estimates of the productivity equation. We employ here two measures of productivity, sales and value added per employee. In both cases the dependent variable is the natural log of productivity thus the parameter estimates presented are the elasticities or semi-elasticities of labour productivity in relation to innovation variables and other company-level variables. However, bevause capital-intensity belongs in the list of right-hand side variables we are in fact measuring the impact on total factor productivi-ty.
13 Similarly, Terk et al. (2007) noted that while in 1998–2000 innovative companies had
significantly higher sales growth than non-innovative companies (16.9 and 4.4% respec-tively), in 2002–2004 the difference was negligible (14.4 and 13.0% respectively). This indicates that during the period of rapid economic growth (the latter period in this case) it is possible to increase sales without innovations. Notably however, innovativeness still mattered for sales growth in manufacturing.
30
Table 7: Innovator’s labour productivity premium by innovation variable, wave of CIS, ownership
Product innovation Process innovation Group of firms
CIS Sales/
employees Value added/
employees Sales/
employees, level Value added/
employees Dif.
level Growth rates dif.
Dif. level
Growth rates dif.
Dif. level
Growth rates dif.
Dif. level
Growth rates dif.
3 26.1 3.1 21.6 4.68 7.3 2.75 11.5 26.1 4 33.7 0.55 27 1.35 36.1 –1.2 26 33.7
Local firms
2006 26.8 5.84 28.6 11.35 33.5 5.01 30.9 26.8 3 9.3 –2.58 18.2 10.65 –32.3 –9.47 8.2 9.3 4 –21.9 –4.89 20.5 –1.92 0.6 5.51 16 –21.9
Domestic MNE 2006 –1.9 –3.01 95.8 –43.46 –31.2 0.37 8.1 –1.9
3 28.2 8.77 29.1 6.67 28.7 12.03 34.7 28.2 4 24.1 –1.14 12.9 3.5 –2 –4.29 4.2 24.1
Foreign firm without outward FDI 2006 2.3 80.81 13 3.17 4.6 72.64 4.4 2.3
3 –20.8 2.36 19.5 –5.8 120.2 6.77 19.5 –20.8 4 9.7 3.3 22.7 11.5 –20.2 0.26 23.9 9.7
Foreign firm with outward FDI 2006 62.6 11.41 240 14.03 85.8 6.7 12 62.6
3 63.9 1.28 37.5 3.06 32.4 3.43 22.6 63.9 4 46.2 –0.24 42.4 2.61 52.2 0.56 35.7 46.2
Main market domestic
2006 32.4 3.46 38.7 11.31 37.1 3.26 54 32.4 3 2.9 7.32 21.7 8.59 24.8 4.58 31.9 2.9 4 24.9 0 20.3 1.32 15.4 –2.56 15.9 24.9
Main market international
2006 17.9 28.92 26.4 7.35 20.8 25.28 16.3 17.9 3 39.8 4.23 32.4 5.18 30.5 4.38 27.2 39.8 4 34.5 –0.13 28.9 1.16 26.8 –1.81 23.2 34.5
All firms
2006 26.2 24.38 31.5 7.74 29.5 20.86 26.3 26.2
31
Table 8: Output production function (productivity equation): predicted values for product and process innovation from a bivariate probit model
Variable Sales/employees Value added/employees CIS3 CIS4 CIS2006 CIS3 CIS4 CIS2006 Capital intensity 0.316 0.235 0.181 0.239 0.185 0.138 (18.54)*** (14.64)*** (11.60)*** (15.58)*** (12.09)*** (9.78)***
0.468 0.304 0.331 0.464 0.240 0.133 Domestic outward investors (2.47)** (2.35)** (2.37)** (2.30)** (1.86)* (1.03)
0.272 0.292 0.418 0.356 0.290 0.307 Foreign firm without outward FDI (4.87)*** (4.67)*** (7.40)*** (7.18)*** (5.10)*** (6.06)***
0.668 0.563 0.507 0.405 0.530 0.342 Foreign outward investors (3.29)*** (2.87)*** (2.49)** (2.00)** (2.49)** (1.62) Product innovation 0.193 0.118 0.087 0.171 0.052 0.073 (3.91)*** (2.49)** (2.32)** (3.78)*** (1.16) (2.13)** Process innovation –0.079 –0.024 0.039 –0.091 0.015 0.043 (–1.56) (–0.45) (1.15) (–1.96)** (0.29) (1.39)
0.167 0.119 0.125 0.053 Organisational innovation (3.23)*** (2.51)** (2.59)*** (1.24) Export dummy 0.314 0.440 0.352 0.273 0.389 0.270 (6.38)*** (7.61)*** (6.72)*** (6.27)*** (7.42)*** (5.75)*** Boone index –0.024 0.003 0.130 0.052 0.055 0.193 (–1.24) (0.15) (3.85)*** (3.05)*** (2.50)** (6.28)*** Forward FDI spillover 3.047 2.558 3.757 2.082 0.827 2.118 (6.67)*** (6.47)*** (9.87)*** (5.14)*** (2.30)** (6.21)*** Backward FDI spillover –1.772 2.808 1.981 0.251 1.477 3.029 (–1.48) (2.59)*** (1.79)* (0.23) (1.47) (3.09)***
1.454 0.016 –0.237 0.880 –0.014 –0.168 Foreign market share by 2-digit industries (8.08)*** (0.11) (–1.50) (5.43)*** (–0.11) (–1.18)
–0.135 –0.072 –0.090 –0.099 –0.080 –0.096 Log number of employees (–6.81)*** (–2.83)*** (–3.91)*** (–5.37)*** (–3.36)*** (–4.55)***
F-test: industry dummies 0.000 0.000 0.000 0.000 0.000 0.000
Number of observations 1694.000 1333.000 1384.000 1267.000 1008.000 1035.000 R-squared 0.374 0.329 0.318 0.382 0.380 0.403 Notes: Absolute values of t-statistics in parentheses. Industry dummies are included in all regres-sions. * significant at 10%; ** significant at 5%; *** significant at 1%. The equations are esti-mated by using the robust regression analysis that controls for outliers in the data (StataCorp 2003).
32
Differences in the labour productivity levels between companies with dif-ferent owners, also referred to as the own-firm effect of FDI, can be noted, with local companies as the reference group; the own-firm effect fits with earlier studies on Estonia (Vahter and Masso, 2007); Johansson et al. (2008) in a similar framework of the CDM model did not detect any significant dif-ferences in the Nordic countries while Dachs et al. (2008) found foreign owned companies to have significantly higher labour productivity in small EU countries. Domestic multinationals and foreign companies without out-ward FDI from Estonia have similar levels of productivity, while foreign out-ward investors are the group with the highest productivity. Capital intensity has the expected positive significant coefficient in the production function; exporters are found to be more productive than non-exporters, although this might be caused by the more productive companies self-selecting into export markets (see for example Wagner, 2006); and the number of employees has a negative sign, rejecting the constant returns to scale. The goodness of fit can be considered satisfactory given that it is similar to what has been observed in earlier studies in the field (in Griffith et al., 2006 in the range of 19–28%).
Product innovation has a positive impact on productivity (though it fell from 40% in CIS3 to 9.2% in CIS, 2009), while Masso and Vahter (2008) found it to be important only in CIS3. That might be a consequence of macroeconomic developments, as for example in conditions of strong macro-economic growth companies could increase productivity without innovation because of growing market demand and through exploitation of economies of scale.14 The process innovation dummy is negative in CIS3 (similar to Knell, 2008, who used a version of the OECD, 2009 model), which is perhaps coun-ter-intuitive. The possible explanation proposed by Knell (2008) was the possible product innovation bias in the underlying data, which meant that any effect which may be due to the process innovation is already implemented in the presence of product innovation. Regressions also reveal some evidence in favour of both horizontal and vertical FDI spillover effects (for earlier results see for example Vahter and Masso, 2007 or Knell, 2008), although these re-sults can be criticised for the likely endogeneity of industry-level FDI, so an instrumental variable approach would be appropriate in this case (Vahter, 2010). The Boone index for measuring the toughness of competition becomes significantly positive especially at the end of the period under analysis, indi-cating that in industries with lower competitive pressure productivity was higher; this could be explained by the particular period where high domestic
14 This finding is in accordance with the evidence by Terk et al. (2007) that while the
number of companies with innovation increased greatly from CIS3 to CIS4, the returns of innovation in terms of sales growth or productivity decreased considerably.
33
demand fuelled by capital inflows favoured industries and companies ori-ented to domestic markets.15
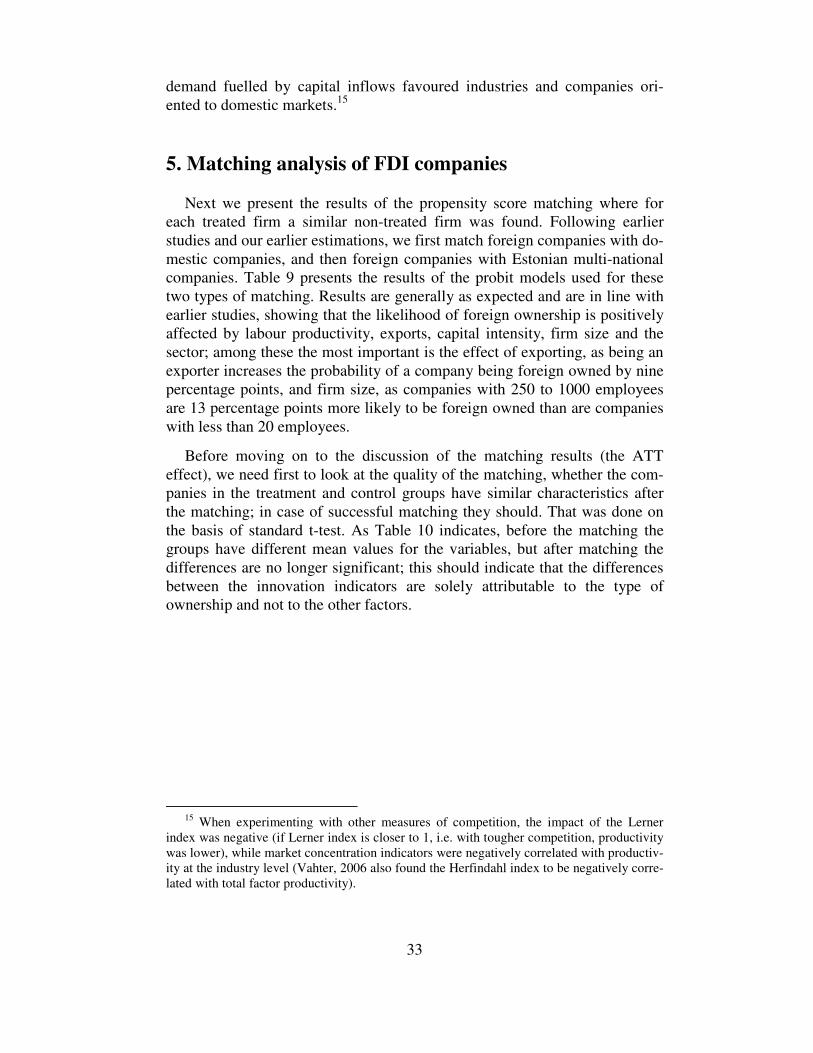
5. Matching analysis of FDI companies Next we present the results of the propensity score matching where for
each treated firm a similar non-treated firm was found. Following earlier studies and our earlier estimations, we first match foreign companies with do-mestic companies, and then foreign companies with Estonian multi-national companies. Table 9 presents the results of the probit models used for these two types of matching. Results are generally as expected and are in line with earlier studies, showing that the likelihood of foreign ownership is positively affected by labour productivity, exports, capital intensity, firm size and the sector; among these the most important is the effect of exporting, as being an exporter increases the probability of a company being foreign owned by nine percentage points, and firm size, as companies with 250 to 1000 employees are 13 percentage points more likely to be foreign owned than are companies with less than 20 employees.
Before moving on to the discussion of the matching results (the ATT effect), we need first to look at the quality of the matching, whether the com-panies in the treatment and control groups have similar characteristics after the matching; in case of successful matching they should. That was done on the basis of standard t-test. As Table 10 indicates, before the matching the groups have different mean values for the variables, but after matching the differences are no longer significant; this should indicate that the differences between the innovation indicators are solely attributable to the type of ownership and not to the other factors.
15 When experimenting with other measures of competition, the impact of the Lerner
index was negative (if Lerner index is closer to 1, i.e. with tougher competition, productivity was lower), while market concentration indicators were negatively correlated with productiv-ity at the industry level (Vahter, 2006 also found the Herfindahl index to be negatively corre-lated with total factor productivity).
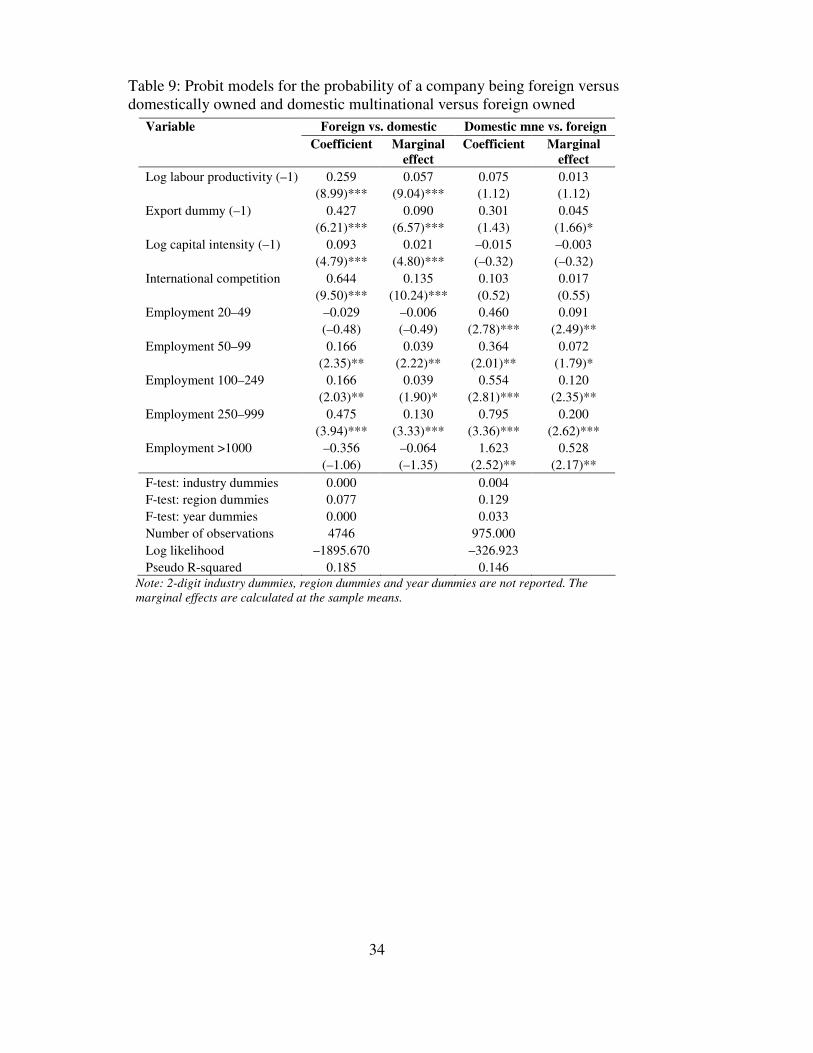
34
Table 9: Probit models for the probability of a company being foreign versus domestically owned and domestic multinational versus foreign owned
Foreign vs. domestic Domestic mne vs. foreign Variable Coefficient Marginal
effect Coefficient Marginal
effect Log labour productivity (–1) 0.259 0.057 0.075 0.013 (8.99)*** (9.04)*** (1.12) (1.12) Export dummy (–1) 0.427 0.090 0.301 0.045 (6.21)*** (6.57)*** (1.43) (1.66)* Log capital intensity (–1) 0.093 0.021 –0.015 –0.003 (4.79)*** (4.80)*** (–0.32) (–0.32) International competition 0.644 0.135 0.103 0.017 (9.50)*** (10.24)*** (0.52) (0.55) Employment 20–49 –0.029 –0.006 0.460 0.091 (–0.48) (–0.49) (2.78)*** (2.49)** Employment 50–99 0.166 0.039 0.364 0.072 (2.35)** (2.22)** (2.01)** (1.79)* Employment 100–249 0.166 0.039 0.554 0.120 (2.03)** (1.90)* (2.81)*** (2.35)** Employment 250–999 0.475 0.130 0.795 0.200 (3.94)*** (3.33)*** (3.36)*** (2.62)*** Employment >1000 –0.356 –0.064 1.623 0.528 (–1.06) (–1.35) (2.52)** (2.17)** F-test: industry dummies 0.000 0.004 F-test: region dummies 0.077 0.129 F-test: year dummies 0.000 0.033 Number of observations 4746 975.000 Log likelihood –1895.670 –326.923 Pseudo R-squared 0.185 0.146
Note: 2-digit industry dummies, region dummies and year dummies are not reported. The marginal effects are calculated at the sample means.

35
Table 10: Matching quality
Foreign vs. domestic Domestic mne vs. foreign Variable Treatment
group Selected control group
Test on mean
equality (p-value)
Treatment group
Selected control group
Test on mean
equality (p-value)
Log labour productivity 12.974 12.920 0.328 13.335 13.251 0.553 Export dummy 0.848 0.867 0.254 0.879 0.932 0.142 Log capital intensity 10.989 10.989 0.997 11.379 11.350 0.870 International market 0.843 0.860 0.292 0.871 0.894 0.568 Employment 20–49 0.265 0.277 0.580 0.295 0.318 0.690 Employment 50–99 0.205 0.206 0.954 0.205 0.163 0.384 Employment 100–249 0.145 0.141 0.815 0.197 0.201 0.939 Employment 250–999 0.066 0.079 0.298 0.114 0.129 0.707 Employment >1000 0.004 0.002 0.286 0.015 0.027 0.520
Table 11 displays the results of causal treatment on various innovation
input and output indicators. The t-values test for the null-hypothesis of no differences in the mean values between the treatment and control groups. The tables report the results of Kernel matching; those obtained by nearest neigh-bour matching with two and five neighbours without replacement were similar. As may be seen, many of the differences are statistically significant before matching, but the estimated ATT is insignificant whichever particular matching algorithm is used. The ATT is always positive, with foreign owned companies having a higher average value than their domestic counterparts. For product innovation, the dummies for new to market products and the sales of new products are significant only in CIS3, which could fit with the evidence that the productivity differences between foreign and domestic firms have decreased over the course of time. Johansson and Lööf (2005) found the differences in case of process innovation to be insignificant, but be-tween in case of product innovation dummy and innovation sales to be signif-icant. No significant differences can be noted for organisational innovations, which equally seem not to be caused by the small sample size as also the absolute value of the ATT is close to zero. The change in the ATT for proc-ess innovation from positive (CIS3) to negative (CIS4) reflects that domestic companies are more often oriented to the less radical cost-saving process in-novations.
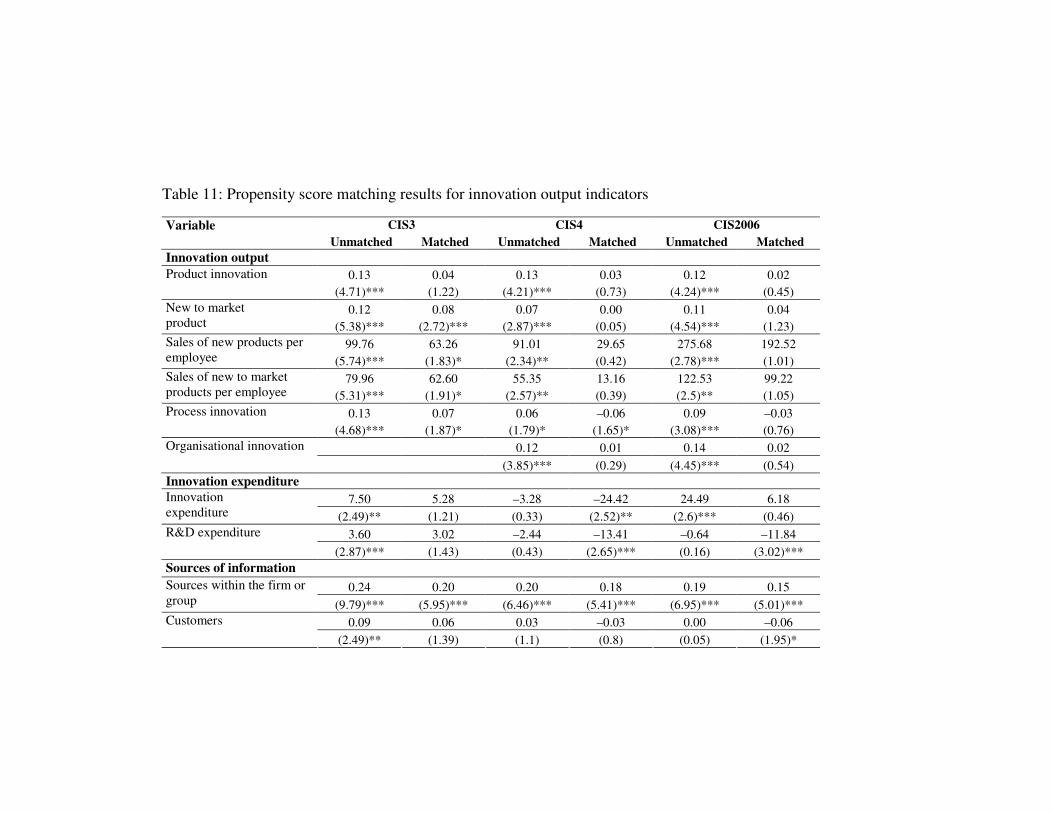
Table 11: Propensity score matching results for innovation output indicators
CIS3 CIS4 CIS2006 Variable Unmatched Matched Unmatched Matched Unmatched Matched
Innovation output 0.13 0.04 0.13 0.03 0.12 0.02 Product innovation
(4.71)*** (1.22) (4.21)*** (0.73) (4.24)*** (0.45) 0.12 0.08 0.07 0.00 0.11 0.04 New to market
product (5.38)*** (2.72)*** (2.87)*** (0.05) (4.54)*** (1.23) 99.76 63.26 91.01 29.65 275.68 192.52 Sales of new products per
employee (5.74)*** (1.83)* (2.34)** (0.42) (2.78)*** (1.01) 79.96 62.60 55.35 13.16 122.53 99.22 Sales of new to market
products per employee (5.31)*** (1.91)* (2.57)** (0.39) (2.5)** (1.05) 0.13 0.07 0.06 –0.06 0.09 –0.03 Process innovation
(4.68)*** (1.87)* (1.79)* (1.65)* (3.08)*** (0.76) 0.12 0.01 0.14 0.02 Organisational innovation (3.85)*** (0.29) (4.45)*** (0.54)
Innovation expenditure 7.50 5.28 –3.28 –24.42 24.49 6.18 Innovation
expenditure (2.49)** (1.21) (0.33) (2.52)** (2.6)*** (0.46) 3.60 3.02 –2.44 –13.41 –0.64 –11.84 R&D expenditure
(2.87)*** (1.43) (0.43) (2.65)*** (0.16) (3.02)*** Sources of information
0.24 0.20 0.20 0.18 0.19 0.15 Sources within the firm or group (9.79)*** (5.95)*** (6.46)*** (5.41)*** (6.95)*** (5.01)***
0.09 0.06 0.03 –0.03 0.00 –0.06 Customers (2.49)** (1.39) (1.1) (0.8) (0.05) (1.95)*
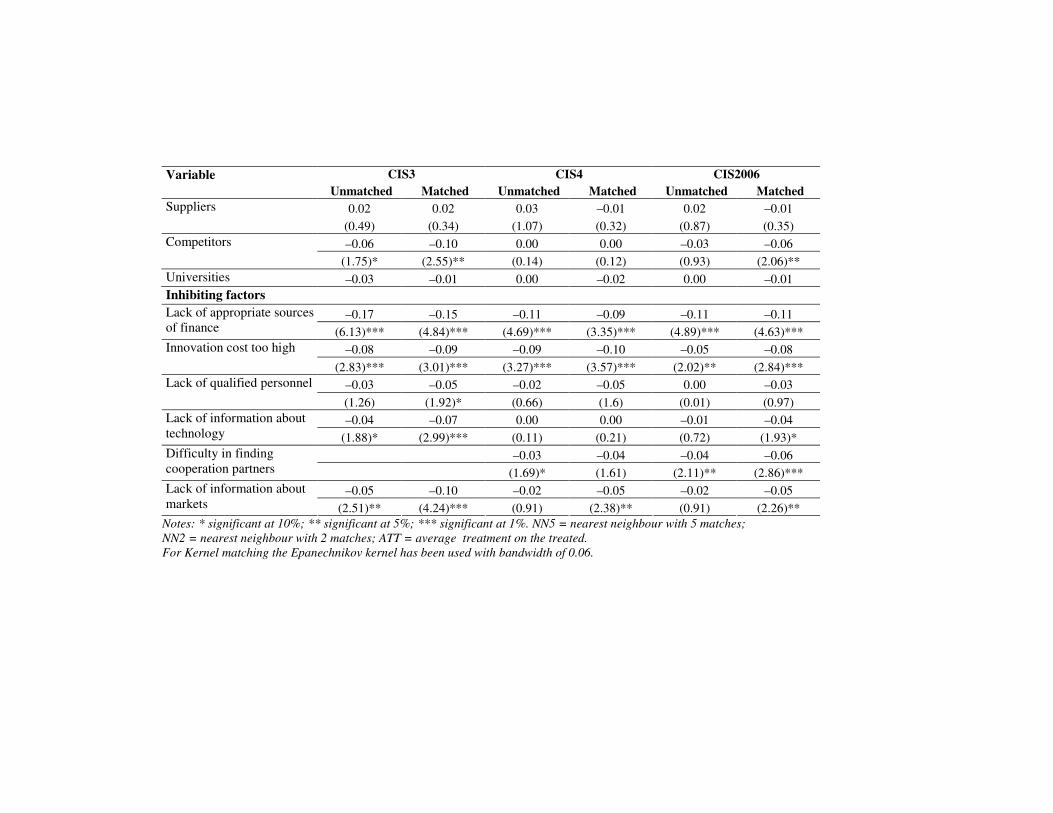
CIS3 CIS4 CIS2006 Variable Unmatched Matched Unmatched Matched Unmatched Matched
0.02 0.02 0.03 –0.01 0.02 –0.01 Suppliers (0.49) (0.34) (1.07) (0.32) (0.87) (0.35) –0.06 –0.10 0.00 0.00 –0.03 –0.06 Competitors
(1.75)* (2.55)** (0.14) (0.12) (0.93) (2.06)** Universities –0.03 –0.01 0.00 –0.02 0.00 –0.01 Inhibiting factors
–0.17 –0.15 –0.11 –0.09 –0.11 –0.11 Lack of appropriate sources of finance (6.13)*** (4.84)*** (4.69)*** (3.35)*** (4.89)*** (4.63)***
–0.08 –0.09 –0.09 –0.10 –0.05 –0.08 Innovation cost too high (2.83)*** (3.01)*** (3.27)*** (3.57)*** (2.02)** (2.84)***
–0.03 –0.05 –0.02 –0.05 0.00 –0.03 Lack of qualified personnel (1.26) (1.92)* (0.66) (1.6) (0.01) (0.97) –0.04 –0.07 0.00 0.00 –0.01 –0.04 Lack of information about
technology (1.88)* (2.99)*** (0.11) (0.21) (0.72) (1.93)* –0.03 –0.04 –0.04 –0.06 Difficulty in finding
cooperation partners (1.69)* (1.61) (2.11)** (2.86)*** –0.05 –0.10 –0.02 –0.05 –0.02 –0.05 Lack of information about
markets (2.51)** (4.24)*** (0.91) (2.38)** (0.91) (2.26)** Notes: * significant at 10%; ** significant at 5%; *** significant at 1%. NN5 = nearest neighbour with 5 matches; NN2 = nearest neighbour with 2 matches; ATT = average treatment on the treated. For Kernel matching the Epanechnikov kernel has been used with bandwidth of 0.06.
38
As concerns the innovation expenditure variables, in many cases the esti-mated ATT is insignificant again, which is not surprising given that earlier studies also found differences in other variables rather than in expenditure (Dachs and Ebersberger, 2009; Johanson and Lööf, 2005); however, in some cases the estimated effect is negative and significant, as the intensity of ex-penditure on innovation is significantly below that of the domestic companies with similar characteristics (similar to the results of Falk and Falk, 2006 and much of the literature on the location of R&D close to the headquarters of multinationals). Among the different sources of information, the most robust finding is the higher use of sources within the company or group, indicating that knowledge flows from the parent to local affiliates. Similarly Srholec (2009) documented that foreign affiliates had significantly higher cooperation with affiliates abroad. There are no significant differences in the use of sup-pliers, meaning the possibility of vertical knowledge spillovers still exists, or in the use universities (different from Günther et al., 2009), which probably reflects the generally weak business-university linkages; customers as a source of information are more frequently used by foreign owners in CIS3 and by domestic companies in CIS2006. Foreign companies use competitors as a source of information less often, which could easily reflect that, while many of them are oriented to local markets and have FDI due to the market seeking motive, they do not cooperate with local companies because of their higher knowledge base and desire to avoid local knowledge spill-overs. In comparison with the sources of information, quite strong and robust results could be found on the lower importance of various impeding factors in case of foreign firms. In particular there were fewer problems with the excessive cost of innovation, a lack of funding or a lack of information about markets; differences in favour of foreign companies could also be seen in others factors, though these are less robust. Thus it can be summarised from the re-sults that among other variables the differences between the importance of various impeding factors are the most noticeable (similarly for example to Dachs and Ebersberger, 2009).
Table 12 presents the matching results for the differences between domes-tic multinationals and foreign companies.
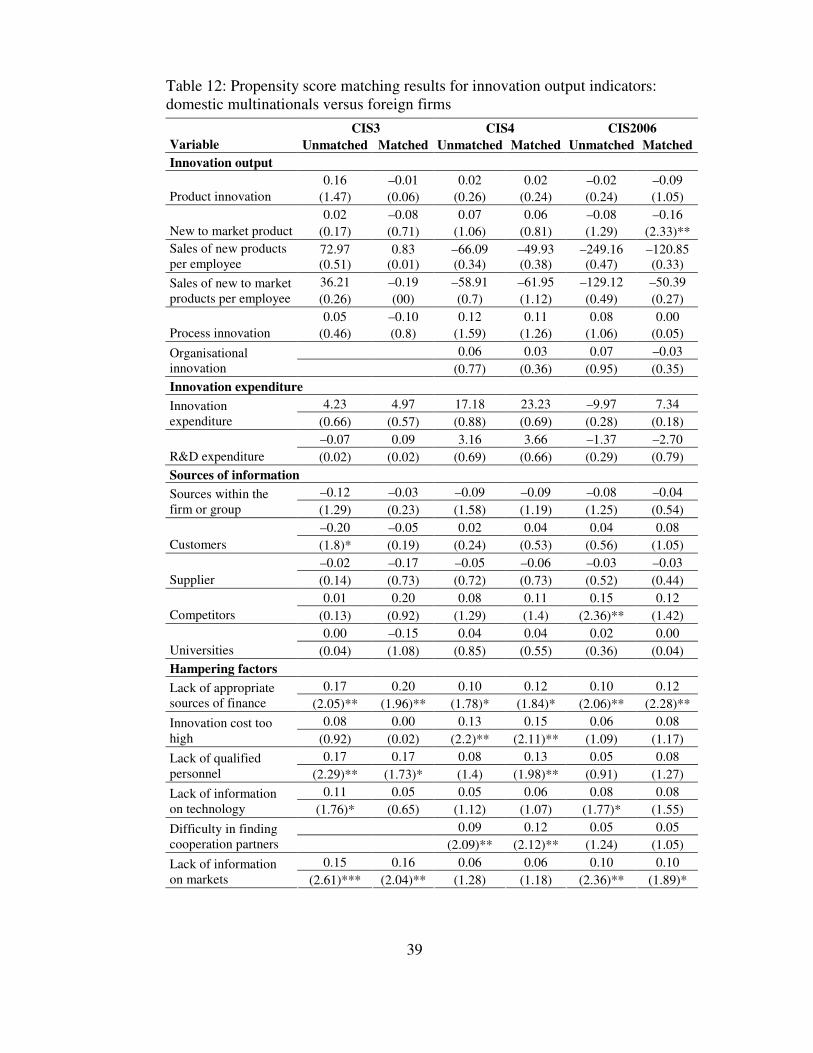
39
Table 12: Propensity score matching results for innovation output indicators: domestic multinationals versus foreign firms
CIS3 CIS4 CIS2006 Variable Unmatched Matched Unmatched Matched Unmatched Matched Innovation output
0.16 –0.01 0.02 0.02 –0.02 –0.09 Product innovation (1.47) (0.06) (0.26) (0.24) (0.24) (1.05)
0.02 –0.08 0.07 0.06 –0.08 –0.16 New to market product (0.17) (0.71) (1.06) (0.81) (1.29) (2.33)**
72.97 0.83 –66.09 –49.93 –249.16 –120.85 Sales of new products per employee (0.51) (0.01) (0.34) (0.38) (0.47) (0.33)
36.21 –0.19 –58.91 –61.95 –129.12 –50.39 Sales of new to market products per employee (0.26) (00) (0.7) (1.12) (0.49) (0.27)
0.05 –0.10 0.12 0.11 0.08 0.00 Process innovation (0.46) (0.8) (1.59) (1.26) (1.06) (0.05)
0.06 0.03 0.07 –0.03 Organisational innovation (0.77) (0.36) (0.95) (0.35) Innovation expenditure
4.23 4.97 17.18 23.23 –9.97 7.34 Innovation expenditure (0.66) (0.57) (0.88) (0.69) (0.28) (0.18)
–0.07 0.09 3.16 3.66 –1.37 –2.70 R&D expenditure (0.02) (0.02) (0.69) (0.66) (0.29) (0.79) Sources of information
–0.12 –0.03 –0.09 –0.09 –0.08 –0.04 Sources within the firm or group (1.29) (0.23) (1.58) (1.19) (1.25) (0.54)
–0.20 –0.05 0.02 0.04 0.04 0.08 Customers (1.8)* (0.19) (0.24) (0.53) (0.56) (1.05)
–0.02 –0.17 –0.05 –0.06 –0.03 –0.03 Supplier (0.14) (0.73) (0.72) (0.73) (0.52) (0.44)
0.01 0.20 0.08 0.11 0.15 0.12 Competitors (0.13) (0.92) (1.29) (1.4) (2.36)** (1.42)
0.00 –0.15 0.04 0.04 0.02 0.00 Universities (0.04) (1.08) (0.85) (0.55) (0.36) (0.04) Hampering factors
0.17 0.20 0.10 0.12 0.10 0.12 Lack of appropriate sources of finance (2.05)** (1.96)** (1.78)* (1.84)* (2.06)** (2.28)**
0.08 0.00 0.13 0.15 0.06 0.08 Innovation cost too high (0.92) (0.02) (2.2)** (2.11)** (1.09) (1.17)
0.17 0.17 0.08 0.13 0.05 0.08 Lack of qualified personnel (2.29)** (1.73)* (1.4) (1.98)** (0.91) (1.27)
0.11 0.05 0.05 0.06 0.08 0.08 Lack of information on technology (1.76)* (0.65) (1.12) (1.07) (1.77)* (1.55)
0.09 0.12 0.05 0.05 Difficulty in finding cooperation partners (2.09)** (2.12)** (1.24) (1.05)
0.15 0.16 0.06 0.06 0.10 0.10 Lack of information on markets (2.61)*** (2.04)** (1.28) (1.18) (2.36)** (1.89)*
40
As concerns the differences between domestic multinationals and foreign companies, many fewer significant differences can be found, probably due to the smaller number of domestic multinationals. Differences in almost all the output indicators are insignificant. For comparison, Johanson and Lööf (2005) found Swedish multinationals to be more innovative than FDI companies after matching. Among innovation input indicators, again there is in most cases no statistically significant difference in expenditures, while for example Johansson and Lööf 2005 found foreign companies to have lower R&D intensity. Among sources of information, the most striking difference is again the lower use of sources within the firm among domestic multination-als. The significantly higher use of competitors by domestic companies in CIS2006 vanishes after matching. Domestic multinationals also have signifi-cantly higher values for impeding factors such as lack of finance, lack of information about markets and technology and lack of qualified personnel than do foreign companies, indicating their lower resource base for innova-tion and possibly also their larger need for innovation. 6. Conclusions
It might seem obvious that internationalisation and especially foreign ownership should enhance the knowledge base, productivity and innovations, but the numerous earlier studies reveal very diverse results. Our study in-vestigated the issue in the context of the small catching-up economy of Estonia. The Community Innovation Surveys (CIS) provided a useful body of data for this purpose. We analysed three waves of the survey, CIS 3, 4 and 2006 covering the years 1998–2000, 2002–2004 and 2004–2006 respectively. These data were interlinked with data on outward FDI from the balance of payments statistics of the Bank of Estonia and with financial data from the Estonian Business Register. For the analysis we combined the CDM used in several innovation studies with a propensity score matching approach.
Our main conclusions are as follows. In terms of innovation expenditure, the probability of expenditure on innovation was significantly higher for for-eign owned companies (differently to the results of Dachs et al., 2008 and Johansson et al., 2008), although the level of innovation expenditure is only higher among the foreign owned outward investors, after other determinants of the expenditure levels are controlled for, while for domestic multinationals and foreign companies without outward investment the innovations expendi-tures mostly did not differ significantly from the levels of local firms. In the propensity score matching analysis the differences were similarly insignifi-cant, and in one case the foreign firms even had lower expenditure. Such a re-sult is expected as foreign companies are expected to be able to use the inter-nal stock of knowledge and technology in their innovation activities and thus
41
may spend less than domestic companies. Among the different impeding factors, the lack of funding has a particular negative impact on expenditure. The propensity score matching analysis also indicated that among other vari-ables the differences in the importance of various impeding factors are the most noticeable, especially factors related to cost and funding (similarly, for example, to Dachs and Ebersberger, 2009). Given that, the relatively minor differences in expenditure between domestic and foreign companies may be slightly surprising. The importance of funding as a constraint for innovation expenditure has decreased, and the differences in the importance of that fac-tor between different groups of companies are also smaller in later periods, reflecting that during the period of strong macroeconomic growth in Estonia there was an improvement in the ability of companies to fund expenditure from both internal sources, due to high profits, and external sources, for example through improved access to bank loans. One factor balancing the impact of funding constraints is public funding for innovation, which has a strong positive impact on expenditure, as it did in most previous studies, and is about twice as common among domestic companies. However, the average frequency of public support for innovation is low compared to other countries anyway.
For most innovation output indicators, foreign owned companies and do-mestic multinationals were more innovative than local companies, but after matching many of these differences became statistically insignificant. The estimation of the knowledge production function for product and process in-novation indicators showed that domestic multinationals and foreign outward investors in particular, but foreign companies without outward investments too, were significantly more likely to come up with either product or process innovations, but after predicted innovation expenditure from the expenditure equation and the knowledge sourcing variables were included in the know-ledge production function, most of the ownership variables became insignifi-cant and the parameter for foreign companies even became negative, indi-cating that after other factors are controlled for, foreign companies are actu-ally less innovative than domestic ones. Indeed, the parameters for innovation expenditure are strongly significant in all estimations and of similar size despite the remarkable growth in the level of expenditure. Among various knowledge sourcing variables, information sources within the company are especially significant in all specifications, but competitors, customers for product innovation, and suppliers for process innovation are also important. From the matching analysis it seemed that the use of sources within the company or group was notably higher among foreign companies, while domestic outward investors use competitors as knowledge sources. The inno-vation accounting framework indicated that the differences in the use of different information sources accounted for most of the innovation output gap between foreign and domestic companies. The somewhat lower use of uni-
42
versities by foreign companies is in line with earlier results on their lower embeddedness in the local innovation system, but the result was statistically insignificant and the use of universities is rather low among all types of firms.
In the productivity equations the higher productivity of foreign owned companies and domestic multinationals was noted, a feature that is also known as the own-firm effect of FDI, but productivity was highest among the companies with outward investments. This reinforces the results above and demonstrates that the group of foreign companies is quite heterogeneous, in-cluding not only true multinationals operating in a number of countries, at least three countries in case of our indirect investors, but also Scandinavian small and medium size companies for which expansion to the neighbouring country of Estonia is the maximum extent of foreign market entry. Product innovation has a strong positive impact on productivity, but one that is de-creasing over time, most probably because in conditions of strong macro-eco-nomic growth companies can increase productivity without innovating be-cause of growing market demand and by exploiting economies of scale. The insignificant impact of process innovation variables could be explained by the possible product innovation bias in the underlying data so that any effect that may be due to the process innovation is already happening in the pres-ence of product innovation (Knell, 2008).
In addition to the study of the own-firm effect we also looked to a lesser extent at the spillover effects from multinationals, for example at whether the presence of foreign companies in the same industry or vertically linked downstream or upstream industries could affect the productivity or innova-tiveness of domestic companies through increased competition, knowledge flows, demonstration effects or similar. In the productivity equation signifi-cant coefficients were more often found for vertical spillover variables than for horizontal spillovers, which show FDI presence in the same industry and were significant only in CIS3. Similarly, with product and process innova-tions the positive impact from the presence of FDI in the same industry was visible only in the first period (1998–2000). In knowledge production func-tions there were also some significant estimates for forward linkages, for example through foreign companies helping to upgrade the production opera-tions of their local distributors, and backward linkages, where the presence of foreign companies in upstream industries could improve the quality of inter-mediate inputs purchased and lower costs. These results on the more likely occurrences of vertical spillover effects are in accordance with expectations, but the results need to be treated with caution due to the likely endogeneity of industry level FDI and it would be more appropriate to use the instrumental variable approach (Vahter, 2010).
43
In general, although foreign companies were found to be more innovative in several respects, many of the results did not hold after various other factors had been controlled for. It seems that the small size of the local market and the lack of local skills mean that foreign companies have less incentive to in-novate, which has also been indicated in surveys of foreign investors. How-ever, the study has some important limitations. Firstly, there might be other organisational characteristics which are of importance but which are current-ly left out due to the limitations of the data available. Secondly, the innova-tion survey data has some problems in terms of the interpretational qualities of the respondents. The responses given might not always reflect a true and detailed understanding of the issue. Despite this, the results represent our best effort to use coherently the joint potential of various datasets in order to derive a detailed picture which also has potential for generalisations.
The managers can benefit from this study by tapping into a wider range of knowledge sources through diverse and active involvement in exports and in-vestment. Often they fail to realise that initiating international activities can also serve as an important learning opportunity in how to become more inno-vative. The policy implications suggest that government policies and triple helix cooperation should be oriented not only towards attracting foreign inter-est, but also towards building opportunities for more extensive regional and international business networking through exports and outward FDI. The multi-directional openness of the business environment seems to be the key to harnessing the full potential of internationalisation from the perspective of innovations.
Future research should be aimed at further refining the model configura-tions in terms of ownership, exports, and other variables to be included in the analysis. At present studies tend to be too limited in incorporating more in-direct influences. The theory development should offer more refined explana-tions for the contradictory influences at company, industry, and country levels that have been revealed. There is a mass of empirical work that has been done in the field, but theory building seems to lag behind. As concerns specific ideas, one fruitful development would be to study the innovativeness of various kinds of foreign investors, like market seeking, efficiency seeking, natural resource seeking and strategic asset seeking, as the different types of investors may be oriented to different kinds of innovations, so that market seeking ones may look for marketing innovations, efficiency seeking inves-tors for process innovations and so forth. However, to distinguish these dif-ferent types of investors would probably require more detailed data than those used in this study. Furthermore, in our study we ignored the impact of innovativeness on FDI, as innovative companies may be the ones who then go into foreign markets, which should be also given attention in future studies.
44
References Aghion, P., Bloom, N., Blundell, R., Griffith, R., Fowitt, P., (2005). Compe-tition and innovation: An inverted U relationship. Quarterly Journal of Economics, pp. 701–728. Almeida, R., Fernandes, A. M., (2006). Openness and Technological Innova-tions in Developing Countries: Evidence from Firm-Level Surveys. World Bank Policy Research Working Paper, No. 3985. Alvarez, R., (2001). External sources of technological innovation in Chilean manufacturing industry. Estudios de Economia, Vol. 28, No 001, pp. 53–68. Arnold, J. M., Smarzynska Javorcik, B., (2005). Gifted Kids or Pushy Parents? Foreign Acquisitions and Plant Performance in Indonesia. CEPR Discussion Paper, No. 5065. Baldwin, J. R., Gu, W., (2005). Global Links: Multinationals, Foreign Own-ership and Productivity Growth in Canadian Manufacturing. The Canadian Economy in Transition Research Paper Series, No. 9. Barba Navaretti, G., Venables, A., with Barry, F., Ekholm, K., Falzoni, A., Haaland, J., Midelfart, K.-H., Turrini, A., (2004). Multinational firms in the world economy. Princeton University Press. Blomström, M., Kokko, A., (2003). Human Capital and Inward FDI. Stockholm School of Economics Working Paper, No 167. Boone, J., (2008). A new way to measure competition. The Economic Journal, Vol. 118, Issue 531, pp. 1245–1261. Caliendo, M., Kopeinig, S., (2005). Some Practical Guidance for the Imple-mentation of Propensity Score Matching. IZA Discussion Paper, No. 1588. Castellani, D., Zanfei, A., (2007). Internationalisation, Innovation and Pro-ductivity: How Do Firms Differ in Italy? The World Economy, Vol. 30, Issue 1, pp. 156–176. Caves, R., (1996). Multinational enterprise and economic analysis. New York: Cambridge University Press. Crépon, B., Duguet, E., Mairesse, J., (1998). Research, Innovation, and Pro-ductivity: an Econometric Analysis at the Firm Level. NBER Working Paper, No. 6696.

45
Criscuolo, C., Haskel, J., Slaughter, M. J., (2005). Global engagement and the innovation activities of firms. NBER Working Paper, No. 11479. Dachs, B., Ebersberger, B., Lööf, H., (2008). The Innovative Performance of Foreign-Owned Enterprises in Small Open Economies. The Journal of Technology Transfer, Vol. 33, Issue 4, pp. 393–406. Dachs, B.; Ebersberger, B., (2009). Does Foreign Ownership Matter for the Innovative Activities of Enterprises? International Economics and Economic Policy, Vol. 6, No. 1, pp. 41–57. Erdilek, A., (2005). R&D Activities of Foreign and National Establishments in Turkish Manufacturing. In Blomstrom, M., Graham, E., Moran, T., (eds.). The Impact of Foreign Direct Investment on Development: New Measures, New Outcomes, New Policy Approaches, Institute for International Econom-ics, Washington, DC. Fairlie, R., (2005). An extension of the Oaxaca-Blinder decomposition technique to logit and probit models. Journal of Economic and Social Mea-surement, Vol. 30, pp. 305–316. Falk, M., (2008). Effects of Foreign Ownership on Innovation Activities: Empirical Evidence for Twelve European Countries. National Institute Economic Review, Vol. 204, pp. 85–97. Falk, M., Falk, R., (2006). Do Foreign-Owned Firms Have a Lower Innova-tion Intensity Than Domestic Firms? Austrian Institute of Economic Re-search (WIFO) Working Paper, No. 275 Girma, S., Gong, Y., Görg, H., (2006). Can You Teach Old Dragons New Tricks? FDI and Innovation Activity in Chinese State-Owned Enterprises. IZA Discussion Paper, No. 2267. Griffith, R., Huergo, E., Mairesse, J., Peters, B., (2006). Innovation and pro-ductivity across four European countries. Oxford Review of Economic Policy, Vol. 22, pp. 483–498. Griffith, R., Redding, S., Simpson, H., (2004). Foreign Ownership and Pro-ductivity: New Evidence from the Service Sector and the R&D Lab. Institute for Fiscal Studies Working Papers, No. W04/22.
46
Günther, J., Jindra, B., Stephan, J., (2009). FDI and the National Innovation System – Evidence from Emerging Economies in Central and Eastern Europe. Globelics 2009 Conference, October 6–8, Dakar. Heckman, J. J., Ichimura, H., Todd, P., (1998). Matching as and Econometric Evaluation Estimator. Review of Economic Studies, Vol. 64, pp. 605–654. Jann, B., (2008). Fairlie: Stata module to generate nonlinear decomposition of binary outcome differentials. Boston College Department of Economics Statistical Software Component, No. S456727. Johansson, B., Lööf, H., Ebersberger, B., (2008). The Innovation and Produc-tivity Effect of Foreign Take-Over of National Assets. CESIS Electronic Working Paper, No. 141. Knell, M., (2008). Innovation and Growth in Nordic Economies. Nordic Centre of Innovation, Oslo. Knell, M., Srholec, M., (2006). Innovation Cooperation and Foreign Owner-ship in the Czech Republic. The Online Proceedings of The First Conference on Micro Evidence on Innovation and Development (MEIDE). Leuven, E., Sianesi, B., (2003). PSMATCH2: Stata module to perform Mahalanobis and propensity score matching, common support graphing, and covariate testing. Statistical Software Components, No. S432001, Boston College Department of Economics. http://ideas.repec.org/c/boc/bocode/s432001.html. Version 1.2.3. Liu, X., Buck, T., (2007). Innovation Performance and Channels for Inter-national Technology Spillovers: Evidence from Chinese High-Tech Industries. Research Policy, Vol. 36, Issue 3, pp. 355–366. Lööf, H., Heshmati, A., Asplund, R., Nas, S.-O., (2003). Innovation and performance in manufacturing industries. The Icfaian Journal of Manage-ment Research, No. 2, 3, pp. 5–35. Mairesse, J., Mohnen, P., (2002). Accounting for Innovation and Measuring Innovativeness: An Illustrative Framework and an Application. American Economic Review, Vol. 92, No. 2, pp. 226–230. Markusen, J. R., (2002). Multinational firms and the theory of international trade. Cambridge, MA: MIT Press.
47
Masso, J., Vahter, P., (2008). Technological Innovation and Productivity in Post-Transition Estonia: Econometric Evidence from Innovation Surveys. European Journal of Development Research, Vol. 20, Issue 2, pp. 240–261. Masso, J., Varblane, U., Vahter, P., (2008). The Impact of Outward FDI on Home-Country Employment in a Low-Cost Transition Economy. Eastern European Economics, Vol. 46, Issue 6, pp. 27–61. Meriküll, J., (2008). The Impact of Innovation on Employment: Firm- and Industry-level Evidence from Estonia. Bank of Estonia Working Paper, No. 1/2008. Mickiewicz, T., Bishop, K., Varblane, U., (2004). Financial Constraints in Investment. Panel Data Results From Estonia, 1995–1999. Acta Oeconomica, Vol. 54, No. 4, pp. 425–449. Narula, R., Zanfei, A., (2005). Globalization of innovation: the role of multi-national enterprises. In J. Fagerberg, D., Mowery, C., Nelson, R. The Oxford Handbook of Innovation, Oxford University Press, Oxford, pp. 318–348. OECD, (2006). OECD Science, Technology and Industry Outlook 2006. OECD, Paris. OECD, (2009). Innovation in Firms. A Microeconomic Perspective. OECD, Paris. Pakes, A., Griliches, Z., (1984). Patents and R&D at the Firm Level: A First Look. In Griliches, Z., (ed.). R&D, Patents and Productivity. Chicago Uni-versity Press, Chicago, pp. 55–71. Rosenbaum, P., Rubin, D., (1983). The Central Role of the Propensity Score in Observational Studies for Causal Effects. Biometrika, Vol. 70, No. 1, pp. 41–50. Sadowski, B. M., Sadowski-Rasters, G., (2006). On the innovativeness of foreign affiliates: Evidence from companies in The Netherlands. Research Policy, Vol. 35, pp. 447–462. Shrolec, M., (2009). Does foreign ownership facilitate cooperation on inno-vation? Firm-level evidence from the enlarged European Union. European Journal of Development Research, Vol. 21, pp. 47–62. Srholec, M., (2006). Research and development activity of foreign affiliates in the Czech Republic. DIME Working Paper, No. 2006.
48
Stiebale, J., Reize, F., (2008). The Impact of FDI on Innovation in Target Firms. Ruhr Economic Papers, No. 50. Terk, E., Viia, A., Lumiste, R., Heinlo, A., etc., (2007). Innovation in Estonian Enterprises. Based on the Estonian results of the Fourth Community Innovation Survey (CIS4). Innovation Studies 7/2007, Enterprise Estonia. Urem, B., Alcorta, L., An, T., (2008). The Innovativeness of Foreign Firms in China. UNU-MERIT Working Paper, No. 19. Vahter, P., (2006). Productivity in Estonian Enterprises: The Role of Innova-tion and Competition. Bank of Estonia Working Paper, No. 7/2006. Vahter, P., (2010). Microeconomic effects of competition on productivity in the EU. PhD dissertation, University of Nottingham (UK), mimeo. Vahter, P., Masso, J., (2007). Home versus host country effects of FDI: searching for new evidence on productivity spillovers. Applied Economics Quarterly, Vol. 53, Issue 2, pp. 165–196. Varblane, U., Mets, T., Ukrainski, K., (2008). Role of university-industry-government linkages in the innovation processes of a small catching-up economy. Industry & Higher Education, Vol. 22, No 6, pp 373–386. Vila, N., Kuster, I., (2007). The Importance of Innovation in International Textile Firms. European Journal of Marketing”, Vol. 41, Issue 1/2, pp. 17–36. Vishwasrao, S., Bosshardt, W., (2001). Foreign Ownership and Technology Adoption: Evidence from Indian Firms. Journal of Development Economics, Vol. 65, Issue 2, pp. 367–387. Wagner, J., (2006). International Firm Activities and Innovation: Evidence from Knowledge Production Functions for German Firms. Max Planck Institute of Economics, Entrepreneurship, Growth and Public Policy Group, Papers on Entrepreneurship, Growth and Public Policy, No. 2006–15.
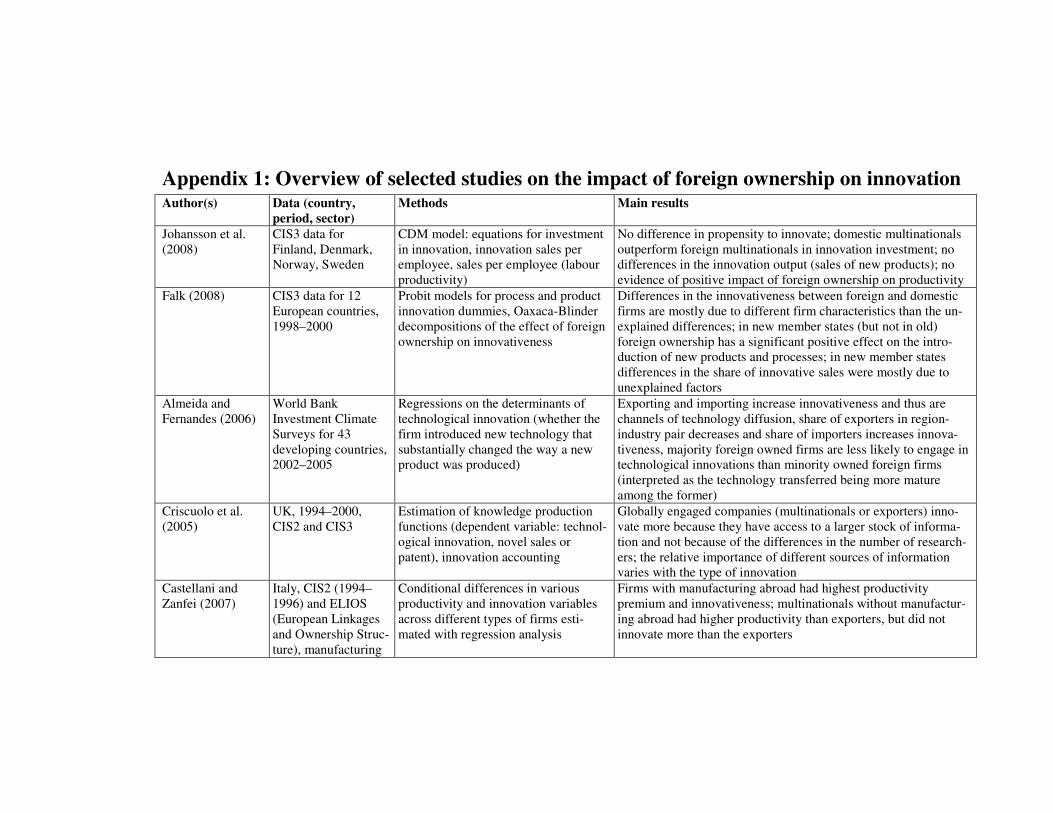
Appendix 1: Overview of selected studies on the impact of foreign ownership on innovation
Author(s) Data (country, period, sector)
Methods Main results
Johansson et al. (2008)
CIS3 data for Finland, Denmark, Norway, Sweden
CDM model: equations for investment in innovation, innovation sales per employee, sales per employee (labour productivity)
No difference in propensity to innovate; domestic multinationals outperform foreign multinationals in innovation investment; no differences in the innovation output (sales of new products); no evidence of positive impact of foreign ownership on productivity
Falk (2008) CIS3 data for 12 European countries, 1998–2000
Probit models for process and product innovation dummies, Oaxaca-Blinder decompositions of the effect of foreign ownership on innovativeness
Differences in the innovativeness between foreign and domestic firms are mostly due to different firm characteristics than the un-explained differences; in new member states (but not in old) foreign ownership has a significant positive effect on the intro-duction of new products and processes; in new member states differences in the share of innovative sales were mostly due to unexplained factors
Almeida and Fernandes (2006)
World Bank Investment Climate Surveys for 43 developing countries, 2002–2005
Regressions on the determinants of technological innovation (whether the firm introduced new technology that substantially changed the way a new product was produced)
Exporting and importing increase innovativeness and thus are channels of technology diffusion, share of exporters in region-industry pair decreases and share of importers increases innova-tiveness, majority foreign owned firms are less likely to engage in technological innovations than minority owned foreign firms (interpreted as the technology transferred being more mature among the former)
Criscuolo et al. (2005)
UK, 1994–2000, CIS2 and CIS3
Estimation of knowledge production functions (dependent variable: technol-ogical innovation, novel sales or patent), innovation accounting
Globally engaged companies (multinationals or exporters) inno-vate more because they have access to a larger stock of informa-tion and not because of the differences in the number of research-ers; the relative importance of different sources of information varies with the type of innovation
Castellani and Zanfei (2007)
Italy, CIS2 (1994–1996) and ELIOS (European Linkages and Ownership Struc-ture), manufacturing
Conditional differences in various productivity and innovation variables across different types of firms esti-mated with regression analysis
Firms with manufacturing abroad had highest productivity premium and innovativeness; multinationals without manufactur-ing abroad had higher productivity than exporters, but did not innovate more than the exporters
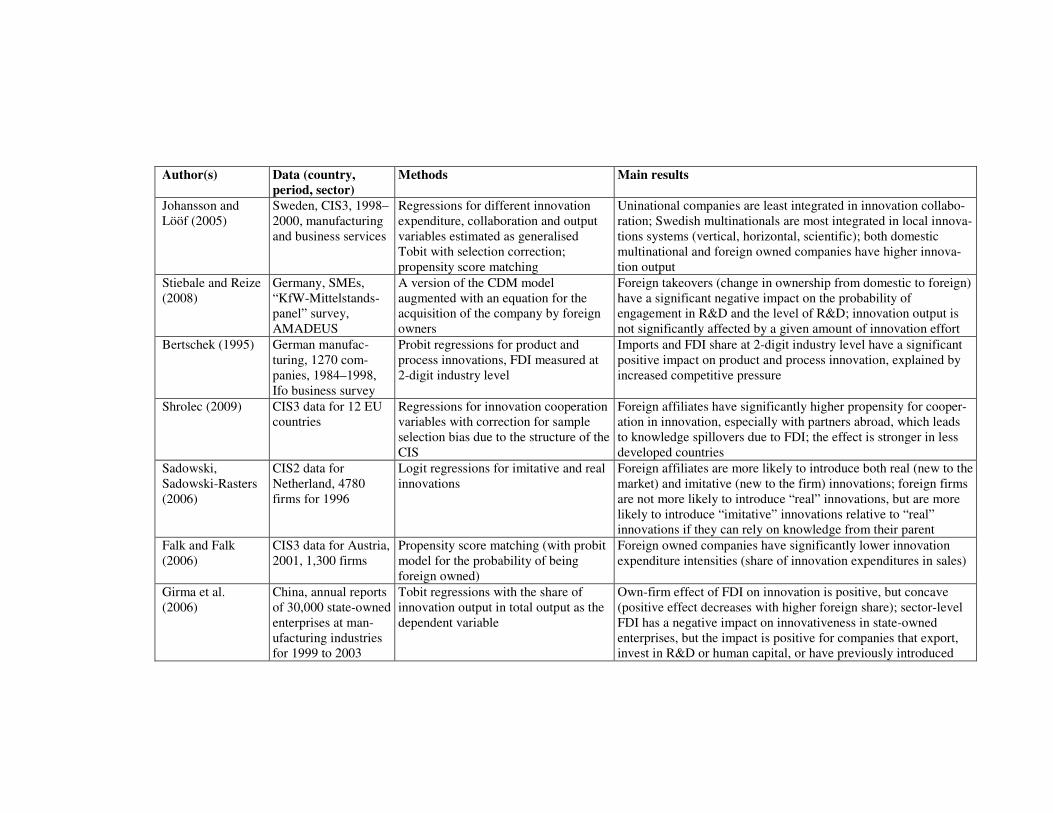
Author(s) Data (country, period, sector)
Methods Main results
Johansson and Lööf (2005)
Sweden, CIS3, 1998–2000, manufacturing and business services
Regressions for different innovation expenditure, collaboration and output variables estimated as generalised Tobit with selection correction; propensity score matching
Uninational companies are least integrated in innovation collabo-ration; Swedish multinationals are most integrated in local innova-tions systems (vertical, horizontal, scientific); both domestic multinational and foreign owned companies have higher innova-tion output
Stiebale and Reize (2008)
Germany, SMEs, “KfW-Mittelstands-panel” survey, AMADEUS
A version of the CDM model augmented with an equation for the acquisition of the company by foreign owners
Foreign takeovers (change in ownership from domestic to foreign) have a significant negative impact on the probability of engagement in R&D and the level of R&D; innovation output is not significantly affected by a given amount of innovation effort
Bertschek (1995) German manufac-turing, 1270 com-panies, 1984–1998, Ifo business survey
Probit regressions for product and process innovations, FDI measured at 2-digit industry level
Imports and FDI share at 2-digit industry level have a significant positive impact on product and process innovation, explained by increased competitive pressure
Shrolec (2009) CIS3 data for 12 EU countries
Regressions for innovation cooperation variables with correction for sample selection bias due to the structure of the CIS
Foreign affiliates have significantly higher propensity for cooper-ation in innovation, especially with partners abroad, which leads to knowledge spillovers due to FDI; the effect is stronger in less developed countries
Sadowski, Sadowski-Rasters (2006)
CIS2 data for Netherland, 4780 firms for 1996
Logit regressions for imitative and real innovations
Foreign affiliates are more likely to introduce both real (new to the market) and imitative (new to the firm) innovations; foreign firms are not more likely to introduce “real” innovations, but are more likely to introduce “imitative” innovations relative to “real” innovations if they can rely on knowledge from their parent
Falk and Falk (2006)
CIS3 data for Austria, 2001, 1,300 firms
Propensity score matching (with probit model for the probability of being foreign owned)
Foreign owned companies have significantly lower innovation expenditure intensities (share of innovation expenditures in sales)
Girma et al. (2006)
China, annual reports of 30,000 state-owned enterprises at man-ufacturing industries for 1999 to 2003
Tobit regressions with the share of innovation output in total output as the dependent variable
Own-firm effect of FDI on innovation is positive, but concave (positive effect decreases with higher foreign share); sector-level FDI has a negative impact on innovativeness in state-owned enterprises, but the impact is positive for companies that export, invest in R&D or human capital, or have previously introduced
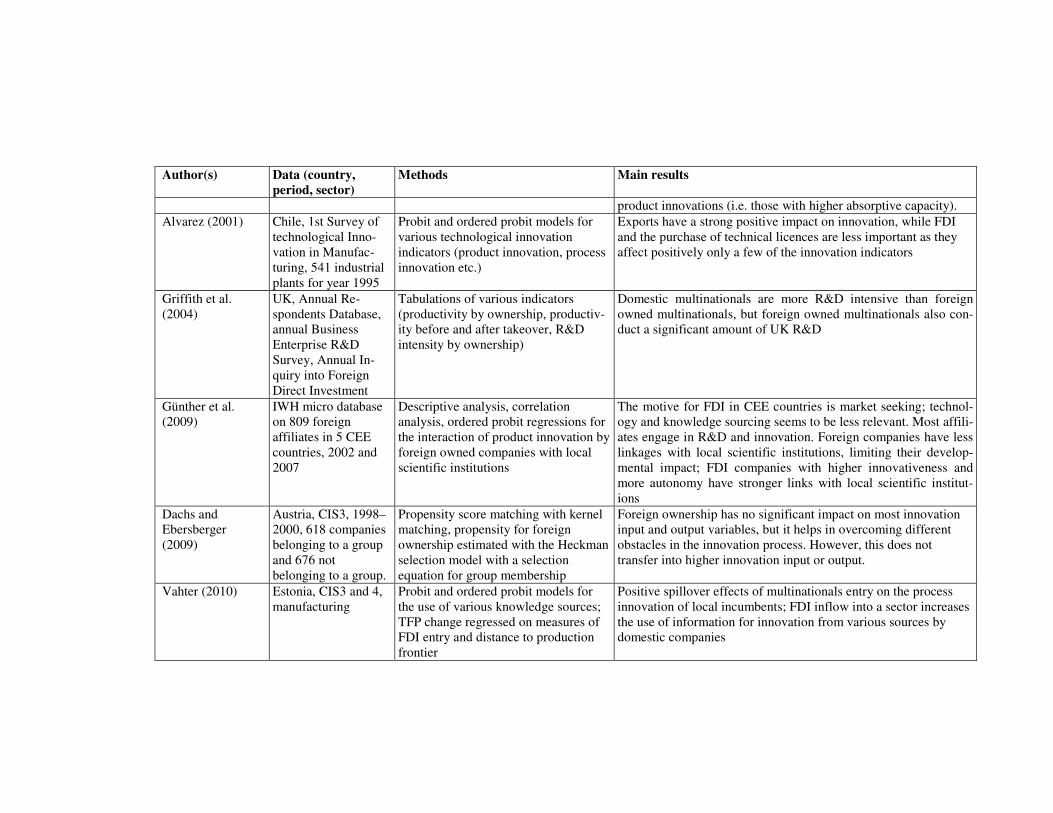
Author(s) Data (country, period, sector)
Methods Main results
product innovations (i.e. those with higher absorptive capacity). Alvarez (2001) Chile, 1st Survey of
technological Inno-vation in Manufac-turing, 541 industrial plants for year 1995
Probit and ordered probit models for various technological innovation indicators (product innovation, process innovation etc.)
Exports have a strong positive impact on innovation, while FDI and the purchase of technical licences are less important as they affect positively only a few of the innovation indicators
Griffith et al. (2004)
UK, Annual Re-spondents Database, annual Business Enterprise R&D Survey, Annual In-quiry into Foreign Direct Investment
Tabulations of various indicators (productivity by ownership, productiv-ity before and after takeover, R&D intensity by ownership)
Domestic multinationals are more R&D intensive than foreign owned multinationals, but foreign owned multinationals also con-duct a significant amount of UK R&D
Günther et al. (2009)
IWH micro database on 809 foreign affiliates in 5 CEE countries, 2002 and 2007
Descriptive analysis, correlation analysis, ordered probit regressions for the interaction of product innovation by foreign owned companies with local scientific institutions
The motive for FDI in CEE countries is market seeking; technol-ogy and knowledge sourcing seems to be less relevant. Most affili-ates engage in R&D and innovation. Foreign companies have less linkages with local scientific institutions, limiting their develop-mental impact; FDI companies with higher innovativeness and more autonomy have stronger links with local scientific institut-ions
Dachs and Ebersberger (2009)
Austria, CIS3, 1998–2000, 618 companies belonging to a group and 676 not belonging to a group.
Propensity score matching with kernel matching, propensity for foreign ownership estimated with the Heckman selection model with a selection equation for group membership
Foreign ownership has no significant impact on most innovation input and output variables, but it helps in overcoming different obstacles in the innovation process. However, this does not transfer into higher innovation input or output.
Vahter (2010) Estonia, CIS3 and 4, manufacturing
Probit and ordered probit models for the use of various knowledge sources; TFP change regressed on measures of FDI entry and distance to production frontier
Positive spillover effects of multinationals entry on the process innovation of local incumbents; FDI inflow into a sector increases the use of information for innovation from various sources by domestic companies
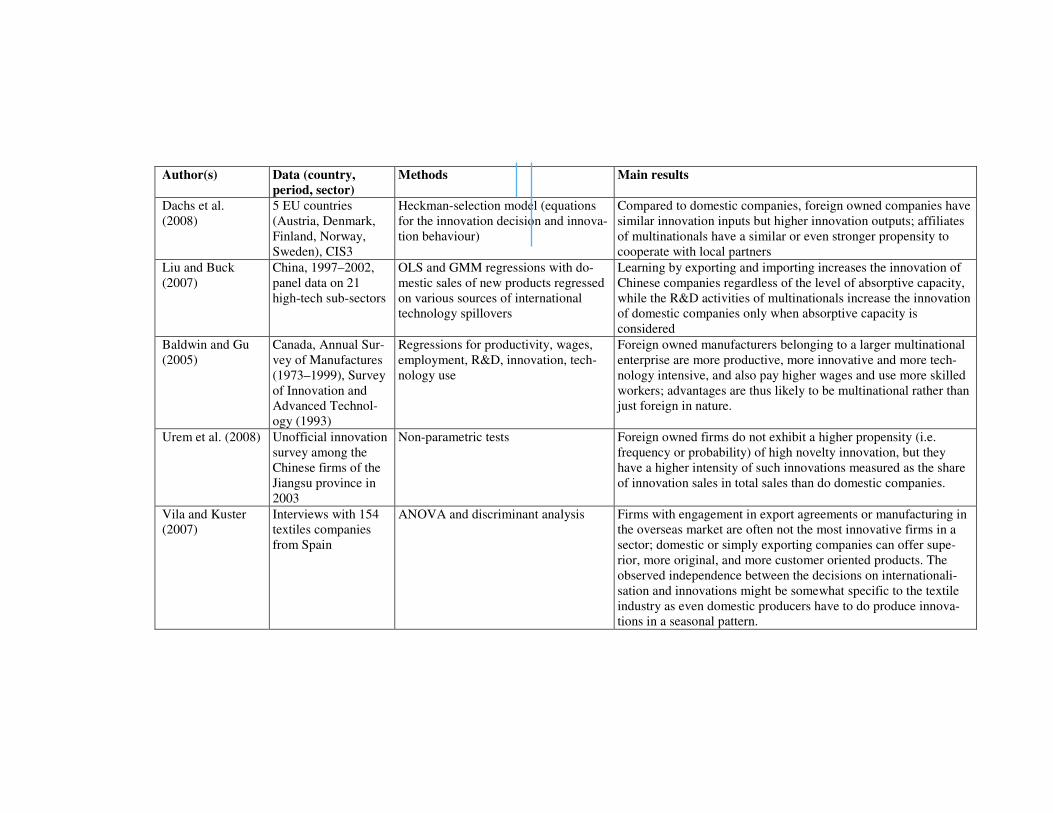
Author(s) Data (country, period, sector)
Methods Main results
Dachs et al. (2008)
5 EU countries (Austria, Denmark, Finland, Norway, Sweden), CIS3
Heckman-selection model (equations for the innovation decision and innova-tion behaviour)
Compared to domestic companies, foreign owned companies have similar innovation inputs but higher innovation outputs; affiliates of multinationals have a similar or even stronger propensity to cooperate with local partners
Liu and Buck (2007)
China, 1997–2002, panel data on 21 high-tech sub-sectors
OLS and GMM regressions with do-mestic sales of new products regressed on various sources of international technology spillovers
Learning by exporting and importing increases the innovation of Chinese companies regardless of the level of absorptive capacity, while the R&D activities of multinationals increase the innovation of domestic companies only when absorptive capacity is considered
Baldwin and Gu (2005)
Canada, Annual Sur-vey of Manufactures (1973–1999), Survey of Innovation and Advanced Technol-ogy (1993)
Regressions for productivity, wages, employment, R&D, innovation, tech-nology use
Foreign owned manufacturers belonging to a larger multinational enterprise are more productive, more innovative and more tech-nology intensive, and also pay higher wages and use more skilled workers; advantages are thus likely to be multinational rather than just foreign in nature.
Urem et al. (2008) Unofficial innovation survey among the Chinese firms of the Jiangsu province in 2003
Non-parametric tests Foreign owned firms do not exhibit a higher propensity (i.e. frequency or probability) of high novelty innovation, but they have a higher intensity of such innovations measured as the share of innovation sales in total sales than do domestic companies.
Vila and Kuster (2007)
Interviews with 154 textiles companies from Spain
ANOVA and discriminant analysis Firms with engagement in export agreements or manufacturing in the overseas market are often not the most innovative firms in a sector; domestic or simply exporting companies can offer supe-rior, more original, and more customer oriented products. The observed independence between the decisions on internationali-sation and innovations might be somewhat specific to the textile industry as even domestic producers have to do produce innova-tions in a seasonal pattern.
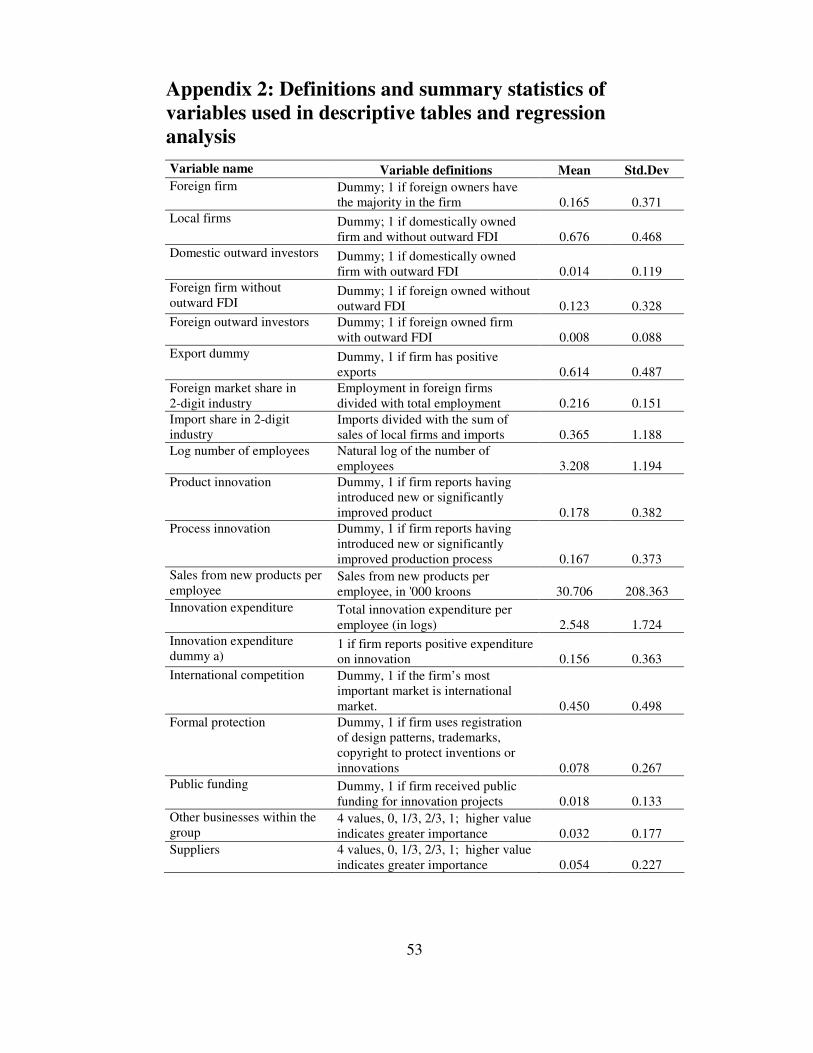
53
Appendix 2: Definitions and summary statistics of variables used in descriptive tables and regression analysis Variable name Variable definitions Mean Std.Dev Foreign firm Dummy; 1 if foreign owners have
the majority in the firm 0.165 0.371 Local firms Dummy; 1 if domestically owned
firm and without outward FDI 0.676 0.468 Domestic outward investors Dummy; 1 if domestically owned
firm with outward FDI 0.014 0.119 Foreign firm without outward FDI
Dummy; 1 if foreign owned without outward FDI 0.123 0.328
Foreign outward investors Dummy; 1 if foreign owned firm with outward FDI 0.008 0.088
Export dummy Dummy, 1 if firm has positive exports 0.614 0.487
Foreign market share in 2-digit industry
Employment in foreign firms divided with total employment 0.216 0.151
Import share in 2-digit industry
Imports divided with the sum of sales of local firms and imports 0.365 1.188
Log number of employees Natural log of the number of employees 3.208 1.194
Product innovation Dummy, 1 if firm reports having introduced new or significantly improved product 0.178 0.382
Process innovation Dummy, 1 if firm reports having introduced new or significantly improved production process 0.167 0.373
Sales from new products per employee
Sales from new products per employee, in '000 kroons 30.706 208.363
Innovation expenditure Total innovation expenditure per employee (in logs) 2.548 1.724
Innovation expenditure dummy a)
1 if firm reports positive expenditure on innovation 0.156 0.363
International competition Dummy, 1 if the firm’s most important market is international market. 0.450 0.498
Formal protection Dummy, 1 if firm uses registration of design patterns, trademarks, copyright to protect inventions or innovations 0.078 0.267
Public funding Dummy, 1 if firm received public funding for innovation projects 0.018 0.133
Other businesses within the group
4 values, 0, 1/3, 2/3, 1; higher value indicates greater importance 0.032 0.177
Suppliers 4 values, 0, 1/3, 2/3, 1; higher value indicates greater importance 0.054 0.227
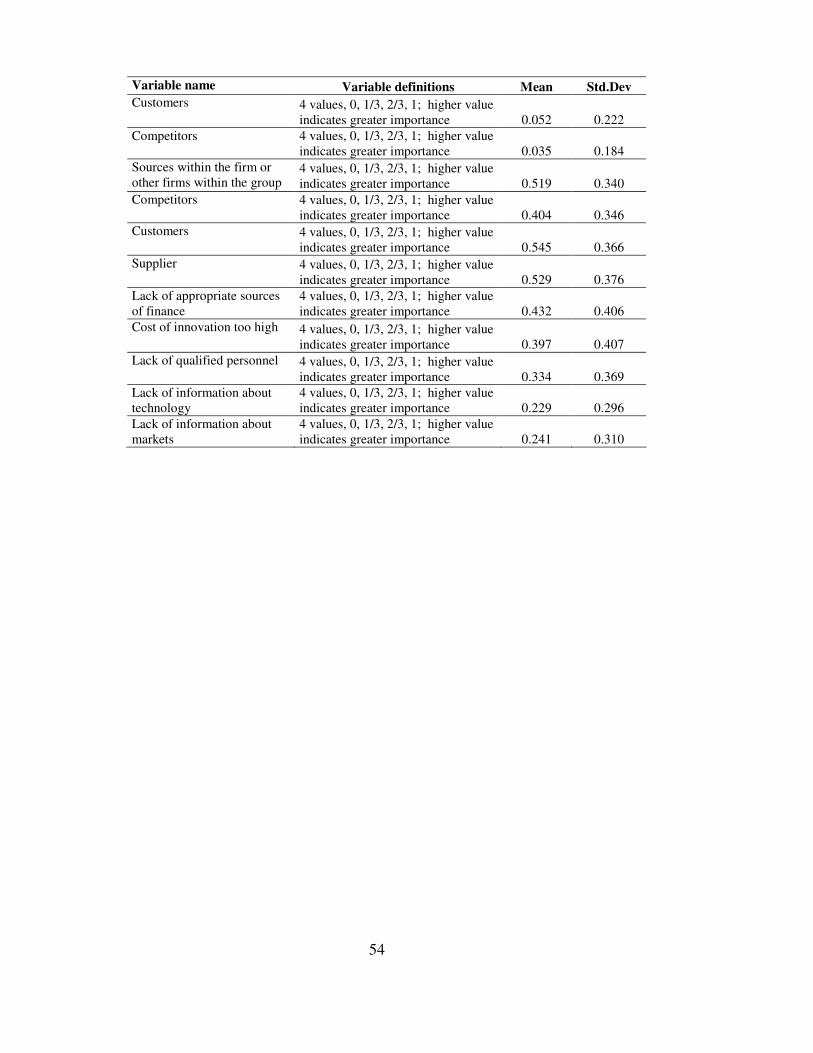
54
Variable name Variable definitions Mean Std.Dev Customers 4 values, 0, 1/3, 2/3, 1; higher value
indicates greater importance 0.052 0.222 Competitors 4 values, 0, 1/3, 2/3, 1; higher value
indicates greater importance 0.035 0.184 Sources within the firm or other firms within the group
4 values, 0, 1/3, 2/3, 1; higher value indicates greater importance 0.519 0.340
Competitors 4 values, 0, 1/3, 2/3, 1; higher value indicates greater importance 0.404 0.346
Customers 4 values, 0, 1/3, 2/3, 1; higher value indicates greater importance 0.545 0.366
Supplier 4 values, 0, 1/3, 2/3, 1; higher value indicates greater importance 0.529 0.376
Lack of appropriate sources of finance
4 values, 0, 1/3, 2/3, 1; higher value indicates greater importance 0.432 0.406
Cost of innovation too high 4 values, 0, 1/3, 2/3, 1; higher value indicates greater importance 0.397 0.407
Lack of qualified personnel 4 values, 0, 1/3, 2/3, 1; higher value indicates greater importance 0.334 0.369
Lack of information about technology
4 values, 0, 1/3, 2/3, 1; higher value indicates greater importance 0.229 0.296
Lack of information about markets
4 values, 0, 1/3, 2/3, 1; higher value indicates greater importance 0.241 0.310
55
Appendix 3: Econometric model The CDM model that we use can be written down as follows: Let
Ni ,,1 �� be used to index firms. In the first step, firms decide whether or not to engage in innovation, thus giving the selection equation, and after that a selected group of firms decide on the size of their investment in R&D or more broadly their total innovation expenditures. This is modelled by the Heckman equation. Equation (7) models the firm’s latent (unobserved) pro-pensity to innovate,
*ig :
iii xg 000
* � �� , (7) where oix is a vector of variables that determine this innovation effort, 0 is the associated coefficient vector, and i0� is an error term. Let ig be used to denote the observed indicator variable that equals 1 for firms reporting inno-vation expenditures and 0 for firms not reporting innovation expenditures. A firm invests in knowledge producing activities so that 1�ig , if cg i �
* , where c is a constant threshold level. Correspondingly, if cg i �
*, then
0�ig . The term *ig represents a decision criterion about whether to engage
in innovative activities, for example the expected return on investment in research and development (Crépon et al., 1998).
If a firm engages in innovative activities (i.e. if cg i �* ), we can observe
the innovation expenditure of firm i, denoted as ir . The variable *ir denotes
the latent intensity of research for firm i. The two variables, ir and *ir are
related in the second equation of our model as follows:
��
��
�
�
����
00
1111*
i
iiiii
gif
gifxrr
� . (8)
In equation (8) ix1 is a vector of explanatory variables and i1� an error term. We have used the Heckman model to estimate equations (7) and (2). Equation (2) looks at the size or intensity of the innovation activities, for example the level of expenditure on innovation per employee. Instead of R&D expenditure, as used by several other papers, we use total expenditure on innovative activities. The reason for this is the relatively small number of Estonian companies undertaking R&D activities.
56
Equation (9) is the knowledge or innovation production function relating potentially unobserved knowledge (innovation output) to the innovation input and other variables:
iiiKi xrt 222* � � ��� . (9)
Here, variable it is the innovation output or knowledge proxied both by
the product and process innovation indicators (dummy variables) and by in-novation sales per employee, ix2 is a vector of explanatory variables, i2� an error term, which is assumed to be normally distributed with a zero mean and variance 2
2� , and is also assumed to be independent of error terms i0� and i1� . To account for the fact that the use of process and product innovation by
a firm are highly interdependent, we estimated equation (9) as a bivariate probit model, the dependent variables being the dummy variables for product innovation ( iP ) and process innovation ( iQ ) respectively. As an alternative, we also estimated the knowledge production function in a form where the dependent variable was innovation sales per employee; in this case the knowledge production function was estimated with least squares. The latent innovation effort, *
ir , enters the knowledge production function as an explan-atory variable. It is instrumented, meaning its predicted values from the first step of the equation are used to account for both the selectivity and endo-geneity of *
ir in equation (9). The endogeneity comes from the fact that un-observable firm characteristics may increase both the enterprise’s innovation effort and its ability to produce technological innovation (Griffith et al., 2006).
The last equation in the model is the productivity equation assuming Cobb-Douglas technology, where knowledge inputs are also included in addition to labour and capital (Crépon et al., 1998; Lööf et al., 2003). Thus the output production function can be written as:
iiiTi xtq 333 � � ��� , (10)
where variable iq stands for the log of productivity (sales per employee or value added per employee), ix3 is a vector of standard control variables in the productivity analysis, and i3� is an error term, which is assumed to be normally distributed with a zero mean and a variance of 2
3� .

Working Papers of Eesti Pank 2010
No 1Rasmus KattaiCredit Risk Model for the Estonian Banking Sector
No 2Karsten StaehrThe Global Financial Crisis and Public Finances in the New EU Countries from Central and Eastern Europe
No 3Rasmus KattaiPotential Output and the Output Gap in Estonia – A Macro Model Based Evaluation
No 4Karsten StaehrIncome Convergence and Inflation in Central and Eastern Europe: Does the Sun Always Rise in the East?
Copyright © 2022 FDOKUMEN