HRAS1 and LASS1 with APOE are associated with human longevity and healthy aging
20
HRAS1 and LASS1 with APOE are associated with human longevity and healthy aging S. Michal Jazwinski 1 , Sangkyu Kim 1,* , Jianliang Dai 1,2,* , Li Li 3 , Xiuhua Bi 1 , James C. Jiang 1 , Jonathan Arnold 2 , Mark A. Batzer 4 , Jerilyn A. Walker 4 , David A. Welsh 5 , Christina M. Lefante 6 , Julia Volaufova 6 , Leann Myers 7 , L. Joseph Su 6,† , Dorothy B. Hausman 8 , Michael V. Miceli 1 , Eric Ravussin 9 , Leonard W. Poon 10 , Katie E. Cherry 11 , Michael A. Welsch 12 , and Georgia Centenarian Study and the Louisiana Healthy Aging Study 1 Tulane Center for Aging and Department of Medicine, Tulane University Health Sciences Center, New Orleans, Louisiana 70112 2 Genetics Department, University of Georgia, Athens, Georgia 30602 3 Neuroscience Center, Louisiana State University Health Sciences Center, New Orleans, Louisiana 70112 4 Department of Biological Sciences, Louisiana State University, Baton Rouge, Louisiana 70803 5 Department of Medicine, Louisiana State University Health Sciences Center, New Orleans, Louisiana 70112 6 School of Public Health, Louisiana State University Health Sciences Center, New Orleans, Louisiana 70112 7 Department of Biostatistics, School of Public Health and Tropical Medicine, Tulane University Health Sciences Center, New Orleans, Louisiana 70112 8 Department of Foods and Nutrition, University of Georgia, Athens, Georgia 30602 9 Pennington Biomedical Research Center, Baton Rouge, Louisiana 70808 10 Institute of Gerontology, University of Georgia, Athens, Georgia 30602 11 Department of Psychology, Louisiana State University, Baton Rouge, Louisiana 70803 12 Department of Kinesiology, Louisiana State University, Baton Rouge, Louisiana 70803 Summary The search for longevity-determining genes in human has largely neglected the operation of genetic interactions. We have identified a novel combination of common variants of three genes that has a marked association with human lifespan and healthy aging. Subjects were recruited and stratified according to their genetically-inferred ethnic affiliation to account for population structure. Haplotype analysis was performed in three candidate genes, and the haplotype combinations were tested for association with exceptional longevity. An HRAS1 haplotype Correspondence may be addressed to: S. Michal Jazwinski, Ph.D., Department of Medicine, Tulane University Health Sciences Center, 1430 Tulane Ave., SL-12, New Orleans, LA 70112, Ph: 504-988-8621; Fax: 504-988-8835, [email protected]. * Contributed equally † Present address: Modifiable Risk Factors Branch, National Cancer Institute, Rockville, Maryland 20892 Author contributions S.M.J., L.W.P., M.A.B., D.A.W., L.J.S., D.B.H., E.R., K.E.C., and M.A.W. designed the research; S.K., L.L., X.B., J.C.J., J.A.W., C.M.L., J.V., L.M., L.J.S., D.B.H., M.V.M., and K.E.C. acquired data; J.A. and J.D. contributed new analytic tools; S.M.J., S.K., J.D., X.B., J.A., M.A.B., D.A.W., C.M.L., J.V., L.M., and L.J.S. analyzed and interpreted data; and S.M.J., S.K., and J.D. prepared the manuscript. NIH Public Access Author Manuscript Aging Cell. Author manuscript; available in PMC 2011 October 1. Published in final edited form as: Aging Cell. 2010 October ; 9(5): 698–708. doi:10.1111/j.1474-9726.2010.00600.x. NIH-PA Author Manuscript NIH-PA Author Manuscript NIH-PA Author Manuscript
Transcript of HRAS1 and LASS1 with APOE are associated with human longevity and healthy aging

HRAS1 and LASS1 with APOE are associated with humanlongevity and healthy aging
S. Michal Jazwinski1, Sangkyu Kim1,*, Jianliang Dai1,2,*, Li Li3, Xiuhua Bi1, James C. Jiang1,Jonathan Arnold2, Mark A. Batzer4, Jerilyn A. Walker4, David A. Welsh5, Christina M.Lefante6, Julia Volaufova6, Leann Myers7, L. Joseph Su6,†, Dorothy B. Hausman8, MichaelV. Miceli1, Eric Ravussin9, Leonard W. Poon10, Katie E. Cherry11, Michael A. Welsch12, andGeorgia Centenarian Study and the Louisiana Healthy Aging Study1Tulane Center for Aging and Department of Medicine, Tulane University Health Sciences Center,New Orleans, Louisiana 701122Genetics Department, University of Georgia, Athens, Georgia 306023Neuroscience Center, Louisiana State University Health Sciences Center, New Orleans,Louisiana 701124Department of Biological Sciences, Louisiana State University, Baton Rouge, Louisiana 708035Department of Medicine, Louisiana State University Health Sciences Center, New Orleans,Louisiana 701126School of Public Health, Louisiana State University Health Sciences Center, New Orleans,Louisiana 701127Department of Biostatistics, School of Public Health and Tropical Medicine, Tulane UniversityHealth Sciences Center, New Orleans, Louisiana 701128Department of Foods and Nutrition, University of Georgia, Athens, Georgia 306029Pennington Biomedical Research Center, Baton Rouge, Louisiana 7080810Institute of Gerontology, University of Georgia, Athens, Georgia 3060211Department of Psychology, Louisiana State University, Baton Rouge, Louisiana 7080312Department of Kinesiology, Louisiana State University, Baton Rouge, Louisiana 70803
SummaryThe search for longevity-determining genes in human has largely neglected the operation ofgenetic interactions. We have identified a novel combination of common variants of three genesthat has a marked association with human lifespan and healthy aging. Subjects were recruited andstratified according to their genetically-inferred ethnic affiliation to account for populationstructure. Haplotype analysis was performed in three candidate genes, and the haplotypecombinations were tested for association with exceptional longevity. An HRAS1 haplotype
Correspondence may be addressed to: S. Michal Jazwinski, Ph.D., Department of Medicine, Tulane University Health SciencesCenter, 1430 Tulane Ave., SL-12, New Orleans, LA 70112, Ph: 504-988-8621; Fax: 504-988-8835, [email protected].*Contributed equally†Present address: Modifiable Risk Factors Branch, National Cancer Institute, Rockville, Maryland 20892Author contributionsS.M.J., L.W.P., M.A.B., D.A.W., L.J.S., D.B.H., E.R., K.E.C., and M.A.W. designed the research; S.K., L.L., X.B., J.C.J., J.A.W.,C.M.L., J.V., L.M., L.J.S., D.B.H., M.V.M., and K.E.C. acquired data; J.A. and J.D. contributed new analytic tools; S.M.J., S.K., J.D.,X.B., J.A., M.A.B., D.A.W., C.M.L., J.V., L.M., and L.J.S. analyzed and interpreted data; and S.M.J., S.K., and J.D. prepared themanuscript.
NIH Public AccessAuthor ManuscriptAging Cell. Author manuscript; available in PMC 2011 October 1.
Published in final edited form as:Aging Cell. 2010 October ; 9(5): 698–708. doi:10.1111/j.1474-9726.2010.00600.x.
NIH
-PA Author Manuscript
NIH
-PA Author Manuscript
NIH
-PA Author Manuscript

enhanced the effect of an APOE haplotype on exceptional survival, and a LASS1 haplotype furtheraugmented its magnitude. These results were replicated in a second population. A profile ofhealthy aging was developed using a deficit accumulation index, which showed that thiscombination of gene variants is associated with healthy aging. The variation in LASS1 isfunctional, causing enhanced expression of the gene, and it contributes to healthy aging andgreater survival in the tenth decade of life. Thus, rare gene variants need not be invoked to explaincomplex traits such as aging; instead rare congruence of common gene variants readily fulfills thisrole. The interaction between the three genes described here suggests new models for cellular andmolecular mechanisms underlying exceptional survival and healthy aging that involve lipotoxicity.
KeywordsLongevity genes; haplotypes; lipotoxicity; healthy aging profile; population stratification
IntroductionExceptional longevity has genetic and environmental components, but in humans they haveoften been difficult to identify (Christensen et al, 2006). Most of the research on the geneticsof human aging has focused on the genetic risk factors associated with age-related diseasesand disorders, with APOE being one prime candidate (Christensen et al, 2006). This is notsurprising given the impact of variation in this gene on cardiovascular and neuropathologicalaspects of aging (Christensen et al, 2006; Schächter et al., 1994; Song et al., 2004;Strittmatter et al., 1993). Studies in model systems have also recently guided the search forgenetic determinants of human longevity, pointing to several pathways and processescontributing to enhanced lifespan (Jazwinski, 1996; Finch & Ruvkun, 2001; Kenyon, 2005).However, this approach has largely been limited to components of the insulin/IGF-1pathway (Suh et al., 2008; Hong et al., 2008; Willcox et al., 2008). We decided to expandon this approach by examining the Ras and ceramide signaling pathways. The involvementof Ras signaling in lifespan determination has been adduced in studies in yeast (Chen et al.,1990; Sun et al., 1994) and in mice (Migliaccio et al., 1999), while the role of ceramidesignaling emerges from research in yeast (D’mello et al., 1994; Jazwinski & Conzelmann,2002; Guillas et al., 2003) and in Caenorhabditis elegans (Tedesco et al., 2008; Menuz etal., 2009; Mehta et al., 2009).
The APOE ε4 allele is a risk factor for early mortality, while the alleles ε2 and ε3 areenriched in exceptionally old individuals in some studies (Christensen et al, 2006).Apolipoprotein E (APOE) is important in chylomicron and VLDL metabolism (Mahley &Rall, 2000). Thus, it is one of the factors responsible for maintenance of circulating lipidhomeostasis. This balance can break down with age, and it is clearly disrupted in someindividuals resulting in an increase in the risk for cardiovascular disease and other disorders(Mahley & Rall, 2000). The rise in circulating cholesterol and triglycerides results invascular damage and can be a cause of lipotoxicity, a potential trigger of insulin resistanceand diabetes (Kusminski et al., 2009). This lipotoxicity may trigger responses that aremediated by HRAS1, a small G-protein involved in signal transduction (Ramos, 1999).Furthermore, some of the pathways that are induced are modulated by ceramide, a productof the ceramide synthase LASS1 (Jazwinski & Conzelmann, 2002; Ogretmen & Hannun,2004). Ceramide synthase responds to growth and to stress signals via Tor complex TORC2and calcineurin, respectively (Dickson, 2008). Lipotoxicity stimulates ceramide synthesis(Kusminski et al., 2009), and the resulting ceramide can signal apoptosis, resulting in theremoval of damaged cells (Koybasi et al., 2004). It can also facilitate the transfer ofcholesterol from cells to HDL (Witting et al., 2003). Therefore, we postulate that the HRAS1and LASS1 genes interact genetically with the APOE gene to reduce age-related increase in
Jazwinski et al. Page 2
Aging Cell. Author manuscript; available in PMC 2011 October 1.
NIH
-PA Author Manuscript
NIH
-PA Author Manuscript
NIH
-PA Author Manuscript

lipotoxic events, and that a combination of variants or haplotypes in these three genes isassociated with exceptional survival.
ResultsGene combination associated with exceptional longevity
We have initiated a genetic analysis of exceptional longevity in the Georgia and Louisianapopulations. Our attention in this study was exclusively directed to APOE, HRAS1, andLASS1 in a candidate gene approach. As noted earlier, variants of APOE are associated withlongevity. This pattern is also found in the Georgia and Louisiana populations, forcentenarians and nonagenarians respectively (Table S1). Both the Georgia and Louisianapopulations are admixed with the two major strata being of European and African origin. Toaddress this problem, we stratified each population by ethnic affiliation using an identical-by-descent (IBD) genetic system (Figure 1). We placed the subjects in each population intotwo major groups of African and European origin. Together, these two groups constituted81% and 83% of subjects 20 to 59 years-old and 72% and 77% of centenarians andnonagenarians in the Georgia and Louisiana samples, respectively. The ability to stratify ismarkedly enhanced by the Alu system used here, which can trace genealogy within theprimate lineage. The mean correct prediction rates with the 100 Alu used here are 95 to 99%(Bamshad et al., 2003). After stratification the association of APOE with longevity persisted(Table S2). However, no such association was detected for HRAS1 or LASS1 here (TableS3).
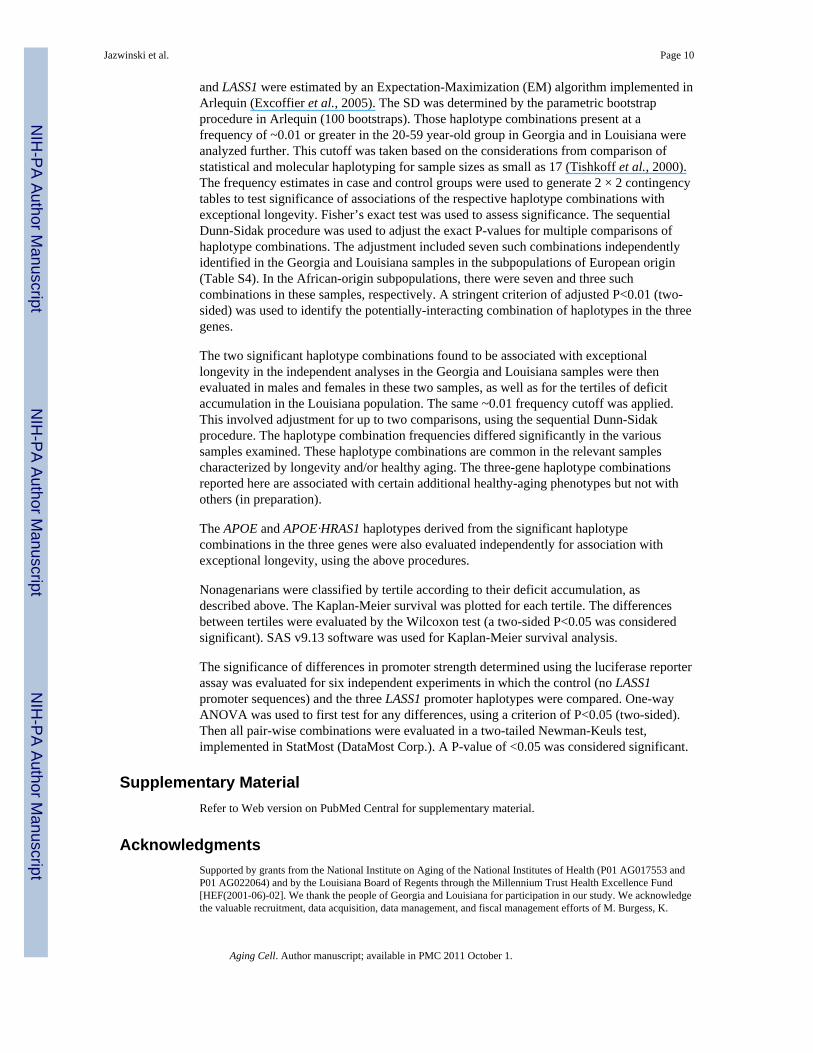
To test the hypothesis that the genetic interaction postulated above is associated withlongevity, we genotyped the Georgia sample at the three relevant genomic regions. None ofthe 15 SNP examined showed significance for departure from Hardy-Weinberg proportionsin either the African or European origin populations in Georgia. (The same was foundseparately for the Louisiana population.) We searched for combinations of haplotypes in thethree genes (15 SNP) in the Georgia population present at ~0.01 or greater frequency, usingexpectation maximization. We then tested them for association with exceptional longevity(Table S4). Such associations were detected in the subpopulation of European origin inGeorgia, stratified with an assignment probability of 0.9 (Table 1), but not in thesubpopulation of African origin. They involve the ε3 containing APOE haplotype (ATTTC)and the HRAS1 (CGCGCGT) haplotype in combination with the LASS1 (CCT) or (CGT)haplotypes, in which the SNP are listed starting with the furthest upstream SNP for eachgene. The odds ratios (OR) of 7.68 and 2.56 were obtained for the APOE, HRAS1, andLASS1 (CCT) or (CGT) haplotype combinations, respectively. The stratification of thepopulation at the 0.9 assignment probability level was sufficient for this analysis because nosignificant differences were observed in the frequencies of the ethnic affiliation markersbetween the control and centenarian groups in the European subpopulation.
To determine whether these associations are present in the Louisiana population, we carriedout the same analyses independently. The results obtained in the Georgia sample replicatedin the Louisiana sample (Table 1). The same haplotype combinations were associated withexceptional longevity in the subpopulation of European origin in Louisiana, stratified withan assignment probability of 0.9, and no significant association was found in the Africanorigin subpopulation. The OR were 2.93 and 2.97 for the APOE, HRAS1, and LASS1 (CCT)or (CGT) haplotype combinations, respectively. The lower OR of the LASS1 (CCT)-containing haplotype combination in the Louisiana population is likely due to the greaterdemographic selection for centenarians than for nonagenarians in the Georgia and Louisianasamples, respectively, but this does not appear to apply to the LASS1 (CGT).
Jazwinski et al. Page 3
Aging Cell. Author manuscript; available in PMC 2011 October 1.
NIH
-PA Author Manuscript
NIH
-PA Author Manuscript
NIH
-PA Author Manuscript
The lack of an association with longevity in the African-American subpopulation from bothGeorgia and Louisiana could be due to the relatively lower numbers of subjects from thisgroup. However, it is likely that this may be an intrinsic difference in the subpopulation.Analysis of the frequency of the haplotypes in the individual genes supports the notion thatthere is an intrinsic difference between the European and African subpopulations in bothGeorgia and Louisiana (Table 2). The major difference is in the APOE haplotype frequency,with a smaller difference in LASS1. The European populations in Georgia and Louisianaalso differ, as an examination of the haplotype blocks in the three genes suggests (FigureS1).
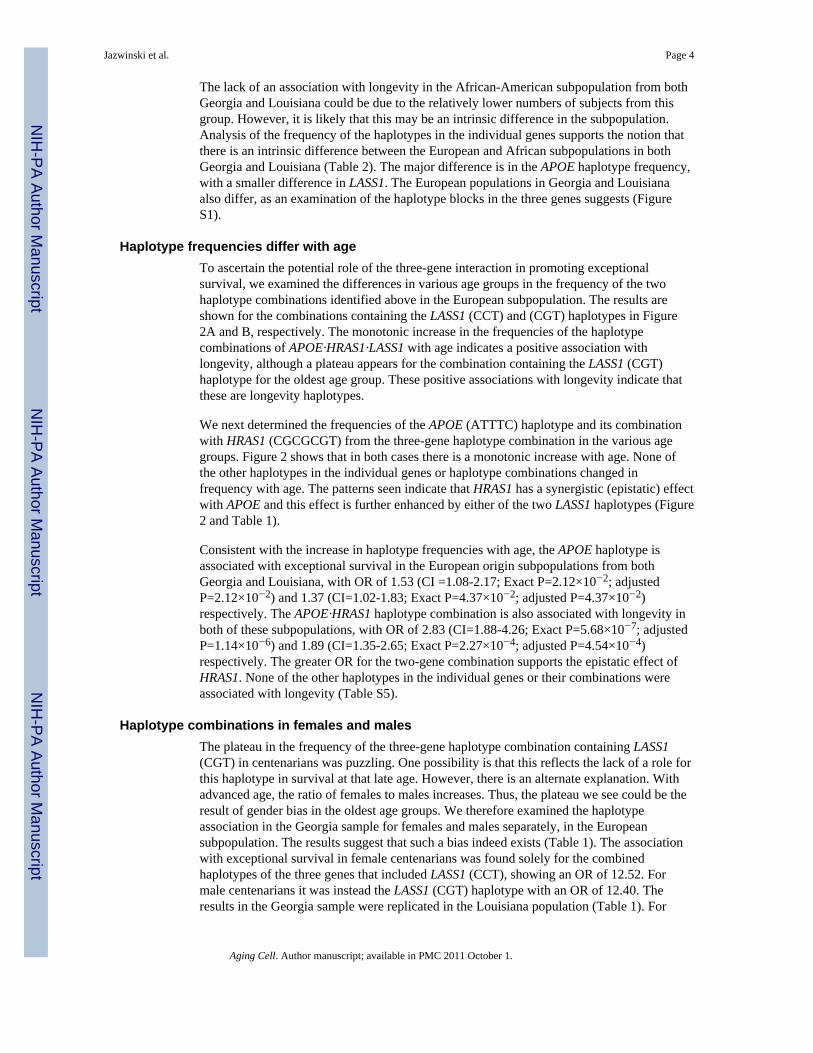
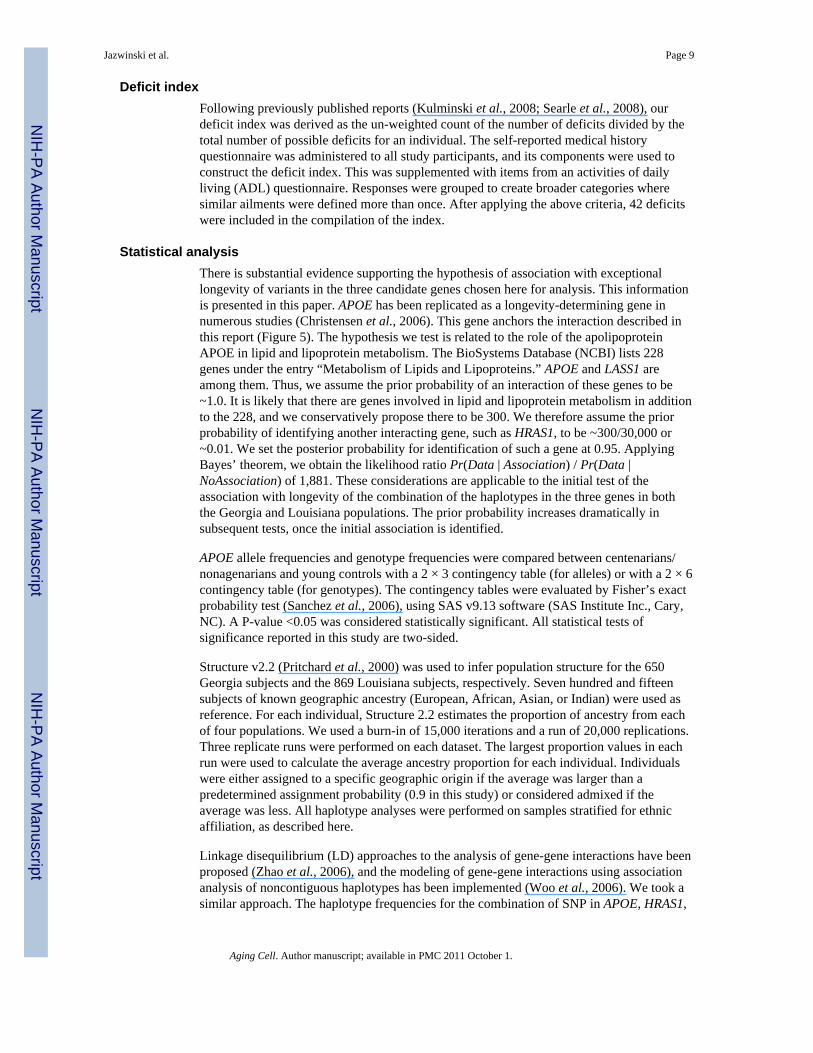
Haplotype frequencies differ with ageTo ascertain the potential role of the three-gene interaction in promoting exceptionalsurvival, we examined the differences in various age groups in the frequency of the twohaplotype combinations identified above in the European subpopulation. The results areshown for the combinations containing the LASS1 (CCT) and (CGT) haplotypes in Figure2A and B, respectively. The monotonic increase in the frequencies of the haplotypecombinations of APOE·HRAS1·LASS1 with age indicates a positive association withlongevity, although a plateau appears for the combination containing the LASS1 (CGT)haplotype for the oldest age group. These positive associations with longevity indicate thatthese are longevity haplotypes.
We next determined the frequencies of the APOE (ATTTC) haplotype and its combinationwith HRAS1 (CGCGCGT) from the three-gene haplotype combination in the various agegroups. Figure 2 shows that in both cases there is a monotonic increase with age. None ofthe other haplotypes in the individual genes or haplotype combinations changed infrequency with age. The patterns seen indicate that HRAS1 has a synergistic (epistatic) effectwith APOE and this effect is further enhanced by either of the two LASS1 haplotypes (Figure2 and Table 1).
Consistent with the increase in haplotype frequencies with age, the APOE haplotype isassociated with exceptional survival in the European origin subpopulations from bothGeorgia and Louisiana, with OR of 1.53 (CI =1.08-2.17; Exact P=2.12×10⁻²; adjustedP=2.12×10⁻²) and 1.37 (CI=1.02-1.83; Exact P=4.37×10⁻²; adjusted P=4.37×10⁻²)respectively. The APOE·HRAS1 haplotype combination is also associated with longevity inboth of these subpopulations, with OR of 2.83 (CI=1.88-4.26; Exact P=5.68×10⁻⁷; adjustedP=1.14×10⁻⁶) and 1.89 (CI=1.35-2.65; Exact P=2.27×10⁻⁴; adjusted P=4.54×10⁻⁴)respectively. The greater OR for the two-gene combination supports the epistatic effect ofHRAS1. None of the other haplotypes in the individual genes or their combinations wereassociated with longevity (Table S5).
Haplotype combinations in females and malesThe plateau in the frequency of the three-gene haplotype combination containing LASS1(CGT) in centenarians was puzzling. One possibility is that this reflects the lack of a role forthis haplotype in survival at that late age. However, there is an alternate explanation. Withadvanced age, the ratio of females to males increases. Thus, the plateau we see could be theresult of gender bias in the oldest age groups. We therefore examined the haplotypeassociation in the Georgia sample for females and males separately, in the Europeansubpopulation. The results suggest that such a bias indeed exists (Table 1). The associationwith exceptional survival in female centenarians was found solely for the combinedhaplotypes of the three genes that included LASS1 (CCT), showing an OR of 12.52. Formale centenarians it was instead the LASS1 (CGT) haplotype with an OR of 12.40. Theresults in the Georgia sample were replicated in the Louisiana population (Table 1). For
Jazwinski et al. Page 4
Aging Cell. Author manuscript; available in PMC 2011 October 1.
NIH
-PA Author Manuscript
NIH
-PA Author Manuscript
NIH
-PA Author Manuscript
female nonagenarians the combined haplotypes that included LASS1 (CCT) were associatedwith exceptional longevity with an OR of 3.12. For male nonagenarians this combinationincluded LASS1 (CGT) and an OR of 4.86.
Gene combination associated with healthy agingWe next examined the question whether the genetic combination that contributes toexceptional longevity is also associated with “healthy aging.” Healthy aging is a conceptthat is difficult to define adequately. We elected to quantify healthy aging using thefrequency of self-reported deficits (Rockwood & Mitnitski, 2007) in the Louisiananonagenarians (Table S6). For this purpose, we surveyed subjects for the presence of 42medical conditions or functional limitations and summed them for each nonagenarian. Wethen partitioned the subjects into tertiles based on the number of deficits reported; tertile 1had the fewest deficits, while tertile 3 had the greatest number of deficits. A Kaplan-Meiersurvival analysis was performed for each of the tertiles (Figure 3). Examining the entiresample of nonagenarians from Louisiana, the survival curves are significantly different(Wilcoxon χ2
(2)=20.06, P<0.0001).
We then searched for genetic associations with healthy aging by examining the haplotypesin the three genes in the tertile with the fewest deficits versus that with the most (Table 1).The results indicate that the combination of the same haplotypes in the three genes isassociated with healthy aging but only for the combination including LASS1 (CGT). The ORfor this association was 15.48 for the European subpopulation in Louisiana.
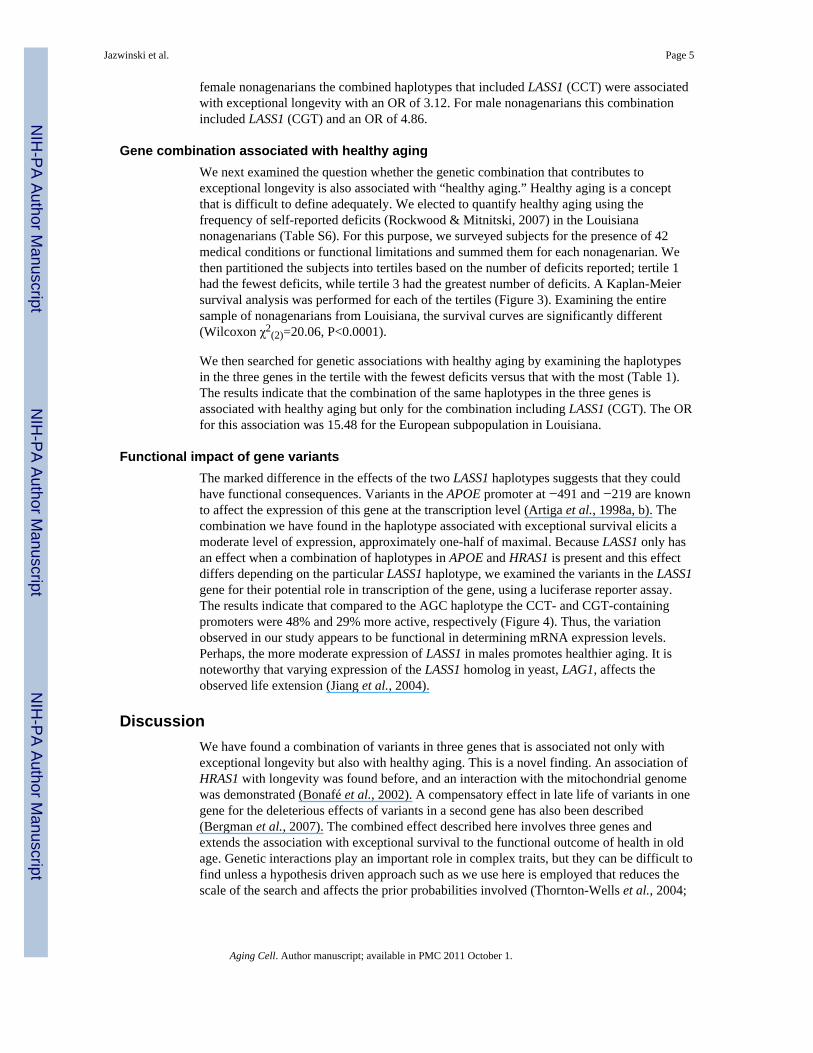
Functional impact of gene variantsThe marked difference in the effects of the two LASS1 haplotypes suggests that they couldhave functional consequences. Variants in the APOE promoter at −491 and −219 are knownto affect the expression of this gene at the transcription level (Artiga et al., 1998a, b). Thecombination we have found in the haplotype associated with exceptional survival elicits amoderate level of expression, approximately one-half of maximal. Because LASS1 only hasan effect when a combination of haplotypes in APOE and HRAS1 is present and this effectdiffers depending on the particular LASS1 haplotype, we examined the variants in the LASS1gene for their potential role in transcription of the gene, using a luciferase reporter assay.The results indicate that compared to the AGC haplotype the CCT- and CGT-containingpromoters were 48% and 29% more active, respectively (Figure 4). Thus, the variationobserved in our study appears to be functional in determining mRNA expression levels.Perhaps, the more moderate expression of LASS1 in males promotes healthier aging. It isnoteworthy that varying expression of the LASS1 homolog in yeast, LAG1, affects theobserved life extension (Jiang et al., 2004).
DiscussionWe have found a combination of variants in three genes that is associated not only withexceptional longevity but also with healthy aging. This is a novel finding. An association ofHRAS1 with longevity was found before, and an interaction with the mitochondrial genomewas demonstrated (Bonafé et al., 2002). A compensatory effect in late life of variants in onegene for the deleterious effects of variants in a second gene has also been described(Bergman et al., 2007). The combined effect described here involves three genes andextends the association with exceptional survival to the functional outcome of health in oldage. Genetic interactions play an important role in complex traits, but they can be difficult tofind unless a hypothesis driven approach such as we use here is employed that reduces thescale of the search and affects the prior probabilities involved (Thornton-Wells et al., 2004;
Jazwinski et al. Page 5
Aging Cell. Author manuscript; available in PMC 2011 October 1.
NIH
-PA Author Manuscript
NIH
-PA Author Manuscript
NIH
-PA Author Manuscript

Flint & Mackay, 2009). Unmasking the interactions of common variants mitigates thenecessity of invoking the wide involvement of rare variants in complex traits.
The association with healthy aging and the profile of increasing frequencies of thehaplotypes with age indicates that the three genes studied here are not frailty genes orhaplotypes but instead genetic determinants of longevity. The foundation for the geneticinteraction is laid by the haplotype in APOE. HRAS1 has a synergistic effect, and thiscombined effect is further enhanced by either of the two LASS1 haplotypes in a synergisticmanner. Our results point to the importance of accounting for population heterogeneity inassociation studies (Dai et al., 2007). The African-origin subpopulation displays a very lowfrequency of the crucial APOE haplotype, as well as a reduced frequency of the LASS1haplotypes. Thus, intrinsic genetic differences between the European and Africansubpopulations can explain the lack of observation of the three-gene interaction in the lattergroup. On the other hand, the associations we have discovered in the European-originsample from Georgia are replicated in the corresponding Louisiana sample, though thehaplotype structures in the two samples differ. It will be important to examine samples fromadditional populations for these associations to further generalize our findings and to explorepotential nuances in the haplotypic effects.
There are two different haplotypes in LASS1 that play a role in the three-gene combinationdescribed here. One appears to operate in females and the other in males to determineexceptional longevity. Furthermore, it is only the latter that is associated with healthy aging.Thus, similar but distinct mechanisms of aging are at play. Differences in geneticassociations with exceptional longevity between the genders have been noted previously (DeBenedictis et al., 2001). Interestingly, the cognition and physical function ability of malecentenarians is often greater than for their female counterparts, even though they areoutnumbered by them (Terry et al., 2008). Survival to exceptional old age, however, canoccur due to delay or escape from morbidity, as well as survival in its presence, regardlessof gender (Terry et al., 2008; Evert et al., 2003). The promoter analyses suggest that anenhanced LASS1 activity is conducive to longevity. They further suggest that healthy agingin nonagenarians depends on a somewhat lower enhancement of this promoter activity. Thiscould, for example, be related to moderation in apoptosis-promoting activity coupled tosufficient enhancement of cholesterol clearance by ceramide. Our results support a model(Figure 5) postulating that metabolic (lipid) stress induces protective responses. However, atsome point, removal of damaged cells is needed. Confirmation of this model will require thelongitudinal study of appropriate endophenotypes.
The haplotypes in the three genes are all present at high frequency in the Europeansubpopulation in both Georgia and Louisiana (Table 2). However, the congruence of therespective haplotypes in all three genes is relatively infrequent in the population at large,although it increases in frequency dramatically with age (Table 1 and Figure 2). Thus, wehave uncovered an individual path to exceptional longevity and healthy aging, and othersremain to be found.
Experimental proceduresStudy subjects
The Georgia sample (N=650) was recruited in the Georgia Centenarian Study from 44counties in Northern Georgia. The sampling frame consisted of voter’s registration files andlists prepared from a survey of nursing homes and personal care homes in the catchmentarea for centenarians and random digit dialing for younger subjects. The Louisiana sample(N=869) was recruited in the Louisiana Healthy Aging Study from 8 parishes within a 40-mile radius of Baton Rouge. The sampling frame consisted of the Center for Medicare and
Jazwinski et al. Page 6
Aging Cell. Author manuscript; available in PMC 2011 October 1.
NIH
-PA Author Manuscript
NIH
-PA Author Manuscript
NIH
-PA Author Manuscript

Medicaid Services enrollment database for subjects 65 and older and voter’s registrationfiles for younger individuals. Age of subjects was verified using both demographicquestionnaires and documentary evidence. Mortality data were collected using SocialSecurity Death Index search. Subjects provided informed consent according to protocolsapproved by the respective Institutional Review Boards. The demographic characteristics ofthe samples are tabulated (Table S7).
GenotypingSmall subsets of samples from Georgia and Louisiana were first independently genotyped toidentify all detectable variation in the selected genomic regions. Only polymorphismspresent at ≥0.09 frequency were chosen for subsequent analysis in all samples. Thisprovided sufficient power (>0.95) to detect associations with exceptional longevity (Dai etal., 2007). Genomic regions of interest were then amplified by the polymerase chainreaction (PCR). The primers, forward and reverse respectively, used to amplify the DNAregions of interest by the PCR were as follows: (1) the promoter region of the APOE gene,5′-GCGTCTGAGCGTTCACTGT-3′ and 5′-GTCCCAGTCTCGCATTCCT-3′; (2) exon 4of APOE, 5′-CTTGGGTCTCTCTGGCTCATC-3′ and 5′-GCAGCCTGCACCTTCTCC-3′;(3) promoter of LASS1, 5′-CAGCAAGTGACCCTCAGAG A-3′ and 5′-GACCTGGACCCCGAGAGA-3′; (4) exon1 of LASS1, 5′-GCCTGGGTTTCTCTGCTG-3′and 5′-GCCCGAGAGACCTTATCCTG-3′; (5) promoter of HRAS1, 5′-ATCCCAGCCTTTCCCCAG-3′ and 5′-TTCGCCCCGCGCATGGGCT-3′; (6) exon 1 ofHRAS1, 5′-CAGGAGACCCTGTAGGAGGA-3′ and 5′-CCTATCCTGGCTGTGTCCTG-3′.
Amplicons were verified by agarose gel electrophoresis, and cleaned DNA was subjected tocycle-sequencing using the Big-Dye Terminator Reagent version 3.1 (Applied Biosystems)and the same primers, and the 3130xl DNA sequencing system (Applied Biosystems).Identification of alleles was aided by the SNP detection and base-calling software Seqscapev2.5 (Applied Biosystems). To minimize errors, both strands of DNA were sequenced twiceindependently. The genotyped loci included SNP: rs449647, rs769446, rs405509, rs429358,rs7412, rs8176330, rs8176331, rs8176332, rs8176333, rs8176334, rs8176335, rs12628,rs60774903, rs3746263, and a SNP in exon 1 (+234) in LASS1 that is not found in dbSNP.The genotyped loci are tabulated (Table S8).
Some of the Louisiana samples were genotyped using the SNPlex technology (AppliedBiosystems), which is based on the oligonucleotide ligation assay combined with multiplexPCR amplification. Primers were designed according to the SNPlex Design Pipeline for thefollowing SNP: rs449647, rs769446, rs405509, rs440446, rs8176330, rs2229765,rs3746263, rs1801282, rs3856806, and rs17848595. Size fractionation of genotype-specificproducts was performed by capillary electrophoresis using the 3130xl DNA Analyzer, andgenotype calls were made using the GeneMapper v4.0 software (Applied Biosystems). TheSNPlex genotyping was repeated twice independently.
The two polymorphisms in the coding region (rs429358 and rs7412) account for theoccurrence of three alleles, ε2, ε3, and ε4, which result in the three major isoforms, E2, E3,and E4 of APOE, respectively. The E2, E3, and E4 isoforms differ in amino acid sequenceat site A (residue number 112) and site B (residue number 158) in exon 4. For HRAS1 andLASS1 SNP, their locations are relative to the first nucleotide of the translation start codon,whereas the transcription start site was used for the APOE SNP.
Population stratification using StructureIdentification of ethnic origins of individuals using Alu insertion polymorphisms wasperformed as described (Ray et al., 2005; Bamshad et al., 2003; Watkins et al., 2003). DNA
Jazwinski et al. Page 7
Aging Cell. Author manuscript; available in PMC 2011 October 1.
NIH
-PA Author Manuscript
NIH
-PA Author Manuscript
NIH
-PA Author Manuscript

samples were genotyped at 100 separate Alu loci located throughout the genome. The Alusequences were amplified by PCR using locus specific primers. The PCR fragments wereseparated by agarose gel electrophoresis. The primers and methods used have beendescribed (Ray et al., 2005; Bamshad et al., 2003; Watkins et al., 2003). Subjects wereclassified as one or the other of the possible homozygotes based on the presence of aparticular Alu sequence at a given locus or as heterozygotes. The Alu genotypes thusobtained were analyzed to assign ethnic affiliation using Structure (Pritchard et al., 2000).For this purpose, the same Alu genotypes from 715 independent DNA samples fromsubjects from around the world were used (Ray et al., 2005; Bamshad et al., 2003; Watkinset al., 2003). These samples spanned the geographic regions of Europe, Africa, Asia, andIndia and included sampling of individuals from many populations in each region (31 total).Subjects were then assigned to populations of origin corresponding to these geographicregions using an assignment probability of 0.9.
Plot of pairwise linkage disequilibrium (LD) comparisonHaplotype blocks for the three genes were examined using Haploview. The standard colorscheme is used for D’/LOD values: bright red (D’ = 1, LOD ≥ 2); blue (D’ = 1, LOD < 2);shades of pink/red (D’ < 1, LOD ≥ 2); white (D’ < 1, LOD < 2). The numbers shown insidethe boxes are D’ values x 100 (empty boxes represent the D’ value of 1). Haplotype blocksare defined based on confidence bounds on D’. If the one-sided upper 95% confidencebound on D’ lies between 0.7 and 0.98, the SNP pairs involved are considered to be instrong LD (Gabriel et al., 2002). Haploview was also used to examine the Hardy-Weinbergequilibrium. None of the 15 SNP examined in this study showed significance for departurefrom Hardy-Weinberg proportions in the Georgia and Louisiana samples stratified byStructure at 0.9 assignment probability. Haploview is available at:www.broad.mit.edu/mpg/haploview.
Promoter analysis of LASS1 haplotypesA 1,755-bp DNA fragment containing the putative promoter region and part of the codingregion of LASS1 was PCR-amplified from appropriate genomic DNA samples using EcoRVand BglII-tagged primers and cloned into the Pgl4.10 vector (Promega). The clonedsequence is in frame with the firefly luciferase coding sequence in the vector. Then, anadditional 1,040-bp fragment tagged with XhoI and EcoRV was added upstream of theoriginal clone. The translational start codon of LASS1 was changed to TAG by site-directedmutagenesis. The correctness of the final constructs was verified by sequencing. The onlysequence differences between the constructs were at the polymorphic sites of interestspecified below.
Transfection of HeLa cells was performed using the PolyFect transfection reagent (Qiagen)per the protocol provided. Co-transfection was done with mixtures of one of theexperimental constructs (0.4 μg) with a control vector, Pgl4.73 (10 ng), which carries aRenilla luciferase coding sequence under the SV40 promoter. The experimental constructswere either Pgl4.10 without LASS1 promoter sequences or Pgl4.10 with one of threedifferent LASS1 sequences. These had the following bases at positions −718, +216, and+234, respectively: AGC, CCT, or CGT. Following 24-hr incubation, luciferase activitieswere measured using the Dual-Glo Luciferase Assay (Promega) per the protocol provided,using a Modulus Microplate Luminometer (Turner BioSystems). The firefly luminescencereadings were normalized to the Renilla luminescence readings. There were at least 6replicates of each assay per experiment.
Jazwinski et al. Page 8
Aging Cell. Author manuscript; available in PMC 2011 October 1.
NIH
-PA Author Manuscript
NIH
-PA Author Manuscript
NIH
-PA Author Manuscript
Deficit indexFollowing previously published reports (Kulminski et al., 2008; Searle et al., 2008), ourdeficit index was derived as the un-weighted count of the number of deficits divided by thetotal number of possible deficits for an individual. The self-reported medical historyquestionnaire was administered to all study participants, and its components were used toconstruct the deficit index. This was supplemented with items from an activities of dailyliving (ADL) questionnaire. Responses were grouped to create broader categories wheresimilar ailments were defined more than once. After applying the above criteria, 42 deficitswere included in the compilation of the index.
Statistical analysisThere is substantial evidence supporting the hypothesis of association with exceptionallongevity of variants in the three candidate genes chosen here for analysis. This informationis presented in this paper. APOE has been replicated as a longevity-determining gene innumerous studies (Christensen et al., 2006). This gene anchors the interaction described inthis report (Figure 5). The hypothesis we test is related to the role of the apolipoproteinAPOE in lipid and lipoprotein metabolism. The BioSystems Database (NCBI) lists 228genes under the entry “Metabolism of Lipids and Lipoproteins.” APOE and LASS1 areamong them. Thus, we assume the prior probability of an interaction of these genes to be~1.0. It is likely that there are genes involved in lipid and lipoprotein metabolism in additionto the 228, and we conservatively propose there to be 300. We therefore assume the priorprobability of identifying another interacting gene, such as HRAS1, to be ~300/30,000 or~0.01. We set the posterior probability for identification of such a gene at 0.95. ApplyingBayes’ theorem, we obtain the likelihood ratio Pr(Data | Association) / Pr(Data |NoAssociation) of 1,881. These considerations are applicable to the initial test of theassociation with longevity of the combination of the haplotypes in the three genes in boththe Georgia and Louisiana populations. The prior probability increases dramatically insubsequent tests, once the initial association is identified.
APOE allele frequencies and genotype frequencies were compared between centenarians/nonagenarians and young controls with a 2 × 3 contingency table (for alleles) or with a 2 × 6contingency table (for genotypes). The contingency tables were evaluated by Fisher’s exactprobability test (Sanchez et al., 2006), using SAS v9.13 software (SAS Institute Inc., Cary,NC). A P-value <0.05 was considered statistically significant. All statistical tests ofsignificance reported in this study are two-sided.
Structure v2.2 (Pritchard et al., 2000) was used to infer population structure for the 650Georgia subjects and the 869 Louisiana subjects, respectively. Seven hundred and fifteensubjects of known geographic ancestry (European, African, Asian, or Indian) were used asreference. For each individual, Structure 2.2 estimates the proportion of ancestry from eachof four populations. We used a burn-in of 15,000 iterations and a run of 20,000 replications.Three replicate runs were performed on each dataset. The largest proportion values in eachrun were used to calculate the average ancestry proportion for each individual. Individualswere either assigned to a specific geographic origin if the average was larger than apredetermined assignment probability (0.9 in this study) or considered admixed if theaverage was less. All haplotype analyses were performed on samples stratified for ethnicaffiliation, as described here.
Linkage disequilibrium (LD) approaches to the analysis of gene-gene interactions have beenproposed (Zhao et al., 2006), and the modeling of gene-gene interactions using associationanalysis of noncontiguous haplotypes has been implemented (Woo et al., 2006). We took asimilar approach. The haplotype frequencies for the combination of SNP in APOE, HRAS1,
Jazwinski et al. Page 9
Aging Cell. Author manuscript; available in PMC 2011 October 1.
NIH
-PA Author Manuscript
NIH
-PA Author Manuscript
NIH
-PA Author Manuscript
and LASS1 were estimated by an Expectation-Maximization (EM) algorithm implemented inArlequin (Excoffier et al., 2005). The SD was determined by the parametric bootstrapprocedure in Arlequin (100 bootstraps). Those haplotype combinations present at afrequency of ~0.01 or greater in the 20-59 year-old group in Georgia and in Louisiana wereanalyzed further. This cutoff was taken based on the considerations from comparison ofstatistical and molecular haplotyping for sample sizes as small as 17 (Tishkoff et al., 2000).The frequency estimates in case and control groups were used to generate 2 × 2 contingencytables to test significance of associations of the respective haplotype combinations withexceptional longevity. Fisher’s exact test was used to assess significance. The sequentialDunn-Sidak procedure was used to adjust the exact P-values for multiple comparisons ofhaplotype combinations. The adjustment included seven such combinations independentlyidentified in the Georgia and Louisiana samples in the subpopulations of European origin(Table S4). In the African-origin subpopulations, there were seven and three suchcombinations in these samples, respectively. A stringent criterion of adjusted P<0.01 (two-sided) was used to identify the potentially-interacting combination of haplotypes in the threegenes.
The two significant haplotype combinations found to be associated with exceptionallongevity in the independent analyses in the Georgia and Louisiana samples were thenevaluated in males and females in these two samples, as well as for the tertiles of deficitaccumulation in the Louisiana population. The same ~0.01 frequency cutoff was applied.This involved adjustment for up to two comparisons, using the sequential Dunn-Sidakprocedure. The haplotype combination frequencies differed significantly in the varioussamples examined. These haplotype combinations are common in the relevant samplescharacterized by longevity and/or healthy aging. The three-gene haplotype combinationsreported here are associated with certain additional healthy-aging phenotypes but not withothers (in preparation).
The APOE and APOE·HRAS1 haplotypes derived from the significant haplotypecombinations in the three genes were also evaluated independently for association withexceptional longevity, using the above procedures.
Nonagenarians were classified by tertile according to their deficit accumulation, asdescribed above. The Kaplan-Meier survival was plotted for each tertile. The differencesbetween tertiles were evaluated by the Wilcoxon test (a two-sided P<0.05 was consideredsignificant). SAS v9.13 software was used for Kaplan-Meier survival analysis.
The significance of differences in promoter strength determined using the luciferase reporterassay was evaluated for six independent experiments in which the control (no LASS1promoter sequences) and the three LASS1 promoter haplotypes were compared. One-wayANOVA was used to first test for any differences, using a criterion of P<0.05 (two-sided).Then all pair-wise combinations were evaluated in a two-tailed Newman-Keuls test,implemented in StatMost (DataMost Corp.). A P-value of <0.05 was considered significant.
Supplementary MaterialRefer to Web version on PubMed Central for supplementary material.
AcknowledgmentsSupported by grants from the National Institute on Aging of the National Institutes of Health (P01 AG017553 andP01 AG022064) and by the Louisiana Board of Regents through the Millennium Trust Health Excellence Fund[HEF(2001-06)-02]. We thank the people of Georgia and Louisiana for participation in our study. We acknowledgethe valuable recruitment, data acquisition, data management, and fiscal management efforts of M. Burgess, K.
Jazwinski et al. Page 10
Aging Cell. Author manuscript; available in PMC 2011 October 1.
NIH
-PA Author Manuscript
NIH
-PA Author Manuscript
NIH
-PA Author Manuscript

Grier, E. Jackson, E. McCarthy, K. Shaw, L. Strong, S. Reynolds, S. Anderson, E. Cassidy, M. Janke, T. Savla, M.Durden, M. Cervantes, D. Rouzan, and T. Beard.
Additional authors include for The Georgia Centenarian Study: R.C. Green, M. Gearing, W.R. Markesbery, J.L.Woodard, M.A. Johnson, J.S. Tenover, I.C. Siegler, P. Martin, M. MacDonald, C. Rott, W.L. Rodgers, and A.Davey; for The Louisiana Healthy Aging Study: M. Allen, I.E. Antikainen, A.M. Arce, J. Arceneaux, E.O.Boudreaux, L. Byerley, P.A. Callinan, C.M. Champagne, H. Cheng, Y.-w. Chiu, L. Cosenza, M.E. Cress, M.Czarny-Ratajczak, J.P. DeLany, J. Denver, A. Deutsch, M.J. deVeer, D.A. Dobrosielski, R. Ellis, A. Ermolao, M.Erwin, M. Erwin, J. Fabre, E. Fontham, M. Frisard, P. Geiselman, L. Goodwin, V. Greco, S. Hadie, T. Hall, M.Hamilton, S.W. Herke, K. Hawley, J. Hayden, K. Hebert, F. Holton, H.-C. Hsu, D. Johannsen, L. Kawasaki, B.Kimball, C. King-Rowley, M. Konkel, R. Kuhn, K. Landry, C. Lavie, D. LaVie, M. Leblanc, H.-Y. Lin, K. Lopez,B. McEvoy-Hein, J.D. Mountz, E. Olinde, J. Owens, K. Pedersen, A. Pellett, P. Remedios, Y. Robertson, J. Rood,H. Rothschild, R.A. Russell, E. Sandifer, B. Schmidt, R. Schwartz, D.K. Scott, J. Silva, F.N. Standberry, J.Thomson, A. Tiwari, V. Toups, C. Traylor, C. Velasco-Gonzalez, C. Waguespack, X.-Y. Wang, R.H. Wood, Q.Yu, S. Zehr, and P. Zhang.
ReferencesArtiga MJ, Bullido MJ, Sastre I, Recuero M, Garcia MA, Aldudo J, Vázquez J, Valdivieso F. Allelic
polymorphisms in the transcriptional regulatory region of apolipoprotein E gene. FEBS Lett. 1998a;421:105–108. [PubMed: 9468288]
Artiga MJ, Bullido MJ, Frank A, Sastre I, Recuero M, Garcia MA, Lendon CL, Han SW, Morris JC,Vázquez J, Goate A, Valdivieso F. Risk of Alzheimer’s disease correlates with transcriptionalactivity of the APOE gene. Hum. Molec. Genet. 1998b; 7:1887–1892. [PubMed: 9811931]
Bamshad MJ, Wooding S, Watkins WS, Ostler CT, Batzer MA, Jorde LB. Human population geneticstructure and inference of group membership. Am. J. Hum. Genet. 2003; 72:578–589. [PubMed:12557124]
Bergman A, Atzmon G, Ye K, MacCarthy T, Barzilai N. Buffering mechanisms in aging: a systemsapproach toward uncovering the genetic component of aging. PLoS Comput. Biol. 2007; 3:e170.[PubMed: 17784782]
Bonafé M, Barbi C, Olivieri F, Yashin A, Andreev KF, Vaupel JW, De Benedictis G, Rose G, CarrieriG, Jazwinski SM, Franceschi C. An allele of HRAS1 3′variable number of tandem repeats is a frailtyallele: Implication for an evolutionarily-conserved pathway involved in longevity. Gene. 2002;286:121–126. [PubMed: 11943467]
Chen JB, Sun J, Jazwinski SM. Prolongation of the yeast life span by the v-Ha-Ras oncogene. Molec.Microbiol. 1990; 4:2081–2086. [PubMed: 2089221]
Christensen K, Johnson TE, Vaupel JW. The quest for genetic determinants of human longevity:Challenges and insights. Nature Rev. Genet. 2006; 7:436–448. [PubMed: 16708071]
D’mello NP, Childress AM, Franklin DS, Kale SP, Pinswasdi C, Jazwinski SM. Cloning andcharacterization of LAG1, a longevity gene in yeast. J. Biol. Chem. 1994; 269:15451–15459.[PubMed: 8195187]
Dai J, Li L, Kim S, Kimball B, Jazwinski SM, Arnold J, the Georgia Centenarian Study. Exact samplesize needed to detect dependence in 2 × 2 × 2 tables. Biometrics. 2007; 63:1245–1253. [PubMed:18078486]
De Benedictis G, Tan Q, Jeune B, Christensen K, Ukraintseva SV, Bonafè M, Franceschi C, VaupelJW, Yashin AI. Recent advances in human gene-longevity association studies. Mech. Ageing Dev.2001; 122:909–920. [PubMed: 11348658]
Dickson RC. More chores for TOR: De novo ceramide synthesis. Cell Metabolism. 2008; 7:99–100.[PubMed: 18249168]
Evert J, Lawler E, Bogan H, Perls T. Morbidity profiles of centenarians: survivors, delayers, andescapers. J. Gerontol. A Biol. Sci. Med. Sci. 2003; 58:232–237. [PubMed: 12634289]
Excoffier L, Laval G, Schneider S. Arlequin ver. 3.0: An integrated software package for populationgenetics data analysis. Evolutionary Bioinformatics Online. 2005; 1:47–50. [PubMed: 19325852]
Finch CE, Ruvkun G. The genetics of aging. Ann. Rev. Genomics Hum. Genet. 2001; 2:435–462.[PubMed: 11701657]
Flint J, Mackay TF. Genetic architecture of quantitative traits in mice, flies, and humans. Genome Res.2009; 19:723–733. [PubMed: 19411597]
Jazwinski et al. Page 11
Aging Cell. Author manuscript; available in PMC 2011 October 1.
NIH
-PA Author Manuscript
NIH
-PA Author Manuscript
NIH
-PA Author Manuscript

Gabriel SB, Schaffner SF, Nguyen H, Moore JM, Roy J, Blumenstiel B, Higgins J, DeFelice M,Lochner A, Faggart M, Liu-Cordero SN, Rotimi C, Adeyemo A, Cooper R, Ward R, Lander ES,Daly MJ, Altshuler D. The structure of haplotype blocks in the human genome. Science. 2002;296:2225–2229. [PubMed: 12029063]
Guillas I, Jiang JC, Vionnet C, Roubaty C, Uldry D, Chuard R, Wang J, Jazwinski SM, ConzelmannA. Human homologues of LAG1 reconstitute Acyl-CoA-dependent ceramide synthesis in yeast. J.Biol. Chem. 2003; 278:37083–37091. [PubMed: 12869556]
Hong MG, Reynolds C, Gatz M, Johansson B, Palmer JC, Gu HF, Blennow K, Kehoe PG, de Faire U,Pedersen NL, Prince JA. Evidence that the gene encoding insulin degrading enzyme influenceshuman lifespan. Hum. Molec. Genet. 2008; 17:2370–2378. [PubMed: 18448515]
Jazwinski SM. Longevity, genes, and aging. Science. 1996; 273:54–59. [PubMed: 8658195]Jazwinski SM, Conzelmann A. LAG1 puts the focus on ceramide signaling. Int. J. Biochem. Cell Biol.
2002; 34:1491–1495. [PubMed: 12200041]Jiang JC, Kirchman PA, Allen M, Jazwinski SM. Suppressor analysis points to the subtle role of the
LAG1 ceramide synthase gene in determining yeast longevity. Exp. Gerontol. 2004; 39:999–1009.[PubMed: 15236759]
Kenyon C. The plasticity of aging: Insights from long-lived mutants. Cell. 2005; 120:449–460.[PubMed: 15734678]
Koybasi S, Senkal CE, Sundararaj K, Spassieva S, Bielawski J, Osta W, Day TA, Jiang JC, JazwinskiSM, Hannun YA, Obeid LM, Ogretmen B. Defects in cell growth regulation by C18:0-ceramideand longevity assurance gene 1 in human head and neck squamous cell carcinomas. J. Biol. Chem.2004; 279:44311–44319. [PubMed: 15317812]
Kulminski AM, Ukraintseva SV, Culminskaya IV, Arbeev KG, Land KC, Akushevich L, Yashin AI.Cumulative deficits and physiological indices as predictors of mortality and long life. J. Gerontol.A Biol. Sci. Med. Sci. 2008; 63:1053–1059. [PubMed: 18948555]
Kusminski CM, Shetty S, Orci L, Unger RH, Scherer PE. Diabetes and apoptosis: lipotoxicity.Apoptosis. 2009; 14:1484–1495. [PubMed: 19421860]
Mahley RW, Rall SJ. Apolipoprotein E: Far more than a lipid transport protein. Ann. Rev. GenomicsHum. Genet. 2000; 1:507–537. [PubMed: 11701639]
Mehta R, Steinkraus KA, Sutphin GL, Ramos FJ, Shamieh LS, Huh A, Davis C, Chandler-Brown D,Kaeberlein M. Proteasomal regulation of the hypoxic response modulates aging in C. elegans.Science. 2009; 324:1196–1198. [PubMed: 19372390]
Menuz V, Howell KS, Gentina S, Epstein S, Riezman I, Fornallaz-Mulhauser M, Hengartner MO,Gomez M, Riezman H, Martinou JC. Protection of C. elegans from anoxia by HYL-2 ceramidesynthase. Science. 2009; 324:381–384. [PubMed: 19372430]
Migliaccio E, Giorgio M, Mele S, Pelicci G, Reboldi P, Pandolfi PP, Lanfrancone L, Pelicci PG. Thep66shc adaptor protein controls oxidative stress response and life span in mammals. Nature. 1999;402:309–313. [PubMed: 10580504]
Ogretmen B, Hannun Y. Biologically active sphingolipids in cancer pathogenesis and treatment.Nature Rev. Cancer. 2004; 4:604–616. [PubMed: 15286740]
Pritchard JK, Stephens M, Donnelly P. Inference of population structure using multilocus genotypedata. Genetics. 2000; 155:945–959. [PubMed: 10835412]
Ramos KS. Redox regulation of c-Ha-ras and osteopontin signaling in vascular smooth muscle cells:Implications in chemical atherogenesis. Ann. Rev. Pharmacol. Toxicol. 1999; 39:243–265.[PubMed: 10331084]
Ray DA, Walker JA, Hall A, Llewellyn B, Ballantyne J, Christian AT, Turteltaub K, Batzer MA.Inference of human geographic origins using Alu insertion polymorphisms. Forensic Sci. Int.2005; 153:117–124. [PubMed: 16139099]
Rockwood K, Mitnitski A. Frailty in relation to the accumulation of deficits. J. Gerontol. A Biol. Sci.Med. Sci. 2007; 62:722–727. [PubMed: 17634318]
Sanchez MS, Basten CJ, Ferrenberg AM, Asmussen MA, Arnold J. Exact sample sizes needed todetect dependence in 2 × 3 tables. Theor. Pop. Biol. 2006; 69:111–120. [PubMed: 16343573]
Jazwinski et al. Page 12
Aging Cell. Author manuscript; available in PMC 2011 October 1.
NIH
-PA Author Manuscript
NIH
-PA Author Manuscript
NIH
-PA Author Manuscript

Schächter F, Faure-Delanef L, Guénot F, Rouger H, Froguel P, Lesueur-Ginot L, Cohen D. Geneticassociations with human longevity at the APOE and ACE loci. Nature Genet. 1994; 6:29–32.[PubMed: 8136829]
Searle SD, Mitnitski A, Gahbauer EA, Gill TM, Rockwood K. A standard procedure for creating afrailty index. BMC Geriatr. 2008 http://www.biomedcentral.com/1471-2318/8/24.
Song Y, Stampfer MJ, Liu S. Meta-analysis: Apolipoprotein E genotypes and risk for coronary heartdisease. Ann. Intern. Med. 2004; 141:137–147. [PubMed: 15262670]
Strittmatter WJ, Saunders AM, Schmechel D, Pericak-Vance M, Enghild J, Salvesen GS, Roses AD.Apolipoprotein E: High-avidity binding to beta-amyloid and increased frequency of type 4 allelein late-onset Alzheimer disease. Proc. Natl. Acad. Sci. USA. 1993; 90:1977–1981. [PubMed:8446617]
Suh Y, Atzmon G, Cho MO, Hwang D, Liu B, Leahy DJ, Barzilai N, Cohen P. Functionallysignificant insulin-like growth factor I receptor mutations in centenarians. Proc. Natl. Acad. Sci.USA. 2008; 105:3438–3442. [PubMed: 18316725]
Sun J, Kale SP, Childress AM, Pinswasdi C, Jazwinski SM. Divergent roles of RAS1 and RAS2 inyeast longevity. J. Biol. Chem. 1994; 269:18638–18645. [PubMed: 8034612]
Tedesco P, Jiang J, Wang J, Jazwinski SM, Johnson TE. Genetic analysis of hyl-1, the C. eleganshomolog of LAG1/LASS1. Age. 2008; 30:43–52. [PubMed: 19424872]
Terry DF, Sebastiani P, Andersen SL, Perls TT. Disentangling the roles of disability and morbidity insurvival to exceptional old age. Arch. Intern. Med. 2008; 168:277–283. [PubMed: 18268168]
Thornton-Wells TA, Moore JJ, Haines JL. Genetics, statistics and human disease: Analytical retoolingfor complexity. Trends Genet. 2004; 20:640–647. [PubMed: 15522460]
Tishkoff SA, Pakstis AJ, Ruano G, Kidd KK. The accuracy of statistical methods for estimation ofhaplotype frequencies: An example from the CD4 locus. Am. J. Hum. Genet. 2000; 67:518–522.[PubMed: 10859209]
Watkins WS, Rogers AR, Ostler CT, Wooding S, Bamshad MJ, Brassington AM, Carroll ML, NguyenSV, Walker JA, Prasad BV, Reddy PG, Das PK, Batzer MA, Jorde LB. Genetic variation amongworld populations: Inferences from 100 Alu insertion polymorphisms. Genome Res. 2003;13:1607–1618. [PubMed: 12805277]
Willcox BJ, Donlon TA, He Q, Chen R, Grove JS, Yano K, Masaki KH, Willcox DC, Rodriguez B,Curb JD. FOXO3A genotype is strongly associated with human longevity. Proc. Natl. Acad. Sci.USA. 2008; 105:13987–13992. [PubMed: 18765803]
Witting SR, Maiorano JN, Davidson WS. Ceramide enhances cholesterol efflux to apolipoprotein A-Iby increasing the cell surface presence of ATP-binding cassette transporter A1. J. Biol. Chem.2003; 278:40121–40127. [PubMed: 12890677]
Woo JG, Dolan LM, Deka R, Kaushal RD, Shen Y, Pal P, Daniels SR, Martin LJ. Interactions betweennoncontiguous haplotypes in the adiponectin gene ACDC are associated with plasma adiponectin.Diabetes. 2006; 55:523–529. [PubMed: 16443790]
Zhao J, Jin L, Xiong M. Test for interaction between two unlinked loci. Am. J. Hum. Genet. 2006;79:831–845. [PubMed: 17033960]
Jazwinski et al. Page 13
Aging Cell. Author manuscript; available in PMC 2011 October 1.
NIH
-PA Author Manuscript
NIH
-PA Author Manuscript
NIH
-PA Author Manuscript

Fig. 1.Stratification of the populations by ethnic affiliation. Alu genotypes and Structure analysiswere employed to assign subjects to two major strata, European and African, in the Georgia(A) and Louisiana (B) populations. The Structure analysis was carried out in two batches forLouisiana consisting of 434 and 435 samples to speed computation, the latter of which isshown, while all 650 samples from Georgia were analyzed in one batch. Dots: red (Georgiaor Louisiana samples), green (African control samples), blue (European control samples),pink (Asian control samples), orange (Indian control samples). Indian refers to the Indiansubcontinent. Not all samples are evident due to superposition of dots.
Jazwinski et al. Page 14
Aging Cell. Author manuscript; available in PMC 2011 October 1.
NIH
-PA Author Manuscript
NIH
-PA Author Manuscript
NIH
-PA Author Manuscript
Fig. 2.Haplotype frequencies in different age groups. The frequencies for each haplotype orhaplotype combination determined for the European subpopulation (0.9 assignmentprobability) were normalized to the frequencies in the <60 years-old age group from Georgiaor Louisiana, respectively, to facilitate comparison. Error bars denote the SD (100bootstraps). The age groups labeled “90” and “100” are the nonagenarians and centenariansin Georgia and Louisiana, respectively. For clarity, only the haplotypes or haplotypecombinations that differ significantly in frequency between age groups are shown: APOE(ATTTC), HRAS1 (CGCGCGT), and LASS1 (CCT) in A and APOE (ATTTC), HRAS1(CGCGCGT), and LASS1 (CGT) in B. Note the difference in scale of the ordinates in A andB. The APOE and APOE·HRAS1 frequencies are identical in the two panels.
Jazwinski et al. Page 15
Aging Cell. Author manuscript; available in PMC 2011 October 1.
NIH
-PA Author Manuscript
NIH
-PA Author Manuscript
NIH
-PA Author Manuscript

Fig. 3.Survival of nonagenarians as a function of their healthy aging profile. Kaplan-Meier survivalof all nonagenarians in the Louisiana sample is plotted after partitioning individuals intotertiles of deficit accumulation. Deficit count increases from tertile 1 to 3. Mortality wasassessed on follow up after enrollment. Censoring is indicated by the symbols.
Jazwinski et al. Page 16
Aging Cell. Author manuscript; available in PMC 2011 October 1.
NIH
-PA Author Manuscript
NIH
-PA Author Manuscript
NIH
-PA Author Manuscript

Fig. 4.Impact of polymorphisms in LASS1 on gene expression. A luciferase reporter assay wasused for determining the promoter activity in transfected HeLa cells. Error bars denote SEMfor six independent experiments with at least six replicates for each of the four promoterconstructs shown. The LASS1 promoter variants CCT and CGT associated with exceptionallongevity were compared to an AGC variant. The control is a reporter lacking insertedpromoter sequences.
Jazwinski et al. Page 17
Aging Cell. Author manuscript; available in PMC 2011 October 1.
NIH
-PA Author Manuscript
NIH
-PA Author Manuscript
NIH
-PA Author Manuscript

Fig. 5.Hypothetical model of the role of APOE, HRAS1, and LASS1 interactions. Circulating lipidsare cleared by APOE and by HDL, which is aided by LASS1-generated ceramide. Metabolic(lipid) stress induces protective survival and stress responses, which are mediated/modulatedby HRAS1 and LASS1. Lipotoxicity enhances LASS1 production of ceramide, whichsignals apoptosis removing damaged cells. These mechanisms become overwhelmed withage resulting in dysfunction and morbidity.
Jazwinski et al. Page 18
Aging Cell. Author manuscript; available in PMC 2011 October 1.
NIH
-PA Author Manuscript
NIH
-PA Author Manuscript
NIH
-PA Author Manuscript
NIH
-PA Author Manuscript
NIH
-PA Author Manuscript
NIH
-PA Author Manuscript
Jazwinski et al. Page 19
Table 1
Association of haplotypes with exceptional longevity and healthy aging
Population Haplotype Case (N; frequency)Control (N; frequency)
OR(CI)
Exact P(adjusted P)
Georgia APOE·HRAS1·LASS1 (CCT)
≥98 yr-old (147; 0.073)20-59 yr-old (188; 0.010)
7.68(2.55-23.10)
4.1×10⁻⁵
(2.88×10⁻⁴)
Georgia APOE·HRAS1·LASS1 (CGT)
≥98 yr-old (147; 0.191)20-59 yr-old (188; 0.084)
2.56(1.61-4.08)
7.8×10⁻⁵
(4.66×10⁻⁴)
Louisiana APOE·HRAS1·LASS1 (CCT)
≥90 yr-old (204; 0.105)20-59 yr-old (251; 0.039)
2.93(1.68-5.09)
9.5×10⁻⁵
(5.68×10⁻⁴)
Louisiana APOE·HRAS1·LASS1 (CGT)
≥90 yr-old (204; 0.175)20-59 yr-old (251; 0.067)
2.97(1.92-4.58)
6.91×10⁻⁷
(5×10⁻⁶)
Georgia APOE·HRAS1·LASS1 (CCT)
≥98 yr-old female (128; 0.099)20-59 yr-old female (115; 0.009)
12.52(2.93-53.57)
1×10⁻⁵
(2×10⁻⁵)
Georgia APOE·HRAS1·LASS1 (CGT)
≥98 yr-old male (19; 0.251)20-59 yr-old male (73; 0.026)
12.40(3.55-43.29)
9×10⁻⁶
(9×10⁻⁶)
Louisiana APOE·HRAS1·LASS1 (CCT)
≥90 yr-old female (125; 0.092)20-59 yr-old female (163; 0.032)
3.12(1.47-6.63)
1.97×10⁻³
(3.93×10⁻³)
Louisiana APOE·HRAS1·LASS1 (CGT)
≥90 yr-old male (79; 0.279)20-59 yr-old male (88; 0.074)
4.86(2.50-9.45)
1×10⁻⁶
(2×10⁻⁶)
Louisiana APOE·HRAS1·LASS1 (CCT)
≥90 yr-old healthy (68; 0.023)≥90 yr-old unhealthy (68; 0.076)
0.29(0.08-1.04)
*5.11×10−2
(5.11×10⁻²)
Louisiana APOE·HRAS1·LASS1 (CGT)
≥90 yr-old healthy (68; 0.295)≥90 yr-old unhealthy (68; 0.026)
15.48(5.08-47.15)
1.06×10⁻⁹
(2.11×10⁻⁹)
European subpopulations (0.9 assignment probability) were examined. The haplotypes are ATTTC and CGCGCGT for APOE and HRAS1,respectively. Healthy and unhealthy were classified as described in Experimental procedures. OR, odds ratio; CI, 95% confidence interval.
*Not significant.
Aging Cell. Author manuscript; available in PMC 2011 October 1.

NIH
-PA Author Manuscript
NIH
-PA Author Manuscript
NIH
-PA Author Manuscript
Jazwinski et al. Page 20
Table 2
Haplotype frequencies in the general population
European
Haplotype APOE HRAS1 LASS1 (CCT) LASS1 (CGT)
Georgia (N=220) 0.237 0.634 0.289 0.504
Louisiana (N=293) 0.237 0.664 0.253 0.561
African
Haplotype APOE HRAS1 LASS1 (CCT) LASS1 (CGT)
Georgia (N=145) 0.041 0.633 0.200 0.333
Louisiana (N=52) 0.08 0.60 0.15 0.28
A Structure assignment probability of 0.8 was used for this analysis in order to provide a conservative evaluation of any differences. The 20-59year-old age groups were used here, as representative of the general population. APOE (ATTTC) and HRAS1 (CGCGCGT) haplotypes are shown.
Aging Cell. Author manuscript; available in PMC 2011 October 1.