Discover the 1 twin flame secret to attract your dream lover

Challenging beliefsHow to Attract candidates, understand application motivation, and measure
recruitment success?Soumik Ganguly, Vice President, PaGaLGuY.com

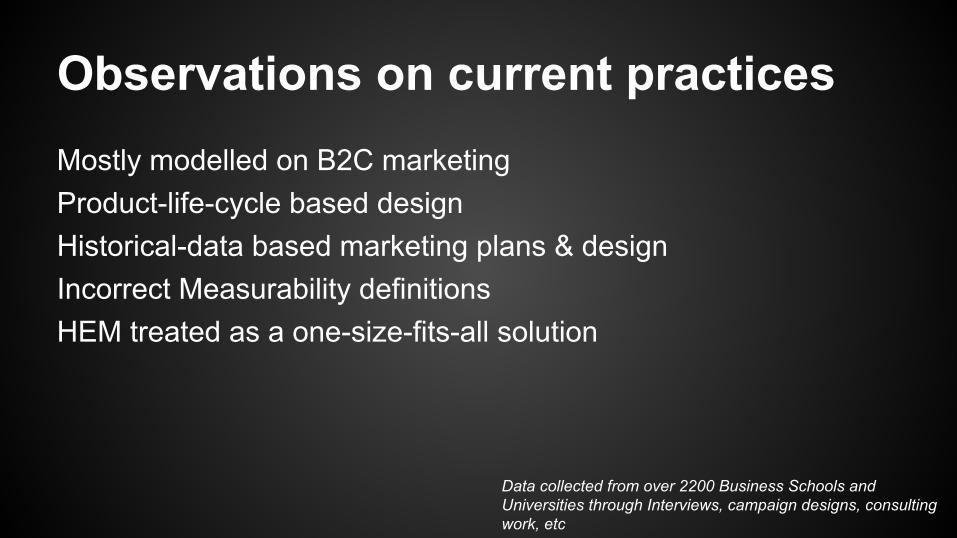
Observations on current practicesMostly modelled on B2C marketingProduct-life-cycle based designHistorical-data based marketing plans & designIncorrect Measurability definitionsHEM treated as a one-size-fits-all solution
Data collected from over 2200 Business Schools and Universities through Interviews, campaign designs, consulting work, etc
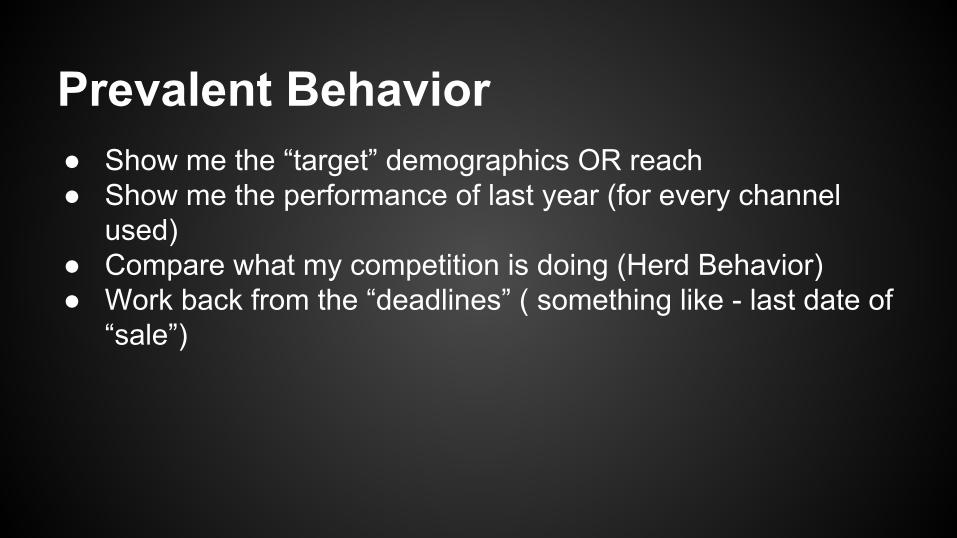
Prevalent Behavior● Show me the “target” demographics OR reach● Show me the performance of last year (for every channel
used)● Compare what my competition is doing (Herd Behavior)● Work back from the “deadlines” ( something like - last date of
“sale”)
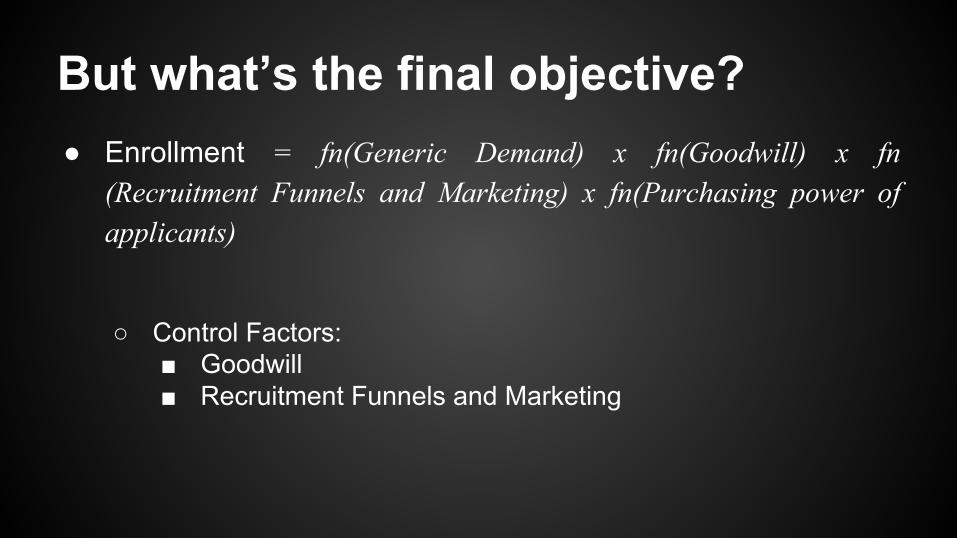
But what’s the final objective?● Enrollment = fn(Generic Demand) x fn(Goodwill) x fn
(Recruitment Funnels and Marketing) x fn(Purchasing power of applicants)
○ Control Factors: ■ Goodwill■ Recruitment Funnels and Marketing
A new Design for Aspirants Acquisition
Need to redefine and restart

Critical ComponentsDeducing a formula for Aspirant-acquisition
Understanding integration of key channels and its functionality
Building new frameworks
Algos, econometrics, and reasoning
Bring in some Math

The Aspirant Acquisition FormulaE = i x D
If we consider Engagement for all institutions "g", at time "t", the given equation can take a form of:
Egt = igt x Dt (1)User acquisition can be defined as the product of a positive “engagement” and the “action” taken due to that engagement in a given channel. Therefore:
User Acquisition, Ua = Egt x At ; Substituting the value of “E” from equation (1)
= igt x Dt x At (2)
Action - At = Qgt x Ppt (3)
How do we define “Demand”?
The “demand” for any program is a function of the program’s goodwill (that consists of ROI and other intrinsic factors), the program’s price, and the amount of communication or Advertisements available for the program over a given time “t”.
Therefore
Demand - Qgt = Qg (Wt, Pt, Adt) (4)
Substituting all Values,
Ua = igt x Dt x Qg(Wt, Pt, Adt) x Ppt
Ua = igt x Dt x Qg(Wt, Pt, Adt) x Ppt

Integration of Key ChannelsResult = fn(Action, Engagement) We can predict the probability of engagement of a particular platform at a certain time for a result "R".Mathematically, this would mean finding - P(PG) = Probability of student engaging with Pagalguy.comP(C) = Probability of student engaging over a callR = Result from the overall marketing system probability of engagement on Pagalguy, when there is a Result from the marketing system.This can be denoted as - P(PG | R)P(PG | R) = [P(PG) * P(R | PG)] / [ [P(PG) * P(R | PG)] X [P(C) * P(R | C)] ]
P(R | PG) = Time x Activity x (1/Total number of options at a given time) = 4 x 5 x (1/50)[Considering 4 hours total time, 5 pages viewed each time, and 50 B-schools as option during his visits] = 0.2P(R | C) = 0.1 x 10 x (1/100)[Considering 0.1 hours call time, 10 calls, and 100 b-schools calling] = 0.01Now, The P(PG | R) = [0.4 x 0.2] / [ [0.4 x 0.2] + [0.2 x 0.01] ] = 0.08/0.082 = 0.97
Result = fn(Action, Engagement) Marketing team in this case is using 6 different channels, and given that there are two factors, the number of engagement-action sets will be 6P2 (permutation), giving us about 30 such sets that will contribute to the overall results.

Key Data input
Recruitment Demand GenerationIt is the %age or number of users with the right “intent” and “demographic” fitment available for a specific program in a given medium/channel at a given time
RDG is measurable, can produce trends, and needs to be correlated to Application Numbers for each year

A Case for RDG● Application numbers of Top 50 Business Schools/Programs
in India for past 5 years● Calculated the “Recruitment Demand Generation” for past 5
years● Correlation Score of “0.4”● High correlation, since multiple factors involved towards
contributing to an Application

The Framework4 Phases in the HEM process: Follow for every channel used in the design, and in the integration
Discovery Networking Conversation Conversion
Content MapsContent Integration strategiesDifferent formats of presenting Info/content
Building a micro community of aspirants, current candidates, and alumni. Repeat every year.
Extensions of internal counselling systems
Access systems
Presence across high RDG and “Action” probability channels
Research Prep Application Conversion
You
Aspirant

Maximizing Enrollments via HEM
Ground Rules:● Change base definitions of HEM design● Upgrade from “Product-life-cycle” design to “Aspirant-life-cycle”
design● Account for “intent” and “demographics” Ad plans● Calculate and correlate demand for your program across all
channels/geographies to application trends in past years● Design Integrated systems supported by data and analytics● Practice zero-based marketing design each year
Copyright © 2022 FDOKUMEN