How stressful are 105days of isolation? Sleep EEG patterns and tonic cortisol in healthy volunteers...
9
How stressful are 105 days of isolation? Sleep EEG patterns and tonic cortisol in healthy volunteers simulating manned ight to Mars Angelo Gemignani a,b,c, , Andrea Piarulli d,b , Danilo Menicucci b,c , Marco Laurino a,b , Giuseppina Rota e , Francesca Mastorci b,c , Vadim Gushin f , Olga Shevchenko f , Erika Garbella b , Alessandro Pingitore b,c , Laura Sebastiani g , Massimo Bergamasco d , Antonio L'Abbate b,c , Paolo Allegrini b,c , Remo Bedini b,c a Department of Surgery, Medical, Molecular and Critical Area Pathology, University of Pisa, via Paradisa 2, 56124 Pisa, Italy b EXTREME Centre, Scuola Superiore Sant'Anna, Piazza Martiri della Libertà 33, 56127 Pisa, Italy c Institute of Clinical Physiology, National Research Council (CNR), via Moruzzi 1, 56124 Pisa, Italy d Perceptual Robotics Laboratory, Scuola Superiore Sant'Anna, Pisa, via Alamanni 13b, 56010 Pisa, Italy e Laboratory of Clinical Biochemistry and Molecular Biology, Department of Experimental Pathology, Medical Biotechnologies, Infectivology and Epidemiology, University of Pisa, via Roma 67, 56126, Pisa, Italy f Institute of Biomedical Problems of Moscow, Moscow, Russia g Department of Translational Research on New Technologies in Medicine and Surgery, University of Pisa, Italy abstract article info Article history: Received 30 November 2013 Received in revised form 5 April 2014 Accepted 24 April 2014 Available online 2 May 2014 Keywords: Sleep Cortisol Social/environmental connement Stress High-density EEG NREM sleep MARS 500 Spaceights “environment” negatively affects sleep and its functions. Among the different causes promoting sleep alterations, such as circadian rhythms disruption and microgravity, stress is of great interest also for earth-based sleep medicine. This study aims to evaluate the relationships between stress related to social/environmental connement and sleep in six healthy volunteers involved in the simulation of human ight to Mars (MARS500). Volunteers were sealed in a spaceship simulator for 105 days and studied at 5 specic time-points of the simu- lation period. Sleep EEG, urinary cortisol (24 h preceding sleep EEG recording) and subjectively perceived stress levels were collected. Cognitive abilities and emotional state were evaluated before and after the simulation. Sleep EEG parameters in the time (latency, duration) and frequency (power and hemispheric lateralization) domains were evaluated. Neither cognitive and emotional functions alterations nor abnormal stress levels were found. Higher cortisol levels were associated to: i) decrease of sleep duration, increase of arousals, and shortening of REM latency; ii) reduction of delta power and enhancement of sigma and beta in NREM N3; and iii) left lateralization of delta activity (NREM and REM) and right lateralization of beta activity (NREM). Stressful conditions, even with cortisol uctuations in the normal range, alter sleep structure and sleep EEG spec- tral content, mirroring pathological conditions such as primary insomnia or insomnia associated to depression. Correlations between cortisol uctuations and sleep changes suggest a covert risk for developing allostatic load, and thus the need to develop ad-hoc countermeasures for preventing sleep alterations in long lasting manned space missions. © 2014 Elsevier B.V. All rights reserved. 1. Introduction Poor sleep quality has been frequently described as a common response to stress or distress (Van Reeth et al., 2000). The exposure to chronic stress often determines alterations of sleep, affecting both NREM and REM phases. NREM changes consistently observed in human studies are the increase of shallow sleep and the reduction of Slow Wave Sleep (SWS or NREM stage N3). REM changes are the increase of its duration and the shortening of the latency of the rst REM period, and a general increase of REM density (Van Reeth et al., 2000). Studies both on animal models of chronic stress (Cheeta et al., 1997; Opp, 1995) and on humans (Opp, 1995) suggest that these alterations are likely me- diated via corticotropin-releasing hormone (CRH) release, which in turn stimulates endogenous adreno-cortico-tropic hormone (ACTH) and corti- sol secretion (i.e. hypothalamic pituitary adrenal axis – HPA – activation). HPA hyperactivation related to chronic stress is paralleled by a right hemi- sphere hyperarousal during wake (Hewig et al., 2008). Astronauts involved in real or simulated long-term missions represent a model for the study of chronic stressful engagement with “real or simulated extreme environment” (Monk et al., 1998). Reduction of SWS and REM sleep, shortening of REM latency and increase of arousals are International Journal of Psychophysiology 93 (2014) 211–219 Corresponding author at: Department of Surgery, Medical, Molecular and Critical Area Pathology, University of Pisa, via Paradisa 2, 56124 Pisa, Italy. Tel.: +39 050 315 2686; fax: +39 050 580018. E-mail address: [email protected] (A. Gemignani). http://dx.doi.org/10.1016/j.ijpsycho.2014.04.008 0167-8760/© 2014 Elsevier B.V. All rights reserved. Contents lists available at ScienceDirect International Journal of Psychophysiology journal homepage: www.elsevier.com/locate/ijpsycho
-
Upload
independent -
Category
Documents
-
view
0 -
download
0
Transcript of How stressful are 105days of isolation? Sleep EEG patterns and tonic cortisol in healthy volunteers...
How stressful are 105 days of isolation? Sleep EEG patterns and toniccortisol in healthy volunteers simulating manned !ight to Mars
Angelo Gemignani a,b,c,!, Andrea Piarulli d,b, Danilo Menicucci b,c, Marco Laurino a,b, Giuseppina Rota e,Francesca Mastorci b,c, Vadim Gushin f, Olga Shevchenko f, Erika Garbella b, Alessandro Pingitore b,c,Laura Sebastiani g, Massimo Bergamasco d, Antonio L'Abbate b,c, Paolo Allegrini b,c, Remo Bedini b,ca Department of Surgery, Medical, Molecular and Critical Area Pathology, University of Pisa, via Paradisa 2, 56124 Pisa, Italyb EXTREME Centre, Scuola Superiore Sant'Anna, Piazza Martiri della Libertà 33, 56127 Pisa, Italyc Institute of Clinical Physiology, National Research Council (CNR), via Moruzzi 1, 56124 Pisa, Italyd Perceptual Robotics Laboratory, Scuola Superiore Sant'Anna, Pisa, via Alamanni 13b, 56010 Pisa, Italye Laboratory of Clinical Biochemistry and Molecular Biology, Department of Experimental Pathology, Medical Biotechnologies, Infectivology and Epidemiology, University of Pisa, via Roma 67,56126, Pisa, Italyf Institute of Biomedical Problems of Moscow, Moscow, Russiag Department of Translational Research on New Technologies in Medicine and Surgery, University of Pisa, Italy
a b s t r a c ta r t i c l e i n f o
Article history:Received 30 November 2013Received in revised form 5 April 2014Accepted 24 April 2014Available online 2 May 2014
Keywords:SleepCortisolSocial/environmental con"nementStressHigh-density EEGNREM sleepMARS 500
Space!ights “environment” negatively affects sleep and its functions. Among the different causes promoting sleepalterations, such as circadian rhythms disruption and microgravity, stress is of great interest also for earth-basedsleep medicine. This study aims to evaluate the relationships between stress related to social/environmentalcon"nement and sleep in six healthy volunteers involved in the simulation of human !ight to Mars (MARS500).Volunteers were sealed in a spaceship simulator for 105 days and studied at 5 speci"c time-points of the simu-lation period. Sleep EEG, urinary cortisol (24 h preceding sleep EEG recording) and subjectively perceived stresslevels were collected. Cognitive abilities and emotional state were evaluated before and after the simulation.Sleep EEG parameters in the time (latency, duration) and frequency (power and hemispheric lateralization)domains were evaluated.Neither cognitive and emotional functions alterations nor abnormal stress levels were found. Higher cortisollevels were associated to: i) decrease of sleep duration, increase of arousals, and shortening of REM latency;ii) reduction of delta power and enhancement of sigma and beta in NREM N3; and iii) left lateralization ofdelta activity (NREM and REM) and right lateralization of beta activity (NREM).Stressful conditions, evenwith cortisol !uctuations in the normal range, alter sleep structure and sleep EEG spec-tral content, mirroring pathological conditions such as primary insomnia or insomnia associated to depression.Correlations between cortisol !uctuations and sleep changes suggest a covert risk for developing allostaticload, and thus the need to develop ad-hoc countermeasures for preventing sleep alterations in long lastingmanned space missions.
© 2014 Elsevier B.V. All rights reserved.
1. Introduction
Poor sleep quality has been frequently described as a commonresponse to stress or distress (Van Reeth et al., 2000). The exposure tochronic stress often determines alterations of sleep, affecting bothNREM and REM phases. NREM changes consistently observed in humanstudies are the increase of shallow sleep and the reduction of SlowWave Sleep (SWS or NREM stage N3). REM changes are the increase of
its duration and the shortening of the latency of the "rst REM period,and a general increase of REM density (Van Reeth et al., 2000). Studiesboth on animal models of chronic stress (Cheeta et al., 1997; Opp, 1995)and on humans (Opp, 1995) suggest that these alterations are likely me-diated via corticotropin-releasing hormone (CRH) release, which in turnstimulates endogenous adreno-cortico-tropic hormone (ACTH) and corti-sol secretion (i.e. hypothalamic pituitary adrenal axis –HPA – activation).HPAhyperactivation related to chronic stress is paralleledby a right hemi-sphere hyperarousal during wake (Hewig et al., 2008).
Astronauts involved in real or simulated long-termmissions representa model for the study of chronic stressful engagement with “real orsimulated extreme environment” (Monk et al., 1998). Reduction of SWSand REM sleep, shortening of REM latency and increase of arousals are
International Journal of Psychophysiology 93 (2014) 211–219
! Corresponding author at: Department of Surgery, Medical, Molecular andCritical Area Pathology, University of Pisa, via Paradisa 2, 56124 Pisa, Italy.Tel.: +39 050 315 2686; fax: +39 050 580018.
E-mail address: [email protected] (A. Gemignani).
http://dx.doi.org/10.1016/j.ijpsycho.2014.04.0080167-8760/© 2014 Elsevier B.V. All rights reserved.
Contents lists available at ScienceDirect
International Journal of Psychophysiology
j ourna l homepage: www.e lsev ie r .com/ locate / i jpsycho

typically observed in short-term space missions, due to circadian rhythmphase shifts, heightened workload demand, emergencies, and more ingeneral, extraordinary stressful environmental conditions (Dijk et al.,2001; Mallis and DeRoshia, 2005). In this light, a crucial problem forlong lastingmannedmissions in space is represented by sleep alterations.Sleep EEG data from long-term space missions are scarce and ground-based simulation of long lasting missions is at present the experimentalcondition of choice for the study of such alterations. Recently, a study in-vestigating the relationships between sleep and long lasting space!ightsimulation has been published (Basner et al., 2013). This study, basedon actigraphy and neurobehavioral assessment, identi"ed that the simu-lation of long lasting space mission induces alterations of sleep qualityand of sleep-wake periodicity and timing, which are mainly sustainedby an inadequate circadian entrainment.
Here we report a study in which the model of stress is representedby the simulation of the human !ight to Mars (MARS105, pilot phaseof the MARS500 project). Six healthy volunteers were kept for 105days within an isolation facility mimicking a spacecraft and were stud-ied during the !ight simulation as well as right before and after the pe-riod of con"nement. In this condition, stress was represented by socialand environmental con"nement, enforced interaction betweencrewmembers, resources rationing, limited and lagged communicationswith the outside and environmental acoustic noise.
The working hypothesis of the study addresses the issue of stress vul-nerability to spatial con"nement and social isolation in a super-selectedand well-trained population. This pilot study is the "rst internationalattempt aimed at identifying indices of abnormal stress responses inhealthy volunteers in order to design and develop ad hoc countermea-sures to be administered in the study of 520 days of isolation (MARS500), which represents the real simulation of human !ight to Mars. Theaim of the study was to examine how stress, measured by tonic cortisollevels and subjectively perceived stress levels, affects sleep in terms ofstructure and EEG power/lateralization and whether it produces longlasting effects on cognitive abilities and emotional state that persist be-yond the con"nement duration.
As in many simulation studies with such complex experimentalsetups (Basner et al., 2013; Schneider et al., 2010), the choice of an appro-priate statistical analysis has been conditioned by two important issuesconcerning the high number of parameters necessary for sleep character-ization and the involvement of a small number of participants and sam-pling times. In order to override these intrinsic limitations, a hierarchicalapproach aimed at pruning the numerous variables that characterizesleep patterns was employed in the data analysis. Principal ComponentAnalysis (PCA) and con"rmatory ANCOVAs performed on the selectedvariables allowed the identi"cation of signi"cant associations betweenspeci"c sleep features and cortisol levels, considered by consensus a reli-able indicator of stress.
2. Materials and methods
2.1. Subjects selection and experimental setup
Six healthy right-handed male volunteers (mean age 33 ± 6 years)have been selected for a 105-days (fromMarch 31st to July 14th, 2009)mission to Mars simulation organized by the Institute for BiomedicalProblems (IBMP, Moscow, Russia) and the European Space Agency(ESA). Crewmembers selection procedures, based on a thorough psy-chophysical evaluation of the candidates, were the same of those usedfor real astronauts (for further details on the selection procedure seeSupplementary material). The protocol of the study was approved bythe Ethics Committee of the IBMP and by the ESA Medical Board, andwas compliant with all guidelines stated in the Declaration of Helsinki.All participants gave informed consent to participate in the study.
Crewmembers were sealed in an isolation facility that simulated aspacecraft !ight for a 105-day period (the real round trip to Mars willlast approximately 500 days). The isolation facility was arti"cially
lighted (16 h on, 8 h off), ambient temperature was maintainedconstant at 24 °C, and an environmental noise in line with that of theInternational Space Station (60–70 dB) was constantly present (seeSupplementary material for further details). Once sealed into thefacility, the crewmembers had only personal contact with eachother and a time-limited voice contact with a simulated control cen-ter was the only connection with the outside. Inside the isolation fa-cility, daily tasks were organized in order to match those typical ofhuman space!ight missions. The crew had a working schedule sim-ilar to the one of space crews: 8 h of work, 8 h of free time and 8 h ofsleep. They had to perform scienti"c experiments dealing with thepsychological and physiological effects of con"nement. They alsohad to monitor life support systems and keep the standards ofchambers hygiene. Mars Mission impact was introduced via re-sources rationing, characterized by no re-supply from outside andcommunication limitations with the outside world (communicationwas conducted with a realistic time delay of up to 25 min, to simu-late the communications lag between Mars and Earth). Thecrewmembers were under 24-hours of outside supervision, andthe group of supervisors on duty consisted of a medical doctor, amedical assistant, an engineer and his assistant.
The design of our experiment included 5 time-points:
- BDC: Basal Data Collection, performed pre-simulation (27th to 29thof March).
- T1, T2, T3: three equally spaced time points during the 105days sim-ulation (T1, 22nd to 24th of April, T2, 27th to 29th of May, and T3,30th of June to 2nd of July).
- RDC: Recovery Data Collection performed post-simulation (19th to21st of July).
Sleep and stress levels were evaluated at each time-point, while theneuropsychological evaluation was performed only during BDC andRDC.
As no person was allowed to enter the simulation module from theoutside for the 105 days of con"nement, crewmembers had to carry theexperiments by themselves as normally happens during space !ights.To this aim, the crew underwent a training phase before the beginningof the simulation, in order to learn the correct procedures of the experi-ment setup and as a support, each subject was provided with a log-book containing a step-by-step description of all the experimental proce-dures. In order to keep the experimental procedure unchanged at alltime-points, sleep EEG recordings were conducted by crewmembersalso during BDC and RDC phases.
2.2. Cognitive and emotional neuro-psychological evaluation (BDC, RDC)
A clinical psychologist evaluated working memory, attentionand mood state immediately before (BDC) and immediately after(RDC) the 105 days of isolation. The choice of this cognitive andemotional evaluation was based on previous literature showingan effect of con"nement on these speci"c functions (Hockey andSauer, 1996; Dèchamps and Rosnet, 2005). Cognitive functionswere evaluated by means of three subsets of the Wechsler MemoryScale (Wechsler, 1997): Digit Span for numeric working-memoryfunction, Picture Arrangement for logic temporal reasoning andDigit Symbol Coding for attention. Visuospatial working memorywas evaluated with the Corsi block test (Vandierendonck et al.,2004), whereas spatial reasoning was tested through the KohsCubes test (Kohs, 1923). Finally, the Pro"le of Mood States(POMS) (McNair et al., 1992) was administered to evaluate six fac-tors: tension–anxiety, depression–dejection, anger–hostility, fa-tigue–inertia, vigor-activity and confusion–bewilderment. Thewhole evaluation lasted approximately one hour and a half andtook place in the medical division of the isolation facility.
212 A. Gemignani et al. / International Journal of Psychophysiology 93 (2014) 211–219
2.3. Stress levels evaluation (BDC, T1, T2, T3, RDC)
Urinary cortisol samples were collected at each time-point (BDC, T1,T2, T3, RDC) in the 24 h immediately preceding the sleep EEG recording(from 8 pm of the day before to 8 pm of the day of the sleep recording).Since urine produced in the 24 hwas collected in a single !ask, only theall-day cortisol concentration was available. Tonic cortisol levels weremeasured using urinary free cortisol test-kit DKO018, Lot 1730 fromDIAMETRA, Milan, Italy. The Perceived Stress Scale (PSS) questionnaire(Cohen et al., 1983)was auto-administered during daytime at each timepoint.
2.4. Sleep EEG recordings and processing (BDC, T1, T2, T3, RDC)
At each time point, volunteers went to sleep at their scheduled bed-time and whole night high-density (128 channels, Electrical Geodesics,Eugene, OR) sleep EEG recording was performed. The use of a high-density EEG (128 channels) allowed overcoming the low skill of volun-teers in the EEG montage. Indeed, the lack of any experimental controlon this phase of EEG recording (the montage) induced us to choose ahigh-density EEG system that allowed a redundancy of electrodeswith the aim of obtaining a signi"cant number of electrodes with agood signal quality. The high-density system comprised also electrodesfor eye movement and zygomatic muscle tone recordings.
Signals referenced to Cz were acquired with a sampling rate of250 Hz and with electrode impedances kept below 50 k!. Of!ine signalprocessing and statistical analyses were implemented using Matlab(MathWorks, Natick, MA, USA). EEG raw data were notch-"ltered to re-move power-line frequency and re-referenced to the average potentialof the mastoids.
Movement artifacts were detected according to Menicucci et al.,2009, and Piarulli et al., 2010. After a con"rmatory visual inspection,most of them (95%) were discarded. Sleep stages were visually scoredin line with American Academy of Sleep Medicine criteria (Iber et al.,2007). EEG analysis was limited to the "rst two sleep cycles, due tothe decline of signal quality (progressive drying of the EEG electrodesfrom the third cycle on), which was apparent in most of the recordings.Each sleep EEG recording was characterized with time-domain and fre-quency domain parameters. For the time domain we estimated the fol-lowing features: from the "rst sleep cycle, the N3 and REM Latency;averaging over the cycles 1 and 2, the time duration of sleep phases(N2 time, N3 time, REM time and Wakefulness after Sleep Onset time— WASO time), the total sleep time (the sum of N2, N3 and REMtimes) and the frequency of stage shifts and arousals. Stage Shift wasde-"ned as a change of sleep stage in line with Borbély et al., 1985; arousalwas de"ned as an abrupt shift of EEG frequency including alpha and/orhigher frequencies (with the exception of spindles) that lasts at least 3 s,with at least 10 s of stable sleep preceding the change (Borbély et al.,1985).
For the frequency-domain parameters, in each sleep stage we esti-mated single channels EEG power spectra related to six EEG frequencybands (Fast Fourier Transform calculated and averaged on consecutive20 s epochs): delta (0.5–4 Hz, Slow Wave Activity, SWA), theta (4–8 Hz), alpha (8–12 Hz), sigma (12–15 Hz), beta (15–25 Hz) andgamma (25–90 Hz). For each band, we estimated two parameters: (i)Band Median Power (BMP) obtained as the median power value overscalp electrodes; (ii) Band Hemispheric Lateralization (BHL), de"nedas the difference between right and left hemispheres median powerspectra, excluding thus mid-line electrodes from the computation (48electrodes for each hemisphere were retained). Power band measureswere expressed in dB.
2.5. Statistical procedures
In order to overcome the issue of low sample size-to-variable ratiowe applied a hierarchical approach that pruned the sleep-related
parameters and thenwe calculated the association between the remain-ing ones and the two stress measures (cortisol and PSS levels). This as-sociation was tested after correction of the factors (subject and time ofsampling) putatively in!uencing the measures (step illustrated in theupper panel of Fig. 1). Repeated measures ANOVA and one-wayANOVA were used in order to check for, respectively, time and subjecteffects on each parameter. The correction was applied only in case ofsigni"cant factor effect. As no variable showed any signi"cant time ef-fect, no correction was applied. In contrast, limited to frequency-domain parameters, the subject effect was signi"cant and thusremoved.
After these corrections, the analyses of possible relations betweenstress and sleep parameters were conducted considering each experi-mental point statistically independent from the others.
Besides the study of the stress versus sleep feature associations, wealso compared the neuropsychological scores collected before andafter the !ight simulation by using the non-parametric pairedWilcoxonSigned Rank Test.
2.5.1. Pruning and identi!cation of stress-sleep associationsSleep variables were divided into 7 datasets: one in the time-
domain, six in the frequency domain, that is BMP and BHL estimatedin N2, N3 and REM stages for each frequency band. The pruning proce-dure was applied separately on each dataset. Moreover, the two stressmeasures were added to each dataset in order to retain only sleep var-iables sharing information with them.
The variable pruning procedurewas based on the PCA.Many rules ofthumb about either the minimum sample size S or the sample size-to-variable ratio (S:v) have been proposed for PCA to produce stable solu-tions (Kline, 1979; Cattell, 1978). In order to obtain reliable results evenfrom sample sizes less than 50 a general consent about a S:v ! 5 hasbeen reached (Barrett and Kline, 1981; Gorsuch, 1983). As all thedatasets had S:v below the minimum of 5 (range 2.5 to 3.75), we hadto reduce to six the number of variables submitted to each PCA.
The criterion used for dropping sleep variables from each datasetwas the Measure of Sampling Adequacy (MSA, Kaiser, 1970) of eachvariable; MSA indicates whether the variable shares an adequate levelof variancewith the other ones of the same dataset, including the stressmeasures (Hair et al., 2010).
The PCA pruning procedure (Fig. 1, middle panel) works as follows:
- PCA is performed on the entire dataset.- MSA is calculated for each variable.- Variables with MSA b 0.5 are excluded from the dataset (Kaiser,1970).
- If the number of retained variables still exceeds six, the "rst twosteps are repeated.
If the pruning yielded lowMSA for both PSS and cortisol, the analysiswas stopped since no reliable correlation between stress parametersand other parameters was found; if, on the contrary, at least oneamong cortisol and PSS was retained, the "nal PCA was performed.
The results of the "nal PCA were considered reliable if the followingthree conditions (Hair et al., 2010) were met (see Fig. 1, middle panel):
a) The pruned dataset satis"ed Bartlett's test of sphericity.b) The MSA of each retained variable was higher than 0.5.c) The overall Kaiser–Meyer–Olkinmeasure of sampling adequacywas
higher than 0.5 (Kaiser, 1970).
For each PCA satisfying the three conditions, the number of retainedprincipal components was estimated applying Horn's Parallel Analysis(Hayton et al., 2004). For each retained component, the loadings wereextracted. Component loadings are the correlation coef"cients betweeneach variable and the component. When two or more variables havesigni"cant loadings on the same component, this provides indicationof the existence of a common underlying process contributing to thevariables behavior.
213A. Gemignani et al. / International Journal of Psychophysiology 93 (2014) 211–219

2.5.2. Con!rmatory analysis of stress-sleep associationsAll variables stood Shapiro–Wilk test for normality (Shapiro and
Wilk, 1965), thus con"rmatory statistical analyses were performedusing parametric statistics (step illustrated in the lower panel ofFig. 1). As a con"rmatory step, planned ANCOVAs with cortisoltreated as a dichotomous variable C and time (treated as an ordinalvariable) as covariate were conducted on those sleep parametersthat on the basis of PCA were signi"cantly related both to cortisoland PSS. In order to obtain two equally populated groups (low Cand high C), threshold for cortisol dichotomization was set at themedian value of the distribution. Cortisol and not PSS was chosenfor con"rmatory analyses of variance, as the former is a more objec-tive measure of stress level and of HPA axis activation. Also, a
substantial agreement of objective (cortisol) and subjectivelyperceived (PSS) stress levels was demonstrated both by the highpositive correlation between them (r = 0.59, p b 0.001) and byANCOVA performed on PSS with C as a between factor and time ascovariate (F1,27 = 8.4, p b 0.01).
Relations between cortisol and sleep parameters were consid-ered signi"cant only if they were veri"ed both in PCA andANCOVA models. The rationale of this approach relies on the useof exploratory PCA as a hypothesis generator (i.e. PCA "ndingswere tested by planned ANCOVA with C as a between factor). Nocorrection for multiple comparison was applied on ANCOVAs aseach test was conducted to con"rm or reject "ndings derivedfrom PCA.
Fig. 1. Flowchart of data analysis steps. Upper panel describes the variable preparation (checking of Time and subject effects on each variable). Note that the repeated measures ANOVAwith time effect checkbox has no “Y” output as no variable showed signi"cant effects. Middle panel describes both the pruning (described in more detail in the Materials and methodssection, Pruning and identi"cation of stress-sleep associations procedure, subsection) and the "nal PCA procedures applied to each dataset. Lower panel describes the con"rmatoryANCOVAwith C as a between factor and time as covariate applied to variables selected by PCA. A Red dot indicates, for each of the three panels, the starting block of the !owchart.
214 A. Gemignani et al. / International Journal of Psychophysiology 93 (2014) 211–219

3. Results
3.1. Cognitive and emotional neuro-psychological evaluation
The comparison of psychometric scores did not reveal signi"cantdifferences between BDC and RDC phases either for cognitive abilitiesor for emotional state (see Table 1).
3.2. Stress and sleep time-domain parameters
Table 2 summarizes descriptive statistics of stress and sleep time-domain parameters related to each subject. Note that crewmembersshowed on average: (i) perceived stress scale (PSS) scores lower thannormative levels (Cohen and Williamson, 1988); (ii) cortisol levelswithin the normality range (Görges et al., 1999), and (iii) a higheramount of REM sleep in the "rst two sleep cycles associated to a short-ening of REM latency of the "rst REM period.
The PCA pruning procedure yielded six retained variables: PSS, cor-tisol, sleep time, arousal frequency, N3 time and REM latency.
PCA applied to stress and pruned sleep time-domain parameters re-sulted in one retained PCA component. Component loadings aredepicted in Fig. 2, panel A. Cortisol and PSS were associated since theyhad signi"cant loadings on the same principal component, thus wecould consider them as a unitary marker of stress (the same holdstrue for all the other frequency domain datasets).
As shown in Fig. 2, higher stress (cortisol and PSS) levels yield: higherarousal frequency, reductionof sleep time, and shorteningof REM latency.Con"rmatory one-way ANCOVAs with 2-levels C and time as covariatewere performed on the retained variables after pruning, and results arepresented in Fig. 3. Coherently with PCA "ndings, signi"cant negative re-lations with C were found for REM latency (F(1,27) = 4.2, p b 0.05) andsleep time (F(1,27)=5.4, p b 0.05)while a positive relationwith arousalfrequency (F(1,27) = 4.3, p b 0.05). The time effect was not signi"cant,thus con"rming the results of the repeated measures ANOVA performedin order to correct the variables for the time factor putatively in!uencingthe measures. Time effect was not signi"cant also for the frequency do-main sleep features.
3.3. Stress and N2 spectral parameters
Regarding BMP datasets, PSS and cortisol hadMSA below 0.5, and assuch were not suitable for deriving reliable factors associating stress toN2 B.P. Accordingly, no con"rmatory ANCOVAs were conducted onBMP dataset (Fig. 4).
Regarding BHL dataset, the pruning procedure yielded four retainedfrequency bands: delta, theta, alpha, and beta. The PCA yielded onecomponent showing signi"cant direct correlations with cortisol andbeta, indicating that the higher was the cortisol level the greater wasthe right lateralization for beta (increasing BHL). The same componentshowed inverse correlations with delta, theta and alpha (Fig. 2C, left
diagram) indicating that the higher was the cortisol level, the greaterwas the left lateralization for delta, theta and alpha (decreasing BHL).Even though the comparison of BHLs between high and low C levelsshowed lateralization changes (Fig. 5) in line with the PCA results, thecon"rmatory ANCOVAs did not yield any signi"cant C effect.
3.4. Stress and N3 spectral parameters
Retained variables for BMP were cortisol, PSS, delta, sigma, beta andgamma, whereas for BHLwere cortisol, PSS, delta, theta, alpha and beta.PCAs yielded one component both for BMP and BHL datasets.
The BMP component was directly correlated with cortisol, PSS andfrequencies from sigma to beta and gamma and inversely with delta(Fig. 2B).
The BHL component was directly related to cortisol, PSS, beta, andinversely to delta, theta and alpha (Fig. 2C, central diagram). Higher cor-tisol and PSS levels were associated to a shift towards right BHL for beta,while delta, theta and alpha to a shift towards left BHL.
Con"rmatory ANCOVAs with C as between-factor were conductedon BMP and BHL retained variables (variables framed in red in Fig. 4for BMP and in Fig. 5 for BHL).
As for BMP, high C had lower values for delta (F(1,27) = 4.4,p b 0.05), andhigher values for sigma (F(1,27)=7.9, p b 0.01) andbeta(F(1,27) = 4.6, p b 0.05) than low C.
As for BHL, high C exhibited a higher left lateralization for delta(F(1,27) = 8.2, p b 0.01) and theta (F(1,27) = 6.6, p b 0.05) and ahigher right lateralization for beta (F(1,27) = 6.3, p b 0.05) than low C.
3.5. Stress and REM spectral parameters
Regarding the BMP dataset related to REM, no analyses were con-ducted as MSA of PSS and cortisol were both below 0.5.
With regard to REM BHL the pruning procedure selected delta,sigma, beta and gamma bands. PCA performed on the pruned datasethad one signi"cant component that yielded direct correlationswith cor-tisol, PSS, sigma, beta and gamma on one side, and inverse correlationwith delta (Fig. 2C, right diagram). Similarly to what observed for N3data, higher cortisol levels were related to a right lateralization forhigh frequency bands, and a left lateralization for the delta band. Con"r-matory ANCOVA, applied on delta, sigma, beta and gammaBHL, indicat-ed a signi"cant C-effect for delta, showing a shift towards left at High C,(F(1,27) = 6.4, p b 0.05) (Fig. 5).
4. Discussion
We investigated the relationships between stress, sleep, cognitiveabilities and emotional state in six male volunteers enrolled in theMARS500 pilot phase and sealed within an isolation facility modulefor 105 days.
Table 1Cognitive and emotional test scores descriptive statistics for BDC, column 4, and RDC, column 5. Values are presented as mean ± standard error. Last column represents results ofWilcoxon paired test on each of the parameters.
Functions Test Subtest BDC RDC Statistics
Numeric working memory Digit span Forward 6.6 ± 1.36 7.0 ± 0.63 NSBackward 5.5 ± 1.76 6.6 ± 0.81 NS
Spatial working memory Corsi's blocks – 6.8 ± 0.98 6.5 ± 0.83 NSLogic temporal reasoning Picture arrangement – 13.0 ± 2.44 11.16 ± 2.48 NSAttention Digit symbol coding – 17.0 ± 1.67 17.8 ± 1.47 NSSpatial reasoning Kohs cubes – 7.74 ± 0.10 7.79 ± 0.07 NSMood quality Pro"le of Mood States— POMS Tension–anxiety 47.0 ± 8.83 36 ± 2.94 NS
Confusion–bewilderment 42.0 ± 5.29 35.1 ± 2.92 NSDepression–dejection 46.16 ± 5.81 43.0 ± 2.19 NSFatigue–inertia 46.33 ± 6.25 40.0 ± 4.64 NSAnger–hostility 45.0 ± 8.94 40.6 ± 1.2 NSVigor-activity 57.6 ± 5.39 61.1 ± 9.26 NS
215A. Gemignani et al. / International Journal of Psychophysiology 93 (2014) 211–219
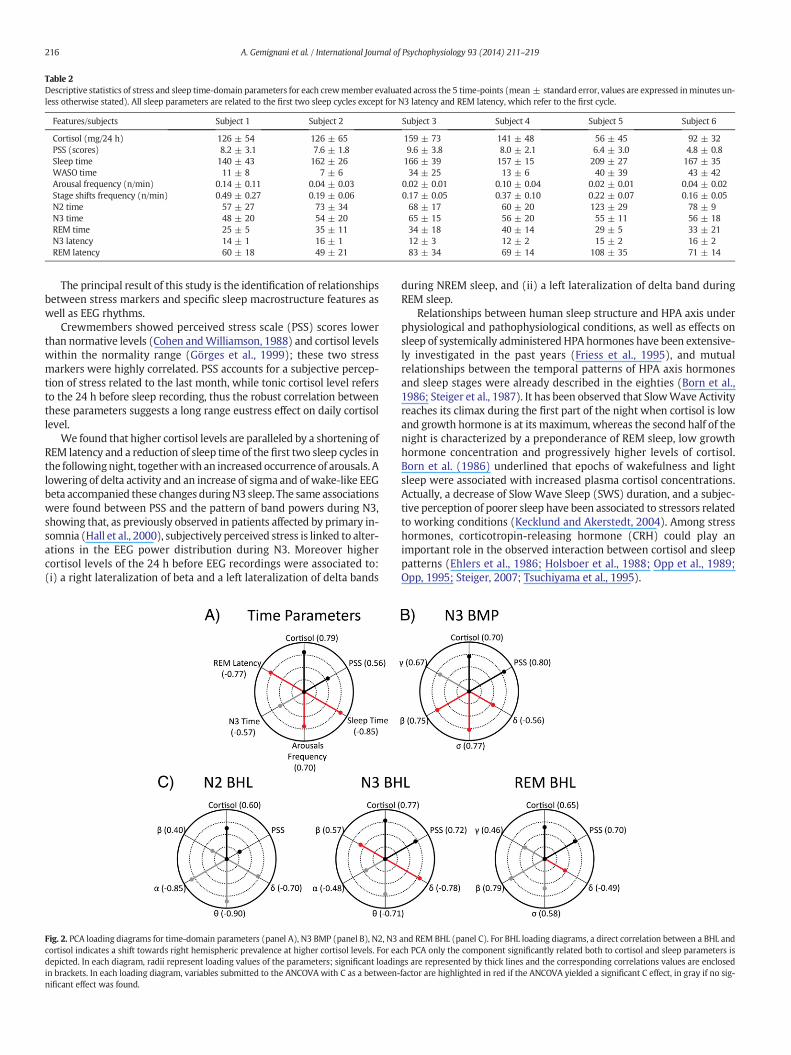
The principal result of this study is the identi"cation of relationshipsbetween stress markers and speci"c sleep macrostructure features aswell as EEG rhythms.
Crewmembers showed perceived stress scale (PSS) scores lowerthan normative levels (Cohen andWilliamson, 1988) and cortisol levelswithin the normality range (Görges et al., 1999); these two stressmarkers were highly correlated. PSS accounts for a subjective percep-tion of stress related to the last month, while tonic cortisol level refersto the 24 h before sleep recording, thus the robust correlation betweenthese parameters suggests a long range eustress effect on daily cortisollevel.
We found that higher cortisol levels are paralleled by a shortening ofREM latency and a reduction of sleep time of the "rst two sleep cycles inthe followingnight, togetherwith an increased occurrence of arousals. Alowering of delta activity and an increase of sigma and of wake-like EEGbeta accompanied these changes duringN3 sleep. The same associationswere found between PSS and the pattern of band powers during N3,showing that, as previously observed in patients affected by primary in-somnia (Hall et al., 2000), subjectively perceived stress is linked to alter-ations in the EEG power distribution during N3. Moreover highercortisol levels of the 24 h before EEG recordings were associated to:(i) a right lateralization of beta and a left lateralization of delta bands
during NREM sleep, and (ii) a left lateralization of delta band duringREM sleep.
Relationships between human sleep structure and HPA axis underphysiological and pathophysiological conditions, as well as effects onsleep of systemically administered HPA hormones have been extensive-ly investigated in the past years (Friess et al., 1995), and mutualrelationships between the temporal patterns of HPA axis hormonesand sleep stages were already described in the eighties (Born et al.,1986; Steiger et al., 1987). It has been observed that SlowWave Activityreaches its climax during the "rst part of the night when cortisol is lowand growth hormone is at its maximum, whereas the second half of thenight is characterized by a preponderance of REM sleep, low growthhormone concentration and progressively higher levels of cortisol.Born et al. (1986) underlined that epochs of wakefulness and lightsleep were associated with increased plasma cortisol concentrations.Actually, a decrease of Slow Wave Sleep (SWS) duration, and a subjec-tive perception of poorer sleep have been associated to stressors relatedto working conditions (Kecklund and Akerstedt, 2004). Among stresshormones, corticotropin-releasing hormone (CRH) could play animportant role in the observed interaction between cortisol and sleeppatterns (Ehlers et al., 1986; Holsboer et al., 1988; Opp et al., 1989;Opp, 1995; Steiger, 2007; Tsuchiyama et al., 1995).
Table 2Descriptive statistics of stress and sleep time-domain parameters for each crewmember evaluated across the 5 time-points (mean ± standard error, values are expressed inminutes un-less otherwise stated). All sleep parameters are related to the "rst two sleep cycles except for N3 latency and REM latency, which refer to the "rst cycle.
Features/subjects Subject 1 Subject 2 Subject 3 Subject 4 Subject 5 Subject 6
Cortisol (mg/24 h) 126 ± 54 126 ± 65 159 ± 73 141 ± 48 56 ± 45 92 ± 32PSS (scores) 8.2 ± 3.1 7.6 ± 1.8 9.6 ± 3.8 8.0 ± 2.1 6.4 ± 3.0 4.8 ± 0.8Sleep time 140 ± 43 162 ± 26 166 ± 39 157 ± 15 209 ± 27 167 ± 35WASO time 11 ± 8 7 ± 6 34 ± 25 13 ± 6 40 ± 39 43 ± 42Arousal frequency (n/min) 0.14 ± 0.11 0.04 ± 0.03 0.02 ± 0.01 0.10 ± 0.04 0.02 ± 0.01 0.04 ± 0.02Stage shifts frequency (n/min) 0.49 ± 0.27 0.19 ± 0.06 0.17 ± 0.05 0.37 ± 0.10 0.22 ± 0.07 0.16 ± 0.05N2 time 57 ± 27 73 ± 34 68 ± 17 60 ± 20 123 ± 29 78 ± 9N3 time 48 ± 20 54 ± 20 65 ± 15 56 ± 20 55 ± 11 56 ± 18REM time 25 ± 5 35 ± 11 34 ± 18 40 ± 14 29 ± 5 33 ± 21N3 latency 14 ± 1 16 ± 1 12 ± 3 12 ± 2 15 ± 2 16 ± 2REM latency 60 ± 18 49 ± 21 83 ± 34 69 ± 14 108 ± 35 71 ± 14
Fig. 2. PCA loading diagrams for time-domain parameters (panel A), N3 BMP (panel B), N2, N3 and REM BHL (panel C). For BHL loading diagrams, a direct correlation between a BHL andcortisol indicates a shift towards right hemispheric prevalence at higher cortisol levels. For each PCA only the component signi"cantly related both to cortisol and sleep parameters isdepicted. In each diagram, radii represent loading values of the parameters; signi"cant loadings are represented by thick lines and the corresponding correlations values are enclosedin brackets. In each loading diagram, variables submitted to the ANCOVA with C as a between-factor are highlighted in red if the ANCOVA yielded a signi"cant C effect, in gray if no sig-ni"cant effect was found.
216 A. Gemignani et al. / International Journal of Psychophysiology 93 (2014) 211–219

Findings regarding sigma activity deserve, in our opinion, a sepa-rate discussion: the enhancement of sigma at higher cortisol levelsseems at odds with a primary role of spindles in memory consolida-tion (Destexhe et al., 2007), which is classically counterbalanced byglucocorticoids (Wagner and Born, 2008). However, Marshall et al.(2006) demonstrated that association between boosting of declara-tive memory and enhancement of spindles activity is limited to thelow frequency interval (8–12 Hz) that corresponds to our alpha
band. Other authors pointed out a sleep protective function of spin-dles especially towards auditory stimuli (Dang-Vu et al., 2011). Inour experimental environment, which was highly contaminated byacoustic noise, a higher spindle activity at higher cortisol levelscould have had a sleep-preserving role. At higher cortisol levels thebrain is less asleep, as apparent from lower delta activity and higherwake-like activity expression, and a partial inhibition of thalamicsensory gating occurs (Steriade andMcCarley, 2010); in this sense spin-dle activity could be elicited to suppress auditory stimuli conveyed tothe cortex. Another interpretation of our "ndings can be drawn fromthe following: our analysis, focusing on a spectral representation ofthe EEG signals, does not discriminate between spindle oscillationsand sigma activity, so that our sigma could be part of a broadbandwake-like activity including beta (Menicucci et al., 2013). In our opin-ion, evidence of links between HPA axis and sleep sigma expression de-scribed in previous works could be interpreted in this framework.Andrew et al. (2002), found a lowering of delta and an increasing ofsigma and beta in patients with subjective insomnia when comparedto normal subjects. Moreover, Antonijevic et al. (1999) showed howCRH administration in healthy subjects enhanced EEG power in thesigma and low-beta range both during wakefulness and SWS.
Several lines of evidence suggest, duringwakefulness, links betweenright hemisphere lateralization and human stress response bothin healthy subjects (Hewig et al., 2008) and in depressive patients(Hecht, 2010). Our "ndings of a right hemispheric prevalence duringNREM sleep for beta activity at higher cortisol seem consistent withthis scenario and the aroused right hemisphere can be regarded as anadverse environment for sleep. On the other hand, delta power levelshowed a left hemispheric prevalence at higher cortisol during NREMsleep, consistent with the of!ine reprocessing related to the previoushighly demanding wakefulness (Poe et al., 2010). This could indicatethat mild cortisol levels produce a eustress condition able to supportthe emotional arousal via activation of the right hemisphere in thebeta band, while maintaining the cognitive functions via the SlowWave Activity expression in the left hemisphere. Accordingly, severalanimal models show that mild cortisol increases stimulate, rather thandepress, the hippocampal neurogenesis, which is involved in learningconsolidation processes (Lucassen et al., 2010). Also, evidence inhumans shows that high cortisol could improve memory consolidationof salient information over a night of sleep (Bennion et al, 2013).
In contrast with a whole body of literature (for a review seeVandekerckhove and Cluydts, 2010), no link was found between anybandmedian power during REM sleep and cortisol. However, due to ex-perimental issues, analyses were limited to the "rst two sleep cycles,while the greater expression of REM sleep appears later in the night.We cannot exclude effects on REM sleepwhen REM sleep is at its zenith(Payne and Nadel, 2004).
We found a delta left hemispheric prevalence during REM sleep inthe same direction of that found during NREM sleep; however, it isworth noting that delta activity during REM sleep has to be consid-ered as a part of the theta rhythm instead of being sustained by aspeci"c thalamo-cortical oscillator as during NREM sleep (Steriadeand McCarley, 2010).
Finally, no effect of prolonged con"nement was found either forcognitive abilities or for emotional state suggesting that the light sleepalterations associated to high, yet physiological, levels of cortisol arenot suf"cient to impair brain functions. This "nding is in agreementwith Schneider et al. (2010), demonstrating in the framework of thesame simulation that mood of crewmembers, after a decrease duringthe "rst 11 weeks, returned to baseline levels during the last week ofisolation. The lack of any alteration of emotional status seems at oddswith the shortening of REM latency identi"ed in our subjects at highercortisol levels. Notice that similar shortenings of REM latency and dura-tions of REM sleep in the "rst two sleep cycles (Table 2) are typically ob-served in depression (Steiger and Kimura, 2010). Indeed, these changeshave been considered either a marker of cholinergic over-activity in
Fig. 3.Descriptive statistics (mean and 95% con"dence interval) of high–low C differencesare presented for time parameters selected from PCA. Each selected parameter was sub-mitted to an ANCOVAwith C as a between factor and time as a covariate (asterisks denotesigni"cance at p b 0.05).
Fig. 4.Descriptive statistics (mean and 95% con"dence interval) of high–low C differencesare presented for BMP variables. Upper, middle and lower panels refer to N2, N3 and REMsleep BMP respectively. BMP variables onwhich the con"rmatory ANCOVAwith C as a be-tween factor and time as a covariate was conducted (selected on the basis of PCA) areencircled by dotted lines. Asterisks denote signi"cant ANCOVAs (single asterisk,p b 0.05; double asterisks, p b 0.01).
217A. Gemignani et al. / International Journal of Psychophysiology 93 (2014) 211–219

depression (Palagini et al., 2013) or a marker of stressful reaction, asshown in animals exposed to chronic mild stress (Cheeta et al., 1997).
The described "ndings highlight a physiological relationship be-tween total cortisol production related to the previous 24-hour activityand sleep of the following night. Even if related only to the "rst twosleep cycles, these "ndings overlap those found both in animal andhuman models of chronic stress and can be interpreted in the frame-work of well-known interactions between HPA axis and sleep (Steiger,2007). The lack of any information about the quality of sleep in thenights preceding the cortisolmeasurement, does not allow to complete-ly exclude sleep restriction effects on HPA axis and thus on cortisollevels (Leproult et al., 1997). In other words, we are not able to discrim-inate whether cortisol alters sleep or vice versa or, even more, if our re-sults re!ect the establishment of a self-sustaining vicious cycle.According with our working hypothesis, i.e. identifying a stress vulner-ability, the direction of the association between cortisol and sleep is notpivotal since it is the association per se to play a key role for designingpossible adhoc non pharmacological countermeasures (e.g. transcranialdirect current stimulation) able to prevent sleep alterations and main-tain sleepmemory functions (Marshall et al., 2006). In line with severalreports of NASA, ESA and Roscosmos, sleep dysfunctions are able tojeopardize the real spatial mission, increasing the risk of incidents andaccidents (Mallis and DeRoshia, 2005). Despite the study of the associa-tion between cortisol and sleep is not novelwhen cortisol is abnormal, itbecomes original when cortisol !uctuates in the normal range. This ap-pears crucial for super-selected and well-trained subjects engaged inextreme long-lasting spatial missions.
As a caveat, we stress that our results might not apply to generalpopulation because of the small sample size and the peculiarity of oursample. Indeed, this is a study for preparing humans to !y toMars. Nev-ertheless, our results are in line with a more common response of sleepto stressful conditions associatedwith an increase in cortisol levels, typ-ically observed in animal models and in general population.
In conclusion, we believe that 105 days of simulation do not repre-sent a stressor able to produce an allostatic load with associated cogni-tive or emotional alterations but rather a eustress condition useful to
produce an adaptive response characterized by increased arousal to ex-ternal stimuli and maintained sleep homeostatic functions.
We cannot exclude that longer simulations, such as 500 days corre-sponding to the real duration of a !ight to Mars, could elicit an allostaticload (McEwen, 2012). In this sense, we believe that our "ndings couldcontribute to de"ne indicators of astronauts “well-being” that may bemonitored during space missions and to design possible ad hoccountermeasures.
Acknowledgments
This work is dedicated to the memory of Prof. Mario Guazzelli.This research was supported by Italian Space Agency (ASI) through
grant ASI no. I/006/09/0We thank the Institute of Biomedical Problems (IBMP, Moscow,
Russia) and the European Space Agency (ESA) for the organization ofthe 105 day simulation.
We thank Luca Bastiani and Marco Scalese of Social EpidemiologicalSection of the Institute of Clinical Physiology of the National ResearchCouncil for revising the statistical procedures.
Appendix A. Supplementary data
Supplementary data to this article can be found online at http://dx.doi.org/10.1016/j.ijpsycho.2014.04.008.
References
Andrew, D., Krystal, A.D., Edinger, J.D., Wohlgemuth, W.K., Marsh, G.R., 2002. NREM sleepEEG frequency spectral correlates of sleep complaints in primary insomnia subtypes.Sleep 25, 630–640.
Antonijevic, I.A., Murck, H., Frieboes, R., Holsboer, T.T., Steiger, A., 1999. Hyporesponsive-ness of the pituitary to CRH during slow wave sleep is not mimicked by systemicGHRH. Neuroendocrinology 69, 88–96.
Barrett, P.T., Kline, P., 1981. The observation to variable ratio in factor analysis. Pers. StudyGroup Behav. 1, 23–33.
Basner, M., Dinges, D.F., Mollicone, D., Ecker, A., Jones, C.W., Hyder, E.C., Di Antonio, A.,Savelev, I., Kan, K., Goel, N., Morukov, B.V., Sutton, J.P., 2013. Mars 520-d mission
Fig. 5.Descriptive statistics (mean and95% con"dence interval) of high–lowCdifferences are presented for BHL variables. Upper,middle and lower rows refer toN2, N3 and REMsleepBHLrespectively. Eachhead plot represents results related to a speci"c band. In each head plot, a bar plot of the highC–low Cmean difference for the corresponding BHL is presented. Error barsdenote 95% con"dence intervals for themean. BHL variables onwhich the con"rmatory ANCOVAwith C as a between factor and time as a covariatewas conducted (selected on the basis ofPCA) are enclosed in dotted rectangles. Asterisks denote signi"cant ANCOVAs (single asterisk p b 0.05; double asterisk p b 0.01). The scale used for each head-plot is depicted in the head-plot at the end of middle panel.
218 A. Gemignani et al. / International Journal of Psychophysiology 93 (2014) 211–219
simulation reveals protracted crew hypokinesis and alterations of sleep duration andtiming. Proc. Natl. Acad. Sci. U. S. A. 110, 2635–2640.
Bennion, K.A., Steinmetz, K.R.M., Kensinger, E.A., Payne, J.D., 2013. Sleep and cortisol inter-act to support memory consolidation. Cereb, Cortex. http://dx.doi.org/10.1093/cercor/bht255 (Epub ahead of print).
Borbély, A.A., Mattmann, P., Loepfe, M., Strauch, I., Lehmann, D., 1985. Effect of benzodiaz-epine hypnotics on all-night sleep EEG spectra. Hum. Neurobiol. 4, 189–194.
Born, J., Kern, W., Bieber, K., Fehm-Wolfsdorf, G., Schiebe, M., Fehm, H.L., 1986. Night-timeplasma cortisol secretion is associated with speci"c sleep stages. Biol. Psychiatry 21,1415–1424.
Cattell, R.B., 1978. The Scienti"c Use of Factor Analysis. Plenum, New York (618 pp.).Cheeta, S., Ruigt, G., Proosdij, J.I., Willner, P., 1997. Changes in sleep architecture following
chronic mild stress. Biol. Psychiatry 41, 419–427.Cohen, S., Kamarck, T., Mermelstein, R., 1983. A global measure of perceived stress. J.
Health Soc. Behav. 24, 385–396.Cohen, S., Williamson, G., 1988. Perceived stress in a probability sample of the United
States. In: Oskamp, S. (Ed.), Spacapan, S. The Social Psychology of Health. Sage,Newbury Park, CA, pp. 31–67.
Dang-Vu, T.T., Bonjean, M., Schabus, M., Boly, M., Darsaud, A., Desseilles, M., Degueldre, C.,Balteau, E., Phillips, C., Luxen, A., Sejnowski, T.J., Maquet, P., 2011. Interplay betweenspontaneous and induced brain activity during human non-rapid eye movementsleep. Proc. Natl. Acad. Sci. U. S. A. 108, 15438–15443.
Dèchamps, G., Rosnet, E.A., 2005. Longitudinal assessment of psychological adaptationduring a winter-over in Antarctica. Environ. Behav. 37, 418–435.
Destexhe, A., Hughes, S.W., Rudolph, M., Crunelli, V., 2007. Are corticothalamic ‘up’ statesfragments of wakefulness? Trends Neurosci. 30, 334–342.
Dijk, D.J., Neri, D.F., Wyatt, J.K., Ronda, J.M., Riel, E., Ritz-De Cecco, A., Hughes, R.J., Elliott,A.R., Prisk, G.K., West, J.B., Czeisler, C.A., 2001. Sleep, performance, circadian rhythms,and light-dark cycles during two space shuttle !ights. Am. J. Physiol. Regul. Integr.Comp. Physiol. 281, 1647–1664.
Ehlers, C.L., Reed, T.K., Henriksen, S.J., 1986. Effects of corticotropin-releasing factor andgrowth hormone-releasing factor on sleep and activity in rats. Neuroendocrinology42, 467–474.
Friess, E., Wiedemann, K., Steiger, A., Holsboer, F., 1995. The hypothalamic-pituitary-adrenocortical system and sleep in man. Adv. Neuroimmunol. 5, 111–125.
Görges, R., Knappe, G., Gerl, H., Ventz, M., Stahl, F., 1999. Diagnosis of Cushing's syndrome:re-evaluation of midnight plasma cortisol vs urinary free cortisol and low-dose dexa-methasone suppression test in a large patient group. J. Endocrinol. Investig. 22,241–249.
Gorsuch, R.L., 1983. Factor Analysis. Erlbaum, Hillsdale, NJ (454 pp.).Hair, J.F., Black,W.C., Babin, B.J., Anderson, R.E., Tatham, R.L., 2010. Multivariate Data Anal-
ysis. Prentice Hall, Upper Saddle River, NJ (816 pp.).Hall, M., Buysse, D.J., Nowell, P.D., Nofzinger, E.A., Houck, P., Reynolds, C.F., 2000. Symp-
toms of stress and depression as correlates of sleep in primary insomnia. Psychosom.Med. 62, 227–230.
Hecht, D., 2010. Depression and the hyperactive right-hemisphere. Neurosci. Res. 68,77–87.
Hayton, J.C., Allen, D.G., Scarpello, V., 2004. Factor retention decisions in exploratory factoranalysis: a tutorial on parallel analysis. Organ. Res. Methods 7, 191–205.
Hewig, J., Schlotz, W., Gerhards, F., Breitenstein, C., Lurken, A., Naumann, E., 2008. Associ-ations of the cortisol awakening response with cortical activation asymmetry duringthe course of an exam stress period. Psychoneuroendocrinology 33, 83–91.
Hockey, G.R., Sauer, J., 1996. Cognitive fatigue and complex decision making underprolonged isolation and con"nement. Adv. Space Biol. Med. 5, 309–330.
Holsboer, F., von Bardeleben, U., Steiger, A., 1988. Effects of intravenous corticotropin-releasing hormone upon sleep-related growth hormone surge and sleep EEG inman. Neuroendocrinology 48, 32–38.
Iber, C., Ancoli-Israel, S., Chesson, A., Quan, S.F., 2007. The AASMManual for the Scoring ofSleep and Associated Events: Rules, Terminology and Technical Speci"cations.American Academy of Sleep Medicine, Westchester, IL.
Kaiser, H.F., 1970. A second generation little jiffy. Psychometrika 35, 401–415.Kecklund, G., Akerstedt, T., 2004. Apprehension of the subsequent working day is associ-
ated with a low amount of slow wave sleep. Biol. Psychol. 66, 169–176.Kline, P., 1979. Psychometrics and psychology. Academic Press, London (381 pp.).Kohs, S.C., 1923. Intelligence Measurement: A Psychological and Statistical Study Based
upon the Block Design Test. Macmillan, New York, USA (326 pp.).
Leproult, R., Copinschi, G., Buxton, O., Van Cauter, E., 1997. Sleep loss results in an eleva-tion of cortisol levels the next evening. Sleep 20, 865–870.
Lucassen, P.J., Meerlo, P., Naylor, A.S., van Dam, A.M., Dayer, A.G., Fuchs, E., Oomen, C.A.,Czéh, B., 2010. Regulation of adult neurogenesis by stress, sleep disruption, exerciseand in!ammation: Implications for depression and antidepressant action. Eur.Neuropsychopharmacol. 20, 1–17.
Mallis, M.M., DeRoshia, C.W., 2005. Circadian rhythms, sleep, and performance in space.Aviat. Space Environ. Med. 76, 94–107.
Marshall, L., Helgadóttir, H., Mölle, M., Born, J., 2006. Boosting slow oscillations duringsleep potentiates memory. Nature 444, 610–613.
McEwen, B.S., 2012. Brain on stress: how the social environment gets under the skin. Proc.Natl. Acad. Sci. U. S. A. 109 (Suppl. 2), 17180–17185.
McNair, D.M., Lorr, M., Droppleman, L.F., 1992. Pro"le of Mood States. Educational & In-dustrial Testing Service, San Diego, California, USA.
Menicucci, D., Piarulli, A., Debarnot, U., d'Ascanio, P., Landi, A., Gemignani, A., 2009. Func-tional structure of spontaneous sleep slow oscillation activity in humans. PLoS ONE 4,e7601.
Menicucci, D., Piarulli, A., Allegrini, P., Laurino, M., Mastorci, F., Sebastiani, L., Bedini, R.,Gemignani, A., 2013. Fragments of wake-like activity frame down-states of sleepslow oscillations in humans: New vistas for studying homeostatic processes duringsleep. Int. J. Psychophysiol. 89, 151–157.
Monk, T.H., Buysse, D.J., Billy, B.D., Kennedy, K.S., Willrich, L.M., 1998. Sleep and circadianrhythms in four orbiting astronauts. J. Biol. Rhythm. 13, 188–201.
Opp, M., Obal Jr., F., Krueger, J.M., 1989. Corticotropin-releasing factor attenuates interleu-kin 1-induced sleep and fever in rabbits. Am. J. Physiol. 257, 528–535.
Opp, M.R., 1995. Corticotropin-releasing hormone involvement in stressor-induced alter-ations in sleep and in the regulation of waking. Adv. Neuroimmunol. 5, 127–143.
Palagini, L., Baglioni, C., Ciapparelli, A., Gemignani, A., Riemann, D., 2013. REM sleepdysregulation in depression: state of the art. Sleep Med. Rev. 17, 377–390.
Payne, J.D., Nadel, L., 2004. Sleep, dreams, and memory consolidation: the role of thestress hormone cortisol. Learn. Mem. 11, 671–678.
Piarulli, A., Menicucci, D., Gemignani, A., Olcese, U., d'Ascanio, P., Pingitore, A., Bedini, R.,Landi, A., 2010. Likeness-based detection of sleep slow oscillations in normal and al-tered sleep conditions: application on low-density EEG recordings. IEEE Trans.Biomed. Eng. 57, 363–372.
Poe, G.R., Walsh, C.M., Bjorness, T.E., 2010. Cognitive neuroscience of sleep. Prog. BrainRes. 185, 1–19.
Schneider, S., Brümmer, V., Carnahan, H., Kleinert, J., Piacentini, M.F., Meeusen, R., Strüder,H.K., 2010. Exercise as a countermeasure to psycho-physiological deconditioningduring long-term con"nement. Behav. Brain Res. 211, 208–214.
Shapiro, S.S., Wilk, M.B., 1965. An analysis of variance test for normality (complete sam-ples). Biometrika 52, 591–611.
Steiger, A., Herth, T., Holsboer, F., 1987. Sleep-electroencephalography and the secretionof cortisol and growth hormone in normal controls. Acta Endocrinol. (Copenh) 116,36–42.
Steiger, A., 2007. Neurochemical regulation of sleep. J. Psychiatr. Res. 41, 537–552.Steiger, A., Kimura, M., 2010. Wake and sleep EEG provide biomarkers in depression. J.
Psychiatr. Res. 44, 242–252.Steriade, M., McCarley, R.W., 2010. Brain Control of Wakefulness and Sleep, 2nd edn.
Springer, New York (728 pp.).Tsuchiyama, Y., Uchimura, N., Sakamoto, T., Maeda, H., Kotorii, T., 1995. Effects of hCRH on
sleep and body temperature rhythms. Psychiatr. Clin. Neurosci. 49, 299–304.Van Reeth, O., Weibel, L., Spiegel, K., Leproult, R., Dugovic, C., Maccari, S., 2000. Interac-
tions between stress and sleep: from basic research to clinical situations. SleepMed. Rev. 4, 201–219.
Vandekerckhove, M., Cluydts, R., 2010. The emotional brain and sleep: an intimate rela-tionship. Sleep Med. Rev. 14, 219–226.
Vandierendonck, A., Kemps, E., Fastame, M.C., Szmalec, A., 2004. Working memory com-ponents of the Corsi blocks task. Br. J. Psychol. 95, 57–79.
Wagner, U., Born, J., 2008. Memory consolidation during sleep: interactive effects of sleepstages and HPA regulation. Stress 11, 28–41.
Wechsler, D., 1997. Wechsler Adult Intelligence Scale-III (WAIS-III). Psychological Corpo-ration, San Antonio.
219A. Gemignani et al. / International Journal of Psychophysiology 93 (2014) 211–219