How Much Can We Trust Maternal Ratings of Early Child ...
13
SOEPpapers on Multidisciplinary Panel Data Research The German Socio-Economic Panel study How Much Can We Trust Maternal Ratings of Early Child Development in Disadvantaged Samples? Malte Sandner and Tanja Jungmann 817 2016 SOEP — The German Socio-Economic Panel study at DIW Berlin 817-2016
-
Upload
khangminh22 -
Category
Documents
-
view
3 -
download
0
Transcript of How Much Can We Trust Maternal Ratings of Early Child ...

SOEPpaperson Multidisciplinary Panel Data Research
The GermanSocio-EconomicPanel study
How Much Can We Trust Maternal Ratings of Early Child Development in Disadvantaged Samples?
Malte Sandner and Tanja Jungmann
817 201
6SOEP — The German Socio-Economic Panel study at DIW Berlin 817-2016

SOEPpapers on Multidisciplinary Panel Data Research at DIW Berlin This series presents research findings based either directly on data from the German Socio-Economic Panel study (SOEP) or using SOEP data as part of an internationally comparable data set (e.g. CNEF, ECHP, LIS, LWS, CHER/PACO). SOEP is a truly multidisciplinary household panel study covering a wide range of social and behavioral sciences: economics, sociology, psychology, survey methodology, econometrics and applied statistics, educational science, political science, public health, behavioral genetics, demography, geography, and sport science. The decision to publish a submission in SOEPpapers is made by a board of editors chosen by the DIW Berlin to represent the wide range of disciplines covered by SOEP. There is no external referee process and papers are either accepted or rejected without revision. Papers appear in this series as works in progress and may also appear elsewhere. They often represent preliminary studies and are circulated to encourage discussion. Citation of such a paper should account for its provisional character. A revised version may be requested from the author directly. Any opinions expressed in this series are those of the author(s) and not those of DIW Berlin. Research disseminated by DIW Berlin may include views on public policy issues, but the institute itself takes no institutional policy positions. The SOEPpapers are available at http://www.diw.de/soeppapers Editors: Jan Goebel (Spatial Economics) Martin Kroh (Political Science, Survey Methodology) Carsten Schröder (Public Economics) Jürgen Schupp (Sociology) Conchita D’Ambrosio (Public Economics) Denis Gerstorf (Psychology, DIW Research Director) Elke Holst (Gender Studies, DIW Research Director) Frauke Kreuter (Survey Methodology, DIW Research Fellow) Frieder R. Lang (Psychology, DIW Research Fellow) Jörg-Peter Schräpler (Survey Methodology, DIW Research Fellow) Thomas Siedler (Empirical Economics) C. Katharina Spieß ( Education and Family Economics) Gert G. Wagner (Social Sciences)
ISSN: 1864-6689 (online)
German Socio-Economic Panel (SOEP) DIW Berlin Mohrenstrasse 58 10117 Berlin, Germany Contact: Uta Rahmann | [email protected]

How Much Can We Trust Maternal Ratings of Early ChildDevelopment in Disadvantaged Samples?
Malte Sandner*∗, Tanja Jungmann§
*NIW Hannover, Königstrasse 53, 30175 Hannover§Universität Rostock August-Bebel-Strasse 28, 18051 Rostock
January 2016
AbstractAn increasing number of panel studies use short screening questionnaires to assess infant de-
velopment. Although some research examines the validity of screening questionnaires for middle-class families, knowledge about their accuracy in disadvantaged households is scarce. This papervalidates a short screening questionnaire included in the German Socio-Economic Panel (SOEP)with the Bayley Scales for Infant Development (BSID) as an external criterion with a disadvan-taged population. The results reveal significant correlations between the screening questionnaireratings and the BSID scores for disadvantaged mothers. However, the concordance of maternalratings and test results decreased in mothers with multiple risk burdens.
JEL-Classification: J13, C42, C91Keywords: Child Development, Validation of Survey Measures
∗Forthcoming in Economics Letters. We are grateful to the editor Costas Meghir, and an anonymous referee, StephanThomsen, Katharina Spieß, and Daniel Schnitzlein, for for their helpful comments and suggestions. Financial supportby the German Federal Ministry for Family, Seniors, Women and Youth (BMFSFJ), the Saxony Social Ministry, theTUI Foundation, and the Foundations Dürr and Reimann-Dubbers is gratefully acknowledged.
1

1 Introduction
Recent evidence from economic research underlines the crucial role of early childhood
in lifelong human capital accumulation (e.g., Cunha and Heckman, 2007; Almond and
Currie, 2011). Many economists claim that policies for disadvantaged families starting
in early childhood are efficient to reduce poverty and inequality (e.g., Heckman and
Masterov, 2007). To understand the mechanisms of the effects of these policies, it is
important to consider both, long-term outcomes, such as income or grades, and short-
term outcomes, such as infant development. Field experiments offer the opportunity to
assess infant development using tests administered by professional examiners, with the
Bayley Scales for Infant Development (BSID; Bayley, 1993) considered the “gold stan-
dard”. However, developmental tests are costly to conduct and difficult to administer
in large panel studies. Therefore, panel studies such as the German Socio-Economic
Panel Study (SOEP, Wagner et al., 2007) or the National Longitudinal Survey of Chil-
dren and Youth (NLSCY, Statistics Canada, 2001) use less time and cost intensive
screening questionnaires (SQs) in which the caregiver rates the infants development.
However, measuring children’s skills by asking the parents may be accompanied
with many threats to validity. Caregivers can be positively or negatively biased in
their perception of their children, may give socially desired answers, or may report
developmental achievements only because they are asked for (e.g., Schwarz, 1999).
Furthermore, child development is a highly dynamic process with large individual
variation. While some evidence indicates that these threats only slightly bias the
screening scores in average populations (e.g., Johnson et al., 2004), research has not
determined whether this finding also applies to disadvantaged mothers, who are the
main target population for early childhood interventions. The described threats may
be more severe for disadvantaged mothers because they are often less knowledgeable
about the milestones of child development. Additionally, they are more often socially
isolated and thus have limited occasions to compare their own children’s development
to that of age-equivalent children. Even if they have a functioning social network,
these mothers are often too burdened with daily crises and existential problems to
fully realize developmental delays in various domains of child development.
This paper examines the validity of the SOEP-SQ (see Schmiade et al., 2008, for de-
2

tailed description) in a sample of psychosocially disadvantaged mothers. The mothers
exhibit between one and 12 social risk factors (e.g., low education, teenage pregnancy,
isolation, experiences of violence or health problems). For validation, infants were
screened using the SOEP-SQ and were tested using the BSID-II (German version by
Reuner et al., 2007) as an external criterion. The results revealed significant correla-
tions between the overall disadvantaged mothers’ SOEP-SQ ratings and the BSID-II
scores (r = 0.35 - 0.56). We found that the concordance between the maternal ratings
and the test results is lower for mothers with five or more risk factors than for mothers
with less than five risk factors, although our sample size lacks power to show that
these differences are significant. Overall, the results indicate that SQs draw a valid
and reliable picture of child development, also in a disadvantaged sample. However,
studies evaluating childhood policies for families with multiple risk factors should be
cautious when using SQ results.
2 Measuring Child Development
Psychologists distinguish between two procedures to measure child development: screen-
ing and tests. Following the definition of the American Academy of Child and Adoles-
cent Psychiatrists, screening involves the identification of current behavioral health or
developmental status. In the screening procedure, developmental achievement in var-
ious domains (mental, psychomotor, behavior, and language) is typically documented
using a standardized questionnaire. The family member or caregiver is expected to
be a reliable source who knows the child well. Typically, the screening is quick and
easy to administer and score. In contrast, testing is a more comprehensive process,
as it involves the family and evaluates the strengths and difficulties of the child and
the family in all life domains. A qualified individual with the appropriate credentials
required by the licensing authority conducts the assessment of developmental status.
The SOEP-SQ is a short version of the Vineland Adaptive Behavior Scale (VABS;
Sparrow et al., 2005), which is a screening procedure that obtains a parent’s report
of the child’s adaptive behavior from one month of age through adolescence. Par-
ents are asked to indicate whether their child always (2), sometimes (1), or never (0)
demonstrates age-normed adaptive behaviors in four critical domains of functioning
3

(communication, daily living skills, motor skills, and socialization). The interview con-
tains 297 items and requires 30 to 60 minutes. The SOEP uses a modified short version
of the VABS with the four subscales of “Speaking”, “Everyday Skills”, “Movement”,
and “Social Relationships” for infants between 24 to 36 months of age. This version
includes a total of 20 items that have not been validated using external criteria.1
In contrast to the screening approach, the BSID-II is an examiner-administered
test of infant development that assesses the mental abilities and psychomotor abilities
of infants between the ages of one and 42 months. Mental abilities include percep-
tual acuities, acquisition of object constancy, memory, learning and problem solving,
nonverbal and verbal communication, complex language, and abstract thinking. Psy-
chomotor abilities are defined as the degree of body control, large muscle coordination,
fine motor skills of the hands and fingers, dynamic movements, postural imitation, and
the ability to recognize objects by the sense of touch with different items. The BSID-II
comprises one scale to assess the mental abilities (Mental Development Index, MDI)
and another scale to evaluate the psychomotor abilities (Psychomotor Development
Index, PDI).
In conducting the BSID-II, the examiner presents a series of play materials or
pictures to the child. She provides brief instruction for each task and observes and
documents whether the child is able to solve it. The test sessions are videotaped and
scored after the interview by a developmental psychologist. Raw scores for each sub-
test are summed and transformed into standard scores (MDI and PDI) with a mean of
100 and SD of 15. Because of the comprehensive and appropriate content, construct,
and criterion validity, the BSID-II represents the “gold standard” of neurodevelop-
mental assessment in infancy and toddlerhood (e.g., Tylenda et al., 2007). Regarding
predictive validity, most evidence refers to the MDI. In their literature review, Fryer
and Levitt (2013) show that the average correlation between MDI and future IQ is
approximately 0.3 at 9 years of age. For Germany in particular, Coneus et al. (2012)
find a positive correlation between MDI and high school graduation. Less is known
about the predictive validity of PDI.1Appendix I provides the full text (English translation) of these SOEP screening questions (TNS Infratest Sozial-
forschung, 2015).
4
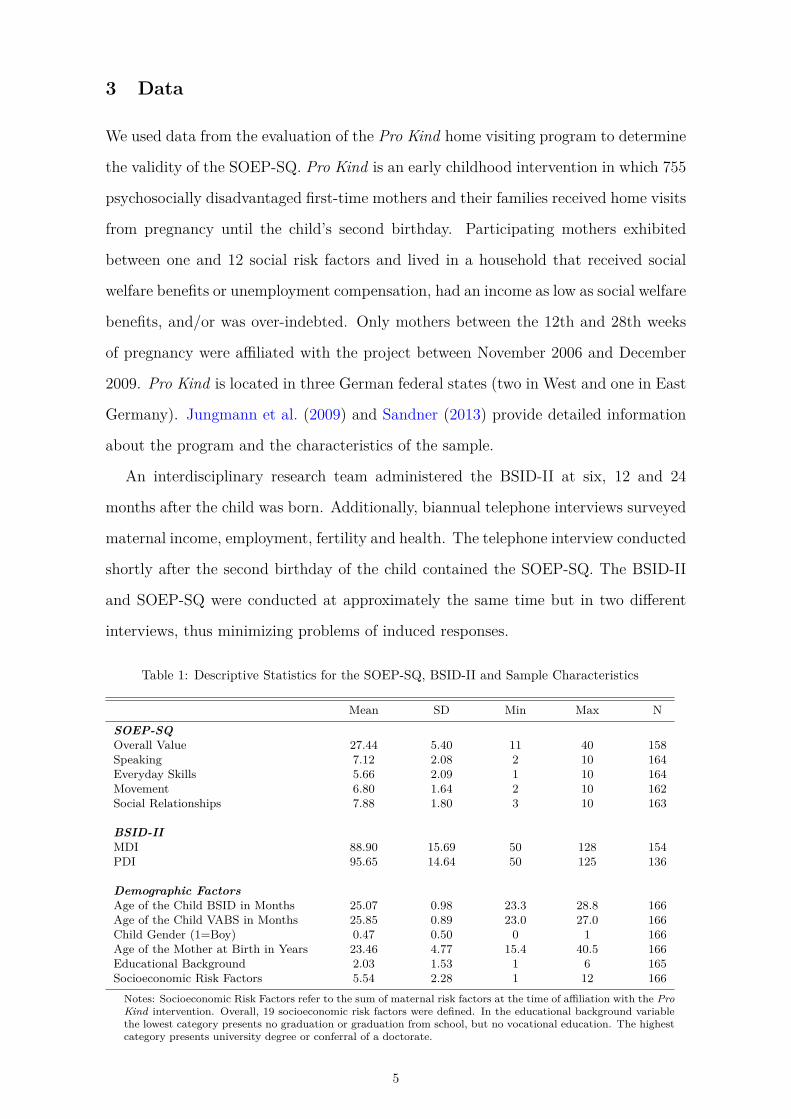
3 Data
We used data from the evaluation of the Pro Kind home visiting program to determine
the validity of the SOEP-SQ. Pro Kind is an early childhood intervention in which 755
psychosocially disadvantaged first-time mothers and their families received home visits
from pregnancy until the child’s second birthday. Participating mothers exhibited
between one and 12 social risk factors and lived in a household that received social
welfare benefits or unemployment compensation, had an income as low as social welfare
benefits, and/or was over-indebted. Only mothers between the 12th and 28th weeks
of pregnancy were affiliated with the project between November 2006 and December
2009. Pro Kind is located in three German federal states (two in West and one in East
Germany). Jungmann et al. (2009) and Sandner (2013) provide detailed information
about the program and the characteristics of the sample.
An interdisciplinary research team administered the BSID-II at six, 12 and 24
months after the child was born. Additionally, biannual telephone interviews surveyed
maternal income, employment, fertility and health. The telephone interview conducted
shortly after the second birthday of the child contained the SOEP-SQ. The BSID-II
and SOEP-SQ were conducted at approximately the same time but in two different
interviews, thus minimizing problems of induced responses.
Table 1: Descriptive Statistics for the SOEP-SQ, BSID-II and Sample Characteristics
Mean SD Min Max NSOEP-SQOverall Value 27.44 5.40 11 40 158Speaking 7.12 2.08 2 10 164Everyday Skills 5.66 2.09 1 10 164Movement 6.80 1.64 2 10 162Social Relationships 7.88 1.80 3 10 163
BSID-IIMDI 88.90 15.69 50 128 154PDI 95.65 14.64 50 125 136
Demographic FactorsAge of the Child BSID in Months 25.07 0.98 23.3 28.8 166Age of the Child VABS in Months 25.85 0.89 23.0 27.0 166Child Gender (1=Boy) 0.47 0.50 0 1 166Age of the Mother at Birth in Years 23.46 4.77 15.4 40.5 166Educational Background 2.03 1.53 1 6 165Socioeconomic Risk Factors 5.54 2.28 1 12 166Notes: Socioeconomic Risk Factors refer to the sum of maternal risk factors at the time of affiliation with the ProKind intervention. Overall, 19 socioeconomic risk factors were defined. In the educational background variablethe lowest category presents no graduation or graduation from school, but no vocational education. The highestcategory presents university degree or conferral of a doctorate.
5

Table 1 shows the descriptive statistics of the sample that we used to validate
the SOEP-SQ.2 The first rows present the outcomes for the SOEP-SQ and BSID-II.
Pro Kind children scored lower than comparable children on the SOEP-SQ (Schmiade
et al., 2008), and below the norm of 100 on the MDI and PDI. The last rows in Table
1 present the demographic factors of the children and the mothers. The children were
approximately the same average age when they were tested with the BSID-II and when
their mothers answered the SOEP-SQ. At their first child’s birth, the mothers were
young, had a low socioeconomic status indicated by a mean of 5.4 risk factors and a
low educational background with 60% of the mothers in the lowest education group.
These characteristics are potential obstacles to child development, as reflected in the
children’s low scores on the BSID-II scales and the SOEP-SQ maternal ratings. Results
from multivariate regressions reveal that in particular a higher value at the education
scale is positively correlated with both the SOEP-SQ and the BSID-II, indicating
that the SOEP-SQ is suitable to detect unfavorable child development resulting from
reduced stimulating environmental conditions.
4 Methods
We used Pearson’s correlations between SOEP-SQ and BSID-II to test whether the
SOEP-SQ measures what it intends to measure (construct validity).3 Because the
SOEP-SQ and BSID-II assess partly the same constructs and partly different con-
structs, we were also able to test for high correlations between the BSID-II scales
measuring the same construct (concurrent validity) and for low correlations between
scales measuring different constructs (discriminant validity). We expected the high-
est correlations between the BSID-II MDI and the SOEP-SQ “Speaking” scale and
between the BSID-II PDI and the SOEP-SQ “Movement” scale.
In the next step, we divided the sample into two groups of mothers with more than
five and fewer than five risk factors because we expected more disadvantaged mothers
to be less skilled in accurately rating the developmental status of their children. The
results changed only slightly if the cut-off point was set to include one more or one2Children were included in the sample if their mothers answered the SOEP-SQ when their child’s age ranged from
23 to 27 months, resulting in a sample of 166 children.3We also used multivariate regression with maternal demographic characteristics as controls, leading to similar
results.
6

less risk factor.
5 Results
Table 2 summarizes the main results of the analysis. The correlations between the
“Overall” SOEP-SQ value and the MDI and PDI scores were significant, with closer
relationships with MDI than with PDI. As expected, MDI was more strongly correlated
with the “Speaking” subscale than with the other scales. The correlation between the
“Movement” scale and the PDI was close, as expected, but the correlation with the
“Social Relationships” scale was even stronger.
Table 2: Correlation between SOEP-SQ and BSID-II
BSID-II, MDI BSID-II, PDISOEP-SQ r N r NOverall Value 0.487*** 146 0.375*** 129Speaking 0.561*** 152 0.192* 134Everyday Skills 0.170* 152 0.241** 134Movement 0.259** 150 0.330*** 133Social Relationships 0.362*** 146 0.340*** 133
Notes: r represents Pearson’s correlation coefficients. *p < 0.05, **p < 0.01, *** p < 0.001
When the sample was divided into groups of more than five and five or fewer
risk factors, the correlations were higher for the less disadvantaged subsample (Table
3). In the lower-risk sample, the correlation between MDI and “Speaking” increased
up to 0.663, and the correlation between PDI and “Movement” was higher than the
correlations among the other scales. In the higher-risk group, the correlations remained
significant but were smaller. However, the differences between the low- and high-risk
groups are almost all insignificant and completely insignificant when adjusting for
multiple testing. We also split the sample into a higher and lower education group,
resulting in reduced correlations in the lower education group. Other characteristics,
such as maternal age or child gender, did not influence the correlations.
6 Conclusion
This article examined how much we can trust in maternal ratings of infants’ and tod-
dlers’ skills in disadvantaged populations. We assessed the construct validity of a
7
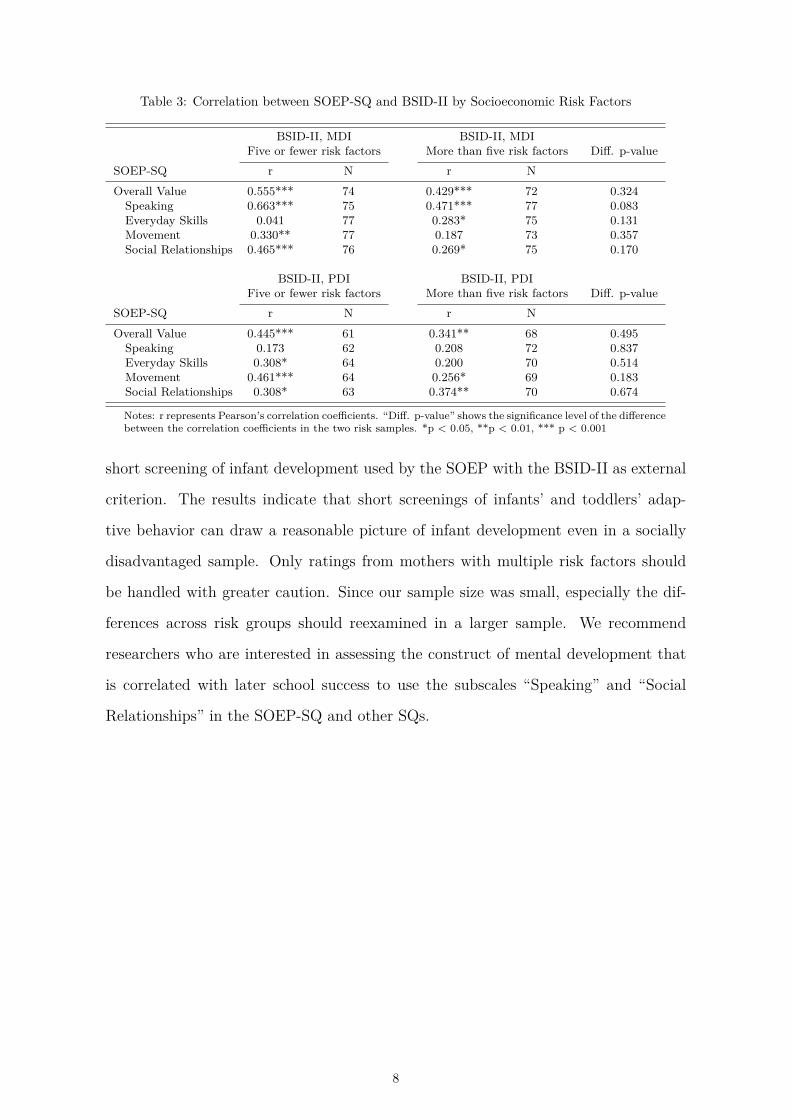
Table 3: Correlation between SOEP-SQ and BSID-II by Socioeconomic Risk Factors
BSID-II, MDI BSID-II, MDIFive or fewer risk factors More than five risk factors Diff. p-value
SOEP-SQ r N r NOverall Value 0.555*** 74 0.429*** 72 0.324Speaking 0.663*** 75 0.471*** 77 0.083Everyday Skills 0.041 77 0.283* 75 0.131Movement 0.330** 77 0.187 73 0.357Social Relationships 0.465*** 76 0.269* 75 0.170
BSID-II, PDI BSID-II, PDIFive or fewer risk factors More than five risk factors Diff. p-value
SOEP-SQ r N r NOverall Value 0.445*** 61 0.341** 68 0.495Speaking 0.173 62 0.208 72 0.837Everyday Skills 0.308* 64 0.200 70 0.514Movement 0.461*** 64 0.256* 69 0.183Social Relationships 0.308* 63 0.374** 70 0.674
Notes: r represents Pearson’s correlation coefficients. “Diff. p-value” shows the significance level of the differencebetween the correlation coefficients in the two risk samples. *p < 0.05, **p < 0.01, *** p < 0.001
short screening of infant development used by the SOEP with the BSID-II as external
criterion. The results indicate that short screenings of infants’ and toddlers’ adap-
tive behavior can draw a reasonable picture of infant development even in a socially
disadvantaged sample. Only ratings from mothers with multiple risk factors should
be handled with greater caution. Since our sample size was small, especially the dif-
ferences across risk groups should reexamined in a larger sample. We recommend
researchers who are interested in assessing the construct of mental development that
is correlated with later school success to use the subscales “Speaking” and “Social
Relationships” in the SOEP-SQ and other SQs.
8

References
Almond, D. and J. Currie (2011). Human Capital Development before Age Five. In
Orley Ashenfelter and David Card (Ed.), Handbook of Labor Economics, pp. 1315–
1486. Elsevier.
Bayley, N. (1993). Manual for the Bayley Scales of Infant Development (2nd Edition).
San Antonio: Psychological Corporation.
Coneus, K., M. Laucht, and K. Reuß (2012). The Role of Parental Investments for
Cognitive and Noncognitive Skill Formation—Evidence for the First 11 Years of Life.
Economics & Human Biology 10 (2), 189–209.
Cunha, F. and J. Heckman (2007). The Technology of Skill Formation. American
Economic Review 97 (2), 31–47.
Fryer, R. G. and S. D. Levitt (2013). Testing for Racial Differences in the Mental
Ability of Young Children. American Economic Review 103 (2), 981–1005.
Heckman, J. J. and D. V. Masterov (2007). The Productivity Argument for Investing
in Young Children. Review of Agricultural Economics 29 (3), 446–493.
Johnson, S., N. Marlow, D. Wolke, L. Davidson, L. Marston, A. O’Hare, and Pea-
cock, Janet and Schulte, Jane (2004). Validation of a Parent Report Measure of
Cognitive Development in very Preterm Infants. Developmental Medicine & Child
Neurology 46, 389–397.
Jungmann, T., Y. Ziert, V. Kurtz, and T. Brand (2009). Preventing Adverse De-
velopmental Outcomes and Early Onset Conduct Problems through Prenatal and
Infancy Home Visitation: The German Pilot Project Pro Kind. European Journal
of Developmental Science 3 (3), 292–298.
Reuner, G., J. Rosenkranz, J. Pietz, and R. Horn (2007). Bayley Scales of Infant
Development II (BSID-II), German Edition. Frankfurt/M: Hartcourt Test Services.
Sandner, M. (2013). Effects of Early Childhood Intervention on Child Development
and Early Skill Formation. Evidence from a Randomized Controlled Trial. Hannover
Economic Papers 518.
9

Schmiade, N., C. K. Spiess, and W. Tietze (2008). Zur Erhebung des adaptiven
Verhaltens von zwei- und dreijährigen. SOEPpapers 116.
Schwarz (1999). Self-reports. How the Questions Shape the Answers. American Psy-
chologist 54 (2), 93–105.
Sparrow, S. S., D. V. Cicchetti, and D. A. Balla (2005). Vineland Adaptive Behavior
Scales: Survey Forms Manual. (Second Edition ed.). Circle Pines, MN: American
Guidance Service.
Statistics Canada (2001). National Longitudinal Survey of Children and Youth.
TNS Infratest Sozialforschung (2015). SOEP 2015 – Erhebungsinstrumente 2015
(Welle 32) des Sozio - oekonomischen Panels: Mutter und Kind (2 - 3 Jahre), Alt-
stichproben. SOEP Survey Papers 278. Berlin: DIW/SOEP.
Tylenda, B., J. Beckett, and R. P. Barrett (2007). Assessing mental retardation using
standardized intelligence tests. In J. Matson (Ed.), Handbook of Assessment in
Persons with Intellectual Disability. London, Amsterdam, Oxford, Burlington, San
Diego: Elsevier.
Wagner, G., J. Frick, and J. Schupp (2007). The German Socio-Economic Panel Study
(SOEP) – Scope, Evolution and Enhancements. Schmollers Jahrbuch 127 (1), 139–
169.
10

Figure A1: SOEP Screening Questionnaire
11


![Credit ratings failures and policy options [with Discussion]](https://static.fdokumen.com/doc/165x107/633fd3e6d10f841e2f086984/credit-ratings-failures-and-policy-options-with-discussion.jpg)