
Risk characteristics of covered bonds: monitoring beyond ratings
69
Working Paper Series Risk characteristics of covered bonds: monitoring beyond ratings Magdalena Grothe, Jana Zeyer Disclaimer: This paper should not be reported as representing the views of the European Central Bank (ECB). The views expressed are those of the authors and do not necessarily reflect those of the ECB. No 2393 / April 2020
-
Upload
khangminh22 -
Category
Documents
-
view
0 -
download
0
Transcript of Risk characteristics of covered bonds: monitoring beyond ratings

Working Paper Series Risk characteristics of covered bonds: monitoring beyond ratings
Magdalena Grothe, Jana Zeyer
Disclaimer: This paper should not be reported as representing the views of the European Central Bank (ECB). The views expressed are those of the authors and do not necessarily reflect those of the ECB.
No 2393 / April 2020

Abstract
This paper proposes a set of indicators relevant for the risk characteristics of coveredbonds, as based on granular publicly available transparency data. The indicatorscapture various aspects of cash flow risks related to the issuer, the cover pool andthe payment structure. They offer unified risk metrics for the European coveredbond universe, which ensures comparability across covered bonds issued by differentissuers and rated by different credit rating agencies. The availability of granularrisk indicators adds to the overall transparency of the market in the context of riskmonitoring.
Keywords: covered bonds; risk monitoring; risk indicators;covered bond transparency data; credit ratings
JEL classification: G12; G24; G21; C30
ECB Working Paper Series No 2393 / April 2020 1

Non-technical summary
This paper analyses factors that influence the risk profile of covered bonds. Based on
publicly available transparency data on individual covered bond programmes, we pro-
pose a set of granular risk indicators. They capture various aspects of cash flow risks,
grouped into the following categories: (1) issuer risk, (2) overcollateralization, (3) cover
pool risk, (4) mismatches between covered bond and cover pool cash flows, and (5)
maturity type. The indicators are comparable across European covered bonds issued by
different issuers and rated by different credit rating agencies and thus contribute to the
overall transparency of the market.
The results of this paper illustrate that there is a significant heterogeneity of covered
bond programmes with respect to various dimensions of their risk characteristics. For
example, within the same rating class, we observe a significant variability of the proposed
granular indicators, e.g. those informing on the risks in the cover pool like the share of
cover pool assets in arrears or with very high loan-to-value ratios. Due to the nature of the
covered bond as a financial product with double protection, the credit ratings of these
instruments tend to be relatively high though, with 101 out of 198 bonds rated AAA.
Consequently, some particular aspects of risk-related information available from the
granular indicators, which could be of interest from the perspective of particular investor’s
risk preferences, may provide useful information and enable a better risk monitoring and
comparability within the European covered bond market. The paper also offers a stylised
example of an application of risk indicators for monitoring purposes.
The paper includes also a series of model-based robustness checks exploring to which
extent the information content provided by the granular risk indicators may be already
visible in the credit ratings. We employ a unilateral correlation analysis, turning further
to a more systematic regression approach as well as the least absolute shrinkage and
selection operator algorithm. In this way we identify those risk indicators, e.g. the issuer
rating, that are likely to offer less of the new information in addition to the credit ratings.
Overall, the proposed risk indicators offer value added in terms of risk monitoring of the
ECB Working Paper Series No 2393 / April 2020 2

European covered bond market, as compared to the information conveyed by the credit
ratings only. While there is relatively little variability in the credit ratings of covered
bonds, the proposed risk indicators offer comparable and relatively granular information
on vulnerabilities embedded in these assets. The availability of such indicators, which
are comparable across the European covered bond universe, adds to the transparency
of the market in the context of risk monitoring.
ECB Working Paper Series No 2393 / April 2020 3

1 Introduction
Covered bonds are an important source of market-based funding for European banks
and an interesting financial product for investors. The covered bond market has been
steadily growing over the past years, attracting new issuers and investors (see, for ex-
ample European Covered Bond Council (2017), European Central Bank (2011b) and
Packer, Stever, and Upper (2007)).1 The key reason is that covered bonds include an
additional layer of collateral, as compared to unsecured bank bonds, which offers in-
vestors a safer banking debt instrument and allows banks for cheaper refinancing in the
debt market. At the same time, this specific feature of covered bonds adds a layer of
complexity to the product, which may pose challenges with respect to the risk assess-
ment. Based on new transparency data on individual covered bond programmes, this
paper proposes a set of granular risk indicators, which can be uniformly computed and
compared across issuers and credit rating agencies. The results illustrate that there is
a significant heterogeneity of equally-rated covered bond programmes with respect to
various dimensions of their granular risk characteristics. Consequently, some particular
aspects of risk-related information available from the granular indicators, which could
be of interest from the perspective of particular investor’s risk preferences, may provide
useful information and enable a better risk monitoring and comparability within the
European covered bond universe, contributing to market transparency.
Covered bonds are debt instruments issued by banks and backed by collateral, a so-
called cover pool, which is composed of private sector loans (usually residential and/or
commercial mortgage loans) or public sector debt instruments (usually loans and/or
debt securities). The issuer is responsible for the payments of the covered bond coupon
and principal, while the cover pool becomes the source of payments only in the case of the
issuer default. This structure implies a double-layered protection of covered bond cash
1In the recent years the covered bond market also gained importance for monetary policy operations,where covered bonds were included in several purchase programmes of the Eurosystem (see EuropeanCentral Bank (2009, 2011a, 2014, 2017a and 2017b), as well as Beirne et al. (2011)). For an overviewof the role of the covered bond market, see also, e.g., Nicolaisen (2017), Oddenes and Fasseland (2014),Klestinec (2013), as well as Vucetich and Watson (2013) for some cross-country statistics and the historyof the market.
ECB Working Paper Series No 2393 / April 2020 4

flows for an investor, as the payments are disrupted only when (1) the issuer defaults
and (2) the cover pool resources are insufficient to make payments in a timely manner.
Therefore, the analysis of risks related to this financial product needs to account for
the credit quality of both, the issuer and the cover pool, also including the mismatches
between the cash flows promised by the covered bond and those received from the cover
pool. Based on newly available transparency data (see European Central Bank (2016)),
such risk analysis is possible to conduct in a standardised way for a set of European
covered bonds.2
Before the introduction of new data requirements, it was challenging to find timely and
comparable information on various European covered bond programmes. Apart from
the ratings of the credit rating agencies, more detailed information related to the credit
quality of this financial product was either not available or not standardised. While
the credit rating agencies have access to the loan-level information of the cover pool
and are thus able to conduct particular stress tests and a very detailed risk analysis,
the investors and other market participants can only rely on the aggregate indicators
published by the credit rating agencies or the issuers.3 At the same time, even the
ratings of credit rating agencies do not offer a uniform platform for the comparative risk
assessment of the covered bond universe, since the ratings are not fully comparable due
to the differences in underlying methodologies (see, e.g., Moody’s (2016), FitchRatings
(2016a), Standard & Poor’s (2015 and 2014), and DBRS (2017a), as well as FitchRatings
(2018)).4 Consequently, covered bonds with the same rating may still have various credit
quality metrics of the cover pool, various levels of concentration in the pool, various
levels of currency and asset-liability mismatches, which could all be relevant from the2A covered bond programme encompasses a series of covered bonds (of several or possibly even
several tenths of ISINs), which are based on the same cover pool. The data on risk characteristics isthus available at the level of a covered bond programme. Throughout this paper, we use the expressions”covered bond” and the ”covered bond programme” interchangeably, always meaning the programme.
3The availability of credit ratings for the risk assessment purposes is very useful, but there may besome caveats in the applied models and/or related to the information asymmetry, as shown in the pastexperiences, see, e.g., BIS (2008 or 2005).
4For example, some methodologies conduct the cover pool modelling under the assumption of anissuer default probability of 100%, while other methodologies model the cover pool quality under theoccurrence of the issuer default (see, e.g., FitchRatings (2018) and Moody’s (2016)).
ECB Working Paper Series No 2393 / April 2020 5

perspective of individual risk preferences of particular investors (e.g., aversion to high
concentration in the cover pool or to foreign currency exposures).5
While several covered bond legal frameworks make certain transparency requirements
mandatory, as for example the case in Germany, France, Ireland, Luxembourg and the
Netherlands, the required data coverage differs across countries. Moreover, some covered
bond issuers publish covered bond and cover pool information on their websites, but not
in a standardised manner. With respect to the information provided by the credit rating
agencies, publishing standards differ substantially, for example with regard to the data
granularity, definitions, formats and reference periods. To improve the data availability
and increase transparency in the covered bond market, private sector initiatives were
undertaken, in particular the covered bond label created by the European Covered
Bond Council together with the European Mortgage Federation.6 However, since not all
covered bond programmes were represented in this initiative, it was only the introduction
of the transparency requirements (see European Central Bank (2016)) which made a
more detailed comparison of covered bond characteristics across the market possible.7
This paper proposes a set of risk indicators relevant for the risk profile of covered bonds.
The indicators are grouped to the following categories: (a) issuer risk, (b) overcollater-
alization, (c) cover pool risk, (d) mismatches between the covered bond and the cover
pool cash flows, and (e) maturity type. In particular, beyond the overall characteristics
of the covered bond, our indicator set explores the detailed information on the timing,
currencies and structure of covered bond and cover pool cash flows, as well as the char-
5See also further literature illustrating the value of other variables for risk monitoring, in addition tocredit ratings, e.g., Deku, Kara, and Marques-Ibanez (2019) or Grothe (2013), as well as some discussionon the credit rating industry in Bongaerts (2014).
6The ”covered bond label”, introduced in 2012, was designed in a cooperation of Europeancovered bond issuers, investors and regulators. Covered bond issuers which want to use this la-bel as a quality criterion for their programmes have to fulfil several requirements. For example,they have to publish a standardised Excel-Sheet (a so-called ”Harmonised Transparency Template”),containing relevant covered bond and pool information on a quarterly basis. For details, see alsohttps://www.coveredbondlabel.com/. As of end-2017, the European Covered Bond Council labelled112 cover pools of 95 issuers across 16 jurisdictions, i.e. the coverage still not fully encompassing thewhole universe of covered bond programmes. Moreover, the way to fill out the template is not fullystandardised, which complicates the comparison across programmes.
7Also other institutions expressed the view that more harmonisation in the market is needed, see,e.g. European Banking Authority (2016).
ECB Working Paper Series No 2393 / April 2020 6

acteristics of the cover pool in terms of distributions of arrears, loan-to-value ratios,
countries, regions and asset types. In this way, our set of indicators offers an example
of a broad information set which could be relevant for risk comparison of covered bonds
across the whole European universe, which until now was not possible in this much
detail.8
The results of this paper illustrate that there is a significant heterogeneity of covered
bond programmes with respect to various dimensions of their risk characteristics. For
example, within the same rating class, we observe a significant variability of the proposed
granular indicators, e.g. those informing on the risks in the cover pool like the share of
cover pool assets in arrears or with very high loan-to-value ratios. Due to the nature of the
covered bond as a financial product with double protection, the credit ratings of these
instruments tend to be relatively high though, with 101 out of 198 bonds rated AAA.
Consequently, some particular aspects of risk-related information available from the
granular indicators, which could be of interest from the perspective of particular investor’s
risk preferences, may provide useful information and enable a better risk monitoring and
comparability within the European covered bond market.9
The paper includes also a series of model-based robustness checks exploring to which
extent the information content provided by the granular risk indicators may be already
visible in the credit ratings. We employ a unilateral correlation analysis, turning further
to a more systematic regression approach as well as the least absolute shrinkage and
selection operator algorithm. In this way we identify those risk indicators, e.g. the issuer
rating, that are likely to offer less of the new information in addition to the credit ratings.
Overall, our results suggest that the transparency data contributes to a deeper under-8In the context of risk monitoring, the exact definition, selection and weighting of indicators needs,
however, to be seen from the perspective of individual preferences. In this paper, we use a relativelybroad set of simple indicators and abstract from detailed choices on how to weight them.
9This is in line with some findings, e.g. those showing that some characteristics of cover pool arerelevant for pricing of covered bonds, even within the same credit rating segment (see Prokopczuk,Siewert, and Vonhoff (2013)). More generally, the fact that there is a pricing differentiation withinthe group of bonds with the same credit rating suggests that there are some further specific bondcharacteristics that could be important from the perspective of individual investors, e.g., specific featuresof the cover pool, potential for cash flow mismatches or secondary market liquidity.
ECB Working Paper Series No 2393 / April 2020 7

standing of the risks related to the covered bonds, in particular allowing for an analysis
of cover pool credit risk and cash flow aspects without the access to loan-level informa-
tion. The risk indicators proposed in this paper allow for a comparison of bonds within
the universe of one rating class. They can be selected in a way tailored to investor pref-
erences, like for example aversion to high concentration risk or to high-LTV exposures.
In result, investors could monitor the risks in a more detailed and systematic way, also
being able to compare the indicator values across the European covered bond universe,
contributing to market transparency.
The remainder of the paper is structured as follows. Section 2 describes the data. Section
3 introduces the granular risk indicators and illustrates new information provided in
addition to the credit ratings, including also a stylised example of a risk monitoring
application. Section 4 contains several model-based robustness checks and Section 5
concludes.
2 Data
The data on covered bonds is published by the credit rating agencies in compliance
with the recently introduced transparency requirements (see European Central Bank
(2016)).10 Each agency publicly discloses data on all European covered bond pro-
grammes which it rates.11 Published documents entail detailed information on pro-
gramme characteristics, including the distribution of cash flows on the asset and liability
sides (i.e., for the cover pool and the covered bond, also including currency distribu-
tion and interest rate characteristics). The data also contains detailed characteristics
of the cover pool, including the distribution of loans with respect to their loan-to-value
ratios, the share of assets in arrears, as well as asset distribution across countries and,
10The data used in this paper is publicly available on the websites of four credit rating agencies. Allnumbers presented in this paper are based on own calculations.
11In case of non-disclosure, any delays in publication or the lack of compliance with the requirements,the ECB guideline states consequences as following (see European Central Bank (2016)): ”If the criteriaare not fulfilled for a particular covered bond programme, the Eurosystem may deem the public creditrating(s) related to the relevant covered bond programme not to meet the high credit standards of theECAF. Thus, the relevant ECAI’s public credit rating may not be used to establish the credit qualityrequirements for marketable assets issued under the specific covered bond programme.”
ECB Working Paper Series No 2393 / April 2020 8

within them, across regions. For the detailed list of the available information, see Eu-
ropean Central Bank (2016, Section 2(b)). The data is published by four credit rating
agencies, Moody’s, Fitch, S&P and DBRS, on a quarterly basis and is available since
end-November 2017 (first set for all covered bond programmes for Q3-2017).12
Rating agencyNumber of bonds
rated by each rating agency
Number of bonds rated exclusively byeach rating agency
Number of bonds rated by both, Moody's and each other rating
agency
Number of bonds rated by both, Fitch
and each other rating agency
Moody's 138 84 * 27Fitch 51 17 27 *S&P 53 23 22 13
DBRS 24 3 19 8
Rating agencyNumber of bonds
rated by both, S&P and each other rating
agency
Number of bonds rated by all, Moody's, Fitch and each other
rating agency
Number of bonds rated by all, Fitch, S&P andeach other rating
agency
Number of bonds rated by all, Moody's, Fitch, S&P and DBRS
Moody's 22 * 6 *Fitch 13 * * *S&P * 6 * *
DBRS 5 7 3 2
Table 1: Overview of the data coverage across the credit rating agenciesNote: The names of credit rating agencies are displayed in the order corresponding to the number of bonds ratedby each agency.
The data sample in this paper covers the programmes rated by Moody’s, Fitch, S&P and
DBRS published for Q3-2017. Out of all published programmes, we exclude the bonds
with some rare features, like those where the currency of denomination or reporting
is not euro, or those based on shipping, airplane or SME loans. Overall, 198 covered
bond programmes are included in the analysis. Table 1 presents an overview of the
number of covered bond programmes rated by agencies, while the definitions of main
data characteristics are listed in Tables 2 - 4, as based on Moody’s (2016), FitchRatings
(2016a), Standard & Poor’s (2015 and 2014), and DBRS (2017a).13
12Throughout the paper, the ordering of names of credit rating agencies corresponds to the numberof bonds in our dataset rated by each agency. (see Table 1). Some credit rating agencies publishedalso information going further back in time for some bonds (e.g., Fitch and DBRS), some others pub-lished the data for a broader set of covered bond programmes (e.g., Moody’s, including non-Europeanprogrammes).
13For further related details, see also Moody’s (2017), FitchRatings (2017 and 2016b), Standard &Poor’s (2017, 2016a and 2016b), DBRS (2015) as well as Commerzbank (2017).
ECB Working Paper Series No 2393 / April 2020 9

Nam
eDefinition
Data
avail-
ability
Covered
Bond
Rat-
ing
Ratingpublish
edbythecred
itratingagen
cy.Forthesakeofcomparability,
theratingistransform
edto
alinearnumericalscale.Forcovered
bondsrated
by
severalcred
itratingagen
cies,weuse
the
averagecred
itrating.Unit:notches.a
Moody’s,
Fitch
,S&P,
DBRS
Issu
erRisk
Long-term
default
ratingoftheissu
eronunsecu
redbonds.
Ifdata
isnotavailable,weuse
other
mea-
suresofthecounterp
artyrisk
assessm
ent,asprovided
bythecred
itratingagen
cies.Thecounterp
arty
risk
assessm
entprovides
aprobabilityofdefaultassessm
entonabank’soperatingobligations,su
chas
pay
men
tobligationsassociatedwithcovered
bonds(andcertain
other
secu
redtransactions),deriva-
tives,lettersofcred
it,third-party
guarantees,servicingand
trustee
obligationsand
other
similar
obligationsthatarise
from
abankin
perform
ingitsessentialoperatingfunctions.
Forthesakeof
comparability,
theratingis
transform
edto
alinearnumericalscale.Unit:notches.
Moody’s,
Fitch
,S&P,
DBRS
Leeway
Thenumber
ofratingnotches
bywhich
an
issu
erratingcan
belowered
before
thecovered
bonds
may
face
adow
ngrade.
Unit:notches.
Moody’s,
Fitch
,S&P
Main
Collate
ralAs-
setType
Typeoftheassetswith
thelargestsh
are
inthecover
pool(e.g.,
residen
tial,
commercial,
public
sector).Unit:EUR
(nominalva
lueoftheassets)
or(ofcover
poolassets),dep
endingonthecred
itratingagen
cy.
Moody’s,
Fitch
,S&P,
DBRS
Cover
Pool
Asset
Distrib
ution
Distributionofthecover
poolassetsamongasset
types
(e.g.,residen
tial,commercial,publicsector
assets),countriesand
regions.
Unit:EUR
(nominalva
lueoftheassets)
or(ofcover
poolassets),
dep
endingonthecred
itratingagen
cy.
Moody’s,
Fitch
,S&P,
DBRS
Overcollate
ralization
Overcollateralisation
comparesthe
valueofcover
poolassetsto
theva
lueofcovered
bonds,
on
nominalornet
presentva
luebasis,
dep
endingonthecred
itratingagen
cyandtheissu
er.Committed
overcollateralizationis
theov
ercollateralizationthattheissu
eris
required
tomaintain,either
based
onthecovered
bondlegalframew
ork
orthecontractualobligation.Unit:%
(ofcovered
bonds).
Moody’s,
Fitch
,S&P,
DBRS
Asset-Liability
Pro-
file
Theprincipalcash
flow
softhecover
poolassetsandcovered
bonds,
divided
into
maturity
buckets.
Formost
bonds(those
rated
byMoody’s
and
Fitch
),thematurity
bucketsare:0-1Y,1-2Y,2-3Y,
3-4Y,4-5Y,5-10Y
and>10Y.b
Unit:EUR
(nominalva
lueoftheassets)
or%
(ofcovered
bondsor
cover
poolassets,
resp
ectively),
dep
endingonthecred
itratingagen
cy.
Moody’s,
Fitch
,DBRS
Tab
le2:
Overview
ofdataavailable
from
thetran
sparen
cytemplates(1/3)
Note:Thetable
presents
anov
erview
ofthedata
available
from
thetransp
arency
templatespublish
edbythecred
itratingagen
cies.The
column”Data
source”
indicateswhether
given
inform
ationis
available
forseveralcred
itratingagen
cies
oris
specificforoneagen
cy.The
names
ofcred
itratingagen
cies
are
displayed
bythenumber
ofbondsratedbyeach
agen
cy(see
Table
1).
aThech
oiceofalinearscale
ismotiva
tedbyitssimplicity
andtraceability.
Theresultingtransfor-
mation
can
beeasily
compared
and
aggregated
across
thecred
itratingagen
cies.Atthesametime,
this
transform
ationmay
hav
esomedrawbacksin
case
thereare
non-lineareff
ects,forex
ample
between
theinvestm
ent-
andnon-investm
entgradeclasses.See
alsoAnnex
A,Table
A-1
foranov
erview
and
mappingofratingscales.
bThematurity
bucketsforprincipalcash
flow
sofunder
10years
inthecase
ofDBRSare:0-5Y,
5-8Y,8-10Y.
ECB Working Paper Series No 2393 / April 2020 10

Nam
eDefinition
Data
avail-
ability
Weighte
dAverage
Life
Weighted
averagelife
(inyears)oftheassetsorcovered
bonds,
calculatedbymultiplyingprincipal
pay
men
tsbytheperiodin
whichthey
are
received
/paid
anddividingtheresu
ltbythetotalamount
ofprincipal.Tim
ingofprincipalpay
men
tsis
norm
allybasedonsched
uledpay
men
ts.Unit:years.
Moody’s,
Fitch
,S&P,
DBRS
Inte
rest
Rate
Dis-
trib
ution
Nominalva
lueofthecover
bond
liabilitiesand
cover
poolassetswith
thefixed
and
floatingrate.
Unit:EUR
(nominalva
lueoftheassets)
or%
(ofcovered
bondsorcover
poolassets,
resp
ectively),
dep
endingonthecred
itratingagen
cy.
Moody’s,
Fitch
,S&P,
DBRS
Currency
Distrib
u-
tion
Nominalva
lueofthecover
bondliabilitiesandcover
poolassetsden
ominatedin
variouscu
rren
cies.
Unit:EUR
(nominalva
lueoftheassets)
or%
(ofcovered
bondsorcover
poolassets,
resp
ectively),
dep
endingonthecred
itratingagen
cy.
Moody’s,
Fitch
,S&P,
DBRS
LTV
Distrib
ution
Distributionofcover
poolassetsaccord
ingto
theirloan-to-valueratio.Formost
bonds(those
rated
byMoody’s,Fitch
andS&P),theLTV
bucketsare:0-40%,40%-50%,50%-60%,60%-70%,70%-80%,
80%-90%,90%-100%,>100%.Unit:EUR
(nominalva
lueoftheassets)
or%
(ofcover
poolassets),
dep
endingonthecred
itratingagen
cy.
Moody’s,
Fitch
,S&P,
DBRS
Arrears
Cov
erpoolassetsin
arrears.Formost
bonds(those
ratedbyMoody’s,Fitch
andS&P),
thebuckets
forthelength
ofarrears
are:less
than3months,
3-6
months,
6monthsormore.a
Unit:EUR
(nominal
valueoftheassets)
or%
(ofcover
poolassets),dep
endingonthecred
itratingagen
cy.
Moody’s,
Fitch
,S&P,
DBRS
Collate
ral
Score
(Moody’s-specifi
c)
Thecollateralscore
measu
resthecred
itquality
ofthecover
poolanddetermines
theamountofthe
cover
poolwritten
offasaresu
ltofasset
cred
itdeteriorationfollow
ingaCB
anch
oreven
t.Thehigher
thecred
itquality
ofthecover
pool,thelower
thecollateralscore.Unit:%.
Moody’s
Cover
Pool
Losses
(Moody’s-specifi
c)
AssumptionoftheMoody’s
ExpectedLoss
Model.Thesu
mofcollateralrisk
(i.e.,CollateralScore
post-haircu
t)and
market
risk.Theloss
follow
ingaCB
anch
oreven
twillprimarily
dep
end
on
(1)
theva
lueofthecover
poolin
relation
totheoutstandingcovered
bonds;
and
potentially
(2)any
additionalunsecu
redclaim
against
theissu
eroranyoutstandingclaim
against
swapcounterp
arties.
Inassessing
theva
lueofthecover
pool,
ourconsiderationsinclude(1)thecred
itquality
ofthe
cover
pool;
(2)therefinancingrisk
iffundsneed
toberaised
against
thecover
pool;
and
(3)any
interest-rate
andcu
rren
cyrisk
towhichthecover
poolis
exposed.Unit:%.
Moody’s
Tab
le3:
Overview
ofdataavailable
from
thetran
sparen
cytemplates(2/3)
Note:Thetable
presents
anov
erview
ofthedata
available
from
thetransp
arency
templatespublish
edbythecred
itratingagen
cies.The
column”Data
source”
indicateswhether
given
inform
ationis
available
forseveralcred
itratingagen
cies
oris
specificforoneagen
cy.The
names
ofcred
itratingagen
cies
are
displayed
bythenumber
ofbondsratedbyeach
agen
cy(see
Table
1).
aAdditionally,
Fitch
and
S&P
offer
also
bucketsfor1-2
monthsand
2-3
months.
Moody’s
offers
alsoasecond
option
todefi
nethebucketsforarrears,asfollow
s:less
than
2months,
2-6
months,
6monthsormore.This
optionis
reported
for118outof144programmes.Toalignthedata
across
all
cred
itratingagen
cies,weuse
thethreshold
of3months,
correspondingalsoto
theBaselCommitteeon
BankingSupervision’s
defi
nitionofnon-perform
ingex
posures(see
alsoBaselCommitteeon
Banking
Supervision(2017)).
ECB Working Paper Series No 2393 / April 2020 11

Nam
eDefinition
Data
avail-
ability
Tim
ely
Paym
entIn
-dicato
r(M
oody’s-
specifi
c)
Moody’s
Tim
elyPay
men
tIndicator.
Itreflects
theprobabilitythatpay
men
tsonthecovered
bond
willbemadein
atimelyfash
ionfollow
ingacovered
bondanch
oreven
t(e.g.,adefault
oftheissu
er)
andfollow
sa6-elemen
tscale
thatranges
from
“VeryHigh”to
“VeryIm
probable”.Unit:descriptive
scale.
Moody’s
Paym
ent
Continu-
ity
Uplift
(Fitch-
specifi
c)
Fitch
’sPay
men
tContinuityUplift.It
reflects
theuplift
relatedto
theprobabilitythatpay
men
tson
thecovered
bond
willbemadein
atimelyfash
ion
follow
ingacovered
bond
anch
oreven
t(e.g.,
adefault
oftheissu
er).
Unit:notches.
Fitch
Target
Credit
En-
hancem
ent
(S&P-
specifi
c)
S&P’s
Target
Credit
Enhancemen
t.It
reflects
theprobabilitythatpay
men
tson
thecovered
bond
willbemadein
atimelyfash
ion.Unit:units.
S&P
Cover
Pool
Credit
Assessm
ent
(DBRS-specifi
c)
DBRS’s
Cov
erPoolCredit
Assessm
ent.
Itreflects
theuplift
relatedto
theprobabilitythatpay
men
tsonthecovered
bondwillbemadein
atimelyfash
ionfollow
ingacovered
bondanch
oreven
t(e.g.,a
default
oftheissu
er).
Unit:notches.
DBRS
Matu
rity
type
”Hard
bullet”is
acovered
bondrepay
able
infullonasingle
sched
uledmaturity
date.”Soft
bullet”
isacovered
bond
wheretheinitialsched
uled
maturity
date
may
beex
tended
toalatersched
uled
maturity
date,usu
allynotex
ceed
ing
2years
post
thematurity
date,unless
itqualifies
asapass
through.”Pass
through”is
acovered
bond
thatmov
esto
apass
through
stru
cture
after
atrigger
even
t,e.g.anissu
erdefault
oranissu
er’sfailure
toconduct
amandatory
amortisationtest,including
wherethebond
hasasched
uled
maturity
date
setto
fallafter
thelast
maturingcover
poolasset.
”Mixed
”is
wherecovered
bondsofdifferen
tmaturity
types
are
issu
ed.Unit:descriptive.
Moody’s,
Fitch
,S&P,
DBRS
Tab
le4:
Overview
ofdataavailable
from
thetran
sparen
cytemplates(3/3)
Note:Thetable
presents
anov
erview
ofthedata
available
from
thetransp
arency
templatespublish
edbythecred
itratingagen
cies.The
column”Data
source”
indicateswhether
given
inform
ationis
available
forseveralcred
itratingagen
cies
oris
specificforoneagen
cy.The
names
ofcred
itratingagen
cies
are
displayed
bythenumber
ofbondsratedbyeach
agen
cy(see
Table
1).
ECB Working Paper Series No 2393 / April 2020 12

3 Risk indicators
This section introduces granular risk indicators and presents the results of monitoring.
It shows their summary statistics and distributions for the European covered bond
universe. In a more detailed approach, we illustrate the variability of indicators within
one rating class, showing how much additional information they provide on the various
aspects of potential vulnerabilities. The section concludes with a stylised example of an
application of risk indicators for monitoring purposes.
3.1 Indicator definitions
Based on the transparency data, we develop a set of risk indicators, grouped into the
following categories: (1) issuer risk, (2) overcollateralization, (3) cover pool risk, (4)
mismatches between the covered bond and the cover pool cash flows, and (5) maturity
type. The indicators are based on the data which is comparable across all data providers
(four credit rating agencies) and all issuers. In this way, the risk indicators constitute a
uniform platform for a comparison of covered bonds across the whole European market
with respect to the set of important characteristics.
3.1.1 Issuer risk
Issuer risk is captured by the rating ascribed by the credit rating agency, as defined in
Tables 2 - 4. For completeness, we also consider the sovereign rating of the issuer’s coun-
try, but we use this variable, along with some country dummies, only for the robustness
purposes, as it is highly correlated with the issuer rating.14
3.1.2 Overcollateralisation
Overcollateralisation compares the value of cover pool assets to the value of covered
bonds. We use the following indicators:
14The issuer rating incorporates the macroeconomic risk of the country where the issuer is located,as well as, at least to some extent, the sovereign risk (see also Moody’s (2017)). See also Table B-1 inAnnex B for the correlation between the issuer and sovereign ratings.
ECB Working Paper Series No 2393 / April 2020 13

- Overcollateralization (OC) - Nominal overcollateralization, defined as:
OC = 100 ∗ (CP
CB− 1), (1)
where CP denotes the nominal value of the cover pool and CB denotes the nominal
value of the covered bond, and
- Committed Overcollateralization (OC) - The overcollateralization which the
issuer is required to maintain, either based on the covered bond legal framework or the
contractual obligation.
3.1.3 Cover pool risk
The cover pool risk is captured by several indicators characterising the asset pool:
- Arrears - The share of the cover pool assets which have been in arrears for at least
3 months,
- High LTV loans (Very high LTV loans) - The share of the cover pool assets with
the loan-to-value ratio exceeding 80% (and 100%, respectively),
- Commercial assets - The share of commercial loans in the cover pool,
- Regional concentration - The largest share of the cover pool assets concentrated
in one region, while regions are defined within countries,
- Macroeconomic risk (MR) - Macroeconomic risk relevant for the cover pool, defined
as:
MR =
C∑
c=1
CPc
CP∗Rc, (2)
where CPc denotes the nominal value of the cover pool assets in country c, Rc denotes
the sovereign rating of country c and C denotes the number of all countries relevant for
the cover pool, and
- Real estate risk (RR) - Real estate risk relevant for the cover pool, defined as the
share of residential loans in the cover pool originated in a country where the residential
ECB Working Paper Series No 2393 / April 2020 14

real estate sector was identified as vulnerable by the European Systemic Risk Board
(see European Systemic Risk Board (2016a and 2016b)).
RR =C∑
i=1
CPi ∗Ri
CP, (3)
where CPi denotes the nominal value of the cover pool assets in country i, C denotes
the number of all countries relevant for the cover pool, Ri equals 1 if country i received
a warning related to the vulnerabilities in the residential real estate sector from the
European Systemic Risk Board in 2016 and 0 otherwise.
For the purpose of comparison of the data availability, we also use the indicators pro-
vided by the credit rating agencies, i.e. collateral score, cover pool losses and the timely
payment indicator by Moody’s, payment continuity uplift by Fitch, target credit en-
hancement by S&P and cover pool credit assessment by DBRS, which summarise the
credit rating agency’s assessment about the credit quality of the cover pool (all as de-
fined in Tables 3-4).
3.1.4 Mismatches between the covered bond and the cover pool cash flows
Cash flow mismatches are captured by the following indicators:
- Asset-liability mismatch (ALMT ) - Mismatch between the cash flows on the asset
and liability sides, defined as:
ALMT = max(
∑Tt=1 CBt −
∑Tt=1 CPt
CB; 0), (4)
where CBt (CPt) denotes the nominal value of the cover bond liabilities (cover pool
assets) scheduled for payment in year t, and T denotes the number of years for which
the mismatch is computed. We consider the asset-liability mismatches for 3 and 5 years.
We use in the charts, if not specified otherwise, the asset-liability mismatch for a 5-year
horizon, which corresponds to a typical maturity of a covered bond.
ECB Working Paper Series No 2393 / April 2020 15

- Currency mismatch (CM) - Mismatch between the currencies of the cash flows on
the asset and liability sides, defined as:
CM =
I∑
i=1
max(CBi − CPi
CB; 0), (5)
where CBi (CPi) denotes the nominal value of the cover bond liabilities (cover pool
assets) denominated in currency i, and I denotes the number of all currencies relevant
for the cover pool, reported by the credit rating agency.
- Interest rate mismatch (IRM) - Mismatch between the interest rate characteristics
of the cash flows on the asset and liability sides, defined as:
IRM = max(CBfixed − CPfixed
CB; 0) +max(
CBfloating − CPfloating
CB; 0), (6)
where CBfixed (CPfixed) denotes the nominal value of the cover bond liabilities (cover
pool assets) with the fixed rate and CBfloating (CPfloating) denotes the nominal value
of the cover bond liabilities (cover pool assets) with the floating rate. The data provided
for most covered bond programmes does not allow for an identification of the value of
the currency or interest rate swaps or the assessment of individual swap counterparties.
Therefore, the indicators for the currency mismatch and the interest rate mismatch do
not take possible swap arrangements into account. However, based on the data from one
credit rating agency, where the information on the currency and interest rate exposures
before and after swap is provided, the effect of hedging on the currency and interest
rate mismatches seems to be relatively limited (see Figure C-1 in Annex C).
- Maturity mismatch - Mismatch between the average maturities of the cash flows
on the asset and liability sides, defined as the difference between the weighted average
life of the cover pool assets and the covered bond liabilities (as defined in Table 2).
3.1.5 Maturity type
This category captures the risks of payment delays, relative to the initial scheduled
maturity date, due to the embedded options for maturity extension in soft bullet and
pass-through covered bonds, as defined in Table 4.
ECB Working Paper Series No 2393 / April 2020 16

3.2 Summary overview of credit ratings and new information providedby granular risk indicators
This section discusses the distributions of credit ratings, as well as illustrates the new
information provided by granular risk indicators comparable across the whole asset
class. Tables 5-6 present the descriptive statistics of credit ratings and proposed risk
indicators, also separately for several countries with the largest number of covered bond
programmes, as well as for main cover pool asset types. Country-specific descriptive
statistics are presented for all countries with more than 10 covered bonds in the sample.
For the sake of comparison, we also report some risk indicators as published by the credit
rating agencies (i.e. collateral score, cover pool losses and the timely payment indicator
by Moody’s, payment continuity uplift by Fitch, target credit enhancement by S&P and
cover pool credit assessment by DBRS). To complement the overall descriptive statistics,
Figures 1 and 2 show the distributions of credit ratings and selected risk indicators for all
European bonds, while Figure 3 presents the distributions of risk indicators within the
highest rating class. The highest rated bonds are those with the maximum rating (i.e.,
Aaa in Moody’s terminology and AAA in the Fitch, S&P and DBRS terminology, see
also Table A-1 in Annex A) ascribed by all agencies which rate the respective bonds.
There are 101 bonds within the highest rating class, out of 198 bonds in the whole
dataset.
ECB Working Paper Series No 2393 / April 2020 17

Risk indicators Units
Number of observations Avgerage Median Min Max
Number of bonds(with mismatch or
asset/ maturity type)
Covered bond amounts (EUR bn) 189 7.3 3.6 0.0 62.7Cover pool amounts (EUR bn) 189 11.1 5.3 0.2 93.2Covered bond and issuer ratingsCovered bond rating (notches, AAA=1, Aa1=2,…) 189 2.6 1.0 1.0 16.0Covered bond rating incl. leeway (notches) 160 -0.5 -1.0 -9.0 8.0Issuer rating (notches) 150 7.9 7.0 2.0 24.0Covered bond uplift vs issuer incl. leeway (notches) 135 7.9 8.0 2.0 13.0Covered bond uplift vs issuer (notches) 150 5.3 5.0 1.0 10.0Country rating (notches) 189 4.3 2.0 1.0 16.0OvercollateralisationOvercollateralisation (%) 189 72% 43% 0% 650%Committed Overcollateralisation (%) 189 10% 5% 0% 55%Cover pool risk Arrears (% of cover pool) 177 2% 0% 0% 102%High LTV assets (% of cover pool) 177 13% 5% 0% 100%Very high LTV assets (% of cover pool) 173 4% 0% 0% 100%Commercial assets (% of cover pool) 189 14% 0% 0% 97%Regional concentration (% of cover pool) 179 41% 35% 5% 100%Macroeconomic risk of assets (notches) 185 4.4 2.7 0.0 16.0Real estate risk (% of cover pool) 189 19% 0% 0% 100%Collateral score (Moody's) (% of cover pool) 137 11% 8% 3% 30%Cover pool losses (Moody's) (% of cover pool) 137 21% 18% 5% 50%Timely payment indicator (Moody's) (units 1="very high",…,6="very improbable") 138 3.2 3.0 0.0 6.0Payment continuity uplift (Fitch) (notches) 48 4.2 5.0 0.0 8.0Cover pool credit assessment (DBRS) (notches) 21 8.1 10.0 1.0 12.0Target credit enhancement (S&P) (units) 53 25.3 20.6 2.5 90.0Cash flow mismatchAsset-liability mismatch (3 years) (% of covered bond amounts) 161 14% 0% 0% 93% 0Asset-liability mismatch (5 years) (% of covered bond amounts) 165 20% 6% 0% 94% 0Currency mismatch (% of covered bond amounts) 187 2% 0% 0% 67% 39Interest rate mismatch (% of covered bond amounts) 189 20% 2% 0% 100% 103Maturity mismatch (years) 183 4.6 3.7 -7.4 22.3Maturity typeHard bullet (number of bonds) 189 106Soft bullet (number of bonds) 189 41Pass-through (number of bonds) 189 14Mixed (number of bonds) 189 28Main collateral asset typeResidential (number of bonds) 189 120Commercial (number of bonds) 189 20Public sector (number of bonds) 189 47Number of covered bonds (units) 198 189
All covered bonds
Table 5: Descriptive statistics (1/2)Note: The table shows descriptive statistics of risk indicators, as defined in this section, also presenting medianvalues for covered bond programs within a given country and a given asset type. Country-specific descriptive statisticspresented for all countries with more than 10 covered bonds in the sample.a
aFor Germany, the table shows maturity type ”mixed” for 4 covered bond programmes, due to theimprecise reporting. These bonds are hard bullet bonds, as no other type is allowed by this country’slegal framework.
ECB Working Paper Series No 2393 / April 2020 18

Risk indicators Units
Austria France Germany Italy Spain Residential Commercial Public Sector
Covered bond amounts (EUR bn) 1.1 9.1 4.0 3.5 3.5 3.6 4.6 3.0Cover pool amounts (EUR bn) 2.1 10.9 5.5 4.3 10.3 6.7 6.5 4.0Covered bond and issuer ratingsCovered bond rating (notches, AAA=1, Aa1=2,…) 1.0 1.0 1.0 4.5 3.0 1.0 1.0 1.0Covered bond rating incl. leeway (notches) 0.0 -3.0 -3.0 2.0 2.0 -1.0 -3.0 -1.0Issuer rating (notches) 7.0 5.5 5.5 11.5 8.5 8.0 6.0 7.0Covered bond uplift vs issuer incl. leeway (notches) 8.0 8.0 9.0 7.0 7.0 8.0 8.0 8.0Covered bond uplift vs issuer (notches) 6.0 4.3 4.5 6.0 5.5 5.0 5.0 5.0Country rating (notches) 2.0 3.0 1.0 9.0 8.0 3.0 1.0 2.0OvercollateralisationOvercollateralisation (%) 43% 35% 35% 38% 168% 45% 34% 33%Committed Overcollateralisation (%) 2% 8% 2% 8% 25% 8% 2% 2%Cover pool risk Arrears (% of cover pool) 0% 0% 0% 1% 6% 0% 0% 0%High LTV assets (% of cover pool) 5% 27% 0% 3% 10% 11% 6% 0%Very high LTV assets (% of cover pool) 2% 0% 0% 0% 3% 1% 2% 0%Commercial assets (% of cover pool) 6% 0% 1% 0% 15% 0% 76% 0%Regional concentration (% of cover pool) 54% 23% 28% 26% 34% 38% 28% 34%Macroeconomic risk of assets (notches) 2.0 3.0 1.1 9.0 8.0 3.2 1.7 2.0Real estate risk (% of cover pool) 57% 0% 0% 0% 0% 0% 0% 0%Collateral score (Moody's) (% of cover pool) 8% 6% 9% 6% 19% 7% 11% 10%Cover pool losses (Moody's) (% of cover pool) 19% 16% 16% 18% 32% 19% 19% 15%Timely payment indicator (Moody's) (units 1="very high",…,6="very improbable") 4.0 3.0 2.0 4.0 4.0 4.0 2.0 2.0Payment continuity uplift (Fitch) (notches) 4.5 4.0 6.0 0.0 6.0 4.0 5.0Cover pool credit assessment (DBRS) (notches) 10.0 9.5 10.0Target credit enhancement (S&P) (units) 32.2 20.9 15.8 33.0 46.0 20.6 23.7 21.6Cash flow mismatchAsset-liability mismatch (3 years) (% of covered bond amounts) 8% 0% 0% 16% 5% 8% 0% 0%Asset-liability mismatch (5 years) (% of covered bond amounts) 8% 1% 0% 36% 7% 19% 0% 0%Currency mismatch (% of covered bond amounts) 0% 0% 0% 0% 0% 0% 0% 0%Interest rate mismatch (% of covered bond amounts) 29% 0% 1% 20% 26% 1% 19% 2%Maturity mismatch (years) 3.6 1.4 0.8 5.7 4.8 5.0 1.5 1.7Maturity typeHard bullet (number of bonds) 20 6 48 0 25 51 15 39Soft bullet (number of bonds) 0 2 0 17 0 36 2 3Pass-through (number of bonds) 1 0 0 4 0 13 1 0Mixed (number of bonds) 2 10 3 1 3 20 2 5Main collateral asset typeResidential (number of bonds) 12 12 15 19 20Commercial (number of bonds) 1 0 15 2 1Public sector (number of bonds) 10 6 21 1 6Number of covered bonds (units) 23 18 51 22 28 120 20 47
Covered bonds per country(median per indicator)
Covered bonds per main asset type (median per indicator)
Table 6: Descriptive statistics (2/2)Note: The table shows descriptive statistics of risk indicators, as defined in this section, also presenting medianvalues for covered bond programs within a given country and a given asset type. Country-specific descriptive statisticspresented for all countries with more than 10 covered bonds in the sample.a
aFor Germany, the table shows maturity type ”mixed” for 4 covered bond programmes, due to theimprecise reporting. These bonds are hard bullet bonds, as no other type is allowed by this country’slegal framework.
ECB Working Paper Series No 2393 / April 2020 19

Figure 1: Distributions of covered bond indicators (1/2)Note: The figures show histograms of selected risk indicators (as defined in this section) across all 198 coveredbond programmes in the sample. The vertical red lines denote the median.
ECB Working Paper Series No 2393 / April 2020 20

Figure 2: Distributions of covered bond indicators (2/2)Note: The figures show histograms of selected risk indicators (as defined in this section) across all 198 coveredbond programmes in the sample. The vertical red lines denote the median.
ECB Working Paper Series No 2393 / April 2020 21
Overcollateralisation
0%
500%
1000%
1500%
2000%
2500%
Commited OC
0%
5%
10%
15%
20%
25%
30%
Arrears
0%
1%
2%
3%
4%
5%
6%
7%
8%
9%
High LTV share
0%
10%
20%
30%
40%
50%
60%
70%
80%
Very high LTV share
0%
10%
20%
30%
40%
50%
60%
Commercial assets
0%
10%
20%
30%
40%
50%
60%
70%
80%
90%
100%
Regional concentration
10%
20%
30%
40%
50%
60%
70%
80%
90%
100%
Macroeconomic risk
1.0
2.0
3.0
4.0
5.0
6.0
7.0
8.0
Real estate risk-20%
0%
20%
40%
60%
80%
100%
Asset-liability mismatch
0%
10%
20%
30%
40%
50%
60%
70%
Currency mismatch
0%
10%
20%
30%
40%
50%
60%
70%
Interest rate mismatch
0%
10%
20%
30%
40%
50%
60%
70%
80%
90%
100%
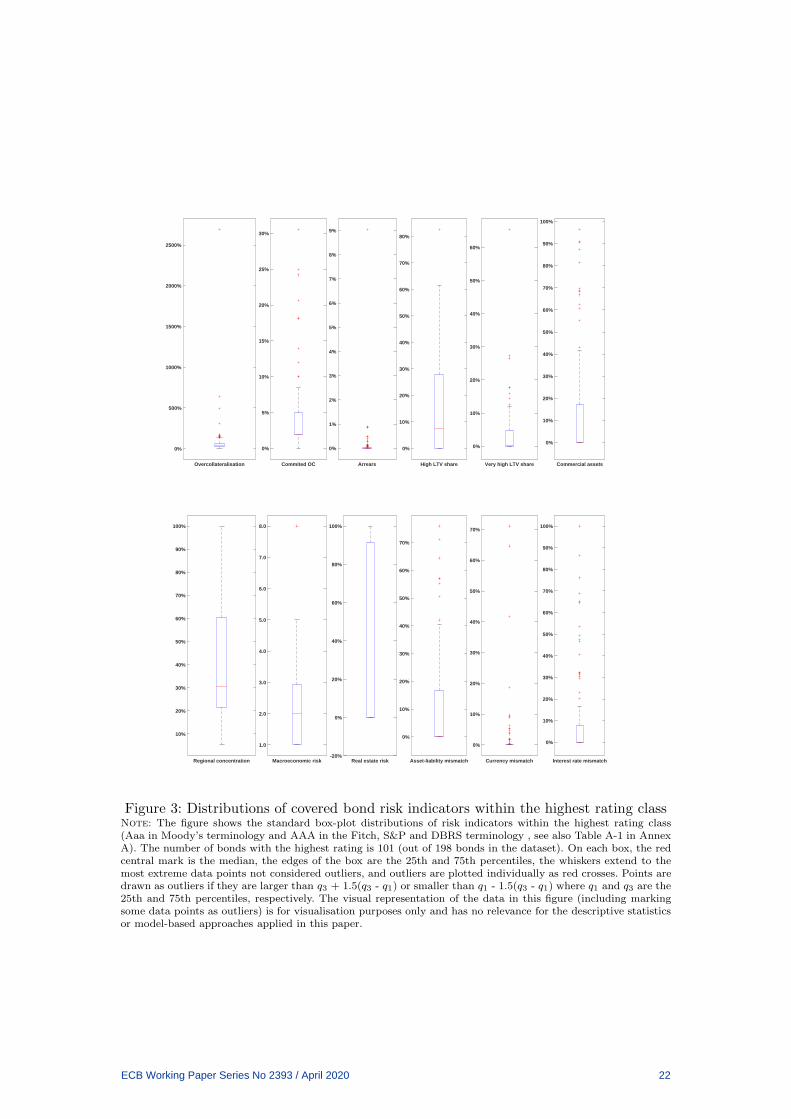
Figure 3: Distributions of covered bond risk indicators within the highest rating classNote: The figure shows the standard box-plot distributions of risk indicators within the highest rating class(Aaa in Moody’s terminology and AAA in the Fitch, S&P and DBRS terminology , see also Table A-1 in AnnexA). The number of bonds with the highest rating is 101 (out of 198 bonds in the dataset). On each box, the redcentral mark is the median, the edges of the box are the 25th and 75th percentiles, the whiskers extend to themost extreme data points not considered outliers, and outliers are plotted individually as red crosses. Points aredrawn as outliers if they are larger than q3 + 1.5(q3 - q1) or smaller than q1 - 1.5(q3 - q1) where q1 and q3 are the25th and 75th percentiles, respectively. The visual representation of the data in this figure (including markingsome data points as outliers) is for visualisation purposes only and has no relevance for the descriptive statisticsor model-based approaches applied in this paper.
ECB Working Paper Series No 2393 / April 2020 22

As the first insight, the overview shows that the proposed granular risk indicators extend
the universe of comparable covered bonds to the whole European market (see the column
with the number of observations in Tables 5 and 6, as compared to the partial coverage
of these bonds by specific credit rating agencies). Most indicators are available for 198
bonds, while indicators specific for credit rating agencies cover a much smaller fraction
of the market (see, e.g., the coverage for the indicators specific for the credit rating
agencies).
The cross-country overview of the markets shows also important heterogeneities (see,
e.g., the number of bonds, main asset type and maturity type per country in Tables
5 and 6). For example, some markets are dominated by soft bullet and pass-through
structures (e.g., Italy), while other markets include mainly hard bullet bonds (e.g.,
Germany, Spain and Austria). The markets are also heterogeneous with respect to the
main asset type classes, with some countries having all, residential, commercial and
public sector covered bonds, and other countries rather focused on residential covered
bonds.15
With respect to the credit ratings, the descriptive statistics in Tables 5 and 6 and
Figure 1 show that covered bonds are on average rated 5 notches above the issuer.
If one takes also the leeway into account, i.e. the buffer of the covered bond rating
with respect to the issuer rating (as defined in Table 2), covered bonds are rated on
average 8 notches above the issuer rating, i.e. almost the whole span of the investment
grade class (which is 10 notches). The median uplift including leeway varies somewhat
across countries, being close to or exceeding 8 notches in German, Italian, Austrian and
French covered bond markets. In result, while the issuer rating of the analysed covered
bond universe is rather broadly distributed, with the median rating of 8 (i.e., Baa1
in Moody’s terminology, BBB+ in the Fitch and S&P terminology and BBBhigh in
the DBRS terminology, see Table A-1 in Annex 1), the covered bond rating is highly
concentrated in the highest rating class with 101 out of 198 bonds rated AAA by all
15For this reason, the average values of risk indicators for specific countries need to be interpretedtogether with the information on the distribution of asset types across covered bonds in these countries.
ECB Working Paper Series No 2393 / April 2020 23

agencies which rate the respective bonds (see Tables 5 and 6 and Figure 1).
The very high uplift of ratings that most covered bonds receive as compared to the rating
of the issuer is a significant feature of the market. It enables a variety of relatively weaker-
rated issuers obtain funding at better terms via issuing highly-rated covered bonds. This
may not be surprising, when taking into account the nature of the covered bond as an
instrument with two layers of protection: issuer and the cover pool. Correspondingly, the
high rating of the covered bond often reflects high overcollateralisation available in the
cover pool. At the same time, one needs to keep in mind that the overcollateralisation
ascribed to a covered bond is not equal to the overcollateralisation which is actually
committed to be available in the cover pool in the case of issuer default. In fact, Tables
5 and 6 shows that while the median European covered bond is overcollateralised by 43%,
the committed median overcollateralisation is 5%. These values vary across countries and
across bonds, but the difference is usually very significant. Also Figure 3 shows that even
among the bonds with the AAA rating the actually committed overcollateralisation is
much lower than the distribution of nominal overcollateralisation. In fact, for most AAA-
rated bonds committed overcollateralisation is below 5% of the bond value, with median
being 2%. This shows how important it is to be able to analyse further characteristics of
the covered bond, going beyond the credit rating and the overcollateralisation towards
more granular information on the cover pool and cash flow mismatches.
Turning to selected pieces of more granular information on covered bond risk charac-
teristics, the data shows a number of interesting stylised facts. In particular, Figure 3
presents an overview of selected granular risk indicators within the highest rating class,
encompassing 101 out of 198 bonds in the dataset, showing how much additional valu-
able information on particular aspects of vulnerabilities is provided by granular covered
bond risk indicators beyond the sole credit rating.
The risk indicators show that some market segments are characterised by non-negligible
shares of relatively risky assets in the cover pool. For example, the indicator of assets
in arrears shows that, while most covered bonds indicate no arrears in the pool (e.g.,
ECB Working Paper Series No 2393 / April 2020 24

median for the whole sample is 0%), there is quite a number of issues with relatively high
shares of arrears in the pool (see Figures 1-2 and Figure 3 for an overview within the
highest rating class). For example, the Spanish covered bond market is characterised
by the median of 7% of cover pool assets in arrears. Figure 1 shows also that there
are instances of covered bonds with a pool in arrears of above 5% or even 10%. Even
among the covered bonds with the highest rating, some bonds have a significant share
of past-due loans in the asset pool. This is particularly interesting in view of the fact
that issuers can (and usually do) reshuffle the cover pool to maintain the best quality
loans and thus obtain the highest rating.
Further risk characteristics are related to the distributions of loan-to-value rations across
loans in the cover pool. The risk indicators show that some covered bonds are based on
pools with a significant share of high-LTV loans. For example, Figure 2 shows that in
some cases, over half of the cover pools are composed of loans having the loan-to-value
ratio of above 80%. In aggregate, such high LTV loans constitute a relatively significant
share in some covered bond markets. For example, a median French covered bond has
around one-fifth of cover pool assets which have high LTV ratios exceeding 80% (labelled
as ”high LTV loans”). As another example, a median Spanish covered bond has around
3% of cover pool assets with LTV ratios of over 100% (labelled as ”very high LTV
loans”). Figure 3 shows that even among the highest-rated covered bonds, there are
many with the significant share of high or very high LTV loans in the cover pool. For
example, for some AAA-rated bonds, over 10% of the cover pool consists of loans with the
loan-to-value of above 100%.
In terms of the concentration of cover pool assets across geographical regions (meaning
units smaller than countries), usually cover pools are diversified somewhat. However,
there are many instances of bonds, even those with the highest rating, with highly
concentrated cover pools (see Tables 5 and 6 and Figures 1 - 3). For example, some
bonds have cover pools fully or almost fully concentrated in only one region, which may
increase correlation among assets in the pool and thus the vulnerability to idiosyncratic
shocks.
ECB Working Paper Series No 2393 / April 2020 25

With respect to risk characteristics related to the mismatches between cash flow
promised by the covered bond and the cash flows generated by the cove pool, we can
focus on mismatches in terms of maturity, interest rate fixation and the currency. As in
the case of other characteristics of the cover pool, the mismatches become relevant in
the case of an issuer default. They can thus provide additional information on the vul-
nerabilities embedded in a covered bond, which can be compared across the whole asset
class. Tables 5 and 6 shows that for the European covered bonds, on average 20% of
the promised cash flows over a 5-year period are not covered by the corresponding cover
pool cash flows. In some cases, the asset-liability mismatch reaches very high levels close
to the full face value of the covered bond, even for the bonds rated AAA (see Figures 2
and 3). Moreover, a number of covered bonds is characterised by significant interest rate
or currency mismatches (see Tables 5 and 6 and Figures 2 and 3).16 For example, some
AAA-rated covered bonds promise cash flows in a currency different than over half of
the cash flows generated by the corresponding cover pools. Finally, a significant number
of bonds have built-in options allowing the extension of the repayment period (so-called
soft bullet or pass-through structures), which may further delay the repayment flows in
the case of an issuer default (see Tables 5 and 6).
Overall, the data shows a significant heterogeneity of covered bond programmes with
respect to various dimensions of their risk characteristics, including, e.g., the cover pool
risks and mismatches between the covered bond and cover pool cash flows. At the
same time, due to the nature of the covered bond as a financial product with double
protection, as well as reflecting substantial overcollateralization of the cover pool beyond
the covered bond value, the credit ratings of these instruments tend to be relatively high,
with 101 out of 198 bonds rated AAA. Consequently, some particular aspects of risk-
related information available from the proposed granular indicators, which could be of
interest from the perspective of particular investor’s risk preferences, may provide useful
16Please note here that the detailed information on currency and interest rate swap values and thecredit quality of swap counterparties is not available for a majority of the data. Figure C-1 in AnnexC illustrates that the effect of hedging on the currency and interest rate mismatches may be relativelylimited, as based on the data from one credit rating agency where the information on the currency andinterest rate exposures before and after swap is provided.
ECB Working Paper Series No 2393 / April 2020 26

information and enable a better risk monitoring and comparability within the European
covered bond market.
3.3 Illustration of application
As a stylised example of an application of risk indicators for monitoring purposes, we
present how the data allows for a comparison of bonds with respect to a set of risk
indicators. The indicators used here need to be treated as an example of an informa-
tion set which could be relevant for investors or other market participants. The exact
definition, selection and weighting of indicators need to be chosen from the perspective
of individual market participant’s preferences. For example, some participants could be
interested in analysing only covered bond credit ratings and, additionally, concentration
risks, while others could see also, e.g., cash flow mismatch aspects as relevant from their
perspective. Here, we show a stylised example using all risk indicators, without any
additional restrictions on their relevance.17
As an example, we choose to compare two residential mortgage covered bonds from the
same country, both rated AAA, with respect to the proposed granular risk indicators,
as described earlier in this section. Beyond the value of the indicator, we also include
a measure to account for a relative position of the bond within the distribution of its
rating class. To this end, we compute a simple rank, Rb,v for bond b and risk indicator
v, defined as:
Rb,v = (
∑Jvj=1 I(vj < vb) + tb,v
Jv) ∗ 100%, (7)
where I is the indicator function, j is the index of all bond observations for a given
risk indicator, Jv denotes the number of observations for a given risk indicator. The
variable t is set to one for the instances where there are several (n) bonds with the
same observation at the value vb, i.e., tb,v = 1 if∑
n I(vn = vb) > 0. This ensures
17We use here only the granular indicators proposed in this paper, as they are comparable across thewhole covered bond universe. The indicators specific for credit rating agencies are only covering partsof the market.
ECB Working Paper Series No 2393 / April 2020 27

that the n bonds with the same risk indicator value (vb) have the same rank among
themselves, which is only one step higher than that of the bond with the next lower
indicator value. The relative rank gives only information about the positioning of the
bond within a distribution of a given risk indicator, but does not say anything about
the absolute value of an indicator.18 Therefore, both pieces of information should be
taken into account, when assessing characteristics of a given covered bond programme,
as based on a given indicator.
An example comparing two bonds with respect to several indicators is illustrated in
Table 7, as well as in Figure 4, which also puts the indicator values into the perspective
of distributions within the highest rating class. The example illustrates how different
two bonds can be with respect to various risk characteristics. For example, one bond
has 40% of cover pool assets with loan-to-value ratios exceeding 80%, as well as high
asset-liability and interest rate mismatches. The other bond has a relatively low issuer
rating, as well as high concentration of asset exposures to one geographical region, as
well as to the commercial real estate sector. As a broader outlook, market participants
could also use such risk indicators to build a more complex risk assessment frameworks,
suited to their individual preferences, and thus complementing the assessment provided
by the credit rating agencies. Still, even single risk indicators may offer useful signals
from the market participant perspective.
18A related methodology is also applied in other economic contexts, e.g., systemic risk monitoring ofeconomic and financial vulnerabilities. For some examples, see Bengtsson, Grothe, and Lepers (2020) andthe references therein. The rank for overcollateralization indicators is adjusted by 1 - Rb,v to result inhigher values for less-overcollateralised bonds. For a more detailed overview of indicator ranks, see also thecorrelation matrix in Table B-4 in Annex B.
ECB Working Paper Series No 2393 / April 2020 28

Risk indicators Indicatorvalue
Indicatorvalue:
difference to median
Relative rank Indicatorvalue
Indicatorvalue:
difference to median
Relative rank
Issuer riskIssuer rating 6 0 43% 9 3 96%OvercollateralisationOvercollateralisation 40% 0% 50% 38% -2% 53%Committed overcollateralisation 0% -2% 99% 0% -2% 99%Cover pool risk Arrears 0% 0% 1% 0% 0% 1%High LTV assets 40% 33% 91% 13% 6% 55%Commercial assets 6% 6% 71% 43% 43% 88%Regional concentration 28% -3% 43% 52% 21% 71%Macroeconomic risk of assets 2 0 49% 2 0 49%Real estate risk 94% 94% 76% 57% 57% 67%Cash flow mismatchAsset-liability mismatch 76% 76% 100% 10% 10% 73%Currency mismatch 0% 0% 1% 1% 1% 82%Interest rate mismatch 86% 86% 99% 69% 69% 97%Maturity type
Bond 1 Bond 2
hard bullet hard bullet
Table 7: Example of risk comparison of two covered bond programmes rated AAANote: The table shows a stylised comparison of two examples of covered bond programmes within the distribu-tions of risk indicators within the highest rating class (Aaa in Moody’s terminology and AAA in the Fitch, S&Pand DBRS terminology , see also Table A-1 in Annex A). The selected programmes have the same main assettype (residential) and the issuers are based in the same country (Austria). The first column presents the indicatorvalue, the second column presents the absolute deviation of the indicator value from the median, and the thirdcolumn presents the relative rank of the indicator, Rb,v, as defined in Section 3. The choice of indicators is forillustrative purposes only, not restriced by any specific criteria. Indicator categories, as discussed in Section 2,marked in grey rows.
ECB Working Paper Series No 2393 / April 2020 29

Issuer rating
1
2
3
4
5
6
7
8
9
10
Value = 6
Rank = 43%
Value = 9
Rank = 96%
Overcollateralisation
0%
500%
1000%
1500%
2000%
2500%
Value = 40%
Rank = 50%
Value = 38%
Rank = 53%
CommittedOC
0%
5%
10%
15%
20%
25%
30%
Value = 0%
Rank = 99%
Value = 0%
Rank = 99%
Arrears
0%
1%
2%
3%
4%
5%
6%
7%
8%
9%
Value = 0%Rank = 1%
Value = 0%Rank = 1%
High LTV share
0%
10%
20%
30%
40%
50%
60%
70%
80%
Value = 40%
Rank = 91%
Value = 13%
Rank = 55%
Commercial assets
0%
10%
20%
30%
40%
50%
60%
70%
80%
90%
100%
Value = 6%
Rank = 71%
Value = 43%
Rank = 88%
Regional concentration
10%
20%
30%
40%
50%
60%
70%
80%
90%
100%
Value = 28%
Rank = 43%
Value = 52%
Rank = 71%
Macroeconomic risk
1.0
2.0
3.0
4.0
5.0
6.0
7.0
8.0
Value = 2Rank = 49%
Value = 2Rank = 49%
Real estate risk-20%
0%
20%
40%
60%
80%
100%Value = 94%
Rank = 76%
Value = 57%
Rank = 67%
Asset-liability mismatch
0%
10%
20%
30%
40%
50%
60%
70%
Value = 76%
Rank = 100%
Value = 10%
Rank = 73%
Currency mismatch
0%
10%
20%
30%
40%
50%
60%
70%
Value = 0%Rank = 1%
Value = 1%Rank = 82%
Interest rate mismatch
0%
10%
20%
30%
40%
50%
60%
70%
80%
90%
100%
Value = 86%
Rank = 99%
Value = 69%
Rank = 97%
Figure 4: Example of risk comparison of two covered bond programmes rated AAANote: The figure shows a comparison of two examples of covered bond programmes within the standard box-plot distributions of risk indicators within the highest rating class (Aaa in Moody’s terminology and AAA in theFitch, S&P and DBRS terminology, see also Table A-1 in Annex A).The selected programmes have the samemain asset type (residential) and the issuers are based in the same country (Austria). The labels refer to thevalue of the indicator and the relative rank of the indicator, Rb,v, as defined in Section 3. The number of bondswith the highest rating is 101 (out of 198 bonds in the dataset). On each box, the red central mark is the median,the edges of the box are the 25th and 75th percentiles, the whiskers extend to the most extreme data points notconsidered outliers, and outliers are plotted individually as red crosses. Points are drawn as outliers if they arelarger than q3 + 1.5(q3 - q1) or smaller than q1 - 1.5(q3 - q1) where q1 and q3 are the 25th and 75th percentiles,respectively. The visual representation of the data in this figure (including marking some data points as outliers)is for visualisation purposes only and has no relevance for the descriptive statistics or model-based approachesapplied in this paper.
ECB Working Paper Series No 2393 / April 2020 30

4 Model-based robustness checks
This section explores further to which extent the information content provided by the
granular risk indicators proposed in this paper may be already included in the outcomes
of credit rating agencies’ assessments. The section starts with a unilateral correlation
analysis between credit ratings and granular risk indicators, turning further to a more
systematic regression approach as well as the least absolute shrinkage and selection
operator algorithm. Within the set of granular risk indicators, the results of this section
highlight those which are most correlated with the credit ratings and are thus least likely
to provide new information content. These are in particular the issuer rating, nominal
overcollateralisation and the macroeconomic risk relevant for the cover pool.
4.1 Correlation analysis
Credit rating agencies document their methodologies for the covered bond ratings, re-
viewing relevant aspects of the cover bond risks and employing models based on de-
tailed loan-level information (see, e.g., Moody’s (2016), FitchRatings (2016a), Standard
& Poor’s (2015 and 2014), and DBRS (2017a)). For the loan-level data, a detailed
credit and liquidity analysis can be conducted, the outcome of which is summarised
in the credit rating. Market participants, however, do not have the access to loan-level
data, but the transparency data offers a possibility to analyse some risk characteristics,
for example using the risk indicators proposed in this paper. From market participants’
perspective, the question thus arises to which extent the granular risk indicators are cor-
related with the credit ratings, and are thus relatively less likely to carry information
beyond them.
To gain the first impression of relations between covered bond risk indicators and the
credit ratings ascribed to the covered bonds by the credit rating agencies, Figures 5 and
6 show simple one-variable dependencies of the following form:
CRi = α+ β ∗RIi + εi, (8)
ECB Working Paper Series No 2393 / April 2020 31

0 2 4 6 8 10 12 14 16 18
Issuer rating
0
2
4
6
8
10
12
14
16
18
Rat
ing
0% 100% 200% 300% 400% 500% 600% 700%
Overcollateralisation (%)
0
2
4
6
8
10
12
14
16
18
Rat
ing
0% 20% 40% 60% 80% 100%
Commercial assets (% cover pool)
0
2
4
6
8
10
12
14
16
18
Rat
ing
0% 5% 10% 15% 20%
Arrears (% pool assets)
0
2
4
6
8
10
12
14
16
18
Rat
ing
0% 10% 20% 30% 40% 50% 60% 70%
High LTV assets (% cover pool)
0
2
4
6
8
10
12
14
16
18
Rat
ing
0% 5% 10% 15% 20% 25% 30%
Very high LTV assets (LTV>100) (% cover pool)
0
2
4
6
8
10
12
14
16
18
Rat
ing
Figure 5: Indicator relations with the covered bond rating (1/2)Note: The figures show the relationship between risk indicators, as defined in this section, (x-axes) and coveredbond ratings (y-axes). Blue lines denote the regression lines resulting from simple univariate regressions of ratingson given risk indicator values.
ECB Working Paper Series No 2393 / April 2020 32

0% 20% 40% 60% 80% 100%
Regional concentration (% cover pool)
0
2
4
6
8
10
12
14
16
18
Rat
ing
0 2 4 6 8 10 12 14 16 18
Average country rating of cover pool assets (notches)
0
2
4
6
8
10
12
14
16
18
Rat
ing
0% 20% 40% 60% 80% 100%
Asset-liability mismatch (% of covered bond amounts)
0
2
4
6
8
10
12
14
16
18
Rat
ing
0% 10% 20% 30% 40% 50%
Currency mismatch (% of covered bond amounts)
0
2
4
6
8
10
12
14
16
18
Rat
ing
0% 20% 40% 60% 80% 100%
Interest rate mismatch (% of covered bond amounts)
0
2
4
6
8
10
12
14
16
18
Rat
ing
Aus
tria
Bel
gium
Cyp
rus
Den
mar
k
Finl
and
Fran
ce
Ger
man
y
Gre
ece
Irela
nd
Italy
Luxe
mbu
rg
Net
herla
nds
Nor
way
Por
tuga
l
Slo
vaki
a
Spa
in
Sw
eden
Uni
ted
Kin
gdom
Country of issuer
0
2
4
6
8
10
12
14
16
18
Rat
ing
Figure 6: Indicator relations with the covered bond rating (2/2)Note: The figures show the relationship between risk indicators, as defined in this section, (x-axes) and coveredbond ratings (y-axes). Blue lines denote the regression lines resulting from simple univariate regressions of ratingson given risk indicator values. The bottom right chart visualises the relationship between the covered bond ratingsand the issuer’s country.
ECB Working Paper Series No 2393 / April 2020 33

where CRi denotes the credit rating of a given covered bond, RIi denotes the value of
a chosen risk indicator for the bond i, α is the constant, β is the slope coefficient and
εi is the error term.
Figures 5 and 6 illustrate that in particular the issuer rating and the macroeconomic
risk of the cover pool seem to be correlated with the covered bond ratings. Most other
risk indicators seem to be rather weakly correlated with the covered bond ratings. For
example, the share of commercial assets, the share of pool with high LTV values or
regional concentration depict rather flat regression lines in Figures 5 and 6. The scatter
plots also illustrate a large variability of indicators within the credit rating classes, for
example in terms of the high-LTV cover pool assets or the share of assets in arrears. A
similar picture is reflected in the correlation matrix of the variables presented in Tables
B-1 to B-3 in Annex B. Already this overview of simple one-to-one relations with the
covered bond ratings suggests that some risk indicators may have a potential to carry
relevant information, in particular for market participants interested in certain risk
dimensions like, e.g., concentration risk or loan-to-value ratios of cover pool exposures.
4.2 Regression analysis
To analyse in a more systematic way to which extent the variability in the risk indicators
across covered bonds may be already reflected by the variability of credit ratings across
covered bonds, we conduct a series of cross-section regressions for the set of covered
bond programmes in our universe, where risk indicators are independent variables and
credit ratings are dependent variables. This approach allows us to account for interde-
pendencies among various risk indicators, going beyond the results of unilateral checks
in the previous section.
In view of the set of several risk indicators to be analysed for a sample of 198 Euro-
pean covered bonds, we face a common issue of model uncertainty and potential for
a variable selection bias and/or overfitting. For example, 24 risk indicators19 can be
19The example includes variables defined in Section 2, including 3 dummy variables for various ma-turity structures, i.e. hard bullet, soft bullet and pass-through bonds.
ECB Working Paper Series No 2393 / April 2020 34

written to 42504 various models with 5 variables, 10626 models with 4 variables and
2024 models with 3 variables. Even if we introduce variable choice restrictions, e.g., by
taking only one indicator per risk category and taking only one indicator from the pairs
correlated by more than 0.7, we still receive 360 various models with 5 variables, 792
models with 4 variables and 584 models with 3 variables, all of which could be plausible
and economically reasonable.20 Given 198 observations, 4 variables result in 5 model
parameters (this includes the constant), which corresponds to ca. 40 observations per
parameter. With 6 variables, we receive ca. 28 observations per parameter, which is
still probably large enough to avoid overfitting, leaving some buffer for the instances
where values for some bonds and some risk indicators are missing. An example of one
of possible models would be as follows:
CRi = α+
K∑
k=1
βk ∗RIki + εi, (9)
where CRi denotes the credit rating of a given covered bond, RIki denotes the value of
the risk indicator k for the bond i, K is the number of risk indicators chosen for the
regression, α is the constant, βk is the vector of slope coefficients and εi is the error
term.
To overcome the issue of model uncertainty, we choose to analyse a broad set of possible
models to draw conclusions about the information content of our risk indicators beyond
the credit ratings. We analyse all 3- and 4-element combinations of risk indicators from
various risk categories as independent variables, including restrictions on the variable
choice. In particular, we allow the models to include only one variable for overcollater-
alization, maturity type and credit rating agency-specific cover pool risk indicators, as
well as up to two cash flow mismatch variables and up to three cover pool risk variables.
We also exclude the joint use of variable pairs correlated by more than 0.7, which binds
only for the issuer risk and the macroeconomic risk of the pool. These restrictions help
20The fact that there are fewer model combinations with 5 variables than with 4 and 3 variablescan be explained by the number of categories possible to choose from (i.e., 5 in our example, where weadditionally define a subcategory with agency-specific indicators). This constrains the number of choicesfor 5-variable selection considerably.
ECB Working Paper Series No 2393 / April 2020 35

avoid estimating regressions with potential multicollinearity issues as well as with a
smaller number of observations. The single regressions are estimated with OLS, which
seems to be sufficient in view of the restrictions on the number and correlation of vari-
ables chosen in each iteration. Our approach to analyse a wide set of possible models is
broadly similar in spirit to other approaches commonly applied to economic problems
where there is a large set of possible explanatory variables.21
We run this analysis for several versions of dependent variables to ensure the broad
overview of results. We use the credit rating (denoted above CRi) and ratings uplifts,
i.e., the differences of the covered bond rating and the issuer rating, both including
and excluding leeway. Including rating uplifts in our analysis enables us to check the
results also for the case where the strong correlation between the issuer rating and the
covered bond rating is at least partly accounted for (see also Table B-1 in Annex B).
For these regressions, we exclude the issuer rating from the set of explanatory variables.
Also, we adjust the covered bond rating by the information on leeway, i.e. the buffer
of the covered bond rating with respect to the issuer rating (as defined in Tables 2 -
4). Adding leeway to the rating allows us to account for potentially important piece of
information on the actual number of notches by which the issuer can be downgraded
before the covered bond gets downgraded. It results also in a more granular rating scale,
in particular for the AAA-rated bonds.
To generate an informative overview of results, we summarise the explanatory power of
each of our risk indicators across regressions. For each risk indicator and within top 25%
regressions with the highest R2, we analyse the share of regressions where the indicator is
significant, as well as the median p-value and median coefficient of significant estimates.
The results for all regressions are qualitatively similar and are available upon request.
Tables 8-11 show the results for the covered bond rating, as well as for the covered
bond rating uplift as dependent variables, respectively. Overall, the results show that
key indicator correlated with the covered bond ratings includes the issuer credit rating.
21For example, broadly related techniques have been applied in the context of the euro area stresstests (see, e.g., Gross, Georgescu, and Hilberg (2017) and Henry and Kok (2013, Box 1 by M. Gross),as well as Gross and Poblacion (2017 and 2015)).
ECB Working Paper Series No 2393 / April 2020 36

Also, the macroeconomic risk of the cover pool assets seems to be relatively highly
correlated with the covered bond credit ratings, also when entering into regressions
along other variables. High significance in a large number of regressor combinations
can be also observed for the variables which are specific to credit rating agencies, i.e.
the timely payment indicator of Moody’s, the payment continuity uplift of Fitch, the
target credit enhancement of S&P and, to a somewhat lower extent due to the number
of observations, the cover pool credit assessment of DBRS (see also Tables 2 - 4 for
definitions). Further risk indicators that are in some cases correlated with the credit
ratings refer to the overcollateralisation.
The regressions results show also that some variables seem to be less correlated with
the credit ratings. For example, some features related to the cover pool risks like the
share of high LTV loans and arrears in the pool, as well as the share of commercial
assets and regional concentration seem to be only weekly correlated with the overall
covered bond rating uplifts (and ratings) in a systematic way (see Tables 8-11). Also
most variables related to cash flow mismatches, like the asset-liability mismatch, as well
as currency and interest rate mismatches seem to be not significant for explaining the
credit rating variation. This result is in line with the findings of Section 3 showing how
these variables vary within the same rating class, as well as the one-to-one correlations
described earlier in this section.
We check the robustness of these findings for other specifications, repeating the exercise
for 5-variable and 6-variable combinations. For completeness, we also present the results,
including asset-type and country-related variables. The results are qualitatively similar
(see Tables 8-11 and Tables in Annex D and Annex E).22
22As further robustness checks, we also repeated the analysis for the data subset encompassing infor-mation from only one credit rating agency with the largest number of covered bond programmes rated(i.e., Moody’s, see also Table 1), and the results are qualitatively the same.
ECB Working Paper Series No 2393 / April 2020 37

Risk indicators% reg's where
indicatorsignificant
median p-value
mediancoeff. if
significant
number of regressions
% reg's where indicator
significant
median p-value
mediancoeff. if
significant
number of regressions
Issuer riskIssuer rating 100% 0.00 0.93 1116 100% 0.00 0.94 211OvercollateralisationOvercollateralisation 15% 0.50 0.01 232 6% 0.50 0.02 32Committed Overcollateralisation 22% 0.31 0.07 241 49% 0.17 0.07 43Cover pool risk Arrears 84% 0.08 0.17 316 83% 0.09 0.17 60High LTV assets 55% 0.24 -0.08 272 61% 0.22 -0.05 38Very high LTV assets 11% 0.45 0.05 236 9% 0.45 0.05 33Commercial assets 21% 0.48 0.08 236 18% 0.49 0.06 33Regional concentration 11% 0.56 0.01 225 6% 0.67 0.01 33Macroeconomic risk of assets 99% 0.01 0.60 153 100% 0.00 0.69 110Real estate risk 31% 0.31 -0.02 244 29% 0.30 -0.02 34Collateral score (Moody's) 9% 0.51 0.04 116 3% 0.59 0.04 32Cover pool losses (Moody's) 99% 0.00 0.05 117 50% 0.39 0.05 32Timely payment indicator (Moody's) 98% 0.00 1.08 118 69% 0.07 0.90 32Payment continuity uplift (Fitch) 100% 0.00 -0.85 308 100% 0.00 -0.92 65Cover pool credit assessment (DBRS) 0% 0.59 0.00 66 0% 0.77 0.00 17Target credit enhancement (S&P) 64% 0.12 0.06 365 92% 0.03 0.07 63Cash flow mismatchAsset-liability mismatch (3 years) 29% 0.36 0.05 290 52% 0.22 0.05 60Asset-liability mismatch (5 years) 74% 0.14 0.04 341 87% 0.06 0.04 63Currency mismatch 12% 0.42 -1.56 239 9% 0.35 0.04 34Interest rate mismatch 76% 0.12 0.02 251 70% 0.20 0.02 37Maturity mismatch 25% 0.37 0.09 231 24% 0.35 0.09 34Maturity typeHard bullet 44% 0.38 0.98 212 44% 0.38 1.06 32Soft bullet 66% 0.15 0.81 188 57% 0.19 0.74 30Pass-through 85% 0.05 -0.70 259 79% 0.11 0.15 42
Rating incl. leeway4-var 3-var
Table 8: Results for covered bond rating (1/2)Note: The table shows the results across regressions with all 4- and 3-variable combinations of risk indicators asindependent variables for covered bond rating and covered bond rating including leeway as dependent variables.The results are computed for 25% regressions with the highest goodness of fit (measured by adjusted R2). Riskindicators as defined in Section 2.
ECB Working Paper Series No 2393 / April 2020 38

Risk indicators% reg's where
indicatorsignificant
median p-value
mediancoeff. if
significant
number of regressions
% reg's where indicator
significant
median p-value
mediancoeff. if
significant
number of regressions
Issuer riskIssuer rating 100% 0.00 0.64 1144 100% 0.00 0.65 211OvercollateralisationOvercollateralisation 20% 0.40 0.00 219 15% 0.39 0.00 39Committed Overcollateralisation 37% 0.26 -0.05 270 45% 0.19 -0.05 38Cover pool risk Arrears 22% 0.35 -0.01 268 17% 0.29 -0.04 42High LTV assets 8% 0.54 0.00 239 3% 0.54 0.02 40Very high LTV assets 6% 0.58 -0.03 253 3% 0.57 -0.05 40Commercial assets 38% 0.20 -0.01 226 20% 0.33 -0.01 40Regional concentration 4% 0.48 -0.01 226 0% 0.58 0.00 40Macroeconomic risk of assets 100% 0.00 0.66 435 99% 0.00 0.65 181Real estate risk 23% 0.29 -0.01 218 12% 0.46 -0.02 41Collateral score (Moody's) 100% 0.00 0.09 167 100% 0.00 0.08 32Cover pool losses (Moody's) 95% 0.02 0.04 124 50% 0.27 0.04 32Timely payment indicator (Moody's) 94% 0.02 0.44 140 84% 0.05 0.20 32Payment continuity uplift (Fitch) 48% 0.24 -0.14 217 50% 0.22 -0.13 34Cover pool credit assessment (DBRS) 21% 0.20 0.14 68 73% 0.08 0.17 15Target credit enhancement (S&P) 94% 0.02 0.03 134 100% 0.00 0.04 23Cash flow mismatchAsset-liability mismatch (3 years) 91% 0.04 0.03 322 95% 0.02 0.03 42Asset-liability mismatch (5 years) 84% 0.06 0.02 302 93% 0.03 0.02 46Currency mismatch 29% 0.46 0.07 267 49% 0.33 0.05 43Interest rate mismatch 34% 0.48 -0.01 244 50% 0.41 -0.01 40Maturity mismatch 2% 0.49 0.07 248 0% 0.49 0.00 40Maturity typeHard bullet 67% 0.15 -0.19 189 51% 0.22 -0.23 37Soft bullet 81% 0.11 0.04 225 86% 0.06 -0.09 36Pass-through 42% 0.21 0.39 227 50% 0.13 1.01 36
Rating4-var 3-var
Table 9: Results for covered bond rating (2/2)Note: The table shows the results across regressions with all 4- and 3-variable combinations of risk indicators asindependent variables for covered bond rating and covered bond rating including leeway as dependent variables.The results are computed for 25% regressions with the highest goodness of fit (measured by adjusted R2). Riskindicators as defined in Section 2.
ECB Working Paper Series No 2393 / April 2020 39

Risk indicators% reg's where
indicatorsignificant
median p-value
mediancoeff. if
significant
number of regressions
% reg's where indicator
significant
median p-value
mediancoeff. if
significant
number of regressions
Issuer riskIssuer ratingOvercollateralisationOvercollateralisation 2% 0.57 0.01 253 12% 0.51 0.01 42Committed Overcollateralisation 74% 0.12 0.05 278 86% 0.07 0.05 50Cover pool risk Arrears 15% 0.30 -0.11 276 9% 0.27 -0.11 46High LTV assets 5% 0.41 0.03 258 2% 0.40 0.02 44Very high LTV assets 0% 0.59 0.00 259 0% 0.59 0.00 39Commercial assets 0% 0.77 0.00 252 0% 0.81 0.00 37Regional concentration 34% 0.24 0.01 255 36% 0.21 0.01 42Macroeconomic risk of assets 14% 0.45 -0.10 226 27% 0.33 -0.21 48Real estate risk 44% 0.40 0.01 241 41% 0.42 0.01 39Collateral score (Moody's) 0% 0.54 0.00 3 0% 0.13 0.00 1Cover pool losses (Moody's) 50% 0.14 -0.03 2 80% 0.19 -0.04 5Timely payment indicator (Moody's) 100% 0.00 -1.06 693 100% 0.00 -1.06 148Payment continuity uplift (Fitch) 100% 0.00 0.82 693 100% 0.00 0.81 148Cover pool credit assessment (DBRS) 0% 0.43 0.00 82 0% 0.47 0.00 15Target credit enhancement (S&P) 58% 0.16 -0.05 120 79% 0.09 -0.06 76Cash flow mismatchAsset-liability mismatch (3 years) 0% 0.66 0.00 276 0% 0.67 0.00 45Asset-liability mismatch (5 years) 1% 0.61 0.00 276 2% 0.56 -0.01 47Currency mismatch 9% 0.59 1.01 288 24% 0.47 0.28 46Interest rate mismatch 11% 0.52 -0.04 298 26% 0.39 -0.03 50Maturity mismatch 2% 0.40 0.08 269 11% 0.40 0.04 45Maturity typeHard bullet 8% 0.71 -3.92 224 11% 0.63 -2.03 38Soft bullet 0% 0.52 0.00 208 5% 0.47 -1.32 37Pass-through 56% 0.16 3.07 360 65% 0.10 3.29 68
Rating uplift incl. leeway4-var 3-var
Table 10: Results for covered bond rating uplift vs. issuer (1/2)Note: The table shows the results across regressions with all 4- and 3-variable combinations of risk indicators asindependent variables for covered bond rating uplift vs. issuer rating and covered bond rating uplift including leewayas dependent variables. The results are computed for 25% regressions with the highest goodness of fit (measured byadjusted R2). Risk indicators as defined in Section 2.
ECB Working Paper Series No 2393 / April 2020 40

Risk indicators% reg's where
indicatorsignificant
median p-value
mediancoeff. if
significant
number of regressions
% reg's where indicator
significant
median p-value
mediancoeff. if
significant
number of regressions
Issuer riskIssuer ratingOvercollateralisationOvercollateralisation 22% 0.37 0.00 232 14% 0.37 0.00 37Committed Overcollateralisation 32% 0.26 0.10 302 44% 0.17 0.08 63Cover pool risk Arrears 13% 0.34 -0.05 256 20% 0.30 0.05 50High LTV assets 21% 0.43 -0.08 268 19% 0.36 -0.08 47Very high LTV assets 15% 0.51 -0.03 262 15% 0.53 -0.07 41Commercial assets 37% 0.22 0.00 251 29% 0.22 0.00 42Regional concentration 6% 0.50 -0.02 265 2% 0.48 -0.06 43Macroeconomic risk of assets 31% 0.29 0.25 77 41% 0.37 0.17 29Real estate risk 22% 0.28 0.01 201 16% 0.25 0.00 38Collateral score (Moody's) 100% 0.00 -0.09 116 100% 0.00 -0.08 16Cover pool losses (Moody's) 100% 0.01 -0.04 116 100% 0.01 -0.04 16Timely payment indicator (Moody's) 100% 0.00 -0.53 116 100% 0.00 -0.53 16Payment continuity uplift (Fitch) 55% 0.12 0.24 252 81% 0.06 0.30 79Cover pool credit assessment (DBRS) 19% 0.44 -0.18 271 26% 0.40 -0.17 46Target credit enhancement (S&P) 76% 0.07 -0.04 224 61% 0.13 -0.04 49Cash flow mismatchAsset-liability mismatch (3 years) 76% 0.13 -0.02 243 71% 0.12 -0.01 35Asset-liability mismatch (5 years) 70% 0.15 -0.01 248 71% 0.13 0.00 41Currency mismatch 5% 0.60 -1.30 255 2% 0.67 -0.21 41Interest rate mismatch 8% 0.60 -0.01 240 18% 0.43 0.01 49Maturity mismatch 6% 0.48 0.05 249 7% 0.51 0.09 42Maturity typeHard bullet 64% 0.19 0.09 181 65% 0.22 0.19 26Soft bullet 78% 0.12 -1.30 232 76% 0.13 -1.27 34Pass-through 61% 0.14 2.61 338 84% 0.04 2.61 109
Rating uplift4-var 3-var
Table 11: Results for covered bond rating uplift vs. issuer (2/2)Note: The table shows the results across regressions with all 4- and 3-variable combinations of risk indicators asindependent variables for covered bond rating uplift vs. issuer rating and covered bond rating uplift including leewayas dependent variables. The results are computed for 25% regressions with the highest goodness of fit (measured byadjusted R2). Risk indicators as defined in Section 2.
ECB Working Paper Series No 2393 / April 2020 41

4.3 Least absolute shrinkage and selection operator algorithm
As a final robustness check for the usefulness of the granular risk indicators introduced
in this paper, we conduct indicator selection using the least absolute shrinkage and selec-
tion operator, or lasso, algorithm.23 This algorithm allows for selecting a parsimonious
set of variables which are significant, as based on an out-of-sample forecast validation.
In the context of our dataset, we try to explore whether some of the granular risk
indicators have the out-of-sample predictive power for the covered bond credit ratings.
As a result, we can assess the indicators where this predictive power is relatively large,
to be relatively closely related to the already available information content of credit
ratings in the form of the overall rating or the rating uplift, including or excluding the
leeway.
The results of the lasso algorithm are presented in Table 12. This robustness check shows
that the indicators which are most often significant across a set of regressions, i.e. the
issuer rating as well as the macroeconomic risk of the cover pool assets (see the previous
subsection) are also those chosen in the lasso algorithm as most suitable to forecast the
credit ratings in an out-of sample setting. Also agency-specific variables of the cover pool
risk assessment are good out-of-sample predictors of the credit rating. The bottom row
of Table 12 shows that it is in fact possible to build models with only a small subset of
the above mentioned chosen indicators, which forecasts the credit rating with around 1
notch of out-of-sample precision. This suggests that the indicators like the issuer rating,
the macroeconomic risk of the cover pool assets or credit rating agency-specific cover
pool risk assessment are not likely to offer much additional signals beyond the already
available credit rating. At the same time, some specific granular indicators of the cover
pool do not act as good out-of-sample predictors of the credit rating, which together
with the high variability of these indicators within the same rating classes suggests that
they may be a useful complementary granular information for risk monitoring purposes.
23For related literature on the lasso algorithm, see also Tibshirani (1996) and Hastie, Tibshirani, andFriedman (2008).
ECB Working Paper Series No 2393 / April 2020 42

Risk indicators Rating uplift incl. leeway Rating uplift Rating incl.
leeway Rating
Issuer riskIssuer rating + +OvercollateralisationOvercollateralisation + + + +Committed Overcollateralisation +Cover pool risk ArrearsHigh LTV assets + +Very high LTV assetsCommercial assets + +Regional concentration +Macroeconomic risk of assets + + +Real estate risk + +Collateral score (Moody's) + +Cover pool losses (Moody's)Timely payment indicator (Moody's) + + + +Payment continuity uplift (Fitch) + +Cash flow mismatchAsset-liability mismatch (3 years) +Asset-liability mismatch (5 years) +Currency mismatchInterest rate mismatchMaturity mismatch +Maturity typeHard bullet +Soft bulletPass-through +Root mean squared error 1.1 1.4 0.9 1.4
Table 12: Results of lasso regressions for a set of risk indicatorsNote: The table shows the results of indicator selection using least absolute shrinkage and selection operatoralgorithm for risk indicators, defined in Section 2, as independent variables and dependent variables, as specifiedin column headers (covered bond rating and rating uplift, including and excluding leeway). The markers indicatethe set of variables of the most parsimonous model with the minimummean squared error (computed using 10-foldcross-validation). For related literature on the lasso algorithm, see also Tibshirani (1996) and Hastie, Tibshirani,and Friedman (2008). The bottom row presents the root mean squared error of the selected regression, whichcan be interpreted as an average out-of-sample forecast error in notches, as compared to the observed coveredbond rating or covered bond rating uplift.
ECB Working Paper Series No 2393 / April 2020 43

5 Conclusion
Covered bonds constitute an important asset class, both from the perspective of issuers
and investors. In terms of the risk assessment, the analysis of these assets needs to
combine the information on the issuer and the cover pool, to some extent resembling
the assessment conducted for an unsecured bank bond and an asset-backed security,
respectively. This paper analyses indicators that shed some light on the risk profile of
covered bonds.
Based on publicly available transparency data on individual covered bond programmes,
we propose a set of risk indicators comparable across European covered bonds issued
by different issuers and rated by different credit rating agencies. The indicators capture
various aspects of cash flow risks, grouped into the following categories: (a) issuer risk,
(b) overcollateralization, (c) cover pool risk, (d) mismatches between the covered bond
and the cover pool cash flows, and (e) maturity type.
The distributions of risk indicators show the heterogeneity of equally-rated covered
bond programmes with respect to their risk characteristics, e.g., cover pool risks and
mismatches between the covered bond and cover pool cash flows. Due to the nature of
the covered bond as a financial product with double protection, the credit ratings of
these instruments tend to be relatively high (101 out of 198 bonds rated AAA). Conse-
quently, some particular aspects of risk-related information available from the granular
indicators, which could be of interest from the perspective of particular investor’s risk
preferences, may provide useful insights and enable a better risk monitoring and com-
parability within the European covered bond market. These findings are confirmed by
a set of regression-based robustness checks. More generally, the availability of granular
risk indicators comparable for the European covered bond universe adds to the market
transparency in the context of risk monitoring.
ECB Working Paper Series No 2393 / April 2020 44

References
Bank for International Settlements (2005): “The role of ratings in structured
finance: issues and implications,” Committee on the Global Financial System Paper,
January 2005.
(2008): “Ratings in structured finance: what went wrong and what can be done
to address shortcomings?,” Committee on the Global Financial System Paper No 32,
July 2008.
Basel Committee on Banking Supervision (2017): “Prudential treatment of prob-
lem assets - definitions of non-performing exposures and forbearance,” April 2017.
Beirne, J., L. Dalitz, J. Ejsing, M. Grothe, S. Manganelli, F. Monar, B. Sa-
hel, M. Susec, J. Tapking, and T. Vong (2011): “The impact of the Eurosystem’s
Covered Bond Purchase Programme on the primary and secondary markets,” Euro-
pean Central Bank Occasional Paper 122, January 2011.
Bengtsson, E., M. Grothe, and E. Lepers (2020): “Home, safe home: cross-country
monitoring framework for vulnerabilities in the residential real estate sector,” Journal
of Banking and Finance, 112.
Bongaerts, D. (2014): “Alternatives for issuer-paid credit rating agencies,” European
Central Bank Working Paper 1703, August 2014.
Commerzbank (2017): “Soft-Bullet-Gedanken und S&Ps neue Ratingmethodik,”
Pfandbrief Weekly, Commerzbank Research 8 February 2017.
DBRS (2015): “Rating European covered bonds addendum: market value spreads range
(midpoints),” December 2015.
(2017a): “Rating European covered bonds,” December 2017.
Deku, S., A. Kara, and D. Marques-Ibanez (2019): “Do reputable issuers pro-
vide better-quality securitizations?,” European Central Bank Working Paper 2236,
February 2019.
ECB Working Paper Series No 2393 / April 2020 45

European Banking Authority (2016): “EBA report on covered bonds. Recommen-
dations on harmonisation of covered bond frameworks in the EU,” EBA-Op-2016-23,
20 December 2016.
European Central Bank (2009): “Decision of the European Central Bank of
2 July 2009 on the implementation of the covered bond purchase programme,”
ECB/2009/16.
(2011a): “Decision of the European Central Bank of 3 November 2011 on the
implementation of the second covered bond purchase programme,” ECB/2011/17.
(2011b): “Euro area markets for banks’ long-term debt financing instruments:
recent developments, state of integration and implications for monetary policy trans-
mission,” Monthly Bulletin November 2011.
(2014): “Decision of the European Central Bank of 15 October 2014 on the
implementation of the third covered bond purchase programme,” ECB/2014/40.
(2016): “Minimum requirements in the Eurosystem credit assessment frame-
work for new issue and surveillance reports on covered bond programmes,” Annex
IXb in “Guideline 2016/2298 of the ECB of 2 November 2016 amending Guideline
2015/510 on the implementation of the Eurosystem monetary policy framework”,
ECB/2016/31.
(2017a): “Decision 2017/101 of the European Central Bank of 11 January 2017
amending Decision ECB/2014/40 on the implementation of the third covered bond
purchase programme,” ECB/2017/02.
(2017b): “Decision 2017/1360 of the European Central Bank of 18 May 2017
amending Decision ECB/2014/40 on the implementation of the third covered bond
purchase programme,” ECB/2017/14.
European Covered Bond Council (2017): “European covered bond fact book,”
August 2017.
ECB Working Paper Series No 2393 / April 2020 46

European Systemic Risk Board (2016a): “The ESRB issues eight warnings on
medium-term residential real estate vulnerabilities and a Recommendation on closing
real estate data gaps,” Press release 28 November 2016.
(2016b): “Vulnerabilities in the EU residential real estate sector,” November
2016.
FitchRatings (2016a): “Covered bonds rating criteria,” 26 October 2016.
(2016b): “Criteria for the analysis of commercial real estate loans securing
covered bonds,” 17 November 2016.
(2017): “Asset analysis criteria for covered bonds and CDOs of public entities,”
5 January 2017.
(2018): “Acceptance of low OC may lead to complacency in the covered bond
market,” 7 February 2018.
Gross, M., O. M. Georgescu, and B. Hilberg (2017): “Credit risk satellite mod-
els,” Chapter 4 in “STAMPe: Stress-test analytics for macroprudential purposes in
the euro area”, edited by Stephane Dees, Jerome Henry and Reiner Martin, European
Central Bank, February 2017.
Gross, M., and J. Poblacion (2015): “A false sense of security in applying handpicked
equations for stress test purposes,” European Central Bank Working Paper 1845,
September 2015.
(2017): “Implications of model uncertainty for bank stress testing,” Journal of
Financial Services Research, Apr 2017.
Grothe, M. (2013): “Market pricing of credit rating signals,” European Central Bank
Working Paper 1623, December 2013.
Hastie, T., R. Tibshirani, and J. Friedman (2008): “The elements of statistical
learning,” 2nd edition. New York: Springer.
ECB Working Paper Series No 2393 / April 2020 47

Henry, J., and C. Kok (2013): “A macro stress testing framework for assessing sys-
temic risks in the banking sector,” European Central Bank Occasional Paper 152,
October 2013.
Klestinec, M. (2013): “Current and past developments in covered bond markets,”
Narodna banka Slovenska, 10/2013.
Moody’s (2016): “Moody’s approach to rating covered bonds,” 19 December 2016.
(2017): “Rating methodology: banks,” Moody’s Investor Services 26 September
2017.
Nicolaisen, J. (2017): “Covered Bonds and their impact on investors, banks and the
real economy,” Remarks at the European Covered Bond Council Plenary Meeting,
Oslo, 6 April 2017.
Oddenes, L. K., and C. Fasseland (2014): “Liquidity in covered bond markets,”
Norwegian School of Economics, Bergen, Fall 2014.
Packer, F., R. Stever, and C. Upper (2007): “The covered bond market,” BIS
Quarterly Review, September 2007.
Prokopczuk, M., J. B. Siewert, and V. Vonhoff (2013): “Credit risk in covered
bonds,” Journal of Empirical Finance, 21, 102–120.
Standard & Poor’s (2014): “Covered bonds criteria,” 9 December 2014.
(2015): “Covered bond ratings framework: methodology and assumptions,” 30
June 2015.
(2016a): “How we rate and monitor EMEA structured finance transactions,”
RatingsDirect 24 March 2016.
(2016b): “Methodology and assumptions: assessing pools of European residen-
tial loans,” Global Ratings 23 December 2016.
ECB Working Paper Series No 2393 / April 2020 48

(2017): “An inside look at conditional pass-through covered bonds,” 25 May
2017.
Tibshirani, R. (1996): “Regression shrinkage and selection via the lasso,” Journal of
the Royal Statistical Society, 58, 267–288.
Vucetich, A., and A. Watson (2013): “Discovering covered bonds – the market, the
challenges, and the Reserve Bank’s response,” Reserve Bank of New Zealand Bulletin,
Vol. 76, June 2013.
ECB Working Paper Series No 2393 / April 2020 49

Annex A: Rating scale
Rating Moody's Fitch S&P DBRS1 Aaa AAA AAA AAA2 Aa1 AA+ AA+ Aahigh3 Aa2 AA AA AA4 Aa3 AA- AA- Aalow5 A1 A+ A+ Ahigh6 A2 A A A7 A3 A- A- Alow8 Baa1 BBB+ BBB+ BBBhigh9 Baa2 BBB BBB BBB10 Baa3 BBB- BBB- BBBlow11 Ba1 BB+ BB+ BBhigh12 Ba2 BB BB BB13 Ba3 BB- BB- Bblow14 B1 B+ B+ Bhigh15 B2 B B B16 B3 B- B- Blow17 Caa1 CCC+ CCC+ CCC18 Caa2 CCC CCC CC19 Caa3 CCC- CCC- CC20 Ca CC CC C21 C C C C22 DDD D D23 DD24 D
Table A-1: Rating scaleNote: The table shows the rating scales applied by Moody’s, Fitch, S&P and DBRS, along with the correspondingnumber (first column) applied in the analysis. The line in the table marks the split between the investment andnon-investment grades.
ECB Working Paper Series No 2393 / April 2020 50

Annex B: Indicator correlations
Risk indicators 1 2 3 4 5 6 7 8 9 101 Covered bond amounts 1.0 0.9 -0.2 -0.1 -0.2 -0.2 -0.2 -0.1 -0.2 -0.12 Cover pool amounts 0.9 1.0 -0.1 0.0 -0.2 -0.3 -0.1 0.0 0.0 0.1
Covered bond and issuer ratings3 Covered bond rating -0.2 -0.1 1.0 0.8 0.9 -0.3 0.1 0.8 0.1 0.44 Covered bond rating incl. leeway -0.1 0.0 0.8 1.0 0.8 -0.6 0.5 0.7 0.2 0.45 Issuer rating -0.2 -0.2 0.9 0.8 1.0 0.0 0.6 0.8 0.0 0.46 Covered bond uplift vs issuer incl. leeway -0.2 -0.3 -0.3 -0.6 0.0 1.0 0.3 -0.4 -0.1 -0.17 Covered bond uplift vs issuer -0.2 -0.1 0.1 0.5 0.6 0.3 1.0 0.2 0.0 0.28 Country rating -0.1 0.0 0.8 0.7 0.8 -0.4 0.2 1.0 0.2 0.6
Overcollateralisation9 Overcollateralisation -0.2 0.0 0.1 0.2 0.0 -0.1 0.0 0.2 1.0 0.3
10 Committed Overcollateralisation -0.1 0.1 0.4 0.4 0.4 -0.1 0.2 0.6 0.3 1.0Cover pool risk
11 Arrears 0.0 0.0 0.2 0.3 0.2 -0.2 0.2 0.2 0.1 0.212 High LTV assets 0.1 0.1 0.0 -0.2 0.0 0.1 0.0 -0.1 0.0 0.013 Very high LTV assets 0.0 0.0 0.1 0.1 0.1 0.0 0.1 0.0 0.0 0.114 Commercial assets 0.0 0.0 -0.1 0.0 0.0 0.0 0.0 -0.2 0.0 -0.115 Regional concentration -0.3 -0.3 0.0 -0.1 -0.1 0.0 0.0 0.0 0.3 0.016 Macroeconomic risk of assets -0.1 0.0 0.8 0.7 0.7 -0.4 0.1 1.0 0.2 0.517 Real estate risk 0.0 -0.1 -0.3 -0.3 -0.3 0.0 -0.2 -0.3 -0.1 -0.118 Collateral score (Moody's) -0.2 -0.1 0.5 0.2 0.4 -0.1 0.0 0.4 0.4 0.619 Cover pool losses (Moody's) -0.1 0.0 0.3 0.4 0.3 -0.3 0.0 0.5 0.3 0.720 Timely payment indicator (Moody's) 0.0 0.1 0.3 0.5 0.2 -0.7 -0.1 0.6 0.2 0.321 Payment continuity uplift (Fitch) -0.2 -0.3 -0.1 -0.7 0.1 0.9 0.3 -0.2 -0.4 -0.122 Cover pool credit assessment (DBRS) -0.2 -0.4 0.5 0.3 0.3 0.2 0.0 0.3 -0.1 -0.223 Target credit enhancement (S&P) -0.1 0.1 0.6 0.6 0.4 -0.6 0.0 0.5 0.4 0.4
Cash flow mismatch24 Asset-liability mismatch (3 years) -0.2 -0.1 0.5 0.3 0.5 -0.1 0.1 0.4 0.0 0.225 Asset-liability mismatch (5 years) -0.1 -0.1 0.5 0.4 0.5 -0.2 0.2 0.4 -0.1 0.226 Currency mismatch 0.1 0.1 -0.1 0.0 -0.1 -0.1 0.0 -0.2 -0.1 -0.127 Interest rate mismatch -0.1 0.0 0.3 0.3 0.3 -0.3 0.0 0.4 0.2 0.228 Maturity mismatch -0.1 0.0 0.3 0.2 0.3 -0.1 0.2 0.3 0.0 0.2
Maturity type29 Hard bullet 0.0 0.0 -0.2 -0.1 -0.2 0.1 0.0 -0.3 0.2 0.030 Soft bullet -0.1 -0.2 0.1 0.3 0.0 -0.3 -0.1 0.3 -0.1 -0.131 Pass-through -0.1 -0.1 0.5 0.0 0.5 0.3 0.2 0.3 -0.1 0.232 Mixed 0.3 0.2 -0.2 -0.2 -0.2 0.1 -0.1 -0.1 -0.1 0.0
Main collateral asset type33 Residential 0.1 0.2 0.1 0.2 0.2 -0.2 0.1 0.3 0.1 0.234 Commercial -0.1 -0.1 -0.1 -0.1 -0.1 0.0 0.0 -0.2 -0.1 -0.235 Public sector -0.1 -0.2 -0.1 -0.1 -0.2 0.2 0.0 -0.2 -0.1 -0.1
Table B-1: Correlation matrix for risk indicators (1/3)Note: The table shows the correlation matrix for risk indicators, as defined in Section 2.
ECB Working Paper Series No 2393 / April 2020 51

Risk indicators 11 12 13 14 15 16 17 18 19 20 21 22 231 Covered bond amounts 0.0 0.1 0.0 0.0 -0.3 -0.1 0.0 -0.2 -0.1 0.0 -0.2 -0.2 -0.12 Cover pool amounts 0.0 0.1 0.0 0.0 -0.3 0.0 -0.1 -0.1 0.0 0.1 -0.3 -0.4 0.1
Covered bond and issuer ratings3 Covered bond rating 0.2 0.0 0.1 -0.1 0.0 0.8 -0.3 0.5 0.3 0.3 -0.1 0.5 0.64 Covered bond rating incl. leeway 0.3 -0.2 0.1 0.0 -0.1 0.7 -0.3 0.2 0.4 0.5 -0.7 0.3 0.65 Issuer rating 0.2 0.0 0.1 0.0 -0.1 0.7 -0.3 0.4 0.3 0.2 0.1 0.3 0.46 Covered bond uplift vs issuer incl. leeway -0.2 0.1 0.0 0.0 0.0 -0.4 0.0 -0.1 -0.3 -0.7 0.9 0.2 -0.67 Covered bond uplift vs issuer 0.2 0.0 0.1 0.0 0.0 0.1 -0.2 0.0 0.0 -0.1 0.3 0.0 0.08 Country rating 0.2 -0.1 0.0 -0.2 0.0 1.0 -0.3 0.4 0.5 0.6 -0.2 0.3 0.5
Overcollateralisation9 Overcollateralisation 0.1 0.0 0.0 0.0 0.3 0.2 -0.1 0.4 0.3 0.2 -0.4 -0.1 0.4
10 Committed Overcollateralisation 0.2 0.0 0.1 -0.1 0.0 0.5 -0.1 0.6 0.7 0.3 -0.1 -0.2 0.4Cover pool risk
11 Arrears 1.0 0.5 0.5 0.0 0.0 0.1 -0.1 0.1 0.1 0.0 -0.1 -0.4 0.612 High LTV assets 0.5 1.0 0.7 0.0 -0.1 -0.1 0.2 0.0 0.0 0.0 0.3 -0.4 -0.313 Very high LTV assets 0.5 0.7 1.0 0.1 0.0 0.0 0.1 0.1 0.0 0.1 0.1 -0.3 -0.114 Commercial assets 0.0 0.0 0.1 1.0 0.0 -0.1 -0.1 0.2 0.1 -0.2 -0.2 -0.1 0.215 Regional concentration 0.0 -0.1 0.0 0.0 1.0 -0.1 0.0 0.2 0.1 0.1 0.0 -0.1 0.316 Macroeconomic risk of assets 0.1 -0.1 0.0 -0.1 -0.1 1.0 -0.3 0.4 0.5 0.6 -0.2 0.3 0.417 Real estate risk -0.1 0.2 0.1 -0.1 0.0 -0.3 1.0 -0.3 -0.1 0.2 0.4 0.0 -0.318 Collateral score (Moody's) 0.1 0.0 0.1 0.2 0.2 0.4 -0.3 1.0 0.7 0.2 -0.2 -0.1 0.619 Cover pool losses (Moody's) 0.1 0.0 0.0 0.1 0.1 0.5 -0.1 0.7 1.0 0.5 -0.6 0.0 0.520 Timely payment indicator (Moody's) 0.0 0.0 0.1 -0.2 0.1 0.6 0.2 0.2 0.5 1.0 -0.5 0.1 0.521 Payment continuity uplift (Fitch) -0.1 0.3 0.1 -0.2 0.0 -0.2 0.4 -0.2 -0.6 -0.5 1.0 -0.1 -0.922 Cover pool credit assessment (DBRS) -0.4 -0.4 -0.3 -0.1 -0.1 0.3 0.0 -0.1 0.0 0.1 -0.1 1.0 0.023 Target credit enhancement (S&P) 0.6 -0.3 -0.1 0.2 0.3 0.4 -0.3 0.6 0.5 0.5 -0.9 0.0 1.0
Cash flow mismatch24 Asset-liability mismatch (3 years) 0.0 0.1 0.1 -0.1 0.1 0.4 0.0 0.1 0.1 0.1 0.1 0.3 0.125 Asset-liability mismatch (5 years) 0.2 0.2 0.2 -0.2 0.0 0.4 0.1 0.0 0.1 0.3 -0.1 0.3 0.126 Currency mismatch -0.1 0.0 0.0 0.0 -0.1 -0.2 0.0 -0.1 0.0 -0.1 0.1 -0.3 0.227 Interest rate mismatch 0.1 0.0 0.1 0.1 0.0 0.3 -0.1 0.2 0.2 0.2 -0.4 0.2 0.428 Maturity mismatch 0.2 0.2 0.1 -0.1 0.0 0.3 0.2 0.1 0.2 0.3 0.1 -0.1 -0.2
Maturity type29 Hard bullet -0.1 -0.2 0.0 0.3 0.2 -0.3 -0.2 0.2 0.1 -0.3 -0.5 -0.4 0.330 Soft bullet 0.0 0.0 0.0 -0.2 -0.1 0.3 0.1 -0.3 0.0 0.4 0.1 0.3 -0.131 Pass-through 0.1 0.2 0.1 0.0 -0.1 0.3 0.1 0.2 0.0 -0.1 0.5 -0.1 -0.332 Mixed -0.1 0.1 0.0 -0.1 -0.2 -0.1 0.1 -0.1 -0.1 -0.1 0.2 0.2 -0.1
Main collateral asset type33 Residential 0.1 0.3 0.2 -0.3 0.1 0.3 0.4 -0.2 0.0 0.5 0.1 -0.1 -0.134 Commercial 0.0 0.0 0.0 0.9 -0.1 -0.2 -0.1 0.2 0.0 -0.3 0.0 0.0 0.035 Public sector -0.1 -0.4 -0.2 -0.3 0.0 -0.2 -0.3 0.1 0.0 -0.3 0.0 0.0 0.1
Table B-2: Correlation matrix for risk indicators (2/3)Note: The table shows the correlation matrix for risk indicators, as defined in Section 2.
ECB Working Paper Series No 2393 / April 2020 52

Risk indicators 24 25 26 27 28 29 30 31 32 33 34 351 Covered bond amounts -0.2 -0.1 0.1 -0.1 -0.1 0.0 -0.1 -0.1 0.3 0.1 -0.1 -0.12 Cover pool amounts -0.1 -0.1 0.1 0.0 0.0 0.0 -0.2 -0.1 0.2 0.2 -0.1 -0.2
Covered bond and issuer ratings3 Covered bond rating 0.5 0.5 -0.1 0.3 0.3 -0.2 0.1 0.5 -0.2 0.1 -0.1 -0.14 Covered bond rating incl. leeway 0.3 0.4 0.0 0.3 0.2 -0.1 0.3 0.0 -0.2 0.2 -0.1 -0.15 Issuer rating 0.5 0.5 -0.1 0.3 0.3 -0.2 0.0 0.5 -0.2 0.2 -0.1 -0.26 Covered bond uplift vs issuer incl. leeway -0.1 -0.2 -0.1 -0.3 -0.1 0.1 -0.3 0.3 0.1 -0.2 0.0 0.27 Covered bond uplift vs issuer 0.1 0.2 0.0 0.0 0.2 0.0 -0.1 0.2 -0.1 0.1 0.0 0.08 Country rating 0.4 0.4 -0.2 0.4 0.3 -0.3 0.3 0.3 -0.1 0.3 -0.2 -0.2
Overcollateralisation9 Overcollateralisation 0.0 -0.1 -0.1 0.2 0.0 0.2 -0.1 -0.1 -0.1 0.1 -0.1 -0.1
10 Committed Overcollateralisation 0.2 0.2 -0.1 0.2 0.2 0.0 -0.1 0.2 0.0 0.2 -0.2 -0.1Cover pool risk
11 Arrears 0.0 0.2 -0.1 0.1 0.2 -0.1 0.0 0.1 -0.1 0.1 0.0 -0.112 High LTV assets 0.1 0.2 0.0 0.0 0.2 -0.2 0.0 0.2 0.1 0.3 0.0 -0.413 Very high LTV assets 0.1 0.2 0.0 0.1 0.1 0.0 0.0 0.1 0.0 0.2 0.0 -0.214 Commercial assets -0.1 -0.2 0.0 0.1 -0.1 0.3 -0.2 0.0 -0.1 -0.3 0.9 -0.315 Regional concentration 0.1 0.0 -0.1 0.0 0.0 0.2 -0.1 -0.1 -0.2 0.1 -0.1 0.016 Macroeconomic risk of assets 0.4 0.4 -0.2 0.3 0.3 -0.3 0.3 0.3 -0.1 0.3 -0.2 -0.217 Real estate risk 0.0 0.1 0.0 -0.1 0.2 -0.2 0.1 0.1 0.1 0.4 -0.1 -0.318 Collateral score (Moody's) 0.1 0.0 -0.1 0.2 0.1 0.2 -0.3 0.2 -0.1 -0.2 0.2 0.119 Cover pool losses (Moody's) 0.1 0.1 0.0 0.2 0.2 0.1 0.0 0.0 -0.1 0.0 0.0 0.020 Timely payment indicator (Moody's) 0.1 0.3 -0.1 0.2 0.3 -0.3 0.4 -0.1 -0.1 0.5 -0.3 -0.321 Payment continuity uplift (Fitch) 0.1 -0.1 0.1 -0.4 0.1 -0.5 0.1 0.5 0.2 0.1 0.0 0.022 Cover pool credit assessment (DBRS) 0.3 0.3 -0.3 0.2 -0.1 -0.4 0.3 -0.1 0.2 -0.1 0.0 0.023 Target credit enhancement (S&P) 0.1 0.1 0.2 0.4 -0.2 0.3 -0.1 -0.3 -0.1 -0.1 0.0 0.1
Cash flow mismatch24 Asset-liability mismatch (3 years) 1.0 0.8 0.0 0.1 0.4 -0.1 0.1 0.3 -0.1 0.2 -0.2 -0.225 Asset-liability mismatch (5 years) 0.8 1.0 0.0 0.1 0.5 -0.3 0.2 0.3 0.0 0.3 -0.1 -0.326 Currency mismatch 0.0 0.0 1.0 0.0 -0.1 -0.1 0.0 -0.1 0.1 -0.2 0.1 0.127 Interest rate mismatch 0.1 0.1 0.0 1.0 0.1 0.0 0.1 0.1 -0.1 0.1 0.0 -0.228 Maturity mismatch 0.4 0.5 -0.1 0.1 1.0 -0.3 0.2 0.3 0.0 0.3 -0.2 -0.3
Maturity type29 Hard bullet -0.1 -0.3 -0.1 0.0 -0.3 1.0 -0.6 -0.3 -0.5 -0.4 0.1 0.330 Soft bullet 0.1 0.2 0.0 0.1 0.2 -0.6 1.0 -0.1 -0.2 0.3 -0.1 -0.231 Pass-through 0.3 0.3 -0.1 0.1 0.3 -0.3 -0.1 1.0 -0.1 0.2 0.0 -0.232 Mixed -0.1 0.0 0.1 -0.1 0.0 -0.5 -0.2 -0.1 1.0 0.1 0.0 -0.1
Main collateral asset type33 Residential 0.2 0.3 -0.2 0.1 0.3 -0.4 0.3 0.2 0.1 1.0 -0.5 -0.834 Commercial -0.2 -0.1 0.1 0.0 -0.2 0.1 -0.1 0.0 0.0 -0.5 1.0 -0.235 Public sector -0.2 -0.3 0.1 -0.2 -0.3 0.3 -0.2 -0.2 -0.1 -0.8 -0.2 1.0
Table B-3: Correlation matrix for risk indicators (3/3)Note: The table shows the correlation matrix for risk indicators, as defined in Section 2.
ECB Working Paper Series No 2393 / April 2020 53

Risk indicators 1 2 3 4 5 6 7 8 9 10 11 12Issuer risk 1 1,0 -0,2 0,0 0,0 0,0 0,1 0,2 0,0 0,0 0,0 -0,2 0,1OvercollateralisationOvercollateralisation 2 -0,2 1,0 0,0 0,2 0,2 0,0 -0,3 -0,1 0,1 0,2 0,2 0,2Committed Overcollateralisation 3 0,0 0,0 1,0 -0,2 -0,3 0,5 0,1 -0,4 -0,3 -0,4 0,0 0,3Cover pool risk Arrears 4 0,0 0,2 -0,2 1,0 0,3 0,1 -0,1 -0,1 0,3 0,2 0,1 0,0High LTV assets 5 0,0 0,2 -0,3 0,3 1,0 0,2 -0,1 0,0 0,3 0,3 0,0 0,0Commercial assets 6 0,1 0,0 0,5 0,1 0,2 1,0 0,1 -0,2 -0,1 -0,3 -0,1 0,3Regional concentration 7 0,2 -0,3 0,1 -0,1 -0,1 0,1 1,0 0,1 0,0 0,0 -0,3 -0,2Macroeconomic risk of assets 8 0,0 -0,1 -0,4 -0,1 0,0 -0,2 0,1 1,0 0,0 0,2 -0,1 0,0Real estate risk 9 0,0 0,1 -0,3 0,3 0,3 -0,1 0,0 0,0 1,0 0,4 -0,1 0,0Cash flow mismatchAsset-liability mismatch 10 0,0 0,2 -0,4 0,2 0,3 -0,3 0,0 0,2 0,4 1,0 0,1 0,0Currency mismatch 11 -0,2 0,2 0,0 0,1 0,0 -0,1 -0,3 -0,1 -0,1 0,1 1,0 0,1Interest rate mismatch 12 0,1 0,2 0,3 0,0 0,0 0,3 -0,2 0,0 0,0 0,0 0,1 1,0
Table B-4: Correlation matrix for indicator ranksNote: The table shows the correlation matrix for risk indicator ranks within the highest rating class, as definedin Section 3.
ECB Working Paper Series No 2393 / April 2020 54

Annex C: Currency and interest rate hedging
0.0 5.0 10.0 15.0 20.0
Currency mismatch
0
2
4
6
8
10
12
14
16
18
20
Cur
renc
y m
ism
atch
afte
r sw
ap
data145° line
0.0 20.0 40.0 60.0 80.0 100.0
Interest rate mismatch
0
10
20
30
40
50
60
70
80
90
100
Inte
rest
rate
mis
mat
ch a
fter s
wap
data145° line
0.0 20.0 40.0 60.0 80.0 100.0
Fixed interest rate mismatch
0
10
20
30
40
50
60
70
80
90
100
Fixe
d in
tere
st ra
te m
ism
atch
afte
r sw
ap
data145° line
0.0 10.0 20.0 30.0 40.0 50.0 60.0 70.0 80.0 90.0
Floating interest rate mismatch
0
10
20
30
40
50
60
70
80
90
Floa
ting
inte
rest
rate
mis
mat
ch a
fter s
wap
data145° line
Figure C-1: Currency and interest rate mismatches before and after swapsNote: The table shows the currency and interest rate mismatches (also divided by the type of the interest ratemismatch) before (x-axis) and after swaps (y-axis), as based on the data provided by Fitch (overall 58 coveredbond programmes, see also Table 1).
ECB Working Paper Series No 2393 / April 2020 55

Annex D: Robustness check: results for 6- and 5-variablecombinations
Risk indicators% reg's where
indicatorsignificant
median p-value
mediancoeff. if
significant
number of regressions
% reg's where
indicatorsignificant
median p-value
mediancoeff. if
significant
number of regressions
Issuer riskIssuer ratingOvercollateralisationOvercollateralisation 3% 0.54 0.00 1825 1% 0.57 0.00 935Committed Overcollateralisation 56% 0.18 0.05 2152 64% 0.14 0.05 991Cover pool risk Arrears 27% 0.36 -0.11 1921 19% 0.34 -0.10 909High LTV assets 16% 0.36 0.05 1511 8% 0.39 0.03 852Very high LTV assets 0% 0.57 -0.14 1439 0% 0.60 -0.13 835Commercial assets 0% 0.72 0.02 1439 0% 0.75 0.04 831Regional concentration 34% 0.30 0.01 1613 34% 0.25 0.01 858Macroeconomic risk of assets 25% 0.41 -0.08 1002 18% 0.43 -0.07 651Real estate risk 47% 0.33 0.01 1662 46% 0.36 0.01 840Collateral score (Moody's) 0% 0.00 0.00 0 0% 0.00 0.00 0Cover pool losses (Moody's) 0% 0.00 0.00 0 0% 0.00 0.00 0Timely payment indicator (Moody's) 100% 0.00 -1.05 2510 100% 0.00 -1.06 1918Payment continuity uplift (Fitch) 100% 0.00 0.82 3255 100% 0.00 0.82 1957Cover pool credit assessment (DBRS) 2% 0.47 0.23 179 0% 0.47 0.00 65Target credit enhancement (S&P) 21% 0.35 -0.04 343 32% 0.32 -0.04 114Cash flow mismatchAsset-liability mismatch (3 years) 1% 0.63 -0.06 1823 0% 0.66 -0.06 976Asset-liability mismatch (5 years) 6% 0.59 -0.01 1853 2% 0.62 -0.01 999Currency mismatch 3% 0.67 1.54 1924 2% 0.66 2.29 1027Interest rate mismatch 9% 0.62 -0.04 2034 6% 0.60 -0.04 1043Maturity mismatch 3% 0.36 0.04 2162 1% 0.38 0.07 1003Maturity typeHard bullet 8% 0.68 -3.33 1452 5% 0.73 -3.89 777Soft bullet 1% 0.56 -1.23 1433 0% 0.52 -1.16 770Pass-through 37% 0.28 2.32 1821 34% 0.26 2.18 887
Rating uplift incl. leeway6-var 5-var
Table D-1: Detailed results for covered bond rating uplift vs. issuer – 6- and 5-variablecombinations (1/2)Note: The table shows the results across regressions with all 6- and 5-variable combinations of risk indicatorsas independent variables for covered bond rating uplift vs. issuer rating and covered bond rating uplift includingleeway as dependent variables. The results are computed for 25% regressions with the highest goodness of fit(measured by adjusted R2). Risk indicators as defined in Section 2.
ECB Working Paper Series No 2393 / April 2020 56

Risk indicators% reg's where
indicatorsignificant
median p-value
mediancoeff. if
significant
number of regressions
% reg's where
indicatorsignificant
median p-value
mediancoeff. if
significant
number of regressions
Issuer riskIssuer ratingOvercollateralisationOvercollateralisation 25% 0.34 0.00 1651 18% 0.37 0.00 808Committed Overcollateralisation 19% 0.41 -0.01 1603 12% 0.39 0.00 789Cover pool risk Arrears 22% 0.43 -0.05 1592 19% 0.41 -0.06 852High LTV assets 11% 0.47 -0.03 1595 14% 0.48 -0.05 865Very high LTV assets 14% 0.46 0.00 1616 13% 0.49 -0.03 884Commercial assets 37% 0.24 0.00 1779 40% 0.20 0.00 951Regional concentration 12% 0.43 0.00 1560 9% 0.43 0.00 828Macroeconomic risk of assets 13% 0.38 0.41 175 20% 0.43 0.53 82Real estate risk 39% 0.28 0.01 1250 35% 0.26 0.01 711Collateral score (Moody's) 100% 0.00 -0.10 986 100% 0.00 -0.09 476Cover pool losses (Moody's) 100% 0.01 -0.04 310 100% 0.01 -0.04 367Timely payment indicator (Moody's) 100% 0.00 -0.52 798 100% 0.00 -0.53 476Payment continuity uplift (Fitch) 52% 0.17 0.21 1083 65% 0.12 0.20 476Cover pool credit assessment (DBRS) 5% 0.51 -0.17 1493 10% 0.48 -0.17 761Target credit enhancement (S&P) 72% 0.14 -0.03 1155 88% 0.07 -0.03 476Cash flow mismatchAsset-liability mismatch (3 years) 72% 0.12 -0.02 2336 78% 0.10 -0.02 984Asset-liability mismatch (5 years) 57% 0.19 -0.02 1877 69% 0.14 -0.02 975Currency mismatch 2% 0.66 -0.89 1511 1% 0.66 -0.74 801Interest rate mismatch 19% 0.49 -0.02 1545 11% 0.57 -0.02 798Maturity mismatch 10% 0.47 0.03 1751 8% 0.51 0.04 884Maturity typeHard bullet 54% 0.24 0.62 1405 60% 0.20 0.59 674Soft bullet 58% 0.25 -1.41 1496 71% 0.17 -1.24 843Pass-through 52% 0.24 2.51 1491 50% 0.21 2.62 831
Rating uplift6-var 5-var
Table D-2: Detailed results for covered bond rating uplift vs. issuer – 6- and 5-variablecombinations (2/2)Note: The table shows the results across regressions with all 6- and 5-variable combinations of risk indicatorsas independent variables for covered bond rating uplift vs. issuer rating and covered bond rating uplift includingleeway as dependent variables. The results are computed for 25% regressions with the highest goodness of fit(measured by adjusted R2). Risk indicators as defined in Section 2.
ECB Working Paper Series No 2393 / April 2020 57

Risk indicators% reg's where
indicatorsignificant
median p-value
mediancoeff. if
significant
number of regressions
% reg's where indicator
significant
median p-value
mediancoeff. if
significant
number of regressions
Issuer riskIssuer rating 100% 0.00 0.88 5566 100% 0.00 0.91 3205OvercollateralisationOvercollateralisation 12% 0.50 0.00 1622 11% 0.54 0.01 792Committed Overcollateralisation 11% 0.43 0.00 1649 12% 0.42 0.02 807Cover pool risk Arrears 70% 0.17 0.16 1932 81% 0.10 0.16 1191High LTV assets 20% 0.40 -0.08 1484 32% 0.33 -0.06 820Very high LTV assets 1% 0.56 0.17 1411 7% 0.53 0.03 739Commercial assets 17% 0.46 0.00 1445 19% 0.43 0.04 770Regional concentration 23% 0.32 0.00 1503 17% 0.42 0.00 755Macroeconomic risk of assets 92% 0.03 0.53 298 95% 0.02 0.59 428Real estate risk 30% 0.38 -0.01 1434 30% 0.37 -0.01 782Collateral score (Moody's) 14% 0.47 0.05 1007 11% 0.49 0.05 476Cover pool losses (Moody's) 100% 0.00 0.05 1155 100% 0.00 0.05 476Timely payment indicator (Moody's) 100% 0.00 1.08 1155 100% 0.00 1.08 476Payment continuity uplift (Fitch) 100% 0.00 -0.83 1384 100% 0.00 -0.80 850Cover pool credit assessment (DBRS) 20% 0.31 -0.24 95 6% 0.38 -0.22 82Target credit enhancement (S&P) 34% 0.29 0.05 1423 49% 0.21 0.06 917Cash flow mismatchAsset-liability mismatch (3 years) 17% 0.53 0.03 1826 20% 0.46 0.03 895Asset-liability mismatch (5 years) 34% 0.35 0.03 1966 57% 0.23 0.03 1076Currency mismatch 10% 0.57 -0.84 1633 12% 0.53 -0.91 817Interest rate mismatch 50% 0.29 0.02 1835 62% 0.19 0.02 907Maturity mismatch 42% 0.27 0.09 1651 28% 0.37 0.09 791Maturity typeHard bullet 57% 0.29 0.32 1370 55% 0.30 0.72 656Soft bullet 44% 0.25 1.35 1285 54% 0.18 0.89 655Pass-through 67% 0.11 -1.95 1593 79% 0.07 -2.13 907
Rating incl. leeway6-var 5-var
Table D-3: Detailed results for covered bond rating – 6- and 5-variable combinations(1/2)Note: The table shows the results across regressions with all 6- and 5-variable combinations of risk indicators asindependent variables for covered bond rating and covered bond rating including leeway as dependent variables.The results are computed for 25% regressions with the highest goodness of fit (measured by adjusted R2). Riskindicators as defined in Section 2.
ECB Working Paper Series No 2393 / April 2020 58

Risk indicators% reg's where
indicatorsignificant
median p-value
mediancoeff. if
significant
number of regressions
% reg's where indicator
significant
median p-value
mediancoeff. if
significant
number of regressions
Issuer riskIssuer rating 99% 0.00 0.58 5523 100% 0.00 0.63 3594OvercollateralisationOvercollateralisation 25% 0.36 0.00 1640 17% 0.40 0.00 810Committed Overcollateralisation 18% 0.39 0.04 1643 14% 0.37 0.01 834Cover pool risk Arrears 26% 0.39 0.05 1630 21% 0.37 0.05 911High LTV assets 7% 0.49 0.00 1497 10% 0.49 0.00 833Very high LTV assets 13% 0.47 -0.04 1570 11% 0.52 -0.04 848Commercial assets 40% 0.20 0.00 1645 47% 0.16 0.00 891Regional concentration 11% 0.37 -0.01 1472 7% 0.43 -0.01 842Macroeconomic risk of assets 100% 0.00 0.71 633 100% 0.00 0.73 397Real estate risk 34% 0.30 -0.01 1449 31% 0.28 -0.01 817Collateral score (Moody's) 100% 0.00 0.10 1010 100% 0.00 0.10 511Cover pool losses (Moody's) 100% 0.01 0.04 302 100% 0.01 0.04 365Timely payment indicator (Moody's) 100% 0.00 0.53 1155 100% 0.00 0.53 476Payment continuity uplift (Fitch) 43% 0.25 -0.12 1695 46% 0.25 -0.12 802Cover pool credit assessment (DBRS) 2% 0.53 0.14 282 7% 0.36 0.14 148Target credit enhancement (S&P) 61% 0.17 0.03 1076 79% 0.09 0.03 399Cash flow mismatchAsset-liability mismatch (3 years) 83% 0.06 0.03 2482 87% 0.05 0.03 979Asset-liability mismatch (5 years) 64% 0.16 0.02 1928 78% 0.10 0.02 1000Currency mismatch 14% 0.60 0.09 1656 11% 0.59 0.09 907Interest rate mismatch 29% 0.38 0.00 1546 20% 0.53 0.00 865Maturity mismatch 10% 0.46 0.07 1667 6% 0.48 0.07 897Maturity typeHard bullet 66% 0.18 -0.19 1413 70% 0.14 -0.26 709Soft bullet 52% 0.27 0.44 1503 72% 0.17 0.43 739Pass-through 25% 0.33 -0.90 1305 26% 0.28 -0.97 696
Rating6-var 5-var
Table D-4: Detailed results for covered bond rating – 6- and 5-variable combinations(2/2)Note: The table shows the results across regressions with all 6- and 5-variable combinations of risk indicators asindependent variables for covered bond rating and covered bond rating including leeway as dependent variables.The results are computed for 25% regressions with the highest goodness of fit (measured by adjusted R2). Riskindicators as defined in Section 2.
ECB Working Paper Series No 2393 / April 2020 59

Annex E: Robustness check: results for specifications in-cluding variables related to the main asset type and the
country of issuer
Risk indicators% reg's where
indicatorsignificant
median p-value
mediancoeff. if
significant
number of regressions
% reg's where indicator
significant
median p-value
mediancoeff. if
significant
number of regressions
Issuer and country riskIssuer ratingCountry rating 22% 0.39 -0.16 426 47% 0.26 -0.20 79OvercollateralisationOvercollateralisation 5% 0.56 0.01 595 13% 0.51 0.01 69Committed Overcollateralisation 76% 0.10 0.05 665 85% 0.09 0.06 86Cover pool risk Arrears 18% 0.28 -0.10 704 12% 0.27 -0.10 74High LTV assets 4% 0.44 0.04 634 1% 0.42 0.02 72Very high LTV assets 0% 0.61 0.15 614 0% 0.63 0.00 66Commercial assets 1% 0.74 -0.04 472 0% 0.74 0.00 60Regional concentration 31% 0.24 0.00 639 31% 0.26 0.00 74Macroeconomic risk of assets 27% 0.37 -0.17 638 43% 0.28 -0.22 91Real estate risk 43% 0.38 0.01 571 43% 0.37 0.00 67Collateral score (Moody's) 1% 0.44 0.05 98 3% 0.66 0.05 37Cover pool losses (Moody's) 41% 0.32 -0.03 133 47% 0.17 -0.04 49Timely payment indicator (Moody's) 100% 0.00 -1.06 2043 100% 0.00 -1.06 302Payment continuity uplift (Fitch) 100% 0.00 0.82 1844 100% 0.00 0.82 281Cover pool credit assessment (DBRS) 0% 0.51 0.00 321 0% 0.48 0.00 39Target credit enhancement (S&P) 66% 0.13 -0.05 577 84% 0.07 -0.06 174Cash flow mismatchAsset-liability mismatch (3 years) 0% 0.65 0.02 624 0% 0.69 0.00 79Asset-liability mismatch (5 years) 6% 0.58 -0.01 666 8% 0.54 -0.02 83Currency mismatch 13% 0.56 0.50 666 27% 0.45 0.13 78Interest rate mismatch 19% 0.46 -0.03 729 27% 0.36 -0.03 84Maturity mismatch 7% 0.41 0.06 654 16% 0.39 -0.01 70Maturity typeHard bullet 7% 0.68 -2.73 526 7% 0.65 -2.03 58Soft bullet 16% 0.41 -1.45 547 26% 0.34 -1.34 76Pass-through 65% 0.12 3.22 1005 76% 0.07 3.43 150Main collateral asset typeResidential 10% 0.43 0.50 510 11% 0.35 -0.29 63Commercial 1% 0.67 -2.72 462 2% 0.64 -2.94 56Public sector 2% 0.49 -0.23 470 0% 0.44 0.00 56Country effectsAustria 36% 0.36 -3.94 330 46% 0.30 -3.90 41Germany 35% 0.30 1.50 615 56% 0.23 1.72 109Italy 32% 0.29 2.97 600 32% 0.29 2.95 71Spain 12% 0.46 -2.46 475 17% 0.45 -1.82 58
Rating uplift incl. leeway4-var 3-var
Table E-1: Results for covered bond rating uplift vs. issuer (1/2)Note: The table shows the results across regressions with all 4- and 3-variable combinations of risk indicatorsas independent variables for covered bond rating uplift vs. issuer rating and covered bond rating uplift includingleeway as dependent variables. The results are computed for 25% regressions with the highest goodness of fit(measured by adjusted R2). Risk indicators as defined in Section 2.
ECB Working Paper Series No 2393 / April 2020 60

Risk indicators% reg's where
indicatorsignificant
median p-value
mediancoeff. if
significant
number of regressions
% reg's where indicator
significant
median p-value
mediancoeff. if
significant
number of regressions
Issuer and country riskIssuer ratingCountry rating 36% 0.33 0.16 237 42% 0.36 0.18 45OvercollateralisationOvercollateralisation 14% 0.37 0.00 565 9% 0.38 0.00 66Committed Overcollateralisation 42% 0.23 0.08 902 50% 0.17 0.07 101Cover pool risk Arrears 15% 0.34 0.02 690 20% 0.32 0.06 82High LTV assets 20% 0.39 -0.07 743 14% 0.35 -0.08 84Very high LTV assets 13% 0.50 -0.01 612 9% 0.59 -0.09 79Commercial assets 31% 0.24 0.01 532 26% 0.24 0.01 68Regional concentration 5% 0.48 -0.01 702 4% 0.46 -0.03 79Macroeconomic risk of assets 39% 0.30 0.17 365 40% 0.36 0.17 52Real estate risk 24% 0.28 0.00 603 24% 0.26 0.00 79Collateral score (Moody's) 92% 0.06 -0.09 258 82% 0.13 -0.08 28Cover pool losses (Moody's) 93% 0.06 -0.04 256 79% 0.17 -0.04 29Timely payment indicator (Moody's) 95% 0.01 -0.53 283 86% 0.03 -0.48 43Payment continuity uplift (Fitch) 77% 0.08 0.30 1006 90% 0.04 0.30 218Cover pool credit assessment (DBRS) 22% 0.39 -0.20 529 25% 0.36 -0.19 80Target credit enhancement (S&P) 61% 0.12 -0.04 653 53% 0.20 -0.04 85Cash flow mismatchAsset-liability mismatch (3 years) 67% 0.16 -0.02 542 47% 0.38 -0.01 72Asset-liability mismatch (5 years) 66% 0.16 -0.01 572 52% 0.23 0.00 87Currency mismatch 4% 0.64 -0.74 627 3% 0.66 -0.21 72Interest rate mismatch 11% 0.47 0.01 700 18% 0.42 0.01 76Maturity mismatch 5% 0.52 0.07 644 14% 0.46 0.08 87Maturity typeHard bullet 49% 0.26 0.24 411 60% 0.25 0.32 42Soft bullet 69% 0.15 -1.26 514 76% 0.13 -1.31 62Pass-through 82% 0.06 2.49 1380 92% 0.02 2.51 297Main collateral asset typeResidential 14% 0.46 -0.56 472 7% 0.43 -0.63 59Commercial 3% 0.62 0.86 413 2% 0.72 0.80 55Public sector 8% 0.48 0.30 439 4% 0.43 0.57 57Country effectsAustria 93% 0.05 1.26 456 96% 0.03 1.25 48Germany 56% 0.19 1.20 464 44% 0.25 0.90 55Italy 32% 0.28 1.56 587 42% 0.21 1.78 95Spain 16% 0.40 -1.54 497 9% 0.35 -1.21 69
Rating uplift4-var 3-var
Table E-2: Results for covered bond rating uplift vs. issuer (2/2)Note: The table shows the results across regressions with all 4- and 3-variable combinations of risk indicatorsas independent variables for covered bond rating uplift vs. issuer rating and covered bond rating uplift includingleeway as dependent variables. The results are computed for 25% regressions with the highest goodness of fit(measured by adjusted R2). Risk indicators as defined in Section 2.
ECB Working Paper Series No 2393 / April 2020 61

Risk indicators% reg's where
indicatorsignificant
median p-value
mediancoeff. if
significant
number of regressions
% reg's where indicator
significant
median p-value
mediancoeff. if
significant
number of regressions
Issuer and country riskIssuer rating 100% 0.00 0.93 2686 100% 0.00 0.95 369Country rating 99% 0.00 0.67 588 100% 0.00 0.69 172OvercollateralisationOvercollateralisation 9% 0.53 0.01 510 4% 0.54 0.02 55Committed Overcollateralisation 50% 0.21 0.02 703 58% 0.15 0.04 74Cover pool risk Arrears 81% 0.09 0.17 850 85% 0.08 0.16 107High LTV assets 55% 0.22 -0.06 644 57% 0.16 -0.04 92Very high LTV assets 16% 0.43 0.02 535 10% 0.57 0.03 77Commercial assets 28% 0.40 0.04 487 31% 0.40 0.03 59Regional concentration 6% 0.65 0.00 638 3% 0.71 0.01 64Macroeconomic risk of assets 100% 0.00 0.70 921 100% 0.00 0.71 231Real estate risk 39% 0.28 -0.02 573 30% 0.31 -0.02 61Collateral score (Moody's) 6% 0.49 0.04 422 3% 0.59 0.04 65Cover pool losses (Moody's) 56% 0.20 0.05 410 35% 0.49 0.05 65Timely payment indicator (Moody's) 65% 0.09 0.89 518 49% 0.10 0.89 65Payment continuity uplift (Fitch) 100% 0.00 -0.89 963 100% 0.00 -0.93 162Cover pool credit assessment (DBRS) 0% 0.61 0.00 121 0% 0.74 0.00 22Target credit enhancement (S&P) 70% 0.10 0.06 844 86% 0.05 0.07 96Cash flow mismatchAsset-liability mismatch (3 years) 37% 0.30 0.05 773 62% 0.18 0.05 119Asset-liability mismatch (5 years) 78% 0.10 0.03 937 89% 0.05 0.03 121Currency mismatch 16% 0.39 -0.96 563 33% 0.26 0.05 67Interest rate mismatch 67% 0.17 0.02 561 59% 0.23 0.03 66Maturity mismatch 29% 0.36 0.10 629 18% 0.35 0.10 67Maturity typeHard bullet 57% 0.25 1.08 609 66% 0.21 1.14 80Soft bullet 59% 0.18 0.63 458 46% 0.25 0.67 54Pass-through 80% 0.09 -0.04 597 72% 0.16 0.31 65Main collateral asset typeResidential 41% 0.31 0.81 435 40% 0.36 0.87 53Commercial 8% 0.44 -0.85 396 4% 0.48 -0.88 50Public sector 24% 0.39 -0.82 428 20% 0.45 -0.73 51Country effectsAustria 38% 0.40 2.17 359 52% 0.34 1.84 46Germany 56% 0.22 -1.55 383 53% 0.26 -1.64 43Italy 24% 0.41 1.15 440 39% 0.29 2.43 61Spain 66% 0.20 1.04 455 68% 0.24 1.35 44
Rating incl. leeway4-var 3-var
Table E-3: Results for covered bond rating (1/2)Note: The table shows the results across regressions with all 4- and 3-variable combinations of risk indicators asindependent variables for covered bond rating and covered bond rating including leeway as dependent variables.The results are computed for 25% regressions with the highest goodness of fit (measured by adjusted R2). Riskindicators as defined in Section 2.
ECB Working Paper Series No 2393 / April 2020 62

Risk indicators% reg's where
indicatorsignificant
median p-value
mediancoeff. if
significant
number of regressions
% reg's where indicator
significant
median p-value
mediancoeff. if
significant
number of regressions
Issuer and country riskIssuer rating 100% 0.00 0.65 2707 100% 0.00 0.66 369Country rating 100% 0.00 0.65 715 100% 0.00 0.64 236OvercollateralisationOvercollateralisation 18% 0.41 0.00 539 14% 0.38 0.00 73Committed Overcollateralisation 51% 0.23 -0.05 718 59% 0.16 -0.05 73Cover pool risk Arrears 23% 0.34 -0.04 723 16% 0.29 -0.06 77High LTV assets 6% 0.55 0.01 613 3% 0.54 0.02 76Very high LTV assets 4% 0.54 -0.02 645 1% 0.53 -0.05 76Commercial assets 30% 0.25 0.00 443 13% 0.33 -0.01 67Regional concentration 3% 0.52 -0.01 546 0% 0.56 0.00 76Macroeconomic risk of assets 100% 0.00 0.68 1636 100% 0.00 0.67 328Real estate risk 27% 0.32 -0.01 548 13% 0.49 -0.01 76Collateral score (Moody's) 100% 0.00 0.09 454 100% 0.00 0.08 65Cover pool losses (Moody's) 88% 0.06 0.04 298 38% 0.32 0.04 64Timely payment indicator (Moody's) 83% 0.05 0.32 381 80% 0.07 0.06 65Payment continuity uplift (Fitch) 40% 0.28 -0.10 583 38% 0.27 -0.11 65Cover pool credit assessment (DBRS) 33% 0.17 0.16 102 78% 0.07 0.17 18Target credit enhancement (S&P) 93% 0.03 0.04 295 100% 0.00 0.04 29Cash flow mismatchAsset-liability mismatch (3 years) 95% 0.02 0.03 827 97% 0.01 0.03 79Asset-liability mismatch (5 years) 90% 0.04 0.02 811 95% 0.02 0.02 80Currency mismatch 47% 0.33 0.06 681 62% 0.25 0.05 78Interest rate mismatch 47% 0.37 -0.01 624 63% 0.30 -0.01 76Maturity mismatch 6% 0.47 0.06 648 3% 0.51 0.05 76Maturity typeHard bullet 58% 0.19 0.04 473 38% 0.29 -0.12 71Soft bullet 87% 0.07 -0.28 583 90% 0.05 -0.35 70Pass-through 58% 0.15 0.82 594 63% 0.09 1.24 70Main collateral asset typeResidential 56% 0.19 -0.52 531 63% 0.12 -0.65 67Commercial 31% 0.41 0.72 471 44% 0.30 0.80 66Public sector 23% 0.30 0.43 460 20% 0.23 0.47 66Country effectsAustria 86% 0.05 -0.12 391 94% 0.04 0.04 48Germany 80% 0.10 0.19 440 91% 0.05 0.23 47Italy 45% 0.25 -1.39 456 50% 0.24 -1.37 48Spain 53% 0.23 -1.58 504 50% 0.23 -1.68 48
Rating4-var 3-var
Table E-4: Results for covered bond rating (2/2)Note: The table shows the results across regressions with all 4- and 3-variable combinations of risk indicators asindependent variables for covered bond rating and covered bond rating including leeway as dependent variables.The results are computed for 25% regressions with the highest goodness of fit (measured by adjusted R2). Riskindicators as defined in Section 2.
ECB Working Paper Series No 2393 / April 2020 63

Risk indicators% reg's where
indicatorsignificant
median p-value
mediancoeff. if
significant
number of regressions
% reg's where indicator
significant
median p-value
mediancoeff. if
significant
number of regressions
Issuer and country riskIssuer ratingCountry rating 15% 0.43 -0.07 4446 13% 0.45 -0.08 1662OvercollateralisationOvercollateralisation 2% 0.56 0.00 10336 2% 0.56 0.00 3176Committed Overcollateralisation 62% 0.14 0.05 11663 68% 0.12 0.06 3515Cover pool risk Arrears 20% 0.35 -0.10 11105 18% 0.32 -0.10 3403High LTV assets 8% 0.42 0.04 9896 5% 0.44 0.04 3222Very high LTV assets 1% 0.62 0.00 9712 0% 0.62 0.09 3205Commercial assets 1% 0.72 -0.02 5057 1% 0.74 -0.06 2049Regional concentration 32% 0.26 0.01 10485 31% 0.25 0.01 3207Macroeconomic risk of assets 20% 0.42 -0.07 6755 15% 0.45 -0.08 2465Real estate risk 42% 0.34 0.01 10230 42% 0.36 0.01 3037Collateral score (Moody's) 0% 0.68 0.00 5 13% 0.39 0.02 32Cover pool losses (Moody's) 6% 0.16 -0.02 16 53% 0.27 -0.03 57Timely payment indicator (Moody's) 100% 0.00 -1.05 22860 100% 0.00 -1.05 8811Payment continuity uplift (Fitch) 100% 0.00 0.83 21249 100% 0.00 0.83 7725Cover pool credit assessment (DBRS) 0% 0.71 0.23 1252 0% 0.57 0.00 809Target credit enhancement (S&P) 28% 0.36 -0.04 1823 48% 0.21 -0.05 1381Cash flow mismatchAsset-liability mismatch (3 years) 0% 0.67 -0.05 10833 0% 0.68 -0.06 3445Asset-liability mismatch (5 years) 2% 0.64 -0.01 11083 2% 0.63 -0.01 3458Currency mismatch 4% 0.67 2.06 11352 7% 0.61 1.10 3652Interest rate mismatch 8% 0.60 -0.04 11893 11% 0.54 -0.04 3732Maturity mismatch 4% 0.36 0.05 11761 5% 0.38 0.07 3446Maturity typeHard bullet 5% 0.66 -2.35 8391 6% 0.68 -3.35 2769Soft bullet 10% 0.46 -1.24 9025 8% 0.44 -1.37 2742Pass-through 39% 0.25 2.35 10825 50% 0.19 2.78 3783Main collateral asset typeResidential 17% 0.47 0.56 8212 14% 0.46 0.54 2483Commercial 0% 0.66 -0.84 7628 0% 0.67 -1.53 2353Public sector 4% 0.53 -0.52 7692 4% 0.52 -0.50 2405Country effectsAustria 10% 0.53 -3.83 3650 19% 0.47 -4.05 1369Germany 23% 0.27 1.03 7475 17% 0.33 1.08 2353Italy 18% 0.36 2.16 8195 21% 0.34 2.68 2704Spain 12% 0.44 -2.11 7246 12% 0.46 -2.47 2408
Rating uplift incl. leeway6-var 5-var
Table E-5: Results for covered bond rating uplift vs. issuer – 6- and 5-variable (1/2)Note: The table shows the results across regressions with all 6- and 5-variable combinations of risk indicatorsas independent variables for covered bond rating uplift vs. issuer rating and covered bond rating uplift includingleeway as dependent variables. The results are computed for 25% regressions with the highest goodness of fit(measured by adjusted R2). Risk indicators as defined in Section 2.
ECB Working Paper Series No 2393 / April 2020 64

Risk indicators% reg's where
indicatorsignificant
median p-value
mediancoeff. if
significant
number of regressions
% reg's where indicator
significant
median p-value
mediancoeff. if
significant
number of regressions
Issuer and country riskIssuer ratingCountry rating 12% 0.41 0.43 395 25% 0.34 0.20 591OvercollateralisationOvercollateralisation 18% 0.38 0.00 9894 17% 0.38 0.00 2936Committed Overcollateralisation 15% 0.42 0.02 10139 35% 0.30 0.09 3884Cover pool risk Arrears 15% 0.42 -0.03 10770 12% 0.37 -0.03 3349High LTV assets 8% 0.50 -0.04 10925 17% 0.45 -0.06 3412Very high LTV assets 11% 0.48 0.02 10790 14% 0.47 0.02 3285Commercial assets 39% 0.22 0.01 6643 36% 0.24 0.01 2394Regional concentration 8% 0.44 0.01 10826 6% 0.49 0.00 3416Macroeconomic risk of assets 22% 0.34 0.30 788 32% 0.31 0.19 1042Real estate risk 39% 0.27 0.01 9611 35% 0.28 0.01 2819Collateral score (Moody's) 100% 0.00 -0.10 5426 98% 0.01 -0.09 1456Cover pool losses (Moody's) 100% 0.01 -0.04 5426 97% 0.02 -0.04 1460Timely payment indicator (Moody's) 100% 0.00 -0.55 5426 99% 0.01 -0.54 1519Payment continuity uplift (Fitch) 53% 0.18 0.20 4832 55% 0.15 0.26 3083Cover pool credit assessment (DBRS) 12% 0.49 -0.19 4507 18% 0.43 -0.22 2096Target credit enhancement (S&P) 70% 0.12 -0.03 5946 65% 0.11 -0.03 2854Cash flow mismatchAsset-liability mismatch (3 years) 82% 0.08 -0.02 10410 71% 0.14 -0.02 3075Asset-liability mismatch (5 years) 71% 0.14 -0.02 10550 65% 0.17 -0.01 3248Currency mismatch 2% 0.66 -0.67 10496 4% 0.61 -0.54 3312Interest rate mismatch 10% 0.56 -0.02 10427 8% 0.56 -0.01 3185Maturity mismatch 5% 0.55 0.03 10614 6% 0.52 0.05 3237Maturity typeHard bullet 59% 0.19 0.55 7858 53% 0.22 0.37 2273Soft bullet 67% 0.17 -1.19 8879 70% 0.16 -1.20 2735Pass-through 42% 0.25 1.83 9375 65% 0.14 2.31 4323Main collateral asset typeResidential 23% 0.40 -0.71 7250 19% 0.44 -0.63 2257Commercial 10% 0.53 0.91 6154 6% 0.56 0.88 1962Public sector 11% 0.44 0.58 6553 10% 0.46 0.41 2048Country effectsAustria 90% 0.06 1.15 5396 90% 0.07 1.24 2124Germany 55% 0.19 1.60 7503 60% 0.17 1.52 2363Italy 24% 0.32 0.86 7560 27% 0.32 1.35 2462Spain 23% 0.40 -1.18 7467 20% 0.40 -1.47 2335
Rating uplift6-var 5-var
Table E-6: Results for covered bond rating uplift vs. issuer – 6- and 5-variable (2/2)Note: The table shows the results across regressions with all 6- and 5-variable combinations of risk indicatorsas independent variables for covered bond rating uplift vs. issuer rating and covered bond rating uplift includingleeway as dependent variables. The results are computed for 25% regressions with the highest goodness of fit(measured by adjusted R2). Risk indicators as defined in Section 2.
ECB Working Paper Series No 2393 / April 2020 65

Risk indicators% reg's where
indicatorsignificant
median p-value
mediancoeff. if
significant
number of regressions
% reg's where indicator
significant
median p-value
mediancoeff. if
significant
number of regressions
Issuer and country riskIssuer rating 100% 0.00 0.91 36528 100% 0.00 0.92 12949Country rating 91% 0.03 0.58 2752 93% 0.02 0.59 1211OvercollateralisationOvercollateralisation 8% 0.56 0.00 9423 10% 0.55 0.01 2950Committed Overcollateralisation 21% 0.40 -0.02 9655 25% 0.34 0.03 3206Cover pool risk Arrears 74% 0.12 0.15 13663 78% 0.10 0.17 3946High LTV assets 39% 0.29 -0.05 9845 49% 0.25 -0.06 3384Very high LTV assets 11% 0.47 0.00 9078 15% 0.43 0.00 3073Commercial assets 15% 0.45 0.02 5720 17% 0.46 0.07 2167Regional concentration 18% 0.44 0.00 9471 11% 0.54 0.00 3013Macroeconomic risk of assets 93% 0.02 0.62 3943 95% 0.02 0.64 1639Real estate risk 38% 0.33 -0.01 9586 38% 0.30 -0.02 3157Collateral score (Moody's) 13% 0.48 0.05 5426 12% 0.48 0.05 1460Cover pool losses (Moody's) 95% 0.02 0.05 5426 93% 0.03 0.05 1465Timely payment indicator (Moody's) 100% 0.00 1.07 5426 98% 0.01 1.07 1467Payment continuity uplift (Fitch) 100% 0.00 -0.82 10484 100% 0.00 -0.83 3996Cover pool credit assessment (DBRS) 3% 0.52 -0.23 843 1% 0.53 -0.22 480Target credit enhancement (S&P) 42% 0.27 0.06 9252 49% 0.21 0.06 4121Cash flow mismatchAsset-liability mismatch (3 years) 16% 0.49 0.03 10424 23% 0.41 0.05 3552Asset-liability mismatch (5 years) 52% 0.24 0.03 11757 67% 0.16 0.04 3977Currency mismatch 13% 0.51 -0.81 9983 16% 0.44 -0.87 3090Interest rate mismatch 54% 0.21 0.02 11087 68% 0.14 0.02 3313Maturity mismatch 25% 0.38 0.09 9709 21% 0.41 0.09 3115Maturity typeHard bullet 54% 0.28 0.75 8008 47% 0.30 1.06 2763Soft bullet 55% 0.18 0.95 8028 59% 0.16 0.87 2485Pass-through 81% 0.06 -1.52 10367 84% 0.06 -0.84 3099Main collateral asset typeResidential 38% 0.33 0.80 7442 41% 0.30 0.87 2310Commercial 15% 0.43 -0.84 6138 12% 0.42 -0.86 1979Public sector 23% 0.40 -0.78 7175 26% 0.36 -0.85 2271Country effectsAustria 15% 0.47 3.32 4262 16% 0.50 2.99 1582Germany 63% 0.14 -1.47 7574 59% 0.17 -1.51 2136Italy 22% 0.46 -0.28 7060 20% 0.43 -0.11 2356Spain 46% 0.27 1.82 7695 54% 0.24 1.65 2383
Rating incl. leeway6-var 5-var
Table E-7: Results for covered bond rating – 6- and 5-variable (1/2)Note: The table shows the results across regressions with all 6- and 5-variable combinations of risk indicators asindependent variables for covered bond rating and covered bond rating including leeway as dependent variables.The results are computed for 25% regressions with the highest goodness of fit (measured by adjusted R2). Riskindicators as defined in Section 2.
ECB Working Paper Series No 2393 / April 2020 66

Risk indicators% reg's where
indicatorsignificant
median p-value
mediancoeff. if
significant
number of regressions
% reg's where indicator
significant
median p-value
mediancoeff. if
significant
number of regressions
Issuer and country riskIssuer rating 100% 0.00 0.62 37648 100% 0.00 0.63 12985Country rating 100% 0.00 0.74 2645 100% 0.00 0.70 1480OvercollateralisationOvercollateralisation 18% 0.41 0.00 9605 18% 0.40 0.00 2789Committed Overcollateralisation 19% 0.41 0.00 9986 35% 0.32 -0.05 3614Cover pool risk Arrears 23% 0.39 0.04 10620 25% 0.35 0.00 3310High LTV assets 8% 0.50 0.01 9685 7% 0.53 0.01 3000Very high LTV assets 10% 0.48 -0.04 10358 8% 0.51 -0.02 3079Commercial assets 41% 0.21 0.00 6308 39% 0.22 0.00 2095Regional concentration 8% 0.46 -0.01 9780 6% 0.49 -0.01 2923Macroeconomic risk of assets 100% 0.00 0.72 5772 100% 0.00 0.70 4020Real estate risk 38% 0.27 -0.01 9891 32% 0.29 -0.01 2888Collateral score (Moody's) 100% 0.00 0.10 6473 100% 0.00 0.10 2212Cover pool losses (Moody's) 99% 0.01 0.04 4192 96% 0.02 0.04 1636Timely payment indicator (Moody's) 97% 0.01 0.54 5613 88% 0.04 0.48 1721Payment continuity uplift (Fitch) 38% 0.31 -0.05 10149 40% 0.30 -0.07 3078Cover pool credit assessment (DBRS) 13% 0.41 0.15 685 19% 0.26 0.16 395Target credit enhancement (S&P) 62% 0.15 0.03 5195 84% 0.06 0.03 1778Cash flow mismatchAsset-liability mismatch (3 years) 89% 0.05 0.03 12026 92% 0.04 0.03 3976Asset-liability mismatch (5 years) 79% 0.10 0.02 11736 85% 0.07 0.02 3659Currency mismatch 15% 0.56 0.09 10593 27% 0.46 0.08 3402Interest rate mismatch 25% 0.45 -0.01 9971 28% 0.45 -0.01 3005Maturity mismatch 10% 0.50 0.08 10661 8% 0.50 0.07 3319Maturity typeHard bullet 70% 0.14 0.02 8852 67% 0.14 0.09 2469Soft bullet 72% 0.15 0.09 9391 79% 0.12 -0.10 2795Pass-through 30% 0.30 -0.62 7896 38% 0.25 0.04 2676Main collateral asset typeResidential 28% 0.35 0.23 7293 40% 0.28 -0.22 2409Commercial 10% 0.54 -0.73 6424 16% 0.50 0.32 2190Public sector 15% 0.43 -0.05 7019 19% 0.37 0.22 2203Country effectsAustria 96% 0.02 -0.16 6028 87% 0.06 -0.24 1787Germany 50% 0.21 -0.59 6591 64% 0.16 -0.11 2137Italy 33% 0.29 -1.05 6386 34% 0.29 -1.28 2195Spain 38% 0.32 -1.00 8238 50% 0.25 -1.51 2940
Rating6-var 5-var
Table E-8: Results for covered bond rating – 6- and 5-variable (2/2)Note: The table shows the results across regressions with all 6- and 5-variable combinations of risk indicators asindependent variables for covered bond rating and covered bond rating including leeway as dependent variables.The results are computed for 25% regressions with the highest goodness of fit (measured by adjusted R2). Riskindicators as defined in Section 2.
ECB Working Paper Series No 2393 / April 2020 67

Acknowledgements The views expressed in this paper are those of the authors and do not necessarily represent the views of the European Central Bank, the Deutsche Bundesbank, the European Systemic Risk Board, any of its Member Institutions or the ESRB Secretariat. Magdalena Grothe worked on this project within the Schuman Programme encompassing the European System of Central Banks and the Single Supervisory Mechanism. We are grateful to Wolfgang Föttinger for his valuable comments and guidance throughout this project. We are also grateful to Jörg Binder, Jonas Böhmer, Manuel Polley and Bijan Sahamie for valuable comments on the earlier versions of this work. Magdalena Grothe European Central Bank, Frankfurt am Main, Germany; email: [email protected] JanaZeyer Deutsche Bundesbank, Frankfurt am Main, Germany; email: [email protected]
© European Central Bank, 2020
Postal address 60640 Frankfurt am Main, Germany Telephone +49 69 1344 0 Website www.ecb.europa.eu
All rights reserved. Any reproduction, publication and reprint in the form of a different publication, whether printed or produced electronically, in whole or in part, is permitted only with the explicit written authorisation of the ECB or the authors.
This paper can be downloaded without charge from www.ecb.europa.eu, from the Social Science Research Network electronic library or from RePEc: Research Papers in Economics. Information on all of the papers published in the ECB Working Paper Series can be found on the ECB’s website.
PDF ISBN 978-92-899-4036-8 ISSN 1725-2806 doi:10.2866/395233 QB-AR-20-045-EN-N