How manual cockle-raking may affect availability of cockles ...
101
How manual cockle-raking may affect availability of cockles Cerastoderma edule for oystercatchers Haematopus ostralegus in the Dutch Wadden Sea DATE: August 2020 VERSION: Final v1.1 BUG REFERENCE: BUG2842 PROJECT DIRECTOR: Richard A. Stillman PROJECT MANAGER: Richard A. Stillman REPORT AUTHOR(s): John D. Goss-Custard and Richard A. Stillman BU Global Environmental Solutions (BUG) Bournemouth University Department of Life and Environmental Sciences Faculty of Science and Technology Christchurch House, Fern Barrow Poole, Dorset, BH12 5BB www.bournemouth.ac.uk/bug Client: Province of Fryslân Postbus 20120 8900 hm Leeuwarden Tweekbaksmarkt 52 The Netherlands
-
Upload
khangminh22 -
Category
Documents
-
view
0 -
download
0
Transcript of How manual cockle-raking may affect availability of cockles ...
How manual cockle-raking may affect availability of cockles Cerastoderma edule for oystercatchers Haematopus ostralegus
in the Dutch Wadden Sea
DATE: August 2020
VERSION: Final v1.1
BUG REFERENCE: BUG2842
PROJECT DIRECTOR: Richard A. Stillman
PROJECT MANAGER: Richard A. Stillman
REPORT AUTHOR(s): John D. Goss-Custard and Richard A. Stillman
BU Global Environmental Solutions (BUG) Bournemouth University Department of Life and Environmental Sciences Faculty of Science and Technology Christchurch House, Fern Barrow Poole, Dorset, BH12 5BB www.bournemouth.ac.uk/bug
Client: Province of Fryslân Postbus 20120 8900 hm Leeuwarden Tweekbaksmarkt 52 The Netherlands
TITLE: How manual cockle-raking may affect availability of cockles Cerastoderma edule for oystercatchers Haematopus ostralegus in the Dutch Wadden Sea
CLIENT: Province of Fryslân
BUG REF: BUG2842
This document has been issued and amended as follows:
VERSION DATE DESCRIPTION CHECKED BY LEAD AUTHOR APPROVED BY
Draft v0.1 15/04/2020 Draft for client review.
Final v1.0 26/06/2020 Final report
Final v1.1 21/08/2020 Final report – 1 corrected to 0.1 on line 2 of page iv.
This report should be cited as:
Goss-Custard, J. D. and Stillman, R. A. (2020) How manual cockle-raking may affect availability of cockles Cerastoderma edule for oystercatchers Haematopus ostralegus in the Dutch Wadden Sea. BU Global Environmental Solutions report BUG2842 to Province of Fryslân. 99 pp.
Disclaimer
This report has been prepared by Bournemouth University for the sole use of the client for the intended purpose as agreed between the parties, and is subject to the terms and conditions agreed between the parties. The report may not be relied upon by any other party, without
Bournemouth University’s agreement in writing. Any third party seeking to rely on the report without permission does so at their own risk. Bournemouth University does not accept liability for any unauthorised use of the report, either by third parties or by the client for any purpose
other than that for which it was originally prepared and provided.

i
EXECUTIVE SUMMARY
This report evaluates how ‘concentrated fishing’ in one or more of the eight areas in the Dutch Wadden Sea that have been partially or completely open to manual cockle-fishing over the fishing seasons (1 September to 31 August) of 2007-08 to 2018-19 might have affected food availability to oystercatchers wintering in that area and in the Wadden Sea as a whole, particularly in years when the stocks of harvestable cockles were generally low.
Evidence suggests that we did not need to evaluate the possible impact of cockle-fishing during autumn and winter on the food supply of breeding oystercatchers in the following spring and summer for three reasons: (i) previous reports produced by Dutch scientists did not consider it to be necessary; (ii) field studies show that breeding oystercatchers often feed on prey other than cockles and, when cockles are taken, the birds consume cockles below harvestable size for much of the breeding season, and (iii) oystercatcher numbers are low in spring and summer so that the birds’ demand for cockles will be low relative to the supply. Accordingly, the report focusses on the non-breeding season or ‘overwintering’ period from 1 September to 31 March.
We suggest that another method to that which has been used in recent years might be considered as a means of measuring the effect of concentrated cockle-fishing on oystercatchers. We define the ‘carrying capacity’ of a wintering area as the number of oystercatchers that the food supply can support. ‘Support’ means that the birds’ normal low overwinter mortality rate (2% in adults) is maintained through the non-breeding season and that the survivors in spring are in good condition for breeding. We refer to this measure as the ‘within-winter’ carrying capacity to emphasize that the method provides measures that refer to a single winter and are unaffected by events occurring at other times of year and in other years, unlike the method that has been used in recent years in the Dutch Wadden Sea. In the absence of good data on spring body condition, our report focusses on the winter mortality rate.
The report argues that, when estimating carrying capacity, cockles of harvestable size that occur at densities <50/m2 should not be excluded from the definition of the food supply. Cockles below harvestable size should also be included although, unfortunately, the data needed to do so were not available.
The validated individual-based model ‘MORPH’ of the cockle fishery in the Burry Inlet, south Wales is used to estimate the quantity of cockles required by the average oystercatcher to survive the winter with a probability of 0.98; that is, so that no more than 2% of the adult population starve during the food-critical months of December to March. MORPH is used to estimate the 2% Ecological Multiplier (2%EM) from this equation:
2%EM = 2%ER/PR Equation 1
where 2%ER = Ecological Requirement, the amount of cockle biomass occurring at densities >0/m2
required on 1 September to enable the average adult oystercatcher to survive with a 98% probability until 31 March and PR = the Physiological Requirement of a single oystercatcher from 1 September to 31 March.

ii
The evidence suggests that the appropriate value of the 2%EM for the Dutch Wadden Sea is 3.25, slightly higher than the typical value of 3.0 for the warmer Welsh estuaries. This gives a per bird estimate of the 2%ER of 32.045 kg AFDM of flesh.
The reduction in carrying capacity due to the harvest can be calculated from the simple ‘daily ration’ model (Goss-Custard et al. 2002):
r = h/32.045 Equation 2
where r = the reduction in 2%carrying capacity in oystercatcher-winters and h = harvest in kg AFDM. This approach makes it very easy to calculate the potential impact on carrying capacity of any proposed cockle-harvesting strategy, whether for the whole Dutch Wadden Sea or for single fishing areas.
The approximate average number of wintering oystercatchers in the entire Dutch Wadden Sea over the years 2008-09 to 2018-19 was 117 250 for which the 2%ER was 3 757 276 kg AFDM. The average biomass of harvestable cockles present on 1 September in all the open and closed areas of the Dutch Wadden Sea combined over the same period in the places where cockles occurred at densities >50/m2 was 9 564 774 kg AFDM. The average potential 2%CC of the harvestable cockle stocks alone before the winter harvest had taken place was therefore 298 479 oystercatcher/winters, 2.6 times the average number of oystercatcher-winters that occurred in the Dutch Wadden Sea over the same period. On average over those 11 years, manual cockle-harvesting reduced the 2%CC of the harvestable cockle beds by 1.04%.
Oystercatchers took prey other than cockles of harvestable that occurred at densities >50/m2. Adding these other sources of food to the calculation of the 2%CC increased the estimate for the average carrying capacity of the Dutch Wadden Sea, depending on which additional sources of food are included in the calculation. Between them, but excluding cockles below harvestable size, they provided, on average over the period 2008-09 to 2018-19, 3.75 times the carrying capacity required to support the overwintering oystercatcher population of 117 250 birds. This capacity of 439 192 birds is approximately double the current maximum conservation target for wintering oystercatchers of 207 500 birds, the minimum target being 181 500. The Baltic Tellin Macoma balthica makes such a small contribution to the within-winter 2% carrying capacity of the Dutch Wadden Sea that is not considered any further.
The same comparisons were made separately for the western and eastern regions of the Dutch Wadden Sea. The number of oystercatchers wintering in the western region exceeded the 2%CC provided by harvestable cockles at densities >50/m2 in six of the 11 years. The deficit was reduced or removed by the addition of the capacity provided by the other sources of food, but the difference between capacity and overwintering bird numbers remained small in three years (2008, 2011 and 2018). In the eastern region, the differences between carrying capacity and bird numbers were as small as those in the western region in two years (2011 and 2018). Across all 22 combinations of regions and years (‘region-years’), the estimated number of overwintering oystercatchers was close to the predicted carrying capacity in eight cases, the magnitude of the differences depending, of course, on which food sources were included in the estimate of carrying capacity. This raised the possibility that intensive cockle harvesting in some of the component areas of the two regions – especially in the western region – might have reduced the carrying capacity below the number of oystercatchers that were overwintering there.

iii
Over the 55 combinations of areas and years for which data are available, the annual cockle harvest (1 September to 31 August) was largest in areas which on 1 September had a highest biomass of cockles at densities >50/m2 and where cockles were large. Over the eleven years and eight years included in the analysis, fishing occurred in only 55% of area-winters. Due to concentrated fishing, as much as 27% of the standing crop of harvestable cockles that was present in an area at densities >50/m2 on 1 September was removed by harvesting over the following 12 months. On average across all area-years, 57% of the annual harvest was taken during the ‘oystercatcher winter’ months of 1 September to 31 March.
As no counts had been made of the number of oystercatchers feeding in each of the nine areas in each winter, we had to estimate the numbers as best we could. Unfortunately, it was not possible to test the accuracy of our method.
The carrying capacity for each area-year was calculated from the biomass of cockles at densities >0/m2 on 1 September to which were added the numbers of oystercatchers (again estimated) to have occurred on mussel and oyster beds. The harvest taken during the winter was deducted from the initial stock of cockles. For each area-year where cockle-fishing occurred, we calculated the ratio between the 2%CC and the estimated number of oystercatchers that spent the winter in that area-year. A ratio of 1 would mean that the number of overwintering birds was the same as the 2%CC; that is, the capacity present was equal to that which the estimated numbers of birds required to support them until spring. A ratio >1 would indicate a surplus of carrying capacity.
We used linear regression to explore the quantitative relationship across the 55 area-years between this ratio and (i) the size of the winter harvest as a percentage of the initial stock of cockles at densities >50/m2, and (ii) the general abundance of harvestable cockles in the Dutch Wadden Sea as a whole, measured as the harvestable biomass present on 1 September. The size of the standing crop in the Dutch Wadden Sea on 1 September had a highly significant effect on the ratio: when cockles were generally abundant, the surplus capacity was significantly greater than when cockles were scarce. In contrast, the size of the winter harvest measured as a percentage of the initial stock did not have a significant effect on the ratio. In fact, the sign was positive and so contra-hypothesis: larger winter harvests should have reduced the magnitude of the difference between the 2%CC and the number of wintering oystercatchers in an area/year, but there was no evidence that this occurred.
As the ratio was smaller in years when harvestable cockles were generally scarce in the Dutch Wadden Sea, we re-analysed the data from the years of cockle scarcity alone to remove any risk that the outcome would be affected by the data from the years of abundance. A comparison was made between area-years when the annual harvest was above (N=9) and below (N=29) 2.5% of the standing crop of harvestable cockles on 1 September. As expected, the general abundance of cockles was larger in the area-years when harvests were >2.5% than when they were <2-.5% of the stock. But the ratio did not differ between area-years when the harvests were >2.5% and when they were <2.5% of the annual harvest.
On average over the 38 area-years that occurred in years of widespread cockle scarcity in the Dutch Wadden Sea, the ratio was 2.41, with a minimum of 0.75 and maximum of 5.69. Ratios <1 occurred in three area-years: area 4 in 2011 and in areas 1 and 3 in 2018, the year of very low cockle stocks. In none of these area-years, however, did the annual harvest exceed 2.5%. In the nine areas where the
iv
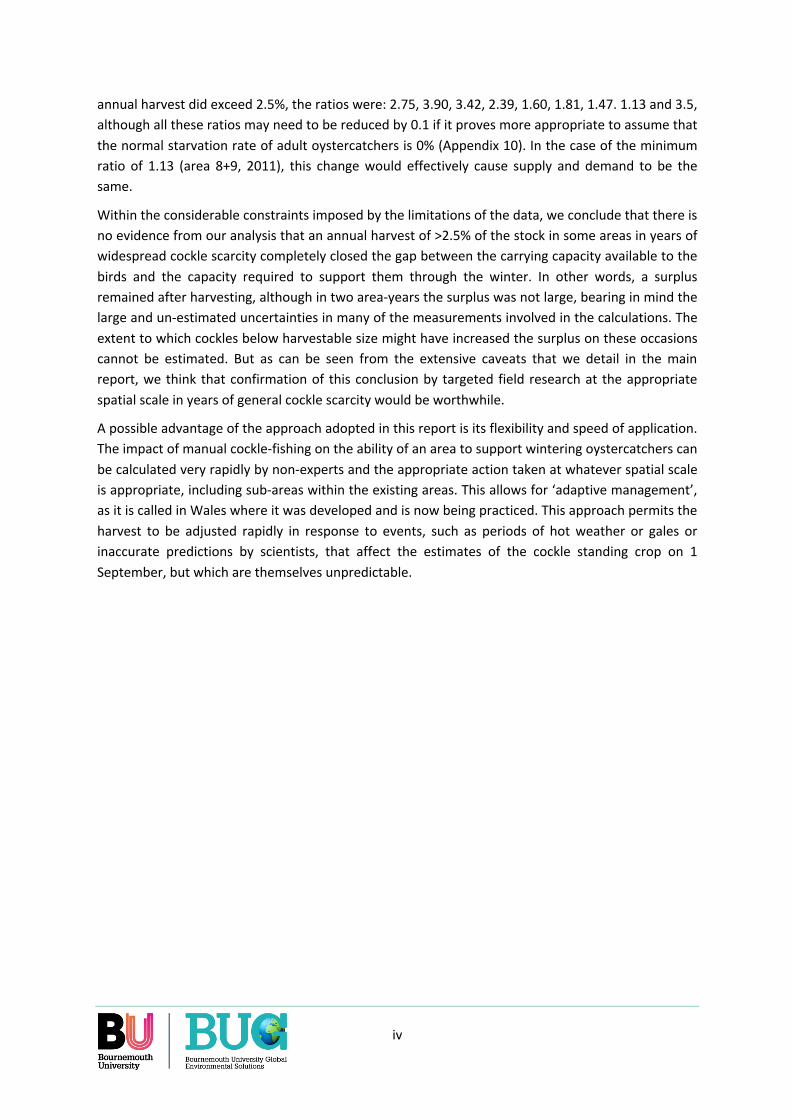
annual harvest did exceed 2.5%, the ratios were: 2.75, 3.90, 3.42, 2.39, 1.60, 1.81, 1.47. 1.13 and 3.5, although all these ratios may need to be reduced by 0.1 if it proves more appropriate to assume that the normal starvation rate of adult oystercatchers is 0% (Appendix 10). In the case of the minimum ratio of 1.13 (area 8+9, 2011), this change would effectively cause supply and demand to be the same.
Within the considerable constraints imposed by the limitations of the data, we conclude that there is no evidence from our analysis that an annual harvest of >2.5% of the stock in some areas in years of widespread cockle scarcity completely closed the gap between the carrying capacity available to the birds and the capacity required to support them through the winter. In other words, a surplus remained after harvesting, although in two area-years the surplus was not large, bearing in mind the large and un-estimated uncertainties in many of the measurements involved in the calculations. The extent to which cockles below harvestable size might have increased the surplus on these occasions cannot be estimated. But as can be seen from the extensive caveats that we detail in the main report, we think that confirmation of this conclusion by targeted field research at the appropriate spatial scale in years of general cockle scarcity would be worthwhile.
A possible advantage of the approach adopted in this report is its flexibility and speed of application. The impact of manual cockle-fishing on the ability of an area to support wintering oystercatchers can be calculated very rapidly by non-experts and the appropriate action taken at whatever spatial scale is appropriate, including sub-areas within the existing areas. This allows for ‘adaptive management’, as it is called in Wales where it was developed and is now being practiced. This approach permits the harvest to be adjusted rapidly in response to events, such as periods of hot weather or gales or inaccurate predictions by scientists, that affect the estimates of the cockle standing crop on 1 September, but which are themselves unpredictable.

v
CONTENTS
1. Pre-amble ....................................................................................................................................... 7
2. Introduction ................................................................................................................................... 8
3. Cockle abundance in spring and breeding oystercatchers in the Dutch Wadden Sea ................... 9
3.1 Evidence from omissions ........................................................................................................ 9
3.2 Evidence from field studies .................................................................................................... 9
3.3 Evidence from oystercatcher abundance ............................................................................. 10
3.4 Conclusion ............................................................................................................................ 10
4. Measurement of carrying capacity .............................................................................................. 12
4.1 Definition of carrying capacity ............................................................................................. 12
4.2 The model MORPH ............................................................................................................... 14
4.3 Our approach ....................................................................................................................... 16
4.4 Cockle harvesting and oystercatcher population size .......................................................... 22
4.5 Definition of the cockle food supply .................................................................................... 23
Oystercatchers can achieve high intake rates where cockle density is below 50/m2 .. 23
Areas with low intake rates can influence the overwinter survival of cockle-eating oystercatchers .............................................................................................................................. 23
Cockles below harvestable size can make an important contribution to oystercatcher survival 25
Implications for calculating the food supply of oystercatchers .................................... 26
5. The single-winter carrying capacity for oystercatchers of the Dutch Wadden Sea ..................... 27
5.1 Overwinter mortality and carrying capacity ......................................................................... 27
5.2 Estimating the 2% ecological requirement of the oystercatcher population ....................... 28
5.3 The 2% ecological multiplier ................................................................................................ 29
6. How harvesting was conducted ................................................................................................... 30
7. Carrying capacity of the cockle beds for oystercatchers .............................................................. 36
7.1 Annual and spatial variations in the effect of harvesting on carrying capacity of harvestable cockles at densities >50/m2 .............................................................................................................. 36
7.2 Carrying capacity taking other sources of food into account ............................................... 39
7.3 Impact of cockle fishing on carrying capacity in the western and eastern region ............... 43
7.4 Impact of winter cockle fishing on carrying capacity by area .............................................. 44
8. Discussion ..................................................................................................................................... 51
8.1 Cockle-harvesting and the carrying capacity of the Dutch Wadden Sea for oystercatchers 51
8.2 Shellfish abundance in winter and oystercatcher numbers ................................................. 53
vi
8.3 Adaptive management ......................................................................................................... 55
9. Acknowledgements ...................................................................................................................... 57
10. References ................................................................................................................................ 58
Appendix 1. Winter mortality rate of oystercatchers .......................................................................... 67
Appendix 2. What should the value of the 2%EM be for the Dutch Wadden Sea? ............................. 71
Appendix 3. The Ash-free dry mass to fresh-weight ratio in cockles in September ............................. 79
Appendix 4. Energy requirements of oystercatchers ........................................................................... 81
Appendix 5. Cockle requirements of the oystercatcher population .................................................... 83
Appendix 6. Perhaps the mortality rate of young birds can be used to define carrying capacity rather than that of adult birds ........................................................................................................................ 87
Appendix 7. Within-winter shifts in the distribution of cockle-eating oystercatchers in the Wash, UK. ............................................................................................................................................................. 93
Appendix 8. Effect of the start date on the 2%EM ............................................................................... 95
Appendix 9. The effect of a harvest in one year on the rate of decline in the standing crop of cockles in subsequent years. ............................................................................................................................ 96
Appendix 10. Effect of the target mortality rate on the Ecological Requirement ................................ 99

7
1. PRE-AMBLE
This is the tender for the work described in this report:
“Background: In the multi-annual plan for the manual cockle-raking fishery in the Wadden Sea it was agreed that research into how the fishing activity might affect the availability of cockles Cerastoderma edule in the Wadden Sea for oystercatchers Haematopus ostralegus would be carried out.
Annually 2.5% of the total biomass of harvestable cockles is allocated to the fishermen. The fishing effort is spread over eight areas in the Wadden Sea and the fishermen follow a rotation system. This means that the total removal of cockles can be higher than 2.5% in any given area. An analysis by Troost and van Asch (2018) showed that up to 8% of the cockle biomass was fished in one particularly favoured area with high cockle densities. If this activity continues over several years, then up to 3% of the biomass in the Wadden Sea as a whole would be fished, and for the favoured area this could rise up to 24%. What is the effect of manual cockle-raking on the spatial distribution and biomass of cockles suitable as food for oystercatchers? It is unclear if this localized depletion affects the food availability for oyster catchers. This is the basis for the research requested.
Key question: The research should focus on how concentrated fishing in certain areas might affect the food availability in that area and in the Wadden Sea as a whole.
The following aspects should be taken into consideration: (i) The distribution of oystercatchers over the different areas in the Wadden Sea; (ii) The distribution of the fishing activity over the different areas in the Wadden Sea; (iii) The availability of cockles in the period 2012-2018; (iv) The availability (biomass, density, distribution) of alternative sources of food such as the Baltic tellin Macoma balthica and edible mussels Mytilus edulis; (v) The distribution of available food sources across the Wadden Sea in areas close to breeding areas and high-water refuges.
This concerns a desk-study and a model should be used that can compare the food requirement of oystercatchers in the eight different areas with the availability of cockles in the system. The models used by Stillman & Wood (2013) and Stillman et al. (2016) could be an option. Data on abundance and distribution of cockles is collected and analysed by Wageningen Marine Research (WMR) and can be made available for this project for a fee.”

8
2. INTRODUCTION
Our summary of the objective is this: The hypothesis (the ‘2.5% hypothesis’) to be tested is that the manual harvesting of cockles over the last 12 years has reduced the carrying capacity of the wintering grounds. This is to be tested at two spatial scales: (i) within a single open area in which concentrated fishing within one winter and/or cumulative fishing over several years may have made the annual 2.5% rule ineffective at protecting the birds, and (ii) the entire Dutch Wadden Sea (Figure 1).
Figure 1. The Dutch Wadden Sea showing the areas permanently closed to cockle-fishing and those where manual harvesting can occur under licence.
9
3. COCKLE ABUNDANCE IN SPRING AND BREEDING OYSTERCATCHERS IN THE DUTCH WADDEN SEA
The first question that we had to consider was whether cockles of fishable size make an important contribution during the breeding season to the food consumption of oystercatchers. If they do not, our attention needs only to focus on that other critical period of the year for oystercatchers, the winter, when starvation regularly occurs and is particularly high during periods of severe weather and/or shellfish scarcity.
3.1 Evidence from omissions
The EVA II review on the interaction between cockles, mussels and oystercatchers does not highlight the importance of the abundance of cockles during the breeding season itself on the reproductive success of oystercatchers in the Dutch Wadden Sea (Ens et al. 2004). The only indications that cockle abundance in spring might influence the reproductive success of oystercatchers is a personal communication concerning Schiermonnikoog where it is reported that: ‘a decline in reproductive success coincided with a decline in the proportion of breeders with a pure shellfish diet (Verhulst, pers. comm)' – which, of course, would include mussels as well as cockles. Ens et al. (2004) did however discuss the possibility that the feeding conditions during the previous winter may affect reproductive output (page 115), a possibility in which there is increasing interest in the ornithological literature (Norris 2005; Calvert et al. 2009).
3.2 Evidence from field studies
We could not find a review of the extent of cockle-eating in breeding oystercatchers over the whole of the Dutch Wadden Sea. Detailed studies of breeding oystercatchers have focussed on three areas: Schiermonnikoog, the Frisian coast and Texel and these, of course, may not be representative of the whole Dutch Wadden See. In these areas, cockles were only once reported as being a main prey of breeding oystercatchers, notwithstanding the many years of observation and therefore opportunities for cockles to have been abundant in some years (Table 1). Perhaps this is to be expected as soft-bodied prey species, such as the ragworm Nereis diversicolor and the Baltic tellin Macoma balthica, tend to occur at the higher levels of the shore close to the breeding territories of oystercatchers situated in the saltmarsh while cockles are scarce, and probably with low flesh-content, at these shore-levels. In any case, Nereis and Macoma provide oystercatchers during the breeding season with intake rates that are comparable to those they obtain from cockles (Zwarts & Wanink 1993; Zwarts et al. 1996c), a species which generally occurs further downshore and thus at a greater distance from the breeding territories (Zwarts et al. 1996c). Although foraging by adults at a distance from the nesting territory increases the risk of their chicks being taken by predators (Leopold et al. 1996), oystercatchers breeding on saltmarshes and in polders do regularly leave their breeding territory to forage for themselves on cockles downshore (Kersten 1996; Kersten & Visser 1996; Ens et al. 2014).
Cockles did predominate in the diets of breeding oystercatchers in one German area of the Wadden Sea (Table 1). In the Dutch Wadden Sea, however, researchers have noted the high accessibility and profitability of the soft-bodied prey species during the breeding season (Leopold et al. 1996; Zwarts et al. 1996c). Van de Pol et al. (2010a) found by demographic modelling that the annual variations in

10
the fecundity of oystercatchers on the island of Schiermonnikoog over the years 1983-2007 was correlated with the abundance of ragworms, the oystercatchers’ main food source on Schiermonnikoog during the chick feeding period (Bunskoeke et al. 1966). Since over approximately the same span of years the breeding success of oystercatchers at the eastern and western extremities of the Dutch Wadden Sea were positively correlated (Oosterbeek et al. 2006), and since the abundance of ragworms in spring correlates with the preceding winter’s ambient temperature (Lawrence & Soames 2004), it seems likely that the findings from Schiermonnikoog might apply to many of the oystercatcher’s breeding areas in the Dutch Wadden Sea.
Finally, oystercatchers switch from large shellfish to small ones in spring (Ens et al. 1996b). This further reduces the likely importance of the abundance of larger cockles of fishable size to these birds during the breeding season. The evidence from field studies does suggest that large cockles of fishable size may not contribute much to the breeding success of oystercatchers in the Dutch Wadden Sea.
3.3 Evidence from oystercatcher abundance
Compared with the winter period, there are only low numbers of oystercatchers present during the breeding season (Figure 19 in Zwarts et al. 1996c; Figure 4 in van Roomen et al. 2005). This may also imply that the demand of oystercatchers for cockles is low relative to the abundance of this shellfish.
3.4 Conclusion
The evidence suggests that we need not concern ourselves with the impact of cockle-fishing that takes place during autumn and winter on the food supply of breeding oystercatchers the following spring, except through its possible influence on the condition of birds at the end of the winter. This suggests that our assumption should be that it is through its impact on the birds’ body condition and survival in winter that cockle harvesting could have a significant effect on oystercatchers.

11
Table 1. Diet of breeding oystercatchers in the intensively studied regions of the Wadden Sea.
Location Source Years Main prey Minor prey – if noted
Schiermonnikoog Zwarts & Drent 1981 1971-73 Mytilus
van der Pol et al. 2010b 1983-2008 Macoma Nereis Mytilus Mya
Hulsman et al. 1996 1986 Macoma Nereis
Ens et al. 1996 1986 Macoma Nereis
Bunskoeke et al. 1996 1986 Macoma Nereis
de Vlas et al. 1996 1986-87 Macoma Nereis
Hulscher et al. 1996
1986-89, 1992-93
Macoma Nereis
Hulsman et al. 1996 1986 Macoma Nereis
Kersten 1996 1985-88 Macoma Nereis Cerastoderma Mya Mytilus
Verhulst et al. 2001 1999 Scrobicularia Macoma Mya Arenicola
Cerastoderma Nereis Carcinus
Texel Bunskoeke 1988 1986 Mya
Ens et. al. 1996 1983-84 Cerastoderma Mytilus Macoma Nereis Carcinus
Leopold et al. 1996 Mytilus Cerastoderma Carcinus
Friesen coast Hulscher 1982 1979 Macoma
Zwarts et al. 1996c 1977-86 Scrobicularia Macoma Cerastoderma
Spiekeroog (Germany)
Schwemmer et al. 2017 2008-10 Cerastoderma
Hallig (Denmark) Schwemmer et al. 2017 2009-10 Ensis

12
4. MEASUREMENT OF CARRYING CAPACITY
4.1 Definition of carrying capacity
Much of the discussion on the issue of shellfishing and shorebirds rests on the notion of ‘carrying capacity’ and how it should be defined and measured. A frequently-asked question is: ‘Does shellfishing significantly reduce the carrying capacity of an area for shorebirds’. It is a deceptively simple question that in practice requires much dedicated research to answer, not least because different research workers define and measure capacity in different ways (Goss-Custard 1993). The notion survives this conceptual uncertainty because it encapsulates the very simple, common-sense idea that resources are limited and must set an upper limit to the numbers of shorebirds that can be supported by an area through the non-breeding season (Goss-Custard 1993).
It is therefore important that we define the way in which carrying capacity is defined and measured in this report. The basic idea underlying the concept of carrying capacity as applied to shorebirds during the non-breeding season is that, because the resources available to support the birds in an area are not infinite, there must be a limit to the numbers that it can support from autumn to spring. The mechanism that causes the carrying capacity to be achieved is competition between birds: as the numbers of birds arriving in autumn increases, competition between them gradually intensifies until a point is reached at which no more birds can be supported. The potential increase in numbers is constrained by starvation or emigration due to a combination of the two known mechanisms of competition in shorebirds, interference and depletion.
The most severe definition of carrying capacity is the ‘one bird, one bird out’ definition (Goss-Custard et al. 1997). In this case a point is reached as the numbers of birds arriving increases at which for every new bird that arrives one that is already present either starves or emigrates because it can no longer obtain the food it needs to survive (Figure 2). An analogy would be the carrying capacity of a car park: once all the parking spaces have been taken, no more cars can be fitted in and all those remaining outside must seek somewhere else to park.

13
Figure 2. Representation of overwinter density-dependent mortality and/or emigration in oystercatchers and the ‘one in, one out’ measure of the carrying capacity of the food supply. The results in the left-hand panels are obtained from the histograms shown in the right-hand panel in
which the number of oystercatchers arriving on the estuary in autumn is varied. The winter period runs from September 1 to March 31 when most adults move to their breeding areas. The vertical
line in the right-hand panels shows the average daily consumption an individual bird must achieve if it is to survive with good body condition from September 1 to March 31. Individuals vary in their foraging efficiency and in their ability to compete with other oystercatchers. The right-hand panels
show the frequency distributions at different population sizes of the average daily consumption achieved by all the individuals in the population. In the lowest right-hand panel, for example, very
few oystercatchers arrived on the estuary, so the histogram is correspondingly small. There are too few birds for competition to affect them: even the weakest competitors can find a foraging
space which enables them to acquire all their food requirements without interference from more dominant competitors and the depletion of the prey by the birds themselves is too minor to affect their intake rate. As the population size increases up the right-hand panels, however, competition
from both interference and depletion intensify. Consequently, the daily consumption of an increasing proportion of the increasing population fails to achieve the required threshold rate to survive, and individuals begin to starve (or emigrate). As the population increases still more, the
frequency histogram bulges increasingly to the left. This bulge happens because, whereas the daily consumption rates of the most successful competitors are not affected by the increased numbers of competitors, those of the increasing proportion of less competitive individuals are suppressed. As a result, the daily consumption of an increasing proportion of birds falls below the threshold
rate required to avoid starvation. Accordingly, the proportion of birds that starve increases as the population size increases and the starvation rate is density-dependent (bottom left-hand panel). If the number of birds arriving in autumn is high enough, a point can be reached at which for every
extra bird that arrives, one will starve or emigrate, and numbers will then reach an asymptote (top panel); this is the so-called ‘one in, one out;’ definition of carrying capacity. Taken from Goss-
Custard et al. (1996b).

14
As Figure 2 illustrates, the ‘one-in, one-out’ carrying capacity is most unlikely ever to be reached in oystercatchers by means of winter mortality because the mortality rates are normally far below the rates of 25-40% that would be required for this to happen (Appendix 1). Were the mortality rate to be so high, the size of the global population as well as the local population would probably decrease to the point at which there would not be enough birds available to reach the ‘one-in, one-out’ capacity anyway (Goss-Custard 1993).
Alternatively, a one-in, one-out carrying capacity could be reached by means of immigration and emigration at the time the birds arrive on the wintering grounds in late summer. A simple thought experiment might be useful her: Consider a case in which the feeding conditions on the wintering grounds were constant year after year. If ‘one-in, one-out’ carrying capacity applied at the time the birds arrive in late summer, it would require that any birds surplus to the capacity of the area would emigrate immediately or later during autumn. That is, emigration would be perfectly compensatory: in k-factor terms, the slope of the relationship between the logarithms of the number of birds emigrating and the numbers attempting to settle in the area would be 1 (Goss-Custard 1981; 1993). Although this might sometimes occur in areas where breeding territories are competed for vigorously in spring (Goss-Custard et al. 1996a), it would be mere speculation to argue that this could happen, let alone does happen, in oystercatchers settling on the wintering grounds.
In this report, we have used a very simple and easily understood definition of carrying capacity; i.e., the numbers of oystercatcher-winters that the food supply can support. ‘Support’ means that the birds’ normal low overwinter mortality rate is maintained through the non-breeding season and that the survivors in spring are in good condition: the value of the ‘normal low overwinter mortality rate’ is defined later. A typical statement about the carrying capacity of a non-breeding area could then be, for example: ‘This intertidal area can support up to N oystercatchers over the non-breeding season’. We refer to this measure as the ‘within-winter’ carrying capacity to emphasize that it refers to a single, non-breeding season.
4.2 The model MORPH
This diagram also illustrates the conceptual basis of the individual-based model MORPH which has played a large part in our analysis in this report in testing the 2.5% hypothesis, and is therefore briefly described here: a full description is in Stillman (2008). MORPH represents individual birds that use optimisation decision rules to decide how to obtain most rapidly their daily energy requirements which, in the model as in reality, depend on the ambient temperature. Individuals vary in competitive ability and each bird takes into account the decisions made by competitors in deciding when (e.g. night or day), where (e.g. which shellfish bed) and on what (e.g. cockles, mussels or alternative prey species) it should feed. Because shellfish are particularly profitable for wintering oystercatchers (Zwarts et al. 1996a), they attempt first to obtain their requirements from shellfish alone but, should they fail, they eat other intertidal invertebrates or terrestrial prey, such as earthworms Lumbricidae. Once an individual has obtained its current daily energy requirements, it stores subsequent consumption as fat up to a daily limit. A bird uses its fat reserves should it ever fail to obtain its daily requirement from current foraging and starves to death if its body reserves fall to zero. MORPH and the model WEBTICS that is widely used to model the carrying capacity of the Dutch Wadden Sea for oystercatchers are conceptually identical but differ in how the oystercatcher population is represented and in the outputs
15
they provide. In the latter case, the main difference is that MORPH predicts the overwinter mortality rate of the birds whereas WEBTICS predicts the level of food stress experienced by the average bird under different conditions (Rappoldt et al. 2003c). For reasons which are discussed later, we use MORPH in our appraisal of manual cockle-fishing in the Wadden Sea.
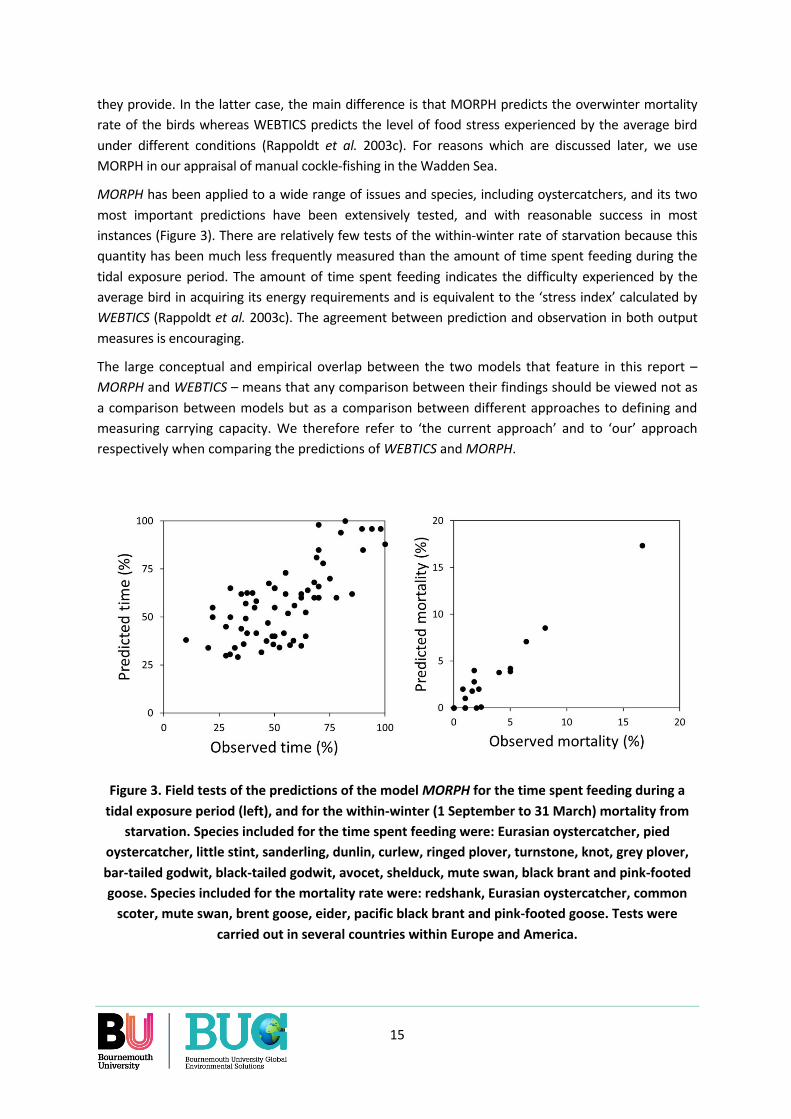
MORPH has been applied to a wide range of issues and species, including oystercatchers, and its two most important predictions have been extensively tested, and with reasonable success in most instances (Figure 3). There are relatively few tests of the within-winter rate of starvation because this quantity has been much less frequently measured than the amount of time spent feeding during the tidal exposure period. The amount of time spent feeding indicates the difficulty experienced by the average bird in acquiring its energy requirements and is equivalent to the ‘stress index’ calculated by WEBTICS (Rappoldt et al. 2003c). The agreement between prediction and observation in both output measures is encouraging.
The large conceptual and empirical overlap between the two models that feature in this report – MORPH and WEBTICS – means that any comparison between their findings should be viewed not as a comparison between models but as a comparison between different approaches to defining and measuring carrying capacity. We therefore refer to ‘the current approach’ and to ‘our’ approach respectively when comparing the predictions of WEBTICS and MORPH.
Figure 3. Field tests of the predictions of the model MORPH for the time spent feeding during a tidal exposure period (left), and for the within-winter (1 September to 31 March) mortality from
starvation. Species included for the time spent feeding were: Eurasian oystercatcher, pied oystercatcher, little stint, sanderling, dunlin, curlew, ringed plover, turnstone, knot, grey plover, bar-tailed godwit, black-tailed godwit, avocet, shelduck, mute swan, black brant and pink-footed goose. Species included for the mortality rate were: redshank, Eurasian oystercatcher, common
scoter, mute swan, brent goose, eider, pacific black brant and pink-footed goose. Tests were carried out in several countries within Europe and America.
16
4.3 Our approach
Following the appraisal made by Argonus Fisheries Consultancy (2009, 2019) of the 2.5% harvesting rule, we thought that it was important to take into account four considerations:
I. the widely fluctuating annual stock of harvestable cockles and the associated large spatfall that occurs every few years (van der Meer et al. 2001; Beukema & Dekker 2018);
II. the need to focus on the winter period alone so that the predicted carrying capacity would relate solely to the cockle beds of the Wadden Sea itself in the winter in question and not be influenced by population processes occurring at other times of year on the migration and breeding grounds;
III. our preference for the conceptual clarity provided by an absolute measure of the carrying capacity of the cockle beds of the Wadden Sea rather than a measure of the relative change brought about by an activity such as manual cockle harvesting;
IV. the need to obtain a single-winter estimate of carrying capacity for an area of any size while nonetheless recognising that the harvest in the current year could reduce carrying capacity in future years.
It is generally appreciated that current estimates of the carrying capacity of the cockle beds of the Dutch Wadden Sea under-estimates the numbers of oystercatchers that could be supported because, for good reasons, it focusses on the years of cockle scarcity and is based on simulations across runs of several years (Rappoldt et al. 2003a, 2003b, 2006, 2008; Rappoldt & Ens 2011, 2013; Agonus Fisheries Consultancy 2009, 2019). Quite apart from taking several years to estimate carrying capacity this way, we think the current approach has some drawbacks, as were discussed in the reports by the Agonus Fisheries Consultancy (2009, 2019) and to which discussion we cannot add anything new. Our particular concern is that factors and processes acting in places other than the Wadden Sea itself – whose carrying capacity is the quantity being estimated - could affect the estimate of the absolute carrying capacity in winter even if it predicts the magnitude of the change/reduction in capacity due to a human activity, as discussed by Rappoldt et al. (2008), Rappoldt & Ens (2013) and Keus (2009). This implies to us that a situation could arise in which there was a large surplus in capacity for the birds that winter there but the prediction of the effect of manual cockle-fishing would still be a reduction in carrying capacity, even if this had no actual impact on the birds. The only circumstances in which this objection could be avoided is when all of the factors that determine annual variation in the bird population’s vital rats – annual survival and fecundity - are determined solely by the shellfish food supply on the wintering grounds. The evidence from studies of fecundity alone renders this idea unlikely to be the case.
It is becoming increasingly clear that breeding success in inland-nesting waders is widely affected by predation and changes in agricultural practice (Teunissen et al. 2005; Klok et al. 2009; Roodbergen et al. 2011). As the number of oystercatchers that breed around the Dutch Wadden Sea is <20% of the numbers that overwinter there (Brinkman et al. 2008), most oystercatchers that winter there must breed elsewhere, such as Norway (Hulscher et al. 1996). Within the Netherlands, many probably breed inland where about 75% of Dutch breeding oystercatchers nest, mostly at some distance from the Wadden Sea (Ens et al. 2011). Whereas the annual survival of adult and sub-adult oystercatchers breeding inland in Europe did not change over the four decades prior to 2006, the nesting success declined strongly across all meadow-breeding birds from circa 40% to circa 20% (Klok et al. 2009;
17
Roodbergen et al. 2011). This decline in breeding success coincided in all species with a circa 40% increase in the rate of predation of nests, the rate being particularly high in oystercatchers and curlews Numenius arquata (Roodbergen et al. 2011).
In coastal breeding birds, demographic modelling of breeding success of oystercatchers on the island of Schiermonnikoog showed that fecundity was positively correlated with ragworm abundance (van de Pol et al. 2010a): this polychaete was the oystercatchers’ main food source during chick feeding (Bunskoeke et al. 1996). As egg production of ragworms is increased by cold winter temperatures (Lawrence and Soame 2004), fecundity was negatively associated with winter temperature. [It was also negatively associated with flooding events during the breeding season, as these floods flushed away many nests.] Since over approximately the same span of years the breeding success of oystercatchers at the eastern and western extremities of the Dutch Wadden Sea were positively correlated (Oosterbeek et al. 2006), and since the abundance of ragworms in spring correlates with the preceding winter’s ambient temperature (Lawrence & Soames 2004), it seems likely that the findings from Schiermonnikoog on the factors determining fecundity might apply widely across the breeding areas of the Dutch Wadden Sea.
These findings on the reproductive rate imply that a gradual year-on-year decrease in the reproductive success of oystercatchers in summer due, for example, to increasing predator numbers would cause the carrying capacity of the cockle beds in winter as currently estimated gradually to decrease. Accordingly, one way to increase the absolute carrying capacity of the Wadden Sea would be to reduce the numbers of nest predators in inland breeding sites. To us, this concept of carrying capacity is much more akin to the notion of equilibrium population size than to the widely-held understanding that carrying capacity should measure the ability of a wintering site itself to support birds (Goss-Custard 1993). It might be instructive, in fact, to model using the current approach to estimating carrying capacity the effect of a gradual year-on-year increase or decrease in the production of juveniles and/or survival of adults during the summer on the estimate of the carrying capacity of a wintering ground in which the feeding conditions stay exactly the same every year, but to our knowledge, this has not been done.
The events of the last decade or so have also question that shellfish stocks on the wintering grounds generally have a dominating influence on oystercatcher survival and subsequent breeding success. The populations of oystercatchers in the Netherlands in general and in the Wadden Sea in particular reached their maxima in the mid-1980 since when numbers have declined steadily (Allen 2019). Yet this continuing decline is not matched by a decline in cockles and mussels from which the birds obtain their highest intake rates (Zwarts et al. 1996a). From being virtually extinct in the littoral zone in the early 1990s (Ens et al. 2004; Ens 2006), mussels have increased in both the area they occupy and in biomass (van den Ende et al. 2018; Ens et al. 2009, 2019). From being at a low point in the early 1990s, the biomass of cockles has also increased since the late 1990s and early 2000s (Ens et al. 2009, 2019), yet there has been no upsurge in in the number of oystercatchers wintering in the Dutch Wadden Sea. There is thus no obvious link between the downward trend in oystercatcher numbers and the stock of cockles and mussels. It is noteworthy also that the number of oystercatchers wintering in the UK has also decreased since the mid-1990s and few if any of these birds breed in the Dutch Wadden Sea (Hulscher et al. 1996). The decline in the Wadden Sea oystercatcher population appears to be a component of a Europe-wide and as yet unexplained phenomenon.

18
We should make it clear at this point that these observations do not in any way imply that the abundance of shellfish on the wintering grounds have no effect on the oystercatcher population’s vital rates. They just mean that the shellfish stocks in winter are not the sole cause of the trajectory, average and annual variations in the size of the population: the stocks may be just one of several ‘limiting factors’ that between them interact to determine bird numbers at any one time and place (Goss-Custard 1993).
Oystercatchers usually have very high annual survival rates and produce very few young each year (Roodbergen et al. 2011). They therefore lack the ability rapidly to increase their numbers to the level of the potential carrying capacity when winter food stocks are temporarily high (Figure 4). Such a rapid exploitation of short-term spare capacity could only happen through immigration. In the Netherlands, however, oystercatchers more than one year old tend to be site-faithful from one winter to the next and are even reluctant to move from one part of the Wadden Sea to another even though they are losing condition (Verhulst et al. (2004). And although flocks of immigrating juvenile oystercatchers do sometimes in autumn move into an area to exploit a locally super-abundant stock of cockles (Sutherland 1982c), there are never likely to be enough juveniles produced each year in the Netherlands to provide the huge supply of potential recruits required to take advantage of the large stocks of cockles that are available in some years (Ens et al. 2004). The surplus stocks in such years can be viewed as ‘spare carrying capacity’ that cannot be exploited by the bird population because it cannot respond quickly enough to do so (Figure 4).

19
Figure 4. How oystercatchers cannot take advantage of the full foraging potential provided by cockles in years of very high abundance: an hypothetical example. The black circles show the
standing crop of cockles present on 1 September, the start of the non-breeding season over the years 2000 to 2008. They portray the typical sequence of high abundance every few years
following a large spatfall the previous year followed by a gradual year-on-year decline due to cockle harvesting, predation by oystercatchers and other predators and losses due to extremes of
temperature and/or gales or disease. The vertical bars show the biomass of cockles required by the current wintering population to survive the non-breeding season from 1 September to 31
March and to be in good condition at the start of the next breeding season in April. The bars vary a little in size because the numbers of oystercatchers fluctuates a little from year to year due to annual variations in survival and fecundity. The dashed line draws attention to the difference
between the total amount of cockles the current population of birds requires during a given non-breeding season and what is available for them to exploit: we refer to this as ‘the surplus or spare carrying capacity’. Much of this surplus could be removed before survival and body condition of
the current population of oystercatchers would be affected. Unless the birds have an improbable tendency to suppress their consumption in years of plenty to safeguard their food stocks in future years (Wynne-Edwards 1962), very large numbers of oystercatchers could in principle immigrate
into the area to take advantage of the massive surplus that is available. This does not usually happen because they are not enough birds in existence to do so. On the other hand, people
disinterested in the long-term survival of the fishery could do so, unless restrained from doing so either by long-term self-interest or statute. Nonetheless, cockle-harvesters with the long-term
survival of the fishery in mind could take a proportion of the large surpluses without any danger of lowering the survival and body condition of the birds and therefore affecting the size of the
oystercatcher population. They would only do this in the current non-breeding season if they reduced stocks to below the top of the vertical bars, but should not do this because of the long-
term implications for the stocks.

20
Figure 4 also portrays the issue facing shellfishery managers. There are years of large surplus when the harvest could be larger than the current limit of 2.5% without harming the birds while still ensuring the long-term survival of the cockle stocks. This dilemma is certainly not confined to the Netherlands. In Wales, for example, a mussel fishery’s harvest in summer and autumn was greatly limited by a fixed allowance even though, in most years, much of the stock remaining after harvest was washed away by winter gales. While it has been realised for many years that the law is sometimes ‘an ass’ (Chapman 1654), this regulation seemed to the shellfishers involved a particularly absurd breach of common sense and an unfair restriction on their commercial activities and, indeed, on their civil liberty to pursue an environmentally-neutral enterprise.
The distinction between population size as used in the current approach to carrying capacity and our own suggested approach is illustrated another way in Figure 5. This uses a population model to follow the change in the size of an oystercatcher population that exploits a widely-fluctuating winter food supply. As in Figure 4, there are many years in which the food supply over the non-breeding season is greatly in excess of the requirements of the current oystercatcher population. Over a run of such years, the population size gradually increases as the annual, but small, recruitment of juvenile birds increases total numbers and most adults survive the non-breeding season. But the increase is checked by the occasional year in which the food supply during the non-breeding season is so low that survival across all age-classes decreases and the population goes down.
Figure 5 illustrates the difference between the two approaches to defining and measuring carrying capacity. The current approach focusses on the years of low shellfish stocks during which the potential but gradual rise in oystercatcher numbers is checked. Our approach focusses on each year separately by (i) allowing higher harvests in years of abundance but (ii) allowing much lower, or even no, harvest at all in years of scarcity. The criteria of decision are (i) the harvest must not reduce the oystercatcher population’s vital rates in the current non-breeding and following breeding season, and (ii) the effect of the harvest on the stocks in subsequent years must be taken into account; that is, it is important to know how much could be taken in years of abundance without significantly reducing the stocks available to the birds and cockle-fishers in subsequent years.
In the particular case of the cockle fishery of the Dutch Wadden Sea, doubling a harvest measured as a constant and low percentage of the standing stock– in the present case 2.5% - may have no effect at all on oystercatchers when cockles are very abundant: this has been understood for many years (Rappoldt et al. 2003a). On the other hand, even such a low statutory harvest could be very damaging to oystercatchers in years of cockle scarcity - especially if much of the fishing effort is concentrated in a limited number of open areas and repeated year by year. In our view, it is therefore preferable to consider the impact of cockle harvesting on a winter by winter, area by area basis. This would allow larger harvests to be collected in some years but little or none in others. Accordingly, we compare the carrying capacity of an area after harvesting with the food requirements of the oystercatchers in the area during the non-breeding season in question while taking into account, as best we can with the information available, that a 2.5% harvest might have implications for the survival of both birds and fishery in subsequent years.
21
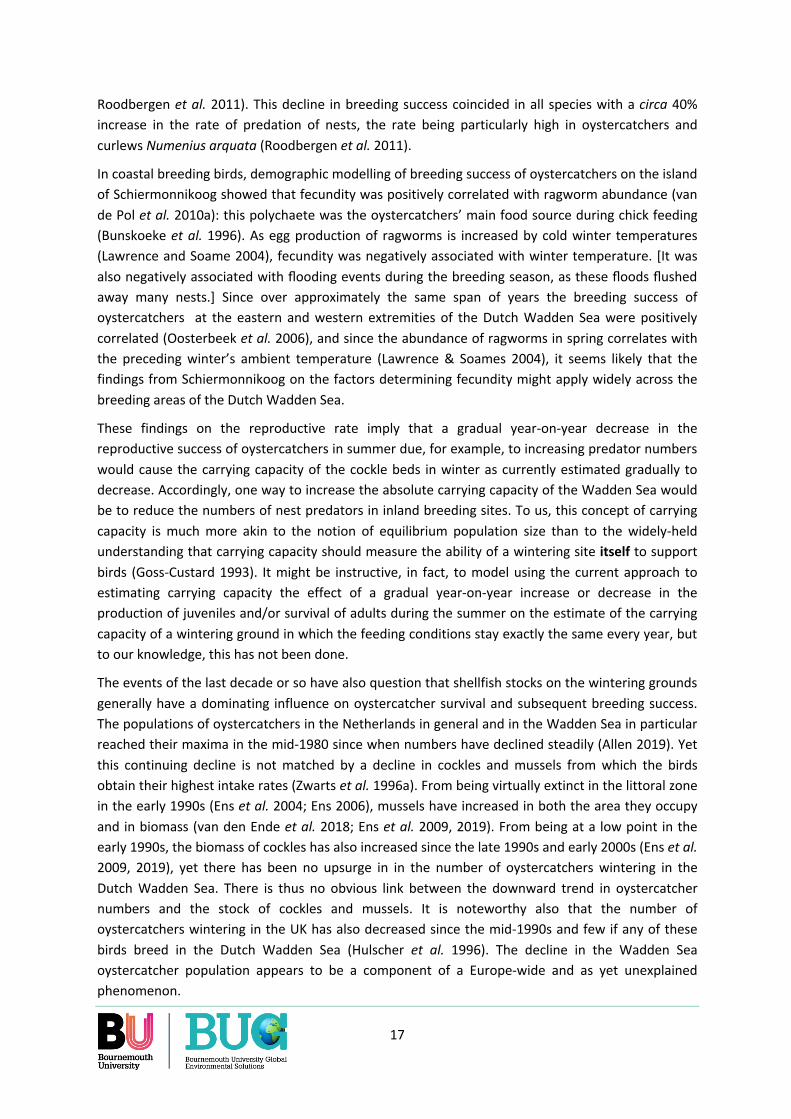
Figure 5. The occasional year with very low food stocks during the non-breeding season checks the previously gradual rise in the population due to several years of juvenile recruitment and high
survival rates during the non-breeding season. Annual changes in the food supply in winter are shown by the broken line. The ‘single-winter’ or ‘within-winter’ or ‘surplus’ carrying capacity is shown by the continuous thin line. The continuous thick line shows how the population would change from year to year with realistic annual mortality rates and numbers of juvenile recruits
arriving each autumn: the procedure is described in Stillman et al. (2003). Clearly, in years of high stocks of shellfish, the number of oystercatchers is far below the potential capacity of the estuary
to support the birds and so survival during the non-breeding season is high and the population increases but only slowly because of the low rate of recruitment. The increase is checked by the
occasional non-breeding season when the food supply is extremely low: only then does the number of birds coincide with that year’s carrying capacity. Note that in many years of low mussel stocks there is still a surplus of food available so the population increase is not checked; it is only
in the occasional year of very low stocks when this happens. Taken from Goss-Custard et al. (1996b).
22
4.4 Cockle harvesting and oystercatcher population size
The objective of avian conservation policy is primarily focussed on the size of the populations of the species in question. Maintaining or increasing its size is usually regarded as a success whereas a decline would be viewed as a worrying trend that should be reversed. We discuss now our approach to understanding how the population size in oystercatchers is determined.
At large spatial scales, population size is determined by the interaction between two demographic rates: the per capita rate of mortality and the per capita rate of reproduction. If these two quantities are on average equal over a period of years, the population will stabilise around an equilibrium level. In fact, this is probably quite a rare circumstance in nature because both reproductive and mortality rates can trend up or down over periods of years: although possessing the mechanisms to home in on an equilibrium size, the actual population may seldom attain this state in an ever-changing environment. Nonetheless, the size of the population may decrease year by year because the reproductive rate on the breeding grounds is gradually decreasing, even though the mortality rate – including that proportion of it that occurs on the wintering grounds – remains constant, or even increases: the outcome is all a question of the interaction of quantities (Goss-Custard 1993). In practice, it can take many years of difficult and expensive research to establish the causes of a consistent trend downwards (or upwards) in the size of a population, especially in migratory species like the oystercatcher where much of the annual mortality and all of the reproduction occurs in different places. Unfortunately, in an ever-changing world, it is entirely likely that, by the time the research has reached a conclusion, the factors responsible for the change in population size will also have changed!
Our proposed approach to managing the habitats of overwintering shorebirds is to measure the condition of a wintering site in terms of two metrics (Goss-Custard & Stillman 2010, 2019a). The first is the survival rate – or conversely the mortality rate – that the wintering site enables the birds to achieve. The second is the body condition since body condition at the time the birds migrate in spring may affect their chances of reaching the breeding grounds and of breeding successfully. If an activity, such as manual cockle fishing, does not reduce either the overwinter survival rate or the body condition of departing adults in spring – either in the current year or subsequently - it will not have an effect on the size of the population. The cause of any decline in population size must therefore be sought elsewhere.
Accordingly, our approach here is to test whether manual cockle fishing reduces the overwinter survival rate of oystercatchers or, to put it another way, increases their mortality rate over a single winter period. Generally, the body condition of birds in various MORPH models track the mortality rate very closely so, for simplicity, we refer here only to the mortality rate. The aim of our analysis is to answer the question: ‘Does manual cockle-fishing increase the overwinter mortality rate above the level it would have been in the absence of cockle fishing?’ Or to put the question another way:’ Does manual cockle fishing reduce the ability of the Dutch Wadden Sea to support oystercatchers at their natural rate of overwinter survival?’ That is: ‘Does manual cockle fishing reduce carrying capacity?’

23
4.5 Definition of the cockle food supply
Currently, the cockle food supply of oystercatchers is regarded as those occurring in places at densities above 50/m2. We make the case here that excluding cockles at lower densities ignores a food supply that plays an important role in determining the overwinter survival of oystercatchers.
Oystercatchers can achieve high intake rates where cockle density is below 50/m2
Data from a review of intake rates in waders show that oystercatchers are able to maintain a high intake rate at much lower densities than 50/m2 if the cockles contain much flesh (Figure 6). In these circumstances, oystercatchers can achieve the typical intake rate of 2 mg AFDM/s even when the density of cockles is <10/m2. Oystercatchers can also achieve a high rate of consumption when mussels are at extremely low densities (Goss-Custard et al. 2006). To humans, these birds are extraordinarily skilful at locating scarce food items.
Figure 6. Intake rate of cockle-feeding oystercatchers as a function of prey density (x-axis) and prey size (diameter of the circle). The grey line is not relevant to this report. Fig 16. in Zwarts et al.
(1996a).
Areas with low intake rates can influence the overwinter survival of cockle-eating oystercatchers
In autumn the food supplies of oystercatchers are usually abundant, the profitability of the prey is high and the birds’ own energy requirements are relatively low. With one or two surprising and not yet understood exceptions (Ens et al. 2015), the birds have little difficulty obtaining their daily food requirements at this time of year. In general, the birds stay in the roost over the high-tide period and only move onto the intertidal flats after the lower levels of the shore have been exposed by the receding tide. The birds’ energy requirements increase during winter and at the same time the profitability of many of their shellfish prey diminishes as they lose mass. At that time of year, oystercatchers move out onto the intertidal flats much earlier during the exposure period than they had done in autumn and leave the flats much later (Heppleston 1971; Goss-Custard et al. 1977b,
24
2019b). As a result, oystercatchers feed on upshore flats in winter that in autumn they would ignore and overfly on their way out to the low-lying, and more profitable feeding areas further downshore.
Currently, there are two explanations for the downshore shift in feeding location as the tide recedes. One is that, as sandy sediments dry out after the tide has receded, the intake rate of oystercatchers decreases: the sediment may be more difficult for the birds to penetrate and/or the cockles close their shells to avoid dessication, thus making themselves less vulnerable to attack by stabbing oystercatchers. The other explanation is that cockles at the lower levels of the shore are both larger and, at a given length, contain more flesh and this makes them more profitable to oystercatchers compared with cockles higher up the shore: both trends are illustrated by data given by Sutherland (1982b), and supported by data on cockle-feeding oystercatchers on the Exe estuary (J D Goss-Custard, unpublished information).
The intake rates achieved by oystercatchers in winter on the upshore flats is generally low compared with those they obtain further down the shore on larger and more fleshy prey. The upshore intake rates of cockle-eating oystercatchers have been estimated six times on the Exe estuary between 1995 and 2019 and averaged 0.576 mg AFDM/s (s.e. = ±0.109; n = 6) (Stillman et al. (1996b; J.D. Goss-Custard, unpublished information). The intake rates of oystercatchers eating other prey species, such as ragworms, clams and winkles, on the upshore flats of the Baie de Somme, the Bangor flats in north Wales and of the Exe estuary were, respectively 0.593 mg AFDM/s (P. Triplet, pers. comm.), 0.867 mg AFDM/s (Caldow et al. 2004) and 0.673 mg AFDM/s (Stillman et al. 2000). On the Exe estuary, terrestrial feeding on earthworms can also be a very important source of additional food (Appendix 7) despite the low intake rate of 0.53 mg AFDM/s and unavailability to oystercatchers at low soil temperatures, and is a food source that is utilised in some parts of the Dutch Wadden Sea All these upshore intake rates are <1 mg AFDM/s and so well below the more typical intake rates achieved by oystercatchers eating cockles of around 2 mg AFDM/s (Zwarts et al. 1996a).
Simulations with the MORPH model for the Wash, UK show that these low intake rates do not diminish the importance of the feeding done on the upshore flats during winter (Figure 7). The ability to forage upshore is clearly very important to survival. The reason seems to be that, even when the intake rates they provide are small compared with the more typical downshore intake rates of >2 mg AFDM/s, upshore foraging extends the time available for which the birds can feed (Goss-Custard & Stillman 2019).

25
Figure 7. The mortality rate of shellfish-eating oystercatchers on the Wash as predicted by the model MORPH in winters when shellfish are abundant (>40kg AFDM per oystercatcher) and scarce
(<30 kg AFDM per oystercatcher) in relation to the assumed intake rate of the birds on the upshore flats. When shellfish are abundant, the upshore intake rate has little effect on the
predicted mortality rate, which is always very small. In winters of shellfish scarcity, and with no upshore foraging available, the predicted rate of starvation is >50%. The predicted rate decreases as the assumed intake rate on the upshore flats increases and is 0% when the birds obtain 1 mg AFDM/s when feeding on the upshore flats on the receding and advancing tides (Stillman et al.
2003).
Cockles below harvestable size can make an important contribution to oystercatcher survival
Simulations with the model MORPH for the cockle-eating population of oystercatchers in the Burry Inlet have shown that an oystercatcher population can be supported to a significant extent by cockles below harvestable size, 21mm in that case (Stillman et al. 2001). This possibility cannot be explored here for the Dutch Wadden Sea because there are no data on the abundance, size and flesh-content of cockles below harvestable size. This is perhaps an omission that might be avoided in future surveys.
26
Implications for calculating the food supply of oystercatchers
The ability of oystercatchers to forage successfully on densities of harvestable cockles well below 50/m2, on cockles below harvestable size along with the importance of upshore feeding areas in winter suggest that all the cockle stocks, and not just those occurring at densities >50/m2, should be included in the measure of the cockle food supply, notwithstanding the low intake rates of <1 mg AFDM/s that may occur there. Including the upshore foraging areas has been the normal practice whenever the carrying capacity of an area has been calculated using MORPH. We therefore suggest that more of the cockle stock might be included in the estimates of the food supply of oystercatchers in the Wadden Sea and not just that part of it that occurs at densities >50/m2, and we do this in some places below. From Figure 6, when doing so we chose the cut-off density as 10 cockles/m2.

27
5. THE SINGLE-WINTER CARRYING CAPACITY FOR OYSTERCATCHERS OF THE DUTCH WADDEN SEA
5.1 Overwinter mortality and carrying capacity
As already discussed, it is most unlikely that the ‘one in, one out’ carrying capacity illustrated in Figure 2 ever applies in every year in such a highly competitive and long-lived species as oystercatchers eating widely-fluctuating populations of shellfish (Goss-Custard et al. 1997). In fact, were this measure of carrying capacity ever to be achieved by means of mortality, the high rate (circa 25%) it would require (September to March inclusive) would have an enormous impact on equilibrium population size (Goss-Custard et al. 1996a). Such high rates only occur exceptionally in wintering shellfish-eating oystercatchers during very severe weather or when both cockles and mussels are scarce (Swennen 1984; Hulscher et al. 1984; Stock et al. 1987, Neve & van Noordwijk 1997, Zwarts & Wanink 1996, Atkinson et al. 2003, Oosterbeek et al. 2006, Duriez et al. 2009, 2012; Camphuysen et al. 1996, Schwemmer et al. 2014; Roodbergen et al. 2011). Mortality can be especially high when both these conditions coincide, with >30% dying (Duriez et al. 2012).
Severe winters and reduced food stocks do not necessarily lead to greater mortality, however. Both Duriez et al. (2009, 2012) and Camphuysen et al. (1996) report that not all winters that were regarded as severe by people killed large numbers of oystercatchers. Similarly, even large reductions in the food supply do not necessarily reduce oystercatcher survival. For example, engineering works in the Oosterschelde reduced the intertidal area, and presumably the food supply, available to shorebirds by one third, yet in mild winters there was no detectable increase in the mortality rate of oystercatchers (Duriez et al. 2009). Similarly, on the Wash, oystercatchers maintained a high survival rate if cockles were very scarce as long as there were abundant stocks of mussels, but not if both shellfish were scarce (Atkinson et al. 2003). This is likely to have been the case in the Dutch Wadden Sea as well (Ens et al. 2004).
Normally, the overwinter mortality rate in oystercatchers is quite low. According to our definition of carrying capacity over a single winter period, it is necessary to know the ‘natural’ or ‘normal’ mortality rate of overwintering oystercatchers in the absence of severe weather and of food shortage caused by cockle-fishing. We decided that we needed to know the winter mortality rate of adult birds rather than of sub-adult birds because population size in oystercatchers seems to be sensitive to this numerically dominant age-class on the Wash (Atkinson et al. 2003), in the Netherlands (Oosterbeek et al. 2006) and in Europe as a whole (Klok et al. 2009); note, however, this assumption may need to be revised in future as the mortality rate of birds between fledging and first-breeding in Klok et al.’s study also had an influence on population size although a smaller one than that of adults. Simulations with the Burry Inlet 2000-01 version of MORPH suggested, however, that the ecological requirements of immature and juvenile oystercatchers might be quite similar to those of adult birds, and possibly even slightly lower (Appendix 7). It may make no difference therefore if future research finds that it would be more appropriate to use young birds rather than adults in defining the value of the 2%EM.
A review of the literature concluded that the ‘normal’ overwinter mortality over the period September 1st to March 31st in adult oystercatchers is 2% (Appendix 1). This led to the definition of carrying capacity used in this report: the carrying capacity of a wintering area is the population size

28
at which the density-dependent overwinter mortality rate of adult birds is 2%. This is called the ‘2% Carrying Capacity (2%CC)’.
5.2 Estimating the 2% ecological requirement of the oystercatcher population
Consider an overwintering population of N adult oystercatchers that only consumes cockles above the minimum fishable size of 20mm. The initial stock on 1 September is 758 tonnes Ash-Free Dry Mass (AFDM). Harvesting by manual shellfishers is carried out during summer before the birds arrive. How much of the 758 tonnes that remain on 1 September could be harvested through autumn and winter without causing more than 2% of adult oystercatchers to starve at some point during the winter?
This question is answered by running a series of simulations with MORPH. In these simulations, the initial stock present on 1 September in a particular year is multiplied by a range of fractions to identify the fraction that coincides with a mortality rate of 2%. In the example in Figure 8, the estimated fraction at 2% mortality is 0.2081 for the population of 12343birds that spent the 2000-01 non-breeding season in the site modelled, the Burry Inlet, Wales. This means, that after harvesting, 158 of the initial 758 tonnes (0.2081x758) had to be left if N adult birds were to maintain an overwinter mortality rate of 2%. This amount is called the ‘2% Ecological Requirement’ of the population. In principle, the cockle fishers that winter could have harvested 600 (758-158) tonnes AFDM from the stock of cockles present on 1 September without increasing the birds’ overwinter mortality rate above its normal level, although the possible longer-term consequences for the abundance of cockles would also have to be taken into account.
As some of the 2% of adults would have died from causes other than starvation, 2% might be considered too high a rate to use as the criterion. If many of the 2% died from accidents, for example, perhaps a lower rate should have been used, as in our original paper (Goss-Custard et al. 2006b). Such a low rate may have been over-precautionary, however, because birds that were losing condition and likely to be en route to starving may have been killed by accident or predator (Cresswell 1994; Goss-Custard et al. 1996c) or subjected to infestation by lethal gut parasites (Goss-Custard et al. 1996c), risks that they might have avoided had they not been starving. But in fact, simulations with MORPH of the Burry Inlet cockle fishery in 2000-01 showed that ecological requirement was rather little affected by the mortality rate used to define it: over the rates of 0.5%, 1.0% and 2%, the predicted requirements differed by up to 10% (Appendix 10). This suggests that using a target mortality rate of 2% might have under-estimated the ecological requirement by up to 10%. The precautionary measure, therefore, is to allow for a possible 10% under-estimate when comparisons were made between how much food the birds required and how much remained for them after harvesting.

29
Figure 8. How the 2% ecological requirement - stock of cockles that should be left for oystercatchers after harvesting - is calculated using the model MORPH. Each point shows the predicted mean mortality rate of adult birds, each one being based on ten simulations. The
horizontal and vertical lines illustrate how the fraction of the initial stock that gives a mortality rate of 2% is estimated from the quadratic equation above the graph.
5.3 The 2% ecological multiplier
An average oystercatcher in a population of 12343 birds in this estuary consumes over the winter a total of 10.5 kg AFDM. The ‘Physiological Requirement (PR)’ of the whole overwintering population is therefore 129 602 kg AFDM (12.343x10.5), or 130 tonnes. If the birds obtain all their energy requirements from cockles of fishable size, and if the normal adult mortality rate of 2% is to be maintained, the stock of cockles remaining after harvesting needs to be 1.215 (158/130) times the amount they will actually consume. This ratio between the amount of cockle flesh required to give an adult mortality rate of 2% and the amount that the population needs to consume is called the ‘2% Ecological Multiplier (2%EM)’. This can be calculated for a single oystercatcher or for a population. If we know the value of 2%EM, the food requirements of any number of birds can be calculated by multiplying the physiological requirements between 1 September and 31 March by the 2%EM. The 2%CC of an area is calculated by dividing the biomass of cockles by the 2%ER of a single oystercatcher.
What value of the 2%EM should be used in the case of the Dutch Wadden Sea? Stillman & Wood (2010) reviewed the values of the multiplier then available and found a wide variation that could not be fully explained. In just the Burry Inlet in south-west Wales, for example, the predicted values varied over seven winters between 2.0 and 5.7, the mean being 3.43 (± s.d. = 1.42). Subsequent unpublished (J.D. Goss-Custard) and published (Goss-Custard et al. 2019a) findings identified some correlates of the variation in 2%EM. Values of these factors for the Dutch Wadden Sea were obtained from published and unpublished sources and used to derive an estimate of the 2%EM for the Dutch Wadden Sea (Appendix 2). The choice of 3.25 accords well with the single previous estimate of 3.1 for the Dutch Wadden Sea (Ens et al. 2004; Ens 2006).

30
6. HOW HARVESTING WAS CONDUCTED
The data from the open and partially open sectors of each area were combined because no record was kept in any area of the proportion of the harvest that came from each of these two parts: these are called ‘combined areas’. Areas 8 and 9 were combined for the same reason. No fishing occurred in the closed areas, of course, so the analysis here is restricted to the combined areas 1, 2, 3, 4, 5, 6,7 and to 8+9 (sometimes called ‘89’).
Because of the logistical difficulty of doing so, no counts could be made on the ground of the numbers of oystercatchers that wintered in these areas. It was therefore not possible to estimate the 2%ER of the actual number of birds that depended on the food supplies in a given area in a given year. Although we attempt to estimate oystercatcher numbers in each area later in the report, we began the analysis by calculating by how much harvesting would have reduced the 2%CC of each combined area in each of the winters from 2007-08 to 2018-19.
Data on cockle biomass and the harvest were measured as fresh-weight, which included the shells, water and flesh, material that is not assimilated by the birds. As the ash Free Dry Mass (AFDM) is the appropriate measure of the food value of the prey to oystercatchers (Zwarts et al. 1996a), fresh-weight was converted to AFDM by multiplying it by 0.038 (Appendix 3).
Our expectation was that fishermen would concentrate harvesting in areas with abundant cockles. We therefore expected the impact of cockle fishing on the 2%ER to vary between areas in relation to the standing crop of cockles present on 1 September. The analysis refers to the winter harvest taken between 1 September and 31 March as the purpose of this project is to investigate how the harvest that was carried out during the winter might have affected the oystercatchers’ food supply.
Fishermen seemed likely to concentrate their harvesting in places not only where cockles of harvestable size were most abundant but also in those places where (i) cockle density was very abundant, defined as exceeding 600/m2, and (ii) cockles were large and therefore profitable. A multiple regression analysis was carried out to identify correlates of the percentage of the total ‘winter harvest’ (that collected between 1 September and 31 March) using the data from all areas and winters. The explanatory variables included in the analysis were: (i) the standing crop biomass of cockles of harvestable size (>21mm long) on 1 September (kg AFDM); (ii) the proportion of the combined area in which the density of harvestable cockles exceeded 600/m2, and (iii) the mean flesh-content of the cockles of harvestable size (mg AFDM). An initial GLIM analysis did not expose a significant between-year variation so the data from all years and areas were combined in a multiple regression analysis.
Contrary to expectation, the association with the proportion of a combined area with cockle densities >600/m2 was negative when the effect of both the other two variables, or just the standing crop in 1 September, were taken into account; that is, the harvest was proportionately smaller where a high percentage of the ground was occupied by cockles at densities >600/m2. The correlations with standing crop and mean flesh-content were both positive and significant, which was according to expectation (Table 2). The relationship between the size of the harvest and the more influential predictor variable, the standing crop cockle biomass on 1 September, is plotted in Figure 9.

31
Data on the size of the harvest removed over the winter (1 September to 31 March) was available for the 8 combined areas for all winters except 2007-08. No fishing occurred in 43% of the combined area-years (Figure 10). All the fishing was carried out in only just over half of the area-years. The analysis therefore focusses on these 55 data which are detailed in Table 3.
The annual harvest exceeded 2.5% in 17 of the 55 area-years for which data are available (Table 3). Almost 30% was harvested in one exceptional area/year but all the remainder were <12% (Figure 11).
Table 2. Correlates of the percentage of the total winter (1 September and 31 March) harvest across all 75 combined area-years for which data are available. The units were: standing crop on 1
September, kg AFDM; mean flesh content of cockles of harvestable size, mg AFDM. This analysis refers to all the cockles in each and not just those occurring at densities >50/m2. The results were essentially the same if the standing crop biomass of the cockles occurring at densities >50/m2 only
were used instead.
Predictor Coefficient s.e. T P DF R-Sq (adj.)
P
Constant -21.84 9.301 -2.35 0.022
*Standing crop 1 Sep.
0.0000098 0.0000021 4.60 0.000
Mean flesh content 0.08278 0.02768 2.99 0.004 74 23.2 0.000
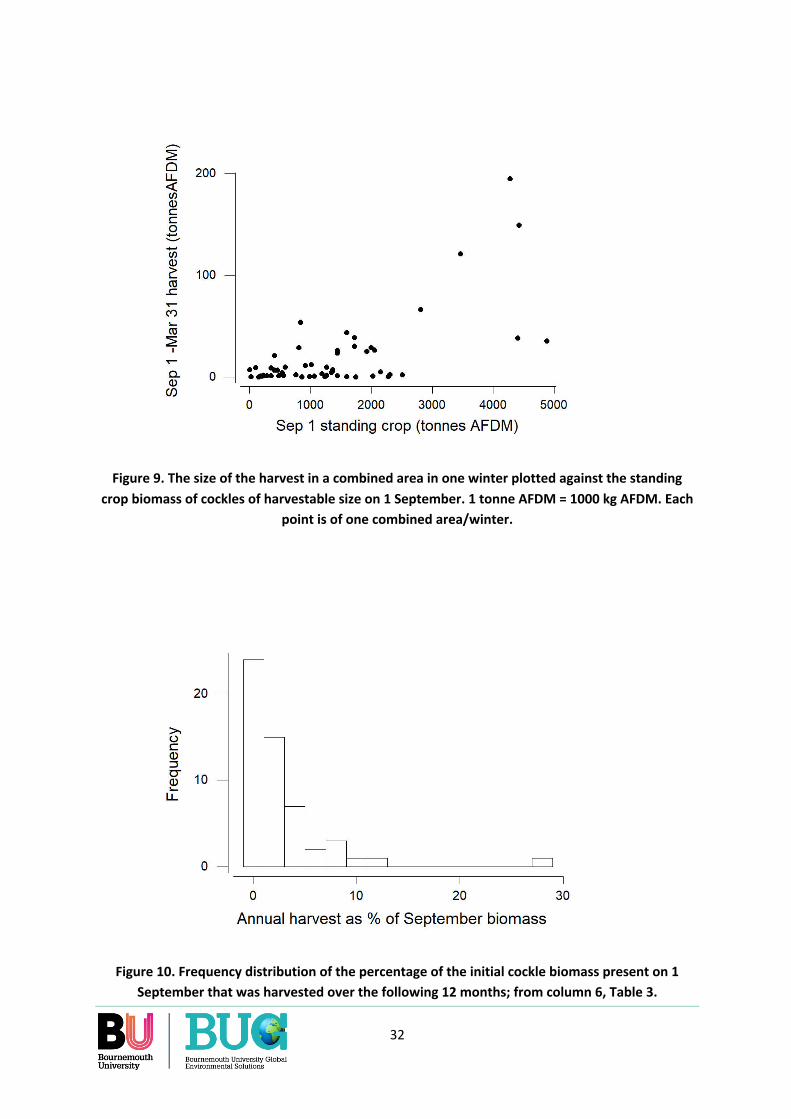
32
Figure 9. The size of the harvest in a combined area in one winter plotted against the standing crop biomass of cockles of harvestable size on 1 September. 1 tonne AFDM = 1000 kg AFDM. Each
point is of one combined area/winter.
Figure 10. Frequency distribution of the percentage of the initial cockle biomass present on 1 September that was harvested over the following 12 months; from column 6, Table 3.
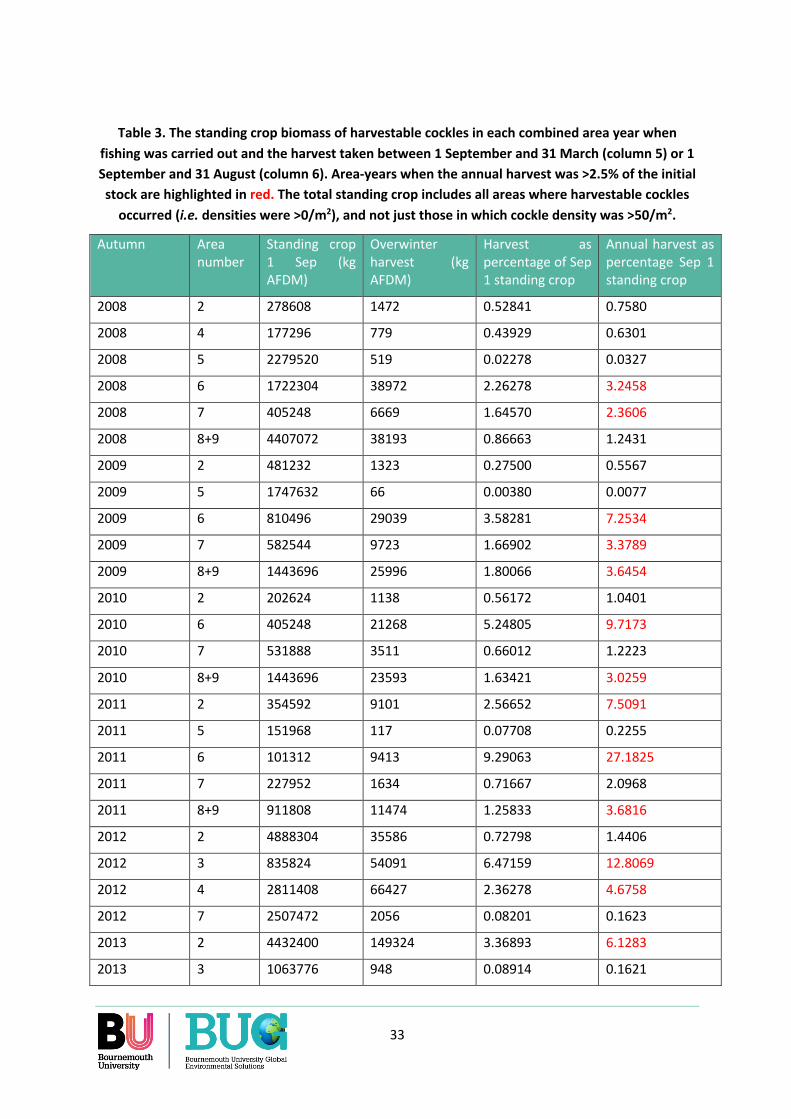
33
Table 3. The standing crop biomass of harvestable cockles in each combined area year when fishing was carried out and the harvest taken between 1 September and 31 March (column 5) or 1 September and 31 August (column 6). Area-years when the annual harvest was >2.5% of the initial stock are highlighted in red. The total standing crop includes all areas where harvestable cockles
occurred (i.e. densities were >0/m2), and not just those in which cockle density was >50/m2.
Autumn Area number
Standing crop 1 Sep (kg AFDM)
Overwinter harvest (kg AFDM)
Harvest as percentage of Sep 1 standing crop
Annual harvest as percentage Sep 1 standing crop
2008 2 278608 1472 0.52841 0.7580
2008 4 177296 779 0.43929 0.6301
2008 5 2279520 519 0.02278 0.0327
2008 6 1722304 38972 2.26278 3.2458
2008 7 405248 6669 1.64570 2.3606
2008 8+9 4407072 38193 0.86663 1.2431
2009 2 481232 1323 0.27500 0.5567
2009 5 1747632 66 0.00380 0.0077
2009 6 810496 29039 3.58281 7.2534
2009 7 582544 9723 1.66902 3.3789
2009 8+9 1443696 25996 1.80066 3.6454
2010 2 202624 1138 0.56172 1.0401
2010 6 405248 21268 5.24805 9.7173
2010 7 531888 3511 0.66012 1.2223
2010 8+9 1443696 23593 1.63421 3.0259
2011 2 354592 9101 2.56652 7.5091
2011 5 151968 117 0.07708 0.2255
2011 6 101312 9413 9.29063 27.1825
2011 7 227952 1634 0.71667 2.0968
2011 8+9 911808 11474 1.25833 3.6816
2012 2 4888304 35586 0.72798 1.4406
2012 3 835824 54091 6.47159 12.8069
2012 4 2811408 66427 2.36278 4.6758
2012 7 2507472 2056 0.08201 0.1623
2013 2 4432400 149324 3.36893 6.1283
2013 3 1063776 948 0.08914 0.1621
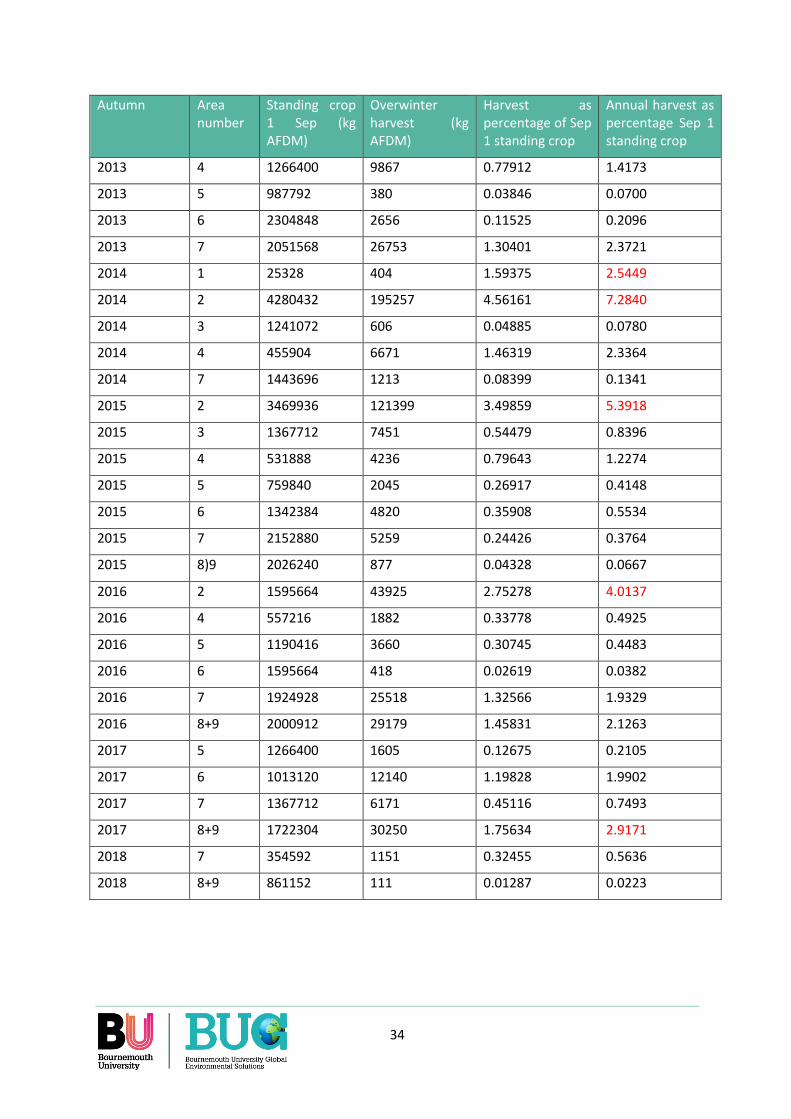
34
Autumn Area number
Standing crop 1 Sep (kg AFDM)
Overwinter harvest (kg AFDM)
Harvest as percentage of Sep 1 standing crop
Annual harvest as percentage Sep 1 standing crop
2013 4 1266400 9867 0.77912 1.4173
2013 5 987792 380 0.03846 0.0700
2013 6 2304848 2656 0.11525 0.2096
2013 7 2051568 26753 1.30401 2.3721
2014 1 25328 404 1.59375 2.5449
2014 2 4280432 195257 4.56161 7.2840
2014 3 1241072 606 0.04885 0.0780
2014 4 455904 6671 1.46319 2.3364
2014 7 1443696 1213 0.08399 0.1341
2015 2 3469936 121399 3.49859 5.3918
2015 3 1367712 7451 0.54479 0.8396
2015 4 531888 4236 0.79643 1.2274
2015 5 759840 2045 0.26917 0.4148
2015 6 1342384 4820 0.35908 0.5534
2015 7 2152880 5259 0.24426 0.3764
2015 8)9 2026240 877 0.04328 0.0667
2016 2 1595664 43925 2.75278 4.0137
2016 4 557216 1882 0.33778 0.4925
2016 5 1190416 3660 0.30745 0.4483
2016 6 1595664 418 0.02619 0.0382
2016 7 1924928 25518 1.32566 1.9329
2016 8+9 2000912 29179 1.45831 2.1263
2017 5 1266400 1605 0.12675 0.2105
2017 6 1013120 12140 1.19828 1.9902
2017 7 1367712 6171 0.45116 0.7493
2017 8+9 1722304 30250 1.75634 2.9171
2018 7 354592 1151 0.32455 0.5636
2018 8+9 861152 111 0.01287 0.0223
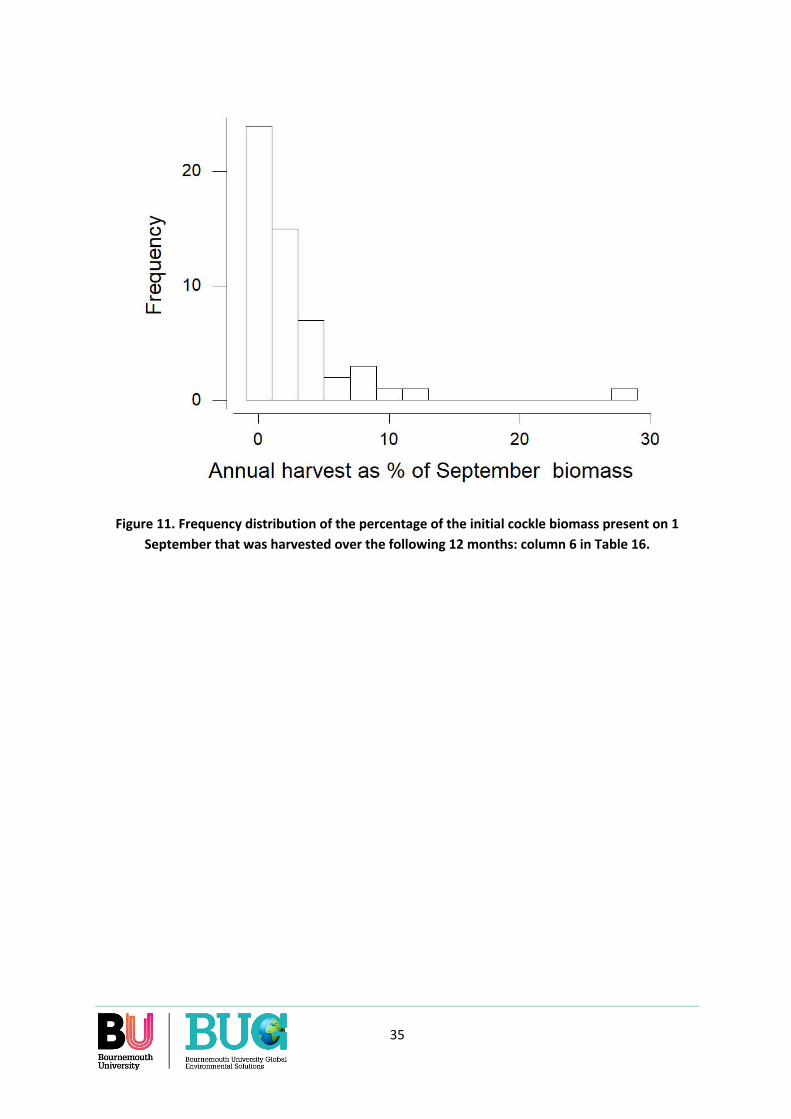
35
Figure 11. Frequency distribution of the percentage of the initial cockle biomass present on 1 September that was harvested over the following 12 months: column 6 in Table 16.
36
7. CARRYING CAPACITY OF THE COCKLE BEDS FOR OYSTERCATCHERS
Here we ask: ‘What has been the effect of manual cockle harvesting in winter on the 2%CC for oystercatchers in the areas in which the harvesting was carried out and how close was the number of birds that wintered in these areas to carrying capacity after the harvest has been deducted?’ This question is posed at three spatial scales: (i) the whole Dutch Wadden Sea; (ii) the west and east regions of the Dutch Wadden Sea, and (iii) individual areas. The 2%CC could be calculated with equal confidence at each scale and winter estimates of oystercatcher numbers were available from SOVON for the two largest spatial scales. However, none was available for individual areas. Accordingly, we had to estimate the numbers that occurred in each area in each winter, and we cannot evaluate how reliable our estimates were. This is unfortunate as it was to this scale that the main question asked by the tender applies. We do what we can with the data available to discuss the confidence with which the comparisons between bird numbers and the 2%CC can be regarded.
This is an appropriate point at which to remind readers of the definitions of the terms used in this Report:
Physiological Requirement (PR): the total biomass of cockle flesh required by an individual oystercatcher or a population for birds to survive until the end of the non-breeding season in good body condition.
2% Ecological Requirement (2%ER): the biomass of cockles that needs to be present on the first day of the non-breeding season for 98% of adult birds to survive in good body condition until the end (or for an individual bird to have a 98% chance of surviving).
2% Ecological Multiplier (2%EM): the ratio between the supply of, and the demand for, cockle biomass by an individual or population of oystercatchers; i.e. the ratio of 2%ER divided by the PR on the first day of the non-breeding season.
2% Carrying Capacity (2%CC): the number of oystercatchers that the biomass of cockles present on the first day of the non-breeding season can support such that 98% of adults survive in good condition until the end.
Note that the quantities PR, 2%ER and 2%EM can be used for either the average bird in the population or for the whole population.
7.1 Annual and spatial variations in the effect of harvesting on carrying capacity of harvestable cockles at densities >50/m2
The reduction in the 2%ER in each area/year where harvesting occurred was estimated by subtracting the biomass removed by harvesting from the standing crop biomass present on 1 September (Table 3). This analysis is based on the cockles occurring at densities >50/m2 which is where the harvesting would have taken place. Each bird’s gross consumption from 1 September to 31 March was 9.86 kg AFDM (Appendix 4). With a 2%EM of 3.25, this meant that the 2%ER of each bird for the whole winter was 32.045 kg AFDM (3.25x9.86). The biomass of cockles harvested during the winter was deducted from the biomass present on 1 September to estimate how much would remain for oystercatchers after harvesting had taken place. This quantity was divided by 32.045 to estimate the numbers of oystercatchers that the remaining cockle food supply could support at a
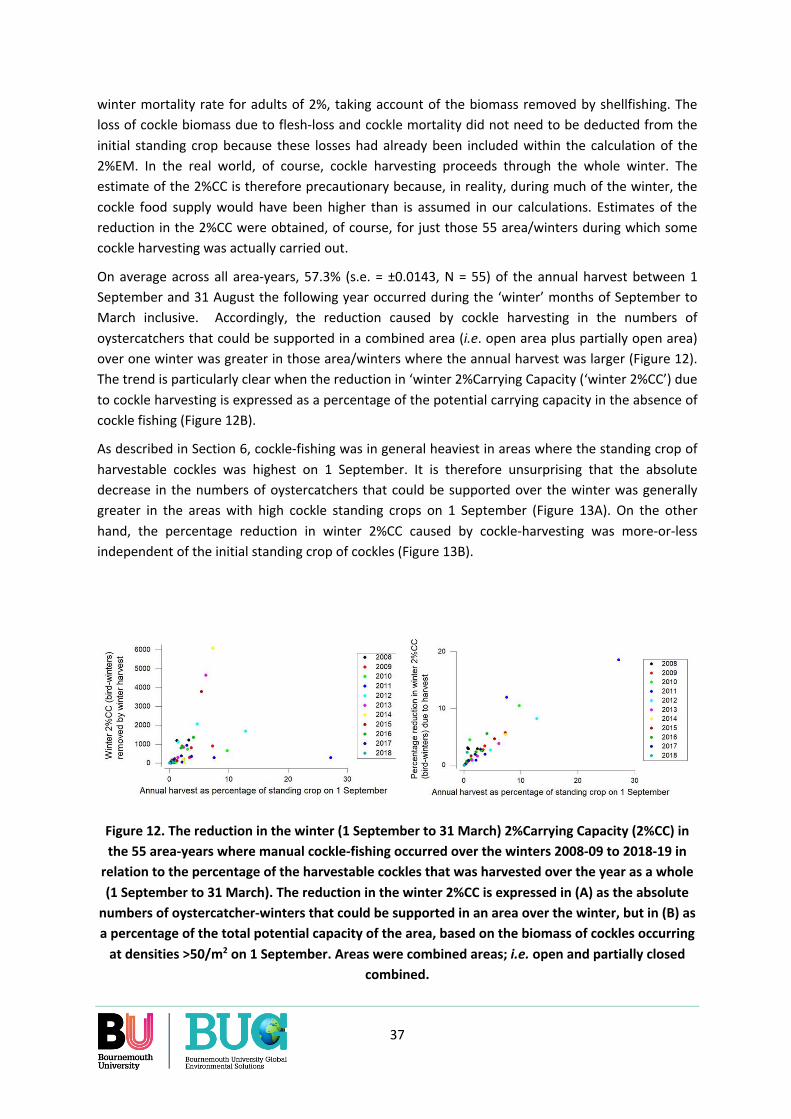
37
winter mortality rate for adults of 2%, taking account of the biomass removed by shellfishing. The loss of cockle biomass due to flesh-loss and cockle mortality did not need to be deducted from the initial standing crop because these losses had already been included within the calculation of the 2%EM. In the real world, of course, cockle harvesting proceeds through the whole winter. The estimate of the 2%CC is therefore precautionary because, in reality, during much of the winter, the cockle food supply would have been higher than is assumed in our calculations. Estimates of the reduction in the 2%CC were obtained, of course, for just those 55 area/winters during which some cockle harvesting was actually carried out.
On average across all area-years, 57.3% (s.e. = ±0.0143, N = 55) of the annual harvest between 1 September and 31 August the following year occurred during the ‘winter’ months of September to March inclusive. Accordingly, the reduction caused by cockle harvesting in the numbers of oystercatchers that could be supported in a combined area (i.e. open area plus partially open area) over one winter was greater in those area/winters where the annual harvest was larger (Figure 12). The trend is particularly clear when the reduction in ‘winter 2%Carrying Capacity (‘winter 2%CC’) due to cockle harvesting is expressed as a percentage of the potential carrying capacity in the absence of cockle fishing (Figure 12B).
As described in Section 6, cockle-fishing was in general heaviest in areas where the standing crop of harvestable cockles was highest on 1 September. It is therefore unsurprising that the absolute decrease in the numbers of oystercatchers that could be supported over the winter was generally greater in the areas with high cockle standing crops on 1 September (Figure 13A). On the other hand, the percentage reduction in winter 2%CC caused by cockle-harvesting was more-or-less independent of the initial standing crop of cockles (Figure 13B).
Figure 12. The reduction in the winter (1 September to 31 March) 2%Carrying Capacity (2%CC) in the 55 area-years where manual cockle-fishing occurred over the winters 2008-09 to 2018-19 in
relation to the percentage of the harvestable cockles that was harvested over the year as a whole (1 September to 31 March). The reduction in the winter 2%CC is expressed in (A) as the absolute
numbers of oystercatcher-winters that could be supported in an area over the winter, but in (B) as a percentage of the total potential capacity of the area, based on the biomass of cockles occurring
at densities >50/m2 on 1 September. Areas were combined areas; i.e. open and partially closed combined.

38
Figure 13. The reduction in the winter (1 September to 31 March) 2%Carrying Capacity (2%CC) in the 55 area-years where manual cockle-fishing occurred over the winters 2008-09 to 2018-19 in
relation to the standing crop biomass of harvestable cockles present on 1 September, the start of the annual harvesting year. The reduction in the winter 2%CC is expressed as: (A) the absolute
numbers of oystercatcher-winters that could be supported in an area over the winter, and (B) as a percentage of the potential 2%CC in the absence of cockle fishing. Areas were combined areas; i.e.
open and partially closed combined.
The reduction in carrying capacity as measured by our approach has a 1:1 relationship with the reduction in the standing crop of cockles caused by cockle harvesting, whether expressed in absolute values (Figure 14) or as percentages (not shown). This makes it very easy to calculate how manual cockle fishing reduces the ability of an area to support oystercatchers at their normal overwinter adult mortality rate of 2%. The reduction in carrying capacity can be calculated from this simple ‘daily ration’ model (Goss-Custard et al. 2002):
r = h/e.g Equation 3
where r = the reduction in 2%CC in oystercatcher/winters, h = harvest in kg AFDM, e = 2%EM (current value = 3.25) and g = the gross requirement for cockle flesh in kg AFDM of a single oystercatcher from 1 September to 31 March (current value = 9.86).

39
Figure 14. The reduction in the potential 2% carrying capacity – measured as bird-winters - of the 55 open and partially open fished areas in relation to the biomass of cockles removed by
harvesting in the same area and winter between 1 September and 31 March.
7.2 Carrying capacity taking other sources of food into account
Although not the primary issue with which this report is concerned, it may be of interest to consider these local reductions in winter 2%CC in relation to the cockle stocks in the whole of the Dutch Wadden Sea. The mean winter harvest from all open and partially open areas combined over the 11 years of the study was 99 583 kg AFDM. With a 2%ER for the average oystercatcher of 32.045 kg AFDM, the cockle harvest equates to a 2%CC of 3108 (99 583/32.045) oystercatcher-winters. The approximate average number of wintering oystercatchers in the Dutch Wadden Sea over the years 2008-09 to 2018-19 was 117 250 for which the 2%ER was 3 757 276 kg AFDM. The average biomass of harvestable cockles present on 1 September in all the open and closed areas of the Dutch Wadden Sea combined over the same period in the places where cockles occurred at densities >50/m2 was 9 564 774 kg AFDM. The average potential 2%CC of the harvestable cockle stocks alone before the winter harvest had taken place was therefore 298 479 oystercatcher/winters, 2.6 times the average number of oystercatcher-winters that overwintered in the Dutch Wadden Sea over the same period. On average over those 11 years, manual cockle-harvesting reduced the 2%CC of the harvestable cockle beds by 1.04%.

40
Oystercatchers took prey other than cockles at harvestable densities >50/m2, however Adding these other sources of food to the calculation of the 2%CC increased the estimate for the carrying capacity of the Dutch Wadden Sea, depending on which additional sources of food are included in the calculation (Table 4). We have some confidence in the estimates of the 2%CC provided by the sources of food in the first four rows of Table 4. Between them, they provided, on average over the period 2008-09 to 2018-19, 3.75 times the carrying capacity required to support the overwintering oystercatcher population of 117 250 birds. This capacity of 439 192 birds is approximately double the current maximum conservation target for wintering oystercatchers of 207 500 birds, the minimum target being 181 500 (B.J. Ens, personal communication). In comparison with this value, manual cockle fishing reduced the 2%CC on average by 0.71%. Had it been possible to include the other sources of food detailed in the bottom three rows of Table 4, the percentage reduction would have been correspondingly smaller.
Table 4. How adding additional food sources to harvestable cockles at densities >50/m2 increases the potential 2%carrying capacity of the Dutch Wadden Sea over the non-breeding seasons 2008-09 to 2018-2019. The top three rows refer to food supplies for which we have some confidence in
the estimates given. The assumed densities of oystercatchers on the additional food sources were: mussel beds, 20/ha; oyster beds, 4.0/ha (Appendix 5). There are insufficient data to estimate to
additional carrying capacity provided by the remaining three. The number of oystercatchers wintering on the Dutch Wadden Sea over the same years was 117 250.
Food supply added:
Cumulative 2%CC
(bird-winters)
Cockles >21mm long at >50/m2 298 479
plus cockles >21mm long at <50/m2 415 098
plus Macoma >15mm long* 415 382
plus mussel and oyster beds 439 192
plus cockles 15 – 20 mm long ?
plus other intertidal prey: e.g. Ensis ?
plus terrestrial food supplies ?
*The biomass of Macoma >15mm long was sufficient in principle to support 5678 oystercatchers but for the reasons present in the text, this value had to be reduced by a factor of 0.05.
41
Given the ability of oystercatchers to forage effectively at very low densities of cockles (>10/m2), we are also confident that cockles at densities <50/m2 could add significantly to the potential carrying capacity, but on present data, we cannot estimate by how much.
The same uncertainty does not apply to the potential additional carrying capacity provided by Macoma. Oystercatchers mainly eat the larger individuals (Zwarts et al. 1996a; Goss-Custard et al. 2006). The mean AFDM of Macoma >15mm long sampled in the spring surveys averaged 27.6 mg AFDM which, in summer, would provide the birds with an intake rate of 2-2.5 mg AFDM/s (Zwarts & Wanink 1993). Although the growth of individuals through the summer could approximately counter the reduction in flesh-content that occurs in individual Macoma over that period, there is an approximately 30% reduction in the flesh-content of individual Macoma between September and mid-winter (Zwarts 1991). In addition, in winter, Macoma bury themselves deeper in the substrate and a considerable proportion occur below 4cm, the depth below which oystercatchers mostly cannot reach them (Zwarts & Wanink 1993). The proportion of Macoma below 4cm varies greatly between winters but Figure 10 in Zwarts & Wanink (1993) suggests that, on average, approximately 30% of Macoma are within reach of an oystercatcher through the winter. Large Macoma are buried deeper than small ones (Zwarts & Wanink 1993), so only a small fraction of the biomass of Macoma present on 1 September would constitute a food supply for oystercatchers during the winter.
Our approximation of the proportion of Macoma biomass accessible to oystercatchers in winter would be (0.30 x 0.30 x 0.5), the values corresponding, respectively, with (i) the loss of flesh by individual Macoma; (ii) being buried below 4cm, and (iii) especially the large ones taken by oystercatchers. This means that only 5% of the Macoma biomass present in winter actually counts as a food supply for oystercatchers at that critical time of year. Therefore, the biomass present was multiplied by 0.05 to take into account the inaccessibility and reduced profitability of Macoma during winter. This reduced the potential 2%CC provided by this food source from 5678 oystercatchers to 284 (Table 4), an amount so small that Macoma are no longer included in the calculations of the winter food supply through the remainder of this report.
Cockles under harvestable length could add very significantly to carrying capacity. Simulations with the Burry Inlet 2000-01 model suggested that oystercatchers can survive very well when only cockles <20mm long are available; in that winter, all the harvestable cockles could have been harvested and 98% of adult oystercatchers would still have survived until spring.
Across the annual estimates summarised in Table 4, the standard deviations of the carrying capacities associated with each source of food varied between 75% and 30% of the mean, the highest being for cockles at densities >50/m2. That the large annual variability in the food supplies has in recent years been driven primarily by the fluctuations in the biomass of cockles is evident from Figure 15.
Figure 15 also highlights the fact that the favourable comparison on average between the carrying capacity of the Wadden Sea and the numbers of oystercatchers that wintered there owed much to the few years of very high cockle abundance. In five of the eleven years, the carrying capacity provided by cockles at densities above 50/m2 was below the number of oystercatchers that wintered on the Dutch Wadden Sea and/or the minimum conservation target numbers. Including cockles at densities <50/m2 and mussels may have reduced the number of these ‘marginal or difficult’ winters by two (2009 and 2017), but this is uncertain because of the unknown contribution made in both

42
years by cockles at low densities. Had the data been available to do so, adding cockles <21mm long to the food supply may have made a significant difference to the predicted carrying capacity. But this too is uncertain because, in some years, such cockles may have been too small to provide a profitable food source for oystercatchers: 2012 and 2018 may be examples of this (van Asch et al. 2019). Given the unknown magnitude of the confidence limits around the estimated carrying capacities in Figure 15, it is evident that winters of low cockle abundance do occur when it is highly appropriate to ask whether manual cockle-harvesting might reduce the carrying capacity of the Dutch Wadden Sea below the actual or target numbers of oystercatchers.
Figure 15. The within-winter 2% carrying capacity of the Dutch Wadden Sea over the winters 2008-09 to 2018-19 for the period 1 September to 31 March. Data from areas open to fishing or
partially open or permanently closed are combined. The black symbols show the actual number of oystercatcher-winters in the Dutch Wadden Sea as obtained counts by SOVON up until the winter 2011-12, after which we made an estimate. The coloured symbols show how the 2%CC increases
as the definition of the food supply food supply expands from harvestable cockles at densities >50/m2 (red) through harvestable cockles at any density (blue) and, finally, with mussel and oyster
beds added to the harvestable cockles at any density (green). The data include the reduction capacity due to winter harvesting of cockles. Macoma is not included as a food source for the
reasons discussed above. The dot circles show the maximum and minimum target conservation target for the number of oystercatchers in the Dutch Wadden Sea.

43
7.3 Impact of cockle fishing on carrying capacity in the western and eastern region
The need to focus on the years of cockle scarcity is emphasised by comparing the predicted carrying capacity and wintering oystercatcher numbers at the scale of the western and eastern regions of the Dutch Wadden Sea.
The numbers of oystercatcher wintering in the western region of the Wadden Sea exceeded the 2%CC provided by harvestable cockles at densities >50/m2 in six of the 11 years (Figure 16, left). The deficit was reduced or removed by the addition of the capacity provided by the other sources of food, but the difference between capacity and overwintering bird numbers remained small in three years (2008, 2011 and 2018). In the eastern region, the differences between carrying capacity and bird numbers were as small as those in the western region in two years (2011 and 2018) (Figure 16, right). Across all 22 region/years, the number of overwintering oystercatchers was in the vicinity of the predicted capacity in eight cases, the magnitude of the differences depending, of course, on which food sources were included in the estimate of carrying capacity. This raises the possibility that intensive cockle harvesting in some of the component areas of the two regions – especially in the western region – might have reduced the carrying capacity below the number of oystercatchers that were overwintering there.
Figure 16. The within-winter 2% carrying capacity of the western (left) and eastern (right) regions of the Dutch Wadden Sea over the winters 2008-09 to 2018-19. Data from areas open to fishing or
partially open or permanently closed are combined. The black symbols show the estimated number of oystercatcher-winters in each region of the Dutch Wadden Sea. The coloured symbols
show how the 2%CC increases as the definition of the food supply food supply expands from harvestable cockles at densities >50/m2 (red) through harvestable cockles at any density (blue)
and, finally, with mussel and oyster beds added to the harvestable cockles at any density (green). The data include the reduction in carrying capacity due to winter harvesting of cockles.

44
7.4 Impact of winter cockle fishing on carrying capacity by area
This section addresses a prime concern expressed in the tender which is that the concentration of harvesting in certain areas could affect oystercatchers. This concern arises because there is evidence that when the feeding conditions within their normal home range deteriorate, oystercatchers are reluctant to move to another area where conditions may be better, perhaps because any potential gain in feeding circumstances would be more than over-ridden by the costs of being unfamiliar with the new area (Ens et al. 2004; Duriez et al. 2009): but see Appendix 6 for a possible exception where cockle-eating oystercatchers do move between feeding areas within a single winter.
The risk that an annual harvest of more than 2.5% of the standing stock of cockles present on 1 September would affect oystercatchers would be expected to be highest in years when the cockle stocks were generally low everywhere in the Dutch Wadden Sea. In contrast, the birds would be much less likely to be affected by such large harvests in years of widespread cockle abundance. Hence our comparison between the food requirements of oystercatchers with the amount that remained after harvesting in individual areas is related to the general abundance of cockles in the Dutch Wadden Sea.
As no counts had been made of the number of oystercatchers feeding in each of the nine areas of the Dutch Wadden Sea in each winter, we had to estimate the numbers as best we could. Cockle-feeding oystercatchers generally concentrate in areas with abundant and large cockles where their intake rate is generally highest (Goss-Custard et al. 1996d). Other factors, such as the proximity of a foraging area to the high-tide roost and the nature of the sediment can also influence the birds’ use of an area but it was not possible for us to take such factors into account in this project. Instead, we allocated to each area a proportion of the overwintering oystercatcher population according to the proportion of the cockle standing crop at densities >50/m2 that occurred in the area. This was done separately for the western or eastern regions because of the large differences in bird numbers between them. We were unable to test how reliable this method was, so the resulting estimated numbers of oystercatchers in each area each year should be regarded as approximations of the true numbers present.
The question we were required to answer was whether harvests that over 12 months exceeded 2.5% of the standing crop of cockles present in an area/year on 1 September disproportionately reduced the ability of that area to support oystercatchers over the winter. Unusually high harvests during a given year could have an effect on the birds during that year because on average across areas and years so much (57%) of the annual harvest occurred during the winter immediately following the stock assessment for 1 September. We made two precautionary assumptions in our calculations of the effect on the 2%CC of that part of the annual harvest that was carried out between 1 September and 31 March – the ‘winter harvest’. First, we assumed that 75% of the annual harvest was taken between 1 September and 31 March from each area/year. Second, we assumed that all the harvest took place on 1 September and so we deducted the winter harvest from the standing crop present on 1 September: in reality, the erosion of the cockle stocks over the winter would have taken place more gradually, of course.
We measured the possible effect of unusually large harvests on carrying capacity in two ways. First, we calculated the difference between the 2% carrying capacity of an area/winter and the number of oystercatchers that were estimated to have wintered in that area/year; in other words, the surplus

45
or deficit in oystercatcher-winters. The definition of 2%CC within each area/year was for cockles of harvestable size that occurred at densities >0/m2, because our estimates of the 2%EM included cockles at all densities (Appendix 2). The estimated numbers of oystercatchers overwintering on beds of mussels and oysters were then added to the area/year estimate of the carrying capacity provided just by cockles.
The surplus (or deficit) in capacity is referred to here as the ‘difference’ in oystercatcher-winters between the carrying-capacity of an area/winter and the numbers of oystercatchers that were estimated to have wintered there: as we used the average numbers present over the whole winter, each oystercatcher represented one oystercatcher-winter, of course. But to make a clear and easily-understood comparison, we also expressed the results as the ratio between the 2%CC of each area/year and the estimated number of oystercatchers that spent the winter in that area/year. A ratio of 1 would mean that the number of overwintering birds was the same as the 2%CC; that is, the capacity present was equal to that which the estimated numbers of birds required.
The differences and the ratios were then plotted for each area/year against the standing crop biomass of harvestable cockles at densities >50/m2 over the whole Dutch Wadden Sea: this was thought to be the most appropriate measure of the general abundance of the cockle food supply. Area-years in which the annual harvest exceeded 2.5% of the harvestable standing crop are shown with red symbols in Figures 17 and 18. Although deficits did occur in a number of area/winters, there was a surplus in most area-years. There is no obvious link between the difference or the ratio and whether or not the annual harvest exceeded 2.5% of the standing crop present on 1 September. As would be expected, the disparity between the food supply available and the amount the birds required was largest when cockle stocks were high and least when they were low.

46
Figure 17. The difference between the estimated number of oystercatcher-winters occurring in each area/year from the predicted 2%CC of that area/year. The definition of 2%CC within each area/year was for: (i) cockles at densities >0/m2; (ii) the estimated numbers of oystercatchers
subsisting on beds of mussels and oysters with (iii) the harvest taken during the winter from the area/year in question deducted from the sum of (i) and (ii). The red circles show area-years in
which the annual harvest exceeded 2.5% of the stock present on 1 September.
The annual harvest in year N could be as high as 27% of the September standing crop (Figure 11). This being a continuous variable, we used linear regression to explore the quantitative relationship between both the difference and the ratio and (i) the size of the annual harvest as a percentage of the initial stock of cockles at densities >50/m2, and (ii) the general abundance of harvestable cockles in the Dutch Wadden Sea as a whole, measured as the harvestable biomass present on 1 September.
The size of the standing crop in the Dutch Wadden Sea on 1 September had a highly significant effect on both the difference and the ratio: when cockles were generally abundant, the surplus capacity was significantly greater than when cockles were scarce. In contrast, the size of the winter harvest measured as a percentage of the initial stock did not have a significant effect on either the difference or the ratio (Table 5). Furthermore, the sign of both relationships is positive and so contra-hypothesis: larger harvests would have reduced the magnitude of the difference between the 2%CC and the number of wintering oystercatchers in an area/year.

47
Figure 18. The ratio of the predicted 2%CC of an area/year to the estimated number of oystercatcher-winters that occurred in each area/year. The value 4, for example, means that the capacity was four times larger than was required to provide the estimated number of wintering birds the food they needed to survive until spring. The definition of 2%CC within each area/year was for: (i) cockles at densities >0/m2; (ii) the estimated numbers of oystercatchers subsisting on beds of mussels and oysters with (iii) the harvest taken during the winter from the area/year in
question deducted from the sum of (i) and (ii). The red circles show area-years in which the annual harvest exceeded 2.5% of the stock present on 1 September.
Table 5. Regression analysis for the data shown in Figures 17 and 18 but with the percentage of the stock harvested during the year measured as a continuous variable.
Comparison Standing crop in Dutch Wadden Sea Harvest df
P-value (sign) P-value (sign)
Difference 0.000 (+) 0.340 (+) 87
Ratio 0.000 (+) 0.254 (+) 87

48
As the ratio was smaller in years when harvestable cockles were generally scarce in the Dutch Wadden Sea, and these were anyway the years of most concern, we re-analysed the data from the years of general scarcity – the ‘scarce years’ - on their own to remove any risk that the outcome would be affected by the data from years of abundance. From Figures 17 and 18, the years of scarcity were defined as those years when the biomass of harvestable cockles on 1 September was <6 000 000 kg AFDM: the data for the ratios for these years are reproduced in Figure 19.
Figure 19. The ratio of the predicted 2%CC of an area/year to the estimated number of oystercatcher-winters that occurred in each area/year in years when harvestable cockles were generally scarce in the Dutch Wadden Sea. Symbols and specifications are the same as in Figure
18.
The results of the comparisons made between the ratios and other variables in area-years when the annual harvest was above and below 2.5% of the standing crop of harvestable cockles on 1 September are shown in Table 6. As expected, the harvest was substantially larger in years when the annual harvest exceeded 2.5% of the standing crop in September (rows 5 and 6). Given the tendency for cockle-harvesters to focus their harvest in areas with high stocks of harvestable cockles (Section 6), it had expected that the general abundance of cockles would be larger in the area-years when harvests were >2.5% of the stock, and that proved to be the case (rows 8 and 9). Probably because of this, the ratio did not differ between area-years with harvests >2.5% and <2.5% (rows 2 and 3).
On average over the 38 combinations of areas and years that occurred in years of widespread cockle scarcity in the Dutch Wadden Sea, the ratio was 2.41, with a minimum of 0.75 and maximum of 5.69. According to our calculations, therefore, on average there was more than twice the carrying capacity

49
left over after harvesting than was required to support the estimated number of oystercatchers that wintered in an area. But this was not always the case as ratios of l<1 occurred in three area-years: area 4 in 2011 and in areas 1 and 3 in 2018, the year of very low cockle stocks. In none of these area-years, however, did the annual harvest exceed 2.5%. In the nine areas where the annual harvest did exceed 2.5%, the ratios were: 2.75, 3.90, 3.42, 2.39, 1.60, 1.81, 1.47. 1.13 and 3.5. In the case of the minimum ratio of 1.13 (area 8+9, 2011), the estimated surplus is only 10% so that there is very little margin for error.
Table 6. Comparison between the ratios in area-years when the annual harvest was above and below 2.5% of the standing crop of harvestable cockles on 1 September. The comparisons are
between the red and the black symbols in Figure 19. The ratio is between the 2%CC of an area year in oystercatcher-winters and the actual oystercatcher-winters estimated to have occurred there.
Annual harvest
Comparison: Mean ± S.E. N T-value
P-value
DF
1
2 <2.5% Ratio of 2%CC over number of 2.394 0.231 29 0.11 0.911 16
3 >2.5% overwintering oystercatchers 2.440 0.324 9
4
5 <2.5% Annual harvest as % of standing 0.299 0.109 29 2.82 0.022 8
6 >2.5% crop of cockles >50/m2 on 1 Sept
7.590 2.580 9
7
8 <2.5% Standing crop of cockles >50/m2 353 719 60 014 29 2.30 0.047 9
9 >2.5% in Dutch Wadden Sea – kg AFDM
824 567 196 013 9
Unfortunately, we cannot calculate confidence limits to either the estimated numbers of overwintering oystercatchers that depended on cockles and the estimated carrying capacities that supported them. It is not just the methodology that we have used that precludes our doing so, but uncertainties about the precision of some estimates and parameter values. While this applies to the results for the Dutch Wadden Sea as a whole and to the regions, it is particularly applicable to the analysis of the individual areas. In the latter case, for instance, we do not know the reliability of the estimates for the numbers of oystercatchers that depended each winter on cockles and on mussels as no direct counts for those years are available. Nor can we be sure that the calculated biomass of cockles present in each area in September was accurately forecast from the field surveys carried out the previous spring (Agonus Fisheries Consultancy 2019). Accordingly, the finding that the ratio exceeded 1 in all area-years during the winters of general scarcity, the data simply do not allow us to be certain as to how often in reality demand for cockles may have exceed supply.

50
We can, however, estimate the likely reliability of our estimate of the current estimate of 3.25 for the 2%EM for the Dutch Wadden Sea. If further research suggests that the target winter starvation rate should be close to 0%, for example, the estimate of the 2%EM should be increased by up to 10% to 3.58 so that all the ratios would need to be reduced by 0.1 (Appendix 10). It might prove necessary to increase the estimate by a maximum of a further 25% if concentrated cockle-fishing is confirmed as generally reducing the cockle-stocks in subsequent years by up to 25% (Troost & van Asch 2018). But this is uncertain because any reduction could be partially compensated by reduced cockle mortality from other causes ((Agonus Fisheries Consultancy 2019) as seems to occur in the Burry Inlet (Bell et al. 2001). We could find no evidence ourselves that concentrated fishing in some areas reduced the ratio over the following two years between how much oystercatchers required and how much was available in the area-years where the annual harvest exceeded 2.5% (Appendix 9). Nor did the standing crop of cockles in the fished areas decrease at a faster rate following the peak abundance in 2012 in the fished areas compared with the closed areas (Appendix 9).
But within the considerable constraints imposed by the limitations of the data, there is no evidence from our analysis that an annual harvest of >2.5% of the stock in some area in years of widespread cockle scarcity closed the gap between the carrying capacity available to the birds and the capacity they required to support them through the winter. With the exception of two area-years, an estimated surplus in excess of 50% of the birds’ requirements remained after harvesting. The extent to which cockles below harvestable size might have increased the surplus on these occasions cannot be estimated.

51
8. DISCUSSION
8.1 Cockle-harvesting and the carrying capacity of the Dutch Wadden Sea for oystercatchers
Over the Dutch Wadden Sea as a whole, the manual cockle-fishing as it was conducted over the eleven winters of the study reduced the average carrying capacity of the Dutch Wadden Sea by approximately 0.71 - 1.04%, and probably rather less if unmeasured food sources could have been taken into account. Over the same period, the sources of food that could be estimated (cockles >21mm long, Macoma and mussels) were on average across the 11 years sufficient to support up to 3.75 times the numbers of oystercatchers that actually overwintered on the Dutch Wadden Sea.
This favourable comparison depends heavily, however, on several winters with a large super-abundance of cockles, something that has been recognised for many years (Rappoldt et al. 2003a-c). Unless a harvest in a year of abundance considerably reduces the stock of cockles available to both cockle-harvesters and oystercatchers in subsequent years – as currently seems unlikely (Agonus Fisheries Consultancy 2019) – it is very clear that even concentrated harvesting at the level seen during the 11 years considered here is most unlikely to have lowered the winter survival and body condition of cockle-dependent oystercatchers when cockles were very abundant.
It is in years of widespread scarcity of cockles that a proper concern for the effect of concentrated harvesting on oystercatcher survival and body condition has been focussed. A general scarcity of cockles of harvestable size at densities >50/m2 occurred across the Dutch Wadden Sea, particularly in the western region (fishing areas 1-4), in five of the winters included within our analysis. During these winters (2009-10, 2010-11, 2011-12, 2017-18, 2018-19), the predicted carrying capacities of the cockles of harvestable size at densities >50/m2 were lower than or close to, the numbers of overwintering oystercatchers and/or the conservation target number of oystercatchers for the Dutch Wadden Sea (Figure 15). Including in the food supply the stocks of harvestable cockles at densities <50/m2 and mussel and oyster beds reduced the numbers of winters of low food supply relative to demand to three (2010-11, 2011-12 and 2018-19). Cockles below harvestable size could have made up for the shortfall in such years, but the extent to which they did so cannot be calculated because there are no data on their abundance, size distribution and flesh-content.
Despite our inability to place confidence intervals around the estimates of food abundance, it seems clear that there are winters of cockle scarcity when it is certainly justified to hypothesize that concentrated cockle-fishing in certain areas (>2.5% of the annual harvest) might lowered the carrying capacity of those areas to the point at which the body condition and survival chances of the oystercatchers that winter there would have been reduced. However, within the considerable constraints imposed by the absence of the data required definitively to test this hypothesis, our analysis does suggest that concentrated cockle-fishing in the years of cockle scarcity did not affect the ratio between the supply and demand of the oystercatchers in these areas compared with the others where the annual harvest was <2.5% of the cockle stocks present on 1 September.
We use the words ‘considerable constraints’ advisedly. There are no counts in the field of the numbers of cockle-feeding oystercatchers that overwintered in each area-year with which to compare the area-year estimates of the 2%CC. Consequently, we had to devise a way to estimate the numbers using a procedure that has not been validated in the field. Nor are there counts of the

52
numbers of oystercatchers that fed on mussels in those area-years which in the past provided a substantial, additional source of food (Smit et al. 1998; Argonus Fisheries Consultancy 2019).
In addition, there are particular parameter values used in the calculation of the ecological requirements of oystercatchers that might vary between areas and years and for which only a global average was available to us. Obvious examples are (i) the flesh-content of the cockles and its rate of decline over the winter months and (ii) the mortality rate of cockles from causes other than shellfishing and predation by oystercatchers. The abundance of cockles <21mm long, their size distribution and flesh-content are also critically important quantities that could greatly affect the ratio between supply and demand in an area. The same applies to the densities of oystercatchers on mussel beds, oyster beds and mixed beds within the area of concern. Nor can we evaluate how reliable were the estimates we used of the standing crop of harvestable cockles in each area on 1 September in each year which were necessarily calculated from field surveys conducted some months previously.
There is also doubt about the spatial scale at which the comparison between carrying capacity and oystercatcher numbers should be made and the precise way in which harvesting might affect the cockle food supply of oystercatchers. Manual cockle-harvesting occupies no more than 2% of the area occupied by harvestable cockles at densities >50/m2, and so fished areas in any one place and time may be very small in comparison with the area occupied by cockles (Argonus Fisheries Consultancy 2019). It is most unlikely that the surface area of the areas used in our analysis coincide with the ecologically most appropriate scale. The key consideration is this: What is the surface area of the heavily-harvested areas in relation to the size of the home-range within which individual oystercatchers overwinter and from which they appear reluctant to leave in case their body condition and survival chances are reduced. If the harvested area is small relative to the home range, the issue then is whether there are adequate supplies of cockles (or other prey) within the rest of the home range to support the birds. If the harvested area is large relative to the home range, however, it could be rendered unusable as a feeding area to oystercatchers, depending on the densities to which concentrated harvesting reduces the cockle stocks and the minimum densities of cockles required by oystercatchers to maintain an adequate intake rate. If the issue of the possible effects on the birds of concentrated cockle-fishing in years of cockle scarcity continues to remain contentious, it might be appropriate to research intensively such areas by tracking the cockle stocks, oystercatcher numbers and the depletion caused by harvesting in a sample of such areas. Such a project would also allow the possible effects of disturbance of oystercatchers by cockle-fishers to be examined, although this possibility does seem unlikely because most of the harvesting is carried out when the water is too deep for the birds to forage nearby. Such a study would also provide an opportunity to test whether foraging oystercatchers are affected by light from the fishing boats; in fact, the birds might even benefit from light as has been shown for some mussel-eating oystercatchers (Sitters 2000).
Within the considerable constraints imposed by the limitations of the data, we conclude that there is no evidence from our analysis that, over the winters 2008-09 to 2018-19, an annual harvest of >2.5% of the stock in some areas in years of widespread cockle scarcity completely closed the gap between the carrying capacity available to the birds and the capacity they required to support them through the winter. In other words, a surplus remained after harvesting, although in two area-years the surplus was not large, bearing in mind the large and un-estimated uncertainties in many of the
53
measurements involved in the calculations. The extent to which cockles below harvestable size might have increased the surplus on these occasions cannot be estimated. But as can be seen from the extensive caveats that we have already discussed, we think that confirmation of this conclusion by targeted field research at the appropriate spatial scale in some years of general cockle scarcity would be worthwhile.
8.2 Shellfish abundance in winter and oystercatcher numbers
A compelling case has been made that the decline in the abundance and increase in the within-winter mortality rate of oystercatchers in the Dutch Wadden Sea from the mid-90s was probably partly caused by the virtual disappearance of mussels from the intertidal zone from 1990-1994 combined with intensified cockle harvesting due to the introduction of suction-dredging during the 1990s (Ens 2006). It should not be surprising that the reduction in the stocks of intertidal cockles and mussels reduced the birds’ overwinter survival and body condition because, historically, shellfish provided the main food supply of wintering oystercatchers and developing ways to exploit these prey species probably played a major role in the evolution of the oystercatcher’s morphology (Hulscher 1996). Comparable mortality rates were also recorded in oystercatchers wintering on the Wash in winters when both mussels and cockles were scarce (Atkinson et al. 2003).
What is surprising, however, is that the decline in numbers has continued – albeit at a considerably reduced rate - since the early 2000s after some mussels had returned to the Wadden Sea and suction-dredging for cockles was abandoned and replaced by the smaller harvests of manual harvesting. This is in striking contrast to the population of another long-lived bird species, the grey heron, which recovered within a few years after a severe reduction in numbers following very severe winters (Lack 1954).
The long-term study of the population of oystercatchers breeding on Schiermonnikoog may have provided a key insight (van de Pol et al. 2010). The annual variations in survival in all age-classes were related to annual variations in the winter temperature, this being a particularly strong association in juvenile birds which ‘are the seed-corn of future generations’ (Goss-Custard & Durell 1984). The ambient temperature in winter was also the main correlate of fecundity but in the opposite direction to that of winter mortality: low winter temperatures increased the abundance in the following spring of an important prey species for breeding oystercatchers, the ragworm, and thus increased the birds’ fecundity. For that majority of oystercatchers that breed inland, an important insight as to the cause of the continuing decline in oystercatcher numbers came from the analysis of the long-term trends in fecundity of that majority (>75%) of oystercatchers in The Netherlands that nest on agricultural land. This study showed that increasing predation, and perhaps changes in agricultural practice, has greatly reduced fecundity over the last several decades (Klok et al. 2009; Roodbergen et al. 2011).
This is not to argue that the shellfish stocks in winter could no longer sometimes affect survival during winter and perhaps fecundity in the following summer. Up and until the early 2000s, high mortality rates occurred during very severe weather or when both cockles and mussels were scarce (Swennen 1984; Hulscher et al. 1984; Stock et al. 1987, Neve & van Noordwijk 1997, Zwarts & Wanink 1996, Atkinson et al. 2003, Oosterbeek et al. 2006, Duriez et al. 2009, 2012; Camphuysen et al. 1996, Schwemmer et al. 2014; Roodbergen et al. 2011) and was especially high when both these conditions coincided (Duriez et al. 2012). On the other hand, Duriez et al. (2009, 2012) and
54
Camphuysen et al. (1996) reported that not all winters that were regarded as severe by people killed large numbers of oystercatchers. Similarly, even large reductions in the food supply did not necessarily reduce oystercatcher survival. For example, engineering works in the Oosterschelde reduced the intertidal area, and presumably the food supply, available to shorebirds by one third, yet in mild winters there was no detectable increase in the mortality rate of oystercatchers (Duriez et al. 2009). Similarly, on the Wash, oystercatchers maintained a high survival rate if cockles were very scarce as long as there were abundant stocks of mussels, but not if both shellfish were scarce (Atkinson et al. 2003). This is likely to have been the case in the Dutch Wadden Sea as well (Ens et al. 2004).
The partial return of mussel beds since the 1990s and the switch to what is widely believed in the UK to be a more oystercatcher-friendly method for harvesting cockles since then may suggest that, over the last decade, numbers should have recovered significantly if the winter stocks of shellfish was indeed a major determinant of population size. But this has not happened. It is possible, of course, that as-yet undetected changes in the cockle and mussel food supply over that period has reduced their suitability as prey to oystercatchers. The increasing presence of the Pacific oyster on some mussel beds may have reduced the potential benefit from the general increase in the abundance of mussels because oysters have suppressed their flesh-content and thus profitability to oystercatchers (Waser et al. 2016). We could also speculate that the shells of cockles have thickened over the last decade so that the risk of bill-damage may have reduced the suitability of this species as prey for oystercatchers (Rutten et al. 2006; van de Pol et al. 2009; Dokter et al. 2017). Perhaps the lengths and energy-content of cockles of a given size have decreased since the early 2000s, a possibility that it should be possible to test in some well-studied parts of the Wadden Sea, such as the Balgzand.
At the current state of knowledge, it does seem almost certain that a number of processes on both the wintering and breeding grounds interact to determine the numbers of oystercatchers that winter and breed in the Dutch Wadden Sea. We think it is already clear that not all the processes that determine the abundance of oystercatchers in the Wadden Sea lie in that region of the Netherlands alone. It is therefore timely that the project CHIRP has been initiated to model how the several processes involved interact to determine the dynamics and size of the oystercatcher population. As argued above in the body of this report, we think that to evaluate fairly the possible effect of manual cockle harvesting on the oystercatcher population it is necessary to devise an approach that focusses solely on the winter period itself and on how the cockle food supply at that time of year affects the overwinter survival of all age classes of oystercatchers and, perhaps, breeding success the following spring.
We chose the adult mortality rate of 2% as the maximum within-mortality rate that should be the target for managing oystercatcher populations. But perhaps future population modelling will show that the within-winter mortality rate of juveniles, for example, might be an important a quantity on which to base the choice of Ecological Requirement (ER), although the limited evidence available at present suggests that the ER in juveniles may not differ from that of adult birds (Appendix 7). Their soft-bills, inexperience and low social dominance may limit the ability of young birds to utilise shellfish (Goss-Custard & Durell 1987a-c), yet the long-term future of the population depends on their successful recruitment. It is also possible that the target mortality rates of the most appropriate age-classes should take a value lower than used here, although the limited evidence suggests that even the maximum effect on the estimate of the ER would be quite small (10% -

55
Appendix 10). Time will tell but, in the meantime, the evidence available at present suggests that the best approach to managing the cockle stocks is to ensure that the adult mortality rate does not exceed 2%.
8.3 Adaptive management
The continuing scientific uncertainty about the principal factors and processes that determine population size in even as well-studied species such as the oystercatcher does argue for a flexible approach to managing shellfisheries so that policy can be quickly modified as understanding advances. So too does the uncertainty about the parameter values used to calculate the value of the birds’ ecological requirement and, especially in years of generally scarce cockles, how much extra should be added ER to allow for errors of estimation. And so too does the natural, large and uncontrollable variability in the stocks of the cockles themselves and, especially in years of generally high stocks, the uncertainty about the long-term effect of harvesting on the stocks in future years. And finally, so too does uncertainty about the precise way in which manual cockle-fishing affects the cockle food supply; for example, whether it is more or less harmful to oystercatchers to remove areas of cockles rather than just to thin them.
Flexibility is the principal that underlies the ‘adaptive management’ approach adopted in Wales to managing shellfisheries in a way that secures the viability of co-dependent bird populations, notably the oystercatcher. This approach recognises the erratic and largely unpredictable events that should determine the size of the harvest, and that the under-pinning scientific understanding does change as new discoveries are made. As cold winters and hot summers in the Dutch Wadden Sea have illustrated in recent years, circumstances can change quickly and unexpectedly and in ways that should be taken into account when deciding harvesting policy. Such a flexible and ‘moment-to-moment’ strategy is now also advocated, for example, for deep-sea fisheries where the distribution of fish that are accessible to the birds can change very rapidly (Hobday et al. 2013; Dunn et al. 2016; McInnes et al. 2019). While this study has shown that in most years the 2.5% rule does protect oystercatchers in the Wadden Sea as a whole and in the fished areas in particular, in years of plenty it does prevent the cockle industry from taking advantage of a spike in cockle abundance even though increased harvesting would be most unlikely to harm the birds in that winter and, probably, not much affect the cockle stock in subsequent winters either.
The consequences of a greater harvest in winters of abundance harvest for cockle abundance in subsequent years would be an important issue to resolve for both the protection of the birds and for the future harvest of the shellfishers. This matter has been investigated and the long-term effect of the 2.5% rule on the cockle stocks does not seem to be large compared with the fluctuations in cockle abundance due to other, unidentified causes (Kamermans et al. 2004; Troost & van Asch 2018; Agonus Fisheries Consultancy 2019). Indeed, density-dependent effects on the recruitment, growth rates, survival, flesh-content and perhaps even the thickness of the shells of cockles may mean that harvesting may actually improve the quality of the birds’ food supply in some respects in the longer term (Beukema & Dekker 2015, 2018). There could also be genetic consequences of whatever fishery management policy is adopted, such as breeding at a younger age in cockles (Brinkman et al. 2007): this idea has been investigated in the Burry Inlet, where the evidence is currently not clear (Elliot et al. 2012).

56
The main advantage of adopting adaptive management the using within-winter carrying capacity as the decision-making criterion is this: if the cockle food supply of oystercatchers collapses for unforeseen reasons – and not the least of which is that the ‘scientists got it wrong’ - , the threat can be rapidly calculated and immediate action can be taken to safeguard the birds by limiting harvesting in appropriate ways. Other potential advantages are:
• In Wales, it has been welcomed and actively supported by the cockle fishers whose living, of course, depends on the harvest, and collaborate well with the conservation authorities.
• It is unaffected by events happening at other times of year. • It can be re-estimated quickly if circumstances change suddenly, as occur during ice winters. • It can be estimated for 1 December which is immediately before the onset of the difficult
feeding conditions for oystercatchers and not three months in advance on 1 September (Appendix 8). This delay may enable the cockle stocks to be sampled later in the summer thus minimising the need to forecast the stock from surveys in spring, before any unpredictable events have occurred during the summer.
• It partially avoids the problem of possible long-term effects on cockle abundance because it is derived from here-and-now measurements of the stock so that any unknown effects on long-term abundance – whether up or down – are automatically taken into account each year.
Within-winter carrying capacity is therefore a suitable metric for using with the kind of flexible ‘adaptive management;’ that is now being used to manage shellfish stocks in Wales and potentially marine fish populations.

57
9. ACKNOWLEDGEMENTS
One of the joys of producing this report was the essential need to read a lot more about the wonderful research work that has been carried out over so many years by so many Dutch research scientists on the ecology of the Dutch Wadden Sea. The only difficulty this presented was that much of the research is published in large reports written in Dutch, a language with which neither of us is familiar. Our first acknowledgement is therefore to Google Translator for providing generally very understandable translations of key texts. It took a very long time, but it was worth it.
More personally and with warm appreciation, we are very grateful to Ingrid van Beek, Bert Keus, Karin Troost, Bruno Ens, Henk-Jan van der Kolk and Kees Rappoldt for their help in providing data and invaluable feedback on the first draft of our report. The rapidity of their responses was very much appreciated.
We are also very grateful to our former colleague Mick Yates for making the data he collected on the numbers of oystercatchers feeding in early and late winter on different sectors of the huge intertidal mudflats and sandflats of the Wash.
58
10. REFERENCES
Agonus Fisheries Consultancy. 2009. Habitattoets handmatige kokkelvisserij Waddenzee: Seizoen 2009 – 2010. A report. Herengracht 9, 2312 LA Leiden.
Agonus Fisheries Consultancy. 2019. Habitattoets handmatige kokkelvisserij Waddenzee. A report. Herengracht 9, 2312 LA Leiden.
Allen, A. 2019. Migratie en overleving van Scholeksters in Nederland. Project CHIRP: https://www.google.com/search?q=chirp+wadden+sea+oystercatchers&rlz=1C1GIVA_enGB715GB718&oq=&sourceid=chrome&ie=UTF-8
Allen, A.M., Ens, B.J., van de Pol. M., van der Jeugd, H., Fraudendorf, M., Oosterbeek, K. & Jongejans, E. 2019. Seasonal survival and migratory connectivity of the Eurasian Oystercatcher revealed by citizen science. The Auk 136: 1-17.
Atkinson, P.W., Cl;ark, N.A., Bell, M.C., Dare, P.J., Clark, J.A. &Ireland, P.L. 2003. Changes in commercially fished shellfish stocks and shorebird populations in the Wash, England. Biological Conservation 114: 127-141.
Bell, M.C., Bannister, R.C.A., Walker, P., Atkinson, P.W. & Clark, N.A. 2001. Fisheries and bird opredation as components of cockle (Cerastoderma edule) mortality in the Burry Inlet, South Wales. ICES CM 2001/J.02.
Beukema, J.J. & Dekker, R. 2015. Density dependence of growth and production in a Wadden Sea population of the cockle Cerastoderma edule. Marine Ecology Progress Series 538: 157-167.
Beukema, J.J. & Dekker, R. 2018. Effects of cockle abundance and cockle fishery on bivalve recruitment. Journal of Sea Research 140: 81-86.
Bowgen, K.M. 2018. Development of MOROPH for the 2000-01 and 2004-05 Burry Inlet cockle fisheries. http://birdsandestuaries.blogspot.com/2018/02/development-of-morph-for-burry-inlet.html
Brinkman, A.G., Ens, B.J., Jansen, J. & Leopold, M.F. 2008. Handkokkelactiviteiten in de Waddenzee: Antwoord op een aantal vragen van de Provincie Fryslan. Wageningen IMARES Rapport C047/08.
Buit, T.P., Ens, B.J., Baars, D., Kats, R. & Leoplod, M. 2004. B3: Evaluation of the measurement of the available food supply for birds that eat large shellfish. Report to the Netherlands Institute for Fisheries Research (RIVO).
Bunskoeke, E.J. 1988. Over de fluctuaties van de prooikeus van de Scholekster (Haematopus ostraleus) in het broedseizoen 1986 op Schiermonnikoog. Student report, University of Groningen, Groningen.
Bunskoeke, A.J., Ens, B.J., Hulscher, J.B. & de Vlas, S.J. 1996. Why do Oystercatchers Haematopus ostralegus switch from feeding on Baltic tellin Macoma balthica to feeding on the ragworm Nereis divsersicolor during the breeding season. Ardea 84A: 91-104.
Caldow, R.W.G., Goss-Custard, J.D., Stillman, R.A., Durell, S.E.A. le V. dit, Swinfen, R. & Bregnballe, T. (1999). Individual variation in the competitive ability of interference-prone foragers: the relative importance of foraging efficiency and susceptibility to interference. Journal of Animal Ecology 68: 869-878.
Caldow, R.W.G., McGrorty,S., Stillman, R.A., Goss-Custard, J.D., Durell, S.E.A. le V., West, A.D., Beadman, A.D., Kaiser, M.J, Mould, K & Wilson, A. 2004. A behaviour-based modelling approach to predicting how best to reduce shorebird-shellfish conflicts. Ecological Applications 14: 1411-1427.

59
Calvert, A.M., Walde, S.J. & Taylor, P.D. 2009. Non-breeding season drivers of population dynamics in seasonal migrants: conservation parallels across taxa. Avian Conservation and Ecology 4: http://www.ace-eco.org/vol4/iss2/art5/
Camphuysen, C.J., Ens, B.J., Heg, D., Hulscher, J., van der Meer, J. & Smit, C.J. 1996. Oystercatcher Haematopus ostralegus winter-mortality in The Netherlands: the effect of severe weather and food supply. Ardea 84A: 469–492.
Chapman, G. 1654. Revenge for Honour (a play).
Cresswell, W. 1994. Age-dependent choice of Redshank (Tringa totanus) feeding location: profitability or risk? Journal Animal Ecology 63: 589–600.
Dankers, N. & Koelemaij, K. 1989. Variations in the mussel population of the Dutch Wadden Sea in relation to monitoring of other ecological parameters. Helglander Meeresuntersuchtungen 43:529-535.
de Vlas, S. J., Bunskoeke, A.J., Ens, B.J. & Hulscher, J.B. 1996. Tidal changes in the choice of Nereis diversicolor or Macoma balthica as main prey species in the diet of the Oystercatcher Haematopus ostralegus. Ardea 84A:105-116.
Dokter, A.M., van Loon, E.E., Rappoldt, C., Oosterbeek, K., Baptist, M.J., Bouten, W. & Ens, B.J. 2017. Balancing food and density-dependence in the spatial distribution of an interference-prone forager. Oikos 126: 1184-1196.
Dunn, D.C., Maxwell, S.M., Boustany, A.M. & Halpin, P.N. 2016. Dynamic ocean management increases the efficiency and efficacy of fisheries management. Proceedings of the National Academy of Sciences 113: 668-673.
Durell, S.E.A. Le V. dit 2007. Differential survival in adult Eurasian oystercatchers Haematopus ostralegus. Journal of Avian Biology 38: 530-535.
Durell, S.E.A. Le V. dit, Goss-Custard, J.D., Caldow, R.W.G. Malcolm, H.M. & Osborn, D. 2001. Sex, diet and feeding-method related differences in body condition in the Oystercatcher Haematopus ostralegus. Ibis 143: 107-119.
Duriez, O., Saether, S.A., Ens, B.J., Choquet, R., Pradel, R., Lambeck, R.H.D. & Klaassen, M. 2009. Estimating survival and movements using both live and dead recoveries: a case study of oystercatchers confronted with habitat change. Journal of Applied Ecology 46: 144-153.
Duriez, O., Ens, B.J., Choquet, R., Pradel, R. & Klaassen, M. 2012. Oikos 121: 862-873.
Elliott, M., Burdon, D., Callaway, R., Franco, A., Hutchinson, T., Longshaw, M., Malham, S., Mazik. K., Otto, Z., Palmer, D., Firmin, C., Smith, T. & Wither. A. 2012. Burry Inlet Cockle Mortalities Investigation 2009-2011. Technical Report to Environment Agency Wales, Institute of Estuarine and Coastal Studies, University of Hull, UK.
Ens, B.J. 2006. The conflict between shellfisheries and migratory waterbirds in the Dutch Wadden Sea. In: G.C. Boere, SD.A. Galbraith & D.A. Stroud (eds.) Waterbirds around the World. The Stationary Office, Edinburgh, UK.:806-811.
Ens, B.J. & Cayford, J.T. Feeding with other oystercatchers. The Oystercatcher: from individuals to populations, (Ed. J.D. Goss-Custard), pp. 77-104. Oxford University Press, Oxford.
Ens, B.J., Smaal, A.C. & de Vlas, J. 2004. The effects of shellfish fishery on the ecosystems of the Dutch Wadden Sea and Oosterschelde: Final report on the second phase of the scientific evaluation of the Dutch shellfishery policy (EVA II). Alterra-rapport 1011; RIVO-rapport C056/04; RIKZ-rapport/2004.031.
60
Ens, B.J., Bom, R.A., Dokter, A.M., Oosterbeek, K., de Jong, J. & Bouten, W. 2014. Nieuwe ontdekkingen en mogelijkheden in het onderzoek aan Scholeksters dankzij het UvA Bird Tracking Systeem. Limosa, 87: 117-128.
Ens, B.J., Bunskoeke, A.J., Hoekstra, R., Hulscher, J.B., Kersetn, M. & de Vlas, S.J. 1996a. Prey choice and search speed: why simple optimality fails to explain the prey choice of Oystercatchers Haematopus ostralegus feeding on Nereis diversicolor and Macoma balthica. Ardea 84A: 73-89.
Ens, B.J., Diksen, S., Smit, C.J. & Bunskoeke, A.J. 1996b. Seasonal changes in size selection and intake rate of Oystercatchers Haematopus ostralegus feeding on the bivalves Mytilus edulis and Cerastoderma edule. Ardea 84A: 159-176.
Ens, B.J., Smaal, A.C. & de Vlas, J. 2004. The effects of shellfish fishery on the ecosystems of the Dutch Wadden Sea and Oosterschelde: Final report on the second phase of the scientific evaluation of the Dutch shellfishery policy (EVA II). Alterra-rapport 1011; RIVO-rapport C056/04; RIKZ-rapport/2004.031.
Ens, B.J., Aarts, B., Hallman, C., Oosterbeek, K., Sierdsema, H., Slaterus, R., Troost, G., van Turnhout, C., Wiersma, P., Nienhuis, J. & van Winden, E. 2011. Scholeksters in de knel: onderzoek naar de oorzaken van de dramatische achteruitgang van de Scholekster in Nederland. SOVON-Onderzoeksrapport 2011/13.
Ens, B.J., Dokter, QA., Rappoldt, K. & Oosterbeek, K. 2015. Wat bepaalt de draagkracht van de Waddenzee voor wadvogels: onderzoek naar het verspreidingsgedrag van Scholeksters. SOVON-rapport 2015/02.
Ens, B,J., van der Meer, Troost, K., van Winden, E. , Schekkerman, H. & Rappoldt, K./ 2019. Monitoring van het voor vogels oogstbare voedselaanbod in de kombergingen van het Pinkegat en Zouthamberlaag: rapportage tot en met monitoringjaar 2018. Sovon-rapport 2019/22.
Goss-Custard, J.D. 1981. Role of winter food supplies in the population ecology of common British wading birds. Verhandlung Ornithologische Gesellschaft Bayern, 23: 125-146.
Goss-Custard, J.D. 1993. The effect of migration and scale on the study of bird populations: 1991 Witherby Lecture. Bird Study 40: 81-96.
Goss-Custard, J.D. & Durell, S.E.A. Le V. dit (1983). Individual and age differences in the feeding ecology of oystercatchers, Haematopus ostralegus, wintering on the Exe. Ibis 125: 155-171.
Goss-Custard, J.D. & Durell, S.E.A. Le V. dit 1984. Feeding ecology, winter mortality and the population dynamics of oystercatchers, Haematopus ostralegus, on the Exe estuary. Coastal Waders and Wildfowl in Winter. (Ed. by P.R. Evans, J.D. Goss-Custard & W.G. Hale), pp. 190-208. Cambridge, Cambridge University Press.
Goss-Custard, J.D. & Durell, S.E.A. Le V. dit. 1987a. Age-related effects in oystercatchers, Haematopus ostralegus, feeding on mussels, Mytilus edulis. 1. Foraging efficiency and interference. Journal of Animal Ecology 56: 521-536.
Goss-Custard, J.D. & Durell, S.E.A. Le V. dit. 1987b. Age-related effects in oystercatchers, Haematopus ostralegus, feeding on mussels, Mytilus edulis. 2. Aggression. Journal of Animal Ecology 56: 537-548.
Goss-Custard, J.D. & Durell, S.E.A. Le V. dit. 1987c. Age-related effects in oystercatchers, Haematopus ostralegus, feeding on mussels, Mytilus edulis. 3. The effect of interference on overall intake rate. Journal of Animal Ecology 56: 549-558.
61
Goss-Custard, J.D. & Stillman, R.A. 2019. How new science should affect the application of protection measures for UK estuarine shorebirds In: Humphreys J. & Clark. R. (eds) Marine Protected Areas: Evidence, Policy and Practice, Elsevier, Oxford.: 525-542.
Goss-Custard, J.D. & West, A. D. 1997. The concept of carrying capacity and shorebirds. In: Predicting and detecting the effect of habitat loss and change on wetland bird populations, (Ed. J.D. Goss-Custard, R. Rufino & A. Luis), pp. 52-62. ITE Symposium no. 30; Wetlands International publication no. 42. HMSO, London.
Goss-Custard, J.D., Jones, R.E. & Newbery, P.E. 1977a. The ecology of the Wash. I. Distribution and diet of wading birds (Charadrii). Journal of Applied Ecology 14: 681-700.
Goss-Custard, J.D., Jenyon, R.A., Jones, R.E., Newbery, P.E. & Williams, R. le B. 1977b. The ecology of the Wash. II. Seasonal variation in the feeding conditions of wading birds (Charadrii). Journal of Applied Ecology 14: 701-719.
Goss-Custard, J.D., Kay, D.G. & Blindell, R.M. 1977c. The density of migratory and overwintering redshank, Tringa totanus (L.), and curlew, Numenius arquata (L.), in relation to the density of their prey in South-east England. Estuarine & Coastal Marine Science 5: 497-510.
Goss-Custard, J.D., Durell, S.E.A. le V. dit, Clarke, R.T., Beintema, A.J., Caldow, R.W.G., Meininger, P.L. & Smit, C. 1996a. Population dynamics of the Oystercatcher. The Oystercatcher: from individuals to populations, (Ed. J.D. Goss-Custard), pp. 352-383. Oxford University Press, Oxford.
Goss-Custard, J.D., West, A.D., Caldow, R.W.G., Clarke, R.T., Durell, S. E.A. le V. dit. 1996b. The carrying capacity of coastal habitats for Oystercatchers. In: The Oystercatcher: from individuals to populations, (Ed. J.D. Goss-Custard), pp. 326-351. Oxford University Press, Oxford.
Goss-Custard, J.D., Durell, S.E.A. le V., Goater, C.P., Hulscher, J.B., Lambeck, R.H.D., Meinminger, P.L and Urfi, J. 1996c. How oystercatchers survive the winter. In: The Oystercatcher: from individuals to populations, (Ed. J.D. Goss-Custard), pp. 133-154. Oxford University Press, Oxford.
Goss-Custard, J.D., West, A.D. & Sutherland, W.J. 1996d. Where to feed. In: The Oystercatcher: from individuals to populations, (Ed. J.D. Goss-Custard), pp. 105-132. Oxford University Press, Oxford.
Goss-Custard, J.D., Stillman, R.A., West, A.D., Caldow, R.W.G. & McGrorty, S. 2002. Carrying capacity in overwintering migratory birds. Biological Conservation 105: 27-41.
Goss-Custard, J.D., West, A.D., Yates, M.G. and 31 other authors. 2006a. Intake rates and the functional response in shorebirds (Charadriiformes) eating macro-invertebrates. Biological Review 81: 501–529.
Goss-Custard, J.D., Bowgen, K.M. & Stillman, R.A. 2019a. Increasing the harvest for mussels Mytilus edulis without harming oystercatchers Haematopus ostralegus. Marine Ecology Progress Series 612: 101–110; https://doi.org/10.3354/meps12875.
Goss-Custard, J.D., Hoppe, C.H., Hood, M.J. & Stillman, R.A. 2019b. Disturbance does not have a significant impact on waders in an estuary close to conurbations: importance of overlap between birds and people in time and space. Ibis doi: 10.1111/ibi.12769.
Heppleston, P.B. 1971. The feeding ecology of Oystercatchers (Haematopus ostralegus L.) in winter in Northern Scotland. Journal of Animal Ecology 40: 651-672.
Hobday, A.J., Maxwell, S.M., Forgie, J. & McDonald, J. 2013. Dynamic ocean management: integrating scientific and technological capacity with law, policy, and management. Stanford Environmental Law Journal: 33: 125.
Hulscher, J.B. 1996. Food and feeding behaviour. In: The Oystercatcher: from individuals to populations, (Ed. J.D. Goss-Custard), pp. 155-185. Oxford University Press, Oxford.

62
Hulscher, J.B., Exo, K.-M. & Clark, N.A. 1996. Why do oystercatchers migrate? In: The Oystercatcher: from individuals to populations, (Ed. J.D. Goss-Custard), pp. 7-29. Oxford University Press, Oxford.
Hulscher, J.B. 1982. The Oystercatcher Haematopus ostralegus as a predator of the bivalve Macoma balthica in the Dutch Wadden Sea. Ardea 70: 89-152.
Hulscher, J.B., Alting, D.A., Bunskoeke, A.J., Ens, B.J. & Heg, D. 1996. Subtle differences between male and female Oystercatchers Haematopus ostralegus in feeding on the bivalve Macoma balthica. Ardea 84A:117-130.
Hulsman, K., Zalucki, M.P. & Iedema, A. 1996. Searching behaviour and diet of Oystercatcher Haematopus ostralegus pairs feeding in their territories. Ardea 84A: 131-140.
Lawrence, A.J. & Soame, J.M. 2004. The effect of climate change on the reproduction of coastal invertebrates. Ibis 146(Supplement): 29-39.
Kamermans, P., Bult, T., Kater, B., Baars, D., Kest6eloo, J., Perdion, J. & Schuiling, E. 2004. Eindrapport EVA II.
Kersten, M. 1996. Time and energy budgets of Oystercatchers Haematopus ostralegus occupying territories of different quality. Ardea 84A: 291-310.
Kersten, M. & Piersma, T. 1987. High levels of energy expenditure in shorebirds: metabolic adaptations to an energetically expensive way of life. Ardea 75: 175-187.
Kersten, M. & Visser, W. 1996. Food intake of Oystercatchers Haematopus ostralegus by day and by night measured with an electronic nest balance. Ardea, 84A: 57-72.
Klepper, O. 1989. A model of carbon flows in relation to microbenthic food supply in the Ooosterschelde (S.W. Netherlands). Ph.D. thesis, Agricultural University Wageningen.
Klok, C., Roodbergen, M. & Hemerik, L. 2009. Diagnosing declining grassland wader populations using simple matrix models. Animal Biology 50: 127-144.
Lack, David. 1954. The Natural Regulation of Animal Numbers. Oxford University Press, Oxford.
Lawrence, A.J. & Soame, J.M. 2004. The effect of climate change on the reproduction of coastal invertebrates. Ibis 146(Supplement): 29-39.
Leopold, M.F., van Elk, J.F. & van Heezik, Y.M. 1996. Central place foraging in Oystercatchers Haematopus ostralegus: can parents that transport mussels Mytilus edulis to their young profit from size selection. Ardea 84A: 311-325.
McInnes, A.M., Ryan. P.G., Lacerda, M. & Pichegru, L. 2019. Targeted prey fields determine foraging effort thresholds of a marine diver: important cues for the sustainable management of fisheries. Journal of Applied Ecology: doi: 10.1111/1365-2664.13462.
Markert, A., Esser, W., Frank, D., Wehrmann, A, & Exo, K-M. 2013. Habitat change by the formation of alien Crassostrea-reefs in the Wadden Sea and its role as feeding sites for waterbirds. Estuarine, Coastal and Shelf Science 131:41-51.
Neve, G. & van Noordwijk, A. 1997. Factors affecting Oystercatcher (Haemotopus ostralegus) survival rate in the Dutch Wadden Sea area. Interim report. NIOZ: Heteren.
Norris, D.R. 2005. Carry-over effects and habitat quality in migratory populations. Oikos 109: 178-186.
Oosterbeek, K.H., van de Pol, M., de Jong, M.L., Smit, C.J. & Ens, B.J. 2006. Scholekster populatie studies: Bijdrage aan de zoektocht naar oorzaken van de sterke achteruitgang van de Scholekster het Waddengebied. Alterra-Rapport 1344, SOVON-onderzoeksrapport 2006/05.

63
Rappoldt, C. & Ens, B.J. 2011. Het effect van bodemdaling op het aantal scholeksters dat kan overwinteren in de Waddenzee: Exploratieve berekeningen met model WEBTICS. EcoCurves rapport 12; SOVON-onderzoeksrapport 2011/05.
Rappoldt, C. & Ens, B.J. 2013. Het effect van bodemdaling op overwinterende scholeksters dat kan in de Waddenzee: Een modelstudie met WEBTICS. EcoCurves rapport 17; SOVON-onderzoeksrapport 2013/19.
Rappoldt, C., Ens, B.J., Berrevoets, C.M., Geutrts van Kessel, A.J.M., Bult, T.P. & Dijkman, E.M. 2003a. Scholeksters en hun voedsel in de Oosterschelde; rapport voor deelproject D2 thema 1 van EV II, de tweede fase van het evaluatieonderzoek naar de effecten van schelpdiervisserij op natuurwaarden in de Waddenzee en Oosterschelde 199-2003. Wageningen, Alterra-Rapport 883.
Rappoldt, C., Ens, B.J., Bult, T.P. & Dijkman, E.M. 2003b. Scholeksters en hun voedsel in de Wadenzee; rapport voor deelproject D2 thema 1 van EV II, de tweede fase van het evaluatieonderzoek naar de effecten van schelpdiervisserij op natuurwaarden in de Waddenzee en Oosterschelde 199-2003. Wageningen, Alterra-Rapport 882.
Rappoldt, C., Ens, B.J., Kersten, M.A.J.M. & Dijkman, E.M. 2003c.Wader Energy Balance & Tidal Cycle Simulator WEBTICS: Technical Documentation Version 1.1. Alterra-rapport 869.
Rappoldt, C., Kersten, M. & Ens, B.J. 2006. Schleksters en de droogvalduur van kokkels in de Oosterschelde. EcoCurves rapport 2; SOVON-onderzoeksrapport 2006/12.
Rappoldt, C., Ens, B.J. & Brinkman, A.G. 2008. Het kokkelbestand tussen 2001-2007 en het aantal scholeksters in de Waddenzee. EcoCurves rapport 8; SOVON-onderzoeksrapport 2008/09.
Roodbergen, M., van der Werf & Hotker, H. 2011. Revealing the contributions of reproduction and survival to the Europe-wide decline in meadow birds: review and meta-analysis. J. Ornithol. DOI 10.1007/s10336-011-0733-y.
Rutten, A.L., Oosterbeek, K., Ens, B.J. & Verhulst, S. 2006. Optimal foraging on perilous prey: risk of bill damnage reduces optimal prey size in oystercatchers. Behavioural Ecology: doi:101093/beheco/arj029.
Schwemmer, P., Halterlein, B., Getter, O., Gunther, K., Gorman, V.M. & Garthe, S. (2014). Weather-related winter mortality of European oystercatchers (Haematopus ostralegus) in the Northwestern Wadden Sea. Waterbirds 37: 319-330.
Schwemmer, Weiel & Gartga 2017 Ecol Evol
Smit, C.J., Dankers, N., Ens, B.J. & Meijboom, A. 1998. Birds, Mussels, Cockles and Shellfish Fishery in the Dutch Wadden Sea: How to Deal with Low Food Stocks for Eiders and Oystercatchers? Senckenbergiana maritima 29: 141-153.
Stewart, B. (2001) The relationship between mussel and oystercatcher populations in the Burry Inlet, Part 1b, Section 2.
Steenbergen, J., Baars, J.M.D.D., van Stralen, M.R. & Craeymeersch, J.A. 2006. Winter survival of mussel beds in the intertidal part of the Dutch Wadden Sea. In: Monitoring and assessment in the Wadden Sea. Proceedings from the 11 Scientific Wadden Sea Symposdium, Denmark, Esbjerg 4-8 April, 2005.( Ed. K. Laursen). NERI Technical Report No. 573, 107-111.
Stillman, R.A. 2008. MORPH: An individual-based model to predict the effect of environmental change on foraging animal populations. Ecological Modelling 216: 265-276.
Stillman, R.A. & Goss-Custard, J.D. 2010. Individual-based ecology of coastal birds. Biological Reviews 85: 413-434.
64
Stillman, R.A. & Wood, K.A. 2013. Predicting food requirements of overwintering shorebird populations on the Solway Firth. A report to Scottish Natural Heritage and Marine Scotland. Bournemouth University, Poole.
Stillman, R.A, Wood, K.A. & Goss-Custard, J.D. 2016. Deriving simple predictions from complex models to support environmental decision-making. Ecological Modelling 326: 134–141.
Stillman, R.A., Goss-Custard, J.D., Clarke, R.T. & Durell, S.E.A. le V. dit. 1996a. Shape of the interference function in a foraging vertebrate. Journal of Animal Ecology 65: 813-824.
Stillman, R.A., Goss-Custard, J.D., McGrorty, S., West, A.D., Durell, S.E.A. le V. dit, Clarke, R.T., Caldow, R.W.G., Norris, K.J., Johnstone, I.G., Ens, B.J., Bunskoeke, E.J., Merwe, A v.d., van der Meer, J., Triplet, P., Odoni, N., Swinfen, R. & Cayford, J.T. 1996b. Models of shellfish populations and shorebirds: final report. Report to the European Union.
Stillman, R.A., Goss-Custard, J.D., West, A.D., Durell, S.E.A. le V., Caldow, R.W.G., McGrorty, S. & Clarke, R.T. 2000. Predicting to novel environments: tests and sensitivity of a behaviour-based population model. Journal of applied Ecology 37: 564-588.
Stillman, R. A., Goss-Custard, J. D., West, A. D., McGrorty, S., Caldow, R. W. G., Durell, S. E. A. le V. dit, Norris, K. J., Johnstone, I. G., Ens, B. J., van der Meer, J. & Triplet, P. 2001. Predicting oystercatcher mortality and population size under different regimes of shellfishery management. Journal of Applied Ecology 38: 857-868.
Stillman, R.A., West, A.D., Goss-Custard, J.D., Durell, S.E.A. le V., Yates, M.G., Atkinson, P.W., Clark, N.A., Bell, M.C., Dare, P.J. & Mander, M. 2003. A behaviour-based model can predict shorebird mortality rate using routinely collected shellfishery data. Journal of Applied Ecology 40: 1090-1101.
Stillman, R.A., Moore, J.J., Woolmer, A.P., Murphy, M.D., Walker, P., Vanstaen, K.R., Palmer, D. & Sanderson, W.G. 2010. Assessing waterbird conservation objectives: An example for the Burry Inlet, UK. Biological Conservation 143: 2617-2630.
Sutherland, W. J. 1982a. Do oystercatchers select the most profitable cockles? Animal Behaviour 30: 857–861.
Sutherland, W. J. 1982b. Spatial variation in the predation of cockles by oystercatchers at Traeth Melynog, Anglesey. II. The pattern of mortality. Journal of Animal Ecology 51: 491–500.
Sutherland 1982c Food supply and dispersal in the determination of wintering population levels of oystercatchers. Estuarine and Coastal Shelf Science, 14: 223-229.
Swennen, C. 1984. Differences in quality of roosting flocks of Oystercatchers In: Coastal Waders and Wildfowl in Winter. (Ed. by P.R. Evans, J.D. Goss-Custard & W.G. Hale), pp. 177-189. Cambridge, Cambridge University Press.
Teunissen, W.A., Schekkerman, H. & Willems, F. 2005. Predatie bij weidevogels. Op zoek naar de mogelijke effecten van predatie op de weidevogelstand. SOVON-ondeerzoeksrapport 2005/11; Alterra-rapport 1292.
Triplet, P., Stillman, R.A. & Goss-Custard, J.D. 1999. Prey abundance and the strength of interference in a foraging shorebird. Journal of Animal Ecology 68: 254-265.
Troost, K. & van Asch, M. 2018. Effecten van handkokkelvisserij op het kokkelbestand in de Waddenzee: Een theoretische benadering. Wageningen Marine Research rapport C072/18.
van Asch, M., van den Ende, D., van der Pool, J., Brummelhuis, E., van Zweeden, C., van Es, Y. & Troost, K. 2019. Het kokkelbestand in de Nederlandse kustwateren in 2019. pp. 1-28. Stichting Wageningen Research, Centrum voor Visserijonderzoek (CVO), IJmuiden.

65
van de Pol, M., Ens, B.J., Oosterbeek, K., Brouwer, L., Verhulst, S., Tinbergen, J.M., Rutten, A.L. & de Jong, M. 2009. Oystercatchers’ bill shapes as a proxy for diet specialisation: more differentiation than meets the eye.Ardea 97: 335-347.
van den Ende, D., Troost, K., van Asch, M., Perdon, J. & van Zweeden, C. 2018. Mosselbanken en oesterbanken op droogvallende platen in de Nederlandse kustwateren in 2018: bestand en arealen. CVO rapport 18.023.
van der Hut, R.M.G., Folmer, E.O., Koffijberg, K., van Roomen, M., van der Zee, E., Stahl & Boudewijn, T.J. 2014. Vogel slangs de randen van het wad: Verkenning van knelpunten en kansen op broedlocaties en hoogwatervluchtplaatsen. SOVON Ecospace; A&W-rapport 1982.
van der Meer, J., Piersma, T. & Beukema, J.J. 2001. Population Dynamics of Benthic Species on Tidal Flats: the Possible Roles of Shorebird Predation. Ecological Comparisons of Sedimentary Shores (ed. K. Reise), pp. 317-335. Springer-Verlag, Berlin Heidelberg.
van der Pol, M., Vindenes, Y., Saether, B-E., Engen, S., Ens, B.J., Brouwer, Oosterbeek, K., Tiinbergen, J. 2010a. Effects of climate change and variability on population dynamcs in a long-lived shorebird. Ecology 91: 1192-1204.
van der Pol, M., Brouwer, L., Ens, B.J., Oosterbeek, K., Tiinbergen, J. & Candolin, U. 2010b. Fluctuating selection and the maintenance of individual and sex-specific diet specialization in free-living Oystercatchers. Evolution, 64: 836-851.
van Kleunen, A , Ens, B.J. & Smit, C.J. 2012. Het belang van oester-en mosselbanken voor Scholekster en Steenloper. Sovon-rapport 2012/18, Sovon Vogelonderzoek Nederland, Nijmegan.
van Roomen, M., van Turnhout, C., van Winden, R., Koks, B., Goedhart, P., Leopold, M. & Smit, C. 2005. Trends van benthivore watervogels in de Nederlandse Waddenzee 1975-2002: grote verschillen tussen scjhelpdiereneters en wormeneters. Limosa 78: 21-38.
Verhulst, S., Oosterbeek, K., Rutten, A.I. & Ens, B.J. 2004. Shellfish fishery severely reduces condition and survival of oystercatchers despite creation of large marine protected areas. Ecology and Society 9: 17.
Waser, A.M., Deuzeman, S., wa Kangeri, A.K., van Winden, E., Postma, J., de Boer, P., van der Meer, J. & Ens, B.J. 2016. Impact on bird fauna of a non-native oyster expanding into blue mussel beds in the Dutch Wadden Sea. Biological Conservation: 202, 39-49.
West, A.W., McGrortgy, S., Goss-Custard, J.D., Sanderson, B. & Gray, C. 2015. Modelling shorebirds and their food on the Dee estuary, Traeth Lafan and Burry Inlet SPAs to inform target settings and site management -Phase 2, Final report. A report to the Countryside from the Centre for Ecology and Hydrology. CCW Marine Monitoring Report No. 16.
West, A.D & McGrorty, M. 2015. Marine Monitoring Project: modelling Oystercatchers and their food on the Dee estuary, Traeth Lafan and Burry Inlet SPA to inform target setting and site management – Phase 1. CCW Contract No: FC 73-02-252 (C02143).
Williams,M. & Ens,B.J. 2003. The many ways to determine the weight of shellfish or their parts: an attempt to determine general conversion factors. Alterra werkdocument. Wageningen, Alterra.
Wynne-Edwards V C. 1962. Animal dispersion in relation to social behaviour. Edinburgh: Oliver & Boyd.
Yates, M., Garbutt, A., Rispin, E. & Brown, N. 2004. Low tide survey of The Wash Special Protection Area, Final report of the winter 2002-2003 shorebird survey (ENRR589). English Nature Research Report 589. English nature, Peterborough, UK.

66
Zwarts, L. 1991. Seasonal variation in body weight of the bivalves Macoma balthica, Scrobicularia plana, Mya arenaria and Cerastoderma edule in the Dutch Wadden Sea. Netherlands Journal of Sea Research 28: 231-245.
Zwarts, L. & Blomert, A-M. 1992. Why knot Calidris canutus take medium-sized Macoma balthica when six prey species are available. Marine Ecology Progress Series 83: 113-128.
Zwarts, L. & Drent, R.H. 1981. Prey depletion and the regulation of predator density: Oystercatchers (Haematopus ostralegus) feeding on mussels (Mytilus edulis). In: N.V. Jones & W.J. Wolff (eds) Feeding and survival strategies of estuarine organisms: 193-216. Plenum Press, New York.
Zwarts, L. & Wanink, J.H. (1993). How the food supply harvestable by waders in the Wadden Sea depends on the variation in energy density, body weight, biomass, burying depth and behaviour if tidal-flat invertebrates. Netherlands Journal of Sea Research 31:441-476.
Zwarts, L., Ens, B.J., Goss-Custard, J.D., Hulscher, J.B. & Durell S.E.A. le V dit. 1996a. Causes of variation in prey profitability and its consequences for the intake rate of the Oystercatchers Haematopus ostralegus. Ardea 84: 229-268.
Zwarts, L., Hulscher, J.B., Koopman, K., Piersma, T. & Zegers, P.M. 1996b. Seasonal and annual variation in body weight, nutrient stores and mortality of Oystercatchers Haematopus ostralegus. Ardea 84A: 327-356.
Zwarts, L., Wanink, J.H. & Ens, B.J. 1996c. Predicting seasonal and annual fluctuations in the local exploitation of different prey by oystercatchers Haematopus ostralegus: a ten-year study in the Wadden Sea. Ardea 1984A: 401-440.

67
APPENDIX 1. WINTER MORTALITY RATE OF OYSTERCATCHERS
The question: What is the ‘natural’ or ‘normal’ mortality rate of oystercatchers in winter in the absence of any food shortages caused by cockle-fishing? That is, what is the permissible ‘target’ mortality rate that we should ensure pertains after cockles have been harvested?
Winter mortality rate of adult oystercatchers: Most natural mortality in oystercatchers in winter in the Dutch Wadden Sea occurs in December and, especially, in January and February (Zwarts et al. 1996b). The winter mortality rate of oystercatchers can be very high when the weather is very severe and there are many ‘frost’ days with average daily temperatures below zero 0C (Swennen 1984; Hulscher et al. 1984; Stock et al. 1987, Neve & van Noordwijk 1997, Zwarts 1996a; Duriez et al. (2009, 2012; Camphuysen et al. 1996, Schwemmer et al. 2014) and when the food supplies have been much reduced (Atkinson et al. 2003; Camphuysen et al. 1996; Duriez et al. 2012). It can be especially high when both these conditions coincide, with >30% dying (Duriez et al. 2012). Verhulst et al. (2004) also showed that the body condition of oystercatchers was lower in areas open to cockle-fishing compared with areas closed to shellfishing. Furthermore, the probability of dying was also 43% higher and may have been (p = 0.3) higher in males amongst which there was a higher proportion of shellfish-eaters compared with females, many of which took soft-bodied prey.
Severe winters and reduced food stocks do not necessarily lead to greater mortality, however. Both Duriez et al. (2009, 2012) and Camphuysen et al. (1996) report that not all winters that were regarded as severe by people killed large numbers of oystercatchers. Similarly, even large reductions in the food supply do not necessarily reduce oystercatcher survival. For example, engineering works in the Oosterschelde reduced the intertidal area available to shorebirds by one third, yet in mild winters there was no detectable increase in the mortality rate of oystercatchers (Duriez et al. 2009). Similarly, on the Wash, oystercatchers maintained a high survival rate if cockles were very scarce as long as there were abundant stocks of mussels, but not if both shellfish were scarce (Atkinson et al. 2003). This seems to have been the case in the Dutch Wadden Sea as well (Ens et al. 2004).
When oystercatchers are unable to obtain enough food from their main shellfish prey, they supplement their consumption by feeding on the higher levels of the shore as the tide recedes and advances and/or in terrestrial habitats over high tide in some regions of the UK (Heppleston 1971; Goss-Custard & Durell 1983; Caldow et al. 1999) and in some parts of the Dutch Wadden Sea (Ens et al. 2004). Atkinson et al. (2003) suggest that one reason why the mortality rates of oystercatchers on the Wash was so high in years of a combined scarcity of mussels and cockles is that there were no earthworm-rich fields nearby where oystercatchers could feed over high tide. Accordingly, when terrestrial habitats freeze over, any oystercatchers that normally supplement any feeding they can do on the unfrozen parts of the intertidal flats would no longer be able to do so. Indeed, the effect of lowered ambient temperature may start before the ground freezes because the intake rate of oystercatchers on earthworms starts to decrease when the soil temperature falls below 60C (Goss-Custard & Durell 1987). During prolonged periods of severe weather in the Dutch Wadden Sea when much of the intertidal flats as well as terrestrial habitats freeze over, the feeding conditions become very difficult for oystercatchers and many starve or emigrate (Hulscher 1996).
Mortality rate can vary between oystercatchers with different diets. The main diets categories consist of (i) mainly mussels; (ii) mainly cockles and (iii) mainly ‘un-armoured’ prey without thick

68
shells, such as Macoma and Nereis and, over the last few decades, Ensis (Ens et al. 2004). Birds also employ different feeding techniques which adds a further potential source of variation, and thus complexity, to establishing the normal winter mortality rate of oystercatchers. This complexity can be illustrated by adult oystercatchers wintering on the Exe estuary during the 1980s and 90s. This was a relatively straightforward situation because there was no shell-fishing and the shellfish-eating birds mostly fed only one species of shellfish, mussels (Goss-Custard & Durell 1983). Other adults fed on Nereis and the bivalve Scrobicularia plana. Mussel-specialists either hammered mussels to break the shell or stabbed directly into the mussel between its valves. The intake rate of mussel-hammerers was greater than that of mussel-stabbers which was, in turn, greater than that of clam-worm specialists. The frequency with which birds supplemented their low tide consumption by feeding in the fields over high tide was inversely related to the intake rate of their different specialisations on the intertidal flats. That is, mussel hammerers were seldom seen in fields while, at the other extreme, clam/worm specialists were seen there frequently (Durell et al. 2001). The birds’ body condition and chances of dying during the winter followed the same trend.
When the study was repeated a few years later, however, the association between diet and risk of mortality disappeared: there was no significant difference between diet specialists in their chances of dying from one year to the next: mortality within the winter period alone could not be measured this time (Durell 2007). Durell’s explanation for this difference was that the winters were milder during the second study than they had been during the first so that feeding upshore and, particularly, in fields over high tide, had become more favourable. As also argued by van de Pol et al. (2010), Durell (2007) reasoned that the risk of a weather-induced periods of very low intake rate, and not just average intake rate, was an important factor in determining the survival chances of oystercatchers. This view is compatible with the findings of Dutch researchers on the survival rates of oystercatchers in relation to diet, weather and the abundance of the food supply in the modified Dutch coastal systems. That a longer-term view should also be taken of the effect of the feeding conditions in winter on oystercatchers was strengthened by the finding that the conditions in winter can have a carry-over effect into the following summer (Duriez et al. 2012). Ens et al. (2004) and Allen et al. (2019) also discuss the possibility that the feeding conditions during the previous winter may affect the reproductive output of oystercatchers breeding in the Wadden Sea, a possibility in which there is increasing interest in the ornithological literature for birds in general (Norris 2005; Calvert et al. 2009).
The diversity of factors that affect the overwinter mortality rate of oystercatchers makes it difficult to establish the normal, natural rate of mortality in cockle-eating birds alone, as would be most relevant to the present project. We need really to select a mortality rate that would ensure the long-term maintenance of the population in the absence of shell-fishing. I am not aware, however, of any field-tested population model that would enable us to select the winter mortality rate and body condition in spring, along with their associated long-term consequences for survival and reproductive rate that could be used to estimate the overwinter mortality that would ensure the maintenance of the oystercatcher population. Accordingly, we adopted a simpler, and perhaps more pragmatic, approach to defining an appropriate ‘target’ mortality rate.
We selected estimates that had been obtained when the feeding conditions for shellfish-eating birds were likely to have been very favourable; that is, shellfish, whether cockles or mussels or both, were abundant and there was no prolonged period of severe weather. The estimates were for birds that

69
specialised on cockles or mussels and, with the exception of the Wash, had access to supplementary feeding in fields over high tide in mild weather, if needed. As the population size in oystercatchers is particularly sensitive to changes in the survival rate of adults (Atkinson et al. 2003), and the most reliable estimates are available for adult birds anyway, we use values for adults only. There are very few measurements of the mortality rate of oystercatchers within the winter period itself (September/October to March) so we also included estimates from the UK (Table A2 1).
Conclusion: When testing the effect of cockle fishing on the winter mortality rate and body condition of oystercatchers, the natural rate for adult birds should be taken to be 2%. That is, the criterion for deciding whether or not the current cockle-fishing policy is compatible with maintaining the oystercatchers population is whether it raises the mortality rate above 2%.
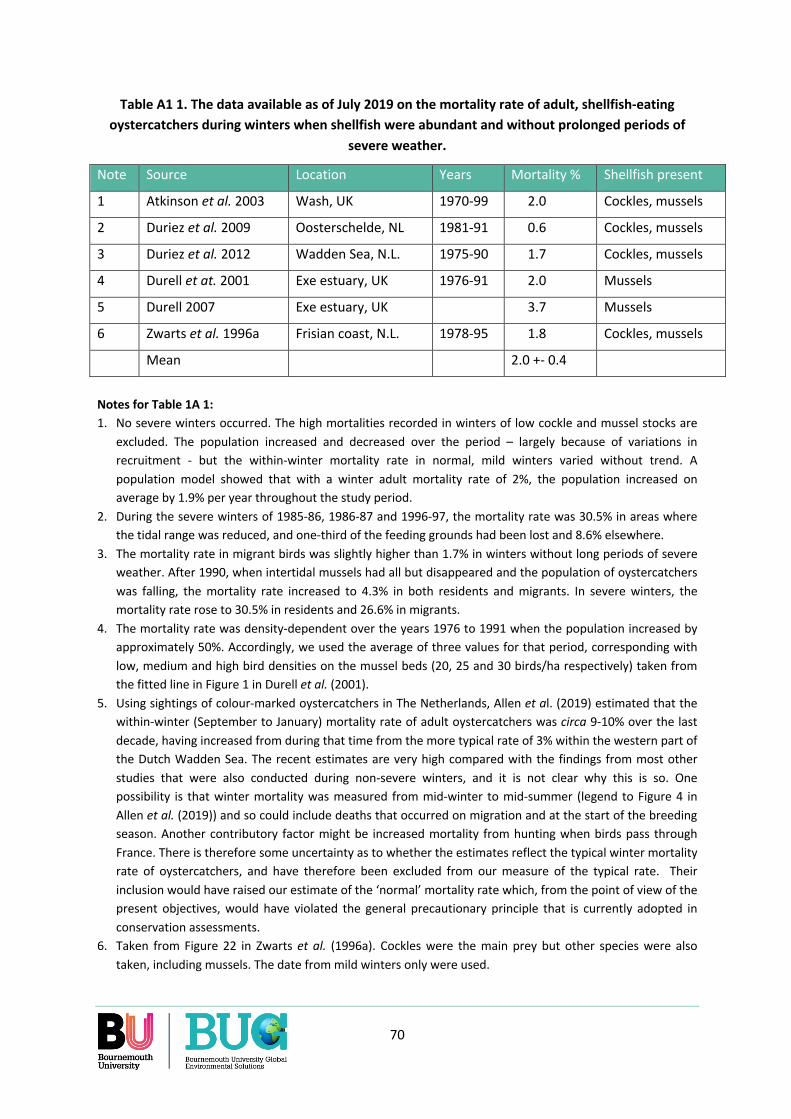
70
Table A1 1. The data available as of July 2019 on the mortality rate of adult, shellfish-eating oystercatchers during winters when shellfish were abundant and without prolonged periods of
severe weather.
Note Source Location Years Mortality % Shellfish present
1 Atkinson et al. 2003 Wash, UK 1970-99 2.0 Cockles, mussels
2 Duriez et al. 2009 Oosterschelde, NL 1981-91 0.6 Cockles, mussels
3 Duriez et al. 2012 Wadden Sea, N.L. 1975-90 1.7 Cockles, mussels
4 Durell et at. 2001 Exe estuary, UK 1976-91 2.0 Mussels
5 Durell 2007 Exe estuary, UK 3.7 Mussels
6 Zwarts et al. 1996a Frisian coast, N.L. 1978-95 1.8 Cockles, mussels
Mean 2.0 +- 0.4
Notes for Table 1A 1: 1. No severe winters occurred. The high mortalities recorded in winters of low cockle and mussel stocks are
excluded. The population increased and decreased over the period – largely because of variations in recruitment - but the within-winter mortality rate in normal, mild winters varied without trend. A population model showed that with a winter adult mortality rate of 2%, the population increased on average by 1.9% per year throughout the study period.
2. During the severe winters of 1985-86, 1986-87 and 1996-97, the mortality rate was 30.5% in areas where the tidal range was reduced, and one-third of the feeding grounds had been lost and 8.6% elsewhere.
3. The mortality rate in migrant birds was slightly higher than 1.7% in winters without long periods of severe weather. After 1990, when intertidal mussels had all but disappeared and the population of oystercatchers was falling, the mortality rate increased to 4.3% in both residents and migrants. In severe winters, the mortality rate rose to 30.5% in residents and 26.6% in migrants.
4. The mortality rate was density-dependent over the years 1976 to 1991 when the population increased by approximately 50%. Accordingly, we used the average of three values for that period, corresponding with low, medium and high bird densities on the mussel beds (20, 25 and 30 birds/ha respectively) taken from the fitted line in Figure 1 in Durell et al. (2001).
5. Using sightings of colour-marked oystercatchers in The Netherlands, Allen et al. (2019) estimated that the within-winter (September to January) mortality rate of adult oystercatchers was circa 9-10% over the last decade, having increased from during that time from the more typical rate of 3% within the western part of the Dutch Wadden Sea. The recent estimates are very high compared with the findings from most other studies that were also conducted during non-severe winters, and it is not clear why this is so. One possibility is that winter mortality was measured from mid-winter to mid-summer (legend to Figure 4 in Allen et al. (2019)) and so could include deaths that occurred on migration and at the start of the breeding season. Another contributory factor might be increased mortality from hunting when birds pass through France. There is therefore some uncertainty as to whether the estimates reflect the typical winter mortality rate of oystercatchers, and have therefore been excluded from our measure of the typical rate. Their inclusion would have raised our estimate of the ‘normal’ mortality rate which, from the point of view of the present objectives, would have violated the general precautionary principle that is currently adopted in conservation assessments.
6. Taken from Figure 22 in Zwarts et al. (1996a). Cockles were the main prey but other species were also taken, including mussels. The date from mild winters only were used.

71
APPENDIX 2. WHAT SHOULD THE VALUE OF THE 2%EM BE FOR THE DUTCH WADDEN SEA?
What values of the 2%EM for the cockles of harvestable size should be used for the Dutch Wadden Sea? Stillman & Wood (2010) reviewed the values of the multiplier then available and found a wide variation that could not be fully explained. In just the Burry Inlet in south-west Wales, for example, the predicted values varied over seven winters between 2.0 and 5.7, the mean being 3.43 (± s.d. = 1.42). Subsequent unpublished (J.D. Goss-Custard) and published (Goss-Custard et al. 2019a) findings identified some correlates of the variation in 2%EM. So the question is: ‘What values of these factors would be appropriate for the Dutch Wadden Sea?’ Values were obtained from published and unpublished sources and used to derive an estimate of the 2%EM for the Dutch Wadden Sea using the model MORPH.
A 2 1 The model used
We do not have a MORPH model of the Dutch Wadden Sea and it would have been impossible to develop one for this project. Instead, we used as an analogue the version of MORPH used was that developed and tested for the shellfish-eating oystercatcher population of the Burry Inlet during the winter 2000-01 by Bowgen (2018). The food supply and numbers of adult and immature birds in the model was the same as had been observed that winter on the Burry Inlet and adults in the model left for the breeding grounds through February and March at approximately the observed rate. By the end of March, only immature birds remained in the model Burry Inlet, as in reality. Three tests of the model’s predictions were made.
A 2 1.1 Habitat use: Shellfish-eating oystercatchers foraged on mussel beds, cockle beds and ‘mussel crumble’; the latter being areas where spat mussels had attached themselves to the exposed shells of densely packed cockles. Low tide counts of oystercatchers were carried out on seven occasions between 4 January 2001 and 9 February 2001 spanning four neap and three spring tides (Stewart 2001). For the purpose of model validation, the counts on each section were summarised into total numbers on mussel beds, cockle beds and mussel crumble. The model predictions closely matched the foraging habitat the birds used to within ±3.1% (Table A2 1). This raises confidence in the ability of the model to predict the birds’ behaviour (Table A2 1).
Table A2 1. Comparison between the predicted and observed distribution of oystercatchers over mussel beds, cockle beds and mussel crumble beds of the Burry Inlet during the winter 2000-01.
Cockles Mussels Mussel Crumble
Spring Tides Observed 91.67 7.98 0.35
Predicted 89.07 7.49 3.44
Difference 2.60% 0.49% 3.09%
Neap Tides Observed 87.07 11.59 1.34
Predicted 84.36 12.01 3.63
Difference 2.71% 0.42% 2.29%

72
A 2 1.2 Time spent feeding: Observations of time spent feeding were made between January and March 2001 on oystercatchers foraging on cockle and mussel beds in the Burry Inlet (Stewart 2001). Observations were made on neap tides only because on spring tides birds were often out of sight in gullies and on low-level flats and could not be seen from onshore observation points. The percentage of birds feeding and not feeding was calculated for each half-hour period of the exposure period and averaged over each 10-hour day. Estimates of the time spent foraging by the average bird were obtained for four neap tide tidal cycles (2 each for and mussel cockle beds) and compared to model predictions for precisely the same days. Although the model birds spent slightly more time than the real birds in foraging on both cockles and mussels, the agreement between prediction and observation was reasonable (Table A2 2). The results suggested that the model birds obtained their food more slowly than real birds, indicating that its predictions for carrying capacity might be cautious.
Table A2 2. Comparison between the predicted and observed number of hours spent feeding over a daylight neap tide by birds on mussel beds and cockle beds of the Burry Inlet during the winter
2000-01.
Cockles Mussels
Average Time Spent Feeding over 10 hours
Observed 5.48 4.08
Predicted 5.75 4.60
Difference (minutes) 16 31
Percentage difference 4.9% 12.6%
A 2 1 3 Mortality: There are no estimates of the overwinter mortality rate of oystercatchers for the winter 2000-01. However, very few oystercatchers were seen feeding at any stage of the winter in the many mature (and therefore worm-rich) grass fields around the Burry Inlet (Stewart 2001). This strongly suggests that the mortality rate was very low, which accords with the model’s predictions that none starved that winter.
A 2 2 Correlates of the 2%EM
Simulations with mussel-feeding oystercatchers on the Exe estuary showed that the loss of flesh from individual mussels and the mortality rate of mussels over the winter partly explains why more shellfish biomass must be available at the beginning of winter than the birds will actually consume by 31 March if they are to retain their normally high survival rate (Goss-Custard et al. 2019a). In other words, providing a surplus food supply at the beginning of the winter is necessary because so much will be lost subsequently to causes other than consumption by oystercatchers.
We used the Burry Inlet 2000-01 version of MORPH to explore the effect of these factors on the magnitude of the 2%EM in cockle-feeding oystercatchers. In these simulations, model oystercatchers only took cockles and were allowed either to consume only those above the minimum fishable length (20mm) or to take both fishable cockles and smaller ones down to a minimum length of

73
15mm. Birds were not allowed to feed on soft-bodied invertebrates, such as clams and polychaete worms, and could not forage in fields over high water to supplement their consumption on cockles. The rates of flesh-loss and mortality between September and March in these simulations were those that had been measured locally, these being 39% and 30% respectively. The density of oystercatchers over the entire surface of the cockle beds of the Inlet was 10 birds/ha, which a fairly typical value in the Wadden Sea. The model was populated with the number of adults and immature birds that occurred in the Inlet that winter. As in nature, adult bird in the model gradually emigrated during February and March, until none were left by March 31. The 2%EM was estimated for 1 December, the beginning of the period of the winter when oystercatchers in the model and in the real world begin to starve, and which may be a more appropriate time as a consequence to set the target date for the ER (Appendix 7).
It is important to make clear that the 2%EM is calculated just for cockles of harvestable size (>20mm long). We explored by how much the 2%EM was affected by the values of (i) the rate of flesh-loss in cockles; (ii) the mortality rate of cockles over the winter, and (iii) the density of oystercatchers on the cockle beds. The same rates of flesh-loss and mortality were applied to cockles below harvestable size in those simulations where this size-class was included. In the simulations, one of the three factors was varied at a time by multiplying the observed value by multiples of 0.5, 1.5 and 2. All three factors had a large influence on the value of the 2%EM. Without small cockles being consumed, the 2%EM varied across the range of multiples between two and five times (Figure A2 1A). Allowing the birds to consume small cockles greatly reduced the magnitude of 2%EM, except at the highest value of the multiples (Figure A2 1B).
Figure A2 1. The effect of varying the overwinter rate of flesh-loss and mortality of cockles and the density of oystercatchers on the 2%EM of the Burry Inlet during the winter 2000-01. The real-world value is given as 1 on the x-axis: the actual over-winter values are shown along the top of the figure. (A) Model oystercatchers were only allowed to consume cockles above the minimum fishable length (20mm) whereas in (B) they were also allowed to eat smaller cockles down to a
minimum of 15mm. Each point is the mean of 10 simulations.

74
The importance of the potential influence of small cockles is expressed another way in Figure A2 2. The density of oystercatchers took the real-world value of 10 birds/ha in these simulations. Model birds were allowed to eat small cockles in one series of simulations but not in the other. The densities of cockles of harvestable size were varied to find the cockle stock at which the overwinter mortality rate (September to March) of oystercatchers was 2%: this is the horizontal dotted lines in Figure A2 2. There only needed to be 149 tonnes AFDM of cockle flesh of cockles of harvestable size to be available in September if the birds were allowed to eat small cockles. But if they were not, and so had to obtain all their requirements from cockles >20mm long, they needed 242 tonnes AFDM to be available on 1 September.
Figure A2 2. The proportion of the stock of cockles of harvestable size available at the beginning of winter that was required for 98% of adults in the Burry Inlet to survive until March. Model birds
were only allowed to consume cockles. If birds were prevented from taking cockles below harvestable length, the proportion required of the harvestable stock required was 0.319 (242
tonnes AFDM of cockle flesh). If the model birds were allowed, the proportion was 0.197 (149 tonnes AFDM of cockle flesh).
Expressing these rates and densities as ‘multiples of the real value’ may not be very meaningful to many readers. Accordingly, further simulations were run with the Burry Inlet 2000-01 version of MORPH with the rate of flesh-loss and mortality expressed as over-winter percentage values. The density of oystercatchers was 10 birds/ha in all simulations and, for simplicity, every individual was adult. The rate of flesh-loss was kept at 0% when the effect of variations in the overwinter mortality rate of cockles was being explored, and vice versa . In the third set of simulations, the values of both rates were varied equally and together. Increasing the rate of flesh-loss or mortality both increased the predicted 2%EM and, of course, their combined effect was much greater (Figure A2 3).
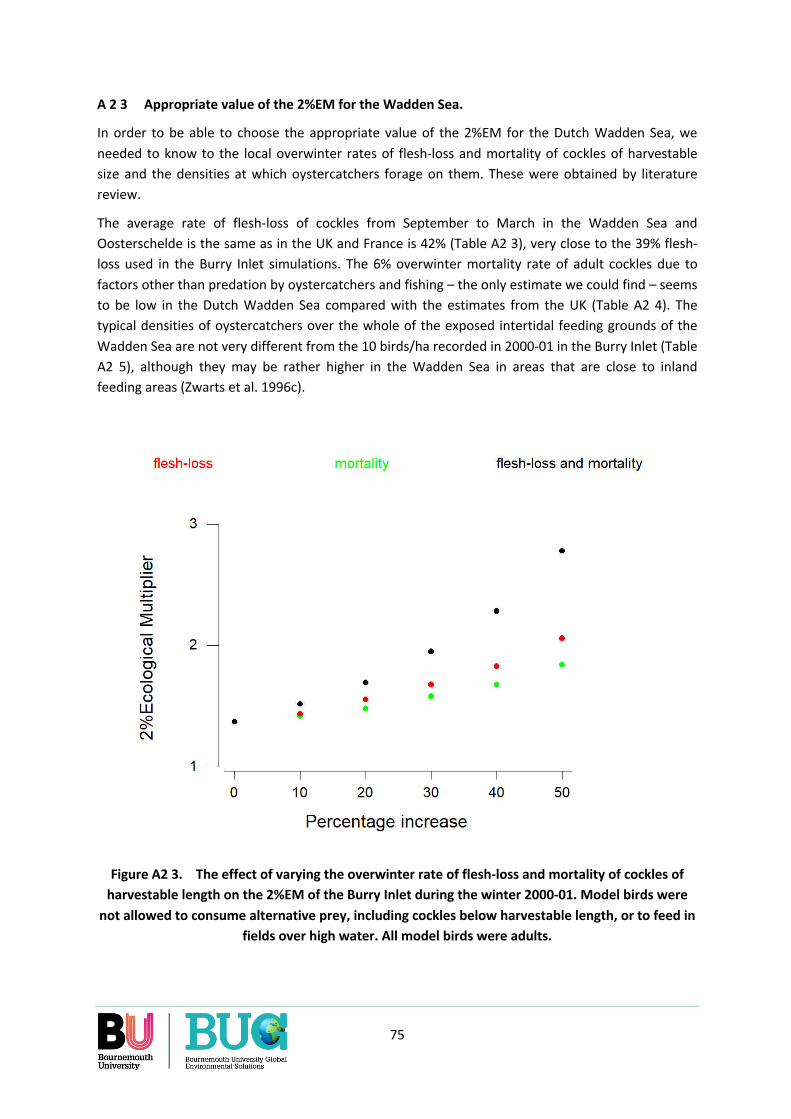
75
A 2 3 Appropriate value of the 2%EM for the Wadden Sea.
In order to be able to choose the appropriate value of the 2%EM for the Dutch Wadden Sea, we needed to know to the local overwinter rates of flesh-loss and mortality of cockles of harvestable size and the densities at which oystercatchers forage on them. These were obtained by literature review.
The average rate of flesh-loss of cockles from September to March in the Wadden Sea and Oosterschelde is the same as in the UK and France is 42% (Table A2 3), very close to the 39% flesh-loss used in the Burry Inlet simulations. The 6% overwinter mortality rate of adult cockles due to factors other than predation by oystercatchers and fishing – the only estimate we could find – seems to be low in the Dutch Wadden Sea compared with the estimates from the UK (Table A2 4). The typical densities of oystercatchers over the whole of the exposed intertidal feeding grounds of the Wadden Sea are not very different from the 10 birds/ha recorded in 2000-01 in the Burry Inlet (Table A2 5), although they may be rather higher in the Wadden Sea in areas that are close to inland feeding areas (Zwarts et al. 1996c).
Figure A2 3. The effect of varying the overwinter rate of flesh-loss and mortality of cockles of harvestable length on the 2%EM of the Burry Inlet during the winter 2000-01. Model birds were
not allowed to consume alternative prey, including cockles below harvestable length, or to feed in fields over high water. All model birds were adults.
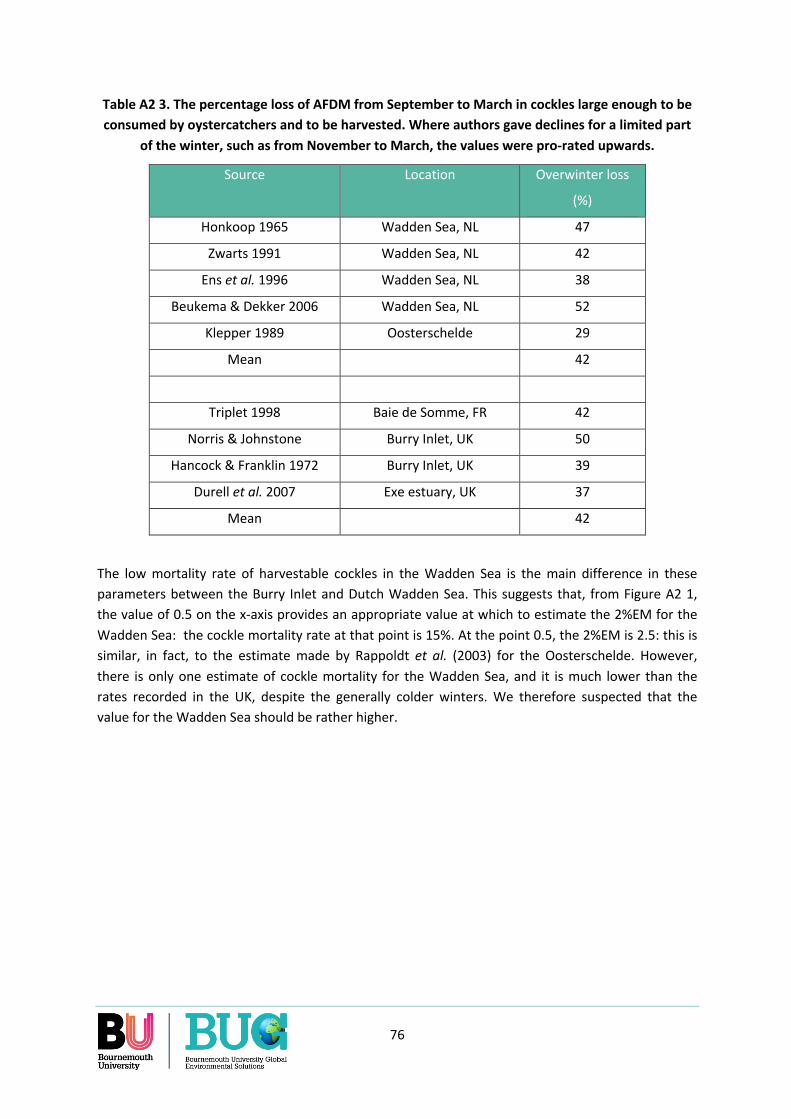
76
Table A2 3. The percentage loss of AFDM from September to March in cockles large enough to be consumed by oystercatchers and to be harvested. Where authors gave declines for a limited part
of the winter, such as from November to March, the values were pro-rated upwards.
Source Location Overwinter loss
(%)
Honkoop 1965 Wadden Sea, NL 47
Zwarts 1991 Wadden Sea, NL 42
Ens et al. 1996 Wadden Sea, NL 38
Beukema & Dekker 2006 Wadden Sea, NL 52
Klepper 1989 Oosterschelde 29
Mean 42
Triplet 1998 Baie de Somme, FR 42
Norris & Johnstone Burry Inlet, UK 50
Hancock & Franklin 1972 Burry Inlet, UK 39
Durell et al. 2007 Exe estuary, UK 37
Mean 42
The low mortality rate of harvestable cockles in the Wadden Sea is the main difference in these parameters between the Burry Inlet and Dutch Wadden Sea. This suggests that, from Figure A2 1, the value of 0.5 on the x-axis provides an appropriate value at which to estimate the 2%EM for the Wadden Sea: the cockle mortality rate at that point is 15%. At the point 0.5, the 2%EM is 2.5: this is similar, in fact, to the estimate made by Rappoldt et al. (2003) for the Oosterschelde. However, there is only one estimate of cockle mortality for the Wadden Sea, and it is much lower than the rates recorded in the UK, despite the generally colder winters. We therefore suspected that the value for the Wadden Sea should be rather higher.

77
Table A2 4. The overwinter mortality of cockles of harvestable size excluding losses due to shellfishing and oystercatchers. The results from ice-free winters only are given: on the Wadden
Sea, the mean mortality over three ice winters was 28.1% ±11.1. Where authors gave declines for a limited part of the winter, such as from November to March, the values were pro-rated upwards.
Source Location Length/age class Years Overwinter mortality %
Ens et al. 2004 Wadden Sea, NL 1yr and older 1990 - 2003 Mean = 6.2 ±0.38 n = 14
Bell et al. 2001 Burry Inlet, UK 2yr and older 1985 - 1997 Mean = 34.7 ±3.29 n = 13
Bell 2006 Wash, UK 1yr and older 1992 - 2001 Mean = 24.6
28.1% se=11.1 n=3
Table A2 5. The densities of oystercatchers on the cockle beds of the Wadden Sea. The data refer to the large areas within which birds move around as the tide ebbs and flows. Very much higher
densities will occur in places that currently attract large numbers of birds – such as at the tide edge (the ‘wetted margin’) (Ens et al. 2015).
Source Location Year Birds/ha
Markert et al. 2013 Baltrum, GE spring 2007 2.17
autumn 2007 6.21
van de Kam et al. 2004 Frisian coast, NL 10.00
Ens et al. 2004 Frisian coast, NL 8.3
Ens et al. 2004 Frisian coast, NL 11.5
Ens et al. 2004 Wadden Sea, NL 1975/76 to 2012/03 1.388 se = 0.045 n = 28
Zwarts et al. 1996 Wadden Sea, NL 1987/78 to 1986/87 8.4
The ambient temperature in west Wales is generally higher than in the Dutch Wadden Sea, especially at the eastern end. The ambient temperature, and frequency of gales, could influence the appropriate value of the 2%EM because they would affect the energy requirements and thus daily consumption of the birds and, perhaps the availability of some or all of their prey. This possibility could only be tested for the effect of ambient temperature, however.
The effect on the 2%EM of the lower average winter temperature (1 December to 31 March) experienced by oystercatchers in the eastern, and therefore coldest, part of the Dutch Wadden Sea on the island of Schiermonnikoog (2.54oC) compared with that in the Burry Inlet (5.88oC) was simulated by reducing the hourly temperature in the Burry Inlet model by 2.5oC and 5.0oC to 3.4 and 0.9oC respectively. Simulations were run with and without small cockles 15-20mm long being
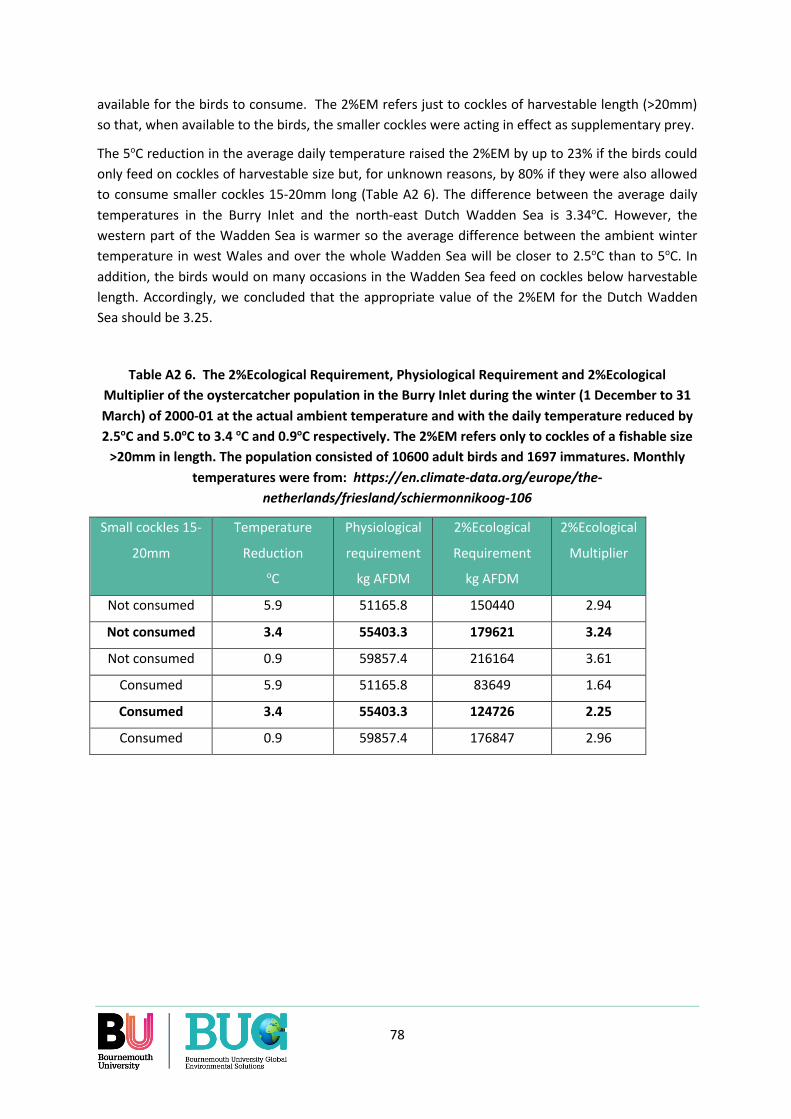
78
available for the birds to consume. The 2%EM refers just to cockles of harvestable length (>20mm) so that, when available to the birds, the smaller cockles were acting in effect as supplementary prey.
The 5oC reduction in the average daily temperature raised the 2%EM by up to 23% if the birds could only feed on cockles of harvestable size but, for unknown reasons, by 80% if they were also allowed to consume smaller cockles 15-20mm long (Table A2 6). The difference between the average daily temperatures in the Burry Inlet and the north-east Dutch Wadden Sea is 3.34oC. However, the western part of the Wadden Sea is warmer so the average difference between the ambient winter temperature in west Wales and over the whole Wadden Sea will be closer to 2.5oC than to 5oC. In addition, the birds would on many occasions in the Wadden Sea feed on cockles below harvestable length. Accordingly, we concluded that the appropriate value of the 2%EM for the Dutch Wadden Sea should be 3.25.
Table A2 6. The 2%Ecological Requirement, Physiological Requirement and 2%Ecological Multiplier of the oystercatcher population in the Burry Inlet during the winter (1 December to 31 March) of 2000-01 at the actual ambient temperature and with the daily temperature reduced by 2.5oC and 5.0oC to 3.4 oC and 0.9oC respectively. The 2%EM refers only to cockles of a fishable size
>20mm in length. The population consisted of 10600 adult birds and 1697 immatures. Monthly temperatures were from: https://en.climate-data.org/europe/the-
netherlands/friesland/schiermonnikoog-106
Small cockles 15-
20mm
Temperature
Reduction oC
Physiological
requirement
kg AFDM
2%Ecological
Requirement
kg AFDM
2%Ecological
Multiplier
Not consumed 5.9 51165.8 150440 2.94
Not consumed 3.4 55403.3 179621 3.24
Not consumed 0.9 59857.4 216164 3.61
Consumed 5.9 51165.8 83649 1.64
Consumed 3.4 55403.3 124726 2.25
Consumed 0.9 59857.4 176847 2.96
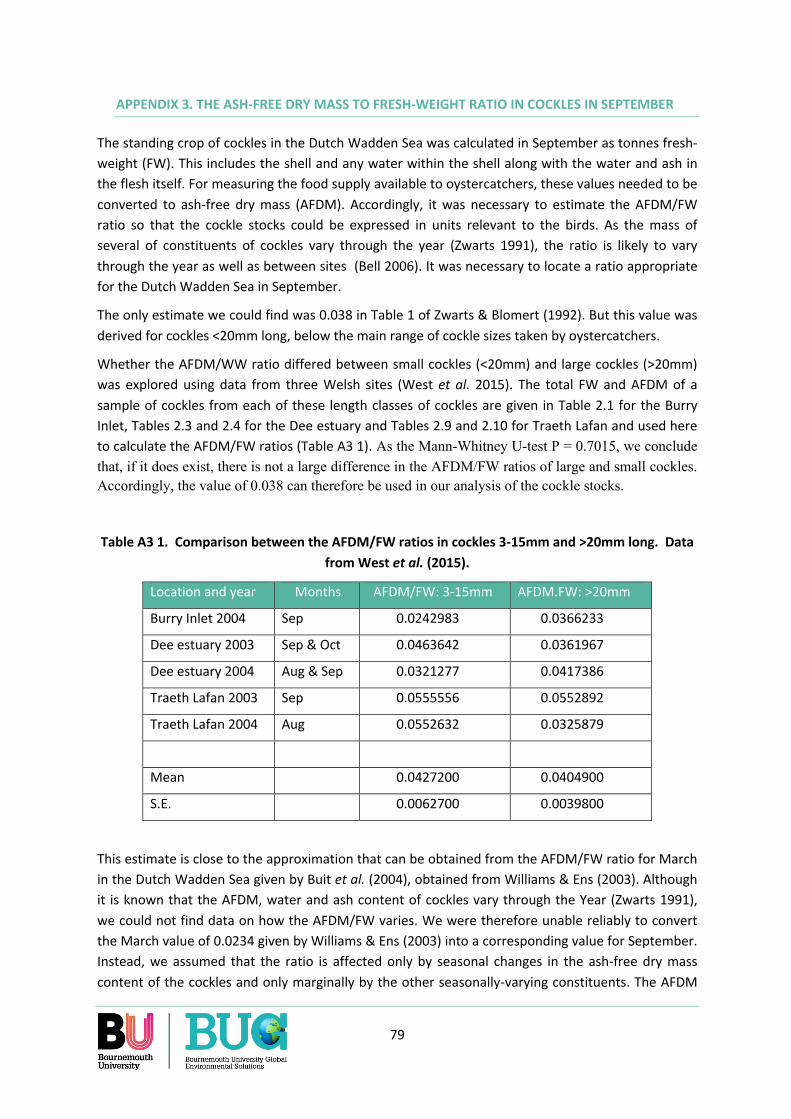
79
APPENDIX 3. THE ASH-FREE DRY MASS TO FRESH-WEIGHT RATIO IN COCKLES IN SEPTEMBER
The standing crop of cockles in the Dutch Wadden Sea was calculated in September as tonnes fresh-weight (FW). This includes the shell and any water within the shell along with the water and ash in the flesh itself. For measuring the food supply available to oystercatchers, these values needed to be converted to ash-free dry mass (AFDM). Accordingly, it was necessary to estimate the AFDM/FW ratio so that the cockle stocks could be expressed in units relevant to the birds. As the mass of several of constituents of cockles vary through the year (Zwarts 1991), the ratio is likely to vary through the year as well as between sites (Bell 2006). It was necessary to locate a ratio appropriate for the Dutch Wadden Sea in September.
The only estimate we could find was 0.038 in Table 1 of Zwarts & Blomert (1992). But this value was derived for cockles <20mm long, below the main range of cockle sizes taken by oystercatchers.
Whether the AFDM/WW ratio differed between small cockles (<20mm) and large cockles (>20mm) was explored using data from three Welsh sites (West et al. 2015). The total FW and AFDM of a sample of cockles from each of these length classes of cockles are given in Table 2.1 for the Burry Inlet, Tables 2.3 and 2.4 for the Dee estuary and Tables 2.9 and 2.10 for Traeth Lafan and used here to calculate the AFDM/FW ratios (Table A3 1). As the Mann-Whitney U-test P = 0.7015, we conclude that, if it does exist, there is not a large difference in the AFDM/FW ratios of large and small cockles. Accordingly, the value of 0.038 can therefore be used in our analysis of the cockle stocks.
Table A3 1. Comparison between the AFDM/FW ratios in cockles 3-15mm and >20mm long. Data from West et al. (2015).
Location and year Months AFDM/FW: 3-15mm AFDM.FW: >20mm
Burry Inlet 2004 Sep 0.0242983 0.0366233
Dee estuary 2003 Sep & Oct 0.0463642 0.0361967
Dee estuary 2004 Aug & Sep 0.0321277 0.0417386
Traeth Lafan 2003 Sep 0.0555556 0.0552892
Traeth Lafan 2004 Aug 0.0552632 0.0325879
Mean 0.0427200 0.0404900
S.E. 0.0062700 0.0039800
This estimate is close to the approximation that can be obtained from the AFDM/FW ratio for March in the Dutch Wadden Sea given by Buit et al. (2004), obtained from Williams & Ens (2003). Although it is known that the AFDM, water and ash content of cockles vary through the Year (Zwarts 1991), we could not find data on how the AFDM/FW varies. We were therefore unable reliably to convert the March value of 0.0234 given by Williams & Ens (2003) into a corresponding value for September. Instead, we assumed that the ratio is affected only by seasonal changes in the ash-free dry mass content of the cockles and only marginally by the other seasonally-varying constituents. The AFDM

80
of cockles declines on average by 42% between September and March in the Dutch Wadden Sea (Appendix A2, Table A2 3). Therefore, the September ratio can be back-calculated from the March value from 0.0234/(1-0.42), which is 0.040. This is close enough to the estimate from Zwarts & Blomert (1992) to raise no concern that the ratio of 0.038 should not be used.
This in an average value, however, and the data are too few to estimate the annual variation between years. It is likely that differences do occur, as is suggested by the comparison of the values in adjacent years from the Dee estuary and Traeth Lafan in Table A3 1). The data are not available to explore whether these apparent differences are real rather than reflecting sampling error, and so we cannot at present estimate the likely magnitude of the variation between years.

81
APPENDIX 4. ENERGY REQUIREMENTS OF OYSTERCATCHERS
The energy requirement of an average oystercatcher was calculated using the same method as is used in the model WEBTICS (Rappoldt et al. 2003c). The daily energy requirements of a single bird were calculated either in the presence (Equation 1) or absence (Equation 2) of thermoregulatory costs. The values for the coefficients below are on page 88 of the Webtics Technical Documentation version 1.1 (Rappoldt et al. 2003c).
Etherm = a – Tb Equation 1
where Etherm = daily energy requirements (KJ day-1) in the presence of thermoregulation, T = temperature (oc), a = 904.0 and b = 30.3.
Enotherm = amb Equation 2
where Enotherm = daily energy requirements (KJ day-1) in the absence of thermoregulation, m = mass of bird (g), a = 0.061 and b = 1.489.
Etherm declines with increasing temperature, whereas Enotherm increases with increased body mass. The maximum value was used to calculate energy requirements, being Etherm at lower temperatures, changing to Enotherm above a threshold temperature that was higher for individuals of greater body mass. The values used for body mass and ambient temperature are shown in Table A4 1.
The biomass of cockles consumed per 24 hrs – rather than just the energy required - by the average bird was obtained by taking into account (i) the assimilation efficiency of cockle flesh of 0.85 (Kersten & Piersma 1987); (ii) the observation that oystercatchers leave behind, un-consumed, about 10% of the flesh in an opened cockle (Zwarts et al. 1996a) , and (iii) the energy density of cockle flesh of 22.5 kJ/g AFDM (Kersten & Piersma 1987; Zwarts & Wanink 1993). The per bird physiological requirements for the average 24 hr day in each month of the non-breeding season are shown in Table A4 2. Over the non-breeding season as a whole, the average bird consumes 9.861 g AFDM of cockle flesh. Over the winter period alone (1 December to 31 March) it consumes 5.856 kg AFDM.

82
Table A4 1. Data used to calculate the daily energy requirement of the average adult oystercatcher in each month of the non-breeding season, using the equation given in Rappoldt et
al. 2003).
Max. temp Min. temp Average temp oC
Adult body weight
(g)
Energy requirements
kJ/day
Sep 17.6 10.3 13.9 542 718.2
Oct 13.4 7.1 10.2 565 764.1
Nov 8.5 3.4 5.9 589 812.9
Dec 5.3 0.7 3.0 611 858.5
Jan 4.2 -0.9 1.6 614 864.8
Feb 4.4 -1-1 1.6 611 858.5
Mar 7.0 0.9 3.9 519 785.8
Table A4 2. Data used to calculate the daily consumption of cockle flesh by the average adult oystercatcher in each month of the non-breeding season.
Net energy requirements
(kJ/day)
Gross energy requirements with 0.85 A.E.
(kJ/day)
Biomass consumption at 22.5 kJ/g AFDM
(g/day)
Gross biomass consumption with
10% waste
(g AFDM /day)
Sep 718.2 844.94 37.5529 41.3082
Oct 764.1 898.94 39.9529 43.9482
Nov 812.9 956.35 42.5046 46.7550
Dec 858.5 1010.00 44.8889 49.3778
Jan 864.8 1017.41 45.2183 49.7401
Feb 858.5 1010.00 44.8889 49.3778
Mar 785.8 924.47 41.0876 45.1963
83
APPENDIX 5. COCKLE REQUIREMENTS OF THE OYSTERCATCHER POPULATION
As well as depending on the energy requirements of each bird, the biomass of cockles required by a population of oystercatchers to maintain an overwinter adult mortality rate of 2% depends on the numbers of them that depend on cockles.
A 5 1 Total numbers
No direct counts are available of the numbers of oystercatchers for which cockles were the principal source of food in winter for each area in each year and so the number doing so was estimated indirectly.
The average number of oystercatchers wintering on the Dutch Wadden Sea over the period 1 September to 31 March were: 2007-08, 135 100; 2008-09, 128 000; 2009-10, 113 800; 2009-10, 124 450; 2010-11, 117 500 (SOVON data; B.J. Ens, personal communication). The equivalent data for the winters 2011-12 to 2018-19 were not available to us but oystercatcher numbers have continued to decrease over that period (Kleefstra et al. 2019). We assumed that 115 000 oystercatchers were on the Dutch Wadden Sea for each of these later winters, a perhaps precautionary estimate.
Within-winter carrying capacity was calculated using the very simple and easily-applied ‘daily ration’ model discussed by Goss-Custard et al. (2002). This model divides the cockle biomass available on 1 September by the biomass required by a single oystercatcher to keep it alive in good condition until 31 March, multiplied by a constant. Sustaining one bird for one winter is termed an ‘oystercatcher/winter’ in this report. So if the harvest collected in an area over the winter is equivalent to the food demands of 1000 oystercatcher/winters, doubling the harvest would decrease the carrying capacity by 2000 oystercatcher/winters.
Wintering oystercatchers are not evenly distributed over the whole of the Dutch Wadden Sea. Counts of birds roosting over high tide show that oystercatchers are more numerous in the eastern part than in the western part (Ens et al. 2009; van der Hut et al. 2014). Based on the diameter of the circles shown in Figure 3.6 (page 18) of van der Hut et al. (2014), we estimated that approximately 60% of oystercatchers overwinter in the eastern part and 40% in the western part, a similar distribution to that over the years 1990 to 2007 (Ens et al. 2009). In our analysis, we assumed that 60% of the total wintering population wintered in the eastern part of the Wadden Sea, this being defined as areas 5 to 9. The remaining 40% were assumed to winter in fishing areas 1 to 4.
A 5 2 Numbers feeding on prey other than cockles
The most stringent, and unrealistic, assumption to make when calculating the demands for cockles by the oystercatcher population is that the birds could only eat cockles above the minimum fishable length of 21mm and only from areas where the density of harvestable cockles exceeded 50/m2. But in the real world, of course, birds take cockles <21mm long and also feed in places with cockle densities <50/m2. They also take mussels, oysters and soft-bodied prey, such as Macoma balthica, from the intertidal flats and prey from the fields, except during frosty periods. As a starting point – the ‘worst case scenario’ - we first calculated carrying capacity on the assumption that all birds only ate cockles of harvestable size and only in areas where the density of cockles was >50/m2. We then explored - as best we could - by how much the impact of cockle harvesting on carrying capacity

84
would be reduced by allowing oystercatchers to exploit these other sources of food. Here we estimate the numbers that may have fed on prey species other than cockles.
We estimated the number of birds feeding on mussel and oyster beds from the surface areas of the beds (Table A5 1) and the typical average densities of oystercatchers on these beds. In NW Europe, the density of oystercatchers on beds with mature populations of mussels averages about 35 birds/ha (Zwarts & Drent 1981; Ens & Cayford 1996; Ens et al. 2004). In the Dutch Wadden Sea over the period being considered, however, oystercatcher densities varied between 5 and 30/ha on mussel beds with <10% coverage by oysters (van Kleunen et al. 2012; Waser et al. 2016). On the advice of B.J. Ens, we used 20 oystercatchers/ha for mussel beds.
The density of oystercatchers on mixed beds of mussels and Pacific oysters with >10% coverage of oysters in the Dutch and German Wadden Seas varied between 1.2 and 8.69 oystercatchers/ha (Markert et al. 2013 Waser et al. 2016). As the mean values in the two studies were, respectively, 4.14 (over the years 2005 to 2007) and 4.71 (2010 to 2013) birds/ha, we assumed a typical and precautionary density of 4.0 birds/ha on oyster beds in the Dutch Wadden Sea over our study period. It does not matter for our purposes that oystercatchers may have been eating mussels or oysters because we just need to know the likely numbers that were not feeding on cockles.
Table A5 1. The surface area covered by harvestable cockles at densities above 50/m2, mussel beds and oyster beds in the Dutch Wadden Sea.
Winter Surface area of harvestable
cockles >50/m2
(ha)
Surface are of mussel beds (ha)
Oyster beds (ha)
2007/08 14940 1560.49 750.62
08 14939 1017.28 938.27
09 12706 1007.41 997.53
10 8842 1106.17 888.89
11 8368 1046.91 1106.17
12 25996 819.75 1056.79
13 26874 918.52 1096.30
14 23193 553.09 1204.94
15 24242 592.59 1244.45
16 21447 691.36 1520.99
17 16408 2637.04 1481.48
The area occupied by mussels in the Dutch Wadden Sea can be greatly reduced over some winters by gales and ice, the severity of which may vary from area to area within the Wadden Sea and between years (Dankers & Koelemaij 1989; Ens et al. 2004, Steenbergen, et al. 2006). A particular

85
difficulty arising from this for our study that sometimes very large areas of spatfall can occur which do not persist long enough for the mussels to grow to the size from which oystercatchers in winter obtain most of their mussel meat (circa. >30mm long) and so should not be included as potential feeding ground for oystercatchers. To look for large and un-sustained spikes in abundance that would indicate massive spatfall, we plotted the surface area of mussels recorded in each area throughout the study period. In fact, the surface area covered by mussels in most areas fluctuated rather steadily between 2007 and 2018, with the exception of several areas towards the western Wadden Sea in 2017 (Figure A5 1). This spike in abundance is also apparent in one area in the eastern Wadden Sea where mostly the surface area covered by mussels did not fluctuate exceptionally, as illustrated in (Figure A5 2). We therefore discounted the huge peaks in surface area covered by mussels in some areas in 2017 and used for our estimate in that year the average of the adjacent years of 2016 and 2018.
Figure A5 1. Surface area covered by mussels in four areas of the western Wadden Sea. Huge increases occurred in 2017 in three areas but had collapsed by the following year. Areas partially
open to cockle fishing (C). were combined with areas that were permanently open to cockle fishing (D).

86
Figure A5 2. Surface area covered by mussels in the four areas eastern areas of the Wadden Sea. A huge increase only occurred in 2017 in one area. Areas partially open to cockle fishing (C). were
combined with areas that were permanently open to cockle fishing (D).

87
APPENDIX 6. PERHAPS THE MORTALITY RATE OF YOUNG BIRDS CAN BE USED TO DEFINE CARRYING CAPACITY RATHER THAN THAT OF ADULT BIRDS
One reason for choosing to base our definition of carrying capacity on the normal mortality of adult birds was that, being far more numerous than young birds, there are more published reliable estimates of their mortality rate than there are for young birds. The other reason was that existing models of oystercatcher populations indicated that population trends are more sensitive to changes in the mortality rate of adults than of young birds: for example, Atkinson et al. (2003) concluded from simulations with their model of the oystercatcher population of the Wash; ‘..sensitivity analysis (not shown) indicated that the model index (of oystercatcher population size) is relatively insensitive to small changes in juvenile survival and recruitment but very sensitive to small changes in adult mortality’. On the other hand, other modelling has indicated that ‘increasing the mortality of a small and vulnerable minority (i.e. juveniles) of the population in winter may have a substantial effect on stable population size’ (Goss-Custard & Durell 1984). Perhaps the recruitment and subsequent winter survival of young birds is actually as important, or even more important, in determining the population’s future trajectory than is the winter mortality rate of adults? Juvenile recruitment is of particular concern because there is evidence that juvenile oystercatchers are more able than adults to exploit newly-settled banks of cockles (Sutherland 1982c). It is also difficult to understand how the numbers of waders on different estuaries come to vary with food abundance unless young birds try a number of sites when they first arrive on the non-breeding grounds and settle preferentially in areas with abundant food relative to the size of the bird population already present (Goss-Custard et al. 1977c). It is uncertain, therefore, whether the definition of carrying capacity should be based on the mortality rate of adult birds rather than on the recruitment and subsequent survival of juveniles and immature birds.
The current (WEBTICS) approach to assessing carrying capacity has the advantage over our approach in this regard because it takes into account juvenile recruitment and survival. It also takes into account any linkage between feeding conditions on the non-breeding grounds and subsequent breeding success (Rappoldt et al. 2003c). This approach is unaffected by uncertainty as to which demographic rate, or which combination of demographic rates, is critical for determining the long-term trajectory of an oystercatcher population, as discussed by (Klok et al. 2009). In our view, though, the difficulty with it is that the absolute measure of the carrying capacity of the wintering grounds can be affected by changes in the survival and reproductive success on the breeding grounds due to factors unrelated to the condition of the wintering grounds themselves. This is contrary to the widespread ‘common-sense’ understanding of the notion of the carrying capacity of the wintering grounds which focusses on the factors and processes that determine how many birds can be supported by the winter food supplies (Goss-Custard 1993).
One can speculate, however, that young oystercatchers prospecting for an area in which to spend their winters would be less likely to settle on a site where the adults have difficulty in meeting their food requirements in winter and would move on to find a site with better feeding conditions. With this perspective, the criterion of 2% adult mortality rate can be viewed as a measure of the feeding conditions in a particular non-breeding site which could indicate to young birds whether they should settle there or find an alternative. We should stress that this is not to imply that young birds in autumn are able to monitor the survival prospects of adult birds several months later in the winter,
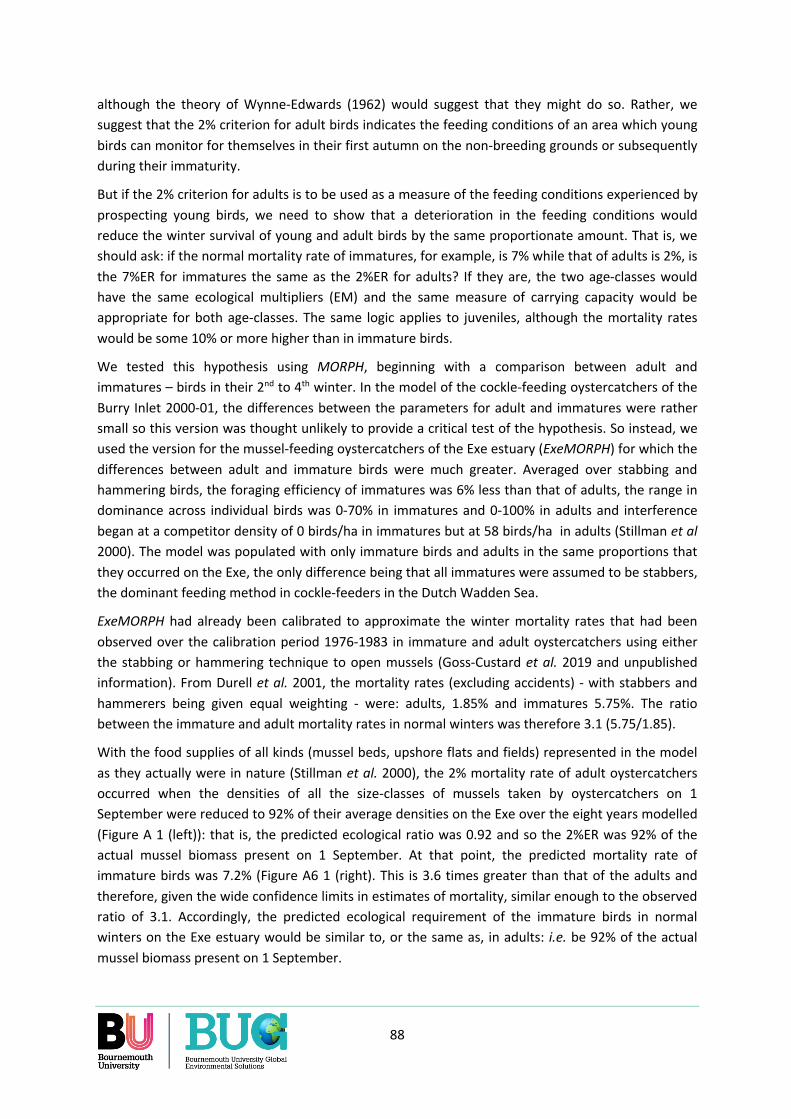
88
although the theory of Wynne-Edwards (1962) would suggest that they might do so. Rather, we suggest that the 2% criterion for adult birds indicates the feeding conditions of an area which young birds can monitor for themselves in their first autumn on the non-breeding grounds or subsequently during their immaturity.
But if the 2% criterion for adults is to be used as a measure of the feeding conditions experienced by prospecting young birds, we need to show that a deterioration in the feeding conditions would reduce the winter survival of young and adult birds by the same proportionate amount. That is, we should ask: if the normal mortality rate of immatures, for example, is 7% while that of adults is 2%, is the 7%ER for immatures the same as the 2%ER for adults? If they are, the two age-classes would have the same ecological multipliers (EM) and the same measure of carrying capacity would be appropriate for both age-classes. The same logic applies to juveniles, although the mortality rates would be some 10% or more higher than in immature birds.
We tested this hypothesis using MORPH, beginning with a comparison between adult and immatures – birds in their 2nd to 4th winter. In the model of the cockle-feeding oystercatchers of the Burry Inlet 2000-01, the differences between the parameters for adult and immatures were rather small so this version was thought unlikely to provide a critical test of the hypothesis. So instead, we used the version for the mussel-feeding oystercatchers of the Exe estuary (ExeMORPH) for which the differences between adult and immature birds were much greater. Averaged over stabbing and hammering birds, the foraging efficiency of immatures was 6% less than that of adults, the range in dominance across individual birds was 0-70% in immatures and 0-100% in adults and interference began at a competitor density of 0 birds/ha in immatures but at 58 birds/ha in adults (Stillman et al 2000). The model was populated with only immature birds and adults in the same proportions that they occurred on the Exe, the only difference being that all immatures were assumed to be stabbers, the dominant feeding method in cockle-feeders in the Dutch Wadden Sea.
ExeMORPH had already been calibrated to approximate the winter mortality rates that had been observed over the calibration period 1976-1983 in immature and adult oystercatchers using either the stabbing or hammering technique to open mussels (Goss-Custard et al. 2019 and unpublished information). From Durell et al. 2001, the mortality rates (excluding accidents) - with stabbers and hammerers being given equal weighting - were: adults, 1.85% and immatures 5.75%. The ratio between the immature and adult mortality rates in normal winters was therefore 3.1 (5.75/1.85).
With the food supplies of all kinds (mussel beds, upshore flats and fields) represented in the model as they actually were in nature (Stillman et al. 2000), the 2% mortality rate of adult oystercatchers occurred when the densities of all the size-classes of mussels taken by oystercatchers on 1 September were reduced to 92% of their average densities on the Exe over the eight years modelled (Figure A 1 (left)): that is, the predicted ecological ratio was 0.92 and so the 2%ER was 92% of the actual mussel biomass present on 1 September. At that point, the predicted mortality rate of immature birds was 7.2% (Figure A6 1 (right). This is 3.6 times greater than that of the adults and therefore, given the wide confidence limits in estimates of mortality, similar enough to the observed ratio of 3.1. Accordingly, the predicted ecological requirement of the immature birds in normal winters on the Exe estuary would be similar to, or the same as, in adults: i.e. be 92% of the actual mussel biomass present on 1 September.
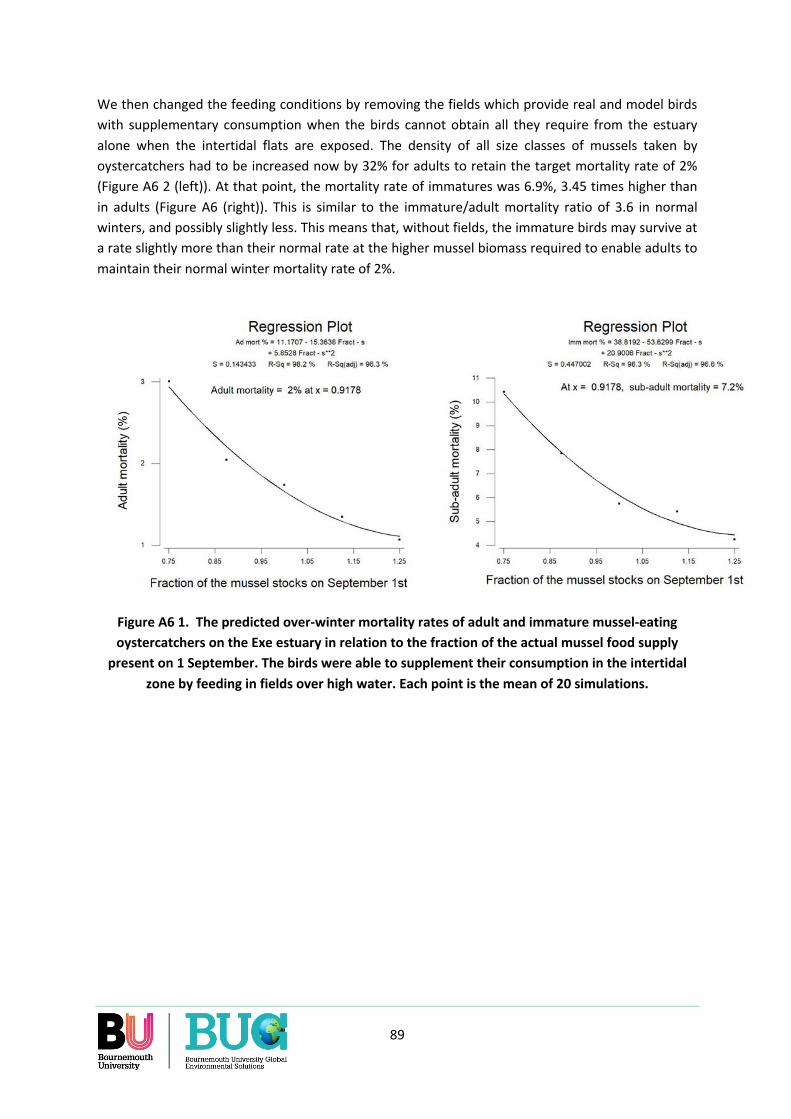
89
We then changed the feeding conditions by removing the fields which provide real and model birds with supplementary consumption when the birds cannot obtain all they require from the estuary alone when the intertidal flats are exposed. The density of all size classes of mussels taken by oystercatchers had to be increased now by 32% for adults to retain the target mortality rate of 2% (Figure A6 2 (left)). At that point, the mortality rate of immatures was 6.9%, 3.45 times higher than in adults (Figure A6 (right)). This is similar to the immature/adult mortality ratio of 3.6 in normal winters, and possibly slightly less. This means that, without fields, the immature birds may survive at a rate slightly more than their normal rate at the higher mussel biomass required to enable adults to maintain their normal winter mortality rate of 2%.
Figure A6 1. The predicted over-winter mortality rates of adult and immature mussel-eating oystercatchers on the Exe estuary in relation to the fraction of the actual mussel food supply
present on 1 September. The birds were able to supplement their consumption in the intertidal zone by feeding in fields over high water. Each point is the mean of 20 simulations.

90
Figure A6 2. The predicted over-winter mortality rates of adult and immature mussel-eating oystercatchers on the Exe estuary in relation to the fraction of the actual mussel food supply present on 1 September. The birds were not allowed to supplement their consumption in the intertidal zone by feeding in fields over high water. Each point is the mean of 20 simulations.
This prompted the question: ‘Does the ratio between the winter mortality rates of immatures and adults remain the same in the real world when the feeding conditions deteriorate?’ This was tested by comparing the winter mortality rates of oystercatchers of different age-classes foraging in normal and in sub-normal conditions in continental Europe (Duriez et al. 2012). In their analysis of ringing data they distinguished between three periods: (i) years with a mild winter; (ii) years following the removal of much intertidal habitat in the Netherlands, and (iii) years with severe winter weather. The study also distinguished between resident and migrant oystercatchers in adults, immatures and juveniles.
There is no indication that, following a major deterioration in the feeding conditions, the winter mortality rate of immature birds increased disproportionately relative to the increase that occurred in adults. That is, the ratio immature mortality/adult mortality either remained the same or decreased (Table A6 1). This result is consistent with a previous finding from the Dutch Wadden Sea that, when the mortality rate increases across all three age-classes, the ratio between the mortality rates in young birds and that of the adults decreases; that is, the higher the absolute average mortality rate in all classes, the smaller is the difference between the rate in adults and those in the two classes of young birds (page 349, Zwarts et al. 1996b).

91
Table A6 1. Ratio of the winter mortality rate in immature and juvenile oystercatchers to the mortality rate of adult oystercatchers. From Duriez et al. (2012).
Category of birds Normal winter After habitat loss Severe weather
Immature - resident 4.94 3.29 2.18
Immature - migrant 3.11 4.16 2.56
Average 4.03 3.72 2.37
Juvenile - resident 15.35 14.81 2.58
Juvenile - migrant 9.67 9.98 2.63
Average 12.51 12.40 2.60
The first simulations with ExeMORPH suggested that, when the feeding conditions deteriorate, the increase in the stock of mussels required to enable oystercatchers to achieve their normal over-winter survival rate is similar in adults and immatures. The 2%ER of the adult birds is therefore equivalent to the circa 7%ER of immature birds. Further simulations were run to test this under a wider range of conditions. As the feeding conditions deteriorate from the top to the bottom row in Table A6 2, the biomass of mussels required to maintain the adult mortality rate at 2% increases almost threefold. As that happens, the immature mortality rate may decrease slightly (but not significantly statistically) from its rate in normal conditions. But it certainly does not increase as would be the case if a deterioration of the food supplies on the wintering grounds caused the 2%ER to increase more in immature birds than it does in adults. In fact, the 2% ecological requirements of the immatures increases by a slightly lower amount than it does in adult birds (Table A6 2). There is therefore no indication that it would be inappropriate to apply the 2EM for adult birds to immature birds for their normal winter mortality rate to be maintained. If anything, using the 2%ER for adults as the criterion for carrying capacity may, for the immature birds, be slightly precautionary.
Table A6 2. Simulations with ExeMORPH showing how the winter mortality rate and ecological requirements of immatures changes as the mussel food supply required to maintain an adult
winter mortality rate of 2% increases.
Conditions Immature mortality when adult rate = 2%
2%ER - adults 2%ER – immatures
% Tonnes AFDM Tonnes AFDM
Normal Exe 1976-83 7.2 116 116
Normal but no fields 6.9 167 162
1.5x normal population size 6.8 170 163
Double population all ages 6.7 226 213
Double population - no fields 6.8 346 331
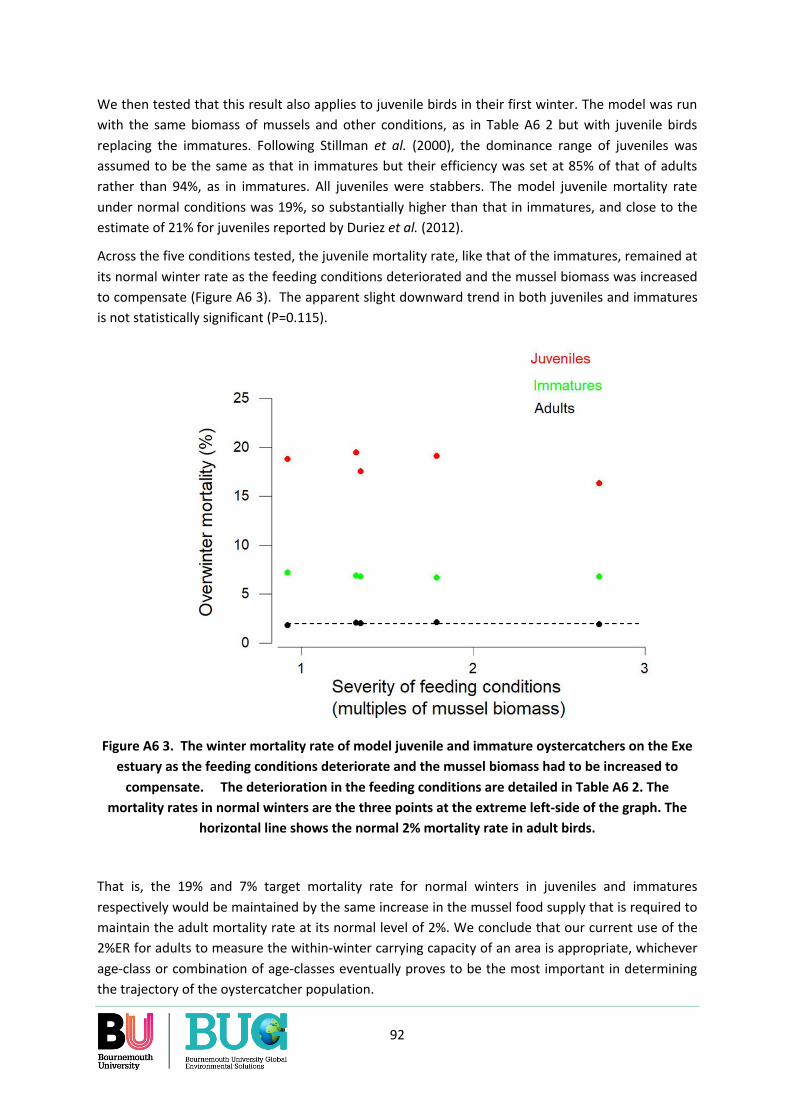
92
We then tested that this result also applies to juvenile birds in their first winter. The model was run with the same biomass of mussels and other conditions, as in Table A6 2 but with juvenile birds replacing the immatures. Following Stillman et al. (2000), the dominance range of juveniles was assumed to be the same as that in immatures but their efficiency was set at 85% of that of adults rather than 94%, as in immatures. All juveniles were stabbers. The model juvenile mortality rate under normal conditions was 19%, so substantially higher than that in immatures, and close to the estimate of 21% for juveniles reported by Duriez et al. (2012).
Across the five conditions tested, the juvenile mortality rate, like that of the immatures, remained at its normal winter rate as the feeding conditions deteriorated and the mussel biomass was increased to compensate (Figure A6 3). The apparent slight downward trend in both juveniles and immatures is not statistically significant (P=0.115).
Figure A6 3. The winter mortality rate of model juvenile and immature oystercatchers on the Exe estuary as the feeding conditions deteriorate and the mussel biomass had to be increased to
compensate. The deterioration in the feeding conditions are detailed in Table A6 2. The mortality rates in normal winters are the three points at the extreme left-side of the graph. The
horizontal line shows the normal 2% mortality rate in adult birds.
That is, the 19% and 7% target mortality rate for normal winters in juveniles and immatures respectively would be maintained by the same increase in the mussel food supply that is required to maintain the adult mortality rate at its normal level of 2%. We conclude that our current use of the 2%ER for adults to measure the within-winter carrying capacity of an area is appropriate, whichever age-class or combination of age-classes eventually proves to be the most important in determining the trajectory of the oystercatcher population.

93
APPENDIX 7. WITHIN-WINTER SHIFTS IN THE DISTRIBUTION OF COCKLE-EATING OYSTERCATCHERS IN THE WASH, UK.
M.G. Yates has counted the numbers of oystercatchers in a sample of areas in the Wash, UK, over several years (1997-2008). Counts were made in early winter (November and December) and in late winter (January and February), just before the birds start migrating to the breeding areas. Figure A7 1. Shows the locations of the transects and areas on the east and south-east sides of the Wash. Counts were also made in two additional areas on the west side of the Wash at Wrangle. We used counts from those two west-side areas, areas DS and PS and transects 63-66 as the oystercatchers there were known to feed exclusively on cockles.
Figure A7 1. The locations of the transects and areas on the east and south-east sides of the Wash used for recording the distribution of cockle-feeding oystercatchers in November and December
and in January and February over the winters 1997-98 and 2007-08. Counts were also made in two other areas at Wrangle, on the west side of the Wash.
The comparison for all area-years between the numbers of oystercatchers counted in early winter and late winter indicates that the birds’ distribution did change over the winter, and sometimes substantially (Figure A7 2). It is not known, however, whether birds that changed their locations

94
suffered any reduction in body condition and/or survival chances. On the other hand, oystercatcher survival in the Wash over the winter is typically very high and invariable between winters, unless the stocks of cockles and mussels are both very low (Atkinson et al. 2003). This might suggest that the changes in location made by the oystercatchers of the Wash through the winter did not affect them deleteriously, and may even have enhanced their chances of surviving the winter in good condition.
Figure A7 2. The numbers of oystercatchers counted in a single transect or area in January/February plotted against the numbers recorded there in the preceding
November/December. The y=x line shows when numbers in both counts would be the same. The gap between a point and the y=x line shows by much bird numbers differed between the two
counts made in the same place in a single winter.

95
APPENDIX 8. EFFECT OF THE START DATE ON THE 2%EM
In N.W. Europe, oystercatchers have a very high survival rate through autumn and only start to experience difficulties from the end of November onwards (Zwarts et al. 1996b; Ens et al. 2004; Goss-Custard et al. 2019a). Most of the mortality that takes place starts during December and peaks during January and February. It has been suggested that the best date at which to ensure that the ecological requirements of the birds are met, and also that carrying capacity is measured, would be 1 December, and not 1 September as previously (Goss-Custard et al. 2019a).
We thought it could be useful to find out whether it matters if the 2%EM is calculated for 1 September or for 1 December. Accordingly, a series of simulations were run with the Burry Inlet 2000-01 model in which parameters were varied to provide a range of conditions. The difference between the mean values for the period 1 September to 31 March and 1 December to 31 March was not significant (Table A8 1). Accordingly, whenever the carrying capacity is measured for 1 December in this report, the value of 3.25 for the 2%EM is still appropriate.
Table A8 1. The 2%Ecological Multipliers (2%EM) for the Burry Inlet 2000-01 under a variety of scenarios. The period for which the 2%EM values were calculated were either 1 September to 31 March or from 1 December to March 31 (highlighted red). For 1 September, mean= 2.01, s.e. = ± 0.318; for 1 December, mean = 1.86, = ± 0.420, the difference not being significant in a paired T-
test (T = 1.09, p = 0.324).
Start date Scenario 2%EM
1 September without cockles <20mm: 12343 birds 2.11411
1 December without cockles <20mm: 12343 birds 1.66526
1 September with cockles <20mm: 12343 birds 1.58045
1 December with cockles <20mm: 12343 birds 1.12911
1 September with cockles <20mm: 6172 birds 1.04166
1 December with cockles <20mm: 6172 birds 0.83055
1 September with cockles <20mm: 24686 birds 1.59424
1 December with cockles <20mm: 24686 birds 1.48481
1 September without cockles <20mm: beds lowered 1m 2.44765
1 December without cockles <20mm: beds lowered 1m 2.42067
1 September with cockles <20mm: beds lowered 2m 3.25263
1 December with cockles <20mm: beds lowered 2m 3.65140
96
APPENDIX 9. THE EFFECT OF A HARVEST IN ONE YEAR ON THE RATE OF DECLINE IN THE STANDING CROP OF COCKLES IN SUBSEQUENT YEARS.
When cockle stocks are very high, there is considerable surplus above the requirements of oystercatchers which could be fished without harming oystercatchers during that winter of abundance (Section 7.7.1 in the main report). But would that mean that the stocks available to both the birds and the fishers would be reduced in subsequent years by more than they would otherwise have been?
During the period covered by this report, the stock of harvestable cockles at densities >50/m2 was at peak in September 2012 and then declined year-by-year until the last year for which we have data, 2018 (Figure 15). This run of six winters provided an opportunity to test whether the rate of decline was increased by the cockle fishing that occurred throughout.
If cockle-fishing increased the rate of decline in the September stocks, we would expect the rate of decline to have been steeper in the fished areas than in the closed areas, but this does not appear to be the case (Figure A9 1).
Figure A9 1. The September standing crop of harvestable cockles at densities >50/m2 in fished (red) and closed areas of the Dutch Wadden Sea. The slopes are not significantly different: P =
0.494; DF = 3, 13.
If cockle-fishing increased the rate of decline in the September stocks, we would also expect the decline year-on-year to have been higher in area-years with the largest harvests. We tested this by
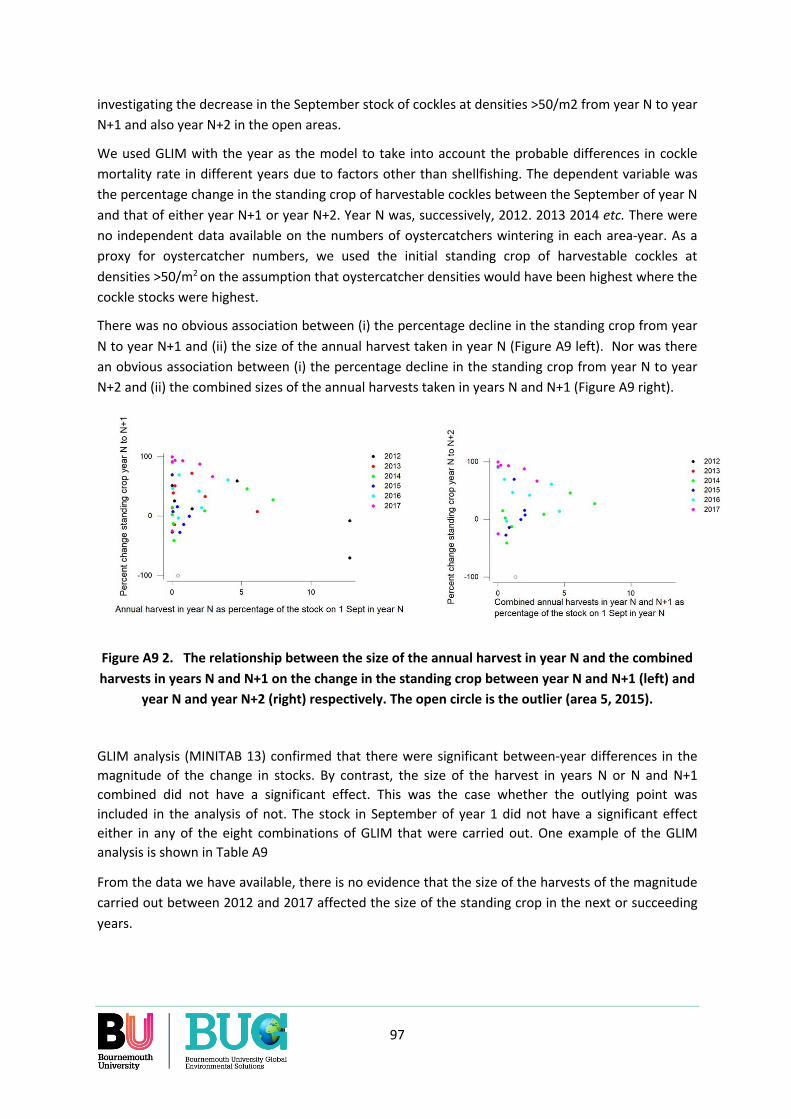
97
investigating the decrease in the September stock of cockles at densities >50/m2 from year N to year N+1 and also year N+2 in the open areas.
We used GLIM with the year as the model to take into account the probable differences in cockle mortality rate in different years due to factors other than shellfishing. The dependent variable was the percentage change in the standing crop of harvestable cockles between the September of year N and that of either year N+1 or year N+2. Year N was, successively, 2012. 2013 2014 etc. There were no independent data available on the numbers of oystercatchers wintering in each area-year. As a proxy for oystercatcher numbers, we used the initial standing crop of harvestable cockles at densities >50/m2 on the assumption that oystercatcher densities would have been highest where the cockle stocks were highest.
There was no obvious association between (i) the percentage decline in the standing crop from year N to year N+1 and (ii) the size of the annual harvest taken in year N (Figure A9 left). Nor was there an obvious association between (i) the percentage decline in the standing crop from year N to year N+2 and (ii) the combined sizes of the annual harvests taken in years N and N+1 (Figure A9 right).
Figure A9 2. The relationship between the size of the annual harvest in year N and the combined harvests in years N and N+1 on the change in the standing crop between year N and N+1 (left) and
year N and year N+2 (right) respectively. The open circle is the outlier (area 5, 2015).
GLIM analysis (MINITAB 13) confirmed that there were significant between-year differences in the magnitude of the change in stocks. By contrast, the size of the harvest in years N or N and N+1 combined did not have a significant effect. This was the case whether the outlying point was included in the analysis of not. The stock in September of year 1 did not have a significant effect either in any of the eight combinations of GLIM that were carried out. One example of the GLIM analysis is shown in Table A9
From the data we have available, there is no evidence that the size of the harvests of the magnitude carried out between 2012 and 2017 affected the size of the standing crop in the next or succeeding years.

98
Table A9 2. Example of the GLIM analysis of variance table of the percentage change in the September standing crop of cockles at densities >50/m2 in relation to the size of the annual
harvest in year N (AH%), measured as a percentage of the initial standing crop.: Year N to N+1; includes outlier and standing crop of cockles (SC) in September of year N.
Year fixed 2012 2013 2014 2015 2016 2017
Analysis of Variance for %change, using Adjusted SS for Tests
Source DF Seq SS Adj SS Adj MS F P
SC 1 0 3065 3065 1.86 0.181
AH% 1 4432 3734 3734 2.27 0.141
Year 5 30343 30343 6069 3.69 0.009
Error 35 57602 57602 1646
Total 42 92378
Term Coef SE Coef T P
Constant 21.77 10.89 2.00 0.053
SC 0.000009 0.000006 1.36 0.181
AH% -3.378 2.243 -1.51 0.141

99
APPENDIX 10. EFFECT OF THE TARGET MORTALITY RATE ON THE ECOLOGICAL REQUIREMENT
If few or perhaps even none of the 2% of adults that die in winter have starved to death, how much of a difference would this false assumption make to the estimated ecological requirement (ER)?
This was explored by calculating the ER from the Burry Inlet version of MORPH for 2000-01 that has been used throughout this report. With the model birds unable to take cockles below the harvestable size of 20mm, the ER was 89.4 tonnes AFDM of cockles of harvestable size at an adult starvation rate of 2% and 97.5 tonnes AFDM at 0%, a difference of 9% (Figure A10 1). If the model birds were allowed to take cockles between 15 and 20mm long as well as those of harvestable size, the equivalent values were 72.8 and 80.2 tonnes AFDM of cockles of harvestable size, a difference of 10% (Figure A10. 1). This suggests that the error arising from an inappropriate assumption about the target rate of adult mortality from starvation might cause as much as a 10% under-estimation in the ecological requirements of the population. This small effect reflects the low intensity of interference competition in cockle-feeding oystercatchers (Triplet et al. 1999; Stillman et al. 2001). Accordingly, in a cockle-feeding oystercatcher population, competition more closely resembles scramble than contest competition in which the difference would be larger.
Figure A10 1. The effect on the ecological requirement for cockles of harvestable size of reducing the target adult starvation rate from 2% to 0% when the birds were not allowed to eat cockles
below harvestable length (black) and when they were (red).