How Knowledge Management Implementation Affects the ...
36
University of Windsor University of Windsor Scholarship at UWindsor Scholarship at UWindsor Odette School of Business Publications Odette School of Business 2017 How Knowledge Management Implementation Affects the How Knowledge Management Implementation Affects the Performance of Egyptian Construction Companies Performance of Egyptian Construction Companies Ahmed Elfar Pioneers Holding Co. Abdel Moneim Elsaid Ain Shams University Eahab Elsaid University of Windsor Follow this and additional works at: https://scholar.uwindsor.ca/odettepub Part of the Business Administration, Management, and Operations Commons Recommended Citation Recommended Citation Elfar, Ahmed; Elsaid, Abdel Moneim; and Elsaid, Eahab. (2017). How Knowledge Management Implementation Affects the Performance of Egyptian Construction Companies. Journal of Applied Business Research, 33 (3), 409-438. https://scholar.uwindsor.ca/odettepub/128 This Article is brought to you for free and open access by the Odette School of Business at Scholarship at UWindsor. It has been accepted for inclusion in Odette School of Business Publications by an authorized administrator of Scholarship at UWindsor. For more information, please contact [email protected].
-
Upload
khangminh22 -
Category
Documents
-
view
3 -
download
0
Transcript of How Knowledge Management Implementation Affects the ...
University of Windsor University of Windsor
Scholarship at UWindsor Scholarship at UWindsor
Odette School of Business Publications Odette School of Business
2017
How Knowledge Management Implementation Affects the How Knowledge Management Implementation Affects the
Performance of Egyptian Construction Companies Performance of Egyptian Construction Companies
Ahmed Elfar Pioneers Holding Co.
Abdel Moneim Elsaid Ain Shams University
Eahab Elsaid University of Windsor
Follow this and additional works at: https://scholar.uwindsor.ca/odettepub
Part of the Business Administration, Management, and Operations Commons
Recommended Citation Recommended Citation Elfar, Ahmed; Elsaid, Abdel Moneim; and Elsaid, Eahab. (2017). How Knowledge Management Implementation Affects the Performance of Egyptian Construction Companies. Journal of Applied Business Research, 33 (3), 409-438. https://scholar.uwindsor.ca/odettepub/128
This Article is brought to you for free and open access by the Odette School of Business at Scholarship at UWindsor. It has been accepted for inclusion in Odette School of Business Publications by an authorized administrator of Scholarship at UWindsor. For more information, please contact [email protected].

How Knowledge Management Implementation Affects the Performance of Egyptian Construction Companies
Ahmed ElFar
Project Director
Pioneers Holding Co.
169 Orouba Street, Heliopolis
Cairo, Egypt
Abdel Moneim Elsaid,
Faculty of Commerce,
Ain Shams University,
Khalifa Mamon St., Abassya,
Cairo, Egypt
Eahab Elsaid
Finance Department
Odette School of Business
University of Windsor
401 Sunset Ave.
Windsor, Ontario, N9B 3P4
Canada
(519) 253-3000 ext. 4258
Ahmed Elfar is a DBA student at ESLSCA International Business School, Cairo, Egypt. He is also the Projects
Director at the Pioneer Holding, Co. in Cairo, Egypt.
Abdel Moneim Elsaid is a Full Professor of Management at the Faculty of Commerce, Ain Shams University, Cairo,
Egypt. He has published in Journal of Applied Business Research, Research & Practice in Human Resource
Management and International Journal of Electronic Marketing & Retailing.
Eahab Elsaid is an Associate Professor of Finance at the Odette School of Business, University of Windsor, Canada.
He has published in Journal of Applied Business Research, Gender in Management: An International Journal,
Quarterly Review of Economics & Finance and Managerial Finance
How Knowledge Management Implementation Affects the Performance of Egyptian Construction Companies
ABSTRACT
This study examines the effectiveness of knowledge management systems within the construction industry
in Egypt from the perspective of knowledge infrastructure capability (KIC), knowledge process capability (KPC) and
their impact on business performance (BP) from the financial, consumer, learning and growth, supplier and internal
perspectives. The sample consists of 75 first class Egyptian construction companies. The authors used a questionnaire
that was modified from the questionnaire previously used by Gold et al., (2001) and Smith (2006). The authors used
one-way ANOVA, t-tests and OLS regressions. The results indicated that both knowledge infrastructure capability
(KIC) and knowledge process capability (KPC) have a positive effect on business performance (BP). The results also
indicate that organizations with well-developed training and development plans have significantly higher KIC and
KPC scores compared to those that do not have such plans.
Keywords: Egypt; Knowledge Management; Construction Industry; Business Performance; Knowledge
Infrastructure Capability; Knowledge Process Capability
INTRODUCTION
Two of main characteristics of today’s business environment are complexity and uncertainty. Most
organizations, including construction companies, have a competitive advantage depending on the knowledge available
to them. To maintain this competitive advantage in a dynamic environment, companies must keep developing their
knowledge management strengths in order to build and improve their knowledge resources over time. Although the
term knowledge management is relatively new, the application of knowledge management is not new (Robinson et
al., 2004). The main challenge in a knowledge-based economy is to be innovative and to continuously improve
products, services and processes (Robinson et al., 2004). Knowledge management is defined as any process of
creating, acquiring, capturing, sharing and using knowledge in order to enhance learning and performance in
organizations ((Robinson et al., 2004; Scarborough et al., 1999). The goal of the study is to examine the effectiveness
of the knowledge management system within Egyptian construction companies from the perspective of Knowledge
Infrastructure Capability (KIC) and Knowledge Process Capability (KPC) and its impact on business performance
from financial, consumer, learning and growth, supplier and internal perspectives.
The construction industry is a knowledge-driven industry. The main challenge for any construction firm is
time and cost of the project. Accordingly, knowledge management when implemented properly will provide
employees with necessary knowledge in a fast and reliable method which will likely lead to better business
performance when it comes to project cost and time. The construction companies’ competitive advantage is directly
linked to the effectiveness of their knowledge management system. An effective knowledge management system will
encourage individuals within the same organization to create, share and protect knowledge. Mohamed and Anumba
(2006) indicated that there is no accepted model when it comes to guiding construction companies in effectively
implementing knowledge management. Chen and Mohamed (2005) stated that the number of empirical studies on
knowledge management in construction companies worldwide is very limited (Serra et al., 2012).
Categorizations of Knowledge Management
In the knowledge management literature, the “knowledge” and “information” are two different concepts. Al-
Hawamdeh (2002) argued that “information” must be transferred to “knowledge” in order to be shared and transferred.
The proposed classification of knowledge management is similar to the classification proposed by Maier (2002).
Knowledge management is classified into the following five categories:
1. Ontology of Knowledge and Knowledge Management
2. Knowledge Management Systems
3. Role of Information Technology
4. Managerial and Social Issues
5. Knowledge Measurement
Ontology of Knowledge and Knowledge Management
Moteleb and Woodman (2007) and Kidwell et al., (2000) argued that knowledge begins with “data” which
after being processed produces “information” which when mixed with practice becomes “knowledge” that is used in
decision making. Nonaka and Takeuchi (1995) identified knowledge management as “the process of applying a
systematic approach to the capture, structuring, management, and dissemination of knowledge throughout an
organization to work faster, reuse best practice, and reduce costly rework from project to project.” According to the
above definition, the linkage between knowledge management and the organizational strategy must ensure that
employees are familiar with the knowledge management objectives in order to improve corporate performance.
Polanyi (1967) identified two kinds of knowledge: explicit and tacit. Robinson et al., (2004) defines explicit
knowledge as “codifiable knowledge inherent in the so-called non-human storehouses including organizational
manuals on processes and procedures, databases, marketing channels and consumer relationship management systems.
Explicit knowledge is, therefore, easily shared with other people or parts of an organization. Examples of explicit
knowledge in construction are design codes of practice, manuals on construction standards and specifications.” Grant
(2007) defines tacit knowledge as “an individual’s judgment and experiences and cannot be articulated or stored.”
Knowledge Management Systems
Nidumolo et al., (2005) identified knowledge management systems as “focusing on grouping the explicit
knowledge that exists in organizations, the know-how that can be easily documented and shared.” Alavi and Leidner
(2001) indicated that there are three procedures to design a successful knowledge management systems: codification,
personalization, and people-finder.
i- The codification approach, also referred to as the “hard” approach, has as a starting point of bringing
together knowledge, store it in powerful databases, using people to document strategy and prepare it to
be retrieved by decision makers.
ii- The personalization approach, also referred to as the “soft” approach, tends to transfer knowledge by
using face-to-face interactions. The IT role is limited to connecting people to facilitate tacit knowledge
circulation. More investment is made in motivating people who are sharing their knowledge.
iii- The people-finder approach tends to locate the knowledge location within the organization and not the
knowledge itself. Lloria (2008) argued that the people-finder approach facilitates the finding of people
who have certain knowledge within the organization as well as to ensure their accessibility to be
consulted or to share their knowledge.
Ragab and Aricha (2013) concluded that the knowledge management systems can be grouped into four core
categories: “knowledge creation and acquisition, knowledge storage and retrieval, knowledge transfer and sharing,
and knowledge application”.
Role of Information Technology
The role of Information Technology (IT) in knowledge management is thoroughly discussed in the
knowledge management literature. Lindvall et al., (2003) indicated that there is no comprehensive software for the
knowledge management systems. Any software may be used in knowledge acquisition, application and protection.
Grace (2009) argued that the massive growth in the use of the internet will help in managing knowledge management
within organizations.
Unfortunately, some organizations started to adopt a full IT-based system for knowledge management based
on the unrealistic expectations that this will lead to successful knowledge management. These initiatives did not
succeed as it neglected that knowledge management depends on processes accomplished by the human brain with
integration of social, cultural and socio-cultural interconnectivity which is neglected by IT. IT-based systems have
limited capabilities compared to human brains in knowledge management as they are only focused on explicit
knowledge that can be codified and totally neglect the explicit knowledge sources. The second reason for failure of
total IT-based systems in knowledge management was the wrong assumption that people, by default, tend to share
their knowledge (Lindvall et al., 2003). Mohamed and Anumba (2006) concluded that “IT as a perfect solution will
fail. Equally, the knowledge management initiative that undervalues IT will follow suit.”
Managerial and Social Issues
Davenport and Prusak (2000) indicated that one of the recurring issues that affects the knowledge
management implementation was the resistance of the employees to share knowledge with their counterparts for fear
of potential job loss and reducing the probability of being promoted while increasing the probability of their
counterparts with whom they share their knowledge being promoted. Unfortunately, in today’s organizational systems,
knowledge sharing is not rewarded and knowledge hiding is not prohibited. Davenport and Prusak (2000) also stated
that “over and above, knowledge exchange may be negatively evaluated as time waste.” To solve this conflict, Human
Resource Management supports the knowledge management implementation by motivating employees who are
sharing their knowledge and engaging them in knowledge management system creation.
Al-Adaileh and Al-Atawi (2011) have argued that organizational culture is essential for the success of
knowledge management by supporting knowledge sharing. Kannabiran and Pandyan (2010) indicated that a
knowledge management governance system can be formed within the organizational structure and can be led by the
organization’s Chief Knowledge Officer. Chen and Huang (2007) stated that knowledge sharing increases within
decentralized, flat organizations with few hierarchal levels.
Shen and Liu (2003) and Cheng et al., (2000) identified the key factors that lead to knowledge management
success as follows: communicating knowledge management benefits to the employees, embedding the knowledge
management process in business strategy, developing a system to manage explicit and tacit knowledge, rewarding the
sharing of knowledge and at the same time creating a communication methodology within employees, using a suitable
IT-based system to support knowledge management and dedicating suitable staff to lead the knowledge management
initiatives.
Knowledge Measurement
Bontis (1999) indicated that knowledge measurement is problematic due to the vague nature of knowledge
in general and tacit knowledge in specific. Hong Pew et al., (2008) argued that any discussion concerning knowledge
measurement must be linked to intellectual capital that is defined as knowledge and experience that can be transformed
into assets or competitive advantage for the organization. Kannan and Aulbur (2004) indicated that the concept of
intellectual capital can be measured from two perspectives within the organization:
i- Internal perspective in which the organization is trying to locate the intellectual capital within its
employees in order to utilize it more effectively as well as convince top management of its benefits.
ii- External perspective shows that the organizational book value does not take into consideration the
organization’s intellectual capital assets and only evaluates its physical assets.
Carson et al., (2004) proposed four knowledge measurement methods: financial, intellectual capital, human
capital and performance.
Financial methods. There are four financial methods that are used to evaluate an organization’s intellectual
capital. Tobin’s Q method established by James Tobin (1969) which evaluates tangible assets not by their book value
but by their replacement cost (Luthy, 1998). Economic Value Added (EVA) developed by Stewart (1994) which
applies 164 adjustments to the organization’s balance sheet in order to get the intellectual capital value. Human
Resource Accounting (HRA) developed by Hermanson (1964) which uses the corporate financial data to evaluate
human resource assets. Value Creation Intellectual Coefficient (VAIC) was first introduced by Pulic (2000) and it
measures the efficiency of utilization of intellectual capital in order to generate profits for the organization (Hejase et
al., 2016).
Intellectual Capital methods. The Chartered Institute of Management Accountants (CIMA, 2003) indicated
that intellectual capital can be classifies into three groups: human, structural and relational (Hejase et al., 2016). Wang,
2011 and Carson et al., (2004) stated that Human Capital (HC) is a combination of skills and abilities that are a major
factor in the organization’s innovation ability such as the competitive advantage. This type of capital belongs to the
employees themselves and is lost upon the employees’ departure from the organization. Structural Capital (SC) is
represented by the organization’s physical resources such as the IT infrastructure used by the employees. Structural
capital is not lost upon the employees’ departure from the organization.
Human Capital methods. The Human Capital view is one of the most realistic and accurate structures of
intellectual capital. Norton (2001) proposed the Human Capital Readiness (HCR) model, which used a modified
balance scorecard with an emphasis on human capital (Ingham, 2007). Skyrme (2003) stated that the Human Capital
Readiness model evaluates five areas in the human capital: “strategic skills and competencies, leadership, culture and
strategic awareness, alignment of goals and incentives, and strategic integration and learning.” The HR consultants at
Watson Wyatt created the Human Capital Index in 2001. They highlighted the impact of HR dimensions on the
increase of human capital and it affects the financial value of the organization. The main advantage of this model is
its ability to measure the level of the individual’s human capital.
Performance methods. Carrillo et al., (2003) adopted the view of measuring knowledge by measuring its
impact after being implemented. Andreeva and Kianto, (2012) noted that knowledge management implementation is
linked to better performance in organizations. Khalifa et al., (2008) argued that the more the employees are using
knowledge management systems, the easier it will be for organizations to take corrective actions to fix the issues that
are affecting their performance.
Huang et al., (2007) proposed three knowledge management performance methods: quantitative, qualitative
and balanced scoreboard methods. Quantitative methods use stock price; return on investment and other financial data
from the organization’s financial statements. Feng et al., (2004) concluded that knowledge management
implementation leads stabilizing financial performance while Chang Lee et al., (2005) suggested a relationship
between company stock price and the successful implementation of knowledge management. Qualitative methods use
surveys and questionnaires to measure performance variation which could be subjective and dependent on individuals’
opinions (Kannan and Aulbur, 2004). Balanced Scorecard method, developed by Kaplan and Norton (1996), uses a
mixture of financial and non-financial measures. This method is a systematic procedure using indicators of
performance to evaluate four categories of performance: financial, internal business processes, consumer, and growth.
Business Performance
Carrillo et al., (2000) concluded an exhaustive survey of construction companies and this led to their
proposition that knowledge management has to be combined with the firm’s key performance indicators and other
performance measures such as balanced scorecard to fulfill the need to evaluate the likely benefits of applying
knowledge management. Robinson et al., (2004) introduced the main building blocks for Improving Management
Performance through Knowledge Transformation (IMPaKT). The framework is composed of three categories. The
first category defines the firm’s business goals and strategic objectives. The second and third categories assess the
firm’s knowledge management process and evaluate the implications and the gaps from the people and product
perspectives as well as its impact on business performance.

THEORETICAL FRAMEWORK AND RESEARCH DESIGN
The model that will be used in this study was previously used by Gold et al., (2001). Knowledge Infrastructure
Capability consists of three groups: technology, structure of the organization, and culture of the employees (Gold et
al., 2001). Knowledge Process Capability has four processes: knowledge acquisition, knowledge conversion,
knowledge application and knowledge protection (Gold et al., 2001). When it comes to measuring the organization’s
performance, Hansen and Oetinger (2001) advocated for using the financial perspective such as, reduction in project
cost, sales volume and net profit.
Knowledge Infrastructure Capability
As per Gold et al., (2001), knowledge infrastructure capability has three groups: technology which is the
infrastructure (i.e., internet and intranet) that facilitates and integrates knowledge and information and knowledge in
the organization. Structure of the organization (i.e., procedures, rules and document management) which can
facilitate and promote knowledge sharing. Culture of the employees (i.e., openness, trust and collaboration) which
can affect knowledge management by employee interaction, meetings and communication.
Technology
Becerra-Fernandez (2000) argued that knowledge-based software supports knowledge management. For
example, some of the knowledge-based software used in construction companies is for drawings (e.g., AutoCAD),
monitoring the project time and budgeting and resource management (e.g., Primavera). The use of internet and emails
is essential for day to day activities especially when the project location is geographically far from the company’s
main office.
Structure of the Organization
Mintzberg (1979) defined the organizational structure as “ways to divide work into tasks within the
organization with the presence of coordination between different departments”. Miles and Snow (1978) indicated that
the organizational structure filters the information received by the company and specifies what can be learned from
this information. Miller (1987) argued that the organizational structure affects information flow as well as employee
interaction. Lei and Slocum (1992) and Kanter (1994) proposed that the horizontal organizational form facilitates
knowledge transfer within the firm. In construction companies, the project structure represents the information flow
within the project. As per Tserng and Li (2004), there are six management stages in construction companies: problem
happening, create knowledge, share knowledge, record knowledge, knowledge storage and knowledge reuse
(Kanapeckiene et al., 2010).
Culture
Ajmal and Koskinen (2008) argued that the organizational culture is based on assumptions based on deep
beliefs of the organization’s participants as well as the demonstration of these beliefs by actions and reactions of the
participants. Ajmal and Koskinen, (2008) referred the failure in knowledge transfer to the cultural factors rather than
the technological reasons. DeTiene and Jackson (2001) argued that the organizational culture could be a major cause
of failure for the knowledge management process. Bedford (2013) stated that the role of individuals could potentially

come into conflict with the company culture. In order to avoid this conflict, Kayworth and Leidner (2003) proposed
that sharing knowledge through interpersonal relationships must be encouraged by the organizational culture to ensure
successful knowledge creation, storage, transfer and application. Building a supportive organizational culture is vital
for a successful knowledge management system.
Knowledge Process Capability
Kayworth and Leidner (2003) suggested that Knowledge Process Capability has four categories. Knowledge
acquisition which includes creating and collaborating knowledge. Knowledge conversion which includes organizing,
storing, integrating and combining knowledge. Knowledge application which includes retrieving and sharing
knowledge. Knowledge protection which includes securing knowledge within the organization.
Knowledge Acquisition
Knowledge acquisition can be considered to have two levels, organizational and individual. Liao et al., (2010)
defined knowledge acquisition at the organizational level as “accepting knowledge from outside the organizational
environment, transforming it and using it”. Gray and Meister (2004) defined knowledge acquisition at the individual
level as the changing of the mental model of the individual by changing their beliefs to the new acquired knowledge
with the intention of using this knowledge in order to be effective (Pemsel and Müller, 2012).
Knowledge Conversion
The knowledge conversion is a continuous transformation from tacit to explicit knowledge and vice versa
(Nonaka, 1994). According to Nonaka (1994) and Nonaka and Takeuchi (1995), knowledge conversion has four
stages: socialization, externalization, combination and internalization. Socialization can be viewed as the conversion
of tacit knowledge into other forms of tacit knowledge using social interactions. Externalization can be viewed as the
conversion of tacit knowledge to explicit knowledge. Combination can be viewed as the conversion of explicit
knowledge into other forms of explicit knowledge using sorting and modeling. Internalization can be viewed as the
conversion of explicit knowledge to tacit knowledge within the individual by learning and application.
Knowledge Application
According to Newell et al., (2003) knowledge application is used to enhance the business strategy, solve the
problems that arise due to new projects, reduce the cost and the execution time of similar projects by using previous
projects’ reports, lessons learned and closed out reports. Knowledge transfer is the movement of knowledge to where
it can be easily accessed and reused.
Knowledge Protection
Khamseh and Jolly (2008) defined knowledge protection as blocking the knowledge sharing in the knowledge
management system. Jennex and Durcikova (2013) defined knowledge protection as preventing the leakage of
knowledge to unauthorized external users as well as preventing tacit knowledge loss due to employee turnover. Dhillon
and Torkzadeh (2006) argued that organizations rely on information technology systems to secure their knowledge
against commercial unauthorized use. Ahmad et al., (2014) stated that poor knowledge protection could cause financial
losses for the organization as well as productivity losses.

Organization Performance
The traditional method to measure company performance is from financial perspective such as reduction in
project cost, increase in sales volume and increase in net profits. Chakravarthy (1986) found that using financial
methods to measure the business performance could give misleading results about the continuity of the company
competitive advantage and innovation. Fliaster (2004) suggested using other intangible methods such as, consumer
satisfaction perspective, learning and growth perspective, supplier perspective and internal processes perspective.
Tseng and Fang, 2015 and Maltz et al., (2003) proposed using financial and non-financial measures such as the
following five indexes financial, consumer, process, people development and future.
Hypotheses
Hypothesis 1: The knowledge infrastructure capability (KIC) has a positive effect on business performance (BP).
Hypothesis 2: The knowledge process capability (KPC) has a positive effect on business performance (BP).
DATA COLLECTION
Following the data collection method used in Perng and Chang (2004), the authors contacted the Egyptian
Federation for Construction and Building Contractors, the following data was received as of August 2015: total
number of construction companies in Egypt was 10,622 companies. Total number of construction companies classified
as First Class (companies allowed to take unlimited integrated projects) was 380 companies. Number of construction
companies classified as first class in Cairo, Giza and Alexandria governorates was 299 companies. The authors choose
to focus on first class construction companies in Egypt as they are all working within the same culture, same project
conditions and same Human Resources mindset.
The questionnaires were distributed to senior managers with 15 years or more of experience in construction
who have been working for the past 5 years in the same company. The senior managers included project managers,
construction managers, general managers, HR managers and contract managers. The questionnaires were randomly
distributed to senior managers in 146 of the 299 first class construction companies in Cairo, Giza and Alexandria
governorates. The final sample size was 75 first class construction companies which is about a 51% response rate.
The proposed questionnaire was modified from the one previously used by Gold et al., (2001) and Smith
(2006). The proposed questionnaire includes eight sections. The first three sections measure the Knowledge
Infrastructure Capability including technology, company structure and culture (Ghosh and Scott, 2009). The following
four sections measure Knowledge Process Capability including knowledge acquisition, knowledge conversion,
knowledge application and knowledge protection (Emadzade et al., 2012). The last section measures the company
performance from the following perspectives: financial, consumer, learning and growth, supplier and internal
processes. Responses were presented using a 5-scale Likert scale with a range from 1 (strongly disagree) to 5 (strongly
agree). At the beginning of the questionnaire the authors included four questions regarding the organization’s legal
status, sector, number of employees in 2015 and the availability of a training and development plans. The questionnaire
is available in Appendix A.
METHODOLOGY AND RESULTS
Descriptive Statistics
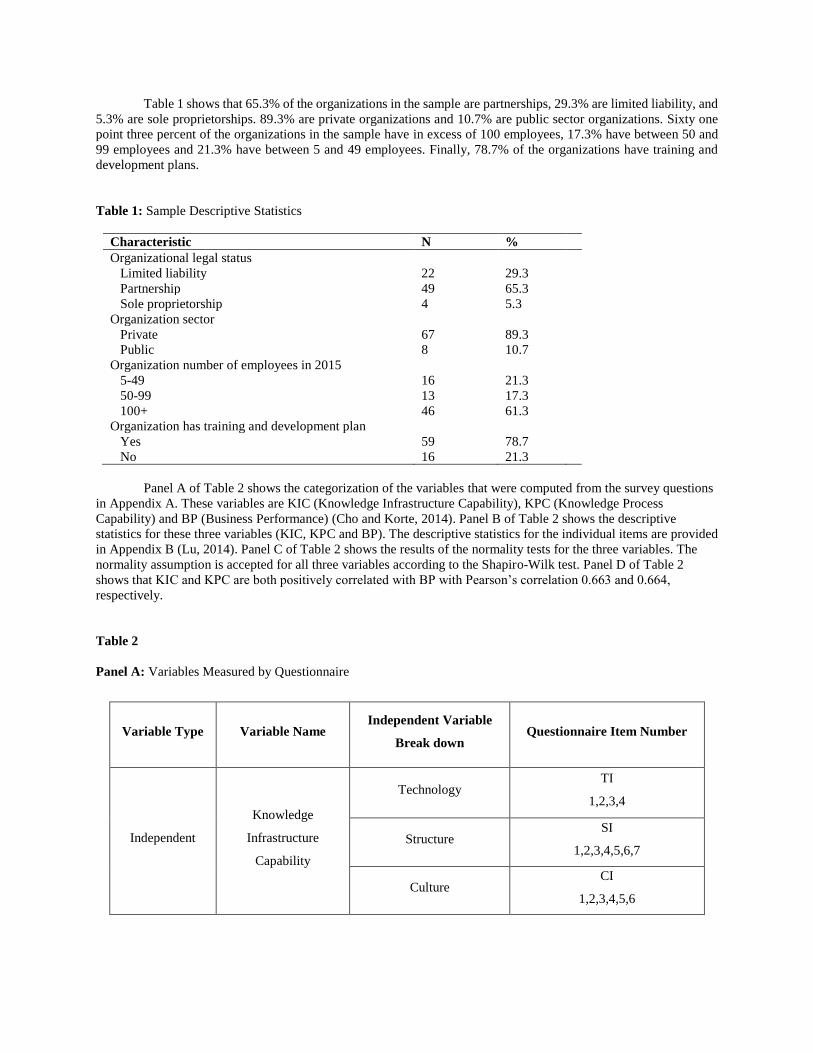
Table 1 shows that 65.3% of the organizations in the sample are partnerships, 29.3% are limited liability, and
5.3% are sole proprietorships. 89.3% are private organizations and 10.7% are public sector organizations. Sixty one
point three percent of the organizations in the sample have in excess of 100 employees, 17.3% have between 50 and
99 employees and 21.3% have between 5 and 49 employees. Finally, 78.7% of the organizations have training and
development plans.
Table 1: Sample Descriptive Statistics
Characteristic N %
Organizational legal status
Limited liability 22 29.3
Partnership 49 65.3
Sole proprietorship 4 5.3
Organization sector
Private 67 89.3
Public 8 10.7
Organization number of employees in 2015
5-49 16 21.3
50-99 13 17.3
100+ 46 61.3
Organization has training and development plan
Yes 59 78.7
No 16 21.3
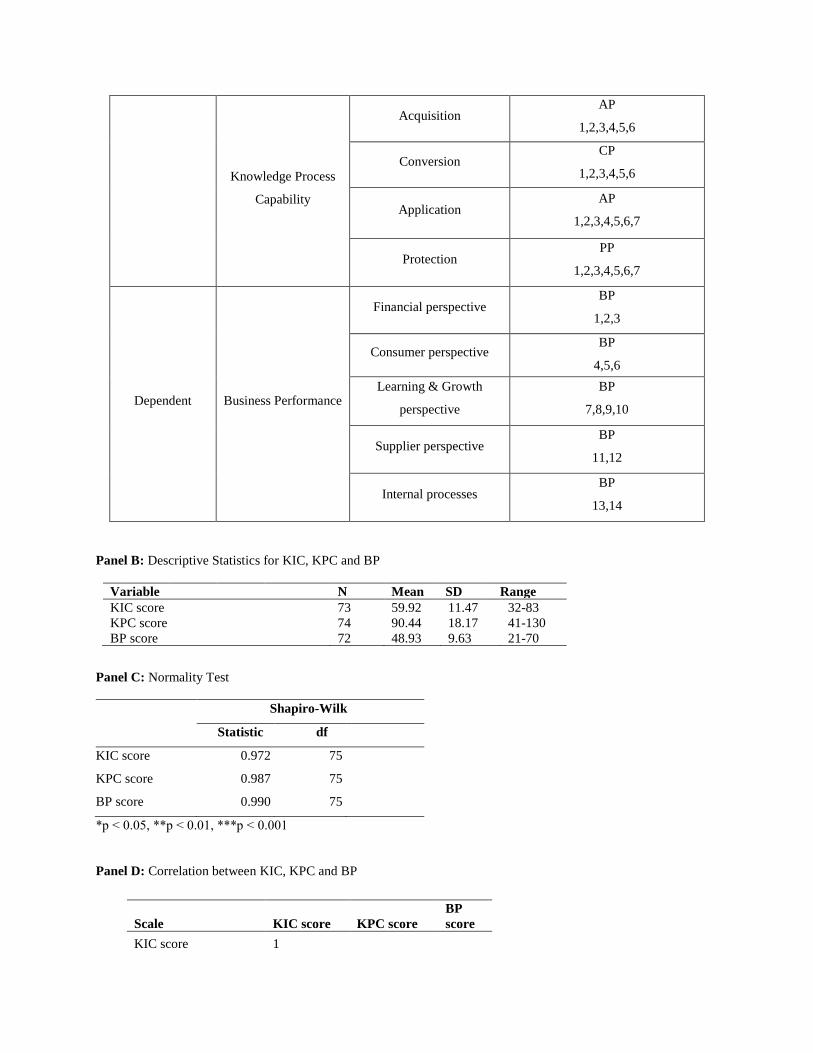
Panel A of Table 2 shows the categorization of the variables that were computed from the survey questions
in Appendix A. These variables are KIC (Knowledge Infrastructure Capability), KPC (Knowledge Process
Capability) and BP (Business Performance) (Cho and Korte, 2014). Panel B of Table 2 shows the descriptive
statistics for these three variables (KIC, KPC and BP). The descriptive statistics for the individual items are provided
in Appendix B (Lu, 2014). Panel C of Table 2 shows the results of the normality tests for the three variables. The
normality assumption is accepted for all three variables according to the Shapiro-Wilk test. Panel D of Table 2
shows that KIC and KPC are both positively correlated with BP with Pearson’s correlation 0.663 and 0.664,
respectively.
Table 2
Panel A: Variables Measured by Questionnaire
Variable Type Variable Name Independent Variable
Break down Questionnaire Item Number
Independent
Knowledge
Infrastructure
Capability
Technology TI
1,2,3,4
Structure SI
1,2,3,4,5,6,7
Culture CI
1,2,3,4,5,6
Knowledge Process
Capability
Acquisition AP
1,2,3,4,5,6
Conversion CP
1,2,3,4,5,6
Application AP
1,2,3,4,5,6,7
Protection PP
1,2,3,4,5,6,7
Dependent Business Performance
Financial perspective BP
1,2,3
Consumer perspective BP
4,5,6
Learning & Growth
perspective
BP
7,8,9,10
Supplier perspective BP
11,12
Internal processes BP
13,14
Panel B: Descriptive Statistics for KIC, KPC and BP
Variable N Mean SD Range
KIC score 73 59.92 11.47 32-83
KPC score 74 90.44 18.17 41-130
BP score 72 48.93 9.63 21-70
Panel C: Normality Test
Shapiro-Wilk
Statistic df
KIC score 0.972 75
KPC score 0.987 75
BP score 0.990 75
*p ˂ 0.05, **p ˂ 0.01, ***p ˂ 0.001
Panel D: Correlation between KIC, KPC and BP
Scale KIC score KPC score
BP
score
KIC score 1
Bivariate Analysis
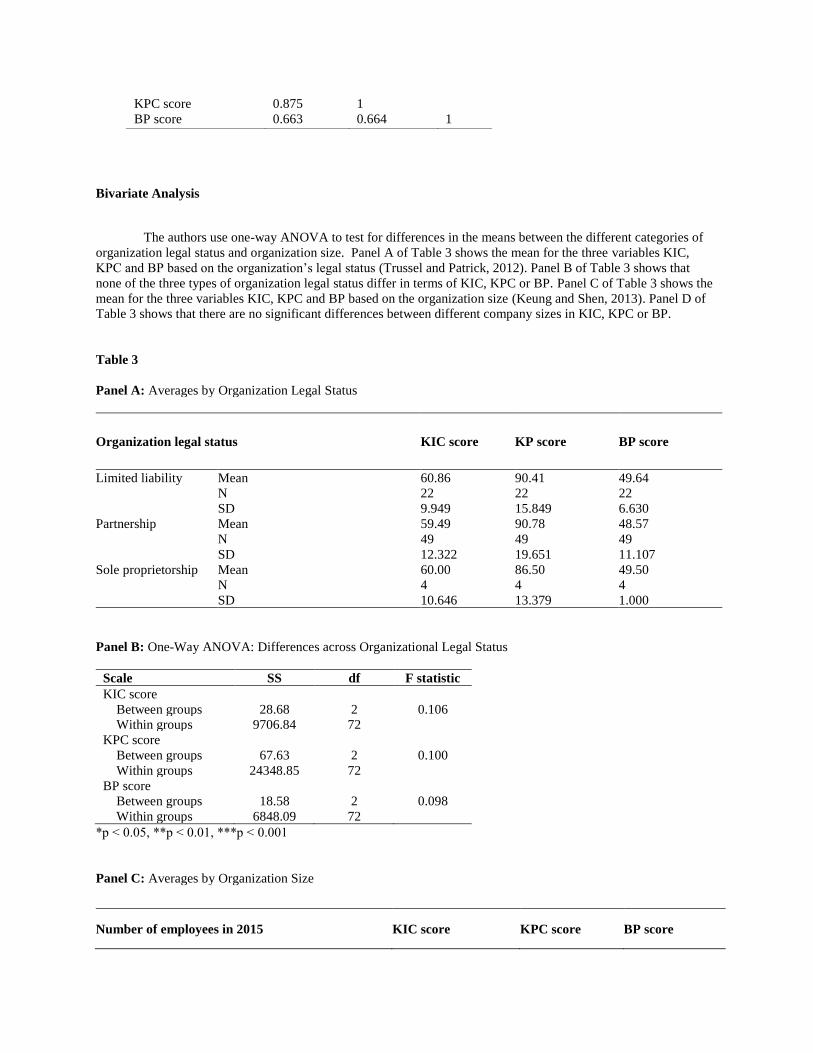
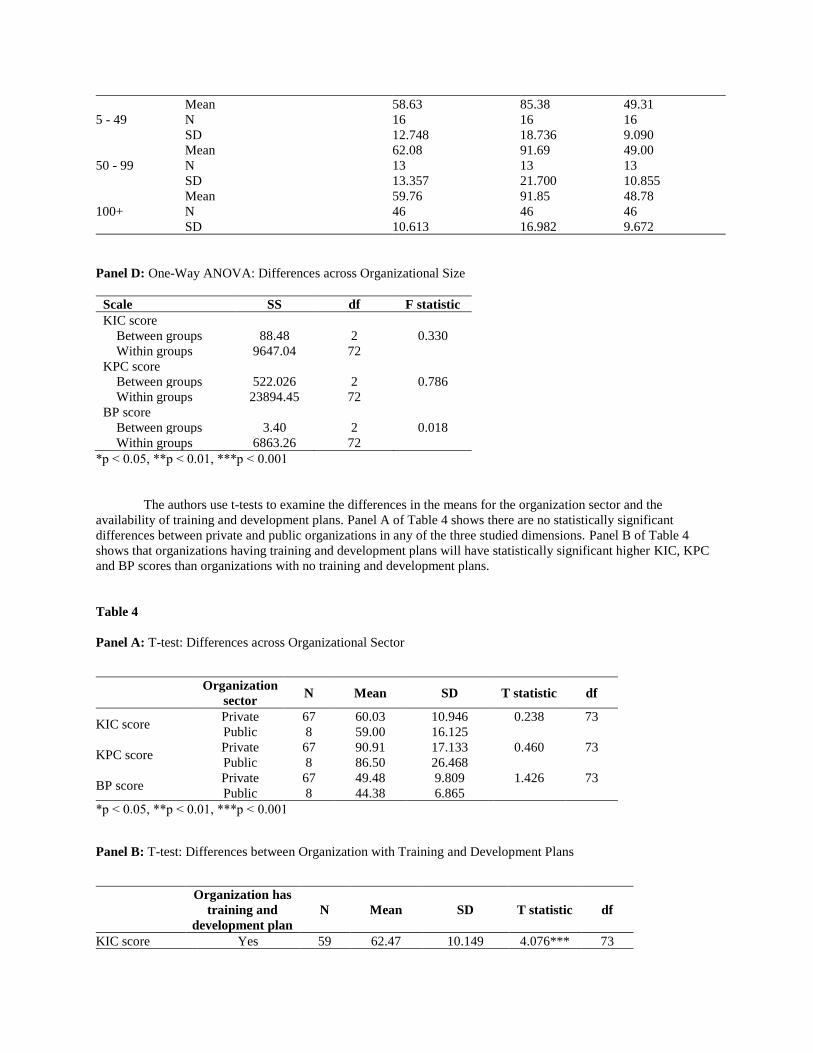
The authors use one-way ANOVA to test for differences in the means between the different categories of
organization legal status and organization size. Panel A of Table 3 shows the mean for the three variables KIC,
KPC and BP based on the organization’s legal status (Trussel and Patrick, 2012). Panel B of Table 3 shows that
none of the three types of organization legal status differ in terms of KIC, KPC or BP. Panel C of Table 3 shows the
mean for the three variables KIC, KPC and BP based on the organization size (Keung and Shen, 2013). Panel D of
Table 3 shows that there are no significant differences between different company sizes in KIC, KPC or BP.
Table 3
Panel A: Averages by Organization Legal Status
Organization legal status KIC score KP score BP score
Limited liability Mean 60.86 90.41 49.64
N 22 22 22
SD 9.949 15.849 6.630
Partnership Mean 59.49 90.78 48.57
N 49 49 49
SD 12.322 19.651 11.107
Sole proprietorship Mean 60.00 86.50 49.50
N 4 4 4
SD 10.646 13.379 1.000
Panel B: One-Way ANOVA: Differences across Organizational Legal Status
Scale SS df F statistic
KIC score
Between groups 28.68 2 0.106
Within groups 9706.84 72
KPC score
Between groups 67.63 2 0.100
Within groups 24348.85 72
BP score
Between groups 18.58 2 0.098
Within groups 6848.09 72
*p ˂ 0.05, **p ˂ 0.01, ***p ˂ 0.001
Panel C: Averages by Organization Size
Number of employees in 2015 KIC score KPC score BP score
KPC score 0.875 1
BP score 0.663 0.664 1
5 - 49
Mean 58.63 85.38 49.31
N 16 16 16
SD 12.748 18.736 9.090
50 - 99
Mean 62.08 91.69 49.00
N 13 13 13
SD 13.357 21.700 10.855
100+
Mean 59.76 91.85 48.78
N 46 46 46
SD 10.613 16.982 9.672
Panel D: One-Way ANOVA: Differences across Organizational Size
Scale SS df F statistic
KIC score
Between groups 88.48 2 0.330
Within groups 9647.04 72
KPC score
Between groups 522.026 2 0.786
Within groups 23894.45 72
BP score
Between groups 3.40 2 0.018
Within groups 6863.26 72
*p ˂ 0.05, **p ˂ 0.01, ***p ˂ 0.001
The authors use t-tests to examine the differences in the means for the organization sector and the
availability of training and development plans. Panel A of Table 4 shows there are no statistically significant
differences between private and public organizations in any of the three studied dimensions. Panel B of Table 4
shows that organizations having training and development plans will have statistically significant higher KIC, KPC
and BP scores than organizations with no training and development plans.
Table 4
Panel A: T-test: Differences across Organizational Sector
Organization
sector N Mean SD T statistic df
KIC score Private 67 60.03 10.946 0.238 73
Public 8 59.00 16.125
KPC score Private 67 90.91 17.133 0.460 73
Public 8 86.50 26.468
BP score Private 67 49.48 9.809 1.426 73
Public 8 44.38 6.865
*p ˂ 0.05, **p ˂ 0.01, ***p ˂ 0.001
Panel B: T-test: Differences between Organization with Training and Development Plans
Organization has
training and
development plan
N Mean SD T statistic df
KIC score Yes 59 62.47 10.149 4.076*** 73

No 16 50.50 11.419
KPC score Yes 59 92.85 16.623 2.265* 73
No 16 81.56 21.270
BP score Yes 59 50.69 8.889 3.229** 73
No 16 42.44 9.750
*p ˂ 0.05, **p ˂ 0.01, ***p ˂ 0.001
Regression Analysis
The authors conducted Ordinary Least Square (OLS) Regressions with BP score as the dependent variable,
KIC score as the independent variable in Table 5 (McCall et al., 2008) and KPC score as the independent variable in
Table 6 (Good et al., 1997). “Organization has training and development plan” was used as a control variable in
Tables 5 and 6. In Table 5 the estimated coefficient of the KIC score is positive and significant as predicted in
hypothesis 1 which indicated that there is a positive association between KIC and the company performance.
Table 5: OLS Regression Estimates for Hypothesis 1: The knowledge infrastructure capability (KIC) has a positive
effect on business performance (BP) (t statistics in brackets)
BP score
Constant 15.833
(3.513)***
KIC score 0.527
(6.452)***
Organization has training and
development plan
1.949
(0.858)
Adjusted R2
VIF
White-Koenker
43%
1.228
12.698
*p ˂ 0.05, **p ˂ 0.01, ***p ˂ 0.001
In Table 6 the estimated coefficient of the KPC score is positive and significant as predicted in hypothesis 2
which indicated that there is a positive association between KPC and the company performance. The control
variable “Organization has training and development plan” is also positive and significant indicating that companies
with training and development plans have higher performance compared to companies with no such plans. The
variance inflation factors (VIF) in Tables 5 and 6 are less than 10, as result there are no signs of multicollinearity.
The White-Koenker statistics given in the last line of the Tables 5 and 6 show that all of our regressions are free of
heteroscedasticity (Baum et al., 2003).
Table 6: OLS Regression Estimates for Hypothesis 2: The knowledge process capability (KPC) has a positive effect
on business performance (BP) (t statistics in brackets)
BP score
Constant 15.901
(4.204)***
KPC score 0.325
(6.956)***
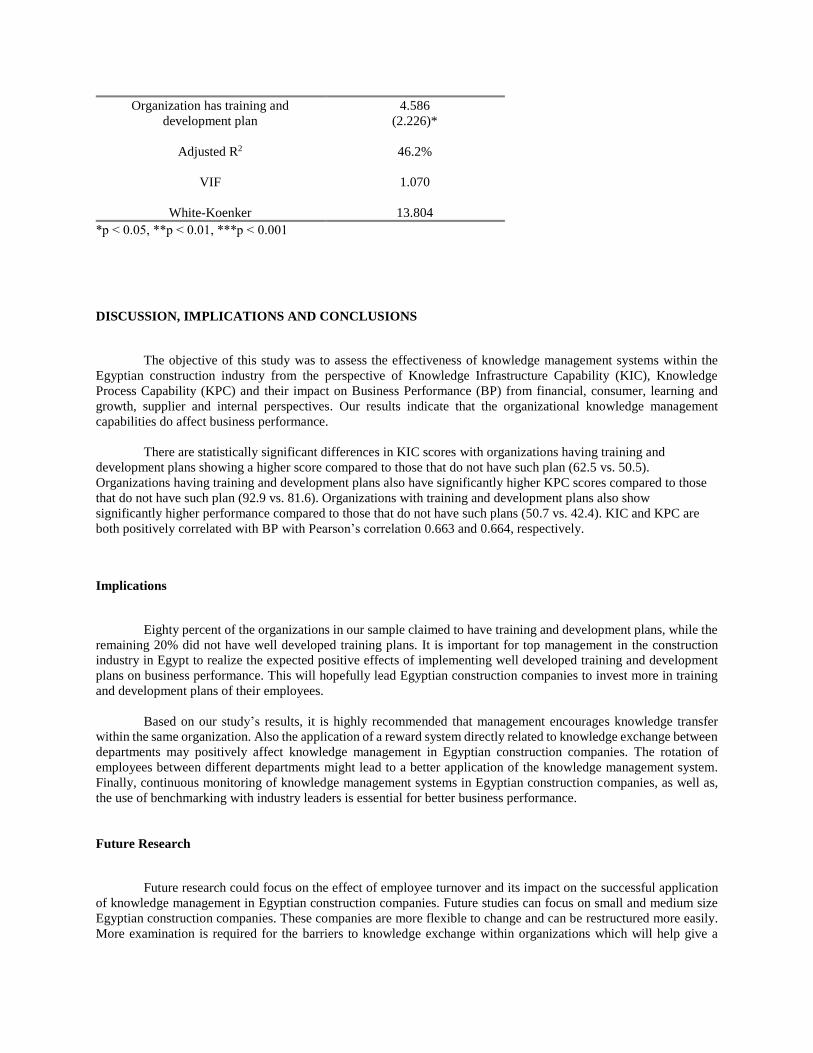
Organization has training and
development plan
4.586
(2.226)*
Adjusted R2
VIF
White-Koenker
46.2%
1.070
13.804
*p ˂ 0.05, **p ˂ 0.01, ***p ˂ 0.001
DISCUSSION, IMPLICATIONS AND CONCLUSIONS
The objective of this study was to assess the effectiveness of knowledge management systems within the
Egyptian construction industry from the perspective of Knowledge Infrastructure Capability (KIC), Knowledge
Process Capability (KPC) and their impact on Business Performance (BP) from financial, consumer, learning and
growth, supplier and internal perspectives. Our results indicate that the organizational knowledge management
capabilities do affect business performance.
There are statistically significant differences in KIC scores with organizations having training and
development plans showing a higher score compared to those that do not have such plan (62.5 vs. 50.5).
Organizations having training and development plans also have significantly higher KPC scores compared to those
that do not have such plan (92.9 vs. 81.6). Organizations with training and development plans also show
significantly higher performance compared to those that do not have such plans (50.7 vs. 42.4). KIC and KPC are
both positively correlated with BP with Pearson’s correlation 0.663 and 0.664, respectively.
Implications
Eighty percent of the organizations in our sample claimed to have training and development plans, while the
remaining 20% did not have well developed training plans. It is important for top management in the construction
industry in Egypt to realize the expected positive effects of implementing well developed training and development
plans on business performance. This will hopefully lead Egyptian construction companies to invest more in training
and development plans of their employees.
Based on our study’s results, it is highly recommended that management encourages knowledge transfer
within the same organization. Also the application of a reward system directly related to knowledge exchange between
departments may positively affect knowledge management in Egyptian construction companies. The rotation of
employees between different departments might lead to a better application of the knowledge management system.
Finally, continuous monitoring of knowledge management systems in Egyptian construction companies, as well as,
the use of benchmarking with industry leaders is essential for better business performance.
Future Research
Future research could focus on the effect of employee turnover and its impact on the successful application
of knowledge management in Egyptian construction companies. Future studies can focus on small and medium size
Egyptian construction companies. These companies are more flexible to change and can be restructured more easily.
More examination is required for the barriers to knowledge exchange within organizations which will help give a
realistic corrective action plan for companies planning to maximize their performance by applying knowledge
management system.
Limitations
One of the limitations for the study is that the questionnaire respondents may be biased but there are no
means for an ideal method for data collection. Another limitation is that the survey participants are answering the
questionnaire from their perception, as it was not possible to check the documents of the surveyed companies.
Another limitation of the study was the translation of the questionnaires from English to Arabic then back to
English. The authors tried to overcome this limitation by using the Werner and Campbell (1970), decentring method.
The authors attempt to reduce the selection bias issue (Heckman, 1979) by randomly selecting 146 of the
299 first class construction companies in Cairo, Giza & Alexandria governorates. The sample used construction
companies classified as first class according to the Egyptian Federation for Construction & Building Contractors on
August 2015 in Cairo, Giza and Alexandria. To include construction companies in other governorates and other
classes will be a time consuming and costly process. The problem is that the results of the study cannot be
generalized to all construction companies in Egypt.

REFERENCES
Ahmad, A., Bosua, R., & Scheepers, R. (2014). Protecting organizational competitive advantage: a knowledge
leakage perspective. Computers & Security, 42, 27-39.
Ajmal, M., & Koskinen, K. (2008). Knowledge transfer in project-based organizations: an organizational culture
perspective. Project Management Journal, 39(1), 7-15.
Al-Adaileh, R., & Al-Atawi, M. (2011). Organizational culture impact on knowledge exchange: Saudi telecom
context. Journal of Knowledge Management, 15(2), 212-230.
Alavi, M., & Leidner, D. (2001). Review: knowledge management and knowledge management systems: conceptual
foundations and research issues. MIS Quarterly, 25(1), 107-136.
Al-Hawamdeh, S. (2002). Knowledge management: re-thinking information management and facing the challenge
of managing tacit knowledge. Information Research, 8(1), paper no. 143. Retrieved from:
http://InformationR.net/ir/8-1/paper143.html
Andreeva, T., & Kianto, A. (2012). Does knowledge management really matter? Linking knowledge management
practices, competitiveness and economic performance. Journal of Knowledge Management, 16(4), 617-
636.
Baum, C., Schaffer, M. & Stillman, S. (2003). Instrumental variables and GMM: estimation and testing. Stata
Journal, 3, 1-31.
Becerra-Fernandez, I. (2000). The role of artificial intelligence technologies in the implementation of people-finder
knowledge management systems. Knowledge Based Systems, 13(5), 315-20.
Bedford, D. (2013). A case study in knowledge management education – historical challenges and future
opportunities. The Electronic Journal of Knowledge Management, 11(3), 199-213.
Bontis, N. (1999). Managing organizational knowledge by diagnosing intellectual capital: framing and advancing the
state of the field. International Journal of Technology Management, 18(5-8), 433-462.
Carrillo, P., Robinson, H., Al-Ghassani, A., & Anumba, C. (2004). Knowledge management in UK construction:
strategies, resources and barriers. Project Management Journal, 35(1), 46-56.
Carson, E., Ranzijn, R., Winefield, A., & Marsden, H. (2004). Intellectual capital: mapping employee and work
group attributes. Journal of Intellectual Capital, 5(3), 443-463.
Chang Lee, K., Lee, S., & Kang, I. (2005). KMPI: measuring knowledge management performance. Information &
Management, 42(3), 469-482.
Chakravarthy, B. (1986). Measuring strategic performance. Strategic Management Journal, 7(5), 437-458.
Chen, C., & Huang, J. (2007). How organizational climate and structure affect knowledge management – the social
interaction perspective. International Journal of Information Management, 27(2), 104-118.
Chen, L., & Mohamed, S. (2005). Conceptual model linking knowledge management with organizational
performance. In Ribeiro, F., Love, P., Davidson, C., Egbu, C., & Dimitrijevic, B. (Eds), In the Proceedings
of the CIB W102-2005 Meeting and International Conference: Information and Knowledge Management in
a Global Economy, Lisbon, Portugal, 415-423.
Cheng, E., Li, H., & Love, P. (2000). Establishment of critical success factors for construction partnering. Journal of
Management in Engineering, 16(2), 84-92.

Cho, T., & Korte, R. (2014). Managing knowledge performance: testing the components of a knowledge
management system on organizational performance. Asia Pacific Education Review, 15(2), 313-327.
CIMA (Chartered Institute of Management Accountants) (2003). Understanding corporate value: managing and
reporting intellectual capital. Retrieved from
http://www.cimaglobal.com/Documents/ImportedDocuments/tech_techrep_understandi
ng_corporate_value_2003.pdf
Davenport, T., & Prusak, L. (2000). Working knowledge: How organizations manage what they know. Boston, MA:
Harvard Business School Press.
DeTiene, K., & Jackson, L. (2001). Knowledge management: understanding theory and developing strategy.
Competitiveness Review, 11(1), 1-11.
Dhillon, G., & Torkzadeh, G. (2006). Value-focused assessment of information system security in organizations.
Information Systems Journal, 16(3), 293-314.
Emadzade, M., Mashayekhi, B., & Abdar, E. (2012). Knowledge management capabilities and organizational
performance. Interdisciplinary Journal of Contemporary Research in Business, 3(11), 781.
Feng, K., Chen, E., & Liou, W. (2004). Implementation of knowledge management systems and firm performance:
an empirical investigation. Journal of Computer Information Systems, 45(2), 92-104.
Fliaster, A. (2004). Cross-hierarchical interconnectivity: forms, mechanisms and transformation of leadership
culture. Knowledge Management Research & Practice, 2(1), 48-57.
Ghosh, B., & Scott, J. (2009). Managing clinical knowledge among hospital nurses. International Journal of
Technology Management, 47(1), 57-74.
Gold, A., Malhotra, A., & Segars, A. (2001). Knowledge management: an organizational capabilities perspective.
Journal of Management Information Systems, 18(1), 185–214.
Good, J., Aggleton, J., Kentridge, R., Barker, J., and Neave, N., (1997). Measuring musical aptitude in children: on
the role of age, handedness, scholastic achievement, and socioeconomic status. Psychology of Music, 25(1),
57-69.
Grace, T. (2009). Wikis as a knowledge management tool. Journal of Knowledge Management, 13(4), 64-74.
Grant, K. (2007), Tacit knowledge revisited - we can still learn from Polanyi. The Electronic Journal of Knowledge
Management, 5(2), 173-180.
Gray, P., & Meister, D. (2004). Knowledge sourcing effectiveness. Management Science, 50(6), 821-834.
Hansen, M., & Oetinger, B. (2001). Introducing T-shaped managers: knowledge management’s next generation.
Harvard Business Review, March, 106-116.
Heckman, J. (1979). Sample selection bias as a specification error. Econometrica, 47(1), 153-161.
Hejase, H., Hejase, A., Tabsh, H., and Chalak, H. (2016). Intellectual capital: an exploratory study from Lebanon.
Open Journal of Business and Management, 4(4), 571-605.
Hermanson, R. (1964). Accounting for human assets. East Lansing: MI: Michigan State University Press.
Hong Pew, T., David, P., & Phil, H. (2008). The evolving research on intellectual capital. Journal of Intellectual
Capital, 9(4), 585-608.

Huang, M., Chen, M., & Yieh, K. (2007). Comparing with your main competitor: the single most important task of
knowledge management performance measurement. Journal of Information Science, 33(4), 416-434.
Ingham, J. (2007). Managing and measuring human capital. In Ingham, J. (Eds), In Strategic Human Capital
Management: Creating Value through People, Taylor and Francis, 167-204.
Jennex, M., & Durcikova, A. (2013). Assessing knowledge loss risk. 2013 46th Hawaii International Conference on
System Sciences (HICSS), Wailea, Maui, HI, USA, 3478-3487. Retrieved from:
http://ieeexplore.ieee.org/xpl/articleDetails.jsp?arnumber=6480264&sortType%3Dasc_
_Sequence%26filter%3DAND%28p_IS_Number%3A6479821%29%26pageNumber%D18
Kannabiran, G., & Pandyan, C. (2010). Enabling role of governance in strategizing and implementing KM. Journal
of Knowledge Management, 14(3), 335-347.
Kannan, G., & Aulbur, W. (2004). Intellectual capital: measurement effectiveness. Journal of Intellectual Capital,
17(6), 389-413.
Kanapeckiene, L., Kaklauskas, A., Zavadskas, E., and Seniut, M. (2010). Integrated knowledge management model
and system for construction projects. Engineering Applications of Artificial Intelligence, 23(7), 1200-1215.
Kanter, R. (1994). Collaborative advantage: the art of alliances. Harvard Business Review, 72(4), 96-108.
Kaplan, R., & Norton, D. (1996). The balanced scoreboard: translating strategy into action. Harvard Business
Press.
Kayworth, T., & Leidner, D. (2003).Organizational culture as a knowledge resource. In Holsapple, C. (Eds.),
Handbook on knowledge management 1: knowledge matters, Springer-Verlag, Heidelberg, 235-252.
Keung, C., & Shen, L. (2013). Measuring the networking performance for contractors in practicing construction
management. Journal of Management in Engineering, 29(4), 400-406.
Khalifa, M., Yu, A., & Shen, K. (2008). Knowledge management systems success: a contingency perspective.
Journal of Knowledge Management, 12(1), 119-132.
Khamseh, H., & Jolly, D. (2008). Knowledge transfer in alliances: determinant factors. Journal of Knowledge
Management, 12(1), 37-50.
Kidwell, J., Vander Linde, K., & Johnson, S. (2000). Applying corporate knowledge management practices in
higher education: colleges and universities have significant opportunities to apply knowledge management
practices to support every part of their mission. Educause Quarterly, 23(4), 28-33.
Liao C., Wang H., Chuang S., Shih M., & Liu C. (2010). Enhancing knowledge management for R&D innovation
and firm performance: an integrative view. African Journal of Business Management, 4(14), 3026-3038.
Lindvall, M., Rus, I., & Sinha, S. (2003). Software systems support for knowledge management. Journal of
Knowledge Management, 7(5), 137-150.
Lloria, M. (2008). A review of the main approaches to knowledge management. Knowledge Management Research
& Practice, 6(1), 77-89.
Lu, H. (2014). Does disclosure of non-financial statement information reduce firms' propensity to under-invest?
Quarterly Journal of Finance and Accounting, 51(3/4), 1-44.
Luthy, D. (1998). Intellectual capital and its measurement. Proceedings of the Asian Pacific Interdisciplinary
Research in Accounting Conference (APIRA), Osaka.
Maier, R., & Remus, U. (2002). Defining process-oriented knowledge management strategies. Knowledge and
Process Management – The Journal of Corporate Transformation, 9(2), 103-118
Maltz, A., Shenhar, A., & Reilly, R. (2003). Beyond the balanced scorecard: refining the search for organizational
success measures. Long Range Planning, 36(2), 187-204.
McCall, H., Arnold, V., & Sutton, S. (2008). Use of knowledge management systems and the impact on the
acquisition of explicit knowledge. Journal of Information Systems, 22(2), 77-101.
Miles, R., & Snow, C. (1978). Organizational strategy, structure and process. Academy of Management Review, 3(3),
546-562.
Miller, D. (1987). Strategy making and structure: analysis and implications for performance. Academy of
Management Journal, 30(1), 7-32.
Mintzberg, H. (1979). The structuring of organizations. Englewood Cliffs, NJ: Prentice-Hall.
Mohamed, S., & Anumba, C. (2006). Potential for improving site management practices through knowledge
management. Construction Innovation, 6(4), 232-249.
Moteleb, A., & Woodman, M. (2007). Notions of knowledge management systems: a gap Analysis. The Electronic
Journal of Knowledge Management, 5(1), 55-62.
Newell, S., Huang, J., Galliers, R., & Pan, S. (2003). Implementing enterprise resource planning and knowledge
management systems in tandem: fostering efficiency and innovation complementarity. Information and
Organization, 13(1), 25-52.
Nidumolo S., Subramani M., & Aldrich A. (2005). Situated learning and situated knowledge web: exploring the
ground beneath knowledge management. Journal of Management Information System, 18(1), 115-150.
Nonaka, I. (1994). A dynamic theory of organizational knowledge creation. Organization Science, 5(1), 14-37.
Nonaka, I., & Takeuchi, H. (1995). The knowledge-creating company. How Japanese companies create the
dynamics of innovation. Oxford: Oxford University Press.
Norton, D. (2001). Managing the development of human capital. Balanced Scorecard Report, September-October.
Pemsel, S., & Müller, R. (2012). The governance of knowledge in project-based organizations. International
Journal of Project Management, 30(8), 865–876.
Perng, Y., & Chang, C. (2004). How does government procurement law affect bidding price competition in
Taiwan? Building Research & Information, 32(6), 497-509.
Polanyi, M. (1967). The Tacit Dimension. Chicago, IL: The University of Chicago Press.
Pulic, A. (2000). VAIC - an accounting tool for IC management. International Journal of Technology Management,
20(5-8), 702-714.
Ragab, M., & Arisha, A. (2013), Knowledge management and measurement: a critical review. Journal of
Knowledge Management, 17(6), 873-901.
Robinson, H., Carrillo, P., Anumba, C., & Al-Ghassani, A. (2004). Developing a business case for knowledge
management: the IMPaKT approach. Construction Management and Economics, 22(7), 733-743.
Serra, P., Ribeiro, F., & Grilo, A. (2012). Knowledge management system in a construction company: a case study.
eWork and eBusiness in Architecture Engineering and Construction ECPPM 2012.

Scarborough, H., Swan, J., & Preston, J. (1999). Issues in People Management: Knowledge Management: A
Literature Review. Institute of Personnel and Development, The Cromwell Press, Wiltshire.
Shen, Q., & Liu, G. (2003). Critical success factors for value management studies in construction. Journal of
Construction Engineering and Management, 129(5), 485-491.
Skyrme, D. (2003). Measuring knowledge and intellectual capital: models and methods to maximize the value of
knowledge, intangibles and intellectual assets. Business Intelligence.
Smith, T. (2006). Knowledge management and its capabilities linked to the business strategy for organizational
effectiveness. Published doctoral thesis, Nova Southeastern University, USA.
Tobin, J. (1969). A general equilibrium approach to monetary theory. Journal of Money, Credit and Banking, 1(1),
15-29.
Trussel, J., & Patrick, P. (2012). Predicting significant reductions in instructional expenditures by school districts.
Journal of Education Finance, 37(3), 205-233.
Tserng, H., & Lin, Y. (2004). Developing an activity-based knowledge management system for contractors.
Automation in Construction, 13(6), 781-802.
Tseng, S., & Fang, Y., (2015). Customer knowledge management performance index: managing and quantifying
customer knowledge. Knowledge and Process Management, 22(2), 68-77.
Wang, M. (2011). Measuring intellectual capital and its effect on financial performance: evidence from the capital
market in Taiwan. Frontiers of Business Research in China, 5(2), 243-265.
Werner, O., & Campbell, D. (1970). Translating, working through interpreters, and the problem of decentering. In
Naroll, R. and Cohen, R. (Eds.), A handbook of method in cultural anthropology, American Museum of
Natural History, New York, NY, 398-420.
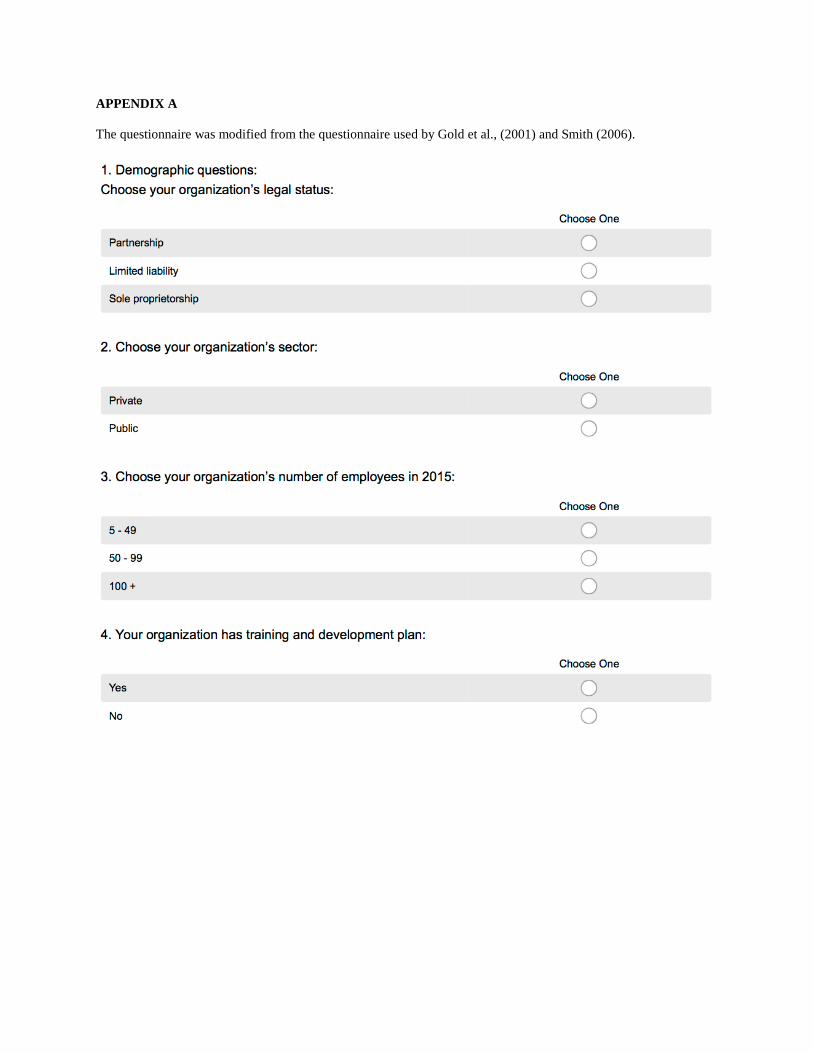
APPENDIX A
The questionnaire was modified from the questionnaire used by Gold et al., (2001) and Smith (2006).


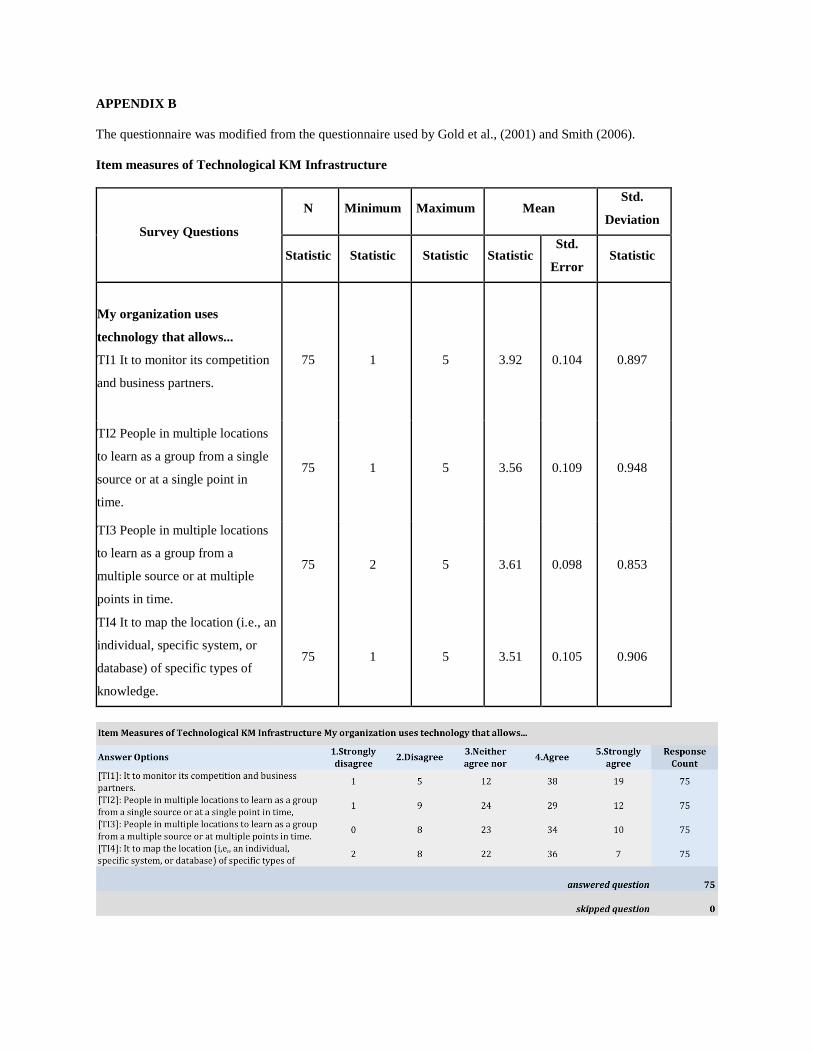
APPENDIX B
The questionnaire was modified from the questionnaire used by Gold et al., (2001) and Smith (2006).
Item measures of Technological KM Infrastructure
Survey Questions
N Minimum Maximum Mean Std.
Deviation
Statistic Statistic Statistic Statistic Std.
Error Statistic
My organization uses
technology that allows...
TI1 It to monitor its competition
and business partners.
75
1
5
3.92
0.104
0.897
TI2 People in multiple locations
to learn as a group from a single
source or at a single point in
time.
75 1 5 3.56 0.109 0.948
TI3 People in multiple locations
to learn as a group from a
multiple source or at multiple
points in time.
75 2 5 3.61 0.098 0.853
TI4 It to map the location (i.e., an
individual, specific system, or
database) of specific types of
knowledge.
75 1 5 3.51 0.105 0.906

Item measures of Structural KM Infrastructure
Survey Questions
N Minimum
Maximum Mean Std.
Deviation
Statistic Statistic
Statistic Statistic Std.
Error Statistic
My organization's ...
SI1 Structure facilitates the
discovery of new knowledge
75 2
5 3.69 0.114 0.986
SI2 Structure facilitates the
creation of new knowledge 75 2
5 3.67 0.114 0.991
SI3 Bases our performance on
knowledge creation 75 1
5 3.24 0.112 0.970
SI4 Has a standardized reward
system for sharing knowledge 75 1
5 2.93 0.132 1.143
SI5 Designs processes to
facilitate knowledge exchange
across functional boundaries
75 1
5 3.37 0.115 0.997
SI6 Managers frequently
examine knowledge for
errors/mistakes
75 1
5 3.35 0.118 1.020
SI7 Structure facilitates the
transfer of new knowledge across
structural boundaries
75 1
5 3.39 0.121 1.051
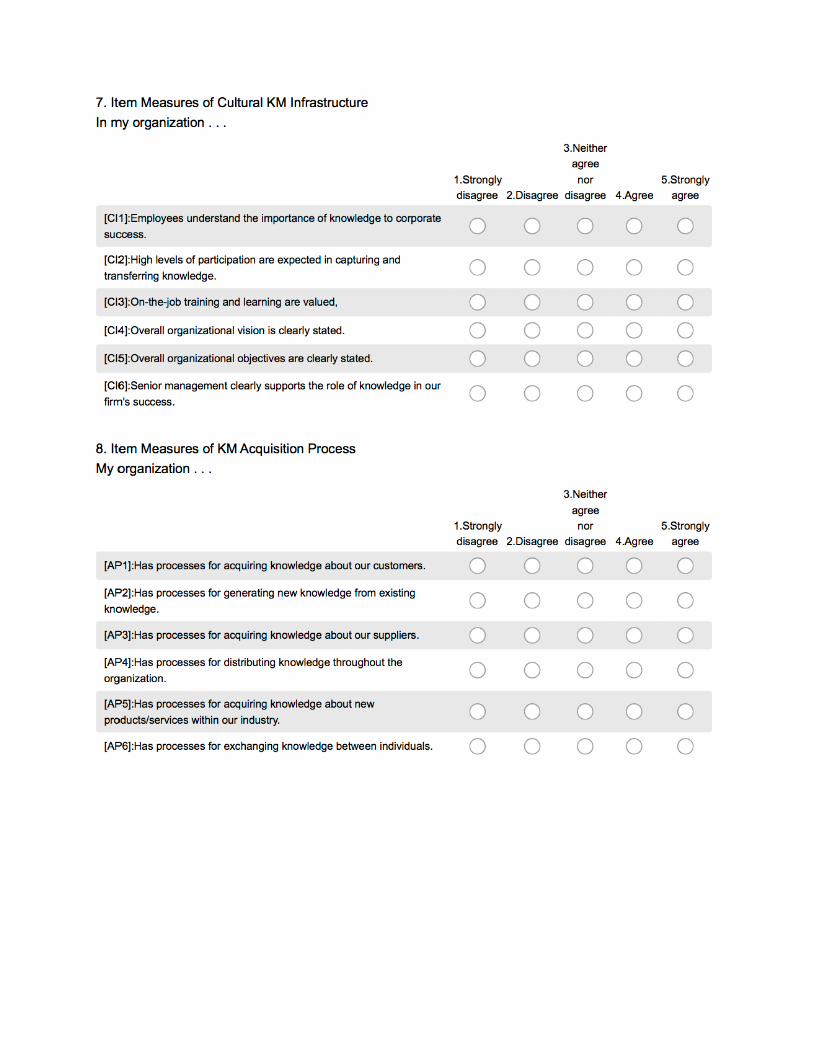
Item measures of Cultural KM Infrastructure
Survey Questions
N Minimum Maximum Mean Std.
Deviation
Statistic Statistic Statistic Statistic Std.
Error Statistic
In my organization . . .
CI1 Employees understand the
importance of knowledge to
corporate success
75 1 5 3.65 0.111 0.966

CI2 High levels of participation
are expected in capturing and
transferring knowledge
73 1 5 3.53 0.123 1.055
CI3 On-the-job training and
learning are valued 75 1 5 3.68 0.123 1.067
CI4 Overall organizational vision
is clearly stated 75 1 5 3.49 0.145 1.256
CI5 Overall organizational
objectives are clearly stated 75 1 5 3.71 0.126 1.088
CI6 Senior management clearly
supports the role of knowledge in
our firm's success
75 1 5 3.71 0.118 1.024
KIC Score 75 32 83 59.92 1.324 11.470
Valid N (listwise) 73
Item measures of KM acquisition process
N Minimum Maximum Mean Std.
Deviation
Statistic Statistic Statistic Statistic Std.
Error Statistic
My organization . . .
AP1 Has processes for acquiring
knowledge about our consumers
75 1 5 3.55 0.101 0.874

AP2 Has processes for generating
new knowledge from existing
knowledge
75 2 5 3.40 0.100 0.870
AP3 Has processes for acquiring
knowledge about our suppliers 75 1 5 3.61 0.109 0.943
AP4 Has processes for distributing
knowledge throughout the
organization
75 1 5 3.33 0.119 1.031
AP5 Has processes for acquiring
knowledge about new
products/services within our
industry.
75 1 5 3.60 0.127 1.103
AP6 Has processes for exchanging
knowledge between individuals 74 1 5 3.43 0.126 1.086
Item measures of KM Conversion process
N Minimum Maximum Mean Std.
Deviation
Statistic Statistic Statistic Statistic Std.
Error Statistic
My organization . . .
CP1 Has processes for filtering
knowledge
75 1 5 3.07 0.110 0.949
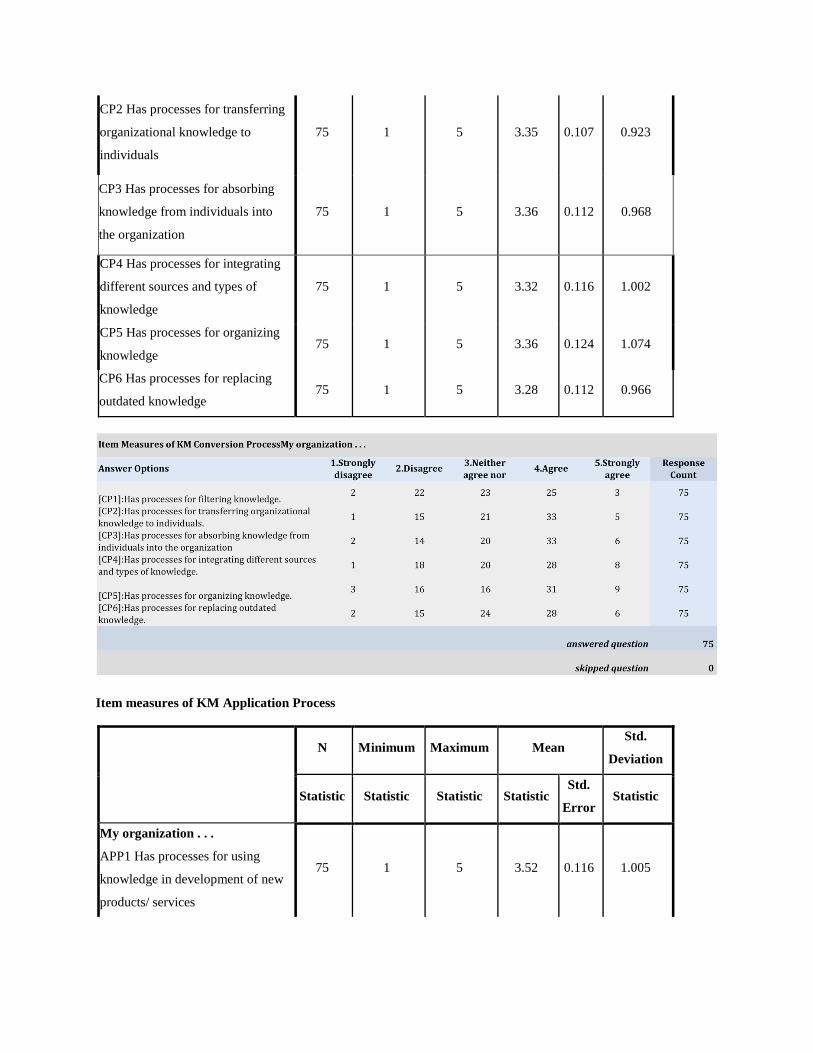
CP2 Has processes for transferring
organizational knowledge to
individuals
75 1 5 3.35 0.107 0.923
CP3 Has processes for absorbing
knowledge from individuals into
the organization
75 1 5 3.36 0.112 0.968
CP4 Has processes for integrating
different sources and types of
knowledge
75 1 5 3.32 0.116 1.002
CP5 Has processes for organizing
knowledge 75 1 5 3.36 0.124 1.074
CP6 Has processes for replacing
outdated knowledge 75 1 5 3.28 0.112 0.966
Item measures of KM Application Process
N Minimum Maximum Mean Std.
Deviation
Statistic Statistic Statistic Statistic Std.
Error Statistic
My organization . . .
APP1 Has processes for using
knowledge in development of new
products/ services
75 1 5 3.52 0.116 1.005
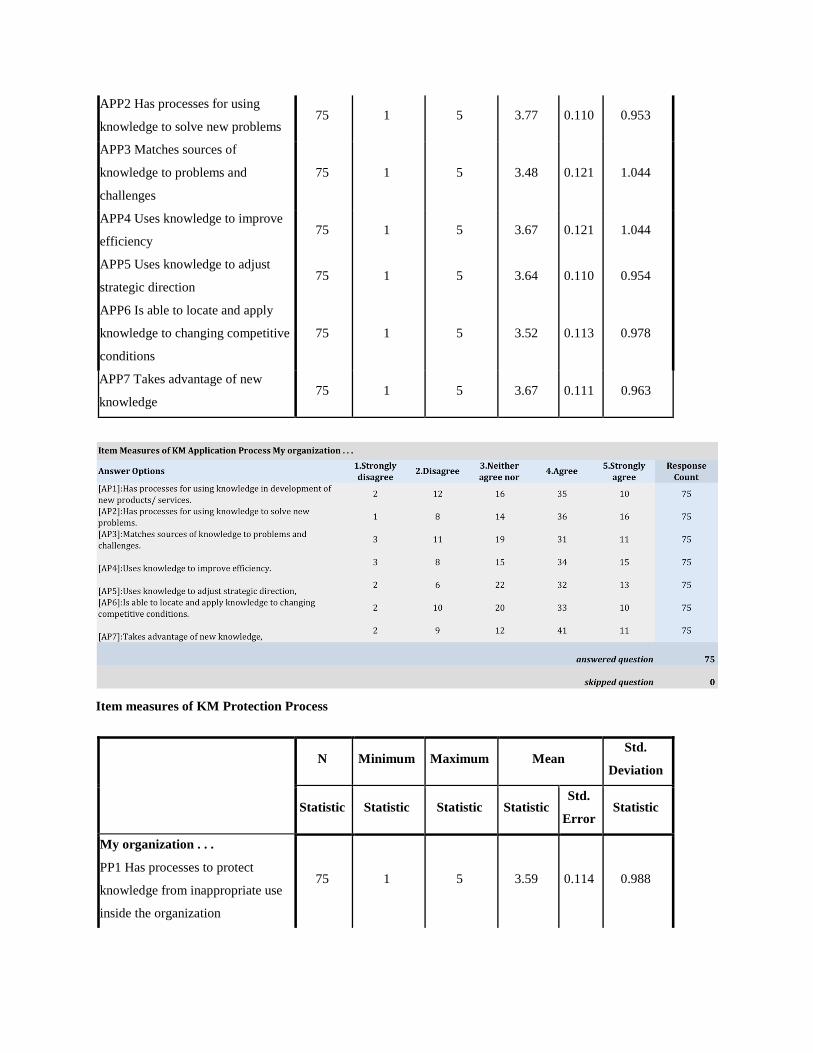
APP2 Has processes for using
knowledge to solve new problems 75 1 5 3.77 0.110 0.953
APP3 Matches sources of
knowledge to problems and
challenges
75 1 5 3.48 0.121 1.044
APP4 Uses knowledge to improve
efficiency 75 1 5 3.67 0.121 1.044
APP5 Uses knowledge to adjust
strategic direction 75 1 5 3.64 0.110 0.954
APP6 Is able to locate and apply
knowledge to changing competitive
conditions
75 1 5 3.52 0.113 0.978
APP7 Takes advantage of new
knowledge 75 1 5 3.67 0.111 0.963
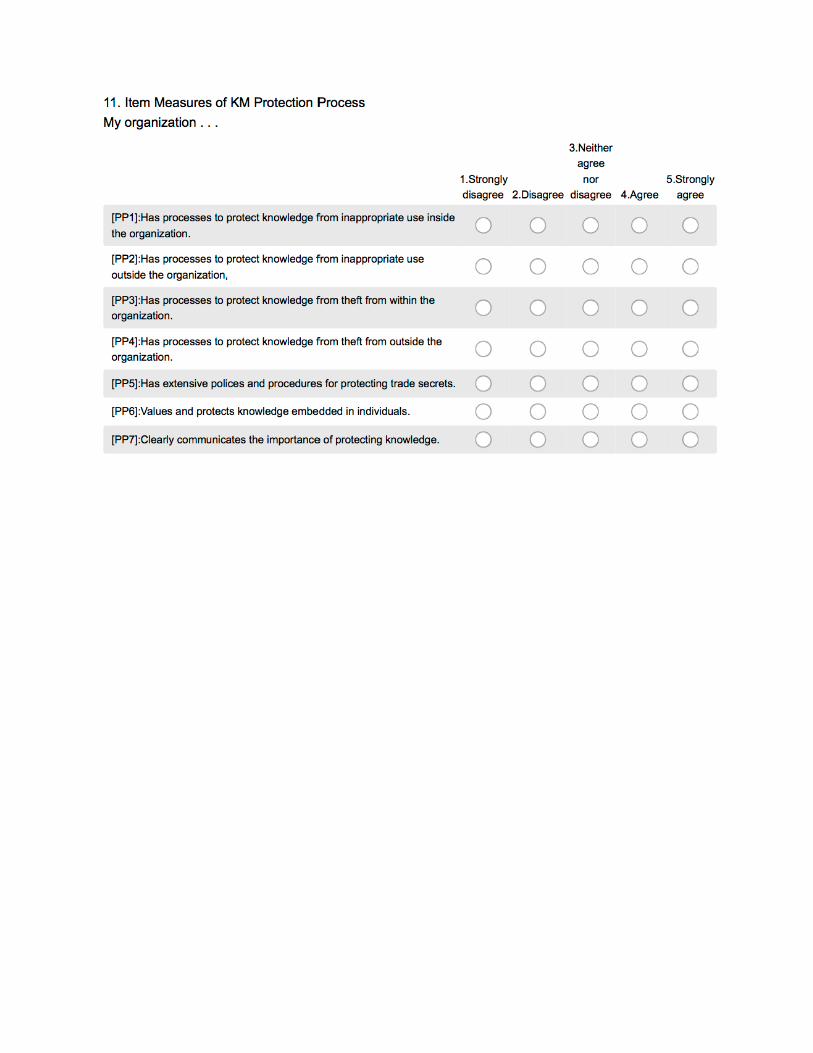
Item measures of KM Protection Process
N Minimum Maximum Mean Std.
Deviation
Statistic Statistic Statistic Statistic Std.
Error Statistic
My organization . . .
PP1 Has processes to protect
knowledge from inappropriate use
inside the organization
75 1 5 3.59 0.114 0.988
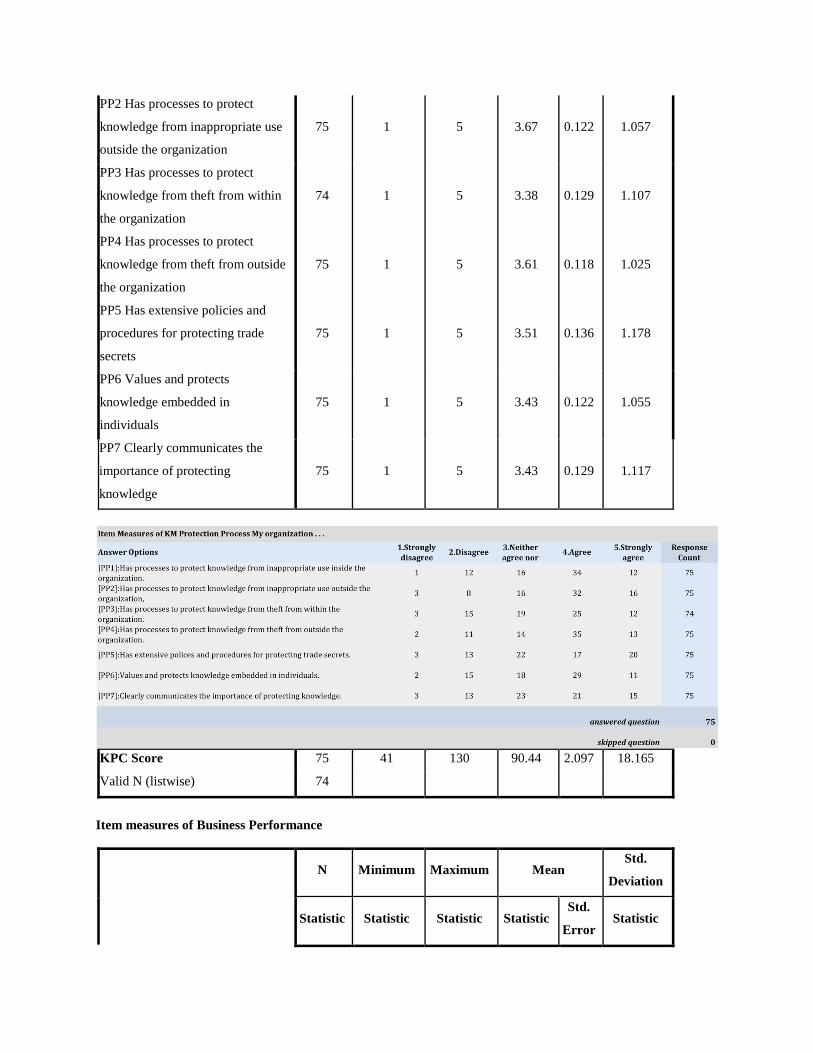
PP2 Has processes to protect
knowledge from inappropriate use
outside the organization
75 1 5 3.67 0.122 1.057
PP3 Has processes to protect
knowledge from theft from within
the organization
74 1 5 3.38 0.129 1.107
PP4 Has processes to protect
knowledge from theft from outside
the organization
75 1 5 3.61 0.118 1.025
PP5 Has extensive policies and
procedures for protecting trade
secrets
75 1 5 3.51 0.136 1.178
PP6 Values and protects
knowledge embedded in
individuals
75 1 5 3.43 0.122 1.055
PP7 Clearly communicates the
importance of protecting
knowledge
75 1 5 3.43 0.129 1.117
KPC Score 75 41 130 90.44 2.097 18.165
Valid N (listwise) 74
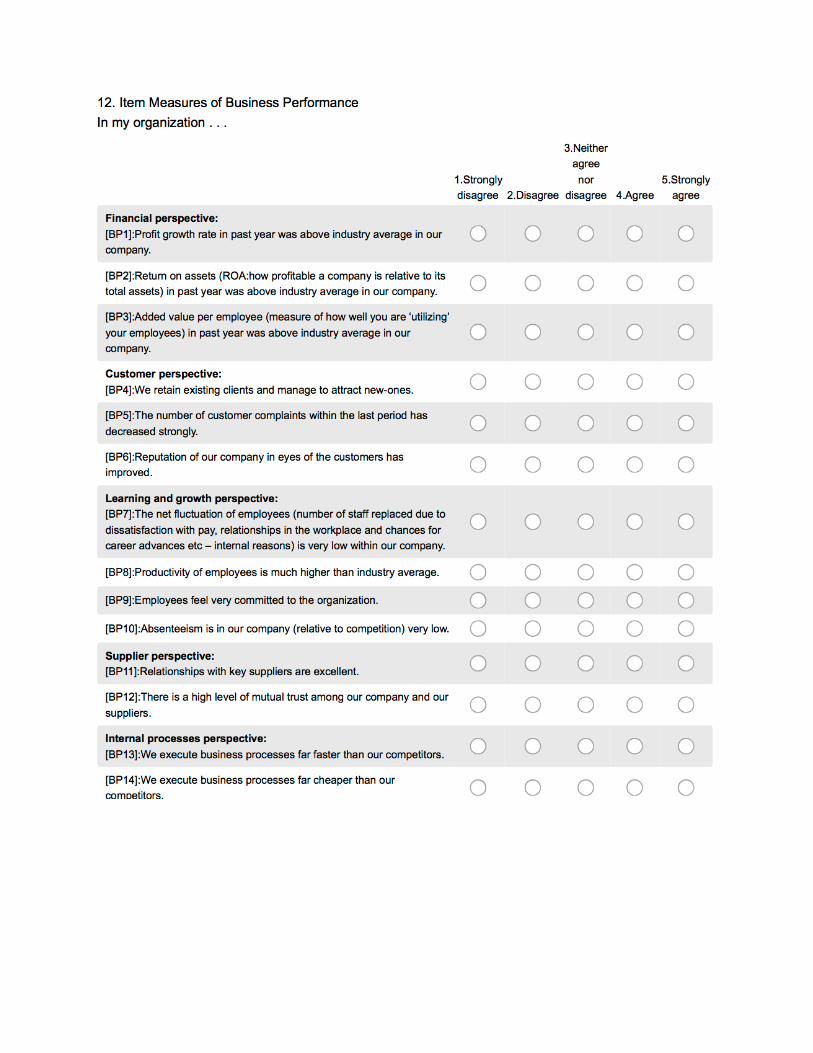
Item measures of Business Performance
N Minimum Maximum Mean Std.
Deviation
Statistic Statistic Statistic Statistic Std.
Error Statistic
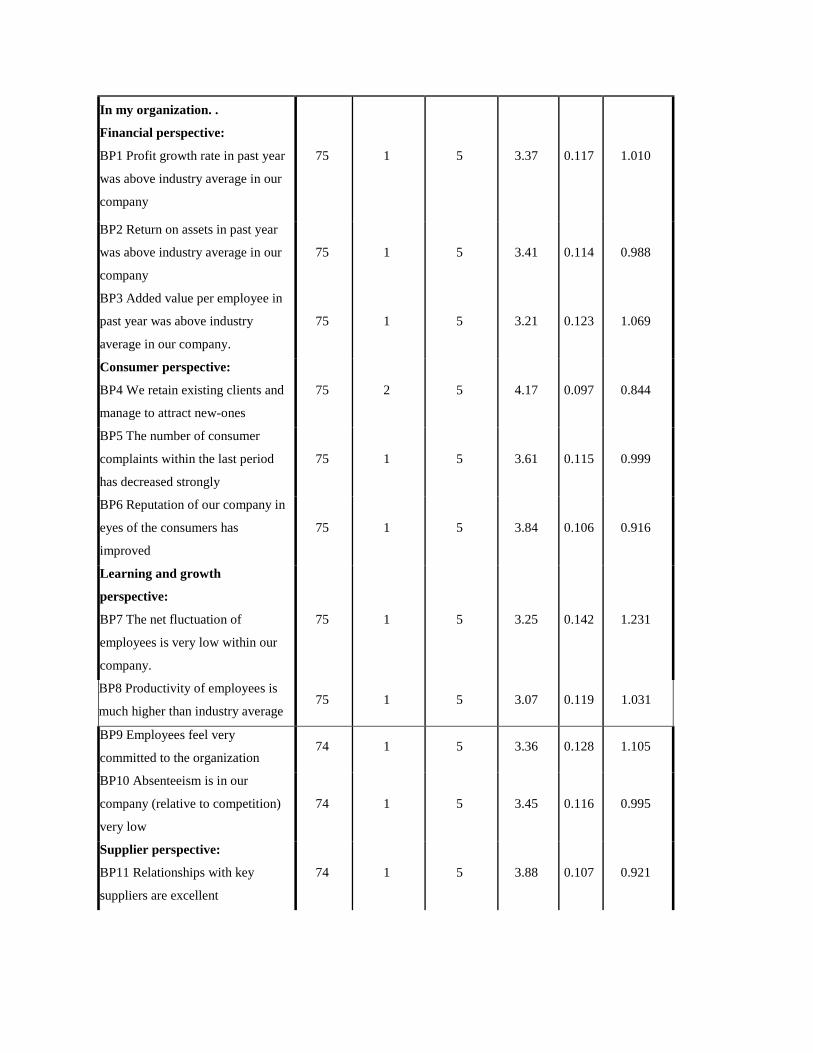
In my organization. .
Financial perspective:
BP1 Profit growth rate in past year
was above industry average in our
company
75 1 5 3.37 0.117 1.010
BP2 Return on assets in past year
was above industry average in our
company
75 1 5 3.41 0.114 0.988
BP3 Added value per employee in
past year was above industry
average in our company.
75 1 5 3.21 0.123 1.069
Consumer perspective:
BP4 We retain existing clients and
manage to attract new-ones
75 2 5 4.17 0.097 0.844
BP5 The number of consumer
complaints within the last period
has decreased strongly
75 1 5 3.61 0.115 0.999
BP6 Reputation of our company in
eyes of the consumers has
improved
75 1 5 3.84 0.106 0.916
Learning and growth
perspective:
BP7 The net fluctuation of
employees is very low within our
company.
75 1 5 3.25 0.142 1.231
BP8 Productivity of employees is
much higher than industry average 75 1 5 3.07 0.119 1.031
BP9 Employees feel very
committed to the organization 74 1 5 3.36 0.128 1.105
BP10 Absenteeism is in our
company (relative to competition)
very low
74 1 5 3.45 0.116 0.995
Supplier perspective:
BP11 Relationships with key
suppliers are excellent
74 1 5 3.88 0.107 0.921
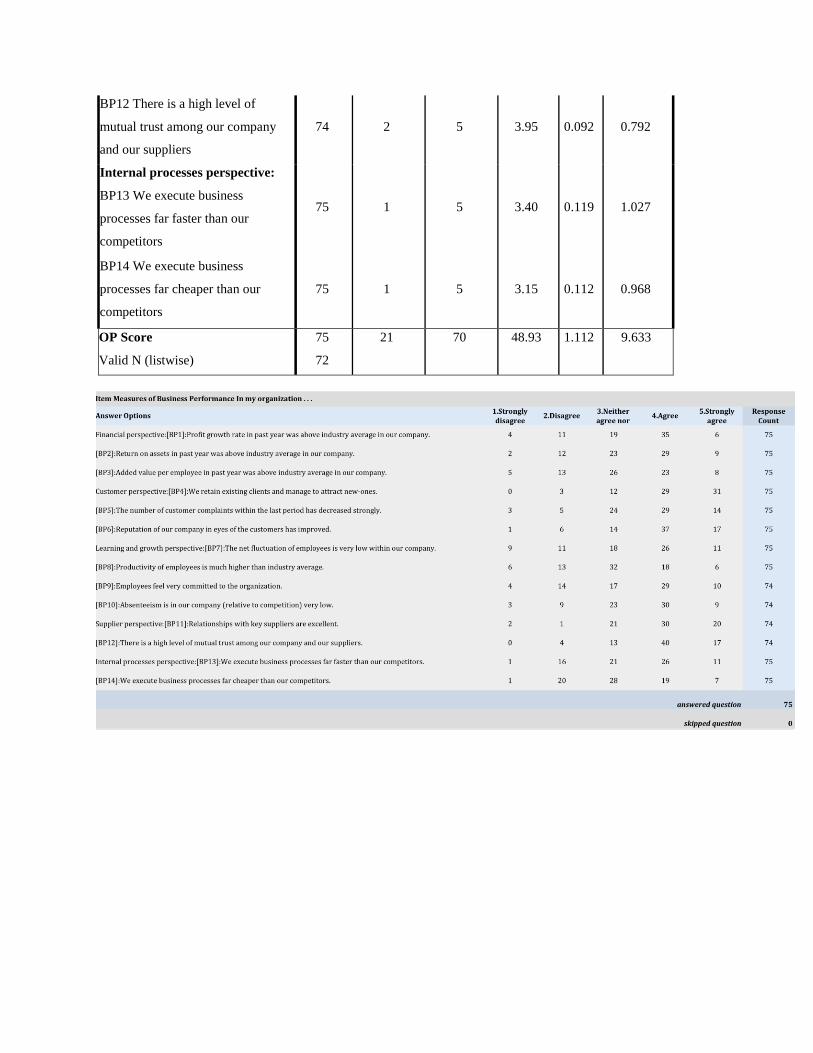
BP12 There is a high level of
mutual trust among our company
and our suppliers
74 2 5 3.95 0.092 0.792
Internal processes perspective:
BP13 We execute business
processes far faster than our
competitors
75 1 5 3.40 0.119 1.027
BP14 We execute business
processes far cheaper than our
competitors
75 1 5 3.15 0.112 0.968
OP Score 75 21 70 48.93 1.112 9.633
Valid N (listwise) 72