How are falls and fear of falling associated with objectively measured physical activity in a cohort...
9
RESEARCH ARTICLE Open Access How are falls and fear of falling associated with objectively measured physical activity in a cohort of community-dwelling older men? Barbara J Jefferis 1* , Steve Iliffe 1 , Denise Kendrick 2 , Ngaire Kerse 3 , Stewart Trost 4 , Lucy T Lennon 1 , Sarah Ash 1 , Claudio Sartini 1 , Richard W Morris 1 , S Goya Wannamethee 1 and Peter H Whincup 5 Abstract Background: Falls affect approximately one third of community-dwelling older adults each year and have serious health and social consequences. Fear of falling (FOF) (lack of confidence in maintaining balance during normal activities) affects many older adults, irrespective of whether they have actually experienced falls. Both falls and fear of falls may result in restrictions of physical activity, which in turn have health consequences. To date the relation between (i) falls and (ii) fear of falling with physical activity have not been investigated using objectively measured activity data which permits examination of different intensities of activity and sedentary behaviour. Methods: Cross-sectional study of 1680 men aged 71–92 years recruited from primary care practices who were part of an on-going population-based cohort. Men reported falls history in previous 12 months, FOF, health status and demographic characteristics. Men wore a GT3x accelerometer over the hip for 7 days. Results: Among the 12% of men who had recurrent falls, daily activity levels were lower than among non-fallers; 942 (95% CI 503, 1381) fewer steps/day, 12(95% CI 2, 22) minutes less in light activity, 10(95% CI 5, 15) minutes less in moderate to vigorous PA [MVPA] and 22(95% CI 9, 35) minutes more in sedentary behaviour. 16% (n = 254) of men reported FOF, of whom 52% (n = 133) had fallen in the past year. Physical activity deficits were even greater in the men who reported that they were fearful of falling than in men who had fallen. Men who were fearful of falling took 1766(95% CI 1391, 2142) fewer steps/day than men who were not fearful, and spent 27(95% CI 18, 36) minutes less in light PA, 18(95% CI 13, 22) minutes less in MVPA, and 45(95% CI 34, 56) minutes more in sedentary behaviour. The significant differences in activity levels between (i) fallers and non-fallers and (ii) men who were fearful of falling or not fearful, were mediated by similar variables; lower exercise self-efficacy, fewer excursions from home and more mobility difficulties. Conclusions: Falls and in particular fear of falling are important barriers to older people gaining health benefits of walking and MVPA. Future studies should assess the longitudinal associations between falls and physical activity. Keywords: Falls, Fear of falls, Physical activity, Accelerometer, Older adults * Correspondence: [email protected] 1 Department of Primary Care & Population Health, UCL Medical School, Rowland Hill Street, London NW3 2PF, UK Full list of author information is available at the end of the article © 2014 Jefferis et al.; licensee BioMed Central Ltd. This is an Open Access article distributed under the terms of the Creative Commons Attribution License (http://creativecommons.org/licenses/by/4.0), which permits unrestricted use, distribution, and reproduction in any medium, provided the original work is properly credited. The Creative Commons Public Domain Dedication waiver (http://creativecommons.org/publicdomain/zero/1.0/) applies to the data made available in this article, unless otherwise stated. Jefferis et al. BMC Geriatrics 2014, 14:114 http://www.biomedcentral.com/1471-2318/14/114
Transcript of How are falls and fear of falling associated with objectively measured physical activity in a cohort...
Jefferis et al. BMC Geriatrics 2014, 14:114http://www.biomedcentral.com/1471-2318/14/114
RESEARCH ARTICLE Open Access
How are falls and fear of falling associated withobjectively measured physical activity in a cohortof community-dwelling older men?Barbara J Jefferis1*, Steve Iliffe1, Denise Kendrick2, Ngaire Kerse3, Stewart Trost4, Lucy T Lennon1, Sarah Ash1,Claudio Sartini1, Richard W Morris1, S Goya Wannamethee1 and Peter H Whincup5
Abstract
Background: Falls affect approximately one third of community-dwelling older adults each year and have serioushealth and social consequences. Fear of falling (FOF) (lack of confidence in maintaining balance during normalactivities) affects many older adults, irrespective of whether they have actually experienced falls. Both falls and fearof falls may result in restrictions of physical activity, which in turn have health consequences. To date the relationbetween (i) falls and (ii) fear of falling with physical activity have not been investigated using objectively measuredactivity data which permits examination of different intensities of activity and sedentary behaviour.
Methods: Cross-sectional study of 1680 men aged 71–92 years recruited from primary care practices who werepart of an on-going population-based cohort. Men reported falls history in previous 12 months, FOF, health statusand demographic characteristics. Men wore a GT3x accelerometer over the hip for 7 days.
Results: Among the 12% of men who had recurrent falls, daily activity levels were lower than among non-fallers;942 (95% CI 503, 1381) fewer steps/day, 12(95% CI 2, 22) minutes less in light activity, 10(95% CI 5, 15) minutes lessin moderate to vigorous PA [MVPA] and 22(95% CI 9, 35) minutes more in sedentary behaviour. 16% (n = 254) ofmen reported FOF, of whom 52% (n = 133) had fallen in the past year. Physical activity deficits were even greater inthe men who reported that they were fearful of falling than in men who had fallen. Men who were fearful of fallingtook 1766(95% CI 1391, 2142) fewer steps/day than men who were not fearful, and spent 27(95% CI 18, 36) minutesless in light PA, 18(95% CI 13, 22) minutes less in MVPA, and 45(95% CI 34, 56) minutes more in sedentary behaviour.The significant differences in activity levels between (i) fallers and non-fallers and (ii) men who were fearful offalling or not fearful, were mediated by similar variables; lower exercise self-efficacy, fewer excursions from homeand more mobility difficulties.
Conclusions: Falls and in particular fear of falling are important barriers to older people gaining health benefits ofwalking and MVPA. Future studies should assess the longitudinal associations between falls and physical activity.
Keywords: Falls, Fear of falls, Physical activity, Accelerometer, Older adults
* Correspondence: [email protected] of Primary Care & Population Health, UCL Medical School,Rowland Hill Street, London NW3 2PF, UKFull list of author information is available at the end of the article
© 2014 Jefferis et al.; licensee BioMed Central Ltd. This is an Open Access article distributed under the terms of the CreativeCommons Attribution License (http://creativecommons.org/licenses/by/4.0), which permits unrestricted use, distribution, andreproduction in any medium, provided the original work is properly credited. The Creative Commons Public DomainDedication waiver (http://creativecommons.org/publicdomain/zero/1.0/) applies to the data made available in this article,unless otherwise stated.
Jefferis et al. BMC Geriatrics 2014, 14:114 Page 2 of 9http://www.biomedcentral.com/1471-2318/14/114
BackgroundPhysical activity (PA) levels in older people are low anddecline with increasing age [1]. In the UK only 9% of menand 6% of women over 75 years [1] report achieving rec-ommended levels of moderate to vigorous physical activity(MVPA) of 150 minutes per week [2,3]. These low PAlevels have deleterious effects on a wide range of healthoutcomes [4].Falls are very common in community-dwelling older
adults; approximately one third report falling in the past12 months [5]. Falls have serious physical and psycho-logical consequences for individuals, for society, and forhealth services due to the high cost of inpatient admis-sions and long term care [6]. Fallers have lower levels ofself-reported PA [7], perhaps due to mobility limitationsafter an injury or avoiding activities because of fear offalling. The lower activity levels may in turn decreasestrength and balance and initiate a downward cycle towardslosing independence and entering long-term care.Fear of falling (FOF) has been variously defined includ-
ing concern that normal activities cannot be performedwithout falling, lack of confidence in maintaining balanceduring normal activities and being frightened of falling [8].FOF affects 20-50% of older adults [9-11] and may be a ra-tional psychological response to previous falls, but is alsoreported by people who have not fallen [12]. FOF is asso-ciated with an increased falls risk, functional restrictions,lower quality of life and low PA levels [11-16]. Whilst FOFmay result in taking extra care during activities, possiblypreventing falls, the reduction in activity may also lead todeconditioning and loss of muscle strength [17].Much research about PA and falls focuses on exercise
interventions to reduce onset of falls in the community
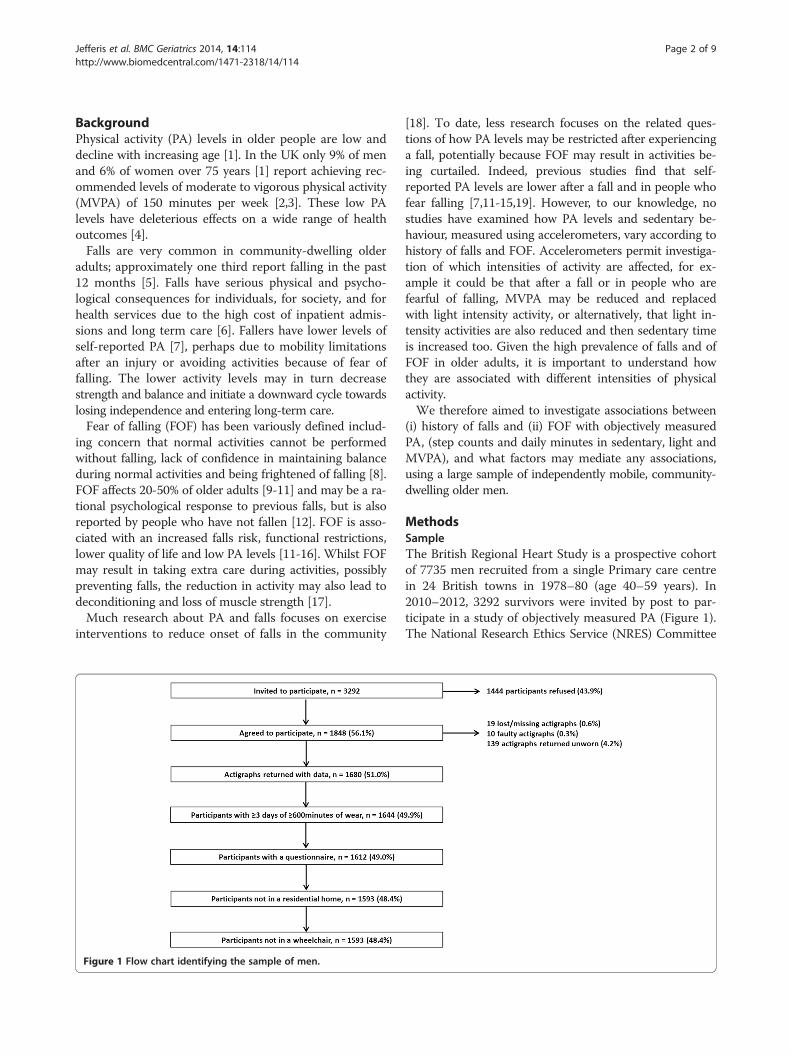
Figure 1 Flow chart identifying the sample of men.
[18]. To date, less research focuses on the related ques-tions of how PA levels may be restricted after experiencinga fall, potentially because FOF may result in activities be-ing curtailed. Indeed, previous studies find that self-reported PA levels are lower after a fall and in people whofear falling [7,11-15,19]. However, to our knowledge, nostudies have examined how PA levels and sedentary be-haviour, measured using accelerometers, vary according tohistory of falls and FOF. Accelerometers permit investiga-tion of which intensities of activity are affected, for ex-ample it could be that after a fall or in people who arefearful of falling, MVPA may be reduced and replacedwith light intensity activity, or alternatively, that light in-tensity activities are also reduced and then sedentary timeis increased too. Given the high prevalence of falls and ofFOF in older adults, it is important to understand howthey are associated with different intensities of physicalactivity.We therefore aimed to investigate associations between
(i) history of falls and (ii) FOF with objectively measuredPA, (step counts and daily minutes in sedentary, light andMVPA), and what factors may mediate any associations,using a large sample of independently mobile, community-dwelling older men.
MethodsSampleThe British Regional Heart Study is a prospective cohortof 7735 men recruited from a single Primary care centrein 24 British towns in 1978–80 (age 40–59 years). In2010–2012, 3292 survivors were invited by post to par-ticipate in a study of objectively measured PA (Figure 1).The National Research Ethics Service (NRES) Committee
Jefferis et al. BMC Geriatrics 2014, 14:114 Page 3 of 9http://www.biomedcentral.com/1471-2318/14/114
for London provided ethical approval. All men providedinformed written consent to the investigation, which wasperformed in accordance with the Declaration of Helsinki.
MeasuresAccelerometer dataParticipants wore a GT3X accelerometer (Actigraph,Pensacola, Florida) over the hip for 7 days, during wak-ing hours, removing it for bathing. Uniaxial data wereanalysed in 60 second epochs. Non-wear time was iden-tified and excluded using a commonly used, freely avail-able R package [20]. Men with ≥3 days of ≥600 minutesof wear time were included in analyses. Extreme datapoints (step counts <100 or >20,000/day) were verifiedagainst log diaries. The number of minutes spent in PAof different intensity levels was categorised using stand-ard counts per minute (cpm)-based intensity thresholdvalues of <100 for sedentary behaviour, 100–1040 forlight activity and >1040 for MVPA (a cut-point for olderadults) [21-23].
Questionnaire dataMen completed a log diary (detailing accelerometer weartimes), and questionnaire including the following questions:“Have you had a fall in the past 12 months?” [yes/no] and“if yes, how many falls have you had in the past 12 months?”This question has high specificity and acceptable sensitivityfor detecting falls in the previous 12 months [24]. “At thepresent time are you afraid that you may fall over?” [veryfearful and somewhat fearful were compared to not fear-ful]. Participants completed the Self-Efficacy for Exercisescale [25] and the Expected Outcomes for Habitual Exer-cise scale [25]. Men scoring two or more on the 4 itemGeriatric Depression scale (GDS) were classified as havingdepression [26], Men reported whether they had prob-lems getting about outdoors and on how many days in theprevious week they left the house. Men answered fivestandard questions about mobility, self-care, usual activ-ities, pain or discomfort and anxiety or depression fromwhich the EuroQol EQ-5D health related quality of lifescore was calculated [27], this score was transformed intoa z-score for analyses. Social position was based on longestheld occupation reported in previous surveys [manual/non-manual].
Statistical methodsAssociations between confounding and potential medi-ator variables and falls history were examined. Summarymeasures of confounding and potential mediator vari-ables were calculated according to falls history. Linearregression models were used to examine differences incontinuous variables across the three groups of non-fallers, single fallers and recurrent fallers, differences incategorical variables were tested using Chi Squared
tests. The same approach was taken for FOF. Associa-tions between each of the potential mediators and thePA outcome variables were evaluated using random ef-fects linear regression models.Daily steps and minutes of sedentary and light activity
were approximately normally distributed. MVPA had anexcess of zero counts so was transformed (using log orsquare root transformations), but patterns of results didnot differ from analyses using untransformed data, sothe latter are presented for ease of interpretation. Ran-dom effects linear regression models were used to assessthe associations between falls and each of four differentPA outcome measures (daily steps, minutes of sedentary,light and MVPA), accounting for clustering with PA out-come (range 3–8 days of accelerometer data) at level 1and person at level 2. The xtmixed command in Statawas used, specifying a random intercept and identitycorrelation structure. The mean difference in each of thefour PA outcomes was compared between 3 groups;(i) men had not fallen in the past 12 months (baseline),(ii) men who had fallen once and (iii) men with recur-rent (> = 2) falls. Models were adjusted for confounders;age, day order, month, wear time (minutes/day) andtown of residence. Mediators between falls history andPA level were chosen if they had been reported to be as-sociated with PA levels and with falls or FOF in otherstudies, and were also related to falls, FOF and PA levelsin our study. These mediators were added one by one,to evaluate the role of each; exercise self-efficacy, exerciseoutcome expectations (both analysed as standard devi-ation scores), mobility problems, number of days leavingthe house, depression, health-related quality of life score,and FOF. A final model included all potential mediatorsto evaluate whether associations between falls and PAwere fully mediated. Complete case analysis was used.The same modelling strategy was used for FOF; men
who were currently “very” and “somewhat” fearful weregrouped together and compared to men who were notfearful of falling. Falls history was included as a covariatein models of FOF. Interactions between FOF and fall his-tory on step count, minutes of sedentary, light and MVPAwere investigated, and change in model fit was evaluatedusing a likelihood ratio test (LRT). As a sensitivity analysis,we investigated the impact of using lower cut points of25 cpm [28] and 50 cpm [29] rather than 100 cpm to de-fine sedentary behaviour. Analyses were conducted usingStata version 12 [30].
Results1680/3292 (51%) of men invited agreed to participate andhad accelerometer data (Figure 1). The sample was re-stricted to 1593/1680 (95%) independently mobilecommunity-dwelling men with > =600 minutes wear timeon 3–8 days, with mean age 78.3 years (range 71–93).
Jefferis et al. BMC Geriatrics 2014, 14:114 Page 4 of 9http://www.biomedcentral.com/1471-2318/14/114
Falls history and physical activity21% (328/1568) of men with falls data reported at leastone fall in the previous 12 months; 9% (n = 143) had onefall and 12% (n = 185) had recurrent falls (range 2–25).Compared to men who did not fall, single and recurrentfallers were significantly older, more fearful of falling,had more mobility difficulties outdoors, left the houseless often, had higher prevalence of depression, lower ex-ercise self-efficacy (they were less confident about beingable to exercise in the face of difficulties), lower exerciseoutcomes expectations (expectations about the benefitsof exercise for them) and lower quality of life. Men whodid not fall took significantly more steps per day andspent more time in light and in moderate or vigorousactivity than recurrent fallers, (Table 1) at the time ofthe survey. Men in manual social class were less likely tohave a single fall and more likely to have recurrent fallsthan men in non-manual social class. Each one of themediator variables was associated with the number ofminutes in sedentary, light and MVPA and steps per day(data not presented).Results from regression models indicate that single
fallers took a similar number of steps/day, and spent asimilar number of minutes in sedentary, light and MVPAcompared to non-fallers (Table 2a, Model 1). However, re-current fallers took significantly fewer steps/day than non-fallers (adjusted mean difference −942 (95% CI −503, −1381)and spent more minutes sedentary 22(95%CI 9, 35), and lessin light PA −12(95% CI −2, −22) MVPA −10(95% CI −5,-15),[Table 2b, Model 1]). These differences were abolishedafter adjustment for quality of life (Model 8), exercise self-efficacy (Model 3), fear of falling (Model 6) and mobilitylimitations (Model 5). The differences in step count wereattenuated but remained significant after adjustment forleaving the house on fewer days (Model 4), lower exerciseoutcome expectations (Model 2) and depression (Model7). The differences in sedentary and light time were fullymediated by adjustment for each of the mediators. Thedifferences in MVPA were partially mediated on adjust-ment for exercise outcome expectations (Model 2), leavingthe house (Model 4) and depression (Model 7), and fullymediated with each of the other single adjustments andwhen all covariates were included (Model 9).
Fear of falling and physical activity16% (n = 254/1577) of men were “very” or “somewhat”fearful of falling, they were more likely to have mobilitydifficulties, to leave the house less often, to have lowerexercise self-efficacy and lower expectations about thebenefits of exercise, lower quality of life and higher levelsof depression, (Table 1). Men reporting FOF took signifi-cantly fewer steps per day; −1766(95% CI −1391, −2142)and spent more minutes in sedentary 45(95% 34, 56),and less in light −27(95% CI −18, −36) or MVPA −18
(95% CI −13, −22), (Table 3, Model 1). These differenceswere very strongly mediated by lower exercise self-efficacy (Model 3). Other important mediators werehigher levels of mobility limitations (Model 5), lowerquality of life (Model 8), leaving the house on fewer days(Model 4), and exercise outcomes expectations (Model2). Presence of depression (Model 7) and falls history(Model 6) changed the estimates a small amount. Thedifferences in sedentary, light and MVPA were attenu-ated but remained significant on adjustment for each ofthe mediators in turn (Models 2–8). The differences instep count and minutes of sedentary, light and MVPAwere fully mediated in Model 9 which included all thecovariates.
Fear of falling and physical activity- impact of having hada fall16% (n = 254) of men reported FOF, of which 52% (n = 133)had fallen in the past year [15% (n = 37) one fall and 38%(n = 96) recurrent falls]. 41% (n = 133/325) of those whofell reported FOF. There was no evidence that FOF had agreater impact on PA levels among men who had fallencompared to those who had not fallen (LRT, p > 0.4 ineach case).As a sensitivity analysis, lower cut points of 25 cpm
and 50 cpm (rather than 100 cpm) were used to definesedentary behaviour. Whilst these cut points identifyfewer minutes of sedentary behaviour each day, the pat-terns of associations between falls or fear of falling andsedentary behaviour were unchanged.
DiscussionIn this large community-based sample, one in five oldermen fell in the past year, of whom half had recurrentfalls, and one in six men reported FOF. In line withother studies, FOF was more common in, but not re-stricted to men with a history of falls [12]; only half ofthe men with FOF had actually fallen in the past year.In our study, prevalence of falls was a little lower than
other comparable studies [7,11,12,15,19], and FOF wasless prevalent than in some other studies [9-11]. Thiscould reflect selection bias, but even if our participantswere more active and less fearful of falling than the aver-age, any bias should underestimate true associations be-tween falls or FOF and PA levels. Also, studies whichascertain falls using prospective monthly follow-up mayreport higher prevalences of falls than studies using asingle item recall over the past year. Our FOF scale is aone item question with 3 possible answers. The scale hasconstruct validity: in line with expectations from otherstudies, men with FOF had lower quality of life andmore mobility limitations than those who were not fear-ful [31]. A variety of single item questions have beenused in many other studies to identify fear of falls [14].
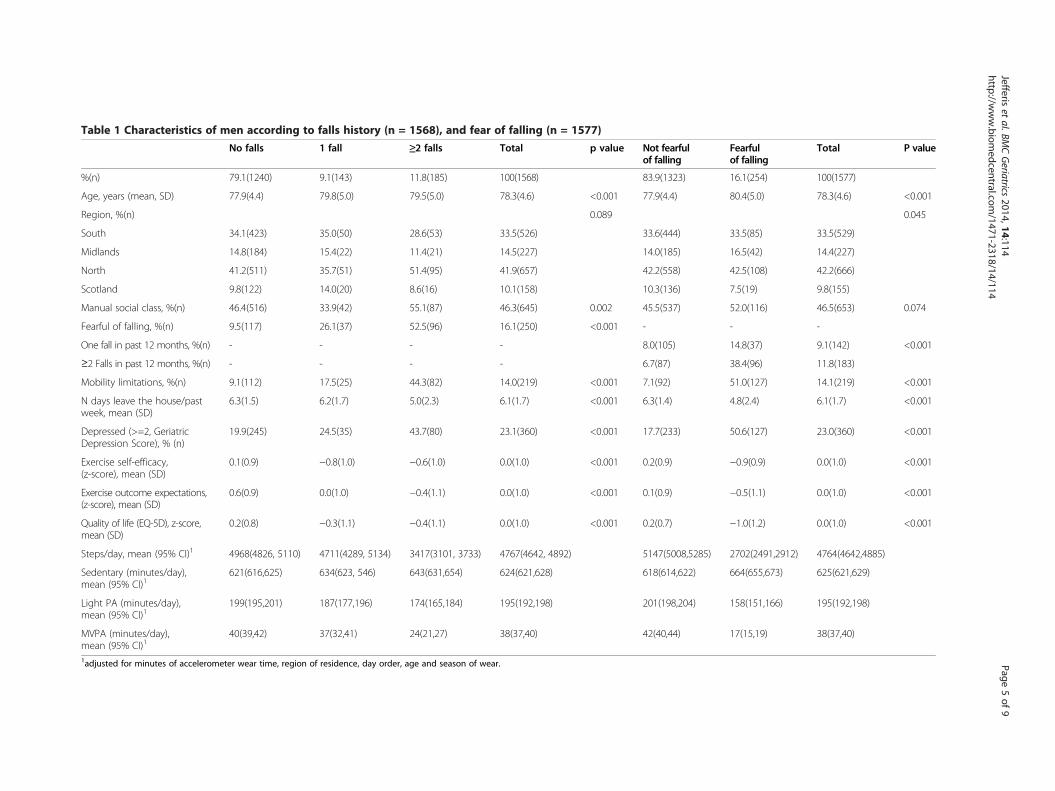
Table 1 Characteristics of men according to falls history (n = 1568), and fear of falling (n = 1577)
No falls 1 fall ≥2 falls Total p value Not fearfulof falling
Fearfulof falling
Total P value
%(n) 79.1(1240) 9.1(143) 11.8(185) 100(1568) 83.9(1323) 16.1(254) 100(1577)
Age, years (mean, SD) 77.9(4.4) 79.8(5.0) 79.5(5.0) 78.3(4.6) <0.001 77.9(4.4) 80.4(5.0) 78.3(4.6) <0.001
Region, %(n) 0.089 0.045
South 34.1(423) 35.0(50) 28.6(53) 33.5(526) 33.6(444) 33.5(85) 33.5(529)
Midlands 14.8(184) 15.4(22) 11.4(21) 14.5(227) 14.0(185) 16.5(42) 14.4(227)
North 41.2(511) 35.7(51) 51.4(95) 41.9(657) 42.2(558) 42.5(108) 42.2(666)
Scotland 9.8(122) 14.0(20) 8.6(16) 10.1(158) 10.3(136) 7.5(19) 9.8(155)
Manual social class, %(n) 46.4(516) 33.9(42) 55.1(87) 46.3(645) 0.002 45.5(537) 52.0(116) 46.5(653) 0.074
Fearful of falling, %(n) 9.5(117) 26.1(37) 52.5(96) 16.1(250) <0.001 - - -
One fall in past 12 months, %(n) - - - - 8.0(105) 14.8(37) 9.1(142) <0.001
≥2 Falls in past 12 months, %(n) - - - - 6.7(87) 38.4(96) 11.8(183)
Mobility limitations, %(n) 9.1(112) 17.5(25) 44.3(82) 14.0(219) <0.001 7.1(92) 51.0(127) 14.1(219) <0.001
N days leave the house/pastweek, mean (SD)
6.3(1.5) 6.2(1.7) 5.0(2.3) 6.1(1.7) <0.001 6.3(1.4) 4.8(2.4) 6.1(1.7) <0.001
Depressed (>=2, GeriatricDepression Score), % (n)
19.9(245) 24.5(35) 43.7(80) 23.1(360) <0.001 17.7(233) 50.6(127) 23.0(360) <0.001
Exercise self-efficacy,(z-score), mean (SD)
0.1(0.9) −0.8(1.0) −0.6(1.0) 0.0(1.0) <0.001 0.2(0.9) −0.9(0.9) 0.0(1.0) <0.001
Exercise outcome expectations,(z-score), mean (SD)
0.6(0.9) 0.0(1.0) −0.4(1.1) 0.0(1.0) <0.001 0.1(0.9) −0.5(1.1) 0.0(1.0) <0.001
Quality of life (EQ-5D), z-score,mean (SD)
0.2(0.8) −0.3(1.1) −0.4(1.1) 0.0(1.0) <0.001 0.2(0.7) −1.0(1.2) 0.0(1.0) <0.001
Steps/day, mean (95% CI)1 4968(4826, 5110) 4711(4289, 5134) 3417(3101, 3733) 4767(4642, 4892) 5147(5008,5285) 2702(2491,2912) 4764(4642,4885)
Sedentary (minutes/day),mean (95% CI)1
621(616,625) 634(623, 546) 643(631,654) 624(621,628) 618(614,622) 664(655,673) 625(621,629)
Light PA (minutes/day),mean (95% CI)1
199(195,201) 187(177,196) 174(165,184) 195(192,198) 201(198,204) 158(151,166) 195(192,198)
MVPA (minutes/day),mean (95% CI)1
40(39,42) 37(32,41) 24(21,27) 38(37,40) 42(40,44) 17(15,19) 38(37,40)
1adjusted for minutes of accelerometer wear time, region of residence, day order, age and season of wear.
Jefferiset
al.BMCGeriatrics
2014,14:114Page
5of
9http://w
ww.biom
edcentral.com/1471-2318/14/114
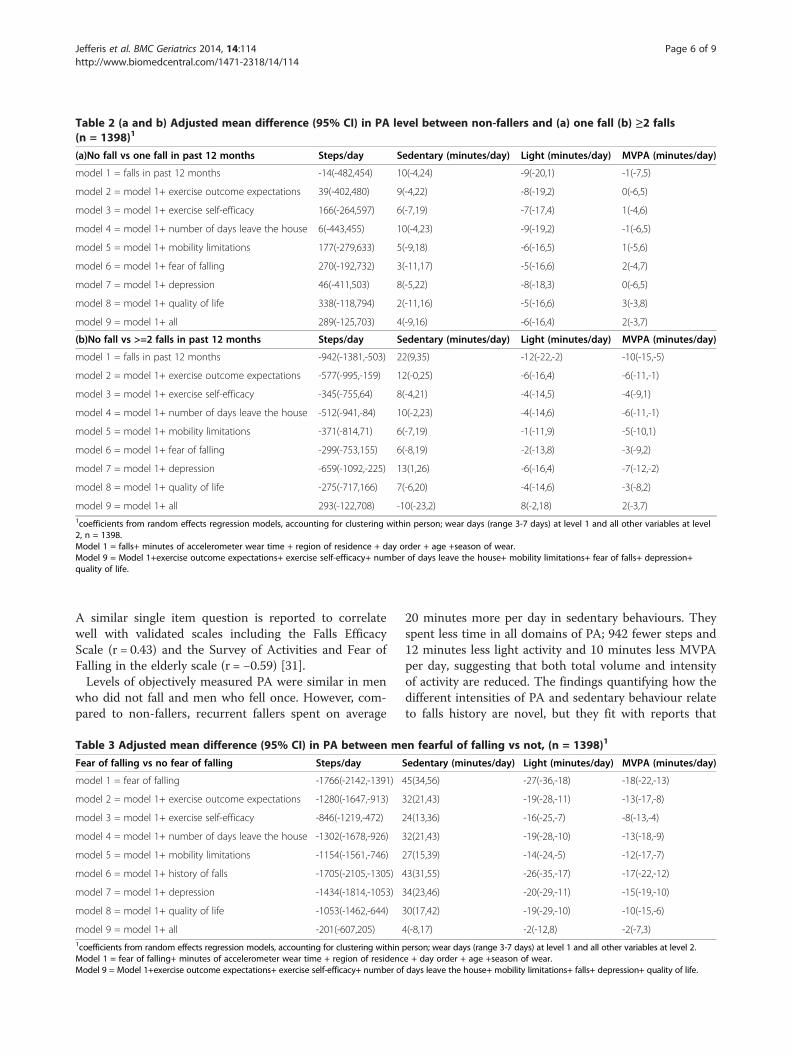
Table 2 (a and b) Adjusted mean difference (95% CI) in PA level between non-fallers and (a) one fall (b) ≥2 falls(n = 1398)1
(a)No fall vs one fall in past 12 months Steps/day Sedentary (minutes/day) Light (minutes/day) MVPA (minutes/day)
model 1 = falls in past 12 months -14(-482,454) 10(-4,24) -9(-20,1) -1(-7,5)
model 2 = model 1+ exercise outcome expectations 39(-402,480) 9(-4,22) -8(-19,2) 0(-6,5)
model 3 = model 1+ exercise self-efficacy 166(-264,597) 6(-7,19) -7(-17,4) 1(-4,6)
model 4 = model 1+ number of days leave the house 6(-443,455) 10(-4,23) -9(-19,2) -1(-6,5)
model 5 = model 1+ mobility limitations 177(-279,633) 5(-9,18) -6(-16,5) 1(-5,6)
model 6 = model 1+ fear of falling 270(-192,732) 3(-11,17) -5(-16,6) 2(-4,7)
model 7 = model 1+ depression 46(-411,503) 8(-5,22) -8(-18,3) 0(-6,5)
model 8 = model 1+ quality of life 338(-118,794) 2(-11,16) -5(-16,6) 3(-3,8)
model 9 = model 1+ all 289(-125,703) 4(-9,16) -6(-16,4) 2(-3,7)
(b)No fall vs >=2 falls in past 12 months Steps/day Sedentary (minutes/day) Light (minutes/day) MVPA (minutes/day)
model 1 = falls in past 12 months -942(-1381,-503) 22(9,35) -12(-22,-2) -10(-15,-5)
model 2 = model 1+ exercise outcome expectations -577(-995,-159) 12(-0,25) -6(-16,4) -6(-11,-1)
model 3 = model 1+ exercise self-efficacy -345(-755,64) 8(-4,21) -4(-14,5) -4(-9,1)
model 4 = model 1+ number of days leave the house -512(-941,-84) 10(-2,23) -4(-14,6) -6(-11,-1)
model 5 = model 1+ mobility limitations -371(-814,71) 6(-7,19) -1(-11,9) -5(-10,1)
model 6 = model 1+ fear of falling -299(-753,155) 6(-8,19) -2(-13,8) -3(-9,2)
model 7 = model 1+ depression -659(-1092,-225) 13(1,26) -6(-16,4) -7(-12,-2)
model 8 = model 1+ quality of life -275(-717,166) 7(-6,20) -4(-14,6) -3(-8,2)
model 9 = model 1+ all 293(-122,708) -10(-23,2) 8(-2,18) 2(-3,7)1coefficients from random effects regression models, accounting for clustering within person; wear days (range 3-7 days) at level 1 and all other variables at level2, n = 1398.Model 1 = falls+ minutes of accelerometer wear time + region of residence + day order + age +season of wear.Model 9 = Model 1+exercise outcome expectations+ exercise self-efficacy+ number of days leave the house+ mobility limitations+ fear of falls+ depression+quality of life.
Jefferis et al. BMC Geriatrics 2014, 14:114 Page 6 of 9http://www.biomedcentral.com/1471-2318/14/114
A similar single item question is reported to correlatewell with validated scales including the Falls EfficacyScale (r = 0.43) and the Survey of Activities and Fear ofFalling in the elderly scale (r = −0.59) [31].Levels of objectively measured PA were similar in men
who did not fall and men who fell once. However, com-pared to non-fallers, recurrent fallers spent on average
Table 3 Adjusted mean difference (95% CI) in PA between me
Fear of falling vs no fear of falling Steps/day
model 1 = fear of falling -1766(-2142,-1391)
model 2 = model 1+ exercise outcome expectations -1280(-1647,-913)
model 3 = model 1+ exercise self-efficacy -846(-1219,-472)
model 4 = model 1+ number of days leave the house -1302(-1678,-926)
model 5 = model 1+ mobility limitations -1154(-1561,-746)
model 6 = model 1+ history of falls -1705(-2105,-1305)
model 7 = model 1+ depression -1434(-1814,-1053)
model 8 = model 1+ quality of life -1053(-1462,-644)
model 9 = model 1+ all -201(-607,205)1coefficients from random effects regression models, accounting for clustering withinModel 1 = fear of falling+ minutes of accelerometer wear time + region of residencModel 9 = Model 1+exercise outcome expectations+ exercise self-efficacy+ number of
20 minutes more per day in sedentary behaviours. Theyspent less time in all domains of PA; 942 fewer steps and12 minutes less light activity and 10 minutes less MVPAper day, suggesting that both total volume and intensityof activity are reduced. The findings quantifying how thedifferent intensities of PA and sedentary behaviour relateto falls history are novel, but they fit with reports that
n fearful of falling vs not, (n = 1398)1
Sedentary (minutes/day) Light (minutes/day) MVPA (minutes/day)
45(34,56) -27(-36,-18) -18(-22,-13)
32(21,43) -19(-28,-11) -13(-17,-8)
24(13,36) -16(-25,-7) -8(-13,-4)
32(21,43) -19(-28,-10) -13(-18,-9)
27(15,39) -14(-24,-5) -12(-17,-7)
43(31,55) -26(-35,-17) -17(-22,-12)
34(23,46) -20(-29,-11) -15(-19,-10)
30(17,42) -19(-29,-10) -10(-15,-6)
4(-8,17) -2(-12,8) -2(-7,3)
person; wear days (range 3-7 days) at level 1 and all other variables at level 2.e + day order + age +season of wear.days leave the house+ mobility limitations+ falls+ depression+ quality of life.
Jefferis et al. BMC Geriatrics 2014, 14:114 Page 7 of 9http://www.biomedcentral.com/1471-2318/14/114
self-reported PA is curtailed after a fall [7,19] and thatinactivity may lead to falls. Findings suggest that recur-rent fallers have different characteristics to single fallers.The deficits in total volume and in intensity of PA
seen among men with FOF were approximately twice aslarge as the deficits seen among recurrent fallers com-pared to non-fallers. FOF was associated with 1766fewer steps/day and 27 minutes less of light activity,18 minutes less of MVPA along with an increase of45 minutes/day in sedentary behaviour. Whilst the defi-cits in MVPA were small in absolute terms (18 minutes/day), because total MVPA levels are very low in olderadults (38 minutes/day in our sample), and decline withadvancing age [1], in relative terms, this was a large de-crease. The deficit has potentially detrimental conse-quences, including loss of strength and balance, whichmay be important in eventual loss of independent living[17]. Although many studies have established that fear offalling is associated with activity limitations [11-15], it ishard to compare the size of associations from previousstudies of total self-reported PA directly with our mea-sures of daily minutes in different intensities of PA.We examined several potential mediators which might
account for differences in PA between fallers and non-fallers and men with and without FOF. Mediators werechosen if they had been reported to be associated withPA levels and with falls or FOF in other studies, andwere also related to falls, FOF and PA levels in ourstudy. We found that lower quality of life, lower exerciseself-efficacy, leaving the house on fewer days, and, to alesser extent, mobility difficulties outdoors and lower ex-pectations of benefits of exercise were potential media-tors between falls or FOF and activity levels. Indeedthese mediators were mostly consistent across all the do-mains of activity (daily step counts and minutes of sed-entary, light and MVPA). The same mediators were alsoimportant in mediating between both falls history andPA outcomes and also between FOF and PA outcomes,not surprising given that falls history and FOF areclosely inter-related. Exercise self-efficacy and outcomeexpectation are important constructs from the domainof theory of behaviour change and in our study, as else-where, were strongly predictive of activity levels [25].The number of journeys outside the home may import-antly determine PA levels in older adults [21] and afewer journeys outside the home may indicate activitylimitation. Some activity limitation will be due to limita-tions in indoor activity, however we did not ask specificquestions about indoor activities, so cannot specificallyinvestigate this. There was little evidence that presenceof depression, indexed by the GDS, was a strong medi-ator, perhaps because our measure was limited or be-cause other measures of mental health status (includinganxiety) might be more relevant. FOF was a strong
mediator between recurrent falls and all aspects of activitylevels. However associations between FOF and activitywere little affected by adjustment for falls history. Add-itionally we did not find evidence that the associations be-tween FOF and activity levels were modified by fallshistory, suggesting that the FOF-PA association is inde-pendent of actual falls history. Although FOF and recur-rent falls overlap, there seems to be a distinct and strongerassociation between fear of falling and PA than with fallshistory.
Strengths and limitationsThis study extends literature about how falls and FOFare associated with PA in several ways. Firstly, we useobjectively measured PA which, unlike self-reports, isnot susceptible to recall or reporting bias. Whilst otherstudies have established that FOF is associated with limi-tations in self-reported PA [11-13,15,16], the impact ondifferent intensities of activities and on sedentary timehave not been studied. Secondly, we accounted for im-portant confounding factors. Thirdly, we investigated awide range of mediators to understand the activity defi-cits in recurrent fallers and those with FOF. Fourthly,our sample is large and includes ambulatory community-dwelling men, not an “at risk” population, (eg adults inresidential care), so results are widely generalizable. How-ever the cross-sectional study design prevents us fromidentifying the direction of causality, which may be bidir-ectional [32]. Our sample is limited to men so our findingscannot be extrapolated to women. We know from previ-ous research that the prevalence of falls is higher amongwomen than men [32], that women are more likely to re-port fear of falling than men [14], that women are morelikely to inappropriately perceive themselves to be at highrisk of falls than men [33] and that women have lowerMVPA and higher levels of sedentary behaviour than men[34]. It is therefore important that future studies explorewhether the relationship between PA, FOF and falls variesby gender. The accelerometer data permitted us to esti-mate the size of the changes in time spent in sedentary,light and MVPA associated with falls or FOF. Whilst thecoefficients for sedentary, light activity and MPVA mustbalance out and sum to zero, we have independent dataon two of the three outcomes. It is nevertheless a strengthto investigate associations with objectively measured timespent in different intensities of activity and with stepcounts, as these data give us insights that questionnairedata would not give us. It is possible that there is somereactivity to wearing an accelerometer, ie becomingmore active, we found that there was a small excess onthe first day of accelerometer wear and estimates fromsubsequent days were very consistent. Indeed, we spe-cifically accounted for this issue in our analyses by con-trolling for day order in statistical models. We note that

Jefferis et al. BMC Geriatrics 2014, 14:114 Page 8 of 9http://www.biomedcentral.com/1471-2318/14/114
there are no universally agreed accelerometer cut-pointsto define sedentary behaviour in older adults, we usedthe most commonly used definition of 100 cpm, [35]which permits our results to be compared to other data.However sensitivity analyses using recently suggestedlower cut-points of 25 cpm [28] and 50 cpm [29], didnot alter our conclusions about associations betweenfalls or fear of falling and sedentary behaviour.
ConclusionsFear of falls and actual falls are important barriers toolder people benefitting from walking and MVPA, andmay promote sedentary behaviour, with its own detri-mental health effects. The strong association betweenFOF and lower step counts and time spent in light andMVPA may have serious adverse consequences for themany outcomes associated with lower PA levels [4], in-cluding future risk of falls. FOF may reduce activitylevels through reduced exercise self-efficacy and fewerjourneys outside the home which, if replicated in longi-tudinal studies, may be areas for intervention to reducethe activity-limiting effects of FOF. However, as FOFmay protect against falls, interventions to increase PAlevels in adults with FOF also need to reduce falls risk,otherwise targeting FOF could actually increase falls.
AbbreviationsCI: Confidence interval; CPM: Counts per minute; FOF: Fear of falling;GDS: Geriatric depression score; LRT: Likelihood ratio test; MVPA: Moderate tovigorous physical activity; PA: Physical activity; SD: Standard deviation.
Competing interestsThe authors declare that they have no competing interests.
Authors’ contributionsBJJ contributed to the design of the manuscript and statistical analyses,performed statistical analysis, drafted and revised the manuscript,incorporated revisions of co-authors, and approved the final version, SI,DKand NK contributed to the design of the manuscript, provided comments oninterpretation of data, revised the manuscript and approved the final version,ST advised on processing the accelerometer data, revised the manuscript,and approved the final version, LTL and SA enrolled participants, collecteddata, revised the manuscript, and approved the final version, CS cleaned andprocessed the accelerometer data, linked the databases, performed statisticalanalyses, revised the manuscript, and approved the final version, RWM contributedto the acquisition of data, design of the statistical analysis, interpreted data, revisedthe manuscript, and approved the final version, SGW and PHW contributed tothe acquisition of data, design of the manuscript, interpreted data, revised themanuscript, and approved the final version. All authors read and approved thefinal manuscript.
AcknowledgementsThe British Regional Heart Study is supported by a BHF programme grant(RG/08/013/25942). This report is independent research arising from a Post-DoctoralFellowship (to BJ) supported by the National Institute for HealthResearch (PDF-2010-03-23) and National Institute for Health ResearchNational School of Primary Care Project number 80. The views expressedin this publication are those of the author(s) and not necessarily thoseof the NHS, the National Institute for Health Research or the Departmentof Health.
Author details1Department of Primary Care & Population Health, UCL Medical School,Rowland Hill Street, London NW3 2PF, UK. 2Division of Primary Care, Schoolof Medicine, University of Nottingham, Nottingham, UK. 3Department ofGeneral Practice and Primary Health Care, School of Population Health,University of Auckland, Auckland, New Zealand. 4School of Human Studies,University of Queensland, Queensland, Australia. 5Population Health ResearchInstitute, St George’s, University of London, Cranmer Terrace, SW17 0RELondon, UK.
Received: 20 May 2014 Accepted: 17 October 2014Published: 27 October 2014
References1. Roth M: Self-reported physical activity in adults. In Health Survey For
England 2008, Volume 1. Physical Activity and Fitness. 1st edition. Edited byMindell J, Hirani V. London: HMSO; 2009:21–88.
2. Nelson ME, Rejeski J, Blair SN, Duncan PW, Judge JO, King AC, Macera CA,Castaneda-Sceppa C: Physical activity and public health in older adults:recommendation from the American College of Sports Medicine and theAmerican Heart Association. Circulation 2007, 116:1094–1105.
3. Chief Medical Officers of England SWaNI: Start Active, Stay Active. A report onphysical activity for health from the four home countries' Chief Medical Officers.London: Crown; 2011.
4. Chodzko-Zajko WJ, Proctor DN, Fiatarone Singh MA, Minson CT, Nigg CR,Salem GJ, Skinner JS: American College of Sports Medicine position stand:exercise and physical activity for older adults. Med Sci Sports Exerc 2009,41:1510–1530.
5. Masud T, Morris RO: Epidemiology of falls. Age Ageing 2001, 30:3–7.6. Scuffham P, Chaplin S, Legood R: Incidence and costs of unintentional
falls in older people in the United Kingdom. J Epidemiol CommunityHealth 2003, 57:740–744.
7. Tinetti ME, Williams CS: The effect of falls and fall injuries on functioningin community-dwelling older persons. J Gerontol A Biol Sci Med Sci 1998,53A:M112–M119.
8. Jung D: Fear of falling in older adults: comprehensive review. AsianNursing Research 2008, 2:214–222.
9. Austin N, Devine A, Dick I, Prince R, Bruce D: Fear of falling in olderwomen: a longitudinal study of incidence, persistence, and predictors.J Am Geriatr Soc 2007, 55:1598–1603.
10. Murphy SL, Williams CS, Gill TM: Characteristics associated with fear offalling and activity restriction in community-living older persons. J AmGeriatr Soc 2002, 50:516–520.
11. Mendes da Costa E, Pepersack T, Godin I, Bantuelle M, Petit B, Leveque A:Fear of falling and associated activity restriction in older people. resultsof a cross-sectional study conducted in a Belgian town. Arch Pub Health2012, 70:1.
12. Zijlstra GA, Van Haastregt JC, Van Eijk JT, Van RE, Stalenhoef PA, Kempen GI:Prevalence and correlates of fear of falling, and associated avoidance ofactivity in the general population of community-living older people.Age Ageing 2007, 36:304–309.
13. Schepens S, Ananda S, Painter JA, Murphy SL: Relationship between fall-relatedefficacy and activity engagement in community-dwelling older adults: ameta-analytic review. Am J Occup Ther 2012, 66:137–148.
14. Scheffer AC, Schuurmans MJ, van DN, van der Hooft T, de Rooij SE: Fear offalling: measurement strategy, prevalence, risk factors and consequencesamong older persons. Age Ageing 2008, 37:19–24.
15. Bruce DG, Devine A, Prince RL: Recreational physical activity levels inhealthy older women: the importance of fear of falling. J Am Geriatr Soc2002, 50:84–89.
16. Cumming RG, Salkeld G, Thomas M, Szonyi G: Prospective study of theimpact of fear of falling on activities of daily living, SF-36 scores, andnursing home admission. J Gerontol A Biol Sci Med Sci 2000, 55:M299–M305.
17. Deshpande N, Metter EJ, Lauretani F, Bandinelli S, Guralnik J, Ferrucci L:Activity restriction induced by fear of falling and objective andsubjective measures of physical function: a prospective cohort study.J Am Geriatr Soc 2008, 56:615–620.
18. Sherrington C, Whitney JC, Lord SR, Herbert RD, Cumming RG, Close JC:Effective exercise for the prevention of falls: a systematic review andmeta-analysis. J Am Geriatr Soc 2008, 56:2234–2243.
Jefferis et al. BMC Geriatrics 2014, 14:114 Page 9 of 9http://www.biomedcentral.com/1471-2318/14/114
19. Gill DP, Zou GY, Jones GR, Speechley M: Injurious falls are associated withlower household but higher recreational physical activities incommunity-dwelling older male veterans. Gerontology 2008, 54:106–115.
20. Choi L, Liu Z, Matthews C, Buchowski MS: Physical Activity: Process PhysicalActivity Accelerometer Data. [0.1-1]. Nashville, TN: Leena Choi; 2011.
21. Davis MG, Fox KR, Hillsdon M, Sharp DJ, Coulson JC, Thompson JL:Objectively measured physical activity in a diverse sample of olderurban UK adults. Med Sci Sports Exerc 2011, 43:647–654.
22. Copeland JL, Esliger DW: Accelerometer assessment of physical activity inactive, healthy older adults. J Aging Phys Act 2009, 17:17–30.
23. Harris TJ, Owen CG, Victor CR, Adams R, Cook DG: What factors areassociated with physical activity in older people, assessed objectively byaccelerometry? Br J Sports Med 2009, 43:442–450.
24. Ganz DA, Higashi T, Rubenstein LZ: Monitoring falls in cohort studies ofcommunity-dwelling older people: effect of the recall interval. J AmGeriatr Soc 2005, 53:2190–2194.
25. Resnick B, Jenkins LS: Testing the reliability and validity of the self-efficacyfor exercise scale. Nurs Res 2000, 49:154–159.
26. van Marwijk HW, Wallace P, de Bock GH, Hermans J, Kaptein AA, Mulder JD:Evaluation of the feasibility, reliability and diagnostic value of shortenedversions of the geriatric depression scale. Br J Gen Pract 1995, 45:195–199.
27. Luo N, Johnson JA, Shaw JW, Coons SJ: A comparison of EQ-5D indexscores derived from the US and UK population-based scoring functions.Med Decis Making 2007, 27:321–326.
28. Aguilar-Farias N, Brown WJ, Peeters GM: ActiGraph GT3X + cut-points foridentifying sedentary behaviour in older adults in free-living environments.J Sci Med Sport 2014, 17:293–299.
29. Clemes S, Connelly J, Konstantinidis T, Koivula R, Edwardson C, Yates T,Gorely T, Biddle S: Validity of the ActiGraph GT3X + inclinometer anddifferent counts per minute cut-points for the assessment of sedentarybehaviour. J Sci Med Sport 2013, 15:S68.
30. StataCorp: Statistical Software: Release 13. College Station, TX: StataCorp LP;2013.
31. Lachman ME, Howland J, Tennstedt S, Jette A, Assmann S, Peterson EW:Fear of falling and activity restriction: the survey of activities and fear offalling in the elderly (SAFE). J Gerontol B Psychol Sci Soc Sci 1998, 53:43–50.
32. Friedman SM, Munoz B, West SK, Rubin GS, Fried LP: Falls and fear offalling: which comes first? A longitudinal prediction model suggestsstrategies for primary and secondary prevention. J Am Geriatr Soc 2002,50:1329–1335.
33. Delbaere K, Close JCT, Brodaty H, Sachdev P, Lord SR: Determinants ofdisparities between perceived and physiological risk of falling amongelderly people: cohort study. Br Med J 2010, 341:c4165.
34. Jefferis BJ, Sartini C, Lee IM, Choi M, Amuzu A, Gutierrez C, Casas JP, Ash S,Lennnon LT, Wannamethee SG, Whincup PH: Adherence to physicalactivity guidelines in older adults, using objectively measured physicalactivity in a population-based study. BMC Public Health 2014, 14:382.
35. Gorman E, Hanson HM, Yang PH, Khan KM, Liu-Ambrose T, Ashe MC:Accelerometry analysis of physical activity and sedentary behavior inolder adults: a systematic review and data analysis. Eur Rev Aging PhysAct 2014, 11:35–49.
doi:10.1186/1471-2318-14-114Cite this article as: Jefferis et al.: How are falls and fear of fallingassociated with objectively measured physical activity in a cohort ofcommunity-dwelling older men?. BMC Geriatrics 2014 14:114.
Submit your next manuscript to BioMed Centraland take full advantage of:
• Convenient online submission
• Thorough peer review
• No space constraints or color figure charges
• Immediate publication on acceptance
• Inclusion in PubMed, CAS, Scopus and Google Scholar
• Research which is freely available for redistribution
Submit your manuscript at www.biomedcentral.com/submit