Overcoming the Fear of Free Falling: Monetary Policy Graduation in Emerging Markets
26
NBER WORKING PAPER SERIES OVERCOMING THE FEAR OF FREE FALLING: MONETARY POLICY GRADUATION IN EMERGING MARKETS Carlos A. Vegh Guillermo Vuletin Working Paper 18175 http://www.nber.org/papers/w18175 NATIONAL BUREAU OF ECONOMIC RESEARCH 1050 Massachusetts Avenue Cambridge, MA 02138 June 2012 This paper was prepared for a conference on "The role of Central Banks in financial stability: How has it changed?" organized by the Federal Reserve Bank of Chicago on November 10-11, 2011. We are grateful to Pablo Federico, Agustin Roitman, and conference participants for helpful comments and suggestions. The views expressed herein are those of the authors and do not necessarily reflect the views of the National Bureau of Economic Research. NBER working papers are circulated for discussion and comment purposes. They have not been peer- reviewed or been subject to the review by the NBER Board of Directors that accompanies official NBER publications. © 2012 by Carlos A. Vegh and Guillermo Vuletin. All rights reserved. Short sections of text, not to exceed two paragraphs, may be quoted without explicit permission provided that full credit, including © notice, is given to the source.
-
Upload
johnshopkins -
Category
Documents
-
view
5 -
download
0
Transcript of Overcoming the Fear of Free Falling: Monetary Policy Graduation in Emerging Markets
NBER WORKING PAPER SERIES
OVERCOMING THE FEAR OF FREE FALLING:MONETARY POLICY GRADUATION IN EMERGING MARKETS
Carlos A. VeghGuillermo Vuletin
Working Paper 18175http://www.nber.org/papers/w18175
NATIONAL BUREAU OF ECONOMIC RESEARCH1050 Massachusetts Avenue
Cambridge, MA 02138June 2012
This paper was prepared for a conference on "The role of Central Banks in financial stability: Howhas it changed?" organized by the Federal Reserve Bank of Chicago on November 10-11, 2011. Weare grateful to Pablo Federico, Agustin Roitman, and conference participants for helpful commentsand suggestions. The views expressed herein are those of the authors and do not necessarily reflectthe views of the National Bureau of Economic Research.
NBER working papers are circulated for discussion and comment purposes. They have not been peer-reviewed or been subject to the review by the NBER Board of Directors that accompanies officialNBER publications.
© 2012 by Carlos A. Vegh and Guillermo Vuletin. All rights reserved. Short sections of text, not toexceed two paragraphs, may be quoted without explicit permission provided that full credit, including© notice, is given to the source.

Overcoming the Fear of Free Falling: Monetary Policy Graduation in Emerging MarketsCarlos A. Vegh and Guillermo VuletinNBER Working Paper No. 18175June 2012JEL No. E52,F41
ABSTRACT
Developing countries have typically pursued procyclical macroeconomic policies, which tend to amplifythe underlying business cycle (the “when-it-rains-it-pours” phenomenon). There is, however, evidenceto suggest that about a third of developing countries have shifted from procyclical to countercyclicalfiscal policy over the last decade. We show that the same is true of monetary policy: around 35 percentof developing countries have become countercyclical over the last decade. We provide evidence thatlinks procyclical monetary policy in developing countries to what we refer as the “fear of free falling;”that is, the need to raise interest rates in bad times to defend the domestic currency.
Carlos A. VeghDepartment of EconomicsTydings Hall, Office 4118GUniversity of MarylandCollege Park, MD 20742-7211and [email protected]
Guillermo VuletinColby CollegeDepartment of EconomicsDiamond, 3rd floor5230 Mayflower HillWaterville, ME [email protected]

2
Introduction
As is well-documented by now, developing countries have traditionally pursued procyclical
fiscal policy.2 In other words, governments have tended to follow expansionary fiscal policy
during booms and contractionary fiscal policy in recessions, thus exacerbating the underlying
business cycle (the so-called “when it rains, it pours” phenomenon).
Figure 1 illustrates procyclical fiscal policy on the spending side, by plotting the cyclical
components of government spending and real GDP for 94 countries during the period 1960 to
2009.3 Black bars denote industrial countries while light bars indicate developing countries. The
visual impression is quite striking: while an overwhelming majority of light bars lie on the right
side of the picture, indicating a positive correlation or procyclical government spending in
developing countries, a majority of black bars lie on the left side, indicating a negative
correlation or countercyclical government spending in industrial countries.4 Explanations for this
puzzling behavior of fiscal policy in developing countries range from imperfect access to
international capital markets (Gavin and Perotti, 1997; Riascos and Vegh, 2003) to political
pressures for additional spending in good times (Talvi and Vegh, 2005; Alesina and Tabellini,
1990; Iltezki 2011).
Over the last decade, however, many emerging countries have managed to escape the fiscal
procyclicality trap and actually become countercyclical (see Frankel, Vegh, and Vuletin, 2011).
To illustrate this “graduation” phenomenon, Figure 2 repeats Figure 1 for the period 1960-1999,
2 See Kaminsky, Reinhart, and Vegh (2004) and the references therein. 3 Real government expenditure is defined as central government expenditure and net lending deflated by the GDP deflator. 4 The same is true on the taxation side. As shown in Vegh and Vuletin (2012), tax rate policy tends to be procyclical in developing countries and acyclical in industrial countries.

3
while Figure 3 focuses on the decade 2000-2009. While Figure 2 essentially conveys the same
message as Figure 1, Figure 3 shows an obvious shift of light bars from the right side of the
picture to the left. In fact, about a third of developing countries have graduated. Frankel, Vegh,
and Vuletin (2011) trace this dramatic shift in policy to improvements in institutional quality,
which are reflected in better fiscal institutions and policy rules that require the fiscal authority to
meet a certain target for the cyclically-adjusted primary balance (Frankel 2011). This ensures
that countries will save in good times and hence be able to dissave in bad times.
While a great deal of attention has been paid to the cyclical properties of fiscal policy, relatively
little attention has been devoted to monetary policy. In particular, there has been no attempt, as
far as we know, to examine whether the graduation phenomenon alluded to above is also present
for monetary policy. Our aim in this paper is thus to (i) document the extent of monetary policy
procyclicality in developing countries relative to industrial countries and (ii) assess how many
countries have graduated, if any, over the last decade. In fact, we will show that 40 percent of
developing countries in our sample have, on average, pursued procyclical monetary policy over
the last 50 years. In sharp contrast, every single industrial country has followed countercyclical
monetary policy over the same period. Over the last decade, however, around 35 percent of
developing countries have graduated.
We trace this graduation from monetary policy procyclicality to the fact that many emerging
markets have overcome what we call the “fear of free falling.” In the past – and this is still true,
of course, of many developing countries – the depreciation of the domestic currency during bad
times (typically characterized by large capital outflows) would force policymakers to raise

4
interest rates to defend the currency. The fear was (is) that a rapidly depreciating currency would
plunge the economy into a deeper crisis by encouraging further capital outflows and leading to
widespread bankruptcy of firms indebted in dollar terms. The need to raise interest rates to
defend the currency would preclude the possibility of using monetary policy to spur the
economy, as in industrial countries. As many emerging markets have matured – by undertaking
market-friendly reforms and pursuing sounder macroeconomic management – this fear of free
falling has subsided, or disappear altogether, thus allowing policymakers to free policy rates for
countercyclical purposes.
The paper proceeds as follows. We first document the shift in the cyclical behavior of monetary
policy over the last decade in the developing world. We then show empirically how this
graduation process is tightly linked to developing countries overcoming the fear of free falling.
Final thoughts close the paper.
Graduating class
This section documents the shift in the cyclical behavior of monetary policy over the last
decade in the developing world. To set the stage, Figure 4 plots the cyclical component of
short-term interest rates and real GDP for 68 countries for the period 1960-2009.5 As can be
seen, every single dark bar lies on the left side of the figure, indicating that all industrial
countries have pursued, on average, countercyclical monetary policy (i.e., higher interest rates in
good times). In contrast, 40 percent of light bars (developing countries) lie on the right side,
5 We take short-term interest rates as a proxy for the stance of monetary policy. In some cases, we have data for overnight interbank interest rates, such as the Federal Funds rate in the United States. In most cases, however, we rely on discount rates due to their longer availability. Conceptually, any standard open economy model with imperfect asset substitution would allow monetary authorities to use the interest rate as a policy instrument (see, for instance, Calvo and Vegh, 1995, and Flood and Jeanne, 2005)

5
indicating procyclical monetary policy (i.e., lower interest rates in good times). In fact, the
average correlation for developing countries is 0.05 percent, compared to 0.41 for industrial
countries.
How is monetary policy cyclicality related to fiscal policy cyclicality? Not surprisingly, Figure 5
shows that fiscal and monetary policy cyclicality are strongly related. All countries pursuing
procyclical monetary policy (i.e., Corr(cycle i, cycle RGDP) < 0) have also followed procyclical
fiscal policy (i.e., Corr(cycle RG, cycle RGDP) > 0). Moreover, countries that tend to be more
countercyclical in monetary policy are also less procyclical when it comes to fiscal policy. Given
the close relation between the cyclicality of monetary and fiscal policy – and based on the
findings in Frankel, Vegh, Vuletin (2011) regarding fiscal policy graduation – we would expect
many developing countries to have also graduated from monetary policy procyclicality.
To address the issue of monetary policy graduation, we divide the 1960-2009 sample used in
Figure 4 into two sub-samples: 1960-1999 and 2000-2009. Figure 6 replicates Figure 4 for the
period 1960-1999 and conveys essentially the same message. Figure 7, on the other hand,
focuses on the period 2000-2009. Once again, the visual image conveyed by Figure 7 is striking
when compared to Figure 6. Specifically, the number of light bars on the left-side of the picture
(i.e., positive correlations) has greatly increased. Around 77 percent of developing countries (36
out of 47) now show countercyclical monetary policy, up from 49 percent (23 out of 47) in
Figure 6. Moreover, the average correlation between the cyclical components of short-term
interest rates and real GDP in developing countries has increased from -0.02 for the period 1960-
6
1999 (indicating acyclical monetary policy on average) to 0.28 since the year 2000 (indicating
countercyclical monetary policy).
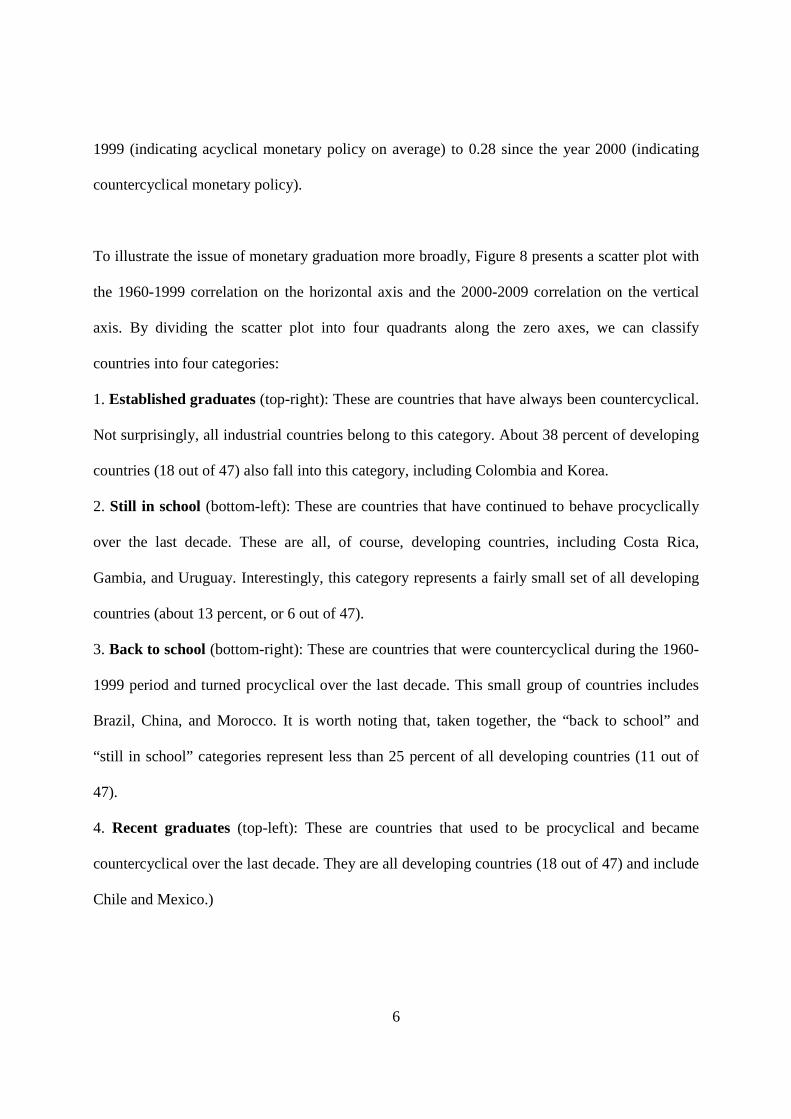
To illustrate the issue of monetary graduation more broadly, Figure 8 presents a scatter plot with
the 1960-1999 correlation on the horizontal axis and the 2000-2009 correlation on the vertical
axis. By dividing the scatter plot into four quadrants along the zero axes, we can classify
countries into four categories:
1. Established graduates (top-right): These are countries that have always been countercyclical.
Not surprisingly, all industrial countries belong to this category. About 38 percent of developing
countries (18 out of 47) also fall into this category, including Colombia and Korea.
2. Still in school (bottom-left): These are countries that have continued to behave procyclically
over the last decade. These are all, of course, developing countries, including Costa Rica,
Gambia, and Uruguay. Interestingly, this category represents a fairly small set of all developing
countries (about 13 percent, or 6 out of 47).
3. Back to school (bottom-right): These are countries that were countercyclical during the 1960-
1999 period and turned procyclical over the last decade. This small group of countries includes
Brazil, China, and Morocco. It is worth noting that, taken together, the “back to school” and
“still in school” categories represent less than 25 percent of all developing countries (11 out of
47).
4. Recent graduates (top-left): These are countries that used to be procyclical and became
countercyclical over the last decade. They are all developing countries (18 out of 47) and include
Chile and Mexico.)

7
In sum, the evidence suggests that more than a third of the developing world (18 out of 47
countries) has recently "graduated" from monetary policy procyclicality. As a result, about 77
percent (36 out of 47) of developing countries have followed countercyclical monetary policy
over the last decade.
Graduation and "fear of free falling."
What explains the ability of some developing countries to escape the procyclical monetary policy
trap? While there is no doubt that many factors come into play, we believe that a critical channel
is the following. In emerging economies, recessions are often associated with capital outflows
(and, in fact, are sometimes caused by sudden reversals of capital inflows, the so-called “sudden
stops” phenomenon; see Calvo, 1998). This capital outflow triggers a steep depreciation of the
domestic currency, which forces the Central Bank to raise interest rates to defend the currency.6
We refer to this monetary policy reaction as "fear of free falling" (FFF) and we measure it by
computing the correlation between the cyclical component of the short-term interest rate and the
rate of depreciation of the exchange rate.7 Specifically, a positive correlation indicates that the
short-term policy rate increases when the domestic currency is depreciating, indicating the
6 The need to defend the domestic currency in bad times is best exemplified by IMF advice during the 1997 Asian crisis. To quote Stanley Fischer (at the time, the First Deputy Managing Director), “[i]n weighing [the question of whether programs were too tough], it is important to recall that when they approached the IMF, the reserves of Thailand and Korea were perilously low, and the Indonesian rupiah was excessively depreciated. Thus, the first order of business was, and still is, to restore confidence in the currency. To achieve this, countries have to make it more attractive to hold domestic currency, which, in turn, requires increasing interest rates temporarily, even if higher interest costs complicate the situation of weak banks and corporations. This is a key lesson of the tequila crisis in Latin America 1994-95, as well as from the more recent experience of Brazil, the Czech Republic, Hong Kong and Russia, all of which have fended off attacks on their currencies in recent months with a timely and forceful tightening of interest rates along with other supporting policy measures. Once confidence is restored, interest rates can return to more normal levels.” 7 We borrow the expression “free falling,” of course, from Reinhart and Rogoff ‘s (2004) well-known exchange rate regime classification.
8
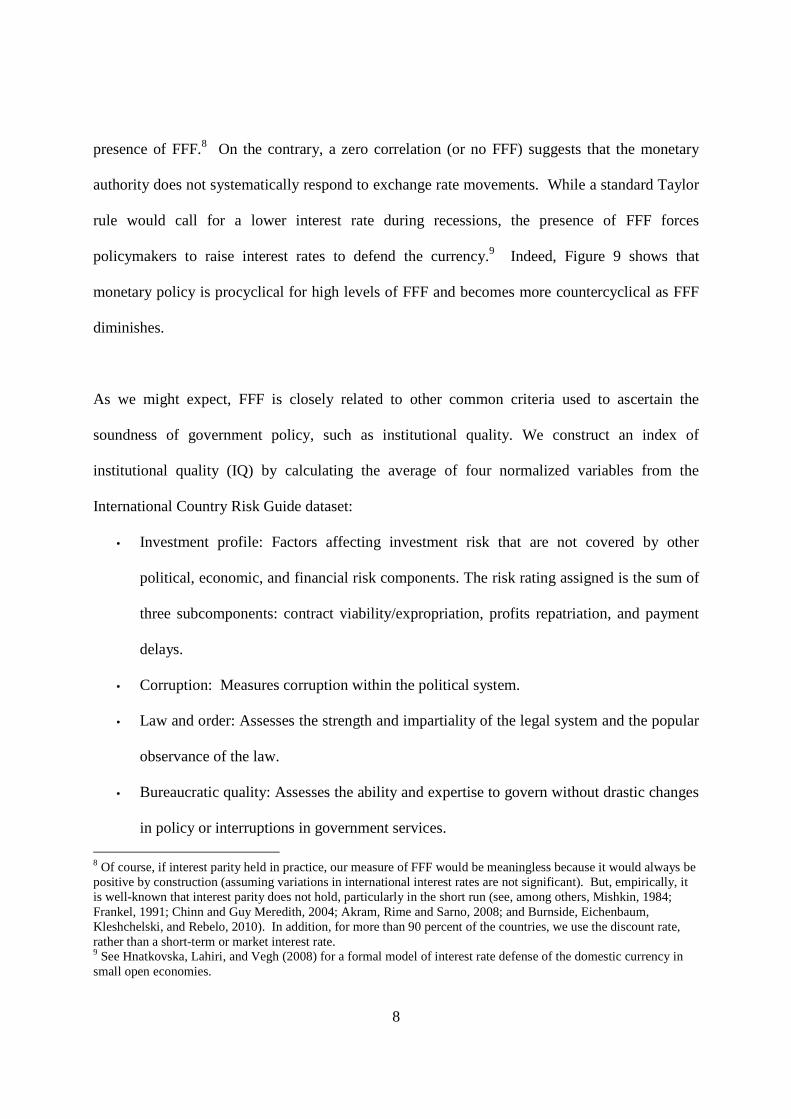
presence of FFF.8 On the contrary, a zero correlation (or no FFF) suggests that the monetary
authority does not systematically respond to exchange rate movements. While a standard Taylor
rule would call for a lower interest rate during recessions, the presence of FFF forces
policymakers to raise interest rates to defend the currency.9 Indeed, Figure 9 shows that
monetary policy is procyclical for high levels of FFF and becomes more countercyclical as FFF
diminishes.
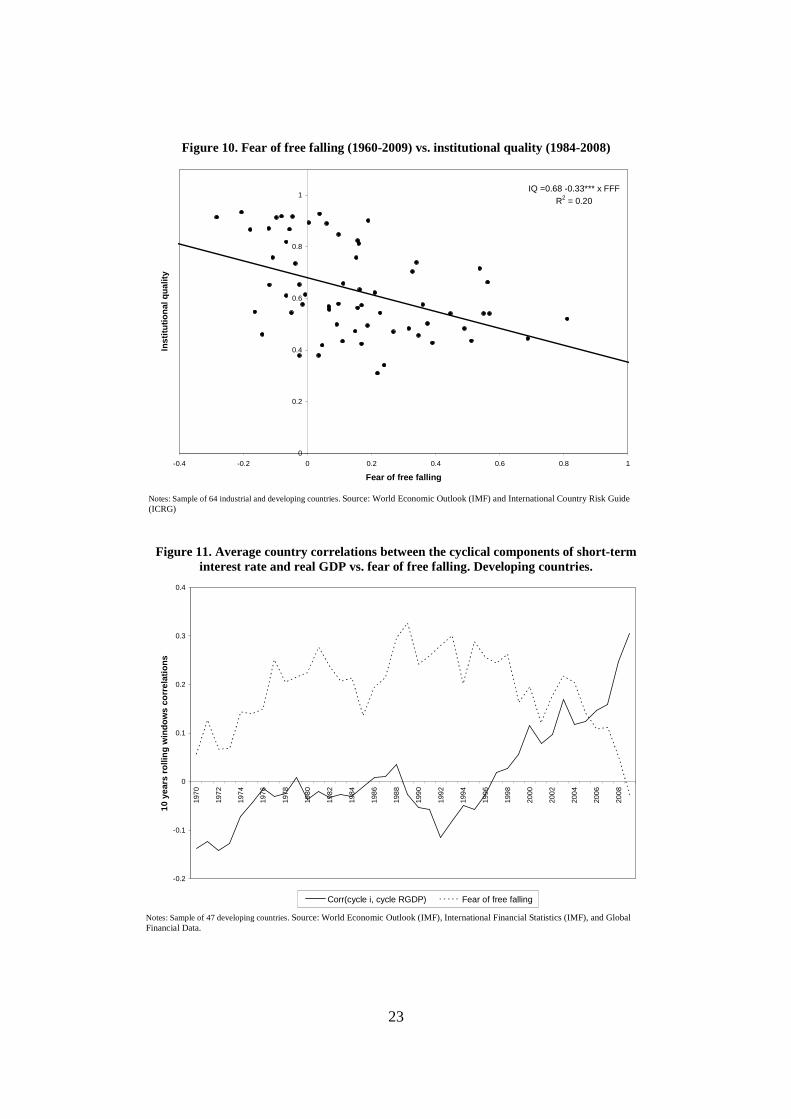
As we might expect, FFF is closely related to other common criteria used to ascertain the
soundness of government policy, such as institutional quality. We construct an index of
institutional quality (IQ) by calculating the average of four normalized variables from the
International Country Risk Guide dataset:
• Investment profile: Factors affecting investment risk that are not covered by other
political, economic, and financial risk components. The risk rating assigned is the sum of
three subcomponents: contract viability/expropriation, profits repatriation, and payment
delays.
• Corruption: Measures corruption within the political system.
• Law and order: Assesses the strength and impartiality of the legal system and the popular
observance of the law.
• Bureaucratic quality: Assesses the ability and expertise to govern without drastic changes
in policy or interruptions in government services.
8 Of course, if interest parity held in practice, our measure of FFF would be meaningless because it would always be positive by construction (assuming variations in international interest rates are not significant). But, empirically, it is well-known that interest parity does not hold, particularly in the short run (see, among others, Mishkin, 1984; Frankel, 1991; Chinn and Guy Meredith, 2004; Akram, Rime and Sarno, 2008; and Burnside, Eichenbaum, Kleshchelski, and Rebelo, 2010). In addition, for more than 90 percent of the countries, we use the discount rate, rather than a short-term or market interest rate. 9 See Hnatkovska, Lahiri, and Vegh (2008) for a formal model of interest rate defense of the domestic currency in small open economies.
9
The IQ index ranges from 0 (lowest institutional quality) to 1 (highest institutional quality).
Figure 10 shows that higher (lower) IQ is associated with lower (higher) FFF. Moreover, Figure
11 shows that in developing countries FFF diminishes over time as countercyclicality of
monetary policies increases.
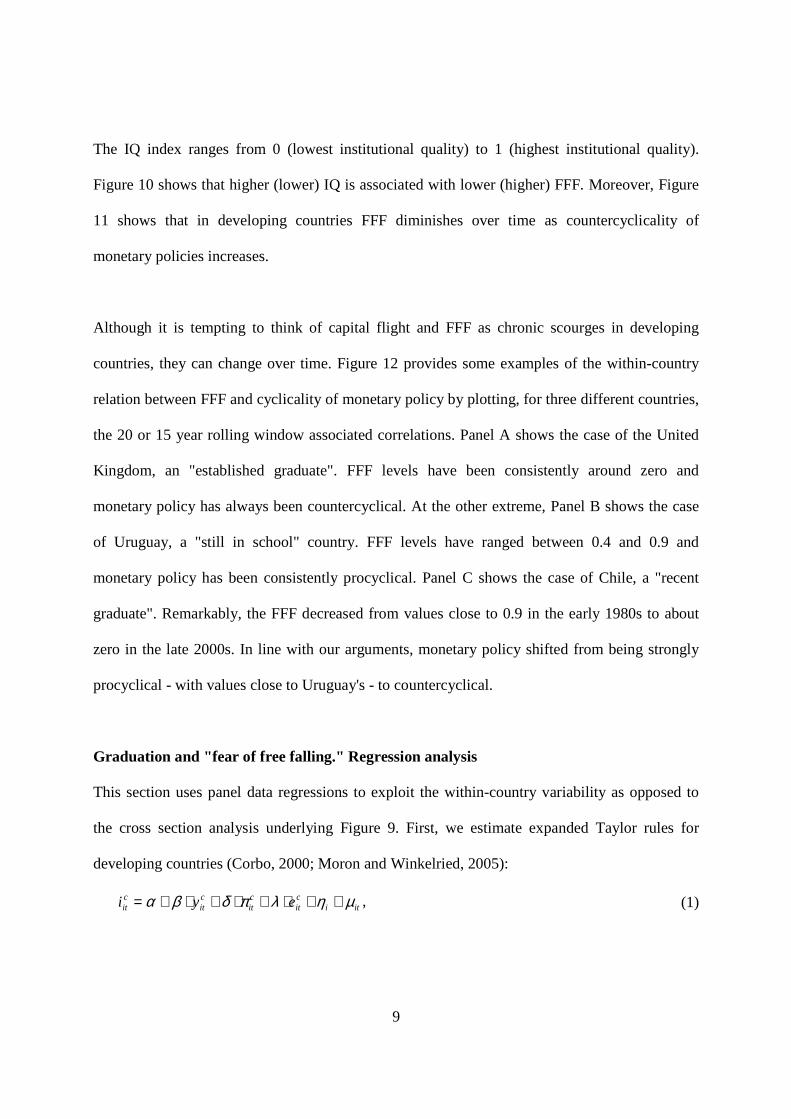
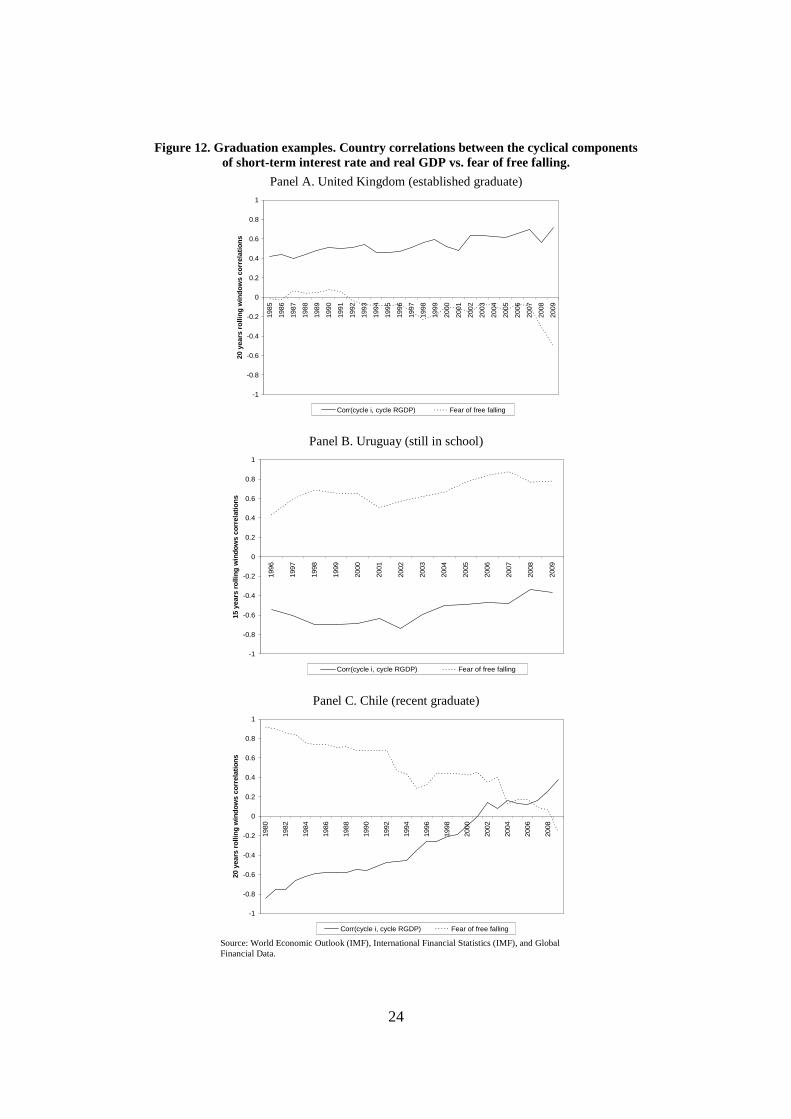
Although it is tempting to think of capital flight and FFF as chronic scourges in developing
countries, they can change over time. Figure 12 provides some examples of the within-country
relation between FFF and cyclicality of monetary policy by plotting, for three different countries,
the 20 or 15 year rolling window associated correlations. Panel A shows the case of the United
Kingdom, an "established graduate". FFF levels have been consistently around zero and
monetary policy has always been countercyclical. At the other extreme, Panel B shows the case
of Uruguay, a "still in school" country. FFF levels have ranged between 0.4 and 0.9 and
monetary policy has been consistently procyclical. Panel C shows the case of Chile, a "recent
graduate". Remarkably, the FFF decreased from values close to 0.9 in the early 1980s to about
zero in the late 2000s. In line with our arguments, monetary policy shifted from being strongly
procyclical - with values close to Uruguay's - to countercyclical.
Graduation and "fear of free falling." Regression analysis
This section uses panel data regressions to exploit the within-country variability as opposed to
the cross section analysis underlying Figure 9. First, we estimate expanded Taylor rules for
developing countries (Corbo, 2000; Moron and Winkelried, 2005):
iticit
cit
cit
cit eyi µηλπδβα ++⋅+⋅+⋅+= , (1)

10
where citi , c
ity , citπ , and c
ite are the cyclical components of the short-term interest rate, real GDP,
inflation, and exchange rate depreciation, respectively. In addition, we will interact FFF with the
output cycle to evaluate whether the FFF alters the way in which monetary policy responds to
business cycle fluctuations.10 Specifically, we estimate:
( ) itiitcitit
cit
cit
cit
cit FFFyFFFeyi µηφγλπδβα ++⋅+×⋅+⋅+⋅+⋅+= . (2)
In line with our findings from Figure 9, we expect γ to be negative. This would confirm that
interest rates respond more countercyclicaly as FFF diminishes.
Table 1 shows all panel country-fixed-effects regressions. Columns 1, 2, and 3 estimate the
effect of each regressor in regression (1) one-at-a-time. Panel A shows the results for all
countries in the sample, which support Taylor rules implications. In particular, Column 1 shows
that, during good (bad) times interest rate increases (decreases), indicating that monetary policy
is countercyclical. Columns 2 and 3 support the notion that the interest rate is positively related
to inflation and depreciation shocks.
In line with our earlier correlation-based analysis, monetary policy is countercyclical in
industrial economies (Panel B, column 1) and seems to be acyclical in developing countries
(Panel C, column 1). These results continue to hold when we include macroeconomic
determinants of interest rate policy two-at-a-time or all together (Columns 4 to 7).
10 FFF is constructed using the 10-year rolling window correlation between the cyclical component of the short-term interest rate and the rate of depreciation of the exchange rate.

11
Columns 8 to 10 estimate different versions of regression (2); column 8 excludes cite , column 9
leaves citπ off, and column 10 includes all regressors. In all cases, the interaction term γ has a
negative sign, as expected. However, it is not statistically significant for industrial countries;
supporting the idea that FFF is not an important issue in those cases. In sharp contrast, FFF
appears to be critical for developing countries. First, the interaction term between FFF and real
GDP cycle is negative, which gives empirical support to the arguments laid out in the previous
section. Second, including FFF makes it possible to recover the Taylor rule prediction between
monetary policy and business cycle. Indeed, as shown in Panel C, columns 8, 9, and 10, once
FFF is included, the coefficient on RGDP cycle becomes positive.
We thus conclude from the empirical analysis that, when FFF is not an issue, monetary policy is
countercyclical because the traditional monetary policy reaction dominates. However, as FFF
increases, policymakers’ concerns regarding sharp depreciations during recessions become more
relevant. Eventually, for high levels of FFF, this new suggested channel dominates the traditional
one and monetary policy becomes procyclical.
Conclusions
We have documented the fact that, over the last decade, more than a third of developing
countries have graduated from monetary policy procyclicality and become countercyclical. We
have argued that a critical factor in achieving this important policy shift has been overcoming the
fear of free falling; that is, the need to defend a rapidly depreciating currency in bad times. This
frees the policy rate for countercyclical purposes.

12
References
Akram, Q. Farooq, Dagfinn Rime, and Lucio Sarno, 2008, "Arbitrage in the foreign exchange market: Turning on the microscope," Journal of International Economics, Vol. 76, pp. 237-253.
Alesina, Alberto and Guido Tabellini, 1990, "A positive theory of fiscal deficits and government debt," Review of Economic Studies, Vol. 57, pp. 403-414.
Burnside, Craig, Martin Eichenbaum, Isaac Kleshchelski, and Sergio Rebelo, 2010, "Carry trade and momentum in currency markets," (mimeo, Duke University and Northwestern University).
Calvo, Guillermo A., and Carlos A. Vegh, 1995, "Fighting inflation with high interest rates: The small open economy case under flexible prices," Journal of Money, Credit and Banking, Vol. 27, pp. 49-66.
Corbo, Vittorio, 2000, "Monetary policy in Latin America," Central Bank of Chile Working Paper No. 78.
Flood, Robert and Olivier Jeanne, 2005, "An interest rate defense of a fixed exchange rate?" Journal of International Economics, Vol. 66, pp. 471-484.
Frankel, Jeffrey, 1991, "Quantifying international capital mobility in the 1980s," in National Saving and Economic Performance, University of Chicago Press.
Frankel, Jeffrey, 2011, "A solution to fiscal procyclicality: The structural budget institutions pioneered by Chile," forthcoming, Fiscal Policy and Macroeconomic Performance, edited by Luis Felipe Céspedes and Jordi Galí (Central Bank of Chile). NBER Working Paper No. 16945.
Frankel, Jeffrey A., Carlos A. Vegh , and Guillermo Vuletin, 2011, "On graduation from fiscal procyclicality," NBER Working Paper No. 17619.
Fischer, Stanley (1998), "The IMF and the Asian crisis," http://www.imf.org/external/np/ speeches/1998/032098.HTM
Gavin, Michael, and Roberto Perotti, 1997, "Fiscal policy in Latin America," NBER Macroeconomics Annual, Vol. 12, pp. 11-61.
Hnatkovska, Viktoria, Amartya Lahiri, and Carlos Vegh, 2008, “Interest rates and the exchange rate: A non-monotonic tale,” NBER Working Paper No. 13925.
Ilzetzki, Ethan, 2011, "Rent-seeking distortions and fiscal procyclicality," Journal of Development Economics, Vol. 96, pp. 30-46.
Kaminsky, Graciela, Carmen M. Reinhart, and Carlos A. Vegh , 2004, "When it rains, it pours: Procyclical capital flows and macroeconomic policies," NBER Macroeconomics Annual, Vol. 19, pp. 11-82.
Chinn, Menzie and Guy Meredith, 2004, "Monetary policy and long-horizon uncovered interest parity," IMF Staff Papers, Vol. 51, pp. 409-430.
Mishkin, Frederic, 1984, "Are real interest rates equal across countries? An empirical investigation of international parity conditions," Journal of Finance, Vol. 39, pp.1345- 1357.

13
Moron, Eduardo and Diego Winkelried, 2005, "Monetary policy rules for financially vulnerable economies," Journal of Development Economics, Vol. 76, pp. 23-51.
Riascos, Alvaro and Carlos A. Vegh, 2003, "Procyclical government spending in developing countries: The role of capital market imperfections." (mimeo, UCLA and Banco Republica, Colombia).
Vegh, Carlos A., and Guillermo Vuletin, 2012, "How is tax policy conducted over the business cycle?," NBER Working Paper No. 17753.
Talvi, Ernesto, and Carlos A. Vegh, 2005, "Tax base variability and procyclicality of fiscal policy," Journal of Development Economics, Vol. 78, No. 1, pp. 156-190.
Reinhart, Carmen M. and Kenneth Rogoff, 2004, "The modern history of exchange rate arrangements: A reinterpretation," Quarterly Journal of Economics, Vol. 119, pp. 1-48.
14
Appendix 1. Definition of variables and sources
Gross Domestic Product World Economic Outlook (WEO-IMF) and International Financial Statistics (IFS-IMF) were the main data sources. Series NGDP (gross domestic product, current prices) for WEO and 99B for IFS-IMF. For Azerbaijan, Bahrain, Kuwait, Libya, Qatar, and United Arab Emirates data were provided by Middle East Department at the IMF. Data period covers 1960-2009.
GDP deflator World Economic Outlook (WEO-IMF) and International Financial Statistics (IFS-IMF) were the main data sources. Series NGDP_D (gross domestic product deflator) for WEO-IMF and 99BIP for IFS-IMF. For Azerbaijan, Bahrain, Kuwait, Libya, Qatar, and United Arab Emirates data were provided by Middle East Department at the IMF. Data period covers 1960-2009.
Consumer price index World Economic Outlook (WEO-IMF) and International Financial Statistics (IFS-IMF) were the main data sources. Series PCPI (consumer price index) for WEO-IMF and 64 for IFS-IMF. For Azerbaijan and Kuwait data were taken from Global Financial Data (GFD). Data period covers 1960-2009.
Short-term interest rate Global financial data was the main data source. For the following countries, the short-term interest rate used is the discount window interest rate: Algeria, Argentina, Austria, Bangladesh, Barbados, Belgium, Bolivia, Botswana, Brazil, Bulgaria, Canada, Chile, China, Colombia, Costa Rica, Cyprus, Czech Rep., Denmark, Egypt, Fiji, Finland, France, Gambia, Germany, Ghana, Greece, India, Ireland, Israel, Italy, Japan, Jordan, Kenya, Korea, Kuwait, Malaysia, Mauritius, Mexico, Morocco, Nepal, Netherlands, Nigeria, Norway, Pakistan, Paraguay, Peru, Philippines, Portugal, Rwanda, South Africa, Spain, Sri Lanka, Swaziland, Switzerland, Tanzania, Trinidad and Tobago, Tunisia, Turkey, Uganda, United States, Uruguay, Venezuela, and Zambia. For Australia we used the Australia Reserve Bank overnight cash rate. For New Zealand we used the New Zealand Reserve Bank official cash rate. For Sweden we used the Sweden Riksbank repo rate. For Thailand we used the discount window as well as the repo rate. For the United Kingdom we used the Bank of England base lending rate. Data period covers 1960-2009.
Official exchange rate World Economic Outlook (WEO-IMF) was the main data source. Series ENDA (exchange rate, national currency per U.S. Dollar). For the United States we use the Dollar per Euro exchange rate. Data period covers 1960-2009.
Institutional quality International Country Risk Guide (ICRG) was the source of data. Institutional quality is a normalized index that ranges between 0 (lowest institutional quality) and 1 (highest institutional quality). The index was calculated by the authors as the average of four components: investment profile, corruption, law and order, bureaucracy quality. Data period covers 1984-2008.
15
Appendix 2. Countries in the sample
TABLE 1A
Countries in the tax sample
Australia Algeria KuwaitAustria Argentina MalaysiaBelgium Bangladesh MauritiusCanada Barbados MexicoDenmark Bolivia MoroccoFinland Botswana NepalFrance Brazil NigeriaGermany Bulgaria PakistanGreece Chile ParaguayIreland China PeruItaly Colombia PhilippinesJapan Costa Rica RwandaNetherlands Cyprus South AfricaNew Zealand Czech Rep. Sri LankaNorway Egypt SwazilandPortugal Fiji TanzaniaSpain Gambia ThailandSweden Ghana Trinidad and TobagoSwitzerland India TunisiaUnited Kingdom Israel TurkeyUnited States Jordan Uganda
Kenya UruguayKorea Venezuela
Zambia
Industrial countries (21) Developing countries (47)
Notes: Total number of countries is 68.
16
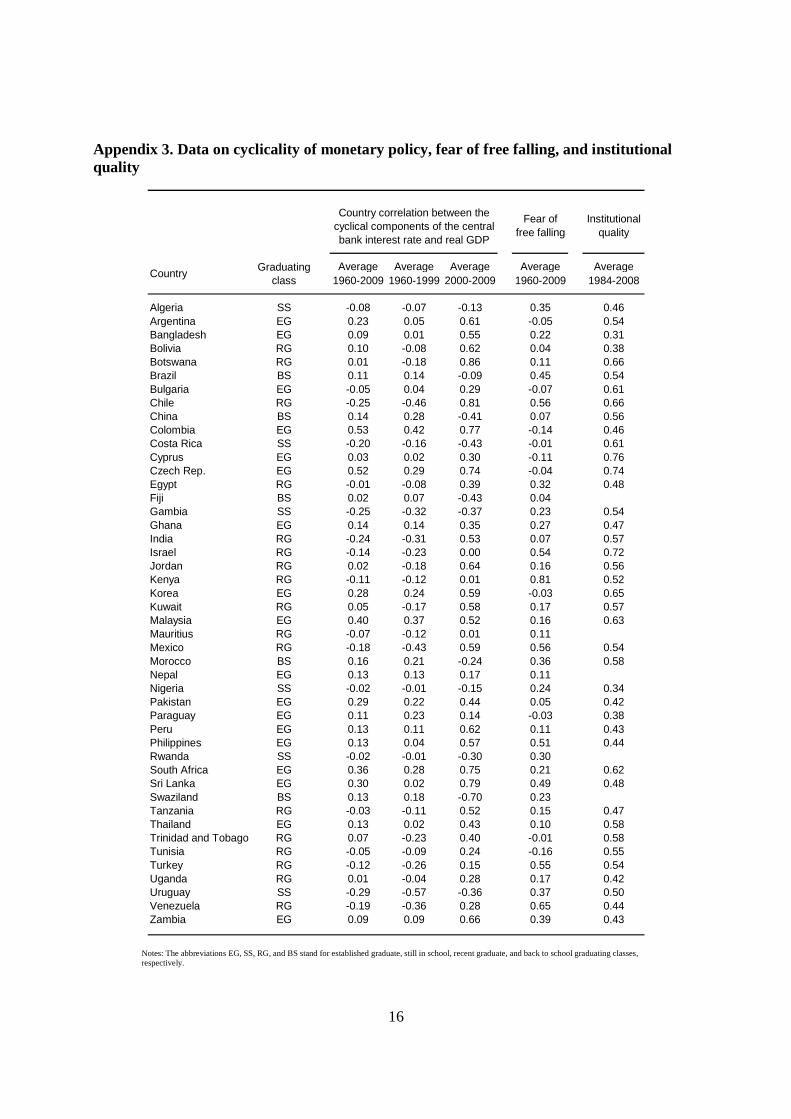
Appendix 3. Data on cyclicality of monetary policy, fear of free falling, and institutional quality
Fear of free falling
Institutional quality
Average Average Average Average Average1960-2009 1960-1999 2000-2009 1960-2009 1984-2008
Algeria SS -0.08 -0.07 -0.13 0.35 0.46Argentina EG 0.23 0.05 0.61 -0.05 0.54Bangladesh EG 0.09 0.01 0.55 0.22 0.31Bolivia RG 0.10 -0.08 0.62 0.04 0.38Botswana RG 0.01 -0.18 0.86 0.11 0.66Brazil BS 0.11 0.14 -0.09 0.45 0.54Bulgaria EG -0.05 0.04 0.29 -0.07 0.61Chile RG -0.25 -0.46 0.81 0.56 0.66China BS 0.14 0.28 -0.41 0.07 0.56Colombia EG 0.53 0.42 0.77 -0.14 0.46Costa Rica SS -0.20 -0.16 -0.43 -0.01 0.61Cyprus EG 0.03 0.02 0.30 -0.11 0.76Czech Rep. EG 0.52 0.29 0.74 -0.04 0.74Egypt RG -0.01 -0.08 0.39 0.32 0.48Fiji BS 0.02 0.07 -0.43 0.04Gambia SS -0.25 -0.32 -0.37 0.23 0.54Ghana EG 0.14 0.14 0.35 0.27 0.47India RG -0.24 -0.31 0.53 0.07 0.57Israel RG -0.14 -0.23 0.00 0.54 0.72Jordan RG 0.02 -0.18 0.64 0.16 0.56Kenya RG -0.11 -0.12 0.01 0.81 0.52Korea EG 0.28 0.24 0.59 -0.03 0.65Kuwait RG 0.05 -0.17 0.58 0.17 0.57Malaysia EG 0.40 0.37 0.52 0.16 0.63Mauritius RG -0.07 -0.12 0.01 0.11Mexico RG -0.18 -0.43 0.59 0.56 0.54Morocco BS 0.16 0.21 -0.24 0.36 0.58Nepal EG 0.13 0.13 0.17 0.11Nigeria SS -0.02 -0.01 -0.15 0.24 0.34Pakistan EG 0.29 0.22 0.44 0.05 0.42Paraguay EG 0.11 0.23 0.14 -0.03 0.38Peru EG 0.13 0.11 0.62 0.11 0.43Philippines EG 0.13 0.04 0.57 0.51 0.44Rwanda SS -0.02 -0.01 -0.30 0.30South Africa EG 0.36 0.28 0.75 0.21 0.62Sri Lanka EG 0.30 0.02 0.79 0.49 0.48Swaziland BS 0.13 0.18 -0.70 0.23Tanzania RG -0.03 -0.11 0.52 0.15 0.47Thailand EG 0.13 0.02 0.43 0.10 0.58Trinidad and Tobago RG 0.07 -0.23 0.40 -0.01 0.58Tunisia RG -0.05 -0.09 0.24 -0.16 0.55Turkey RG -0.12 -0.26 0.15 0.55 0.54Uganda RG 0.01 -0.04 0.28 0.17 0.42Uruguay SS -0.29 -0.57 -0.36 0.37 0.50Venezuela RG -0.19 -0.36 0.28 0.65 0.44Zambia EG 0.09 0.09 0.66 0.39 0.43
Country correlation between the cyclical components of the central bank interest rate and real GDP
CountryGraduating
class
Notes: The abbreviations EG, SS, RG, and BS stand for established graduate, still in school, recent graduate, and back to school graduating classes, respectively.

17
Figure 1. Country correlations between the cyclical components of the real government spending and real GDP. 1960-2009
Sw
itzer
land
Uni
ted
Kin
gdom A
ustr
alia
Fra
nce
Aus
tria
Uni
ted
Sta
tes
Jam
aica S
pain
Japa
nC
anad
aG
reec
eS
udan
Con
go, D
em. R
ep. o
fB
elgi
um Italy
Irel
and
Kor
eaD
enm
ark
Net
herla
nds
Yem
enU
nite
d A
rab
Em
irate
sN
orw
ayLi
bya
Col
ombi
aU
gand
aN
ew Z
eala
ndK
uwai
tE
l Sal
vado
r
Sou
th A
fric
aS
ri La
nka
Tur
key
Bra
zil
Pan
ama
Gam
bia
Zam
bia
Ger
man
yB
oliv
iaC
hile
Mex
ico
Hon
dura
sE
gypt
Tha
iland
Indi
aT
anza
nia
Arg
entin
aE
cuad
orM
ozam
biqu
e
Chi
naH
ong
Kon
gB
ahra
inU
rugu
ayIn
done
sia
Ang
ola
Jord
anC
ongo
, Rep
. of
Hai
tiA
lger
iaP
akis
tan
Mal
aysi
aN
iger
iaM
oroc
coG
hana
Ven
ezue
laP
ortu
gal
Mad
agas
car
Sen
egal
Tun
isia
Gua
tem
ala
Tog
oN
icar
agua
Ken
yaP
arag
uay
Phi
lippi
nes
Iran Dom
inic
an R
ep.
Côt
e d'
Ivoi
reM
ali
Ban
glad
esh
Sau
di A
rabi
aN
iger
Mya
nmar
Sie
rra
Leon
eP
eru
Qat
arG
abon
Om
an Syr
ian
Ara
b R
ep.
Trin
idad
and
Tob
ago
Cam
eroo
nB
otsw
ana
Aze
rbai
jan
Fin
land
Cos
ta R
ica
Sw
eden
-1
-0.8
-0.6
-0.4
-0.2
0
0.2
0.4
0.6
0.8
1
Co
rr(c
ycle
RG
, cyc
le R
GD
P)
Notes: Dark bars are industrial countries and light ones are developing countries. The cyclical components have been estimated using the Hodrick-Prescott filter. A positive (negative) correlation indicates procyclical (countercyclical) fiscal policy. Source: Frankel, Vegh, and Vuletin (2011).
Figure 2. Country correlations between the cyclical components
of the real government spending and real GDP. 1960-1999
Sw
itzer
land
Fin
land
Uni
ted
Kin
gdom Fra
nce
Aus
tral
iaA
ustr
iaJa
mai
caS
wed
enC
ongo
, Dem
. Rep
. of
Gre
ece
Sud
anU
nite
d S
tate
sK
uwai
tS
pain
Japa
nB
elgi
umC
anad
aIta
lyY
emen
Den
mar
kN
ethe
rland
sK
orea
Irel
and
Col
ombi
aS
ri La
nka
New
Zea
land
El S
alva
dor
Uga
nda
Uni
ted
Ara
b E
mira
tes
Pan
ama
Tan
zani
aM
exic
oIn
dia
Gam
bia
Ang
ola
Bra
zil
Chi
naN
orw
ayZ
ambi
aT
haila
ndH
ondu
ras
Egy
ptB
oliv
iaM
ozam
biqu
eE
cuad
orC
hile
Uru
guay
Jord
anA
rgen
tina
Ger
man
yH
aiti
Con
go, R
ep. o
fC
osta
Ric
aP
akis
tan
Indo
nesi
aV
enez
uela
Hon
g K
ong
Gha
naLi
bya
Sen
egal
Mor
occo
Tur
key
Ken
yaM
alay
sia
Tun
isia
Por
tuga
lA
lger
iaN
icar
agua
Gua
tem
ala
Tog
oM
adag
asca
rP
hilip
pine
sIr
an Dom
inic
an R
ep.
Qat
arN
iger
iaB
angl
ades
hC
ôte
d'Iv
oire
Mal
iB
ahra
inP
arag
uay
Mya
nmar
Nig
erP
eru
Sau
di A
rabi
aG
abon
Sie
rra
Leon
eO
man
Trin
idad
and
Tob
ago
Syr
ian
Ara
b R
ep.
Cam
eroo
n Bot
swan
aA
zerb
aija
n
Sou
th A
fric
a
-1
-0.8
-0.6
-0.4
-0.2
0
0.2
0.4
0.6
0.8
1
Co
rr(c
ycle
RG
, cyc
le R
GD
P)
Notes: Dark bars are industrial countries and light ones are developing countries. The cyclical components have been estimated using the Hodrick-Prescott filter. A positive (negative) correlation indicates procyclical (countercyclical) fiscal policy. Source: Frankel, Vegh, and Vuletin (2011).

18
Figure 3. Country correlations between the cyclical components of the real government spending and real GDP. 2000-2009
Nor
way
Bol
ivia
Can
ada
Aus
tral
iaN
iger
iaM
alay
sia
Tur
key
Cos
ta R
ica Chi
leS
audi
Ara
bia
Spa
inA
lger
iaJa
pan
Fin
land
Kor
eaH
ong
Kon
gU
nite
d K
ingd
om Zam
bia
Syr
ian
Ara
b R
ep.
Ger
man
yIr
elan
dB
otsw
ana
Den
mar
k Liby
aIn
done
sia
Aus
tria
Net
herla
nds
Phi
lippi
nes
Bel
gium
Côt
e d'
Ivoi
reP
arag
uay
Italy
Uni
ted
Ara
b E
mira
tes
Bah
rain
Yem
enM
oroc
co Om
anE
l Sal
vado
rU
gand
aA
rgen
tina
Egy
ptC
amer
oon
Fra
nce E
cuad
orP
ortu
gal
Col
ombi
aS
udan
Gam
bia
Hon
dura
sS
witz
erla
ndG
reec
eM
ozam
biqu
eS
wed
enS
outh
Afr
ica
Kuw
ait
Gua
tem
ala
Mad
agas
car
Con
go, R
ep. o
fG
abon
Tha
iland
Mal
iN
iger P
akis
tan
Sie
rra
Leon
eH
aiti In
dia
Jam
aica
New
Zea
land
Nic
arag
uaB
angl
ades
hD
omin
ican
Rep
.A
zerb
aija
nA
ngol
aS
ri La
nka
Qat
arG
hana
Ven
ezue
laJo
rdan
Chi
naT
rinid
ad a
nd T
obag
oT
unis
iaM
yanm
arK
enya
Sen
egal
Iran U
rugu
ayT
ogo
Mex
ico
Pan
ama
Per
uT
anza
nia
Con
go, D
em.
Uni
ted
Sta
tes
Bra
zil
-1.2
-1
-0.8
-0.6
-0.4
-0.2
0
0.2
0.4
0.6
0.8
1
1.2
Co
rr(c
ycle
RG
, cyc
le R
GD
P)
Notes: Dark bars are industrial countries and light ones are developing countries. The cyclical components have been estimated using the Hodrick-Prescott filter. A positive (negative) correlation indicates procyclical (countercyclical) fiscal policy. Source: Frankel, Vegh, and Vuletin (2011).
Figure 4. Country correlations between the cyclical components
of short-term interest rate and real GDP. 1960-2009
Ger
man
yC
anad
aN
ethe
rland
sU
nite
d K
ingd
omA
ustr
alia
Bel
gium
Col
ombi
aC
zech
Rep
.S
witz
erla
ndS
wed
enD
enm
ark
Uni
ted
Sta
tes
Italy
Fra
nce
Mal
aysi
aS
outh
Afr
ica
New
Zea
land
Spa
inJa
pan
Sri
Lank
aA
ustr
iaP
akis
tan
Kor
eaG
reec
eIr
elan
dF
inla
ndA
rgen
tina
Por
tuga
lM
oroc
coC
hina
Gha
naN
epal
Per
uT
haila
ndS
waz
iland
Phi
lippi
nes
Nor
way
Par
agua
yB
razi
lB
oliv
iaZ
ambi
aB
angl
ades
hT
rinid
ad a
nd T
obag
oK
uwai
tC
ypru
sJo
rdan
Fiji
Uga
nda
Bot
swan
aB
arba
dos
Egy
ptR
wan
daN
iger
iaT
anza
nia
Bul
garia
Tun
isia
Mau
ritiu
sA
lger
iaK
enya
Tur
key
Isra
elM
exic
oV
enez
uela
Cos
ta R
ica
Indi
aC
hile
Gam
bia
Uru
guay
-1
-0.75
-0.5
-0.25
0
0.25
0.5
0.75
1
Co
rr(c
ycle
i, c
ycle
RG
DP
)
Notes: Dark bars are industrial countries and light ones are developing countries. The cyclical components have been estimated using the Hodrick-Prescott filter. A positive (negative) correlation indicates countercyclical (procyclical) monetary policy. Sample of 68 industrial and developing countries. Source: World Economic Outlook (IMF), International Financial Statistics (IMF), and Global Financial Data.

19
Figure 5. Cyclicality of fiscal policy vs. cyclicality of monetary policy. 1960-2009
Corr(cycle RG, cycle RGDP) = 0.27 -0.73*** x Corr(cycle i, cycle RGDP)R2 = 0.32
-0.8
-0.6
-0.4
-0.2
0
0.2
0.4
0.6
0.8
1
-0.5 -0.3 -0.1 0.1 0.3 0.5 0.7 0.9
Corr(cycle i, cycle RGDP)
Co
rr(c
ycle
RG
, cyc
le R
GD
P)
Notes: Corr(cycle RG, cycle RGDP) measures country correlations between the cyclical components of the real government spending and real GDP; source: Frankel, Vegh, and Vuletin (2011). Corr(cycle i, cycle RGDP) measures country correlations between the cyclical components of short-term interest rate and real GDP. A positive (negative) Corr(cycle RG, cycle RGDP) indicates procyclical (countercyclical) fiscal policy. A positive (negative) Corr(cycle i, cycle RGDP) indicates countercyclical (procyclical) monetary policy. Source: World Economic Outlook (IMF), International Financial Statistics (IMF), and Global Financial Data.
Figure 6. Country correlations between the cyclical components
of short-term interest rate and real GDP. 1960-1999
Ger
man
yC
anad
aA
ustr
alia
Net
herla
nds
Bel
gium
Uni
ted
Kin
gdom
Sw
itzer
land
Uni
ted
Sta
tes
Italy
Fra
nce
Col
ombi
aM
alay
sia
Sw
eden
Spa
inG
reec
eA
ustr
iaC
zech
Rep
.C
hina
Sou
th A
fric
aIr
elan
dJa
pan
Fin
land
New
Zea
land
Kor
eaP
arag
uay
Pak
ista
nP
ortu
gal
Mor
occo
Sw
azila
ndD
enm
ark
Bra
zil
Gha
naN
epal
Per
uZ
ambi
aF
ijiA
rgen
tina
Phi
lippi
nes
Bul
garia
Nor
way
Sri
Lank
aT
haila
ndC
ypru
sB
angl
ades
hN
iger
iaR
wan
daU
gand
aA
lger
iaB
oliv
iaE
gypt
Tun
isia
Bar
bado
sT
anza
nia
Mau
ritiu
sK
enya
Cos
ta R
ica
Kuw
ait
Bot
swan
aJo
rdan
Trin
idad
and
Tob
ago
Isra
elT
urke
yIn
dia
Gam
bia
Ven
ezue
laM
exic
oC
hile
Uru
guay
-1
-0.75
-0.5
-0.25
0
0.25
0.5
0.75
1
Co
rr(c
ycle
i, c
ycle
RG
DP
)
Notes: Dark bars are industrial countries and light ones are developing countries. The cyclical components have been estimated using the Hodrick-Prescott filter. A positive (negative) correlation indicates countercyclical (procyclical) monetary policy. Sample of 68 industrial and developing countries. Source: World Economic Outlook (IMF), International Financial Statistics (IMF), and Global Financial Data.

20
Figure 7. Country correlations between the cyclical components of short-term interest rate and real GDP. 2000-2009
Den
mar
k
Bot
swan
a
Chi
le
New
Zea
land
Can
ada
Bar
bado
s
Sri
Lank
a
Col
ombi
a
Sou
th A
fric
a
Cze
ch R
ep.
Sw
eden
Uni
ted
Kin
gdom
Uni
ted
Sta
tes
Zam
bia
Jord
an
Per
u
Bol
ivia
Arg
entin
a
Kor
ea
Nor
way
Mex
ico
Kuw
ait
Aus
tral
ia
Phi
lippi
nes
Ban
glad
esh
Indi
a
Mal
aysi
a
Tan
zani
a
Japa
n
Pak
ista
n
Tha
iland
Trin
idad
and
Tob
ago
Egy
pt
Gha
na
Cyp
rus
Bul
garia
Ven
ezue
la
Uga
nda
Tun
isia
Nep
al
Tur
key
Par
agua
y
Mau
ritiu
s
Ken
ya
Isra
el
Bra
zil
Alg
eria
Nig
eria
Mor
occo
Rw
anda
Uru
guay
Gam
bia
Chi
na
Fiji
Cos
ta R
ica
Sw
azila
nd
-1
-0.75
-0.5
-0.25
0
0.25
0.5
0.75
1
Co
rr(c
ycle
i, c
ycle
RG
DP
)
Notes: Dark bars are industrial countries and light ones are developing countries. The cyclical components have been estimated using the Hodrick-Prescott filter. A positive (negative) correlation indicates countercyclical (procyclical) monetary policy. Sample of 56 industrial and developing countries. Source: World Economic Outlook (IMF), International Financial Statistics (IMF), and Global Financial Data.

21
Figure 8. Country correlations between the cyclical components of short-term interest rate and real GDP. 1960-1999 vs. 2000-2009
-1
-0.8
-0.6
-0.4
-0.2
0
0.2
0.4
0.6
0.8
1
-0.7 -0.5 -0.3 -0.1 0.1 0.3 0.5 0.7
Corr(cycle i, cycle RGDP) 1960-1999
Co
rr(c
ycle
i, c
ycle
RG
DP
) 20
00-2
009
Still in school
Recent graduate Established graduate
Back to school
USA
UK
Uruguay
Chile
Mexico Colombia
Korea
GambiaCosta Rica
Brazil
ChinaMorrocco
Notes: The cyclical components have been estimated using the Hodrick-Prescott filter. A positive (negative) correlation indicates countercyclical (procyclical) monetary policy. See Appendix 2 for correlation values for each country. Sample of 56 industrial and developing countries. Established graduates: Argentina, Australia, Bangladesh, Bulgaria, Canada, Colombia, Cyprus, Czech Rep., Denmark, Ghana, Japan, Korea, Malaysia, Nepal, New Zealand, Norway, Pakistan, Paraguay, Peru, Philippines, South Africa, Sri Lanka, Sweden, Thailand, United Kingdom, United States, and Zambia. Still in school: Algeria, Costa Rica, Gambia, Nigeria, Rwanda, and Uruguay. Back to school: Brazil, China, Fiji, Morocco, and Swaziland. Recent graduates: Barbados, Bolivia, Botswana, Chile, Egypt, India, Israel, Jordan, Kenya, Kuwait, Mauritius, Tanzania, Trinidad and Tobago, Tunisia, Turkey, Uganda, and Venezuela. Sample of 56 industrial and developing countries. Source: World Economic Outlook (IMF), International Financial Statistics (IMF), and Global Financial Data.

22
Figure 9. Country correlations between the cyclical components of short-term interest rate and real GDP vs. fear of free falling. 1960-2009
Corr(cycle i, cycle RGDP) =0.24 -0.53*** x Fear of free fallingR2 = 0.25
-0.4
-0.2
0
0.2
0.4
0.6
0.8
1
-0.4 -0.2 0 0.2 0.4 0.6 0.8 1
Fear of free falling
Co
rr(c
ycle
i, c
ycle
RG
DP
)
Notes: Sample of 66 industrial and developing countries. Source: World Economic Outlook (IMF), International Financial Statistics (IMF), and Global Financial Data.
23
Figure 10. Fear of free falling (1960-2009) vs. institutional quality (1984-2008)
IQ =0.68 -0.33*** x FFFR2 = 0.20
0
0.2
0.4
0.6
0.8
1
-0.4 -0.2 0 0.2 0.4 0.6 0.8 1
Fear of free falling
Inst
itu
tio
nal
qu
alit
y
Notes: Sample of 64 industrial and developing countries. Source: World Economic Outlook (IMF) and International Country Risk Guide (ICRG)
Figure 11. Average country correlations between the cyclical components of short-term interest rate and real GDP vs. fear of free falling. Developing countries.
-0.2
-0.1
0
0.1
0.2
0.3
0.4
1970
1972
1974
1976
1978
1980
1982
1984
1986
1988
1990
1992
1994
1996
1998
2000
2002
2004
2006
2008
10 y
ears
ro
llin
g w
ind
ow
s co
rrel
atio
ns
Corr(cycle i, cycle RGDP) Fear of free falling
Notes: Sample of 47 developing countries. Source: World Economic Outlook (IMF), International Financial Statistics (IMF), and Global Financial Data.
24
Figure 12. Graduation examples. Country correlations between the cyclical components of short-term interest rate and real GDP vs. fear of free falling.
Panel A. United Kingdom (established graduate)
-1
-0.8
-0.6
-0.4
-0.2
0
0.2
0.4
0.6
0.8
1
1985
1986
1987
1988
1989
1990
1991
1992
1993
1994
1995
1996
1997
1998
1999
2000
2001
2002
2003
2004
2005
2006
2007
2008
2009
20 y
ears
ro
llin
g w
ind
ow
s co
rrel
atio
ns
Corr(cycle i, cycle RGDP) Fear of free falling
Panel B. Uruguay (still in school)
-1
-0.8
-0.6
-0.4
-0.2
0
0.2
0.4
0.6
0.8
1
1996
1997
1998
1999
2000
2001
2002
2003
2004
2005
2006
2007
2008
2009
15 y
ears
ro
llin
g w
ind
ow
s co
rrel
atio
ns
Corr(cycle i, cycle RGDP) Fear of free falling
Panel C. Chile (recent graduate)
-1
-0.8
-0.6
-0.4
-0.2
0
0.2
0.4
0.6
0.8
1
1980
1982
1984
1986
1988
1990
1992
1994
1996
1998
2000
2002
2004
2006
2008
20 y
ears
ro
llin
g w
ind
ow
s co
rrel
atio
ns
Corr(cycle i, cycle RGDP) Fear of free falling Source: World Economic Outlook (IMF), International Financial Statistics (IMF), and Global Financial Data.

25
TABLE 1
Panel regressions. Dependent variable is the cyclical component of short-term interest rate
Panel A. All countries
(1) (2) (3) (4) (5) (6) (7) (8) (9) (10)
RGDP cycle 0.48*** 0.47*** 0.49*** 0.47*** 1.63*** 1.63** * 1.66***[2.8] [2.7] [2.8] [2.7] [5.6] [5.5] [5.6]
Inflation cycle 0.04*** 0.04*** 0.04*** 0.04*** 0.04*** 0 .04***[6.4] [6.3] [6.2] [6.1] [5.2] [5.0]
Exchange rate depreciation cycle 0.41** 0.42** 0.29* 0.30* 0.42** 0.33*[2.3] [2.4] [1.7] [1.7] [2.2] [1.8]
RGDP cycle * Fear of free falling -3.01*** -3.02*** -3.05***[-4.0] [-4.0] [-4.1]
Number of observations 2732 2718 2769 2681 2705 2702 2669 2037 2037 2037Number of countries 68 68 68 68 68 68 68 67 67 67
Panel B. Industrial countries
(1) (2) (3) (4) (5) (6) (7) (8) (9) (10)
RGDP cycle 5.38*** 5.37*** 5.67*** 5.59*** 5.73*** 6.01** * 5.92***[12.3] [12.0] [12.8] [12.4] [11.1] [11.7] [11.4]
Inflation cycle 0.03*** 0.01 0.03*** 0.01 0.01 0.01[2.9] [1.6] [2.9] [1.5] [1.2] [1.2]
Exchange rate depreciation cycle 12.20 25.51*** 12.55 25.80*** 26.60*** 26.37***[1.5] [3.3] [1.5] [3.3] [3.1] [3.1]
RGDP cycle * Fear of free falling -1.76 -2.06 -2.12[-1.3] [-1.5] [-1.5]
Number of observations 874 878 893 858 856 871 851 705 705 705Number of countries 21 21 21 21 21 21 21 21 21 21
Panel C. Developing countries
(1) (2) (3) (4) (5) (6) (7) (8) (9) (10)
RGDP cycle 0.13 0.13 0.14 0.14 0.95*** 0.89** 0.98***[0.6] [0.7] [0.7] [0.7] [2.6] [2.4] [2.7]
Inflation cycle 0.05*** 0.05*** 0.04*** 0.04*** 0.04*** 0 .04***[5.6] [5.5] [5.4] [5.3] [4.4] [4.2]
Exchange rate depreciation cycle 0.40** 0.41** 0.28 0.28 0.39* 0.29[2.1] [2.1] [1.4] [1.4] [1.9] [1.4]
RGDP cycle * Fear of free falling -2.26** -2.22** -2.30**[-2.4] [-2.4] [-2.5]
Number of observations 1858 1840 1876 1823 1849 1831 1818 1332 1332 1332Number of countries 47 47 47 47 47 47 47 46 46 46
Notes: Estimations are performed using country-fixed-effects. t-statistics are in square brackets. Constant and Fear of free falling terms are not reported. *, ** and *** indicate statistically significant at the 10%, 5% and 1% levels, respectively. Fear of free falling is constructed using the 10-year rolling window correlation between the percentage change in short-term interest rate and exchange rate depreciation.