The China Puzzle: Falling Happiness in a Rising Economy
19
RESEARCH PAPER The China Puzzle: Falling Happiness in a Rising Economy Hilke Brockmann Jan Delhey Christian Welzel Hao Yuan Ó Springer Science+Business Media B.V. 2008 Abstract Over the 1990–2000 decade happiness in China plummeted despite massive improvement in material living standards. This finding contradicts the notion that income growth at low living standards leads to gains, not losses, in happiness. We explain this puzzle by drawing on a specific version of relative deprivation theory, the concept of ‘‘frustrated achievers.’’ Our major finding is that income inequality in China became increasingly skewed towards the upper income strata, so that related to the average income the financial position of most Chinese worsened. Consequently, financial dissatisfaction rose and became an increasingly important factor in depressing happiness. Other negative feelings emerging with rapid transitions, such as anomie and disaffection, show a less depressive effect on Chinese happiness. We conclude with some speculations about the applicability of our findings to transition economies in general. Keywords Happiness Á Life satisfaction Á Relative deprivation Á Inequality Á Income Á Transition economies Á Market economy 1 Introduction: The China Puzzle In 1978, the Chinese government launched a massive reform program to fight poverty and to liberalize the economy. Since then, China experienced one of the most astounding and enduring growth periods in the history of humankind. Over the last 30 years, the economy has grown at an average annual rate of more than 8%, fundamentally improving the living conditions of many of the 1.3 billion Chinese (Klein and O ¨ zmucur 2002). The average nominal income of the rural population more than tripled, jumping from 686 YUAN in 1990 to 2,253 YUAN in 2000 (The National Bureau of Statistics of China 2001), thereby H. Brockmann Á J. Delhey (&) Á C. Welzel School of Humanities and Social Sciences, Jacobs University, P.O. Box 750561, 28725 Bremen, Germany e-mail: [email protected] H. Yuan GSSS, University of Bremen, Bremen, Germany 123 J Happiness Stud DOI 10.1007/s10902-008-9095-4
-
Upload
independent -
Category
Documents
-
view
0 -
download
0
Transcript of The China Puzzle: Falling Happiness in a Rising Economy

RESEARCH PAPER
The China Puzzle: Falling Happiness in a RisingEconomy
Hilke Brockmann Æ Jan Delhey Æ Christian Welzel Æ Hao Yuan
� Springer Science+Business Media B.V. 2008
Abstract Over the 1990–2000 decade happiness in China plummeted despite massive
improvement in material living standards. This finding contradicts the notion that income
growth at low living standards leads to gains, not losses, in happiness. We explain this
puzzle by drawing on a specific version of relative deprivation theory, the concept of
‘‘frustrated achievers.’’ Our major finding is that income inequality in China became
increasingly skewed towards the upper income strata, so that related to the average income
the financial position of most Chinese worsened. Consequently, financial dissatisfaction
rose and became an increasingly important factor in depressing happiness. Other negative
feelings emerging with rapid transitions, such as anomie and disaffection, show a less
depressive effect on Chinese happiness. We conclude with some speculations about the
applicability of our findings to transition economies in general.
Keywords Happiness � Life satisfaction � Relative deprivation � Inequality �Income � Transition economies � Market economy
1 Introduction: The China Puzzle
In 1978, the Chinese government launched a massive reform program to fight poverty and
to liberalize the economy. Since then, China experienced one of the most astounding and
enduring growth periods in the history of humankind. Over the last 30 years, the economy
has grown at an average annual rate of more than 8%, fundamentally improving the living
conditions of many of the 1.3 billion Chinese (Klein and Ozmucur 2002). The average
nominal income of the rural population more than tripled, jumping from 686 YUAN in
1990 to 2,253 YUAN in 2000 (The National Bureau of Statistics of China 2001), thereby
H. Brockmann � J. Delhey (&) � C. WelzelSchool of Humanities and Social Sciences, Jacobs University, P.O. Box 750561,28725 Bremen, Germanye-mail: [email protected]
H. YuanGSSS, University of Bremen, Bremen, Germany
123
J Happiness StudDOI 10.1007/s10902-008-9095-4

pulling millions of Chinese out of poverty.1 Rural poverty declined from some 80% in
1978 to 13% in 2000, the number of ‘‘officially’’ poor declined from more than 323 million
in 1980 to 47 million in 2000 (Ravallion and Chen 2007).2 In urban China, the average
nominal income quadrupled within one decade, from 1,510 YUAN in 1990 to 6,280
YUAN in 2000 (The National Bureau of Statistics of China 2001).
Every key social indicator for China points towards the most rapid improvement in
living standards in recorded history. In stark contrast to this objective progress, subjectivewell-being, measured by self-reported ratings of people’s life satisfaction and happiness,
has declined considerably (similarly Wong et al. 2006). The percentage of Chinese who
described themselves as very happy plummeted from 28% in 1990 to 12% in 2000.
Measured on a scale from 1 (low) to 10 (high), life satisfaction fell from an average of 7.3
to 6.5. Most significantly, life satisfaction fell in both urban and rural China and in every
income group (Table 1).
The combination of massive improvement in living conditions and declining subjective
well-being challenges almost every explanation which three decades of happiness research
had firmly established. To begin with, China’s declining happiness is at odds with the
1 Inflation did not undermine the accelerated economic growth during the 1990s, although the nationalconsumer price index rose by 109% between 1990 and 1996, but dropped sharply down to 0.7% between1996 and 2000. During the entire decade, GDP prices deflated by factor 1.9 (UN 2006). Also, between 1990and 2000 the exchange rate of 1 US dollar increased moderately from 5.0 Yuan to 8.5 Yuan.2 The poverty line is drawn at 300 Yuan per person per year at 1990 prices (Ravallion and Chen 2007, p. 5).
Table 1 Life satisfaction in China, 1990–2000
Rural Urban
1990 2000 1990 2000
Total 7.7 6.8 7.2 6.3
Gender
Men 7.7 6.7 7.3 6.2
Women 7.5 6.7 7.1 6.3
Age groups (years)
-30 6.7 6.5 6.8 6.8
30–40 7.8 6.6 7.3 6.3
40–50 8.2 6.7 7.1 5.9
50+ 7.9 6.9 7.7 5.3
Partnership
Married/cohabiting 7.9 6.8 7.4 6.4
Single/widowed 6.3 5.9 6.6 5.8
Income
Lowest quartile 7.3 6.0 (6.8) 4.9
2nd quartile 7.5 6.7 7.0 5.7
3rd quartile 8.6 7.3 7.3 6.3
Highest quartile 7.7 7.5 7.2 6.8
Dependent variable: life satisfaction 1–10 (high)
( ) denotes case numbers below 30
Data: WVS China 1990 and 2000, own computations
H. Brockmann et al.
123

famous ‘‘Easterlin paradox.’’ In 1974, Easterlin discovered that, although richer popula-
tions tend to be happier than poorer ones, a society’s average happiness is a constant that
remains unchanged even if per capita incomes increase for most of the population (Eas-
terlin 1974). This apparent paradox can be explained by combining the ideas of ‘norm
adjustment’ and ‘relative advantage’. On the one hand, happiness is not enhanced by
absolute living standards, as people quickly adjust to what they have and come to regard it
as normal. In other words, whatever one has achieved becomes one’s norm of expectation.
On the other hand, happiness is also shaped by the phenomenon of relative advantage,
which occurs through comparing one’s social standing with that of others, making those
who see themselves above the average happier than those below. However, a society’s
aggregate happiness might not increase at all even if the average income increases tre-
mendously, if the proportion of the population above and below the average does not
change.
More recent research has shown that the Easterlin paradox overstates the constancy of
happiness (Layard 2005). It has been established that happiness levels have increased
modestly, but significantly, in most affluent societies over a longer period of time (Hagerty
and Veenhoven 2003; Veenhoven and Hagerty 2006). More importantly in our context,
Diener and Diener (1995) have provided evidence that improvements in material living
standards yield greater happiness, especially at low levels of per capita income. Nowadays,
researchers generally agree that the relationship between material conditions and sub-
jective well-being is curvilinear: at low living standards rising income yields great gains in
happiness but these gains level off as incomes continue to rise.
Against this background, China confronts us with a major puzzle. As this country
experienced rising incomes particularly at low living standards, one would expect rising
happiness (Knight et al. 2007). Also, provided that comparisons with the living standard in
other nations play a role (Delhey and Kohler 2006), the Chinese should have become
happier, given that the country is rapidly catching up with Western economic standards,
particularly in its coastal regions. Even more unsettling is the finding that subjective well-
being has declined for all income groups, including high incomes. It is still true that life
satisfaction correlates positively with one’s income position: this pattern holds for 1990 as
well as for 2000. However, even the better-off felt slightly less satisfied with their lives at
the end of the 1990s than at the beginning.
How can this puzzle be resolved? We test three theoretical explanations: anomie,
political disaffection, and relative deprivation. While anomie and political disaffection
prove to be less influential, we find that a specific manifestation of relative deprivation,
the phenomenon of ‘‘frustrated achievers,’’ explains very well the decrease in Chinese
life satisfaction. To be more concrete, we find income inequality to be increasingly
skewed such that most income groups find themselves in a more disadvantageous relative
position, despite absolute income gains. Relative decline despite absolute increase has a
major frustrating effect in giving rise to financial dissatisfaction, which in turn depresses
life satisfaction. Consistent with this finding is evidence for a ‘‘monetarization of hap-
piness’’—life satisfaction has become primarily dependent on financial satisfaction, a
pattern which might be a peculiarity of countries undergoing economic transition from
plan to market.
The first section of this paper portrays the three possible explanations of the China
puzzle. The second section presents the data and variables that we used, followed by our
findings in the third section. In the concluding part, we speculate whether our findings
represent a pattern that could be generalized to fast-growing emerging market economies.
The China Puzzle: Falling Happiness in a Rising Economy
123
2 Three Competing Explanations
The concept of life satisfaction refers to ‘‘the degree to which a person positively evaluates
the overall quality of his/her life as-a-whole’’ (Veenhoven 1996). The anomie, disaffection,
and relative deprivation theories may explain why life satisfaction fell significantly in
China by emphasizing rapid social changes as a force nurturing negative feelings among a
population.
2.1 Anomie
As Durkheim (1933) argued, rapid social changes easily overwhelm people’s mental
capacities and result in disorientation, depression, and anomic attitudes that lead to a
diminution of overall happiness. Merton (1938) emphasized that capitalistic and merito-
cratic norms might contribute to anomic attitudes and mass depression, given the
permanent pressure and stress that economic competition and a social obsession with
achievement puts on people. The anomic effects could be even more detrimental in
societies like China, in which rising competition and capitalism fundamentally question the
collectivist and egalitarian traditions inherited from Confucianism and Communism.
China’s groundbreaking economic reforms changed the life of the urban population
dramatically. The country’s cities began to grow rapidly and continue to do so. Millions
leave the countryside to find a job. Motorways and high-speed trains increase personal
mobility, and mobile phones and Internet quickly become widespread among a well-
educated population. Mass consumption changes traditional life-styles. Capitalism cata-
pults the Chinese into modernity in the period of a few years—after decades or even
centuries of stagnation. The insecurity nurtured by these rapid transformations makes the
urban population particularly vulnerable to anomie, one would suggest.
Feelings of powerlessness have been identified as one of the important dimensions of
anomic attitudes (Seeman 1959). In direct opposition to personal efficacy, powerlessness
implies the belief that fate cannot be controlled by a person’s own actions. Various studies
found that massive transformations of the social environment can have a negative influence
on the feeling of control one has over one’s life (Gecas and Schwalbe 1983; Mead 1934).
The general syndrome of anomie, however, seems to be mediated by personal resources,
such as occupational status, education, and income. Typically, ‘winners’ in society are less
likely to react anomically to large-scale social changes than ‘‘losers’’ (Gecas 1989; Turner
and Roszell 1994).
2.2 Political Disaffection
Apart from economic and social factors, many studies indicate that institutions and
political structures have meaningful effects on life satisfaction. Frey and Kirchgassner
(2002), for example, find that people tend to be happier when living in a democratic
environment. Likewise, Inglehart (1997) observes that levels of life satisfaction are sys-
tematically higher in more democratic societies. If Inglehart and Welzel (2005) are correct
and value change follows indeed the logic of Maslow’s (1943) need hierarchy, then
democracy (or lack thereof) should have a greater impact on people’s life satisfaction on
higher levels of material need satisfaction. Indeed, Veenhoven (2000) found that political
freedom is more important in wealthier nations than in poorer nations, whereas economic
freedom has a stronger effect on well-being in poor countries than in wealthy ones.
H. Brockmann et al.
123

Applying these findings to China, democracy should become an important concern for the
Chinese population as the country becomes more prosperous. Unfortunately, China is not a
free country, as the annual Freedom House reports say. On a scale running from 1 (free) to
7 (unfree), China is scored 7 on political rights, and 6 on civil liberties since 1999 (before
1999, it was scored 7 on both dimensions). Thus, the continuing denial of democracy in
China may contribute to a widespread disaffection from the system, causing a decrease in
people’s life satisfaction.
Another source of growing political dissatisfaction might be the decline of effective and
trustworthy governance. Helliwell (2003) found that corruption and the absence of rule of
law are associated with lower life satisfaction at the national level. Corruption in China has
become more rampant during the market transition (Gong 1994) as many high-ranking
officials take advantage of their power for personal gain: they trade inside information,
forgive debts and taxes, and grant illegal loans for real estate deals (Deng and Cordilia
1999; Gong 1994). Thus, one would expect that distrust in the political system has grown
over time and increasingly depressed life satisfaction.
2.3 Relative Deprivation
As pointed out by Merton und Kitt (1950), relative deprivation is a concept belonging to
the wider realm of reference group theory. The basic idea of the latter is that people
compare themselves with other individuals or groups when evaluating their own situation
(Hyman 1968; Kelly 1968; Merton and Kitt 1950). Relative deprivation, then, refers to a
situation in which people perceive themselves to be disadvantaged in relation to others. In
‘The American Soldier’, Stouffer et al. (1949) found that soldiers’ feelings of dissatis-
faction were less related to the actual degree of hardship they experienced than to the
situation of the unit or group to which they compared themselves. The concept of ‘relative
deprivation’ was introduced to explain these findings. Consequently, happiness might carry
a strong relative component, and if so, it is a reflection of social utility rather than eco-
nomic utility. This is in line with Easterlin’s (1974) claim that a generalized augmentation
in income will not increase happiness in a given population, simply because one’s relative
income—relative to fellow citizens—does not improve (see also Easterlin 1995, 2005).
The depressing effect of relative deprivation on happiness has been demonstrated in
numerous studies. Clark and Oswald (1996), for instance, find that British workers are less
satisfied with their jobs when the income level of their reference group is higher. Psy-
chologists and behavioral economists have shown in experiments that people avoid
outcomes through which they end up having less than the majority, even if they improve
their situation drastically in absolute terms (Frank 1997; Smith et al. 1989; Tversky and
Griffin 1991). Although people tend to be happier if they think they outclass others,
negative experiences seem to be more salient than positive ones: relative disadvantage
makes people unhappier than relative advantage makes them happy (Delhey and Kohler
2006; Surowiecki 2004).
In order to understand why life satisfaction fell in China, we employ a new version of
relative deprivation theory, the concept of ‘frustrated achievers’ proposed by Graham and
Pettinato (2002). These authors find low levels of happiness throughout almost all income
groups in transition economies such as Peru and Russia, even in times of economic growth.
This phenomenon reflects a rapid change in the shape of a society’s income distribution to
the effect that inequality becomes increasingly skewed towards the upper income groups
(‘top-driven inequality’). As a result, the proportion of the population falling below the
The China Puzzle: Falling Happiness in a Rising Economy
123

country’s mean income becomes bigger, worsening most people’s relative position despite
absolute gains.
This phenomenon may be particularly pronounced in China in which the political
hierarchy has been the sole standard of social ranking for decades (Li 2002; Nee 1989;
Zhou 2000). In economic terms, egalitarianism dominated and wages were usually kept at
an average subsistence level without much variation among workers. Differences in
income and other material resources existed but were usually small (Szelenyi 1978; Zhou
2000). The situation has changed dramatically since China reformed its economy in 1978.
The move towards private ownership and a market-based economy brought profound
changes in property rights and the distribution of resources. Economic inequality increased
markedly. During the 1990s, the Gini coefficient of income inequality skyrocketed from
.28 to .43, with some estimates as high as .48, a level which is comparable to some of the
most unequal countries in Asia and Latin America. As Li (2002) pointed out, only a small
group of elites and entrepreneurs benefited massively from the boom, heading away from
the rest of the population. Unthinkable during Communism, today more than 300,000
Chinese have a net wealth worth over $1 million, excluding property, according to a report
from Merrill Lynch. Mainland millionaires control some $530 billion in assets, Boston
Consulting Group estimates.3 Moreover, the income gap between urban and rural areas has
also been growing (Ravallion and Chen 2007). To a large extent, the countryside lives in
the shadow of the prospering economy of the cities.
Using data from the World Values Survey, Figs. 1 and 2 illustrate the rising number of
‘frustrated achievers’ in China. We mainly introduce these figures for illustrating the
general tendency, rather than drawing an accurate picture of income distribution in China.
The income information provided in the WVS is based on ten brackets of household
income in ascending order. We assigned to each respondent the midpoint of his/her
respective income bracket, and then computed the ratios of these household incomes to the
average national income (and to the urban average and rural average, respectively). This
procedure converted the income information into relative incomes. The original use of
income brackets explains why the income distributions displayed are not continuous, but
display discrete points.
The figures show the distribution of these relative incomes in a logged version. The
transformation centers the data on zero as the reference point at which income equals the
mean income (log of 1 is 0). Accordingly, the area to the left of the zero-lines indicates
lower-than-average incomes, whereas higher-than-average incomes can be found in the
area to the right.
Figure 1 reveals a shift in the urban population to the left. The relative income position
of a large part of the urban Chinese population has worsened during the 10 years covered
here, and this is particularly true for the poor for whom the urban average has completely
moved out of sight. Hence in relative terms, a majority of the urban population finds itself
worse off in the emerging Chinese capitalism. The unequal distribution of the economic
gains may constitute a fertile ground for rising feelings of relative deprivation—a fact that
is likely to be aggravated by the conspicuous consumption of the new rich. As of today, the
Chinese are the third biggest high-end buyers, with more than 12% of world sales. In the
next decade, China will likely leapfrog Japan and the U.S. to become the top luxury
market.4
3 ‘‘In China, to get rich is glorious’’, Business Week, February 6, 2006. Retrieved September 14, 2007 fromhttp://www.businessweek.com/magazine/content/06_06/b3970072.htm.4 See footnote 3.
H. Brockmann et al.
123

There has been no shift towards relative disadvantage within the rural population, if we
take the average rural income as a yardstick (see Fig. 2, top panel). This reflects the
concentration of the economic gains within urban areas and the relative stagnation in the
countryside. Compared to the urban population, however, large numbers of the rural
dwellers are in a (much) more disadvantageous position now than they were 10 years
before (see Fig. 2, bottom panel). Again, one can notice a shift in the distribution towards
Against the rural mean income:
0
10
20
30
40
Per
cent
−4 −3.5 −3 −2.5 −2 −1.5 −1 −.5 0 .5 1 1.5 2 2.5 3multiple of rural mean income, log
China_WVS1990.dorural population, 1990
0
10
20
30
40
Per
cent
−4 −3.5 −3 −2.5 −2 −1.5 −1 −.5 0 .5 1 1.5 2 2.5 3multiple of rural mean income, log
China_WVS2000.dorural population, 2000
Against the urban mean income:
0
10
20
30
40
Per
cent
−4 −3.5 −3 −2.5 −2 −1.5 −1 −.5 0 .5 1 1.5 2 2.5 3
multiple of urban mean income, log
China_WVS1990.dorural population, 1990
0
10
20
30
40
Per
cent
−4 −3.5 −3 −2.5 −2 −1.5 −1 −.5 0 .5 1 1.5 2 2.5 3
multiple of urban mean income, log
China_WVS2000.dorural population, 2000
Fig. 2 Relative income position of rural population. Note: (cf. note for Fig. 1)
0
10
20
30
40
Per
cent
−4 −3.5 −3 −2.5 −2 −1.5 −1 −.5 0 .5 1 1.5 2 2.5 3multiple of urban mean income, log
China_WVS1990.dourban population, 1990
0
10
20
30
40
Per
cent
−4 −3.5 −3 −2.5 −2 −1.5 −1 −.5 0 .5 1 1.5 2 2.5 3multiple of urban mean income, log
China_WVS2000.dourban population, 2000
Fig. 1 Relative income position of urban population; Note: The relative income (the percentage of therespective mean) is expressed as log. Here are examples to read the scale: 0, average income; 1, 200% ofaverage income; 2, 400% of average income; -1, 50% of average income; -2, 25% of average income.Data: WVS China 1990 and 2000, own computations
The China Puzzle: Falling Happiness in a Rising Economy
123

the left. In 2000, only very few rural dwellers enjoyed incomes above the urban average.
Provided rural residents compare themselves with the urban living standard, their feelings
of relative deprivation should have risen too.
To summarize, anomie, disaffection, and deprivation each imply negative feelings in the
context of a rapid market transition. Each of these negative feelings plausibly helps to
explain declining levels of life satisfaction, though for different reasons. Therefore, we will
test all three factors simultaneously.
3 Data and Variables
3.1 Data
Our analyses use evidence from two Chinese surveys conducted as part of the World
Values Survey (WVS) in 1990 and 2000 (for further details on sampling methodology,
questionnaire, and data sets see the Appendix, and visit the website: http://www.
worldvaluessurvey.org). The Chinese surveys were based on national samples of roughly
1,000 people each, covering the resident population that was aged 18 years and older in
1990, and those between 18 and 65 years old in 2000. We use all respondents aged 18–65
in order to ensure comparability between the two surveys, which leaves us with 968 cases
for 1990, and 1,000 cases for 2000. The sampling population universe was stratified
according to residence, gender, age, occupation and education, and within the sampling
points, each stratum was sampled by quota, with a 10% sub-sample of illiterate persons
(Inglehart et al. 2000).
Since living conditions in rural and urban China differ enormously and since the urban/
rural composition varies between the two surveys, we split both samples and run separate
analysis. Whereas in 1990 the number of respondents from cities clearly outnumbered
those from the countryside (767 vs. 233), in 2000 the situation was reversed (625 rural vs.
375 city). One should note that the official urbanization figure is 36% (The National
Bureau of Statistics of China 2001). It goes without saying that we would have preferred to
have higher numbers of rural residents in the 1990 survey, and of urban dwellers in the
2000 survey. Yet the decline in life satisfaction we find for both urban and rural China is
significant, and not a statistical artefact.
As the WVS does not provide direct information on the place of residence of the
respondent, i.e. whether the respondent lives in the countryside or in a city, we derive the
urban-rural distinction from combining information on residential region according to
sampling points, and occupation.
Both surveys used stratified multi-stage random sampling. The 1990-survey first
stratified the provinces according to three levels of economic development, with several
provinces being randomly selected within each of these strata. Within each province,
approximately twenty sampling points were selected randomly, with five individuals being
interviewed at each point. Finally, the total number of the respondents in 1990 is 1,000
(Inglehart et al. 2000). The 2000-survey treated each province as an independent stratum.
Forty county-level units were drawn out of the sampling frame of 2,708 units. In each unit,
a township-level unit was randomly chosen. Similarly, a village/neighborhood-level unit
was randomly chosen in each township-level unit. Thus, thirty village-level units and ten
neighborhood-level units were drawn. In each of the chosen village/neighborhood-level
units, twenty-five respondents were selected according to the sampling interval. The
population was stratified according to gender, age, occupation and education, and within
H. Brockmann et al.
123
these sampling points, each stratum was sampled by quota, with a ten percent sub-sample
of illiterate persons (Chen and Yang 2001).
Since migration between urban and rural areas was institutionally limited in 1990, the
non-agricultural employees usually lived in the urban areas, while agricultural workers and
farmers were rural residents. Thus, 202 respondents whose occupation was agricultural
worker were treated as rural residents. Furthermore, 200 respondents were retired,
housewives, students, and so on. Thirty-one of them were from families in which the chief
bread winners were agricultural workers. These respondents were treated as rural residents,
too. Thus, 767 respondents came from urban areas and 233 from rural areas. For the sample
of 2000, 250 respondents from the ten neighborhood-level units could be identified as
urban residents. Besides, five village-level units from East-coast areas were also treated as
urban because of the high levels of urbanization and industrialization of these regions.
Thus, in the sample of 2000, 625 respondents came from rural areas and 375 came from the
urban areas. In the variable ‘‘region,’’ respondents from urban areas were coded ‘‘1’’ and
those from rural areas were coded ‘‘0’’.
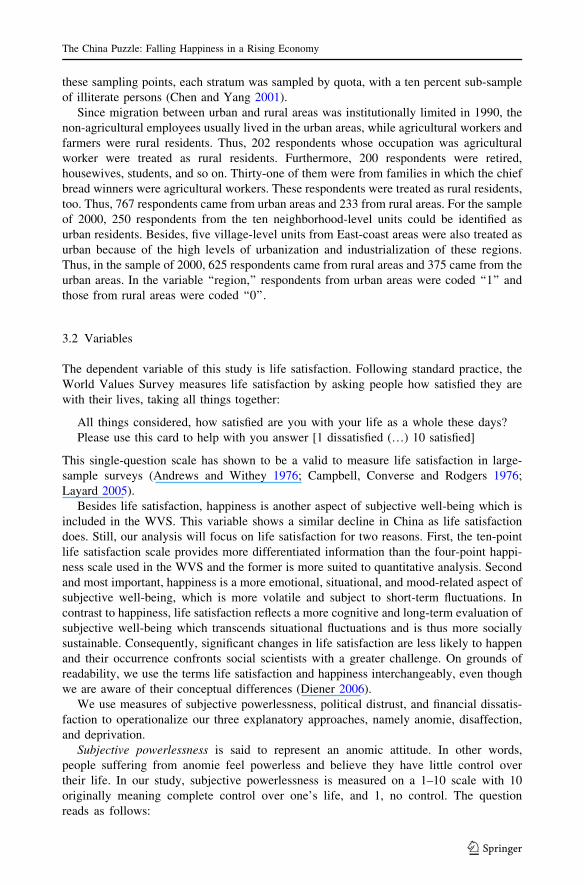
3.2 Variables
The dependent variable of this study is life satisfaction. Following standard practice, the
World Values Survey measures life satisfaction by asking people how satisfied they are
with their lives, taking all things together:
All things considered, how satisfied are you with your life as a whole these days?
Please use this card to help with you answer [1 dissatisfied (…) 10 satisfied]
This single-question scale has shown to be a valid to measure life satisfaction in large-
sample surveys (Andrews and Withey 1976; Campbell, Converse and Rodgers 1976;
Layard 2005).
Besides life satisfaction, happiness is another aspect of subjective well-being which is
included in the WVS. This variable shows a similar decline in China as life satisfaction
does. Still, our analysis will focus on life satisfaction for two reasons. First, the ten-point
life satisfaction scale provides more differentiated information than the four-point happi-
ness scale used in the WVS and the former is more suited to quantitative analysis. Second
and most important, happiness is a more emotional, situational, and mood-related aspect of
subjective well-being, which is more volatile and subject to short-term fluctuations. In
contrast to happiness, life satisfaction reflects a more cognitive and long-term evaluation of
subjective well-being which transcends situational fluctuations and is thus more socially
sustainable. Consequently, significant changes in life satisfaction are less likely to happen
and their occurrence confronts social scientists with a greater challenge. On grounds of
readability, we use the terms life satisfaction and happiness interchangeably, even though
we are aware of their conceptual differences (Diener 2006).
We use measures of subjective powerlessness, political distrust, and financial dissatis-
faction to operationalize our three explanatory approaches, namely anomie, disaffection,
and deprivation.
Subjective powerlessness is said to represent an anomic attitude. In other words,
people suffering from anomie feel powerless and believe they have little control over
their life. In our study, subjective powerlessness is measured on a 1–10 scale with 10
originally meaning complete control over one’s life, and 1, no control. The question
reads as follows:
The China Puzzle: Falling Happiness in a Rising Economy
123
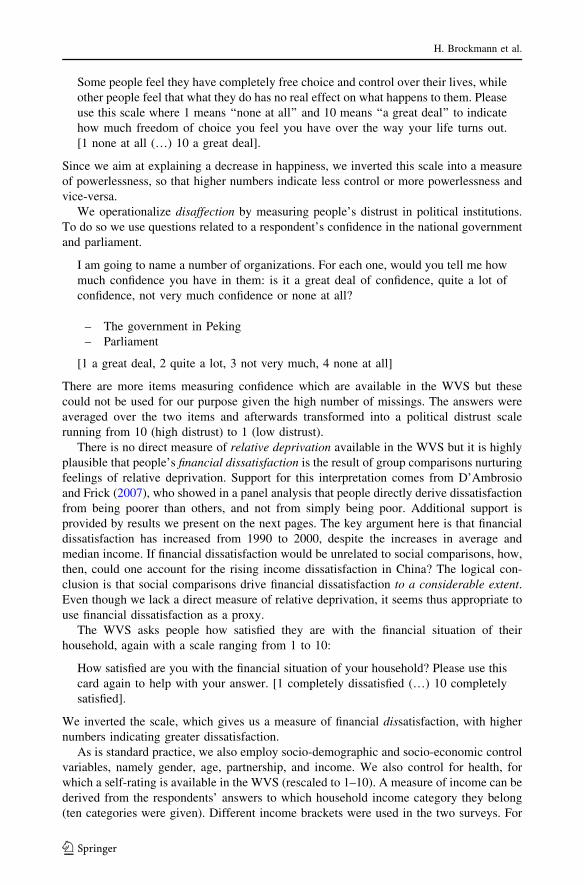
Some people feel they have completely free choice and control over their lives, while
other people feel that what they do has no real effect on what happens to them. Please
use this scale where 1 means ‘‘none at all’’ and 10 means ‘‘a great deal’’ to indicate
how much freedom of choice you feel you have over the way your life turns out.
[1 none at all (…) 10 a great deal].
Since we aim at explaining a decrease in happiness, we inverted this scale into a measure
of powerlessness, so that higher numbers indicate less control or more powerlessness and
vice-versa.
We operationalize disaffection by measuring people’s distrust in political institutions.
To do so we use questions related to a respondent’s confidence in the national government
and parliament.
I am going to name a number of organizations. For each one, would you tell me how
much confidence you have in them: is it a great deal of confidence, quite a lot of
confidence, not very much confidence or none at all?
– The government in Peking
– Parliament
[1 a great deal, 2 quite a lot, 3 not very much, 4 none at all]
There are more items measuring confidence which are available in the WVS but these
could not be used for our purpose given the high number of missings. The answers were
averaged over the two items and afterwards transformed into a political distrust scale
running from 10 (high distrust) to 1 (low distrust).
There is no direct measure of relative deprivation available in the WVS but it is highly
plausible that people’s financial dissatisfaction is the result of group comparisons nurturing
feelings of relative deprivation. Support for this interpretation comes from D’Ambrosio
and Frick (2007), who showed in a panel analysis that people directly derive dissatisfaction
from being poorer than others, and not from simply being poor. Additional support is
provided by results we present on the next pages. The key argument here is that financial
dissatisfaction has increased from 1990 to 2000, despite the increases in average and
median income. If financial dissatisfaction would be unrelated to social comparisons, how,
then, could one account for the rising income dissatisfaction in China? The logical con-
clusion is that social comparisons drive financial dissatisfaction to a considerable extent.Even though we lack a direct measure of relative deprivation, it seems thus appropriate to
use financial dissatisfaction as a proxy.
The WVS asks people how satisfied they are with the financial situation of their
household, again with a scale ranging from 1 to 10:
How satisfied are you with the financial situation of your household? Please use this
card again to help with your answer. [1 completely dissatisfied (…) 10 completely
satisfied].
We inverted the scale, which gives us a measure of financial dissatisfaction, with higher
numbers indicating greater dissatisfaction.
As is standard practice, we also employ socio-demographic and socio-economic control
variables, namely gender, age, partnership, and income. We also control for health, for
which a self-rating is available in the WVS (rescaled to 1–10). A measure of income can be
derived from the respondents’ answers to which household income category they belong
(ten categories were given). Different income brackets were used in the two surveys. For
H. Brockmann et al.
123

instance, the highest category was ‘‘more than 450 YUAN/month’’ in the 1990 survey, but
‘‘more than 50,000/year’’ in the 2000 survey. In order to make the two income bracket
schemes comparable, we assigned to each respondent the midpoint of his/her respective
income category, and then computed the ratios of these household incomes to the national
average income (or to the urban average and rural average, respectively). This procedure
converted the income information into relative incomes. In the regressions, we use the log
of this relative income. For some descriptive purposes, simple income quartiles are
displayed.
4 Analyses
We first investigate which of our measures, subjective powerlessness, political distrust or
financial dissatisfaction shows the strongest increase during the 1990s. Then we look at the
association between each of these three negative feelings and life satisfaction and check
whether the major factor responsible for (un)happiness in 1990 gained more influence in
2000. Finally, we control for other factors by using multivariate regressions.
4.1 Descriptive Findings
Among rural Chinese feelings of powerlessness did not increase significantly over the
1990–2000 decade (Table 2). Some groups indicate an increase in powerlessness but others
show evidence of a decrease. Tables 3 and 4 provide additional information on the level of
these negative feelings among the rural and the urban population. From the correlation
analysis it is evident that the negative correlation between powerlessness and life satis-
faction has become weaker over time, though it is still considerably strong (Table 5). This
means that for the rural areas, anomic feelings cannot be the key to understand declining
happiness. But anomic feelings might have contributed to growing unhappiness in urban
settings. Here, women, the elderly, and the lower income groups, who are often named the
‘losers’ of Chinese capitalism, feel more powerless in 2000 than in 1990. Yet, the overall
increase is very small, and the association between subjective powerlessness and life
satisfaction has not grown stronger. Given the above-mentioned findings, anomic feelings
are unlikely to be the major cause of falling happiness in China.
Political distrust divides the rural and urban population. Across all groups, rural resi-
dents are more distrustful of political institutions in 2000 than they were in 1990. However,
the significant relationship between political distrust and life satisfaction found in 1990
disappears in 2000. The perception of Chinese political institutions by the rural population
seems to have become largely disconnected from their life satisfaction. The picture is
different in urban China, where distrust in political institutions has declined over the same
decade and not increased as in the countryside. Yet, distrust in political institutions also
loses importance in urban areas. Like their rural compatriots, city dwellers appear less
concerned about politics when they rate their life satisfaction in 2000 than 10 years ago. In
light of these results, it seems evident that political disaffection cannot be held responsible
for the decline in Chinese life satisfaction.
The findings for financial dissatisfaction point in a different direction. Almost all
segments of the rural population became less satisfied with their financial situation, with
the exception of the youngest generation and the richest quarter among which we see no
change over time. On the grounds of rising income inequality, the strength by which
The China Puzzle: Falling Happiness in a Rising Economy
123
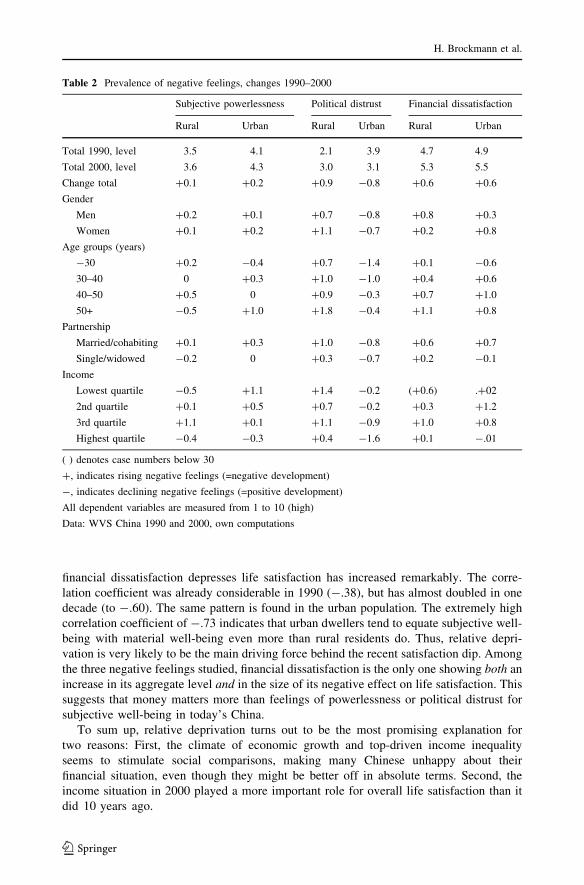
financial dissatisfaction depresses life satisfaction has increased remarkably. The corre-
lation coefficient was already considerable in 1990 (-.38), but has almost doubled in one
decade (to -.60). The same pattern is found in the urban population. The extremely high
correlation coefficient of -.73 indicates that urban dwellers tend to equate subjective well-
being with material well-being even more than rural residents do. Thus, relative depri-
vation is very likely to be the main driving force behind the recent satisfaction dip. Among
the three negative feelings studied, financial dissatisfaction is the only one showing both an
increase in its aggregate level and in the size of its negative effect on life satisfaction. This
suggests that money matters more than feelings of powerlessness or political distrust for
subjective well-being in today’s China.
To sum up, relative deprivation turns out to be the most promising explanation for
two reasons: First, the climate of economic growth and top-driven income inequality
seems to stimulate social comparisons, making many Chinese unhappy about their
financial situation, even though they might be better off in absolute terms. Second, the
income situation in 2000 played a more important role for overall life satisfaction than it
did 10 years ago.
Table 2 Prevalence of negative feelings, changes 1990–2000
Subjective powerlessness Political distrust Financial dissatisfaction
Rural Urban Rural Urban Rural Urban
Total 1990, level 3.5 4.1 2.1 3.9 4.7 4.9
Total 2000, level 3.6 4.3 3.0 3.1 5.3 5.5
Change total +0.1 +0.2 +0.9 -0.8 +0.6 +0.6
Gender
Men +0.2 +0.1 +0.7 -0.8 +0.8 +0.3
Women +0.1 +0.2 +1.1 -0.7 +0.2 +0.8
Age groups (years)
-30 +0.2 -0.4 +0.7 -1.4 +0.1 -0.6
30–40 0 +0.3 +1.0 -1.0 +0.4 +0.6
40–50 +0.5 0 +0.9 -0.3 +0.7 +1.0
50+ -0.5 +1.0 +1.8 -0.4 +1.1 +0.8
Partnership
Married/cohabiting +0.1 +0.3 +1.0 -0.8 +0.6 +0.7
Single/widowed -0.2 0 +0.3 -0.7 +0.2 -0.1
Income
Lowest quartile -0.5 +1.1 +1.4 -0.2 (+0.6) .+02
2nd quartile +0.1 +0.5 +0.7 -0.2 +0.3 +1.2
3rd quartile +1.1 +0.1 +1.1 -0.9 +1.0 +0.8
Highest quartile -0.4 -0.3 +0.4 -1.6 +0.1 -.01
( ) denotes case numbers below 30
+, indicates rising negative feelings (=negative development)
-, indicates declining negative feelings (=positive development)
All dependent variables are measured from 1 to 10 (high)
Data: WVS China 1990 and 2000, own computations
H. Brockmann et al.
123
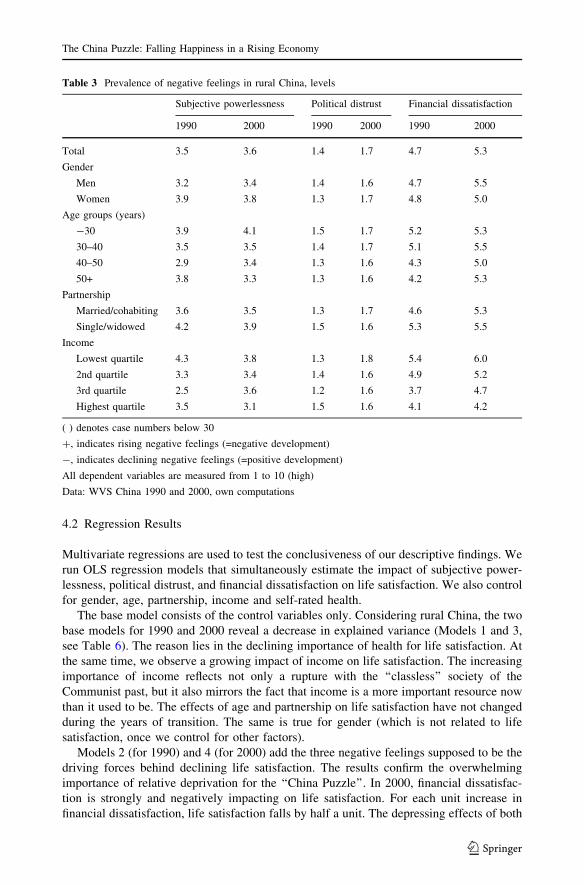
4.2 Regression Results
Multivariate regressions are used to test the conclusiveness of our descriptive findings. We
run OLS regression models that simultaneously estimate the impact of subjective power-
lessness, political distrust, and financial dissatisfaction on life satisfaction. We also control
for gender, age, partnership, income and self-rated health.
The base model consists of the control variables only. Considering rural China, the two
base models for 1990 and 2000 reveal a decrease in explained variance (Models 1 and 3,
see Table 6). The reason lies in the declining importance of health for life satisfaction. At
the same time, we observe a growing impact of income on life satisfaction. The increasing
importance of income reflects not only a rupture with the ‘‘classless’’ society of the
Communist past, but it also mirrors the fact that income is a more important resource now
than it used to be. The effects of age and partnership on life satisfaction have not changed
during the years of transition. The same is true for gender (which is not related to life
satisfaction, once we control for other factors).
Models 2 (for 1990) and 4 (for 2000) add the three negative feelings supposed to be the
driving forces behind declining life satisfaction. The results confirm the overwhelming
importance of relative deprivation for the ‘‘China Puzzle’’. In 2000, financial dissatisfac-
tion is strongly and negatively impacting on life satisfaction. For each unit increase in
financial dissatisfaction, life satisfaction falls by half a unit. The depressing effects of both
Table 3 Prevalence of negative feelings in rural China, levels
Subjective powerlessness Political distrust Financial dissatisfaction
1990 2000 1990 2000 1990 2000
Total 3.5 3.6 1.4 1.7 4.7 5.3
Gender
Men 3.2 3.4 1.4 1.6 4.7 5.5
Women 3.9 3.8 1.3 1.7 4.8 5.0
Age groups (years)
-30 3.9 4.1 1.5 1.7 5.2 5.3
30–40 3.5 3.5 1.4 1.7 5.1 5.5
40–50 2.9 3.4 1.3 1.6 4.3 5.0
50+ 3.8 3.3 1.3 1.6 4.2 5.3
Partnership
Married/cohabiting 3.6 3.5 1.3 1.7 4.6 5.3
Single/widowed 4.2 3.9 1.5 1.6 5.3 5.5
Income
Lowest quartile 4.3 3.8 1.3 1.8 5.4 6.0
2nd quartile 3.3 3.4 1.4 1.6 4.9 5.2
3rd quartile 2.5 3.6 1.2 1.6 3.7 4.7
Highest quartile 3.5 3.1 1.5 1.6 4.1 4.2
( ) denotes case numbers below 30
+, indicates rising negative feelings (=negative development)
-, indicates declining negative feelings (=positive development)
All dependent variables are measured from 1 to 10 (high)
Data: WVS China 1990 and 2000, own computations
The China Puzzle: Falling Happiness in a Rising Economy
123

subjective powerlessness and political distrust are much weaker, and for political distrust
even not significant. One should note that all three main explanatory variables use the same
scale, so that the size of the regression coefficients are directly comparable.
The most striking finding is the increase of the depressing effect of financial dissatis-
faction. In 1990 no relationship between life satisfaction and financial dissatisfaction could
be observed. Whether or not people were dissatisfied with their financial situation did not
matter, controlling for other factors at all for their appraisal of life. Rather, life satisfaction
was more affected by feelings of powerlessness and by subjective health rating. Both
factors play a less important role in 2000. Financial dissatisfaction, however, has a
Table 4 Prevalence of negative feelings in urban China, levels
Subjective powerlessness Political distrust Financial dissatisfaction
1990 2000 1990 2000 1990 2000
Total 4.1 4.3 2.0 1.7 4.9 5.5
Gender
Men 4.1 4.2 2.0 1.7 5.1 5.4
Women 4.2 4.4 1.9 1.7 4.7 5.5
Age groups (years)
-30 4.4 3.9 2.1 1.7 5.2 4.6
30–40 4.0 4.3 2.0 1.7 5.2 5.8
40–50 4.2 4.2 1.9 1.7 4.9 5.9
50+ 3.7 4.7 1.8 1.6 4.3 5.1
Partnership
Married/cohabiting 4.0 4.3 1.9 1.7 4.8 5.5
Single/widowed 4.4 4.4 2.0 1.8 5.5 5.4
Income
Lowest quartile 4.1 5.3 1.6 1.7 6.6 6.8
2nd quartile 4.3 4.8 1.8 1.8 5.1 6.3
3rd quartile 4.0 4.1 1.9 1.6 4.8 5.6
Highest quartile 4.1 3.8 2.2 1.7 4.8 4.7
( ) denotes case numbers below 30
+, indicates rising negative feelings (=negative development)
-, indicates declining negative feelings (=positive development)
All dependent variables are measured from 1 to 10 (high)
Data: WVS China 1990 and 2000, own computations
Table 5 Association between life satisfaction and three independent variables
Rural Urban
1990 2000 1990 2000
Subjective powerlessness -.48*** -.34*** -.45*** -.48***
Political distrust -.17*** -.02 -.31*** -.20***
Financial dissatisfaction -.38*** -.60*** -.41*** -.73***
Data: WVS China 1990 and 2000, own computations
* \ .05, ** \ .01, *** \ .001
H. Brockmann et al.
123

negative, highly significant impact on life satisfaction in 2000 and it turns out to be by far
the most powerful factor in depressing life satisfaction, even dominating the relationship
between subjective health and well-being. Model 4 explains 44% of the variance in life
satisfaction for the rural population, of which nearly half can be attributed to financial
dissatisfaction.
The effect is even more pronounced in urban China. With regard to the base models
(Models 5 and 7, see Table 7), we see again the declining importance of subjective health in
times of collapsing socialized medicine and staggering increases of health care costs
(Economist 2004). Still subjective health remains a strong determinant along with the
growing influence of income. Most strikingly, however, the impact of financial dissatisfaction
on life satisfaction has again skyrocketed. Even though financial dissatisfaction depressed
urban life satisfaction considerably already in 1990, the effect nearly tripled 10 years later.
A decomposition analysis reveals that this enormous increase only marginally stems
from an endowment effect, that is, the change in mean financial dissatisfaction over time.
Instead, 78% of the effect change reflects indeed a growing importance of financial dis-
satisfaction for life satisfaction—at any level of financial dissatisfaction in urban China
(2.18, z = 7.77) (Oaxaca 1973; Blinder 1973).5
Table 6 Explaining life satisfaction for rural China
Model 1 Model 2 Model 3 Model 41990 1990 2000 2000b/t b/t b/t b/t
Gender (1=men) 0.104(0.36)
-0.129(-0.47)
-0.137(-0.72)
0.122(0.75)
Age 0.033*(2.05)
0.022(1.37)
0.024*(2.52)
0.007(0.85)
Age (squared) 0.105(0.28)
0.107(0.30)
-0.068(-0.31)
0.022(0.12)
Married/with partner 1.034(1.94)
0.497(0.94)
0.499(1.54)
0.534(1.93)
Self-rated health 0.228***(4.48)
0.124*(2.42)
0.166***(5.28)
0.029(1.03)
Relative income, log 0.093(0.55)
-0.037(-0.23)
0.481***(4.63)
0.182*(2.05)
Subjective powerlessness -0.356***(-5.25)
-0.205***(-6.19)
Political distrust -0.156(-1.92)
-0.043(-0.77)
Financial dissatisfaction -0.086(-1.51)
-0.491***(-15.52)
Constant 3.851***(5.60)
7.607***(9.01)
4.726***(9.16)
9.304***(16.75)
Adjusted R2 0.177 0.353 0.106 0.442
N 209 172 591 516
Dependent variable: life satisfaction 1–10 (high)
Data: WVS China 1990 and 2000, own computations
* \ .05, ** \ .01, *** \ .001
5 The results for rural areas are similar.
The China Puzzle: Falling Happiness in a Rising Economy
123

Besides financial dissatisfaction, feelings of powerlessness influence life satisfaction as
well, but this effect weakens over time. Similarly, political distrust had a stronger negative
impact on life satisfaction in 1990 than in 2000. Obviously, urban-based Chinese shifted
their priorities for a good life partly from political to economic concerns. When the market
provides goods and services, there is no need for political loyalty but for money. The full
model for urban China explains 59% of the variance in life satisfaction (in 2000), which is
remarkably high for individual-level analysis.
5 Conclusion: Is the China Puzzle Solved?
Over the decade from 1990 to 2000, China experienced a massive improvement in living
standards and yet people’s subjective well-being fell considerably. This puzzling combi-
nation cannot be explained by the ‘Easterlin paradox’ and stands in direct contradiction to
the established notion that subjective well-being increases most strongly when there are
material improvements at low standards of living. We tested three explanations, each
focusing on the negative mental consequences of rapid social changes—anomie, political
disaffection, and relative deprivation. The phenomenon of ‘frustrated achievers’ substan-
tiates the latter approach. Many people in successful transition economies experience
considerable income gains in absolute terms, while their relative income position deteri-
orates (Graham and Pettinato 2002; Ravallion and Chen 2007; Sanfey and Teksoz 2005).
Table 7: Explaining life satisfaction for urban China
Model 5 Model 6 Model 7 Model 81990 1990 2000 2000
Gender (1=men) 0.041(0.27)
0.304*(2.18)
-0.328(-1.27)
-0.188(-1.02)
Age 0.022**(3.17)
0.005(0.75)
-0.002(-0.14)
-0.007(-0.70)
Age (squared) 0.164(0.87)
0.070(0.42)
0.139(0.44)
0.235(1.06)
Married/with partner 0.412(1.88)
0.455*(2.22)
0.568(1.31)
0.562(1.79)
Self-rated health 0.190***(6.93)
0.099***(3.88)
0.240***(5.19)
0.021(0.60)
Relative income, log 0.210(1.62)
0.231(1.88)
0.539***(4.58)
0.031(0.35)
Subjective powerlessness -0.268***(-7.45)
-0.194***(-4.66)
Political distrust -0.166***(-5.13)
-0.112*(-1.98)
Financial dissatisfaction -0.218***(-7.30)
-0.609***(-14.96)
Constant 4.773***(14.81)
8.638***(21.47)
4.490***(6.48)
10.521***(17.70)
Adjusted R2 0.097 0.341 0.149 0.586
N 728 645 355 334
Dependent variable: life satisfaction 1–10 (high)
Data: WVS China 1990 and 2000, own computations
* \ .05, ** \ .01, *** \ .001
H. Brockmann et al.
123

This pattern can be explained by a top-heavy biased income inequality, placing a
growing proportion of the population below the rising national income mean. Rising
relative deprivation turns these people into ‘frustrated achievers’—people who have
achieved higher incomes in absolute terms, but who are dissatisfied when it comes to their
income position relative to the winners. Our analysis uncovers two consequences of this
pattern: (1) financial dissatisfaction rises and (2) becomes a stronger factor in depressing
life satisfaction. A fast-paced commodification of a growing number of areas of life makes
financial dissatisfaction the strongest depressor of subjective well-being.
The depressive effects of anomie and political disaffection are less pronounced. This is
particularly true for political disaffection, which we found to be unrelated to life satis-
faction in urban areas, once other factors are controlled for (similarly for Hong Kong, see
Wong et al. 2006). Moreover, political disaffection has not increased, but on the contrary
decreased over time, at least in urban regions. In a similar vein, anomic feelings have
become less consequential for subjective well-being in both urban and rural areas, even
though they remain an important depressor of life satisfaction.
More research is needed to fully understand why financial dissatisfaction causes such a
profound decrease in subjective well-being in China. We suspect that the main reason lies
in China’s rapid transition to a capitalist economy, with all its structural and ideological
repercussions. As long as the Chinese lived in a planned subsistence economy, the ful-
fillment of needs depended on political loyalty or family ties, and money mattered little.
However, in a capitalist economy in which many areas of life like health care, retirement or
education are commodified, money does matter. In capitalism money is the key to get
goods, services, security and also social reputation—in short: for subjective well-being. In
the ideological realm, the cultural meaning of economic success has changed completely.
Once deemed immoral under the doctrine of Communism, economic success has now
become the prime goal of life: ‘‘Becoming rich is glorious,’’ claims the new official
doctrine—propagating a Confucian version of the Calvinistic predestination doctrine that
gave rise to Western capitalism. As a consequence, it is unsurprising that money means
happiness in today’s China, and that financial dissatisfaction is on the rise.
However, it might well be that the phenomenon of the ‘frustrated achievers’ will be limited
to the initial stage of growth in rapidly rising economies and that its prevalence will fade away
once the income distribution becomes more egalitarian again, with equally large tails above
and below the national income mean. In the same vein, the outraging materialistic lust in the
initial growth phase may cool down afterwards. Once the emerging Chinese middle class has
satisfied its initial hunger for consumption, other concerns such as freedom and democracy
might gain prominence, as the ‘‘human development’’ model of Welzel et al. (2003) suggests.
An alternative explanation of the declining happiness in China could be transformations
in social relations and ties. Unfortunately, the WVS does not provide sufficiently indicative
measures of how well respondents are socially related to family, friends, and neighbours,
so we cannot test this alternative explanation. Still, the pattern we discover is so strong that
we doubt that any alternative explanation could wash it away.
We suggest two lines of future research. First, a comparison of our results for China
with other BRICS-countries (Brazil, Russia, India, China, South Africa) is needed to see if
the combination of ‘‘frustrated achievers’’ and the ‘‘monetarization of happiness’’ could be
a pattern common to all rapidly transforming economies. Second, a continuous observation
of income distributions, financial dissatisfaction, and subjective well-being is needed to see
if what we found is transitory, possibly fading away after the initial stages of economic
progress. For this purpose, future research should elaborate more precisely on the mech-
anisms of rising aspirations and social comparisons.
The China Puzzle: Falling Happiness in a Rising Economy
123
References
Andrews, F. M., & Withey, S. B. (1976). Social indicators of well-being. Americans’ perceptions of lifequality. New York: Plenum Press.
Blinder, A. S. (1973). Wage discrimination: Reduced form and structural estimates. The Journal of HumanResources, 8, 436–455.
Campbell, A., et al. (1976). The quality of American Life. Perceptions, evaluations, and satisfactions. NewYork: Russel Sage Foundation.
Chen, M., & Yang, B. (2001). Report on public value survey in China (in Chinese). Research Center forContemporary China, Peking University, Beijing, China. http://data.library.ubc.ca/datalib/survey/icpsr/4531/99-04/China_WVS_2001_1.pdf
Clark, A., & Oswald, A. (1996). Satisfaction and Comparison Income. Journal of Public Economics, 61,359–381.
D’Ambrosio, C., & Frick, J. (2007). Income satisfaction and relative deprivation: An empirical link. SocialIndicators Research, 81, 497–519.
Delhey, J., & Kohler, U. (2006). From nationally bounded to Pan-European inequalities? On the importanceof foreign countries as reference groups. European Sociological Review, 22, 125–140.
Deng, X., & Cordilia, A. (1999). To get rich is glorious: Rising expectations, declining control and esca-lating crime in contemporary China. International Journal of Offender Therapy and ComparativeCriminology, 43, 211–229.
Diener, E. (2006). Guidelines for national indicators of subjective well-being and ill-being. Journal ofHappiness Studies, 7, 397–404.
Diener, E. D., & Diener, C. (1995). The wealth of nations revisited: Income and quality of life. SocialIndicators Research, 36, 275–286.
Durkheim, E. (1933). The division of labour in society. New York: Free Press.Easterlin, R. A. (1974). Does economic growth improve the human lot? Some empirical evidence. In P. A.
David & M. W. Reder (Eds.), Nations and households in economic growth. New York: AcademicPress.
Easterlin, R. A. (1995). Will raising the incomes of all increase the happiness of all? Journal of EconomicBehavior and Organization, 27, 35–47.
Easterlin, R. A. (2005). Feeding the illusion of growth and happiness: A reply to Hagerty and Veenhoven.Social Indicators Research, 74, 429–443.
Economist (2004). China’s health care. Where are the patients? Economist, Aug 19th, 20–24.Frank, R. H. (1997). The frame of reference as a public good. The Economic Journal, 107, 1832–1847.Frey, B. S., & Kirchgassner, G. (2002). Demokratische Wirtschaftspolitik. Theorie und Anwendung.
Munchen: Vahlen.Gecas, V. (1989). The social psychology of self-efficacy. Annual Review of Sociology, 15, 291–316.Gecas, V., & Schwalbe, M. L. (1983). Beyond the looking-glass self: Social structure and efficacy-based
self-esteem. Social Psychology Quarterly, 46, 77–88.Gong, T. (1994). The politics of corruption in contemporary China: An analysis of policy outcomes.
Wesport, Connecticut: Praeger.Graham, C., & Pettinato, S. (2002). Frustrated achievers, winners, losers, and subjective well-being in new
market economies. The Journal of Development Studies, 38, 100–140.Hagerty, M. R., & Veenhoven, R. (2003). Wealth and happiness revisited—growing national income does
go with greater happiness. Social Indicators Research, 64, 1–27.Helliwell, J. F. (2003). How’s life? Combining individual and national variables to explain subjective well-
being. Economic Modelling, 20, 331–360.Hyman, H. H. (1968). Introduction. In H. H. Hyman & E. Singer (Eds.), Readings in reference group theory
and research (pp. 3–21). New York: The Free Press.Inglehart, R. (1997). Modernization and postmodernization. Cultural, economic, and political change in 43
societies. Princeton: Princeton University Press.Inglehart, R., et al. (2000). World values surveys and European values surveys, 1981–1984, 1990–1993, and
1995–1997 [Computer File]. ICPSR Version. (Ann Arbor, MI: Institute for Social Research [producer],Ann Arbor, MI: Inter-university Consortium for Political and Social Research [distributor]).
Inglehart, R., & Welzel, C. (2005). Modernization, cultural change and democracy. The human developmentsequence. New York: Cambridge University Press.
Kelly, H. H. (1968). Two functions of reference groups. In H. H. Hyman & E. Singer (Eds.), Readings inreference group theory and research (pp. 199–206). New York: The Free Press.
Klein, L. R., & Ozmucur, S. (2002). The estimation of China’s economic growth rate. Journal of Economicand Social Measurement, 28, 187–202.
H. Brockmann et al.
123

Knight, J., et al. (2007). Subjective well-being, and its determinants in rural China. Department of Eco-nomics, Oxford University, Discussion Paper Series 334.
Layard, P. R. G. (2005). Happiness. Lessons from a new science. London: Penguin Books.Li, P. (2002). Changes in social stratification in China since the reform. Social Sciences in China, XXIII.Maslow, A. H. (1943). A theory of human needs. Psychological Review, 50, 370–296.Mead, G. H. (1934). Mind, self and society. Chicago: University of Chicago Press.Merton, R. K. (1938). Social structure and anomie. American Sociological Review, 3, 672–682.Merton, R. K., & Kitt, A. S. (1950). Contributions to the theory of reference group behaviour. In R. K.
Merton & P. F. Lazarsfeld (Eds.), Studies in the scope and method of ‘the American soldier’ (pp.40–106). Glencoe: The Free Press.
Nee, V. (1989). A theory of market transition: From redistribution to markets in state socialism. AmericanSociological Review, 54, 663–681.
Oaxaca, R. (1973). Male-female wage differentials in urban labor markets. International Economic Review,14, 693–709.
Ravallion, M., & Chen, S. (2007). China’s (uneven) progress against poverty. Journal of DevelopmentEconomics, 82, 1–42.
Sanfey, R., & Teksoz, U. (2005). Does transition make you happy? European bank for reconstruction anddevelopment (EBRD) working paper No. 91.
Seeman, M. (1959). On the meaning of alienation. American Sociological Review, 24, 783–791.Smith, R. H., et al. (1989). Intrapersonal and social comparison determinants of happiness: A range-
frequency theory analysis. Journal of Personality and Social Psychology Bulletin, 56, 317–325.Stouffer, S. A., et al. (1949). The American soldier. Adjustment during army life. Princeton: Princeton
University Press.Surowiecki, J. (2004). The wisdom of crowds. Why the many are smarter than the few. London: Abacus.Szelenyi, I. (1978). Social inequalities in state socialist redistributive economies: Dilemmas for social policy
in contemporary socialist societies of Eastern Europe. International Journal of Comparative Sociology,19, 63–87.
The National Bureau of Statistics of China (2001). Statistics yearbook 2000. Beijing: China Statistics Press.Turner, R. J., & Roszell, P. (1994). Psychosocial resources and the stress process. In R. Avison & I. H.
Gotlib (Eds.), Stress and mental health: Contemporary issues and prospects for the future (pp. 179–212). New York: Plenum.
Tversky, A., & Griffin, D. (1991). Endowment and contrast in judgments of well-being. In F. Strack,M. Argyle & N. Schwarz (Eds.), Subjective well-being—an interdisciplinary perspective (pp. 101–118). Oxford: Pergamon Press.
Veenhoven, R. (1996). Developments in satisfaction research. Social Indicators Research, 37, 1–46.Veenhoven, R. (2000). Freedom and happiness: A comparative study in forty-four nations in the early
1990s. In E. Diener & E. M. Suh (Eds.), Culture and subjective well-being. Cambridge, MA: The MITPress.
Veenhoven, R., & Hagerty, M. R. (2006). Rising happiness in nations 1946–2004: A reply to Easterlin.Social Indicators Research, 79, 421–436.
Welzel, C., Inglehart, R., & Klingemann H.-D. (2003). The theory of human development: A cross-culturalanalysis. European Journal of Political Research, 42, 341–379.
Wong, C. K., et al. (2006). Sujective well-being, societal condition and social policy—the case study of arich Chinese society. Social Indicators Research, 78, 405–428.
Zhou, X. (2000). Economic transformation and income inequality in Urban China: Evidence from a paneldata. The American Journal of Sociology, 105, 1135–1174.
The China Puzzle: Falling Happiness in a Rising Economy
123