Housing Redevelopment and Neighborhood Change As A Gentrification Process in Seoul, Korea: A Case...
130
THE FLORIDA STATE UNIVERSITY COLLEGE OF SOCIAL SCIENCES HOUSING REDEVELOPMENT AND NEIGHBORHOOD CHANGE AS A GENTRIFICATION PROCESS IN SEOUL, KOREA: A CASE STUDY OF THE WOLGOK-4 DONG REDEVELOPMENT DISTRICT By KIRL KIM A dissertation submitted to the Department of Geography in partial fulfillment of the requirements for the degree of Doctor of Philosophy Degree Awarded: Summer Semester, 2006 Copyright© 2006 Kirl Kim All Rights Reserved
Transcript of Housing Redevelopment and Neighborhood Change As A Gentrification Process in Seoul, Korea: A Case...
THE FLORIDA STATE UNIVERSITY
COLLEGE OF SOCIAL SCIENCES
HOUSING REDEVELOPMENT AND NEIGHBORHOOD CHANGE AS A
GENTRIFICATION PROCESS IN SEOUL, KOREA:
A CASE STUDY OF THE WOLGOK-4 DONG REDEVELOPMENT DISTRICT
By
KIRL KIM
A dissertation submitted to the Department of Geography in partial fulfillment of the
requirements for the degree of Doctor of Philosophy
Degree Awarded: Summer Semester, 2006
Copyright© 2006 Kirl Kim
All Rights Reserved
ii
The members of the Committee approve the dissertation of Kirl Kim defended on April 14, 2006.
Barney Warf Professor Directing Dissertation Tim Chapin Outside Committee Member Dan Klooster Committee Member Jonathan Leib Committee Member Approved: Barney Warf, Chair, Department of Geography David Rasmussen, Dean, College of Social Sciences The Office of Graduate Studies has verified and approved the above named committee members.
iii
TABLE OF CONTENTS
LIST OF TABLES.............................................................................................................. v
LIST OF FIGURES ........................................................................................................... vi
ABSTRACT..................................................................................................................... viii
CHAPTER 1 INTRODUCTION ....................................................................................... 1
Definitions of Gentrification........................................................................................... 3
Research Questions......................................................................................................... 5
Research Methods........................................................................................................... 6 Quantitative Method Using Multivariate Statistics..................................................... 7 Qualitative Method Using Semi-structured Interviews .............................................. 8
Sketch of Dissertation ..................................................................................................... 9
CHAPTER 2 COMPETING EXPLANATIONS FOR GENTRIFICATION ................. 10
The Supply-Side Interpretation: The Rent Gap Hypothesis ........................................ 12
The Demand-Side Interpretation: The Post-Industrial City Thesis ............................. 16
The Political Interpretation of Gentrification ............................................................... 19
Integration of Supply- and Demand-Side Interpretations of Gentrification ................. 21
Extensions of Gentrification Research.......................................................................... 22
Summary ....................................................................................................................... 25
CHAPTER 3 THE CONTEXT OF GENTRIFICATION IN SEOUL ............................ 27
The General Development of Seoul.............................................................................. 28
Changes in Maximum Residential and Commercial Land Values ............................... 29 The Spatial Pattern of Maximum Residential Land Values...................................... 30 The Spatial Pattern of Maximum Commercial Land Values.................................... 35
Changes in Seoul’s Economy, Labor Force, and Income Structure ............................. 38 The Transformation of Seoul’s Labor Force ............................................................ 41 The Transformation in Earnings and Income Structure............................................ 41
The Demographic Transformation of Seoul ................................................................. 45
Changes in Government Industrial Policies.................................................................. 48
Summary ....................................................................................................................... 50
CHAPTER 4 ALTERNATIVE MODELS FOR EXPLAINING GENTRIFICATION IN SEOUL.............................................................................................................................. 52
Analysis of Dong .......................................................................................................... 52
Hypotheses Explaining Gentrification in Seoul............................................................ 55
iv
Operational Definition of Gentrification in Seoul and Selection of Independent Variables ....................................................................................................................... 56
Correlations................................................................................................................... 66
Factor Analysis ............................................................................................................. 68
Stepwise Regression from Factor Analysis .................................................................. 81
Summary ....................................................................................................................... 82
CHAPTER 5 A CASE STUDY OF GENTRIFICATION: THE WOLGOK4-DONG REDEVELOPMENT........................................................................................................ 84
Description of the Study Area....................................................................................... 84 Location of the Study Area ....................................................................................... 85 Before and After Redevelopment ............................................................................. 88
Changes in Residents’ Composition ............................................................................. 93 Gentrifiers’ Demographic Attributes ........................................................................ 94 Gentrifiers’ Economic Attributes.............................................................................. 94
In-Migration Patterns .................................................................................................... 95 Motivations for Movement ....................................................................................... 96
The Role of the Gu Government................................................................................... 99
Summary ..................................................................................................................... 100
CHAPTER 6 CONCLUSIONS ..................................................................................... 103
APPENDIX A................................................................................................................. 107
APPENDIX B ................................................................................................................. 108
APPENDIX C ................................................................................................................. 110
APPENDIX D................................................................................................................. 112
REFERENCES ............................................................................................................... 114
BIOGRAPHICAL SKETCH .......................................................................................... 120
v
LIST OF TABLES
Table 1: The Employment Structure of Seoul by Industry, 1991-2001............................ 39
Table 2: Korean TNCs Included Within Global Fortune 500 List, 2005........................ 40
Table 3: Changes in Employment by Occupation in Korea, 1990 and 2000.................... 41
Table 4: Earning Differences by Occupation in Korea, 1990–2000 (Clerks = 100). ....... 42
Table 5: Changes in Average Real Household Income in Korea, 1990 - 2000. ............... 43
Table 6: Changes in Household Size in Seoul, 1990 and 2000. ....................................... 45
Table 7: Changes in Composition of Females Employed by Marital Status in Korea, 1990-2000. ................................................................................................................ 46
Table 8: Percentage of Professional Workers among Females Employed in Korea, ....... 47
Table 9: Foreign Workers in Korea, 1990 and 2000. ....................................................... 48
Table 10: Statistical Summary of Social Status Indexes and Gentrification Index. ......... 58
Table 11: Independent Variables and Correlations with Gentrification Index across 522 Dong in Seoul. .......................................................................................................... 65
Table 12: Variables and Factor Loadings. ........................................................................ 69
Table 13: Classification of Factors. .................................................................................. 72
Table 14: Results of the Stepwise Regression. ................................................................. 81
Table 15: Joint Redevelopment Projects in Seoul (as of June, 2002)............................... 88
Table 16: Comparison of Housing and Cheonse Prices between Pre- and Post-Redevelopment. (Unit: Won/m2) ............................................................................. 88
Table 17: Change of Residential Environment of Wolgok4-dong Redevelopment District.
................................................................................................................................... 89
vi
LIST OF FIGURES
Figure 1: Conception of the Rent Gap. ............................................................................. 13
Figure 2: The Evolution of Land Values in Chicago (after Hoyt 1933)........................... 14
Figure 3: Evolution of the Ground Rent Surface and Land Value Valley Following Gentrification. ........................................................................................................... 16
Figure 4: Maximum Residential Land Values Per Dong, 1991....................................... 31
Figure 5: Maximum Residential Land Values Per Dong, 2001....................................... 32
Figure 6: Changes in Maximum Residential Land Value Per Dong, 1991-2001. ........... 33
Figure 7: Seoul Subway Lines, 2005. .............................................................................. 34
Figure 8: Maximum Commercial Land Values Per Dong, 1991. .................................... 35
Figure 9: Maximum Commercial Land Values Per Dong, 2001. .................................... 36
Figure 10: Maximum Commercial Land Value Changes Per Dong, 1991-2001. ........... 38
Figure 11: Korea's Unemployment Rate, 1981-2004. ..................................................... 49
Figure 12: Seoul Gu, 2000. .............................................................................................. 53
Figure 13: Seoul Dong, 2000. .......................................................................................... 54
Figure 14: Social Status Index Distribution, 1990........................................................... 59
Figure 15: Social Status Index Distribution, 2000........................................................... 60
Figure 16: Percent Change in Social Status Indexes, 1990-2000. ................................... 61
Figure 17: Gentrification Index Distribution, (Social Status 2000-1990). ...................... 62
Figure 18: Histograms of Factor Scores. .......................................................................... 73
Figure 19: Distribution of Scores of Factor 1 (Housing Factor)....................................... 74
Figure 20: Distribution of Scores of Factor 2 (Population Change Factor)...................... 75
Figure 21: Distribution of Scores of Factor 3 (Post-Industrial City Status Factor). ........ 76
Figure 22: Distribution of Scores of Factor 4 (Population and Household Factor).......... 77
vii
Figure 23: Distribution of Scores of Factor 5 (Rent Gap Factor). ................................... 78
Figure 24: Distribution of Scores of Factor 6 (Fiscal Independence Factor). ................. 79
Figure 25: Distribution of Scores of Factor 7 (Family Size and Housing Factor)........... 80
Figure 26: Location of the Study Area (Wolgok4-Dong). ................................................ 85
Figure 27: Wolgok4-dong Map Before Redevelopment, 1999. ........................................ 90
Figure 28: Wolgok4-dong After Redevelopment, 2003.................................................... 91
Figure 29: Wolgok4-dong Before Redevelopment, 1999. ................................................ 92
Figure 30: Wolgok4-dong After Redevelopment, 2003.................................................... 93
Figure 31: In-Migrants' Addresses prior to Moving (Total: 262 Households). ............... 95

viii
ABSTRACT
This dissertation investigates housing redevelopment and neighborhood change
as a gentrification process in Seoul, Korea. Gentrification is the restoration and upgrading
of deteriorated urban property by the middle class and commercial developers, often
causing displacement of low income people. It has spilled beyond the traditional confines
of cities in the Western world to reshape cities in much of Asia as well. Given the
western bias of most social science, little is known about the dynamics of cities in
countries such as Korea, however. As the Korean economy and population have been
steadily transformed over the last two decades, gentrification there has become
increasingly apparent.
In the context of the rent gap thesis, Seoul had potential for gentrification in that
the residential and commercial land values in the inner cities are lower than those of the
CBD, sub-CBDs, and suburbs. In the context of the post-industrial city status thesis
emphasizing economic restructuring such as changes in employment structure, Seoul has
experienced the shift from an industrial city to a post-industrial city. However, Seoul still
had a high dependence on a manufacturing instead of producer services. In the context of
the demographic change thesis, Seoul has experienced a reduction of household size and
a growth of female labor force participation, but the proportion of female labor force
participation was still lower than in American cities and the number of foreign
immigrants was very small compared to global cities such as New York and Tokyo. In
the context of the political restructuring thesis, Korea’s industrial policies have focused
on an export-oriented economic strategy since the 1960s. After the financial crisis in
1997, the role of the Korean central government shrank and competition among local
governments accelerated. Such a political restructuring can be an important force
generating gentrification in Seoul by forcing local governments to compete for people
and investment capital. However, the results obtained from the interviews with city
officials revealed that local governments did not perceive the importance of gentrification
as a mode of increasing their fiscal revenues.
In the statistical analyses of gentrification in Seoul between 1990 and 2000, the
strongest correlations existed between the gentrification index and independent variables
ix
representing post-industrial city status, rent gap, and institutional dimensions. There was
also a significant association between the gentrification index and the decrease in family
size among the 522 dong. Factor analysis revealed that post-industrial city status and rent
gap factors were significant in explaining the changing regional structure of Seoul.
Factors representing population change and fiscal independence were also significant in
accounting gentrification in Seoul. The regression model based upon factor scores was
poor in accounting for the variation in gentrification in Seoul (R2 = 0.2098). However,
the result revealed that gentrification in Seoul was affected by the rent gap, its post-
industrial city status, demographic changes, and institutional characteristics, excluding
housing type and ownership characteristics.
In the case study of Wolgok-4 dong, the study area changed from blighted
detached housing to huge apartment complexes. The neighborhood changed from low
class residential areas to middle class residential areas through the redevelopment as a
gentrification process. The neighborhood’s physical and qualitative changes were
accompanied by changes in its residents’ composition. Existing residents were replaced
by middle class people in their 30s and 40s employed in management, administration,
business, and professional occupations and with an educational level higher than the
university degree. In terms of land values, the housing sale price after redevelopment
increased by about 240 percent and the cheonse price increased by 522 percent. This fact
revealed that the rent gap thesis was applicable to the study area in that after
redevelopment, the rent gap drastically decreased and in-movers considered the
differential revenue created before and after redevelopment to be a motivation for their
movement. In the patterns of movement, short distance migration was more frequent than
that over long distances and the proportion of gentrifiers was relatively low when
compared with total in-mover households. Korean gentrifiers’ major motivations for
movement were the inner city’s accessibility to the city center, saving commuting time
and cost, and preferences for the inner city recreational opportunities, the relative
disadvantage of suburban life, and life style changes. Gu governments in Seoul had a
different role from Western countries’ local governments in that whereas the latter induce
gentrification to enhance local tax revenues and neighborhood quality, gu governments in
Seoul emphasized only physical neighborhood upgrading through redevelopment.

x
In conclusion, gentrification in Seoul was similar to Western countries’
gentrification in that it was affected by demographic changes, rent gap, and the city’s
post-industrial city status. However, there existed differences in urban policy between
Korea’s local governments and those in the West in that Korea’s local governments did
not perceive the importance of gentrification as a mode of increasing their fiscal revenues.
Gentrification in Seoul is a relatively small scale phenomenon in terms of the migration
rate of gentrifiers when compared with Western cities.

1
CHAPTER 1
INTRODUCTION
Korea’s urban growth to date has been based on new town development.1 By
focusing on only new town development that enlarges the urban housing supply, the
redevelopment and revitalization of the existing cities has never been given careful
attention. Especially in the inner city, land use planning is required for it to be
redeveloped and improved continuously. If the inner city were a slum area, the country as
well as an entire city would suffer.
Since the early 1990s, Korea’s central government and the Seoul city
government have started to realize the importance of redevelopment in the inner city. The
alternative methods to revitalize deteriorated inner city areas were housing
redevelopment and central city revitalization (Kim et al. 1996; Jeon 1997). Housing
redevelopment in Seoul is similar to gentrification in that it refers to the restoration and
upgrading of deteriorated urban property by the middle class and commercial developers,
often causing the displacement of low income families (Smith and Williams 1986, p. 1).
Gentrification is also an alternative method for the redevelopment and revitalization of
the existing cities in that it can restore and upgrade the deteriorated urban property by
displacing low income people. Furthermore, gentrification plays an important role in
restoring deteriorated urban areas, improving the profitability of land use, and revitalizing
urban economic activity, housing, transportation and culture.
Although gentrification has now been identified in a large number of Western
cities, gentrification in Korea has rarely been studied. Smith (2002) argued that
gentrification in Seoul was geographically isolated and in its infancy without offering any
empirical evidence. However, in the context of changes in its economic base through
1 In the early 1990s, five new towns (Bundang, Ilsan, Jungdong, Pyeongchon, and Sanbon) adjacent to Seoul were constructed to alleviate the housing shortage in the urban areas under the central government planning. These new towns became a typical example of the suburb in which the Korean middle class resides (Jeon 1997).
2
industrial restructuring and the negative impacts incurred by the intensification of
suburbanization, Seoul has a great potential for gentrification.
Gentrification is of considerable importance to urban studies, geography, and
planning. Gentrification has spilled beyond the traditional confines of cities in the
Western world to reshape the landscapes of cities in much of Asia as well. Given the
western bias of most social science, little is known about the dynamics of cities in
countries such as Korea, however. As the Korean economy and population have been
steadily transformed over the last 20 years, gentrification there has become increasingly
apparent.
This research uses both primary and secondary data to assess the relative
strengths and weaknesses of two competing perspectives on gentrification, those that
emphasize behavioral and cultural factors and those that stress the labor market. In doing
so, it sheds light on how the broad forces of international restructuring intersect with the
unique context of Seoul, a major metropolis of 10 million people.
The implications of such a project are important for understanding not only
transportation, housing, and land use issues in Korea, but in Asia and more broadly in the
developing world. The study of gentrification in Seoul can be compared with that of
Western cities because Seoul is one of the non-Western cities following Western style
development.
This research explaining gentrification in Seoul has several implications for
geography and other fields. First, whereas gentrification is seen by some city officials as
the savior of the inner cities, heralding a halt to middle class flight to the suburbs and
offering an increased tax base, others regard it as a threat to inner city working class areas.
Second, gentrification in Seoul can be seen to constitute one of the major
leading edges of contemporary Korean metropolitan restructuring triggered by the
International Monetary Fund (IMF) bail-out of 1997 following the fiscal crisis. An
income gap between middle class and low class people was generated by the economic
depression following the fiscal crisis, which in turn triggered middle class people’s
movement into the inner city.
Third, this project can inform one of key theoretical and ideological battles in
urban geography between urban scholars who stress the key role of choice, culture,

3
consumption and consumer demand and those who stress the role of capital, class,
production and supply. In short, this project can reveal the conflict between the
proponents of culture, preference and human agency, and the proponents of the
imperatives of capital and profitability.
The last implication of this project is that it compares gentrification research of
Western cities with Asian ones. In doing so, it raises the question as to whether Western
models can be easily transplanted into non-Western cultural contexts.
Definitions of Gentrification
Gentrification originally was a type of revitalization of low rent areas,
represented as “Victorian barn and cottage in England,” which were replaced by high
class people (Glass 1964). Yeates (1990) divided the concept of urban revitalization into
three sub-concepts composed of redevelopment, incumbent upgrading, and gentrification.
He argued that redevelopment, as differentiated from incumbent upgrading and
gentrification, was frequently characterized by a combination of changes including land
use, structures, types of residential units, per capita income, social status, and stage in the
life cycle of the population. For him, redevelopment meant that there was a complete
change in the neighborhoods, and the original inhabitants were displaced. Gentrification
focused on an influx of upper and middle class households into an area of old homes that
were previously occupied by low income individuals and households. Incumbent
upgrading does not include the kind of social, income, and residential unit changes that
are involved in either gentrification or redevelopment. Since the emergence of the
concept of gentrification, the phenomenon has occupied a large amount of attention in
scholarly journals over the last 30 years.
Gentrification has now been identified in a large number of cities in North
America, Europe and Australia, but despite its expansion during the 1970s, 1980s and
1990s, it was still regarded as “a relatively small scale and very geographically-
concentrated phenomenon” compared with post-war suburbanization and inner city
decline (Hamnett 1991, p. 173).
Glass (1964) defined gentrification as a process of class succession and
displacement in areas broadly characterized by working class and unskilled households
4
first identified in the East End of London. The U.S. Department of Housing and Urban
Development (1979, p. 4) referred to gentrification as “the process by which a
neighborhood occupied by lower income households undergoes revitalization or
reinvestment through the arrival of upper income households.”
Smith and Williams (1986, p. 1) defined gentrification as “the rehabilitation of
working class and derelict housing and the consequent transformation of an area into a
middle class neighborhood.” Similarly, gentrification was defined as “the movement of
middle class families into urban areas causing property values to increase and having the
secondary effect of driving out poorer families” (Shaffer and Smith 1986, p. 347).
Hamnett (1984, p. 284) defined gentrification as:
Simultaneously a physical, economic, social and cultural phenomenon. Gentrification commonly involves the invasion by middle-class or higher-income groups of previously working-class neighborhoods or multi-occupied ‘twilight areas’ and the replacement or displacement of many of the original occupants. It involves the physical renovation or rehabilitation of what was frequently a highly deteriorated housing stock and its upgrading to meet the requirements of its new owners. In the process, housing in the areas affected, both renovated and unrenovated, undergoes a significant price appreciation. Such a process of neighborhood transition commonly involves a degree of tenure transformation from renting to owning.
Similarly, Smith (1987, p. 463) stated:
The crucial point about gentrification is that it involves not only a social change but also, at the neighborhood scale, a physical change in the housing stock and an economic change in the land and housing market. It is the combination of social, physical, and economic change that distinguishes gentrification as an identifiable process/set of processes.
Hamnett (1991, p.176) maintained:
It is clear from above definitions that gentrification involves both a change in the social composition of an area and its residents, and a change in the nature of the housing stock and an adequate explanation of gentrification will have to cover both aspects of the process: the housing and the residents.
Schaffer and Smith (1986, p. 347) argued “gentrification can also occur in
nonresidential areas where the building is economically obsolete but sufficiently sound
that rehabilitation is viable.” In addition, Smith and Williams (1986) held that
gentrification began as a predominantly residential process but has become more broadly
based, involving a fundamental restructuring of central and inner city land uses.

5
The definitions of gentrification have been enlarged and transformed over time.
In different locations gentrification has taken different forms, but the common point is the
renovation of old inner and central city building stock for new uses generally associated
with the middle class. Gentrification is the restoration and upgrading of deteriorated
urban property by the middle class “gentrifiers” or commercial developers, often causing
the displacement of low income people. In the urban revival literature, gentrification is an
alternative method for the redevelopment and revitalization of existing cities in that it can
restore and upgrade deteriorated urban property by displacing low income people.
Gentrification has three specific conditions that must all be met:1) A “back to
the city” movement of the middle class and displacement of lower income residents; 2)
physical upgrading of the neighborhood, particularly of housing stock; and 3) change in
neighborhood quality, such as conversion from slum areas to middle class areas.
In order to explain gentrification in Seoul, this research focuses on what factors
affect gentrification there, how gentrification changes the neighborhood and physical
landscape, and what Korean gentrifiers’ attributes are, and how city officials play a role
in administrating redevelopment plans.
Research Questions
Gentrification is commonly understood as the “rehabilitation of working class
or derelict housing and the consequent transformation of an area into a middle class
neighborhood, often causing the displacement of low income households” (Smith and
Williams 1986, p. 1). This definition includes both gentrifiers’ and gentrified areas’
characteristics. In other words, gentrification means the essential change of gentrified
areas in terms of housing market (housing ownership, price, and condition) and the
changes in local residents’ attributes in terms of social and economic composition.
In order to explain gentrification in Seoul, the following questions are asked:
(1) In relation to the causes of gentrification in Seoul, which factors contribute to
generate gentrification in Seoul, such as demographics, the housing market (i.e.,
the rent gap), post-industrial city status, and urban policy?
6
(2) In the context of neighborhood change, how does the joint redevelopment project
as a process of gentrification change the neighborhood and physical landscape in
Seoul?
(3) In terms of changes in residents’ composition, what are Korean gentrifiers’ social
and economical attributes, their movement pattern and motivations behind their
location choices?
(4) To identify difference of urban policy between Korea’s local governments and
Western countries’ local governments, how do city officials play a role in
administrating redevelopment plans and what is the role of local government in
inducing gentrification?
Research Methods
This research uses cartographic, quantitative, and qualitative methods. The
cartographic method examines changing land value patterns in Seoul to investigate if
Smith’s (1979) rent gap thesis is applicable to Seoul. The quantitative method lays
emphasis on the importance of basing research upon systematic and comparative analysis
to investigate the regional structure of gentrification in Seoul (Babbie 2001). The emphasis
of qualitative methods tends to be placed upon the explanation and understanding of what
is unique and particular to the individual rather than on what is general and universal
(Hay 2000). The study of gentrification necessitates systematic analysis of the regional
structure of gentrification to investigate which factors affect gentrification in a broad
context as well as an individual analysis of gentrifiers to identify their social and
economic attributes in a detailed level.
The cartographic approach uses land value data between 1991 and 2001 to
identify whether Smith’s rent gap thesis is applicable to explain gentrification in Seoul.
The quantitative approach uses census, land values, and archival data to identify which
factors among demographic change, rent gap, economic structure, and policy factors best
explain gentrification in Seoul. It used multivariate statistics offered a comparative and
systematic analysis of gentrification in the 522 administrative dong of Seoul in 1990 (or
1991) and 2000 (or 2001) to prove what factors affect gentrification. Such a statistical
approach is useful to identify the broad structure of gentrification. However, at a more

7
detailed level, it fails to explain what Korean gentrifiers’ characteristics are and how city
officials play a role in administrating redevelopment plans.
In order to complement the statistical approach, this study selected Wolgok 4-
dong as a case study area. Semi-structured interviews with Korean gentrifiers and city
officials were used to reveal individual gentrifiers’ demographic and economic attributes,
their movement patterns and their motivations behind their location choices, and to
investigate the role of city officials who administer redevelopment plans.
This research strategy integrating cartographic analysis, multivariate statistics
and semi-structured interviews is a triangulation method. Denzin (1978, p. 291) defined
triangulation as “the combination of methodologies in the study of the same
phenomenon.” Triangulation using cartographic, quantitative, and qualitative methods
has three major purposes: (1) It provides a vehicle for cross-checking various results; (2)
The respective weakness of each method and dataset can be counterbalanced by
appealing to the strengths of the others; and (3) The interplay between the findings often
provides insights that would have not been available had only one technique been
employed (England 1993).
Quantitative Method Using Multivariate Statistics
Gentrification is a complex phenomenon related to demographics, housing
markets, economic restructuring, and urban politics. In order to answer the question
regarding what factors generate gentrification in Seoul, 28 variables representing
demographic, housing market, economic and institutional policy characteristics were
selected. Multivariate statistics included correlations, factor analysis, and stepwise
regression. S-Plus 6.2 was used for calculating multivariate statistics.
First, 522 dong as the unit of analysis were defined and their locations were
mapped. Second, data on demographic, housing market, economic and institutional
policy characteristics were examined and 28 variables were consolidated into four
principle characteristics. Third, four major characteristics were made operational through
a set of indicators that served as independent variables in the analysis. Fourth, operational
definitions of gentrification in the dong of Seoul were established by measuring the social
status index computed by occupation and education. Fifth, after the standardization of

8
independent variables, correlations between the gentrification index and the 28
independent variables were calculated. Sixth, the factor scores from correlations of the 28
independent variables were computed through principle component factor analysis. In
last stage, scores from the computed independent factors were regressed against the
gentrification index to examine which factors explain gentrification in Seoul, using the
stepwise regression method.
Qualitative Method Using Semi-structured Interviews
Multivariate statistics could not explain individual gentrifiers’ demographic and
economic attributes, their movement patterns, motivations of location choices, or the role
of city officials and local governments. To obtain more detailed information, the
Wolgok4-dong redevelopment district was selected as a case study and semi-structured
interviews were conducted with Korean gentrifiers and city officials. The data collection
method was semi-structured interviews that employ an interview guide (Appendix C and
D). The semi-structured interviews were organized around an ordered but flexible set of
questions.
The selection of interviewees was based on the random sampling from
addresses in the residents’ registry obtained from the Wolgok4-dong office with the help
of the office head. Fifty households were selected as prospective interviewees. A letter
including the purpose of research and informed consent form (Appendix B) was sent to
them and 12 residents replied. After a call for confirmation, 10 residents were selected as
interviewees. Two city officials were selected as interviewees in Seongbuk-gu. The
interviews were conducted in July, 2005 by visiting the interviewees’ houses and offices.
Before conducting the interviews, some information was presented to enable
persons to voluntarily decide whether or not to participate as a research subject
(Appendix B). After they agreed to participate, the interviews began with prepared
interview questionnaires (see Appendix C and D) and the conversation was tape recorded.
After completing individual interviews, verbatim transcripts of the interviews were typed
for analysis. The contents of interviews for gentrifiers and city officials were excerpted to
explain gentrifiers’ demographic and economic attributes, their movement patterns,
9
motivations underlying their location choices, and examining the role of city officials and
local government.
Sketch of Dissertation
Chapter 2 presents a review of the literature regarding debates over
gentrification and outlines what forces have driven gentrification in Western cities. A
detailed theoretical expectation for gentrification in Seoul is presented in Chapter 3.
Chapter 3 explores the context of gentrification in Seoul regarding changes in maximum
land values, economic base, demographics, and politics based on the “rent gap,” “post-
industrial,” and “world city” theses. Chapter 4 offers an empirical analysis of
gentrification in the 522 administrative dong of Seoul in 1991 and 2001 using
correlations, factor analysis, and stepwise regression. It reveals that gentrification in
Seoul is mainly affected by the changes in land values, demographics, economic base,
and institutional policy characteristics, excluding housing type and ownership. Chapter 5
investigates gentrifiers’ demographic and economic characteristics, movement patterns
and motivation for location choices. It also examines the role of city officials and local
government to induce gentrification in Seoul by using semi-structured interview and
archival data. Brief summaries of each chapter along with concluding comments are
found in Chapter 6. Collectively, the results of my theoretical and empirical
investigations show that gentrification in Seoul has the same pattern as Western cities in
that the rent gap and post-industrial city status theses are applicable to explain
gentrification in Seoul, but there are difference of urban policy between Korea’s local
governments and Western countries’ local governments. Gentrification in Seoul is a
relatively small scale phenomenon in terms of the volume of gentrifiers when compared
with Western cities.
10
CHAPTER 2
COMPETING EXPLANATIONS FOR GENTRIFICATION
This chapter reviews the debates surrounding the explanations of gentrification
and considers what forces have driven gentrification. Furthermore, it explores the
extension and the diversity of research themes on gentrification from the late 1970s to the
early 2000s.
The literatures that document and explain the rise of gentrification are extensive.
However, Berry (1980, 1985) regarded gentrification as an ephemeral phenomenon
created by the sudden demographic changes of the baby boom. He explained the
emergence of “islands of renewal” as the outcome of metropolitan housing construction
and filtering processes that produced vast “seas of decay” (Berry 1985) in the urban core.
Bourne (1993a) predicted the “demise of gentrification” due to an ageing of the baby
boom, declining real incomes, and a relative reduction in the supply of inner city housing.
He also argued (1993b) that gentrification affected urban housing markets only slightly
during the economic recession of the early 1990s. Even Neil Smith, one of the major
figures in gentrification research, asserted that it had not yet had much of an effect on
inner city decline (Smith 1986). Despite skepticism, traditionally, there have been five
sets of arguments related to the causes and effects of gentrification since Glass (1964)
coined the term gentrification.
First, Smith (1979, 1996) argued that gentrification was mainly driven by
capital and land markets. He suggested that the same economic forces that drove
suburbanization in the U.K. and the U.S. after World War II had driven the
reurbanization of capital. He asserted that gentrification was generated by capital, not
people, by explaining the reinvestment of capital into the inner city with the concept of
the “rent gap” between actual and potential land rents (Smith 1979). Smith (1979, 1996)
stressed the production of urban space, the operation of the housing and land market, and
the role of capital and collective social actors such as developers and mortgage finance
institutions on the supply of gentrifiable properties. His supply-side interpretation of
gentrification ignited the debates regarding different explanations of gentrification.

11
Second, in contrast to Smith’s supply-side interpretation, Ley (1980, 1986,
1996) and Hamnett (1991, 2003) argued that gentrification was the product of the
changing industrial structure of major cities during the conversion from a manufacturing
to a producer service economy and the concomitant changes in the occupational class
structure from manual labor classes to white-collar classes composed of professionals,
managers, administrators, and technicians, which were concentrated in major cities.
Ley’s (1980, 1986) “post-industrial city status thesis” is contextually associated with
Sassen’s (1991) and Friedmann’s (1986) “world city hypothesis,” which assumes a
convergence in the economic base, spatial organization and social structure among the
world’s major cities such as New York, London and Tokyo.
Third, related to Ley’s and Hamnett’s emphasis on the demand-side
interpretation of economic change, Bondi (1991), Bridge (1995), Butler (1997), and
Butler and Robson (2003) argued that changes in demographic and cultural preferences
of the middle class generated gentrification. They noticed the increasing feminization of
the professional labor force, the growing importance of dual income professional
households, and the changes in the working patterns of the middle class, which prefers
short commuting distances by living in the inner city to long commuting distances from
the suburbs.
The fourth argument was that gentrification was related to the politics and
policies of urban redevelopment (Fainstein and Fainstein 1986). Kennedy and Leonard
(2001) argued that gentrification should be understood in the context of the politically
charged urban development process. Smith (1979, 2002) and Hackworth and Smith
(2001) asserted that the changing role of the state and the local government was
important for understanding gentrification in inner city areas. In terms of the role of the
state and the local government, central and local governments set up overall strategies to
direct revitalization in targeted areas of central and inner cities, to attract middle class in
order to gain much more local tax revenues, and to curb the disinvestment of capital into
suburbs (Cox 2002). Such a revival policy can be another driving force of gentrification
(Kennedy and Leonard 2001).
Fifth, there was the explanation suggested by Redfern (1997), who argued that
gentrification took place because of the availability and falling real cost of domestic
12
technologies that permitted 19th-century houses to be modernized and upgraded to
contemporary standards. He argued that gentrification depended on the ability to create
modernized houses. This was an important point but it seemed to be a sufficient, rather
than a necessary, factor for gentrification to occur. The reason was that if the supply of
gentrifiable properties and the demand for them were not there, technology alone would
be unlikely to lead to gentrification. Redfern’s argument did not explain gentrification
because his view was based on technological determinism.
Except for political and technological interpretations of gentrification, three
major arguments can be summarized as two versions of supply-side views and one
demand-side interpretation. While some studies examine property that is gentrified, other
literatures focus on the production of gentrifiers. In both cases, supply-side
interpretations emphasize the economic and social factors that produce an attractive
housing supply in the inner city for the middle class individuals, and demand-side
interpretations stress consumer preferences, for demographic or cultural reasons, for the
buildings and areas that become gentrified.
As described above, the research on gentrification has resulted in interesting
confrontations and collaborations between those arguing for the analytical priority of
capital (Smith 1979, 1996) and those arguing for the importance of cultural and
demographic changes (Ley 1980, 1986, 1996; Hamnnett 1991, 2003). The next parts
review the debates over explanations of gentrification in more detail.
The Supply-Side Interpretation: The Rent Gap Hypothesis
Smith (1979, 1996) argued that the driving force behind gentrification was not
the new middle class but the growing gap between property values and underlying land
values in the inner city. He stressed that the supply of gentrifiable properties and the
operation of the urban land and housing markets were the key elements generating
gentrification.
To explain gentrification, Smith (1979) suggested the two concepts of
capitalized land rent and potential land rent and theorized the gap between the two land
rents as the “rent gap.” He defined land rent as “a claim made by landowners on users of
their land; it represents a reduction from the surplus value over and above the cost-price
13
by the producers on the site” (Smith 1979, p. 543). He further identified capitalized land
rent as “the actual quantity of ground rent that is appropriated by the landowner, given
the present use” (Smith 1979, p. 543). Potential land rents represent the amount of land
rent appropriated by the landowner if the land were put to its “highest and best” use.
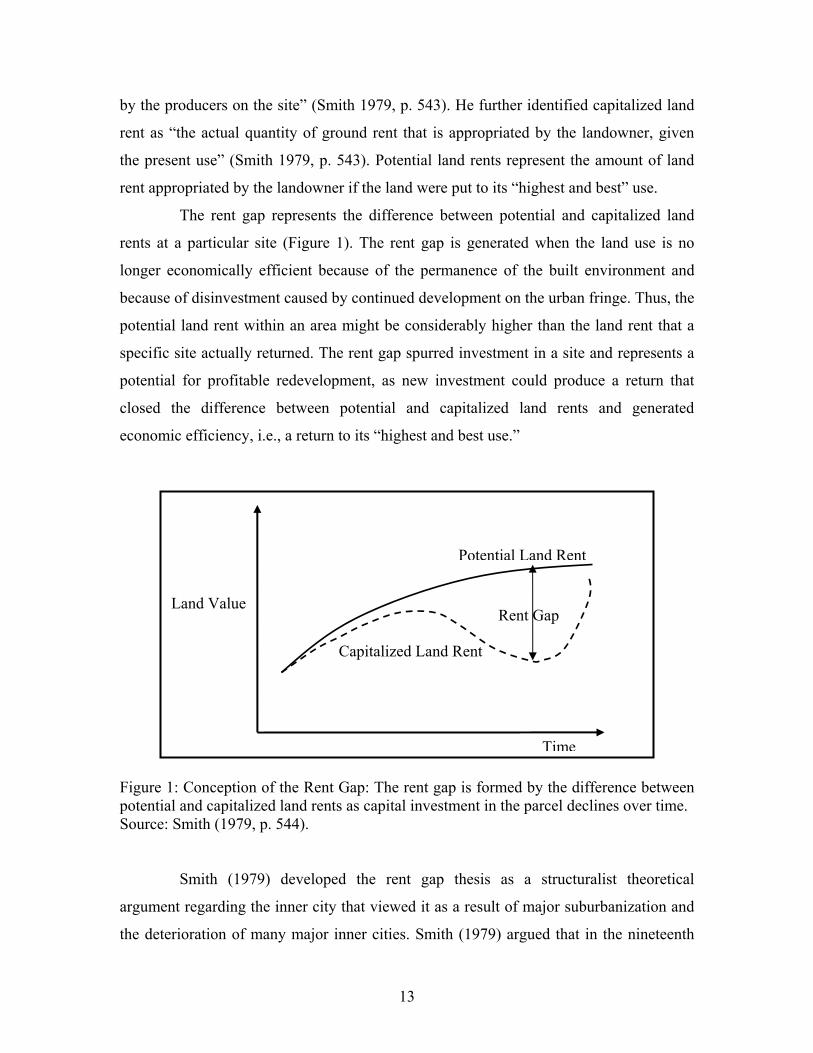
The rent gap represents the difference between potential and capitalized land
rents at a particular site (Figure 1). The rent gap is generated when the land use is no
longer economically efficient because of the permanence of the built environment and
because of disinvestment caused by continued development on the urban fringe. Thus, the
potential land rent within an area might be considerably higher than the land rent that a
specific site actually returned. The rent gap spurred investment in a site and represents a
potential for profitable redevelopment, as new investment could produce a return that
closed the difference between potential and capitalized land rents and generated
economic efficiency, i.e., a return to its “highest and best use.”
Figure 1: Conception of the Rent Gap: The rent gap is formed by the difference between potential and capitalized land rents as capital investment in the parcel declines over time. Source: Smith (1979, p. 544).
Smith (1979) developed the rent gap thesis as a structuralist theoretical
argument regarding the inner city that viewed it as a result of major suburbanization and
the deterioration of many major inner cities. Smith (1979) argued that in the nineteenth
Time
Land Value
Potential Land Rent
Capitalized Land Rent
Rent Gap
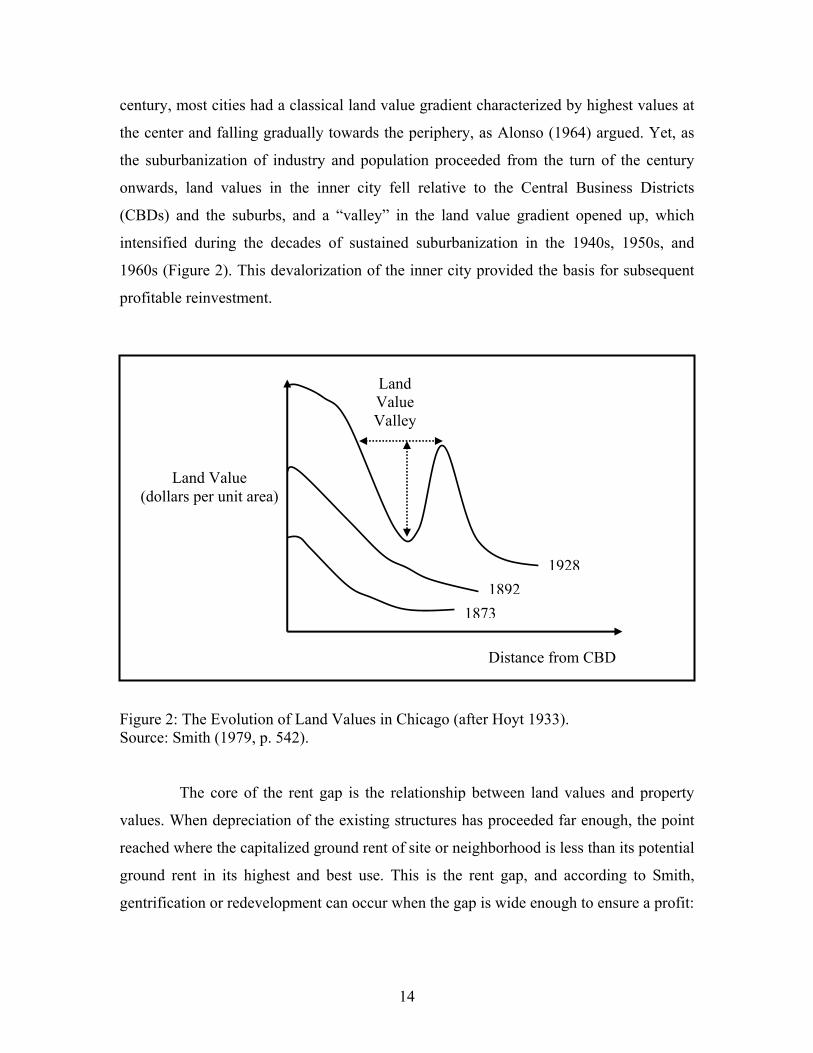
14
century, most cities had a classical land value gradient characterized by highest values at
the center and falling gradually towards the periphery, as Alonso (1964) argued. Yet, as
the suburbanization of industry and population proceeded from the turn of the century
onwards, land values in the inner city fell relative to the Central Business Districts
(CBDs) and the suburbs, and a “valley” in the land value gradient opened up, which
intensified during the decades of sustained suburbanization in the 1940s, 1950s, and
1960s (Figure 2). This devalorization of the inner city provided the basis for subsequent
profitable reinvestment.
Figure 2: The Evolution of Land Values in Chicago (after Hoyt 1933). Source: Smith (1979, p. 542).
The core of the rent gap is the relationship between land values and property
values. When depreciation of the existing structures has proceeded far enough, the point
reached where the capitalized ground rent of site or neighborhood is less than its potential
ground rent in its highest and best use. This is the rent gap, and according to Smith,
gentrification or redevelopment can occur when the gap is wide enough to ensure a profit:
Distance from CBD
Land Value (dollars per unit area)
18731892
1928
Land Value Valley

15
Once the rent gap is wide enough, gentrification may be initiated in a given neighborhood by several different actors in the land and housing market. And here we come back to the relationship between production and consumption, for the empirical evidence suggests strongly that the process is initiated not by the exercise of those individual consumer preferences much beloved of neoclassical economists, but by some form of collective social action at the neighborhood level (Smith 1979, p. 545). Smith’s opposition to any explanations of gentrification based on individual consumer
preferences was clear, and referring to the importance of mortgage funding in this process,
he argued that:
All the consumer preference in the world will come to nought unless this long absent source of funding reappears; mortgage capital must be borrowed by willing consumers exercising some preference or another. But these preferences are not prerequisites since they can be socially created (Smith 1979, pp. 545-546).
Smith summarized his thesis as follows:
Gentrification is a structural product of the land and housing markets. Capital flows where the rate of return is highest, and the movement of capital to the suburbs along with the continual depreciation of inner city capital, eventually produces the rent gap. When this gap grows sufficiently large, rehabilitation (or for that matter, renewal) can begin to challenge the rates of return available elsewhere and capital flows back (Smith 1979, p. 546). He argued “gentrification is a back-to-the-city movement, but a back-to-the-city
movement by capital rather than people” (Smith 1979, p. 547).
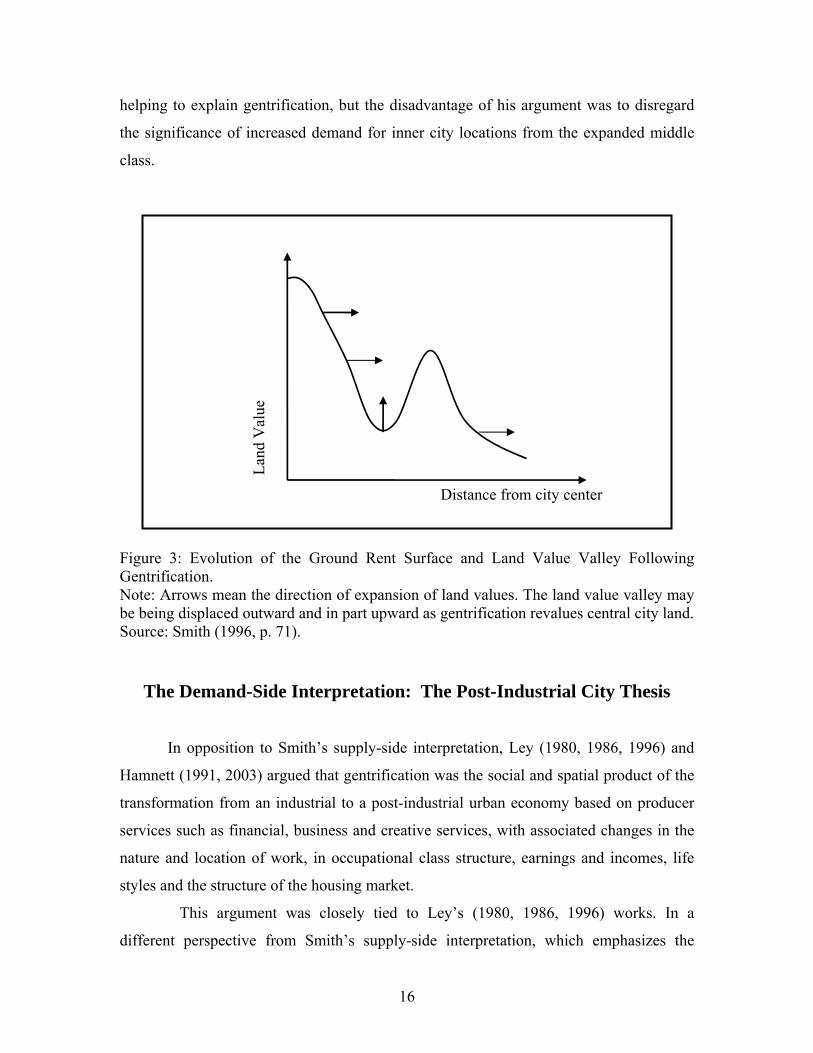
Smith (1996, p. 70) also maintained that the advent of gentrification in the late
20th century demonstrated that, contrary to the conventional neoclassical wisdom, middle
and upper class housing could be intensively developed in the inner city. In addition, he
suggested that gentrification itself had significantly altered the urban ground rent gradient
and that the land value valley might be being displaced outward and in part upward as
gentrification revalues central city land (Figure 3).
Smith’s thesis offered a theoretical basis for understanding why gentrification
occurs, but failed to explain the questions on the identity and characteristics of gentrifiers.
In his view, the focus on cultural values and residential preferences of the new middle
class was a diversion from the key issues that involved the structure of the land and
property market and its financing, rather than demand and preference. Smith was clearly
right regarding the importance of capital depreciation and subsequent reinvestment in
16
helping to explain gentrification, but the disadvantage of his argument was to disregard
the significance of increased demand for inner city locations from the expanded middle
class.
Figure 3: Evolution of the Ground Rent Surface and Land Value Valley Following Gentrification. Note: Arrows mean the direction of expansion of land values. The land value valley may be being displaced outward and in part upward as gentrification revalues central city land. Source: Smith (1996, p. 71).
The Demand-Side Interpretation: The Post-Industrial City Thesis
In opposition to Smith’s supply-side interpretation, Ley (1980, 1986, 1996) and
Hamnett (1991, 2003) argued that gentrification was the social and spatial product of the
transformation from an industrial to a post-industrial urban economy based on producer
services such as financial, business and creative services, with associated changes in the
nature and location of work, in occupational class structure, earnings and incomes, life
styles and the structure of the housing market.
This argument was closely tied to Ley’s (1980, 1986, 1996) works. In a
different perspective from Smith’s supply-side interpretation, which emphasizes the
Land
Val
ue
Distance from city center
17
supply of gentrifiable property, Ley (1980, 1986, 1996) suggested the post-industrial city
status thesis as the key explanation of gentrification based on the demand of gentrifiers.
The first explanation of gentrification lay in the changing industrial structure of
major cities with the switch from manufacturing to service based industries. At the level
of the economic base, the declining role of manual labor forces in the production process
and the growing importance of technology in the factory, in the office and in
administration was a major phenomenon that distinguished the current period from the
industrial era. These changes were associated with a major transformation of the labor
force, with a decline in blue collar workers and a growth of white collar workers,
particularly in the professional, managerial, administrative and technical occupations.
Ley (1980, 1986) related the change of the labor force structure to the switch from a
goods-producing to a services-producing society, and the decline of manufacturing and
the rise of office work.
Ley’s post-industrial city status thesis indicated that gentrification was not
evenly distributed across different cities, but was particularly concentrated in a relatively
small number of global cities, such as London and New York, where the transformation
from an industrial to post-industrial economy was particularly marked, where the
professional and managerial middle class had expanded, and where there was an
attractive 19th- or early 20th-century inner city housing stock suitable for renovation and
conversion. Although gentrification was found in older industrial cities such as
Philadelphia (Smith 1979), it was often a more recent phenomenon and was generally
less marked as the changes in the industrial and occupational class structure were slower.
Ley’s post-industrial city status thesis can meaningfully be related to Sassen’s
(1991) and Friedmann (1986)’s world city2 hypothesis about the spatial organization of
the new international division of labor. Sassen and Friedmann described the emergence
of “global city”3 characterized by the fundamental differences in economic base, spatial
2 Friedmann (1986) prefers the term, world city; Sassen (1991), global city. I use the two terms interchangeably. 3 According to Sassen (1991, p. 3), global cities now function in four new ways: (1) as highly concentrated command points in the organization of the world economy; (2) as key locations for finance and specialized business services that have replaced manufacturing as the leading economic sectors; (3) as sites of production, including the

18
organization, and social structure in New York, London and Tokyo. They took the view
that a single global system is being superimposed on nation-states, which are declining in
importance. The world city hypothesis can mainly be summarized in three theses: (1) The
more globalized the national economy, the greater the agglomeration of central functions
in a relatively few sites (Sassen 1991, p. 5). (2) Global control functions drive world city
growth and are embodied in a small number of sectors such as corporate headquarters,
international finance, global transportation and communication, high level business
services, ideological penetration and control via media and culture (Friedmann 1986, p.
322). (3) International banking and producer services replace manufacturing as the engine
for economic growth and social patterning in the world’s major cities. Manufacturers are
driven out of major cities by the real estate speculation and gentrification linked to
international finance. The changes in economic structure create the sharp increase in
occupation and income polarization and such changes increase the social segregation of
residential space.
Second, Ley (1986) paid attention to the demographic changes generated by the
postwar baby boom. He argued that the growth of the postwar baby boom generation
made first time homebuyers enter into the decayed inner city housing market. The
demographic growth of boomers was associated with a reduction in household size, the
growth of female labor force participation, and an increase of unmarried individuals and
divorce rates. Such results produced an explosive growth of small sized and childless
families, which caused considerable demand pressures for housing in the declining inner
city.
Third, Ley (1986) argued that gentrification was associated with the change of
cultural preference identified with an urban lifestyle. According to him, small sized
families chose the amenities of the central city over those of the suburbs. This
explanation stressed the increasing role of environmental and cultural amenities in the
central city and the inner city. Ley (1986) also suggested that environmental and cultural
amenities were a key factor in determining the location of revitalizing areas.
production of innovations, in these leading industries; (4) as markets for the products and innovation produced.

19
In summary, Ley’s post-industrial city status thesis stressed that gentrification
was caused by the changing industrial structure of major cities with the switch from
manufacturing to service-based industry and the concomitant changes in the occupational
class structure from the manual working class to white collar professionals, managers and
technical workers, in the demographic composition, and in cultural orientation and
residential preferences. In other words, gentrification was not caused by the supply of
gentrifiable properties, but the demand for them.
Smith’s and Ley’s supply versus demand arguments triggered a variety of
debates over gentrification, which expanded into capital versus culture (Zukin 1987) and
production versus consumption (Hamnett 1991). However, the opposing arguments
basically reflected supply and demand-side interpretations of gentrification. Zukin (1987,
p. 129) defined gentrification as “the conversion of socially marginal and working class
areas of the central city to middle class residential use.” By arguing that “gentrification
represents a movement of private market investment capital into downtown districts of
major urban centers and it reflects the clustering of new cultural amenities in the urban
core,” she focused on the integration of capital-centered and cultural analyses on
gentrification. In the same context, Hamnett (1991) argued that gentrification should be
understood in the perspective of both production and consumption. He stressed that an
integrated explanation for gentrification must involve both explanation of the production
of devalued areas and housing and the production of gentrifiers and their specific
consumption and reproducing patterns.
The Political Interpretation of Gentrification
Gentrification as the mode of urban redevelopment cannot be explained through
either purely economic and cultural factors or a study of local politics detached from
wider economic and cultural relations. Hackworth and Smith (2001, p. 464) argued
“gentrification had changed in ways that were related to larger economic and political
restructuring.” They paid attention to the return of state intervention in gentrification after
the economic recession of the early 1990s.
In order to understand the changing role of the state in gentrification,
Hackworth and Smith identified “three waves of gentrification” (2001, pp. 466-468) in
20
the context of North America and Europe. The first wave, beginning in the 1950s, was
regarded as “sporadic and state-led gentrification” (2001, p. 466). During the first wave,
gentrification was significantly funded by the public sector (Smith 1979), as local and
national governments sought to curb the private market economic decline of central city
neighborhood.
A second wave followed in the 1970s and 1980s as gentrification became
increasingly entwined with wider processes of urban and economic restructuring.
Hackworth and Smith (2001) labeled this the “anchoring phase of gentrification” (p. 467).
Most local state efforts focused on stimulating the private market rather than directly
supporting gentrification. The second wave, lasting to the end of the 1980s, was
characterized by the integration of gentrification into a wide range of economic and
cultural processes at the global and national scales (Hackworth and Smith 2001).
A third wave emerged in the 1990s, and the state became more interventionist
from the early 1990s than in the second wave (Hackworth and Smith 2001). Smith (2002,
p. 441) thought of the third wave as “the generalization of gentrification”, characterized
by the transformed role of the state, penetration by global finance, changing levels of
political opposition, and geographical dispersal. Hackworth and Smith (2001) argued that
in the early 1990s, the relative withdrawal of the national state from subsidies to
gentrification that had occurred in the 1980s was reversed with the intensification of
partnerships between private capital and the local government and the shift towards the
post-Keynesian state.
While economic and cultural factors seem to drive gentrification, government
policies can either facilitate or impede gentrification (Kennedy and Leonard 2001). For
example, current cities use a range of policy levers to redevelop deteriorated with the
methods of strategic public investments, tax abatements, and the alleviation of zoning
regulations. Large public infrastructure investments can be a key force in stimulating
redevelopment activity. Tax abatements and the alleviation of zoning regulations can help
create demand for inner city areas. In some cases, these investments and their resulting
effects can yield gentrification. Many cities pursue redevelopment policies with the
intention of providing incentives for middle and high income households to move into
deteriorated areas, or inducements for original residents to upgrade their houses. The
21
changing role of the state and the local government and their policies regarding urban
redevelopment are an important driving force for gentrification.
Integration of Supply- and Demand-Side Interpretations of
Gentrification In the 1980s, gentrification research tended to follow either an economically
determined or a culturally determined route of investigation. The first attempt to integrate
economic and cultural interpretations came from Hamnett (1991), who listed some of the
issues such as structure, capital, production and supply versus agency, culture,
consumption and consumer demand that arose from the gentrification literature. Hamnett
(1991, 2003) argued that the rent gap thesis advanced by Smith and the post-industrial
city status thesis associated with Ley were partial attempts to explain gentrification.
Smith focused on the production of gentrifiable properties through the mechanism of the
rent gap. Hamnett (1991) argued that Smith took for granted the existence of a supply of
potential gentrifiers and ignored the question of why the middle class was moving back to
the inner city.
On the other hand, Ley’s approach focused on changes in the social and spatial
division of labor, changes in occupational structure, the creation of cultural and
environmental demands and their transmission into the housing market through the
greater purchasing power of the new middle class. Hamnett (1991) argued that Ley
largely took for granted the existence of potential areas suitable for gentrification and saw
the process primarily in terms of housing market demand.
By comparing Smith’s rent gap and Ley’s post-industrial city status theses,
Hamnett (1991) suggested that there were four requirements for gentrification to occur on
a significant scale. The three requirements were concerned, respectively, with the supply
of suitable areas for gentrification, the supply of potential gentrifiers, and the existence of
attractive central and inner city environments. The final requirement involved a cultural
preference for inner city residences by a certain segment of the business and service
based classes.
In combining the rent gap thesis and the four requirements, Hamnett (1991)
argued that gentrification only occurred under one combination of the existence of rent
22
gap and inner city preference by the new middle class and that none of the other
combinations generated gentrification, although Ley (1986) argued that gentrification
could occur without a rent gap if the new middle class had the purchasing power to
replace other land users. However, Hamnett (1991) argued that the rent gap was not a
necessary condition for gentrification, but a sufficient one, and that gentrification must
rest on the conditions for the production of potential gentrifiers.
Hamnett’s argument was that the basis of an effective explanation had to rest on
the demand-side more than the supply-side interpretation. Hamnett’s view did not
emphasize consumer sovereignty, but for the recognition of the importance of changes in
the economic base and class structure of cities in the transition from industrialism to post-
industrialism. This shift provided the basis for an expansion of middle class housing
demand in the central city and inner city.
Contrary to Hamnett’s argument that the centerpiece of gentrification lay in the
production of potential gentrifiers by excluding the rent gap, Clark (1992) addressed the
“complementarity” of both supply- and demand-side interpretations of gentrification.
Clark (1992, p. 361) argued that the concept of complementarity meant that “even if
competing theories are mutually exclusive due to incommensurable abstractions, they
may both be true and necessary for a thorough description of that which the theories are
about.” According to the concept of complementarity, Clark argued that gentrification
should be explained by both the rent gap and post-industrial city status theses.
By using Clark’s concept of complementarity, Lees (1994) attempted to
integrate the oppositional thinking produced by the dualism of Marxist economic analysis
and postmodern cultural analysis of gentrification. She argued that because economic and
cultural explanations for gentrification were two sides of the same coin, considering the
two explanations in a complementary manner was helpful to confront the inadequacies
found in both.
Extensions of Gentrification Research
Integrations by Clark (1992) and Lees (1994) tried to reconcile theoretical
divisions between the economy and culture with the notion of complementarity, i.e.,
“comparing and informing one set of ideas with another” (Lees 1994, p. 139) would
23
advance understanding of the gentrification process. However, Wyly and Hammel (1999,
p. 718) indicated that “despite attempts to forge a new synthesis, much of gentrification
literature remains balkanized along lines of debate established a generation ago.” Bondi
(1999, p. 255) also argued that the diversity of gentrification research “might actually be
a sign of good health.”
Butler and Robson (2001, p. 2160) argued “gentrification cannot in any sense be
considered to be a unitary phenomenon, but needs to be examined in each case according
to its own logic and outcomes.” Ley (2003, pp. 2541-2542) also held that “the
interdigitation of economic and cultural competencies and pursuits in the gentrification
field makes any statement of mono-causality questionable. It is not a matter of whether
economic or cultural arguments prevail, but rather how they work together to produce
gentrification as an outcome.” Like Ley, Slater (2004) advocated that gentrification
research should move away from old ideological and explanatory divisions between the
economy and culture.
After integrative discussion of economic and cultural interpretations,
gentrification research delved into more sophisticated class, gender, and race issues and
extended the geography of gentrification from its urban focus to “other geographies of
gentrification” with a rural focus.
Smith (1996) suggested the notion of revanchist (revengeful) gentrification,
which viewed gentrification in New York as the spatial manifestation of “a
class/gender/race terror felt by white middle class” (1996, p. 211) that believed that the
city had been stolen from them by the working classes, especially by minority and
immigrant groups. For Smith, gentrification was an attempt to retake the inner city from
the working class, and the inner city was considered not to be an emancipatory space but
a combat zone in which capital, embodied by middle class gentrifiers, who drove out the
working classes to retake the inner city. Smith (1996) also investigated the relationship
between class, race and space based on Schaffer and Smith (1986)’s gentrification of
Harlem.
After Smith’s class-based analysis on gentrification, Bondi (1991, 1999)
developed the links between class and gender in the gentrification process by
investigating the patterning of life courses in the articulation of class and gender practices.
24
She found that the association between gentrification and the professional middle class
was not an exclusive one and that some gentrifiers did not pursue a class-based housing
strategy.
In contrast to Smith’s revanchist city discourse, Ley (1996) suggested the
emancipatory city discourse that emerged in large measure from the study of
gentrification in Canadian cities such as Toronto and Vancouver. He argued that the new
middle classes defined as the emancipated gentrifiers had the ability to exploit the
emancipatory potential of the inner city, and to create a new culturally sophisticated
urban class group such as “yuppies.” Thus, he argued that gentrification was a spatial
manifestation of these new cultural values and that the inner city was an emancipated
space for the new middle class.
Ley (1996) and Lees (2000) began to recognize the need to gain a more
comprehensive understanding of gentrification’s geography. Ley (1996) argued that the
focus of gentrification research should lie in the geography of gentrification and Lees
(2000) suggested that a detailed examination of the geography of gentrification would
constitute a progressive research frontier. In making this argument, Lees made direct
reference to Ley (1996) and, like him, identified three distinct geographies of
gentrification. For Lees, these geographies were described as international, intra-national
and citywide, while Ley used terms such as international, intra-metropolitan and urban
neighborhood or intra-urban.
Smith (2002) agreed that gentrification was widely seen as a phenomenon
specific to inner city areas in large metropolitan areas. However, as gentrification spread
outwards from the inner city towards the suburbs, he added that gentrification was not
only manifested at a variety of spatial scales but also in a range of locations, including the
suburban, the rural, Central Business Districts (CBDs) and retirement hotspots such as
coastal resorts. Like Smith, Phillips (2004) argued that the analysis of gentrification
should be extended into “other geographies of gentrification” in rural areas, by
investigating gentrification of the British countryside, particularly in rural Norfolk.
25
Summary
The significance of gentrification has been debated widely since the 1980s.
Despite the skepticism of Berry, Bourne, and Smith, the academic literatures that
document and explain the rise of gentrification are extensive and involve on four key
competing arguments.
The first argument was Smith’s supply-side interpretation of gentrification
based on the rent gap thesis. Smith (1979, 1996) argued that the driving force behind
gentrification was not the new middle class, but the growing gap between potential
property values and underlying land values in the inner city.
The second argument was Ley’s and Hamnnet’s demand-side interpretation of
gentrification. Ley (1980, 1986, 1996) and Hamnett (1991, 2003) argued that the roots of
gentrification lay in the changing industrial structure of major cities with the switch from
manufacturing to a producer services economy. This change involved a concomitant
change in the occupational class structure from one based on the dominance of a large
manual working class to one increasingly dominated by white-collar professionals,
managers and technical workers in the financial, cultural and service industries that are
concentrated in major global cities.
Third, Bondi (1991), Bridge (1995), Butler (1997), and Butler and Robson
(2003) stressed that changes in the demographic and cultural preferences of the middle
class created gentrification. They related the changes in the demographic and cultural
preferences of the middle class to the increasing feminization of the professional labor
force, the growing importance of dual income professional families, and changes in the
working patterns of the middle class that prefers living in the inner city to commuting
from suburbs.
The final argument concerned state-induced gentrification (Hackworth and
Smith 2001), which held that gentrification was related to targeted public sector policies
(Kenney and Leonard 2001). While economic and cultural forces seem to drive
gentrification, the changing role of the state and the government policies of the past or
present can either facilitate or impede gentrification.
26
Smith and Ley’s supply versus demand arguments triggered a variety of debates
over gentrification, which were expanded into capital versus culture (Zukin 1987),
production versus consumption (Hamnett 1991), and the revanchist versus emancipatory
city arguments (Smith 1996, Ley 1996, Slater 2004).
Eschewing narrowly conceived interpretations that emphasized the primacy of
economy or culture, integrative discussions of economic and cultural interpretations
emerged from Hamnett (1991), Clark (1992), and Lees (1994). By arguing that economic
and cultural explanations are two sides of the same coin, they tried to integrate economic
and cultural interpretations to complement the weaknesses found in both. After
integrative discussion of economic and cultural interpretation of gentrification,
gentrification research focused on more sophisticated class, gender, and race issues and
extended into the “geography of gentrification” with an urban focus (Ley 1996, Lees
2000) and the “other geography of gentrification” with a rural focus (Phillips 2004).
27
CHAPTER 3
THE CONTEXT OF GENTRIFICATION IN SEOUL
The world city hypothesis assumed a convergence in the “economic base,
spatial organization, and social structure” among the world’s major cities such as New
York, London, and Tokyo (Sassen 1991, p. 4). However, Seoul, center of East Asia’s
second Organization for Economic Cooperation Development (OECD) member and the
region’s second largest metropolis (Hill and Kim 2000), differs from the world city
model in most dimensions. Seoul’s departure from the world city hypothesis was
generated by Korea’s late industrialization and especially the relationship between
industrial policy and finance institutionalized in a developmental state (Hill and Kim
2000). Seoul’s salient pattern was based on state-centered policy. Thus, it is important to
understand that Seoul exemplifies a different conception of world cities and has salient
characteristics of gentrification different from those of New York and London.
This chapter explores the context of gentrification in Seoul regarding changes in
land values, economic base, demographics, and politics based on the world city
hypothesis. It is composed of five parts to explain the world system context regarding
gentrification in Seoul.
The first part briefly reviews the general development of Seoul. The second part
explores the changes in Seoul’s maximum residential and commercial land values
between 1991 and 2001 using Smith’s (1979, 1996) rent gap thesis. The third part
investigates the transformation of the economic base, occupational class structure, and
income gap using Ley’s (1980, 1986, 1996) post-industrial city status thesis and Sassen’s
(1991) global city argument. In the fourth part, population and demographic changes are
reviewed in terms of the decrease of household size and foreign immigration rate. The
last part deals with Korea’s industrial policy and Seoul’s development policy.

28
The General Development of Seoul
Seoul became Korea’s political capital and the center of the national economy
and culture at the onset of the Chosun dynasty in 1392. Seoul is Korea’s command center
for government and commercial functions. While 22 percent (9,895,217 persons) of the
nation’s population (46,136,101 in 2000) resided in Seoul city in 2000 (Population and
Housing Census Report 2000), virtually all of Korea’s central government agencies (96
percent) and top corporate headquarters (48 out of the top 50) were located there.
Additionally, 61 percent of Korea’s business managers and 64 percent of the nation’s
research scientists worked in the city (Kim and Choe 1997, p. 2). The city of Seoul
combines with surrounding satellites in Kyounggi-do Province to form the Seoul
Metropolitan Region (SMR). Koreans often refer to the SMR as the “Seoul Republic”
because it is so dominant over other regions of the country (Hill and Kim 2000). With 20
million residents, the capital region contains 43 percent of South Korea’s population
(Population and Housing Census Report 2000).
Seoul is also Korea’s window on the world. All of the nation’s foreign
embassies, and 15 of Korea’s 22 foreign consulates, were located in Seoul (Korea
Ministry of Foreign Affairs and Trade 2006). All of the nation’s stock brokerages (76),
foreign bank offices (66), offices of foreign media (25) and broadcasting networks (8)
were located in the city in 2000 (Hill and Kim 2000). Seoul hosted 71 percent of Korea’s
overseas based service industries, half the nation’s international hotels and trading
companies, and nearly all of its communication services (Hong 1996).
Seoul has grown explosively since the 1960s, in step with Korea’s successful
export-led industrialization strategy. As Korea’s per capita Gross National Product
(GNP) rose from $81 in 1960, to $1,589 in 1980, to $10,888 in 2000, the percentage of
the nation’s population residing in cities expanded from 33.8 percent in 1960 to 66.7
percent in 1980 to 79.6 percent in 2000 (Korea National Statistical Office 2000). Home to
2.33 million people in 1960, Seoul was the 19th-largest city in the world. By 1990, Seoul
had mushroomed to 10.61 million residents and had become the world’s seventh largest
city. Seoul now ranks seventh among the world’s cities in the number of Global Fortune
500 transnational corporations (TNCs) headquartered there, 13th in the number of TNC
29
bank headquarters, 17th in number of international organizations, and 23rd in the
frequency of international conferences (Hill and Kim 2000).
The salient indicators certainly point to Seoul’s world city status, but it is
important to understand how well Seoul fits the world city hypothesis and how Seoul has
been restructured in the context of the global and national economy and politics. Before
addressing these questions, the next part investigates the spatial pattern of maximum
residential and commercial land values in Seoul.
Changes in Maximum Residential and Commercial Land Values
The quantitative and qualitative growth of the city, the rise of the urban
population, and the enlargement of Seoul’s urban range can be simultaneously explained
by investigating the pattern of residential and commercial land values and changes. Land
values can be an appropriate standard in examining urban structure and its transformation
pattern (Nam 1985). However, each dong has many parcels (over 1,000) and the data for
mean and median property values do not exist. Calculation of mean property values per
dong was not pragmatically feasible for this analysis. Therefore, this part examines the
maximum residential and commercial land values and their changes by dong in Seoul
between 1991 and 2001 to assess whether there is evidence of Smith’s (1979, 1996) rent
gap thesis.4
Residential land is defined as that consisting of structurally separate places for
human habitation, including land used for detached housing, apartments, row houses,
apartment units in private houses, and dwelling units in buildings not intended for human
habitation (Korean Land Value Appraisal Association 2001). Commercial land refers to
land used for business and commerce. For example, it includes the land used for markets,
4 The rent gap thesis argues that the more depreciated the inner-city land market, the higher the probability of reinvestment and gentrification (Smith 1979 and 1996). But this reinvestment is likely to occur only when the alternative suburban market is high priced and property is in short supply relative to the inner city. Thus, according to the rent gap thesis, the shape of the Seoul maximum commercial and residential land value gradient at time t (here 1991) should be a predictor of the extent of gentrification by t+1 (1991-2001). Therefore, the percent change of maximum commercial and residential land values represents one valid measure of the rent gap.

30
commercial buildings, hotels, services, bathhouses, swimming pools, theaters, hospitals,
gas stations, and public buildings (Korean Land Value Appraisal Association 2001).
The Spatial Pattern of Maximum Residential Land Values
In the case of Seoul, residential areas, except for green belts, have occupied the
largest areas among urban internal land uses. By considering the transformation of
residential land values, the direction of city development can be revealed, because
residential areas play a leading role in the enlargement of the urban range. Residential
areas can be changed according to residents’ changing social and economic attributes.
Figure 4 shows the spatial pattern of maximum residential land values per dong
in 1991. The 11 dong showing the highest residential land values (over 3,150,000
Won/m2)5 were mainly distributed in the circumferences of the CBD (Hyehwa-dong,
Chungjeongro-dong) and sub-CBDs (Sinsa-dong, Nonhyeon 1-dong, Nonhyeon 2-dong,
Samsung 1-dong, Samsung 2-dong, Yeoksam 1-dong, Seocho 3-dong and Seocho 4-
dong), and river side area (Ichon 2-dong), which have the advantage of being near the
Han River. The 8 dong among 11 with the highest residential land values were located in
the South-East axis of the Han River, the so-called the 8th school district,6 including
Kangnam-gu and Seocho-gu that have been formed by the new residential district
development planning since the late 1970s. In contrast, the 302 dong having the lowest
maximum residential land value (below 1,320,000 Won/m2) were located in the inner city
and the suburbs.
5 Won is the Korean monetary unit. 1000 Won were equivalent to $1 in 2005. 6 Seoul has eight school districts for K-12 education, and the performance of a school district is generally measured by the percentage of high school students who receive admission to a few highly selective universities (Seoul National University, Korea University, Yonsei University, and Ehwa Women University) in Seoul after taking a nationally conducted test. Because of shortages of housing, national law prohibits residents in Korea from owning more than one home per head of household. People seeking a better school district lease their current residence and rent another home in the school district of their choice. Consequently, in one of the most highly coveted school districts south of the Han River, the cost of leasing a home is often higher than the actual selling price of the home (Kim and Choe 1997, p. 28).
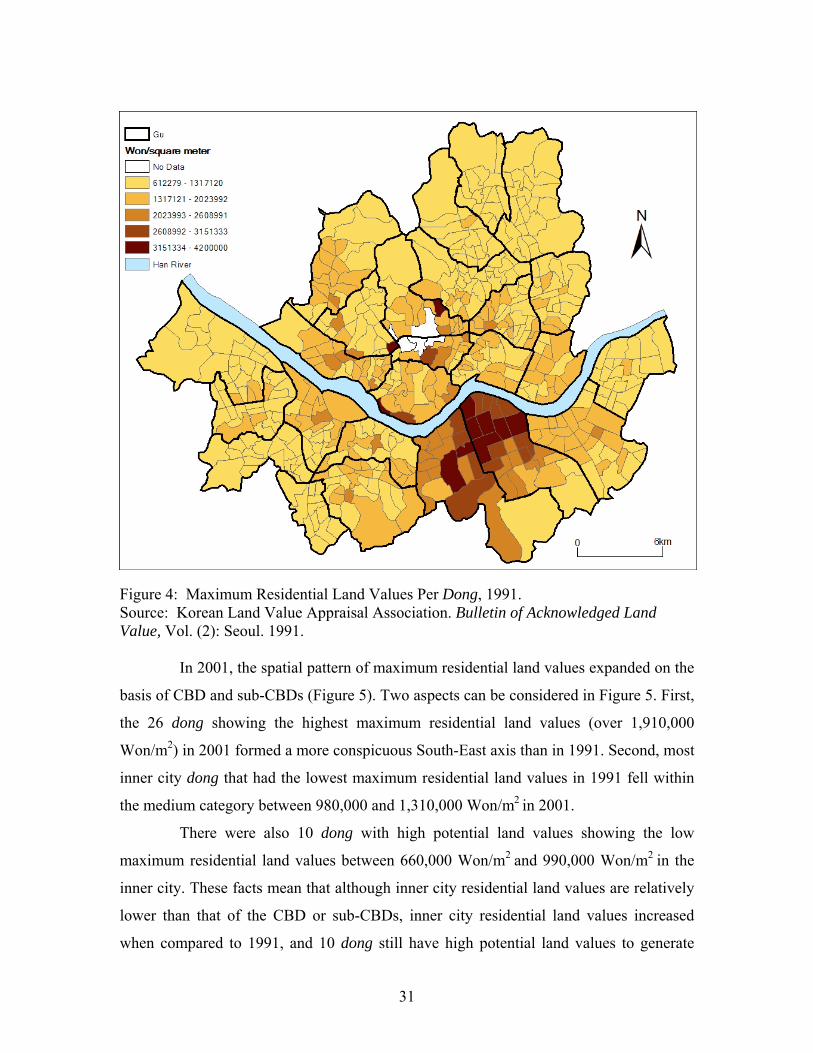
31
Figure 4: Maximum Residential Land Values Per Dong, 1991. Source: Korean Land Value Appraisal Association. Bulletin of Acknowledged Land Value, Vol. (2): Seoul. 1991.
In 2001, the spatial pattern of maximum residential land values expanded on the
basis of CBD and sub-CBDs (Figure 5). Two aspects can be considered in Figure 5. First,
the 26 dong showing the highest maximum residential land values (over 1,910,000
Won/m2) in 2001 formed a more conspicuous South-East axis than in 1991. Second, most
inner city dong that had the lowest maximum residential land values in 1991 fell within
the medium category between 980,000 and 1,310,000 Won/m2 in 2001.
There were also 10 dong with high potential land values showing the low
maximum residential land values between 660,000 Won/m2 and 990,000 Won/m2 in the
inner city. These facts mean that although inner city residential land values are relatively
lower than that of the CBD or sub-CBDs, inner city residential land values increased
when compared to 1991, and 10 dong still have high potential land values to generate
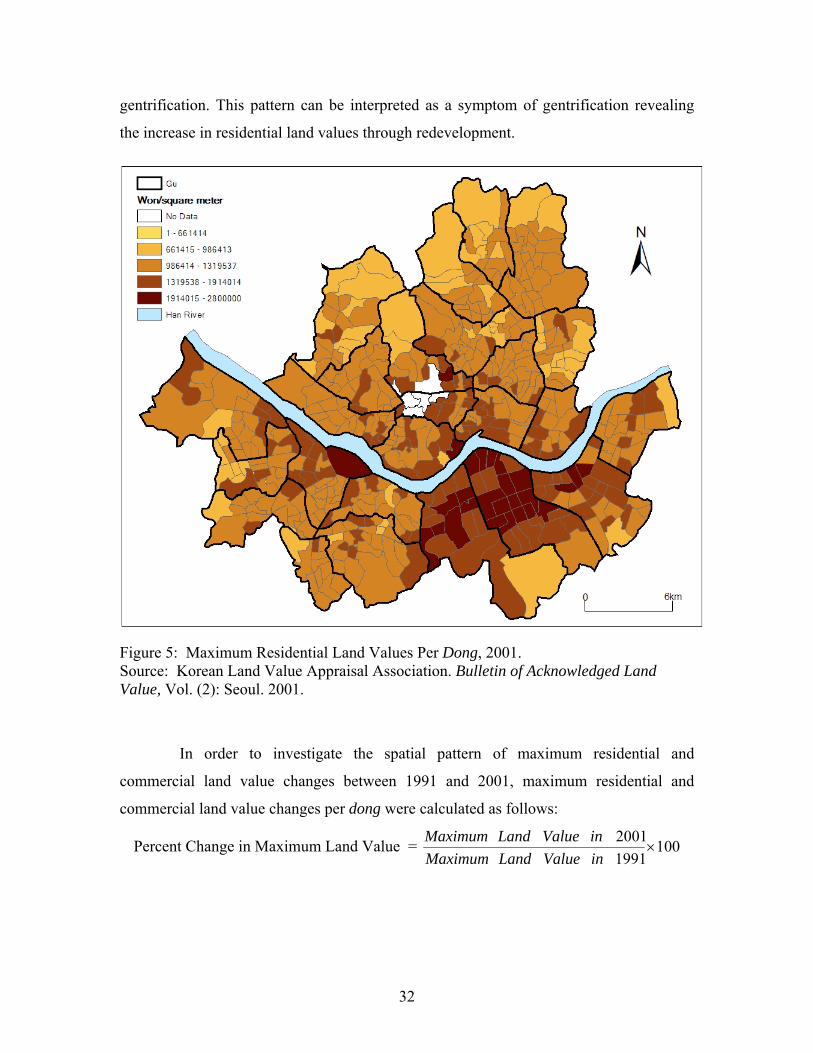
32
gentrification. This pattern can be interpreted as a symptom of gentrification revealing
the increase in residential land values through redevelopment.
Figure 5: Maximum Residential Land Values Per Dong, 2001. Source: Korean Land Value Appraisal Association. Bulletin of Acknowledged Land Value, Vol. (2): Seoul. 2001.
In order to investigate the spatial pattern of maximum residential and
commercial land value changes between 1991 and 2001, maximum residential and
commercial land value changes per dong were calculated as follows:
Percent Change in Maximum Land Value = 10019912001
×inValueLandMaximuminValueLandMaximum

33
Figure 6: Changes in Maximum Residential Land Value Per Dong, 1991-2001. Source: Korean Land Value Appraisal Association. Bulletin of Acknowledged Land Value, Vol. (2): Seoul. 1991 and 2001.
Figure 6 reveals that the maximum residential land values of the suburbs
increased much more than those of inner city. This fact can be explained as the result of
population suburbanization. The urban population migrated into the suburbs because of
the construction of new towns located in the suburbs of Seoul. The increase in population
of the suburbs caused the rise of residential land values. The suburbanization of
population in Seoul is also closely related to the improvements and expansion of urban
traffic networks (Kwon 1998). The construction of bridges and highways and the
emergence of subways have expanded urban residents’ range of activity since the 1970s.
In particular, the expansion of the subway network has deepened the spatial enlargement
of Seoul by improving accessibility from the city center to the suburbs (Figure 7).
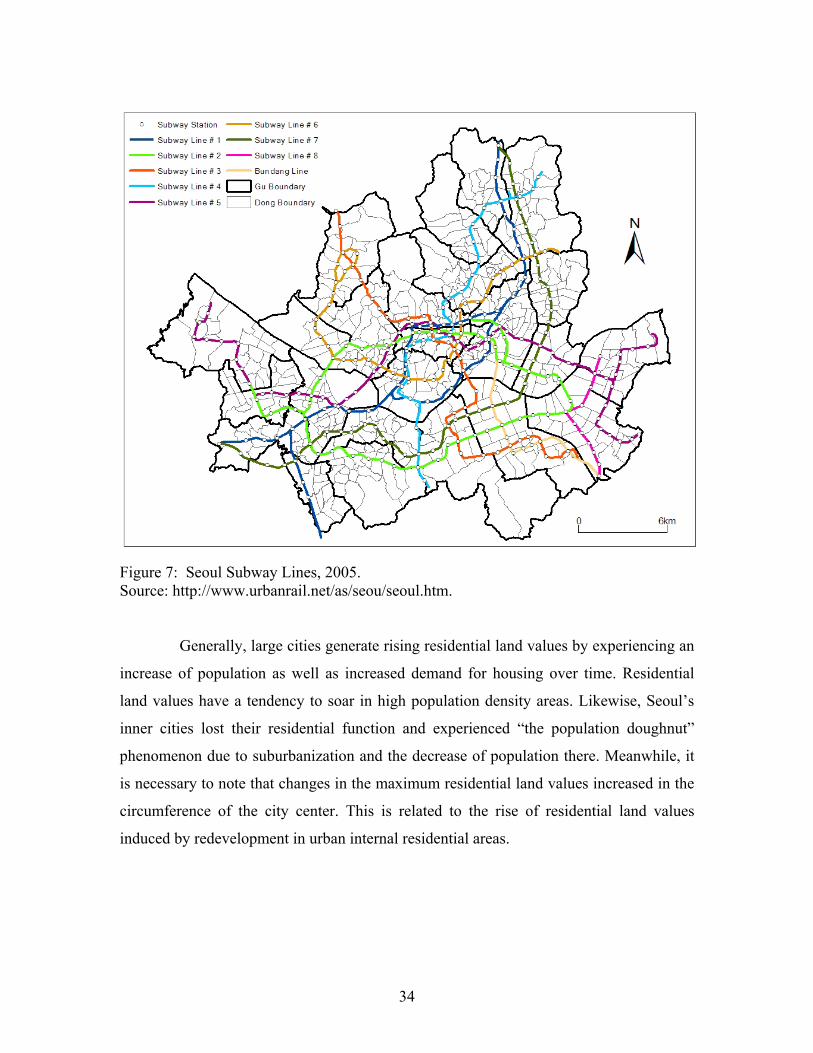
34
Figure 7: Seoul Subway Lines, 2005. Source: http://www.urbanrail.net/as/seou/seoul.htm.
Generally, large cities generate rising residential land values by experiencing an
increase of population as well as increased demand for housing over time. Residential
land values have a tendency to soar in high population density areas. Likewise, Seoul’s
inner cities lost their residential function and experienced “the population doughnut”
phenomenon due to suburbanization and the decrease of population there. Meanwhile, it
is necessary to note that changes in the maximum residential land values increased in the
circumference of the city center. This is related to the rise of residential land values
induced by redevelopment in urban internal residential areas.
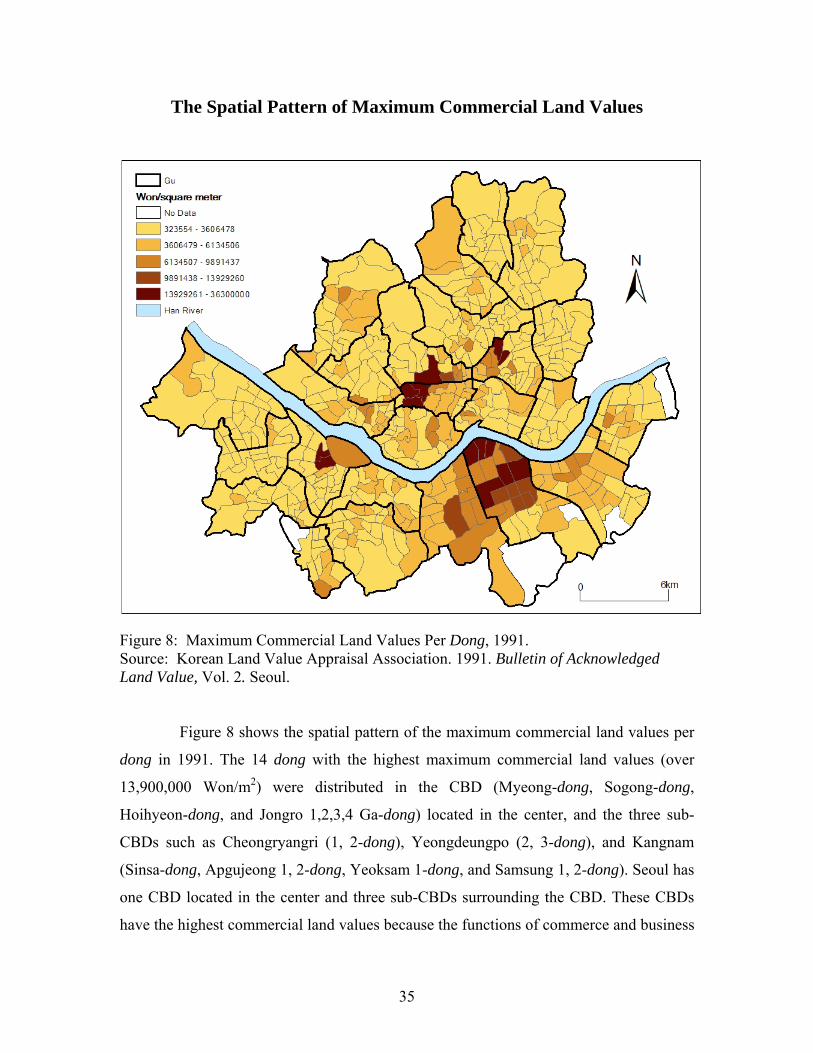
35
The Spatial Pattern of Maximum Commercial Land Values
Figure 8: Maximum Commercial Land Values Per Dong, 1991. Source: Korean Land Value Appraisal Association. 1991. Bulletin of Acknowledged Land Value, Vol. 2. Seoul.
Figure 8 shows the spatial pattern of the maximum commercial land values per
dong in 1991. The 14 dong with the highest maximum commercial land values (over
13,900,000 Won/m2) were distributed in the CBD (Myeong-dong, Sogong-dong,
Hoihyeon-dong, and Jongro 1,2,3,4 Ga-dong) located in the center, and the three sub-
CBDs such as Cheongryangri (1, 2-dong), Yeongdeungpo (2, 3-dong), and Kangnam
(Sinsa-dong, Apgujeong 1, 2-dong, Yeoksam 1-dong, and Samsung 1, 2-dong). Seoul has
one CBD located in the center and three sub-CBDs surrounding the CBD. These CBDs
have the highest commercial land values because the functions of commerce and business
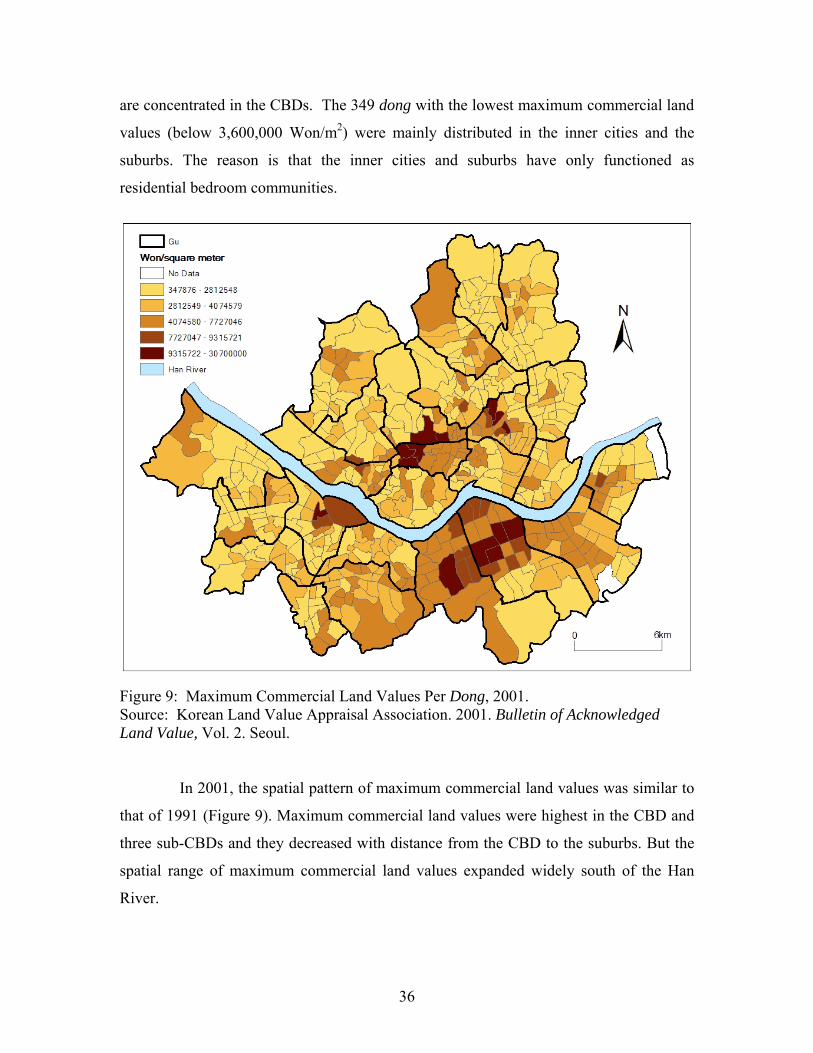
36
are concentrated in the CBDs. The 349 dong with the lowest maximum commercial land
values (below 3,600,000 Won/m2) were mainly distributed in the inner cities and the
suburbs. The reason is that the inner cities and suburbs have only functioned as
residential bedroom communities.
Figure 9: Maximum Commercial Land Values Per Dong, 2001. Source: Korean Land Value Appraisal Association. 2001. Bulletin of Acknowledged Land Value, Vol. 2. Seoul.
In 2001, the spatial pattern of maximum commercial land values was similar to
that of 1991 (Figure 9). Maximum commercial land values were highest in the CBD and
three sub-CBDs and they decreased with distance from the CBD to the suburbs. But the
spatial range of maximum commercial land values expanded widely south of the Han
River.
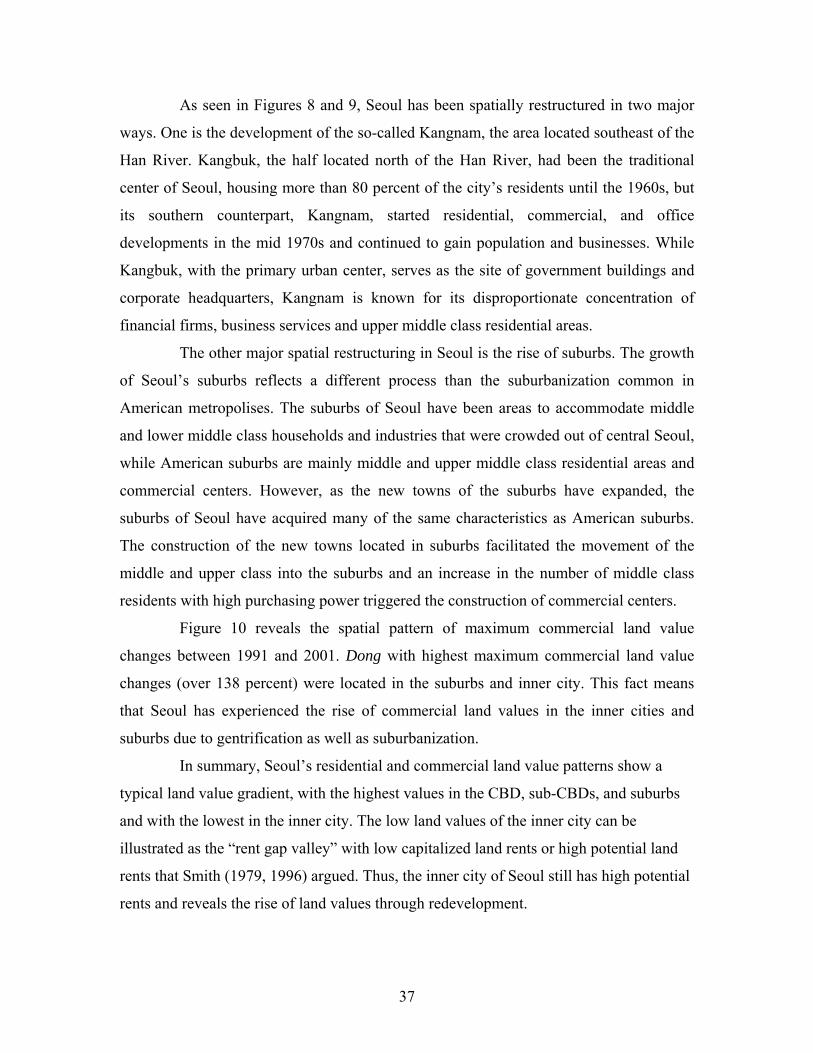
37
As seen in Figures 8 and 9, Seoul has been spatially restructured in two major
ways. One is the development of the so-called Kangnam, the area located southeast of the
Han River. Kangbuk, the half located north of the Han River, had been the traditional
center of Seoul, housing more than 80 percent of the city’s residents until the 1960s, but
its southern counterpart, Kangnam, started residential, commercial, and office
developments in the mid 1970s and continued to gain population and businesses. While
Kangbuk, with the primary urban center, serves as the site of government buildings and
corporate headquarters, Kangnam is known for its disproportionate concentration of
financial firms, business services and upper middle class residential areas.
The other major spatial restructuring in Seoul is the rise of suburbs. The growth
of Seoul’s suburbs reflects a different process than the suburbanization common in
American metropolises. The suburbs of Seoul have been areas to accommodate middle
and lower middle class households and industries that were crowded out of central Seoul,
while American suburbs are mainly middle and upper middle class residential areas and
commercial centers. However, as the new towns of the suburbs have expanded, the
suburbs of Seoul have acquired many of the same characteristics as American suburbs.
The construction of the new towns located in suburbs facilitated the movement of the
middle and upper class into the suburbs and an increase in the number of middle class
residents with high purchasing power triggered the construction of commercial centers.
Figure 10 reveals the spatial pattern of maximum commercial land value
changes between 1991 and 2001. Dong with highest maximum commercial land value
changes (over 138 percent) were located in the suburbs and inner city. This fact means
that Seoul has experienced the rise of commercial land values in the inner cities and
suburbs due to gentrification as well as suburbanization.
In summary, Seoul’s residential and commercial land value patterns show a
typical land value gradient, with the highest values in the CBD, sub-CBDs, and suburbs
and with the lowest in the inner city. The low land values of the inner city can be
illustrated as the “rent gap valley” with low capitalized land rents or high potential land
rents that Smith (1979, 1996) argued. Thus, the inner city of Seoul still has high potential
rents and reveals the rise of land values through redevelopment.
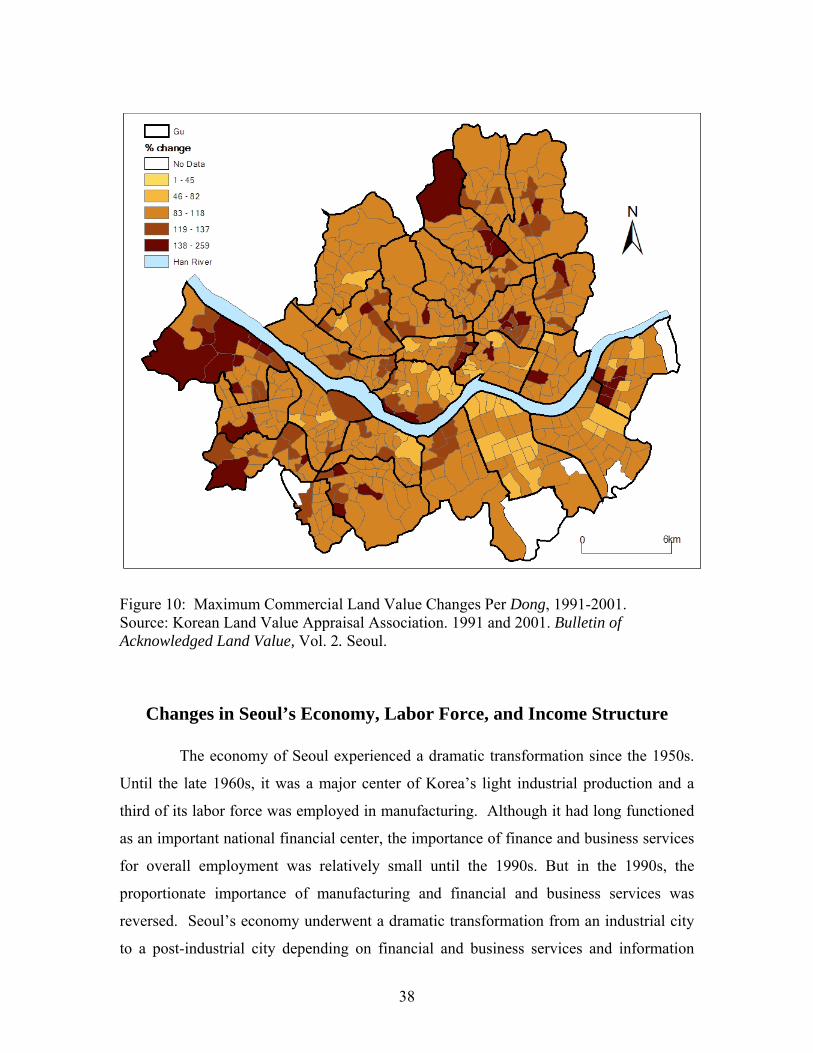
38
Figure 10: Maximum Commercial Land Value Changes Per Dong, 1991-2001. Source: Korean Land Value Appraisal Association. 1991 and 2001. Bulletin of Acknowledged Land Value, Vol. 2. Seoul.
Changes in Seoul’s Economy, Labor Force, and Income Structure
The economy of Seoul experienced a dramatic transformation since the 1950s.
Until the late 1960s, it was a major center of Korea’s light industrial production and a
third of its labor force was employed in manufacturing. Although it had long functioned
as an important national financial center, the importance of finance and business services
for overall employment was relatively small until the 1990s. But in the 1990s, the
proportionate importance of manufacturing and financial and business services was
reversed. Seoul’s economy underwent a dramatic transformation from an industrial city
to a post-industrial city depending on financial and business services and information

39
technology (IT) industries. Manufacturing employment has declined when compared with
its former importance.
Because of its leading role as a national financial center, Seoul contains a
dominant concentration of jobs in financial services. Second, because of its role as a
national headquarters of major corporations, it contains a high proportion of jobs in
corporate headquarters and in associated business services, such as management
consultant, law, advertisement, design and public relations. Third, because of its role as a
center of broadcasting and publishing, it has a disproportionate concentration of jobs in
media production and marketing. Finally, particularly in the early 1990s, it became a
major center for the cultural and IT industries.
Table 1: The Employment Structure of Seoul by Industry, 1991-2001.
Employment by Sector
1991 2001
Change in Employment by Industrial Sector,
1991-2001 Industry Number Percent Number Percent Number Percent
Change
Primary 10,073 0.3 2,350 0.06 -7,723 -77 Manufacturing 769,154 23 631,741 16 -137,413 -18
Finance, Insurance, Real Estate
462,994 14 866,899 22 403,905 87
Total Employment 3,378,741 100 3,876833 100 498,092 15
Sources: Korea National Statistical Office, Report on Total Employment, 1991 and 2001.
In 2001, the so-called Finance, Insurance, and Real Estate industries (FIRE)
together employed almost a fourth of Seoul’s workers, whereas manufacturing employed
about 16 percent. These changes are reflected in the employment figures by industry
(Table 1). In 1991, Seoul had 769,154 manufacturing employees (23 percent of total
employment). The number fell to 631,741 (16 percent) in 2001. In change in employment
by industrial sector between 1991 and 2001, manufacturing employees decreased by 18
percent, whereas FIRE industry employees increased by 87 percent. The growth sectors
in the 1990s and 2000s have been finance, business services, and the IT industries.

40
Producer services are now an extremely important factor in the economy and labor force
of global cities and Seoul is no exception to this trend.
Seoul is certainly a base for Trans-National Corporations (TNCs). Nine of the
eleven Global Fortune 500 companies are located in Seoul in 2005, including Samsung
Electronics (39th), Hyundai Motor (92nd), LG Electronics (115th), SK Corporation
(117th), Samsung Life Insurance (251st), Korea Electronic Power (277th), Hanwha
(393rd), Samsung Corporation (442nd), and SK Networks (446th) (see Table 2).
Table 2: Korean TNCs Included Within Global Fortune 500 List, 2005.
Rank in Korea Company Global
Rank Revenue
($ millions) City
1 Samsung Electronics 39 71,555.9 Seoul 2 Hyundai Motor 92 46,358.2 Seoul 3 LG Electronics 115 37,757.5 Seoul 4 SK 117 37,691.6 Seoul 5 Samsung Life Insurance 251 22,347.9 Seoul 6 POSCO 276 20,929.1 Pohang City 7 Korea Electronic Power 277 20,914.2 Seoul 8 Hanwha 393 15,406.3 Seoul 9 KT 414 14,901.1 Seongnam
10 Samsung Corporation 442 13,919.2 Seoul 11 SK Networks 446 13,844.3 Seoul
Source: Global Fortune 500, 2005. http://money.cnn.com/magazines/fortune/global500/countries/S.html.
However, Seoul’s TNCs are mostly industrial, not financial or producer service
companies. Only one (Samsung Life Insurance) out of the top nine Seoul corporations is
included in finance and producer services. This means that although Seoul’s economy has
transformed from an industrial economy to a post-industrial economy, the proportion of
manufacturing is still relatively high and the headquarters of Korea’s major
manufacturing companies continue to concentrate in Seoul.

41
The Transformation of Seoul’s Labor Force
The transformation of Seoul’s industrial structure has been paralleled by
changes in its occupational class structure. The Annual Report on the Economically
Active Population (1990, 2000) shows that Korea witnessed a substantial growth in the
number and proportion of its professional, administrative, technical and managerial
workers and a significant and consistent decline in the size and proportion of unskilled
manual workers (Table 3).
The proportion of professional, administrative, technical, and managerial jobs
increased significantly from 8.7 percent in 1990 to 18.6 percent in 2000, while semi-
skilled and unskilled manual jobs decreased gradually. There has been a fundamental
change in the occupational class structure of Seoul over a 10 year period that is consistent
with the shift from a manufacturing to a financial and business service-based economy.
The traditional and long-standing manufacturing manual working class has decreased and
has been replaced with a largely service-based middle class.
Table 3: Changes in Employment by Occupation in Korea, 1990 and 2000.
Year Total
Employment (000’s)
Professionals, Administrators,
Technicians, and Managers (%)
Clerks(%)
Sales Workers
(%)
Service Workers
(%)
Unskilled Manual Workers
(%) 1990 18,085 8.7 13.0 14.5 11.2 34.8 2000 21,156 18.6 11.9 13.4 12.6 33.5 Sources: Korea National Statistical Office, Annual Report on the Economically Active Population, 1990 and 2000.
The Transformation in Earnings and Income Structure
The transformation in the industrial and occupational class structure of Seoul
has been paralleled by marked changes in the structure of both earnings and household
incomes. Table 4 shows that there was the gap of earnings between professional,
technical, administrative and managerial workers and unskilled manual workers between
1990 and 2000 in Korea. When the earnings of clerks in 1990 is indexed to a base of 100,
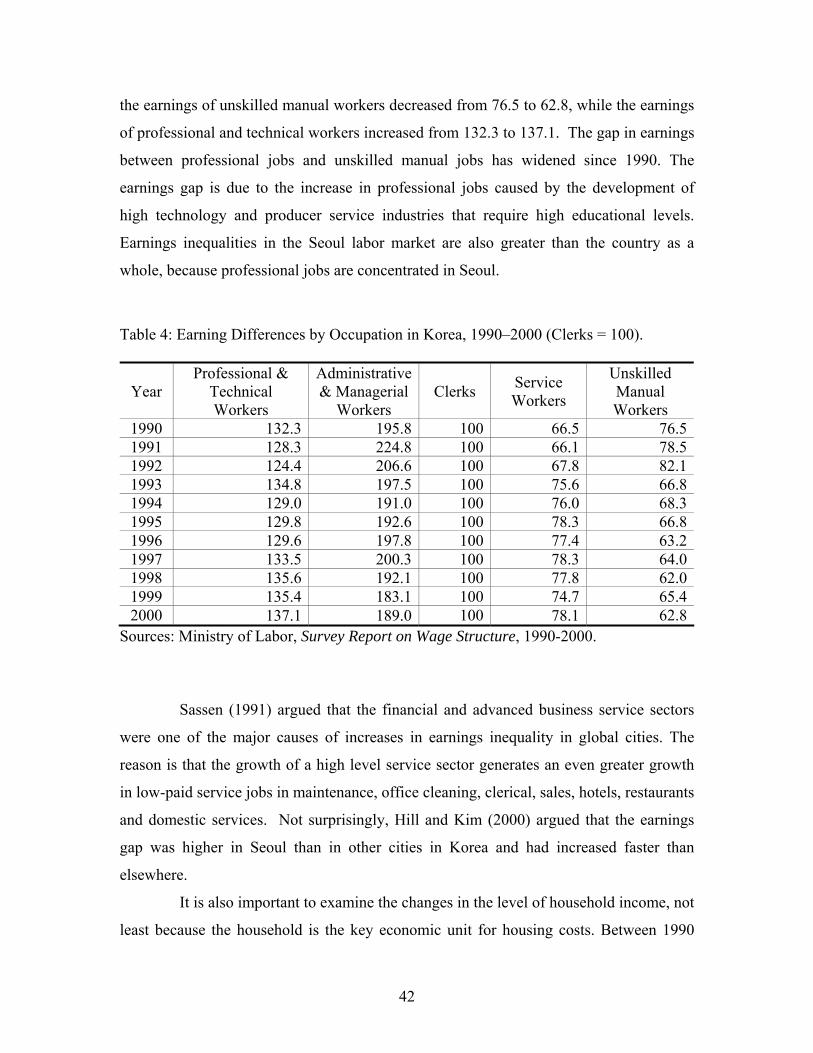
42
the earnings of unskilled manual workers decreased from 76.5 to 62.8, while the earnings
of professional and technical workers increased from 132.3 to 137.1. The gap in earnings
between professional jobs and unskilled manual jobs has widened since 1990. The
earnings gap is due to the increase in professional jobs caused by the development of
high technology and producer service industries that require high educational levels.
Earnings inequalities in the Seoul labor market are also greater than the country as a
whole, because professional jobs are concentrated in Seoul.
Table 4: Earning Differences by Occupation in Korea, 1990–2000 (Clerks = 100).
Year Professional &
Technical Workers
Administrative & Managerial
Workers Clerks Service
Workers
Unskilled Manual Workers
1990 132.3 195.8 100 66.5 76.51991 128.3 224.8 100 66.1 78.51992 124.4 206.6 100 67.8 82.11993 134.8 197.5 100 75.6 66.81994 129.0 191.0 100 76.0 68.31995 129.8 192.6 100 78.3 66.81996 129.6 197.8 100 77.4 63.21997 133.5 200.3 100 78.3 64.01998 135.6 192.1 100 77.8 62.01999 135.4 183.1 100 74.7 65.42000 137.1 189.0 100 78.1 62.8
Sources: Ministry of Labor, Survey Report on Wage Structure, 1990-2000.
Sassen (1991) argued that the financial and advanced business service sectors
were one of the major causes of increases in earnings inequality in global cities. The
reason is that the growth of a high level service sector generates an even greater growth
in low-paid service jobs in maintenance, office cleaning, clerical, sales, hotels, restaurants
and domestic services. Not surprisingly, Hill and Kim (2000) argued that the earnings
gap was higher in Seoul than in other cities in Korea and had increased faster than
elsewhere.
It is also important to examine the changes in the level of household income, not
least because the household is the key economic unit for housing costs. Between 1990

43
and 2000, average monthly household incomes increased in real terms from 982,500 Won
to 2,438,425 Won in Seoul (Seoul Statistical Year Book 1991, 2001). Seoul’s average
household incomes are higher than those elsewhere in Korea (Table 5). In other respects,
incomes in Seoul are rising more rapidly than in the rest of the country and have been
doing so since the late 1970s. The reason is that Seoul is the center of a high level service
industry and its employees reside there.
Table 5: Changes in Average Real Household Income in Korea, 1990 - 2000.
Year Average Monthly Income (Won)
Household Head (%)
Spouse (%)
Other Household Members (%)
1990 943,272 73.3 6.1 6.51991 1,158,608 71.6 6.4 7.11992 1,356,110 72.7 6.7 5.91993 1,477,828 72.2 7.7 6.41994 1,701,304 69.8 8.2 7.21995 1,911,064 69.1 9.1 7.71996 2,152,687 68.6 8.9 7.81997 2,287,335 67.5 9.3 8.01998 2,133,115 70.0 8.8 6.31999 2,224,743 69.2 8.4 6.72000 2,386,947 68.7 8.5 7.0
Sources: Korea National Statistical Office, Annual Report on the Household Income and Expenditure Survey, 1990-2000.
In terms of the average monthly household income in Korea (Table 5), the
household head’s average monthly income rate on total household members’ incomes
decreased from 73.3 percent in 1990 to 68.7 percent in 2000, while the spouses’
proportion of monthly incomes increased from 6.1 percent in 1990 to 8.5 percent in 2000.
This means that the number of dual income households increased gradually, and that the
rate of the female participation in the labor force increased. The increase in the female
participation in the labor force is related to the decline of Confucian values that
discourage female participation in the labor force (Borthwick 1998).
In addition to the growth of earning inequality and growing female participation
in the labor force, there exists an income gap by occupation and educational level in
44
Korea. The income gap by occupation between white and blue collar workers has
widened since the 1990s, reflecting the income inequality is deepening in the country
with Korea’s rapid transition into a producer services economy.
A report by the National Statistical Office (The Korea Times 2006) showed that
the average monthly income of white collar workers or those who work in the office rose
2.8 percent to 2,980,000 Won in 2005 from 2,900,000 Won in 2004. During 2005, the
monthly income of blue collar workers or industrial workers decreased by 2 percent to
1,620,000 Won in 2005 from 1,950,000 Won in 2004. The ratio of the average annual
income of blue collar workers to that of white collar workers dropped to 54.6 percent in
2005 from 55 percent in 2004 and 55.7 percent in 2003, showing that the income
disparity between the two groups has broadened.
The income gap by educational level has remained wide since the 1990s.
Chosun Newspaper (2005) reported that education-based income gap widened in Seoul
and the country. Urban salary earners with high school diplomas took home 2,000,000
Won per month, while college graduates earned 3,000,000 Won in 2005. The report
shows that the average monthly income of employees with a master’s degree approached
4,000,000 Won, making for an increase of 1,000,000 Won per month per higher
education degree. By contrast, the monthly income of urban workers without high school
diplomas decreased for the first time since the 1997 financial crisis, widening the gap
with the better educated. The education-based income gap results from the increase in
professional jobs that require a high educational level.
The average monthly income of urban workers with high school diplomas in
2005 was 2,050,000 Won, a 3.4 percent increase over 2004. The average monthly
income of college graduates in 2005 increased from 2,890,000 Won to 3,000,000 Won, or
3.9 percent, while that of master’s degree holders rose from 3,930,000 Won to 3,990,000
Won, or 1.5 percent. On the other hand, the average income of workers without high
school diplomas shrank from 1,400,000 Won to 1,360,000 Won, a three percent decrease,
and that of those who finished elementary school declined from 1,150,000 Won to
1,120,000 Won, down 2.9 percent. This means that the income gap according to
educational level is widening.

45
The growth of earning gap and household income and the growing occupation-
based and education-based income gap have an important effect on the housing market in
Seoul’s inner city. Put simply, the increases in the number of professional and
managerial occupational jobs and the concomitant growth in earnings inequality and the
income gap can affect changes in the structure of housing demand in Seoul. This is not to
suggest that all professional and managerial high income households in Seoul are
gentrifiers, but that the expansion of professional and managerial households will
increase housing demand in the inner city of Seoul.
The Demographic Transformation of Seoul
Ley (1986) regarded the surge in demand generated by the post war baby boom
generation as a major factor explaining gentrification. He expected the demographically-
induced demand surge to force first time homebuyers into the unfamiliar inner city
housing market. His demand surge was related to a reduction of household size and an
increase in female labor market participation. In other aspects, Sassen (1991) addressed
the increase in the number of the foreign immigrants as a related characteristic of global
cities.
In Seoul, there have been demographic phenomena similar to the baby boom
generation in the U.S.A. After the Korean War (1950-1953), the baby boom generation in
Korea emerged. Seoul has experienced steady demographic changes such as a reduction
of the average household size and an increase in female labor market participation.
Table 6: Changes in Household Size in Seoul, 1990 and 2000.
Year Total Population (A) Household (B) Average Household Size (A/B) 1990 10,612,577 2,814,845 3.77 2000 9,895,217 3,109,809 3.18
Sources: Korea National Statistical Office, Population and Housing Census Report, 1990 and 2000.
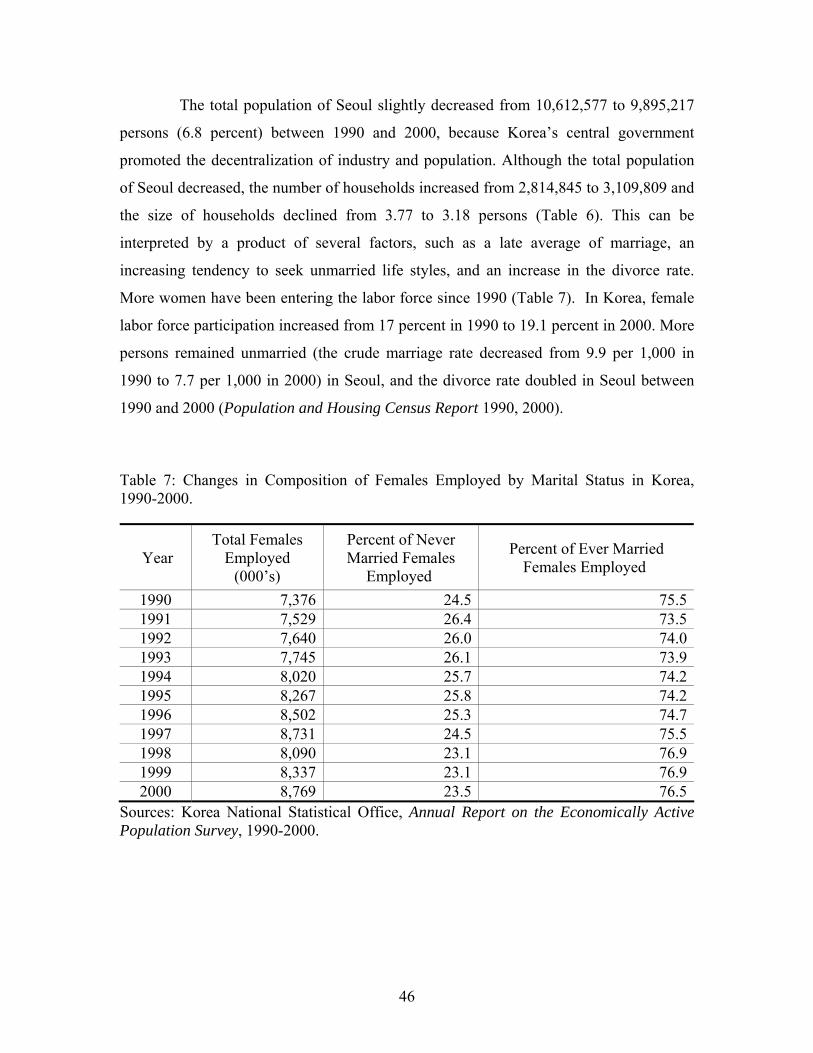
46
The total population of Seoul slightly decreased from 10,612,577 to 9,895,217
persons (6.8 percent) between 1990 and 2000, because Korea’s central government
promoted the decentralization of industry and population. Although the total population
of Seoul decreased, the number of households increased from 2,814,845 to 3,109,809 and
the size of households declined from 3.77 to 3.18 persons (Table 6). This can be
interpreted by a product of several factors, such as a late average of marriage, an
increasing tendency to seek unmarried life styles, and an increase in the divorce rate.
More women have been entering the labor force since 1990 (Table 7). In Korea, female
labor force participation increased from 17 percent in 1990 to 19.1 percent in 2000. More
persons remained unmarried (the crude marriage rate decreased from 9.9 per 1,000 in
1990 to 7.7 per 1,000 in 2000) in Seoul, and the divorce rate doubled in Seoul between
1990 and 2000 (Population and Housing Census Report 1990, 2000).
Table 7: Changes in Composition of Females Employed by Marital Status in Korea, 1990-2000.
Year Total Females
Employed (000’s)
Percent of Never Married Females
Employed
Percent of Ever Married Females Employed
1990 7,376 24.5 75.51991 7,529 26.4 73.51992 7,640 26.0 74.01993 7,745 26.1 73.91994 8,020 25.7 74.21995 8,267 25.8 74.21996 8,502 25.3 74.71997 8,731 24.5 75.51998 8,090 23.1 76.91999 8,337 23.1 76.92000 8,769 23.5 76.5
Sources: Korea National Statistical Office, Annual Report on the Economically Active Population Survey, 1990-2000.
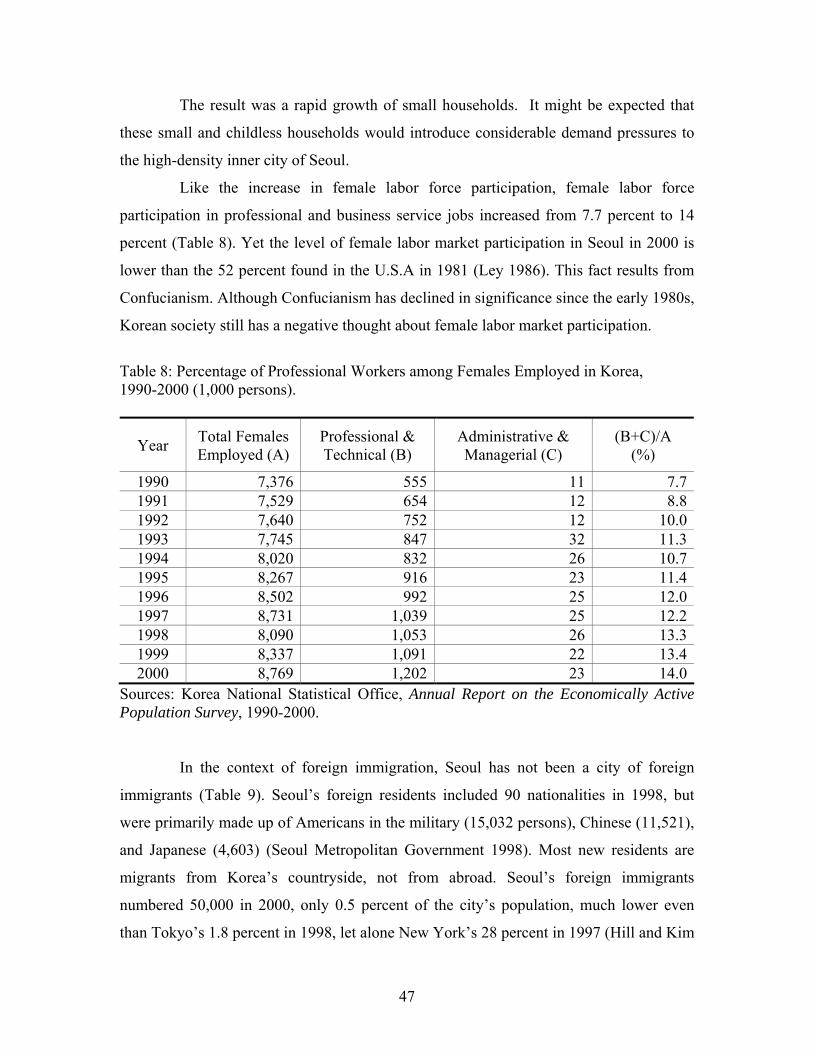
47
The result was a rapid growth of small households. It might be expected that
these small and childless households would introduce considerable demand pressures to
the high-density inner city of Seoul.
Like the increase in female labor force participation, female labor force
participation in professional and business service jobs increased from 7.7 percent to 14
percent (Table 8). Yet the level of female labor market participation in Seoul in 2000 is
lower than the 52 percent found in the U.S.A in 1981 (Ley 1986). This fact results from
Confucianism. Although Confucianism has declined in significance since the early 1980s,
Korean society still has a negative thought about female labor market participation.
Table 8: Percentage of Professional Workers among Females Employed in Korea, 1990-2000 (1,000 persons).
Year Total Females Employed (A)
Professional & Technical (B)
Administrative & Managerial (C)
(B+C)/A (%)
1990 7,376 555 11 7.71991 7,529 654 12 8.81992 7,640 752 12 10.01993 7,745 847 32 11.31994 8,020 832 26 10.71995 8,267 916 23 11.41996 8,502 992 25 12.01997 8,731 1,039 25 12.21998 8,090 1,053 26 13.31999 8,337 1,091 22 13.42000 8,769 1,202 23 14.0
Sources: Korea National Statistical Office, Annual Report on the Economically Active Population Survey, 1990-2000.
In the context of foreign immigration, Seoul has not been a city of foreign
immigrants (Table 9). Seoul’s foreign residents included 90 nationalities in 1998, but
were primarily made up of Americans in the military (15,032 persons), Chinese (11,521),
and Japanese (4,603) (Seoul Metropolitan Government 1998). Most new residents are
migrants from Korea’s countryside, not from abroad. Seoul’s foreign immigrants
numbered 50,000 in 2000, only 0.5 percent of the city’s population, much lower even
than Tokyo’s 1.8 percent in 1998, let alone New York’s 28 percent in 1997 (Hill and Kim
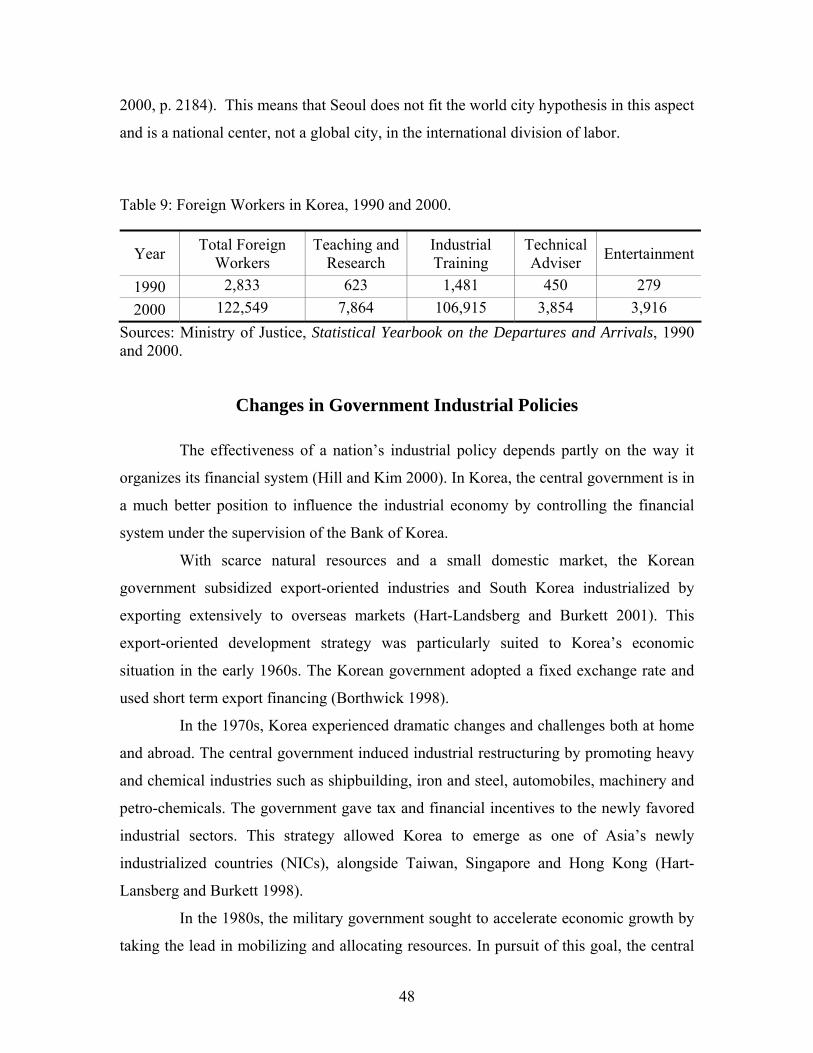
48
2000, p. 2184). This means that Seoul does not fit the world city hypothesis in this aspect
and is a national center, not a global city, in the international division of labor.
Table 9: Foreign Workers in Korea, 1990 and 2000.
Year Total Foreign Workers
Teaching and Research
Industrial Training
Technical Adviser Entertainment
1990 2,833 623 1,481 450 279 2000 122,549 7,864 106,915 3,854 3,916
Sources: Ministry of Justice, Statistical Yearbook on the Departures and Arrivals, 1990 and 2000.
Changes in Government Industrial Policies
The effectiveness of a nation’s industrial policy depends partly on the way it
organizes its financial system (Hill and Kim 2000). In Korea, the central government is in
a much better position to influence the industrial economy by controlling the financial
system under the supervision of the Bank of Korea.
With scarce natural resources and a small domestic market, the Korean
government subsidized export-oriented industries and South Korea industrialized by
exporting extensively to overseas markets (Hart-Landsberg and Burkett 2001). This
export-oriented development strategy was particularly suited to Korea’s economic
situation in the early 1960s. The Korean government adopted a fixed exchange rate and
used short term export financing (Borthwick 1998).
In the 1970s, Korea experienced dramatic changes and challenges both at home
and abroad. The central government induced industrial restructuring by promoting heavy
and chemical industries such as shipbuilding, iron and steel, automobiles, machinery and
petro-chemicals. The government gave tax and financial incentives to the newly favored
industrial sectors. This strategy allowed Korea to emerge as one of Asia’s newly
industrialized countries (NICs), alongside Taiwan, Singapore and Hong Kong (Hart-
Lansberg and Burkett 1998).
In the 1980s, the military government sought to accelerate economic growth by
taking the lead in mobilizing and allocating resources. In pursuit of this goal, the central

49
government launched its five-year development plans, strengthened its control over the
financial markets by nationalizing commercial banks, and amended the Bank of Korea
Act to subordinate the central bank to the government (Cho 1995).
In the 1990s, Korean companies faced intense competition. The rapid growth of
developing countries, the launch of the World Trade Organization (WTO), and the flow
of deregulation and liberalization led to heightened competition in both domestic and
international markets (Stiglitz 2002). In 1997, the Korean financial crisis was triggered
by a shortage of foreign reserves, resulting in a highly volatile Won-dollar exchange rate.
However, the main cause was the structural weakness of the Korean economy that was
revealed and aggravated by the contagion effect of the Asia financial crisis. The Korean
government failed to keep up with the rapid pace of neoliberal globalization characterized
by fiscal austerity, privatization, and market liberalization (Stiglitz 2002).
By agreeing to the financial bail-out by the International Monetary Fund (IMF),
the Korean government consented to pursue macroeconomic stabilization and structural
reform in the financial sector, the corporate sector, and the labor market, and further
agreed to accelerate trade and to liberalize its capital market (Korean Securities
Association 2002).
Unemployment Rate of Korea (1981-2004)
0.0
1.0
2.0
3.0
4.0
5.0
6.0
7.0
8.0
9.0
1981 1983 1985 1987 1989 1991 1993 1995 1997 1999 2001 2003
Year
Une
mpl
oym
ent R
ate
(%)
TotalMaleFemale
Figure 11: Korea's Unemployment Rate, 1981-2004. Sources: Korea National Statistical Office, Annual Report on the Economically Active Population Survey, 1981-2004. Seoul.
50
After being severely hit by the 1997 financial crisis, the average unemployment
rate soared from 2.6 percent in 1997 to 7.0 percent in 1998 (Figure 11). The income of
urban workers in the bottom fifth of the income distribution dropped by 17.2 percent in
1998, while the income of the top fifth dropped by only 0.3 percent (Korea Herald 1999).
Furthermore, economic depression followed by the financial crisis widened the gap of
wealth, and facilitated social and spatial polarization and economic and political
restructuring in Seoul.
The gap in wealth produced class-segregated residential areas in Seoul and the
instability of financial markets made speculative funds flow into the real estate market.
To improve efficiency in the public sector, the central and local governments were
downsized and public companies were privatized. Such a political restructuring with the
introduction of local self-government systems of 1995 accelerated the severe competition
among local governments to lure the middle class in order to gain tax revenues as a way
of improving fiscal independence.
Summary
This chapter investigated the context of gentrification in Seoul between 1990
and 2000. In the context of Smith’s rent gap thesis, Seoul’s supply of potentially
gentrifiable property has a high potential of gentrification in that the residential and
commercial land values in the inner city are lower than those of the CBD, sub-CBDs, and
suburbs. The low land values of the inner city can be illustrated as the “rent gap valley”
that Smith argued. Thus, the inner city of Seoul still has high potential land rents and
reveals the rise of land values through redevelopment.
In terms of the change in industrial, occupational and earnings structures that
underpin middle class demand in the housing market, using Ley’s post-industrial city
status thesis and Sassen’s world city argument, it is clear that the middle class in inner
Seoul has continued to grow in both size and significance over the past 10 years. The
industrial transformation of the city has been linked to a parallel occupational
restructuring, reflected in a long term decline of unskilled manual workers and continued
expansion of professional, technical, administrative, and managerial workers. In addition,
these changes have been linked to a growth of earnings and income, leading to an

51
increase in inequality. Not surprisingly in a market economy, the increase in the size and
purchasing power of the middle class has been accompanied by an intensification of
demand in the housing market. But one should note that Seoul has a relatively high
dependence on manufacturing compared to cities in the West, and that it is not a global
city, but a national center. Although Seoul may not have conformed to the world city
assumptions in the past, it is being forced by global pressures to move in that direction.
In the context of the change in demographics, Seoul has experienced a reduction
of household size and a growth of female labor market participation, but women’s labor
force participation is still lower than that of American cities. The number of foreign
immigrants is very small compared with global cities such as New York, London, and
Tokyo.
The Korean government’s industrial policies have focused on the intervention
and regulation for export-oriented economic strategy since the 1960s. After the financial
crisis of 1997, the role of the central government shrunk and competition among local
governments accelerated. Such a policy change was an important force generating
gentrification in Seoul.
52
CHAPTER 4
ALTERNATIVE MODELS FOR EXPLAINING GENTRIFICATION IN SEOUL
This chapter constructs a comparative and systematic analysis of gentrification
in the 522 administrative dong of Seoul in 1990 (or 1991) and 2000 (or 2001). The
research design proceeds in several stages. First, dong as the unit of analysis are defined
and their locations are mapped. Second, various causal accounts of gentrification are
consolidated into four principal explanations; these provide the hypotheses to be
examined by comparative analysis. Third, these explanations are made operational
through a set of indicators that serve as independent variables in the analysis. Fourth,
operational definitions of gentrification in the dong of Seoul are established. Finally,
correlation, factor and stepwise regression analyses are employed, using a gentrification
index for the 522 dong of Seoul between 1990 and 2000 acting as the dependent variable.
This chapter answers questions concerning the driving forces of gentrification in Seoul.
Analysis of Dong
Since 1949, when Seoul was officially given the present name of the Seoul
Metropolitan Government, the city has experienced many changes in its administrative
areas. A Gu is a division of Seoul similar to a ward in the U.K. or a county in the U.S.A.
Its government administers many of the functions that are handled by city governments in
other jurisdictions. Gu are in turn divided into dong. In 1943, the present gu system was
put in place and Seoul had seven gu: Jongro-gu, Jung-gu, Dongdaemun-gu, Yongsan-gu,
Seongdong-gu, Yeongdeungpo-gu, and Seodaemun-gu. Later Mapo-gu (1943),
Seongbuk-gu (1949), Dobong-gu and Gwanak-gu (1973), Gangnam-gu (1975), Gangseo-
gu (1977) were added. Additions continued with Eunpyeong-gu, Guro-gu, Dongjak-gu,
and Gangdong-gu in 1979, Jungrang-gu, Nowon-gu, Yangcheon-gu, Seocho-gu, Songpa-
gu in 1988, and Geumcheon-gu, Gangbuk-gu, Gwangjin-gu in 1995, bringing the total in
2000 to 25 gu and 522 dong (Figure 12). Such changes in administrative areas reflect the
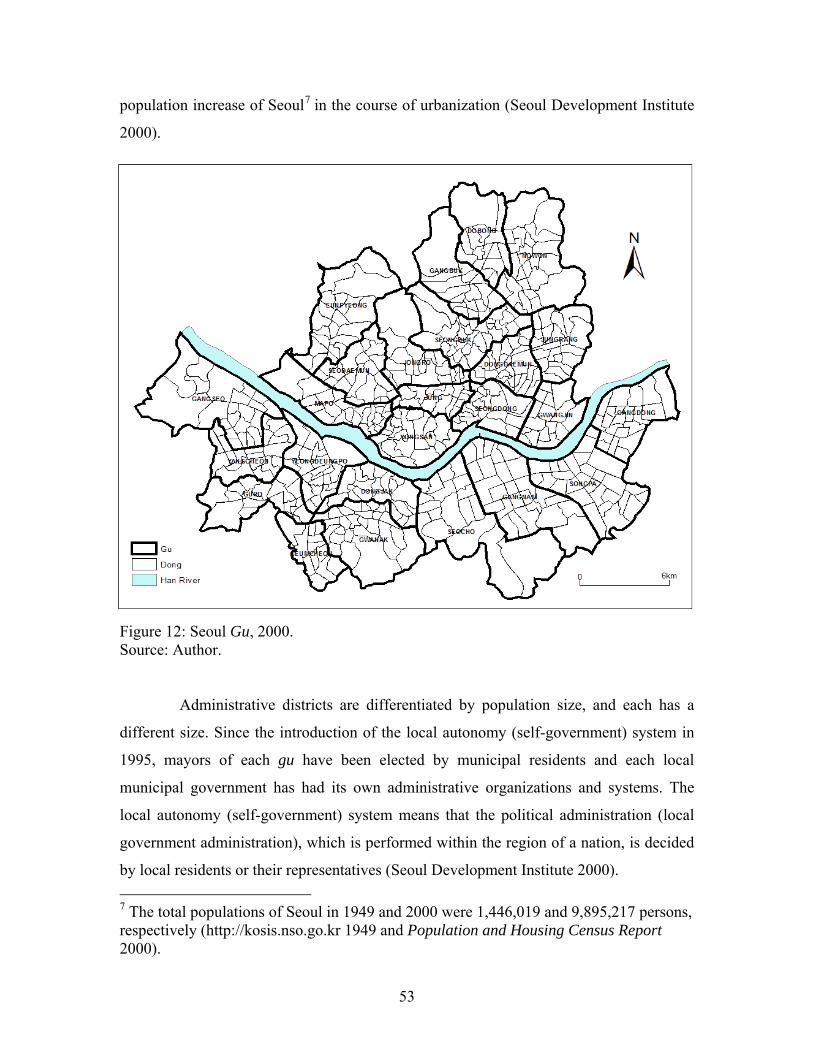
53
population increase of Seoul7 in the course of urbanization (Seoul Development Institute
2000).
Figure 12: Seoul Gu, 2000. Source: Author.
Administrative districts are differentiated by population size, and each has a
different size. Since the introduction of the local autonomy (self-government) system in
1995, mayors of each gu have been elected by municipal residents and each local
municipal government has had its own administrative organizations and systems. The
local autonomy (self-government) system means that the political administration (local
government administration), which is performed within the region of a nation, is decided
by local residents or their representatives (Seoul Development Institute 2000). 7 The total populations of Seoul in 1949 and 2000 were 1,446,019 and 9,895,217 persons, respectively (http://kosis.nso.go.kr 1949 and Population and Housing Census Report 2000).
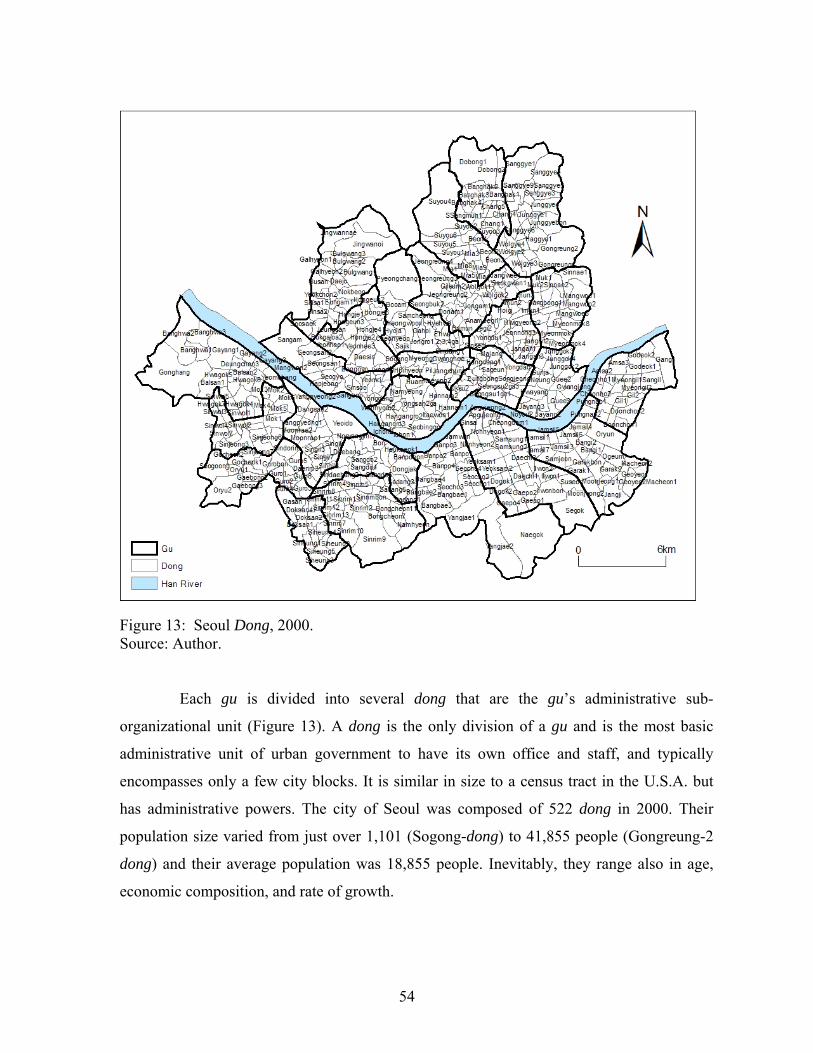
54
Figure 13: Seoul Dong, 2000. Source: Author.
Each gu is divided into several dong that are the gu’s administrative sub-
organizational unit (Figure 13). A dong is the only division of a gu and is the most basic
administrative unit of urban government to have its own office and staff, and typically
encompasses only a few city blocks. It is similar in size to a census tract in the U.S.A. but
has administrative powers. The city of Seoul was composed of 522 dong in 2000. Their
population size varied from just over 1,101 (Sogong-dong) to 41,855 people (Gongreung-2
dong) and their average population was 18,855 people. Inevitably, they range also in age,
economic composition, and rate of growth.
55
Hypotheses Explaining Gentrification in Seoul
The causes and significance of gentrification have been debated widely (see
Hamnett 1991, 2003; Lees 1994, 2000; Slater 2004; Smith 1979, 1996, 2002; and Ley
1986, 1996, for summaries) and led to four key competing hypotheses.
The first hypothesis was that the roots of gentrification lay in the changing
industrial structure of major cities with the switch from manufacturing to a producer
service economy (Ley 1980, 1986, 1996 and Hamnett 1991, 2003). This change involved
a concomitant change in the occupational class structure from one based on the
dominance of a large manual working class to one increasingly dominated by white-
collar professionals, managers and technical workers in the financial, cultural and service
industries that were concentrated in major global cities. The growth of white-collar
service activities and the decentralization of manufacturing stimulated the demand bulge
of the middle class entering the housing market. This hypothesis is related to Ley’s (1980,
1986) post-industrial city status thesis.
The second hypothesis was that as a result of these changes in class composition,
there were also changes in cultural orientation, preferences, and working patterns of
middle class that have predisposed them to living in the inner city rather than commuting
from suburbia (Ley 1980; Bridge 1994). This hypothesis included the idea that as dual
professional households grew, gender relations changed. This hypothesis is associated
with Bondi’s (1991), Bridge’s (1995), Butler’s (1997), and Butler and Robson’s (2003)
demographic change argument.
The third hypothesis, strongly opposed to the previous hypotheses, was that the
driving force behind gentrification was not the middle class, but the growing gap between
potential property values and underlying land values in the inner city (Smith 1979, 1996).
This hypothesis pertains to Smith’s rent gap thesis focused on the housing market.
The final hypothesis was related to targeted public sector policies. This
hypothesis is related to Kennedy and Leonard’s (2001) institutional policy argument.
Even though economic forces seemed to drive gentrification, government policies of the
past or present could either facilitate or impede gentrification. It focused on the role of
the state and local government in that gentrification policies produced increased revenues
56
for municipalities through the inflow of higher income residents and reduced demand for
public services.
Although there was certainly overlap among the various hypotheses and few
authors confined themselves to a single explanation, four major explanatory emphases of
gentrification may be identified. Findings from North America and Europe should not be
transferred uncritically to Seoul. Distinctive features of the city of Seoul included the
presence of deepening income inequality and residential segregation triggered by the
1997 financial crisis and ongoing public sector investment in the built environment (Hart-
Landsberg and Burkett 2001). Therefore, gentrification processes identified in the U.S.
and Europe might well require a restatement in the case of Seoul.
This research suggested four major hypotheses, including demographic
characteristics, housing market characteristics, post-industrial city status characteristics,
and institutional policy characteristics to explain gentrification in Seoul. The core point
of this chapter is to investigate which hypothesis explains gentrification in Seoul.
Operational Definition of Gentrification in Seoul and Selection of
Independent Variables
Two tasks are evident when seeking to evaluate the relative validity of various
explanations of gentrification. First, a single case study is required in order to examine
the empirical case of a research object. A second requirement is that the various
explanations be standardized in terms of a common methodology.
Ley (1986) attempted to make a comparative assessment of four explanatory
accounts for gentrification in the Canadian urban system, with their complementary and
competing interpretations. His independent variables for explaining gentrification were
led to four hypotheses, including the demographic, housing market, urban amenity, and
economic hypotheses. Ley’s proxy variables for the urban amenity hypothesis generated
difficulties in framing operational definitions and securing appropriate data. Hammel and
Wyly’s (1996) model for identifying gentrified areas with census data used only three
measures (socioeconomic, housing, and total population) to interpret gentrification in
Minneapolis-St. Paul. Their model had a weakness in focusing only on the economic and
demographic dimensions of gentrification, and excluded the federal or local
57
governments’ role. Although Ley’s and Hammel and Wyly’s model had an operational
weakness of excluding institutional policy, their research contributed to the construction
of a model for explaining gentrification in a case study of a individual city. Therefore,
this chapter revised their research to improve the empirical measure.
It was necessary to set out operational definitions of gentrification and the four
explanations for gentrification in Seoul. Once this was accomplished, correlation, factor
and stepwise regression analyses can permit various explanations of gentrification in
Seoul to be both contrasted and combined in a systematic manner.
The number of observations (522 dong) can decrease problems of data
availability that result from incorporating smaller dong into the analysis. A starting date
of 1990 (or 1991) was justified on theoretical as well as practical grounds. Though
middle class resettlement in Seoul dates back in some dong to the 1988 Seoul Olympics,
across the city of Seoul the mean level of social status change during the 1980s was small
and much less than the changes recorded during the 1990s.
More problematic was the operational definition of gentrification. Ley (1986)
suggested two options: indicators of housing market activity (such as price changes,
renovations, turnover rates, or building permits) or measures of changing household
status. With 522 dong in Seoul and a ten-year time period, the former option was not
feasible. This chapter therefore followed a majority of studies in using measures of
changing social status at the dong level as the basic index of gentrification in Seoul.
Gentrification refers here to a change in household social status, independent of the
housing stock involved, which might be either renovated or redeveloped units.
In measuring social status, both ecological methods (like social area analysis or
factorial ecology) and social prestige scales typically employ some linear combination of
occupation, income, and education (Babbie 2001). On theoretical grounds, measures of
occupation and education were used here. Specifically, a social status index can be
defined for each dong as the mean value of (1) percentage of the work force employed in
the quaternary sector8 (professional, managerial, technical, and administrative jobs) plus
8 The quaternary sector refers to economic activities related to urban information-based occupations with high qualification requirements and high growth rates, such as finance, insurance, and real estate services (FIRE industry) (Illeris 1996). The quaternary sector of

58
(2) the percentage of the population with a university education. This social status index
was computed for both 1990 and 2000 for each dong in Seoul (Table 10).
Table 10: Statistical Summary of Social Status Indexes and Gentrification Index.
Value Social Status Index 1990 Social Status Index 2000 Gentrification IndexMinimum 1.98 5.30 -29.51Maximum 56.20 50.97 27.86
Mean 16.84 18.56 1.72 Standard 8.76 8.77 8.15
Source: Author.
The equations for the social status indexes are as follows:
2
100 Residents Dong Total of #
Degreey Universita with Residents Dong of #100 Employees Dong Total of #
EmployeesSector Quaternary Dong of #
Index Status Social⎥⎦
⎤⎢⎣
⎡⎟⎟⎠
⎞⎜⎜⎝
⎛×+⎟⎟
⎠
⎞⎜⎜⎝
⎛×
=
The social status indexes in 1990 and 2000 were mapped (Figures 14 and 15). In Figure
14, whereas the Seoul Central Business District (CBD), including Jongro-gu and Jung-gu,
had low social status indexes, the periphery of the CBD and the sub-CBDs had high
social status indexes. The 234 dong with the lowest social status indexes (below 14),
including Dobong-dong and Mia-dong, were low class residential areas located in the
edge of Seoul and the inner Seoul restricted by green belt and urban planning act. The 26
dong with the highest social status indexes (over 35), including Sanggye-dong, Banpo-
dong, Apgujeong-dong, Gaepo-dong, Jamsil-dong, and Songpa-dong, were typical
middle class residential areas formed by the construction of the Kangnam apartment
district in the 1970s and Sanggye new town in the 1980s.
this research includes economic activities related to finance, insurance, real estate services, and administrative job used in Business and Employment Statistical Report in 1990 and 2000.
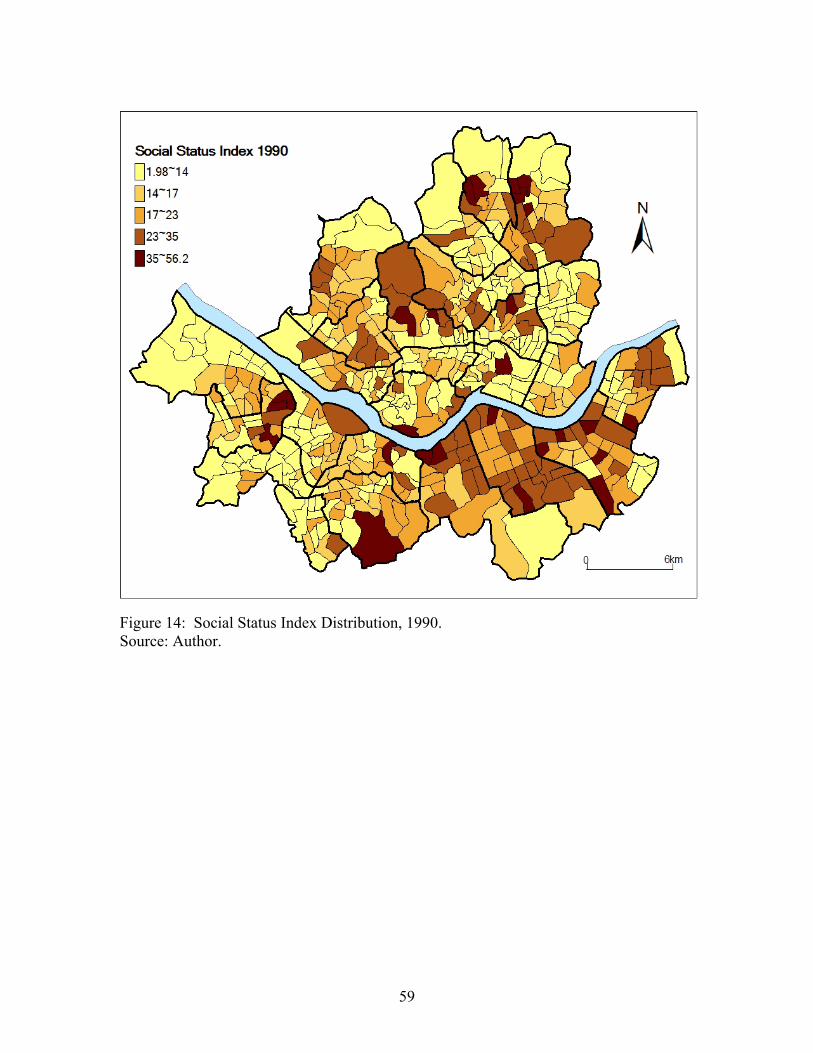
59
Figure 14: Social Status Index Distribution, 1990. Source: Author.

60
Figure 15: Social Status Index Distribution, 2000. Source: Author. Unlike the social status indexes in 1990, the dong with high social status indexes in 2000
were concentrated in the CBD and sub-CBDs (Figure 15). This means that persons with
high social status indexes migrated into the CBD or sub-CBDs and suggests that the
residential areas neighboring the CBD were upgraded through redevelopment. This fact
can be identified in Figure 16. Dong with the highest percent changes in the social status
indexes between 1990 and 2000 were located in the city center and sub-CBDs and the
distribution of the social status indexes suggests that Seoul has experienced
suburbanization as well as centralization of persons with high social status.
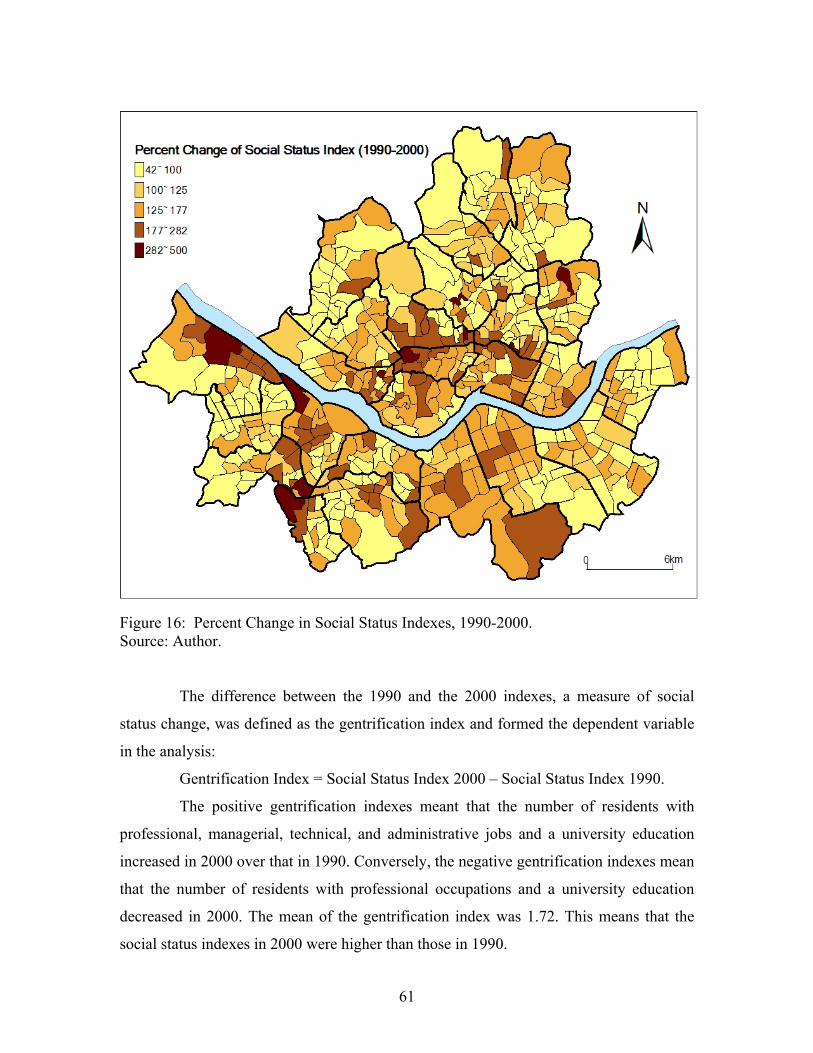
61
Figure 16: Percent Change in Social Status Indexes, 1990-2000. Source: Author.
The difference between the 1990 and the 2000 indexes, a measure of social
status change, was defined as the gentrification index and formed the dependent variable
in the analysis:
Gentrification Index = Social Status Index 2000 – Social Status Index 1990.
The positive gentrification indexes meant that the number of residents with
professional, managerial, technical, and administrative jobs and a university education
increased in 2000 over that in 1990. Conversely, the negative gentrification indexes mean
that the number of residents with professional occupations and a university education
decreased in 2000. The mean of the gentrification index was 1.72. This means that the
social status indexes in 2000 were higher than those in 1990.

62
Dong that had indexes over 11 were mainly located in the center of Seoul
(Figure 17). Sinnae-2 dong (27.86) and Namhyeon-dong (21.63) have exceptionally high
gentrification indexes. These two dong were new town areas developed under the policy
of new town development projects that changed open spaces delineated by a green belt
into huge apartment complexes. Therefore, these two dong did not experience
gentrification. Except for these two dong, other dong that have high gentrification
indexes over 22 were located in the CBD and the sub-CBDs. Dong that have an index
from 11 to 21 were distributed near the CBD and the sub-CBDs. In a strict sense, dong
showing the index from 11 to 21, located near the CBD and the sub-CBDs, were districts
that have experienced gentrification.
Figure 17: Gentrification Index Distribution, (Social Status 2000-1990). Source: Author.
Sinnae 2-dong
Namhyeon-dong
63
The independent variables represent surrogates for each of the demographic,
housing market, post-industrial city status, and institutional policy characteristics
accounting for gentrification in Seoul (Table 11). These variables assessing various
dimensions of Seoul were drawn from a number of different statistical sources for 1990
(or 1991) and 2000 (or 2001). In this analysis, the gentrification index was calculated
from difference between the social status index in 2000 and in 1990. Thus, the start year
of each independent variable that can be matched with gentrification index change is
1990 (or 1991) and percent change in each independent variables means the change in the
independent variable for 10 years.
Six variables were associated with the demographic characteristics in each dong.
These included the number of residents in 1990, the percent change in the number of
residents between 1990 and 2000, the number of households in 1990, the percent change
in the number of households between 1990 and 2000, the mean family size in 1990, and
the percent change in mean family size between 1990 and 2000 (Table 11, variables 1-6).
The housing market characteristics (variables 7-20) included four indicators of
maximum residential and commercial land values in 1991 and percent change in
maximum residential and commercial land values between 1991 and 2001 (variables 15-
18), which were included to test the rent gap thesis. Transforming a theoretical construct
into an empirical variable is never easy, but the definition of the rent gap adopted here as
the difference between potential land values and current land values was consistent with
various elaborations of the rent gap thesis (Smith 1996). Also variables (7-10) with
relation to housing ownership were percent of owner- and cheonse9 - occupied housing
units in 1990 10 and percent change in owner- and cheonse-occupied housing units
between 1990 and 2000. Housing units consist of detached housing, apartments, row
houses, apartments in a private house, and dwelling units in buildings not primarily
9 Cheonse is unique housing rental type in Korea. A renter makes a lump sum deposit of key money at the beginning of occupancy, which is fully refunded at the end of contract period. The landlord usually invests this fund and interest earning represents an imputed rent. Cheonse is an annual contract. The landlord typically demands an annual increase in the cheonse deposit as housing prices rise. In Korea, pure rent payment contracts and combinations of rents and cheonse can be negotiated (Hannah et al. 1993). 10 Percent of Owner (Cheonse) Occupied Housing Units = (# of Owner [Cheonse] Occupied Housing Units ÷ # of Total Housing Units) x 100.
64
intended for human habilitation. Variables such as housing type (11-14) were associated
with the percent of detached housing and apartments in 199011 and percent change in
detached housing and apartments between 1990 and 2000. The last two variables (19 and
20) were the housing supply rate in 199012 and percent change in the housing supply rate
between 1990 and 2000.
The post-industrial city status characteristics (variables 21 and 22) included the
number of total employees in 1991 and percent change in the number of total employees
between 1991 and 2001. More straightforward were assessments of the post-industrial
city status characteristics (variables 23 and 24) that monitor economic performance along
several dimensions for each dong, including total area of office space in 199113 and
percent change in total area of office space between 1991 and 2001.
The institutional policy characteristics (variables 25-28) included the local tax
revenue in 1991, percent change in local tax revenue between 1991 and 2001, degree of
fiscal independence in 1995,14 and percent change in the degree of fiscal independence
between 1995 and 2001 to interpret Seoul local governments’ urban redevelopment
policy changes. The degree of fiscal independence refers to the share of local
governments’ total revenues from local taxes, not national subsidies.
In 1995, the Korean government started a local self-government (autonomy)
system. The system triggered competition between local governments to raise the degree
of fiscal independence through the increase of local tax revenues by redevelopment
(Seoul Development Institute 1995). Each gu government in Seoul had to set up plans
inducing the middle class in order to survive severe competition. Such a policy change
leads to a focus on increasing tax revenues, the degree of fiscal independence, and the
housing supply rate through gentrification.
11 Percent of Detached Housing (Apartments) = (# of Detached Housing (Apartments) ÷ # of Total Housing Units) x 100. 12 Housing Supply Rate = (# of Housing Units ÷ # of Households) x 100. 13 The total area of office space per dong was measured by calculating the total of floor areas used for commerce and business (Office Space Area Report 1991 and 2001). 14 Degree of Fiscal Independence = [(Local Tax Revenues + Non-Tax Revenues) ÷ (Total Dong Budget)] x 100.
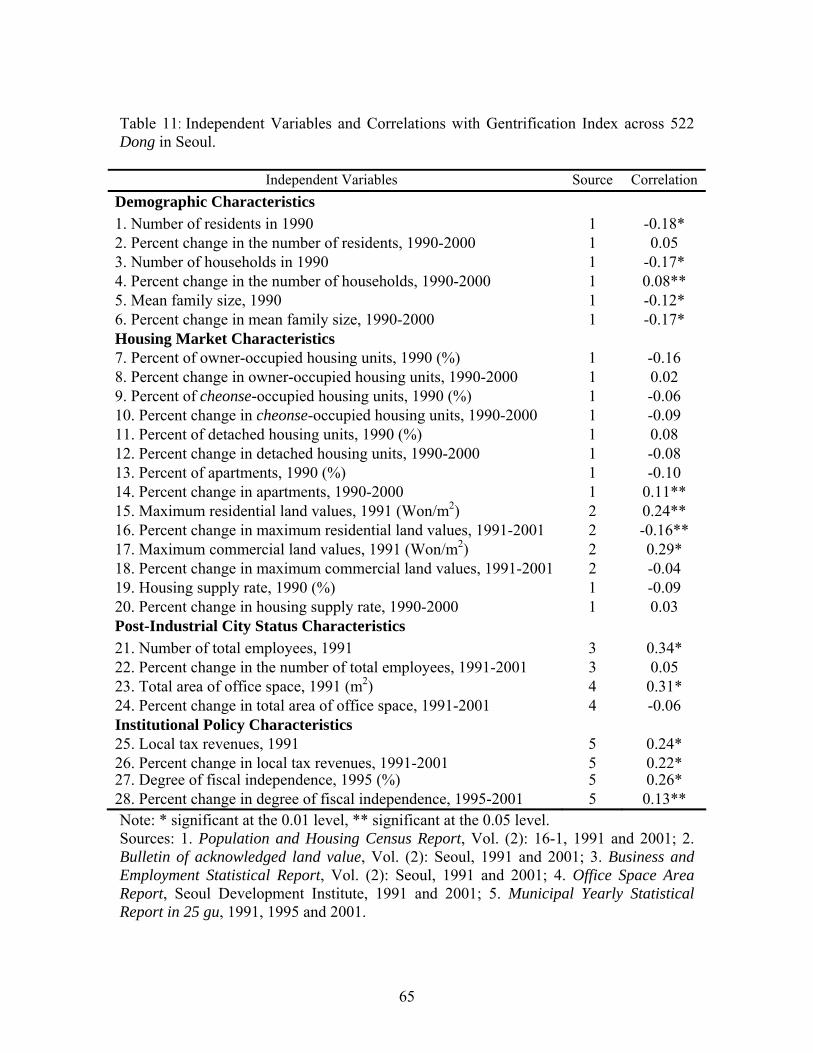
65
Table 11: Independent Variables and Correlations with Gentrification Index across 522 Dong in Seoul.
Independent Variables Source Correlation Demographic Characteristics 1. Number of residents in 1990 1 -0.18* 2. Percent change in the number of residents, 1990-2000 1 0.05 3. Number of households in 1990 1 -0.17* 4. Percent change in the number of households, 1990-2000 1 0.08** 5. Mean family size, 1990 1 -0.12* 6. Percent change in mean family size, 1990-2000 1 -0.17* Housing Market Characteristics 7. Percent of owner-occupied housing units, 1990 (%) 1 -0.16 8. Percent change in owner-occupied housing units, 1990-2000 1 0.02 9. Percent of cheonse-occupied housing units, 1990 (%) 1 -0.06 10. Percent change in cheonse-occupied housing units, 1990-2000 1 -0.09 11. Percent of detached housing units, 1990 (%) 1 0.08 12. Percent change in detached housing units, 1990-2000 1 -0.08 13. Percent of apartments, 1990 (%) 1 -0.10 14. Percent change in apartments, 1990-2000 1 0.11** 15. Maximum residential land values, 1991 (Won/m2) 2 0.24** 16. Percent change in maximum residential land values, 1991-2001 2 -0.16** 17. Maximum commercial land values, 1991 (Won/m2) 2 0.29* 18. Percent change in maximum commercial land values, 1991-2001 2 -0.04 19. Housing supply rate, 1990 (%) 1 -0.09 20. Percent change in housing supply rate, 1990-2000 1 0.03 Post-Industrial City Status Characteristics 21. Number of total employees, 1991 3 0.34* 22. Percent change in the number of total employees, 1991-2001 3 0.05 23. Total area of office space, 1991 (m2) 4 0.31* 24. Percent change in total area of office space, 1991-2001 4 -0.06 Institutional Policy Characteristics 25. Local tax revenues, 1991 5 0.24* 26. Percent change in local tax revenues, 1991-2001 5 0.22*27. Degree of fiscal independence, 1995 (%) 5 0.26* 28. Percent change in degree of fiscal independence, 1995-2001 5 0.13** Note: * significant at the 0.01 level, ** significant at the 0.05 level. Sources: 1. Population and Housing Census Report, Vol. (2): 16-1, 1991 and 2001; 2. Bulletin of acknowledged land value, Vol. (2): Seoul, 1991 and 2001; 3. Business and Employment Statistical Report, Vol. (2): Seoul, 1991 and 2001; 4. Office Space Area Report, Seoul Development Institute, 1991 and 2001; 5. Municipal Yearly Statistical Report in 25 gu, 1991, 1995 and 2001.
66
Correlations
Simple correlations between the gentrification index and the 28 independent
variables representing the four dimensions of gentrification were calculated and
interpreted (Table 11). The standardization of variables was required because the attribute
matrix of the 522 observations on 28 variables had huge differences among variables. Let
Zi denote a standardized value, where a variable is X and its mean is µ; the formula for
the standardized variable is as following: Zi = (Xi-µi)/sqrt σij. The correlations with
gentrification were used in interpreting each hypothesis and examined whether or not
independent variables yielded a single or mixed explanation of gentrification in Seoul.
Correlations between the gentrification index and the 28 independent variables
representing the four characteristics are shown in Table 11. The correlation coefficients
ranged from -0.18 to 0.34. Only seven variables had correlations with the gentrification
index in excess of 0.20, and the other 21 variables had low correlations below 0.20. In
significant level, 10 variables were significant at the .01 confidence level, and 5 variables
were significant at the .05 level. Other 13 variables were not significant at both the .01
and .05 levels. Clearly these results supported no single dominant explanation of
gentrification in Seoul.
The variables representing the demographic characteristics had a low correlation
(-0.18 ≤ r ≤ 0.08) with the gentrification index, though they were in the predicted
direction. Gentrification had positive associations with percent change in the number of
residents (r = 0.05) and percent change in the number of households (r = 0.08). It was
negatively, if weakly, associated with mean family size (r = -0.12), percent change in
mean family size (r = -0.17), the number of residents (r = -0.18), and the number of
households in 1990 (r = -0.17). The relationships with the change in the number of
residents (r = 0.05) and change in the number of households (r = 0.08), though positive,
were quite weak, because there was no substantial increase change in Seoul’s population
and household size between 1990 and 2000. Gentrification had modest negative
associations with the number of residents in 1990 (r = -0.18), the number of households
in 1990 (r = -0.17), the mean family size (r = -0.12), and change in mean family size (r =
-0.17). This means that gentrification is associated with the decrease of average family

67
size between 1990 and 2000. This fact supports Bondi’s (1991) argument that changes in
the demographic pattern of the middle class created gentrification.
Correlations for the housing market characteristics varied from -0.16 to 0.29.
The housing type (r = -0.10 ~ 0.11), the housing ownership (r = -0.16 ~ 0.02), the
housing supply rate (r = -0.09), and the change in housing supply rate (r = 0.03) were not
significant at the .01 and .05 levels. There was no support for the postulated relationship
between gentrification and owner occupancy (r = -0.16). There was a modest association
between gentrification and maximum residential land values (r = 0.24) and commercial
land values (r = 0.29). Conversely, there was a negative association between
gentrification and change in residential land values (r = -0.16) and change in commercial
land values (r = -0.04). This means that Seoul exhibited a small decrease of land values
between 1990 and 2000. In other words, gentrification between 1990 and 2000 was
associated with inner cities that had higher (not lower) residential and commercial land
values relative to the city average. This proves that inner city Seoul did have relatively
higher potential land values relative to the suburban areas such as the cities of Bundang
and Ilsan in Gyeonggi province. Thus, the rent gap thesis was supported by the results.
Among the four variables representing post-industrial city status characteristics,
the number of total employees in 1990 (r = 0.34) and the total area of office space in
1990 (r = 0.31) had the strongest relationship with gentrification among all 28
independent variables. This result parallels Ley’s (1996) finding and strengthens the
argument for the importance of the effects of a post-industrial, office-based economy
upon urban spatial structure. It indicates that Seoul’s economy changed from a
manufacturing and service industry to the quaternary sector.
Correlations for the institutional policy characteristics were somewhat stronger
than demographic and housing market characteristics. Local tax revenues in 1991 (r =
0.24), change in local tax revenues between 1991 and 2001 (r = 0.22), degree of fiscal
independence in 1995 (r = 0.26), and change in degree of fiscal independence (r = 0.13)
had a little higher association. This means that the gentrification index was positively
associated with increase in local tax revenues and local government’s degree of fiscal
independence. This fact reveals that gentrification is a method to raise local governments’
tax revenues and degree of fiscal independence measured by its own tax revenues, not
68
national subsidies. Thus, Korean local governments can use gentrification as an
alternative method to alleviate their own fiscal stresses.
The evidence from the correlation analysis clearly favored the demographic,
rent gap, post-industrial city status and institutional explanations of gentrification in
Seoul. Because intercorrelations existed among the independent variables, the above
results must be qualified. That is, the relative success of the four characteristics could be
misleading if their independent variables account for the same variation. Moreover, the
intercorrelation occurred among independent variables across the four explanatory
characteristics, indicating that the theoretical fragmentation of the four explanations can
be incorporated into a more appropriately integrated system of variables.
Factor Analysis
Multicollinearity among the 28 predicator variables should be respected and
perhaps might be turned to theoretical advantage. Factor analysis isolates the underlying
structures in a correlation or covariance matrix and allows independent factor scores to
replace the original intercorrelated variables in a correlation-regression analysis
(McClendon 1994). This strategy not only eliminates multicollinearity but might also
provide a more theoretically relevant integration of the original variables by allowing an
alternative grouping that might vary from the four initial characteristics. The variables
selected for factor analysis were those used by the correlation analysis (Table 12). The
independent factor loadings were labeled and scores from factor analysis were regressed
against the gentrification index. The results reveal which independent variables account
most effectively for gentrification in Seoul.
Factor analysis by principal component factoring divided an attribute matrix
into a correlation matrix showing interrelations among independent variables.15 Seven
factors with eigenvalues above 1.0 were drawn. This research regarded these seven
factors as common factors. The varimax rotation method was used to clarify the
15 Bartlett’s test of sphericity was used to prove that there is significant correlation in the 28 variables. The result shows that there is overwhelming evidence against the null hypothesis of no significant correlation in the 28 by 28 attribute matrix. Therefore I can proceed with further investigation of the correlation structure using factor and regression analysis.
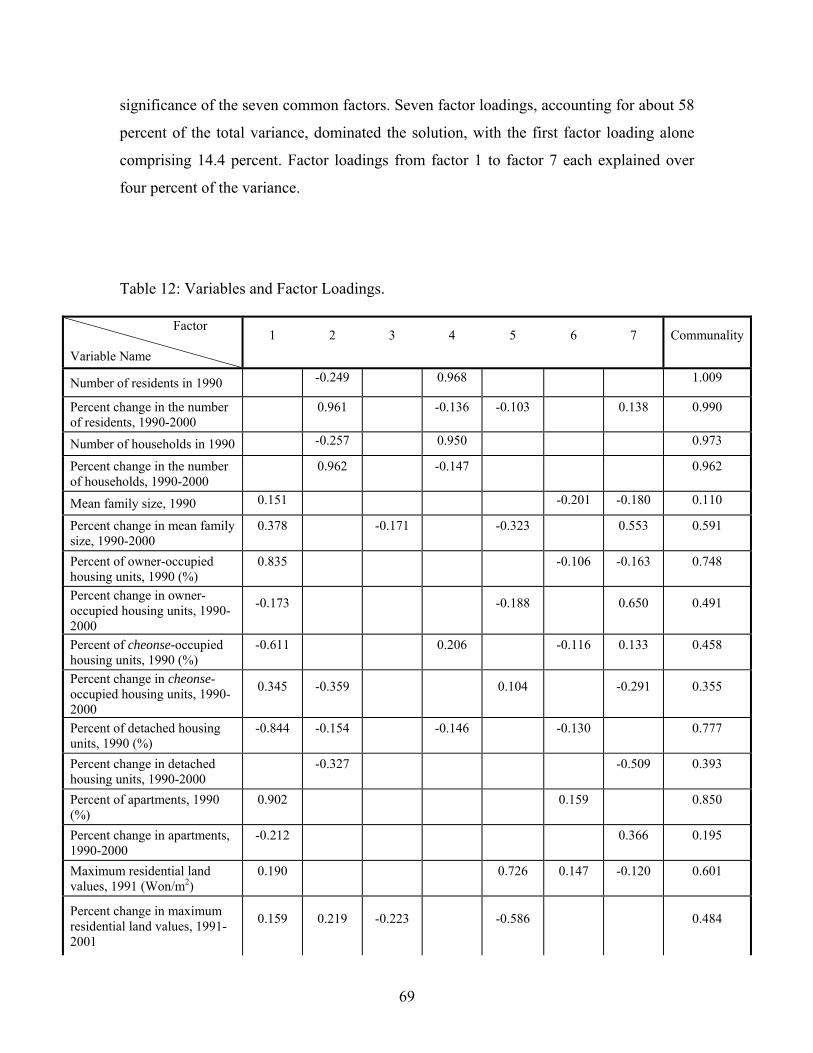
69
significance of the seven common factors. Seven factor loadings, accounting for about 58
percent of the total variance, dominated the solution, with the first factor loading alone
comprising 14.4 percent. Factor loadings from factor 1 to factor 7 each explained over
four percent of the variance.
Table 12: Variables and Factor Loadings.
Factor
Variable Name 1 2 3 4 5 6 7 Communality
Number of residents in 1990 -0.249 0.968 1.009
Percent change in the number of residents, 1990-2000
0.961 -0.136 -0.103 0.138 0.990
Number of households in 1990 -0.257 0.950 0.973
Percent change in the number of households, 1990-2000
0.962 -0.147 0.962
Mean family size, 1990 0.151 -0.201 -0.180 0.110
Percent change in mean family size, 1990-2000
0.378 -0.171 -0.323 0.553 0.591
Percent of owner-occupied housing units, 1990 (%)
0.835 -0.106 -0.163 0.748
Percent change in owner-occupied housing units, 1990-2000
-0.173 -0.188 0.650 0.491
Percent of cheonse-occupied housing units, 1990 (%)
-0.611 0.206 -0.116 0.133 0.458
Percent change in cheonse-occupied housing units, 1990-2000
0.345 -0.359 0.104 -0.291 0.355
Percent of detached housing units, 1990 (%)
-0.844 -0.154 -0.146 -0.130 0.777
Percent change in detached housing units, 1990-2000
-0.327 -0.509 0.393
Percent of apartments, 1990 (%)
0.902 0.159 0.850
Percent change in apartments, 1990-2000
-0.212 0.366 0.195
Maximum residential land values, 1991 (Won/m2)
0.190 0.726 0.147 -0.120 0.601
Percent change in maximum residential land values, 1991-2001
0.159 0.219 -0.223 -0.586 0.484
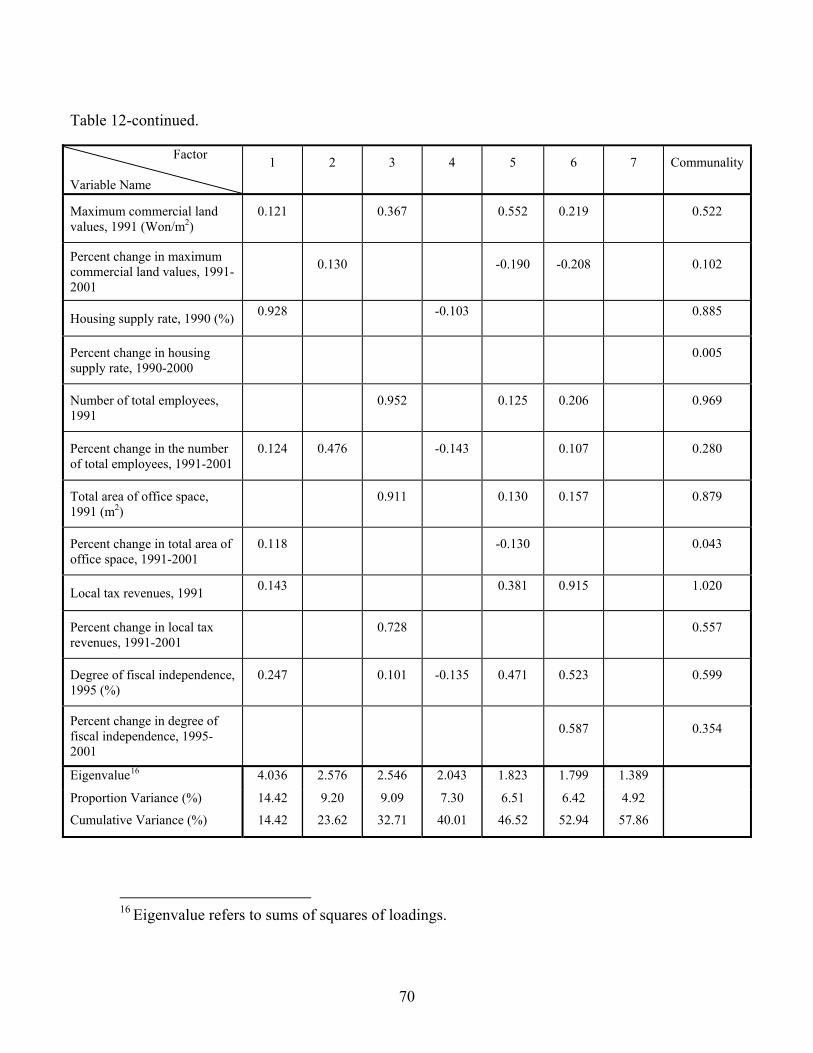
70
Table 12-continued.
Factor
Variable Name
1 2 3 4 5 6 7 Communality
Maximum commercial land values, 1991 (Won/m2)
0.121 0.367 0.552 0.219 0.522
Percent change in maximum commercial land values, 1991-2001
0.130 -0.190 -0.208 0.102
Housing supply rate, 1990 (%) 0.928 -0.103 0.885
Percent change in housing supply rate, 1990-2000
0.005
Number of total employees, 1991
0.952 0.125 0.206 0.969
Percent change in the number of total employees, 1991-2001
0.124 0.476 -0.143 0.107 0.280
Total area of office space, 1991 (m2)
0.911 0.130 0.157 0.879
Percent change in total area of office space, 1991-2001
0.118 -0.130 0.043
Local tax revenues, 1991 0.143 0.381 0.915 1.020
Percent change in local tax revenues, 1991-2001
0.728 0.557
Degree of fiscal independence, 1995 (%)
0.247 0.101 -0.135 0.471 0.523 0.599
Percent change in degree of fiscal independence, 1995-2001
0.587 0.354
Eigenvalue16 4.036 2.576 2.546 2.043 1.823 1.799 1.389
Proportion Variance (%) 14.42 9.20 9.09 7.30 6.51 6.42 4.92
Cumulative Variance (%) 14.42 23.62 32.71 40.01 46.52 52.94 57.86
16 Eigenvalue refers to sums of squares of loadings.
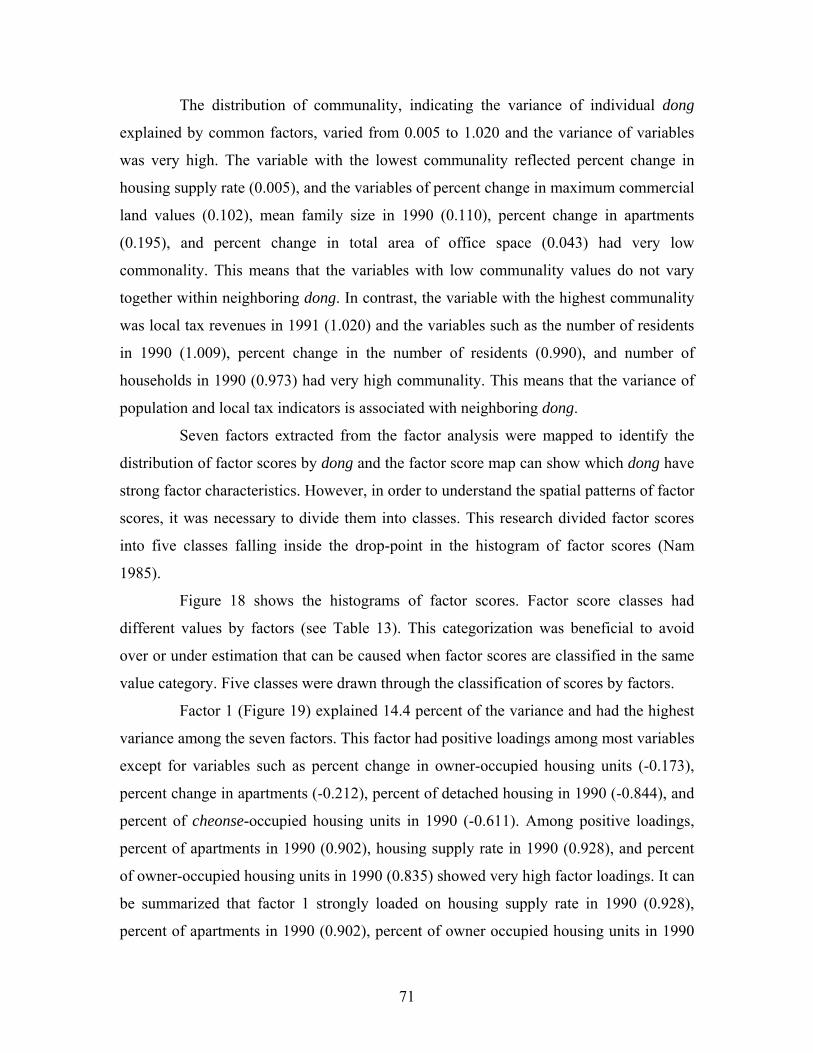
71
The distribution of communality, indicating the variance of individual dong
explained by common factors, varied from 0.005 to 1.020 and the variance of variables
was very high. The variable with the lowest communality reflected percent change in
housing supply rate (0.005), and the variables of percent change in maximum commercial
land values (0.102), mean family size in 1990 (0.110), percent change in apartments
(0.195), and percent change in total area of office space (0.043) had very low
commonality. This means that the variables with low communality values do not vary
together within neighboring dong. In contrast, the variable with the highest communality
was local tax revenues in 1991 (1.020) and the variables such as the number of residents
in 1990 (1.009), percent change in the number of residents (0.990), and number of
households in 1990 (0.973) had very high communality. This means that the variance of
population and local tax indicators is associated with neighboring dong. Seven factors extracted from the factor analysis were mapped to identify the
distribution of factor scores by dong and the factor score map can show which dong have
strong factor characteristics. However, in order to understand the spatial patterns of factor
scores, it was necessary to divide them into classes. This research divided factor scores
into five classes falling inside the drop-point in the histogram of factor scores (Nam
1985).
Figure 18 shows the histograms of factor scores. Factor score classes had
different values by factors (see Table 13). This categorization was beneficial to avoid
over or under estimation that can be caused when factor scores are classified in the same
value category. Five classes were drawn through the classification of scores by factors.
Factor 1 (Figure 19) explained 14.4 percent of the variance and had the highest
variance among the seven factors. This factor had positive loadings among most variables
except for variables such as percent change in owner-occupied housing units (-0.173),
percent change in apartments (-0.212), percent of detached housing in 1990 (-0.844), and
percent of cheonse-occupied housing units in 1990 (-0.611). Among positive loadings,
percent of apartments in 1990 (0.902), housing supply rate in 1990 (0.928), and percent
of owner-occupied housing units in 1990 (0.835) showed very high factor loadings. It can
be summarized that factor 1 strongly loaded on housing supply rate in 1990 (0.928),
percent of apartments in 1990 (0.902), percent of owner occupied housing units in 1990

72
(0.835), and percent of detached housing units in 1990 (-0.844). Thus, factor 1 can be
labeled as the “housing factor.”
Table 13: Classification of Factors.
Factor Class Factor Score Factor Class Factor Score
1 Above 2.4 1 Above 2.2
2 1.3~2.4 2 1.6~2.2
3 0.1~1.3 3 0.2~1.6
4 -0.7~0.1 4 -0.8~0.2
Factor 1
5 Below -0.7
Factor 5
5 Below -0.8 1 Above 3.5 1 Above 2.1
2 0.7~3.5 2 0.6~2.1
3 0.0~0.7 3 -0.2~0.6
4 -0.5~0.0 4 -1.0~-0.2
Factor 2
5 Below -0.5
Factor 6
5 Below -1.0 1 Above 2.7 1 Above 2.2
2 0.8~2.7 2 0.6~2.2
3 0.1~0.8 3 0.1~0.6
4 -0.3~0.1 4 -1.0~0.1
Factor 3
5 Below -0.3
Factor 7
5 Below -1.0 1 Above 2.2
2 1.2~2.2
3 0.5~1.2
4 -1.4~0.5
Factor 4
5 Below -1.4
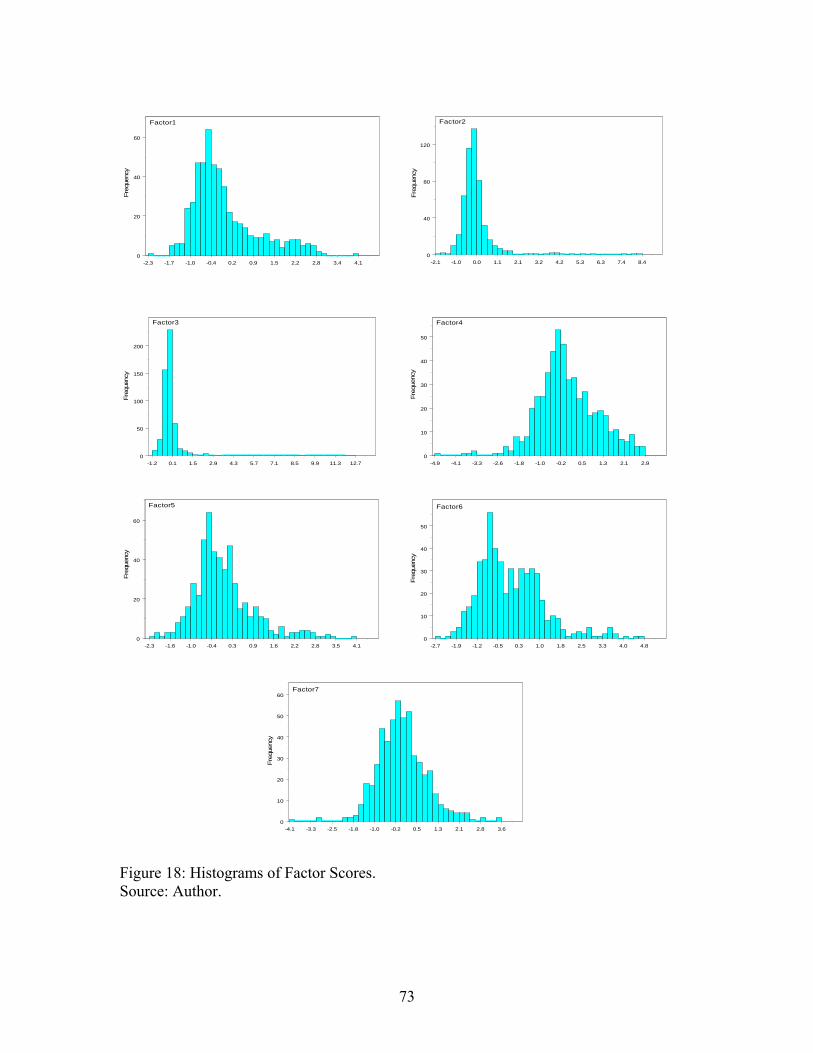
73
-2.3 -1.7 -1.0 -0.4 0.2 0.9 1.5 2.2 2.8 3.4 4.1
Factor1
0
20
40
60
Freq
uenc
y
-2.1 -1.0 0.0 1.1 2.1 3.2 4.2 5.3 6.3 7.4 8.4
Factor2
0
40
80
120
Freq
uenc
y
-1.2 0.1 1.5 2.9 4.3 5.7 7.1 8.5 9.9 11.3 12.7
Factor3
0
50
100
150
200
Freq
uenc
y
-4.9 -4.1 -3.3 -2.6 -1.8 -1.0 -0.2 0.5 1.3 2.1 2.9
Factor4
0
10
20
30
40
50
Freq
uenc
y
-2.3 -1.6 -1.0 -0.4 0.3 0.9 1.6 2.2 2.8 3.5 4.1
Factor5
0
20
40
60
Freq
uenc
y
-2.7 -1.9 -1.2 -0.5 0.3 1.0 1.8 2.5 3.3 4.0 4.8
Factor6
0
10
20
30
40
50
Freq
uenc
y
-4.1 -3.3 -2.5 -1.8 -1.0 -0.2 0.5 1.3 2.1 2.8 3.6
Factor7
0
10
20
30
40
50
60
Freq
uenc
y
Figure 18: Histograms of Factor Scores. Source: Author.
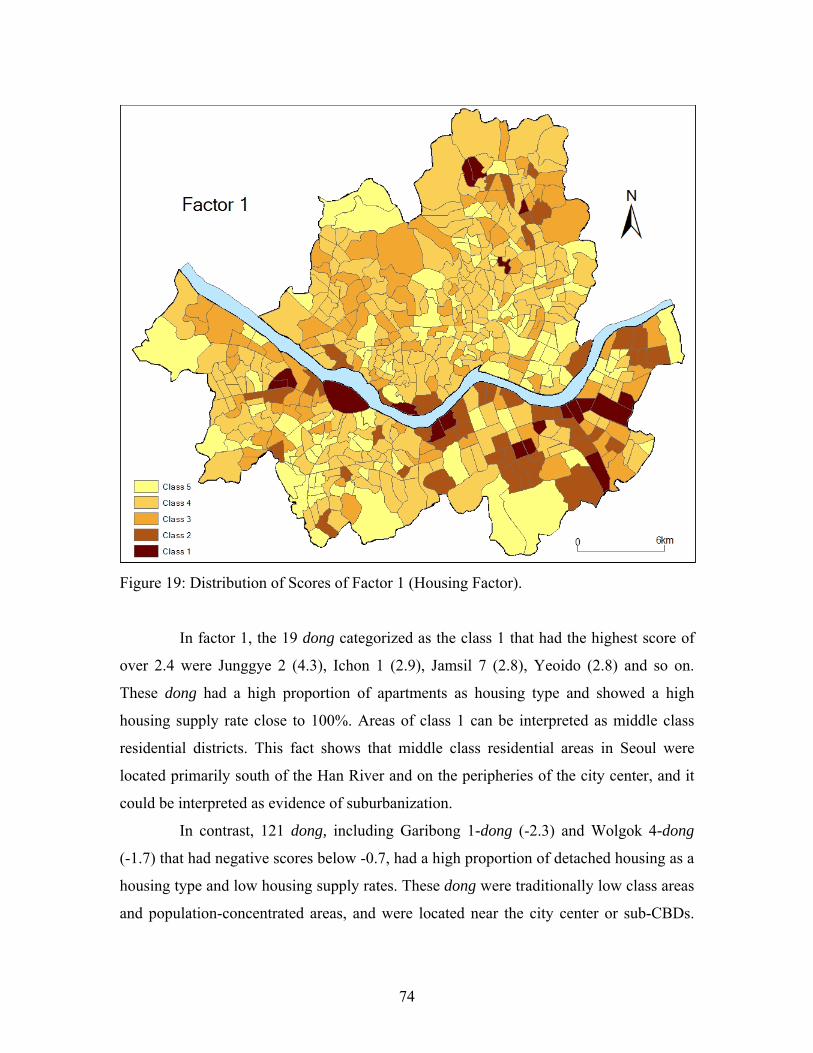
74
Figure 19: Distribution of Scores of Factor 1 (Housing Factor).
In factor 1, the 19 dong categorized as the class 1 that had the highest score of
over 2.4 were Junggye 2 (4.3), Ichon 1 (2.9), Jamsil 7 (2.8), Yeoido (2.8) and so on.
These dong had a high proportion of apartments as housing type and showed a high
housing supply rate close to 100%. Areas of class 1 can be interpreted as middle class
residential districts. This fact shows that middle class residential areas in Seoul were
located primarily south of the Han River and on the peripheries of the city center, and it
could be interpreted as evidence of suburbanization.
In contrast, 121 dong, including Garibong 1-dong (-2.3) and Wolgok 4-dong
(-1.7) that had negative scores below -0.7, had a high proportion of detached housing as a
housing type and low housing supply rates. These dong were traditionally low class areas
and population-concentrated areas, and were located near the city center or sub-CBDs.
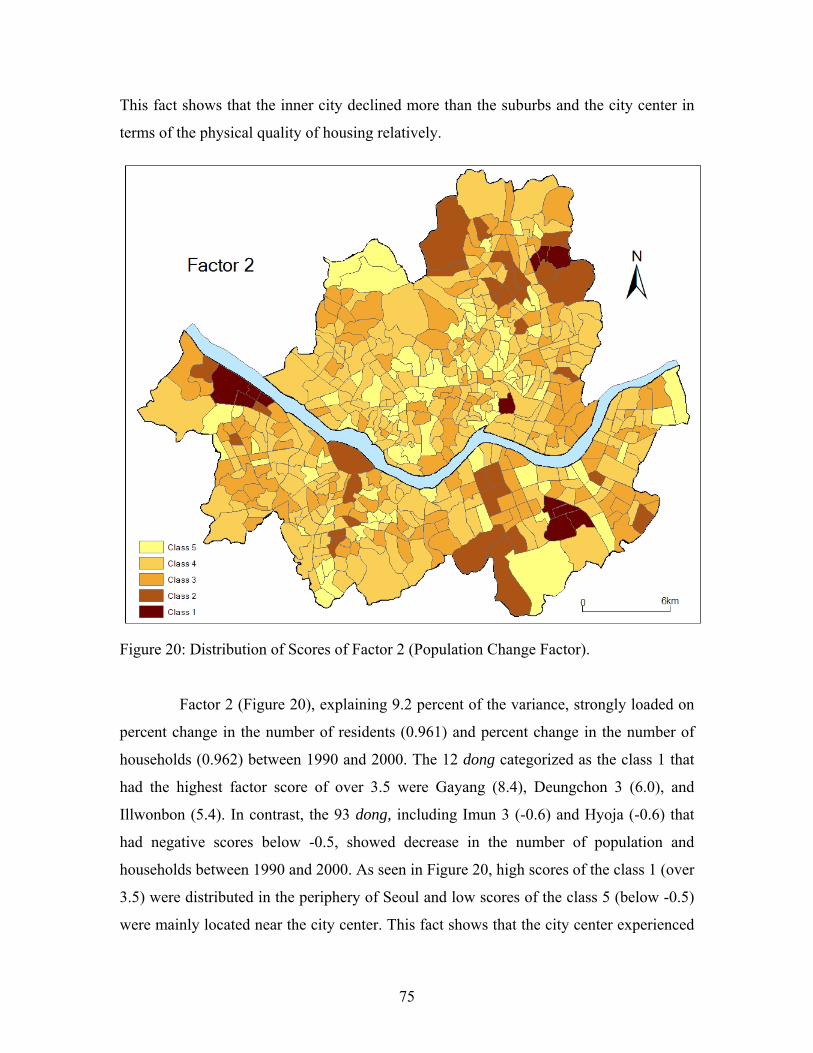
75
This fact shows that the inner city declined more than the suburbs and the city center in
terms of the physical quality of housing relatively.
Figure 20: Distribution of Scores of Factor 2 (Population Change Factor).
Factor 2 (Figure 20), explaining 9.2 percent of the variance, strongly loaded on
percent change in the number of residents (0.961) and percent change in the number of
households (0.962) between 1990 and 2000. The 12 dong categorized as the class 1 that
had the highest factor score of over 3.5 were Gayang (8.4), Deungchon 3 (6.0), and
Illwonbon (5.4). In contrast, the 93 dong, including Imun 3 (-0.6) and Hyoja (-0.6) that
had negative scores below -0.5, showed decrease in the number of population and
households between 1990 and 2000. As seen in Figure 20, high scores of the class 1 (over
3.5) were distributed in the periphery of Seoul and low scores of the class 5 (below -0.5)
were mainly located near the city center. This fact shows that the city center experienced
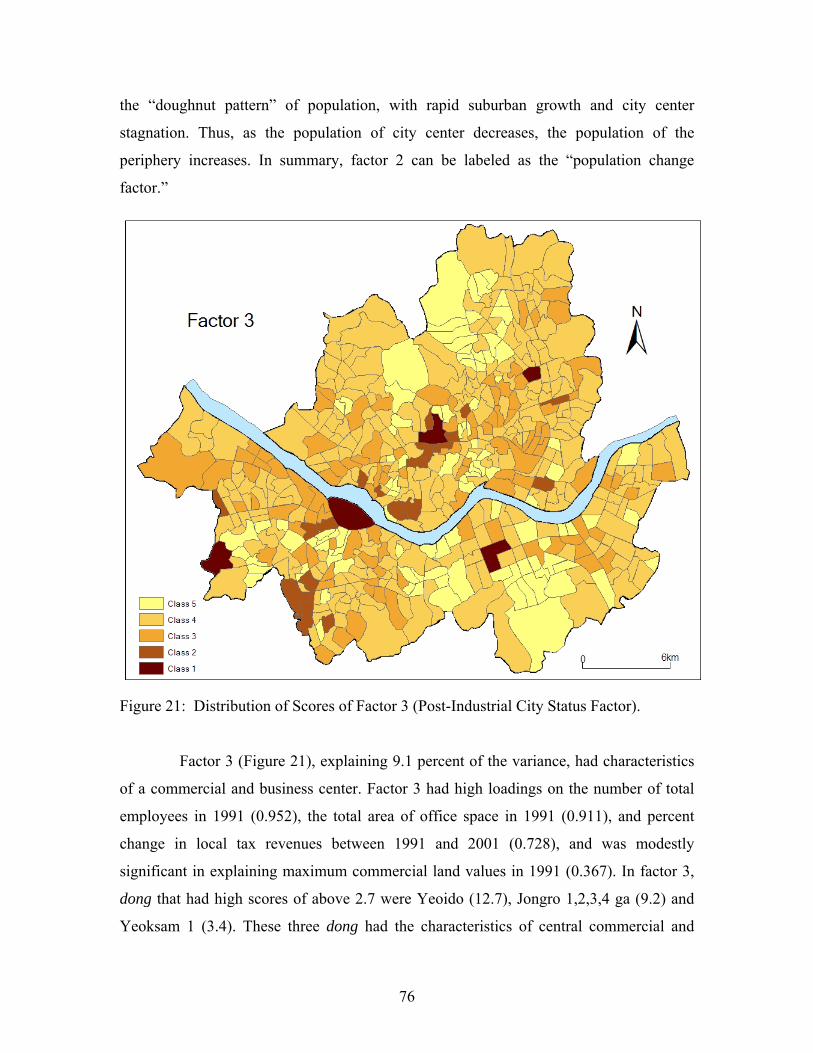
76
the “doughnut pattern” of population, with rapid suburban growth and city center
stagnation. Thus, as the population of city center decreases, the population of the
periphery increases. In summary, factor 2 can be labeled as the “population change
factor.”
Figure 21: Distribution of Scores of Factor 3 (Post-Industrial City Status Factor).
Factor 3 (Figure 21), explaining 9.1 percent of the variance, had characteristics
of a commercial and business center. Factor 3 had high loadings on the number of total
employees in 1991 (0.952), the total area of office space in 1991 (0.911), and percent
change in local tax revenues between 1991 and 2001 (0.728), and was modestly
significant in explaining maximum commercial land values in 1991 (0.367). In factor 3,
dong that had high scores of above 2.7 were Yeoido (12.7), Jongro 1,2,3,4 ga (9.2) and
Yeoksam 1 (3.4). These three dong had the characteristics of central commercial and
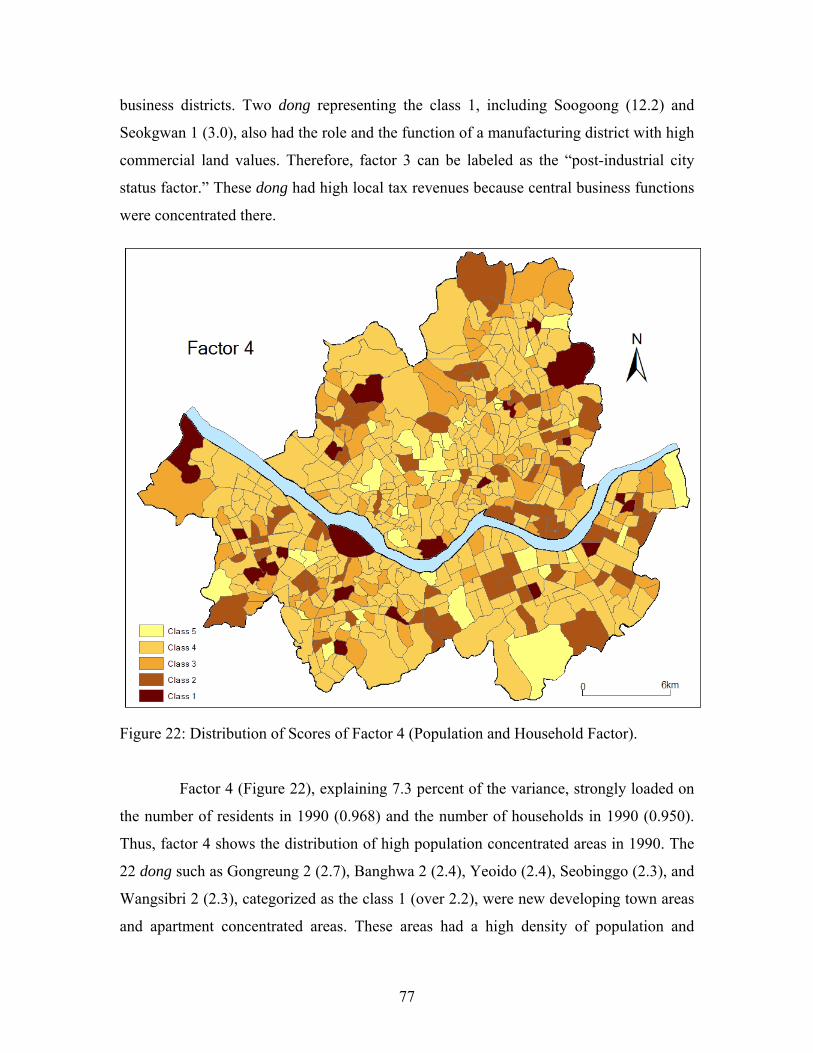
77
business districts. Two dong representing the class 1, including Soogoong (12.2) and
Seokgwan 1 (3.0), also had the role and the function of a manufacturing district with high
commercial land values. Therefore, factor 3 can be labeled as the “post-industrial city
status factor.” These dong had high local tax revenues because central business functions
were concentrated there.
Figure 22: Distribution of Scores of Factor 4 (Population and Household Factor).
Factor 4 (Figure 22), explaining 7.3 percent of the variance, strongly loaded on
the number of residents in 1990 (0.968) and the number of households in 1990 (0.950).
Thus, factor 4 shows the distribution of high population concentrated areas in 1990. The
22 dong such as Gongreung 2 (2.7), Banghwa 2 (2.4), Yeoido (2.4), Seobinggo (2.3), and
Wangsibri 2 (2.3), categorized as the class 1 (over 2.2), were new developing town areas
and apartment concentrated areas. These areas had a high density of population and

78
households. Unlike dong with positive factor scores, the 35 dong categorized as the class
5 (below -1.4), including Jongro 1,2,3,4 ga (-2.2) and Myeong (-3.5), were experiencing
decreases in population and households. Actually these areas were not residential areas
but commercial and business centers. This population doughnut pattern can be seen in the
map of factor 4 (Figure 22). Factor 4 represents the size of the population and number of
households in 1990 and acknowledges that the population is shifting from the city center
to the periphery. Thus, factor 4 can be labeled as the “population and household factor.”
Figure 23: Distribution of Scores of Factor 5 (Rent Gap Factor).
Factor 5 (Figure 23), explaining 6.5 percent of the variance, modestly loaded on
maximum residential land values in 1991 (0.726), percent change in maximum residential
land values between 1991 and 2001 (-0.586), and maximum commercial land values in
1991 (0.552). The 20 dong with the class 1 (over 2.2) were mainly located in the city
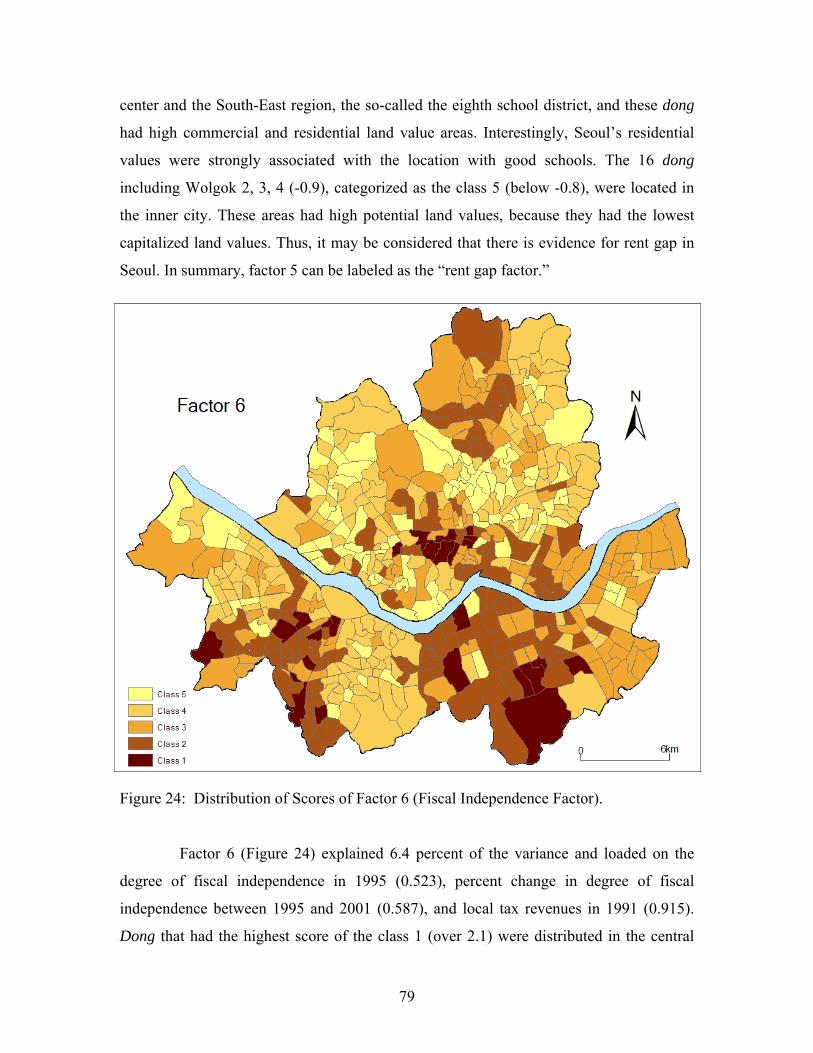
79
center and the South-East region, the so-called the eighth school district, and these dong
had high commercial and residential land value areas. Interestingly, Seoul’s residential
values were strongly associated with the location with good schools. The 16 dong
including Wolgok 2, 3, 4 (-0.9), categorized as the class 5 (below -0.8), were located in
the inner city. These areas had high potential land values, because they had the lowest
capitalized land values. Thus, it may be considered that there is evidence for rent gap in
Seoul. In summary, factor 5 can be labeled as the “rent gap factor.”
Figure 24: Distribution of Scores of Factor 6 (Fiscal Independence Factor).
Factor 6 (Figure 24) explained 6.4 percent of the variance and loaded on the
degree of fiscal independence in 1995 (0.523), percent change in degree of fiscal
independence between 1995 and 2001 (0.587), and local tax revenues in 1991 (0.915).
Dong that had the highest score of the class 1 (over 2.1) were distributed in the central

80
business district and middle class residential areas. In contrast, dong with low scores of
class 5 (below -1.0) were distributed in the inner city. This means that local governments
located in the inner city have low tax revenues and experiences fiscal stress. This factor
can be described as the “fiscal independence factor.”
Figure 25: Distribution of Scores of Factor 7 (Family Size and Housing Factor).
Factor 7 (Figure 25), composing 4.9 percent of the variance, was modestly
significant in explaining the change in family size between 1990 and 2000 (0.553),
percent change in owner-occupied housing units (0.650), and percent change in detached
housing between 1990 and 2000 (-0.509). Since the 1980s, the mean family size in Seoul
has decreased. Small families, such as “dual incomes no kids” couples or those composed
of parents and one child, were distributed in the periphery around the city center. The
owner-occupied housing and the detached housing increased in the central city and the
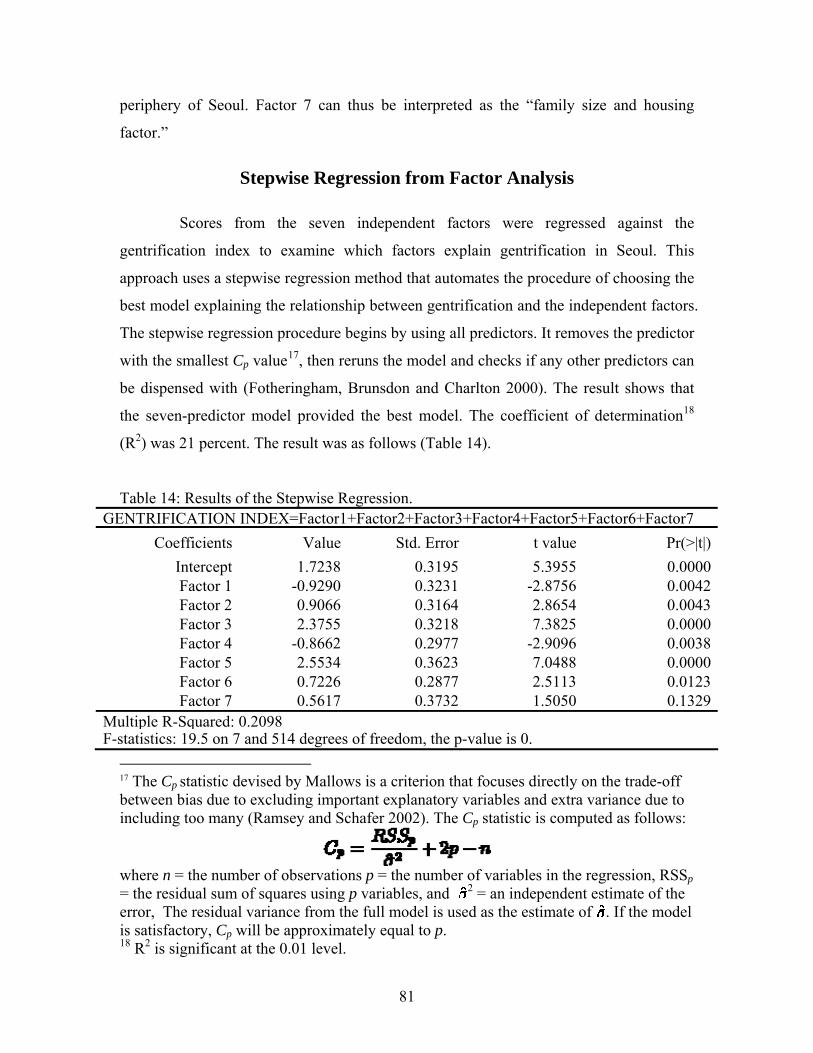
81
periphery of Seoul. Factor 7 can thus be interpreted as the “family size and housing
factor.”
Stepwise Regression from Factor Analysis
Scores from the seven independent factors were regressed against the
gentrification index to examine which factors explain gentrification in Seoul. This
approach uses a stepwise regression method that automates the procedure of choosing the
best model explaining the relationship between gentrification and the independent factors.
The stepwise regression procedure begins by using all predictors. It removes the predictor
with the smallest Cp value17, then reruns the model and checks if any other predictors can
be dispensed with (Fotheringham, Brunsdon and Charlton 2000). The result shows that
the seven-predictor model provided the best model. The coefficient of determination18
(R2) was 21 percent. The result was as follows (Table 14).
Table 14: Results of the Stepwise Regression. GENTRIFICATION INDEX=Factor1+Factor2+Factor3+Factor4+Factor5+Factor6+Factor7
Coefficients Value Std. Error t value Pr(>|t|)Intercept 1.7238 0.3195 5.3955 0.0000Factor 1 -0.9290 0.3231 -2.8756 0.0042Factor 2 0.9066 0.3164 2.8654 0.0043Factor 3 2.3755 0.3218 7.3825 0.0000Factor 4 -0.8662 0.2977 -2.9096 0.0038Factor 5 2.5534 0.3623 7.0488 0.0000Factor 6 0.7226 0.2877 2.5113 0.0123Factor 7 0.5617 0.3732 1.5050 0.1329
Multiple R-Squared: 0.2098 F-statistics: 19.5 on 7 and 514 degrees of freedom, the p-value is 0.
17 The Cp statistic devised by Mallows is a criterion that focuses directly on the trade-off between bias due to excluding important explanatory variables and extra variance due to including too many (Ramsey and Schafer 2002). The Cp statistic is computed as follows:
where n = the number of observations p = the number of variables in the regression, RSSp = the residual sum of squares using p variables, and 2 = an independent estimate of the error, The residual variance from the full model is used as the estimate of . If the model is satisfactory, Cp will be approximately equal to p. 18 R2 is significant at the 0.01 level.

82
Factors 3 and 5, representing “post-industrial city status” and “rent gap” factor,
respectively, were by far the most significant in explaining inter-dong variations in
gentrification. This means that Ley’s post-industrial city status and Smith’s rent gap
theses were applicable to explain gentrification in Seoul. Factors 1 and 4 with negative
coefficients, representing “housing factor” and “population and household factor,”
reflected that gentrification in Seoul was affected by change in demographic and housing
type and ownership. The decrease in family size and households explained gentrification
in the context of demographic characteristics. Factors 2 and 6, representing “population
change factor” and “fiscal independence factor,” respectively, were also significant in
explaining gentrification. Demographic change was positively associated with
gentrification. The gentrification index was positively significant for explaining increase
in local tax revenues and local government’s degree of fiscal independence. This fact
reveals that gentrification is a method to raise local government’s tax revenues and
degree of fiscal independence measured by its own tax revenues, not national subsidy.
Finally, factor 7, “family size and housing factor,” was not significant for explaining
gentrification in Seoul, because its p-value was rejected at the .01 and .05 level. As has
been shown consistently through the analysis, post-industrial city status and rent gap
theses were most significant for explaining gentrification in Seoul, and demographic
change and institutional characteristics together accounted effectively for gentrification in
Seoul.
Summary
One should be cautious that the methodology and the data employed here, like
any methodology, do not answer all questions equally well. The objective of this
research was to develop an analysis that was both comparative and systematic, refining
our understanding of possible causes of gentrification in Seoul and providing an
explanatory context for the case study.
Explanatory accounts of gentrification in Seoul have not generally been
formalized but may be grouped into four categories. The most systematic were the
housing market characteristics, where both demand- and supply-led arguments have been
developed. Three other explanations underlay various accounts of gentrification in Seoul,
83
representing the effects of demographic, post-industrial city status, and institutional
factors. All four of these explanations had some utility in accounting for gentrification in
Seoul between 1990 and 2000. The strongest correlations existed between the
gentrification index and variables representing post-industrial city status, rent gap, and
institutional dimensions; the highest simple correlation was with the number of total
employees in 1991. The variables of total area of office space in 1991, maximum
commercial land values in 1991, maximum residential land values in 1991, local tax
revenues in 1991, percent change in local tax revenues between 1991 and 2001, and
degree of fiscal independence in 1995 had modest positive correlations with the
gentrification index. There was significant association between gentrification and the
decrease in family size among the 522 dong.
Factor analysis was undertaken to resolve the problem of inter-correlations
among the independent variables. A theoretically interesting factor loading (factors 3 and
5), identified as indicating post-industrial city status and rent gap, emerged from the
analysis. Factors 2 and 6, representing population change and fiscal independence, were
significant in accounting gentrification in Seoul. The regression model based upon factor
scores performed relatively poorly in accounting for the variation in gentrification in
Seoul (R2 = 0.2098). However, the results were helpful in understanding how
gentrification in Seoul was affected by the city’s post-industrial city status, its rent gap,
institutional characteristics, and demographic features.
84
CHAPTER 5
A CASE STUDY OF GENTRIFICATION:
THE WOLGOK4-DONG REDEVELOPMENT
Chapter 4 offered a comparative and systematic analysis of gentrification in the
522 administrative dong of Seoul in 1990 and 2000. Such a statistical approach was
useful to identify the regional structure of gentrification in Seoul, but it failed to explain
individual gentrifiers’ demographic and economic characteristics, their movement
patterns, and motivations to move. To obtain more detailed information, this chapter
selected one case study area and investigated its gentrifiers’ demographic and economic
characteristics and movement patterns. It was necessary to focus on the gentrifiers’
attributes in order to explain gentrification in Seoul at a more detailed level. Also, the
role of city officials was investigated to understand the role of the institutional policy
system and joint redevelopment projects (JRPs).
Description of the Study Area
The Wolgok4-dong redevelopment district was selected as a case area in order
to explain gentrification in Seoul. The reason that the Wologok4-dong was selected as a
case study area was because this redevelopment district was currently redeveloped, and
was the second largest redevelopment project in Seoul.19 This study area had been a
typical unlicensed blighted residential area located in central Seoul since the Korean War
of 1950-1953 (Kim et al. 1996). The redevelopment of this district was completed in
2003. The interviews were performed in July, 2005 to explain changes in residents’
composition in the relation of demographic and economic attributes and their movement
patterns. Ten interviews were undertaken by visiting their houses, two persons among the
interviewees were original residents of the area.
19 The largest redevelopment district in Seoul is the Dongsomun redevelopment district, in which 4,509 households live, completed in 1995 (Seoul Development Institute 1995).

85
Location of the Study Area
The study area is located five km to the northeast of the city center and is
situated in hillsides over 60 meters above sea level. This area, delta-shaped, is delineated
by the three main roads of Jeongreung, Mia, and Jongam. It had a locational advantage of
access to four subway lines and the inner express highway, but had a disadvantage of
ineffectiveness of residential and industrial land use (Figure 26). Also, this area abuts the
unlicensed prostitute quarters called “Miari Texas Village” on its left side. It had been a
traditionally low class residential area with high proportion of blighted housings since it
was settled by the war disabled and their families in the 1950s.
Figure 26: Location of the Study Area (Wolgok4-Dong).
Wolgok4-dong was designated as a district of redevelopment in 1995 according
to the Urban Renewal Act. In 2003, this area was redeveloped and changed from a low
Wolgok 4-Dong
86
class residential area to a middle class residential area with new high rise apartment
buildings. Also, the residents’ composition changed from people in their 40s or 50s, with
part time and monotonous jobs to those in their 30s or 40s with white-color management,
administration, business, and professional occupations.
This area is composed of 34 apartment buildings in which 3,343 households
reside in 2005. It has large dispersed apartment complexes interspersed with surrounding
detached housing. Therefore, apartment complexes have independent public facilities and
are not affected by the surrounding detached housing. The floor-area ratio 20 is 280
percent. The apartment complex region is composed of 34 buildings with 12~20 stories.
It is the second huge redevelopment of housing improvement projects undertaken by the
joint redevelopment projects. Two elementary schools, six middle and high schools, and
seven universities, respectively, are distributed within a 2 km radius of the study area.
The study area includes detached housing areas and the apartment complex surrounded
by a retaining wall. Thus, it has an independent apartment complex characteristic that
cannot be connected to pedestrian roads. This area has good accessibility to the CBD as
well as good views due to its hillside location.
The study area was redeveloped by the joint redevelopment projects (hereafter
JRPs). There are two types of housing redevelopment in Korea, as categorized in the
Urban Renewal Act: clearance and redevelopment (JRPs), and on-site improvement
(rehabilitation) (Lee et al. 2003). In the clearance and redevelopment scheme, which is
similar to the urban renewal type of redevelopment in Western countries, the whole site is
evacuated and redeveloped. During the construction period, the residents are moved into
temporary accommodation. They then move back when construction is completed. On-
site improvement is in line with residential rehabilitation in Western countries. In this
scheme, the central government provides new infrastructure, including roads, sewer lines,
public facilities and so on, and assists residents to renovate their blighted and deteriorated
houses without moving out. However, this on-site improvement project did not work well
20 The floor-area ratio refers to the ratio of building area to land area. It is a scale for measuring land use (Suh 2005).
87
in Korea, principally because of insufficient response from the squatters and limited
financial support to implement the rehabilitation plan (Lee et al. 2003). Thus, the Seoul
metropolitan government abandoned rehabilitation in favor of the clearance and
redevelopment. The clearance and redevelopment became a major tool for improving
residential conditions in the blighted and sub-standard housing areas (Seoul Development
Institute 1995).
JRPs, characterized as a mode of clearance and redevelopment, are one
combination of government-initiated and market-driven housing renewal projects
implemented from the early 1970s (Ha 2004). In JRPs, the gu and Seoul metropolitan
government designate clearance areas and authorize building removal. Home owners
form an association, which contracts with the construction company and takes
responsibility for the project. A redevelopment association is created to obtain the
required approval of two-thirds of the landlords. Large construction companies provide
the capital. The gu government allows high-density development to ensure reasonable
profits for all participants but the gu provides no public assistance. In a sense, the JRP
was a gentrification process initiated by the residents themselves. The development
profits are generated by extra differential revenues produced by selling the apartment to
buyers. In Korea, new housing is sold before its construction. This special housing
market condition made the JRPs workable because the city allows extra housing
construction for sale. The revenue from the sale of the additional housing units makes the
project feasible. Lee et al. (2003) argued that the JRP was a real innovation, in that
residential redevelopment was pursued through the market mechanism rather than
through public-driven approaches.
In practice, the construction companies have an independent financing initiative.
The JRP was accompanied by the booming housing market of the 1980s, when high rise
apartments become the most popular type of housing in Korea. There is no doubt that the
JRP has contributed to an increase in the housing stock. As shown in Table 15, the
number of redeveloped housing units is more than twice the number of total units before
redevelopment. Also, the average floor area in the newly developed units is almost triple
the average of the old units. In terms of quality and size of units, Lee et al. (2003) argue
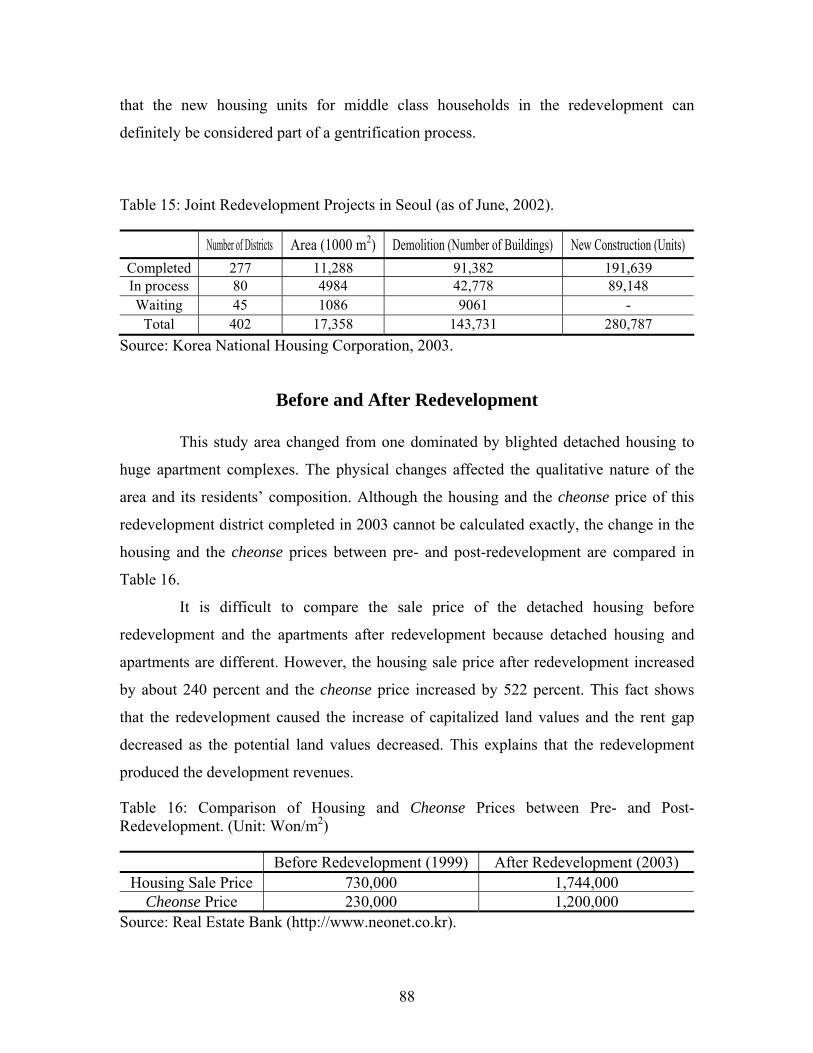
88
that the new housing units for middle class households in the redevelopment can
definitely be considered part of a gentrification process.
Table 15: Joint Redevelopment Projects in Seoul (as of June, 2002).
Number of Districts Area (1000 m2) Demolition (Number of Buildings) New Construction (Units) Completed 277 11,288 91,382 191,639 In process 80 4984 42,778 89,148 Waiting 45 1086 9061 -
Total 402 17,358 143,731 280,787 Source: Korea National Housing Corporation, 2003.
Before and After Redevelopment
This study area changed from one dominated by blighted detached housing to
huge apartment complexes. The physical changes affected the qualitative nature of the
area and its residents’ composition. Although the housing and the cheonse price of this
redevelopment district completed in 2003 cannot be calculated exactly, the change in the
housing and the cheonse prices between pre- and post-redevelopment are compared in
Table 16.
It is difficult to compare the sale price of the detached housing before
redevelopment and the apartments after redevelopment because detached housing and
apartments are different. However, the housing sale price after redevelopment increased
by about 240 percent and the cheonse price increased by 522 percent. This fact shows
that the redevelopment caused the increase of capitalized land values and the rent gap
decreased as the potential land values decreased. This explains that the redevelopment
produced the development revenues.
Table 16: Comparison of Housing and Cheonse Prices between Pre- and Post-Redevelopment. (Unit: Won/m2)
Before Redevelopment (1999) After Redevelopment (2003) Housing Sale Price 730,000 1,744,000
Cheonse Price 230,000 1,200,000 Source: Real Estate Bank (http://www.neonet.co.kr).
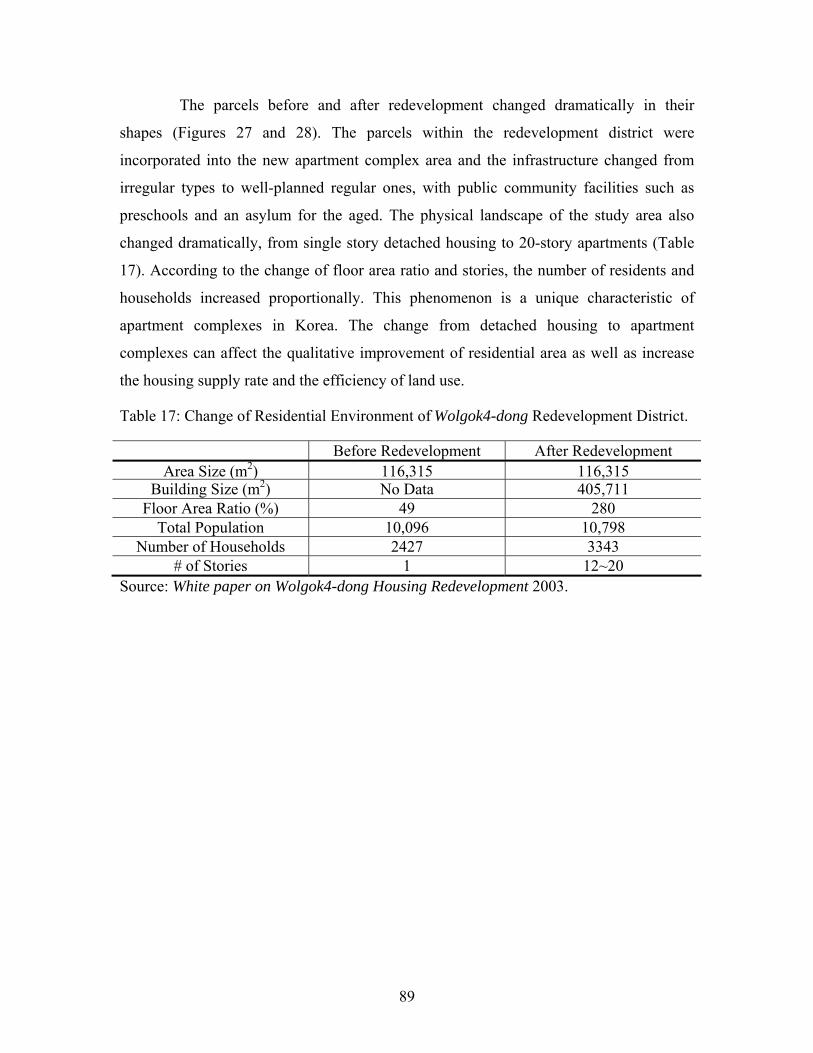
89
The parcels before and after redevelopment changed dramatically in their
shapes (Figures 27 and 28). The parcels within the redevelopment district were
incorporated into the new apartment complex area and the infrastructure changed from
irregular types to well-planned regular ones, with public community facilities such as
preschools and an asylum for the aged. The physical landscape of the study area also
changed dramatically, from single story detached housing to 20-story apartments (Table
17). According to the change of floor area ratio and stories, the number of residents and
households increased proportionally. This phenomenon is a unique characteristic of
apartment complexes in Korea. The change from detached housing to apartment
complexes can affect the qualitative improvement of residential area as well as increase
the housing supply rate and the efficiency of land use.
Table 17: Change of Residential Environment of Wolgok4-dong Redevelopment District.
Before Redevelopment After Redevelopment Area Size (m2) 116,315 116,315
Building Size (m2) No Data 405,711 Floor Area Ratio (%) 49 280
Total Population 10,096 10,798 Number of Households 2427 3343
# of Stories 1 12~20 Source: White paper on Wolgok4-dong Housing Redevelopment 2003.
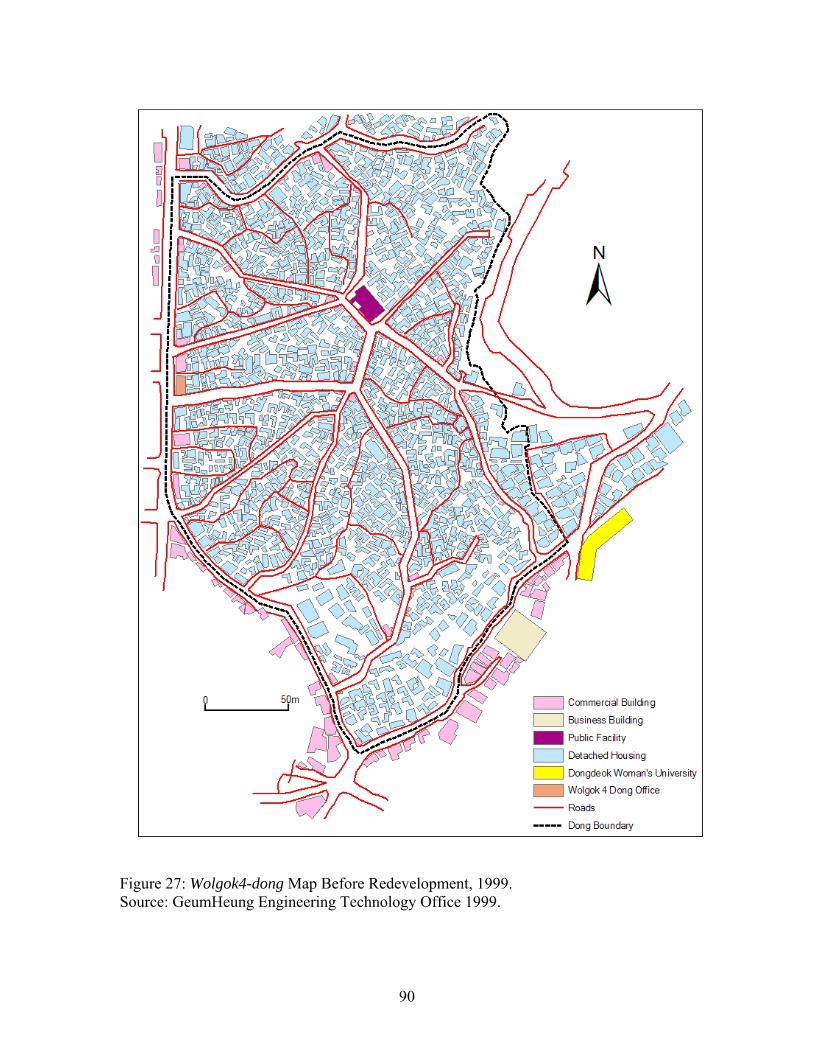
90
Figure 27: Wolgok4-dong Map Before Redevelopment, 1999. Source: GeumHeung Engineering Technology Office 1999.

91
Figure 28: Wolgok4-dong After Redevelopment, 2003. Source: GeumHeung Engineering Technology Office 2003.
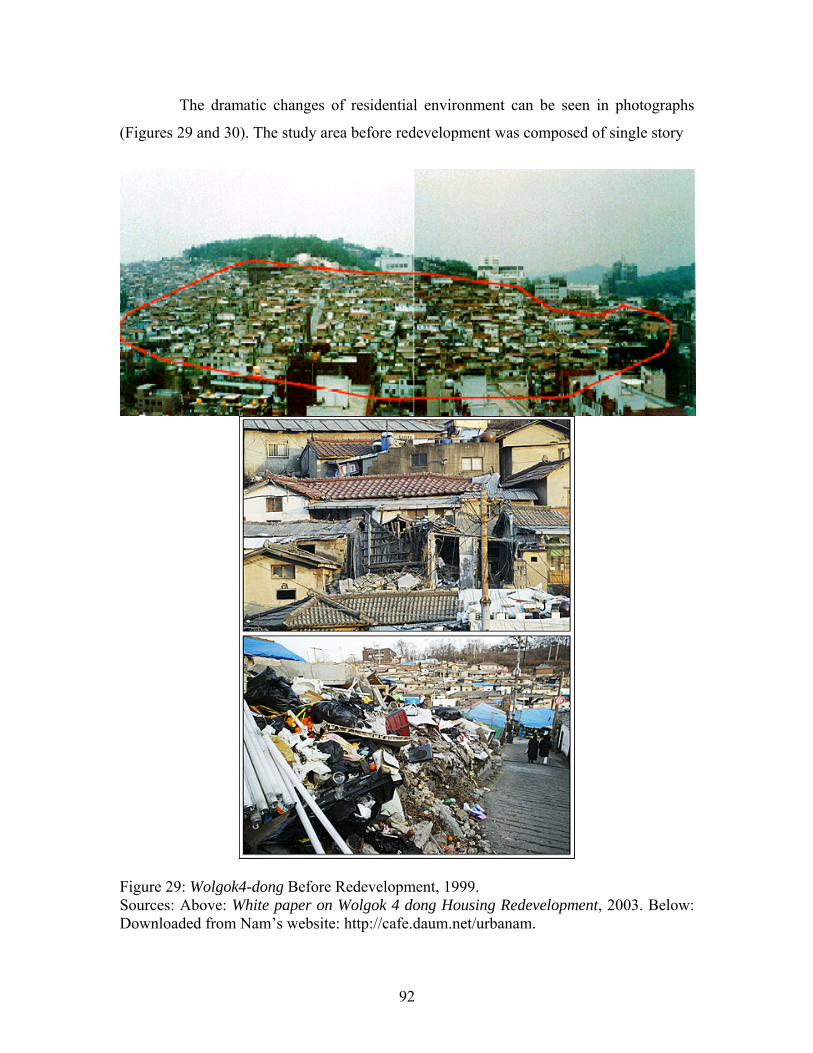
92
The dramatic changes of residential environment can be seen in photographs
(Figures 29 and 30). The study area before redevelopment was composed of single story
Figure 29: Wolgok4-dong Before Redevelopment, 1999. Sources: Above: White paper on Wolgok 4 dong Housing Redevelopment, 2003. Below: Downloaded from Nam’s website: http://cafe.daum.net/urbanam.
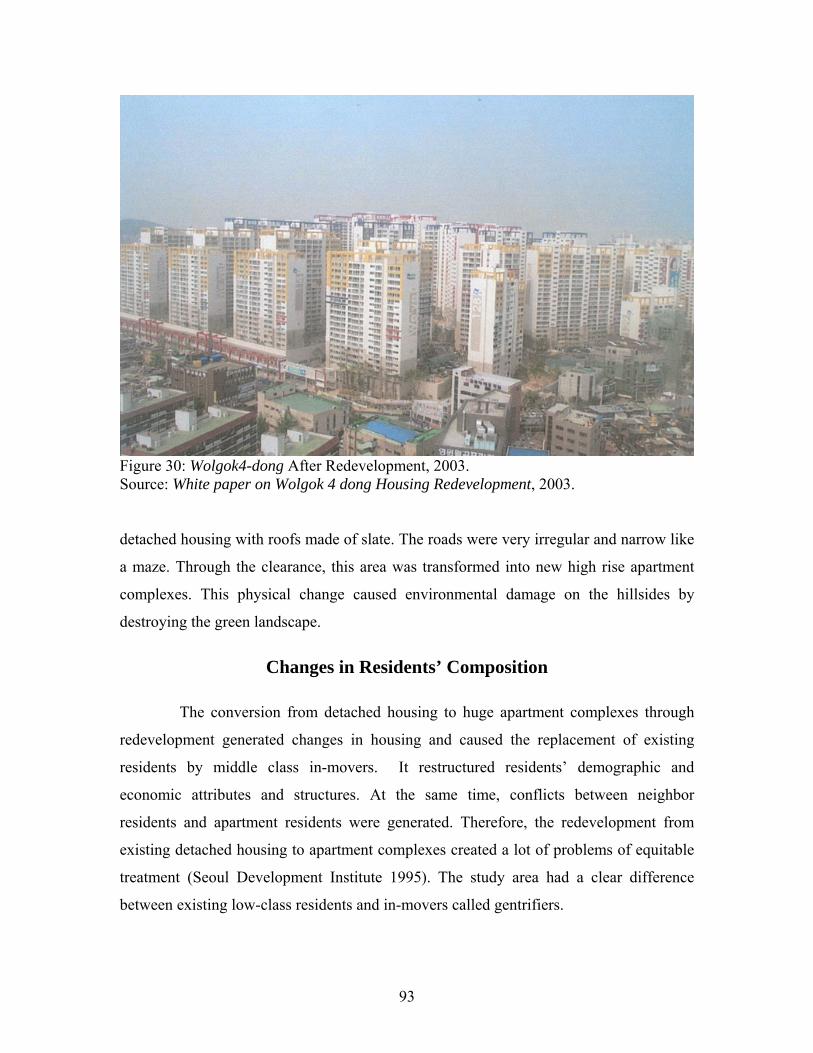
93
Figure 30: Wolgok4-dong After Redevelopment, 2003. Source: White paper on Wolgok 4 dong Housing Redevelopment, 2003.
detached housing with roofs made of slate. The roads were very irregular and narrow like
a maze. Through the clearance, this area was transformed into new high rise apartment
complexes. This physical change caused environmental damage on the hillsides by
destroying the green landscape.
Changes in Residents’ Composition
The conversion from detached housing to huge apartment complexes through
redevelopment generated changes in housing and caused the replacement of existing
residents by middle class in-movers. It restructured residents’ demographic and
economic attributes and structures. At the same time, conflicts between neighbor
residents and apartment residents were generated. Therefore, the redevelopment from
existing detached housing to apartment complexes created a lot of problems of equitable
treatment (Seoul Development Institute 1995). The study area had a clear difference
between existing low-class residents and in-movers called gentrifiers.
94
Gentrifiers’ Demographic Attributes
Eight of the ten interviewees were in-movers and two were original residents.
In-movers’ age was mainly from their middle 30s to early 40s, and they typically had one
or two children who go to the kindergarten or preschool. In contrast, one of the two
existing residents was in his 50s, and has three children who go to college and high
school; the other was 42 years old and supported his parents and two children, who go to
middle school. When compared, the gentrifiers’ family size was less than that of original
residents and their age was younger than that of original residents. This indicated that
residents in their 40s or older were being replaced by in-movers in their 30s or 40s.
In terms of householders’ educational level, the two original residents had high
school diplomas and the in-movers had a bachelor’s degree or higher. This means that in-
movers’ educational level was higher than that of the two original residents.
Gentrifiers’ Economic Attributes
In householders’ occupational composition, most in-movers’ householders had
professional and management occupations, except for two households that owned their
individual business. The two original residents’ occupations were a blue-collar job and a
salesman. This means that in-movers were members of the middle class and the original
residents were relatively low class. This fact indicates that in-movers’ economic status
was higher than that of the original residents and the Wolgok4-dong changed from a low
class area to a middle class area.
In householders’ income, the two original residents had incomes of less than
2,000,000 Won ($2,000) per month, but the in-movers had incomes of over 4,000,000
Won ($4,000) per month.21 Two households among the eight in-movers had dual incomes.
The in-movers’ income was more over two times than that of the original residents. This
income difference was another evidence that this study area had changed from a low class
area to a middle class area.
21 The average income in most JRP housing in the early 1990s is much higher than that of the typical urban wage earner’s household. Households that live in JRP housing belong to the middle income group in Seoul (Ha 2001).

95
In terms of utility costs, the original residents were experiencing high
management costs. Their utility costs occupied 20 or 30 percent out of their expenditures.
In-movers were paying less than 10 percent out of their expenditure costs to utility costs.
However, the replacement by the middle class did not mean the occurrence of
gentrification in the Wolgok4-dong. Therefore, it was necessary to investigate the pre-
addresses of in-movers.
In-Migration Patterns
Figure 31: In-Migrants' Addresses prior to Moving (Total: 262 Households). Source: Registry of the Wolgok4-dong office.
From the registry of the Wolgok4-dong, resident records were selected by
random sampling; 262 householders’ pre-addresses were extracted and mapped in Figure
31. Fifteen households out of 262 sampled were in-movers from Kyeonggi province and
96
four households were in-movers from the city of Incheon. The in-migration of a
relatively short distance, 6 km radius from the study area, was more frequent than in-
migration of distances over 6 km.
Migration within Seongbuk-gu, which includes the study area, comprised 23.3
percent of total in-mover households, and migration from neighboring Nowon-gu
(24.8%), Dobong-gu (9.2%), Gangbuk-gu (6.9%), and Dongdaemun-gu (4.2%)
comprised 45.1 percent. Therefore, the migration from neighboring regions accounted for
about 70 percent of in-migrants.
About 6.9 percent of total in-mover households migrated from the suburban
areas of Seoul such as Gangnam-gu, Songpa-gu, Gangdong-gu, and Gwangjin-gu, which
that are located in the South-East of the study area. About 7.3 percent of total in-mover
households migrated from other cities of Kyeonggi province and the city of Incheon. In a
strict sense, the in-movers migrated from the suburban areas characterized by a middle
class residential area. Gentrifiers were a small number when compared with the number
of the total in-mover households.
Motivations for Movement
Four residents among the eight interviewees answered that the traffic problems
and accessibility to work were most important reasons for moving into the Wolgok4-dong
redevelopment district. The following residents said:
“We moved here because of the location. It is really easy to get into downtown
where I work. It takes 20 minutes to get to my work place located in Jung-gu on the
subway. I lived in Bundang, Kyeonggi province. The previous residential environment
was good for me because Bundang is a well-designed suburban city and has a lot of green
area. I enjoyed nature surrounding my house. But I spent a lot of time (about one and half
hours) commuting to my office. It was hard to get to my work place every day. As you
know, Seoul’s traffic congestion is infamous. I had to use public transit such as the
subway and bus. It was really painful to spend my hours on the street” (Mr. Park,
accountant, interview, July 28, 2005).
Another said:

97
“I lived in Daechi-dong, Gangnam-gu three years ago. My work place was
located in Samsung-dong. So, I could reach my office within 10 minutes. However, I
transferred my work place to SK Telecommunication Company located in Euljiro, Jung-
gu. After the transfer, my commuting time became longer than before. I had to spend one
hour for the commute. I wanted to decrease my commuting time. So, I moved here” (Mr.
Park, marketing manager, interview, July 27, 2005).
As the above interviews indicated, the study area had the attraction of accessibility to the
city center.
The second gentrifiers’ motivation for movement was relevant to commuting
cost and time and occupation: “The reason I moved here is because of the traffic. Ilsan I
lived for five years has a subway line, but I had to get on the bus to reach the subway
station. It took 40 minutes to get to the subway station. But, now I can reach the subway
station within five minutes by walking. That is the reason I moved here” (Mrs. Hwang,
housewife, interview, July 19, 2005).
Another said:
“My job is a lawyer. I am working for large companies to give advice for their
businesses. For me, time is money. My client companies are located downtown, so I need
to live near their companies to save time” (Mr. Lee, lawyer, interview, July 20, 2005).
Two residents among the eight interviewees prioritized affordable living space
and low housing price as motivations for movement. Their interviews included these
quotes:
“I wanted a more spacious house. I lived at 27 Pyeong22 apartment with two
bedrooms in Gwacheon, Kyeonggi province. It was too small for our three family
members because my husband and son, who will go to an elementary school next year,
needed their individual study rooms. As you know, because Gwacheon has a high land
price, we could not buy a more spacious house at the same price. So, I looked for a more
spacious apartment at the same price as Gwacheon apartments and moved into the 43
22 Pyeong is a Korean unique measurement unit of floor size of house; one pyeong is equivalent to 3.3 m2. In general, apartments with over 30 pyeong and less than 50 pyeong are categorized as middle-sized.

98
Pyeong Wolgok4-dong apartment with four rooms” (Mrs. Yang, housewife, interview,
July 21, 2005).
Another said:
“I lived in Ogeum-dong, Songpa-gu for three years and I usually paid my
cheonse money of about 20,000,000 Won ($20,000) per year. Then two years ago, the
landlord requested much more cheonse money (25,000,000 Won) than before, saying he
had refinanced the house and the land price of Ogeum-dong had soared. I could not
accept his offer because I could not afford it, so I had to move here with much lower
cheonse money of about 15,000,000 Won ($15,000) and more space” (Mr. Jeong,
university instructor, interview, July 22, 2005).
Two interviewees answered that they regarded urban amenities and a good
educational environment as reasons for movement: “We just like urban life. My wife and
I have a job. So, we cannot go out together every week and the weekend is our only free
time. We are very busy working during the week and need to have a break on the
weekend. We cannot go outside of the city because we have limited time to rest. So we
go to the shopping mall and to movie theaters to enjoy our leisure time. We usually go to
Myeong-dong, Jung-gu to see a movie and shopping. There were few shopping malls and
movie theaters in our previous living place. Now I can enjoy urban life using its
entertainment facility with my wife” (Mr. Jang, financer, interview, July 22, 2005).
The other interviewee suggested educational environment as the motivation for
movement: “I have a son who goes to kindergarten. The previous apartment area
requested spend higher education cost than now because there were too many children
relative to the small number of kindergarten. I spent 600,000 Won per month for the
kindergarten, but I can save 200,000 Won with the same educational environment. It is a
big deal for me. The saved money will go for more useful use for my child. I am satisfied
with the educational environment of my current apartment” (Mrs. Kim, housewife,
interview, July 25, 2005).
Korean gentrifiers’ motivations for movement can be summarized as the inner
city’s accessibility to the city center, saving commuting time and cost, and preferences
for the inner city caused by the demographic change, the relative disadvantages of
suburban life, and life style changes. These quotes were similar to Ley (1996)’s argument
99
that emphasized the demographic changes associated with shifts from large families to
small families and the associated changes in leisure culture.
The Role of the Gu Government
It is important to understand how local gu governments have a role in
gentrification. Local governments seek the revival of blighted residential areas both to
enhance their tax revenues and to enhance the overall quality of their neighborhoods
(Kennedy and Leonard 2001). Thus, their goals often encourage gentrification. This part
investigated the role of local governments in inducing gentrification in Seoul by using
interviews with two city officials.
Housing renewal policy in Western countries such as the U.K. and the U.S.
focused on area-based and local initiatives, partnerships between local governments and
key agencies, and community involvement (Ha 2004). In Korea, emphasis has been given
to the physical factors of obsolescence and to the economic indicators, and much less
attention has been given to social factors such as housing tenure and residential or
neighborhood change. Such a policy difference between Western countries and Korea
was revealed as the following interview quote:
“Seoul’s redevelopment projects did not focus on the increase of tax revenues
and the tenure shift through the inducement of the middle class. The goal of
redevelopment in Seoul has been focused only on the improvement of the quality of
deteriorated housing. That is to say, only the physical change from the deteriorated
housing into an improved residential environment has been regarded as the purpose of the
redevelopment” (Mr. Yim, manager of department of urban redevelopment, Seongbuk-gu,
interview, July 12, 2005).
In the above quote, the difference in policy concerning redevelopment between
Western countries and Korea can be described as follows: whereas Western countries’
redevelopment policy entirely focuses on the increase of tax revenues and the
improvement of neighborhood quality, Korea’s redevelopment policy focuses on
upgrading the physical environment of the deteriorated housing. This difference was
based on the redevelopment financing difficulties, as the following interview quote
reveals:
100
“The degree of fiscal independence of Seongbuk-gu is about 47 percent. Our gu
government does not have enough money to invest on the redevelopment for ourselves.
Therefore, we need fiscal support from the central government or the Seoul metropolitan
government. However, in practice, the central government and the Seoul metropolitan
government have not provided any fiscal support. So, the gu government relies on JRP
that is based on the partnership between residents and construction companies” (Mr. Kim,
director of department of urban redevelopment, Seongbuk-gu. July 12, 2005).
Whereas Western countries’ local governments regard gentrification as a way to
crease tax revenues, gu governments in Seoul think that gentrification does not increase
tax revenues:
“I do not think that the redevelopment produces the increase of local tax
revenues. The reason is that the influx of the middle class by the redevelopment
comprises a small part of local tax revenues. In my opinion, the introduction of large
commercial buildings and headquarters of large companies such as Samsung and
Hyundai is helpful in increasing local tax revenue more than the influx of the middle
class through redevelopment” (Mr. Kim).
Although these two officials share a common consensus that redevelopment
produces an improvement in the quality of neighborhoods, they did not identify the exact
purpose of policy regarding urban redevelopment. This is derived from the lack of
coherent philosophical perspectives of redevelopment and the short history of the local
autonomy (self-government) system.
In summary, gu governments in Seoul did not actively set up plans for
redevelopment, but adopt a passive position that reflects the necessity for physical
neighborhood upgrading through redevelopment. This means that Korea’s gentrification
is not caused by the policies of local governments, but generated by the residents’
individual judgments and the financing ability of large construction companies.
Summary
This chapter investigated the gentifiers’ demographic and economic attributes,
their movement patterns and motivations for movement, and the role of local
governments in Seoul. This study area changed from blighted detached housing to huge
101
apartment complexes and the physical changes created a qualitative improvement in the
existing residential area and residents’ composition.
Existing residents were typically replaced by middle class people in their 30s
and 40s employed in management, administration, business, and professional occupations
and with an educational level higher than the university degree.
When the region’s pre-redevelopment and post-redevelopment status were
compared, the housing sale price of after redevelopment increased by about 240 percent
and the cheonse price increased by 522 percent. This fact reveals that Smith’s rent gap
thesis is applicable to the case of the study area, in that after redevelopment, the rent gap
drastically decreased and in-movers considered the differential revenue created from
before and after redevelopment to be a motivation for their movement.
In their patterns of in-migration, short distance migration was more frequent
than that over long distances. But about 6.9 percent of total in-mover households
migrated from suburban areas of Seoul such as Gangnam-gu, Songpa-gu, Gangdong-gu,
and Gwangjin-gu, which are middle and high class residential areas. The proportion of
gentrifiers was relatively low when compared with total in-mover households.
Korean gentrifiers’ motivations for movement were the inner city’s accessibility,
saving commuting time and cost, and preferences for the inner city, recreational
opportunities, the relative disadvantage of suburban life, and the life style changes.
Gu governments in Seoul had a different role from Western countries’ local
governments in that whereas Western countries’ local governments induce gentrification
to enhance local tax revenues and neighborhood quality, gu governments in Seoul
emphasized physical neighborhood upgrading through redevelopment. This conclusion
suggests that Korea’s gentrification is not greatly affected by the policy of local
governments.
Gentrification in Seoul changed the neighborhood’s population, and was
accompanied by an increase in housing values resulting from an influx of middle income
owners into previously lower income neighborhoods. Thus, the region’s gentrification
involves middle income in-movers replacing lower income residents. Gentrification in
Seoul connotes a rehabilitation of working class and derelict housing and the consequent

102
transformation of an area into a middle class neighborhood. In other words, gentrification
is a visible spatial component of this social transformation.

103
CHAPTER 6
CONCLUSIONS
Gentrification can be an alternative for the revitalization of declining cities in
that it can revive and regenerate deteriorated inner cities’ property; however, this process
can also lead to the displacement of the low-income class. Gentrification’s significance
and effect have been argued widely since the late 1970s. Research of gentrification has
been based on four major competing arguments, including the rent gap thesis,
demographic change, post-industrial city status, and political restructuring. This study
found differential evidence for these lines of thought.
Applying Smith’s (1979, 1996) rent gap thesis to the supply of potentially
gentrifiable property in the inner areas of Seoul between 1990 and 2000, the city had a
high potential for gentrification in that the residential and commercial land values in
inner cities were lower than those of the CBD, sub-CBDs, and suburbs.
Using Ley’s (1996) post-industrial thesis and Sassen’s (1991) world city
arguments, changes in industrial, occupational and earnings structures that underpinned
middle class in Seoul led to the growth in demand for housing over the 10 years of this
study, 1991-2001. The industrial transformation of the city has been linked to a parallel
occupational restructuring, a long-term decline of unskilled manual workers, and
continued expansion of professional, technical, administrative, and managerial workers.
In addition, these changes have been linked to a growth of earnings and income, leading
to an increase in inequality. Not surprisingly, the increase in the size and purchasing
power of the middle class has been accompanied by an intensification of demand in the
housing market. However, it is necessary to emphasize that Seoul had a relatively high
dependence on manufacturing rather than producer services and it is not a global city, but
a national center. Moreover, although Seoul may not conform to the world city
assumptions in the past, it is being forced by global pressures to move in that direction
today.
In terms of the demographic changes argued by Bondi et al. (1991), Seoul has
experienced a reduction of average household size and a growth of female labor market
104
participation, but the proportion of women’s labor force participation was still lower than
that of American cities. However, the increase in small families and the growth of
female labor market participation profoundly affected the demand for housing in Seoul.
The number of foreign immigrants was very small compared with global cities such as
New York, London, and Tokyo.
South Korea’s government’s policies have focused on an export-oriented
economic strategy since the 1960s. After the financial crisis in 1997, the role of the
central government shrunk and competition among local governments accelerated. Such
a political restructuring is an important force generating gentrification in Seoul. However,
as indicated by interviews with planners, Seoul’s local governments did not perceive the
importance of gentrification as a way to increase their fiscal revenue.
The empirical analysis of gentrification in Seoul between 1990 and 2000
included correlations, factor analysis, and stepwise regression. The strongest relationships
existed between the gentrification index and variables representing the rent gap, post-
industrial city status, and institutional dimensions. There was a significant association
between gentrification and the decrease in family size among the 522 dong in Seoul.
Factor analysis revealed that the population change, post-industrial city status,
rent gap, and fiscal independence factors were significant in accounting for the changing
regional structure of Seoul. The regression model based upon factor scores was poor in
accounting for the variation in the gentrification index (R2 = 0.2098). However, the result
was helpful in understanding that gentrification in Seoul has been affected by the changes
in land values, economic structure, institutional characteristics, and demographic
characteristics, excluding housing type and ownership.
The case study investigated gentifiers’ demographic and economic attributes,
their movement patterns and motivations, and the role of local governments in Seoul
using semi-structured interviews and archival data. The study area changed from
blighted detached housing to huge apartment complexes and the physical changes
generated qualitative improvements in the residential area and residents’ composition.
The existing residents were replaced by middle class people in their 30s or 40s with
management, administration, business, and professional jobs and with an educational
level above the university degree. When comparing the neighborhood before and after

105
redevelopment, the housing sale price increased by about 240 percent and the cheonse
price increased by 522 percent. The qualitative analysis indicated that the joint
redevelopment project changed the neighborhood from a lower socioeconomic class
residential area to middle class one, and the residents’ social and economic attributes
from manual jobs to producer service occupations.
In the patterns of movement, in-migration over short distances was more
frequent than that over long distances. But 6.9 percent of total in-mover households
migrated from the suburban areas of Seoul, such as Gangnam-gu, Songpa-gu, Gangdong-
gu, and Gwangjin-gu, which were middle and high-class residential areas. The total
number of the gentrifiers was relatively small when compared with the proportion of the
total in-mover households. Korean gentrifiers’ motivations for movement included the
advantages of the inner city’s accessibility to the city center, saving commuting time and
cost, and preferences for inner city amenities caused by the demographic changes, the
relative disadvantages of suburban life, and the life style changes.
Gu governments in Seoul had a different role from Western countries’ local
governments in that whereas Western countries’ local governments use inducement
policy to enhance local tax revenues and neighborhood quality, gu governments in Seoul
had a passive position that stressed physical neighborhood upgrading through
redevelopment.
In conclusion, gentrification in Seoul was similar to Western countries’
gentrification in that it was affected by demographic changes, the rent gap, and the city’s
post-industrial city status. However, there existed a significant policy difference between
Korea’s local governments and those in the West in that Korea’s local governments did
not perceived the importance of gentrification as a mode of increasing their fiscal
revenues. Gentrification in Seoul is a relatively small-scale phenomenon in terms of the
volume of gentrifiers when compared with Western cities.
The limitations of this research are the lack of more detailed independent
variables for the quantitative analysis and the limited number of sampled interviewees in
the investigation of the role of local government. In order to explain gentrification in
Seoul, the amenity variables used in Ley’s post-industrial city thesis should be added and
106
interviews with local government’s head should be performed to explain the role of local
government inducing gentrification.
This research focused on the gentrifiers, not low income households’
displacement. While gentrification in Western cities has been dealt with by a number of
scholars, Korean displacement has been disregarded. Although Seoul has been the focus
of increasing polarization and economic and political restructuring, there has been little
work done on displacement. As a future research agenda, it is important not to ignore
where the low income class is dispersed, because gentrification is a direct cause of
working class displacement.

107
APPENDIX A
108
APPENDIX B
109

110
APPENDIX C A Prepared Questionnaire for the Gentrifers (In English)
Introduction: For my doctorate dissertation, I am gathering information about middle-class housing and residential migration and Householder’s social and economic characteristic at the redeveloped area. I thought you as a gentrifier. You would be a particularly good person to talk to. (Place tape recorder out and explain its use) Questions: 1. Would you tell me your previous address before you move into the current housing? 2. I want to know your reasons to move into current house or apartment. Would you tell me the reasons why you were moving into this house or apartment? 3. What are the advantages of previous housing? 4. What are the disadvantages of previous housing? 5. When compared to previous housing, what are the advantages of current housing? 6. When compared to previous housing, what are the disadvantages of current housing? 7. If you have an extra revenue by purchasing current housing, how much is the revenue? 8. Did you expect the revenue before you move into this housing? 9. Would you tell me your occupation and workplace? 10. How long does it take to reach at your workplace every day? 11. Are you satisfied with the commuting time? 12. Would you tell me your educational degree? 13. Would you tell me your income for a month? 14. Would you tell me the percentage of the cost of utilities out of living costs? 15. How do you think about your neighborhood quality? 16. What kind of leisure do you enjoy? 17. How do you think about your son and daughter’s educational environment? 18. If your housing is deteriorated, where will you move into? 19. May I contact you later if I need to clarify something you have said? Conclusion: Tell them they have been very helpful and thank them for their participation.
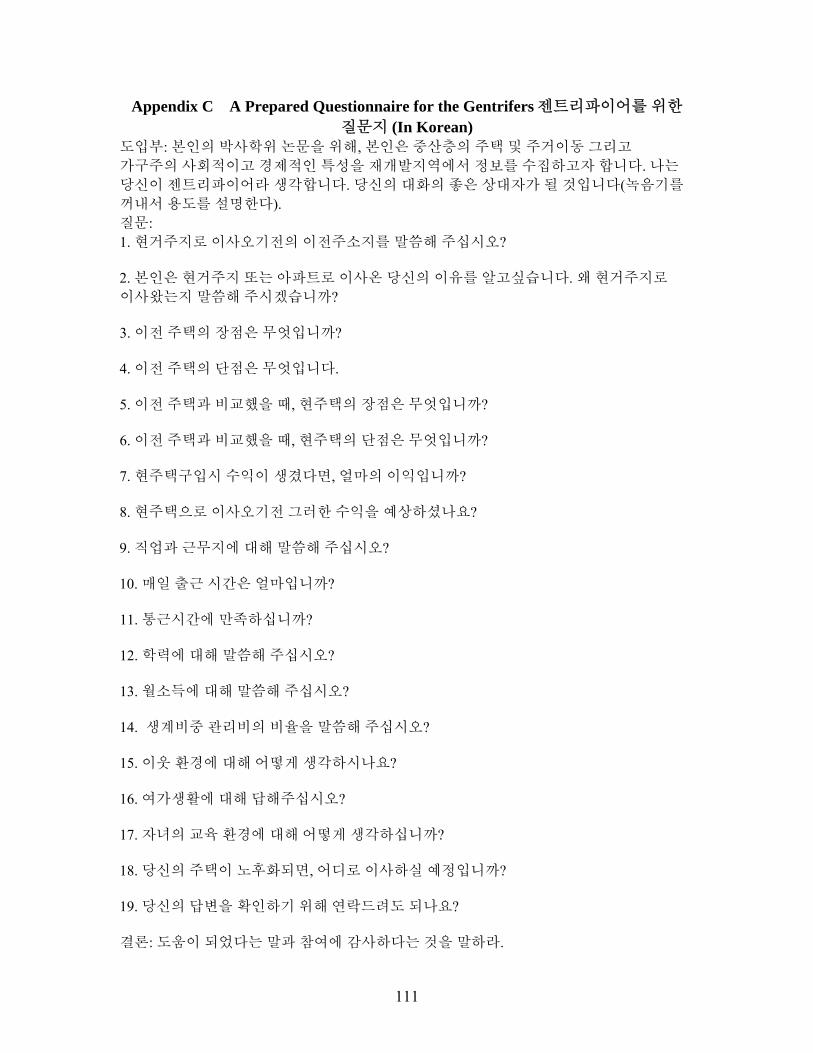
111
Appendix C A Prepared Questionnaire for the Gentrifers젠트리파이어를 위한 질문지 (In Korean)
도입부: 본인의 박사학위 논문을 위해, 본인은 중산층의 주택 및 주거이동 그리고 가구주의 사회적이고 경제적인 특성을 재개발지역에서 정보를 수집하고자 합니다. 나는 당신이 젠트리파이어라 생각합니다. 당신의 대화의 좋은 상대자가 될 것입니다(녹음기를 꺼내서 용도를 설명한다). 질문: 1. 현거주지로 이사오기전의 이전주소지를 말씀해 주십시오? 2. 본인은 현거주지 또는 아파트로 이사온 당신의 이유를 알고싶습니다. 왜 현거주지로 이사왔는지 말씀해 주시겠습니까? 3. 이전 주택의 장점은 무엇입니까? 4. 이전 주택의 단점은 무엇입니다. 5. 이전 주택과 비교했을 때, 현주택의 장점은 무엇입니까? 6. 이전 주택과 비교했을 때, 현주택의 단점은 무엇입니까? 7. 현주택구입시 수익이 생겼다면, 얼마의 이익입니까? 8. 현주택으로 이사오기전 그러한 수익을 예상하셨나요? 9. 직업과 근무지에 대해 말씀해 주십시오? 10. 매일 출근 시간은 얼마입니까? 11. 통근시간에 만족하십니까? 12. 학력에 대해 말씀해 주십시오? 13. 월소득에 대해 말씀해 주십시오? 14. 생계비중 관리비의 비율을 말씀해 주십시오? 15. 이웃 환경에 대해 어떻게 생각하시나요? 16. 여가생활에 대해 답해주십시오? 17. 자녀의 교육 환경에 대해 어떻게 생각하십니까? 18. 당신의 주택이 노후화되면, 어디로 이사하실 예정입니까? 19. 당신의 답변을 확인하기 위해 연락드려도 되나요? 결론: 도움이 되었다는 말과 참여에 감사하다는 것을 말하라.

112
APPENDIX D A Prepared Questionnaire for the city officials (In English)
Introduction: For my doctorate dissertation, I am gathering stories about previous and current situation of redevelopment district and redevelopment plan and policy. I am also interested in the change of tax revenue occurred by the redevelopment. You would be a particularly good person to talk to. (Place tape recorder out and explain its use) Questions: 1. I understand that before the redevelopment this area was a slum. Would you tell me the previous situation of this redeveloped area? 2. What are the local government’s purpose and policy to perform the redevelopment for this district? 3. Why was this area designated as the redevelopment area? 4. What was the housing type of this area before the redevelopment? 5. When did the redevelopment begun? And how long does it take to finish the construction of this new apartment? 6. What is the role of local government for facilitating the redevelopment? 7. After the redevelopment, what kinds of changes occur in the composition of the residents? 8. After the redevelopment, is the tax revenue increased or decreased? 9. What kinds of methods are used to redevelop this district? Is that a partnership redevelopment? 10. What are the local government’s regulations for the construction of this apartment complex? 11. I want to know your opinion of whether urban revival policy can revitalize the deteriorated area? 12. What are the problems occurring after the redevelopment? 13. What are the advantages occurring after the redevelopment? 14. After the appearance of local municipal systems in 1994, I think that there are more competitions between local municipals than before. What are the policies for the local municipal to start for raising tax revenue? 15. Do you think the redevelopment as one of the ways to raise tax revenue? 16. May I contact you later if I need to clarify something you have said? Conclusion: Tell them they have been very helpful and thank them for their participation.
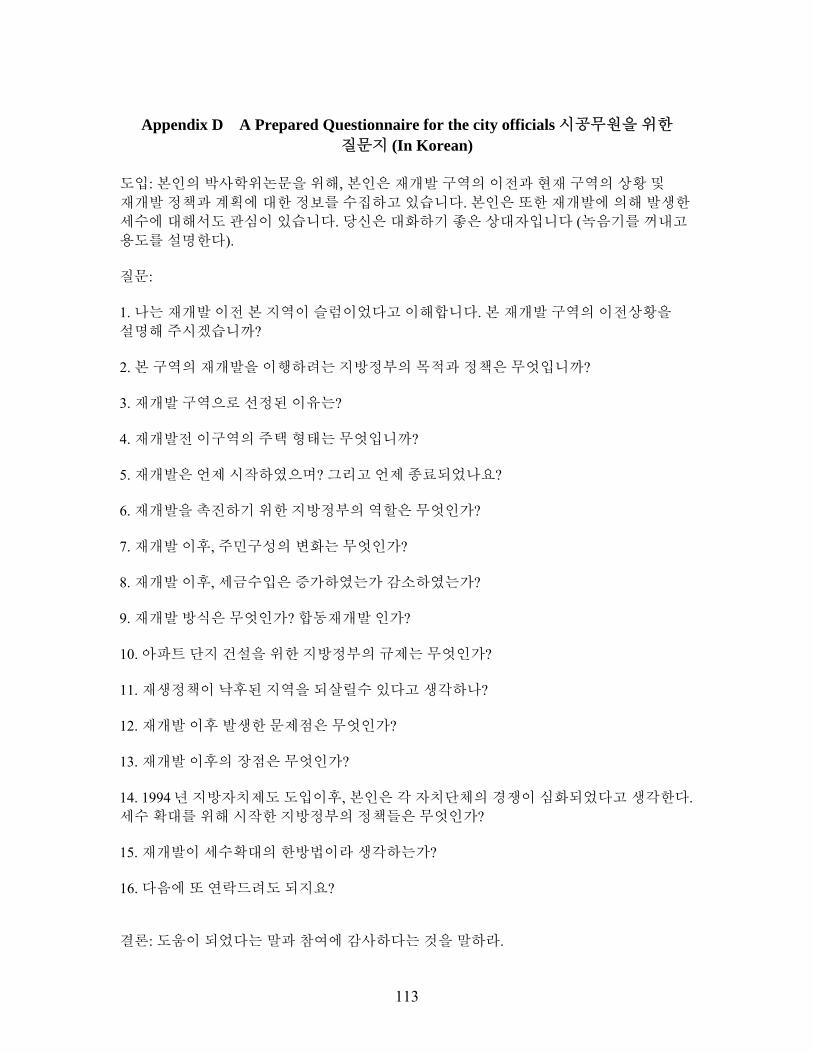
113
Appendix D A Prepared Questionnaire for the city officials 시공무원을 위한
질문지 (In Korean) 도입: 본인의 박사학위논문을 위해, 본인은 재개발 구역의 이전과 현재 구역의 상황 및 재개발 정책과 계획에 대한 정보를 수집하고 있습니다. 본인은 또한 재개발에 의해 발생한 세수에 대해서도 관심이 있습니다. 당신은 대화하기 좋은 상대자입니다 (녹음기를 꺼내고 용도를 설명한다). 질문: 1. 나는 재개발 이전 본 지역이 슬럼이었다고 이해합니다. 본 재개발 구역의 이전상황을 설명해 주시겠습니까? 2. 본 구역의 재개발을 이행하려는 지방정부의 목적과 정책은 무엇입니까? 3. 재개발 구역으로 선정된 이유는? 4. 재개발전 이구역의 주택 형태는 무엇입니까? 5. 재개발은 언제 시작하였으며? 그리고 언제 종료되었나요? 6. 재개발을 촉진하기 위한 지방정부의 역할은 무엇인가? 7. 재개발 이후, 주민구성의 변화는 무엇인가? 8. 재개발 이후, 세금수입은 증가하였는가 감소하였는가? 9. 재개발 방식은 무엇인가? 합동재개발 인가? 10. 아파트 단지 건설을 위한 지방정부의 규제는 무엇인가? 11. 재생정책이 낙후된 지역을 되살릴수 있다고 생각하나? 12. 재개발 이후 발생한 문제점은 무엇인가? 13. 재개발 이후의 장점은 무엇인가? 14. 1994년 지방자치제도 도입이후, 본인은 각 자치단체의 경쟁이 심화되었다고 생각한다. 세수 확대를 위해 시작한 지방정부의 정책들은 무엇인가? 15. 재개발이 세수확대의 한방법이라 생각하는가? 16. 다음에 또 연락드려도 되지요? 결론: 도움이 되었다는 말과 참여에 감사하다는 것을 말하라.

114
REFERENCES
Alonso, W. 1964. Location and Land Use. Honolulu: Harvard University Press.
Babbie, E. 2001. The Practice of Social Research. 9th edition. United State: Wadsworth.
Berry, B. 1980. Inner City Future: An American Dilemma. Transactions of the Institute of British Geographers 5:1-28.
Berry, B. 1985. Islands of Renewal in Seas of Decay. In the New Urban Reality, Paul E. Peterson, ed. Washington, DC: The Brookings Institution. Pp 69-96.
Bondi, L. 1991. Gender Divisions and Gentrification: A Critique. Transactions of the Institute of British Geographers 16:190-198.
Bondi, L. 1999. Between the Woof and the Weft: A Response to Loretta Lees. Environment and Planning D: Society and Space 17:253-260.
Borthwick, M. 1998. Pacific Century: The Emergence of Modern Pacific Asia. Westview Press.
Bourne, L. 1993a. The Demise of Gentrification? A Commentary and Prospective View. Urban Geography 14:95-107.
Bourne, L. 1993b. The Myth and Reality of Gentrification: A Commentary on Emerging Urban Forms. Urban Studies 30:183-189.
Bridge, G. 1994. Gentrification, Class, and Residence: A Reappraisal. Environment and Planning D: Society and Space 12:31-51.
Bridge, G. 1995. The Space for Class? On Class Analysis in the Study of Gentrification. Transactions of the Institute of British Geographers 20:236-247.
Butler, T. 1997. Gentrification and the Middle Classes. Ashford: Ashgate.
Butler, T. and G. Robson. 2001. Social Capital, Gentrification and Neighborhood Change in London: A Comparison of Three South London Neighborhoods. Urban Studies 38:2145-2162.
Butler, T. and G. Robson. 2003. Negotiating Their Way In: The Middle Classes, Gentrification and the Deployment of Capital in a Globalising Metropolis. Urban Studies 40:1791-1809.
Cho, J. 1995. Government Intervention, Rent Distribution, and Economic Development in Korea. Journal of Asian Economics 8:562-585.

115
Chosun Newspaper. 2005. Education-Based Income Gap Widens. 10 December. http://english.chosun.com/w21data/html/news/20512/200512120018.html.
Clark, E. 1992. On Blindness, Centrepieces and Complementarity in Gentrification Theory. Transactions of the Institute of British Geographers 17:358-362.
Cox, K. 2002. Political Geography: Territory, State, and Society. Blackwell.
Denzin, N. 1978. The Research Act. New York: McGraw-Hill.
England, K. 1993. Suburban Pink Collar Ghettos: The Spatial Entrapment of Women? Annals of the Association of American Geographers 83:225-242.
Fainstein, S. and N. Fainstein. 1986. Economic Change, National Policy, and the System of Cities. In Fainstein, S, Fainstein, N. Hill, R. Judd, D. and M. Smith. eds. Restructuring the City: The Political Economy of Urban Redevelopment. New York and London: Longman. Pp. 1-26.
Fotheringham, A. Brunsdon, C. and M. Charlton. 2000. Quantitative Geography: Perspective on Spatial Data Analysis. London: Sage Publications.
Friedmann, J. 1986. The World City Hypothesis. Development and Change 17:69-84.
Glass, R. 1964. Introduction to London: Aspects of Change. London: MacGibbon and Kee.
Global Fortune 500. 2005. http://money.cnn.com/magazines/fortune/global500.
Ha, S. K. 2001. Substandard Settlements and Joint Redevelopment Projects in Seoul. Habitat International 24:385-397.
Ha, S. K. 2004. Housing Renewal and Neighborhood Change as a Gentrification Process in Seoul. Cities 21:381-389.
Hackworth, J. and N. Smith. 2001. The Changing State of Gentrification. Tijdschrift voor Economishe en Sociale Geografie 92:464-477.
Hammel, D. and E. Wyly. 1996. A Model for Identifying Gentrified Areas with Census Data. Urban Geography 17:248-268.
Hamnett, C. 1984. Gentrification and Residential Location Theory: A Review and Assessment. In Herbert, D. and Johnston, R.J. ed. Geography and the Urban Environment. Pp 283-319.
Hamnett, C. 1991. The Blind Men and the Elephant: The Explanation of Gentrification. Transactions of the Institute of British Geographers 16:173-189.
Hamnett, C. 2003. Gentrification and the Middle-class Remaking of Inner London, 1961-2001. Urban Studies 40:2401-2426.
116
Hannah, L., K. Kim. and E. Mills. 1993. Land Use Controls and Housing Prices in Korea. Urban Studies 30:147-156.
Hart-Landsberg, M. and P. Burkett. 1998. Contradictions of Capitalist Industrialization in East Asia: A Critique of Flying Geese Theories of Development. Economic Geography 74:87-110.
Hart-Landsberg, M. and P. Burkett. 2001. Economic Crisis and Restructuring in South Korea: Beyond the Free Market-Statist Debate. Critical Asian Studies 33:403-430.
Hay, I. 2000. Qualitative Research Methods in Human Geography. Oxford University Press.
Hill, R. and J. Kim. 2000. Global Cities and Developmental States: New York, Tokyo and Seoul. Urban Studies 37:2167-2195.
Hong, W. 1996. Seoul: A Global City in A Nation of Rapid Growth, in F. Lo and Y. Yeoung, eds. Emerging World Cities in Pacific Asia. New York: United Nations University Press. Pp. 144-178.
Hoyt, H. 1933. One Hundred Years of Land Values in Chicago. Chicago: University of Chicago Press.
Hoyt, H. 1939. The Structure and Growth of Residential Neighborhoods in American Cities. Washington, D.C.: Federal Housing Administration.
Illeris, S. 1996. The Service Economy: A Geographical Approach. New York: John Wiley and Sons.
Jeon, Y. 1997. A Study on the Urban Renewal of Inner City Areas. Seoul: Korea Research Institute for Human Settlements.
Kennedy, M. and P. Leonard. 2001. Dealing With Neighborhood Change: A Primer on Gentrification and Policy Choices. Discussion Paper Prepared for The Brookings Institution Center on Urban and Metropolitan Policy. www.brookings.edu/urban.
Kim, G. J. Lee, I. J. and Jeong, S. H. 1996. Substandard Housing Redevelopment in Seoul: 1973-1996. Seoul Development Institute: City of Seoul.
Kim, J. and S. Choe. 1997. Seoul: The Making of a Metropolis. New York: John Wiley and Sons.
Korea Herald. 1999. Korea’s Economic Crisis Leading to Collapse of Middle-Income Class. 3 July. http://www.koreaherald.co.kr.
Korea Ministry of Foreign Affairs and Trade. 2006. website: http://www.mofat.go.kr.

117
Korea National Housing Corporation. 2003. Yearbook of Housing Statistics. Seoul KNHC.
Korea National Statistical Office. 1949. http://kosis.nso.go.kr.
Korea National Statistical Office. 1981-2004. Annual Report on the Economically Active Population Survey.
Korea National Statistical Office. 1990 and 2000. Population and Housing Census Report. Vol. 2: Province, 16(1): Seoul-Teukbyeolsi.
Korea National Statistical Office. 1990 and 2000. Annual Report on the Economically Active Population.
Korea National Statistical Office. 1990-2000. Annual Report on the Household Income and Expenditure Survey.
Korea National Statistical Office. 1991 and 2001. Report on Total Employment.
Korea National Statistical Office. 2000. Regional Statistical Year Book. Seoul. http://www.nso.go.kr/nso2005/index.jsp.
Korea Times. 2006. Income Gap Deepens Between White, Blue Collar Workers. 9 Feb. http://www.koreatimes.co.kr.
Korean Land Value Appraisal Association. 1991 and 2001. Bulletin of Acknowledged Land Value, Vol. 2. Seoul.
Korean Securities Association. 2002. Overview of Korea’s Economy. http://www.ksda.or.kr.
Kwon, S. 1998. A Study of Spatial Structure Changes in Seoul Metropolitan Areas. Ph.D. Dissertation. University of Seoul.
Lee, C., M. Lee, J. and Yim, C. 2003. A Revenue-Sharing Model of Residential Redevelopment Projects: The Case of the Hapdong Redevelopment Scheme in Seoul. Urban Studies 40:2223-2237.
Lees, L. 1994. Rethinking Gentrification: Beyond the Positions of Economics or Culture. Progress in Human Geography 18:137-150.
Lees, L. 2000. A Reappraisal of Gentrification: Towards a ‘Geography of Gentrification’. Progress in Human Geography 24:389-408.
Ley, D. 1980. Liberal Ideology and the Postindustrial City. Annals of the Association of American Geographers 70:238-258.
Ley, D. 1986. Alternative Explanations for Inner-City Gentrification: A Canadian Assessment. Annals of the Association of American Geographers 76:521-535.
118
Ley, D. 1996. The Middle Class and the Remaking of the Central City. Oxford: Oxford University Press.
Ley, D. 2003. Artists, Aestheticisation and the Field of Gentrification. Urban Studies 40:2527-2544.
McClendon, M. 1994. Multiple Regression and Causal Analysis. Illinois: Waveland Press, INC.
Ministry of Justice. 1990 and 2000. Statistical Yearbook on the Departures and Arrivals. Seoul.
Ministry of Labor. 1990 and 2000. Survey Report on Wage Structure. Seoul.
Nam, W. 1985. Urban Structure Theories, Seoul: Bubmoonsa.
Phillips, M. 2004. Other Geographies of Gentrification. Progress in Human Geography 28:5-30.
Ramsey, F. and D. Schafer. 2002. The Statistical Sleuth: A Course in Methods of Data Analysis. 2nd ed. New York: Duxbury.
Real Estate Bank. http://www.neonet.co.kr.
Redfern, P. 1997. A New Look at Gentrification: Gentrification and Domestic Technologies. Environment and Planning A 29:1275-1296.
Sassen, S. 1991. The Global City: New York, London, Tokyo. Princeton, NJ: Princeton University Press.
Schaffer, R. and N. Smith. 1986. The Gentrification of Harlem? Annals of the Association of American Geographers 76:347-365.
Seoul Development Institute. 1995. Alternative Development Type of Hillside Redevelopment Apartment. City of Seoul.
Seoul Development Institute. 1991 and 2001. Office Space Area Report. City of Seoul.
Seoul Development Institute. 1990 and 2000. Business and Employment Statistical Report. The City of Seoul.
Seoul Development Institute. 2000. Seoul as a Map. City of Seoul.
Seoul Municipal Government, 1991, 1995, and 2000. Municipal Yearly Statistical Report in 25 Gu.
Seoul Metropolitan Government. 1998. Statistics on Foreign Immigration. Seoul.
Seoul Statistical Year Book. 1991 and 2001. Average Annual Household Income. Seoul.
119
Slater, T. 2004. North American Gentrification? Revanchist and Emancipatory Perspectives Explored. Environmental and Planning A 37:1191-1213.
Smith, D. 2002. Extending the Temporal and Spatial Limits of Gentrification: A Research Agenda for Population Geographers. International Journal of Population Geography 8:385-394.
Smith, N. 1979. Toward a Theory of Gentrification: A Back to the City Movement by Capital, not People. Journal of the American Planning Association 45:538-548.
Smith, N. 1986. Gentrification, the Frontier, and the Restructuring of Urban Space. In Gentrification of the City, N. Smith and P. Williams, ed. London: Allen and Unwin. Pp. 15-34.
Smith, N. 1987. Of Yuppies and Housing: Gentrification, Social Restructuring and The Urban Dream. Environment and Planning D 5:151-172.
Smith, N. 1996. The New Urban Frontier: Gentrification and the Revanchist City. London and New York: Routledge.
Smith, N. 2002. New Globalism, New Urbanism: Gentrification as Global Urban Strategy. Antipode 34:427-450.
Smith, N. and P. Williams. ed. 1986. The Gentrification of the City. London: Allen and Unwin.
Stiglitz, J. 2002. Globalization and Its Discontents. New York and London: Norton.
Suh, S. 2005. A Policy Simulation for the Preservation of Traditional Korean Style Houses within Korean Contexts: Focused on the Transfer Development Right System. Seoul Studies 6:12-23.
United States Department of Housing and Urban Development. 1979. Whither or Whether Urban Distress. Working Paper, Office of Community Planning and Development.
Wolgok 4-dong Redevelopment Association. 2003. White Paper on Wolgok 4-dong Housing Redevelopment. Seoul.
Wyly, E. and D. Hammel. 1999. Islands of Decay in Seas of Renewal: Housing Policy and the Resurgence of Gentrification. Housing Policy Debate 10:711-797.
Yeates, M. 1990. The North American City. New York: Harper and Row.
Zukin, S. 1987. Gentrification: Culture and Capital in the Urban Core. American Review of Sociology 13:129-147.
120
BIOGRAPHICAL SKETCH KIRL KIM
EDUCATION
Florida State University Ph.D. Department of Geography, August 2006. Research Interests: Urban political economic geography, especially gentrification using quantitative, qualitative and cartographic methods; Korea, Japan, and China. Advisor: Dr. Barney Warf.
Korea University M.A., Department of Geography, February 1999. Thesis: A Critique and A Respect of Gentrification: A Case Study of Tongsomun in Seoul. Advisor: Dr. Young-Woo Nam.
Korea University B.A., Department of Education of Geography, February 1997.
EXPERIENCE Graduate Assistant, Devoe Moore Center, Florida State University, September 2005-May 2006. Graduate Assistant, Geography, Florida State University, August 2002-August 2005. Graduate Assistant, Korea University, March 1997-February 1999.
CERTIFICATE & HONORS Certificate of Teacher in Social Studies for Secondary Education by Minister of Education, Seoul, Korea, February 1997. Excellent Student Scholarship, Korea University, March 1995-February 1997.
PUBLICATION “Gentrification: Research Trends and Respects.” Korea Urban Planners Association, 97:83-97. November 1998.
PRESENTATION “A Theoretical Review of Gentrification.” Seminar of Korea Urban Geographers Society at Kyoungwon University, September 1997.
COMPETENCIES Foreign Languages: Korean-native speaker Japanese-written, spoken competence and reading knowledge Chinese-reading knowledge
Computer Skills: SPSS, S-PLUS, ArcGIS
Statistical Skills: ANOVA, Regression Analysis, Cluster Analysis, Factor Analysis.