
Housing in London 2019 - Queen Elizabeth Olympic Park
127
HOUSING IN LONDON: 2019 The evidence base for the Mayor’s Housing Strategy RPP21
-
Upload
khangminh22 -
Category
Documents
-
view
2 -
download
0
Transcript of Housing in London 2019 - Queen Elizabeth Olympic Park

HOUSING IN
LONDON: 2019 The evidence base for the Mayor’s Housing Strategy
RPP21

Housing in London 2019
Copyright
Greater London Authority
September 2019
Published by
Greater London Authority
City Hall
The Queen’s Walk
More London
London SE1 2AA
www.london.gov.uk
enquiries 020 7983 4100
minicom 020 7983 4458
Written and designed by Georgie Cosh and James Gleeson
Cover image produced using EPC data on new homes completed in London between January 2016
and May 2019. See Chart 3.7 in this document for more details.
Contains OS data © Crown Copyright and database right 2019. Ordnance Survey 100032216
Contains National Statistics data © Crown copyright and database right 2019
Contains data produced by Land Registry © Crown copyright 2019
Contains data provided through www.VisionofBritain.org.uk and uses statistical material which is
copyright of the Great Britain Historical GIS Project, Humphrey Southall and the University of
Portsmouth
Contains data provided by Molior London
Contains data retrieved from the London Development Database. All 2017/18 data is provisional – see
the 2017/18 London Plan annual monitoring report for final figures
Copies of this report are available from data.london.gov.uk

HOUSING IN LONDON 2019 3
Contents
Introduction 4
Contents 5
List of charts 5
London Housing Strategy monitoring 10
Key statistics for London Boroughs 12
1. Historical background 16
2. Demographic, economic and social trends 27
3. Housing supply and empty homes 39
4. Housing costs and affordability 65
5. Housing need 87
6. Mobility and decent homes 99
Appendices 119
A1. Discontinued charts 120
A2. Dwelling, household and tenure definitions 121
A3. Sources of data on housing supply 123
A4. London and the Outer Metropolitan Area 124
A5. Referable planning applications 125
A6. Glossary of acronyms 126

HOUSING IN LONDON 2019 4
Introduction
Housing in London is the evidence base for the Mayor’s London Housing Strategy which in
turn informs the London Plan. The document summarises key patterns and trends across a
range of topics relevant to housing in the capital.
Housing in London 2019 is divided into nine sections, including six core thematic chapters:
London Housing Strategy monitoring
Key statistics for London boroughs
1. Historical background
2. Demographic, economic and social context
3. Housing supply and empty homes
4. Housing costs and affordability
5. Housing need
6. Mobility and decent homes
Appendices
This document sits alongside a range of other Greater London Authority (GLA) publications
that provide evidence or statistics on housing. These include (click to follow links):
• GLA Affordable Housing programme statistics
• The London Plan Annual Monitoring Reports
• The 2017 London Strategic Housing Market Assessment
• The 2017 London Strategic Housing Land Availability Assessment
• The 2016 Economic Evidence Base
• The 2018 London Housing Strategy
• The Mayor’s Annual Equalities Reports
• The London Datastore, including statistics on housing and demographics
The data used to produce this report has been uploaded to the London Datastore, where you
can also find data and reports from previous editions of Housing in London.
Some charts included in previous versions of Housing in London have been discontinued for
this edition, usually due to a lack of new data. A list of discontinued charts is provided at
Appendix 1A1. The reader is encouraged to review these charts in previous editions of
Housing in London published at https://data.london.gov.uk/dataset/housing-london
Comments and suggestions are welcomed and should be sent to

HOUSING IN LONDON 2019 5
Contents
Housing in London 2019 is structured around six thematic chapters, with tables of key London
borough statistics at the beginning of the document. Each thematic chapter starts with a
summary page, with links to every chart provided.
The chapter structure in Housing in London 2019 is similar to that of the 2018 edition and of
the London Housing Strategy published in May 2018. The London Housing Strategy outlines
the Mayor’s housing policies, drawing on the data sources presented in this document to
develop and evaluate these policies.
Housing is a complex matter; therefore, the reader is encouraged to read across and between
chapters to establish a full understanding of topics. Some topics, such as new affordable
housing development, are covered by charts in all six chapters.
List of charts
This chart list contains hyperlinks to the relevant section of the document.
Chapter 1: Historical background
1.1 Historic and projected London population, 1801 to 2041
1.2 Estimated numbers of dwellings and households in Greater London, 1901 to 2018
1.3 Estimated number of people per dwelling in England, London and other regions, 1971 to
2018
1.4 Annual trend in household tenure, London, 1981 to 2018
1.5 Home ownership rate by age group of household head, London, 1990 to 2018
1.6 New build homes in Greater London, 1871 to 2018
1.7 Annualised gross new homes built and net change in dwelling stock in London, by
decade, 1961 to 2018
1.8 London Plan capacity-based targets and net completions over time, 1997 to 2028
1.9 Proportion of respondents (in Britain and in London) identifying housing as one of the
most important issues facing the country, 2000 to 2019
1.10 Attitudes towards local house building in London, 2010 to 2017
Chapter 2: Demographic, economic and social trends
2.1 Population change by decade in London and Outer Metropolitan Area, 1811 to 2021
2.2 Components of London’s population change, 1996 to 2018
2.3 Net domestic migration to London by those in their 20s and in their 30s, 2002 to 2018

HOUSING IN LONDON 2019 6
2.4 Share of people aged 20-34 living with their parents, London and UK, 1996-98 to
2016-18
2.5 Proportion of households in London with dependent children by tenure, 2004 to 2018
2.6 Satisfaction with accommodation and tenure, London, 2016/17
2.7 National household income quintile by tenure, London, 2017/18
2.8 Median property wealth, by total household net equivalised income decile, London,
2010-12 to 2014-16
2.9 Non-UK nationals as a share of home building workforce, by region and country, 2017
2.10 Residential Stamp Duty receipts in London, 1988/89 to 2017/18 (2017/18 prices)
2.11 Average Council Tax and Stamp Duty as a percentage of average house price, London,
1996/97 to 2017/18
Chapter 3: Housing supply and empty homes
3.1 Indexed trend in number of jobs, people and homes in London, 1997 to 2018
3.2 Net conventional housing completions by tenure, London, 2004/05 to 2017/18
3.3 New housing completions in London: comparison of various house building datasets,
2010 to 2019
3.4 Annualised new house building starts in London by type of provider, 2000 to 2019
3.5 Percentage increase in dwelling stock by local authority, 2008 to 2018
3.6 Net conventional completions by borough and tenure, 2015/16 to 2017/18
3.7 Concentrations of new home completions in London, 2016 to 2019
3.8 Family sized homes (three bedrooms or more) as a proportion of total gross house
building in London, 1991/92 to 2017/18
3.9 Mean floor area by dwelling age, London and England, 1919 to 2018
3.10 Percentage of new build houses which are leasehold, London and England, 1998 to
2018
3.11 Net conventional housing approvals in London by tenure, 2004/05 to 2017/18
3.12 Mayoral decisions on affordable housing, 2012 to 2018
3.13 Number of units in the planning pipeline by scheme size, London, 2009 to 2018
3.14 Estimated number of homes in each London borough that could be provided by tall
buildings in the pipeline, 2019
3.15 Cumulative Build to Rent starts and completions in London, 2009 to 2018
3.16 Number of community led housing projects by London boroughs, 2019
3.17 Affordable housing starts in London funded by the GLA, 2012/13 to 2018/19
3.18 Number of new build council housing starts by London boroughs, 1980/81 to 2018/19

HOUSING IN LONDON 2019 7
3.19 Affordable housing completions in London, 1991/92 to 2017/18
3.20 Conversions of social rent homes to Affordable Rent compared to starts of social rent
and Affordable Rent homes, London 2011/12 to 2018/19
3.21 Annual Right to Buy council housing sales and average discount, London, 1981 to
2018/19
3.22 Affordable homes in London (excluding shared ownership) by landlord type, 1997 to
2018
3.23 Empty Homes in London as a proportion of total stock, 1978 to 2018
3.24 Dwellings recorded as second homes for Council Tax purposes by borough, 2018
Chapter 4: Housing costs and affordability
4.1 Median of housing costs as a share of income (including benefits and income from all
household members) by tenure, London, 2010 to 2016
4.2 Estimated income distribution of recently moving households in London by tenure,
2016/17
4.3 Average house prices in London and England after adjusting for inflation, 1970 to 2019
4.4 Ratio of London and South East average house prices to UK average, 1974 to 2019
4.5 Median price of homes sold in 2018, by Middle Super Output Area
4.6 Annualised new home buyer mortgages by type, London, 2004 to 2019
4.7 Annualised number of loans to first time buyers in London, by loan-to-value ratio, 2006
to 2018
4.8 Median loan to income ratio for new loans to first time buyers and home movers in
London, 1980 to 2018
4.9 Annualised Help to Buy equity loans in Inner and Outer London, 2014/15 to 2018/19
4.10 Trend in median deposit requirement and mortgage repayments as a share of income for
first time buyers in London, 2000 to 2018/19
4.11 Court orders for mortgage repossession in London, 1980 to 2018
4.12 Annualised mortgage and landlord possessions in London, 2004 to 2018/19
4.13 Estimated number of properties listed on Airbnb in London by type, 2013 to 2019
4.14 Index of change in average private rents by region, 2005 to 2019
4.15 Quarterly change in nominal rent and leading indicators for rental growth, 2010 to 2020
4.16 Index of cumulative change in private rents, earnings and implied affordability in
London, 2005 to 2018
4.17 Median monthly market rent by region and number of bedrooms, 2018/19
4.18 Lower quartile, median and upper quartile monthly market rents for a two-bedroom
home by London borough, 2019

HOUSING IN LONDON 2019 8
4.19 Trend in Housing Benefit and Universal Credit caseload in London by tenure, 1998 to
2019
4.20 Change in private rent Housing Benefit and Universal Credit caseload by London Middle
Super Output Area, April 2018 to February 2019
4.21 Median weekly rents for new social rent and Affordable Rent lettings of two-bedroom
homes in London, 2007/08 to 2017/18 (nominal)
Chapter 5: Housing need
5.1 People seen sleeping rough in London, 2006/07 to 2018/19
5.2 Number of contacts with people seen sleeping rough for the first time, 2008/09 to
2018/19
5.3 Areas of origin of people seen sleeping rough in London, 2008/09 to 2018/19
5.4 Support needs of people seen sleeping rough in London, 2018/19
5.5 Households accepted as statutorily homeless in London, 1990 to 2018/19
5.6 Households accepted as homeless in London by reason for loss of last settled home,
1998/99 to 2018/19
5.7 Homelessness prevention and relief in London, 2009/10 to 2018/19
5.8 Homeless households in temporary accommodation in London by type of
accommodation, 1988 to 2018
5.9 Households leaving temporary accommodation as a proportion of total at beginning of
year, London, 1998/99 to 2017/18
5.10 Proportion of households in London overcrowded (according to the bedroom standard)
by tenure, 1995/96 to 2017/18
5.11 Proportion of children living in overcrowded housing by tenure, London and England,
2014/15 to 2016/17
Chapter 6: Mobility and decent homes
6.1 Length of time in current home by tenure, London, 2015/16 to 2017/18
6.2 Proportion of households in London who have lived less than a year at current address
by tenure, 1995 to 2017/18
6.3 Flows between tenures of London households moving in the last year, 2015/16 to
2017/18
6.4 Lettings to new tenants in London by local authorities and housing associations,
1996/97 to 2017/18
6.5 Reasons for moving: households moving or forming in the last two years, by previous
tenure, 2014/15 to 2016/17

HOUSING IN LONDON 2019 9
6.6 Housing Moves lettings per year by category, 2012/13 to 2018/19
6.7 Number of social rented homes freed up through Seaside & Country Homes moves, by
borough, 2007/08 to 2018/19
6.8 Households in London under-occupying their accommodation (according to the
bedroom standard) by tenure, 1995/96 to 2017/18
6.9 Accessible homes as a proportion of all new build homes approved in London, 2009/10
to 2017/18
6.10 Number of Homes in Multiple Occupation that have been issued with mandatory
licences by London boroughs, 2012 to 2018
6.11 Trend in proportion of non-decent homes in London and the rest of England, 2006 to
2017
6.12 Trend in non-decent homes by tenure, London, 2006 to 2017
6.13 Trend in number of non-decent affordable homes in London by landlord type, 2005 to
2018
6.14 Fires in homes recorded by London Fire Brigade in 2018
6.15 Per capita greenhouse gas emissions in London by sector, 2000 to 2016
6.16 Energy efficiency band of EPCs lodged for existing buildings and new dwellings,
London, 2018/19
6.17 Trend in median SAP (energy efficiency) rating by tenure, London, 1996 to 2017
6.18 Proportion of households in fuel poverty in London and England, 2003 to 2017
6.19 Fuel poverty rates by tenure, England and London, 2017

HOUSING IN LONDON 2019 10
London Housing Strategy monitoring
The London Housing Strategy (May 2018) sets out the Mayor’s policies and proposals for
tackling London’s housing crisis and is centred around five key priorities:
• building homes for Londoners;
• delivering genuinely affordable homes;
• high quality homes and inclusive neighbourhoods;
• a fairer deal for private renters and leaseholders; and.
• tackling homelessness and helping rough sleepers.
The London Housing Strategy: Implementation Plan (May 2018) brings together key policies,
proposals and actions for implementation; Mayoral targets or milestones where these have
been agreed; and headline indicators of success, which have been chosen to measure the
long-term impact of the London Housing Strategy and the state of the housing market in
London more generally.
These indicators are reported in detail in remainder of this publication and summarised below:
Outcome Indicator 2015/16
Baseline
2018/19
Indicator
Housing in
London
chart
Increasing the
supply of new
homes
Net housing supply 38,550 in
2015/16
31,850 in
2017/18 3.3
Increasing the
stock of social
housing
Additions to low cost
rented affordable
housing stock minus
loss to affordable
housing stock
802,890 in
2016
803,240 in
2018 3.22
Making housing
more affordable
Housing costs as a
percentage of
household income
27% in
2015/16
28% in
2016/17 4.1
Improving the
quality of housing
Percentage of homes
that are decent 84% in 2015 83% in 2017 6.9

HOUSING IN LONDON 2019 11
Outcome Indicator 2015/16
Baseline
2018/19
Indicator
Housing in
London
chart
Reducing
overcrowding
Percentage of London
households that are
overcrowded
7.5% in
2015/16
8.0% in
2017/18 5.10
Improving energy
efficiency of
housing
Median SAP rating of
London’s homes 62 in 2015 64 in 2017 6.17
Improving the
private rented
sector
Percentage of private
renting households
satisfied with their
tenure
58% in
2015/16
63% in
2016/17 2.6
Improving
conditions in the
private rented
sector
Number of Homes in
Multiple Occupation
issued with mandatory
licences by London
boroughs
9,683 in April
2017
9,020 at start
of April 2018 6.10
Preventing and
addressing
homelessness
Number of households
accepted as homeless
in London
18,060 in
2016/17
15,470 in
2017/181 5.5
Reducing rough
sleeping
Number of people
seen sleeping rough
8,108 in
2016/17
8,855 in
2018/19 5.1
Reducing
homelessness
Number of homeless
households living in
temporary
accommodation
arranged by London
boroughs
54,370 at end
of 2017
56,880 at end
of 2018 5.8
1 2018/19 will be the first year of data collected after changes were introduced under the Homelessness Reduction Act (HRA) 2017. Provisional figures, calculated by annualising first three quarters of 2018/19 data, estimate there were 7,520 households accepted as statutorily homeless by London boroughs in 2018/19 and 21,170 new relief duties recorded.

HOUSING IN LONDON 2019 12
Key statistics for London Boroughs
Key statistics definitions
The dwelling, household and tenure definitions used in Housing in London 2019 are in line with
Census and National Statistics definitions and are provided at Appendix 1A2.
An explanation of the different measures of housing supply is provided at Appendix 1A3, with
reference to the targets set out in the Mayor’s London Plan and London Housing Strategy.
Map of Inner and Outer London Boroughs
A map of Inner and Outer London Boroughs, as defined by the ONS, is provided below:
A map of Inner and Outer London Boroughs, as defined by the GLA, as well as the Outer Metropolitan
Area, a large area with high rates of commuting into London defined by the Great Britain Historical
GIS, is provided at Appendix 1A4.

HOUSING IN LONDON 2019 13
Table 1: Population and households
Borough Sector Population
(2018)2
Projected households
(2016)3
Dwellings (2018)4
Persons per dwelling (2018)5
Barking and Dagenham Outer 211,998 80,240 74,920 2.83
Barnet Outer 392,140 155,111 150,740 2.60
Bexley Outer 247,258 100,095 97,910 2.53
Brent Outer 330,795 124,066 118,710 2.79
Bromley Outer 331,096 140,429 138,980 2.38
Camden Inner 262,226 114,142 104770 2.50
City of London Inner 8,706 4,375 6,450 1.35
Croydon Outer 385,346 160,141 159,470 2.42
Ealing Outer 341,982 132,984 133,550 2.56
Enfield Outer 333,869 133,099 125,760 2.65
Greenwich Outer 286,186 117,784 112,880 2.54
Hackney Inner 279,665 119,971 110,040 2.54
Hammersmith and Fulham Inner 185,426 84,390 88,140 2.10
Haringey Inner 270,624 115,469 108,820 2.49
Harrow Outer 250,149 91,991 90,680 2.76
Havering Outer 257,810 104,878 101,990 2.53
Hillingdon Outer 304,824 113,272 109,780 2.78
Hounslow Outer 270,782 106,207 100,740 2.69
Islington Inner 239,142 107,680 102,820 2.33
Kensington and Chelsea Inner 156,197 79,544 87,610 1.78
Kingston upon Thames Outer 175,470 70,397 67,140 2.61
Lambeth Inner 325,917 144,051 140,290 2.32
Lewisham Inner 303,536 132,149 126,490 2.40
Merton Outer 206,186 84,208 84,300 2.45
Newham Inner 352,005 127,633 114,470 3.08
Redbridge Outer 303,858 113,193 103,920 2.92
Richmond upon Thames Outer 196,904 84,874 85,140 2.31
Southwark Inner 317,256 136,756 132,970 2.39
Sutton Outer 204,525 85,537 82,980 2.46
Tower Hamlets Inner 317,705 131,247 120,020 2.65
Waltham Forest Outer 276,700 108,119 103,030 2.69
Wandsworth Inner 326,474 140,475 146,160 2.23
Westminster Inner 255,324 121,267 124,510 2.05
London 8,908,081 3,665,774 3,556,180 2.50
2 ONS, Mid-year population estimates, 2018 3 GLA, Population household projections: central trend (households, 2017-based), 2018 4 MHCLG, Live table 100: number of dwellings by tenure and district 5 Population (2018) divided by Dwellings (2018).

HOUSING IN LONDON 2019 14
Table 2: Housing stock and new homes
Borough
Sector
Growth in dwelling
stock (2008 to 2018)6
Affordable dwelling
stock (2018)7
Houses as percentage of
total stock (2018)8
Net new homes
(2017/18)9
Barking and Dagenham Outer 6.2% 22,910 68% 413
Barnet Outer 10.3% 18,770 52% 2,208
Bexley Outer 4.1% 13,970 74% 277
Brent Outer 8.9% 26,290 42% 694
Bromley Outer 4.4% 19,020 68% 554
Camden Inner 7.4% 34,770 12% 945
City of London Inner 19.0% 670 1% 138
Croydon Outer 10.1% 26,580 60% 2,076
Ealing Outer 6.4% 23,600 50% 1,457
Enfield Outer 4.8% 18,750 60% 386
Greenwich Outer 10.4% 35,510 48% 1,901
Hackney Inner 13.1% 45,530 18% 1,267
Hammersmith and Fulham Inner 9.5% 25,500 24% 1,531
Haringey Inner 7.8% 27,030 38% 1,200
Harrow Outer 7.3% 9,070 65% 700
Havering Outer 4.6% 14,230 75% 277
Hillingdon Outer 7.6% 17,520 69% 842
Hounslow Outer 7.1% 21,380 54% 911
Islington Inner 11.3% 40,910 15% 367
Kensington and Chelsea Inner 3.6% 19,710 15% 335
Kingston upon Thames Outer 3.6% 7,400 60% 217
Lambeth Inner 9.6% 48,360 24% 1,543
Lewisham Inner 10.6% 37,210 40% 526
Merton Outer 4.5% 11,510 60% 648
Newham Inner 14.6% 30,110 47% 1,846
Redbridge Outer 4.6% 9,360 66% 462
Richmond upon Thames Outer 4.5% 9,940 58% 382
Southwark Inner 12.5% 55,600 20% 818
Sutton Outer 4.9% 11,790 62% 697
Tower Hamlets Inner 23.7% 43,280 11% 2,003
Waltham Forest Outer 7.0% 22,210 54% 712
Wandsworth Inner 12.2% 27,600 30% 2,247
Westminster Inner 9.8% 27,180 9% 1,143
London 8.6% 803,240 44% 31,723
6 GLA analysis of MHCLG, Live table 125: dwelling stock estimates by local authority district 7 MHCLG, Live table 100: number of dwellings by tenure and district, excluding ‘other public sector’ 8 VOA, Council tax: stock of properties: table CTSOP3.0, November 2018 9 MHCLG, Live table 122: housing supply: net additional dwellings by local authority district

HOUSING IN LONDON 2019 15
Table 3: Rents, house prices and earnings
Borough Sector Average
private rent (2018/19)10
Average house price (Mar 2019)11
Median earnings (2018)12
Price to earnings (2018)13
Barking and Dagenham Outer £1,200 £295,765 £29,274 10.1
Barnet Outer £1,365 £512,636 £35,594 17.3
Bexley Outer £1,100 £335,925 £34,916 11.4
Brent Outer £1,500 £473,162 £30,437 16.3
Bromley Outer £1,225 £436,040 £40,021 14.3
Camden Inner £2,000 £804,551 £41,246 19.4
City of London Inner £2,210 £850,122 n/a 14.3
Croydon Outer £1,100 £364,997 £35,876 11.1
Ealing Outer £1,375 £472,773 £33,154 15.5
Enfield Outer £1,275 £393,237 £31,945 13.6
Greenwich Outer £1,325 £384,385 £35,328 13.0
Hackney Inner £1,712 £564,446 £33,650 15.7
Hammersmith and Fulham Inner £1,690 £702,445 £39,372 19.4
Haringey Inner £1,425 £539,321 £33,338 17.6
Harrow Outer £1,350 £445,570 £35,033 15.4
Havering Outer £1,100 £359,854 £34,178 12.0
Hillingdon Outer £1,200 £410,350 £30,636 13.2
Hounslow Outer £1,300 £396,187 £32,155 11.4
Islington Inner £1,733 £629,885 £44,999 14.5
Kensington and Chelsea Inner £2,427 £1,226,771 n/a 44.5
Kingston upon Thames Outer £1,300 £472,873 £38,009 16.1
Lambeth Inner £1,600 £496,283 £38,009 14.5
Lewisham Inner £1,275 £403,327 £33,499 13.9
Merton Outer £1,400 £509,889 £37,026 15.4
Newham Inner £1,400 £364,996 £31,017 13.4
Redbridge Outer £1,250 £407,600 £33,613 15.7
Richmond upon Thames Outer £1,600 £654,404 £42,982 18.8
Southwark Inner £1,525 £476,597 £36,366 13.9
Sutton Outer £1,100 £372,888 £35,617 13.1
Tower Hamlets Inner £1,647 £430,892 £38,307 9.8
Waltham Forest Outer £1,295 £431,563 £33,060 14.9
Wandsworth Inner £1,650 £563,549 £41,668 18.1
Westminster Inner £2,275 £936,598 £44,711 24.4
London £1,495 £461,856 £35,716 12.3
10 VOA, Private rental market summary statistics: table 2.7, 2018/19 11 ONS, House Price Index, March 2019. This figure is adjusted for the mix of dwellings sold. 12 ONS, Annual Survey of Hours and Earnings: table 8.7, 2018. Median full-time, residence-based earnings. 13 ONS, House price to workplace-based earnings ratio: table 5c, 2018. This uses a different measure of earnings and the median house price is not adjusted for the mix of homes sold, so is not comparable to the figures in the table above.

HOUSING IN LONDON 2019 16
1. Historical background
London’s population has reached a new peak, after growing by 83,000 between 2017 and
2018 (1.1). There are now slightly more homes than households in London, in stark contrast
to the first half of the 20th century (1.2). The number of people for every home in London
increased between 1995 and 2015, but has stabilised in the last few years as the rate of
housing growth has caught up with population growth (1.3).
The private rented sector, once the largest tenure in London, expanded rapidly in the first
decade of the 21st century and has stabilised in recent years (1.4). Meanwhile, the proportion
of Londoners who own their own homes has decreased and this decline in homeownership
rates is particularly acute amongst young Londoners (1.5).
The number of homes built in London in 2018 is still far below historic peaks of the 1930s and
1970s (1.6). However, since 2001, London’s housing stock has grown faster than during the
post-war decades due to fewer demolitions and more conversions (1.7). The annual targets
for new housing in London have increased with each of the last four London Plans (1.8).
Public concern over housing remains high in London, although has fallen from the peak of
2016 due to concerns over the UK’s relationship with the EU and the NHS taking precedence,
and increasing concerns around pollution and the environment (1.9). Around 60% of
Londoners now say they would support new homes being built in their area, up from just over
one third in 2010 (1.10).

HOUSING IN LONDON 2019 17
1.1. London’s population rose to a record 8.9 million in mid-2018, with rapid growth over the last
decade in both Inner and Outer London
• The trend in London's population can be broken into three
distinct periods: first, over a century of rapid expansion
from a population of just over one million people in 1801
to 8.6 million in 1939; a half-century of decline to 6.7
million in 1988; and a new period of thus far uninterrupted
growth that brought the total population to 8.9 million in
2018.
• The population grew by 83,000 between 2017 and 2018,
up from 55,000 the previous year but below the average
growth of 114,000 over the previous decade.
• Growth over the last decade was particularly rapid in Inner
London, which saw an increase of 17% compared to 12% in
Outer London. GLA projections anticipate a further
increase of 1.9 million people between 2018 and 2041,
which would leave London’s population at 10.8 million.
Source and notes:
- 1801-1961: Persons present on
Census day (ONS)
- 1961-2018: Estimated mid-year
resident population (ONS)
- 2015-2041: GLA 2016 based
population projections – central
scenario
- The GLA projections are
‘unconstrained’ by housing supply: if
enough new housing is not built,
population growth may well be lower
London total
1939 - 8.6m 2018 - 8.9m
Inner London
Outer London
0
2
4
6
8
10
12
Po
pu
lati
on
(m
illi
on
s)
Historic and projected London population, 1801 to 2041

HOUSING IN LONDON 2019 18
1.2. There are now slightly more homes than households in London, in stark contrast to the first half
of the 20th century
• At the beginning of the 20th century there were around
1.5 million households in London living in around one
million dwellings, indicating very high levels of sharing and
overcrowding. The numbers of both households and homes
grew over the subsequent decades, and the aggregate
deficit was only eliminated when household growth came
to a halt after the Second World War.
• By the 1970s there were finally more homes than
households in London, but the resumption of growth in the
number of households (driven primarily by rapid population
growth) then saw the ‘surplus’ narrow to around 90,000
homes by 2011.
• Between 2011 and 2018, the number of homes in London
grew by around 200,000 to reach 3.56 million. The change
in the number of households will not be known with any
precision until the 2021 Census – an estimate of 3.49
million from the Family Resources Survey is used here.
Source and notes:
- 1901 to 1931 from ‘London: The
Heartless City’ (1977) by David
Richards and David Wilcox
- 1951 and 1961 from the Holland
Report on Housing in Greater London
- 1971 to 2011 from Census data
- 2011 to 2018 from MHCLG live
table 125 and the Family Resources
Survey
- Census definitions of households
and dwellings have changed over
time, as has the population base
Households
Dwellings
0.0 m
0.5 m
1.0 m
1.5 m
2.0 m
2.5 m
3.0 m
3.5 m
4.0 m
1900 1920 1940 1960 1980 2000 2020
Estimated numbers of dwellings and households in Greater London, 1901 to 2018

HOUSING IN LONDON 2019 19
1.3. After a decade of increases, the estimated number of people per home in London has stabilised in
the last few years as the rate of housing growth has caught up with population growth
• In 1971 there were 2.9 people for each dwelling in both
London and England. Over the next two decades the
number of people per dwelling fell across the country but
particularly in London, due to a combination of population
decline and ongoing house building.
• But starting in the early 1990s new house building in
London fell behind population growth, and the estimated
number of people per dwelling rose from 2.35 in 1991 to
2.52 in 2016. Over the same period the number of people
per dwelling fell in every other region of England.
• The number of people per dwelling in London fell slightly
to 2.50 in 2017 and remained at this level in 2018 as
housing growth kept pace with population growth.
Source and notes:
Compiled by GLA from:
- ONS mid-year population estimates;
- MHCLG dwelling stock data (tables
104, 109 and 215)
- GLA historical Census tables
2.00
2.10
2.20
2.30
2.40
2.50
2.60
2.70
2.80
2.90
3.00
1970 1980 1990 2000 2010 2020
Estimated number of people per dwelling in England, London and other regions, 1971-2018
England
London
Other regions

HOUSING IN LONDON 2019 20
1.4. Around 52% of households in London own their home, either outright or with a mortgage, whilst
48% households rent their home
• London’s tenure mix underwent a dramatic change in the
first decade of the 21st century; the proportion of
households that own their home with a mortgage fell from
38% in 2000 to 29% in 2011, while the proportion that
rent on the open market rose from 15% to 25%.
• In 2018, 52% of households in London owned their homes,
including 23% who owned their home outright and 29%
who owned their home with a mortgage.
• Conversely, 27% of households rented their homes on the
open market and 21% were in social rented housing,
including Affordable Rent housing.
• 2018 marks the second consecutive year that social rented
tenants were the smallest tenure group, after being the
largest tenure group in the early 1980s.
Source and notes:
Compiled by GLA from:
- Housing Trailers to the Labour Force
Survey (1981, 1984, 1988 and 1991,
with intervening years interpolated)
- Labour Force Survey data (1990,
1992 to 1996 and 2009 to 2018)
- MHCLG analysis of Labour Force
Survey data (1997 to 2018)
Owned outright
Owned with mortgage
Social rented
Open market rented
%
5%
10%
15%
20%
25%
30%
35%
40%
45%
Pe
rce
nta
ge
of
all
ho
use
ho
lds
Annual trend in household tenure, London, 1981 to 2018

HOUSING IN LONDON 2019 21
1.5. Home ownership rates among younger Londoners have fallen sharply in recent decades, though
seem to have stabilised in the last couple of years
• London’s home ownership rate has fallen in recent
decades, but there are stark differences in the trends for
different age groups. In 1990, 25% of households in
London were headed by someone aged 16-24 and 57% of
households headed by someone aged 25-34 owned their
home. However, by 2018 these figures had fallen to 7%
and 34% respectively.
• Home ownership rates also fell for households headed by
someone aged 35-44 (from 69% to 48%) and 45-54 (71%
to 57%). The proportion of households headed by
someone 65 or older that owned their own home rose
relatively steadily from 49% in 1990 to 69% in 2017.
• In the last two years, there are signs of stabilising home
ownership rates for the youngest households, and an
increase for those with heads aged 25-34.
Source and notes:
- Labour Force Survey household
datasets, 1990 to 2018

HOUSING IN LONDON 2019 22
1.6. House building has grown in London in the last two decades, without yet reaching the levels seen
in the 1930s and the post-war decades
• In 2018, MHCLG’s house building statistics recorded
18,410 new build completions, down from a figure of
27,190 in 2017 that was the highest since 1977.
• The gross number of homes built doubled between 1997
and 2017, but still did not reach the historic peaks of the
1930s (when new builds averaged 61,500 a year) and the
1970s (averaging 29,400 a year).
• The 1930s boom was dominated by private builders and
the 1960s and 1970s booms were dominated by local
authorities.
• These figures exclude supply from conversions and changes
of use, which are included in other charts later in this
report. They also under-estimate new build supply in more
recent years but are still considered useful as a leading
indicator and for historical comparisons.
Source and notes:
- 1871-1937: Report of the
Commissioner of the Metropolitan
Police
- 1946-1960: GLA estimates based on
national data from 1946-1960
(MHCLG, live table 244), London’s
share of the national total before
World War II (from B. Mitchell, British
Historical Statistics, p. 392), and GLA
and MHCLG data from 1961 onwards
- 1961-1969: Annual Abstracts of
Greater London Statistics
- 1970-2018: MHCLG house building
statistics
0
10,000
20,000
30,000
40,000
50,000
60,000
70,000
80,000
90,000
1871 1891 1911 1931 1951 1971 1991 2011
New build homes in Greater London, 1871 to 2018
Private sector
Housing Association / other public sector
Local Authorities
Total (dashed line indicates figuresestimated from national data)

HOUSING IN LONDON 2019 23
1.7. Since the turn of the millennium the net increase in London’s housing stock has been relatively
rapid, due to large numbers of new homes from conversions and changes of use
• The previous chart showed the gross number of new homes
built in London, but in addition to undercounting supply in
recent years these figures do not take into account other
changes to the stock such as demolitions and conversions.
• An alternative approach is to measure the net change in
housing stock over time. According to this measure the
number of homes in London has grown by 28,300 a year
since 2011, compared to annualised new build completions
of 20,700.
• The net annual change since 2011 is higher than for any
decade since the 1960s. Many new homes were built in the
1960s and 1970s, but this new supply was offset by
demolitions and slum clearance. Conversion of houses into
flats has also added to new supply in recent decades.
Source and notes:
- Gross new homes built from same
sources as Chart 1.7 above
- Net change in dwelling stock from
comparisons of Census estimates for
1961-2011 and MHCLG live tables on
dwelling stock for 2011-18
- The stock growth between 2001 to
2011 may be over-stated due to
under-counts in the 2001 Census.
According to VOA Council Tax
statistics, which include additional
dwellings categories such as student
and care homes, London’s dwelling
stock grew by 25,630 a year between
2001 and 2011
0
5,000
10,000
15,000
20,000
25,000
30,000
35,000
1961-71 1971-81 1981-91 1991-01 2001-11 2011-18
Annualised gross new homes built and net change in dwelling stock in London, by decade, 1961 to 2018
Gross new homes built Net change in dwelling stock

HOUSING IN LONDON 2019 24
1.8. The housing capacities identified in the London Plan have risen over time in line with estimated
capacity, and housing supply has responded
• Since the establishment of the GLA in 2000, successive
London Plans have identified capacity for new housing
supply. The 2004 London Plan identified capacity for
23,000 new homes a year, which then rose to 30,500 in the
2008 Plan, 32,200 in the 2011 Plan, 42,400 in the 2015
Plan, and 64,900 in the draft 2017 Plan.
• The overlaps in the Plan periods shown above demonstrate
that more land capacity has been found in successive
assessments, with net annual housing completions also
trending upwards over the period.
Source and notes:
- Capacities taken from successive
London Plans
- Supply figures from the London
Housing Provision Survey and London
Plan Annual Monitoring Report
- Housing supply includes net
conventional completions, net non-
self-contained completions (including
'C2' units from 2016 onwards) and
from 2005 on the net change in long-
term empty homes. The version of this
chart in the 2018 report used calendar
years but this version uses financial
years for consistency with the London
Plan Annual Monitoring Report
2004 London Plan 2008 London Plan
2011 London Plan
2015 London Plan
2017 draft London Plan
Net housing supply
0
10,000
20,000
30,000
40,000
50,000
60,000
70,000
1997/98 2002/03 2007/08 2012/13 2017/18 2022/23 2027/28
London Plan capacities and net completions, 1997 to 2028

HOUSING IN LONDON 2019 25
1.9. Public concern over housing has fallen in London, partly due to concerns around Europe and the
NHS taking precedence and increasing concerns around pollution and the environment
• The polling company Ipsos MORI has been surveying the
British public since 1974. The survey asks respondents
what they see as important issues facing the country.
• Between 2012 and 2016 the proportion of respondents in
both London and the country as a whole who identified
housing as an important issue increased markedly.
• The number of respondents citing housing as an issue fell
to 18% on average in the six months to March 2019, the
lowest level since 2013.
• This swing is partly attributable to concerns over Europe
and the NHS taking precedence, as well as increasing
concerns around pollution and the environment.
Source and notes:
- Ipsos MORI, Issues Index and
Political Monitor
- The survey base is a sample of
around 1,000 adults in Britain each
month, of which approximately 150
are in London
- Surveys were initially relatively
sporadic, but from the mid-1980s
have been conducted monthly
- A regional breakdown of responses
is available from 2007
%
5%
10%
15%
20%
25%
30%
35%
40%
45%
50%
2000 2002 2004 2006 2008 2010 2012 2014 2016 2018
Pe
rce
nta
ge
of
resp
on
den
ts
Proportion of respondents (in Britain and in London only) identifying housing as one of the most important issues facing the country
Great Britain
London
GB 12 month average
London 12 month average

HOUSING IN LONDON 2019 26
1.10. Around 60% of Londoners say they would support new homes being built in their area, up from
just over one third in 2010
• The proportion of Londoners who say they would support
or ‘strongly’ support new homes being built in their area
has fallen slightly from 67% in 2016 to 62% in 2017 but is
still far higher than the figure of 34% in 2010.
• The proportion who say they would oppose it (including
‘strong’ opposition) also fell, from 47% in 2010 and 18% in
2016 to 13% in 2017. Net support (that is, support minus
opposition) rose from minus 13% in 2010 to plus 49% in
2016 and 2017.
• Support for house building is significantly higher in London
than in England as a whole, where net support was plus
34% in 2017.
• Both in London and across the country as a whole, net
support for house building is highest among social tenants
(plus 57% in London) and private tenants (plus 54%) and
lowest among homeowners (plus 41%).
Source and notes:
- British Social Attitudes Survey 2010
to 2017
0% 25% 50% 75% 100%
2010
2013
2014
2016
2017
Attitudes towards local housebuilding in London, 2010 to 2017
Support strongly Support Neither Oppose Oppose strongly It depends

HOUSING IN LONDON 2019 27
2. Demographic, economic and social trends
In a turnaround from the early part of the 20th century, Inner London's population has been
growing more quickly than Outer London’s since the mid-1990s (2.1). The main drivers of
increased population growth in London are net international migration and natural change
(births minus deaths) whereas net domestic migration has been negative for decades (2.2).
Over the last decade London has seen a net inflow of residents in their 20s from the rest of
the UK and a net outflow of those in their 30s, with net domestic migration of these age
groups negative for the third consecutive year in 2018 (2.3).
Nearly a quarter of young adults in London live with their parents, up from one in six in the
late 1990s (2.4), and more than one in three private renting households in London include
children, up from one in four in 2007 (2.5).
Attitudes to housing vary across the tenures, with only six in ten private tenants in London
satisfied with private renting as a tenure, though over eight in ten are satisfied with the
accommodation itself (2.6). London’s private rented sector accommodates households on a
wide range of incomes, while low income households are concentrated in social housing and
higher income households in owner occupation (2.7). Unsurprisingly, ownership of property is
a major contributor to London’s highly unequal distribution of wealth and, since 2010,
property wealth has become further concentrated among groups with higher incomes (2.9).
Non-UK nationals account for more than half of London’s home building workforce, a far
higher proportion than in other regions (2.9).
London’s housing market generated over £3.6 billion in Stamp Duty receipts in 2017/18,
which is equivalent to two fifths of the England total (2.10). Just as rising house prices have
pulled up the rate of Stamp Duty paid by home buyers, the effective rate of Council Tac has
come down (2.11).
HOUSING IN LONDON 2019 28
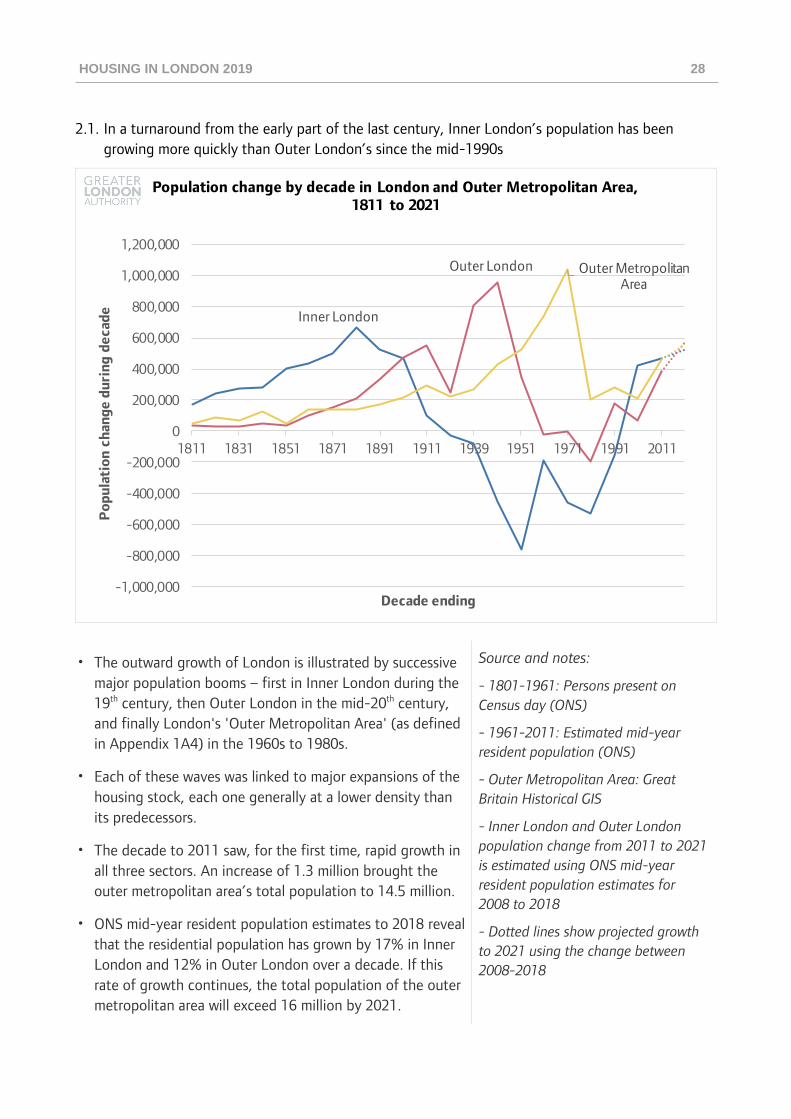
2.1. In a turnaround from the early part of the last century, Inner London’s population has been
growing more quickly than Outer London’s since the mid-1990s
• The outward growth of London is illustrated by successive
major population booms – first in Inner London during the
19th century, then Outer London in the mid-20th century,
and finally London's 'Outer Metropolitan Area' (as defined
in Appendix 1A4) in the 1960s to 1980s.
• Each of these waves was linked to major expansions of the
housing stock, each one generally at a lower density than
its predecessors.
• The decade to 2011 saw, for the first time, rapid growth in
all three sectors. An increase of 1.3 million brought the
outer metropolitan area’s total population to 14.5 million.
• ONS mid-year resident population estimates to 2018 reveal
that the residential population has grown by 17% in Inner
London and 12% in Outer London over a decade. If this
rate of growth continues, the total population of the outer
metropolitan area will exceed 16 million by 2021.
Source and notes:
- 1801-1961: Persons present on
Census day (ONS)
- 1961-2011: Estimated mid-year
resident population (ONS)
- Outer Metropolitan Area: Great
Britain Historical GIS
- Inner London and Outer London
population change from 2011 to 2021
is estimated using ONS mid-year
resident population estimates for
2008 to 2018
- Dotted lines show projected growth
to 2021 using the change between
2008-2018
Inner London
Outer London Outer Metropolitan Area
-1,000,000
-800,000
-600,000
-400,000
-200,000
0
200,000
400,000
600,000
800,000
1,000,000
1,200,000
1811 1831 1851 1871 1891 1911 1939 1951 1971 1991 2011
Po
pu
lati
on
ch
an
ge
du
rin
g d
ecad
e
Decade ending
Population change by decade in London and Outer Metropolitan Area, 1811 to 2021

HOUSING IN LONDON 2019 29
2.2. The main drivers of increased population growth in London are net international migration and
natural change, whilst net domestic migration has remained negative
• London's recent population boom has been driven by
growth in both net international migration and ‘natural
change’, the annual surplus of births over deaths.
• Net international migration has risen from around 50,000 a
year in 1996 to over 112,000 in 2018.
• Natural change was around 40,000 in the late 1990s,
before rising in the 2000s. It has averaged around 80,000
in the last decade and was 73,000 in 2018.
• Net international migration has also contributed to the
increase in natural change, because its net impact has been
to increase the number of young adults in London.
• Net domestic migration is less volatile and more cyclical
than net international migration and has been negative
throughout the last 20 years. The net outflow in 2018 was
103,000.
Source and notes:
- GLA, Demographics analysis of ONS
mid-year estimates
Natural change
Net Domestic migration
Net International migration
-150,000
-100,000
-50,000
0
50,000
100,000
150,000
Year to mid-
Components of London's population change, 1996 to 2018

HOUSING IN LONDON 2019 30
2.3. Over the last decade, London has seen a net inflow of residents in their 20s from the rest of the
UK and a net outflow of those in their 30s
• For many years, London has been central to the system of
domestic migration flows around the UK. London’s
population stock has been characterised by large net
domestic inflows of 20-somethings and domestic outflows
of those in their 30s. These net flows are themselves the
aggregate of much larger gross flows in and out.
• Since 2009, the net domestic outflow of those in their 30s
has increased from 16,200 to 38,500 in the year to mid-
2018, which is on par with the 2004 peak. The net
domestic inflow of those in their 20s has remained steadily
above 30,000 during that period, reaching 35,900 in 2018.
• The total net inflow of 20-39 year olds in the year to mid-
2018 was negative (-2,600), the third consecutive year
where there has been a total net domestic migration
outflow of these age groups.
Source and notes:
- ONS, data on domestic migration
20s
30s
Both
-50,000
-40,000
-30,000
-20,000
-10,000
0
10,000
20,000
30,000
40,000
50,000
2002 2004 2006 2008 2010 2012 2014 2016 2018
Nu
mb
er
of
pe
op
le
Year to mid-
Net domestic migration to London by those in their 20s and those in their 30s, 2002 to 2018

HOUSING IN LONDON 2019 31
2.4. Nearly a quarter of young adults in London live with their parents, although the increase seen
earlier in the decade has levelled off
• 23% of young adults (those aged 20 to 34) in London live
with their parents. The proportion living with their parents
has risen from 17% in the late 1990s, with a particularly
rapid rise seen in the early 2010s.
• The share of young adults living with their parents is lower
in London than across England as a whole, probably due to
the substantial number of young Londoners who came here
from other regions or countries. 26% of young adults in
England live with their parents, up from 20% in the late
1990s.
Source and notes:
- ONS analysis of Labour Force Survey
for 1996-1998 to 2011-13
- GLA analysis of Labour Force Survey
for 2012-14 to 2016-18
- Three-year averages are used to
create a smoother series
- Figures exclude anyone living in
student halls of residence
17%
London
23%20%
UK
26%
0%
30%
Share of people aged 20-34 living with their parents, London and UK, 1996-98 to 2016-18

HOUSING IN LONDON 2019 32
2.5. One in three private renting households in London include children, up from one in five in 2004
• 35% of all households in London include dependent
children aged under 19, a figure that hasn't changed much
since 2004. The share of households with children has
varied little since 2007 for households that own their home
outright (13% in 2004, 14% in 2018), but has risen slightly
for households that are buying with a mortgage (from 44%
in 2004 to 49% in 2018) and fallen slightly for social
renting households (from 43% to 39%).
• The most dramatic change over this period has been the
substantial growth in the proportion of privately renting
households with children, from 20% in 2004 to 34% in
2018.
• In numerical terms, there are now around 300,000 privately
renting households with children in London, compared to
100,000 in 2004.
Source and notes:
- Labour Force Survey household data
- These figures include any
households containing dependent
children under 19
Owned outright
Buying with mortgage
Social rent
Private rent
0%
10%
20%
30%
40%
50%
60%
2004 2006 2008 2010 2012 2014 2016 2018
Pro
po
rtio
n o
f h
ou
se
ho
lds in
each
te
nu
re
Proportion of households in London with dependent children by tenure, 2004 to 2018

HOUSING IN LONDON 2019 33
2.6. Only six in ten private tenants in London are satisfied with private renting as a tenure, though
eight in ten are satisfied with the accommodation itself
• Owner occupiers in London are predominantly satisfied
with their accommodation and with homeownership in
general (95% and 97% satisfied respectively).
• Satisfaction levels are lower for social tenants, of whom
72% are satisfied with their accommodation and 75% are
satisfied with social renting as a tenure.
• The most striking pattern is among private rent tenants, of
whom 83% are satisfied with their accommodation but only
63% are satisfied with renting privately. This disparity may
be driven in part by frustrated aspirations to
homeownership or by insecure tenancies.
• Across all tenures, 86% of households are satisfied with
their accommodation and 82% with their tenure. These
measures have changed little over the last five years.
Source and notes:
- English Housing Survey data,
2016/17
0%
25%
50%
75%
100%
Owner occupied Social rented Private rented All tenures
Pro
po
rtio
n o
f h
ou
se
ho
lds
Satisfaction with accommodation and tenure, London, 2016/17
Satisfied with accommodation Satisfied with tenure

HOUSING IN LONDON 2019 34
2.7. London’s private rented sector accommodates households on a wide range of incomes, while low
income households are primarily concentrated in social rented housing
• Compared to England, London has a relatively unequal
distribution of household income, with 29% of London
households in the top fifth of national household incomes
and 20% in the poorest fifth.
• There are large differences in the income distribution of
households in social rented accommodation and owner
occupiers. 46% of London social tenants are in the bottom
fifth of the national household income distribution and
only 11% are in the top two fifths.
• In contrast, 64% of owner occupiers and 43% of private
tenants are in the top two fifths of the national household
income distribution. Only 11% of London homeowners are
in the bottom fifth.
• Private renting households in London are spread quite
evenly throughout the national income distribution but are
slightly under-represented in the lower fifth.
Source and notes:
- English Housing Survey data,
2017/18
- The income definition used is EHS
Basic Income, which refers to the
annual net income of the Household
Reference Person and any partner
from wages, pensions, other private
sources, savings and state benefits,
after tax and national insurance but
excluding any housing related benefits
or allowances
- Owner occupation includes
households who either own their home
outright or with a mortgage. It also
includes shared ownership
0
0.05
0.1
0.15
0.2
0.25
0.3
Lowest 20% Quintile 2 Quintile 3 Quintile 4 Highest 20%
Pe
rce
nta
ge
of
ho
use
ho
lds in
Lo
nd
on
Quintile of national household income distribution
National household income quintile by tenure, London, 2017/18
Owner occupied
Social rent
Private rent

HOUSING IN LONDON 2019 35
2.8. Between 2010 and 2016 average property wealth in London increased the most for households
that already had the most property wealth and the highest incomes
• It is increasingly the case in London that households with
the highest incomes also have the greatest property wealth.
The average household in each of the four lowest income
deciles had no property wealth at all in 2014-16.
• In 2010-12 those in the fifth income decile, just below
median household income, had average property wealth of
£75,000; in 2014-16 this had fallen to just £8,000. The
fifth income decile was the only group that experienced a
decline in property wealth between 2010 and 2016.
• At the other end of the distribution, households in the top
income decile, who already had the highest average wealth
levels, saw their average property wealth rise from
£350,000 in 2010-12 to £650,000 in 2014-16, the largest
proportionate increase in wealth (+86%) witnessed by any
income decile group.
Source and notes:
- ONS analysis of Wealth and Assets
Survey
- This chart shows median household
net property wealth for each income
decile. Therefore, it is not the case
that no household in the lowest four
deciles has any property wealth.
Rather, it shows that most households
in these deciles do not have any
property wealth
- Negative net property wealth is
reflected in these figures, for example,
where a property is mortgaged
0
100,000
200,000
300,000
400,000
500,000
600,000
700,000
Decile10
Decile 9Decile 8Decile 7Decile 6Decile 5Decile 4Decile 3Decile 2Decile 1(Lowest)
Me
dia
n h
ou
se
ho
ld n
et
pro
pe
rty
we
alt
h (
£)
Total household net equivalised income decile
Median property wealth, by total household net equivalised income decile, London, 2010-12 to 2014-16
July 2014 to June 2016
July 2012 to June 2014
July 2010 to June 2012

HOUSING IN LONDON 2019 36
2.9. Non-UK nationals account for more than half of London’s home building workforce, a far higher
proportion than in other regions
• In autumn 2017 the HBF and its members surveyed the
home building workforce on over 1,000 construction sites
around the country, gathering responses from around
37,000 workers.
• The survey found that overseas nationals accounted for
more than half of London's home building workforce, a far
higher proportion than in any other region. 50% of
London's home building workforce was from EU countries
and another 7% from other countries outside the EU.
• The survey also found that 42% of EU-national workers in
London had been in the UK for less than three years, and
that 7% were not planning to stay in the UK industry
indefinitely (the same proportion as UK nationals).
Source and notes:
- Home Builders Federation, Home
Building Workforce Census 2017
- Previous editions of Housing in
London reported the proportion of
London’s overall construction
workforce that was born overseas,
including those working in areas
unrelated to housing
0%
10%
20%
30%
40%
50%
60%
London South East East ofEngland
South West North East Midlands North West Yorkshireand
Humber
Non-UK nationals as a share of home building workforce by region and country, 2017
Non-EU
EU

HOUSING IN LONDON 2019 37
2.10. London's housing market generated over £3.6 billion in Stamp Duty receipts last year, which is
equivalent to two fifths of the England total
• In 2017/18 Stamp Duty receipts from purchases of homes
in London generated £3.6 billion for the national
exchequer, which is the highest level of Stamp Duty
receipts recorded, even after adjusting for inflation.
• Stamp Duty receipts in London have increased in the last
decade due to a combination of higher prices and a higher
effective tax rate (see next chart), with Londoners
consistently paying higher rates due to the nationally-set
thresholds and rates.
• London's share of the total national receipts fell from 47%
in 2015/16 to 40% in 2017/18, partly due to faster price
growth and higher transaction levels in other regions.
Source and notes:
- 1996/97 to 2017/18 figures from
HMRC UK Stamp Tax statistics
- 1988/89 to 1995/96 from 1999/00
UK Housing Review
- Historic prices have been adjusted
for inflation using the official GDP
deflators as at March 2019
0.0%
12.5%
25.0%
37.5%
50.0%
£0bn
£1bn
£2bn
£3bn
£4bn
Residential Stamp Duty receipts in London, 1988/89 to 2017/18 (2017/18 prices)
London residential Stamp Duty receipts, 2017/18 prices
% of England total (right axis)

HOUSING IN LONDON 2019 38
2.11. The rise of house prices in London has pushed down the effective rate of Council Tax and pulled
up the rate of Stamp Duty paid by home buyers
• The progressive design of Stamp Duty means that
purchasers of higher-priced properties pay a higher rate of
tax, so the long-term increase in London house prices has
driven an even greater rise in Stamp Duty receipts (see
previous chart). The average Stamp Duty bill in London was
£29,080 in 2017/18, equivalent to 5.0% of the simple
average London house price (up from 0.9% in 1997/98).
• By contrast, Council Tax bills are higher relative to property
value for cheaper homes, and Council Tax valuations have
not changed since 1991. The average Council Tax bill in
London was £1,120 in 2017/18, equivalent to 0.2% of
average house prices, down from 0.5% in 1997/98.
Source and notes:
Calculated by GLA from:
- HMRC Stamp Duty statistics
- MHCLG Council Tax statistics
- ONS House price statistics for small
areas
Average annual Council Tax as % of average house price (left axis)
Average Stamp Duty receipt per sale, as % of average house price (right axis)
0%
1%
2%
3%
4%
5%
6%
0.0%
0.1%
0.2%
0.3%
0.4%
0.5%
0.6%
Average Council Tax and Stamp Duty as % of average house price, London, 1996/97 to 2017/18

HOUSING IN LONDON 2019 39
3. Housing supply and empty homes
In the last two decades, the number of jobs in London has grown by 45% and the number of
people by 27%, but the number of homes by only 18% (3.1). According to provisional
estimates there were 31,850 net conventional new housing completions in London in
2017/18, which is 21% below the number of completions recorded in 2016/17 but still above
the annual completions recorded in the decade prior to 2014/15 (3.3).
There are important differences in the housing supply definitions used and quality of data
within new house building datasets (3.4) and it is necessary to consider each in the round.
New housing starts provide an indication of the housing supply pipeline, however, recent
figures show new build starts have continued to fall from their peak in 2015 (3.4).
At local authority level, the London borough of Tower Hamlets has seen the fastest growth in
its housing stock in the country in the last ten years (3.5). A net 107,800 new homes were
completed in London in the last three years, with both total supply and tenure splits varying
widely at borough level (3.6). Over this period, London’s housing stock grew fastest in the
Royal Docks area and in London town centres such as Elephant and Castle, Croydon and
Wembley (3.7).
Around a fifth of new homes built in 2017/18 had three or more bedrooms, up from 15% in
2008/09 (3.8). Homes built in London in the last four years have an average floor area of
77m2, smaller than surviving pre-war homes but larger than those built between the 1940s
and 1980s (3.9). An increasing proportion of new London houses are leasehold (3.10),
although overall numbers remain low due to the small number of new houses built in London.
Planning approval was granted for around 65,000 new homes in 2017/18 (3.11). A total of
42,760 homes were determined and recommended for approval by the Mayor in 2018, of
which one third were affordable (3.12).
Schemes of 500 units or more comprise 44% of London's pipeline of new homes, however, the
proportion of schemes of 250 units or more has fallen in recent years (3.13). The majority of
new homes in tall buildings that are either under construction or are proposed are
concentrated in just four boroughs (3.14).
In the past decade, 29,550 Build to Rent (BTR) homes have started construction and 17,490
have been completed (3.16). There are now around one hundred established community-led
housing projects in London, with dozens more at various stages of development (Error! R
eference source not found.).
14,540 new GLA-funded affordable homes were started in 2018/19, which is the highest level
of starts funded through GLA programmes since 2012/13 (3.17). Councils in London started
over 1,900 new homes in 2018/19, the highest figure since the mid-1980s (3.18). However,
only 7,131 new GLA-funded affordable homes were completed in 2017/18 which, although
showing a slight increase from 2016/17, is still low by the standards of the last decade (3.19).

HOUSING IN LONDON 2019 40
In the last year, conversions of existing social rented homes into more expensive Affordable
Rent homes have all but stopped (3.20). Steep price discounts have increased the number of
London council homes sold to tenants through the Right to Buy (RTB) in recent years, but not
to the levels seen in the 1980s (3.21). The total stock of affordable homes in London in 2018
(excluding shared ownership) was 803,200, a total which has changed little over recent years,
as new additions to the stock are balanced by demolitions and sales out of the sector (3.22).
The number of recorded empty homes in London is far below its long-term average, at 1.9%
of total stock (3.22). There were 45,980 properties recorded as second homes for tax
purposes in 2018, 62% of which are in just five boroughs (3.24).

HOUSING IN LONDON 2019 41
3.1. Since 1997, the number of jobs in London has grown by 45% and the number of people by 27%,
but the number of homes by only 18%
• Since 1997, London’s population and economy have grown
rapidly, although the trend in jobs is far more cyclical.
Between 1997 and 2018, the number of jobs in London
grew by 1.87 million (45%) while the population grew by
1.89 million (27%).
• However, this rapid economic and demographic growth was
not matched by an increase in the housing stock, which
grew by only 530,000 homes (18%) over the same period.
If the housing stock had grown at the same rate as the
population since 1997 there would now be an extra
287,000 homes in London today.
• In 2017 the housing stock grew faster than the population
(1.1% versus 0.6%) for the first time since 2004, while in
2018 they both grew at the same rate of 0.9%.
Source and notes:
- Compiled by GLA from:
- Jobs: ONS, Workforce jobs by
industry, seasonally adjusted
- People: ONS, Mid-year estimates
- Homes: Stock levels from MHCLG
live table 125

HOUSING IN LONDON 2019 42
3.2. According to provisional estimates from GLA data sources, there were 31,850 net conventional
new housing completions in London in 2017/18, a 21% decrease on the previous year…
• The London Development Database (LDD) estimate of the
net number of new homes completed in London in
2017/18 was 31,850, which is 21% fewer than 2016/17
but above the long-term average.
• Since the dip in house building in 2010/11, increases in the
total number of completions have been driven entirely by
growth in market housing completions, moving from
12,480 in 2010/11 to 27,150 in 2017/18.
• Over the same period, the number of affordable homes
completed fell from 7,314 in 2010/11 to a low of 4,703 in
2017/18. Affordable homes comprised 15% of net
conventional housing completions in 2017/18, down from
41% in 2011/12.
• Within the affordable housing category, the most notable
change was the fall in social rented housing completions
from a high of 6,156 in 2011/12 to 433 in 2017/18.
Source and notes:
- GLA Annual Monitoring Report 15
- Data for 2017/18 is provisional
based on LDD estimates
- GLA net conventional completions
figures include new building,
conversions and changes of use
- There were no completions of
London Affordable Rent homes
recorded on the LDD in 2017/18
- As the LDD is continually updated,
these figures do not exactly match
those published in past GLA London
Plan Annual Monitoring Reports, or
past Housing in London reports
0
5,000
10,000
15,000
20,000
25,000
30,000
35,000
40,000
45,000
Net conventional housing completions by tenure, London, 2004/05 to 2017/18
Social Rent
Affordable Rent
Intermediate
Market
Unknown

HOUSING IN LONDON 2019 43
3.3. …but it is important to be note the differences between the definition and coverage of the
various house building datasets
• There are significant differences between the main sources
of statistics on housebuilding in London.
• The quarterly data released by MHCLG on ‘new build
dwellings’ does not count new homes created through
conversions and changes of use of existing properties.
• The quarterly MHCLG data is also believed to undercount
the number of new build homes (see notes to the right).
• Analysts increasingly use MHCLG data on Energy
Performance Certificates (EPCs) to track the number of
new dwellings. As seen above, this data has largely tracked
the LDD net conventional completions data count over
recent years, and after a dip in 2017/18 rose to around
41,700 in 2018/19.
Source and notes:
- GLA LDD 2017/18
- MHCLG EPCs (table NB7)
- MCHLG new build (table 255a)
- The MHCLG undercount is believed
to be partly due to a reduced market
share of the National House-Building
Council (NHBC), who provide the bulk
of this data to MHCLG
MHCLG EPCs (annualised)
LDD net completions
0
5,000
10,000
15,000
20,000
25,000
30,000
35,000
40,000
45,000
Nu
mb
er
of
ne
w h
om
es
New housing completions in London: comparison of various housebuilding datasets, 2010 to 2019
MHCLG new build dwellings

HOUSING IN LONDON 2019 44
3.4. MHCLG figures show new build housing starts in London were down in 2018/19
• Quarterly data on conventional new build housing starts in
London suggests the number of housing starts in 2018/19
(14,140) was at the lowest level since 2009/10.
• Private developers started construction on 23% fewer
homes in 2018/19 than in 2017/18, and public sector
house building was down 36%.
• The slowdown in public sector house building is primarily
driven by a reduction in housing association starts. There
were 970 local authority starts in 2018/19, which is a 29%
increase on 2017/18.
• The MHCLG statistics are believed to undercount the
number of new homes started. See notes to Chart 3.4.
Source and notes:
- MHCLG House building statistics
- MHCLG statistics count new build
starts only and exclude supply from
the ‘non-conventional completions’
statistics reported in the previous
chart. They are also collected from a
different source: NHBC building
control inspectors, rather than local
planning departments
- In this dataset, affordable homes
secured through planning obligations
are attributed to private developers. In
GLA LDD statistics, affordable housing
is attributed to the housing providers
who purchase and manage them
0
5,000
10,000
15,000
20,000
25,000
30,000
2000 2002 2004 2006 2008 2010 2012 2014 2016 2018
Annualised new house building starts in London by type of provider, 2000 to 2019
Local authority Housing association Private

HOUSING IN LONDON 2019 45
3.5. At local authority level, the London borough of Tower Hamlets has seen the fastest growth in its
housing stock over the last ten years, followed by Uttlesford in Essex
• The local authority with the fastest growth in its housing
stock between 2008 and 2018 was Tower Hamlets, which
saw a 24% increase in homes in the last ten years. The next
fastest growing local authorities were Uttlesford (18%) and
Corby (17%).
• At the other end of the scale, Pendle’s housing stock grew
the least out of any English local authority (1.1%) over the
ten-year period. Barrow-in-Furness and Blackpool, also
both in the North, were the next slowest at 1.7% and 1.9%
respectively.
• After Tower Hamlets, the fastest growing London boroughs
were Newham and Hackney at 15% and 13%, respectively.
The slowest-growing London boroughs were Kensington
and Chelsea and Kingston upon Thames (both 3.6%)
followed by Bexley (4.1%).
Source and notes:
- MHCLG live table 125: dwelling
stock estimates by local authority
district
- City of London has been excluded
due to low levels of residential
dwellings
- Dwelling stock estimates count
owner-occupied, private rented sector,
local authority housing and housing
association dwellings
- Table 1 and table 2 of the key
statistics provides figures for the total
number of dwellings and growth in
dwelling stock to 2018, for London
and at local authority level
North
Chorley
Midlands
CorbyUttlesford
London
Tower Hamlets
0%
5%
10%
15%
20%
25%
Percentage increase in dwelling stock by local authority, 2008 to 2018
Newham
Rest of South

HOUSING IN LONDON 2019 46
3.6. A net 107,760 new homes were completed in London in the last three years, with both total
supply and tenure mix varying widely at borough level
• Over the last three years (2015/16 to 2017/18) a net
107,760 new homes were completed in London, of which
89,150 (83%) were market homes. 8,858 (8%) new homes
were intermediate tenure, 6,064 (6%) were Affordable
Rent and the remaining 3,693 (3%) were social rent.
• At borough level the highest numbers of completions over
the last three years were in Tower Hamlets (8,743),
Wandsworth (7,259) and Croydon (6,950). More homes
were completed in these boroughs than in the 14 boroughs
with the lowest number of completions combined.
• The chart above also shows the tenure split of completions
in each borough. Over this period the highest proportion of
new affordable housing was in Waltham Forest (42%),
followed by Barking and Dagenham (36%) and Tower
Hamlets (30%). The lowest was in Bexley, Bromley, City of
London, Harrow and Sutton (all below 5%).
Source and notes:
- GLA Annual Monitoring Report 15
- Data for 2017/18 is provisional
based on LDD estimates
- To ensure legibility the chart does
not show net losses of social rented
housing in six boroughs: Bexley, Brent,
Enfield, Harrow, Lambeth and Sutton
- Boroughs are ordered along the x
axis from left to right, with boroughs
on the left comprising those with the
highest percentage of affordable
completions and boroughs on the
right comprising those with the lowest
percentage of affordable housing
completions
0
1,000
2,000
3,000
4,000
5,000
6,000
7,000
8,000
9,000
10,000
Net conventional completions by borough and tenure, 2015/16 to 2017/18
Affordable Rent Social rent Intermediate Market

HOUSING IN LONDON 2019 47
3.7. Between 2016 and 2019 the greatest concentrations of new homes were in the Royal Docks area,
Elephant and Castle and Croydon
• Between January 2016 and May 2019 there were just over
126,000 Energy Performance Statistics registered for new
homes in London. This map shows their distribution across
London, with the shading indicating the number of new
homes within a 2km radius of each point in London.
• The greatest concentration of new homes in this period was
in the Royal Docks area, where around 4,000 new homes
were completed within 2km of a point just west of the
Royal Victoria Dock.
• Other major concentrations of new homes were found
around Elephant and Castle, central Croydon and Wembley.
Source and notes:
- Energy Performance Certificate
records from MHCLG Open Data
Communities
- Darker shades represent higher
densities of new homes within a 2km
radius, and the contour lines delineate
intervals of 200

HOUSING IN LONDON 2019 48
3.8. Around one fifth of new homes built in 2017/18 had three or more bedrooms, up from 15% in
2008/09
• The proportion of new homes with three or more bedrooms
(the usual definition of 'family sized') in London rose to
over a third of gross conventional housing completions at
the turn of the century, but fell rapidly through the 2000s
as the share of flats in new supply increased.
• With the end of the housing boom and the associated
credit crunch in 2008/09, speculative investment in new
flatted developments fell back. This led the proportion of
family sized homes to rise again, reaching 24% in 2011/12
before falling to 20% in 2015/16, where it has remained.
• In absolute terms, while in 2016/17 the number of family
sized homes completed was the highest yet recorded, in
2017/18 the figure (7,109) was at a five-year low,
reflecting the relatively low levels of house building
recorded in 2017/18 generally.
Source and notes:
- MHCLG live table 254 (discontinued
in 2011/12)
- GLA London Development Database
from 2008/09
- Data for 2017/18 is provisional
based on LDD estimates
- The figures in this chart are based
on gross completions and take no
account of losses due to demolition or
replacement
MHCLG
GLA
0%
10%
20%
30%
40%
Family sized homes (three bedrooms or more) as a proportion of total gross house building in London, 1991/92 to 2017/18

HOUSING IN LONDON 2019 49
3.9. Homes built in London in the last four years have a mean average floor area of 77m2, smaller
than surviving pre-war homes but larger than those built between the 1940s and 1980s
• Surviving homes that were built before the Second World
War are the largest homes on average: pre-1919 homes
have an average area of 100m2 in London, and those built
between 1919 and 1944 an average of 93m2.
• Homes that were built in the post-war decades tend to be
smaller, falling from 77m2 for those built in London between
1945 and 1964, to 68m2 for those built in the 1980s.
• However, average new home sizes in London subsequently
increased to 80m2 for those built between 1991 and 2013,
and 77m2 for those built between 2014 and 2018
(compared to 92m2 in England as a whole). The source and
the definition for the last three years are different from
previous reports – see notes to the right.
• In each period the average size of homes in England was
larger than in London, reflecting lower average densities.
Source and notes:
- Data to 2013 from English Housing
Survey 2010 to 2013; Data from
2013-18 from MHCLG statistics on
Energy Performance Certificates
- This year’s analysis uses a measure
of floor area from the EHS that is
more consistent with the EPC measure
than in earlier reports
- These figures measure the current
average size of existing homes built at
different periods, not the average size
of homes when they were built. They
therefore exclude any homes since
demolished, and account for any
extensions or conversions since
construction
London
England
0
20
40
60
80
100
120
Pre 1919 1919-44 1945-64 1965-80 1981-90 1991-2013 2014-18
English Housing Survey EPCs
Ave
rag
e f
loo
r are
a (
sq
uare
me
tres)
Data source and period of construction
Mean floor area by dwelling age, London and England

HOUSING IN LONDON 2019 50
3.10. The percentage of new build houses in London that are leasehold tenure has increased notably
over the past five years
• New homes in London are predominantly flats, with only
1,000 new houses sold in London each year on average over
the last ten years, versus approximately 10,000 new flats
each year. Houses are usually freehold tenure, whereas flats
are commonly leasehold.
• The percentage of new houses sold in London that are
leasehold tenure increased from 5% in 2013 to 18% in
2017, before coming down slightly to 16% in 2018. In
2018, London had the second highest percentage of new
house sales that were leasehold after the North West (22%).
• In comparison, only 4% of new houses sold in England in
2018 were leasehold, which is a sharp reversal of the trend
prior to 2018 (11% on average over the 10 years prior).
• The percentage of new houses that sold as leasehold in
2018 fell in all English regions and Wales.
Source and notes:
- ONS, Residential property sales for
England and Wales, 2018
- Freehold is outright ownership, in
perpetuity, of a property and the land
on which it is built
- Leasehold is a form of property
ownership where a property is leased
from a freeholder
London
England
0%
2%
4%
6%
8%
10%
12%
14%
16%
18%
20%
Percentage of new build houses sold on a leasehold, London and England, 1998 to 2018

HOUSING IN LONDON 2019 51
3.11. Planning approval was granted for around 65,000 new homes in London in 2017/18
• The net number of new homes receiving planning approval
in London is always higher than the eventual completions,
as some approvals are duplicates and other homes are
never completed.
• Over the last decade, a net average of 65,330 new homes
were approved each year, with a provisional figure of
65,130 approvals in 2017/18. The draft new London Plan
target is 66,000 new homes per year from 2019/20.
• The percentage of total approvals that were affordable
homes fell significantly between 2007/08 and 2015/16,
from 33% to 14%. This is partly due to higher numbers of
market housing increasing the total number of approvals.
• The percentage of approvals that were affordable fell from
33% in 2007/08 to 14% in 2015/16, before rising again to
18% in 2017/18. Separate data from Grant Thornton
indicates that 36% of homes approved in 2018 on sites of
10 or more units were affordable, the highest on record.
Source and notes:
- GLA Annual Monitoring Report 15
- Data for 2017/18 is provisional
based on LDD estimates
- Intermediate housing figures include
Discount Market Rent, Discount
Market Sale and Starter Homes
- London Affordable Rent homes are
included in the social rent category
- Figures for different years should not
be summed as they may contain
repeated approvals for the same
scheme
0%
5%
10%
15%
20%
25%
30%
35%
0
10,000
20,000
30,000
40,000
50,000
60,000
70,000
80,000
90,000
100,000
Net conventional housing approvals in London by tenure, 2004/05 to 2017/18
Affordable Rent Social rent Intermediate Market Affordable %

HOUSING IN LONDON 2019 52
3.12. 33% of residential homes determined by the Mayor in 2018 were affordable homes
• 717 schemes with a residential element have been
determined and recommended for approval by the Mayor or
his predecessor since 2012.
• 42,760 homes were recommended for approval at Stage
Two or Stage Three by the Mayor in 2018 (see Appendix
1A5 for an explanation of the process). This is an 80%
increase on the previous year but below the number of
residential homes determined by the Mayor prior to 2016.
• Of the homes determined by the Mayor in 2018, 33% or
14,140 homes were affordable, the highest figure yet. On
average, the affordable housing percentage offer increased
by 3% between the Stage One and Stage Two referral.
• Of the affordable homes approved by the Mayor in 2018,
48% were low cost rent tenures, including Affordable Rent,
and the remaining 52% were intermediate.
Source and notes:
- GLA monitoring of referable
planning decisions
- Referable applications that have not
had a Stage Two decision have been
omitted from the data, as well as
applications still under consideration
- Where an application has been
called in, affordable housing data is
taken from the called-in application
not the Stage Two application
- Section 73 applications have not
been included in this analysis
0%
5%
10%
15%
20%
25%
30%
35%
0
10,000
20,000
30,000
40,000
50,000
60,000
2012 2013 2014 2015 2016 2017 2018
Mayoral decisions on affordable housing, 2012 to 2018
Stage 2 Market units Stage 2 Affordable units Affordable Percentage

HOUSING IN LONDON 2019 53
3.13. Schemes of more than 500 units comprise 44% of London's pipeline of new homes
• The high number of approvals of new homes in recent
years has left London with a large pipeline of homes either
under construction or approved but not yet started. At the
end of March 2018, there was a total net conventional
pipeline of 277,000 homes.
• 44% of units in the pipeline are on large schemes of more
than 500 units and a further 34% are on schemes of 101 to
500 units. At the other end of the scale, schemes of 1 to 10
units account for just 7% of the units in the pipeline.
• Looking back over time, the percentage of units which are
on schemes of more than 250 units increased from 56% in
2009 to 68% in 2013. However, the proportion of units on
schemes of more than 250 units has fallen in recent years
and was 61% in 2018.
Source and notes:
- GLA Annual Monitoring Report 15
- Data for 2018 is provisional based
on LDD estimates
0
50,000
100,000
150,000
200,000
250,000
300,000
2018201720162015201420132012201120102009
Number of units in the planning pipeline by scheme size, 2009 to 2018
1-10
11 - 50
51-100
101 - 250
251 - 500
501 or more

HOUSING IN LONDON 2019 54
3.14. Around 115,000 new homes could be provided by tall building schemes in the pipeline, with half
of this total concentrated in just four boroughs
• In early 2019 New London Architecture (NLA) estimated
that there are 489 residential or primarily residential tall
buildings (defined as 20 storeys or higher) in the pipeline,
which includes those under construction, those permitted
but not yet started, and those still in pre-planning.
• NLA estimated that around 115,000 new homes could be
provided by these tall buildings, given their average height
of 29 storeys and assuming eight homes per storey.
• Around half of this total capacity is found in just four
boroughs (Tower Hamlets, Greenwich, Southwark and
Hammersmith and Fulham), which have 227 tall buildings in
the pipeline between them.
• In reality, it is unlikely that all of these schemes will be built,
given that some have not even been approved and given
others may be affected by the current economic
uncertainty.
Source and notes:
- NLA tall buildings survey 2019
0
5,000
10,000
15,000
20,000
25,000
Estimated number of homes in each London borough that could be provided by tall buildings in the pipeline, 2019

HOUSING IN LONDON 2019 55
3.15. The Build to Rent (BTR) sector’s contribution to new housing supply in London is growing
• Build to Rent (BTR) schemes are purpose built for market
rent. There are a range of organisations active in London’s
BTR market including institutional investors, private
developers, local authorities and housing associations.
• Since January 2009, 29,550 BTR homes have started
construction and 17,490 have been completed.
• The sector is growing in importance: in 2018, a third new
build market homes sold in London (32%) were for BTR.
• 13,310 BTR homes were under construction at the end of
2018, which is one in five of all open market homes under
construction. This suggests BTR will continue to support
new housing supply in London in the near future.
Source and notes:
- Molior London
- Molior’s BTR database covers
developments with 20 or more BTR
homes. In addition, the homes must
be planned to be owned and
managed as unified blocks of market
rental units
- The cumulative figures count BTR
homes that have been started or
completed since 2009
Starts
Completions
0
5,000
10,000
15,000
20,000
25,000
30,000
35,000
2009 2010 2011 2012 2013 2014 2015 2016 2017 2018
Cumulative Build to Rent starts and completions in London, 2009 to 2018

HOUSING IN LONDON 2019 56
3.16. There are around 100 community housing projects live or in the pipeline across London
• Data collected by the London Community-Led Housing
Hub on behalf of the GLA shows there are around 100
community housing projects live or in the pipeline across
25 London boroughs.
• These projects are at various stages, from discussions and
group formation to planning, construction and occupation.
• Lewisham is home to the most projects with a total of 14,
followed by Lambeth and Tower Hamlets with eight each.
The 14 schemes in Lewisham comprise 300 homes, a fifth
of the London total.
Source and notes:
- London Community-Led Housing
Hub

HOUSING IN LONDON 2019 57
3.17. 2018/19 saw the highest number of affordable housing starts funded through GLA programmes
since 2012/13
• The number of GLA-funded affordable homes started in
London was 14,540 in 2018/19, which is an increase of
16% from 12,555 in 2017/18.
• 2018/19 was the third consecutive year where the number
of GLA-funded affordable homes started in London was
increasing. The number of GLA-funded affordable homes
started in 2018/19 was at the highest level since 2012/13.
• 8,544 (59%) of the GLA-funded affordable homes started
in 2018/19 were intermediate and 3,991 (27%) were at
social rents or at London Affordable Rent (LAR) levels,
both the highest number since 2012/13. A further 12% of
homes were other Affordable Rent products and the tenure
of the remaining 2% was still to be agreed.
Source and notes:
- GLA Affordable Housing Statistics
- Responsibility for affordable housing
investment was devolved to the Mayor
of London in April 2012
- The Mayor’s current funding
programmes include, amongst others,
the Homes for Londoners: Affordable
Homes Programme 2016- 21 and
Building Council Homes for Londoners
- Figures described as intermediate
include shared ownership,
intermediate rent and other
intermediate
0
2,000
4,000
6,000
8,000
10,000
12,000
14,000
16,000
Affordable housing starts in London funded by the GLA, 2012/13 to 2018/19
To be agreed
Social rent and London Affordable Rent
Other Affordable Rent
Intermediate

HOUSING IN LONDON 2019 58
3.18. Councils in London started over 1,900 new homes in 2018/19, the highest figure since the mid-
1980s
• Council housebuilding in London peaked in the 1970s, but
in the early 1980s London councils were still starting
substantial numbers of new homes, with 3,420 in 1982/83
the peak.
• But by the end of the decade the combined effect of
government-imposed borrowing restrictions and an
absence of grant funding meant that very few council
homes were being started, a situation that persisted for two
decades with only 960 started between 1990/91 and
2009/10.
• More recently, the re-introduction of self-financing and the
Mayor's Building Council Homes for Londoners programme
have enabled councils to ramp up supply again. In 2018/19
1,916 new council home starts were recorded by the GLA,
the highest figure since 1984/85.
Source and notes:
- Figures for 1980/81 to 2017/18 are
from MHCLG live table 253, and for
2018/19 from GLA affordable
housing statistics
MHCLG statistics
GLA statistics
0
500
1,000
1,500
2,000
2,500
3,000
3,500
4,000
Number of new build council housing starts by London boroughs, 1980/81 to 2018/19

HOUSING IN LONDON 2019 59
3.19. The number of affordable homes completed in London in 2017/18 was 7,131, an increase from
2016/17 but still low by the standards of the last 27 years
• Counting homes funded from all sources, a total of 7,131
affordable homes were completed in London in 2017/18, a
2% increase on 2016/17 and a 23% increase on the 27-
year low recorded in 2015/16.
• The mix of new affordable homes completed has changed
significantly since the beginning of the 2010s, with the
introduction of Affordable Rent in 2010 and LAR in 2016.
• In 2017/18, only 1,089 social rent and LAR homes were
completed, 15% of new affordable homes. This compares
to 45% Affordable Rent completions (3,191) and 40%
intermediate completions (2,851).
• The level of GLA-funded starts in 2018/19 (Chart Error! R
eference source not found.) suggests the number of
social rent and LAR completions is likely to rise in the
coming years.
Source and notes:
- MHCLG affordable housing supply
live tables 1006C, 1006aC, 1006bC
and 1007c
- The method for collecting these
statistics is different from the net
conventional completions measure
used earlier. The figures do not net off
losses to the stock and therefore
represent gross completions
- As well as homes not funded by the
GLA, MHCLG statistics include
Assisted Purchase Sales and
acquisitions
0
2,000
4,000
6,000
8,000
10,000
12,000
14,000
16,000
18,000
20,000
Affordable housing completions in London, 1991/92 to 2017/18
Social rent and London Affordable Rent
Affordable Rent
Intermediate
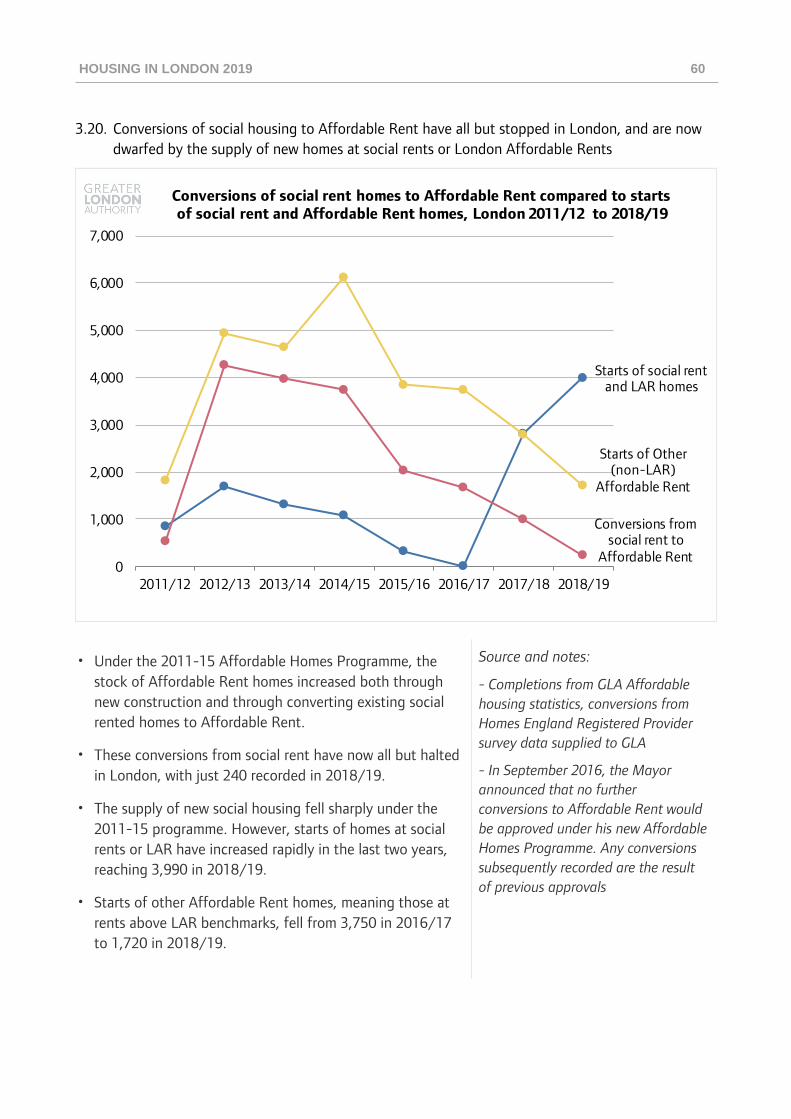
HOUSING IN LONDON 2019 60
3.20. Conversions of social housing to Affordable Rent have all but stopped in London, and are now
dwarfed by the supply of new homes at social rents or London Affordable Rents
• Under the 2011-15 Affordable Homes Programme, the
stock of Affordable Rent homes increased both through
new construction and through converting existing social
rented homes to Affordable Rent.
• These conversions from social rent have now all but halted
in London, with just 240 recorded in 2018/19.
• The supply of new social housing fell sharply under the
2011-15 programme. However, starts of homes at social
rents or LAR have increased rapidly in the last two years,
reaching 3,990 in 2018/19.
• Starts of other Affordable Rent homes, meaning those at
rents above LAR benchmarks, fell from 3,750 in 2016/17
to 1,720 in 2018/19.
Source and notes:
- Completions from GLA Affordable
housing statistics, conversions from
Homes England Registered Provider
survey data supplied to GLA
- In September 2016, the Mayor
announced that no further
conversions to Affordable Rent would
be approved under his new Affordable
Homes Programme. Any conversions
subsequently recorded are the result
of previous approvals
Starts of social rent and LAR homes
Conversions from social rent to
Affordable Rent
Starts of Other (non-LAR)
Affordable Rent
0
1,000
2,000
3,000
4,000
5,000
6,000
7,000
2011/12 2012/13 2013/14 2014/15 2015/16 2016/17 2017/18 2018/19
Conversions of social rent homes to Affordable Rent compared to starts of social rent and Affordable Rent homes, London 2011/12 to 2018/19

HOUSING IN LONDON 2019 61
3.21. 1,708 council homes in London were sold through the Right to Buy (RTB) scheme in 2018/19,
continuing a downward trend since 2014/15
• 1,708 council homes in London were sold through the RTB
scheme in 2018/19, down 18% from 2017/18. This is far
below the most recent peak of 12,780 in 2003/04, or the
record figure of 26,260 in 1990.
• The average discount from market price in London was 36%
in 2017/18, down slightly from the previous five years but
still above the level of discounts recorded between 2006/07
and 2012/13. In 2015, the RTB maximum discount in
London was increased to £100,000 and the maximum
discount in London is currently £110,500.
• The average market value of a home sold under the RTB
scheme was £280,560 in 2017/18, up 15% from 2016/17,
and the average discount was £101,400.
• The number of RTB replacement homes started/acquired by
local authorities in London since 2012/13 is 7,620, which is
less than half of the number of RTB homes sold over the
same period (18,600).
Source and notes:
- MHCLG live tables 670 and 685
(annual RTB sales) for 1981/82 to
2017/18, and table 691 (quarterly RTB
sales) for 2018/19
- MHCLG live table 693 (quarterly starts
on site and acquisitions) for 2012/13 to
2018/19
- MHCLG live table 643 (financial data)
for1998/99 to 2010/11
- MHCLG Local Authority Housing
Statistics (Section B) for 2012/13 to
2017/18 (2018/19 data not yet
available)
- RTB replacements were not monitored by MHCLG prior to 2012/13
0%
10%
20%
30%
40%
50%
60%
0
5,000
10,000
15,000
20,000
25,000
30,000
Ave
rag
e d
isco
un
t
Nu
mb
er
of
sale
s a
nd
re
pla
ce
me
nts
Annual Right to Buy council housing sales and average discount, London, 1981 to 2018/19
RTB sales
Average discount

HOUSING IN LONDON 2019 62
3.22. There were 803,200 affordable homes in London in 2018, up slightly from the year before but
down slightly from two decades ago
• Councils in London owned 392,800 affordable homes
(including social rent and Affordable Rent) in April 2018,
and housing associations another 410,500, for a total of
803,200 (excluding shared ownership). This figure was up
slightly from 801,200 in 2016 but has been relatively steady
at around 800,000 for the last two decades.
• Over this period the share of affordable homes in London
owned by housing associations has grown from 25% in
1997 to 51% in 2018, driven by a combination of new
supply and stock transfers from council ownership.
• In England, the number of homes owned by local authorities
and housing associations fell by 6% between 1997 and
2018, and the proportion owned by housing associations
rose from 22% to 61%.
Source and notes:
- MHCLG live tables 115 and 116
0
100,000
200,000
300,000
400,000
500,000
600,000
700,000
800,000
900,000
1997 1999 2001 2003 2005 2007 2009 2011 2013 2015 2017
Affordable homes in London (excluding shared ownership) by landlord type, 1997 to 2018
Councils
Housingassociations

HOUSING IN LONDON 2019 63
3.23. The proportion of homes in London recorded as empty in 2018 is far below its long-term average,
at 1.9% …
• According to Council Tax data there were 67,100 empty
homes in London in 2018, equivalent to 1.9% of the total
dwelling stock, up from a low of 1.7% in 2014.
• Long term data indicates that both the number of recorded
empty homes in London and their share of the total housing
stock are at very low levels, having fallen steadily from a
figure of 160,500 empty homes in 1993 (5.4% of the stock
at the time).
• In 2018, there were 22,500 homes in London that had been
recorded as empty for more than six months, equal to 0.6%
of the stock.
• These figures show homes recorded as empty for Council
Tax purposes. As such, it is likely that they will not pick up
some ‘frictional’ vacancies, such as homes that are briefly
vacant between one tenant moving out and another tenant
moving in.
Source and notes:
- Data from 1978 to 2011 is a
combination of historical data provided
to GLA by MHCLG and figures reported
by local authorities in their Housing
Strategy Statistical Appendix returns
- Data from 2004 onwards is from
council tax statistics published by
MHCLG in live table 615
- MHCLG suggest that these figures
may under-count empty homes since
the removal of empty property
discounts from Council Tax in many
areas has reduced the incentive for
owners to report homes as empty
0%
1%
2%
3%
4%
5%
6%
1980 1985 1990 1995 2000 2005 2010 2015
Empty homes in London as a proportion of total stock, 1978 to 2018
Empty homes total (DCLG/HSSA)
Empty homes total (Council Tax)
Empty homes >6 months (Council Tax)

HOUSING IN LONDON 2019 64
3.24. … while there are 45,980 recorded as second homes, 62% of which are in just five boroughs
Number of dwellings recorded as second homes for Council Tax
purposes, 2018
• In October 2018, there were 45,980 homes in London
recorded as second homes for Council Tax purposes, around
1.3% of the total housing stock.
• 63% of these homes are in just five boroughs: 8,850 in
Kensington and Chelsea, 7,120 in Camden, 6,160 in Tower
Hamlets, 3,660 in Barnet (by far the highest figure in Outer
London) and 3,190 in Westminster.
• Combined, the remaining 28 boroughs have 16,990
recorded second homes.
• The number of dwellings recorded as second homes fell by
5% between 2017 and 2018 and is down 13% since 2012.
Source and notes:
- MHCLG Council Taxbase 2018

HOUSING IN LONDON 2019 65
4. Housing costs and affordability
Housing affordability, as measured by the median share of housing costs in total household
income, has worsened in recent years, largely driven by the affordability of private renting
(4.1). The income distributions of households in the four main tenures are varied, with only
the private rented sector accommodating the full range of incomes (4.2).
Average house prices in London are six times their 1970 level after adjusting for inflation, but
have dipped in recent years (4.3). The gap between average prices in London and the rest of
the country widened in the first part of this century, but has narrowed recently (4.4). Average
house prices are highest in inner west London and lowest in outer east London (4.5).
The number of first-time buyer mortgages in London continues to be subdued by historical
standards and new loans to home movers are now close to the levels last seen during the crash
in 2008/09 (4.6). First-time buyers in London are generally borrowing lower shares of their
new home’s value than they were before the crash (4.7), but much higher multiples of their
incomes (4.8).
There were over 6,000 homes bought in London through Help to Buy in 2018/19, with
purchases in Outer London comprising the majority (4.9). However, buyers can only take
advantage of low interest rates if they can put down a suitable deposit and deposit
requirements continue to increase relative to incomes (4.10).
The number of mortgage repossessions in London remains at a historically low level, with just
389 homes repossessed in 2018 (4.14). The number of rented homes in London repossessed
by landlords is far higher, although has also fallen significantly in recent years (4.15).
There were almost 80,000 London properties listed on Airbnb by March 2019, a six times
increase in five years (4.13). Average private rents in London have risen by 42% since 2005,
by far the largest increase of any region (4.14) and leading indicators suggest rental growth is
likely to continue in 2019 (4.15). In the last two years, average earnings in London have risen
more quickly than average private rents, improving affordability for tenants (4.164.18).
However, London has by far the highest average private sector rents in the country (4.17).
There is huge variation in monthly market rents within London and, in the most expensive
boroughs, between the top and bottom of the market (4.18).
The number of Housing Benefit recipients in London has fallen slightly over the last five years,
partially offset by the increasing roll out of Universal Credit (4.19). The number of recipients
of either Housing Benefit or Universal Credit has increased overall, while falling in a number of
Inner London neighbourhoods (4.20). Average two-bedroom rents for new social rented
tenancies decreased in 2017/18 to £111 a week, while the average weekly rent for a two-
bedroom Affordable Rent home rose to £199 a week (4.21).

HOUSING IN LONDON 2019 66
4.1. Housing affordability, as measured by the median share of housing costs in total household
income, has worsened in recent years, largely driven by the affordability of private renting
• There are several ways to measure the affordability of
housing. This chart compares trends in affordability using
the most comprehensive measure, which includes gross
income from benefits and from all household members.
• By this measure, the median household in London spent
28% of their income on housing costs in 2016/17, slightly
up from 27% in 2015/16 and 25% in 2010/11.
• But there are significant disparities by tenure: both social
housing tenants and mortgaged homeowners are spending
only slightly more of their incomes on housing as in
2010/11 (31% versus 29% and 19%, versus 16%
respectively), while the typical private renting household is
now spending 37% of their income on rent, up from 30% in
2010/11.
Source and notes:
- English Housing Survey
- Outright owners are excluded as
they have no mortgage or rent
expenditure
- 2017/18 data not yet available
Mortgaged homeowners
Private renters
Social renters
All tenures
0%
5%
10%
15%
20%
25%
30%
35%
40%
2010 2011 2012 2013 2014 2015 2016
Financial year beginning
Median of housing costs as a % of gross household income (including benefits and income from all household members) by tenure, London

HOUSING IN LONDON 2019 67
4.2. The income distributions of households moving into the various main tenures are very different,
with only private renting accommodating the full range of incomes
• This chart shows the distribution of annual incomes among
households moving into each tenure in London.
• Households moving into social housing (including
Affordable Rent) have by far the lowest incomes, with half
of them on less than £13,000 a year. The income
distribution for social rent and Affordable Rent is very
similar so they have been combined for visual clarity.
• The private rented sector accommodates the most diverse
income range, with half of households on less than
£42,500 but 25% on more than £69,000.
• The median income of households accessing shared
ownership is £47,000, compared to £70,000 for those
moving into owner occupied homes.
Source and notes:
- Calculated by GLA from:
- Social rent and Affordable Rent:
Weekly household income from
2017/18 CORE data
- Shared ownership: Sum of annual
incomes of household head and
partner (if applicable), from 2017/18
CORE data
- Private renting and homeowners:
Gross annual income of entire
household (including multiple
earners), from 2017/18 Family
Resources Survey, counting those who
had moved to their current home since
2014

HOUSING IN LONDON 2019 68
4.3. Average house prices in London are six times their 1970 level, after adjusting for inflation
• London’s average house price was £454,400 in March
2019, according to the UK House Price Index (adjusted for
inflation), 5% lower than a year before. March 2019 was
the twelfth consecutive month of nil or negative real term
house price growth in London.
• The average house price across England fell by 1% over the
last year in real terms, to £238,800. However, the average
house price in England is still 12% above its level a decade
earlier and the average house price in London is 39%
higher than in 2009.
• Since the mid-1980s, every market cycle has left London’s
real terms house prices considerably higher than they were
before. Average house prices in London are now six times
their 1970 level, after adjusting for inflation.
Source and notes:
- UK House Price Index (UKHPI)
adjusted for RPI.
- Data is quarterly until the end of
1994 and monthly thereafter
- For various technical reasons, the
average prices reported by the new
UKHPI tend to be lower than those
reported by the previous ONS House
Price Index
London
England
£0
£100,000
£200,000
£300,000
£400,000
£500,000
1970 1975 1980 1985 1990 1995 2000 2005 2010 2015 2020
Average house prices in London and England after adjusting for inflation, 1970 to 2019

HOUSING IN LONDON 2019 69
4.4. The gap between average prices in London and the rest of the country remains high; however,
indicators suggest regional house prices are starting to converge
• At the end of March 2019, London’s average house price
was 2.1 times higher than the UK average.
• Average prices in the Outer Metropolitan Area and the rest
of the South East are also above the national average, but
London prices have detached from those in its
surroundings since the late 1990s.
• Since 2017 there has been a downward trend in the ratio,
which suggests the gap between average house prices in
London and the rest of the country is narrowing.
• Each of the major market cycles over the past four decades
has left average London house prices further above the UK
average than the one before it.
Source and notes:
- Nationwide UK and regional house
price index (all properties).
- Not seasonally adjusted
- A definition of London and the
Outer Metropolitan Area is provided
at Appendix 1A4
London
Outer Metropolitan
Area
Rest of South East
0.8
1.0
1.2
1.4
1.6
1.8
2.0
2.2
2.4
Ratio of London and wider South East average house prices to UK average, 1974 to 2019

HOUSING IN LONDON 2019 70
4.5. Average house prices are highest in inner west London and lowest in outer east London
• In 2018, the median price for a home sold in London
(unadjusted for the mix of homes sold) was £468,000, but
at neighbourhood level the median price varied from
£221,000 in Barking town centre to £2.53 million in
Knightsbridge and Hyde Park.
• The top eight most expensive neighbourhoods in London
are all in Westminster and Kensington and Chelsea, with
the Wimbledon Common area of Merton the only exception
in the top ten.
• At the other end of the price scale there are five
neighbourhoods with median prices at or below £250,000,
one in each of Bexley, Hillingdon, Haringey, Greenwich and
Barking and Dagenham.
Source and notes:
- ONS, House price statistics for small
areas in England and Wales to year
ending December 2018

HOUSING IN LONDON 2019 71
4.6. The level of new home buyer mortgage lending continues to be subdued, with new home mover
mortgages as low as the levels last seen during the crash in 2008/09
• In 2018/19 there were 41,570 new mortgages advanced to
first-time buyers in London, up 3% from 2017/18.
• The number of loans to home movers was 27,570 over the
same period, down 4% on the previous year.
• Although mortgage lending has broadly stabilised in recent
years, the level of first-time buyer and, in particular, home
mover transactions remains subdued by historical
standards.
• The number of home mover loans has fallen by almost a
quarter (24%) since the beginning of 2016, First-time
buyers now account for 60% of all new mortgage advances,
which is at an all-time high.
Source and notes:
- UK Finance mortgage lending
statistics (tables RL1R and RL2R)
- These figures are different to those
reported in previous bulletins, in part
due to a change in the data source
and data collection methodology. In
2019 UK Finance replaced the Council
of Mortgage Lenders industry data
tables. This change reflects access to
more comprehensive data and
improved information on total market
size
Home movers
First-time buyers
0
20,000
40,000
60,000
80,000
100,000
120,000
2004 2006 2008 2010 2012 2014 2016 2018
Annualised new home buyer mortgages by type, London, 2004 to 2019

HOUSING IN LONDON 2019 72
4.7. First-time buyers in London are generally taking out mortgage loans at lower shares of their home’s
value than they were before the financial crisis…
• In 2005/06, loans with LTVs of more than 90% comprised
one third of all lending to first-time buyers in London in
2005/06. However, this share fell to just 1% in 2010/11.
• In the last three years, the proportion of loans at LTVs of
90% and above has increased and was 14% in the year to
June 2018. Loans at LTVs of more than 95% remain
virtually non-existent.
• Loans with LTVs of 50% or less comprised 22% of total
first-time buyer mortgage loans in the year to Q2 2018.
This figure has been broadly stable for the last three years.
• This is partly supported by Help to Buy policy in London,
which reduces the amount of debt to be covered by a
mortgage. 14% of first-time buyers in London in 2018/19
used Help to Buy.
Source and notes:
- FCA, Mortgages Product Sales Data
(PSD) Table 6.1, H1 2018
- The next Mortgages PSD release is
scheduled for Autumn 2019 and will cover
data to Q2 2019
- Help to Buy in London provides
government-backed equity loans of up to
40% of the property value, on properties
valued up to £600,000
0
10,000
20,000
30,000
40,000
50,000
60,000
70,000
2006 2008 2010 2012 2014 2016 2018
Annualised number of loans to London first time buyers, by loan-to-value ratio, 2006 to 2018
>95%
>90% - <=95%
>85% - <=90%
>75% - <=85%
>50% - <=75%
0% - <=50%

HOUSING IN LONDON 2019 73
4.8. … but first-time buyers and home movers are borrowing much higher multiples of their income
• The typical first-time buyer in London borrowed 3.84 times
their income in 2018 up from just 1.88 in 1980.
• Home movers, who usually have equity from the sale of
their previous home, had typically borrowed at a lower
income ratio than first-time buyers. However, the two have
now converged. Home movers in London borrowed an
average of 3.80 times their incomes in 2018.
• In June 2014, the Bank of England recommended that
mortgage lenders do not extend more than 15% of new
residential mortgages at loan to income ratios at, or greater
than, 4.50. This is expected to constrain further increases
in median loan-to-income ratios for buyers in London.
• London’s typical loan to income ratios are higher than the
national average. Across the UK the typical first-time buyer
borrowed 3.50 times their income in 2018.
Source and notes:
- UK Finance mortgage lending statistics
(tables RL1A and RL2A)
- Income figures and calculations are
based on total gross income of all
borrowers assessed in the mortgage
application.
- These figures are different to those
reported in previous bulletins. This change
reflects access to more comprehensive
data and improved information on total
market size, as well as a move to mean
averages rather than medians.
First time buyers
Home movers
0.0
0.5
1.0
1.5
2.0
2.5
3.0
3.5
4.0
4.5
1980 1985 1990 1995 2000 2005 2010 2015
Median loan to income ratio for new loans to first time buyers and home movers in London, 1980 to 2018

HOUSING IN LONDON 2019 74
4.9. There were over 6,000 homes bought in London through Help to Buy in 2018/19, with purchases in
Outer London comprising the majority
• In 2018/19, there were 6,120 homes bought in London
with assistance from the government’s Help to Buy equity
loan scheme, the highest value yet and up from just 1,220
in 2014/15.
• There were 3,820 purchases in Outer London boroughs and
2,300 in Inner London. The typical income of London
households buying with Help to Buy was around £64,000,
and the average loan value was £167,700
• The number of Help to Buy equity loan purchases in
2017/18 is equivalent to 23% of the number of new build
private completions in London in that year (data on new
build completions in 2018/19 is not yet available).
• 95% of homes purchased using Help to Buy in London in
2018/19 were purchased by first-time buyers.
Source and notes:
- GLA analysis of London Development
Database and MHCLG Help to Buy equity
loan statistics
0
1,000
2,000
3,000
4,000
5,000
6,000
7,000
2014 2015 2016 2017 2018 2019
Annualised Help to Buy loans in Inner and Outer London, 2014/15 to 2018/19
Outer London
Inner London
First-time buyers

HOUSING IN LONDON 2019 75
4.10. Changes in lending practices mean that the financial burden for first-time buyers has switched
from having enough income to cover mortgage costs to having enough wealth for a deposit
• The average deposit paid by first-time buyers in London at
the end of 2018/19 was £148,800, which is 192% of the
annual income of the typical first-time buyer household.
• The average income of first-time buyer households in
London in 2018/19 was £77,300 per annum, more than
double the average earnings stated in table 3 of the key
statistics. Deposit requirements are therefore an even higher
percentage of the average income for all households. This is
a barrier to the accessibility of homeownership to
households on average incomes.
• Mortgage payments as a percentage of buyers’ incomes were
18% at the end of 2018. This is down from a peak of 25% in
2007 and continues the trend of a relatively low average
mortgage repayment burden by historical standards.
Source and notes:
- UK Finance, mortgage lending
statistics (table RL1R)
- These figures are different to those
reported in previous bulletins. This
change reflects access to more
comprehensive data and improved
information on total market size, as
well as a move to mean averages
rather than medians
Mortgage payments as % of buyers' income (median, left axis)
Deposit as % of buyers' income
(median, right axis)
0%
50%
100%
150%
200%
250%
0%
4%
8%
12%
16%
20%
24%
28%
32%
2000 2002 2004 2006 2008 2010 2012 2014 2016 2018
Trend in median deposit requirement and mortgage repayments as a share of income for first time buyers in London, 2000 to 2018/19

HOUSING IN LONDON 2019 76
4.11. The number of mortgage repossessions in London remains at a historically low level, with just
389 homes repossessed in 2018…
• The very low mortgage interest rates of recent years have
contributed to extremely low levels of mortgage
repossession in London, with just 334 homes repossessed
in 2017, the lowest figure on record, and 389 in 2018.
• The number of court orders made for repossession in 2018
was 1,160, down slightly from 1,207 in 2017. While still
very low by historical standards, this represents an increase
from a low of 889 in 2015.
• The ‘twin peaks’ of annual repossession orders in London
(14,400 in 1991, and 8,500 in 2008) coincided with the
two most recent housing market ‘crashes’, but there is as
yet little sign of any reaction to the (much milder) recent
slowdown in the housing market.
Source and notes:
Compiled by GLA from:
- 1990-95 from Housing Review
1996/97
- 1996 -2002 from UK Housing
Finance Review / Housing Review
(various years)
- 2003 onwards from Ministry of
Justice statistics
0
2,000
4,000
6,000
8,000
10,000
12,000
14,000
16,000
1980 1985 1990 1995 2000 2005 2010 2015
Nu
mb
ers
Court orders for mortgage repossession in London, 1980 to 2018 (with actual repossessions from 2003)
Repossessions Orders made

HOUSING IN LONDON 2019 77
4.12. … but the number of rented homes in London repossessed by landlords is substantially higher
• In 2018/19 there were 10,100 home repossessions carried
out by county court bailiffs in London, only 402 (4%) of
which were repossessions of mortgaged homes.
• 96% of repossessions in London in 2018/19 were rented
properties taken into possession from tenants by social or
private landlords.
• Landlord repossessions in London almost doubled between
2009 and 2015, reaching a high of 16,990 in the year to
September 2015. However, landlord repossessions have
recently fallen back down to the levels seen prior to
2008/09, with 9, 701 recorded in 2018/19 (11% fewer
than in 2017/18).
Source and notes:
- Ministry of Justice, Mortgage and
landlord possession statistical data
- These figures exclude repossessions
carried out without the involvement of
county court bailiffs, so the total
number of repossessions is likely to be
higher than shown here
Mortgage possessions
Landlord possessions
0
2,000
4,000
6,000
8,000
10,000
12,000
14,000
16,000
18,000
2004 2006 2008 2010 2012 2014 2016 2018
Annualised mortgage and landlord possessions in London, 2004 to 2018/19

HOUSING IN LONDON 2019 78
4.13. The number of London properties listed on Airbnb reached 79,130 by March 2019, which is a six
times increase from 13,240 since May 2014
• Several websites cater to the growing market for short-term
lettings in London, but Airbnb is the market leader.
• The number of London properties listed on Airbnb reached
79,130 by March 2019, up 12% from 70,530 in April 2018
and a six times increase from 13,240 since May 2014.
• In March 2019, entire homes comprised 56% of the
listings, with private rooms in someone's home comprising
43% and shared rooms (not shown) just 0.9%. The
proportion of different room types has remained broadly
consistent roughout this period.
• Whilst Inner London accounted for the largest increase in
numerical terms, the number of Airbnb listings recorded in
Outer London increased tenfold between 2014 and 2019.
• Not all homes listed on Airbnb are necessarily available for
rent, while others are available but may not have been
rented in the last year.
Source and notes:
- 2013 to 2017 data extracted from
Airbnb website by Tom Slee
(tomslee.net)
- 2017 to 2019 data extracted from
Inside Airbnb website
- Data was extracted at irregular
intervals and has been amended over
time in response to changes to
Airbnb's website
- The total figure includes a small
number of shared room properties
(less than 1,000 in any period)
Total
Entire home/apt
Private room
0
10,000
20,000
30,000
40,000
50,000
60,000
70,000
80,000
90,000
June 2013 June 2014 June 2015 June 2016 June 2017 June 2018 June 2019
Estimated number of properties listed on Airbnb in London by type, December 2013 to March 2019

HOUSING IN LONDON 2019 79
4.14. Average private rents in London have risen by 42% since 2005, by far the largest increase of any
region
• The Office for National Statistics have been tracking
changes in average private rents at regional level since
January 2005, and it estimates that between then and June
2019 private rents in London grew 42% in nominal terms.
This is by far the largest increase of any region, although
there has been some convergence since 2017 as rents in
London have been relatively stable.
• The next largest increase is in the South East, where rents
have risen 28% since 2005. The North East has seen the
smallest increase over this period at 19%, all the more
remarkable because it saw the greatest increase between
2005 and 2008.
Source and notes:
- ONS, Experimental Index of Private
Housing Rental Prices
- The ONS index calculates changes in
the rents of both new and existing
tenancies, while most other indices
cover new rents only
Other regions
North East
South East
London
80
90
100
110
120
130
140
150
Index of change in average private rents by region, 2005 to 2019 (2005 = 100)

HOUSING IN LONDON 2019 80
4.15. Leading indicators for open market rents suggest rental growth is likely to pick up in 2019
• Indicators of nominal rental growth include Rightmove
asking rents and the Homelet rental index for new lets.
• In the chart above these indices are lagged by 12
months and overlaid against the ONS nominal rental
index to provide an indication of future rental growth.
• The indicators suggest nominal year-on-year rental
growth in London will continue to increase into 2019.
• If this level of rental growth is sustained, and inflation
remains constant, real term rental growth is likely to
become positive in the future.
Source and notes:
- ONS, Experimental Index of Private
Housing Rental Prices
- Homelet Rental Index
- Rightmove Rental Price Tracker
- ONS data reflects the stock of rental
properties that have been let whereas
Homelet and Rightmove indicators reflect
the flow of new lettings
- Homelet and Rightmove indicators have
been lagged and normalised
- Rightmove data is not mix-adjusted and
is based on asking rents only
-6%
-4%
-2%
0%
2%
4%
6%
8%
10%
12%
14%
16%
-2%
-1%
0%
1%
2%
3%
4%
5%
6%
Quarterly change in nominal rent and leading indicators for rental growth, London, 2010 to 2020
ONS Homelet (lagged and normalised) Rightmove (lagged and normalised)

HOUSING IN LONDON 2019 81
4.16. 2018 saw a continued improvement in the affordability of private rents in London, when
compared to trends in average rent
• Between 2005 and 2016 average private rents in London
rose 38%, while average individual earnings rose just 21%,
leading to a worsening in affordability. The so-called
‘unaffordability’ index above is the cumulative change in
rents divided by the cumulative change in earnings).
• Rents tracked earnings very closely between 2005 and
2009 and then dropped in 2010, before going on to
increase more steeply for six consecutive years.
• In 2018, the rent index fell for only the second time in
twelve years. The earnings index increased by 3%, closing
the gap between the two indices and resulting in a second
consecutive year of improvements in affordability.
• The affordability index compares changes in rents to
changes in median earnings, but there is little difference if
lower or upper quartile earnings are used instead as the
earnings distribution has been quite steady over the period.
Source and notes:
- Earnings: Median full-time weekly
earnings by place of work, London.
From ONS Annual Survey of Hours
and Earnings, republished on London
Datastore
- Rents: ONS Index of Private Rental
Housing Prices, April each year to
match ASHE data (Jan 2011=100)
- ‘Unaffordability’ index: Rent index
divided by median weekly earnings
- The earnings index here is workplace
based and is, therefore, not
comparable to the earnings figures in
table 3 of the key statistics
Earnings index
Rents index
'Unaffordability' index (rent growth divided by earnings
growth)
80
90
100
110
120
130
140
150
Index of cumulative change in private rents, earnings and implied affordability in London, 2005 to 2018 (2005=100)

HOUSING IN LONDON 2019 82
4.17. London has by far the highest average private sector rents of any region in England
• The median rent for a privately rented home in London is
£1,495 per calendar month, more than twice as high as the
median in England as a whole (£695).
• London's rents are so much higher than those of other
regions that the median monthly rent for a one-bedroom
home in the capital (£1,279) is almost as high as the
national median monthly rent for a home with four
bedrooms or more (£1,320).
• It should be noted that these statistics exclude any cases
where the tenant receives Housing Benefit. As the average
private rent for households on Housing Benefit is below the
overall average, excluding these cases is expected to inflate
the average reported.
Source and notes:
- Valuation Office Agency, Private
Rental Market Statistics
- These figures exclude any cases
where the tenant receives Housing
Benefit
£0
£500
£1,000
£1,500
£2,000
£2,500
£3,000
Median monthly market rent by region and number of bedrooms, April 2018 to March 2019
4+ bedrooms
3 bedrooms
2 bedrooms
1 bedroom
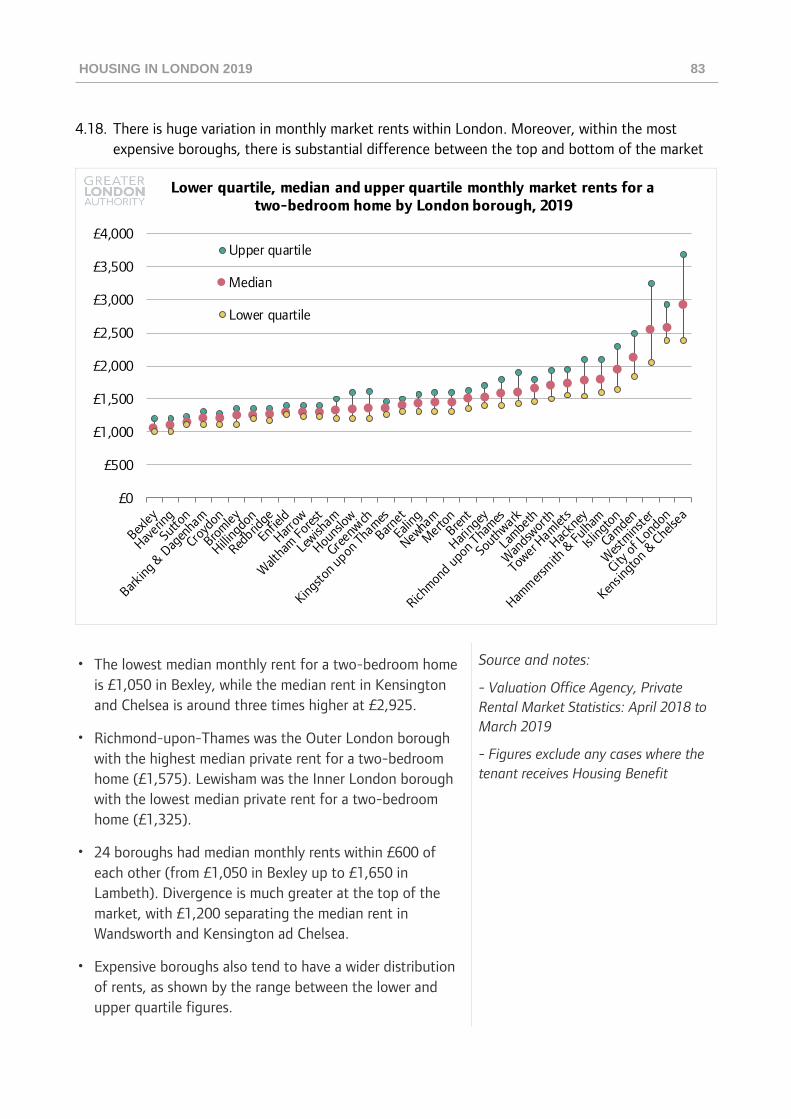
HOUSING IN LONDON 2019 83
4.18. There is huge variation in monthly market rents within London. Moreover, within the most
expensive boroughs, there is substantial difference between the top and bottom of the market
• The lowest median monthly rent for a two-bedroom home
is £1,050 in Bexley, while the median rent in Kensington
and Chelsea is around three times higher at £2,925.
• Richmond-upon-Thames was the Outer London borough
with the highest median private rent for a two-bedroom
home (£1,575). Lewisham was the Inner London borough
with the lowest median private rent for a two-bedroom
home (£1,325).
• 24 boroughs had median monthly rents within £600 of
each other (from £1,050 in Bexley up to £1,650 in
Lambeth). Divergence is much greater at the top of the
market, with £1,200 separating the median rent in
Wandsworth and Kensington ad Chelsea.
• Expensive boroughs also tend to have a wider distribution
of rents, as shown by the range between the lower and
upper quartile figures.
Source and notes:
- Valuation Office Agency, Private
Rental Market Statistics: April 2018 to
March 2019
- Figures exclude any cases where the
tenant receives Housing Benefit
£0
£500
£1,000
£1,500
£2,000
£2,500
£3,000
£3,500
£4,000
Lower quartile, median and upper quartile monthly market rents for a two-bedroom home by London borough, 2019
Upper quartile
Median
Lower quartile

HOUSING IN LONDON 2019 84
4.19. The number of Housing Benefit recipients in London has fallen in recent years, partially offset by
the increasing roll-out of Universal Credit
• The number of Housing Benefit recipients in London grew
from 586,000 in 2001 to a peak of 854,000 in 2013,
before falling to 662,000 in February 2019. 462,000
recipients are in social housing, while 197,000 rent
privately (the tenure of the remainder is unknown).
• Some of the fall in the Housing Benefit caseload is due to
the widening roll-out of Universal Credit for new
claimants. In February 2019, there were 137,000 renting
households in receipt of Universal Credit in London,
73,000 of them in social housing and 63,000 in the private
rented sector.
• Adding together Housing Benefit recipients and
households receiving Universal Credit gives a total of
797,000, of which 535,000 are social housing tenants and
259,000 private tenants (with the rest of an unknown
tenure).
Source and notes:
- Compiled by GLA from:
- 1998 to 2001: UK Housing Review
- 2002 to 2019: DWP, Housing Benefit
caseload statistics and Stat Xplore
- Housing Benefit recipients are
measured in terms of benefit recipients
and Universal Credit recipients in terms
of households
0
100,000
200,000
300,000
400,000
500,000
600,000
700,000
800,000
900,000
Nu
mb
er
of
case
s
Trend in Housing Benefit and Universal Credit caseload in London by tenure, 1998 to 2019
UC social HB social
UC private HB private

HOUSING IN LONDON 2019 85
4.20. Since April 2018, the number of recipients of either Housing Benefit or Universal Credit has
risen slightly across London while falling in a number of Inner London neighbourhoods
• Between February 2017 and February 2019, the number
of privately renting recipients of either Housing Benefit
or Universal Credit in London rose slightly from 253,000
to 259,000.
• At neighbourhood level there was an average increase of
3%, but some sharply divergent trends, from a fall of
21% in the Southbank area of Southwark to an increase
of 51% in the Clapham area of Wandsworth.
• The falling caseload in high-cost areas is likely due in
large part to a reduction in benefit payments and other
welfare reforms, while growth in the caseload could be
due to new development, movement of benefit
recipients, rising rents, or falling incomes.
Source and notes:
- DWP, Stat Xplore
- Unlike the equivalent map in previous
editions of Housing in London, this map
combines both households in receipt of
Universal Credit and ‘benefit units’ in
receipt of Housing Benefit

HOUSING IN LONDON 2019 86
4.21. The typical rent for a two-bedroom social rented home in London is £111 a week, compared to
£199 a week for an Affordable Rented home
• Rents for new general needs social housing tenancies rose
substantially between 2007/08 and 2015/16, largely
because until recently they were determined by a formula
that ensured they rose above inflation. After two years of
legislated annual rent reductions, however, median social
two-bedroom rents have now fallen by 4% since 2015/16
to £111 in 2017/18.
• When Affordable Rent was introduced by the coalition
government it allowed homes to be let at rents at up to
80% of the equivalent market rent. The average two-
bedroom rent in London was £199 a week in 2017/18.
• The Mayor's new London Affordable Rent product ensures
that any new general needs homes funded through the
Affordable Homes Programme in London will be capped
based on social rent levels. The London Affordable Rent
benchmark for a two-bedroom property was £153 a week
in 2017/18.
Source and notes:
- MHCLG, Social Housing Lettings in
England 2017/18, CORE summary
tables
- Weekly rent excludes supplementary
charges such as service and support
charges
- In 2016/17, new social rent tenancies
were more likely than new Affordable
Rent tenancies to have additional
service and support charges
- New lettings data includes homes
being re-let and homes being let for the
first time. Homes being let for the first
time have higher rents, on average
Social rent
Affordable Rent above LAR benchmarks
£0
£50
£100
£150
£200
£250
Median weekly rents for new social rent and Affordable Rent lettings to two-bedroom homes in London, 2007/08 to 2017/18 (nominal)

HOUSING IN LONDON 2019 87
5. Housing need
8,855 people were seen sleeping rough in London in 2018/19, 18% more than in 2017/18
(5.1). The proportion of those seen sleeping rough for the first time who spend only one night
on the streets was 73% in 2018/19, broadly the same proportion as the last two years (5.2).
49% of the people seen sleeping rough in London in 2018/19 were from the UK, while 31%
were from Central and Eastern Europe (5.3). Most rough sleepers who have been assessed
have a support need related to alcohol, drugs and/or mental health (5.4).
The new Homelessness Reduction Act has caused changes in how statistics on homelessness
are measured, affecting comparisons with previous years. For example, the number of people
London boroughs accepted as statutorily homeless fell from 15,470 in 2017/18 to 7,520 in
2018/19, but London boroughs also accepted 21,170 new duties to relieve cases of
homelessness (5.5). The reason most commonly given by homeless households in London for
losing their last home in 2018/19 was that friends or relatives were no longer willing or able to
accommodate them (5.6). Provisional estimates suggest the number of households who were
relieved of their homelessness is broadly aligned with recent years, but changes in the data
collection methodology under the HRA means that data on prevention activities is no longer
comparable with previous prevention data (5.7).
The number of homeless households living in temporary accommodation in London at the end
of December 2018 was 56,880, 3% up from the year before (5.8). Only one fifth of homeless
households in temporary accommodation in London leave it within a given year (5.9).
8% of households in London are overcrowded, a figure that ranges for 3% for homeowners to
15% for social housing tenants (5.10). Around 40% of children under 16 in social housing in
London and a quarter of those in private rented housing in London live in overcrowded
conditions (5.11).

HOUSING IN LONDON 2019 88
5.1. 8,855 people were seen sleeping rough in London in 2018/19, 18% more than a year before
• 8,855 people were seen sleeping rough on London’s streets
in 2018/19. The largest group in 2018/19 were the 5,529
people seen sleeping rough for the first time. This 'flow' of
new people onto the streets grew by 24% in the last year
but has more than trebled since 2007/08.
• The 'stock' figure, which measures the number of people
seen sleeping rough two years in a row, increased by 9% in
the last year, to 2,080, and has more than doubled since
2007/08.
• The 'returner' figure, which represents those who were last
seen sleeping rough more than a year ago, grew by 11% in
the last year, to 1,246, and has trebled in the last decade.
• 28% of all people seen sleeping rough in 2018/19 were
seen in Westminster. Other boroughs with high numbers of
people seen sleeping rough include Camden, Newham,
Southwark, Ealing and Lambeth.
Source and notes:
- CHAIN annual report 2018/19
0
1,000
2,000
3,000
4,000
5,000
6,000
7,000
8,000
9,000
10,000
2006/07 2008/09 2010/11 2012/13 2014/15 2016/17 2018/19
People seen sleeping rough in London, 2006/07 to 2018/19
Returner - Last seen more than a year ago
Stock - Seen two years running
Flow - First seen this year

HOUSING IN LONDON 2019 89
5.2. 73% of people seen sleeping rough for the first time in 2018/19 spent only one night on the
streets, which is broadly the same proportion as in 2017/18 and 2016/17
• 4,036 people, or 73% of those new to the streets in
2017/18, were seen sleeping rough only once in the year,
up from 3,229 in 2017/18 but broadly the same in
percentage terms.
• 1,493 new rough sleepers were seen more than once in
2018/19 (27% of the total). Of this group, most were seen
between two and five times.
• The number of new rough sleepers seen more than 20
times during the year has fallen from 54 in 2012/13 to 15
in 2018/19.
Source and notes:
- CHAIN annual report 2018/19
One
Two or more
0
500
1,000
1,500
2,000
2,500
3,000
3,500
4,000
4,500
2008/09 2010/11 2012/13 2014/15 2016/17 2018/19
Nu
mb
er
of
pe
op
le s
ee
n s
lee
pin
g r
ou
gh
fo
r fi
rst
tim
e
Number of contacts with people seen sleeping rough for the first time, 2008/09 to 2018/19

HOUSING IN LONDON 2019 90
5.3. The number of UK nationals seen sleeping rough in London has increased by 4% compared to
2017/18, while the number of Central or Eastern European nationals has increased by 50%
• The nationality profile of rough sleepers in London remains
diverse, with a total of 126 different nationalities recorded
during 2018/19.
• People from the UK accounted for 4,023 of those seen
sleeping rough in London in 2018/19, 49% of the total.
This is more than twice the number seen in 2008/09, and
the highest number recorded for the UK to date.
• The number of people from Central or Eastern European
countries seen sleeping rough has increased again after a
previous dip, accounting for 31% of those seen in
2018/19, compared to 23% in 2017/18 and 30% in
2016/17.
• 1,613 people seen sleeping rough in 2018/19 were from
the rest of the world, 20% of the total. This share has held
steady over the years.
Source and notes:
- CHAIN annual report 2018/19
UK
Central / Eastern Europe
Rest of world
Other Europe (inc Turkey)
0
500
1,000
1,500
2,000
2,500
3,000
3,500
4,000
4,500
2008/09 2010/11 2012/13 2014/15 2016/17 2018/19
Areas of origin of people seen sleeping rough in London, 2008/09 to 2018/19

HOUSING IN LONDON 2019 91
5.4. Most rough sleepers have a support need related to alcohol, drugs and/or mental health
Support needs of people seen sleeping rough in London, 2018/19
• 50% of people seen sleeping rough in London in 2018/19
whose support needs were assessed were recorded as having
a support need relating to mental health, 42% a need relating
to alcohol and 41% to drugs.
• There was considerable overlap between these support needs,
with 16% of people having support needs related to all three.
24% of those assessed had no support needs in these
categories.
• The proportion of people with an alcohol-related support
need has fallen from 52% in 2010/11. The proportion with a
drug-related support need has increased from 32% and the
proportion with a support need related to mental health from
38%.
• 37% of people seen sleeping rough in 2018/19 had
experience of prison, 11% have lived in care and 6% are
former armed forces members (of whom two-thirds are non-
UK nationals).
Source and notes:
- St Mungo's and GLA, Chain annual
report 2018/19
- The percentages in this chart are
calculated using the same base as
those in the CHAIN reports, i.e.
excluding those whose needs were not
known or not assessed. Previous
Housing in London reports used a
slightly different base

HOUSING IN LONDON 2019 92
5.5. New statutory homelessness duties for local authorities have led to a reduction in the number of
households accepted as statutorily homeless in London in 2018/19, but new relief duties are up
• The Homelessness Reduction Act (HRA) 2017 came into force
in April 2018, amending the Housing Act 1996 and creating
new prevention and relief duties for local authorities with
statutory homelessness responsibilities.
• Under the new Act, a relief duty is owed to households that
are already homeless and require help to secure
accommodation. The duty lasts 56 days, after which a
household is owed a main (original) homelessness duty and
accepted as statutorily homeless.
• There were 7,520 households accepted as statutorily
homeless by London boroughs in 2018/19, which is half the
figure of 15,470 recorded in 2017/18. However, there were
21,170 new relief duties recorded in 2018/19.
• London accounted for 28% of all main (original) duty
homelessness acceptances in England in 2018/19, and 19%
of all new relief duty acceptances in England.
Source and notes:
- UK Housing Review 1999/00
- UK Housing Finance Review 1995/96
- MHCLG live table 784 and 784a
- MHCLG live table MD1 2018/19
- 2018/19 HRA figures are provisional
and are estimated by annualising first
three quarters of 2018/19 data
- The MHCLG table MD1 statistics are
defined as ‘experimental’ while it
continues to work with local authorities
to improve the quality of the HRA data
- HRA relief and main homelessness
duties are shown in the chart
independently, as opposed to stacked
0%
5%
10%
15%
20%
25%
30%
35%
40%
0
5,000
10,000
15,000
20,000
25,000
30,000
35,000
40,000
Households accepted as statutorily homeless in London, 1990 to 2018/19
HRA new relief duty*
HRA main homlessness duty*
Main homlessness duty (original)
London as % England
*figures
provisional

HOUSING IN LONDON 2019 93
5.6. The most common reason given for homeless households in London losing their last home is that
friends or relatives of the household were no longer willing or able to accommodate them
• When households are accepted as homeless, the reason they
lost their last settled accommodation is recorded. Up until
2017/18 the reason for loss of last settled home was recorded
for households accepted as being owed a main (original) duty;
however, under the HRA, this is also now recorded for
households owed a new prevention or relief duty.
• After a sharp increase in the proportion of households owed a
homelessness duty because of the end of an Assured Shorthold
Tenancy (AST), provisional estimates suggest this figure is
coming down again. In 2018/19, approximately 21% of
households were owed a homelessness duty because of the end
of an AST, which is down from 31% in 2017/18.
• In 2018/19, 27% of homeless households in London reported
losing their last home because friends or relatives were no
longer willing or able to accommodate them. This figure is
decreasing as reasons contained within ’other’ increase.
Source and notes:
- MHCLG live table 774
- MHCLG live table A2 2018/19
- 2018/19 HRA figures are provisional
and are estimated by annualising first
three quarters of 2018/19 data
- The MHCLG table A2 statistics are
defined as ‘experimental’ while it
continues to work with local
authorities to improve the quality of
the HRA data
0%
10%
20%
30%
40%
50%
60%
Households owed a homlessness duty in London, by reason for loss of last settled home, 1998/99 to 2018/2019
Relatives / friends nolonger willing / ableto accommodate
End of assuredshorthold tenancy
Relationshipbreakdown withpartner
Loss of other rentedor tied housing
Other

HOUSING IN LONDON 2019 94
5.7. Changes in the data collection methodology under the Homelessness Reduction Act means that
data on prevention activities is no longer comparable with previous prevention data
• Homelessness prevention involves helping people to secure
alternative accommodation or remain in their current home,
thereby avoiding homelessness. Homelessness relief refers
to cases where a homeless household is helped to secure
accommodation without being accepted as statutorily
homeless and being owed a main (original) duty.
• New HRA prevention data is not comparable to the data up
to end of March 2018. This previous prevention data
included interventions and activities that prevented a
household from making a homeless application, and are no
longer reported under the HRA. Provisional estimates
suggest London boroughs helped 3,320 households to
obtain other housing and 3,973 households to remain in
their current home in 2018/19.
• The number of homeless households who were relieved of
their homelessness by being helped to secure
accommodation is estimated to be 3,307 in 2018/19.
Source and notes:
- MHCLG live table 792
- MHCLG live tables P1 and R1
- 2018/19 HRA figures are provisional
and are estimated by annualising first
three quarters of 2018/19 data
- The MHCLG table P1 and R1
statistics are defined as ‘experimental’
while it continues to work with local
authorities to improve the quality of
the HRA data
0
5,000
10,000
15,000
20,000
2009/10 2011/12 2013/14 2015/16 2017/18
Nu
mb
er
of
ho
use
ho
lds
Homelessness prevention and relief in London, 2009/10 to 2018/19
Relief of homelessness Helped obtain other housing Helped remain in current home
Homelessness Reduction Act (HRA) 2017

HOUSING IN LONDON 2019 95
5.8. The number of homeless households living in temporary accommodation in London was 56,880
in December 2018, which is a 3% increase on December 2017
• In December 2018, there were 56,880 homeless households
in temporary accommodation arranged by London boroughs,
more than double the lowest recorded point in late 1988.
• 20,830 of these households, or 37% of all households
accommodated in temporary accommodation, were
accommodated outside of their home borough.
• The number of households in bed and breakfast
accommodation (3,170) increased 20% in the year to
December 2018 and has more than tripled since 2009. Bed
and breakfasts still only account for 6% of temporary
accommodation placements.
• 35% of households in temporary accommodation in
December 2018 were in accommodation leased from private
sector landlords; 40% were in other private sector
accommodation; 14% in social housing used as temporary
accommodation; and 6% in hostels and women's refuges.
Source and notes:
- Housing Finance Review 1995/96
- UK Housing Review 2004/05
- MHCLG live table 775
- MHCLG live table TA1
0
10,000
20,000
30,000
40,000
50,000
60,000
70,000
1988 1993 1998 2003 2008 2013 2018
Homeless households in temporary accommodation in London by type of accommodation, 1988 to 2018
Bed andbreakfast
Hostels andwomen's refuges
Social housing
Leased fromprivate sector byLA or HA
Other privatesectoraccommodation
Total

HOUSING IN LONDON 2019 96
5.9. One fifth of homeless households living in temporary accommodation in London at the start of
2017/18 had left that accommodation by the start of 2018/19
• 10,830 homeless households left temporary accommodation
in London in 2017/18, equivalent to 20% of households in
temporary accommodation at the start of the year. This is
the lowest figure on record in both absolute and
proportional terms.
• Of those households who left temporary accommodation in
2017/18, 25% had been in temporary accommodation for
under six months; 15% for between six months and a year;
another 20% for between one and two years.
• Between 2009/10 and 2014/15, the proportion staying over
two years fell from 50% to 26%, only to increase again to
40% in the three years to 2017/18.
• The length of time spent in temporary accommodation by
homeless households is no longer recorded by MHCLG under
the new HRA reporting regime.
Source and notes:
- MHCLG live table 779
0%
10%
20%
30%
40%
50%
60%
70%
Pe
rce
nta
ge
of
tota
l
Households leaving temporary accommodation as a proportion of total at beginning of year, London, 1998/99 to 2017/18

HOUSING IN LONDON 2019 97
5.10. 8% of households in London are overcrowded, up from 6% in the mid-1980s due primarily to an
increase in overcrowding among social renting households
• 8% of households in London are estimated to be
overcrowded according to the ‘bedroom standard’, which
compares the size and composition of households to the
bedrooms available.
• The overall overcrowding rate is above its level in the 1980s
and 1990s, primarily due to rising overcrowding in social
housing, with overcrowding in private renting following a
more cyclical pattern. The proportion of overcrowded
homeowner households has declined slightly over the same
period.
• As of 2017/18, 15% of households in social housing, 12%
of those in private rented housing, and 3% of homeowners
were overcrowded.
Source and notes:
- 1986/87 data from the London
Housing Survey
- 1995/96 to 2017/18 data from the
Survey of English Housing and English
Housing Survey data, using three-year
rolling averages
- 2006 definition of bedroom standard
and rolling three-year averages used
Owner occupied
Social rented
Private rented
All tenures
0%
3%
6%
9%
12%
15%
18%
Pro
po
rtio
n o
f h
ou
se
ho
lds o
ve
rcro
wd
ed
Three year period ending
Proportion of households in London overcrowded (according to the bedroom standard) by tenure, 1986/87 to 2017/18

HOUSING IN LONDON 2019 98
5.11. Around 40% of children under 16 in social housing in London and a quarter of those in
private rented housing in London live in overcrowded conditions
• Around 370,000 children under 16 in London, or 22% of
the total, live in households that are considered
overcrowded according to the bedroom standard. This is
twice the rate found in the country as a whole (where 1.2
million children or 11% of the total live in overcrowded
homes) and is unchanged from a year ago.
• Childhood overcrowding rates vary widely by tenure. 7% of
children in owner occupied housing, 40% of those in social
rented and 24% of those in private rented housing in
London are overcrowded. This is compared to 5%, 24% and
15% respectively across the entire country.
Source and notes:
- English Housing Survey, 2014/15 to
2016/17
- Three-year average used
- 2017/18 data not yet available
0%
5%
10%
15%
20%
25%
30%
35%
40%
45%
Owned Social rented Private rented Total
Proportion of children under 16 living in overcrowded housing by tenure, London and England, 2014/15 to 2016/17
England London

HOUSING IN LONDON 2019 99
6. Mobility and decent homes
Around one in ten London households and one in four private tenants have lived in their
current home for less than a year (6.1). The proportion of households in London moving
home in a given year has roughly halved within each tenure since the mid-1990s (6.2). Three
quarters of all moves in London in the last year were either into or within the private rented
sector (6.3). The number of households moving into social housing each year in London has
fallen by around two thirds since the mid-1990s (6.4). The most common reasons given by
households moving home in London are to move to a better neighbourhood, to a larger home
or for work (Error! Reference source not found.).
The Mayor’s Housing Moves programme enabled 84 social housing tenants to move between
boroughs in 2018/19, down from nearly 250 in 2015/16 due to a fall in the number of
properties advertised through the scheme (6.6). More than 2,000 social rented homes in
London have been freed up through the Seaside & Country Homes scheme since 2007/08
(6.5). Meanwhile, the proportion of home-owning households that are under-occupying their
homes has risen steadily over time (6.8).
The proportion of newly approved homes meeting Lifetime Homes and wheelchair accessibility
standards has fallen in recent years (6.7). London boroughs have issued around 9,000 Homes
in Multiple Occupation (HMOs) with mandatory licences, although the total number of HMOs
in London is greater than this (6.10). The proportion of homes below the Decent Homes
standard has fallen slightly faster in London than in the rest of England since 2006 (6.9), but
in each tenure there has been relatively little improvement since 2014 (6.12). The number of
affordable homes in London below the Decent Homes standard fell from 260,290 in 2005 to
41,430 in 2016 and has remained broadly at that level (6.11). There were around 5,500 fires
recorded in homes in London in 2018, with more incidents recorded in Inner London than in
Outer London (6.14).
Per capita greenhouse gas emissions from London’s housing stock have fallen by more than
two fifths in the last decade (6.13). The energy efficiency of new dwellings in London far out-
performs existing dwellings, but in 2018/19 few of them achieved the highest rating (6.16).
Progress in improving the energy efficiency of existing homes has slowed in recent years
(6.17). 12% of London households are estimated to be living in fuel poverty, just above the
national rate (6.16). However, the fuel poverty rate within each tenure is similar in London to
the national average (6.19).

HOUSING IN LONDON 2019 100
6.1. Around one in ten of all London households and one in four private renting households have
lived in their current home for less than a year
• 10% of households in London moved to a new home in the
last year (including those moving to London from
elsewhere), while 61% have lived more than five years at
their current home, 43% more than ten years, and 24%
more than 20 years.
• Mobility is far higher in the private rented sector, where
27% of households moved in the last year. This compares
to just 5% of social renting households and 3% of owner
occupiers.
• While mobility rates for individual tenures are similar in
London and the rest of England, London has a higher
overall mobility rate due to its larger private rented sector.
Source and notes:
- English Housing Survey, 2015/16 to
2017/18
Owner occupied
Private rented
Social rented
All tenures
0%
5%
10%
15%
20%
25%
30%
Less thanone year
One year Two years 3-4 years 5-9 years 10-19years
20-29years
30+ years
Length of time in current home by tenure, London, 2015/16 to 2017/18

HOUSING IN LONDON 2019 101
6.2. The proportion of households in London moving home in a given year has roughly halved within
each tenure since the mid-1990s
• As the previous chart showed, housing mobility (as
measured by the proportion of households who moved in
the last year) is far higher in the private rented sector than
in other tenures. However, it used to be higher still: from
the mid-1990s until the mid-2000s between 40% and 45%
of private renters in London moved each year, a figure
which then fell to around one in four in 2017/18.
• Mobility also fell in social housing - from 13% of
households moving house a year to around 5% - and
among owner occupiers, from 7% to 4%.
• The mobility rate has fallen sharply in each tenure over this
period, but the rate across all tenures as a whole has fallen
by less because a larger share of Londoners now live in the
relatively mobile private rented sector. In 2017/18, around
one in ten London households had moved in the last year,
compared to one in seven in 1993.
Source and notes:
- Survey of English Housing 1993 to
2007, English Housing Survey
2008/09 to 2017/18
- Three-year average used
Owner occupied
Private rented
Social rented
All tenures
0%
5%
10%
15%
20%
25%
30%
35%
40%
45%
50%
Three year period ending
Proportion of households in London who have lived less than a year at current address by tenure, 1995 to 2017/18

HOUSING IN LONDON 2019 102
6.3. Three quarters of all moves in London in the last year were either into or within the private rented
sector
• 10% of households in London moved in the last year
(including those who moved to London from elsewhere),
and 75% of those moves were either into or within the
private rented sector.
• Newly forming households accounted for 16% of moves,
11% of which were into the private rented sector, 3% into
owner occupation and 2% into social housing.
• 15% of all moves were into or within owner occupation, of
which the largest number comprised owner occupiers
moving within the tenure, with the remainder people
moving from private renting.
• 10% of moves were into or within social housing, most of
which were within-tenure moves.
Source and notes:
- English Housing Survey, 2015/16 to
2017/18

HOUSING IN LONDON 2019 103
6.4. The number of households moving into social housing each year in London has fallen by around
two thirds since the mid-1990s
• In 2017/18 16,000 households new to social housing
moved into council or housing association homes in
London, a figure that has fallen from 50,000 in 1996/97.
• 10,000 of these lettings were to new council tenants and
6,000 to housing association tenants. The number of
council lettings to new tenants has fallen from 40,500 in
1996/97, partly due to the shrinking of the council housing
stock over the same period. The number of housing
association lettings to new tenants fell from 9,300 to 6,000
over the same period, with a growing stock failing to
entirely compensate for a falling letting rate.
• Lettings to new tenants accounted for around 60% of all
lettings for both councils and housing associations in
2017/18.
Source and notes:
- UK Housing Review 2019, tables 98
(local authorities) and 100 (housing
associations)
- Before 2010/11 the local authority
figures include a small number of
tenants transferring from housing
association homes
Local authorities
Housing associations
0
5,000
10,000
15,000
20,000
25,000
30,000
35,000
40,000
45,000
Lettings to new tenants in London by local authorities and housing associations, 1996/97 to 2017/18
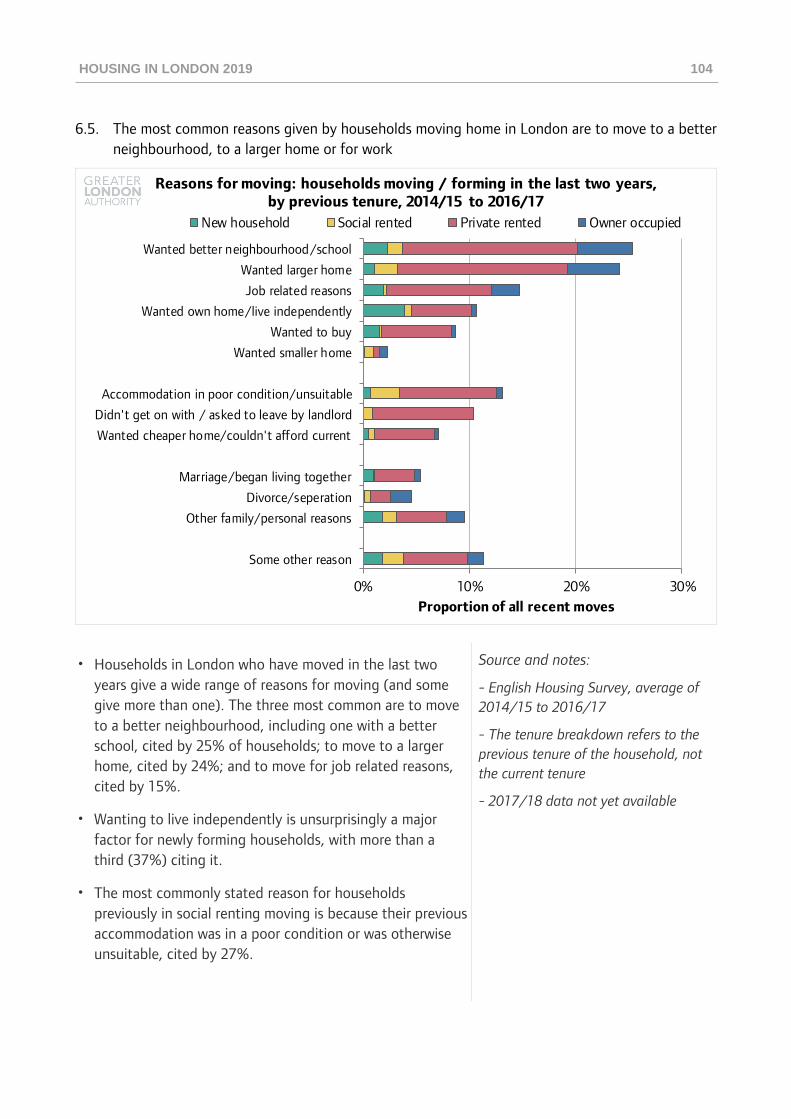
HOUSING IN LONDON 2019 104
6.5. The most common reasons given by households moving home in London are to move to a better
neighbourhood, to a larger home or for work
• Households in London who have moved in the last two
years give a wide range of reasons for moving (and some
give more than one). The three most common are to move
to a better neighbourhood, including one with a better
school, cited by 25% of households; to move to a larger
home, cited by 24%; and to move for job related reasons,
cited by 15%.
• Wanting to live independently is unsurprisingly a major
factor for newly forming households, with more than a
third (37%) citing it.
• The most commonly stated reason for households
previously in social renting moving is because their previous
accommodation was in a poor condition or was otherwise
unsuitable, cited by 27%.
Source and notes:
- English Housing Survey, average of
2014/15 to 2016/17
- The tenure breakdown refers to the
previous tenure of the household, not
the current tenure
- 2017/18 data not yet available
0% 10% 20% 30%
Wanted better neighbourhood/school
Wanted larger home
Job related reasons
Wanted own home/live independently
Wanted to buy
Wanted smaller home
Accommodation in poor condition/unsuitable
Didn't get on with / asked to leave by landlord
Wanted cheaper home/couldn't afford current
Marriage/began living together
Divorce/seperation
Other family/personal reasons
Some other reason
Proportion of all recent moves
Reasons for moving: households moving / forming in the last two years, by previous tenure, 2014/15 to 2016/17
New household Social rented Private rented Owner occupied

HOUSING IN LONDON 2019 105
6.6. The Mayor’s Housing Moves programme enabled 84 social housing tenants to move between
boroughs in 2018/19, the lowest number since the programme was launched in 2012/13
• The Mayor’s Housing Moves programme offers social
housing tenants in London the opportunity to move to
suitable accommodation in another borough.
• The programme prioritises applicants who fall into certain
categories. Households in work or training comprise the
majority of those moving, accounting for 88% of moves in
2018/19 (74 moves in total). Of these households, 44 were
in overcrowded conditions prior to the move.
• No under-occupying households and no households
providing unpaid care or support were moved in 2018/19.
• Since the programme launched in May 2012, 1,166
households have been helped to move. The number of
lettings through the scheme has fallen in each of the last
three years. This fall correlates directly with a reduction in
the number of properties advertised through the scheme.
Source and notes:
- GLA Housing Moves programme
monitoring data
0
100
200
300
400
500
600
0
50
100
150
200
250
300
2012/13 2013/14 2014/15 2015/16 2016/17 2017/18 2018/19
Nu
mb
er
of
ad
ve
rtis
ed
pro
pe
rtie
s
Nu
mb
er
of
lett
ing
s
Housing Moves lettings per year by category, 2012/13 to 2018/19
Other
Providing care
Under-occupying
Overcrowded
In work or training,overcrowded
In work or training,not overcrowded
In work or training
Advertised properties(right axis)

HOUSING IN LONDON 2019 106
6.7. More than 2,000 social rented homes in London have been freed up through the Seaside &
Country Homes scheme since 2007/08
• Between 2007/08 and 2018/19 there were 2,188 social
rented homes freed up in London after the tenants moved
out through the Seaside & Country Homes scheme, which
helps older council and housing association tenants in
London move to a home outside London.
• The borough that has had the most homes freed up is
Greenwich (181), followed by Barking and Dagenham (154)
and Southwark (148). The City of London (five), Brent
(eight) and Kensington and Chelsea (nine) have had the
least homes freed up.
Source and notes:
- GLA, Seaside & Country Homes
programme monitoring data

HOUSING IN LONDON 2019 107
6.8. 42% of home-owning households in London are under-occupying their homes, up from 33% in
the mid-1990s
• Over the last two decades the proportion of households
that are under-occupying their home in London has
remained steady at around a quarter.
• However, this stability has masked increasing differences at
the level of individual tenures. There has been a notable
increase in the proportion of homeowner households who
are under-occupying, from 33% in the mid-1990s to 42%
in the three years ending 2017/18.
• Meanwhile, 7% of social rented households and 9% of
private rented households are currently under-occupying,
both figures having been fairly stable since the mid-1990s.
• These disparities are consistent with the picture for
England as a whole, where over half of home-owning
households have two or more bedrooms than
recommended by the bedroom standard.
Source and notes:
- Survey of English Housing and
English Housing Survey data,
1993/94 to 2017/18 (rolling three-
year average)
- Under-occupation is defined as a
household having two or more
bedrooms than the Government
recommended bedroom standard
Owners
Social renters
Private renters
Total
0%
5%
10%
15%
20%
25%
30%
35%
40%
45%
50%
Three-year period ending
Households in London under-occupying their accommodation (according to the bedroom standard) by tenure, 1995/96 to 2017/18

HOUSING IN LONDON 2019 108
6.9. The proportion of newly approved new build homes in London meeting accessibility and
wheelchair standards has fallen in recent years
• In 2017/18, 66% of new build homes approved in London
were recorded as being in compliance with Building
Regulation M4(2) (previously the Lifetime Homes Standard)
and 7% were in compliance with M4(3) (wheelchair
accessible homes).
• Both figures have fallen significantly since 2011/12, when
94% of new build homes approved were designed to be
accessible or adaptable and 9% were wheelchair accessible.
• This is in part because compliance with Building Regulations
M4(2) and M4(3) can be optional. Although homes may be
designed to these standards, they are only counted if
compliance is conditioned in the decision notice.
• The London Plan (2016) stipulates that 90% new build
homes should meet Building Regulation requirement M4(2)
and 10% should meet requirement M4(3).
Source and notes:
- GLA, London Plan Annual
Monitoring Reports
- Only schemes that are 100% new
build are included in the figures. Split
schemes (some new build and some
conversion of existing buildings) are
not taken into account
- M4(2) and M4(3) replaced Lifetime
Homes and Wheelchair Accessible
Homes standards on all approvals
granted from October 2015 onwards
0%
2%
4%
6%
8%
10%
12%
0%
10%
20%
30%
40%
50%
60%
70%
80%
90%
100%
2009/10 2010/11 2011/12 2012/13 2013/14 2014/15 2015/16 2016/17 2017/18
Accessible homes as a proportion of all new build homes approved in London, 2009/10 to 2017/18
M4(2) Lifetime Homes Standard (left axis)
M4(3) Wheelchair accessible homes (right axis)
Building Regulation M4 introduced

HOUSING IN LONDON 2019 109
6.10. London boroughs have issued around 9,000 Homes in Multiple Occupation with mandatory
licences, although this represents only a small portion of the total number of HMOs in London
• A House in Multiple Occupation (HMO) is a property rented
out by at least three people who are not from the same
‘household’ (such as a family), but who share facilities like
bathrooms and kitchens.
• A HMO must be licensed if it is rented to five or more
people who share facilities and who form more than one
household, and it is at least three storeys high.
• The number of HMOs that have been issued with
mandatory licences in London decreased from 9,683 in
2017 to 9,020 in 2018 but is still above the number of
HMOs seen between 2012 and 2015.
• Note that the number of HMOs that have been issued with
mandatory licences are a small sub-section (less than 10%)
of the total number of HMOs in London.
Source and notes:
- MHCLG, Local Authority Housing
Statistics: data returns for 2017 to
2018 (Section F – condition of
dwelling stock)
0
2,000
4,000
6,000
8,000
10,000
12,000
2012 2013 2014 2015 2016 2017 2018
Number of mandatory licensed Homes in Multiple Occupation in London, 2012 to 2018

HOUSING IN LONDON 2019 110
6.11. The proportion of homes below the Decent Homes standard has fallen slightly faster in London
than in the rest of England since 2006
• The proportion of homes in London that fail to meet the
Decent Homes standard has fallen from 37% in 2006 to
17% in 2017, the same rate as in 2015 and 2016.
• According to this data there are around 570,000 homes
below the Decent Homes standard in London.
• In the rest of England, the proportion below the standard
fell from 35% in 2006 to 20% in 2013 and has remained
at roughly that level since.
Source and notes:
- Survey of English Housing data 2006 to
2007, English Housing Survey stock data
2008 to 2017
- The chart includes 95% confidence
intervals
0%
5%
10%
15%
20%
25%
30%
35%
40%
45%
2006 2007 2008 2009 2010 2011 2012 2013 2014 2015 2016 2017
Trend in proportion of non-decent homes in London and rest of England, 2006 to 2017
London
Rest of England

HOUSING IN LONDON 2019 111
6.12. While the proportion of non-decent homes has fallen in each tenure since 2006, most of this
improvement came in the first half of this period, with relatively little progress since 2014
• The proportion of homes below the Decent Homes
standard in London has fallen significantly in each tenure
between 2006 and 2017; from 41% to 20% for privately
rented homes, 37% to 12% for social rented homes, and
36% to 17% for owner occupied homes.
• However, in each tenure most of these improvements came
in the first half of this period, with relatively little progress
seen in the years since 2014.
• The higher proportion of homes below the standard in the
private rented sector is likely to reflect in part the older mix
of housing in the sector.
Source and notes:
- Survey of English Housing data 2006
to 2007, English Housing Survey stock
data 2008 to 2017
- Confidence intervals are not shown
for reasons of legibility, but
throughout the period shown are
approximately 3% for both owner
occupied and social rented housing,
while falling from 5% to 4% for
private renting (reflecting the growth
of the tenure in recent years)
Owner occupied
Private rented
Social rented
0%
5%
10%
15%
20%
25%
30%
35%
40%
45%
2006 2007 2008 2009 2010 2011 2012 2013 2014 2015 2016 2017
Trend in non-decent homes by tenure, London 2006 to 2017

HOUSING IN LONDON 2019 112
6.13. The number of affordable homes in London below the Decent Homes standard fell from
260,290 in 2005 to 41,430 in 2016 and has remained broadly at that level
• In April 2018, there were 41,780 council or housing
association owned homes in London below the Decent
Homes standard. This is down 14% from 48,590 in 2017,
but up slightly from 41,430 in 2016.
• Between 2005 and 2017, the number of non-decent
housing association homes fell from 48,520 to 1,357.
However, the number of non-decent housing association
homes has more than doubled in a year to 3,480 in 2018.
• The number of non-decent council homes fell from
211,770 in 2005 to an all-time low of 38,300 in 2018, after
an increase in 2017.
Source and notes:
- Council data from Business Plan
Statistical Appendix and Local
Authority Housing Statistics data
published by MHCLG
- Housing association data from
Regulatory Statistical Return data
published by the Tenant Services
Authority and Statistical Data Return
published by the Regulator of Social
Housing
Council
Housing association
0
50
100
150
200
250
2005 2007 2009 2011 2013 2015 2017
Nu
mb
er
of
no
n-d
ece
nt
ho
me
s (
00
0s)
Trend in number of non-decent affordable homes in London by landlord type, 2005 to 2018

HOUSING IN LONDON 2019 113
6.14. There were around 5,500 fires recorded in homes in London in 2018, with more incidents
recorded in Inner than in Outer London
• The London Fire Brigade responded to 105,974 incidents in
2018, but only 5,490 of these involved fires in homes.
• The borough with the most domestic fires was Hackney,
with 251 fires at a rate of 2.3 fires for every thousand
homes in the borough. Excluding the City of London, the
lowest number of domestic fires was in Richmond upon
Thames with 77, or 0.9 per thousand homes.
• The map shows domestic fires on a 1km square grid. The
highest number of dwelling fires recorded in a single square
kilometre area was 25 in an area around Stamford Hill in
Hackney.
Source and notes:
- London Fire Brigade Incident
Records, published on the London
Datastore

HOUSING IN LONDON 2019 114
6.15. Per capita greenhouse gas emissions from London's housing stock have fallen by over two fifths
in the last decade
• The GLA's London Energy and Greenhouse Gas Inventory
(LEGGI) measures greenhouse gas emissions from London's
workplaces, homes and transport.
• Per capita emissions of greenhouse gases from London’s
homes were 1.3 tonnes in 2016, down from 1.4 in 2015
and 43% lower than the 2006 figure of 2.3.
• Per capita emissions from workplaces have fallen even
faster and have halved in the last decade, from 2.7 to 1.3
tonnes.
• Transport emissions per Londoner have fallen less in recent
years, fluctuating around 1.0 tonnes per capita.
• Total greenhouse gas emissions in London have reduced by
over one third since the beginning of 2000, from 59
megatonnes in 2000 to 31 megatonnes in 2016.
Source and notes:
- GLA London Energy and Greenhouse
Gas Inventory 2016 (table 2.0)
- Emissions prior to 2009 were
measured in megatons of carbon
dioxide. From 2010 onwards
measured in megatons of carbon
dioxide equivalent.
- LEGGI 2016 figures are interim
Homes
Workplaces
Transport
0.0
0.5
1.0
1.5
2.0
2.5
3.0
3.5
2000 2002 2004 2006 2008 2010 2012 2014 2016
Per capita greenhouse gas emissions in London by sector, 2000 to 2016
Greenhouse gas emissions (tonnes)
CO2 emissions (tonnes)

HOUSING IN LONDON 2019 115
6.16. The energy efficiency of new dwellings in London far out-performs existing dwellings, but in
2018/19 few of them achieved the highest rating
• 91% of new build dwellings in London in 2018/19 were in
EPC bands A to C, with homes in band B accounting for the
largest proportion (78%). Less than 1% of new build
dwellings in London achieved an EPC rating of A.
• 8% of new build dwellings in London were in bands D or E,
with E being the minimum level of energy efficiency for
privately rented property in England. 0.6% or 260 new
build homes in London in 2018/19 were in bands F or G
and did not meet minimum energy efficiency standards.
• The majority of existing dwellings in London with EPCs
lodged in 2018/19 had a rating of C (37%) or D (40%). A
further 13% of existing dwellings had an EPC rating of E
and 2% or 3,915 homes were in EPC bands F or G.
• 3% of existing dwellings with EPCs lodged in 2018/19 had
an EPC rating of B and only 25 homes were in band A.
Source and notes:
- MHCLG live table NB1: domestic
EPCs for new dwellings by energy
efficiency rating
- EPCs are required for all new homes
including new build dwellings,
conversions and change of use. The
energy efficiency of new build housing
is measured according to a banding
system in which A is the most energy
efficient and G the least
0% 20% 40% 60% 80% 100%
New build
Existing
Energy efficiency band of EPCs lodged for existing buildings and new dwellings, London, 2018/19
A B C D E F/G

HOUSING IN LONDON 2019 116
6.17. Progress in improving the energy efficiency of existing homes has slowed in recent years
• The energy efficiency of housing can also be measured by
the Standard Assessment Procedure (SAP), which gives
ratings in percentage terms (with 100% representing zero
energy cost). This chart tracks these ratings over the last
two decades for all homes in London and for each of the
three main tenures.
• The median rating for all homes in London was 64% in
2017, up from 48% in 1996.
• Social housing is the most energy efficient tenure, with the
typical rating rising from 54% in 1996 to 69% in 2017.
Owner occupied and privately rented homes had median
SAP ratings of 61% and 64% respectively in 2017.
• While energy efficiency has increased markedly in each
tenure over the last two decades, improvements have
basically flat-lined since 2013.
Source and notes:
- English House Condition Survey and
English Housing Survey stock data,
1996 to 2017
- This analysis uses the 2012 SAP
definition throughout
- The difference between tenures is
partly due to the composition of each
tenure’s dwelling stock. Housing
association homes are newer, on
average, and more likely to be flats.
Owner occupied homes tend to be
older and are more likely to be
detached or semi-detached homes,
which are usually less energy efficient
Owner occupied
Private rented
Social rented
All tenures
40
45
50
55
60
65
70
75
1996 1998 2000 2002 2004 2006 2008 2010 2012 2014 2016
Trend in median SAP (energy efficiency) rating by tenure, London, 1996 to 2016

HOUSING IN LONDON 2019 117
6.18. 12% of households in London are estimated to be living in fuel poverty, above the national
rate…
• The government's Low Income High Costs measure defines
a household as living in fuel poverty if they have required
fuel costs above the national average and would be below
the official poverty line if they were to spend that amount
(and after taking housing costs into account).
• According to this definition, 12% of households in London
are fuel poor, a figure that has risen from 10% in 2016 and
is above the national rate for the first time in more than a
decade. In England, 11% of households are estimated to be
in fuel poverty, the same rate as in 2016.
• The causes of the recent increase in London are not yet
clear, but could include changes in income, fuel costs or
energy efficiency.
Source and notes:
-Department for Business, Energy and
Industrial Strategy, Fuel poverty
statistics
- Fuel poverty is measured according
to the 'low income high costs AHC
equivalised income' definition
London
England
0%
2%
4%
6%
8%
10%
12%
14%
2003 2004 2005 2006 2007 2008 2009 2010 2011 2012 2013 2014 2015 2016 2017
Proportion of households in fuel poverty in London and England, 2003 to 2017

HOUSING IN LONDON 2019 118
6.19. … although the rate of fuel poverty within each tenure is similar in London to the national
average
• When the headline rate of fuel poverty is broken down by
tenure, there are similar rates of fuel poverty in London
and England in each tenure, with all differences within
standard margins of error.
• 17% of privately renting households in London are fuel
poor, compared to around 19% of those in England and up
from 12% in 2016 (although the change is not statistically
significant due to the relatively small samples involved).
• While London has similar rates of fuel poverty to the
national average within each tenure, its overall fuel poverty
rate is slightly higher due to its relatively small owner-
occupied sector, which has the lowest rate of any tenure.
Source and notes:
- English Housing Survey fuel poverty
data
- Fuel poverty measure used: Low
income high costs (to match the
Annual Fuel Poverty Statistics report)
with 95% confidence intervals
0%
5%
10%
15%
20%
25%
Owner occupied Private rented Local authority Housingassociation
Total
Fuel poverty rates by tenure, England and London 2017
England London

HOUSING IN LONDON 2019 119
Appendices
A1. Discontinued charts
A2. Dwelling, household and tenure definitions
A3. Sources of data on housing supply
A4. London and the Outer Metropolitan Area
A5. Referable planning applications
A6. Glossary of acronyms

HOUSING IN LONDON 2019 120
A1. Discontinued charts
Some charts from previous editions have not been included in this edition of Housing in London. In
some cases, this was because there were multiple charts on a specific topic. In others, some charts
have been removed as the data included has not been updated in the last year, for example because it
uses 2011 Census data.
Below is a list of the charts in Housing in London 2018 which have been discontinued in Housing in
London 2019. The tables in the 2018 report can be found on the Housing in London webpage
https://data.london.gov.uk/dataset/housing-london using the below index numbers.
Chart Description
1.6 Proportion of benefit units who are sharing a private rented home with one or more
other benefit units (1985 to 2017)
1.10 Distribution of areas with medium and high population density in European cities
(2011)
2.8 Adults in London by tenure and economic activity (2016/17)
2.10 Current tenure by place of residence one year ago (adults in London) (2015 to 2017)
3.1 Annualised growth of population and housing stock in most recent five years for
selected international cities
3.8 Postcodes in London with additional residential addresses between 2015 and 2017
3.13 Pipeline schemes including at least one tall building in London (2017)
4.2 Distribution of renter household incomes and incomes required to afford new build
sale prices in London (2015/16)
4.6 Annual house price growth by London borough and month (2010 to 2017)
4.7 Distribution of local authority average house prices per square metre (2004 and 2016)
4.12 Nationwide first-time buyer affordability ratios, London, 1983 to 2017
6.12 Median basic repair costs per square metre of housing in London by tenure and age
(2014/15)

HOUSING IN LONDON 2019 121
A2. Dwelling, household and tenure definitions
Introduction
This note sets out the dwelling, household and tenure definitions used in Housing in London 2019.
The definitions below are taken from the MHCLG definitions of general housing terms.
Dwelling
For dwelling stock data, unless specifically stated, the definition used follows the Census’s definition
applicable at that time. The Census’s definition has changed several times. For an explanation of how
the dwelling count is derived from the 2011 Census, visit Notes and definitions for stock data.
Since 2001, a dwelling is defined as a self-contained unit of accommodation. Self-containment is
where all the rooms (including kitchen, bathroom and toilet) in a household’s accommodation are
behind a single door which only that household can use. A dwelling can consist of one self-contained
household space or two or more non-self-contained household spaces at the same address.
Houses, bungalows, flats, maisonettes and bedsits are types of accommodation used in the Census
but no clear definition of these is provided. Houses include single storey bungalows. A flat is difficult
to define and there are many types. A flat must be contained within a dwelling with at least two
storeys. Flats include maisonettes; maisonettes are flats containing more than one storey
Household
The National Statistics survey definition of a household is: one person or a group of people who have
the accommodation as their only or main residence and (for a group):
• either share at least one meal a day, or
• share the living accommodation, that is, a living room or sitting room.
The occupant(s) of a bedsit who do not share a sitting or living room with anyone else comprise a
single household.
For the household projections and mid-year estimates a household is defined as in the 2001 census:
• one person living alone, or
• a group of people living at the same address with common housekeeping – that is, sharing
either a living room or at least one meal a day.
Tenure
There are up to four tenure categories for dwelling stock, house building and household figures:
• owner-occupied or private landlords, whether persons or companies. This includes
accommodation that is owned outright or is being bought with a mortgage;
• rented privately, defined as all non-owner-occupied property, including property occupied
rent-free by someone other than the owner;
• rented from housing associations, including social rent, affordable rent, intermediate rent
and low-cost home ownership housing association new build dwellings; and
• rented from local authorities, including social rent, affordable rent, intermediate rent and
low-cost home ownership new build dwellings.

HOUSING IN LONDON 2019 122
Social and affordable housing
Affordable housing is social rented, affordable rented and intermediate housing, provided to eligible
households whose needs are not met by the market. Eligibility is determined with regard to local
incomes and local house prices. From April 2012, affordable housing is defined in the National
Planning Policy Framework.
Affordable housing should include provisions to remain at an affordable price for future eligible
households or for the subsidy to be recycled for alternative affordable housing provision.
• Social rented housing is owned by local authorities and private registered, for which
guideline target rents are determined through the national rent regime. It may also be owned
by other persons and provided under equivalent rental arrangements to the above, as agreed
with the local authority or with the Homes and Communities Agency.
• Affordable rented housing is let by local authorities or private registered providers of social
housing to households who are eligible for social rented housing. Affordable Rent is subject to
rent controls that require a rent of no more than 80 per cent of the local market rent
(including service charges, where applicable). In addition, the Mayor has decided that any
homes funded through the national affordable housing programme in London would be
capped based on social rent levels, at or below London Affordable Rent benchmarks.
• Intermediate housing is homes for sale and rent provided at a cost above social rent, but
below market levels subject to the criteria in the Affordable Housing definition above. These
can include shared equity (shared ownership and equity loans), other low-cost homes for sale
and intermediate rent, but not affordable rented housing.
Homes that do not meet the above definition of affordable housing, such as ‘low cost market’ housing, may not be considered as affordable housing for planning purposes.
For more information see the Government website on definitions of general housing terms.

HOUSING IN LONDON 2019 123
A3. Sources of data on housing supply
Introduction
This note sets out the two measures of housing supply used by the GLA, reflecting the different
targets set out in the Mayor’s London Plan and London Housing Strategy.
London Plan
The housing provision targets set out in the London Plan are defined in terms of total net housing
supply, comprising three components:
• Conventional completions: self-contained homes from new build, conversion or change of use;
• Non-conventional completions: non-self-contained housing such as bedrooms in hostels or
halls of residence; and
• Change in long-term empty homes (those empty for more than six months), where a decrease
is an addition to supply and an increase is a subtraction.
Progress against these targets is monitored in the London Plan Annual Monitoring Report, the latest
edition of which was published in September 2018. The source for conventional and non-conventional
completions is the London Development Database, a uniquely detailed database of housing
developments created from data provided by London borough planning departments and checked by
the GLA. The number of long-term empty homes is monitored using annual statistics reported by
MHCLG, based on local authority Council Tax data.
In 2016/17, the latest year for which data is published, the total net housing supply in London was
45,500, comprising 41,370 conventional completions, 4,526 non-conventional completions and an
increase of 392 in the number of long-term empty homes.
The conventional component of total housing supply is reported by the GLA to MHCLG who publish it
as part of their national statistics on the ‘Net supply of housing’.
MHCLG also publish quarterly national statistics on house building. These statistics are not strictly
comparable to the conventional housing supply statistics published by GLA or MHCLG themselves, as
they cover only new build developments and are reported on a gross rather than net basis. They are
also known to undercount even new build completions. They can however be a useful indicator of
future trends in completions when these caveats are borne in mind.
London Housing Strategy
The affordable housing targets set out in the London Housing Strategy are monitored using MHCLG’s
national statistics on affordable housing supply. These statistics cover not just new build but also
acquisitions of existing private sector homes for affordable housing. They are released on an annual
basis with a lag of several months and combine data from a range of sources including GLA
programme monitoring statistics.
The GLA funds the majority of affordable housing supply in London and publishes its own statistics on
its programme on a monthly and annual basis, with a shorter time lag than MHCLG. The most recent
GLA statistics show that in 2018/19 there were 14,540 affordable homes started in London with GLA
funding and 7,544. The MHCLG total for 2018/19, accounting for homes funded from other sources,
will be published in winter 2019.

HOUSING IN LONDON 2019 124
A4. London and the Outer Metropolitan Area
The ONS definition of Inner and Outer London boroughs is adopted within Housing in London 2019,
as set out within the key statistics for London boroughs at the start of this report.
A slightly different definition of Inner and Outer London is adopted in the Mayor’s London Plan 2016.
In the Mayor’s London Plan, Greenwich is defined as an Inner London borough, whereas ONS defines
it as an Outer London borough. Similarly, the London Plan defines Haringey as an Outer London
borough, whereas ONS defines it as an Inner London Borough.
A map of Inner and Outer London Boroughs, as defined by the GLA, is provided below. In addition,
the map below shows the Outer Metropolitan Area, which is a large area with high rates of commuting
into London defined by the Great Britain Historical GIS.
Source: University College London, 2018

HOUSING IN LONDON 2019 125
A5. Referable planning applications
Introduction
The Mayor is consulted on all planning applications that are of potential strategic importance to
London. These are commonly known as ‘referable’ applications.
An application is referable to the Mayor if it meets the criteria set out in the Mayor of London Order
(2008). The criteria include, but is not limited to:
• development of 150 residential units or more;
• development over 30 metres in height (outside the City of London); and/or
• development on Green Belt or Metropolitan Open Land.
The Mayor does not have any powers to comment or intervene on any proposal that does not meet
the criteria set out within the order, including household applications. These proposals are the
responsibility of the local planning authority.
What is the process for a referable application?
All planning applications are submitted to the relevant local planning authorities within London, one
of either the 32 borough councils or the three London development corporations: City Corporation,
London Legacy Development Corporation, or Old Oak & Park Royal Development Corporation.
Stage One
Once an application has been submitted, and if it meets the Mayor of London Order, the local
planning authority is required to refer it to the Mayor. The Mayor has six weeks to provide comments
on the application, assessing whether it complies with the London Plan policies. This is a consultation
response known as Stage One.
The application is then considered by the local planning authority at its planning committee, where it
decides whether to grant or refuse permission.
Stage Two
Following its consideration, the local planning authority is required to refer the application to the
Mayor for his final decision, known as a Stage Two referral. The Mayor has 14 days to make a decision
to allow the local planning authority decision to stand, to direct refusal, or to take over the
application, thus becoming the local planning authority.
At Stage 2 decision, the Mayor may be content to allow the local planning authority to determine the
case itself, subject to any action that the Secretary of State may take. In such an instance, he would
therefore not wish to direct refusal or direct to become the local planning authority.
Under article 6 of the Mayor of London Order (2008), the Mayor has the power to direct refusal on an
application that has been referred to him.
Stage Three
Under article 7 of the Mayor of London Order (2008), the Mayor has the power to direct that he will
become the local planning authority for an application. These are commonly referred to as ‘call-ins’,
‘public hearings’, 'representation hearings' and ‘Stage Threes’.
For more information see the GLA website on planning applications and decisions.

HOUSING IN LONDON 2019 126
A6. Glossary of acronyms
Acronym Full word / phrase
BTR Build to Rent
CPI Consumer Price Inflation
EPC Energy Performance Certificate
GLA Greater London Authority
HMO House in Multiple Occupation
HRA Homelessness Reduction Act
LAR London Affordable Rent
LDD London Development Database
LEGGI London Energy and Greenhouse Gas Inventory
MHCLG Ministry of Housing, Communities and Local Government
NHBC National Housebuilding Council
NLA New London Architecture
ONS Office for National Statistics
RTB Right to Buy
UKHPI UK House Price Index

HOUSING IN LONDON 2019 127