
HOUSEHOLD DEMAND FOR FOOD AWAY FROM HOME (FAFH) IN NIGERIA: THE ROLE OF EDUCATION
16
T h e J o u r n a l o f D e v e l o p i n g A r e a s Volume 49 No. 2 Spring 2015 HOUSEHOLD DEMAND FOR FOOD AWAY FROM HOME (FAFH) IN NIGERIA: THE ROLE OF EDUCATION Kolawole Ogundari* University of Delaware, USA Adegoke Oluwatosin Aladejimokun University of Ibadan, Nigeria Sadiat Funmilayo Arifalo The Federal University of Technology, Nigeria ABSTRACT The aim of this study is to investigate the demand characteristics of household consumption of food-away-from-home (FAFH) with a focus on the role of education of household head in Nigeria. Using 2003/2004 Nigeria Living Standard Survey (NLSS) data, we employ the Cragg’s Double-Hurdle (DH) model, which estimate jointly, households’ decisions to consume FAFH and how much to spend on FAFH or the demand for FAFH. The empirical results show that education of household head decreases the demand and probability of consuming FAFH, while household income and households with younger age cohorts increase the demand and probability of consuming FAFH in the study. The findings also reveal that education reduces the demand for FAFH for the wealthier households twice as much as it does for the poorer households. JEL Classifications: C01, D11, I2 Keywords: food away from home, expenditure, double hurdle, Engel curve, Nigeria Corresponding Author’s Email Address: [email protected] INTRODUCTION There has been a significant change in economic and socio-demographic structure of Nigerian population over the years (Carew, 2010). This includes change in household composition/size, increase in disposable income to shift in consumption habits, namely increase in the demand for meat, fruits and vegetable rather than tubers and grains and increase in consumption of food-away-from-home (FAFH) among others 1 . According to All Africa (2009), the consumption of FAFH comes with unmistakable rise in the number of fast food outlets at every street corner in highbrow and down town areas of urban and semi-urban areas within the last two decades in Nigeria. This observation however, is not only peculiar to Nigeria; it is a phenomenon that is wide spread in both the developed and developing countries. For example, Pingali (2007) revealed a rising popularity of FAFH in Asian countries, while Bai et al., (2012) argued that rising income and demographic factors contribute to increase in consumption of FAFH in China. A similar finding was also observe in Malaysia by Tan (2010), Turkey by Gal et al., (2007), and US by McCracken and Brandt (1987) and Liu et al., (2013) among others. In Nigeria, available statistics show that fast food business has grown from a total of 25.2 billion in 2004 to 190 billion naira in 2009 (Carew, 2010), partly because fast food habit has gradually become part of the lifestyle of many Nigerians,
Transcript of HOUSEHOLD DEMAND FOR FOOD AWAY FROM HOME (FAFH) IN NIGERIA: THE ROLE OF EDUCATION
T h e J o u r n a l o f D e v e l o p i n g A r e a s
Volume 49 No. 2 Spring 2015
HOUSEHOLD DEMAND FOR FOOD AWAY FROM HOME (FAFH) IN NIGERIA:
THE ROLE OF EDUCATION
Kolawole Ogundari* University of Delaware, USA
Adegoke Oluwatosin Aladejimokun University of Ibadan, Nigeria
Sadiat Funmilayo Arifalo The Federal University of Technology, Nigeria
ABSTRACT
The aim of this study is to investigate the demand characteristics of household consumption of food-away-from-home (FAFH) with a focus on the role of education of household head in Nigeria. Using 2003/2004 Nigeria Living Standard Survey (NLSS) data, we employ the Cragg’s Double-Hurdle (DH) model, which estimate jointly, households’ decisions to consume FAFH and how much to spend on FAFH or the demand for FAFH. The empirical results show that education of household head decreases the demand and probability of consuming FAFH, while household income and households with younger age cohorts increase the demand and probability of consuming FAFH in the study. The findings also reveal that education reduces the demand for FAFH for the wealthier households twice as much as it does for the poorer households. JEL Classifications: C01, D11, I2 Keywords: food away from home, expenditure, double hurdle, Engel curve, Nigeria Corresponding Author’s Email Address: [email protected] INTRODUCTION
There has been a significant change in economic and socio-demographic structure of Nigerian population over the years (Carew, 2010). This includes change in household composition/size, increase in disposable income to shift in consumption habits, namely increase in the demand for meat, fruits and vegetable rather than tubers and grains and increase in consumption of food-away-from-home (FAFH) among others1. According to All Africa (2009), the consumption of FAFH comes with unmistakable rise in the number of fast food outlets at every street corner in highbrow and down town areas of urban and semi-urban areas within the last two decades in Nigeria. This observation however, is not only peculiar to Nigeria; it is a phenomenon that is wide spread in both the developed and developing countries. For example, Pingali (2007) revealed a rising popularity of FAFH in Asian countries, while Bai et al., (2012) argued that rising income and demographic factors contribute to increase in consumption of FAFH in China. A similar finding was also observe in Malaysia by Tan (2010), Turkey by Gal et al., (2007), and US by McCracken and Brandt (1987) and Liu et al., (2013) among others.
In Nigeria, available statistics show that fast food business has grown from a total of 25.2 billion in 2004 to 190 billion naira in 2009 (Carew, 2010), partly because fast food habit has gradually become part of the lifestyle of many Nigerians,
248
especially those in the urban centers (Esohe 2012). In addition, fast food culture is fast evolving among the various segments of the Nigerian society, especially the youths, members of the middle class and the rich (All Africa 2009). While, hectic lifestyle of many Nigerians in the urban centers would not allow the luxury of home cooked meals or food at home (FAH), households in the country also consume FAFH for birthday’s celebration and other social events as noted by Carew (2010).
Generally speaking, FAFH contains more calorie, total fat, saturated fat, and sodium and less micronutrients or/ fiber compared to food at home (FAH). Accordingly, nutritionists, economists, public health officials and policymakers are concern that consumption of more FAFH, relative to FAH likely to contribute to obesity epidemic, diabetes, cancer, heart disease and other none communicable diseases (Mancino et al., 2009; Zan and Fan, 2010; Davis, 2013). In recognition of this, National Labeling and Education (NLE) Act was introduced in 1994 with aim of providing legislative backing to the NLE policies introduce by the Federal Government of Nigeria (Bamiro, 2012). The NLE is an educational program designed to provide nutritional information on food purchase in the restaurants, canteens, and various fast food outlets in the country.
Given the rapid rise in FAFH consumption in Nigeria as revealed by Carew (2010), it is important to understand Nigerian household consumption of FAFH and its determinants that could be used as an input in formulating nutrition and health policy by public health officials and policymakers in the country. In this context, we believe investigating the demand characteristics of FAFH consumption could create an urgent need to identify factors that can provide a framework to develop programs and policies to reduce the consumption of FAFH in Nigeria. For example, there is growing body of research that the better educated households are more likely to employ a more efficient mix of heath inputs (Kenkel, 1991; Rosenzweig, 1995), which probably underscore policy relevance of education as important determinants of FAFH that could be explored in raising awareness on the consumption of unhealthy food such as FAFH in the society.
Based on this, the aim of the study is to investigate the demand characteristics of FAFH consumption in Nigeria. Specifically, this study makes a contribution to the empirical literature by examining the effect of year of schooling of household head on both the decision to consume FAFH and how much to spend on FAFH or the demand for FAFAH in the country. But a major weakness of this study is treating FAFH as a single composite food/item due to data limitation, as data use for the empirical analysis cannot be disaggregated by food facility and type of meal. Also due to the same reason, we ignore the role of price in the demand for FAFH similar to previous studies by McCracken and Brandt (1987), Zan and Fan (2010), Bai et al., (2012), and Liu et al., (2013) among others, as income is consider as only economic factor influencing the demand for FAFH consumption in the study. Hence, under the assumption of constant price, household demand for FAFH consumption is estimated within the framework of Engel curve in the study.
While, we acknowledge bias resulting from the omission of variable such as price in the sample, 2 we cannot for sure know if addition of this variable may increase or decrease the bias in the study (Clarke, 2005). Given this submission, we believe any danger poses by this omission can be ameliorated by inclusion of dummies representing the sector (rural) and the regions as relevant control variables in the study. In other words, we believe that inclusion of these dummies would not only cast light on the sectorial and regional differences in the demand for FAFH, but also control for any possible price differences in FAFH across the sectors and the regions in Nigeria. As noted by Clarke (2005), a key underlying assumption of the
249
danger posed by omitted variable bias can be redeemed by the inclusion of relevant control variables.
The rest of the paper is therefore organized as follows. The next section focuses on the review of literature on FAFH. Section 3 describes the data used in the study. Conceptual framework and empirical model are presented in section 4. Section 5 contains results and discussion, while conclusions are presented in section 6. A REVIEW OF LITERATURE ON FAFH The body of literature on the demand for FAFH consumption has grown in recent years across the globe (Davis, 2013), while scanty empirical evidence still exists in sub Saharan African (SSA). For example, most of the existing literature examining food consumption pattern in SSA has focused primarily on the household demand for food with very limited empirical works on the demand characteristics of FAFH consumption.
However, a review of the literature identify varieties of households’ economic and socio-demographic variables that can trigger change in consumption of FAFH, such as income, household composition and size, age cohorts, and opportunity cost of time among others (McCracker and Brandt 1987; Nayga and Capps 1994; Jensen and Yen 1996; Byrne et al., 1998; Dong et al., 2000; Stewart and Yen, 2004; Mutlu and Gracia, 2006; Ma et al., 2006; Binkley 2006; Ma et al., 2006;Fan et al., 2007; Angulo et al., 2007; Zan and Fan, 2010; Okrent and Alston, 2012; Bai et al., 2012; Richards and Mancino 2013; Liu et al., 2013; and Bozoglu et al., 2013 etc.). While a number of these studies disaggregated expenditure on FAFH by type of food facility, namely commercial restaurant, fast-food facilities and other commercial establishment (e.g., McCracker and Brandt 1987; Byrne et al., 1998; Stewart and Yen 2004; Mutlu and Gracia 2006; Bai et al., 2012; Richards and Mancino 2013), others disaggregated FAFH by type of meal, namely breakfast, lunch, and dinners (e.g., Jensen and Yen 1996; Nayga 1996; Bai et al., 2012; Liu et al., 2013) and by food categories, namely meat, grains, vegetable and fruit etc. (e.g., Ma et al., 2006; Okrent and Alston 2012). Also, there are studies that compare the demand characteristics of FAFH and FAH such as Okrent and Alston (2012) and Bozoglu et al., (2013).
Among the factors that are correlated with the demand for FAFH consumption, income/total expenditure has always been found to have significant positive impact on the consumption of FAFH in a review of over 25 FAFH studies by Davis (2013). Likewise, age has been found to have a significant negative association with the demand for FAFH by Nayga and Capps (1994), Dong et al., (2000), Binkley (2006), Fan et al (2007) and Liu et al., (2013), while Zan and Fan (2010) found evidence that households with later-born cohorts spend more on FAFH compared with households with earlier born-cohorts. In a related development, the role played by household composition/size in the demand for FAFH have been identified by McCracker and Brandt (1987), Min et al (2004) and Ma et al., (2010), while effect of time opportunity cost in the demand for FAFH has also been stressed by McCracker and Brandt (1987), Bai et al., (2012) and Liu et al., (2013).
250
DATA
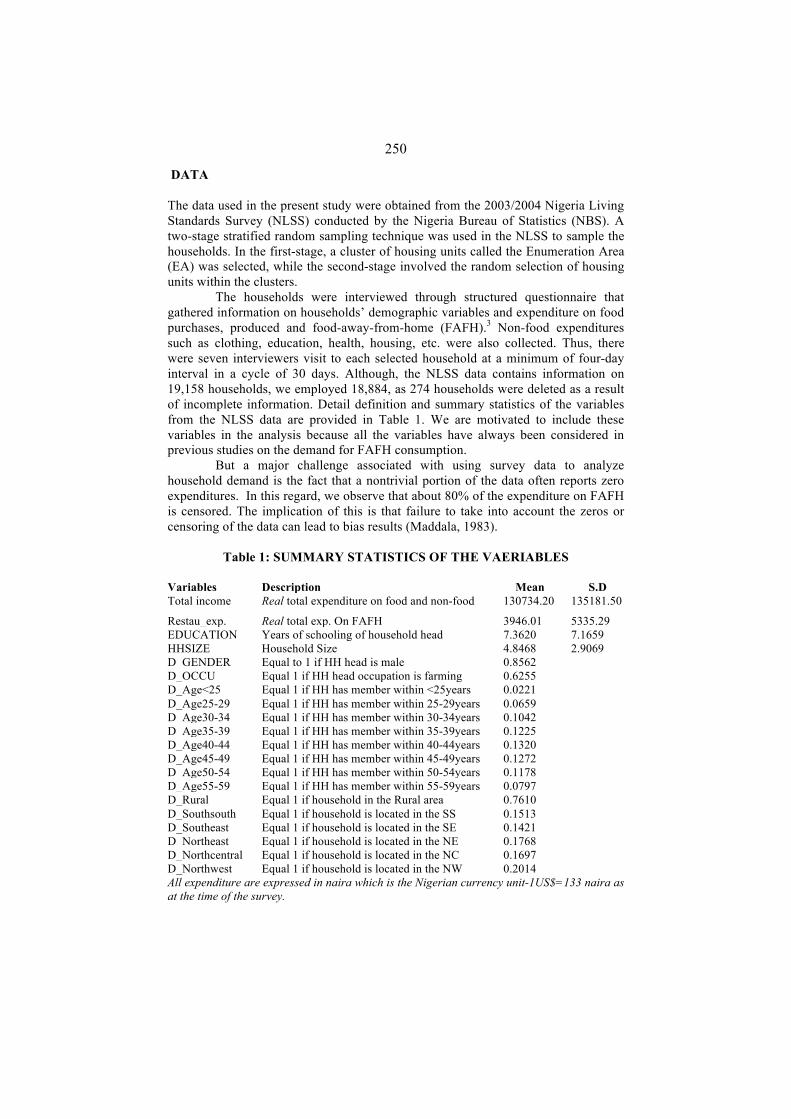
The data used in the present study were obtained from the 2003/2004 Nigeria Living Standards Survey (NLSS) conducted by the Nigeria Bureau of Statistics (NBS). A two-stage stratified random sampling technique was used in the NLSS to sample the households. In the first-stage, a cluster of housing units called the Enumeration Area (EA) was selected, while the second-stage involved the random selection of housing units within the clusters.
The households were interviewed through structured questionnaire that gathered information on households’ demographic variables and expenditure on food purchases, produced and food-away-from-home (FAFH).3 Non-food expenditures such as clothing, education, health, housing, etc. were also collected. Thus, there were seven interviewers visit to each selected household at a minimum of four-day interval in a cycle of 30 days. Although, the NLSS data contains information on 19,158 households, we employed 18,884, as 274 households were deleted as a result of incomplete information. Detail definition and summary statistics of the variables from the NLSS data are provided in Table 1. We are motivated to include these variables in the analysis because all the variables have always been considered in previous studies on the demand for FAFH consumption.
But a major challenge associated with using survey data to analyze household demand is the fact that a nontrivial portion of the data often reports zero expenditures. In this regard, we observe that about 80% of the expenditure on FAFH is censored. The implication of this is that failure to take into account the zeros or censoring of the data can lead to bias results (Maddala, 1983).
Table 1: SUMMARY STATISTICS OF THE VAERIABLES
Variables Description Mean S.D Total income Real total expenditure on food and non-food 130734.20 135181.50
Restau_exp. Real total exp. On FAFH 3946.01 5335.29 EDUCATION Years of schooling of household head 7.3620 7.1659 HHSIZE Household Size 4.8468 2.9069 D_GENDER Equal to 1 if HH head is male 0.8562 D_OCCU Equal 1 if HH head occupation is farming 0.6255 D_Age<25 Equal 1 if HH has member within <25years 0.0221 D_Age25-29 Equal 1 if HH has member within 25-29years 0.0659 D_Age30-34 Equal 1 if HH has member within 30-34years 0.1042 D_Age35-39 Equal 1 if HH has member within 35-39years 0.1225 D_Age40-44 Equal 1 if HH has member within 40-44years 0.1320 D_Age45-49 Equal 1 if HH has member within 45-49years 0.1272 D_Age50-54 Equal 1 if HH has member within 50-54years 0.1178 D_Age55-59 Equal 1 if HH has member within 55-59years 0.0797 D_Rural Equal 1 if household in the Rural area 0.7610 D_Southsouth Equal 1 if household is located in the SS 0.1513 D_Southeast Equal 1 if household is located in the SE 0.1421 D_Northeast Equal 1 if household is located in the NE 0.1768 D_Northcentral Equal 1 if household is located in the NC 0.1697 D_Northwest Equal 1 if household is located in the NW 0.2014 All expenditure are expressed in naira which is the Nigerian currency unit-1US$=133 naira as at the time of the survey.
251
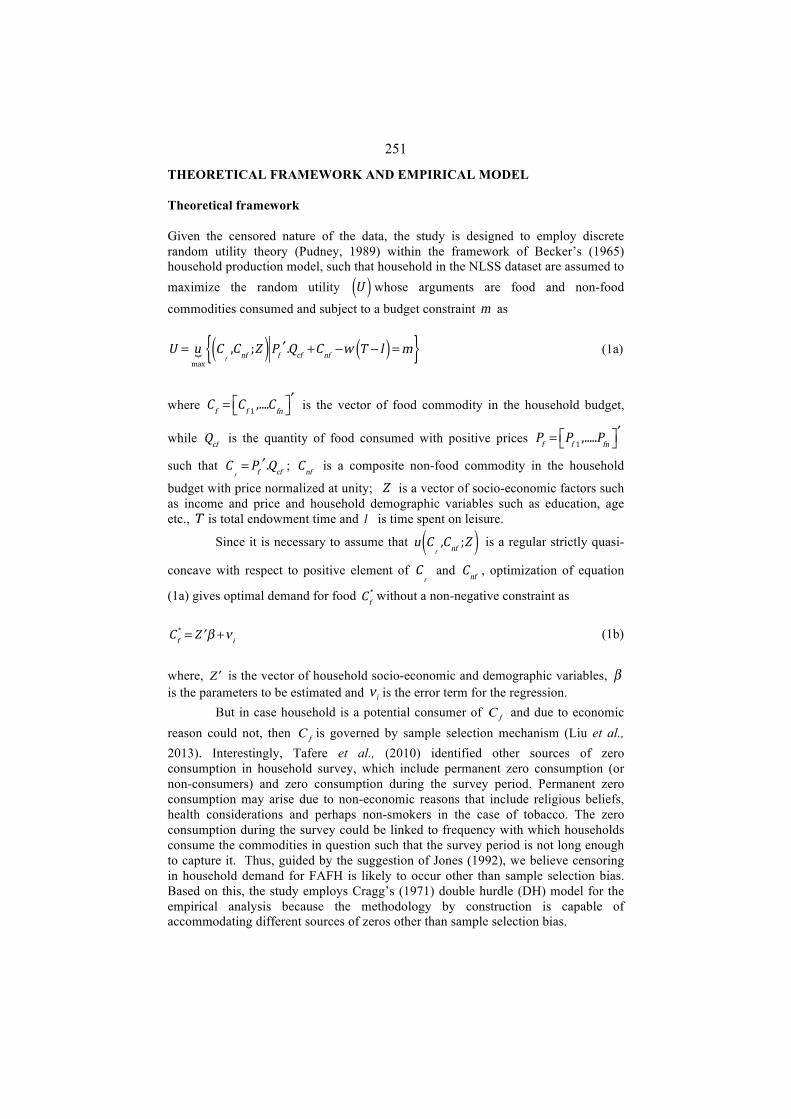
THEORETICAL FRAMEWORK AND EMPIRICAL MODEL Theoretical framework Given the censored nature of the data, the study is designed to employ discrete random utility theory (Pudney, 1989) within the framework of Becker’s (1965) household production model, such that household in the NLSS dataset are assumed to maximize the random utility ! U( ) whose arguments are food and non-food
commodities consumed and subject to a budget constraint !m as
!!U = u
max! C
f,Cnf ;Z( )Pf ′ .Qcf +Cnf −w T − l( ) =m{ } (1a)
where !!Cf = Cf 1 ,....Cfn⎡⎣ ⎤⎦′ is the vector of food commodity in the household budget,
while !Qcf is the quantity of food consumed with positive prices !!Pf = Pf 1 ,.....Pfn⎡⎣ ⎤⎦′
such that !!C f=Pf ′ .Qcf ; !Cnf is a composite non-food commodity in the household
budget with price normalized at unity; !Z is a vector of socio-economic factors such as income and price and household demographic variables such as education, age etc., !T is total endowment time and !l is time spent on leisure.
Since it is necessary to assume that !!u C
f,Cnf ;Z( ) is a regular strictly quasi-
concave with respect to positive element of !C f and !Cnf , optimization of equation
(1a) gives optimal demand for food !!Cf* without a non-negative constraint as
!!Cf* = ′Z β +ν i (1b)
where, ′Z is the vector of household socio-economic and demographic variables, βis the parameters to be estimated and ν i is the error term for the regression.
But in case household is a potential consumer of Cf and due to economic reason could not, then Cf is governed by sample selection mechanism (Liu et al., 2013). Interestingly, Tafere et al., (2010) identified other sources of zero consumption in household survey, which include permanent zero consumption (or non-consumers) and zero consumption during the survey period. Permanent zero consumption may arise due to non-economic reasons that include religious beliefs, health considerations and perhaps non-smokers in the case of tobacco. The zero consumption during the survey could be linked to frequency with which households consume the commodities in question such that the survey period is not long enough to capture it. Thus, guided by the suggestion of Jones (1992), we believe censoring in household demand for FAFH is likely to occur other than sample selection bias. Based on this, the study employs Cragg’s (1971) double hurdle (DH) model for the empirical analysis because the methodology by construction is capable of accommodating different sources of zeros other than sample selection bias.
252
Empirical Model Double Hurdle The earlier model for estimating censored dependent variable models is the Tobit model originally proposed by Tobin (1958). Cragg (1971) argued that Tobit model is restrictive because it assumes the decisions to consume FAFH and the demand for FAFH or how much to spend on FAFH (i.e., actual consumption) are governed by the same process. That is, Tobit model makes a very specific assumption about how these decisions are jointly made. In addition, the corner solution governed by Tobit mechanism means that censoring occur only when the respondent is a potential non-consumer of FAFH. In realization of the argument that decisions to purchase and how much FAFH to consume are not governed by the same process; Cragg proposed a double hurdle (DH) model. Unlike Tobit model, the DH model relaxes the assumptions that the zeros and the positive values come from the same data generating process (DGP).
According to Yen and Jones (1996), DH model allows for the possibility of zero observations, which could be due to any or combination of the following factors: (1) random effect (or data reporting problem), (2) the fact that the respondents are simply not interested in consuming FAFH (abstention) or (3) when the survey period is too short to allow consumers to report any purchase of a specific product (infrequency of purchase of products). These observations motivated the use of DH model in the present study. Meanwhile, a search of the literature shows that DH has been applied widely in the demand analysis. For example, Asteri et al., (2005), Ground and Koch (2008), and Moshoeshoe (2012) and Ogundari (2013) employed DH in the analysis of the demand for beverages. Likewise, Garcia and Labeage, (1996) and Yen and Jones (1996) for cigarette demand, Ogundari and Arifalo (2013) and Durham and Eales (2006) for the demand for fruits and vegetables, while Mutlu and Gracia (2006) and Bai et al., (2012) for the demand for FAFH.
The underlying data generating process (DGP) for DH model specified for household consumption of FAFH in the study can be described using the following two equations:
𝑑!∗ = 𝑍!!𝛿 + ζ!
di =
1 if di* > 0
0 if otherwise
⎧⎨⎪
⎩⎪ (2)
𝐶!!∗ = 𝑍!!𝛽 + τ! 4 Cfi = Cfi
* if di* > 0 and C fi
* > 00 if otherwise
⎧⎨⎪
⎩⎪ (3)
where, equation 2 represents what Cragg (1971) refers to as first hurdle model. It relates households’ decision to consume FAFH denoted by a dummy variable
d( )
to
a vector of exogenous variable ′Zk , which includes household income as the only economic factor consider, education of household head, household size, gender and occupation of household head, households within certain age cohorts and locations viz. rural and regions. The di
* is the unobserved latent variable that describes
whether household consumed FAFH or not, while di is the correspondent observed
253
variable. ζ i is the error term for equation 2. Equation 3 is the Cragg’s second hurdle,
where Cfi*
is the unobserved latent variable describing expenditure on FAFH, while Cfi is the corresponding observed expenditure on FAFH consumed by the households. The ′Z j is a vector of determinants of household expenditure on FAFH
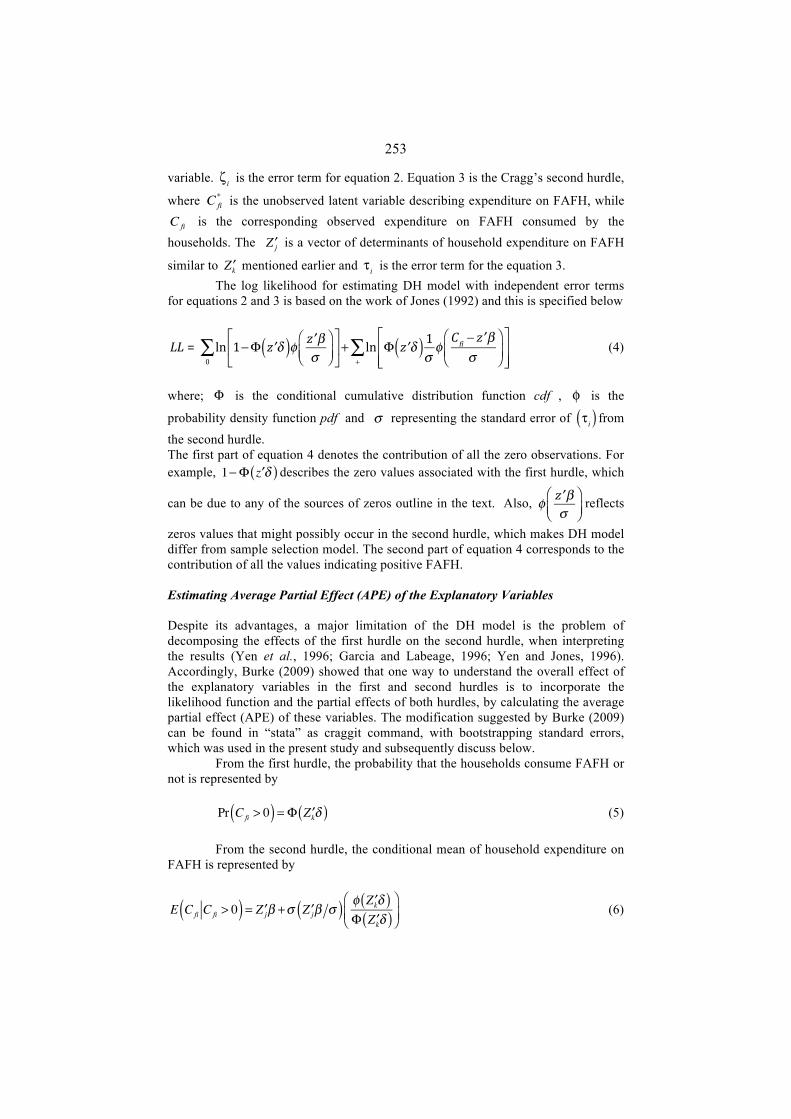
similar to ′Zk mentioned earlier and τi is the error term for the equation 3. The log likelihood for estimating DH model with independent error terms
for equations 2 and 3 is based on the work of Jones (1992) and this is specified below
!!LL!# ! ln
0∑ 1−Φ ′z δ( )φ ′z β
σ⎛⎝⎜
⎞⎠⎟
⎡
⎣⎢
⎤
⎦⎥+ ln Φ ′z δ( ) 1σ φ
Cfi − ′z βσ
⎛
⎝⎜⎞
⎠⎟⎡
⎣⎢⎢
⎤
⎦⎥⎥+
∑ (4)
where; Φ is the conditional cumulative distribution function cdf , φ is the
probability density function pdf and σ representing the standard error of τi( ) from
the second hurdle. The first part of equation 4 denotes the contribution of all the zero observations. For example, 1−Φ ′z δ( ) describes the zero values associated with the first hurdle, which
can be due to any of the sources of zeros outline in the text. Also, !φ ′z β
σ⎛⎝⎜
⎞⎠⎟
reflects
zeros values that might possibly occur in the second hurdle, which makes DH model differ from sample selection model. The second part of equation 4 corresponds to the contribution of all the values indicating positive FAFH. Estimating Average Partial Effect (APE) of the Explanatory Variables Despite its advantages, a major limitation of the DH model is the problem of decomposing the effects of the first hurdle on the second hurdle, when interpreting the results (Yen et al., 1996; Garcia and Labeage, 1996; Yen and Jones, 1996). Accordingly, Burke (2009) showed that one way to understand the overall effect of the explanatory variables in the first and second hurdles is to incorporate the likelihood function and the partial effects of both hurdles, by calculating the average partial effect (APE) of these variables. The modification suggested by Burke (2009) can be found in “stata” as craggit command, with bootstrapping standard errors, which was used in the present study and subsequently discuss below.
From the first hurdle, the probability that the households consume FAFH or not is represented by
Pr Cfi > 0( ) = Φ ′Zkδ( ) (5) From the second hurdle, the conditional mean of household expenditure on
FAFH is represented by
E Cfi C fi > 0( ) = ′Z jβ +σ ′Z jβ σ( ) φ ′Zkδ( )Φ ′Zkδ( )
⎛
⎝⎜⎞
⎠⎟ (6)
254
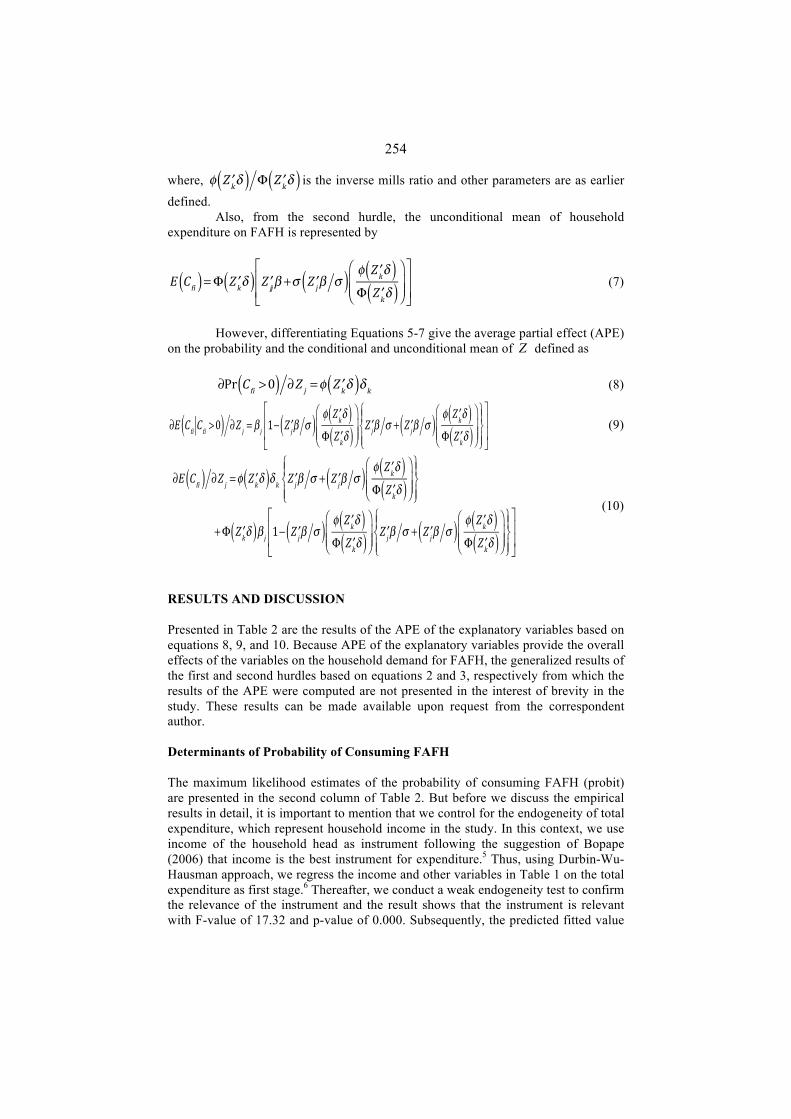
where, !φ ′Zkδ( ) Φ ′Zkδ( ) is the inverse mills ratio and other parameters are as earlier defined.
Also, from the second hurdle, the unconditional mean of household expenditure on FAFH is represented by
!E Cfi( ) =Φ ′Zkδ( ) ′Z jjβ +σ ′Z jβ σ( ) φ ′Zkδ( )
Φ ′Zkδ( )⎛
⎝⎜⎜
⎞
⎠⎟⎟
⎡
⎣⎢⎢
⎤
⎦⎥⎥
(7)
However, differentiating Equations 5-7 give the average partial effect (APE)
on the probability and the conditional and unconditional mean of Z defined as
!!∂Pr Cfi >0( ) ∂Z j =φ ′Zkδ( )δk (8)
!!∂E Cfi Cfi >0( ) ∂Z j = β j 1− ′Z jβ σ( ) φ ′Zkδ( )
Φ ′Zkδ( )⎛
⎝⎜⎜
⎞
⎠⎟⎟
′Z jβ σ + ′Z jβ σ( ) φ ′Zkδ( )Φ ′Zkδ( )
⎛
⎝⎜⎜
⎞
⎠⎟⎟
⎧⎨⎪
⎩⎪
⎫⎬⎪
⎭⎪
⎡
⎣
⎢⎢
⎤
⎦
⎥⎥ (9)
!!
∂E Cfi( ) ∂Z j =φ ′Zkδ( )δk ′Z jβ σ + ′Z jβ σ( ) φ ′Zkδ( )Φ ′Zkδ( )
⎛
⎝⎜⎜
⎞
⎠⎟⎟
⎧⎨⎪
⎩⎪
⎫⎬⎪
⎭⎪
!!!!!!!!!!!!!!!!!!+Φ ′Zkδ( )β j 1− ′Z jβ σ( ) φ ′Zkδ( )Φ ′Zkδ( )
⎛
⎝⎜⎜
⎞
⎠⎟⎟
′Z jβ σ + ′Z jβ σ( ) φ ′Zkδ( )Φ ′Zkδ( )
⎛
⎝⎜⎜
⎞
⎠⎟⎟
⎧⎨⎪
⎩⎪
⎫⎬⎪
⎭⎪
⎡
⎣
⎢⎢
⎤
⎦
⎥⎥
(10)
RESULTS AND DISCUSSION Presented in Table 2 are the results of the APE of the explanatory variables based on equations 8, 9, and 10. Because APE of the explanatory variables provide the overall effects of the variables on the household demand for FAFH, the generalized results of the first and second hurdles based on equations 2 and 3, respectively from which the results of the APE were computed are not presented in the interest of brevity in the study. These results can be made available upon request from the correspondent author. Determinants of Probability of Consuming FAFH The maximum likelihood estimates of the probability of consuming FAFH (probit) are presented in the second column of Table 2. But before we discuss the empirical results in detail, it is important to mention that we control for the endogeneity of total expenditure, which represent household income in the study. In this context, we use income of the household head as instrument following the suggestion of Bopape (2006) that income is the best instrument for expenditure.5 Thus, using Durbin-Wu-Hausman approach, we regress the income and other variables in Table 1 on the total expenditure as first stage.6 Thereafter, we conduct a weak endogeneity test to confirm the relevance of the instrument and the result shows that the instrument is relevant with F-value of 17.32 and p-value of 0.000. Subsequently, the predicted fitted value
255
of the instrumented-total expenditure is then used in the final analysis as household income in the study.
To this end, the results show that household income increases the probability of consuming FAFH significantly from zero, which indicates that any increase in household income increases the likelihood of consuming FAFH in the study. However, a search of the literature shows that our result conforms to the findings of Davis (2013) that reviewed over 25 literatures on FAFH and observes that most of the selected studies identified a positive correlation between income and probability of consuming FAFH. The result also lends support to the argument in the literature that growth in FAFH consumption has been associated with increase in income (Ma et al., 2006; Bai et al., 2010).
The results of households’ demographic determinants of the probability of consuming FAFH show that male-headed households appear to have higher probability of consuming FAFH in the sample, while the estimate is insignificantly different from zero. Other results show that educational level of household head, household size, and being households with farming as the main occupation of the head decrease significantly the probability of consuming FAFH. Since education could be taken as a proxy for consumer dietary knowledge and ability to process dietary information, the negative correlation of education of household head and probability of consuming FAFH may perhaps be an indication that educated household head are conscious of health implication of increase in consumption of fast food and therefore consume less. However, a search in the literature shows that the negative effect of household size in the present study conforms to the finding of Akbay et al., (2007), but contradict the finding of Bozoglu et al., (2013).
The results of age cohorts variables reveal that the probability of consuming FAFH is higher among households with younger age cohorts, compared to households with older age cohorts. This observation perhaps lends support to earlier argument that fast food culture is fast evolving among the youths and members of the middle class who happened to fall within <50 years age cohort in the country (see; All Africa, 2009; Esohe, 2012). In addition, we believe the result could as well be linked to what Zan and Fan (2010) referred to as age effect. The authors argued that people’s FAFH behavior changes as a result of their life cycle stages, which probably explain why they eat out more during young adulthood but reduce their FAFH, as they get older. Accordingly, households with large number of younger cohorts have higher expenditure on FAFH at any stage of life cycle, compared with households with large proportion of older cohorts.
Other results show that household in the rural areas appear to have lower probability of consuming FAFH compared to household in the urban areas. This result perhaps lends support to the earlier finding that households with farming as main occupation of the head are less likely to consume FAFH in Nigeria. But according to Bozoglu et al., (2013), the result of this nature is often expected because dining out is generally consistent with lifestyles of urban households that are seeking for convenience social gatherings and entertainment, while rural households are more inclined to eat at home or more specifically, as FAFH facilities are less accessible for rural households. Meanwhile, a search in the literature shows that our result contradicts the finding of Liu et al., (2013) that was carried out in United States of America, where food restaurants and other fast food joints can be found in both the rural and urban areas.
The regional dummies are all significantly different from zero, indicating that geographical location influences the probability of consuming FAFH in the sample.7 Specifically, the findings show that the probability of consuming FAFH is
256
lower among households in the following regions; South-South, South-East, North-East, North-Central, and North-West regions compared to household in South-West (reference) region of the country.
Determinants of Demand for FAFH Consumption The conditional and unconditional estimates of household demand for FAFH are given in the third and fourth columns of Table 2, respectively. But, we focus the discussion on the unconditional estimates, since they take into account the effects of both the decisions stages (i.e., decisions to consume and the demand for FAFH). Besides, a number of empirical studies on the application of DH model have based their discussion on this (see; Yen and Jones, 1996; Angulo et al., 2001).
To this end, our results show that household income increases the demand for FAFH in the sample. Specifically, it shows that 1% increase in household income increases the demand for FAFH by about 2.5%, which suggest that the demand for FAFH appears to be elastic or/ luxury good and significantly different from unity in the study. Because the demand for food is likely to differ across income groups, we further disaggregated the estimated income elasticities of demand for FAFH across different income groups (for brevity this result is not presented but can be requested from the first author). And the results show that the demand for FAFH remains luxury good across the income groups, albeit, it is lower among households in the poorer group compared to households in the wealthier group. This implies that irrespective of income group to which household belong, households in the sample considered the demand for FAFH to be luxury. But given the negative health implication of increase in consumption of fast food or FAFH as highlighted by Mancino et al., (2009), the estimated income elasticity of demand for FAFH in the present study considered to be luxury may probably be an indication of unmistakable prevalence of fast food culture among an average household in Nigeria. Given this, a search in the literature show that our result contradicts the findings reported by previous studies that considered the demand for FAFH to be necessity good by McCracker and Bradit (1987), Bai et al., (2012), and Liu et al., (2013), while it conforms to the finding of Ma et al., (2006), Angulo et al., (2007), and Zan and Fan (2010) that considered the demand for FAFH to be luxury good.
The results of households’ demographic determinants of the demand for FAFH show that education of household head decreases the consumption of FAFH in the study. This result probably confirms the hypothesis in the literature that the better educated households are more likely to employ a more efficient mix of health inputs (Kenkel, 1991; Rosenzweig, 1995). Meanwhile, in order to have a better insight into how education of household head influences the demand for FAFH, we disaggregated the APE of education on the demand for FAFH by different income groups. Subsequently this gives the magnitudes of APE of education on the demand for FAFH of about -0.11 and -0.20 for an average household in the poorer and wealthier groups, respectively in the sample (for brevity detail result is not presented but can be requested from the first author). These findings suggest that education reduces the demand for FAFH for the wealthier households twice as much as it does for the poorer households in the sample. The implication of this is that more educated household heads in the high-income group demand for less FAFH, compared to those in the low-income group in the sample. Other demographic determinants of the demand for FAFH show that households with higher size and households with farming as the main occupation of head have significant lower expenditure on FAFH. In contrast, male-headed households appear to have increased household expenditure
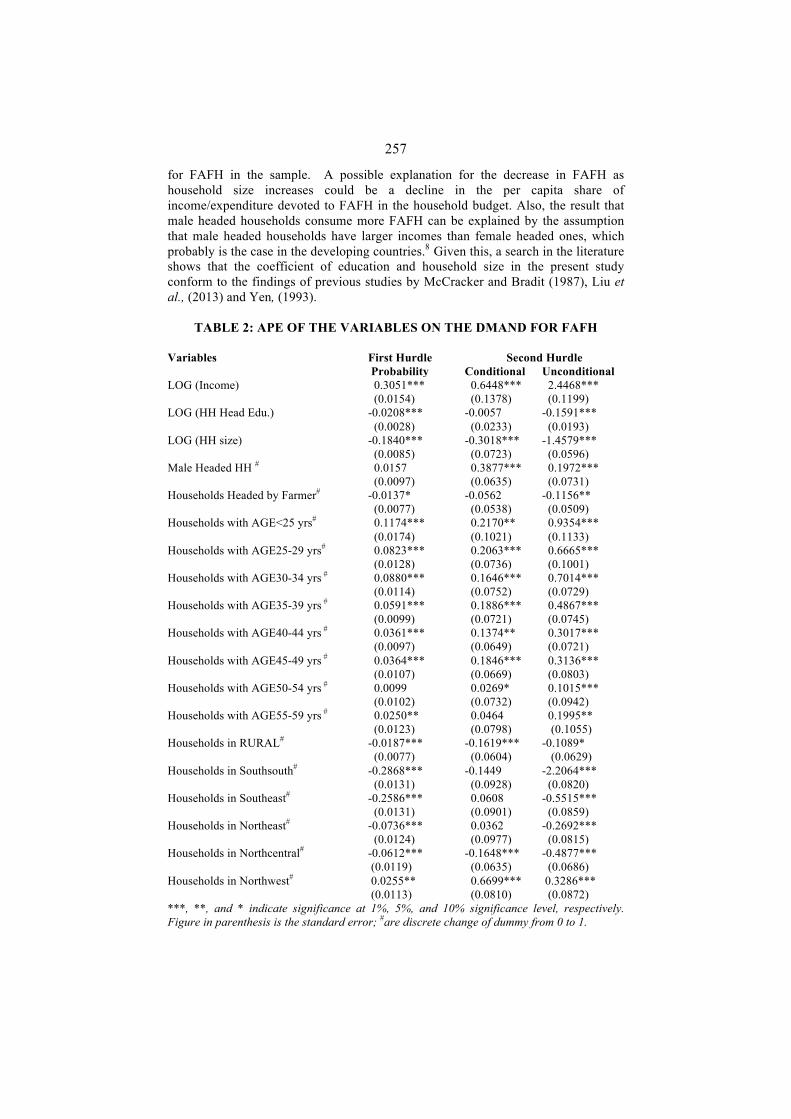
257
for FAFH in the sample. A possible explanation for the decrease in FAFH as household size increases could be a decline in the per capita share of income/expenditure devoted to FAFH in the household budget. Also, the result that male headed households consume more FAFH can be explained by the assumption that male headed households have larger incomes than female headed ones, which probably is the case in the developing countries.8 Given this, a search in the literature shows that the coefficient of education and household size in the present study conform to the findings of previous studies by McCracker and Bradit (1987), Liu et al., (2013) and Yen, (1993).
TABLE 2: APE OF THE VARIABLES ON THE DMAND FOR FAFH
Variables First Hurdle Probability
Second Hurdle Conditional Unconditional
LOG (Income) 0.3051*** (0.0154)
0.6448*** (0.1378)
2.4468*** (0.1199)
LOG (HH Head Edu.) -0.0208*** (0.0028)
-0.0057 (0.0233)
-0.1591*** (0.0193)
LOG (HH size) -0.1840*** (0.0085)
-0.3018*** (0.0723)
-1.4579*** (0.0596)
Male Headed HH # 0.0157 (0.0097)
0.3877*** (0.0635)
0.1972*** (0.0731)
Households Headed by Farmer# -0.0137* (0.0077)
-0.0562 (0.0538)
-0.1156** (0.0509)
Households with AGE<25 yrs# 0.1174*** (0.0174)
0.2170** (0.1021)
0.9354*** (0.1133)
Households with AGE25-29 yrs# 0.0823*** (0.0128)
0.2063*** (0.0736)
0.6665*** (0.1001)
Households with AGE30-34 yrs # 0.0880*** (0.0114)
0.1646*** (0.0752)
0.7014*** (0.0729)
Households with AGE35-39 yrs # 0.0591*** (0.0099)
0.1886*** (0.0721)
0.4867*** (0.0745)
Households with AGE40-44 yrs # 0.0361*** (0.0097)
0.1374** (0.0649)
0.3017*** (0.0721)
Households with AGE45-49 yrs # 0.0364*** (0.0107)
0.1846*** (0.0669)
0.3136*** (0.0803)
Households with AGE50-54 yrs # 0.0099 (0.0102)
0.0269* (0.0732)
0.1015*** (0.0942)
Households with AGE55-59 yrs # 0.0250** (0.0123)
0.0464 (0.0798)
0.1995** (0.1055)
Households in RURAL# -0.0187*** (0.0077)
-0.1619*** (0.0604)
-0.1089* (0.0629)
Households in Southsouth# -0.2868*** (0.0131)
-0.1449 (0.0928)
-2.2064*** (0.0820)
Households in Southeast# -0.2586*** (0.0131)
0.0608 (0.0901)
-0.5515*** (0.0859)
Households in Northeast# -0.0736*** (0.0124)
0.0362 (0.0977)
-0.2692*** (0.0815)
Households in Northcentral# -0.0612*** (0.0119)
-0.1648*** (0.0635)
-0.4877*** (0.0686)
Households in Northwest# 0.0255** (0.0113)
0.6699*** (0.0810)
0.3286*** (0.0872)
***, **, and * indicate significance at 1%, 5%, and 10% significance level, respectively. Figure in parenthesis is the standard error; #are discrete change of dummy from 0 to 1.
258
The estimates for the age cohorts also reveal that households with younger members spend more on FAFH, compared to households with older members. Specifically, the result show that households with members < 50 years of age patronize fast food more in the sample. This observation may be linked to what Zan and Fan (2010) referred to as age effect-considered by the authors as the reason why individual eat out more during young adulthood but reduce their FAFH, as they get older. Other results show that households in the rural areas demand for less FAFH, compared to households in urban areas. This result lends support to earlier finding in the study that households with farming as major occupation of the head spend less on FAFH. Interestingly, a search in the literature shows that our results contradict the finding of Bryne et al., (1996) and Liu et al., (2013) that households in urban areas consume less FAFH than rural counterparts.
Furthermore, the coefficient of regional dummies, which not only capture regional differences in household expenditure on FAFH, but possibly control for the variation in market environment and food prices on the demand for FAFH in the sample, show that household demand for FAFH is significantly lower in the following regions; South-south, South-East, North-East, North-Central, and North-West regions, compared to household in South-West region of the country. CONCLUSIONS The study investigated the demand characteristics of household consumption of FAFH in Nigeria, using double hurdle model based on the 2003/2004 Nigeria Living Standard Survey (NLSS) data. The empirical results show a negative correlation between education and the probability of consuming FAFH and the demand for FAFH in the study. Household income was found to exert a positive impact on the likelihood of consuming FAFH and the demand for FAFH. In addition, the estimated income elasticity was significantly greater than unity, thus indicating that the demand for FAFH consumption belongs to the luxury good in Nigeria. Other results reveal that households with younger members are more likely to consume and demand for FAFH, compared to households with older members in the sample. We also gain an understanding of differences in the consumption of FAFH across the sector (i.e., rural vs. urban) and regions in the country. Meanwhile, from the food and health policy standpoint, we believe the findings have provided a better understanding of household socio-economic characteristics that are essential in driving FAFH consumption and its implications on consumer health in Nigeria. Accordingly, an interesting finding from the study is the observation that one additional year of education of household head decreases household demand for FAFH in the sample. In this respect, the study suggests, the introduction of more focused and multifaceted educational program as a potential tool to raise public awareness on the negative health implication of increase in consumption of unhealthy food with high level of calories, total fat, sodium, and unsaturated fat such as FAFH in the country. Although, not the primary focus of the present study, but a number of countries have introduced a set of policies in recent time such as imposition of surcharge on the purchase of fast food/drink in New York USA and Mexico. In this context, we believe introduction of similar measure with a full legislative backing coupled with educational programs could prove effective in changing public attitude towards fast food culture in Nigeria.
259
ENDNOTES *Acknowledgements The first author gratefully acknowledges the financial support of the Alexander von Humboldt (AvH) Foundation towards his postdoctoral fellowship at the Dept. of Food Economics and Consumption Studies, University of Kiel, Germany, where this study was carried out between 2010/2012. He equally, thanks the Nigerian Bureau of Statistics (NBS) for providing access to the Nigeria Living Standard Survey (NLSS) 2003/2004 data used for the analysis in this paper. Likewise, he would like to thank Prof. Dr. Awudu Abdulai for hosting him during this period. The authors thank the anonymous reviewer for their thoughtful comments and suggestions on the earlier draft of this paper. The views in this paper are the authors’ own and do not necessarily represent those of the AvH, University of Kiel, and NBS. 1FAFH is food bought from food service provider such as a full service restaurant or a fast food restaurant (Davis, 2013). 2We thank the anonymous referee for bringing our attention to this point. 3The household expenditure on FAFH in the NLSS data has been aggregated in the data and thus, it includes household expenditure on fast food such as all kinds of pastries, French fries, fried chicken, chicken nugget and ice cream, and soft drink among others; take away food. FAFH could also be food at local restaurant and at the cafeterias. 4Equation 3 is similar to equation 1b. But due to data limitation as earlier mentioned in the text, equation 3 is expressed as a typical Engel curve specified for the demand for FAFH consumption under the assumption of constant price in the study. 5The NLSS contains detail information on income of household head as information on income of other members of households are not provided. 6For brevity, the result of the first stage regression is not presented and this could be requested from the correspondent author. 7It is important to mention that the six geographical classifications in Nigeria, which present study follow is based on geopolitical zones rather than economic classifications such as incidence of poverty, per capita GDP etc. 8We thank the anonymous referee for bringing our attention to this point. REFERENCES Akbay, C., G.Y. Tiryaki, A. Gül, (2007). Consumer characteristics influencing fast food consumption in Turkey. Food Control 18 (8), 904–913. All Africa (2009). Nigeria: The rising fast food culture. The article was published in All Africa edition of 9th April 2009. Angulo, A M., J. M. Gil and J. Mur (2007). Spanish demand for food away from home: analysis of panel data. Journal of Agricultural Economics, Vol. 58(2): 289-307. Angulo, A.M., J.M. Gil and A. Gracia (2001). The demand for alcoholic beverages in Spain. Agricultural Economics 26:71-83. Asteri, D., F. Perali and L. Pieroni (2005). Cohort, Age and Time effects I Alcoholic consumption by Italian Households: A double Hurdle approach. Paper presented at the 97th EAAE seminar titled ‘ The Economic and Policy of Diet ad Health’ University of Reading 21-22 April 2005. Bai, J., C. Zhang, F. Qiao, and T. Wahl (2012). Disaggregating household expenditure of food away from home in Beijing by type of food facility and type of meal, China Agricultural Economic Review, Vol. 4 (1): 18-35. Bamiro, M. O. (2012). Determinants of consumption of Food Away from Home in Lagos Metropolis, Nigeria. Research Journal of Social Science and Management, Vol. 2:15-23. Becker, G. S. (1965). Theory of allocation if time. Economic Journal, Vol. 75: 493-508.
260
Binkley, J. K (2006). The effect of demographic, economic and nutrition factors on the frequency of food away from home. Journal of consumer Affairs, Vol. (40): 372-391. Bopape, L. E (2006). The influence of demand model selection on household welfare: An application to South Africa food expenditure. A published dissertation submitted to Michigan State University in partial fulfillment for the degree of Doctor of philosophy, Dept. of Agricultural Economics. Bozoglu, M., A. Bilgic, S. T. Yen and C.L. Huang (2013). Household food expenditure at home and away from home in Turkey, Selected paper prepared for presentation at the Agricultural and Applied Economics Association (AAEA) and CAES joint Annual meeting, Washington DC, August 4-6 2013. Burke, W. J (2009). Fitting and interpreting Cragg’s Tobit alternative using Stata. The Stata Journal, Vol. 9 (4): 584-592. Byrne, P.J., J. R. Capps and A. Saha (1998). Analysis of quick serve, mid scale and up-scale food away from home expenditures. The International food and Agribusiness Management Review, Vol. 1: 51-72. Byrne, P.J., J. R. Capps and A. Saha (1996). Analysis of food-away-from-home expenditure patterns for U.S. households 1982-89. American Journal of Agricultural Economics, Vol. 78(3): 614-627. Carew, F (2010). The winning formula for Nigerian fast food players. New print from Ciuci Consulting, August 2010 edition. Clarke, K.A (2005). The Phantom Menace: Omitted variable Bias in Econometric Research. Conflict Management and Peace Science, Vol. 22: 341-352. Cragg, J. G (1971). Some statistical models for limited dependent variables with application to the demand for durable goods. Econometric 39 (5): 829-844. Davis, G (2013). Food at home production and consumption: Implications for nutrition quality and Policy. Review of Economics Households. D0110.1007/s11150-013-9210-0. Dong, D., P. J. Byrne, A. Saha and O. Capps (2000). Determinants of food away from home (FAFH) visit frequency: a count-data approach. Journal of Restaurant and Foodservice Marketing, Vol. 4: 31-46. Durham, C and J. Eales (2006). Demand elasticities for fresh fruit at the retail level. Applied Economics, Vol. 42(2): 1345-1354. Esohe, K. P (2012). Increasing trends in the consumption of Fast-foods in Nigeria, An international Journal of Arts and Humanities, Vol. 1(1): 95-109. Fan, J. X., B.L.Brown, L. Kowalesk-Jones, K. R. Smith and C. D. Zick (2007). Household food expenditure patterns: A cluster analysis. Monthly Labour Review, Vol. 130: 38-51. Gal, A., C. Akbay, C. Ozcicek, R. Ozel, and A. O. Akbay (2007). Expenditure pattern for food away from home consumption in Turkey. Journal of International Food and Agribusiness Marketing, Vol. 19(4): 31-43. Garcia, J and J.M. Labeaga (1996). Alternative approaches to modeling zero expenditure: an application to Spanish demand for Tobacco. Oxford Bulletin of Economics and statistics 58(3):489-504. Ground, M and S. F. Koch (2008). Hurdle models of Alcohol and Tobacco expenditure in South Africa Households. South African Journal of Economics, Vol. 76(1): 132-143. Jensen, H.H and S. T. Yen (1996). Food expenditure away from home by type of meal, Canadian Journal of Agricultural Economics, Vol. 44: 67-80.
261
Jones, A (1992). A note on computation of the double hurdle model with dependence with an application to tobacco expenditure, Bulletin of economic Research, Vol. 44 (1): 67-74. Kenkel, D. S. (1991). Health Behavior, Health Knowledge and Schooling. Journal of Political Economy, Vol. 99: 287-305. Liu, M., P. Kasteridis and S. T. Yen (2013). Breakfast, lunch, and dinner expenditure away from home in the United States. Food Policy 38: 156-164 McCracken, V. A and J. A. Brandt (2007). Household consumption of Food-Away from-Home: Total expenditure and by Type of Food Facility, American Journal of Agricultural Economics, Vol. 69(2): 274-284. Maddala, G.S. (1983). Limited dependent and qualitative variables in Econometrics, Cambridge University Press. Ma, H., J. Huang, F. Fuller and S. Rozelle (2006). Getting rich and eating out: consumption of food away from home in urban China. Canadian Journal of Agricultural Economics, Vol. 54: 101-119. Min, I., C. Fang and Q. Li (2004). Investigation of patterns in food-away-from-home expenditure for China. China Economic Review, Vol. 15: 457-476. Moshoeshoe, R (2012). Consumer demand for alcohol beverages and tobacco in Lesotho: A double-hurdle approach. Economic Research Southern Africa (ERSA) Working paper No.135. Mancino, L. J. Todd and B. H. Lin (2009). Separating what we eat from where: measuring the effect of food away from home on diet quality. Food Policy, Vol. 34(6): 557-562. Mutlu, S and A. Gracia (2006). Spanish food expenditure away from home (FAFH): by type of meal. Applied Economics, Vol. 38: 1037-1047. Nayga, R. M (1996). Analysis of food away from home expenditures by real occasion. Agribusiness, Vol. 12: 421-427. Nayga, R. M and O. Capps (1994). Impact if socio-economic and demographic factors on food away from home consumption: Number of meals and Type of facility. Journal of Restaurant and Foodservice marketing, Vol. 1: 45-69. Ogundari, K. (2013). A Note on Socio-Economic Characteristics and Demand for Beverages in Nigeria: Does Income matter? Economic Analysis and Policy, Vol. 43 (3): 293-301. Ogundari. K and S. F. Arifalo (2013). Determinants of household demand for fresh fruit and vegetable in Nigeria: A double hurdle approach. Quarterly Journal of International Agriculture, Vol. 52(3): 199-216. Okrent, A. M and J. M. Alston (2012). The demand for disaggregated Food-away-from-home and Food-at-home products in the United States. United states Department of Agricultural Economic Research Report Number 139. August 2012. Pingali, P (2007). Westernization of Asian diets and the transformation of food systems: implications for research and policy. Food policy, Vol. 32(3): 281-298. Pudney, S (1989). Modelling individual choice. The Econometrics if corners, Kinks, and Holes. Blackwell Publishers, Cambridge, UK. Richards, T. J and L. Mancino (2013). Demand for food away from home: a multiple-discrete continuous extreme value model. European Review of Agricultural Economics. Doi 10.1093/erae/jbt008 Rosenzweig, M. R (1995). Why are there returns to schooling? American Economic Review, Vol. 85: 153-158. Stewart, H., N. Blisard, S. Bhuyan, and R.M. Nayga Jr (2004). The Demand for food away from home: full-service or fast food? USDA Economic Research Service Report AER-829.
262
Stewart, H and S. T. Yen (2004). Changing household characteristics and the away-from-home food markets: a censored equation systems approach. Food Policy, Vol. 29: 634-658. Tan, A. K. G (2010). Demand for food away from home in Malaysia: a simple selection analysis by ethnicity and gender. Journal of food service Business Research, Vol. 13(3): 252-267. Tafere,K., A. S. Taffesse, S. Tamiru, N. Tefera and Z. Paulos (2010). Food demand Elasticities in Ethiopia: Estimates using Household income consumption expenditure (HICE) survey data. Ethiopia Strategy Support Program II Working paper No.011, IFPRI. Tobin, J. (1958). Estimation of relationships for limited dependent variables, Econometrica Vol. 46(1): 24-36. Yen, S. T and A. Jones (1996). Individual cigarette consumption and addiction: A flexible limited dependent variables approach, Health Economics, Vol. 5: 105-117. Yen, S. T., H. H. Jensen and Q. Wang (1996). Cholesterol information and egg consumption in the US: A non-normal and heteroskedastic double hurdle model. European Review of Agricultural Economics, Vol. 23: 343-356. Yen, S. T (1993). Working wives and food away from home: the Box-Cox double hurdle model. American Journal of Agricultural Economics, Vol. 75(4): 884-895. Zan, H and J. Fan (2010). Cohorts effects of household expenditure on food away from home. The Journal of consumer affairs, Vol. 4(1): 213-233.