An Exploratory Study into Work-Life Balance Mechanisms of Women in the Nigerian Banking Industry
Upload
khangminh22Category
view
1download
0
This PDF is a selection from an out-of-print volume from the National Bureau of Economic Research
Volume Title: Hours of Work in American Industry
Volume Author/Editor: Leo Wolman
Volume Publisher: NBER
Volume URL: http://www.nber.org/books/wolm38-1
Publication Date: 1938
Chapter Title: Hours of Work in American Industry
Chapter Author: Leo Wolman
Chapter URL: http://www.nber.org/chapters/c4124
Chapter pages in book: (p. 1 - 20)
brought to you by COREView metadata, citation and similar papers at core.ac.uk
provided by Research Papers in Economics

BUREMI t:iF flESUtRCII
L
National Bureau
of EconOmic Research• BULLETIN 71
NOVEMBER 27, 1938
• /fc 4 NONPROFIT CORPORATION FOR IMPARTIAL STUDIES IN ECONOMIC AND SOCIAL
1819 BROADWAY, NEW YORK
LEO WOLMAN
• It is a commonplace of the economic history of industrialCountries during the last century that the hours of workof nearly all classes of employees have been radically andprogressively reduced. In 1851 the union of newspapercompositors in New York City recommended to the news-paper industry of that city a work week of six 12-hourdays, or 72 hours'; in 1938 their w-eek wras 373/2 hours.Within the last century the printer's week was thus re-duced almost one half, the shortening by 343/2 hours rep-•resenting more than four 8-hour days. Employees in blastfurnaces were expected to work a full time week of 841hours as late as the turn of the last century, and have:since seen their hours reduced to 40. From 1890 to 1937,.a period during which records of hours of work have,tended to become more complete and, on the whole, morereliable, the average length of the work week of factoryemployees in the United States declined from 60 to prob-ably 42 hours, or 18 a week; of labor in the buildingtrades from 55 to 39, or 16 a week; of steam railroad em-ployees from 60 to 48, or 12 a week; and of anthraciteand bituminous coal miners from 60 to 35, or 25 hoursa week.
A full account of the decline in the length of the work-• ing week and the circumstances attending it is not avail-
able and cannot be had without considerable tyesearchtending back to the early history of American industry.From the historical records it appears that thewas at first gradual and cumulative. Since 1890, however,there have been two periods in which considerable cuts inhours were made during relatively brief spans of time. Thefirst was during the World 'War, 1914-20, when the average1 'Scale of Prices of the Printers Union of the City of New York',proclaimed February 1, 1851, in History of Wages in the 'UnitedStates from Colonial Times to 1928, U. S. Bureau of Labor Statis-
( tics, Bulletin 499 (October 1929). The prices and schedules offlours that were covered in this document were proclaimed by. theunion, but there is no evidence that they were accepted and,hence, enforced by employers. There is reason to think, therefore,that the hours actually worked by newspaper compositors in NewYork City, in 1851 may have exceeded 72 a week.
full time hours of factory employees declined from 55.1 to51.0 a week; the second was the. recent, and in this re-spect more spectacular, period of the N.R.A., 1933-35,when the average length of the prevailing work week inmanufacturing industries was reduced by approximately 8hours, from roughly 50 to about 42 hours.
The factors that help to explain and are responsiblefor these changes in working hours are many. Reductionsin hours during the World War, and in similar periodsof intense business activity, were in part the result ofcompetition among industries for labor. For in such peri-ods concessions in hours, like increases in wage rates, re-flected the state of the labor market. Throughout theirhistory, also, organized labor movements of all typeshave consistently advocated shorter work days and weeks.In trade union doctrine arguments for the reduction ofhours have always occupied a central position—in partbecause the unions wished to give their members relieffrom the drudgery of labor and to win for them greaterleisure, and, chiefly, because most unions saw in fewerper 'capita hours an approach to the solution or, at anyrate, mitigation of the problem of unemployment. While,therefore, the gains in this direction were often made inyears of prosperity when business was good and employ-ment full and the added costs could be most readily ab-sorbed, the incentive to reduce hours received its impetusin the antecedent period ' of depression , and unemployment.
With the passage of time the reasons for a shorter work-ing period became more elaborate and refined and the con-ditions under which concessions in hours might be grantedapparently more frequent and widespread. The observedincrease in per capita and man-hour output in the decade1919-29 produced important revisions in both lay andprofessional opinion as to the function and benefits of pro-gressively shorter periods of work. The American Federa-tiön of Labor, regarding the increased productivity of in-dustry as a cause of the displacement of labor and,' hence,of an increasing rate of unemployment, saw in the reduc-
Hours of Work in American IndustryCop,ritht 1938, National Bureau of Economic Research, Inc.
N4TIONAL BUREAU OF ECONOMIC RESEARCH BULLETINS—Annual Subscription (Five Issues), $1.00Single copies, this issue, twenty-five cents

2 National Bureau of Economic Research
Table 1
Major Categories of IndustryAverage Full Time Hours of Work per Week, 1890-1937
Figures for 1909-29 computed from frequency publishedthe various years; 1899 and 1904 from Paul F. Brissenden, Earnings ofMonographX, 1929), p. 354.a Covers 24 manufacturing industries; does not include iron and steel.
in the U. S. Census of Manufaciures forFaciory Workers, 1899-1927, (U. S. Census
'Not strictly comparable with figures for earlier years; covers 27 industries, iron and steel, petroleum reliningand cement having been added in.1937 to the original 24.
Manufacturing IndustriesNational .
IndustrialCensus of Con- Dept. of • . Coal Mining
Manu-Year facto res'
ferenceBoard'
Commerceand Labor'
BuildingTrades5
SteamRailroads'
Anthracite, Bitumin-union hours' ous'
(.
1890 59.9 55.2 60.0 60.0 60.01891
• 59.8 54.3 60.0 60.0 60.01892 60.0 54.3 60.0 60.0 60.07893 59.7 54.2 60.0 60.0 60.01894 59.3 54.3 60.0 60.0 60.0
1895 59.6 54.0 60.0 60.0 60.01896 59.5 53.8 60.0 60.0 60.01897 59.4 • 53.6 60.0 60.0 60.01898 59.6 53.3 60.0 60.0 52.81899 59.6 59.4 52.6 60.0 60.0 52.7
1900 59.1 52.0 60.0 60.0 52.61901 58.8 51.0 60.0 60.0 52.41902 58.5 50.2 60.0 60.0 52.31903 58.0 50.3 60.0 54.0 52.21904 57.9 60.0 54.0 51.7
1905 60.0 54.0 51.81906 . 60.0 54.0 51.71907 47.4 60.0 54.0 51.67908 46.7 60.0 54.0 51.71909 56.8 46.0 60.0 54.0 51.6
1910 45.5 . 60.0 54.0 51.91911 45.3 60.0 54.0 51.81922 45.2 60.0 54.0 51.91973 . 45.1 60.0 54.0 51.71914 55.1 54.9 449 60.0 54.0 51.8
'b1925 • 44.9 60.0 54.0 51.81916 44.7 60.0 48.0 51.91927 . 44.6 60.0' 48.0 49.71978 : 44.3 48.0 .. 4.8.71919 50.8 44.1 48.0' 48.0 48.4
1920 49.9 • 43.9 48.0 48.0 48.27921 50.3 49.6 . 43.9 48.0 48.0 48.21922 4.9.9 43.9 48.0 48.0 48.41923 51.1 49.9 43.9 • 48.0 48.0 48.41921 49.7 . 43.9 48.0 . 48.0 • 48.5
1925 49.8 43.9 48.0 48.0 48.51926 49.8 43.8 48.0 48.0 48.47927 49.5 . 43.7 48.0 48.0 48.51928 49.6 . 43.5 48.0 48.0 48.51929 50.6 49.6 43.1 48.0 48.0 48.5
1930 48.6 41.9 48.0 48.0 48.51931 48.0 41.4 48.0 48.0 48.51932 47.9 40.6 48.0 48.0 48.67933 . 40.5 48.0 48.0 40.01931 39.0 48.0 48.0 35.1
1935 • 38.7 48.0 48.0 35.1.7936 . 38.7 48.0 . 48.0 35.11937 • • 40.8' 38.9 48.0 35.0 35.0'°

Hours of Work 'Sin American Industry 3
tion of the work week the most effective means of returningthe unemployed to employment. At the same time the viewbecame more generally accepted that the expanding outputof 'mass-production' industries could be absorbed only bymembers of a working population who enjoyed more lei-
[(1' sure and higher rates of pay.The onset and unfolding of the depression of 1929-32
again shifted the emphasis to the value of reduced schedulesof hours as a direct attack on the problem of unemploy-ment. Organized labor continued with greater vigor thanpreviously its campaign for a shorter work week, althoughit was then not strong enough to make its policies prevail.Chart I
Employers, likewise, faced by the unusual shrinkage in em-plovrnent that marked the years 1930-33, turned to thismeasure as a device for spreading such employment asthere was among as many employees as possible and, as atemporary expedient at least, accepted the view that fewerper capita hours meant more men employed. Some prom-inent employers, in fact, organized a national committeeto encourage the adoption of shorter schedules of work.Through their initiative the 'share-the-work' movement as-sumed substantial proportions and, because of it, workspreading was probably more extensively practiced in thisthan in earlier depressions of this country.
MAJOR CATEGORIES OF INDUSTRIESAVERAGE PER CAPITA FULL TIME HOURS OF
1914, 1919, 19a9, AND 1937Manufacturing Building Trades.
Hours
1890 1919 1929 1937 1890 1914 1919 1929 1937 1890 1914 1919 1929 1937 1890 1914 1919 1929 1937
(Footnotes to Table I concluded)
'Averages, weighted by number of employees covered, computed' from figures published in the Nineteenth AnnualReport of the U. S. Commissioner of Labor (1904), covering 456 occupations in 48 industries.
'Figures for 1890-1903 are averages, weighted by number of employees covered, computed from data for 19individual occupations published in the Nineteenth Annual Report of the U. S. Commissioner of Labor (1904). It isnot reported whether these are union or non-union hours, but probably they actually represent the levels of hoursestablished by the unions. Figures for 1907-37 are computed from index numbers of average union hours of workin the building trades published by the U. S. Bureau of Labor Statistics in the Monthly Labor Review, Novem-ber 1937, p. 1156.
'Estimated by assuming a 10-hour day, 1890-1917, an 8-hour day, 1919-37, and a 6-day week throughout.
Prior to federal control, which lasted from December 27, 1917 to March 1, 1920, railroad employees generallyworked a 10-hour day (sometimes a 9-hour day). This is subject to the important exceptions (1) that numerousrailroads already had 'working agreements with their shop employees recognizing the 8-hour day, and (2) thebasic S-hour day had been established in 1917 for employees in train and engine service. By a series of regu-lations during 1918, the 8-hour day was formally extended to cover other classes of railroad labor. See Walker D.Hines, War History of American Railroads (Yale University Press, 1928), p. 189.
'Figures for 1902-37 compiled from union agreements as given in the Report of the U. S. Coal Commission, Part iiand in the U. S. Bureau of Labor Statistics, Monthly Labor Review; figures for 1890-1901 estimated. The 9-hourday, 6-day week became effective April 1, 1903; the 8-hour day, 6-day week, on April 1, 1916; the 7-hour day,5-day week, on May 1, 1937.
Figures for 1903-36 computed from data published in the U. S. Bureau of Mines, Minerals Yearbook, 1937, p. 823.They refer to hours worked by the mines rather than by the men. Figures for 1590-1902 from Paul H. Douglas,Real in the United States, 1890-1926 (Houghton—Mifflin Company, 1930), p. 150. The 8-hour day, 5-dayweek became effective on October 2, 1933; the 7-hour day, 5-day week, on April 1, 1934.
Estimated on the basis of the Appalachian Agreement which became effective on April 2, 1937 and provided forthe continuation of the 7-hour day, 5-day week.
WORK PER WEEK
Steam Railroads Anthracite Mining Bituminous MiningHours,
1890 1914 1919 1929 1937

4 National Bureau of Economic Research
These various theories of the relation of employment tothe length of the work week were all merged in the prin-ciples on which the terms of the National Industrial Recov-ery Act, adopted June 15, 1933, were based. In the admin-istration of this law, it was assumed that shortening thework week would increase employment, and that raisingthe rate of wages, or the price of labor, would enhance theaggregate purchasing power of employees and thus givea further fillip to business and, hence, to employment. Inaccordance with these principles, the Recovery Admihis-tration, through the machinery of codes of fair competition,effected a drastic reduction in the hours of work. Althoughthe N.R.A. lasted only two years, this aspect of its policywon wide public approval and the reductions in the workweek accomplished by it persisted after its demise in June1935. Sporadic efforts to return to a longer week wererestrained after that date by the increase in the member-ship and power of labor unions and by the growth of legis-lation, federdi and state, restricting hours of work.
During the long history of reductions in the length ofthe work week, several factors apparently explain the capa-city of industry to absorb the burdens of cost necessarily
Table 2Manufacturing Industries
Percentage Distribution of Wage according toFull Time Hours of Work per Week, 1909-1929'
associated with this trend, since full time hours are rarelyreduced materially without concomitant increases in wagerates. The first arid most important has been the steady ap-plication of capital to American industry and the resultingexpansion in the use of machinery in our productive pro-cesses. A second has been the improved morale and height-f'ened personal efficiency of labor endowed with greater lei-sure and fewer hours of work. And a third has been themarked improvements in methods of management, such ashave been associated with the development of scientificmanagement since 1890, which have contributed heavily toincreasing the productivity of industry. What limits thereare or may be to the effectiveness of these factors is a mootquestion that requires for its answer data on costs morecomprehensive and reliable than those now available and abetter understanding than we now have of the sources ofincreased employment.
This Bulletin aims to describe the trends in full timehours in the major industries of the United States since1890. The data are largely drawn from the records of gov-ernmental agencies, mainly the United States Census ofManufactures and the various reports of the United StatesBureau of Mines and the United States Department ofLabor and its predecessors, the Bureau of Labor and theDepartment of Commerce and Labor. For the years since1920 some use is made of statistics of actual hours of work,and highly tentative comparisons are ventured betweenactual and full time hours. To suggest relative standardsof working conditions in this and other countries, the aver-age full time hours of work in the United States and in aselected list of foreign countries, based on materials pub-lished by the British Ministry of Labour and the Interna-tional Labour Office at Geneva, are briefly compared at theclose of this Bulletin.
Percentage of Wage Earners with SpecifiedFufl Time Hours of Work per Week
Full Time Hoursof Work per Week
Under 4-040Over 40, under 4444Over 44, under 4845Over 48, under 5454Over 54, under 6060Over 60, under 7272Over 72
1909 1914 2919 2921 1923 1929°'1 1 \ 1 0.5
'I ')'12.3 13.7 9.9 2.87.9 I I I 1.0
I I ) ) ) 9.3°1 1 3.5 4.2 4.5 5.5 Chart U/ / 32.6 33.6 31.7 26.9
7.3 13.5 16.5 18.2 21.9 25.195.4 25.8 9.0 7.1 8.8 6.330.2 22.0 13.8 12.6 14.0 15.130.5 21.1 9.0 7.4 7.3
1.51.5 J
3.0
,)2.5
1.9 J' less
100.0 100.0 100.0 100.0 100.0 100.0 over 54, under 60 ] 60 or more
MANUFACTURING INDU$TRIESPERCENTAGE DISTRIBUTION OF WAGE EARNERSACCORDING TO AVERAGE FULL TIME HOURS PER WEEK1909 — 1929
over 48 under 54 '- 1
Total
4fi or less . 7.9 11.8 48.7 51.5 46.1 46.0
__________
IL1909 3
I392
60 or more 39.2 26.9 12.0 9.9 75 IL
.
Compiled from U. S. Census of Manufactures. Data for estab- 1914 25.8 26.9
lishments having products under $5 000 in value are included for1919 48.7 :::::;:::16.5::::: 90 1111013.811 II 12.0
1909, 1914, and 1919 but not for later years. .:...,.......: H
Covers only those workers for whom hours of work were re 1921
______
182I
ported. Hours were not reported for 1.0 per cent of all wage
___________
earners. . ., . 192.3 2.9 9.21
Percentage whose hours were 44 and over, but under 45.. 1929
_________________
7.5
'Percentage whose hours were 45 and over, but under 48. U. S. Census of Manufactures
IL

Hours of Work..in American Industry 5
I ilverage Full Time Hours in MajorCategories of Industry
Measurement of changes in the hours of labor presents seri-ous difliculties, due at times to obscurities in the definitionof hours of work, but more frequently to the Fack of re-liable and comparable records. Difficulties of definitionarise mainly from a persistent confusion between full timeand actual hours. The two are not the same. The full timeweek (variously designated as normal, standard, nominal,scheduled, maximum). may be defined as the number ofhours per week beyond which a shop is normally not ex-pected to work. As such the full time week may be regard-ed as the maximum week. Hours worked in excess of thismaximum are prohibited, or are permitted at penalty ratesof wages higher than rates prevailing during normal hours,or at prevailing rates under strictly defined and limitedconditions of emergency.
In addition to serving the function of specifying the max-imum length of the work week, the full time week is oneof the several factors on which rates of wages, both timeand piece, are based, since most wage rates are fixed atpoints calculated to yield specified full time weekly earn-ings. For this reason revisions in schedules of full timehours are commonly accompanied by proportionate revisionsin the schedules of wage rates. Accordingly when negotia-tions are carried on for reductions in hours, it is usuallyassumed that at least the same weekly wages will be paidfor the shorter week. In the administration of the N.J.R.A.the usual procedure observed, in the making and adminis-tration of codes was to raise the hourly rates of wages suf-ficiently to compensate employees for losses in hours Whilethis procedure w-as not literally applied in every one of thethousands of occupations under the jurisdiction of the Re-covery Administration, it was applied to most of them, and•average rates of wages in effect after the of the codes'were in operation reflected this adjustment of wage rates tofull time hours.
Actual hours of work rarely coincide with full timehours so defined, and may be expected to exceed full timehours when business is very active, when there is a shortageof labor and overtime is being worked, and to fall short ofthem when business is dull and labor plentiful. In therun, actual hours will, in all probability, have the samegeneral trend as full time hours, but deviations of one from /the other will occasionally be mare or less sharp, dependingon the of business and employment. Because this dis-tinction is not always strictly observed in collecting statis-tics of hours, there is some evidence that per capita actualhours worked per week are occasionally reported as full'time hours. This seems to have been done for some indus-tries during the worst phases of the 1929-32 depression,when considerations of labor cost must have led some indus-
tries to lengthen their schedules of full time hours. If suchaction was taken it is not reflected in the published dataand, in consequence, average full time hours during this de-pression are represented as being at a lower level than theymay have been in actual plant practice.
In each of the five major industries for which there isa more or less continuous record, average full time hoursper week declined substantially between 1890 and 1937.The reductions ranged from 25 hours a week in the anthra-cite and bituminous coal industries to 12 hours on steamrailroads. At the beginning of this period prevailing hoursin all except the building industry were 60 a week. At itsend, in 1937, the overwhelming majority of employees inall these industries except railroads had full time weeksof 40 hours or less. On the railroads the 48-hour week stillprevailed. This general trend in hours for the period 1890-1937 is shown in Table 1, and for the selected years, 1890,1914, 1919, 1929, and 1937, in Chart I.
,For railroad labor2 the greatest single reduction in hourswas made in the three years 1917-19, when the provisions
of the Adamson Act, adopted in 1916, introduced the
8-hour day for train service employees, and orders of theUnited States Railroad Administration reduced the hoursof work of other classes of employees to the same level.In factories there was a gradual decline in hours in thequarter-century from 1890 to 1914, a period during whichthe total reduction in the work week amounted to 4.8hours. During the War years, hours were reduced morerapidly, largely because some ,industries went from the48- tO the 44-hour week, and average full time hours infactories declined, 1914-19, from 55.1 to 50.8, or 4.3 hoursa week. During the prosperous years 1922-29 average fulltime hours of all classes of labor remained remarkablysteady and were, except for a slight decline in the hoursof building employees, no lower at the end than at the be-ginning of this period.
The reliability of the record of hours during the de-pression of 1929-32 is, to say the least, dubious. The re-The stability shown by the hours of work of railroad employees,
1890-1917, and of coal miners over many years of this wholeperiod is probably due more to the inadequacy of the records thanto relative infrequency in the changes in the length of the workweek. There is a strong presumption, for example, that the 60-hour week on the railroads was the week worked by most em-ployees, and was not the average full time week of all employees.A report made by the Railroad Wage Commission, April 30, 1918,showed that in December 1917, 64.3 per cent of' all railroad em-ployees worked a 6-day week and 35.7 a 7-day week. Furthermore52.7 per cent worked the 10-hour day, 9.7 the 9-hour day, 4.6 the11-hour day, 12.9 the 12-hour day, and some 20 per cent the 8-hourday. According to these figures, therefore, the average full timeweek of railr?ad employees at that date was 62.2, and not 60hours. Unfortunately, however, the data required for computingsuch averages are not available for either railroad or coal miningemployees over this period.

6
Table 3
Bituminous Coal Mining
National Bureau of Economic Research
19031904190519061907
19081910191119121913
191419151916191?1918
19191920192119221923
19241925192619271928
1929193019311932
1933Be/oreOcL24 jterOct. 2
1934i4/ter
79351936'19371
Percentage of total employees in minesworking:
56.4 17.1 26.562.1 13.8 24.161.1 13.6 25.363.0 13.5 23.564.0 11.6 24.4
63.5 11.1 25.462.1 11.3 26.662.9 10.9 26.261.6 11.5 26.961.9 15.2 22.9
60.7 15.4 ' 23.959.6 17.0 23.458.6 17.4 24.079.0 12.6 S.490.6 6.7 2.7
95.5 3.5 1.097.1 2.0 0.996.6 2.9 0.595.1 4.0 0.994.7 4.2 1.1
93.7 5.1 1.293.5 5.4 1.193.7 5.5 0.893.4 5.6 1.093.1 6.1 0.8
92.5 6.7 0.892.4 6.6 1.093.0 6.1 0.991.9 6.2 1.9
92.6 4.9 2.5
99.8 0.1 0.1
8.62 6 51.78.65 6 51.98.63 6 51.88.65 6 51.98.61 6 51.7
3.63 6 51.88.64 6 51.88.65 6 51.98.29 6 49.78.12 6 48.7
8.06 6 48.48.04 6 48.28.04 6 48.28.06 6 48.48.06 6 48.4
8.08 6 48.58.08 6 48.58.07 6 48.48.08 6 48.58.08 6 48.5
8.08 6 48.58.09 6 48.58.08 6 48.58.10 6 48.6
8.10 6 48.6
8.00 5 40.0
7.03 5 35.2
7.02 5 35.135.135.0
° U. S. Bureau of Mines, Minerals Yearbook, 1937, p. 323, and 1938, p. 694. These figures referto hours worked by the mines rather than by the men. A few mines that worked more than10 hours or less than 7 hours (less than 8 hours prior to April 1, 1934) have been excluded,
have also all mines for which the reports were defective. Data are not available for 1909.As interpreted in union agreements, the 8-hour day means S hours of labor at the usual workingplace, exclusive of time for lunch and exclusive of time spent in going from the entrance of themine to the working place and back again.
No data on the number of days worked during a full time week are reported for the earlyyears. It is assumed in the literature that the 6-day week prevailed until October 1933 whenthe 5-day week was introduced. It is likely, however, and there is some evidence to support thispresumption, that some mines were working 7 days a week in the early years of this periodand that after the World War some mines were on the 5-day week.
Estimates of the National Bureau of Economic Research. The weighted average working daywas multiplied by the estimated number of days wérked per week.
Percentage of Men Employed in Mines that had Standard Working Days of 7, 8, 9,and 10 hours, and the Average Full Time Working Day and Week, 1903-1937°
Year 7 hours S hours 9 hours 10 hours
Weighted Estimatedaverage No. of full timeworking
dayworking,days per
workingweek1
(hours) week2 (hours)
8.708.628.648.618.60
6 52.26 51.76 51.86 51.76 51.6
97.3 2.6 0.1
97.8 2.0 0.2 ....'

Hours of Work', in American Industry 7
ported full time hours 'of building and factory labor de-clined slightly from 1929 to 1932, and the hours of workof railroad and coal mining employees remained unchanged.in view of the depths to which business activity descendedin this period and the pressure that was exerted to reducecosts either by cutting wage rates or by requiring a longerwork week at the same weekly rate, the probabilities aregreat that the full time work week was, at least in someindustries, materialls' lengthened during the several years
'of depression following 1929. Certainly in parts of the• clothing and textile industries it is commonly believed that
hours were raised above their level of the l920's; and inthe building trades there is reason to believe that on someoperations the device of the kickback in wages was used to-gether with collusive arrangements for lengthening thework week and waiving penalty rates for overtime work.But if more hours were indeed worked, there is little inthe records of either governmental bureaus or the NationalIndustrial Conference Board to confirm this fact.
The figures of full time hours published by the NationalIndustrial Conference Board probably understate somewhat
• the length of the full time week in manufacturing during• the whole period 1920-38 for which they are available.
This is partly because the Board's sample is heavily weight-ed with large establishments and under-represents industryin the South. During the depression, also, the full time hoursreported were so low that the Board itself believed thatsome establishments were confusing full time with actualhours and for this reason discontinued the series from April1932 to February 1937. For, this period, since the Censusof Manufactures ceased to tabulate statistics of full timehours with the Census of 1929, governmental data pertainto only a sample of manufacturing industries collected bythe United States Bureau of Labor Statistics. Added to'these considerations is the possibility that plants workingexcessively long weeks hesitated to report the fact to either'public or private statistical agencies.
'Whatever happened during the depression, theing years of recovery saw the greatest reduction in hours ofwhich we have any record in this country. The change 'oc-curred in two phases. Under the N.R.A., 1933-35, art effortwas made to reduce all hours to 40 or fewer a week. The40-hour week became the most common work period estab-lished in the codes of fair competition. A few industries,principally clothing manufacturing and coal mining, re-
work week averaged somewhat over 40 hours through theyear because of allowances for seasonal and other peaks ofproduction. In consequence of these variations average fulltime hours of factory employees were probably about 42 perweek in 1935. Although the first effect of the terminationof the N.R.A. in June 1935 was to set in train a movementto revert to a longer work week, it did not gain much mo-mentum. Before it was well started, the spectacular gains,'of organized labor and the change in the decisions of theUnited States Supreme Court bearing on the constitution-ality of various types of labor legislation, which paved theway for the enactment of federal and state laws regulatingthe hours of labor, reversed this trend and hours began oncemore to be reduced. By 1937, consequently, average fulltime hours were probably fewer than in 1935, if not1933-34, and for all factory employees slightly exceeded40 a week.
In respect of hours, as of most other working conditions,there has long been considerable diversity in the practiceof American industry. Before the activities of the N.R.A.,
'a prevailing level of hours had rarely been applicable to allthe employees in even a single industry. For so heterogen-
.eous a category as manufacturing, which includes hundredsof industries and millions of employees, an average of fulltime hours is bound to obscure the wide range of hoursactually effective and hence to conceal the true incidence ofreductions in the length of the work week. How wide thisrange has been in manufacturing industries and how it haschanged over the twenty years 1909-29 for which this typeof material is available is shown in Table 2 and Chart II.
The most drastic changes over this whole period ap-parently took place at the upper and lower ranges of pre-vailing schedules of hours. Employees working 48 or fewerhours a week increased from 7.9 to 46.0 per cent of totalfactory employees, and those working 60 or more hours de-clined from 39.2 to 7.5 per cent of the total. The 54.hourweek, or six 9-hour days, tended to apply to a declining'fraction of the work-force of manufacturing industry. Onthe other hand, the proportion employed on the 48-hourweek appeared to decline from 1919 to 1929, while the per-centage of those working from 48 to 54 hours, presumablyon a 50-hour week, increased quite considerably. It may besaid that a substantial number of the employees who hadtheir hours reduced to 48 or fewer during the War sur-rendered a considerable part of their gains during the de-cade 1919-29.'duced hours to 35 or 36. In many industries, the full time.
(Footnoles to Table 3 concluded)
'Data as reported for December 1934. 'Less than .05 of one per cent.
'Reported by the U. S. Bureau of Mines, Minerals Yearbook, 2938, p. 694. The distribution ofmines by length of work day is not given',for this year.
Estimated on the basis of the Appalachian' Agreement which became effective on April 2, 1937and provided for the continuation of the 7'-hour day, 5-day week.
8 National Bureau of Economic Research
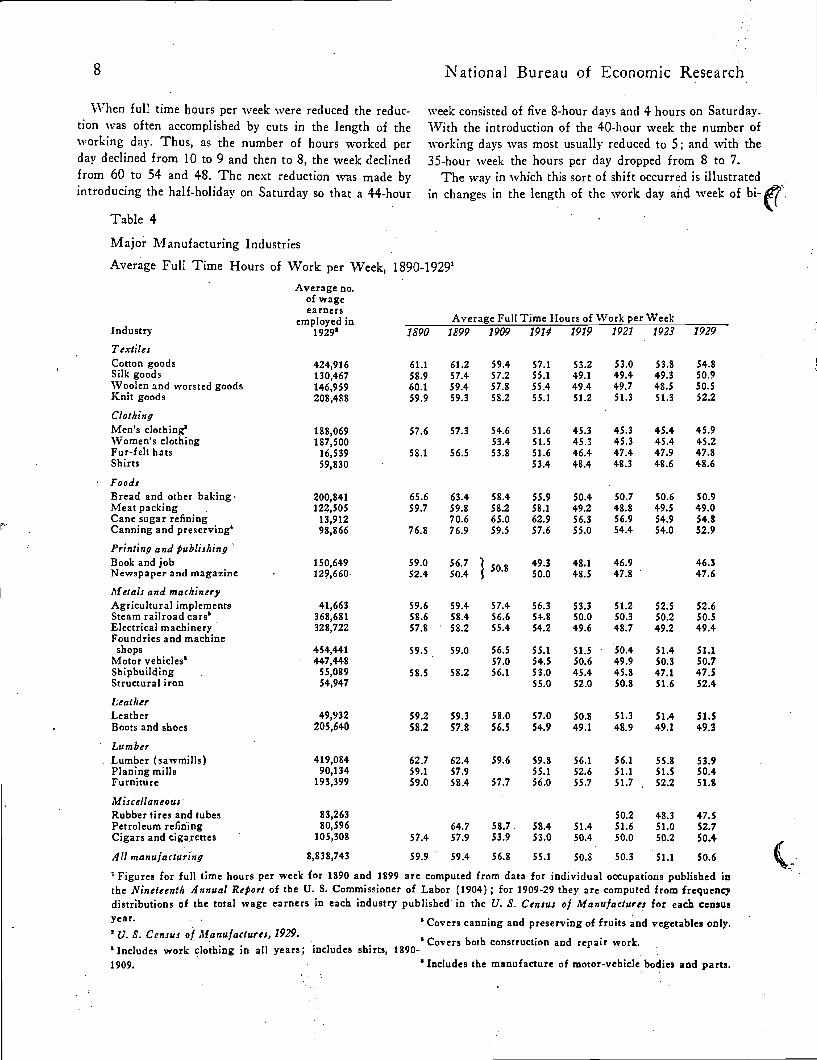
When full time hours per week were reduced the reduc-tion was often accomplished by cuts in the length of theworking day. Thus, as the number of hours worked perday declined from 10 to 9 and then to 8, the week declinedfrom 60 to 54 and 48. The next reduction was made byintroducing the half-holiday on Saturday so that a 44-hour
Table 4
week consisted of five 8-hour days and 4 hours on Saturday.the introduction of the 40-hour week the number of
working days was most usually reduced to 5; and with the35-hour week the hours day dropped from 8 to 7.
The way in which this sort of shift occurred is illustratedin changes in the length of the work day and week of bi-
Major Manufacturing Industries
Average Full Time Hours of Work per Week,
Textile:Cotton goodsSilk goodsWoolen and worsted goodsKnit goods
ClothingMen's clothing!Women's clothingFur-felt hatsShirts
FoodsBread and other bakingMeat packingCane sugar refiningCanning and preserving'
Printing and publishingBook and jobNewspaper and magazine
Metals and machineryAgricultural implementsSteam railroad cars8Electrical machineryFoundries and machineshops
Motor vehicles8ShipbuildingStructural iron
LeatherLeatherBoots and shoes
LumberLumber (sawmills)Planing millsFurniture
MiscellaneousRubber tires and tubesPetroleum refiningCigars and cigarettes
411 manufacturing
Average no.of wageearners
employed in19298
61.1 61.2 59.4 57.1 53.2 53.0 53.8 54.853.9 57.4 57.2 55.1 49.1 49.4 49.3 50.960.1 59.4 57.8 55.4. 49.4 49.7 41.5 50.559.9 59.3 58.2 55.1 51.2 51.3 51.3 52.2
57.6 57.3 54.6 51.6 45.3 45.3 45.4 45.953.4 51.5 45.3 45.3 45.4 45.2
58.1 56.5 53.8 51.6 46.4 47.4 47.9 47.853.4 48.4 48.3 48.6 48.6
65.6 63.4 58.4 55.9 50.4 50.7 50.6 50.959.7 59.8 58.2 58.1 49.2 48.8 49.5 49.0
70.6 65.0 62.9 56.3 56.9 54.9 54.876.8 76.9 59.5 57.6 55.0 54.0 52.9
59.6 59.4 57.4 56.3 53.3 51.2 52.5 52.658.6 58.4 56.6 54.8 50.0 50.3 50.2 50.557.8 58.2 55.4 54.2 49.6 48.7 49.2 49.4
59.5 59.0 56.5 55.1 51.5 '50.4 51.4 51.157.0 54.5 50.6 49.9 50.3 50.7
58.5 58.2 56.1 53.0 45.4 45.8 47.1 47.555.0 52.0 50.8 51.6 52.4
59.2 59.3 58.0 57.0 50.8 51.3 51.4 51.558.2 57.8 56.5 54.9 49.1 48.9 49.1 49.3
62.7 62.4 59.6 59.8 56.1 56.1 55.8 53.959.1 57.9 55.1 52.6 51.1 51.5 50.459.0 58.4 57.7 56.0 55.7 51.7 , 52.2 51.8
50.2 48.3 47.564.7 58.7 , 58.4 51.4 51.6 51.0 52.7
57.4 57.9 53.9 53.0 50.4 50.0 50.2 50.4
59.9 ' 59.4 56.8 55.1 50.8 50.3 51.1
IndustryAverage Full Time Hours of Work per Week
1890 1899 7909 1914 1919 1921 1923 1929
59.0 56.7}
50.852.4. 50.4
424,916130,467146,959208,488
188,069187,500
16,53959,830
200,841122,505
13,91298,866
150,649129,660
41,663368,681328,722
454,441447,448
55,08954,947
49,932205,640
419,08490,134
193,399
83,26380,596
105,308
8,838,743
49.3 48.1 46.950.0 48.5 47.8
46.347.6
50.6
'Figures for full time hours per week for 1890 and 1899 are computed from data for individual occupations published inthe Nineteenth Annual Report of the U. S. Commissioner of Labor (1904) ; for 1909-29 they are computed from frequencydistributions of the total wage earners in each industry published' in the U. S. Census of Manufacture: for each censusyear.
, 'Covers canning and preserving of fruits and vegetables only.U. S. Census of Manufactures, 1929.
8 .Covers both construction and repair work.'Includes work clothing in all years; includes shirts, 1890-1909. '
'Includes the manufacture of motor-vehicle bodies and parts.
c.

Hours of \Vork in American industry 9
tuminous coal miners. Table 3 shows the percentage ofminers working the 10-, 9-, 8-, and 7-hour day, in eachyear, 1903-37. More than half worked an 8-hour day in1903, more than a quarter worked 10 hours a day, andabout one-sixth, 9 hours. These proportions remained vir-
unchanged until the 'World War when there begana strong movement toward a universal 8-hour day in coalmines. By 1920, 9- and 10-hour days applied to only 3 percent of the miners. During the 1920's the tendency to length-en the work day appeared again, and by 1929 nearly 7 per
• cent of the miners were on a 9-hour day. This tendency ap-parently persisted during the depression, 1929-32, and is con-firmed by the slight increase in the proportion of minerswho had returned to 10 hours during 1932. The effect ofthe N.R.A. and of collective agreements between theUnited Mine Workers and coal operators appears in thevirtual elimination of the 9- and 10-hour days in October1933. The next and latest change, made April 1, 1934, re-placed the 8- with the 7-hour day and after that date 97per cent of the miners worked a 35-hour week of five7-hour days.
It is clear from these data also that changes in averagefull time hours worked in an industry do not usually affectall employees. Thus when there was the substantial reduc-tion in average hours, 1916-20, from 51.9 to 48.2 a week,nearly 60 per cent of the miners, who were already on an8-hour day in 1916, failed to profit from this change. Butthe considerable number of miners who passed from the10- to the 8-hour day in this period gained 2 hours a day,or 12 a week. Only when virtually the entire industrychanged from a 6- to a 5-day week, as in 1933, and froman 8- to a 7-hour day, as in 1934, did the great majorityof employees share simultaneously in the reduction in hours.
The wide range observed in the dispersion of hours inmanufacturing industry as a whole is, of course, in part
Table 5
accounted for the great diversity hours among themajor industries that comprise the whole category of manu-facturing. Average full time hours in the most importantof these industries, exclusive of iron and steel, are shownin Table 4 for selected years, 1890-1929. During these 40years hours were reduced in all these industries. The great-est reduction, 24 hours a week, was in canning and pre-serving where the week was longest in 1890. For nearly allthese industries, the most substantial reduction in the short—.est time took place in the War years, 1914-19. Between1919 and 1929 the week was lengthened, although slightly,in about half of the industries. Only in the printing andpublishing, cane sugar refining, canning and preserving,lumber, and furniture industries were hours appreciablyfewer in 1929 than in 1919. Apparently the longest averagefull time week in 1929 in these industries was 54.8 hours incotton goods and cane sugar refining, although lumber millsfollowed closely with a week of 53.9 hours.
At the same time the range of variation itt hours tendedto become appreciably narrower. In 1890 when the mostcommon work week in manufacturing was about 60 hours,the difference between the longest week, 77 hours in can-ning and preserving, and the shortest, 52 in newspaper andmagazine printing, was 25 hours. In 1929 when the mostusual full time week for factory employees was about 50hours, the range had declined to roughly 10 hours, from55 hours in the cotton goods and cane sugar refining indus-tries to 45 in women's clothing.
The case of iron andsteel merits special attention becauseof the persistence in it of the 12-hour day and the strikingreduction in hours that followed its abandonment. Theaverage length of the full time work week is shown for theiron Sand steel industry and its major subdivisions, 1890-1929, in Table 5. The movement of hours in this industryreveals several peculiarities. Over the whole period 1890-
Iron and Steel IndustryAverage Full Time Hours of Work per Week, 1890-1929'
All departments
Blast furnacesBessemer convertersOpen-hearth furnacesPuddling millsBlooming millsPlate millsRail millsBar millsSheet millsTin-plate mills
1890 1899
66.6 65.8
84.0 84.063.1 64.873.0 72.1
57.8 58.364.6 61.3
May May Oct. Oct. Jan. Jan. Mar.2914 1915 2920 2922 1921 1926 1929
64.9 65.5 63.1 63.2 55.2 54.4
74.8 74.968.4 68.774.5 74.453.2 52.270.5 71.069.0 69.8
59.3 65.2 70.1 70.965.9 61.4 61.7 61.4
52.3 52.5
56.8 46.0 50.4
72.1 72.370.3 68.768.7 70.853.9 52.167.5 68.068.8 66.261.2 61.561.8 61.250.3 51.1
50.6 49.9
.59.7
52.3
58.055.754.657.257.455.650.248.8
59.852.6
57.1
52.1
54.255.855.554.7
48.948.1
60.7
53.7
57.7
50.3
55.058.056.055.648.947.4
'Figures for 1890 and 1899 are computed from data for individual octhpations published in the Nineteenth AnnualReJ'or: of the U. S. Commissioner of Labor (1904). Figures for 1914-29 are based on special studies of the U. S.Bureau of Labor Statistics and appear in Bulletin 513. • .

10 National Bureau of Economic Research
1929 average hours declined by 12 a week, somewhat morethan the decline for all manufacturing. Between 1890 and1914 the reduction was very slight, less than 2 hours aweek. During the War the drop in hours in this industrywas again much less than in most others. But from 1922 to1924, when average full time hours in factories remainedstable, they were sharply reduced in iron and steel;' theyfell from 63.2 to 55.2 hours, or 8 a week. This reform wasthe result of rising public disapproval of the continuanceof the 12-hour day in steel mills and a decision reached bymost of the industry in 1923, after conferences betweenits leaders and President Harding, to begin the abandon-ment of this excessively long work day. The effect of thisdecision is most striking in the reduction in the full timehours of blast furnaces from 72.3 a week in 1922 to 59.7in 1924.
Since the full time week, as reported by official and non-official agencies, did not vary much between 1929 and 1933,some idea of the incidence of reductions in hours made un-der the N.R.A., 1933-35, can be had by examining thedispersion of hours in 1929. Table 6 shows the distributionof wage earners according to full time hours per week inmajor divisions of manufacturing in 1929. In the cottongoods industry, where maximum hours per week were fixedby the Code of Fair Competition at 40, only 1.2 per Centof the employees were working a 40-hour week or less in1929. In fact 98 per cent of cotton textile workers wereworking 45 or more hours per week, while 63 per centwere working more than 54 hours. For most employees inthis industry, therefore, the introduction of the 40-hourweek meant a reduction of at least. 14 hours a week. Thesame thing was more or less true in the iron and steel andlumber industries, while the reduction was even greater inpetroleum refining, which went to a 36-hour week underthe N.R.A. In many other industries, most of the employeeshad work weeks ranging from 45 to 54 hours, and for themajority the 40-hour week amounted to a reduction of 8or 10 hours a week. Only in the clothing, printing andpublishing, shipbuilding, motor vehicle, and rubber tire in-dustries was there a substantial number who were alreadyon weekly schedules of less than 45 hours. For that part ofthis group of employees which went to a 40-hour week, thereduction was on 'the whole moderate. But in the two greatdivisions of the clothing industry, men's and women's cloth-ing, where maximum hours were fixed by the codes at 36and 35 respectively; those employees who were on a 44-hourweek in 1929 gained by the change 8 and 9 hours a week.
Because the Census of Manufactures ceased to tabulateand publish data on full time hours in all its reports after1929, we must depend for the record of the years since onfragmentary and occasional data reported by the UnitedStates Bureau of Labor Statistics, the Codes and Reports
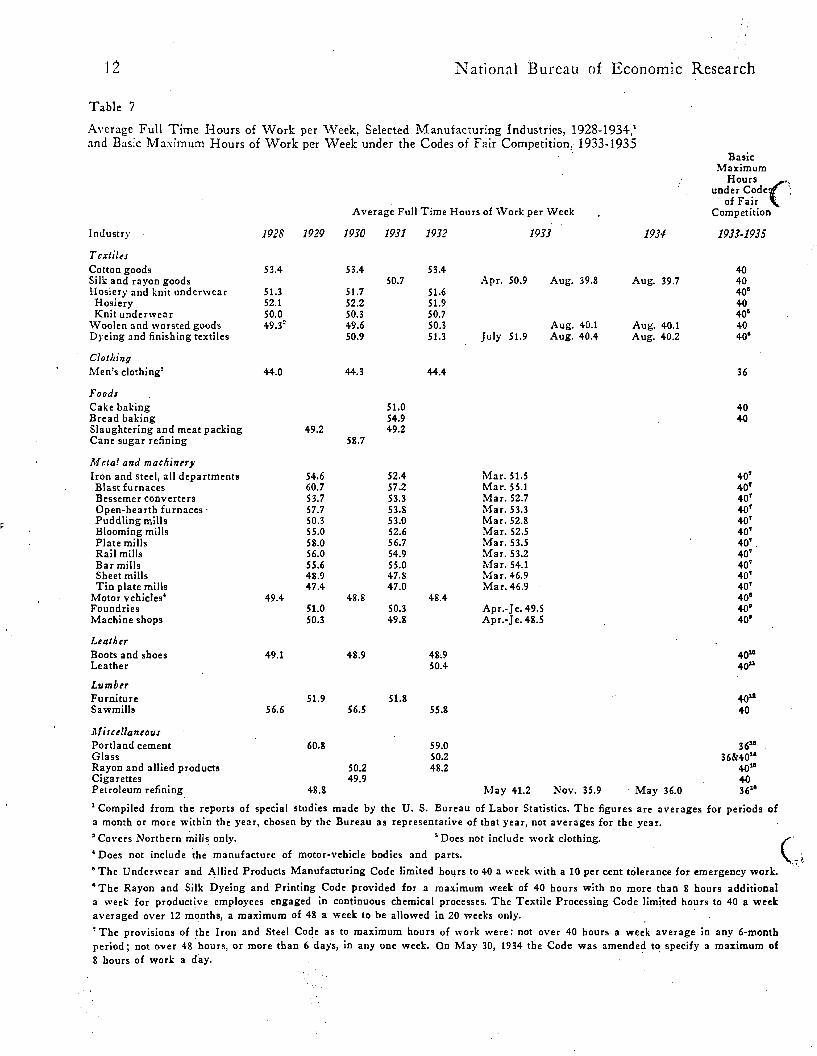
of the N.R.A., and a monthly series, purporting to be fulltime hours, published by the National Industrial Confer-ence Board, for 1914, 1920-32, and now currently reportedsince February 1937. All these series, however, are sub-stantially in accord, at least with respect to the stabilityof hours, 1929-33, and the amount of the 'reduction in the(length of the full time work week between 1933 and 1937.Perhaps the best summary of the course of hours in manu-facturing during the depression 1929-32 can be derivedfrom the special reports of the United States Bureau ofLabor Statistics. The movement of full 'time hours inselected industries, 1928-34, as reported in these specialstudies, is shown in Table 7.
\Vhile this is a small group of industries, it is a repre-sentative one and is not untypical of manufacturing asawhole. In the important iron and steel industry the fulltime week declined slightly during the depression, as it ap-parently did also in the motor vehicle and sawmill indus-tries. In the rest, it either remained stationary or registeredfractional increases.
For the period of the N.R.A., aside from the provisionsof the codes themselves, no comprehensive statistics of aver-age full time hours are available. A few of the specialstudies by the United States Bureau of Labor Statistics in-cluded in Table 7 show how precipitate was the drop inhours consequent to the adoption of codes, and suggest howgeneral, within those industries, was the incidence of re-duced hours. Thus average full time hours in the silk andrayon industry dropped from 50.9 in April 1933 to 39.8 inAugust; in dyeing and finishing, hours were 51.9 in July1933 and 40.4 in August.
Table 8 shows the distribution of codes according to the'full time work week specified for factory or 'general' work-ers. Thus 85 per cent of the codes provided for either astraight maximum of 40 hours or for a maximum of 40hours exceeded during a limited portion of the year. Howmuch these tolerances affected the average full time weekin industries for which they were allowed is not known, butoccasional studies made by the Recovery Administrationshow that the average full time week in this class of in-dustry was not much in excess of 40 hours.
After the N.R.A., the National Industrial ConferenceBoard series alone remains. Since it is well known that thehours of factory employees h'ave tended to decline with therecent revival of trade unionism and the adoption of lawsregulating hours of labor, the average full time hours re-ported by this agency may be used with some degree of con-fidence. They probably reflect with reasonable accuracy thecurrent course of full time weekly hours in manufacturing,although they probably understate the level of such hoursby a small amount, perhaps by 1 or 2 hours a week.

Hours of Work..in American Industry Ii
11 Regional Differences in Full Time HoursThe wide diversity in wage rates and other standards ofworking conditions in the various regions comprising thecontinental area of the United States finds its counterpartin persistent differences in the length of the work week.While the observed decline in average full time hours in thewhole country, 1899-1929, occurred in all geographical
Table 6
areas, it was greater in some than in others, and differencespersisted throughout this period. Table 9 shows average fulltime hours in manufacturing industries, 11899-1929, bygeographical areas.
In 1899 the shortest week (58.5 hours) prevailed in NewEngland and the longest (62.8) in the West South CentralStates, the range being 4.3 hours per week. By 1919 the
not re- 40 andported under
per Week were:over 48,
over 40, 45 to 48, not overunder 45 inclusive 54
over54
TcxtilesCotton goodsSilk goodsWoolen and worsted goodsKnit goods
ClothingMen's clothing2Women's clothingFur-felt hatsShirts
FoodsBread and other bakingMeat packingCane sugar refiningCanning and preserving
Printing and publishingBook and jobNewspaper and magazine
Metal and machineryAgricultural implementsSteam railroad cars3Electrical manufacturingFoundries and machine shopsIron and steel
Blast furnacesSteel works and rolling mills
Motor vehicles, inch bodies and partsMotor vehiclesMotor-vehicle bodies and parts
Shipbuilding
LeatherBoots and shoesLeather
LumberLumber (sawmills)Planing millsFurniture
!i'fiscellaneousRubber tires and tubesPetroleum refiningCigars and cigarettes
.411 manufacturing
3.9 0.9 4.5 39.50.0 1.7 8.1 67.20.0 0.0 0.0 20.71.5 4.6 3.7 20.9
2.1 0.8 44.64.5 0.9 19.2
0.4 0.1 2.8 2.40.0 3.4 6.3 59.80.2 •. 0.2 5.2 59.20.5 ., 1.9. 7.9 25.60.0 3.2 5.4. 38.50.0 0.0 0.0 0.00.0 3.5 5.8 31.40.0 13.0 2.2 6.40.0 19.6 1.8 6.90.0 6.1 2.6 5.80.4 . 0.1 31.9 49.1
0.0 1.1 23.90.0 0.0 0.30.-S 2.7 10.4
63.415.310.926.8
11.8 0.712.5 0.229.5 1.036.8 1.1
35.4 15.933.8 9.218.7 60332.5 36.8
5.2 0.27.4 1.4
15.829.8
3.517.141.459.640.211.4
3.119.9
1.2
2.15.7
6.0 2.61.6 46.2
52.4 9.7
Selected Manufacturing Industries
Distribution of Wage Earners according to Full Time Hours of Work per Week, 19291
Percentage of Wage Earners whose Full Time Hours of Work
Industry
0.0 1.2 0.5 21.30.0 0.5 13.5 23.10.0 0.1 1.6 50.70.0 0.4 3.9 26.7
13.647.736.642.1
2.4 : 7.5 61.22.1 . 17.7 45.30.0 4.3 28.20.7 1.0 23.4
16.522.137.037.0
47.066.7
78.50.7
31.747.011.540.412.267.168.665.517.5
41.180.2
11331.048.3
0.1 2.3 8.4 45.90.0 1.1 4.2 8.8
7.5 3.8 1.11.6 5.3 20.00.5 3.8 9.0
22.718.513.2
66.351.924.2
53.423.625.2
Computed from data published in the U. S. Census of Manufactures, 1929.
'Does not include work clothing. 'Covers both construction and repair work.
1.0 3.2 32.1 31.2 22.4
12 National Bureau of Economic Research
Table 7
Average Full Time Hours of Work per Week, Selected Manufacturing Industries, 1928-1934,'and Basic Maximum Hours of Work per Week under the Codes of Fair Competition, 1933-1935
BaskMaximum
Hoursunder Code
of FairAverage Full Time Hours of Work per Week . Competition
industry 1928 1929 1930 1931 1932 1933 1934 1933-1935
TcxtIlejCotton goods 53.4 53.4 53.4 40Silk and rayon goods 50.7 Apr. 50.9 Aug. 39.8 Aug. 39.7 40Hosiery and knit underwear 51.3 51.7 51.6 406
Hosiery 52.1 52.2 51.9 40Knit underwear 50.0 50.3 50.7 4-0°
Woolen and worsted goods 49,32 49.6 50.3 Aug. 40.1 Aug. 40.1 40Dyeing and finishing textiles 50.9 51.3 July 51.9 Aug. 40.4 Aug. 40.2 40°
ClothingMen's clothing' 44.0 44.3 44.4 36
Food,Cake baking 51.0 40Bread baking 54.9 40Slaughtering and meat packing 49.2 49.2Cane sugar refining 58.7
Metal and machineryIron and steel, all departments 54.6 52.4 Mar. 51.5 401
Blast furnaces 60.7 57.2 Mar. 55.1 40'Bessemer converters 53.7 53.3 Mar. 52.7 401
Open-hearth furnaces - 57.7 53.8 Mar. 53.3Puddling mills 50.3 53.0 Mar. 52.8 40'Blooming mills 55.0 52,6 Mar. 52.5 40'Plate mills 58.0 56.7 Mar. 53.5 40' -
Rail mills 56.0 54.9 Mar. 53.2 401
Bar mills 55.6 55.0 Mar. 54.1 40'Sheet mills 48.9 47.8 Mar. 46.9 40'Tin plate mills 47.4 47.0 Mar. 46.9 40'
Motor vehicles' 49.4 48.8 45.4 40°Foundries 51.0 50.3 Apr.-Je. 49.5 40°Machine shops 50.3 49.8 Apr.-Je. 48.5 40°
Leather -
Boots and shoes 49.1 48.9 48.9 4012
Leather . 50.4 4012
LumberFurniture 51.9 51.8 4012
Sawmills 56.6 56.5 55.8 40
J%fiscellaneou,Portland cement 60.8 59.0 36'°Glass 50.2 36&4014Rayon and allied products 50.2 48.2 4015
Cigarettes 49.9 40Petroleum refining 48.8 May 41.2 Nov. 35.9 May 36.0 3612
'Compiled from the reports of special studies made by the U. S. Bureau of Labor Statistics. The figures are averages for periods ofa month or more within the year, chosen by the Bureau as representative of that year, not averages for the year.Covers Northern mills only. 'Does floe include work clothing.
'Does not include the manufacture of motor-vehicle bodies and pares.6 The Underwear and Allied Products Manufacturing Code limited hours to 40 a week with a 10 per cent tolerance for emergency work.°The Rayon and Silk Dyeing and Printing Code provided for a maximum week of 40 hours with no more than S hours additionala week for productive employees engaged in Continuous chemical processes. The Textile Processing Code limited hours to 40 a weekaveraged over 12 months, a maximum of 48 a week to be allowed in 20 weeks only. -
provisions of the Iron and Steel Code as to maximum hours of work were: not over 40 hours a week average in any 6-monthperiod; not over 48 hours, or more than 6 days, in any one week. On May 30, 1934 the Code was amended to specify a maximum ofS hours of work a day.

Hours of Workin American Industry 13
shortest week (47.5 hours) prevailed in the Pacific States,the longest (55.3 hours) in the East South Central States,and the range had increased to 7.8 hours, or roughly oneworking day of 8 hours. In 1929 the work week in thePacific region was still the shortest (48.6 hours) and in theEast South Central area the longest (54.2 hours), but thedifference between them had narrowed to 5.6 hours.
A clearer and perhaps more accurate picture of regionaldifferences in hours can be obtained from data showing thedistribution of employees by the length of the work week.Table 10 gives the distribution of wage earners in manu-
• facturing industries, 1929, by full time hours and geo-graphical divisions. In the New England, Middle Atlantic,Mountain, and Pacific States more than half of the factory
• employees in 1929 had full time weeks of 48 hours and less.In the group of southern states, on the other hand, morethan half of the employees had full time weeks of morethan 54 hours. Weeks of 60 hours and longer prevailedfor more than one-fourth of the employees in the East andWest South Central States and for about a sixth in theSouth Atlantic States. Full time hours under 45 a weekaffected less than 10 per cent of the employees in the south-ern group, but prevailed for 22.6 per cent -in the Pacific,and 18.9 per cent in the Middle Atlantic States.
This state of things had apparently not changed muchduring the depression of 1929-32. Such changes as tookplace in average full time hours in manufacturing indus-tries were accompanied by the continuance of wide regionaldifferences. A comprehensive distribution of full time hoursby geographical divisions, such as exists for 1929, is un-fortunately not available for the years of the depression orthereafter. But a clue to the behavior of the range of hoursby regions in this period can be had from studies of severalseparate industries. Table 11 shows the states or cities hay-
(Footnotci to Table 7 concluded)
ing the highest and lowest average full time hours per weekin selected manufacturing industries, 1928 and 1932. Inmost of these industries there appears to:have been a ten-dency for the differences between the longest and shortestweek to increase over this period and in several (foundriesand woolen and worsted goods) the change was consider-able. With the exception of the men's clothing industry,which is localized in the East and Middle West, the short-..est week, both in prosperity and depression, appears to have
Table 8
Distribution of Codes of Fair Competitionaccording to Maximum Time specifiedfor Factory or 'General' \Vorkers'
Codes setting specified maximumfor factory or 'general' workers
Number Percentage of total
Maximumnumber of
hoursper week
27 1 .232 1 .235 13 2.336 21 3.8373/a 3 .538 1 .2
• 40 148 26.640, averaged over various
periods 93 16.740, with peak allowances 231 41.544 10 1.845 2 .448 13 2.352 1 .254 1 .2
Combinations of hours averaging:under 40 5 .940 and over 13 2.3
Total 557 100.0
Compiled from U.S. Bureau of Labor Statistics, Monthly LaborReviews March 1935, pp. 584 and 653-5; April 1935, pp. 896-9;and May 1935, pp. 1190-4. Covers all master codes approved ex-cept the fur-trapping code which had no hours limitations.
'The Automobile Manufacturing Code as amended on January 8, 1934 and on January 31, 1935 set a maximum of 48 hours in anyone week for all nonmanagerial employees earning less than $35 per week and further limited the average hours, in any 8-monthperiod, of processing employees to 40 hours, and of nonprocessing employees (indirect labor) to 42 hours. The original code, effectiveAugust 26, 1933-January 8, 1934, had limited the average hours of processing employees to 35.'The workers in this industry were covered by the provisions of several codes the majority of which provided for a maximum week ofeither 40 hours or of 40 hours with a tolerance of S hours a week for, not more than 6 (or 8) weeks in six months. The Laundry andDry-cleaning Machinery Manufacturing Code limited hours to 36a week with not more than 72 hours overtime in six months."The Boot and Shoe Code provided for a 40-hour week with a tolerance of 5 extra hours a week during not more than S weeks insix months.UThe Leather Code provided for maxima of 40 hours a week averaged over 26 weeks and 8 hours a day.i2 The Furniture Manufacturing Code limited hours to 40 a week averaged over the period December 11, 1933-April 1, 1934 and each
/ 6-month period thereafter, with a maximum of 45 hours in any one week.tS The Cement Code limited hours to 36 a week averaged over one-half the calendar year, with maxima of 42 hours a week and 8 hoursa, day.
"The Glass Container Code limited hours to 40 a week averaged over six months with a maximum of 48 hours in any one week. TheFlat Glass Manufacturing and the Window-Glass Manufacturing Codes limited hours to 72 in 14 days with 6 hours a week additionalfor workers engaged in continuous operations.tSThe Rayon and Synthetic Yarn Production Code limited hours to 40 a week averaged over four weeks."The Petroleum Code limited hours to 40 a week, 72 in two weeks, 16 in two days.

14
Table 9Manufacturing Industries
National Bureau of Economic Research
111 Full Time Hours under Union andConditions
'With the possible exception of the railroads, where rulesregulating the hours of work are peculiar and where the'U. S. Bureau of Labor Statistics, Monthly Labor Review, Septem-ber 1933, p, 653.'Pittsburgh, Western Pennsylvania, borderline of Ohio fromYoungstown south to Bellaire, and panhandle of West Virginia.New Jersey and Delaware, and eastern parts of New York, Penn-
sylvania, and Maryland.'Virginia, Tennessee, Kentucky, Alabama, Georgia, and border-line on the Ohio River south and west of Bellaire.
over 48,under
48 54
over 54, 60under and
54 60 over
Average Full Time Hours of Work per Week1899' 1904' 7909 1914 1919 1929
Average Full Time Hours of Work per 'Week
Average No. ofWage Earners
EmployedGeographical Division in 1929'
by Geographical Divisions, 1899-1929'
New England 1,098,514 58.5 56.8 55.7 54.1 ' 49.6 49.8Middle Atlantic 2,562,340 59.0 57.3 56.2 54.3 49.6 49.4East North central 2,542,176 59.5 57.8 56.8 548 51.3 50.5\Vest North Central 474,115 59.3 57.6 56.5 55.2 51.5 50.3South Atlantic 912,247 61.8 60.1 58.9 57.7 53.5 53.6East South Central 377,870 62.4 60.6 59.4 57.9 55.3 54.2West South Central 297,743 62.1 61.0 59.8 58.5 54.9 53.7Mountain 102,492 60.1 58.3 57.2 55.5 52.0 51.2Pacific 59.2 57.5 56.4 54.9 47.5 48.6
United States 8,838,743 59.6 57.9 56.8 55.1 50.8 50.6° Computed from frequency distributions published in the U. S. Census of Manufactures, 1909,1914, 1919, and 1929.
'U. S. Census of Manufactures, 1929. '
'Estimated by Paul F. Brissenden in Earnings of Factory Workers, 1899-1927, (U. S. CensusMonograph X, 1929), p. 355.
471,246
prevailed in the Pacific States. The narrowest range inhours in 1928 was in the woolen and worsted goods indus-try, 4.4 hours, and the widest, 13.2 hours in sawmills. In1932-33, the narrowest was 6.8 hours in the shoe industry,'and the widest, 16 hours in foundries.
No such comparison between 1929 and 1933 can readilybe made for the iron and steel industry. But data collectedfor March 1933° show that the full time hours per weekin that industry were 49.0 in the Pittsburgh,4 56.5 in theEastern,5 and 56.4 in the Southern' districts.
Table 10
Manufacturing Industries
Distribution of Wage Earners by Full Time Hours of Work per Week, byGeographical Divisions, 19291
Percentage of Wage Earners Whose Full Time Hoursof Work per Week were:
44 andover 40, over,
40 and under underGeographical Division under 44 45
45 andover,under
48
New EnglandMiddle AtlanticEast North CentralWest North CentralSouth AtlanticEast South CentralWest South CentralMountainPacific
United States
1.9 0.9 5.4 4.7 41.0 26.54.2 2.1 12.6 7.3 28.4 24.43.2 0.4 8.9 5.4 20.0 38.43.3 0.3 11.3 7.3 28.4 20.32.9 0.4 4.4 4.2 16.0 12.8
2.8 0.1 2.3 2.2 16.1 15.9
2.8 0.5 4.5 3.1 20.8 10.2
2.7 0.4 6.9 6.8 39.1 2.63.3 0.3 19.0 3.8 51.5 4.0
9.4 8.9
6.6 10.3
5.2 13.8
9.6 11.23.1 38.84.2 30.27.0 21.39.8 21.27.1 4.2
1.44.04.78.2
17.426.229.910.6
6.8
Computed from U. S. Census of Manufactures, 1929, I, 58.
3.3 1.0 9.3 5.5 26.9 25.1 6.3 15.1 .7.5

Hours of Work' in 'American Industry IS
48-hour week has persisted longer than in any other majorindustry, full time hours have been generally fewer inunion than in non-union industries and, w'ithin the sameindustry, in union than in non-union plants. In all the
- forty years 1890-1929 hours in the building trades have5een consistently lower than in manufacturing or coalmining. In part certainly, this difference reflects the rela-tively greater extent of union organization in the buildingconstruction industry. Among the major manufacturing in-dustries the shortest average work weeks in 1929 were45.9 hours in men's clothing and 45.2 in women's clothing,both highly organized industries (see Table 4). Withinsuch industries, the range in the length of the work weekis in the main attributable to differences in hours between
• organized and unorganized plants. Thus in 1929, whenunion agreements in the men's clothing industry fixed thefull time week at 44- hours, 61 per cent of the employeeswere reported. as working between 40 and 45 hours, but
Table 11
at the same time 16.5 per cent were reported as workingfrom 45 to 48 hours and 12.5 per cent more than 48 (seeTable 6). Presumably the majority working the longerweeks were employed in non-union factories—a phenom-enon common to most industries that are part union andpart non-union.
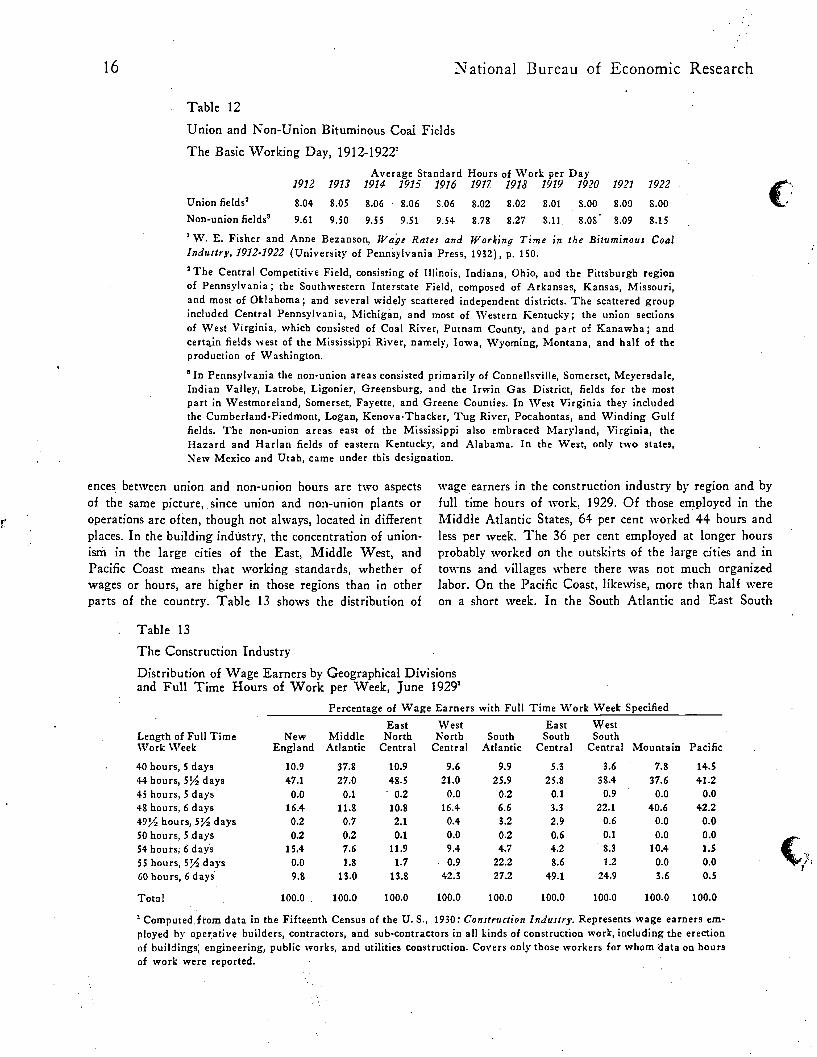
This fact is illustrated by the practice in bituminous coalmining. Table 12 shows the standard (full time) hours :per day in union and in non-union coal fields, 1912-22. Atthe beginning of the period, the work day was more thanone and one-half hours longer in the non-union fields. Themargin narrowed with rising prosperity during the Warand the progressive unionization of the industry. By 1922the difference between the tw'o was slight. After this, thedifference probably increased once more as the union grewweaker and lost control over of the industry in the1920's, but the record for those years is not now available.
In large measure regional differences in hours and differ-
Lumber, sawmills
Slaughtering and meat packing' 58.6 Michigan47.9 California
Compiled from special studies of wages and hours of the S. Bureau of Labor Statistics.Figures are for 1929 and 1933; no figures reported for 1928 and 1932.Only Northern mills covered in 1928.
'Figures are for 1929 and 1931; no figures reported for.192S and 1932.High average is due to change by one establishment from 44- hours per week in 1927 to 5-1- in 1929, affecting a consid-
erable number of wage earners.'Includes Georgia, Kentucky, South Carolina, Tennessee, and Virginia.
Selected Manufacturing IndustriesHighest and Lowest Average Full Time Hours per Week, by States or Cities, 1928 and 19321
1928 1932
AverageFull Time
HoursIndustry per Week State or City - State or City
Machine shops'
AverageFull Time
Hoursper Wteek
51.8 Georgia44.3 California
Kansas39.1 Oregon
54.1 Iowa, Kansas, Louisiana45.9 California
Foundries' 56.4 Louisiana45.9 ' - California
Boots and shoes 53.1 Maine -
47.1 New Jersey
Cotton goods 56.1 Georgia48.5 New York
Woolen and worsted goods5 52.4 Pennsylvania48.0 Vermont
Hosiery 55.6 North Carolina48.1 New Jersey
Men's clothing 50.1 Eastern Pennsylvania40.4 Cincinnati
Furniture' 57.0 Kentucky46.9 California
61.3 Florida4S.1 Washington
53.046.2
56.048.1
55.748.0
MaineNew Jersey
GeorgiaNew York
Southern district'Rhode Island
55.4 Georgia47.7 New Jersey
51.7 Eastern Pennsylvania4-4.0 Chicago, Cincinnati
Philadelphia, Rochester
55.0 Georgia, Virginia4-7.2 California
60.348.0
57.046.2
AlabamaOregon, Washington
MichiganOklahoma
16 National Bureau of Economic Research
Table 12
Union and Non-Union Bituminous Coal Fields
The Basic Working Day,
Average Standard Hours of V,Tork per Day1912 1913 1914 1915 1916 1917 1918 1919 1920 1921 1922
Union fields2 8.04 8.05 8.06 8.06 8.06 8.02 8.02 8.01 8.00 8.00 8.00
Non-union fields5 9.61 9.50 9.55 9.51 9.54 8.73 3.27 8.11 8.OS 8.09 8.15
W. E. Fisher and Anne Bezanson, Wage Rates and Working Time in the Bituminous CoalIndustry, 1912-1922 (University of Pennsylvania Press, 1932), p. 150.
2The Central Competitive Field, consisting of Illinois, Indiana, Ohio, and the Pittsburgh regionof Pennsylvania; the Southwestern Interstate Field, composed of Arkansas, Kansas, Missouri,and most of Oklahoma; and several widely scattered independent districts. The scattered groupincluded Central Pennsylvania, Michigan, and most of Western Kentucky; the union sectionsof West Virginia, which consisted of Coal River, Putnam County, and part of Kanawha; and
fields west of the Mississippi River, namely, Iowa, Wyoming, Montana, and half of theproduction of Washington.
In Pennsylvania the non-union areas consisted primarily of Connellsville, Somerset, Meyersdale,Indian Valley, Latrobe, Ligonier, Greensburg, and the Irwin Gas District, fields for the mostpart in Westmoreland, Somerset, Fayette, and Greene Counties. In West Virginia they includedthe Cumberland-Piedmont, Logan, Kenova-Thacker, Tug River, Pocahontas, and Winding Gulffields. The non-union areas east of the Mississippi also embraced Maryland, Virginia, theHazard and Harlan fields of eastern Kentucky, and Alabama. In the West, only two states,New Mexico and Utah, came under this designation.
ences between union and non-union hours are two aspectsof the same picture, since union and non-union plants oroperations are often, though not always, located in differentplaces. In the building industry, the concentration of union-ism in the large cities of the East, Middle West, andPacific Coast means that working standards, whether ofwages or hours, are higher in those regions than in otherparts of the country. Table 13 shows the distribution of
Table 13
wage earners in the construction industry by region and byfull time hours of work, 1929. Of those employed in theMiddle Atlantic States, 64 per cent worked 44 hours andless per week. The 36 per cent employed at longer hoursprobably worked on the outskirts of the large cities and intowns and villages where there was not much organizedlabor. On the Pacific Coast, likewise, more than half wereon a short week. In the South Atlantic and East South
The Construction Industry
Distribution of Wage Earners by Geographical Divisionsand Full Time Hours of Work per Week, June 19291
Percentage of Wage Earners with Full Time Work Week SpecifiedEast West East West
Length of Full Time New Middle North North South South SouthWork Wreck England Atlantic Central Central Atlantic Central Central Mountain Pacific
40 hours, 5 days 10.9 37.8 10.9 9.6 9.9 5.3 3.6 ' 7.8 14.544 hours, days 47.1 27.0 48.5 21.0 25.9 25.8 38.4 37.6 41.245 hours, 5 days 0.0 0.1 0.2 0.0 0.2 0.1 0.9 0.0 0.048 hours, 6 days 16.4 11.8 10.8 16.4 6.6 3.3 22.1 40.6 42.2
hours, days 0.2 0.7 2.1 0.4 3.2 2.9 0.6 0.0 0.050 hours, 5 days 0.2 0.2 0.1 0.0 0.2 0.6 0.1 0.0 0.054 hours, 6 days 15.4 7.6 11.9 9.4 4.7 4.2 8.3 10.4 1.5
55 hours, 5'/2 day's 0.0 1.8 1.7 0.9 22.2 8.6 1.2 0.0 0.060 hours, 6 days 9.8 13.0 13.8 42.3 27.2 49.1 24.9 3.6 0.5
100.0 , 100.0 100.0 100.0 100.0 100.0 100.0 100.0 100.0
2 Computed from data in the Fifteenth Census of the U.S., 1930: Construction Industry. Represents wage earners em-ployed by operative builders, contractors, and sub-contractors in all kinds of construction work, including the erectionof buildings, engineering, public works, and utilities construction. Covers only those workers for whom data on hoursof work were reported.
Total

Hours of Work.. in American Industry 17
Chart 111
MANUFACTURING INDUSTRIESOF WORK, 1920- 1938Average per Capita Full litre Hours per WeekAverage per Capita Actual hc.jrs Worked per Week (National Industrial Conlerence Beard)Average per Capita Actual Hturs Worked per Week (United Stales Bureau of Labor Stalistics)
- '-louru
\
Central States, half of the employees had full time weeksof 55 hours or more, and in the West South Central Statesone-fourth were on a 60-hour week.
• This table is a composite picture of the distribution ofhours in several divisions of construction, of which buildingis only one. In building construction alone the percentage
• of union and non-union employees working indicated fulltime hours in 1936 was as follows:7
Full Time Hours per Week Union40 hours and under 96.3%41 to 41 hours 3.6Over 48 hours 0.1
IV Full Time and Actual HoursConsiderable interest should attach, for two reasons atleast, to comparisons between full time and actual hours.For one thing, there is the important statistical problem of
U. S. Bureau of Labor Statistics, Monthly Labor Review, October1937, p. 798.
Table 14
Hours
whether changes in full time hours are, in the long run,an accurate measure of the movement of actual hours. Itis to be expected, of course, that as full time hours arematerially reduced, this reduction should reflect itself inthe number of hours actually worked. in a general way thisis so. When the average full time work week in manufac-turing declined from approximately 50 hours in 1932 toapproximately 42 in 1933 and thereafter, average actualhours per week concurrently declined to a lower level. Butduring the nineteen years, 1920-38, for which statistics ofboth full time and actual hours are available, changes inbusiness conditions were so frequent and, for a considerablepart of the period, so substantial, that actual hours deviatedwidely: from the full time and, in consequence, the move-ment of full time hours could hardly serve as a safe indexof the movement of actual hours.
Chart III gives the monthly figures for average percapita actual hours worked per week in manufacturing,
Twenty-five Manufacturing Industries
1920 1921 1922 923 924 1925 1926 igai 1928 1929 1930 1931 1932 1933 1934 1935 1936 1937 1938
Non-Union50.7%41.4.
.7.9
Hours Lost as Percentages of Full Time Hours of Work per Week, monthly, 1920.19381
1920 1921 1922 1923 1924 1925 1926 1927 1928 .1929 1930 1931 1932 1933 1934 1935 1936 1937 1938
Jan. 13.3 2.0 3.6 3.0 3.2 3.8 4.0 2.8 7.6 19.6 28.2 29.8 19.0 13.6 8.6 2.4Feb. 13.3 2.5 3.6 3,0 2.0 3.2 3.2 1.8 6.6 15.4 24.6 28.8 15.2 11.4 9.3 1.2
Mar.Apr.
. 11.812.4
1.81.6
4.84.6
2.83.8
2.43.8
3,44.2
3.6 2.05.2 2.4
8.28.4
15.4 . 27.816.2 31.6
35.832.0
13.314.5
13.112.6
7.96.0
0.72.6
May
f' JuneJulyAug.Sept.
3.12.93.34.5
12.712.311.410.29.8
5.94.53.9
2.22.91.62.44.0
6.88.6
10.09.07.2
4.05.25.24.83.2
4.24.25.05.03.0
3.64.66.04.84.6
4.6. 2.84.0 3.24.8 3.24.2 3.43.4 2.4
10.211.014.215.215.2
14.4 32.617.4 34.419.8 36.220.6 35.821.2 29.6
24.817.014.29.0
13.6
15.515.719.020.220.5
13.614.313.111.010.2
6.26.26.94.53.1
3.34.36.77.48.8
Oct. 5.3 6.5 2.7 3.0 5.0 3.2 2.6 5.2 4.2 1.4 14.8 23.8 27.0 14.0 19.3 8.3 2.1 10.0
Nov. 9.0 7.6 2.5 3.6 6.2 2.8 4.8 5.8 4.6 7.6 18.0 24.4 27.0 19.5 19.0 8.1 1.2 15.2
Dec. 10.2 6.7 2.2 3.6 4.0 2.0 4.6 5.4 4.0 6.8 17.2 23.2 29.8 19.5 16.7 7.9 0.5 18.8
22.620.520.221.422.221.219.516.4
Average 5.5 10.6 3.5 2.6 6.2 3.6 3.8 4.6 4.2. 3.4 12.2 19.2 30.4 22.1 17.4 11.4 3.2 6.7 20.5
* Hours lost are the amount by which actual fall short of full time pee capita hours of work. The series of actual hours is that of the National IndustrialConference Board. Full time hours are at at at 42 thereafter.

18
Table 15
Bituminous Coal Mining
National Bureau of Economic Research
1920-38, and the average per capita full time hours in ef-fect over the same period. It is clear from this chart that,except perhaps for several years during the 1920's, measur-ing changes in average per capita actual hours worked bychanges in average per capita full time hours would lead toquite misleading conclusions.
A second aspect of the relation of full time and actualhours has to do with the expectations commonly associatedwith reductions in the length of the full time week. Muchof the advocacy of the shorter week is due to the belief thatfewer per capita hours cause increased employment. Testingthis belief involves studies of the movement of employ-ment and full time hours which are not the subject of thisBulletin. A closely related hypothesis, at least implicit inthe theories of the short week, is that a drastically shorterweek may produce more regular employment for those whoarc employed by narrowing the difference between the ac-tual and full time hours per week. It is possible to subjectthis hypothesis to some statistical iest by comparing percapita actual with full time. hours and by computing thetime lost. Time lost may be defined as the amount by which
actual fall short of full time hours, expressed as a percen-tage of the full time week. In making these computationsit has assumed that the average full time week inmanufacturing was 51 hours from 1920 to 1923, whenaverage full time hours were reduced in the iron and steelindustry; 50 hours, 1923-33; and 42 thereafter.
Table 14 shows the percentage of time lost in manufac-turing, monthly, 1920-38. From these data there seems tobe little evidence, for the period 1920-38, that the per-centage of time lost, has been much affected by reductionsin full time hours. Comparing similar periods ofactivity, percentages of time lost appear remarkably steady.During the latest depression, 1937-38, although the averagefull time week was at least 8 hours less than in 1932-33,the percentages of time lost rose to levels not much differentfrom those of 1932-33, if the greater severity of the earlierdepression is taken into account. Much the same thinghappened in the bituminous coal industry. In this industry,whose full time hours per week were 48 in 1932 and 35 in1938, the percentage of time lost in 1932 was 44.2, andduring the first seven months of 1938 was 38.9. Table 15
• Specified Occupations, Selected Foreign Cities
Full Time Hours of Work per Week, October 19371
Occupation
Iron moldersBricklayers and masons•Machine compositors (book and job)BakersUnskilled labor (employed by local
authorities)
p. 382.
Melbourne Montreal Bordeaux London StockholmAustralia Canada France England Sweden
Average Full Time and Actual per Capita Hours of Work per Weekas Percentages of Full Time Hours of Work per Week, 1932-1938
1932Aver-
age
1933 1933 1933Jan.- Oci.- Aver-Sept. Dec. age
1934 1934 1934Jan.- Apr.- Aver-Mar. Dec. age
and Hours Lost
1935 1936 7937Aver- Aver- Aver-age age age
1938Jan.-July
Average full timehours per week' 48.6 48.6 40.0 46.5 40.0 35.2 36.4 35.1 35.1 35.0 35.0'
Average actualper capitahours per week' 27.1 29.2 29.8 29.4 32.0 25.5 27.1 26.3 28.8 27.8 21.4
Hours lost aspercentages offull time hoursper week4 44.2 39.9 25.5 36.8 20.0 27.6 25.5 25.1 17.9 20.6 38.9
I See Table 3.Estimated by National Bureau of Economic Research on. the basis of the Appalachian Agreement which be-
came effective on April 2, 1937 and provided for the continuation of the 7-hour day, 5-day week.1.7. S. Bureau of Labor Statistics, Monthly Labor Review, monthly.Hours lost are the amount by which actual fall short of full time per capita hours of work.
Table 16
44 44-5044 40-4444 . 44-4844 48-60
40 47 4840 44 '4840 48 4840 48
'International Labour Office, International Labour Review, Vol. XXXVII, No. 3, March 1938,
44 48 40 47 '48

Hours of Work ifl American Industry 19
shows the average per capita full time and actual hours perweek and the percentages of time lost in the bituminous coalindustry, 1932-38.
V Full Time Hours in Foreign Countriesj- International comparisons of the length of the working
- .veek must rest on fragmentary data. Such as they are theyseem to indicate that in 1937 the shortest week prevailedin France and still does in the United States. In this coun-try most employees in manufacturing, coal mining, andbuilding, work 40 hours or less. In 1937 in France the40-hour week was well-nigh universal and applied to allclasses of labor. In most other countries the 48-hour weekwas still the most common although shorter hours wereto be found in the building industry. Australian labor, ex-cept groups of transport workers, seemed to be on a 44-hourweek. No figures on full time hours of work are available.
• for Germany. In Japan the full time week is probably closeto 60 hours, since available sources of information reportthe hours per day in 1937 and 1938 as close to
Table 16 gives the full time hours per week in specifiedoccupations in selected foreign cities, October 1937. Thesefigures are generally described by the International LabourOffice as the normal statutory hours of work or the normalhours of work as fixed by collective agreements. In mostinstances, then, they pertain to the most highly unionizedoccupations, which may be expected to work on shorterschedules of hours than other classes of labor.
International Labour Office, International Labour Revieg.u, Vol.XXXVIII, No. 1, July 1938, p. 122..
Table 17
More comprehensive data are available for Great Brit-ain. Table 17 shows for October 1935 the normal week inmanufacturing, mining and quarrying (other than coal),transport (other than railways), and certain miscellaneousoccupations..
The predominant work week in Great Britain in 1935was about 48 hours. Approximately 72 per cent of the em-ployees had full time hours between 47 and 48 a week.Nine per cent worked longer than 48 hours and nearly 20per cent were on schedules of less than 47 hours a week.The shortest weeks prevailed in mining and quarrying(other than coal mining), where 29 per cent of the employ-•ees worked 44 hours or less a week, and in building, where36 per cent worked 44 hours or less. In the importantmanufacturing industries of metals, machinery, shipbuild-ing, textiles, and paper and printing, the 48-hour week wasthe most common working period.
Vi Summary
Full time hours, most conveniently defined as the numberof hours per week beyond which a shop is normally not ex-pected to work, have steadily declined in this country overthe last century. Since 1890 they have been reduced rough-ly. 18 hours in manufacturing, 16 in building, 12 in railtransportation, and 25 in both anthracite and bituminouscoal mining. In the last half century the greatest reductiontook place during the years of the World War and of theN.R.A. During the War, railroad employees went fromthe 60- to the 48-hour week as their hours per day werereduced from 10 to 8 either by legislation or by orders of
Great Britain, Specified Industrial Groups
Distribution of Wage Earners by Average Normal Hours of Work per Week, October 19351
Industry GroupMining and quarrying (other than coal mining)Treatment of non-rnetalliferous mine and
quarry productsBrick, pottery, glass, chemical, etc.Metal, engineering, shipbuilding, etc.TextileLeatherClothingFood, drink, and tobacco\sToodworkingPaper, printing, stationery, etc.Building, contracting, etc.Other manufacturing industriesTransport and storage (other than railways)Public utility servicesGovernment industrial establishmentsAll above industries
1 Ministry of Labour Gazette, July 1937, p. 258.
Averageover normal hours
48 per week2
15.6 46.4
Percentage of wage earners whose normalweekly hours of work were:
•44• over44 47orless under47 to4S
29.1 16.0 39.3
11.2 10.2 47.2 31.4 48.614.3. 7.7 65.4 12.6 47.2
6.9 5.7 83.0 4.4 46.84.0 4.2 85.2 6.6 47.83.4 3.5 83.1 10.0 47.8
13.8 16.4 66.3 3.5 47.012.4 8.6 • 65.5 13.5 47.7.
18.7 15.1 51.4 14.8 46.99.9 7.5 • 78.7 3.9 47.3
35.9 29.8 9.5 24.8 46.89.7 12.4. . 67.3 10.6 47.27.4 2.5 79.3 10.8 47.98.2 4.8 . 72.9 14.1 47.33.0 0.2 96.8 0.0 47.3
10.6 8.7 71.1 9.0 47.2
. Excluding mealtimes, except in the case of those shift-workers for whom no definiterecognized.
interval for meals was

20 National Bureau of Economic Research
the United States Railroad Administration; anthracite coalminers from the 54- to the 48-hour week; bituminous coalminers from 51.6 to 48.0 hours; factory employees from55.1 to 50.8; and employees in the building constructionindustry from 44.9 to 43.9.
A vastly greater decline in all industries except railroadsbegan with the creation of the NRA. in June 1933 andhas continued as a result of the unusual expansion of tradeunionism and the adoption of laws regulating hours oflabor. Under the influence of these factors, the work weekin coal mining declined from 48 to 35 hours; in manufac-turing from more than 50 to close to 40. In building thechange in average full time hours was slight largely becausethe 40-hour week had become quite càmmon even before theN.R.A., and on the railroads the 48-hour week remainedunchanged.
During the prosperity of the 1920's average full timehours in manufacturing, coal mining, and on the railroadsceased to decline; there is, indeed, some evidence that theyincreased slightly in coal mining and manufacturing. Thiswas in the main due to the lengthening of hours in someindustries, like cotton textiles, in which substantial parts ofthe industry had adopted the 48- or 44-hoür.week duringthe War and had then abandoned the shorter week duringthe 1921 depression. At the same time other industries,such as• iron and steel, canning and preserving, sugar re-fining, and lumber, which had retained unusually long fulltime hours during the War, reduced them materially from1922 to 1929. The net result of these conflicting, move-ments was to leave average full, time hours relatively un-changed but to reduce the spread between the longest andshortest full time week. Thus in 1920 there was a rangeof 18 hours between 45.3 hours in the clothing industryand 63.1 in iron and steel. But by 1929 the spread had de-clined to 10 hours, from 45 hours in women's clothing to 55in cotton goods and sugar refining.
During the depression 1929-32, likewise, although therewere many forces, such as work-sharing and union agitationfor the shorter week, making for reduced hours, the averagefull time week apparently was not changed and, when theN.R.A. was established, was roughly 50 hours in manufac-turing and 4-8 in coal mining.
Throughout most of the period 1890-1937 there werelarge regional differences in full time hours within nearlyall industries. On 'the whole, the longest week in manufac-turing has persisted in the southern states and since 1919the shortest week has. in the Pacific States. Fol-lowing the passage of the National Industrial Recovery Actin June 1933 and,' the setting up of the N.R.A., regionaldifferences in full time hours have tended to decline and insome industries to 'disappear. The enforcement of the fed-eral Fair Labor Standards Act,° approved June 25, 1938,
may be expected to strengthen this tendency 'and, in' time,to establish a more uniform work week for most of Amer-ican industry.
Union hours have been uniformily fewer'. than non-unionand, in the past, a shorter work week has often been intro-duced into an industry'through the terms' of a contract between employers and ,the union of their employees. -'
strongly unionized building trades had a shorter week thanany other industry until the N.R.A. began the general re-duction of working hours. In coal mining, similarly, the10- and 9-hour day, and hence the 60- and 54-hour weekwas to be found almost exclusively in the non-union coalfields; and in manufacturing the shortest week in the 1920'sprevailed in men's and women's clothing, both highly or-,ganized industries. These divergencies between union and -
non-union hours are reflected in regional differences sinceit has been customary in this country for employers to seekrelaxation of standards of labor and cost by moving 'fromorganized to unorganized regions.
we consider the countries for'which data are mostcomparable, the shortest week appears to be most commonin the United States and France, where 40 hours has cometo prevail. This is true at present iii the United States and;.was true of France in October 1937, the latest month for.which data are available. In Great Britain average full timehours in a wide and representative' range of industries were47.2 in October 1935. Australian labor was largely on .a44-hour week in 1937, while the industries of Sweden andCanada were in the main on a 48-hour week. The Interna-tional Labour Office does not report, in this survey ofOctober 1937, full time hours for Germany and Russia.
In this country it is possible to compare the movement ofaverage full time with average actual hours per week in man-
"ufacturing since 1920 and in bituminous coal mining since1932. The figures show that the movement of full time hoursis an inadequate and often misleading index of the movementof actual hours. They show' also that a material reduction in'the length of the full ,time week does not necessarilystabilize employment. In bituminous coal mining th� aver-age actual per capita hours per week worked by miners dur-ing the first seven months of 1938 were 21.4. Since 35hours were the full time week, the miners lost in this period38.9 per cent of their potential full time hours. This com-pares with 44.2 per cent lost in 1932, when the full timeweek was 48.6 hours and business conditions were muchworse. In manufacturing the percentage of time lost in thefirst eight months of 1938 was 20.5, as' compared to 30.4-in the calendar year' 1932.
° The Fair Labor Standards Act of 1938, effective October 24, 1938,establishes the following maximum weekly hours for employeesengaged in commerce or in the production of goods for commerce:44 hours during the first year from the effective date of the Act,42 hours during the second year, and 40 hours thereafter.
Copyright © 2022 FDOKUMEN