Host immune gene polymorphisms in combination with clinical and demographic factors predict late...
33
doi:10.1182/blood-2007-09-111658 Prepublished online July 16, 2008; Geyer, Wendy Cozen, Stephen J Chanock and James R Cerhan Stephen M Ansell, Patricia Hartge, Richard K Severson, Nathaniel Rothman, Scott Davis, Susan M Thomas M Habermann, Sophia S Wang, Matthew J Maurer, Lindsay M Morton, Charles F Lynch, patients in the pre-rituximab era lymphoma demographic factors predicts late survival in diffuse large B-cell Host immune gene polymorphisms in combination with clinical and (4217 articles) Neoplasia (3716 articles) Clinical Trials and Observations Articles on similar topics can be found in the following Blood collections http://bloodjournal.hematologylibrary.org/site/misc/rights.xhtml#repub_requests Information about reproducing this article in parts or in its entirety may be found online at: http://bloodjournal.hematologylibrary.org/site/misc/rights.xhtml#reprints Information about ordering reprints may be found online at: http://bloodjournal.hematologylibrary.org/site/subscriptions/index.xhtml Information about subscriptions and ASH membership may be found online at: digital object identifier (DOIs) and date of initial publication. the indexed by PubMed from initial publication. Citations to Advance online articles must include final publication). Advance online articles are citable and establish publication priority; they are appeared in the paper journal (edited, typeset versions may be posted when available prior to Advance online articles have been peer reviewed and accepted for publication but have not yet Copyright 2011 by The American Society of Hematology; all rights reserved. 20036. the American Society of Hematology, 2021 L St, NW, Suite 900, Washington DC Blood (print ISSN 0006-4971, online ISSN 1528-0020), is published weekly by For personal use only. by guest on May 31, 2013. bloodjournal.hematologylibrary.org From
-
Upload
mayoclinic -
Category
Documents
-
view
0 -
download
0
Transcript of Host immune gene polymorphisms in combination with clinical and demographic factors predict late...
doi:10.1182/blood-2007-09-111658Prepublished online July 16, 2008;
Geyer, Wendy Cozen, Stephen J Chanock and James R CerhanStephen M Ansell, Patricia Hartge, Richard K Severson, Nathaniel Rothman, Scott Davis, Susan M Thomas M Habermann, Sophia S Wang, Matthew J Maurer, Lindsay M Morton, Charles F Lynch, patients in the pre-rituximab era
lymphomademographic factors predicts late survival in diffuse large B-cell Host immune gene polymorphisms in combination with clinical and
(4217 articles)Neoplasia � (3716 articles)Clinical Trials and Observations �
Articles on similar topics can be found in the following Blood collections
http://bloodjournal.hematologylibrary.org/site/misc/rights.xhtml#repub_requestsInformation about reproducing this article in parts or in its entirety may be found online at:
http://bloodjournal.hematologylibrary.org/site/misc/rights.xhtml#reprintsInformation about ordering reprints may be found online at:
http://bloodjournal.hematologylibrary.org/site/subscriptions/index.xhtmlInformation about subscriptions and ASH membership may be found online at:
digital object identifier (DOIs) and date of initial publication. theindexed by PubMed from initial publication. Citations to Advance online articles must include
final publication). Advance online articles are citable and establish publication priority; they areappeared in the paper journal (edited, typeset versions may be posted when available prior to Advance online articles have been peer reviewed and accepted for publication but have not yet
Copyright 2011 by The American Society of Hematology; all rights reserved.20036.the American Society of Hematology, 2021 L St, NW, Suite 900, Washington DC Blood (print ISSN 0006-4971, online ISSN 1528-0020), is published weekly by
For personal use only. by guest on May 31, 2013. bloodjournal.hematologylibrary.orgFrom

1
Host immune gene polymorphisms in combination with clinical and demographic factors
predicts late survival in diffuse large B-cell lymphoma patients in the Pre-Rituximab Era
Thomas M. Habermann,1 Sophia S. Wang,2 Matthew J. Maurer,1 Lindsay M. Morton,2 Charles F. Lynch,3
Stephen M. Ansell,1 Patricia Hartge,2 Richard K. Severson,4 Nathaniel Rothman,2 Scott Davis,5
Susan M. Geyer,1 Wendy Cozen,6 Stephen J. Chanock,2 and James R. Cerhan1
Affiliations: 1 Mayo Clinic College of Medicine, Rochester, MN 2National Cancer Institute, Bethesda, MD 3The University of Iowa, Iowa City, IA 4Wayne State University, Detroit, MI 5Fred Hutchinson Cancer Research Center, Seattle, WA 6University of Southern California, Los Angeles, CA
Correspondance: James R. Cerhan, MD, PhD Division of Epidemiology Mayo Clinic College of Medicine Rochester, MN 55905 Email: [email protected] Running Title: Diffuse Large B-Cell Lymphoma Survival Key Words: diffuse large B-cell lymphoma, immunogenetics, survival
Blood First Edition Paper, prepublished online July 16, 2008; DOI 10.1182/blood-2007-09-111658
Copyright © 2008 American Society of Hematology
For personal use only. by guest on May 31, 2013. bloodjournal.hematologylibrary.orgFrom

2
Abstract
To evaluate the hypothesis that host germline variation in immune genes is associated with overall
survival in diffuse large B-cell lymphoma (DLBCL), we genotyped 73 single nucleotide polymorphisms
(SNPs) from 44 candidate immune genes in 365 DLBCL patients diagnosed from 1998-2000. We
estimated hazard ratios (HR) and 95% confidence intervals for the association of SNPs with survival
after adjusting for clinical factors. During follow-up, 96 (26%) patients died, and the median follow-up
was 57 months (range, 27-78 months) for surviving patients. The observed survival of this cohort was
consistent with population-based estimates conditioned on surviving 12 months. An IL10 haplotype
(global p=0.03) and SNPs in IL8RB (rs1126580; HRAG/GG=2.11, 1.28-3.50), IL1A (rs1800587;
HRCT/TT=1.90, 1.26-2.87), TNF (rs1800629; HRAG/GG=1.44, 0.95-2.18), and IL4R (rs2107356;
HRCC/CT=1.97, 1.01-3.83) were the strongest predictors of overall survival. A risk score that combined
the latter four SNPs with clinical factors was strongly associated with survival in a Cox model (p=6.0 X
10-11). Kaplan-Meier 5-year survival estimates for low, intermediate-low, intermediate-high, and high
risk patients were 94%, 79%, 60%, and 48% respectively. These data support a role for germline
variation in immune genes, particularly genes associated with a pro-inflammatory state, as predictors of
late survival in DLBCL.
For personal use only. by guest on May 31, 2013. bloodjournal.hematologylibrary.orgFrom
3
Introduction
Diffuse large B-cell lymphoma (DLBCL) is the most commonly diagnosed subtype of non-Hodgkin
lymphoma (NHL) in Western countries.1,2 DLBCL is potentially curable, but the course of the disease is
variable.3-5 Established adverse prognostic factors in DLBCL include older age, higher stage, poor
performance score, and above normal LDH, and these factors have been validated as part of the
International Prognostic Factor Index (IPI). However, the IPI predicts outcome incompletely. Molecular
features of the tumor offer significant promise in providing additional information on prognosis.6,7 For
example, gene expression profiling of DLBCL has defined two major subgroups, one with a gene
expression profile similar to normal germinal center B cells (60% 5-year survival) and the other
mimicking activated peripheral B cells (30% 5-year survival).8-10 Besides clinical and tumor molecular
characteristics, there is a growing appreciation that the tumor microenvironment,7 and more broadly
host genetic background,11 may be an additional critical factor in cancer progression and outcome and
therefore may be useful as a prognostic marker.12
Cytokines and related immune factors have been hypothesized to play an important role in
lymphomagenesis,13 as they appear to influence proliferation, differentiation, and movement of both
tumor and stromal cells, regulate communication between tumor and stroma, and regulate tumor
interactions with the extracellular matrix.14 Immunologic function is in part influenced by host genetics,
and germline genetic variation in cytokine and related immune genes have been associated with risk of
developing DLBCL15-17 and disease-free and overall survival after DLBCL diagnosis.18-20 To test the
hypothesis that inherited variation in cytokine and related immune genes impact DLBCL survival more
comprehensively, we evaluated the role of 73 SNPs from 44 candidate immune genes (Table 1) and
overall survival in DLBCL, using cases that were recruited as part of a population-based case-control
study. We have previously reported the association of immune SNPs with risk of developing DLBCL in
this study population.16 Here we present the risks of dying from DLBCL according to those SNPs. By
measuring the effects of the same markers on both etiology and survival, we examine a larger area of
influence of genes on this immune system malignancy.
For personal use only. by guest on May 31, 2013. bloodjournal.hematologylibrary.orgFrom

4
Methods
Study population
This study was reviewed and approved by human subjects review boards at the National Cancer
Institute and each of the participating study centers, and written, informed consent was obtained from
all participants, in accordance with the Declaration of Helsinki. Methods for this molecular
epidemiology study have been described previously.16 Briefly, we enrolled 1,321 newly diagnosed,
histologically-confirmed NHLs aged 20-74 years in four Surveillance, Epidemiology, and End Results
(SEER) cancer registries (Detroit metropolitan area; northwestern Washington state; the state of Iowa;
and Los Angeles County) from July 1998 through June 2000. Known HIV-positive cases were
excluded. All participants completed an in-person interview, and 1,172 (89%) provided either a venous
blood sample (N=773) or mouthwash buccal cell (N=399) sample. This analysis is restricted to the 365
cases of DLBCL in the case group, as defined by SEER coding and using the InterLymph classification
system,21 who had a DNA sample available for genotyping. Of the eligible DLBCL cases for this study,
21% died before we could contact them, 9% had a physician refusal or could not be located, 17% were
approached but refused participation (many too ill), and 53% participated.
Genotyping
The strategy for candidate gene selection focused on genes involved in key immune pathways,
particularly those related to cytokine regulation and function. Priority in gene selection was given to
those genes with data suggesting functional and biological significance, an association with NHL
etiology or prognosis, an association with other immune diseases, and a minor allele frequency (MAF)
of >5% in the Caucasian population. Full details on candidate gene selection have been previously
published.16
Details on DNA extraction and genotyping have been published previously.16 All genotyping was
conducted at the National Cancer Institute Core Genotyping Facility using the Taqman or EPOCH
platforms (http://cgf.nci.nih.gov), and sequence data and assay conditions are provided at
http://snp500cancer.nci.nih.gov/home_1.cfm?CFID=2106952&cftoken=53492492. 22 Genotyping was
conducted first on blood-based DNA samples (N=215 DLBCL patients), and then was expanded to
For personal use only. by guest on May 31, 2013. bloodjournal.hematologylibrary.orgFrom

5
patients with only buccal samples (N=150 DLBCL patients) for 52 of the 73 candidate SNPs. The
decision to genotype buccal samples was based on a risk association in the subset of participants with
blood-based DNA samples in the parent case-control study..16 For the 21 SNPs that we genotyped on
DLBCL patients with blood samples (N=215), the call rates ranged from 91.2% to 100% (median call
rate 93.0%); for the 52 SNPs that we genotyped on DLBCL patients with blood or buccal (N=365), the
call rates ranged from 89.6% to 99.5% (median 95.9%). While we evaluated all SNPs with survival
(supplementary Table 1), only those 52 SNPs that were also genotyped in patients with buccal samples
were eligible for multi-SNP models.
Positive and negative controls, and 140 replicate samples were interspersed for all genotyping
assays and blinded from the laboratory. Agreement for quality control (QC) replicates and duplicates
was >99% for all assays. Only one SNP (rs1801157) in black controls was not in Hardy-Weinberg
equilibrium (p<0.01); reviewing of all genotyping data (including QC samples) confirmed the accuracy
of this assay.
Prognosis study
Full details on the prognosis study using cases from the case-control study have been previously
published.12 Briefly, age, sex, race, Hispanic ethnicity, and education level were derived from patient
interviews as part of the case-control study. Date of diagnosis, histology, stage, presence of B-
symptoms, first course of therapy, date of last follow-up, and vital status were derived from linkage to
individual SEER registry databases in early 2005. Data on first course of therapy includes use of single
or multi-agent chemotherapy, radiation, and other therapies exclusive of chemotherapy and/or
radiation. Individual agents and doses, as well as indications for use of non-standard therapy, were not
available. The SEER registries collect date and cause of death, but do not collect data on treatment
response or disease recurrence or progression.
Data Analysis
Evaluation of single SNPs and haplotypes. Our overall data analysis approach has been previously
published.12 We first used Cox proportional hazards regression23 to estimate hazard ratios (HR) and
For personal use only. by guest on May 31, 2013. bloodjournal.hematologylibrary.orgFrom
6
95% confidence intervals (95% CI) for the association of each individual genotype with overall survival,
adjusting for age, clinical and demographic factors (Supplementary Table 1). The primary test of
association for each SNP with survival used a co-dominant coding of the alleles (i.e., 0, 1, 2 variant
alleles). This statistic was chosen because it has good power to detect genotype associations under a
range of genetic models.24 Age was modeled according to the standard IPI score as <60 versus 60+
years.25 Clinical and demographic factors were each modeled as two separate risk scores, analogous
to a propensity score for logistic regression.26 The clinical risk score was a linear combination of stage
(local, regional, distant, missing), presence of B-symptoms, (no, yes, missing), and type of initial
therapy (chemotherapy + radiation; chemotherapy + other therapy; radiation only; all other or missing
therapy). The demographic risk score was a linear combination of sex, race (white, all other), study
center (Detroit, Iowa, Los Angeles, Seattle), and years of education (<12, 12-15, 16+ years). For multi-
SNP models, the demographic and clinical risk scores were combined into a single score, with values
of 0-2 (low to high risk) as previously described.12
We were able to construct haplotypes for four genes: TNF/LTA, IL8, IL8RB and IL10. Haplotype
frequencies for selected genes were estimated by an expectation-maximization algorithm,27 and the
posterior probabilities for each haplotype were included in a Cox model to assess the association with
survival.
To address concerns about multiple testing, we computed the tail strength (TS) of all 73 SNPs
initially evaluated for their role in survival (Supplementary Table 1). This measure28 is closely related to
the false discovery rate,29 and assesses the relative strength of the collection of observed p-values from
an analysis of a large number of markers.
Selection of the best multi-SNP risk score. Since many of these genes have overlapping functions
and are part of complex networks, it is useful to identify a parsimonious multivariable prediction model.
To achieve this, we first brought forward 17 SNPs (from 13 genes) with a p≤0.15 based on the recoded
results in Table 2. To preserve power, we eliminated from further consideration for multivariable
modeling the 5 SNPs with a MAF<0.05 or >10% missing data (missing data mainly due to buccal
samples not being genotyped in the parent study). After removing these SNPs, remaining SNPs with
missing genotype were then assigned to the low risk genotype. For the remaining SNPs in high linkage
For personal use only. by guest on May 31, 2013. bloodjournal.hematologylibrary.orgFrom
7
disequilibrium (LD), we selected a single SNP based on the highest MAF and the strongest HR. After
this data reduction process, there were 8 SNPs from 8 genes. To evaluate each of the 255 possible
combinations of these 8 SNPs, we created a SNP score variable by summing the number of deleterious
genotypes (as categorized in Table 2) in each particular combination.12,30 Each multi-SNP score
variable was fit in a Cox model adjusting for age and the clinical and demographic risk scores. The
models were grouped by number of SNPs included in the SNP score variable (i.e., 1 SNP, 2 SNPs,…8
SNPs) and were ranked by likelihood. A comparison of the likelihood for the best 1 SNP, 2 SNP,…8
SNP models according to number of SNPs included in the model is shown Figure 1A. In parallel, we
ran 1,000 bootstrap stepwise selection Cox models (adjusting for age, clinical and demographic risk
scores) using the 8 SNPs, and calculated the percentage of models that each SNP was included
(Figure 1B). The plot of the likelihood suggested a model with 5 or fewer SNPs, as the reduction in
likelihood was marginal after 5 SNPs (Figure 1A). The 4 highest ranked SNPs from the bootstrap
analyses coincided with the most prognostic 4 SNP risk model; we therefore proceeded with a 4 SNP
risk score as the final model.
Evaluation of the multi-SNP risk score. We assessed the association of the 4 SNP risk score with
overall survival using Kaplan-Meier curves, Cox proportional hazards models, and time-dependent
receiver-operator characteristics (ROC) curves for censored data.31 We also developed a single risk
score that combined the number of deleterious genotypes from the 4 SNPs (0-4) plus a combined
clinical and demographic risk score (0-2) to create a single SNP and clinical risk score (0-6). To
compare the significance of the SNP and clinical and demographic risk score observed in our data to
what we would expect from chance, we performed a permutation analysis. The test statistic observed
in our study data was then compared to the distribution of test statistics from 200 permutation iterations.
RESULTS
Descriptive results
The median age at diagnosis of the 365 cases was 57 years (range, 20-74; 41% were age 60 or older).
A majority of the patients (88%) were white, and 56% were male. Clinically, 41% had advanced stage
disease and 27% had B-symptoms. Based on cancer registry data, the most common initial therapy
For personal use only. by guest on May 31, 2013. bloodjournal.hematologylibrary.orgFrom

8
was a chemotherapy-based regimen (88%). During follow-up, 96 (26%) of the patients died, and 68%
of the underlying causes of death were coded on the death certificate as lymphoma. The median
follow-up of living patients was 57 months (range, 27 – 78 months). The age (age 60+ HR= 1.80, 95%
CI 1.22-2.76), demographic (combination of sex, race, study center, and education; HR=2.26, 95% CI
1.36-3.76) and clinical (combination of stage, B-symptoms, and type of treatment; HR = 2.66, 95% CI
1.63-4.33) risk scores were associated with overall survival when included in the same Cox model.
In the parent case-control study, only 53% of the eligible cases were enrolled in the study, and we
did not have genotype or survival data on the non-participants. Therefore, to address the potential
impact of non-response on our results, we compared our observed survival to survival reported in the
SEER program from the same registries as our cases (i.e., Detroit, Iowa, Los Angeles and Seattle) for
white DLBCL patients aged 20 to 74 years and diagnosed from 1995-2000.32 As shown in Figure 2, our
observed survival was higher than that observed in the SEER data for DLBCL from the same time
frame of this study, but was very similar to SEER for 12-month conditional survival (i.e., survival given
that a patient survives 12 months). This is consistent with the enrollment pattern of these patients into
our case-control study, whereby patients with early mortality were less likely to be enrolled into the
study.
Single SNP results
We identified 17 SNPs from 14 genes of potential interest based on our statistical criteria (p trend ≤
0.15 from Supplemental Table 1). These SNPs were re-scored so that all HRs were > 1, and these are
reported in Table 2. Most of the HRs were modest and in the range of 1.4-2.5. The smallest observed
p-value (p<0.001) was for an IL5 SNP (rs2069807, C-1551T, HRCT/TT= 4.56, 95% CI 1.98-10.5) which
was relatively rare (only 2.9% of patients carried a variant allele). The next smallest observed p-value
(p=0.002) was for an IL8RB SNP (rs1126580; HRAG/GG=2.11; 95% CI 1.28-3.50). The only other p ≤
0.01 was for an IL1A SNP (rs1800587; HRCT/TT=1.90; 95% CI 1.26-2.87). The tail strength of our set of
73 immune SNPs was 0.20 (95% CI: -0.03-0.43). A positive tail strength indicated that the observed p-
values were more significant than what would be expected due to chance; the tail strength of 0.20 in
For personal use only. by guest on May 31, 2013. bloodjournal.hematologylibrary.orgFrom
9
our study suggests that this set of SNPs displayed about 20% more signal than expected if all markers
were null.
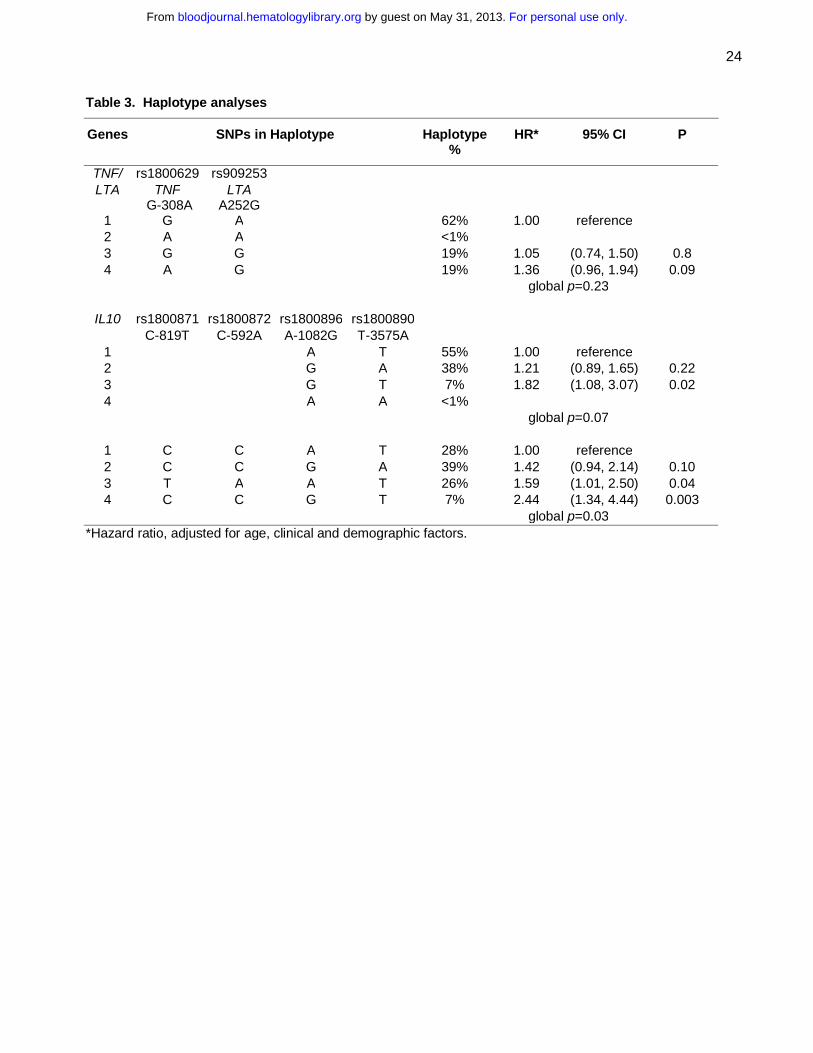
Haplotype results
There was no significant association with the risk of DLBCL (global p-value=0.4) for the TNF/LTA
haplotype constructed from 3 TNF SNPs (rs1799724, rs1800629, and rs361525) and 2 LTA SNPs
(rs2239704 and rs909253) (Supplemental Table 2), which has been previously reported to be
associated with risk of developing DLBCL in this study population.16 However, using a haplotype
limited to TNF G-308A (rs1800629) and LTA A252G (rs909253) reported to be associated with risk of
DLBCL by the InterLymph Consortium,15 the AG versus GA haplotype was associated with a marginally
significant higher risk of death (HR=1.36; 95% CI 0.96-1.94) (Table 3). When the number of adverse
alleles from TNF G-308A (A allele) and LTA A252G (G allele) were summed according to the approach
of Warzocha et al.,18 patients with 2 to 4 adverse alleles (38% of patients) had poorer survival
compared to patients with 0 or 1 alleles (HR=1.27, 95% CI 0.84-1.90), and this association was
stronger for patients with 3 or 4 adverse alleles (10% of the patients) compared to patients with 0 to 2
alleles (HR=1.72; 95% CI 0.95-3.09).
An IL10 haplotype based on IL10 A-1082G (rs1800896) and IL10 T-3575A (rs1800890) showed a
suggestive association with survival (global p=0.07), and the GT haplotype was associated with poorer
survival compared to the most common (AT) haplotype (HR=1.82; 95% CI 1.08-3.07) (Table 3).
Inclusion of two additional SNPs to the haplotype was even more strongly associated with survival
(global p=0.03), and three of the most common haplotypes were associated with poorer survival (Table
3). There were no associations of haplotypes in IL8 or IL8RB with survival (Supplemental Table 2).
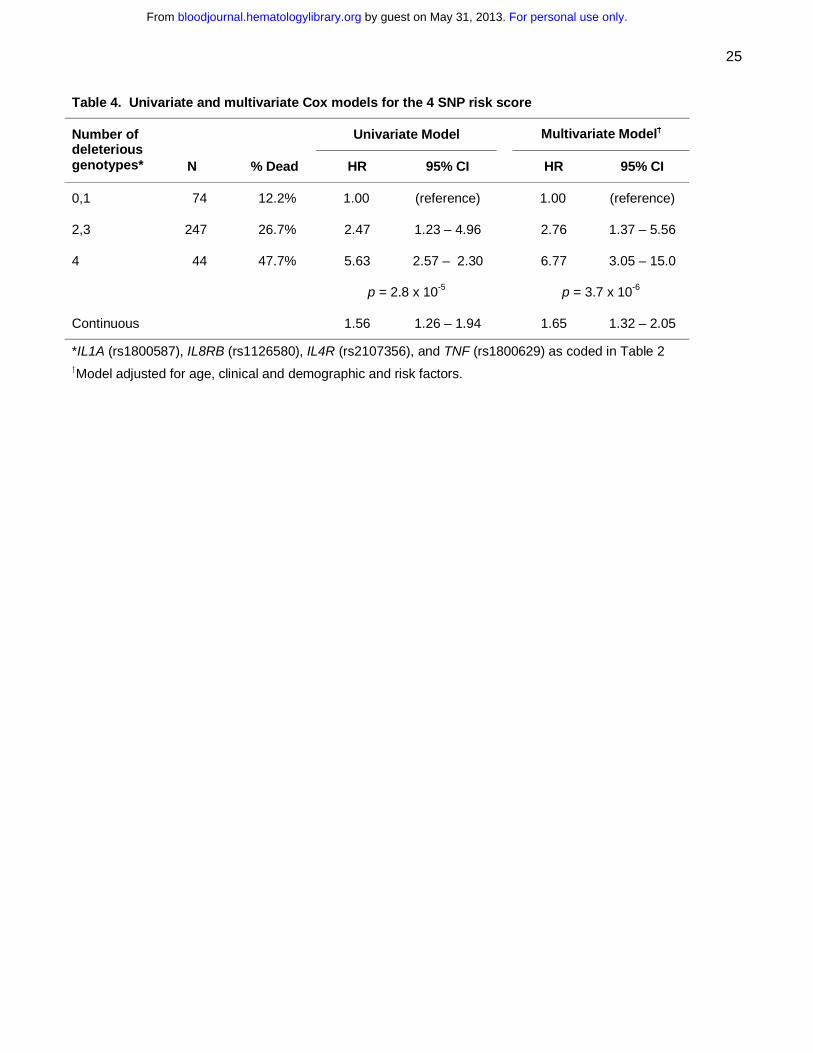
Multi-SNP risk score
As outlined in the methods section, we selected a 4 SNP risk score for further evaluation which
included polymorphisms in IL1A (rs1800587), IL8RB (rs1126580), IL4R (rs2107356), and TNF
(rs1800629). The number of deleterious genotypes was summed from these 4 SNPs (0-4), and this
For personal use only. by guest on May 31, 2013. bloodjournal.hematologylibrary.orgFrom

10
score was strongly associated with survival in both univariate (p = 2.8 x 10⁻⁵) and multivariate (p = 3.7 x
10-6) analyses (Figure 2 and Table 4). Patients with 4 deleterious genotypes were over 6 times more
likely to die compare to patients with zero deleterious genotypes (95% CI 3.05-15.0), and there was a
gradient in risk with the number of deleterious SNP genotypes. Both the 4 SNP risk score and IL10
haplotype remained statistically significant when they were included in the same model along with the
clinical and demographic variables (data not shown).
We next combined the number of deleterious genotypes (0-4) with the clinical and demographic risk
score (0-2). This combined score was strongly associated with survival (p = 6.0 x 10⁻¹¹) (Figure 3 and
Table 5), and patients with a score of 5 or 6 were over 9 times more likely to die compared to those with
a low (0-2) risk score (95% CI 4.22-21.4).
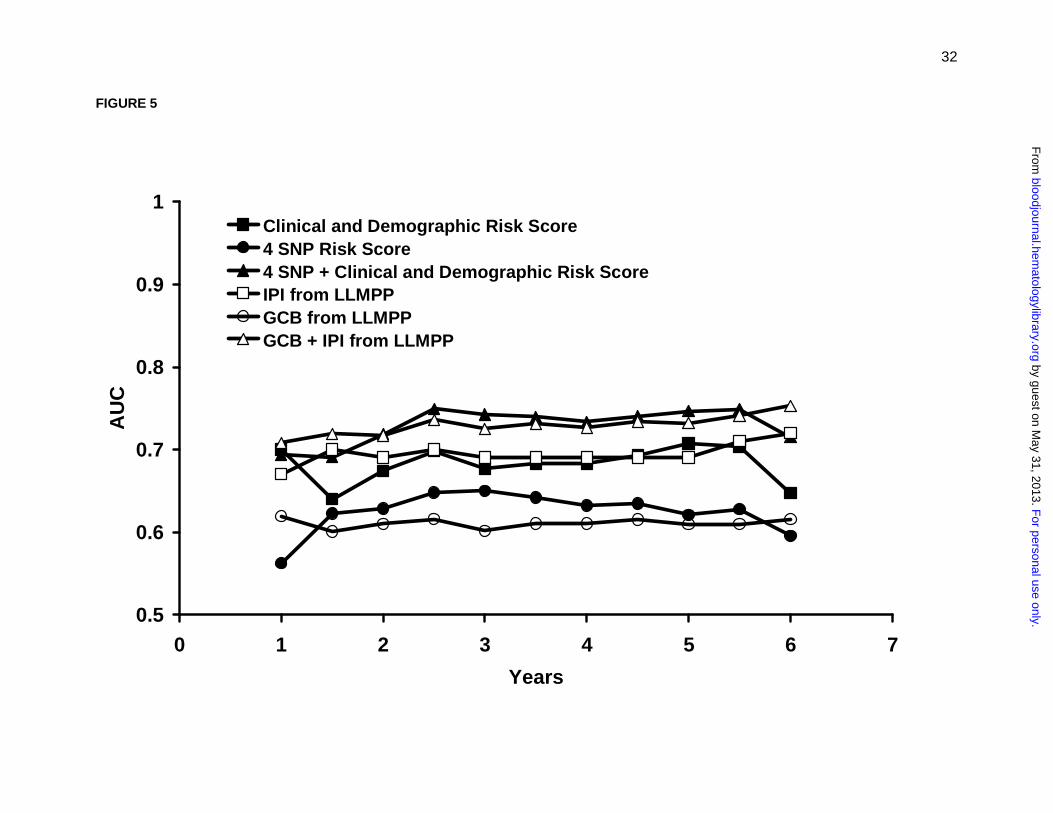
To further evaluate the predictive ability of our model, we conducted a time-dependent ROC
analysis for censored data.31 This analysis uses sensitivity and specificity, both of which are time-
dependent, to measure the prognostic capacity of the survival model as measured by the area under
the curve (AUC). As shown in Figure 4, our clinical and demographic risk score (0-2) compared
favorably in a time-dependent ROC results to the International Prognostic Index (IPI) from a previously
published series.8 The time-dependent ROC analysis for the 4 SNP risk score showed a lower ability to
predict outcome, but when it was combined with the clinical and demographic risk score, the AUC at 2
years was above 0.70, and at 5 years the AUC was 0.75 (95% CI 0.68-0.80). Figure 4 also includes
the predictive ability of the germinal center phenotype versus all others from a previously published
DLBCL survival dataset,8 and this characteristic predicted outcome at the same level as our 4 SNP risk
score. Furthermore, when the germinal center phenotype was combined with the IPI, it predicted at the
same level as our SNP plus clinical and demographic risk score.
To assess the robustness of our multi-SNP risk score, we repeated our model building strategy
(starting with selection of SNPs with a p≤0.15 through the final multi-SNP risk model) with the datasets
generated in a permutation analysis. Our observed results were more significant than 82% of the
results from randomly generated datasets, which suggests that our multi-SNP risk score has some
degree of significance given the intense model building approach performed. In addition, the likelihood
plot (Figure 1A) of the best 1,2,…,8 SNP models suggests that as many as 5 SNPs may add
For personal use only. by guest on May 31, 2013. bloodjournal.hematologylibrary.orgFrom

11
information to predicting survival beyond what would be expected due to chance, although we opted for
4 SNPs based on the combined results that included the bootstrap modeling in selecting the most
robust and parsimonious model.
Sensitivity analyses
All results were also similar when we excluded all non-Whites from the analysis (data not shown).
We fit the final 4 SNP plus clinical and demographic risk score model based on deaths due to
lymphoma coded on the death certificate (N=65 of the 96 deaths; other deaths censored), and found
the HR for the continuous score increased slightly from 1.9 (Table 5) to 2.0 (95% CI 1.6-2.5).
Another potential concern is that not all patients received standard of care. While we did not have
sufficient data to fully evaluate treatment decisions and standard of care for these patients, we were
able to exclude patients who did not receive multi-agent chemotherapy, the presumed standard of care
at the time of enrollment (rituximab was unlikely to have been used in the community setting from 1998-
2000). After excluding these patients (N=73), results from Tables 4 and 5 were essentially unchanged
(data not shown). Finally, there was no survival difference by enrollment year (p=0.42) and no impact
on the final results in Table 5 after adjusting for enrollment year (data not shown).
Discussion
Using a population-based sample of 365 DLBCL cases diagnosed from 1998-2000 and followed
through early 2005, we identified 17 SNPs from 14 cytokine and related immune regulation genes and
a haplotype from the IL10 gene that were all associated with overall survival from DLBCL independent
of clinical and demographic factors. Furthermore, we observed a strong effect from the combination of
four SNP markers; three SNP markers from three genes, namely, IL1A1, IL8RB and IL4R that had not
been previously reported in NHL prognosis, and one SNP marker in TNF which has been shown to
have a deleterious effect on survival. The preliminary results are particularly encouraging when
combined into a common carrier model that linearly summed the number of deleterious genotypes.
Combining the SNP risk score with demographic and clinical factors increased the predictive ability of
the model, with AUCs of >0.70 after 24 months of follow-up in the time-dependent ROC analysis, which
For personal use only. by guest on May 31, 2013. bloodjournal.hematologylibrary.orgFrom
12
is approaching the predictive range needed for clinically useful tests. When compared with gene
expression profiling data from biopsy samples,8 host genetics demonstrated a similar prognostic ability.
Overall, these results support the importance of germline variation in immune genes as predictors of
DLBCL prognosis. While steps were taken to guard against over-fitting the data, including a
permutation analysis of our entire model building strategy to assess the significance of our results
compared to chance, these results clearly require replication in independent populations. In addition, it
will be important to evaluate a population of DLBCL patients treated with rituximab in combination with
CHOP chemotherapy and evaluate these findings in conjunction with molecular subtypes of DLBCL.
Even with rapid reporting by population-based cancer registries, we were only able to enroll
approximately 50% of the eligible DLBCL patients, and therefore we systematically missed those
patients with the most aggressive disease leading to early mortality. Indeed, the observed survival of
our patient cohort was much better than SEER population-based estimates for DLBCL patients overall,
but was quite consistent with survival estimates that were conditioned on DLBCL patients who survived
12 months after diagnosis (Figure 2). Therefore, our results will not apply to early mortality, and this will
need to be addressed in future studies. A majority of deaths during the first year after diagnosis was
due to disease, and in the SEER data from Figure 2, approximately 58% of the deaths which occurred
in the first five years after diagnosis occurred during the first year, and 75% of those deaths were due to
disease. While our data are not informative for early mortality, our data will be robust to patients who
survive to 12 months after their diagnosis. Furthermore, in sensitivity analyses, we found that our
results held for patients who died of their disease (68%).
A proinflammatory state may both contribute to lymphomagenesis and lead to overall poorer
survival. Of the genes in our final multi-SNP model, TNF has been most extensively studied as a
prognostic factor in DLBCL. Higher levels of TNF have been associated with poorer outcome in NHL.33
Warzocha et al.18 reported that an extended haplotype in TNF (G allele) and LTA (A allele) was
associated with higher TNF production, and DLBCL patients (N=126) with 2-4 high risk alleles (33% of
patients) had lower progression-free (HR=2.33; 95% CI 1.17-4.64) and overall (HR=1.92; 95% CI 0.63-
5.80) survival. These results are consistent with our findings that patients with 2-4 risk alleles (38% of
patients) had a lower overall survival compared to patients with 0-1 risk alleles (HR=1.27; 95% CI 0.63-
For personal use only. by guest on May 31, 2013. bloodjournal.hematologylibrary.orgFrom
13
1.48), although our HR was weaker and not statistically significant. However, our HR increased to 1.72
when we compared patients with 3-4 versus 0-2 risk alleles, suggesting a gradient in risk with the
number of adverse alleles. In a follow-up study, Warzocha et al. reported that SNPs in LTA+252, TNF
(TNF-376, -308, -238, -163), and HLA DRB1*02, only the TNF -308A allele was associated with higher levels of
TNF and its associated receptors p55 and p75. The TNF -308A allele was also an independent
predictor of freedom from progression (RR=1.63) and overall survival (RR=1.51) in DLBCL,19 and there
was no evidence of a TNF/LTA haplotype effect in this analysis. Of note, the TNF G-308A promoter
polymorphism has been associated with the development of DLBCL in this study population16 and in
the InterLymph consortium pooled dataset,15 suggesting a role for this SNP, or another one in strong
linkage disequilibrium with it, in both the etiology and prognosis of DLBCL.
The other SNPs in our multi-SNP model (IL1A, IL8RB, and IL4R) have not been previously
evaluated as DLBCL prognostic factors. The IL1A (rs1800587) -889T allele has been associated with
higher IL1 production34 and an elevated erythrocyte sedimentation rate,35 but does not appear to be
associated with risk of developing DLBCL.15,36 IL8RB encodes for the receptor of the chemokine IL8, a
potent neutrophil chemoattractant whose expression is greatly enhanced by IL1 and TNF.37 We
observed an association with the IL8RB SNP rs1126580, which is located in the 3’ untranslated region
of the gene, but we did not observe any associations with the other IL8RB or IL8 SNPs, nor with
haplotypes in these genes. While we observed lower survival with the IL8RB rs1126580 AG/GG
genotype, this genotype was associated with lower risk of developing DLBCL in this study population,16
although there was no association between this SNP and DLBCL risk in another study.36 The common
allele (C) for the IL4R SNP rs2107356 was associated with poorer survival in our study; in etiology
studies, this allele has been associated with a lower risk of developing DLBCL in this study population16
but not in two other studies.17,36 IL4 is central to B-cells switching to IgE antibody production and
maturation of helper T cells to a Th2 phenotype, and the IL4 receptor is crucial for binding and signal
transduction of both IL4 and IL13.38 Several genes that correlate with DLBCL survival (e.g., BCL6,
HGAL)7 are IL4-specific target genes,39,40 although IL4 may use different signaling pathways in the
germinal center B-cell (GCB)-like versus the activated B-cell (ABC)-like subtypes of DLBCL,41 and
future studies should consider these subtypes.
For personal use only. by guest on May 31, 2013. bloodjournal.hematologylibrary.orgFrom
14
We found a suggestive positive association of the IL10 A-1082G allele with DLBCL survival
(HRAG/GG=1.48, 95% CI 0.91-2.38), and although this SNP did not make it into our final multi-SNP risk
score, it did enter 27% of the multi-gene bootstrap models (overall ranked 8th). In contrast, Lech-
Maranda and colleagues20 found that this allele was inversely associated with overall survival in 199
DLBCL patients (RR=0.78, p=0.0015), although two other studies reported no association.42,43 We
observed no association of IL10 rs1800871 (C-819T), rs1800872 (C-592A) and rs1800890 (T-3575A)
with DLBCL survival; the results of the former two SNPs are consistent with other studies,20,43 while the
latter SNP has not been previously evaluated for DLBCL survival. Two microsatellite loci44 and 4 SNPs
(-819C, -592C, -1082G, and -3575T)20,45,46 in the IL10 promotor have been associated with greater IL10
production, and higher IL10 levels have been associated with poorer prognosis in DLBCL in some,20,47
but not all48-50 studies. We found that IL10 haplotypes that included alleles with putative greater IL10
production were also the alleles most strongly associated with lower overall survival. With respect to
etiology, the IL10 -1082G and -3575T alleles have been associated with risk of developing
DLBCL.15,17,36
A major strength of this study was the population-based ascertainment of incident cases of DLBCL.
While lack of standardization in treatment and clinical follow-up are limitations of observational studies
relative to clinical trials, clinical trials are often conducted in highly selected patient populations, and
therefore may not be representative of patients in the community. Furthermore, protection from
confounding by the clinical trial design is less compelling in this context, where genotype is unlikely to
confound treatment choice. Our observations, if validated, could be considered for general application
to community-based patients. This study is the largest study of immune candidate SNPs in relation to
survival conducted to date in DLBCL. The genes and SNPs were selected based on either functional
data or their association with cancer or other immune-related diseases, and extensive quality controls
were used to ensure high quality genotyping. Our statistical analyses were comprehensive, and we
have been cautious to evaluate the robustness of our results to both false positives and false negatives.
Nevertheless, this analysis must be acknowledged as a first step, as other SNPs or haplotypes for
these genes, or other immune genes we did not assess, may be of greater prognostic relevance.
For personal use only. by guest on May 31, 2013. bloodjournal.hematologylibrary.orgFrom

15
A limitation of this study was the lack of detailed data on prognostic factors or treatment. However,
we did have age, stage, B-symptoms and treatment class, and these variables predicted survival with a
similar level of predictive ability as the IPI for a large study of DLBCL patients.8 Pathology classification
was based on the cancer registry report without central review. Our sample was aged 20-74 years, and
may not generalize to patients aged 75 years and older. As discussed above, the study design did not
capture patients with aggressive disease who died shortly after diagnosis. Finally, all of these patients
were initially treated before 2000, before the widespread use of rituximab in the treatment of DLBCL.
In summary, host genetic variation in the cytokine and chemokine genes IL1A, IL8RB, IL4R, IL10
and TNF, individually and particularly in combination, were associated with late survival (>12 months) in
DLBCL after accounting for clinical and demographic factors. Our results suggest that patients with a
greater propensity to produce TNF-alpha, IL-10 and IL-1 (and thus a pro-inflammatory state) may
promote lymphomagenesis, decrease the ability of the host to eradicate lymphoma, or perhaps impair
therapeutic efficacy, leading to poorer overall survival. These same TNF and IL10 SNPs and
haplotypes also appear to increase risk of developing DLBCL, supporting a shared mechanism in the
etiology and prognosis of DLBCL. The association with IL8RB supports a role for the tumor
microenvironment in the biologic and clinical behavior of DLBCL. In conclusion, immunogenetics
represents a promising class of prognostic factors that warrants further evaluation in DLBCL.
For personal use only. by guest on May 31, 2013. bloodjournal.hematologylibrary.orgFrom

16
Acknowledgments
We thank Peter Hui and Cristine Allmer for programming assistance, and Sondra Buehler for assistance
in manuscript preparation. All authors declare no competing financial interests.
Authorship: Design of study: Cerhan, Hartge Obtained funding: Cerhan, Hartge, Rothman, Chanock Obtained Clinical Data: Cerhan, Cozen, Davis, Hartge, Lynch, Severson Obtained Genetic Data: Chanock, Wang, Rothman Statistical Analysis: Maurer, Geyer Drafting of Manuscript: Habermann, Cerhan Revision of Manuscript: All authors All authors reviewed and approved the final manuscript
Support: R01 CA96704; P50 CA97274; NCI Intramural Program; SEER contracts N01-PC-67010, N01-PC-67008, N01-PC-67009, N01-PC-65064, N02-PC-71105.
For personal use only. by guest on May 31, 2013. bloodjournal.hematologylibrary.orgFrom

17
References
1. Jaffe ES, Harris N, Stein H, Vardiman J. World Health Organization classification of tumours
pathology and genetics, tumours of hematopoietic and lymphoid tissues. Lyon: IARC Press; 2001.
2. Morton LM, Wang SS, Devesa SS, Hartge P, Weisenburger DD, Linet MS. Lymphoma incidence
patterns by WHO subtype in the United States, 1992-2001. Blood. 2006;107:265-276.
3. Coiffier B, Lepage E, Briere J, et al. CHOP chemotherapy plus rituximab compared with CHOP
alone in elderly patients with diffuse large-B-cell lymphoma. N Engl J Med. 2002;346:235-242.
4. Feugier P, Van Hoof A, Sebban C, et al. Long-term results of the R-CHOP study in the treatment
of elderly patients with diffuse large B-cell lymphoma: a study by the Groupe d'Etude des
Lymphomes de l'Adulte. J Clin Oncol. 2005;23:4117-4126.
5. Habermann TM, Weller EA, Morrison VA, et al. Rituximab-CHOP versus CHOP alone or with
maintenance rituximab in older patients with diffuse large B-cell lymphoma. J Clin Oncol.
2006;24:3121-3127.
6. Gascoyne RD. Emerging prognostic factors in diffuse large B cell lymphoma. Curr Opin Oncol.
2004;16:436-441.
7. Lossos IS. Molecular pathogenesis of diffuse large B-cell lymphoma. J Clin Oncol. 2005;23:6351-
6357.
8. Rosenwald A, Wright G, Chan WC, et al. The use of molecular profiling to predict survival after
chemotherapy for diffuse large-B-cell lymphoma. N Engl J Med. 2002;346:1937-1947.
9. Wright G, Tan B, Rosenwald A, Hurt EH, Wiestner A, Staudt LM. A gene expression-based
method to diagnose clinically distinct subgroups of diffuse large B cell lymphoma. Proc Natl Acad
Sci U S A. 2003;100:9991-9996.
10. Monti S, Savage KJ, Kutok JL, et al. Molecular profiling of diffuse large B-cell lymphoma identifies
robust subtypes including one characterized by host inflammatory response. Blood.
2005;105:1851-1861.
11. Hunter KW, Crawford NP. Germ line polymorphism in metastatic progression. Cancer Res.
2006;66:1251-1254.
For personal use only. by guest on May 31, 2013. bloodjournal.hematologylibrary.orgFrom
18
12. Cerhan JR, Wang S, Maurer MJ, et al. Prognostic significance of host immune gene
polymorphisms in follicular lymphoma survival. Blood. 2007;109:5439-5446.
13. Kurzrock R. Cytokine deregulation in hematological malignancies: clinical and biological
implications. Clinical Cancer Research. 1997;3:2581-2584.
14. Balkwill F, Mantovani A. Inflammation and cancer: back to Virchow? Lancet. 2001;357:539-545.
15. Rothman N, Skibola CF, Wang SS, et al. Genetic variation in TNF and IL10 and risk of non-
Hodgkin lymphoma: a report from the InterLymph Consortium. Lancet Oncol. 2006;7:27-38.
16. Wang SS, Cerhan JR, Hartge P, et al. Common genetic variants in proinflammatory and other
immunoregulatory genes and risk for non-Hodgkin lymphoma. Cancer Res. 2006;66:9771-9780.
17. Lan Q, Zheng T, Rothman N, et al. Cytokine polymorphisms in the Th1/Th2 pathway and
susceptibility to non-Hodgkin lymphoma. Blood. 2006;107:4101-4108.
18. Warzocha K, Ribeiro P, Bienvenu J, et al. Genetic polymorphisms in the tumor necrosis factor
locus influence non-Hodgkin's lymphoma outcome. Blood. 1998;91:3574-3581.
19. Juszczynski P, Kalinka E, Bienvenu J, et al. Human leukocyte antigens class II and tumor
necrosis factor genetic polymorphisms are independent predictors of non-Hodgkin lymphoma
outcome. Blood. 2002;100:3037-3040.
20. Lech-Maranda E, Baseggio L, Bienvenu J, et al. Interleukin-10 gene promoter polymorphisms
influence the clinical outcome of diffuse large B-cell lymphoma. Blood. 2004;103:3529-3534.
21. Morton LM, Turner JJ, Cerhan JR, et al. Proposed classification of lymphoid neoplasms for
epidemiologic research from the Pathology Working Group of the International Lymphoma
Epidemiology Consortium (InterLymph). Blood. 2007;110:695-708.
22. Packer BR, Yeager M, Staats B, et al. SNP500Cancer: a public resource for sequence validation
and assay development for genetic variation in candidate genes. Nucleic Acids Res.
2004;32:D528-532.
23. Cox DR. Regression models and life tables (with discussion). J R Stat Soc B. 1972;34:187-220.
24. Freidlin B, Zheng G, Li Z, Gastwirth JL. Trend tests for case-control studies of genetic markers:
power, sample size and robustness. Hum Hered. 2002;53:146-152.
For personal use only. by guest on May 31, 2013. bloodjournal.hematologylibrary.orgFrom
19
25. Shipp MA, Harrington DP, Anderson JR, al. e. A predictive model for aggressive non-Hodgkin's
lymphoma. The International Non-Hodgkin's Lymphoma Prognostic Factors Project. N Engl J
Med. 1993;329:987-994.
26. Rosenbaum P, Rubin D. The central role of the propensity score in observational studies for
causal effects. Biometrika. 1983;70:41-55.
27. Schaid DJ, Rowland CM, Tines DE, Jacobson RM, Poland GA. Score tests for association
between traits and haplotypes when linkage phase is ambiguous. Am J Hum Genet. 2002;70:425-
434.
28. Taylor J, Tibshirani R. A tail strength measure for assessing the overall univariate significance in a
dataset. Biostatistics. 2006;7:167-181.
29. Benjamini Y, Hochberg Y. Controlling the false discovery rate: a practical and powerful approach
to multiple testing. J R Stat Soc B. 1995;57:289-300.
30. Wu X, Gu J, Grossman HB, et al. Bladder cancer predisposition: a multigenic approach to DNA-
repair and cell-cycle-control genes. Am J Hum Genet. 2006;78:464-479.
31. Heagerty PJ, Lumley T, Pepe MS. Time-dependent ROC curves for censored survival data and a
diagnostic marker. Biometrics. 2000;56:337-344.
32. Surveillance, Epidemiology, and End Results (SEER) Program (www.seer.cancer.gov) SEER*Stat
Database: Incidence - SEER 9 Regs Limited-Use, Nov 2007 Sub (1973-2005) <Katrina/Rita
Population Adjustment> - Linked To County Attributes - Total U.S., 1969-2005 Counties, National
Cancer Institute, DCCPS, Surveillance Research Program, Cancer Statistics Branch, released
April 2008, based on the November 2007 submission.
33. Warzocha K, Salles G, Bienvenu J, et al. Tumor necrosis factor ligand-receptor system can
predict treatment outcome in lymphoma patients. J Clin Oncol. 1997;15:499-508.
34. Hulkkonen J, Laippala P, Hurme M. A rare allele combination of the interleukin-1 gene complex is
associated with high interleukin-1 beta plasma levels in healthy individuals. Eur Cytokine Netw.
2000;11:251-255.
For personal use only. by guest on May 31, 2013. bloodjournal.hematologylibrary.orgFrom
20
35. McDowell TL, Symons JA, Ploski R, Forre O, Duff GW. A genetic association between juvenile
rheumatoid arthritis and a novel interleukin-1 alpha polymorphism. Arthritis Rheum. 1995;38:221-
228.
36. Purdue MP, Lan Q, Kricker A, et al. Polymorphisms in immune function genes and risk of non-
Hodgkin lymphoma: findings from the New South Wales non-Hodgkin Lymphoma Study.
Carcinogenesis. 2007;28:704-712.
37. De Larco JE, Wuertz BR, Furcht LT. The potential role of neutrophils in promoting the metastatic
phenotype of tumors releasing interleukin-8. Clin Cancer Res. 2004;10:4895-4900.
38. Shirakawa I, Deichmann KA, Izuhara I, Mao I, Adra CN, Hopkin JM. Atopy and asthma: genetic
variants of IL-4 and IL-13 signalling. Immunol Today. 2000;21:60-64.
39. Lossos IS, Alizadeh AA, Rajapaksa R, Tibshirani R, Levy R. HGAL is a novel interleukin-4-
inducible gene that strongly predicts survival in diffuse large B-cell lymphoma. Blood.
2003;101:433-440.
40. Schroder AJ, Pavlidis P, Arimura A, Capece D, Rothman PB. Cutting edge: STAT6 serves as a
positive and negative regulator of gene expression in IL-4-stimulated B lymphocytes. J Immunol.
2002;168:996-1000.
41. Lu X, Nechushtan H, Ding F, et al. Distinct IL-4-induced gene expression, proliferation, and
intracellular signaling in germinal center B-cell-like and activated B-cell-like diffuse large-cell
lymphomas. Blood. 2005;105:2924-2932.
42. Berglund M, Thunberg U, Roos G, Rosenquist R, Enblad G. The interleukin-10 gene promoter
polymorphism (-1082) does not correlate with clinical outcome in diffuse large B-cell lymphoma.
Blood. 2005;105:4894-4895; author reply 4895.
43. Kube D, Hua T-D, Kloss M, et al. The interleukin-10 gene promoter polymorphism--1087AG does
not correlate with clinical outcome in non-Hodgkin's lymphoma. Genes Immun. 2007;8:164-167.
44. Eskdale J, Gallagher G, Verweij CL, Keijsers V, Westendorp RG, Huizinga TW. Interleukin 10
secretion in relation to human IL-10 locus haplotypes. Proc Natl Acad Sci U S A. 1998;95:9465-
9470.
For personal use only. by guest on May 31, 2013. bloodjournal.hematologylibrary.orgFrom

21
45. Turner DM, Williams DM, Sankaran D, Lazarus M, Sinnott PJ, Hutchinson IV. An investigation of
polymorphism in the interleukin-10 gene promoter. Eur J Immunogenet. 1997;24:1-8.
46. Gibson AW, Edberg JC, Wu J, Westendorp RG, Huizinga TW, Kimberly RP. Novel single
nucleotide polymorphisms in the distal IL-10 promoter affect IL-10 production and enhance the
risk of systemic lupus erythematosus. J Immunol. 2001;166:3915-3922.
47. Blay JY, Burdin N, Rousset F, et al. Serum interleukin-10 in non-Hodgkin's lymphoma: a
prognostic factor. Blood. 1993;82:2169-2174.
48. Stasi R, Zinzani L, Galieni P, et al. Clinical implications of cytokine and soluble receptor
measurements in patients with newly-diagnosed aggressive non-Hodgkin's lymphoma. Eur J
Haematol. 1995;54:9-17.
49. Cortes JE, Talpaz M, Cabanillas F, Seymour JF, Kurzrock R. Serum levels of interleukin-10 in
patients with diffuse large cell lymphoma: lack of correlation with prognosis. Blood. 1995;85:2516-
2520.
50. Fabre-Guillevin E, Tabrizi R, Coulon V, et al. Aggressive non-Hodgkin's lymphoma: concomitant
evaluation of interleukin-2, soluble interleukin-2 receptor, interleukin-4, interleukin-6, interleukin-10
and correlation with outcome. Leuk Lymphoma. 2006;47:603-611.
For personal use only. by guest on May 31, 2013. bloodjournal.hematologylibrary.orgFrom

22
Table 1. Candidate genes and SNPs, NCI-SEER NHL Survival Study
Gene Name Location SNP rs number
CARD15 Caspase recruitment domain family, member 15 16q12 rs2066842*, rs2066844*, rs2066847 CCR2 Chemokine, CC motif, receptor 2 3p21 rs1799864 CCR5 Chemokine, CC motif, receptor 5 3p21 rs333 CTLA4 Cytotoxic T lymphocyte-associated 4 2q33 rs231775
CSF3 Colony stimulating factor 3 (granulocyte) 17q11.2-q12 rs25645*
CX3CR1 Chemokine, CXC motif 3p21 rs3732379* CXCL12 Chemokine, CXC motif, ligand 12 10q11.1 rs1801157 FCGR2A Receptor for Fc fragment of IgG, low affinity IIa
(CD32) 1q21-q23 rs1801274
ICAM1 Intercellular adhesion molecule 1 (CD54) 19p13.3-p13.2 rs5491 INFA1 interferon, alpha 1 9p22 rs1758566* IFNG Interferon, gamma 21q14 rs1861494, rs2069705 IFNGR1 Interferon, gamma, receptor 1 6q23-q24 rs3799488* IFNGR2 Interferon, gamma, receptor 2 21q22.11 rs9808753 IL1A Interleukin 1-alpha 2q13 rs17561, rs1800587 IL1B Interleukin 1-beta 2q14 rs16944, rs1143627, rs1143634 IL1RN Interleukin 1 receptor antagonist 2q14.2 rs454078 IL2 Interleukin 2 4q26-q27 rs2069762 IL3 Interleukin 3 5q31.1 rs40401* IL4 Interleukin 4 5q31.1 rs2070874, rs2243248, rs2243250 IL4R Interleukin 4 receptor 16p12.1-p11.2 rs2107356 IL5 Interleukin 5 5q31.1 rs2069807, rs2069812, rs2069818* IL6 Interleukin 6 7p15.3 rs1800795, rs1800797 IL7R Interleukin 7 receptor (CD127) 5p13 rs1494555* IL8 Interleukin 8 4q12-q13 rs4073, rs2227307, rs2227306 IL8RB Interleukin 8 receptor, beta 2q35 rs1126579, rs1126580, rs2230054* IL9 Interleukin 9 5q31.1 rs1799962* IL9R Interleukin 9 receptor Xq28 or Yq12 rs6522* IL10 Interleukin 10 1q31-q32 rs1800871, rs1800872, rs1800896,
rs1800890 IL10RA Interleukin 10 receptor, alpha 11q23.3 rs9610 IL12A Interleukin 12, alpha 3q25.33 rs568408 IL12B Interleukin 12B (natural killer cell stimulatory
factor 2, cytotoxic lymphocyte maturation factor 2, p40)
5q33.3 rs3212227
IL13 Interleukin 13 5q23.3 rs20541, rs1800925 IL15 Interleukin 15 4q31.21 rs10833 IL15RA Interleukin 15 receptor, alpha 10p15.1 rs2296135 IL16 Interleukin 16 15q25.1 rs859, rs11325 JAK3 Janus kinase 3 19p13.1 rs3008*, rs3212713* LTA Lymphotoxin-alpha 6p21.3 rs909253, rs2239704 MBL2 mannose-binding lectin (protein C) 2, soluble 10q11.2-q21 rs7095891*, rs11595876*,
rs10824792*, rs2083771* SELE Selectin E 1q22-q25 rs5361* STAT1 Signal transducer and activator of transcription
1 2q32.2-q32.3 rs2066804*
TLR4 Toll-like receptor 4 9q32-q33 rs4986790 TNF Tumor necrosis factor 6p21.3 rs1800629, rs361525, rs1799724,
rs1800630 TNFRSF10A tumor necrosis factor receptor superfamily, 10a 8p21 rs20577* VCAM1 Vascular cell adhesion molecule 1 1p32-p31 rs1041163, rs3176879
*Genotyped in blood-based samples only
For personal use only. by guest on May 31, 2013. bloodjournal.hematologylibrary.orgFrom

23
Table 2. SNPs most strongly associated with DLBCL survival, ordered by the p-value from the co-dominant model
SNP
Gene
p-valuea
Deleterious
Genotype(s)b
Percent of Patients
with Deleterious Genotype
HRc
95% CI
rs2069807 IL5d <0.001 CT/TT 2.9% 4.56 1.98 – 10.5
rs1126580 IL8RB 0.002 AG/GG 68.6% 2.11 1.28 – 3.50
rs1800587 IL1A 0.004 CT/TT 49.2% 1.90 1.26 – 2.87
rs17561 IL1A 0.03 GT/TT 46.6% 1.56 1.04 – 2.35
rs3176879 VCAM1d 0.03 AG/GG 6.9% 2.10 1.04 – 4.22
rs1800795 IL6 0.03 GG/CG 86.1% 1.57 0.84 – 2.94
rs1800797 IL6 0.04 GG 40.6% 1.47 0.99 – 2.21
rs5491 ICAM1d 0.04 AT/TT 2.3% 2.80 1.01 – 7.72
rs25645 CSF3e 0.04 AA 14.7% 2.37 1.34 – 4.21
rs1800896 IL10 0.08 AG/GG 71.0% 1.48 0.91 – 2.38
rs1143634 IL1B 0.09 CT/TT 33.8% 1.31 0.86 – 1.98
rs1800629 TNF 0.09 AG/AA 33.1% 1.44 0.95 – 2.18
rs1801157 CXCL12 0.09 GG 64.8% 1.62 1.02 – 2.58
rs1041163 VCAM1 0.10 TT 69.4% 1.35 0.88 – 2.08
rs5361 SELEe 0.12 AC/CC 17.0% 1.41 0.74 – 2.66
rs2107356 IL4R 0.14 CC/CT 82.4% 1.97 1.01 – 3.83
rs1799724 TNF 0.15 CC 83.4% 1.35 0.78 – 2.34
aObserved p-value from the trend test (co-dominant model) from supplementary Table 1.
bSNPs recoded as 0=low risk genotype(s) and 1=deleterious genotype(s) based on results from supplementary table. Missing genotype data were included with the low risk category.
cHazard ratio, adjusted for age, clinical and demographic factors. Note that the HR is based on assigning missing SNP data to the reference group (low risk genotype).
dSNPs with a MAF <0.05 (not eligible for the multi-SNP risk score).
eSNPs that were only genotyped in patients with a blood-based DNA sample (N=215) were not eligible for the multi-SNP risk score.
For personal use only. by guest on May 31, 2013. bloodjournal.hematologylibrary.orgFrom
24
Table 3. Haplotype analyses
Genes SNPs in Haplotype Haplotype %
HR* 95% CI P
TNF/ rs1800629 rs909253 LTA TNF
G-308A LTA
A252G
1 G A 62% 1.00 reference 2 A A <1% 3 G G 19% 1.05 (0.74, 1.50) 0.8 4 A G 19% 1.36 (0.96, 1.94) 0.09 global p=0.23
IL10 rs1800871 rs1800872 rs1800896 rs1800890 C-819T C-592A A-1082G T-3575A 1 A T 55% 1.00 reference 2 G A 38% 1.21 (0.89, 1.65) 0.22 3 G T 7% 1.82 (1.08, 3.07) 0.02 4 A A <1% global p=0.07 1 C C A T 28% 1.00 reference 2 C C G A 39% 1.42 (0.94, 2.14) 0.10 3 T A A T 26% 1.59 (1.01, 2.50) 0.04 4 C C G T 7% 2.44 (1.34, 4.44) 0.003 global p=0.03
*Hazard ratio, adjusted for age, clinical and demographic factors.
For personal use only. by guest on May 31, 2013. bloodjournal.hematologylibrary.orgFrom
25
Table 4. Univariate and multivariate Cox models for the 4 SNP risk score
Number of deleterious genotypes*
Univariate Model Multivariate Model†
N % Dead HR 95% CI HR 95% CI
0,1 74 12.2% 1.00 (reference) 1.00 (reference)
2,3 247 26.7% 2.47 1.23 – 4.96 2.76 1.37 – 5.56
4 44 47.7% 5.63 2.57 – 2.30 6.77 3.05 – 15.0
p = 2.8 x 10⁻⁵ p = 3.7 x 10⁻⁶
Continuous 1.56 1.26 – 1.94 1.65 1.32 – 2.05
*IL1A (rs1800587), IL8RB (rs1126580), IL4R (rs2107356), and TNF (rs1800629) as coded in Table 2
†Model adjusted for age, clinical and demographic and risk factors.
For personal use only. by guest on May 31, 2013. bloodjournal.hematologylibrary.orgFrom

26
Table 5. Cox model for the combined SNP and clinical and demographic risk score.
Risk Score* N % Dead HR 95% CI
0-2 95 7.3% 1.00 (reference)
3 106 18.9% 2.76 1.17 – 6.53
4 88 36.4% 5.91 2.61 – 13.4
5-6 76 48.7% 9.50 4.22 – 21.4
p = 6.0 x 10⁻¹¹
Continuous 1.86 1.56 – 2.22
*Number of hazardous genotypes (0-4) plus the clinical and demographic risk score (0-2).
For personal use only. by guest on May 31, 2013. bloodjournal.hematologylibrary.orgFrom
27
FIGURE 1. Selection of the Multi-SNP Model. Panel A shows the reduction in the -2 log likelihood when comparing the best 1 SNP, 2 SNP,…8 SNP model from the study data (solid line) as well as expected reduction due to chance (dashed line). Panel B ranks the percent of 1,000 stepwise bootstrap Cox models in which a SNP was included. The top 4 SNPs in the bootstrap model are the same 4 SNPs in the best 4-SNP risk model. FIGURE 2. Comparison of Study Data to SEER DLBCL Survival. SEER data (observed and conditioned on surviving 12 months) is based on whites from Detroit, Iowa, Los Angeles and Seattle sites, aged 20-74 years at diagnosis, and diagnosis dates 1995-2000.32 FIGURE 3. Results for the 4 SNP Risk Score. Kaplan-Meier curves by the number of deleterious genotypes from the 4 SNP Risk Score based on IL1A (rs1800587), IL8RB (rs1126580), IL4R (rs2107356), and TNF (rs1800629). FIGURE 4. Results for the Combined SNP and Clinical and Demographic Risk Score. Kaplan-Meier curves by level of the combined 4 SNP and clinical and demographic risk score. FIGURE 5. Time-Dependent ROC Analysis. Time-dependent receiver-operator (ROC) analysis using the NCI-SEER dataset (clinical and demographic risk score, 4 SNP risk score, combined 4 SNP and clinical and demographic risk score) and using the Lymphoma/Leukemia Molecular Profiling Project (LLMPP) dataset8 (International Prognostic Index (IPI), Germinal-Center B-cell-like (GCB), and GCB + IPI).
For personal use only. by guest on May 31, 2013. bloodjournal.hematologylibrary.orgFrom
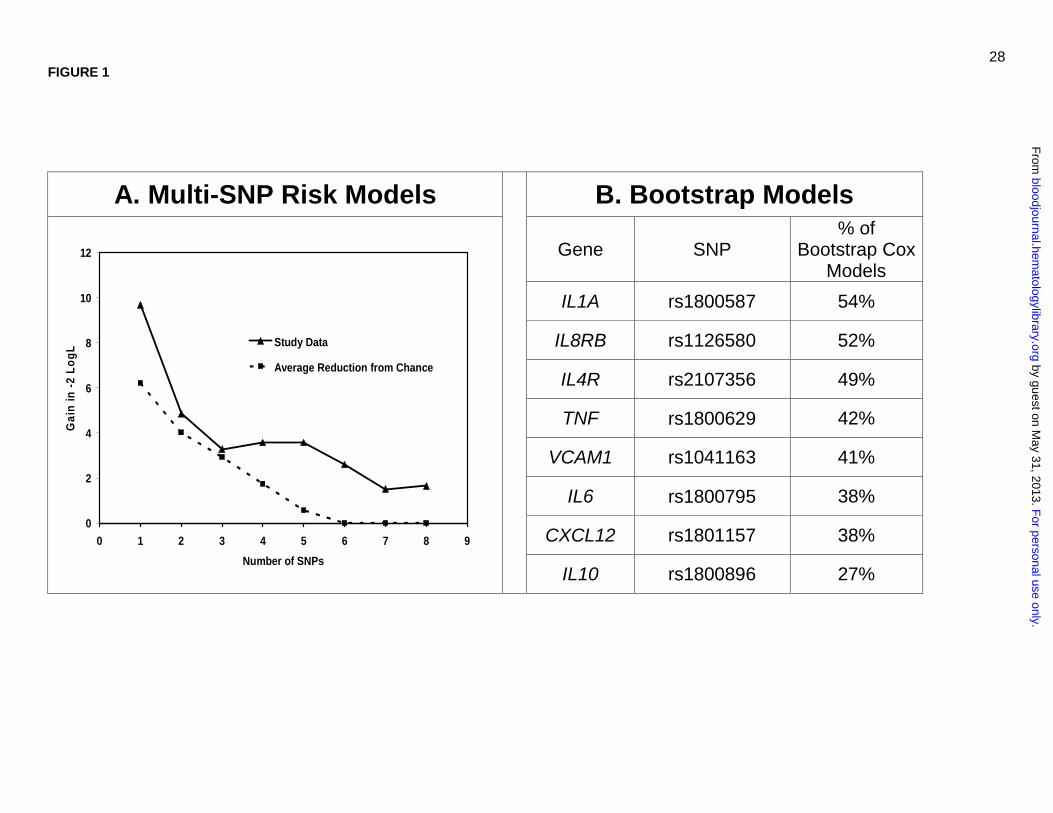
28 FIGURE 1
A. Multi-SNP Risk Models
B. Bootstrap Models
0
2
4
6
8
10
12
0 1 2 3 4 5 6 7 8 9
Number of SNPs
Gai
n in
-2
Lo
gL Study Data
Average Reduction from Chance
Gene SNP % of
Bootstrap Cox Models
IL1A rs1800587 54%
IL8RB rs1126580 52%
IL4R rs2107356 49%
TNF rs1800629 42%
VCAM1 rs1041163 41%
IL6 rs1800795 38%
CXCL12 rs1801157 38%
IL10 rs1800896 27%
F
or personal use only. by guest on M
ay 31, 2013. bloodjournal.hem
atologylibrary.orgF
rom

29 FIGURE 2
0%
10%
20%
30%
40%
50%
60%
70%
80%
90%
100%
0 12 24 36 48 60 72 84
Months
% A
live
SEER ObservedStudy DataSEER 12 Month Conditional Observed
F
or personal use only. by guest on M
ay 31, 2013. bloodjournal.hem
atologylibrary.orgF
rom

30 FIGURE 3
0
20
40
60
80
100
0 1 2 3 4 5 6
Years
% S
urv
ival
p = 0.00001
Score = 0–1
Score = 2–3
Score = 4
F
or personal use only. by guest on M
ay 31, 2013. bloodjournal.hem
atologylibrary.orgF
rom

31 FIGURE 4
0
20
40
60
80
100
0 1 2 3 4 5 6
Years
% S
urv
ival
p = 4.9 x 10⁻¹¹
Score = 0–2
Score = 3
Score = 4
Score = 5–6
F
or personal use only. by guest on M
ay 31, 2013. bloodjournal.hem
atologylibrary.orgF
rom
32
FIGURE 5
0.5
0.6
0.7
0.8
0.9
1
0 1 2 3 4 5 6 7
Years
AU
C
Clinical and Demographic Risk Score4 SNP Risk Score4 SNP + Clinical and Demographic Risk ScoreIPI from LLMPPGCB from LLMPPGCB + IPI from LLMPP
F
or personal use only. by guest on M
ay 31, 2013. bloodjournal.hem
atologylibrary.orgF
rom