Hong Kong Shipping Statistics (April - June 1987)
100
-
Upload
khangminh22 -
Category
Documents
-
view
2 -
download
0
Transcript of Hong Kong Shipping Statistics (April - June 1987)
這份刊物的 PDF 版本的文字是從印刷版掃描而成,再利用光學字符識別軟件轉換成電子格式。由於原印刷版本已印製
並保存多年,光學字符識別技術未必能準確地識別某些文字或數字。因此,搜索或複製此 PDF 檔案內的文字時應加以
注意。 The text of this PDF publication was scanned from its printed version and then converted to electronic text using Optical Character Recognition (OCR) software. Because of the age and condition of the original printed copy, the OCR may not recognise certain characters or figures accurately. Caution should therefore be taken when searching or copying text from this PDF publication.
PART A
PART B
PART C
PART D
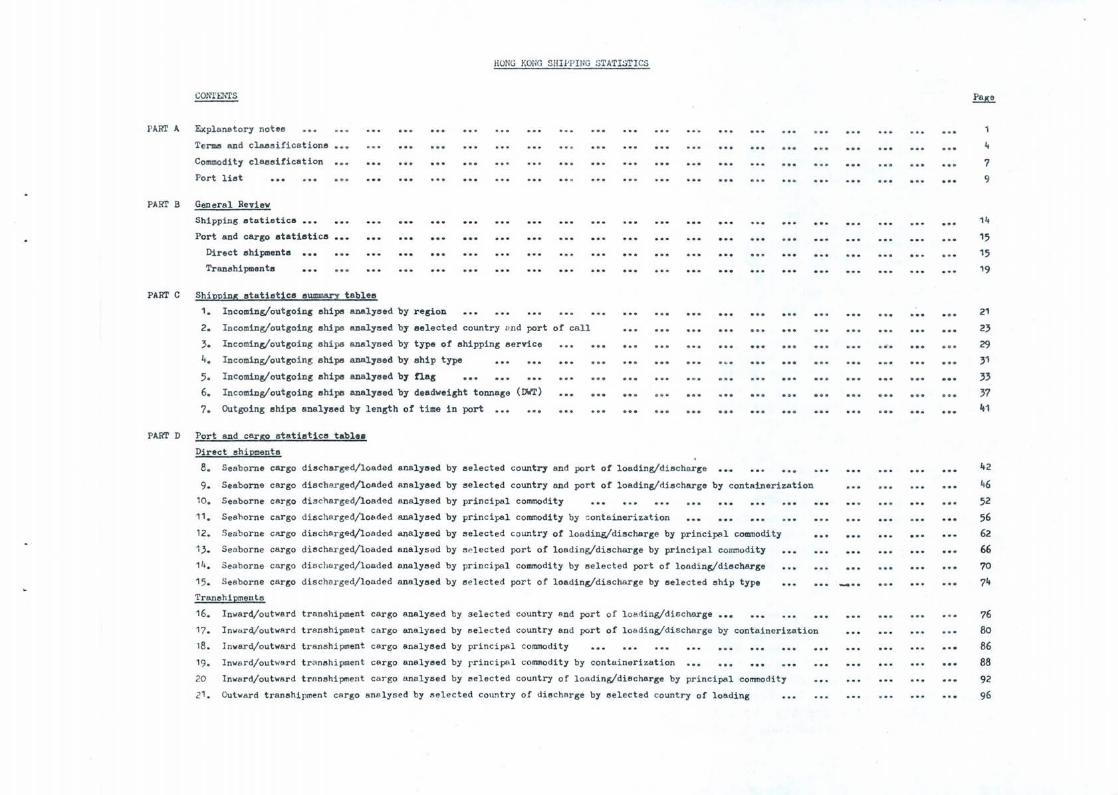
CONTENTS
~planatory notes
Terms and claesifications
Commodity classification
Port liat
General Review
Shipping atatiatica
Port and cargo ststistics
Direct shipments
Tranehipments
Shipping statistics Summary tables
1. Incoming/outgoing ehips analyeed by region
HONG KotlG SHI l-'PING STATISTICS
2. Incoming/outgoing ships analysed by selected country ~nd port of call
3. Incoming/outgoing ships analysed by type of shipping service
4. Incoming/outgoing ships analysed" by ship type
5. Incoming/outgoing ships analysed by !lag
6. Incoming/outgoing ships analysed by deadweight tonnage (DWT)
7. Outgoing ships analysed by length of t ime in port
Port and car !2 statistics table.
Direct ehipments
8. Seaborne cargo
9. Seaborne cargo
10. Seaborne cargo
11. Seahorne cargo
12. Seaborne CRrgo
13. Seaborne cargo
14. Seaborne cargo
15. Seaborne cargo
TranehiEmente
16.
17.
18 .
19. 20
Inward/outward
Inlolard/outward
Inward/outward
Inward/outward
Inward/outward
dischsrged/loaded
dischar ged/loaded
discharged/loaded
discharged/loaded
discharged/loaded
discharged/loaded
discharged/loaded
discharged/loaded
transhipment cargo
transhipment cargo
transhipment cargo
transhipment cargo
trnnshipment cargo
analysed by
analysed by
analysed by
analyeed by
analysed by
analysed by
analysed by
analysed by
analysed by
analysed by
analysed by
analyeed by
analysed by
selected country and port of loading/discharge
selected country and port of loading/discharge by containerization
principal commodity
principal commodity by containerization
selected country of loading/discharge by principal commodity
" elected port of loeding/discharge by principal commodity
principal commodity by selected port of loading/discharge
s elected port of loading/discharge by selected "hip type
selected country and port of l oadi ng/discharge
selected country and port of loading/discharge by containerization
princ i pal commodity
rrincipal commodity by containeri zation
selected country of loading/dischar ge by principal commodity
21. Cutward transhipment cargo analysed by selected co~~try of diecharge by ~elected country of loading
.. '.
Page
4
7
9
14
'5 '5 19
21
23
29
3' 33 37 41
42
46
52
56 62 66
70
74
76 80 86 88
92
96
PAR T A
EXPLANATORY NOTES
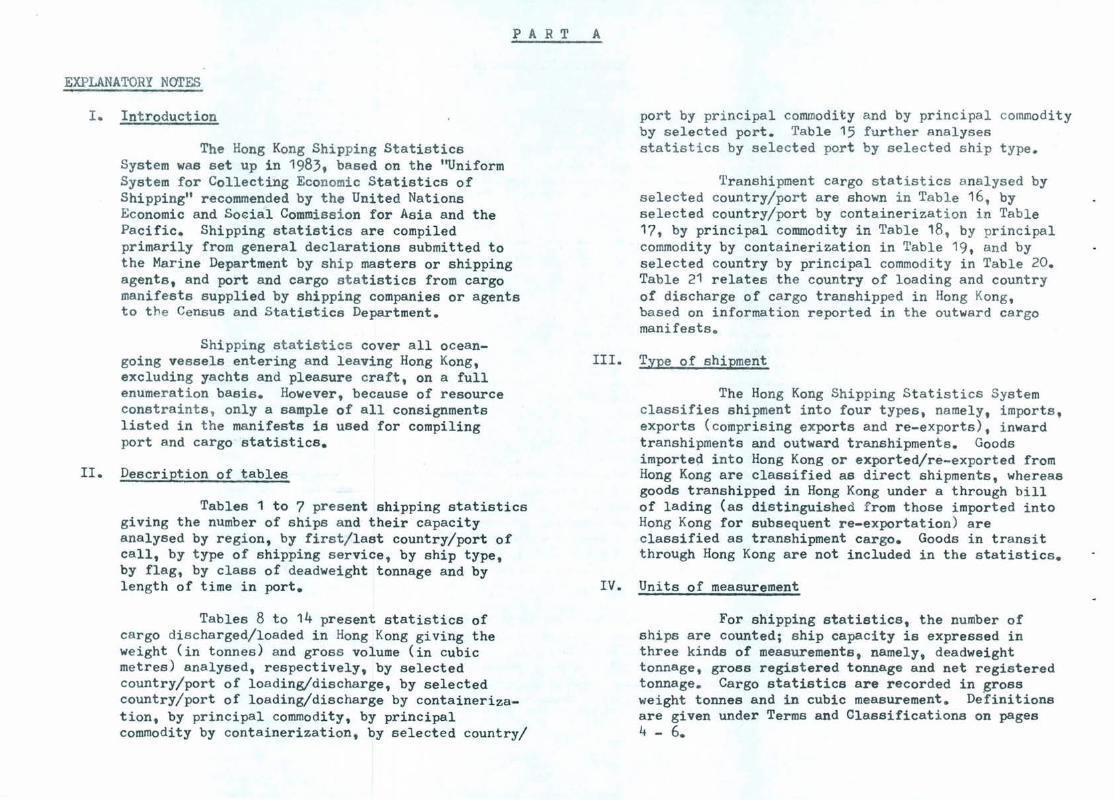
I. Introduction
The Hong Kong Shipping Statistics System was set up in 1983, based on the '~niform System for Collecting Economic Statistics of Shipping" recommended by the United Nations Economic and SOGial Commissi on for Asia and the Pacific~ Shipping statistics are compiled primarily from general declarations submitted to the Marine Department by ship masters or shipping agents, and port and cargo statistics from cargo manifests supplied by shipping companies or agents to t he Census and Statistics Department.
Shipping s tat istics cover all oceangoing vessels entering and leaving Hong Kong, excluding ya chts and pleasure craft, on a full enumeration basis. However, because of resource constraints , only a sample of all consignments listed in the manifests is used for compiling port and cargo statistics.
11. Description of tables
Tables 1 to 7 present shipping statistics g1v1ng the number of ships and their capacity analysed by region, by first/last country/port of call, by type of shipping service, by ship type, by flag, by class of deadweight tonnage and by length of time in port.
Tables 8 to 14 present statistics of cargo discharged/loaded in Hong Kong giving the weight (in tonnes) and gross volume (in cubic metres) analysed, respectively, by selected country/port of loading/discharge, by selected country/port of loading/discharge by containerization, by prinCipal commodity, by prinCipal commodity by containerization, by selected country/
port by principal commodity and by principal commodity by selected port. Table 15 further analyses statistics by selected port by selected ship type.
Transhipment cargo statistics analysed by selected country/port are shown in Table 16, by selected country/port by containerizat ion in Table 17, by principal commodity in Table 18 , by princ ipal commodity by containerization in Table 19, and by selected country by principal commodity in Table 20. Table 21 relates the country of loading and country of discharge of cargo transhipped in Hong Kong, based on informat i on reported in the outward cargo manifests.
Ill . Type of shipment
The Hong Kong Shipping Statistics System classifies shipment into four types, namely, imports, exports (comprising exports and re-exports), inward transhipments and outward transhipments. Goods importe~ into Hong Kong or exported/re-exported from Hong Kong are classified as direct shipments, whereas goods transhipped in Hong Kong under a through bill of lading (as distinguished from those imported into Hong Kong for subsequent re-exportation) are classified as transhipment cargo. Goods in transit through Hong Kong are not included in the statistics.
IV . Units of measurement
For shipping statistics, the number of ships are counted; ship capacity is expressed in three kinds of measurements, namely, deadweight tonnage, gross registered tonnage and net registered tonnage. Cargo statistics are recorded in gross weight tonnes and in cubic measurement. Definitions are given under Terms and Classifications on pages 4 - 6.
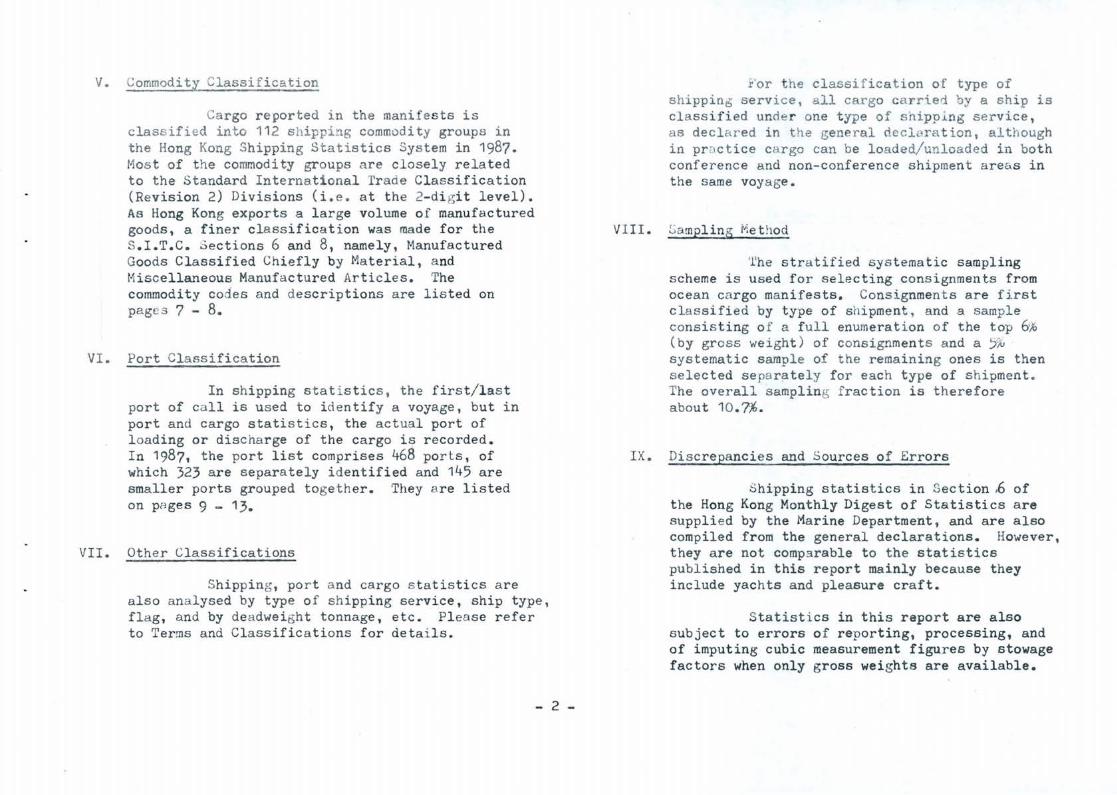
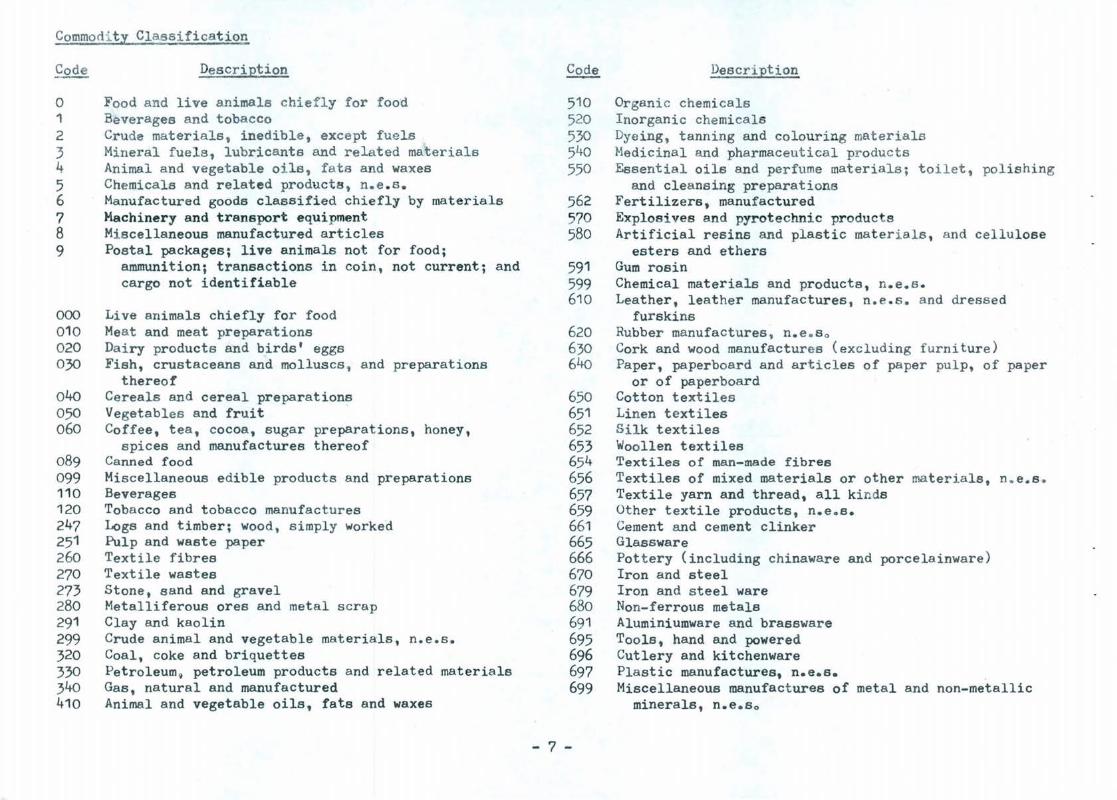
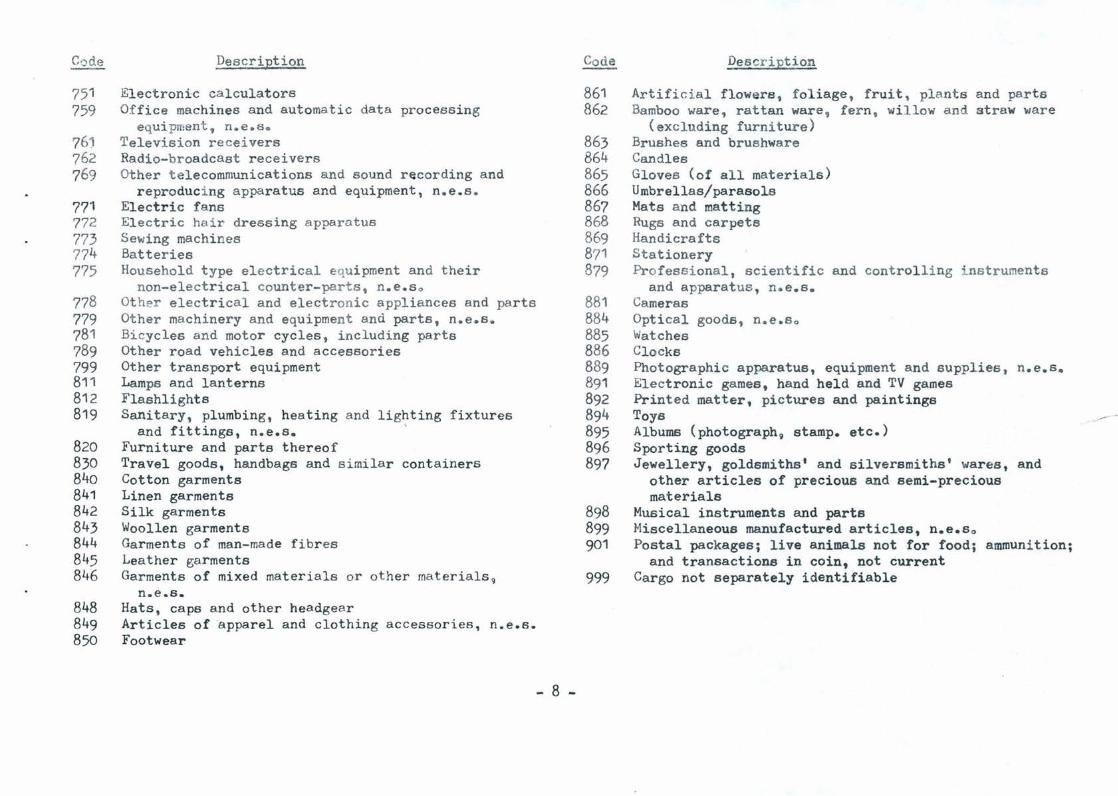
V. Commodi ty Classi f icat ion
Cargo r eported i n the manifes t s i s class if ied into 112 shipping commodity groups in the Hong Kong Shipping Statistics System i n 1987. Most of t he commod ity groups are closel y related to t he Standard I n ternational Tr ade Classification (Revision 2) Divisions (i .e. at the 2-digit level). As Hong Kong exports a large volume of manufactured goods, a finer classifica tion was made for the S.I.T.C. Sections 6 and 8, namely, ~1anufactured Goods Classified Chiefly by t'laterial, and !hscellaneous Manufactured Articles. The commodity code s and descriptions are listed on pages 7 - 8.
VI . Port Classifi cation
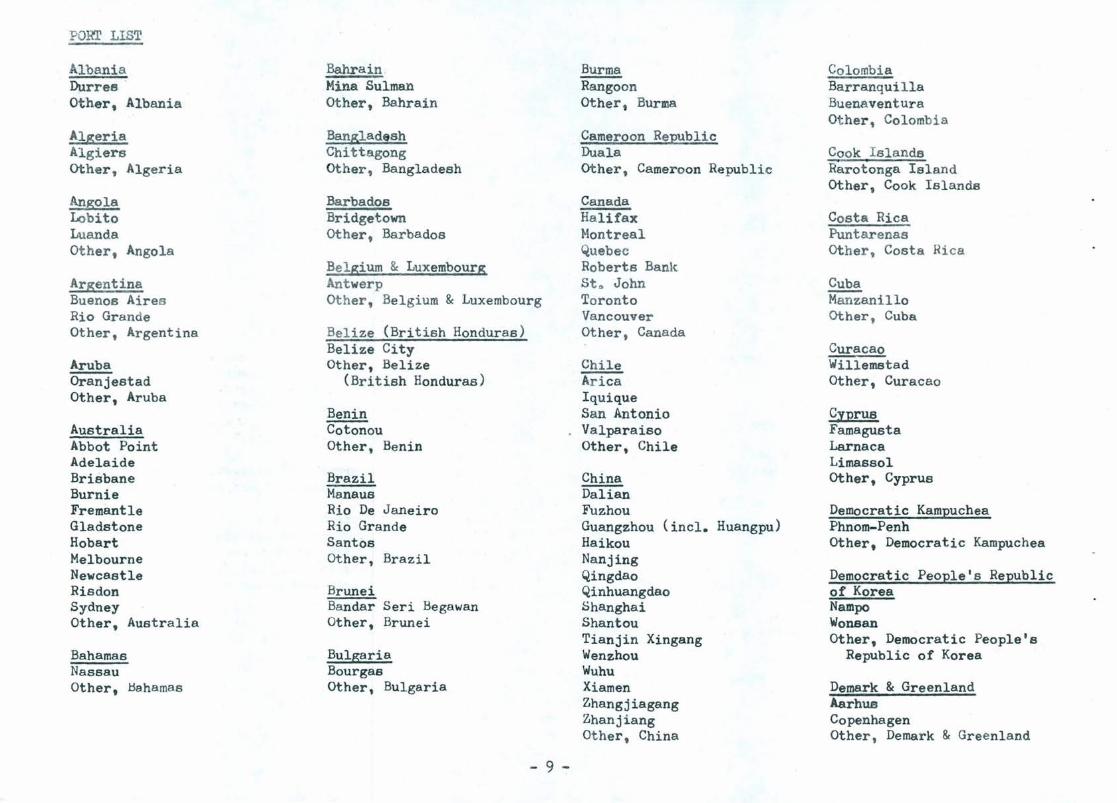
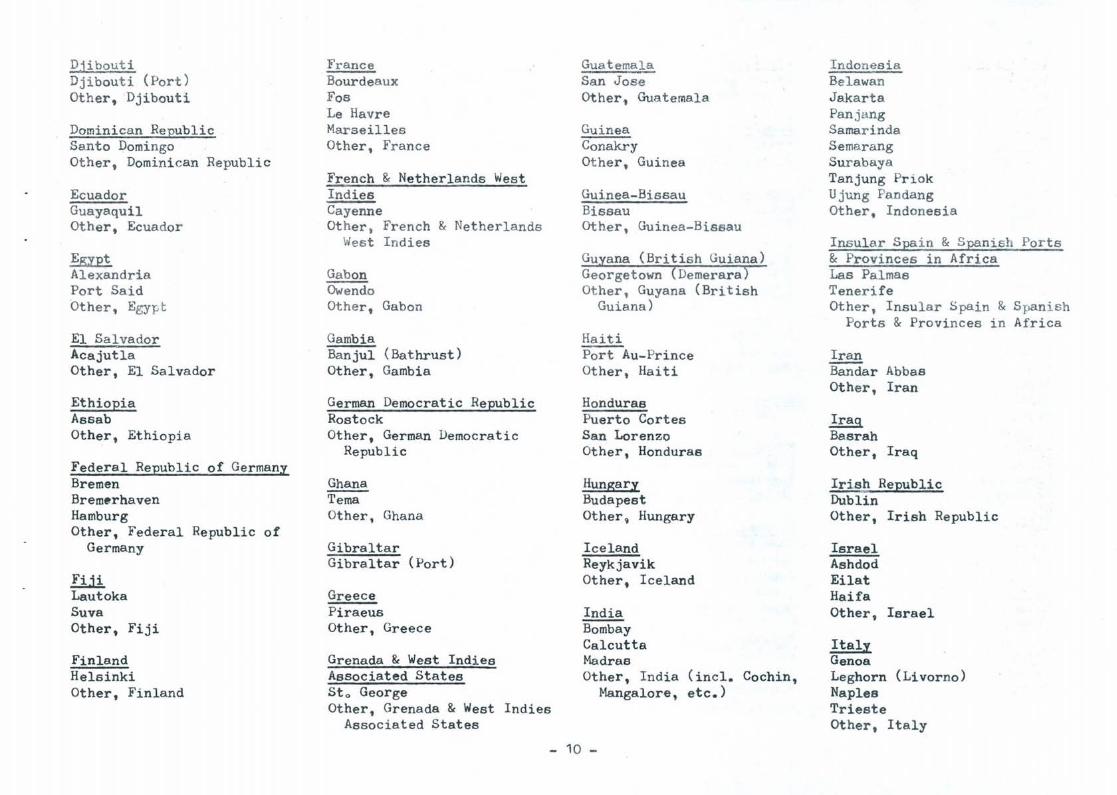
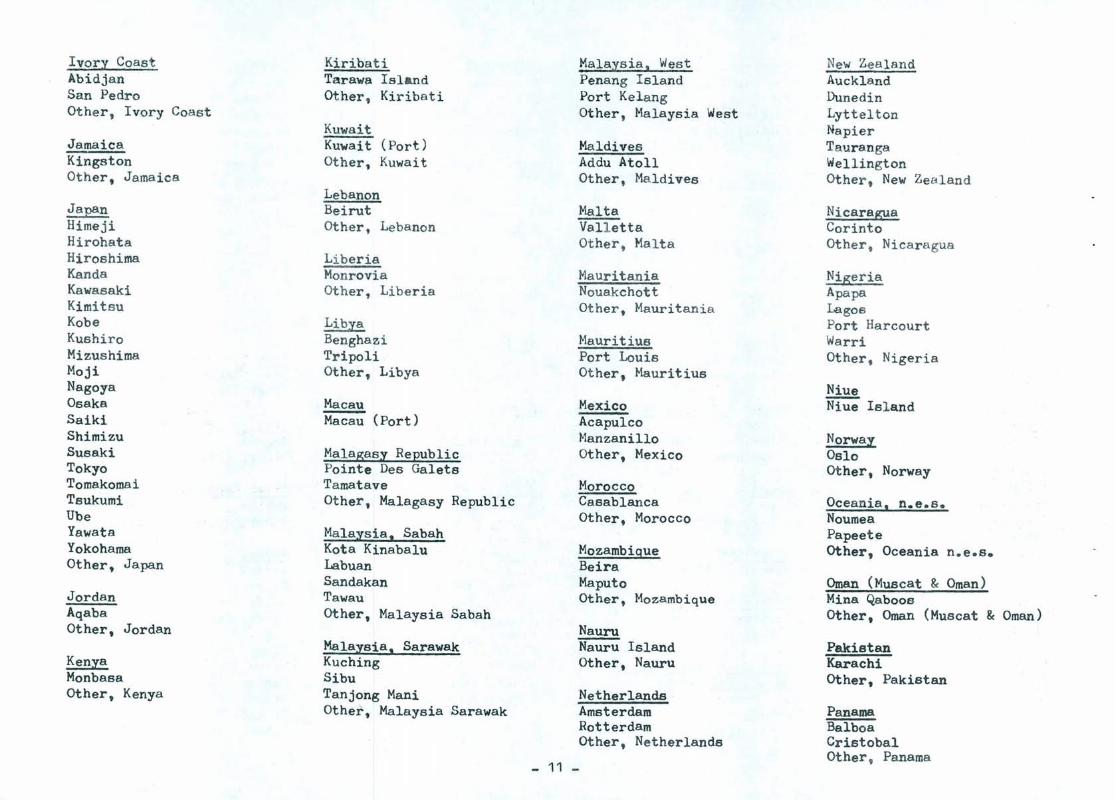
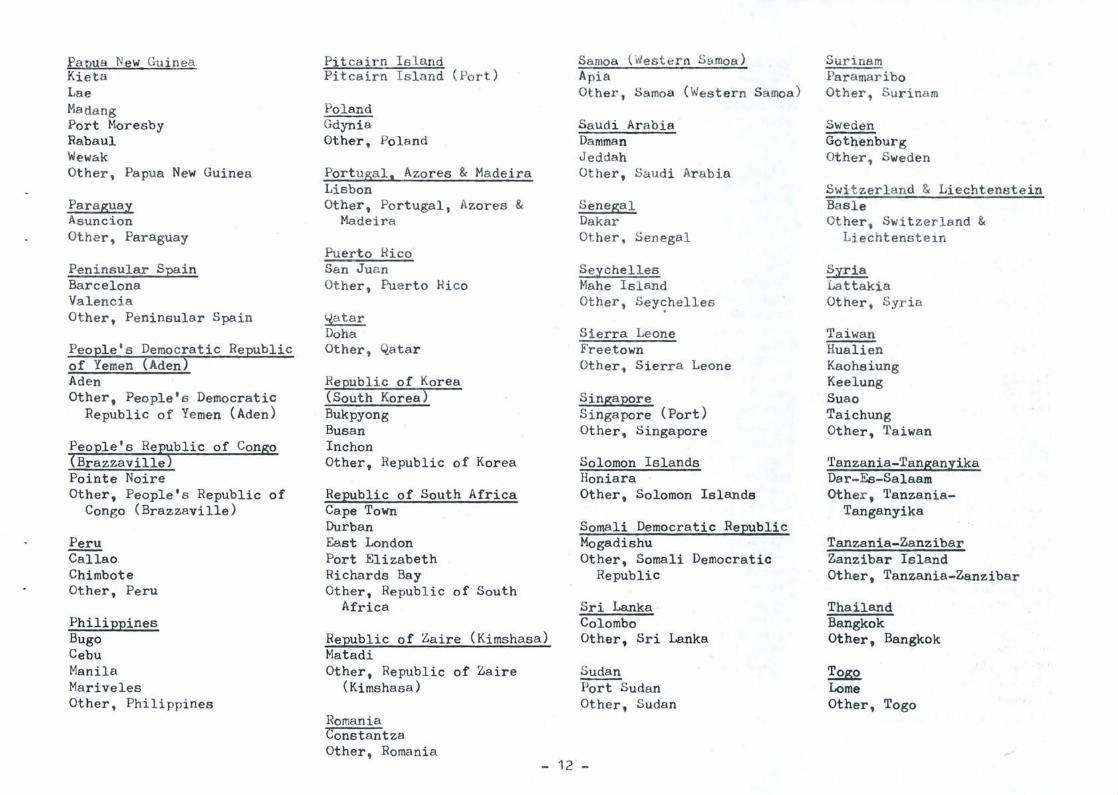
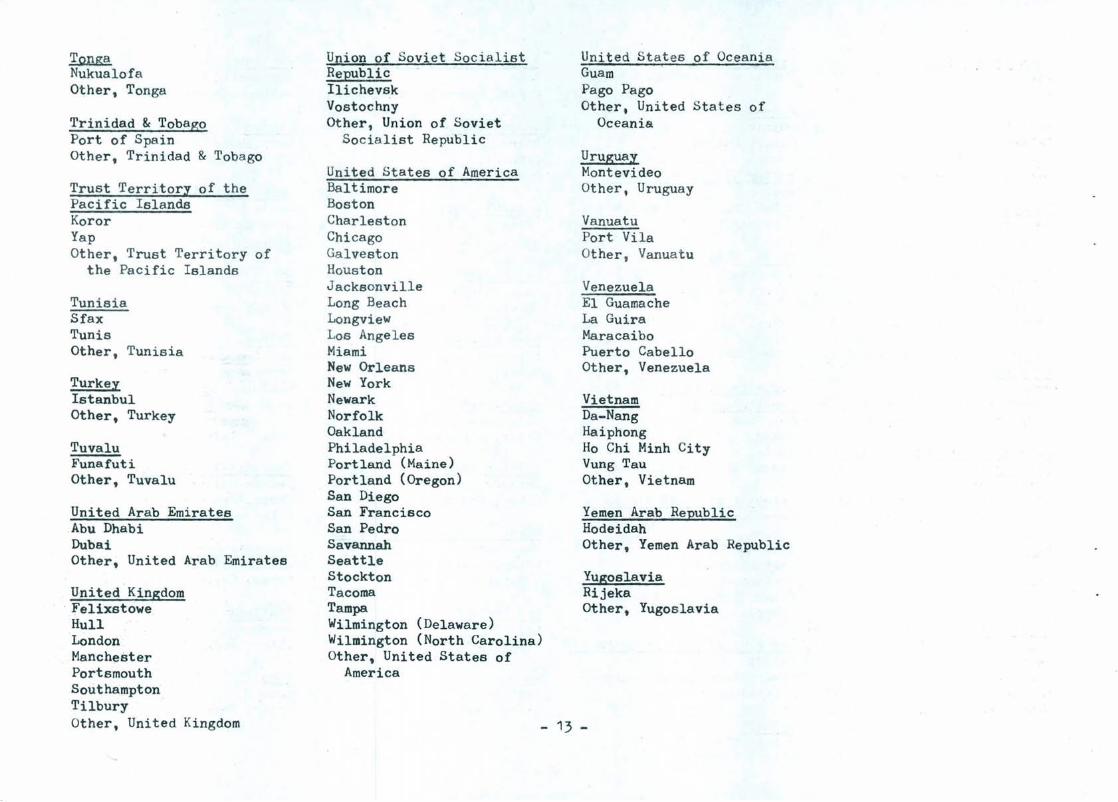
In s hipping s t at i sti cs, t he first/last port of ca l l is used to i dent i f y a voyage, but in port and cargo statistics, the actual port of l oading or disc harge of the cargo is recorded. In 1987, t he port lis t comprises 468 por t s, of which 323 are separa tely i dentified and 145 are smaller ports grouped toge t her. They a re listed on p8ges 9 - 13.
VII. Other Cl a s s ifications
Shipping , po r t and ca rgo s t a tistics are also analysed by type of sh ipping service, ship type, flag, and by deadweight tonnage, etc. Please refer to Terms and Classifica tions for details.
- 2 -
For t he cl assificat ion of t ype of shippin5 serv ice, all cargo car ried by a shi p i s classified under one t ype of shipplng service, a6 declared in the gene r a l declarat ion, although in prnctice car go can be loaded/unloaded in bot h conference and non-conference shipment areas i n the same voyage .
VI II. Gampling !vie t hod
1he stratified s ys tematic sampling scheme is used fo r s electing cons ignments from ocean cargo manif ests. Consignments a r e fi rs t classified by type of shipment, and a sample cons is ting o f a f ull enumeration of the top 6% (by gross we ight ) of consignments and a 5~ sys t ema tic s ample of the remaining ones i s then sel~cted s epa r a tely f or each t ype of shipment. The overall sampling frac t ion i s therefore about 10.7%.
I X. Di screpancies and Sources of Errors
Shipping statist ics in Section ,6 of the Hong Kong Monthly Digest of Statistics are suppli ed by the Marine Department , and are also compiled from the general declarat i ons. However, they are not comparable to t he statisti cs published in this report mainly because they include yachts and pl easure craft.
Stat i st i cs in this report are also subject to errors of reporting, processing, and of imputing cubic measurement figures by stowage factors when only gross weights are available.
Figures presented in t his report are rounded to the nearest digit of the specified unit or to the near est p~rcentage point. Hence individual statistics may not add up to the respective totals.
x. Revisions to Cumulative Statistics
Adjustments to previous months' records may at times be necessary. Since these adjustments are incorporated in the cumulative totals only, the sum of the quarterly statistics in previous quar terly reports may differ from the corresponding cumulative total published i n this report.
XI. Enquiries on Shipping Statistics
Enquiries on the statistics contained in this report may be directed to the Shipping Statistics Section, Census and Statistics Department, 17th floor, Wanchai Tower It 12 Harbour Road, Wanchai, Hong Kong, at telephone number 5-8234887_
- 3 -
TERMS AND CLASSIFICATIONS
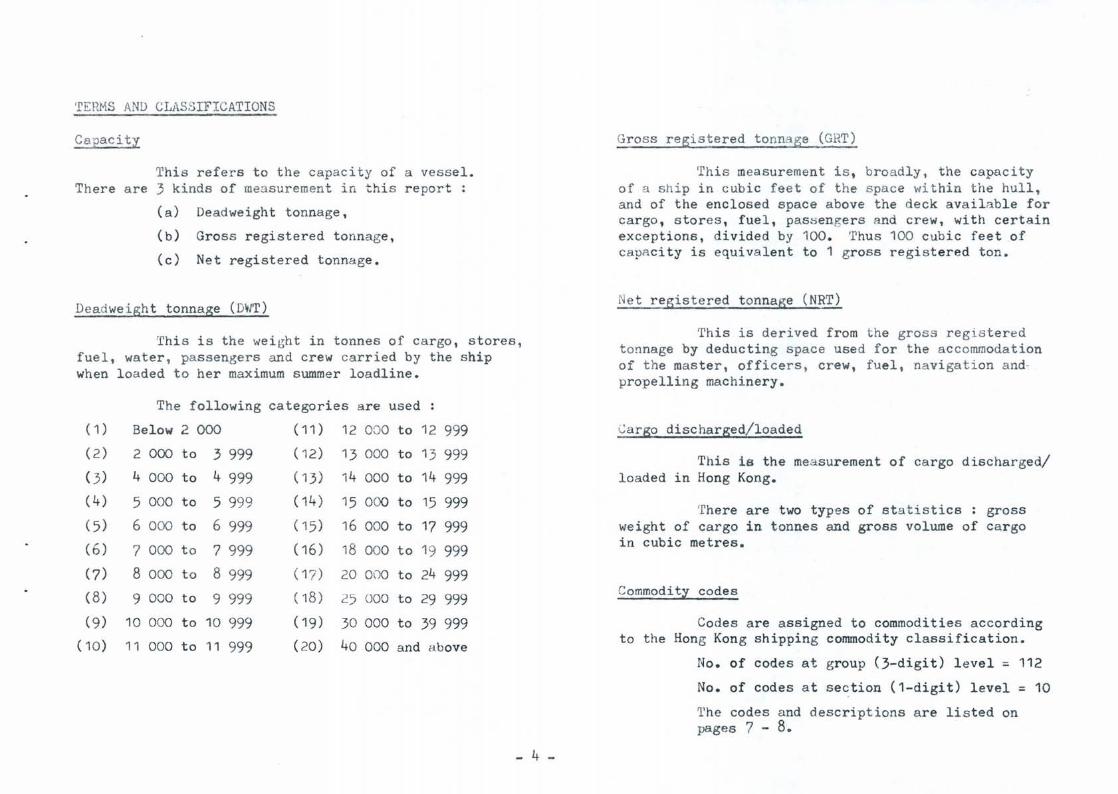
Capacity
This refers to the capacity of a vessel. There are 3 kinds of measurement in this report :
(a) Deadweight tonnage,
(b) Gross registered tonnage,
(c) Net registered tonnage.
Deadweight tonnage (D~JT)
This is the wei ght in tonnes of cargo, stores, fuel, water, passengers and crew carried by the ship when loaded to her maximum summer loadline.
The following categories are used
( 1 ) Below 2 000 (11) 12 000 to 12 999
(2) 2 000 to 3 999 (12) 13 000 to 13 999
(3) 4 000 to 4 999 (13) 14 000 to 14 999
(4) 5 000 to 5 999 (14) 15 000 to 15 999
(5) 6 000 to 6 999 (15) 16 000 to 17 999
(6) 7 000 to 7 999 (16) 18 000 to 19 999
(7) 8 000 to 8 999 ( 17) 20 000 to 24 999
(8) 9 000 to 9 999 (18) 25 000 to 29 999
(9) 10 000 to 10 999 (19) 30 000 to 39 999
(10) 11 000 to 11 999 (20) 40 000 and i:ibove
- 4 -
Gros s registered tonnage (GRT)
This measurement is, broadly, the capacity of a ship in cubic feet of the space wit hin the hull, and of the enclosed space above the deck available for cargo, stores, fuel, passengers nnd crew, with certain exceptions, divided by 100. Thus 100 cubic feet of capacity is equivalent to 1 gross registered ton.
Net registered tonnage (NRT)
This is derived from the gross registered tonnage by deducting space used for the accommodation of the master, officers , crew, fuel, navigation andpropelling machinery.
Cargo discharged/loaded
This is the measurement of cargo discharged/ loaded in Hong Kong.
There are two types of statistics : gross weight of cargo in tonnes and gross volume of cargo in cubic metres.
Commodity codes
Codes are assigned to commodities according to the Hong Kong shipping commodity classification.
No. of codes at group C3-digit) level; 112
No. of codes at section (1-digit) level = 10
The codes and descriptions are listed on pages 7 - 8.
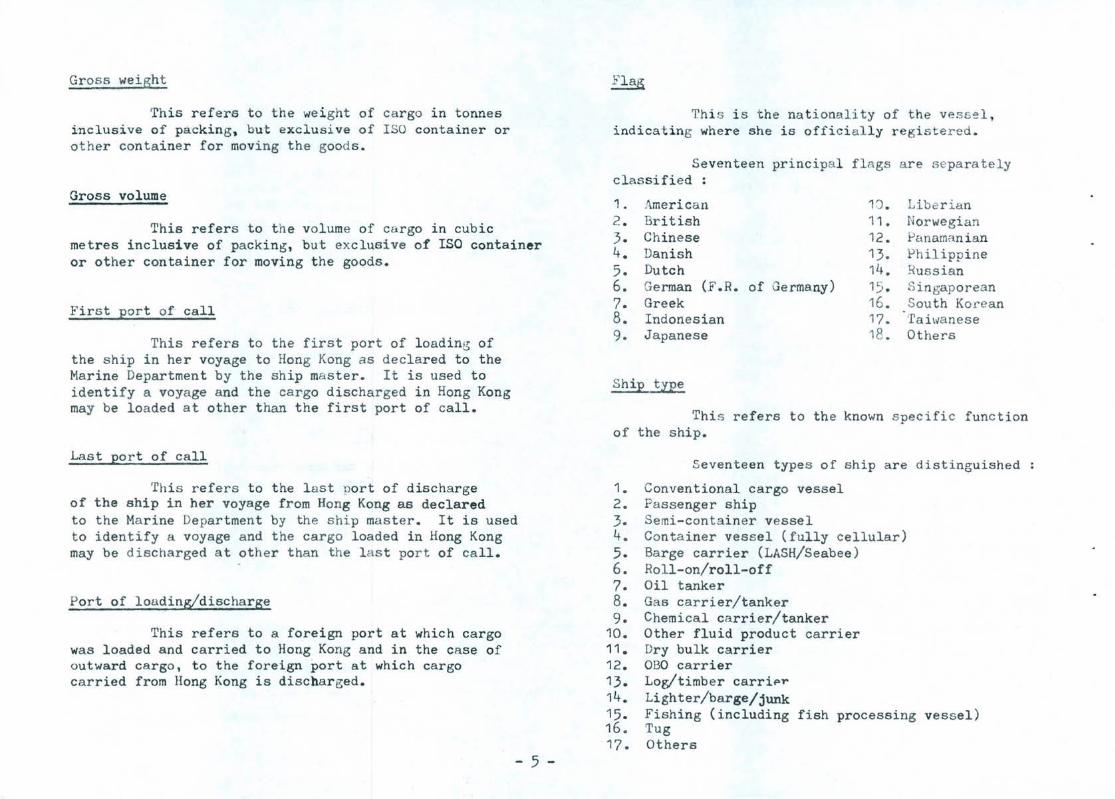
Gross weight
'fhis refers to the weight of cargo in tonnes inclusive of packing, but exclusive of ISO container or other container for moving the goods.
Gross volume
This refers to the volume of cargo in cubic metres inclusive of packing, but exclusive of ISO container or other container for moving the goods.
First port of call
This refers to the first port of loading of the ship in her voyage to Hong Kong as declared to the Marine Department by the ship master. It is used to identif y a voyage and the cargo discharged in Hong Kong may be loaded a t other than the first port of call.
Last port of call
This refers to the l ast port of discharge of the ship in her voyage from Hong Kong as declared to the Marine Department by the s hip master. It is used to identify a voyage and the car go loaded in Hong Kong may be discharged at other than t he l ast port of call.
Port of loading/discharge
This refers to a foreign port at which cargo was loaded and carried to Hong Kong and in the c~se of outward cargo, to the foreign port at which cargo carried from Hong Kong is discharged.
- 5 -
Thi s is the national i ty of the vessel, indicating where she is officially registered.
Seventeen principal flags are s epa rately classified :
1. American 10 . Libe r ian 2. British 11 • Norwegian 3. Chinese 12. Panamanian 4. Danish 13. Ph ilippine 5. Dutch 14. Russian 6. German (F.R. of Germany) 15 . Singaporean 7. Greek 16. South Ko rean 8. Indonesian 17. Tailvanese 9. Japanese 18. Others
Thi s refers to the known s pecific function of the ship.
Seventeen types of ship are distinguished
1. Conventional cargo vessel 2. Passenger ship 3. Semi-container vessel 4. Conta iner vessel ( f ully cellular) 5. Barge carrier (LASH/Seabee) 6. Roll-on/roll-off 7. Oil tanker 8. Gas carrier/tanker 9. Chemical carrier/tanker
10. Other fluid product carrier 11. Dry bulk carrier 12. OBO carrier 13. Log/timber carripr 14. Lighter/barge/junk 15. Fishing (including fish processing vessel) 16. Tug 17. Others
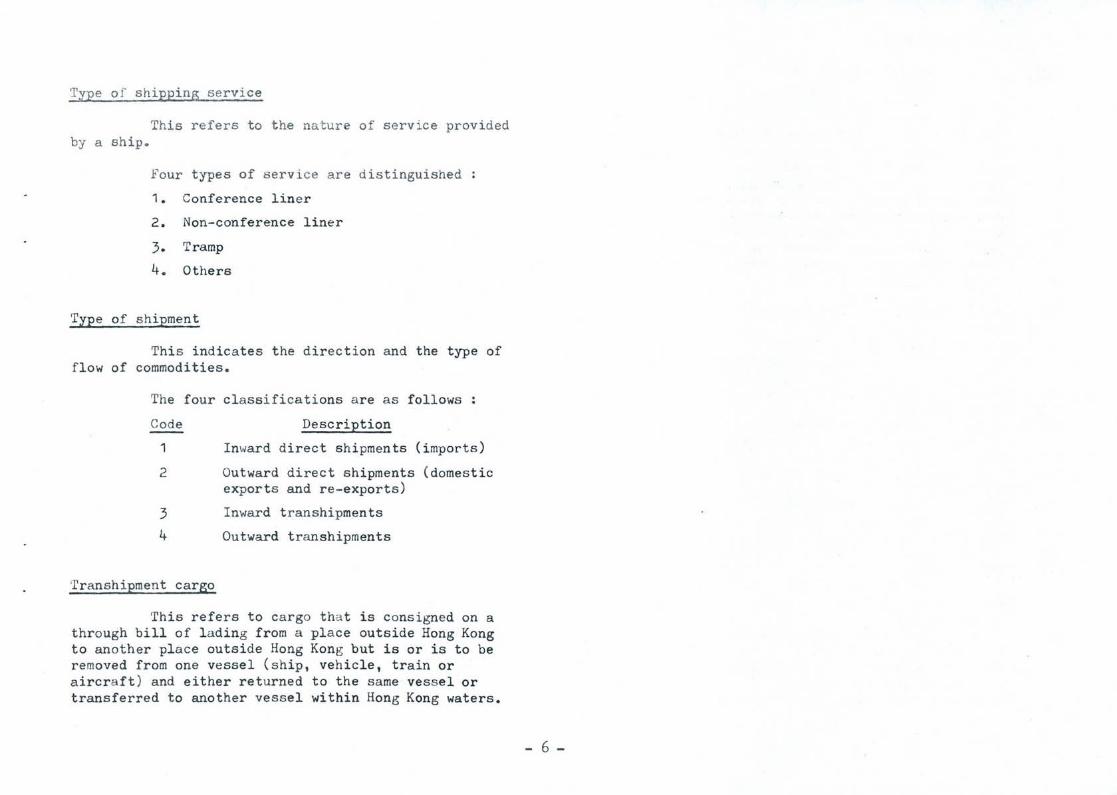
Type of shipping service
This refers to the na ture of service provided by a ship.
Four types of serv i ce are d istinguished
1. Conference liner
2. Non-conference liner
3. Tramp
4. Others
Type of shipment
This indicates the direction and the type of flow of commodities.
The four classifications are as follows
Code
1
2
3 4
Transhipment cargo
Description
Inward direct shipments (imports)
Outward direct shipments (domestic exports and re-exports)
Inward t r anshipments
Outward transhipments
This refers to cargo tha t is consigned on a through bill of l ading from a place outside Hong Kong to another place outside Hong Kong but is or is to be removed from one vessel (ship, vehicle, train or aircraft) and either returned to the same vessel or transferred to another vessel within Hong Kong waters.
- 6 -
Commodi ty Cl ass i ficat ioQ
o 1 2 3 4 5 6 7 8 9
000 010 020 030
040 050 060
089 099 110 120 247 251 260 270 273 280 291 299 320 330 340 410
Description
Food and live animals chiefly for fo o'd B'everages and t obacco Crude materials, inedible , except fuels , Mineral fuel s, lubricants and related materials Animal and vegetable oil s, fats and waxes Chemicale and r elated pr oduct s , n.e . s . Manufactured goods classified chiefly by materials Machinery and transport equipment Miscellaneous manufactured articles Postal packages; live animals not for food;
ammunition; transactions in coin, not current; and cargo not identifiable
Live animals chiefly for food Meat and meat preparat ions Dairy pr oducts and birds' eggs Fish, crustaceans and moll uscs , and preparations
thereof Cereals and cereal preparations Vegetables and fruit ' Coffee, t ea , cocoa, sugar preparations, honey,
spices and manufactures thereof Canned food Miscellaneous edible products and preparations Beverages Tobacco and tobacco manuf actures Logs and timber; wood , s imply worked Pulp and waste paper Text ile fibres Text ile wastes Stone , sand and gravel Metalliferous ores and meta l scrap Clay and kaolin Crude animal and vegetable materials, n.e.s .. Coal, coke and briquettes Petroleumg petroleum products and related materials Gas, natural and manufactured Animal and vegetable oils, fats and waxes
~ Description
510 Organic chemi cals 520 Inorganic chemicals 530 Dyeing, tanning and colour ing materials 540 Medicinal and pharmaceutical pr oducts 550 Essential oi l s and perfume materials; toi let, polis hing
and cleansing prepar ations 562 Fertilizers, manufactured 570 Explosives and pyrotechnic products 580 Artificial resins and plastic mater i a ls, and cellulose
esters and ethers 591 Gum rosin 599 Chemical materials and products, n. e.s . 610 Leather , leather manufactures , n .e .6 . and dressed
fur skins 620 Rubber manufac tures , n. e . s o
630 Cor k and wood manufactures ( excluding furniture) 640 Paper, paperboard and articles of paper pulp, of pa per
or of paperboard 650 Cot ton t ext i les 651 Li nen textiles 652 Silk t extiles 653 Woollen textiles 654 Textiles of man-made fibres 656 Textil es of mi xed mat erials or ot her materials, nse . s .. 657 Textile yarn and thread, all kinds 659 Other t extile products , n. e oB. 661 Cement and cement clinker 665 Glassware 666 Pot t er y ( i ncluding chinaware and porcela i nware ) 670 Iron and steel 679 Iron and s teel ware 680 Non-fer rous metals 691 Aluminiumwar e and brasswar e 695 Tools t hand and powered 696 Cutlery and kitchenware 697 Plastic manufactures, n. e.s. 699 Miscellaneous manufact ures of metal and non- metallic
minerals, n.e . s o
- 7 -
Code Description
751 El ectr onk calculators 759 Office machines and automatic data processi ng
equipment, n.e.s. 761 Television receivers 762 Radio-broa dcast r eceivers 769 Other telecommunications and sound r ecording and
reproduc ing apparatus and equipment , n. e.s . 771 El ectric fans 772 Electric hair dressing apparatus 773 Sewing machines 774 Batteries 775 Household type electrical equipment and their
non-electrical counter-parts, n.e. s o
778 Other electrical and electronic appliances and parts 779 Other machinery and equipment and parts, n.e.S. 781 Bicycles and motor cycles, including parts 789 Other road vehicles and a ccessories 799 Other transpor t equipment 811 Lamps and l anterns 812 Flashlights 819 Sanitar y, plumbing, heating and lighting fixtures
"
and fittings , n.e.s. 820 Furniture and parts thereo f 830 Travel goods, handbags and simila r containers 840 Cotton garments 841 Linen garments 842 Silk garments 843 Woollen garments 844 Garments of man- ma de f ibr es 845 Leather garments 846 Gar ments of mixed mater i als or other ma t erials g
n.e.s. 848 Hats, caps and other headgear 849 Articles of apparel and clothing accessories, n.e.s. 850 Footwear
- 8 -
Code Descript ion
861 Artificial flowers , foliage, fruit, plants and parts 862 Bamboo ware, rattan ware, fern, wi llow and s t raw ware
(excluding furniture) 863 Brushes and brushware 864 Candles 865 Gloves ( of all materials ) 866 Umbrellas/parasols 867 Mats and mat ting 868 Rugs and carpets 869 Handicrafts 871 Stationery 879 Professional, scientific and controlling 'nstruments
and apparatus, n.e.s. 881 Cameras 884 Optical goods, n.e.so 885 vJatches 886 Clocks 889 Photographic apparatus, equipment and supplies, n.e.s. 891 Electroni c games , hand held and TV games 892 Printed matter, pictures and paintings 894 Toys 895 Albums (photograph9 stamp. etc.) 896 Sporting goods 897 Jewell e r y, goldsmi ths ' and s ilvers miths ' wares , and
other articles of precious and s emi-preci ous mat erials
898 Musical instrument s and parts 899 Miscell aneous manufactured articles, n.e.s o
901 Post al paCkages; l ive animals not for food ; ammuni tion; and transactions in coin, not current
999 Cargo not separatel y identifiable
PORT LIST
Albania Durres · Other, Albania
Algeria Algiers other, Al geria
Angola Lobito Luanda Other, Angola
Argentina Buenos Aires Rio Grande Other, Argentina
Aruba Oranjestad Other, Aruba
Australia Abbot Point Adelaide Brisbane Burnie Fremantle Gladstone Hobart Melbourne Newcastle Risdon Sydney Other, Australia
Bahamas Nassau Other, ijahamas
Bahrain . Mina Sulman Other, Bahr ain
Bangladesh Chittagong Other, Bangl adesh
Barbados Bridgetown Other, Barbados
Belgium & Luxembourg Antwerp other , Belgium & Luxembourg
Belize ( Britis h Hondur as) Belize City Other , Belize
(Br i t ish Honduras)
Benin Cotonou Other , Benin
Brazil Manaus Rio De Janeiro Ri o Grande Santos Ot her, Brazil
Brunei Bandar Seri Begawan Other, Brunei
Bulgaria Bourgas Other, Bulgaria
- 9 -
Burma Rangoon Ot her, Bur ma
Cameroon Republic Duala Other , Cameroon Republ ic
Canada Halifax Montreal ~uebec Roberts Bank St.. John Toronto Vancouver Other, Canada
Chile Arica Iquique San Antonio Valparaiso Other, Chile
China Dalian Fuzhou Guangzhou (incl. Huangpu) Haikou Nanjing ~ingdao Qinhuangdao Shanghai Shantou Tianjin Xingang 'w'enzhou 'w'uhu Xiamen Zhangjiagang Zhanj i ang Other , China
Colombia Barranquilla Buenaventura Other, Colombia
Cook Islands ~rotonga Island Ot her , Cook Islands
Costa Rica Punt arenas Other, Costa Rica
Cuba ~anillo Other, Cuba
Curacao Wil l emst ad Ot her , Curacao
Cyprus Famagusta Larnaca Limassol Other, Cyprus
Democratic Kampuchea Phnom-Penh Other, Democratic Kampuchea
Democratic People' s Republic of Korea Nampo Wonsan Other, Democratic People's
Republic of Korea
Demark & Greenland Aarhus Copenhagen Other, Demar k & Greenl and
D.1ibouti Djibouti (Port) Other, Djibouti
Dominican Republic Santo Domingo Other, Dominican Republic
Ecuador Guayaquil Other, Ecuador
Egypt Alexandria Port Said Other, Egyp t
El Salvador Acajutla Other, El Salvador
Ethiopia Assab Other, Ethiopia
Federal Republic of Germany Bremen Breml!lrhaven Hamburg Other, Federal Republic of
Germany
Fiji Lautoka Suva Other, Fiji
Finland Helsinki Other, Finland
France Bourdeaux Fos Le Havre Marseilles Other, France
French & Netherlands West Indies Cayenne Other, French & Netherlands
\~est Indies
Gabon Owendo Other, Gabon
Gambia Banjul (Bathrust) Other, Gambia
German Democratic Republic Rostock Other, German Democratic
Republic
Ghana Tema Other, Ghana
Gibraltar Gibraltar (Port)
Greece Piraeus Other, Greece
Grenada & West Indies Associated States Sto George Other, Grenada & West Indies
Associated States
Guatemala San Jose Other, Guatemala
Guinea Conakry Other, Guinea
Guinea-Bissau Bissau Other, Guinea-Bissau
Guyana (British Guiana) Georgetown (Demerara) Other, Guyana (British
Guiana)
Haiti Port Au-Prince Other, Haiti
Honduras Puerto Cortes San Lorenzo Other, Honduras
Hungary Budapest Other 9 Hungary
Iceland Reykjavik Other, Iceland
India Bombay Calcutta Madras Other, India (incl. Cochin,
Mangalore, etc.)
- 10 -
Indonesia Belawan Jakarta Panjang Samarinda Semarang Surabaya Tanjung Priok Ujung Pandang Other, Indonesia
Insular Spain & Spanish Ports & Provinces in Africa Las Palmas Tenerife Other, Insular Spain & Spanish
Ports & Provinces in Africa
Iran Bandar Abbas Other, Iran
Irag Basrah Other, Iraq
Irish Republic Dublin Other, Irish Republic
Israel Ashdod Eilat Haifa Other, Israel
Italy Genoa Leghorn (Livorno ) Naples Trieste Other, Italy
Ivory Coast Abidjan San Pedro Other, Ivory Coast
Jamaica Kingston Other, Jamaica
Japan Himeji Hirohata Hiroshima Kanda Kawasaki Kimitsu Kobe Kushiro Mizushima Moji Nagoya Osaka Saiki Shimizu Susaki Tokyo Tomakomai Tsukumi Ube Yawata Yokohama Other, Japan
Jordan Aqaba Other, Jordan
Kenya Monbasa other, Kenya
Kiribati Tarawa Island Other , Kiribati
Kuwait Kuwait (Port) Other, Kuwait
Lebanon Beirut Other, Lebanon
Liberia Monrovia Other, Liberia
Libya Benghazi Tripoli Other, Libya
Macau Macau (Port)
Malagasy Republic Pointe Des Galets Tamatave Other, Malagasy Republic
Malaysia, Sabah Kota Kinabalu Labuan Sandakan Tawau other, Malaysia Sabah
Malaysia, Sarawak Kuching Sibu Tanjong Mani Other , Malaysia Sarawak
Malaysia , West Penang Island Port Kelang Other, Malaysia West
Maldives Addu Atoll Other, Maldives
Malta Valletta Other, Malta
Mauritania Nouakchott Other, Mauritania
Mauritius Port Louis Other, Mauritius
Mexico Acapulco ~1anzanillo
Other, Mexico
Morocco Casablanca Other, Morocco
Mozambique Beira Maputo Other, Mozambique
Nauru Nauru Island Other, Nauru
Netherlands Amsterdam Rotterdam Other, Netherlands
- 11 -
New Zealand Auckland Dunedin Lyttelton Napier Tauranga Wellington Other, New Zealand
Nicaragua Cor into Other, Nicaragua
Nigeria Apapa Lagos Port Harcourt Warri Other, Nigeria
Niue Niue Isl and
Norway Oslo Other, Norway
Oceania, n.e.s. Noumea Papeete other, Oceania n.e.s.
Oman (Muscat & Oman) Mina QabooB Other, Oman (Muscat & Oman)
Pakistan Karachi other, Pakistan
Panama Balboa Cristobal Other , Panama
Papua New Guinea Kieta Lae Ma tlang Port Moresby Rabaul Wewak Other , Papua New Guinea
Paraguay Asuncion Other, Paraguay
Peninsular Spain Barcelona Valencia Other, Peninsular Spain
People's Democratic Republic of Yemen (Aden)
·Aden Other, People's Democratic
Republic of Yemen (Aden)
People's Re;ybliC of Congo (Brazzaville Pointe Noire Other, People's Republic of
Congo (Brazzaville)
Peru Callao Chimbote Other, Peru
Philippines Bugo Cebu Manila Mariveles Other, Philippines
Pitcairn Island Pitcairn Isl and (Port)
Poland Gdynia Other, Poland
Portugal, Azores & Madeira Lisbon Other, Portugal, Azores &
Madeira
Puerto Rico San Juan Other, Puerto Rico
~atar Doha Other, Qatar
Republic of Korea (South Korea) Bukpyong Busan Inchon Other, Republic of Korea
RepubliC of South Africa Cape Town Durban East London Port Elizabeth Richards Bay Other, Republic of South
Africa
Republic of Zaire (Kimshasa) Matadi Other, Republic of Zaire
(Kimshasa)
Romania Constantza Other, Romania
Samoa (Western Samoa) Apia Other 1 Samoa (Western Samoa )
Saudi Arabia Damman Jeddah Other, Saudi Arabia
Senegal Dakar Other, Senegal
Seychelles Mahe Island Other, Sey~helles
Sierra Leone Freetown Other, Sierra Leone
Singapore Singapore (Port) Other, Singapore
Solomon Islands Honiara Other, Solomon Islands
Somali Democratic Republic Mogadishu Other, Somali Democratic
Republic
Sri Lanka Colombo Other, Sri Lanka
Sudan Port Sudan Other, Sudan
- 12 -
Surinam Paramaribo Other, Surinam
Sweden Gothenburg Other, Sweden
Switzerland & Liechtenstein BaSle Other, Switzerland &
Liechtenstein
Syria Lattak.ia Other, Syria
Taiwan Hualien Kaohsiung Keelung Suao Taichung Other, Taiwan
Tanzania-Tanganyika Dar-Es-Salaam other , Tanzania-
Tanganyika
Tanzania-Zanzibar Zanzibar Island Other, Tanzania-Zanzibar
Thailand Bangkok
·Other, Bangkok
Togo Lame Other, Togo
T.onga Nukualofa Other, Tonga
Trinidad & Tobago Port of Spain Other, Trinidad & Tobago
Trust Territory of the Pacific Islands Koror Yap Other, Trust Territory of
the Pacific Islands
Tunisia Sfax Tunis Other, Tunisia
Turkey Istanbul Other, Turkey
Tuvalu Funafuti Other, Tuvalu
United Arab Emirates Abu Dhabi Dubai Other, United Arab Emirates
United Kingdom Felixstowe Hull London Manchester Portsmouth Southampton Tilbury . Other, United Kingdom
Union of Soviet Socialist Republic llichevsk Vostochny Other, Union of Soviet
Socialist Republic
United States of America Baltimore Boston Charleston Chicago Galveston Houston Jacksonville Long Beach Longview Los Angeles Miami New Orleans New York Newark Norfolk Oak land Philadelphia Portland (Maine) Portland (Oregon) San Diego San Francisco San Pedro Savannah Seattle Stockton Tacoma Tampa Wilmington (Delaware) Wilmington (North Carolina) Other, United States of
America
United States of Oceania Guam Pago Pago Other. United States of
Oceania
Uruguay Montevideo Other, Uruguay
Vanuatu Port Vila Other, Vanuatu
Venezuela El Guamache La Guira Maracaibo Puerto Cabello Other, Venezuela
Vietnam Da-Nang Haiphong Ho Chi Minh City Vung Tau Other, Vietnam
Yemen Arab Republic Hodeidah Other, Yemen Arab Republic
Yugoslavia Rijeka Other, Yugoslavia
- 13 -

PAR T B
GENERAL REV I EW
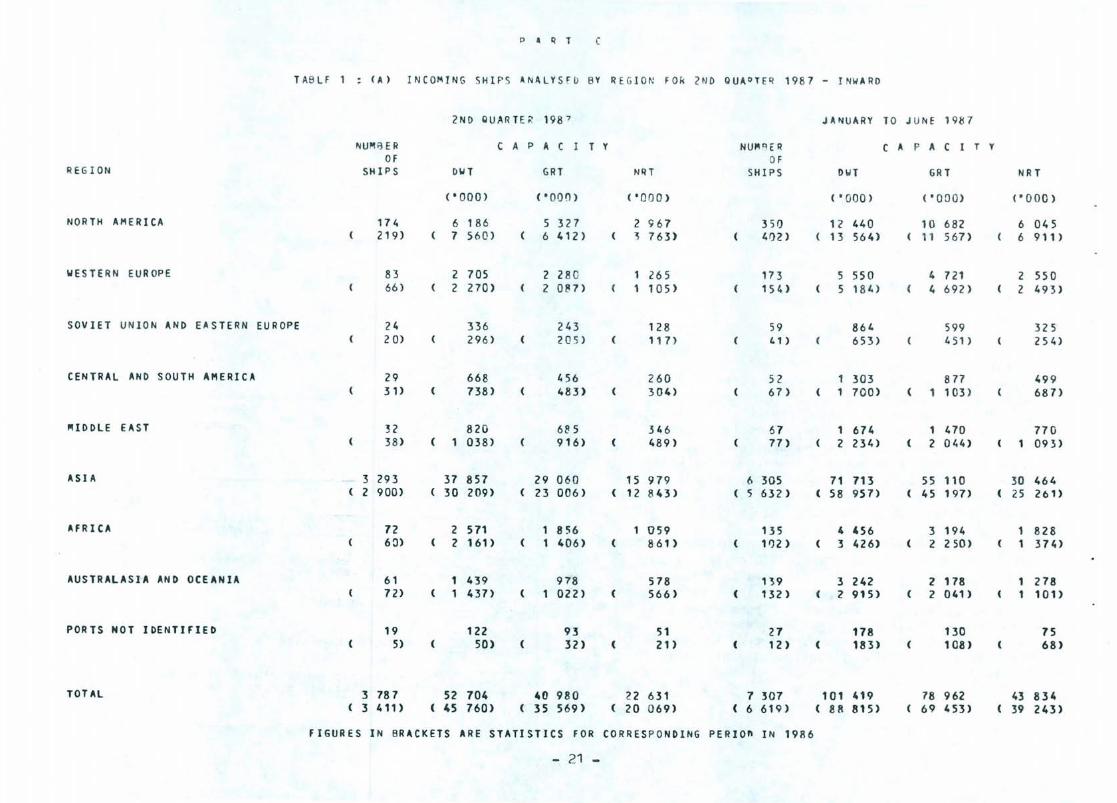
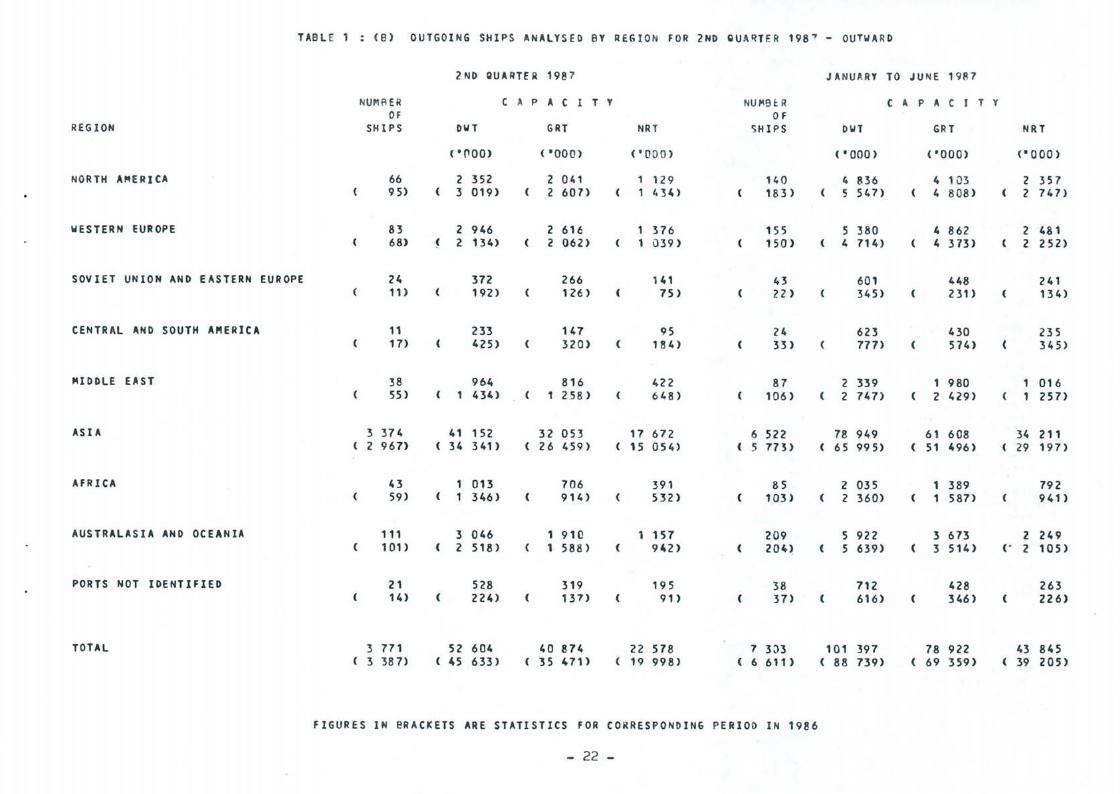
I n the second quarter of 1987 , 3 78 7 ships with a total capacity of 22.6 million NRT arrived i n Hong Kong, rep-resenting an increase of 376 (or 11%) i n number and of 13% in capacity over t he second quarter of 1986. During the same period, departing ships numbered 3 77 1 wi th a total capacity of 22.6 million NRT, representing an increase of 384 (or 11%) in number and of 13% in capacity over the second quarter of 1986. The total t onnage of cargo discharged from incoming ships (estimated from sampled cargo manifest c onsignments) increased by 11% over the same quarter in 1986, while that of cargo loaded onto outgoing ships increased by 17%. Of the cargo discharged from incoming ships, 31% in terms of tonnage was containerized cargo. Of those loaded onto outgoing ships, 74% in terms of tonnage was containerized cargo. The corresponding figures in the second quarter of 1986 were 28% and 67% r e s pectively. In the following analys is , compari son i s focused on changes be t ween the second quarte r of 1986 and t hat of 198 7 .
SHIPPING STATISTICS
1. By first/last country of call
Of the inc om i ng ships, increases were registered in the number of ships calling from China (+147), Taiwan (+51) , Sou th Kore a (+48) , the Philippines (+44) and Japan (+35) , while a decrease was recorded in those calling f r om t he D.S.A. (-36).
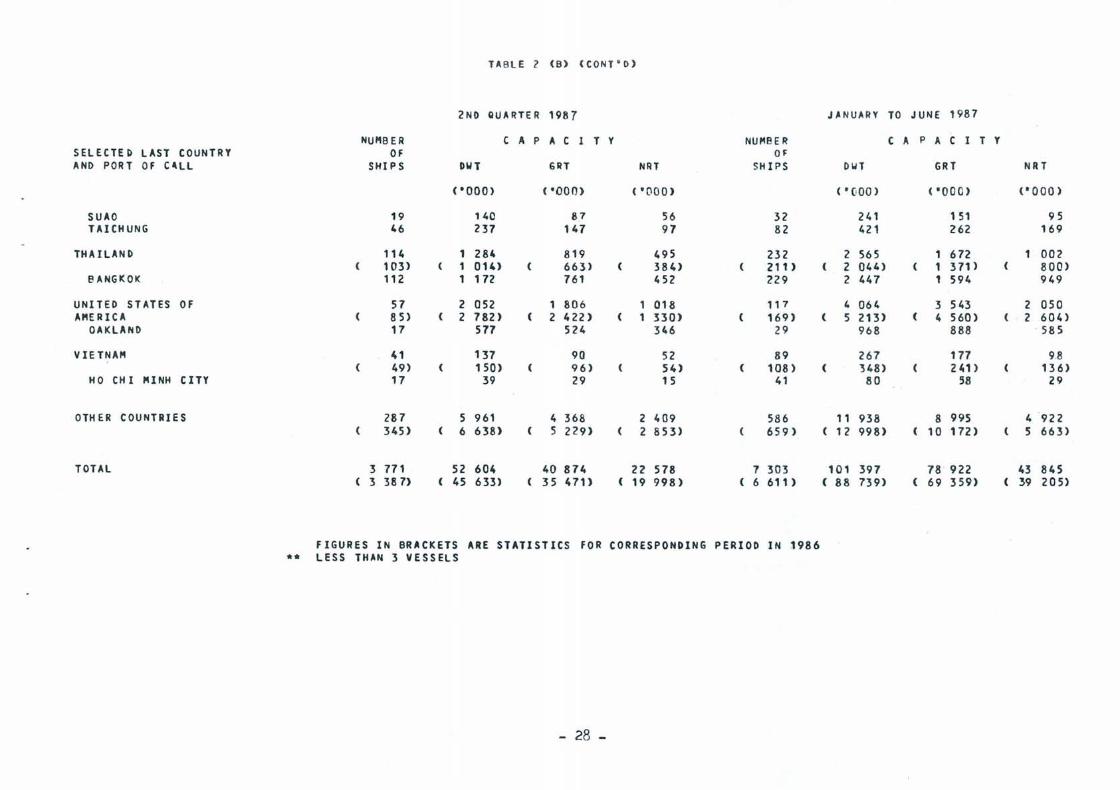
Of the outgoing ships, i ncreases were r egi s t ered in the numbe r of ships departing for China (+1 19) , South Korea (+67) , the Philippines (+66) , Taiwan (+64), Japan (+50), Ind onesia (+25) and Singapor e (+25) , while a decline was recorded in those departing for the D.S.A. (-28) . [Table 2]
Chart 1 shows the number and share of ships arriving from/departing for the major countries of call .
_ 14 -
Chart 1 Numbe r a n d share of ships arr~ving from/ de parting for t he major c ountri e s of call
Other countries (14.4%) 546
Thailand (2.5%) 93
U.S.A. (4.2%) 158
Phi lippines (4.3%) 162
South Korea (5.8% ) 221
Singapore 237
Macau ( 7.2%) 274
Other countri es (16.5%) 624
Australia (2. 5%) 93
Thaila nd 0 . 0%) 11 4
Sout h Korea (4. 3%) 163
Phili ppines ( 5. 2%) 197
Singapore 321
First country of cull
Japan (1 2.7%) 480
Last country of ca ll
Japan (8. 6%) 324
China ( 26. ,?\(.) 993
Taiwan (16.4%) 623
China (24.11%) 922
735
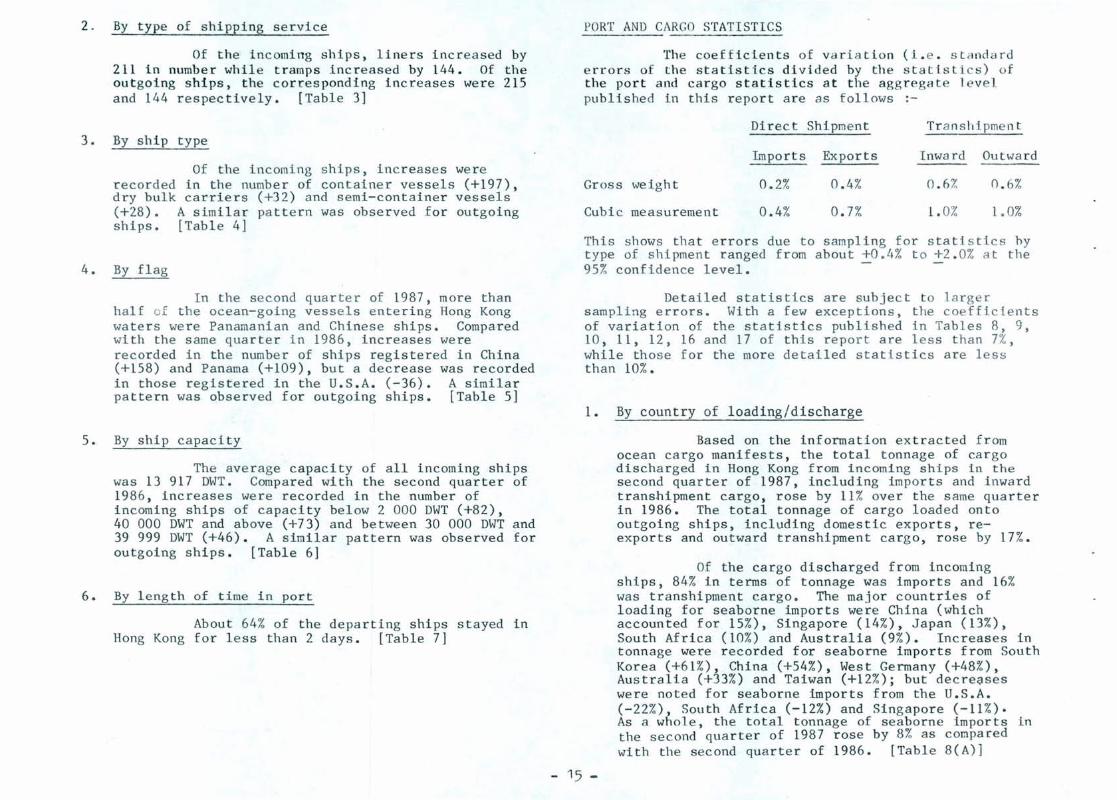
2> By type of shipping service
Of the incoming ships, liners increased by 211 in number while tramps increased by 144. Of the outgoing ships, the corresponding increases were 215 and 144 respectively. [Table 3]
3. By ship type
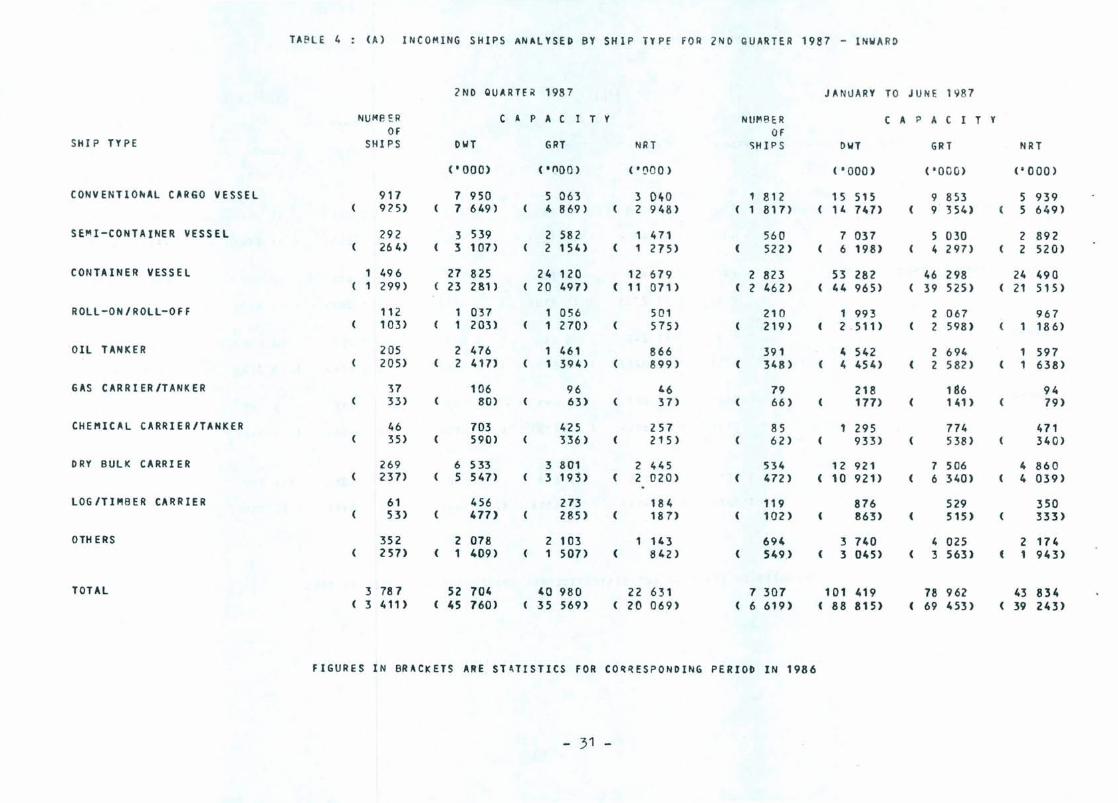
Of the incoming ships, increases were recorded in the number of container vessels (+197), dry bulk carriers (+32) and semi-container vessels (+28). A similar pattern was observed for outgoing ships. [Table 4]
4. By flag
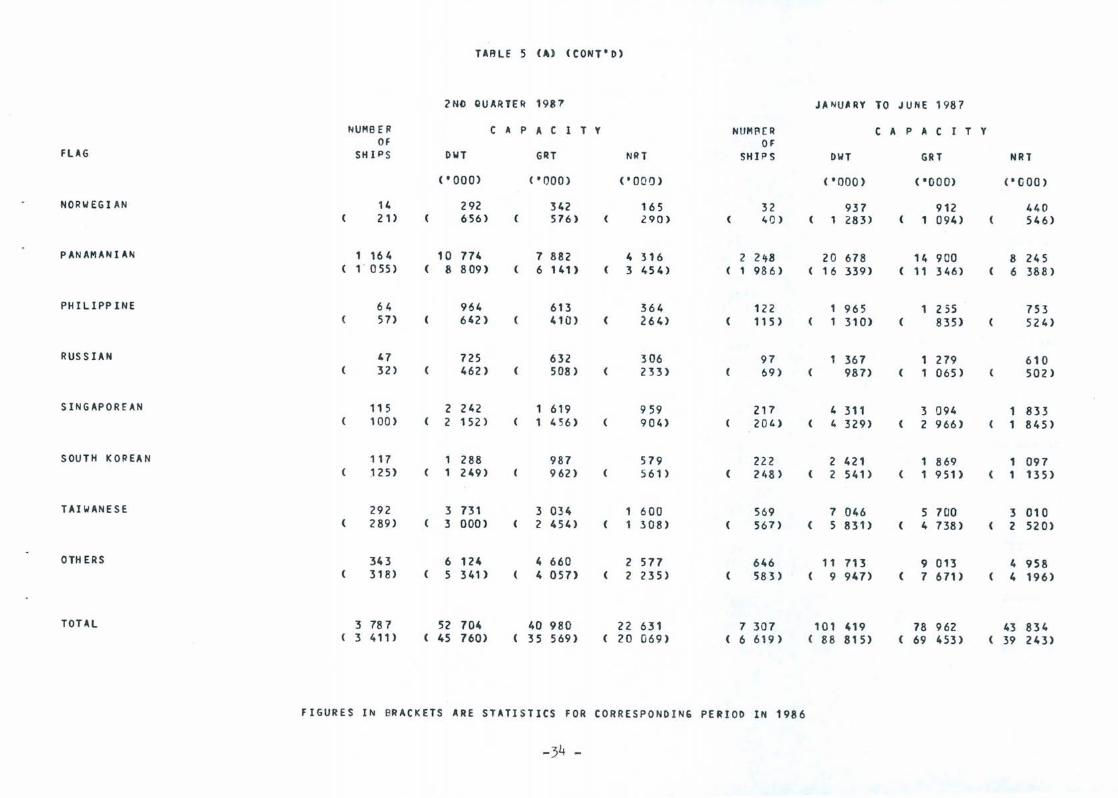
In the sec ond qua r te r of 1987, more than ha l f of t he ocean-going vessel s entering Hong Kong waters we re Pana.'1lanian and Chinese ships. Compa-red with the same quarter i n 1986 , increases were recorded in the number of ships registered in China (+158) and Panama (+109), but a decrease was recorded in those registered in the U.S.A. (-36). A similar pattern was observed for outgoing ships. [Table 5]
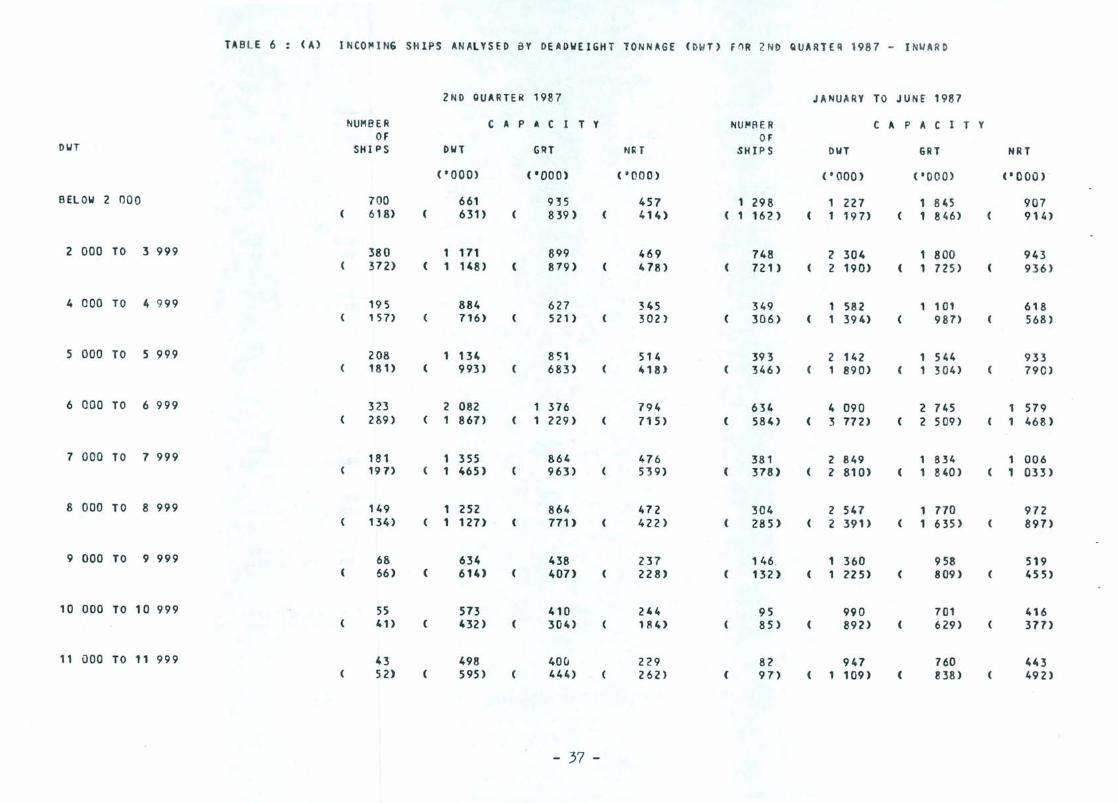
5. By ship capacity
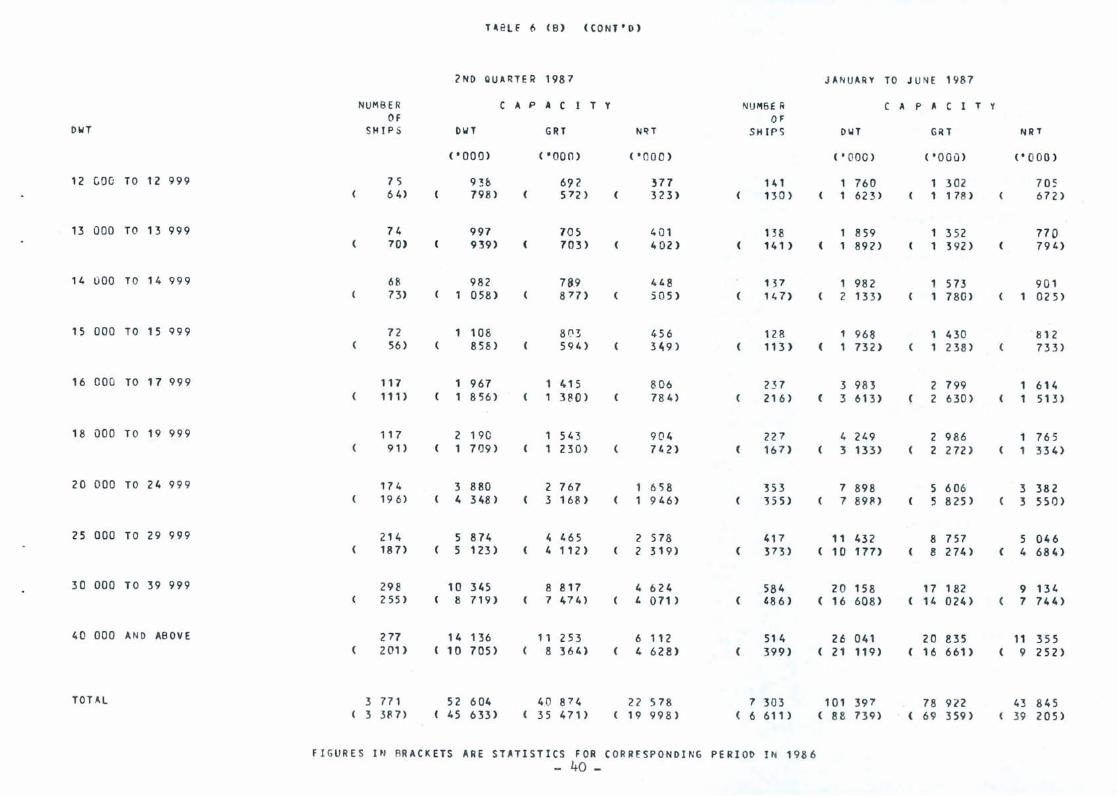
The average capacity of all incoming ships was 13 917 DWT. Compared with the second quarter of 1986, increases were recorded in the number of incoming ships of capacity below 2 000 DWT (+82), 40 000 DWT and above (+73) and between 30 000 DWT and 39 999 DWT (+46). A similar pattern was observed for outgoing ships. [Table 6]
6. By length of time in port
About 64% of the departing ships stayed in Hong Kong for less than 2 days. [Table 7]
PORT AND CARGO STATISTICS
The coefficients of variation (i. e . s tRnd a rd errors of the statistics di vided by the statisti c s) of the port and cargo statistics at the aggregate leve l published in this report are as follows >-
Direct Shipment Tra nshipme nt
Imports Exports Inward Outward
Gross weight 0.2%
0.4%
0.4 %
0.7%
0 .6%
1. 0%
0. 6%
1.0% Cubic measurement
This shows that errors due to sampling for stat ist i cs hy t ype of shipment ranged from about +0 . 4% t o +2 . 0% at the 95% conf i dence level. --
Detailed stat i stics are subject t o larger sampling errors. With a few except i on s , t he coef f icient s of variation of the sta tistics publ i shed i n Tab l es 8, 9 , 10, 11, 12, 16 and 17 of this report are l es s t han 7%, while those for the more detailed stat i stics are l ess than 10%.
1. By country of loading/discharge
- 15 -
Based on the information extracted from ocean cargo manifests, the total tonnage of cargo discharged in Hong Kong from incoming ships in the second quarter of 1987, including imports and inward transhipment cargo, rose by 11% over the same quarter in 1986. The total tonnage of cargo loaded onto outgoing ships, including domestic exports, reexports and outward transhipment cargo, rose by 17%.
Of the cargo discharged from incoming ships, 84% in terms of tonnage was imports and 16% was transhipment cargo. The major countries of loading for seaborne imports were China (which accounted for 15%), Singapore (14%), Japan (13%), South Africa (10%) and Australia (9%). Increases in tonnage were recorded for seaborne imports from South Korea (+61%), China (+54%), West Germany (+48%) , Australia (+33%) and Taiwan (+12%); but decre~ses were noted for seaborne imports from the U.S.A. (-22%), South Africa (-12%) and Singapore (-11%). As a whole, the total tonnage of seaborne imports in the second quarter of 1987 rose by 8% as compared with the second quarter of 1986. [Table 8(A)]
The two major countries of loading for inward transhipment cargo were China (29%) and the U.S.A. (23%). Transhipment cargo from China increased by 17% and that from the U. S.A. increased by 106%. As a whole, the total tonnage of inward transhipment ca r go rose by 29%. [Table 16( A)]
Of the cargo loaded onto outgoing ships, 55% in terms of tonnage was exports (including domestic exports and re-exports) from Hong Kong a nd 45% was transhipment cargo. The major coun t ries of discharge for seabo rne exports were the U.S.A. (which accounted for 22%) , Taiwan 01 %), China (9%) and Japan (7%). Compared with t he second quarter of 1986, increase s in tonnage were registered for seaborne exports to Thailand (+153%), South Korea (+150%), Japan (+86%), the United Kingdom (+28%) a nd the U.S.A. (+23%). As a whole, the total tonnage of seaborne exports rose hy 10%. [Table 8( B)]
The two major countrie s of discha rge for Hong Kong's ou tward tra nshipmen t cargo were China (21%) and the U.S.A. (12 %). Cargo transhipped t o China inc reased by 70% and that to the U.S. A. increased by 23%. As a whole, the to t al tonnage of outward t r a nshipmen t cargo r ose by 25%. [Table 16(B)]
The maj or countries of l oadi ng/discha r ge and thei r share in cargo discharged/loaded for the four type s of shipment are illustra ted in Cha-rt 2.
2. By country of loading/discharge by containerization
Of the ca r go discharged fr om incoming ships, including imp orts and inward transhipment cargo, 31 % in terms of tonnage was containerized cargo. Of those lo aded onto outgoing ships, including domestic exports, re-exports and outward transhipment cargo, 74% in terms of tonnage was containerized cargo . The total tonnage of containerized cargo discharged from incoming ships in the second quarter of 1987 rose by 24 % over the same quarter in 1986. The total tonnage of containerized cargo loaded onto outgoing ships rose by 28% during the same period.
In terms of tonn age , containeri ~ed cargo accounted for 26% of s eaborne imports. In particular, containeri zed cargo accounted for a l arge proport ion of seaborne imports from the Ne therlands ( 86%), the U.S.A. (77%), the United Kingdom (59 %) and West Germany (58%). The total tonnage of con t ainerized seaborne impor ts in the second quarter of 1987 rose by 29% over the same quarter in 1986. [Table 9(A)]
Containerized cargo accoun t ed for 58% of imvard transhipmen t cargo in terms of tonnage and i t accounted for all or a large proportion of cargo transhipped from the .Netherlands (100%), the Ph ilippines (9 8%), Singapore (97 %) , Taiwan (96%) and Thailand (94%). The total tonnage of containerized inward transhipment ca rgo in t he second quarter of 1987 rose by 14% over the same quarter i n 1986. [Table 17(A)]
For seaborne exports, containe rized cargo accounted for 72% in terms of tonnage. In parti cular, containeri zed cargo accounted for almost all of the seaborne export s to the D.S.A. , the Dnited Kingdom, West Germany and the Ne t herlands. The total tonnage of containerized seaborne exports in the second quarter of 1987 rose by 33% over the same quarter in 1986. [Table 9(B)]
Containerized cargo accounted for 77% of outward transhipment cargo in terms of tonnage and it accounted for all or almost all of the cargo transhipped to the D.S.A., Japan, France, the United Kingdom , the Netherlands and West Germany. The total tonnage of containerized outward transhipment cargo in the second quarter of 1987 rose by 23% over the same quarter in 1986. [Table 17(B)]
3. By commodity
- 16 -
In tonnage terms, about 54% of Hong Kong's seaborne imports in the second quarter of 19S7 were bulk cargo (including dry bulk and liquid bulk). Among the principal commodities, increases in tonnage were recorded for seaborne imports of cork and wood manufactures (+103%), artificial resins and pl~stic materials (+79%) and crude animal and vegetable mqterials, n.e.s. (+54%); but decreases were recorded for seaborne imports of inorganic chemicals (- 25%) and petroleum, petroleum products and related materials (-21%).
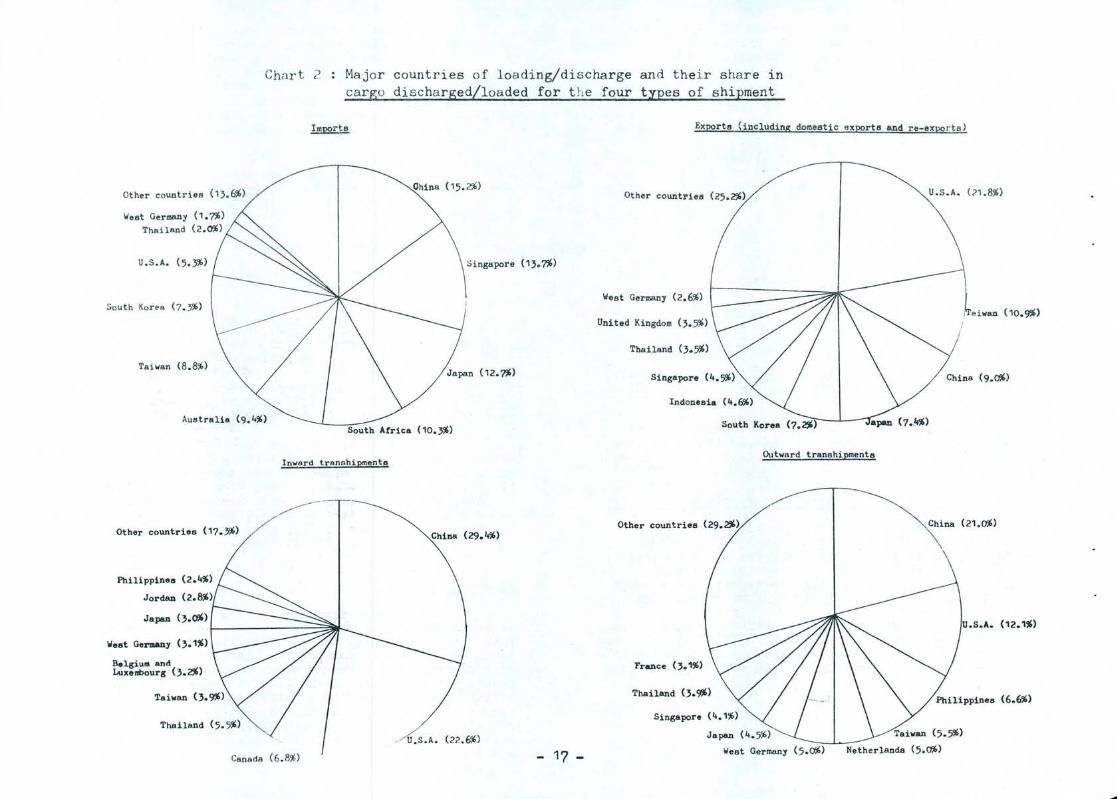
Chart 2
U.S.A. (5.3%)
Sou th Kor ea (7.3%)
Taiwan (8.8%)
Australia (.9.4%)
Major countries of l oading/discharge and their share in cargo discharged/loaded for t he four types of shipment
Exports (including domestic exports and re-exports)
U.S.A. (21.8%) Ohina (15. 2%) Other count r ies (25.2%)
Singapore (13.7%)
West Germany (2.6%)
United Kingdom (3.5%)
Thailand <3.5%)
Japan (12.7%)
South Korea (7.2%) apan
Inwa rd transhipments Outward transhipments
Other countries (17.3%)
Philippines
Jordan
West Germany (3. 1%)
Belgium and Luxenbourg (3.2%)
Canada
China (29.4%)
/ U.S.A. (22.6%)
Other countries (29.2%) ~-(".,."
U.S.A. (12.1%)
Thailand (3.~) (6.6%)
- 17 - West Germany (5.0%) Netherlands (5.0%)
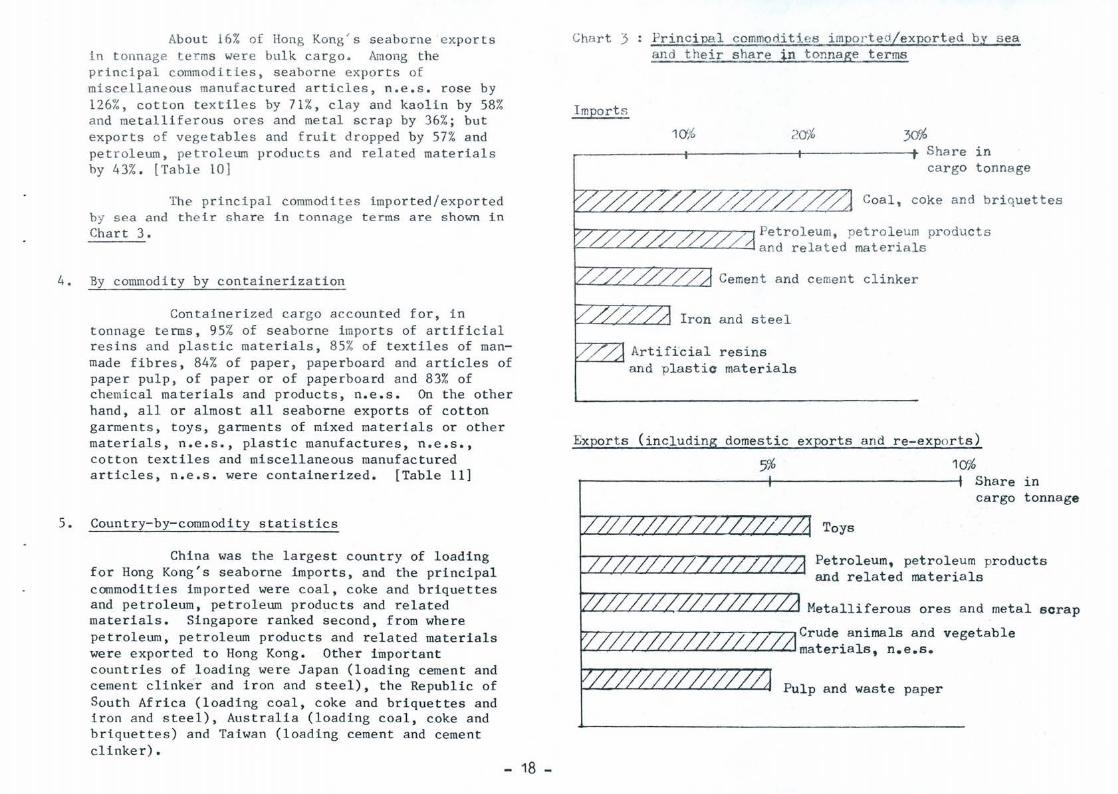
About 16% of Hong Kong ' s seaborne exports in tonnage terms were bulk cargo. A.-uong the principal commodities, seaborne expo rts of miscellaneous manufac tured ar t icles, n.e.s. rose by 126%, cotton textiles by 71%, clay and kaolin by 58% and me t alliferous ores and metal scrap by 36%; but exports of vegetables and fruit dropped by 57% and pet roleum, petroleum products and related materials by 43%. [Tahle 10]
The principal commodites imported/exported by sea and their share in tonnage terms are shown in Chart 3.
4. By commodity by containerization
Containerized cargo accounted for, in tonnage terms, 95% of seaborne imports of artificial resins and plastic materials, 85% of texti les of manmade fibres, 84% of paper, paperboard and articles of paper pulp, of paper or of paperboard and 83% of chemical materials and products, n.e . s . On the other hand, all or almost all seaborne exports of cotton garments, toys, garments of mixed materials or other materials, n.e.s., plastic manufactures, n . e.s., cotton textiles and miscellaneous manufactured articles, n.e.s. were containerized. [Table 11]
5. Country-by-commodity statistics
China was the largest country of loading for Hong Kong's seaborne imports, and the principal commodities imported were coal, coke and briquettes and petroleum, petroleum products and related materials. Singapore ranked second, from where petroleum, petroleum products and related materials were exported to Hong Kong. Other important countries of loading were Japan (loading cement and cement clinker and iron and steel), the Republic of South Africa (loading coal, coke and briquettes and iron and steel), Australia (loading coal, coke and briquettes) and Taiwan (loading cement and cement clinker) •
- 18 -
Chart 3
Imports
Principal commodities impo r ted/exported by sea and their sf-:,?re in tonnage terms
10% 20% 30% Share in cargo tonnage
fL--L~L-..L.~~~-L.~---L-/j-<-~--<--~/. §~ Coal, coke an d briquet tes
t7-r-7-:~;o--:r-:r-?---:"'~--r~ Pe tro 1 eum, pe t ro le urn pro d u. c t S
I"--L.....L......."--L.......~'--L-<~--<.--<.-w an d re la t e d ma t er i a Is
Cement and cement clinker
Iron and steel
Artificial r esins and pl astic materials
Exports (including domestic exports and re- exports)
Toys
10% Share in cargo tonnage
Petroleum, petroleum products and related materials
Metalliferous ores and metal scrap
M-r-,~-'--r-r-~'--'--r~--r-"'--r-.~~ Crude an ima 15 and ve ge tab le ~~~~~~~~~~~~~~~materia16, n.e.s.
Pulp and waste paper
The U.S.A. was the largest count r y of discharge for Hong Kong's seaborne exports, unloading toys, mi scellaneous ma nufactured articl es, n.e.s. and ga rments of mixed mat erials or other materials , n.e.s. Ta i wan ranked second, unloading pulp and waste paper, crude animal and vegetable materials, n.e.s., clay and kaolin and me talliferous ores and metal scrap . Other important countries of discharge were China (unloading petroleum, petroleum products and rela ted materials and inorganic chemicals ), Japan (unloading metalliferous ores and metal scrap) and South Korea (unloading inorganic chemicals). [Table 12]
6. Port-by-commodity statistics
Sin9apore was the largest port of loading for Hong Kong s seaborne imports, and the principal commod ities imported were petroleum, petroleum products and related material s . Richards Bay ranked second, from where coal, coke and briquettes were expor t ed to Hong Kong . Other important parts of loading were Qinhuangdao (load i ng coal, coke and briquett es) , Newcast le (load i ng coal, coke and briquettes) a nd Kaohsiung (load ing vege tables and fruit a nd cement and cement clinker).
Los Angeles was the large st port of di scharge for Hong Kong's seaborne exports, unloading toys , garments of mixed materials or other materials, n. e. s. and misce llaneous manufactured articles, n.e.s. Other important ports of discharge were Busan (unloading textile yarn and thread, all kinds), Keelung (unloading clay and kaolin), Long Beach (unloading toys) and Singapore (unloading vegetables and fruit). lTable 13]
7. Commodity-by-port sta tistics
The principal commod ities of Hong Kong ' s s eaborne imports were coal, coke and brique t tes, petroleum, petroluem products and rel a t ed mate ri a ] s and cement and cement clinker. Coal, coke and briquettes were i mported from Richards Ba y , Qinhuangdao and Newcastle; petroleum, petrol eum pr oducts and related mate r ials f rom Singa pore and Zhanjiang and cemen t a nd cement clinker f rom Ts ukumi, Suao and Hualien.
The principal commoditie s exported f r om Hong Kong by sea were t oys (to Long Beach, Lo s Angeles, Seattle and New York) , petr oleum, pe t rol e um products and related materials (to Macau and Guangzhou), metalliferous ores and metal s c r a p (to Mi zush i ma and Kaohsiung), crude animal and vege tabl e materials, n.e.s. (to Keelung , Kaohsiung and Bus a n) and pulp and waste pape r (to Taichung and Ka ohsiung). [Table 14]
8. Transhipment cargo statist ics
- 19 -
The total t onnage of outward transhipment cargo was greater than that of inward transhipmen t cargo. This is because goods of China origin could come to Hong Kong by various means of transportation other than ocean-going vessel (such as train, lorry and junk) for transhipment and these would not be reported in any inward ocean cargo manifests but would be reported in outward ocean cargo manifests if they were transhipped onto ocea n-going vessels when leaving Hong Kong.
Of the inward transhipment cargo, increases in tonnage were recorded for cargo from Canada (+368%), the U.S.A. (+106%), Belgium and , Luxembourg (+86%), West Germany (+34%) and China (+17%), but decreases were recorded for cargo from Japan' (-31%) and Thailand (-16%). Of the outward transhipment cargo, increases in tonnage were recorded for cargo to China (+70%), France (+69%), the Philippines (+54%), the Netherlands (+46%), West Germany (+36%) and Taiwan (+29%), but decreases were recorded for cargo to Japan (-27%) and Singapore (-17%). ' [Table 16]
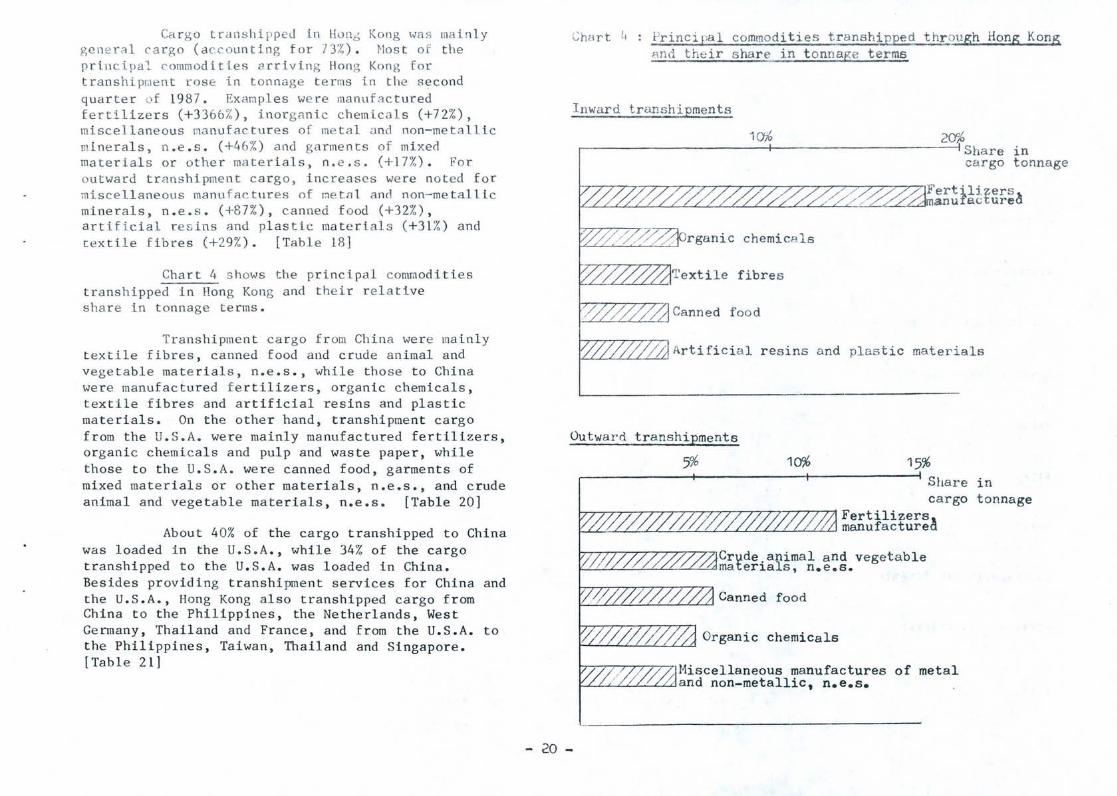
Cargo transhipped in Hon6 Kong wa s mainly gene ral cargo (accounting for 73%) . Most of the principal commoditie s arriving Hong Kon g for trans hipmen t rose in tonnage terms in the second quarter of 19 87. Exampl e s were manufactured fe rtilizers (+3 366%), inorgani c chem icals (+72%), miscellaneous manufactures of metal and non- met a llic minera ls , n .e.s. (+46%) and garment s of mixed material s or other mater ials, n .e.s. (+17%). For ou tward transhipment carg o, increases were noted for miscel l aneo us ma nufactures of me t a l and non-metallic minerals, n. e.s . (+87% ) , canned f ood (+32%), art ificial re sins and plas tic materials (+31% ) and tex tile fibre s (+29%). [Table 18]
Chart 4 shows the principal commodities t rans h ipped in Hong Kong and thei r r ela tive sha re in tonnage te rms.
Transhipme nt cargo from China were ma inly t extile fibres, canned food and crude animal and vegetable mate rial s, n.e.s., wh i le tho se to China were manufactured fe rtilizers, organic chemicals, textile fibres and artificial resins and plastic materials . On the other hand, transhipment cargo from the D. S.A. were mainly manufactured fertilizers, organic chemicals and pulp and waste paper, while those to the D.S.A. we re canned food, garments of mixed materials or other materials, n.e.s., and crude animal and vegetable materials, n.e.s. [Table 20]
About 40% of the cargo transhipped to China was loaded i n the D.S . A., while 34% of the cargo transhipped to the D.S.A. was loaded in China. Besides provid i ng transhipment services for China and the U.S.A., Hong Kong also transhipped cargo from China to the Philippines, the Netherlands, West Germany, Thailand and France, and from the D.S.A. to the Philippines, Taiwan, Thailand and Singapore. [Table 21]
Cho rt I, PriDci pal commodities transhi.£ped~ough Hong Kong and their share in t onnage terms
Inward t r anshipments
1 a;6 20"~ ~------------------------~----------------------~ Share in
cargo tonnage
~// >::?/~Organic chemicA.ls
Textile fibres
~ Artificia l resins and plastic mater i als fL-''-'-L..L....L-LL-'-L1
Outward transhipment s
- 20 -
5% 10% 1 5% Share in cargo tonnage
Fertilizers, ~~~~~...L-~~~~~~~4-~~~~manufacturea
Crude.animal and vegetable ~~~~~~~~~mater1als, n.e.s. .
food
~~~~~~~~ Organic chemicals
Hiscellaneous manufactures of metal f-L~L..,L...L....'-'-..LL-Lland non-metallic, n.e.s.
TA B LF 1
REGI ON
NORTH AMERICA
WES TE RN E UR OPE
SOVIET UNION AND EASTERN EUROPE
CENTRAL AND SOUTH AMERICA
"HDOLE EAST
ASIA
AfRICA
AUSTRALAS r A AND OCEANIA
PORTS NOT IDENTIfIED
TOTAL
( A )
NU"'~ E R OF
SHIPS
174 219)
83 66)
24 20)
29 31>
32 38)
3 293 2 900)
72 60)
61 72)
19 5)
3 787 3 411)
D • Q T C
I ~HOMING SHIPS ~NALYSFD BY
2ND QUAR TE PI
OWT
('ODD)
6 186 7 560)
" 705 2 270)
336 296)
668 738 )
820 1 038)
37 857 30 209)
2 571 2 161)
1 439 1 437>
122 50)
52 704 45 760)
CAP
(
198 7
A C
GRT
('OOn)
5 327 6 412)
2 28 0 2 087>
243 20S)
456 483)
68 S 916)
29 060 23 006)
1 856 1 406)
978 022)
93 32)
40 980 15 569)
T Y
REGIO/'.! FOI( 2ND QUAIHEQ 198 7 - INWARD
NRT
('000)
2 967 3 763)
1 265 1 105)
128 117)
260 304)
346 489)
1S 979 12 843)
059 ( 861 )
578 ( 566)
51 21>
22 631 ( 20 069)
(
(
NUI'I AER OF
SHIPS
351) 41)2)
173 154)
59 41)
52 67>
67 77)
6 305 5 632 )
135 11)2)
B9 132 )
27 12 )
7 307 6 619)
JAN UAR Y
OWT
( '000)
12 440 13 564)
5 550 5 181.)
864 653)
1 303 700)
, 674 2 234)
71 713 58 957)
4 456 3 426)
3 242 2 915)
178 ( 183)
101 419 ( 88 815)
FIGURES IN BRACKETS ARE STATISTICS FOR CORRES PO NDING PE RI on IN 1986
- 21 -
TO JUNE 1987
C A P A C I T Y
GRT
(' 000)
10 682 11 567>
4 721 4 692)
599 451>
877 1 103 )
1 470 2 044)
55 110 45 197>
3 194 2 250)
2 178 2 041)
130 108 )
78 962 69 453)
NRT
(' 000 )
6 045 6 911)
2 550 2 493)
325 254)
499 687>
770 1 093)
30 464 25 261)
1 828 1 374)
1 278 1 101)
75 68)
43 834 39 243)
TABL E 1 (8) OUTGOING SHIPS ANALYSED BY REGION FOR 2ND QU AqTER 198 7 - OUTWARD
2 ND QUARTER 1987 JANUARY TO JU NE 1987
NUP'lBER C A P A C 1 T Y NUI'IBE R C A P A C I T Y OF OF
REGION SH I PS OWT GRT NRT SHIPS DWT GRT NRT
( • (la~) ('000) ('000) ( • 000) ( '000) ('000)
NORTH A"'ERICA 66 2 352 2 041 1 129 140 4 836 4 1 03 2 357 9 5) 3 019) 2 607) 1 434) 183) 5 547) 4 808) 2 747)
WESTERN EUROPE 83 2 946 2 61l: 1 376 lSS 5 380 4 862 2 481 68) 2 134) 2 062) 1 039) 150) 4 714) 4 373) 2 252)
SOVIET UNION AND EASTERN EUROPE 24 372 266 141 43 601 448 241 11) 192 ) 126) 75) 22) 345) 231) 134)
CENTRAL AND SOUTH AMERICA 11 233 147 95 24 623 430 235 17> 425) 320) ( 184) 33) 777) 574) 345)
MIDDLE EAST 38 964 816 422 87 2 H9 1 980 1 016 55) 1 434) 1 258 ) 648) 106) 2 747> 2 429) 1 257>
ASIA 3 374 41 152 32 053 17 672 6 522 78 949 61 608 34 211 ( 2 967> 34 341) ( 26 459) 15 054) 5 773> 65 995) ( 51 496) ( 29 197)
AFR !CA 43 1 013 706 391 85 2 035 1 389 792 59) 1 346) 914) S32 ) ( 103) 2 360) 1 587> 94-1 )
AUSTRALASIA AND OCEANIA 111 3 046 1 91() 1 157 209 5 922 3 673 2 249 ( 101) ( 2 518) 1 588) 942) 204) 5 639) 3 514) (" 2 105)
PORTS NOT IDENTIFIED 21 528 319 195 38 712 428 263 14) ( 224) 137> 91) C 37) ( 616) 346) 226)
TOTAL 3 711 52 604 40 874 22 578 7 3;)3 101 397 78 922 43 845 3 387) 45 633) ( 35 471> 19 998) 6 611) ( 88 739) 69 359) 39 205)
FIGURES IN BRACKETS ARE STATISTICS FOR CORRESPONDING PE RIOD IN 1986
- 22 -
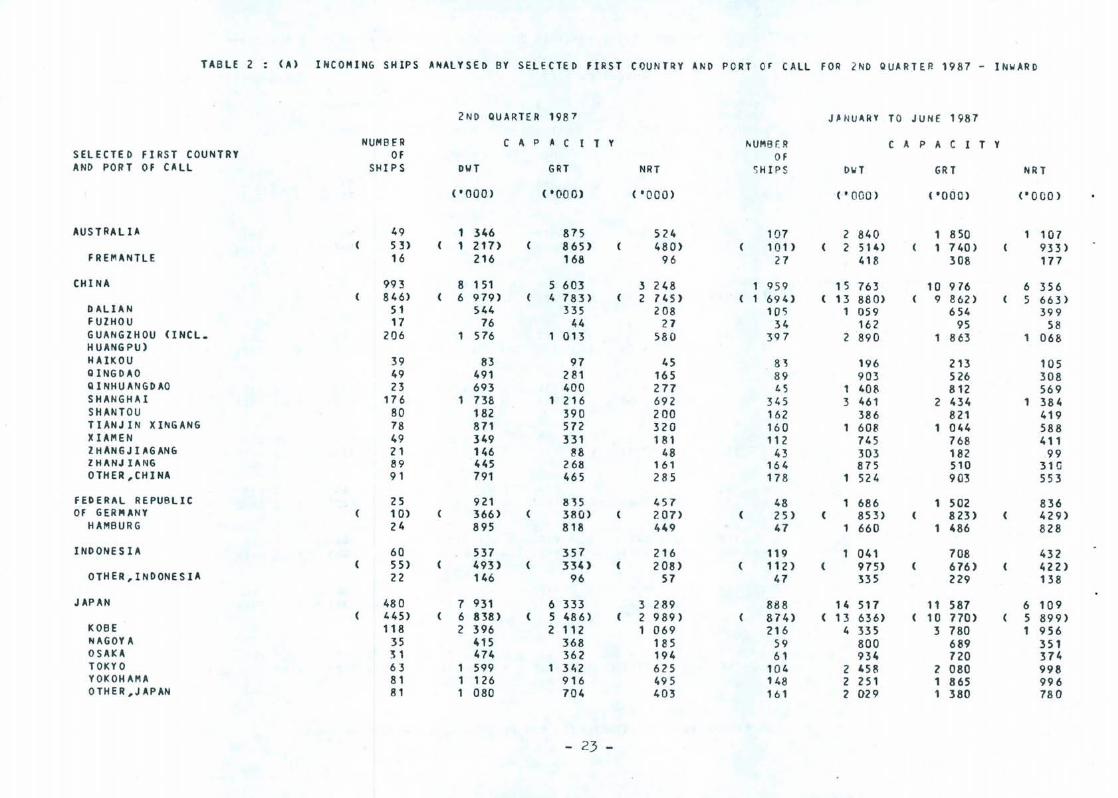
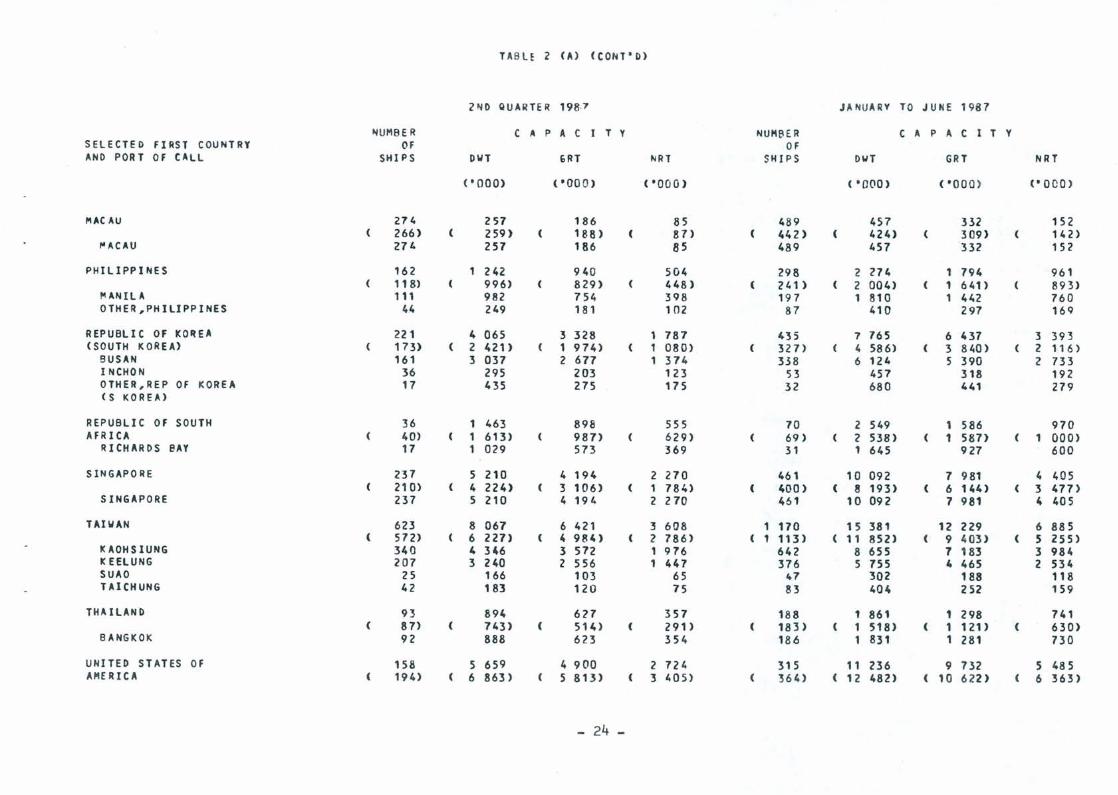
TABLE 2 CA) INCOMING SHIPS ANALYSED BY SELECTED FIRST COUNTRY AND PORT OF CALL FOR 2ND QUARTER 1987 - INWARD
2ND QUARTE R 1987 J~NU4IH TO JUNE 1987
NUMBER CAP A C 1 Y ~UMBF.R C A P A C I T Y SELECTE D FIRST COUNTRY OF OF AND PORT OF CALL SHI P S OWl GIlT NRT SHIPS DwT GRT NR T
('DaD) ( '000) ( '000) ( , 000) ('aDO) (" 0 00)
AUSTRALIA 49 1 346 875 S24 107 2 840 1 850 107 53) 1 217) 865 ) lo80) 101> 2 514) 1 740) 933)
FREMANTLE 16 216 168 96 27 418 308 177
CHINA 993 8 151 5 603 :3 248 959 15 763 10 976 6 356 846) 6 979) 4 783) 2 745) 694) 13 880) 9 862 ) 5 663)
D 4L1AN 51 ~44 335 208 10C; 1 059 654 399 FUIHOU 17 76 44 27 34 162 95 58 GUANGZHOU <INCL. 206 1 576 013 580 397 2 890 863 1 068 HUANGPU) HAIKOU 39 83 97 45 8~ 196 213 105 QINGDAO 49 491 281 165 89 903 526 308 QINHUANGDAO 23 693 400 277 45 1 408 812 569 SHANGHAI 176 1 738 1 216 692 345 3 461 2 434 1 384 SHANTOU 80 182 390 200 162 386 821 lo19 TIANJIN XINGANG 78 871 572 320 160 608 1 044 588 XIAMEN 49 349 331 181 112 745 768 411 Z HAN6J lAGANG 21 146 88 48 43 303 182 .99 ZHANJ IANG 89 445 268 161 164 875 510 31G OTHER ,CHINA 91 791 465 285 178 1 524 903 553
FED ERAL REPUBLIC 25 921 8~5 451 48 686 1 502 836 OF GER"'ANY 1 0) 366) 380) (07) 25) 853) 8 23> 429)
HAMBURG 24 895 818 449 47 1 660 1 486 828
INDONESIA 60 537 357 216 119 041 708 432 55) 493) 334> 2 08) 112) 975) 676) 4(2)
OTHER,INDONESIA 22 146 96 57 47 335 229 138
JAPAN 480 7 931 6 333 3 289 8138 14 517 11 587 6 109 445) 6 838 ) ( 5 486) 2 989) 874) 13 636) 10 770) 5 899)
K08E 118 2 396 2 112 1 069 216 4 335 3 780 1 956 NAGOY A 35 415 368 185 59 800 689 351 OSAKA 31 474 362 194 61 934 720 374 TOKYO 63 1 599 1 342 625 104 2 458 2 080 998 YOKOHAMA 81 1 126 916 495 148 2 251 1 865 996 OTHER,J APAN 81 1 080 704 403 161 2 029 1 380 780
- 23 -
TA BU Z (A) (CONT·D)
2ND QUARTE R 198 7 JA NUARV TO JUNE 1987
NUMB ER CAP A C I T Y NUMBER CAP A C I T Y SELECTED FIRST COUNTRY OF OF AND POR T Of CALL SHIPS DWT Gin NRT SHIPS oWT GRT NRT
("000) ( • 00 0) ( • 00 0) ( .0(0) ( ·000 ) <"OCO)
MAC AU 274 257 186 85 489 457 332 152 266) ( 259) 188) 87> 442> 424) 309) 142)
"ACAU 274 257 186 85 489 457 332 152
PHILIPPINES 162 1 242 940 504 298 2 Z74 1 794 961 118) 996) 829) 448) 241> 2 004) 1 641) 893)
!'I A~HL A 111 982 754 398 197 1 810 1 442 760 OTHER,PHILIPPINES 44 249 181 102 87 410 297 169
REPUBLIC OF KO~EA 221 4 065 3 328 1 787 435 7 765 6 437 3 39 :3 (SOUTH KOREA) 173) ( 2 421> 1 974) 1 080) 327> 4 586) 3 8/00) 2 116)
BUSAN 161 3 037 2 677 1 374 338 6 124 5 390 2 733 I NCHON 36 295 203 123 53 457 318 192 OTHER,REP OF KOREA 17 435 275 175 32 680 441 279 (S KOREA)
REPUBLIC OF SOUTH 36 1 463 898 555 70 2 549 1 586 970 AfRICA 40) 1 613) 987> 629) 69 ) 2 538) 1 587> 1 000)
RICHARoS SAY 17 1 029 573 369 31 1 645 927 600
S INGAPO RE 237 5 210 4 194 2 270 461 10 092 7 981 4 405 210) 4 224) 3 106) ( 1 784) 400 ) ( 8 193) ( 6 144) 3 477)
SINGAPORE 237 5 210 4 194 2 270 461 10 092 7 981 4 405
TAIWAN 623 8 067 6 421 :3 608 1 170 15 381 12 229 6 885 ( 572) 6 227> 4 984) 2 786) 1 113) ( 11 852) 9 403) 5 255)
leAOHSlUNG 340 4 346 :5 572 1 976 642 8 655 7 183 3 984 le EELUNG 207 :5 240 2 556 1 447 376 5 755 4 465 2 534 SUAO 25 166 103 65 47 302 188 118 TAICHUNG 42 183 120 75 83 404 252 159
THAILAND 93 894 6?7 357 188 1 861 1 298 741 ( 87> ( 743) 514) ( 291> 183) 1 518) ( 1 121) 630)
BANGKOK 92 888 623 354 186 1 831 1 281 730
UNITED ST ATES OF 158 5 659 4 900 2 724 315 11 236 9 732 5 485 AMERICA 194) 6 863 ) 5 813) 3 405) 364) ( 12 482) 10 622) 6 363)
- 24 -
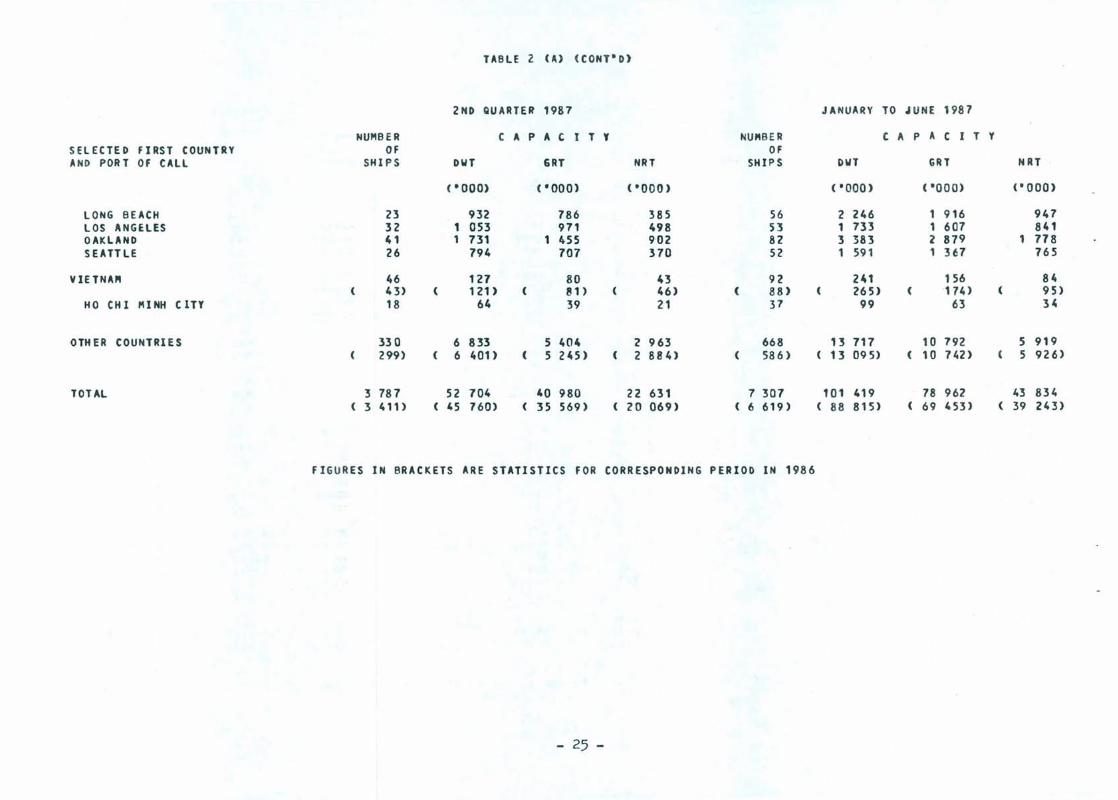
TABLE 2 tA) (CONT" D)
2ND QUARTER 1987 JANUARY TO "UNE 1987
NUMB E R CAP A C I T Y NUMBE R CAP A C I T Y SELECTED FIRST COUNTRY OF OF AND POR T OF CALL SHI PS DWT GRT NRT SHIPS DWT GAT NRT
(" 000) ( ·000) <"000 ) (·000) ( ·000) (·000)
LONG BEACH 23 932 786 385 56 2 246 1 916 947 LOS ANGELES 32 1 053 971 498 53 1 733 1 607 841 OAKLANO 41 1 731 1 455 902 82 3 383 2 879 1 778 SEATTLE 26 794 707 370 52 1 591 1 367 765
VIETNAPI 46 127 80 43 92 241 156 84 ( 43) ( 121> 81) ( 46) ( 88) 265) ( 174> ( 95)
HO CHI MINH CITY 18 64 39 21 31 99 63 34
OTH ER COUNTRIES 330 6 833 5 404 2 963 668 13 717 10 792 5 919 299) ( 6 401) ( 5 245) ( 2 884) ( 586) 13 095) 10 742) 5 926)
TOTAL 3 787 52 704 40 980 22 631 7 307 101 419 78 962 43 834 ( 3 411> ( 45 760) ( 35 569) ( 20 069) ( 6 619) ( 88 815) 69 453) ( 39 243)
FIGURES IN BRACKETS ARE STATISTICS FOR CORRESPONDING PERIOD IN 1986
- 25 -
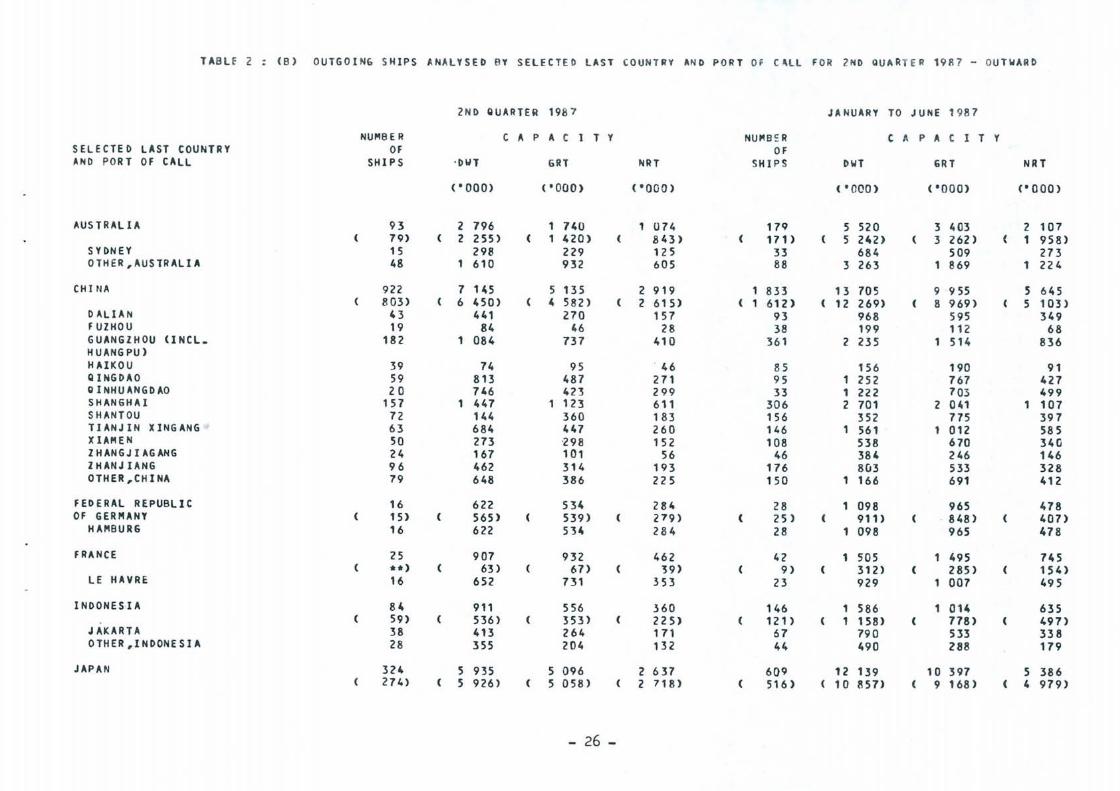
TAB U 2 (B ) OU TGOING SHIPS ANAL YSED BY SELEC TED LAST COU NT RY AN D PORT Of C~Ll FOR 2N D QUA RTER 1987 - OU TWA RD
2ND QUARTER 1987 JA HUARY TO JUNE '987
NUMB ER CAP A C T Y NU"'S ~ R C A P A C I T Y SELECTED LAST COUNTRY OF OF AND PORT OF CALL SHIPS ' DWT GRT NRT SHIPS OWT GRT NRT
( 0 000) ( 0000) <"000) (°000) (0000) CO 000)
AUSTRALIA 93 2 796 1 740 1 074 179 5 520 3 403 2 107 79) 2 255) 1 420) 843) ( 171> 5 242) 3 262) 1 958)
S Y DN E Y 15 298 229 125 33 684 509 273 OTHER,AUSTRALIA 48 610 932 605 88 3 263 869 1 224
CHINA 922 7 145 5 135 2 919 1 833 13 705 9 955 5 645 803) 6 450) 4 582) 2 615) 1 612) 12 269) 8 969) 5 103)
\) AlIAN 43 441 270 157 93 968 595 349 FUIHOU 19 84 46 28 38 199 1 12 68 GUANGIHOU (INCL_ 182 1 084 737 410 361 2 235 1 51 4 836 HUANGPU) H AIKOU 39 74 95 · 46 85 156 190 91 QINGOAO 59 813 487 271 95 1 252 767 427 Q I NHUANGOAO 20 746 423 299 33 1 222 703 499 SHANGHAI 157 1 447 1 123 611 306 2 701 2 041 1 107 SHANTOU 72 144 360 183 156 352 775 397 TIANJIN XINGANG 63 684 447 260 146 561 1 012 585 X lAM E N 50 273 ·298 152 108 538 670 340 IHANGJIAGANG 24 167 101 56 46 384 246 146 IHANJlANG 96 462 314 193 176 8\.13 533 328 OTHER ,CH I NA 79 648 386 225 150 1 166 691 412
FEDERAL REPUBLIC 16 622 534 284 28 098 965 478 OF GERMANY 15) 565) 539) 279) ( 25) 911> 848) 407)
HAMBURG 16 622 534 284 28 1 098 965 478
FRANCE 25 907 932 462 42 1 505 495 745 **) 63 ) 67> 39) 9) 312) ( 285) 154)
LE HAVRE 16 652 731 353 23 929 007 495
INDONESIA 84 911 556 360 146 586 1 014 635 59) ( 536) 353) 225) 121) 158) 778) 497>
JAKARTA 38 413 264 171 67 790 533 338 OTHER ,INDONESIA 28 355 204 132 44 490 288 179
JAPAN 324 5 935 5 096 2 637 609 12 139 10 397 5 386 274) 5 926) ( 5 058) 2 718) 516 ) 10 857> 9 168 ) 4 979)
- 26 -
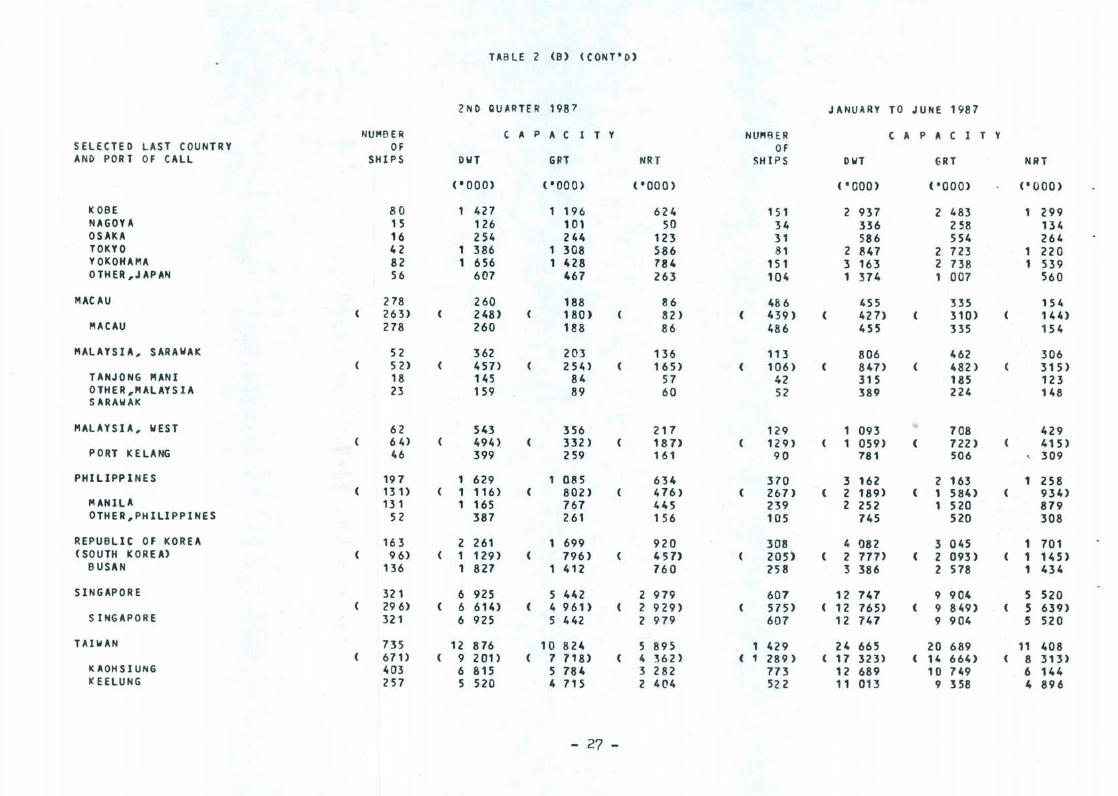
TABLE 2 (8) (CONT'D)
2ND QUARTER 1987 JANUARY TO JUNE 1987
NUMBER , A P A C I T Y NUI''HlER C It P It C I T Y SELECTED LAST COUNTRY OF OF AND POR T OF CALL SHIPS DWT Gin NRT SHIPS OWT GRT NAT
(" 000) ("000 ) ('000) ('000) ( '000) ('ODD)
K OBE 80 1 427 1 196 624 151 2 937 2 483 1 299 NAGOYA 15 126 101 50 34 336 258 134 OSAKA 16 254 244 123 31 586 554 264 TOKYO 42 1 386 1 308 586 81 2 847 2 723 1 220 YOKOHAMA 82 1 656 1 428 784 151 3 163 2 738 1 539 OTHER,JAPAN 56 607 467 263 104 1 374 1 007 560
"'ACAU 278 260 188 86 486 455 335 154 263) 248) 180 ) 82) 439) ( 427> 310) 144)
MACAU 278 260 188 86 486 455 335 154
MALAYSIA, SARAWAK 52 362 203 136 113 806 462 306 52) 457> 254 ) ( 165) ( 106) ( 847> ( 482 ) ( 315)
TANJONG MANI 18 145 84 57 42 315 185 123 OTHER ,"ALAYS lA 23 159 89 60 S2 389 224 148 S ARAWAK
MALAYSIA, WEST 62 543 356 217 129 1 093 708 429 64) 494) 332) 187> 129) 1 059) ( 722) 415)
PORT KELANG 46 399 259 161 90 781 506 , 309
PHILIPPINES 197 1 629 1 085 634 370 3 162 2 163 1 258 131> 1 116) 802) 476) ( 267> ( 2 189) ( 1 584) 934)
MANILA 131 1 165 767 445 239 2 252 1 520 879 OTHER,PHILIPPINES 52 387 261 1 56 105 745 520 308
REPUBLIC OF KOREA 163 2 261 1 699 920 308 4 082 3 045 1 701 (SOUTH KOREA) 96) 1 129) 796) 451> 205) ( 2 777) ( 2 093) 1 145)
B USAN 136 1 827 1 412 760 258 :5 386 2 578 1 434
SINGAPORE 321 6 925 5 442 2 979 607 12 747 9 904 5 520 296) 6 614) ( 4 961) 2 929) 575) .12 765) ( 9 849) 5 639)
S IHGAPORE 321 6 925 5 442 2 979 607 12 747 9 904 5 520
TAIWAN 735 12 876 10 824 5 895 1 429 24 665 20 689 11 408 671) 9 201) 7 718) 4 362) ( 1 289 ) ( 17 323) ( 14 664) 8 313)
KAOHSIUHG 403 6 815 5 784 3 282 773 12 689 10 749 6 144 I( EELUNG 257 5 520 4 715 2 404 522 11 013 9 358 4 896
- 27 -
SELECTED LAST COUNTRY AND PORT OF C4ll
SUAO T AI CH UNG
THA IUN 0
BANGKOK
UNI HO STATES OF AMERICA
OAKLAHD
v IETNA'"
HO CH I ''Il NH CITY
OTH ER COUNTRIES
TOTAL
TABLE 2 (B) (CONT OD)
2ND QUARTER 1987
NUI'IBER CAP A C 1 T Y NUMBER OF OF
SHIPS OWl GRT NRT SHIPS
( '000) ('000) ('(\00)
19 140 87 56 32 46 237 147 97 82
114 1 284 819 495 232 103) 1 014) ( 663) 384) 211> 112 1 172 761 452 229
57 2 052 1 806 1 018 117 85) 2 782 ) ( 2 422 ) 1 no) ( 169) 17 571 524 346 29
41 137 90 52 89 49) ( 1 50) ( 96) 54) ( 108 ) 17 39 29 15 41
287 5 961 4 368 2 409 586 ( 345) ( 6 638) 5 229) 2 853) 659)
3 771 52 604 40 874 22 578 7 303 3 387> ( 45 633) 35 471) ( 19 998) 6 611)
FIGURES IN BRACKETS ARE STATISTICS FOR CORRESPONOING PERIOD IN 1986 ** LESS THAN 3 VESSELS
- 28 -
HNUARY TO JUNE 1987
C A p A C I T Y
OWT GRT NRT
('CiOO) ('ODD) ('000)
241 151 95 421 262 169
2 565 1 672 002 2 044) 1 371> 800) 2 447 1 594 949
4 064 3 543 2 050 ( 5 213) ( 4 560) ( 2 604)
968 888 · 585
267 177 9.8 ( 348) 2 41 ) 13 6)
80 58 29
11 938 8 995 4 922 '2 998) 10 172) 5 663)
101 397 78 922 43 845 ( 88 739) ( 69 359) 39 205)
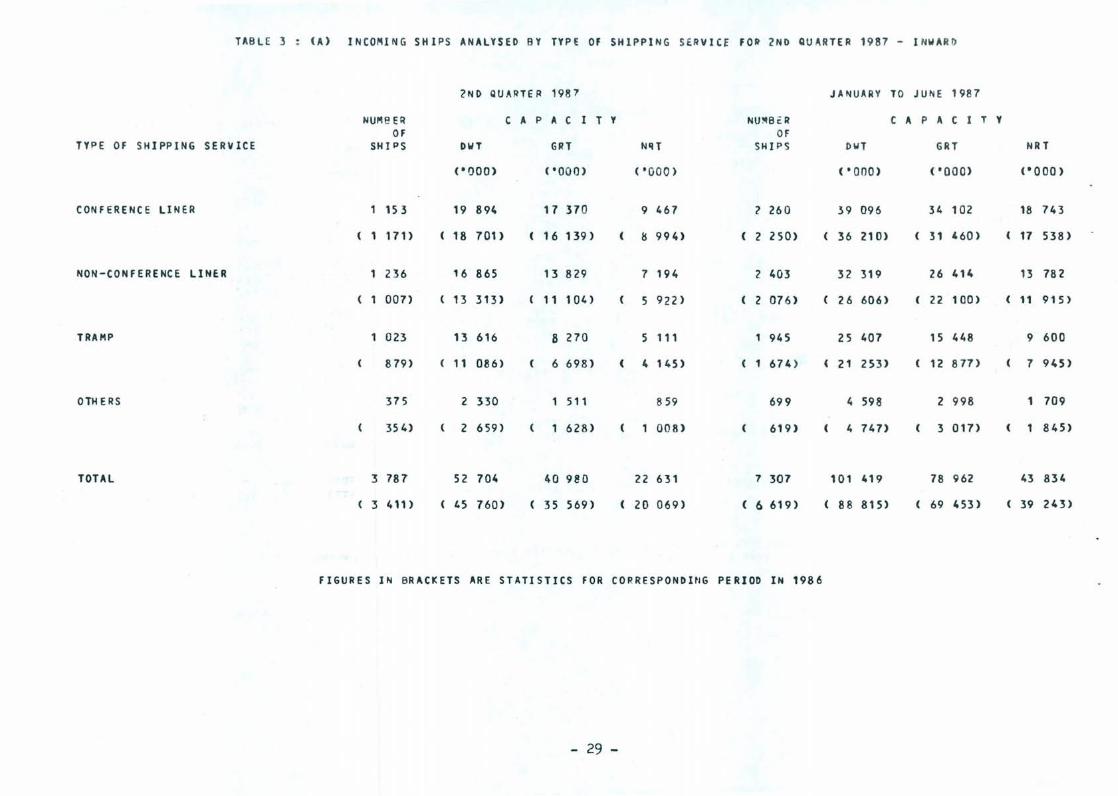
TABLE 3 (A) INCO~ING SHIPS ANALYSED BY Typ e OF SHIPPING SERVICE FO~ 2ND QUARTER 1987 - INWAR D
2ND QUARTE~ 198? JANUAR Y TO J UNE 1987
NUMBER CAP A C I T Y NU!'lB c R CAP A C I T Y OF OF
TYPE OF SHIPPING SERVICE SHIPS OWT GIlT NIIT SHIPS DWT GRT NRT
(" 000) ( '000) ('000) ('aDO) ('000) ('000)
CONFERENCE LINER 153 19 894 17 HO 9 467 2 260 39 096 34 102 18 743
1 171> 18 701> 16 139 ) IS 994) ( 2 250) 36 210) 31 460) (17 538)
NON-CONFERENCE LINER 1 236 16 865 13 829 7 194 2 403 32 319 26 414 13 782
007) 13 313 ) 11 104) 5 922 ) 2 076) 26 606) 22 100) ( 11 915)
TRAMP 1 023 13 616 8 270 5 111 1 945 25 407 15 448 9 600
879) ( 11 086) 6 698) 4 145 ) 1 674 ) 21 253) 12 871) 7 945)
OTH E RS 375 2 330 511 859 699 4 598 2 998 1 709
354) 2 659) 628) 008) 619) 4 747> 3 017) ( 1 845)
TOTAL 3 787 52 704 40 980 22 631 7 307 101 419 78 962 43 834
( 3 411) 45 760) 35 569) 20 069) ( 6 619) ( 88 815) 69 453) 39 243)
FIGURES IN BRACKETS ARE STATISTICS FOR CORRESPONDING PERIOD IN 1986
- 29 -
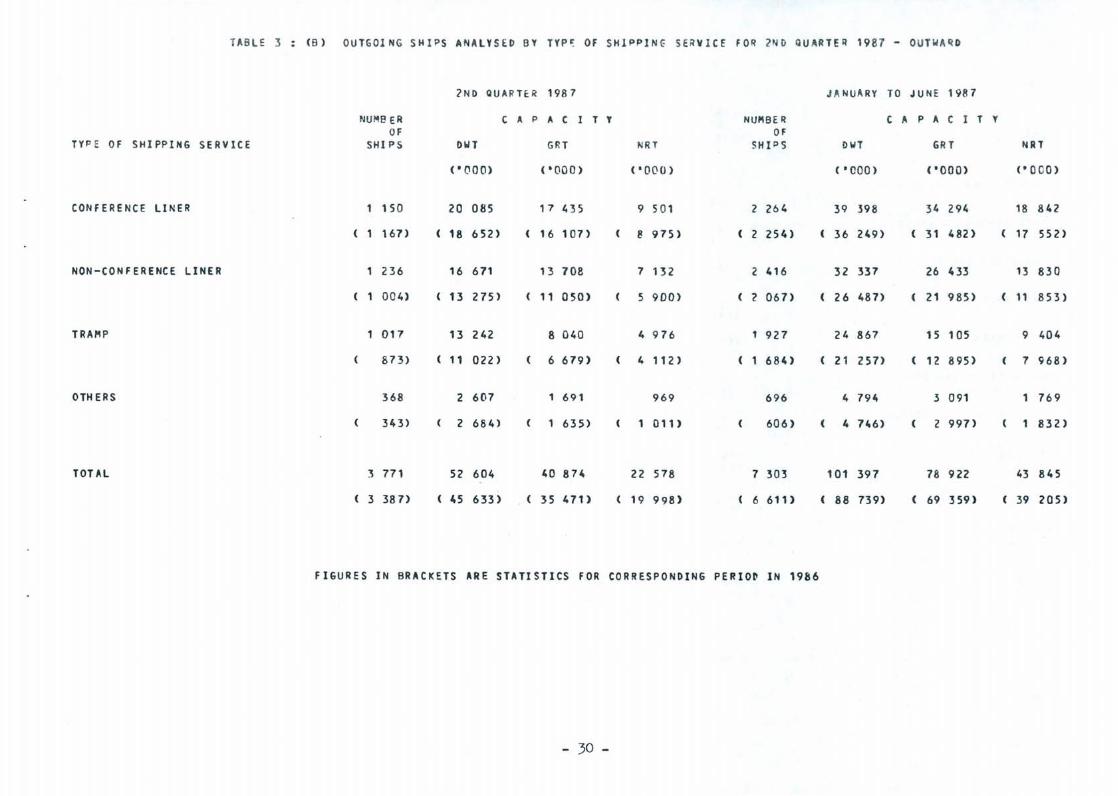
TABLE 3 ( B ) OU TGO I NG SH I PS ANA LY SED BY T YP ~ OF SHIPPI NG SERVI CE f OR 2ND QUART ER 19 81 - OUTWAR O
2 ND QU AR TER 198 7 JA NUARY TO JUN E 198 7
NU MB ER CAP A C I T Y NUMB ER C A P A C I T Y OF OF
TYP E OF SH I PPING SERVICE SHI PS DWT GRT NRT SHIPS OW T GRT NRT
('000) (·000) (·0(10) ('000) ( '000) (. 000)
CONFERENCE LINER 150 20 085 17 435 9 501 2 264 39 398 34 294 18 842
( 167 ) 18 652 ) 16 107) 8 975) 2 254) 36 249) ( 31 482 ) 17 552)
NON-CONFERENCE LINER 236 16 671 13 708 7 132 2 416 32 337 26 433 13 830
1 004) 13 275) 11 050) 5 900) 2 067) 26 487) 21 985) 11 853)
TRAMP 1 017 13 242 8 040 4 976 1 927 24 867 15 105 9 404
873) 11 022) 6 679) 4 112 ) ( 684) 21 257) 1 2 895) 7 968)
OTH ERS 368 2 607 1 691 969 696 4 794 :5 091 769
343) 2 684) 635) 1 011> 606) ( 4 746) 2 997) 832)
TOTAL 3 771 52 604 40 874 22 578 7 303 101 397 78 922 43 845
3 387) 45 633) ( 35 471) 19 998) 6 611) ( 88 739) ( 69 :3 59) 39 205)
FIGURES IN BRAC~ETS ARE STATISTICS FOR CORRESPONDING PERIO~ IN 1986
- 30 -
TA BLE 4 ( A) I NCOMING SHIPS ANALYSED BY SHIP TYP E FOR 2N D QUARTER 198 7 - INWARD
2 NO QUARTE K 1987 JANLl ARY TO J UNE 1 ~8 7
NUMe~R C .. P A C T Y NU P'l 8ER CA P A C I T Y OF OF
SHIP TYPE SHIPS OWT GRT NRT SHIP S OWl GR T NRT
('000) ('"OD) ( • 00 0 ) ( ' 000) ( '000) ('000)
CONVENTIONAL CARGO VESSEL 917 7 950 5 063 3 0"0 1 812 15 515 9 853 5 939 925) 7 649 ) ,. 869 ) 2 948 ) 1 817) 14 747> 9 354) 5 6 49)
SEMI-CONTAINER VESSEL 292 3 539 2 582 1 471 560 7 OH 5 030 2 892 264) 3 107) 2 154) 1 275) 522) 6 198) " 297> 2 520)
CONTAINER VESSEL 496 27 825 24 120 12 679 2 823 53 282 46 298 24 490 299) 23 281> 20 497) 11 071> 2 462) 44 965) 39 525) 21 515)
ROLL-ON/ROLL-OFF 112 037 1 056 501 210 1 993 2 067 967 103) 203) 1 270) 575) 219) 2 511> 2 598) 186)
OIL TANKER 205 2 476 1 461 866 391 4 542 2 694 1 597 205) 2 417) 1 394) 899) ( 348) ( 4 454) ( 2 582 ) ( 1 638)
GAS CARRIERITANKER 37 106 96 46 79 218 186 94 33) 80) 63> 37) 66) 177) 141) 79)
CHEI'lICAL CARRI E R !TANKER 46 703 425 257 85 1 295 774 471 35) 590) 336 ) 215) 62) 933) 538 ) 340)
DRY BULK CARRIER 269 6 533 3 801 2 445 534 12 921 7 506 ,. 860 237) 5 547> 3 193) 2 020) ( 472) ( 10 921) 6 340) 4 039)
LOG III 1'18 E R CARRIER 61 456 273 184 119 876 529 350 53) 477) 285) 187> 102) 863) 515) 333)
OTH ERS 352 2 078 2 103 1 143 694 3 740 4 025 2 174 257> 1 409) 1 507> 842) ( 549) ( 3 045) 3 563) 1 943)
TOTAL 3 787 52 704 40 980 22 631 7 307 101 419 78 962 43 834 ( 3 411> 45 760) ( 35 569) 20 069) 6 619) ( 88 815) 69 453 ) 39 243)
FIGURES IN BRACKETS ARE ST~TISTICS FOR CO~~ESPONDING PERIOD IN 1986
- 31 -
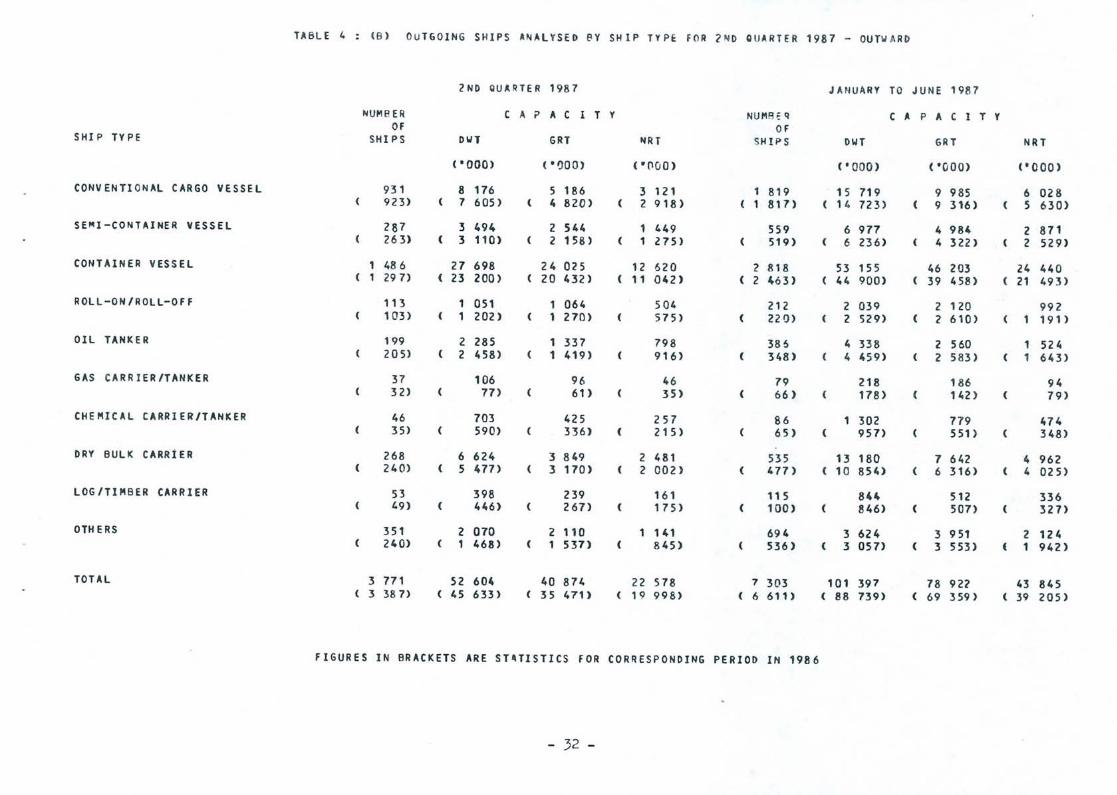
TABLE 4 ( B) OUTGOING SHIPS ANAL YSED BY SHIP TY P~ f OR 2 ND QUART ER 1987 - OUTWA RD
2ND QUARTER 1987 JAN UARY TO JUNE 1987
NUMBER CAP A C I T Y NUMA ~ Cl CAP A C I T Y Of OF
SHIP TYPE SHl PS DWl GRT NRT SHIPS DWT GRT NRT
('000) ( '1)00) (·('100) ('ODD) ('000) ('000)
CONVENTIONAL CARGO VESSEL 931 8 176 5 186 :5 121 1 819 15 719 9 985 6 028 923) 7 605 ) 4 820) 2 918) 1 817) 1 4 723) 9 316) 5 630)
SE~I-CONTAINER VESSEL 287 3 494 2 544 1 449 559 6 977 4 984 2 811 263) ( 3 110) 2 158 ) 1 275) 519) 6 23 6) 4 322 ) 2 529)
CONTAINER VESSEL 1 486 27 698 24 025 12 620 2 818 53 155 46 203 24 440 1 297) 23 200) 20 432) 11 042) ( 2 463) 44 900) 39 458) 21 493)
ROLL-ON/ROll-OFF 113 1 051 1 064 504 212 2 039 2 120 992 103 ) 1 202) 1 270) 575) 22 () 2 529) ( 2 610) 191)
OIL TANKER 1 99 2 285 1 337 798 38 () 4 338 2 560 1 524 205) 2 458) 1 419) 916) 348) 4 459) 2 58 3 ) 1 643)
GAS CARRIERITANKER 37 106 96 46 79 218 186 94 32) 77> 61> 35) 66 ) 178) 142 ) ( 79)
CHEMICAL CARRI ER /TANKER 46 703 425 257 86 1 302 779 474 35) 590) 336) ( 215) 65) 957> 551> 348)
DRY BULK CARRiER 268 6 624 3 849 2 481 535 13 180 7 642 4 962 240) 5 477) 3 170) 2 002) ( 477 ) ( 10 854) ( 6 316) ( 4 025)
LOGITIMBER CARRIER 53 398 239 161 115 844 512 336 49) 446) 267> 175) 100) 846) ( 501) ( 327>
OTH E RS 351 2 070 2 110 1 141 694 3 624 3 951 2 124 240) 1 468) 1 537> 845) 536) ( 3 057> 3 553) ( 1 942)
TOTAL 3 771 52 604 40 874 22 578 7 303 101 397 78 922 43 845 ( :5 387) ( 45 633 ) ( :5 5 471) ( 19 998) ( 6 611) ( 88 739) ( 69 359 ) ( 39 205)
FIGURES IN BRACKETS ARE ST_TISTICS fOR CORRESPONDING PERIOD IN 1986
- 32 -
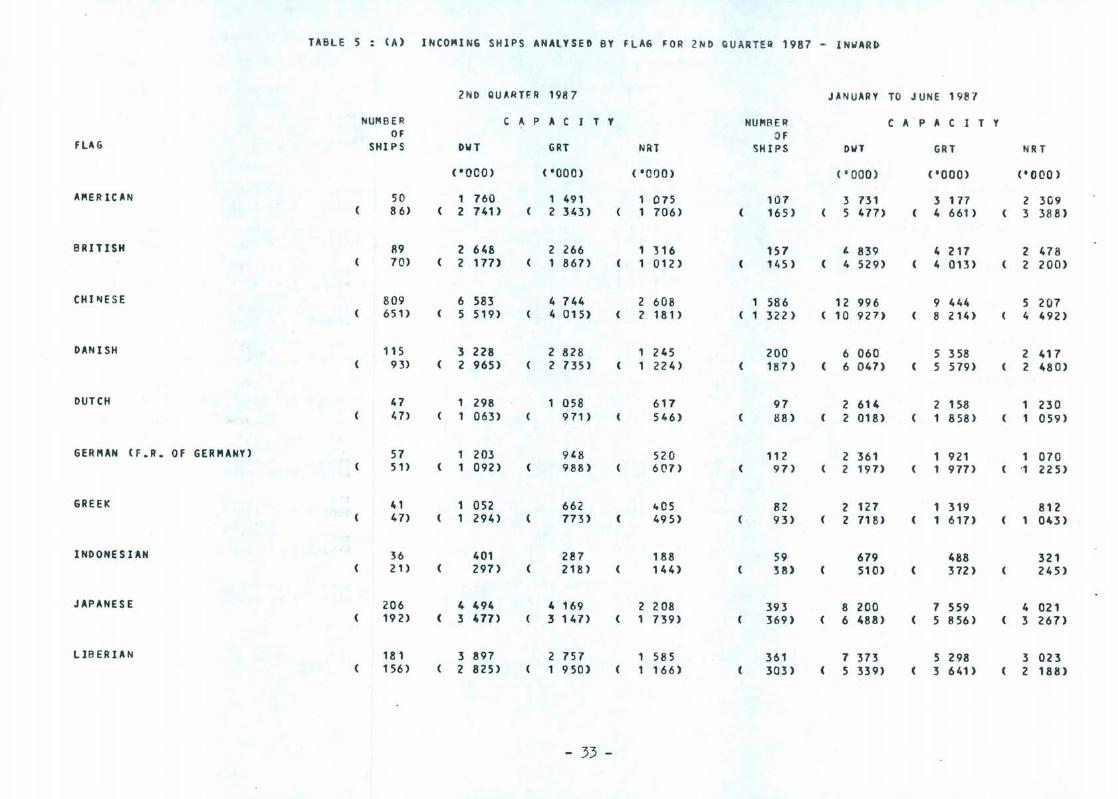
TABLE 5 ( A) INCOM ING SHIPS ANALYSED BY FLAG FOR 2ND QUAR TEQ 19 87 - INW ARD
2ND QUARTER 1987 JAN UARY TO J UNE 1 987
NUMBER CAP A C I T Y NUMBE R C AP A C I T Y OF OF
FLAG SHI PS DWT GRT NRT SHIPS DWT GRT NRT
( "OCO) ('000) ('01)0) ( 1000 ) ( '000) ('000)
AI'IERICAN 50 1 760 1 491 075 107 :5 731 3 177 2 309 86) 2 741> 2 343 ) 706) ( 165) 5 477) 4 661> 3 38 8)
BRITISH 119 2 648 2 266 1 316 151 L 839 4 211 2 478 70) 2 177) 1 867> 1 012 ) 145) 4 529) 4 013) 2 200)
CHINE SE 809 6 583 4 744 2 608 586 12 996 9 444 5 207 651) 5 519) 4 015) 2 181> ( 1 322> ( 10 927) 8 214) 4 492)
DANISH 115 :5 228 2 828 1 245 200 6 060 5 358 2 417 ( 93) ( 2 965) 2 735 ) 1 224) ( 187) ( 6 0 47) 5 579) ( 2 480)
DUTCH 47 1 298 058 617 97 2 614 2 158 1 230 47> 1 063) 971) 546) ~8) 2 018) 1 858 ) 1 059)
GER I1AN ( F.R. OF GERMANY) 57 1 203 9'8 520 112 2 361 1 921 1 070 51) 1 092) 988) 607> 97) 2 197) 1 977> ( -1 225)
GREEK 41 1 052 662 405 82 2 127 1 319 812 47> 1 294) 773) 495) 93) 2 718) 1 617) 1 043)
INDONESIAN 36 401 287 188 59 679 488 321 21) 297> 218) 144> 38) 510) 372 ) 245)
JAPANES E 206 4 494 4 169 2 208 393 8 200 7 559 4 021 192) ( 3 477) :5 147> 1 739) 369) 6 488) 5 856 ) ( 3 267>
LIB ER IAN 181 3 897 2 757 1 585 361 7 373 5 298 3 023 156 ) 2 825) 1 950) 1 166) 303) ( 5 339) ( 3 641> 2 188 )
- 33 -
FLAG
NORWEGI AN
PANAMANIAN
PHILIPPINE
RUSSIAN
SINGAPOREAN
SOUTH KOHAN
TAIWANESE
OTH ERS
TOTAL
(
NUMB E fi OF
SHIPS
14 21 )
164 l ' 055)
64 57>
47 32)
11 5 100)
117 125)
292 (89)
343 318)
3 787 3 411>
TARLE 5 (A) (CONT'D)
2 NO QUARTER
DWT
('000)
292 656)
10 774 8 809 )
964 642 )
725 462 )
2 242 2 152)
1 288 1 249)
3 731 3 000)
6 124 5 341>
52 704 ( 45 760)
CAP
1987
A C 1
GRT
('000)
342 576)
7 882 6 141)
613 410>
632 508 )
1 619 1 456)
987 962 )
3 034 2 454)
4 660 4 057)
40 980 35 569)
T Y
NRT
('001)
165 290)
4 316 3 454)
364 264)
306 233)
959 904)
579 561>
600 1 308)
2 577 2 235)
22 631 20 069)
NlIMRER OF
SHIPS
32 40)
2 248 1 986)
122 115)
97 69)
217 204)
222 248 )
569 567)
646 583)
7 307 6 619)
FIGURES IN BRACKETS ARE STATISTICS FOR CORRESPOND I NG PERIOD IN 1986
- 34 -
JA NU _ RY
DWT
('000)
937 1 283)
20 678 ( 16 339)
1 965 1 310)
1 367 987>
4 311 4 329)
2 421 2 541)
7 046 ( 5 831>
11 713 9 947>
101 419 (88815)
TO J UNf 1987
CAP A C I T Y
GRT
('000)
912 1 094)
14 900 11 346)
1 255 835)
1 279 ( 1 065)
3 094 2 966)
1 869 ( 1 951)
5 700 4 738)
9 on ( 7 671)
78 962 ( 69 453>
(
NRT
(' G 00)
440 546)
8 245 6 388)
753 524)
610 502)
1 833 1 845)
1 097 1 13 5)
3 010 2 520)
4 958 4 196)
43 834 39 243)
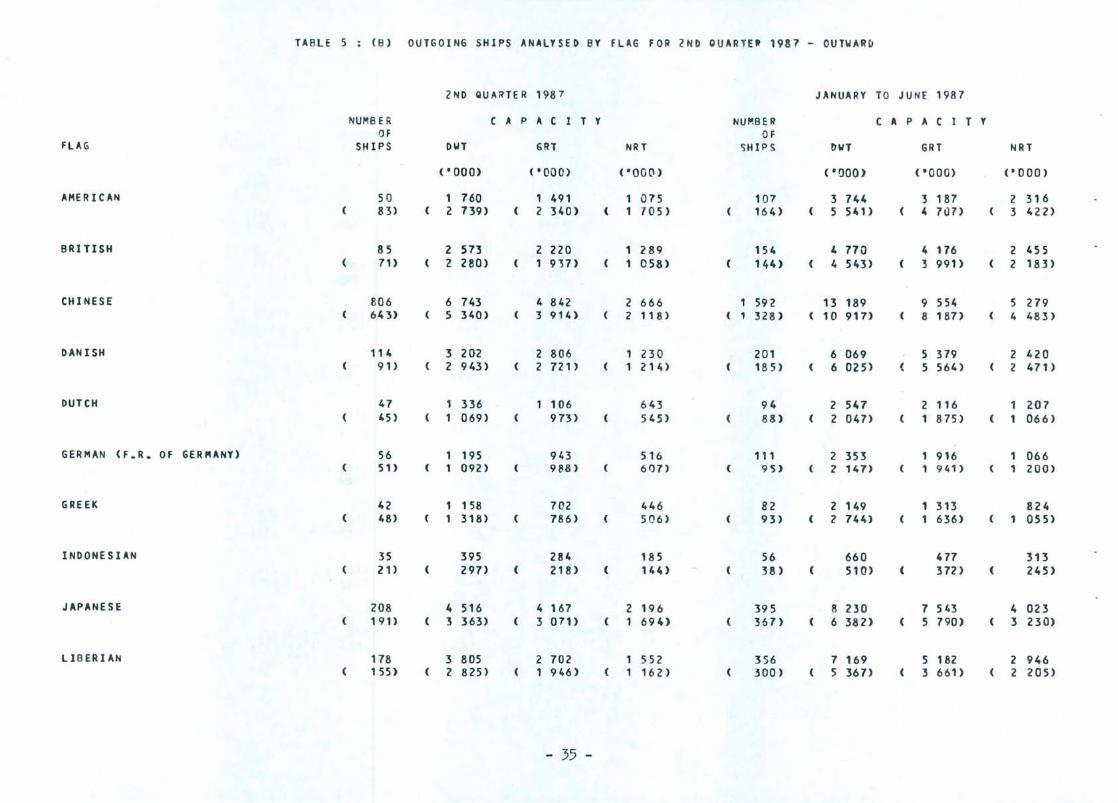
TABLE 5 (8) OUTGOING SHIPS ANALYSED BY FLAG FOR 2ND OUARTE' 1987 - OUTWAR~
2ND QUARTER 1987 JANUARY TO JUNE 1987
NUMB E R CAP A C I T Y NUMER CAP A C I T Y OF OF
FLAG SHIPS DWT GRT NRT ,}HIPS /)WT GRT NRT
( 0000) ( 0000) <"000) (Oaoo) (·000) (0000 )
AMERICAN 50 1 760 1 491 1 075 107 3 744 3 187 2 316 83) 2 739) 2 340) ( 1 705) 164) 5 541) 4 7iJn 3 422)
BRI TISH 85 2 573 2 220 1 289 154 4 770 4 176 2 455 71) 2 280) 1 937) 1 058) 144) 4 543) 3 991) 2 183)
CHINESE B06 6 743 4 842 2 666 1 592 13 189 9 554 5 279 643) 5 340) 3 914) 2 118) ( 1 328 ) 10 917> 8 187> 4 483)
DANISH 114 3 202 2 806 1 230 201 6 069 5 379 2 420 91 ) 2 943) 2 721) 1 214) 185) 6 025) 5 564) 2 471)
DUTCH 47 1 336 106 643 94 2 547 2 116 1 207 45) 1 069) 973) 545 ) ( 88) 2 047> 1 875 ) 1 066)
GERMAN (F.R. OF GER"ANY) 56 1 195 943 516 111 2 353 1 916 1 066 51) 1 092) ( 988) 61)7) ( 95) 2 147> 1 941) , 200)
GREEK 42 1 158 702 446 82 2 149 1 313 824 ( 48) 1 318) 786) 506) 93) 2 744) 1 636) 1 055)
INDONESIAN 35 395 284 185 56 660 477 313 ( 21> 297> ( 218) 144) 38) 510) ( 372 ) 245)
JAPANESE 208 4 516 4 167 2 196 395 8 230 7 543 4 023 191) ( 3 363) 3 071) ( 1 694) ( 367> ( 6 382) 5 790) 3 230)
LIBERIAN 178 :5 805 2 702 552 356 7 169 5 182 2 946 155 ) 2 825 ) 1 946 ) 162) 300) 5 367> 3 661) 2 205)
- 35 -
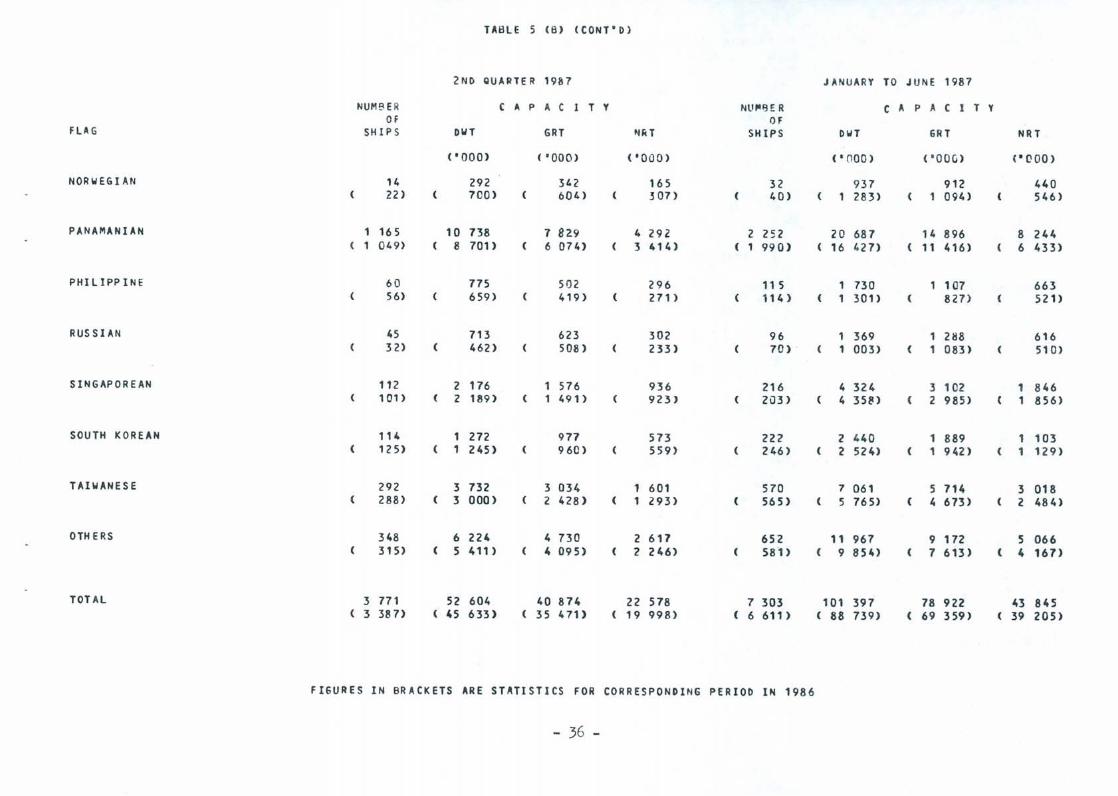
TABLE 5 (8) (CONT'D)
2 ND CWARTE R 1987 JANUARY TO JUNE 1987
NUMBE R ( A P A C I T Y NlI'-8ER CAP A ( I T Y Of OF
FLAG SH I P S DWT GRT ~HiT SHIPS DWT 6RT NRT
('ODD) ( • 000) ( • 00 0) ( • 000) ( ' DOG) ("000)
NORWEGIAN 14 292 342 165 32 93 7 912 440 22) 700) 604) 307) 40) 283) 1 094) 546)
PANAMANIAN 1 165 10 738 7 829 4 292 2 252 20 687 14 896 8 244 ( 1 049) 8 701) 6 074) 3 414) ( 1 990) 16 42 1> 11 416) 6 433)
PHILIPPINE 60 775 502 296 11 5 1 730 107 663 56) 659) 419) 271) 114 ) 1 301> 827> 521)
RUSSIAN 45 713 623 302 96 1 369 1 288 616 32) ( 462) 508 ) 233) 70) . 1 003) 1 083) 510)
SINGAPOREAN 112 2 176 1 576 936 216 4 324 3 102 1 846 101> 2 189) 1 491> 923) 203) 4 3511) 2 985) 1 856)
SOUTH KOREAN 114 1 272 977 573 222 2 440 1 889 1 1 03 ( 125) 1 245) 960) 559) 246) 2 524) 1 942) ( 1 129)
TAIWANESE 292 3 732 3 034 1 601 570 1 061 5 714 3 018 ( 288) ( 3 000 ) 2 428 ) 1 293) 565) 5 765) ( 4 673) 2 484)
OTH E RS 348 6 224 4 730 2 617 652 11 967 9 172 5 066 315) ( 5 411) ( 4 095) 2 246) 581) ( 9 854) 7 613) ( 4 167>
TOTAL 3 771 52 604 40 874 22 578 7 303 101 397 78 922 43 845 3 387> 45 633) 35 411) 19 998) 6 611) ( 88 739) 69 359) 39 205)
FIGURES IN BRACKETS ARE STATISTICS FOR CORRESPONDING PERIOD IN 1986
- 36 -
TAB LE 6 (A ) I NCO "'ING SHI PS ANALYSED BY DE ADWEIGH T TON NA GE ( !>WT) FO R 2ND QUA RTER 1987 - INWARD
2ND OUARTER 1987 J ANU AR V TO JUN E 198 7
NUMBER CAP A C T Y NU~flER CAP A C I T Y OF OF
DW T SHI PS DWT GIlT NU SHIPS DWT GRT HRT
('000) ('ODD) ('ODD) ( ' ODD) ( '000 ) (' 000)
BELOW 2 000 700 661 9~5 457 1 298 1 227 1 845 9Q7 618) 631 ) 839 ) 414) 1 162 ) 1 197> 1 8 46) 914)
2 000 TO :5 999 380 1 171 899 469 748 2 304 1 800 943 372) 1 1(8) ( 879) 478 ) 721> 2 190) ( 1 725) 936)
4 000 TO 4 999 195 884 627 345 349 1 582 1 101 618 { 157> ( 716) 521> 302) 306) ( 1 394) 987> 568)
5 000 TO 5 999 208 134 851 514 393 2 142 1 544 933 181) 993) 683) 418) 346) 1 890) 1 304) 790)
6 000 TO 6 999 323 2 082 1 376 794 634 4 090 2 745 1 579 2S9) 1 867> 1 229) 715 ) ( 584) 3 772) 2 509 ) 1 468 )
7 000 TO 7 999 181 1 355 864 476 381 2 849 1 834 1 006 191) 1 465) 963) 539) 378) 2 810) ( 1 840) , 0 33)
8 000 TO 8 999 149 1 252 864 472 304 2 547 1 710 9 7 2 134) 1 127> 771) 422) ( 285) 2 391> 1 635) 897>
9 000 TO 9 999 68 634 438 237 146. 1 360 958 519 66) ( 614) 40n 228) 132) 1 225) ( 809) 455)
10 000 TO 10 999 55 573 410 244 95 990 701 416 41) ( 432) 304) 1114) 85) ( 892) 629) 377)
11 000 TO 11 999 43 498 40u 229 82 947 760 443 52) 595) 444) 262 ) ( 97> 109) ( 838) 492)
- 37 -
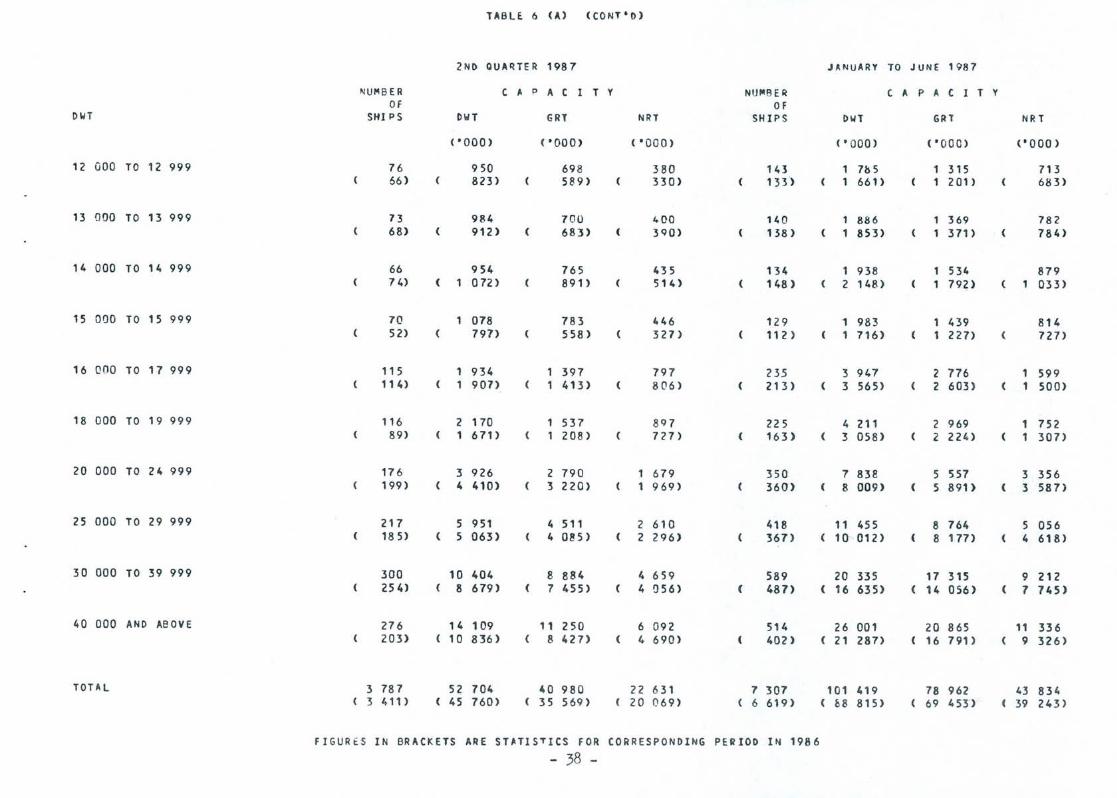
TABLE 6 (A) (CONT'D)
2ND QUAIlTE R 1987 JANUARY TO JUNE 1987
NUMBER CAP A C 1 T Y NU"'BER C A P A C 1 T Y OF OF
Owl SHI PS DWT GRT NRT SHIPS DWT GRT NR T
('000) ('000) ( '000) ('ODD) ( '000) ('000)
12 GOD TO 12 999 76 950 698 380 143 1 7b 5 315 713 66) 823) 589) 330) 133) 1 661) 201) 683)
1 3 000 T 0 1 3 9 9 9 73 984 700 400 140 886 369 782 68) 912) 683) HO) 138) 853) 371) 784)
14 000 TO 14 999 66 954 765 435 134 1 938 1 534 879 74) 072) 891> 514) 148 ) 2 148 ) 1 792) ( 1 033)
15 000 TO 15 999 7() 1 078 783 446 129 1 983 1 439 814 52) 797> 558) 327) 112) 1 716) 1 227> ( 727>
16 000 TO 17 999 115 1 934 1 397 797 235 3 947 2 776 1 599 114) 1 907) 1 413) 806 ) 213 ) 3 565) 2 603) 1 500)
18 000 TO 19 999 116 2 170 537 897 225 4 211 2 969 1 752 89) 1 671> 208) 727) ( 163) 3 058} 2 224) 1 307)
20 000 TO 24 999 176 3 926 2 790 1 679 350 7 838 5 557 3 356 199) 4 410} 3 220) 1 969) 360) 8 009) ( 5 891> ( 3 587>
25 000 TO 29 999 217 5 951 4 511 2 610 418 11 455 8 764 5 056 185) ( 5 063) 4 085) 2 296) 361> 10-' 012) 8 177) 4 618)
30 000 TO 39 999 300 10 404 8 884 4 659 589 20 335 17 315 9 212 254) 8 679) 7 455) ( 4 056) ( 487> 16 635) ( 14 056) 1 745)
40 000 AND ABOVE 276 14 109 11 250 6 092 514 26 001 20 865 11 336 203) 10 836 ) 8 427> 4 690) 402) 21 287) 16 791) 9 326)
TOTAL 3 787 52 104 40 980 22 631 7 307 101 419 78 962 43 834 ( 3 411> 45 760) 35 569 ) ( 20 (69) 6 619) ( 68 815) 69 453"> 39 243)
FIGURES IN BRACKETS ARE STATISTICS FOR CORRESPONDING PERIOD IN 1986
- 38 -
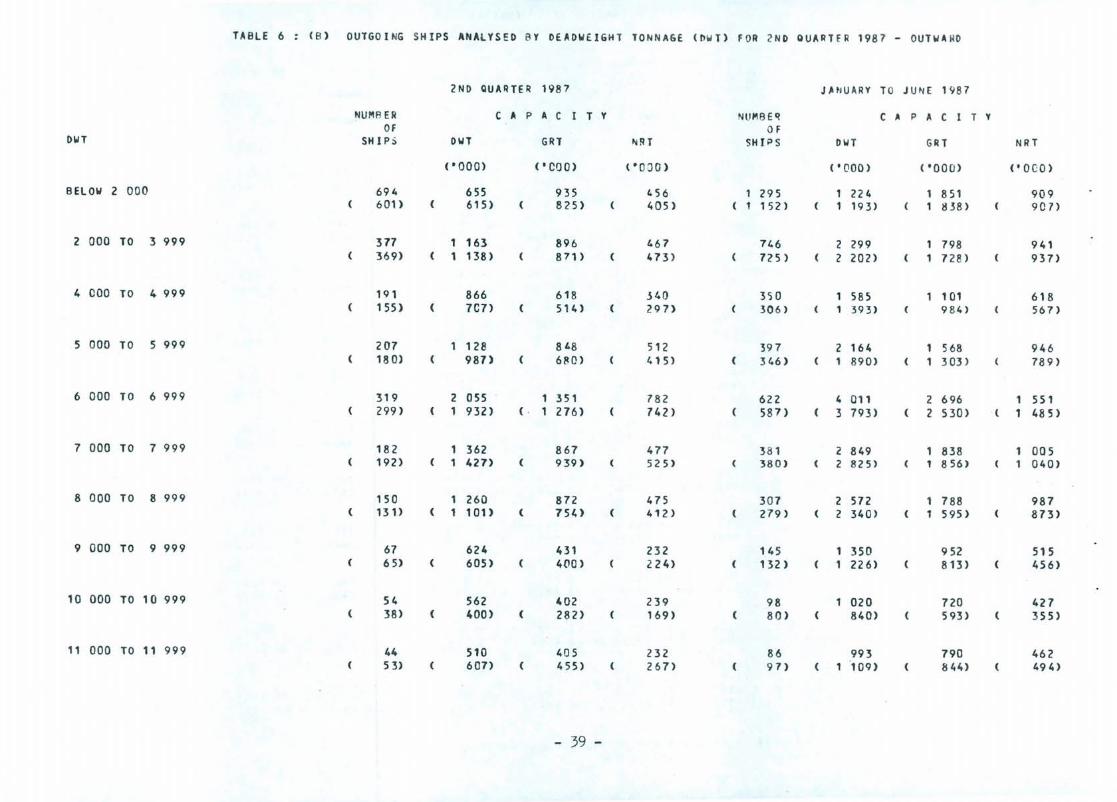
TABLE 6 (B) OUTGOING SHIPS ANALYSED BY DEADWEIGHT TONNAGE (nWT) FOR 2ND QUARTfR 1987 - OUTWA RD
2ND QUARTER 1987 J ,HJUARY TO JUNE 1987
NUI'IFl ER CAP A C I T Y NUMBEQ C A P A C 1 T Y Of OF
DWT SH 1 P5 DWT GRT tIIRT SH JP S DWT GRT NRT
('000) ( , ca 0) ( ·000) ('000) ( 'ODD) ('oeo) BELOW 2 000 694 655 935 456 1 295 224 1 851 909
601) 615) 825) 405) 1 152) 193) 1 I! 38) 907)
2 000 TO 3 999 377 1 163 896 467 746 2 299 798 941 369) 1 138 ) 871) 473) 725 ) 2 202) 1 728) 937)
4 000 TO 4 999 191 866 618 340 350 1 585 101 618 155 ) 7e7) 514) 297) 306) 1 393) 984) 567>
5 000 TO 5 999 207 128 848 512 397 2 164 1 568 946 180) 987> 680) 415) 346) 1 890) 1 303) 789)
6 000 TO 6 999 319 2 055 1 351 782 622 4 011 2 696 1 551 299) 1 932) ( . 1 276) 742) 587> 3 793) 2 530) ( 1 485)
7 000 TO 7 999 182 362 867 477 381 2 849 838 1 005 192) 1 427> 939 ) 525) 380) 2 825) , 856) 1 040)
8 000 TO 8 999 150 1 260 872 475 307 2 572 1 788 987 ( 131> ( 1 101) ( 754) 412 } 279) 2 340) 1 595) 873)
9 000 TO 9 999 67 624 431 232 145 1 350 952 515 ( 65) 605) 400) 224) 132 ) 1 226) 813) 456)
10 000 TO 10 999 54 562 402 239 98 1 020 720 427 38) 400) 282) 169) 80) 840) 593 } 355)
11000 TO 11 999 44 510 405 232 86 993 790 462 53) 607) 455) 267> 97) 1 109) 844) 494)
- 39 -
DWT
12 COO TO 12 999
13 000 TO 13 999
14 000 TO 14 999
15 000 TO 15 999
16 000 TO 17 999
18 000 TO 19 999
20 000 TO 24 999
25 000 TO 29 999
30 000 TO 39 999
40 000 AND ABOVE
TOTAL
NUMBER OF
SHIPS
75 64)
74 70)
68 73)
72 56)
117 111)
117 91)
174 196)
214 187>
298 255 )
277 201 )
3 771 ( 3 3l\ 7>
T~alf 6 (8) (CONT'O)
2ND QUA RH R
DWT
('ODD)
93b 798)
991 939)
982 058)
108 858)
967 1 856 )
2 190 1 709 )
3 880 4 348 )
5 874 5 123 )
10 345 8 719)
14 136 10 70S)
52 604 45 633)
CAP
1987
A C I T Y
GRT
( • 00 n)
692 572)
705 703)
78,9 8 7 7)
803 594)
415 380)
1 543 1 230)
2 767 3 168 )
4 465 4 112 )
8 817 7 474)
1 1 253 8 364)
40 874 35 471>
NqT
('000)
377 323)
401 402 )
448 50S)
456 3it9)
806 784)
904 71,2)
6';8 946)
2 578 2 319)
4 624 4 071)
6 112 4 628)
22 578 19 998)
(
(
NUM8E R OF
SHIPS
141 no)
138 141)
137 147)
128 113 )
237 216)
227 167)
353 355)
417 373)
584 '86)
514 399)
7 303 6 611)
FIGURES IN BRACKETS ARE STATISTICS FOR CORRfSPONDING PERIOD IN 1986 - 40 -
JANUARY
DIolT
( '000)
1 760 1 623)
859 1 892>
1 982 2 133)
968 ( 732)
3 983 3 613)
4 249 3 133)
7 898 7 898)
11 432 10 177>
20 158 ( 16 608)
26 041 21 119)
101 397 ( 88 139)
TO JUNE 1987
C A P A C 1 T Y
GilT
('000)
302 178 )
1 352 1 392 )
1 573 1 780)
430 238)
2 799 2 630)
2 986 2 272 )
5 606 5 825 )
8 757 8 274 )
17 182 14 024)
20 835 16 661>
78 9n ( 69 359)
C
NRT
('000)
705 672)
770 794)
901 025)
812 733)
614 513)
1 765 1 334)
3 382 3 550)
5 046 4 684)
9 134 7 744)
11 355 9 252)
43 845 39 205)
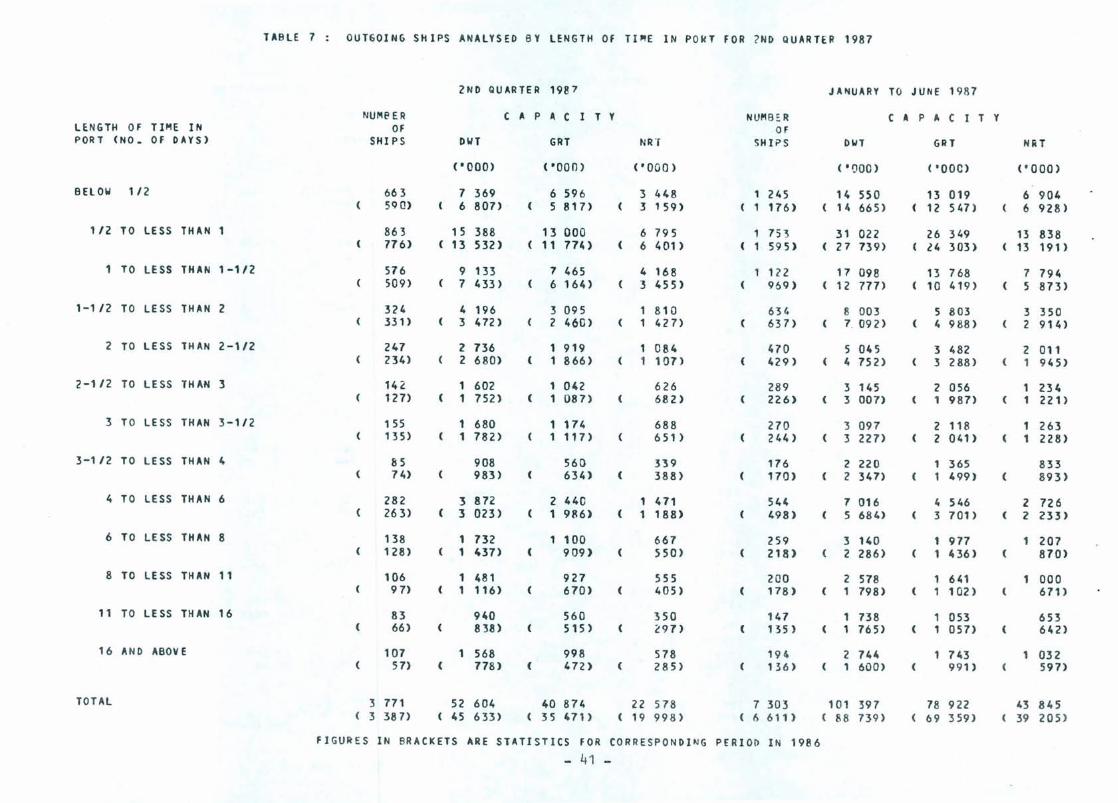
L~NGTH OF TIME IN PORT (NO. OF DAYS)
BElOW 1/2
1/2 TO LESS THAN
1 TO LESS THAN 1-1/2
1-1/2 TO LESS THAN 2
2 TO LESS THAN 2-1/2
2-1/2 TO LESS THAN 3
3 TO LESS THAN 3-1/2
3-1/2 TO LESS THAN 4
4 TO LESS THAN 6
6 TO LESS THAN 8
8 TO LESS THAN 11
11 TO LESS THAN 16
16 AND ABOV E
TOTAL
TABLE 7 OUTGOING SHIPS ANALYSED BY LENGTH Of lI~E IN POWT FOR ?ND QUARTER 1987
NUI"I~ E R OF
SHIPS
663 59 C)
863 776)
576 509)
324 331>
247 234)
142 127)
155 135)
B5 74)
282 263)
138 128 )
106 97>
83 66)
107 57>
3 771 3 387)
2ND QUARTER 1987
CAPACITY
DWl
("000)
7 369 6 807> ·
15 388 13 532)
9 133 7 433)
4 196 3 472)
2 736 2 680)
1 602 1 752)
1 680 1 782)
908 983)
3 872 ( 3 023)
1 732 1 437>
1 481 1 116)
940 838)
1 568 ( 778)
52 604 45 633)
GRT
('000)
6 596 5 817>
13 000 11 774)
7 465 6 164)
3 095 2 (60)
1 919 ( 1 866)
1 042 ( 1 087)
(
(
1 174 1 117)
560 634)
2 440 1 986)
1 100 909)
927 670)
560 515)
998 472)
40 874 35 471)
( , 000 )
3 448 3 159)
6 795 6 401)
4 168 3 455)
810 427>
1 084 1 107)
626 682)
688 651)
H9 388)
1 471 1 188)
667 550)
555 405)
350 297>
578 285)
22 578 ( 19 998)
NU"'B~ R OF
SHI?S
1 245 ( 1 176)
1 75~ 1 595)
1 1;>2 969)
634 637)
470 429 )
289 226)
270 244)
176 170)
544 498 )
259 218)
200 178 )
147 135 )
194 136 )
7 303 6 611)
FIGURES IN BRACKETS ARE STATISTICS FOR CORRESPONDING PERIOD IN 1986
- 41 -
JANUARY TO JUNE 19R7
DWT
('1]00>
14 550 14 665)
31 022 27 739)
17 098 12 777)
8 003 7. 092)
5 045 4 752)
3 145 3 007)
3 097 3 221>
2 220 2 347>
7 016 5 684)
3 140 2 286)
2 578 ( 1 798)
1 738 1 765)
2 744 1 600)
101 397 ( 88 739)
CAPACITY
GAT
( 'OOC)
13 019 12 547)
26 349 l.4 303)
13 768 10 419)
5 803 ( 4 988)
3 482 3 288)
2 056 1 981>
2 118 2 0(1)
365 499)
4 546 :3 701)
1 977 1 436)
1 641 , 102)
, 053 , 057>
743 991)
78 922 69 359)
HIiT
(' 000)
6 904 6 928)
13 838 ( 13 191>
(
7 794 5 873)
3 350 2 914)
2 011 1 945)
1 234 1 221>
1 263 1 228)
833 893)
2 726 ( 2 233>
1 207 870)
1 000 ( 671>
653 642)
1 032 597>
43 845 ( 39 205)
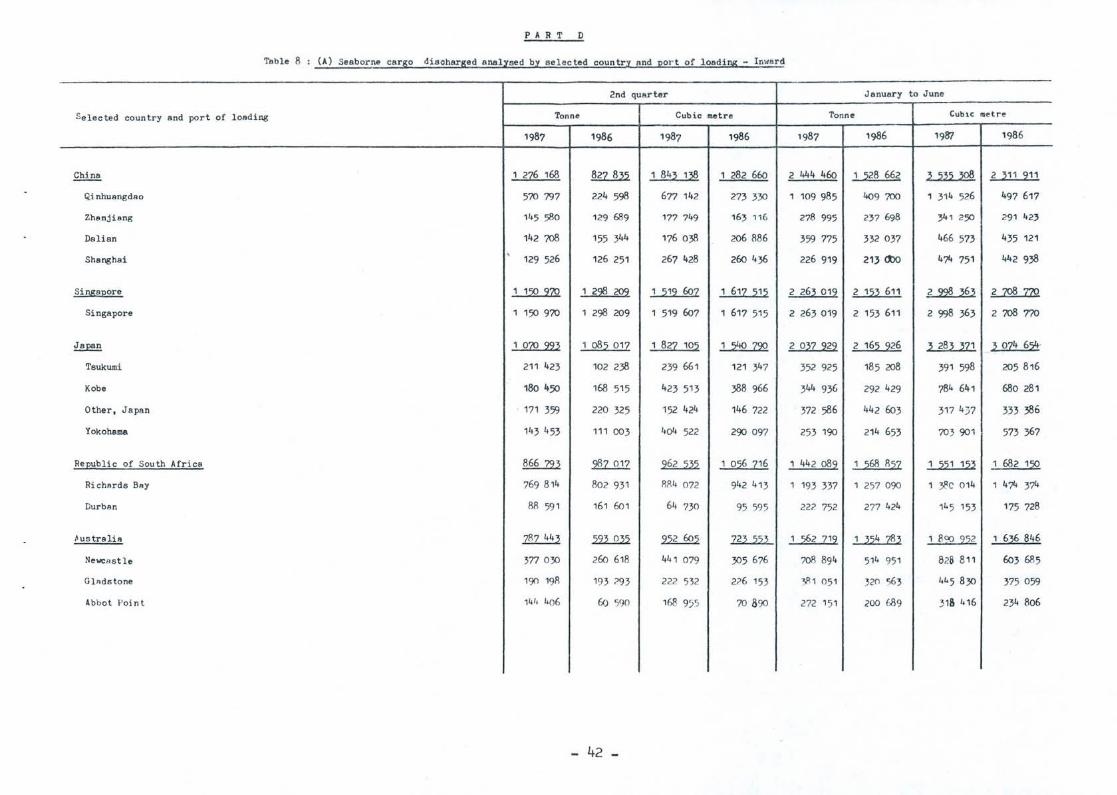
PAR T D
Table 8 (A) Seaborne cargo disoharged enalysed by selected country and port of loading - Inward
2nd quarter January to June
Selected country and port of loading Tonne Cubic metre Tonne CUblC nletre
1987 1986 1987 1986 1987 1986 1987 1986
China 1 226 168 ~ 1 84~ 1~ 1 282 660 2 444 460 1 :228 662 ~ :2~:/ 30B 2 ~11 211
Qinhuangdao 570 797 224 598 677 142 273 330 1 109 985 409 700 1 314 526 497 617
Zhanjiang 145 580 129 689 177 749 163 116 278 995 237 698 341 250 291 423
Dalian 142 ?OB 155 344 176 038 206 886 359 775 332 037 466 573 435 121
Shanghai ,
129 526 126 251 267 428 260 436 226 919 21} <bl 474 751 442938
Singapore 1 1:2Q 2ZQ 1 22§ ~ 1 :212 602 1 612 :/1:/ 2 26~ 012 2 1:/~ 611 2 ~ ~6~ 2 ?OB ZZQ
Singapore 1 150 970 1 298 209 1 519 607 1 617 515 2 263 019 2 153 611 2 998 363 2 ?OB 770
~ 1 OZQ 22~ 1 08:2 012 1 822 10:2 1 ~ 22Q 2 0~2 222 2 16:2 226 ~ 28~ ~21 ~ 024 6~·
Tsukumi 211 423 102 238 239 661 121 347 352 925 185 208 391 598 205 816
Kobe 180 450 168 515 423 513 388 966 344 936 292 429 784 641 680 281
Other, Japan 171 359 220 325 152 424 146 722 372 586 442 603 317 4')7 333 386
Yokohama 143 453 111 003 404 522 290 097 253 190 214 653 703 901 573 367
Republic of South Africa §.§£..ID ~ ~ 1 0:26 216 1 442 082 1 :268 R:22 1 :221 1:2~ 1 682 1:2Q
Richards Bay 769 814 802 931 RR4 072 942 413 1 193 337 1 257 090 1 ;.Ilc 014 1 474 374
Durban 88 59 1 161 601 64 730 95 595 222 752 277 424 145 153 175 728
ftustralia ~ 22.2....Q22 ~ 72~ 222 1 ~2 712 1 224 :z!l2 1 8~ 222 1 6~6 846
Newcastle 377 030 260 618 441 079 305 676 708 894 514 951 828 811 603 685
G lAds tone 190 1911 193 293 222 532 226 153 'J\ 1 051 320 563 445 830 375 059
Abbot Poi nt 14 /, 406 60 590 168 9)') 70 890 272 151 200 689 318 416 234 806
- 42 -
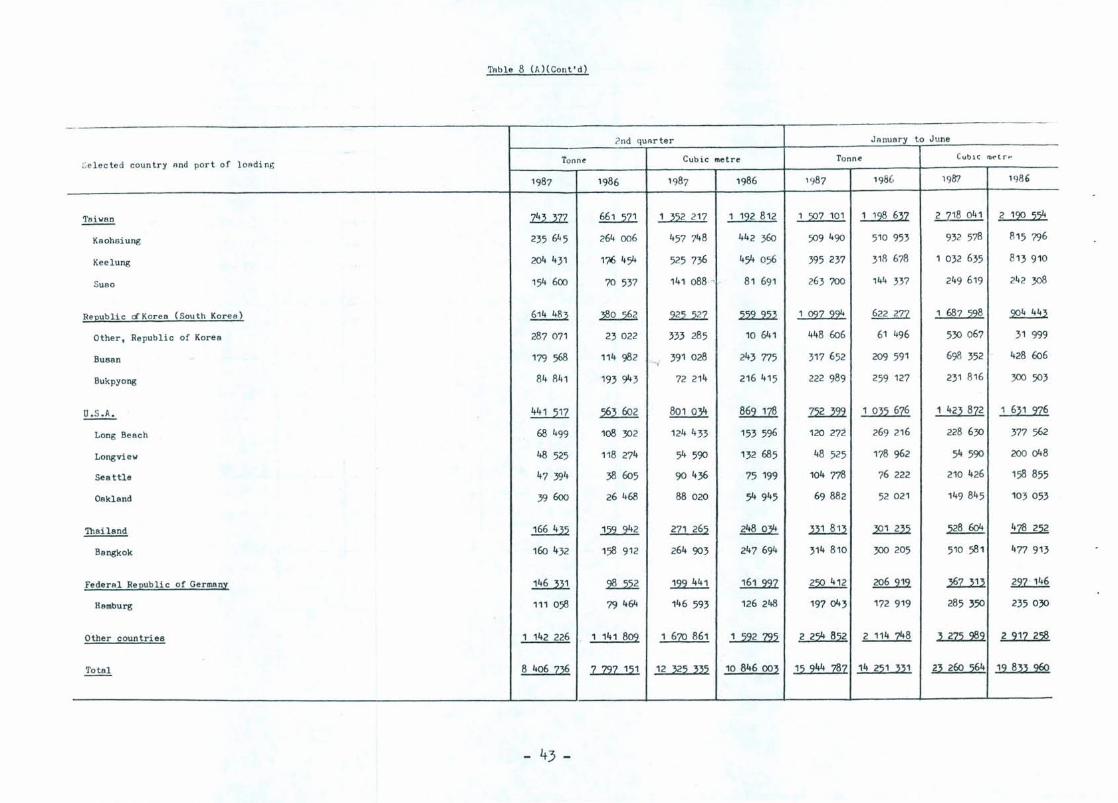
TAble 8 (t, )(Cont' d)
-2nd qURrte r JRnuary to J une
~ e l ec te d country nnd por t of loa ding Tonne Cubic metre Tonne CublC m~lrf'
1987 1986 1987 1986 1987 198(, 1987 198 6
~ N..211 §§.l...W. 1 ~~2 217 1 122 812 1 2Q7 101 1 12§ 6~Z 2 Z18 041 2 12Q :22!:!
Kaohsiung 235 645 264 006 457 748 442 360 509 490 510 953 932 578 815 796
Kee lung 204 431 176 454 525 736 454 056 395 237 31/\ 678 1 032 635 8 13 910
Suao 154 600 70 537 141 088- ~ 81 691 263 700 144 337 249 619 242 3Q8
ReEublic a Kor ea ( South Kore a ) 614 483 ~ ~ ~ 1 Q2Z 22!! 622 27Z 1 687 :228 ~
Other. Re public of Korea 287 071 23 022 333 285 10 641 448 606 61 496 530 067 31 999
BUBan 179 568 114 982 '-{ 391 028 243 775 317 652 209 591 698 352 428 606
Bukpyong 84 /\41 193 943 72 214 216 415 222 989 259 127 231 816 300 503
~ 441 517 ~ ~ ~ 12..1.22. 1 O~~ 6Z6 1 42~ 8Z2 1 6~1 2Z6
Long Beach 68 499 108 302 124 433 153 596 120 272 269 216 228 630 377 562
Longview 48 525 118 274 54 590 132 685 48 525 178 962 54 590 200 048
Seattle 47 394 38 605 90436 75 199 104 778 76 222 210 426 158 855
Oakland 39 600 26 468 88 020 54 945 69882 52 021 149 845 103 053
Thailand ~ ~ .?ZlM 248 034 .w...Jru ~ 528 604 ~
Bangkok 160 432 158 91 2 264 903 247 694 314 810 300 205 510 58 1 477 913
Federal ReEublic of Germany ~ ~ .122..lli ~ ~ ~ ~ ~ Hamburg 111 058 79 464 146 593 126 248 197 043 172 919 285 350 235030
Other countries 1 142 226 1 141 802 1 670 861 1 :292 79:2 2 22!:! 852 2 114 '148 :5 27:2 989 2 21Z 258
Totsl 8 406 Z~ Z Z2Z 1~1 12 ~2~ ~~:2 10 846 OO~ 1:2 244 z§z 14 2:21 ~~1 2~ 260 ~64 12 8~~ 2f!Q
- 43 -
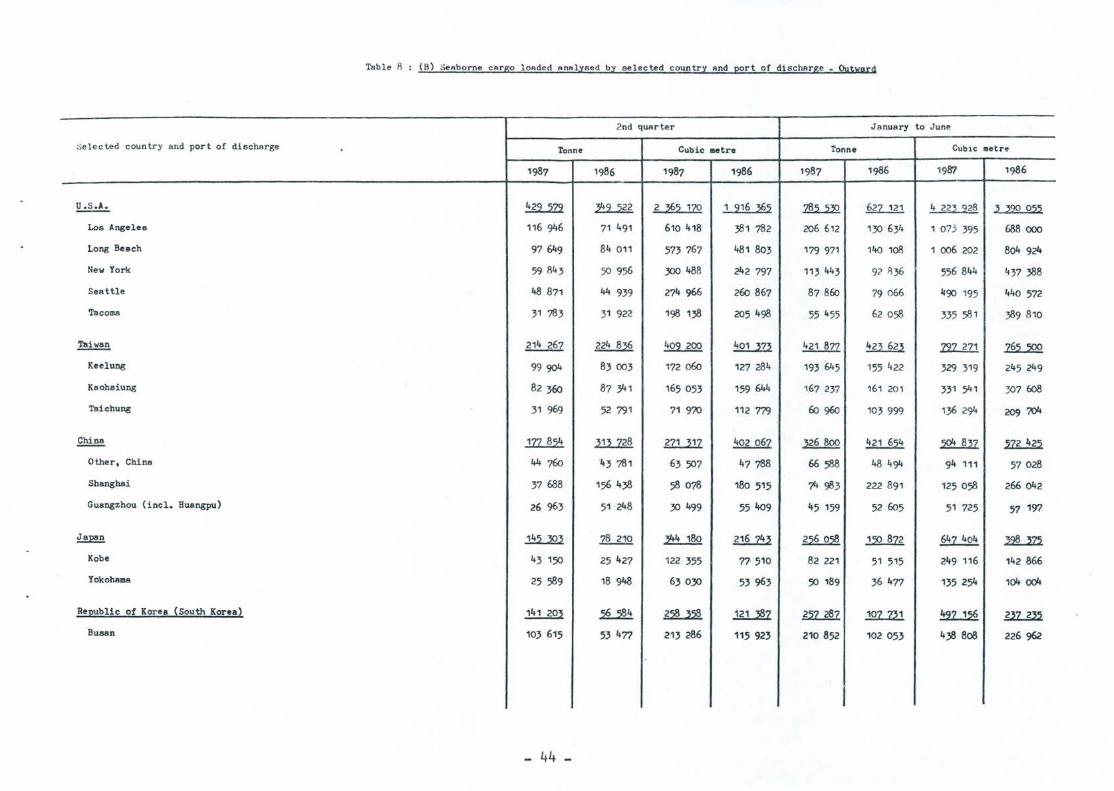
Table R (8) Seaborne cargo lOAded Analysed by selected country and port of discharge _ Outward
2nd quarter January to June
Selected country and port of discharge Tonn~ Cubic llletre ronn~ CUblC .. etr~
1987 1986 1987 1986 1987 1986 1987 1986
~ ~ ~ 2 ~~ 1ZQ 1 216 ~~ ~ 627 121 4 22~ 228 ~ ~ 0:2:2
LOB Angelea 116 946 71 491 610 418 381 782 206 612 130 63/~ 1 07.3 395 688 000
Long Beach 97649 84 011 573 767 481 803 179 971 140 108 1 006 202 804 924
New York 59 843 50 956 300 488 242 797 113 443 921\36 556 844 437 388
Seattle 48 871 44 939 274 966 260 867 87860 79 066 "90 195 440 572
Tacoma 31 783 31 922 198 138 205498 55 455 62058 335 581 389 810
~ 214 267 ~ 402 200 ~ m.§.ZZ ~ 12Z2Z1 ~ Keelung 999Q4 83003 172 060 127 284 193 645 155 422 329 319 245 249
Kaohsiung 82360 87 341 165 053 159 644 167 237 161 20 1 331 541 307 608
Taiehung 31 969 52 '791 71 970 112 779 60960 103 999 136 294 209704
China ~ ~ .ll1...ill 402067 326800 421 654 ~ ~ Other, China 44 760 43 781 63507 47788 66 588 48494 94 111 57 028
Shanghai 37 688 156 438 58 078 180 515 74 983 222 891 125 058 266042
Guangzhou (incl. Huangpu) 26 963 51 '248 30 499 55409 45 159 52 605 51 725 57 197
Japsn ili..JQ.2 ~ ~ ~ ~ ~ 647404 ~ Kob~ 43 150 25 427 122 355 77' 510 82 221 51 515 249 116 142 866
Yokohama 25 589 18 948 63030 53963 50 189 36 477 135 254 104 004
Republic of Kor~a (South Kor~a) 141 203 ~ ~ .Jll.1!l.2 ~ ~ ~ ~ Buaan 103 615 53477 213 286 115 923 210 852 102 053 438 808 226 962
"
- 44 -
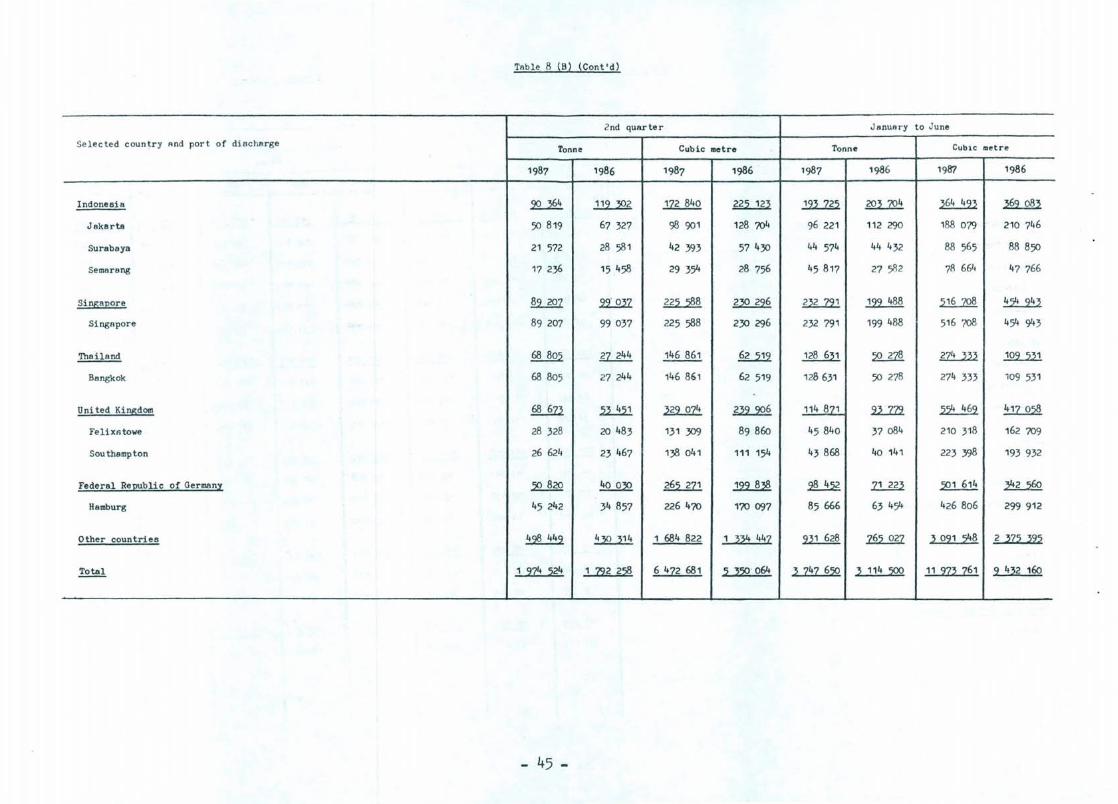
Table 1\ (B) (Cont'd)
2nd quarter JanuAry to June
Se lected country And port of discharge Tonne Cubic metre Tonne CUblC metre
1987 1986 1987 1986 · 1987 1986 1987 1986
Indonesia 2Q..l§! .lli...E 172 840 ~ ~ ~ ~ ~
Jakarta 50 819 67 327 98 901 128 704 96 221 112 290 188 079 210 746
Sursbaya 21 572 28 581 42 393 57 430 44 574 44 432 88 565 88 850
Semarang 17 236 15458 29 354 28 756 45 817 27 582 78 664 47 766
Singapore §L?Qz .22Jm ~ ~ .?.R222 ~ ~ ~
Singapore 89 207 99 037 225 588 230 296 232 791 199 488 516 ?08 454 943
Thailand 68 805 27 244 146 861 ~ ..!.?t.§.ll 2Q..11ll. ~ ~
Bangkok 68 805 27 244 146 861 62 519 128631 50 278 274 333 109 531
Uni ted Kingdom ~ .ll.lli 2.2....Q.l!. ~ 114 871 '22...Ill ~ ~
FelixRtowe 28 328 20 483 131 309 89 860 45840 37084 210 318 162 709
Sou thamp ton 26 624 23 467 138 041 111 154 43868 40 141 223 398 193 932
Federal Republic of Germany ~ ~ &.m ~ ~ .n..m ~ ~ Hamburg 45 242 34857 226470 170~7 85666 63 454 426 806 299 912
Other countries ~ ~ 1 684 822 1 334 447 ~ ~ 3 091 548 2;mm
~ 1 2Z4 :224 1 :222 22§ 6 4Z2 681 :2 ~2Q 064 ~ Z4Z 622 ~ 114 2QQ 11 2Z~ Z61 2 4~2 ,60
- 45 -

Table 9 (A ) Seaborne carEo discharged anAlysed by se lected count r y and por t of loading by contai neri zati on - I nwa rd
--~-.
2nd quarter January to June
Selected country and por t o f loading Tonn e Cubic metre l'o nn ~ Cub I c me tr ~
1987 1986 1987 1986 1987 1986 1987 198(,
Japan 384 671 911 182 744 660 694 671 552 740 1 619 843 1 337 567 Containerized 310 927
Total 1 072 22~ 1 08 :2 01Z 1 82Z 10:1 1 :to Z22 2 O~Z 222 2 16:2 226 ~ 28~ ~Zl ~ 074 6:24
Kobe Containerized 138 697 126 210 364 260 327 602 252 500 219 337 655 409 571 508
Total 180 450 168 515 423 513 388 966 344 936 292 429 784 641 680 281
Yokohama Containerized 110 679 88 105 262 271 214 921 196 755 159 756 466 316 398 487
Total 143 453 111 003 404 522 290 097 253 190 214 653 703 90 1 573 367
Tokyo Contai nerized 49 358 36 954 114 895 80 182 88 237 66 748 196 143 150 41 2
Tota l 57 301 86098 119 699 95 518 112 871 131 248 207 009 170 234
Nagoya Con taineri zed 33 100 15011 67 709 35 062 58 904 27 987 118 706 65 705
Total 62 154 32 841 156 114 80458 113 884 65 779 266 637 186 718
~ Containerized 341 301 256 347 671 247 504 555 633 881 497 969 1 268 423 1 005 153
Tota l ~ ~ ~ §.§2...1Z§. ~ 1 0~:2 6Z6 1 42~ 8Z2 1 6~1 2Z6 Long Beach
Con taineri zed 68 499 51 283 124 433 95367- 120 272 105 747 228 630 202 647
Total 68 499 108 302 124 433 153 596 120 272 269 216 228 630 377 562
Seattle Containerized 47 394 38 605 90 436 75 199 104 778 76 218 210 426 158 840
Total 47 394 38 605 90 436 75 199 104 778 76 222 210 426 158 855 Oak land
Containerized 39600 26468 88 020 54 945 69882 ~ J 504 149 845 101 9.c9 Total 39600 26 468 88 020 54 945 69 882 52021 149 845 103 053
Los Angeles Contsinerized 35 333 23 199 63 921 46443 70 607 37 60. 137 995 78106 Total 35 333 24 143 63 921 48 283 70 607 39 290 137 995 81 090
New York Con tainerized 31 384 20 678 55 038 37369 52 833 40 777 95 58 1 77 636 Total 32 498 20 678 56 973 37 369 53 946 41 546 97 517 78 870
~ Con taineri zed 313 134 238 330 792 647 629 272 595 067 433 402 1 534 843 1 136 058 Totsl 1!Lm ~ 1 ~:22 21Z 1 192 812 1 2QZ 101 1 128 6}2 2 Z18 041 2 190 :2:24
Keelung Con tsinerized 188 230 155 394 494001 411 487 363 780 274 145 973 998 729 490 Total 204 431 176 454 525 736 454 056 395 237 318 678 1 032 635 813 910
Kaohsiung Containerized 117 275 73 997 279 417 19; 690 218 131 142 437 526094 368 209 Total 235 645 264 006 457 748 442 360 509490 510 953 932 578 815 796
- 46 -
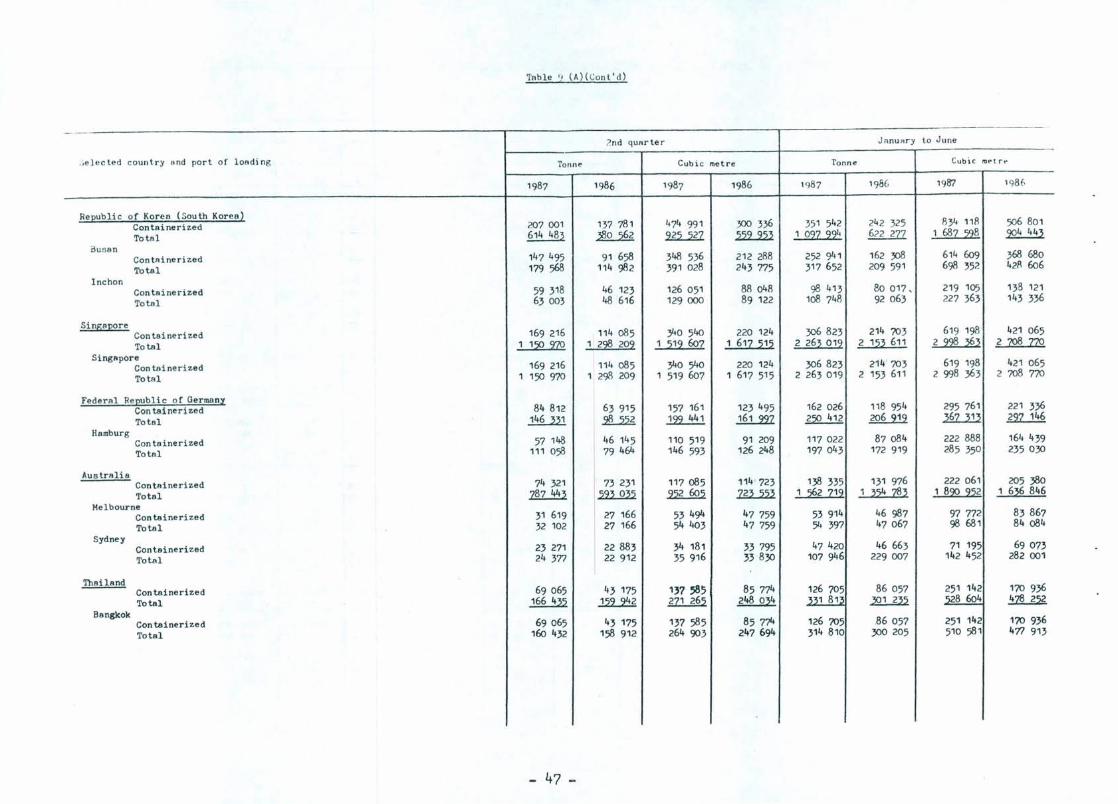
Tnb l e ',I (A)( Conl'd)
;> nd qURrte r J nnu Rr y to June
:;e}ec led coun try a nd port of loadi ng Tonne Cubi c metre Tonne Cubic m~ trt"
1987 1986 1987 1986 1987 198G 1987 198(,
Re Eubli c o f Korea ( South Korea) Containerized 207 001 137 781 474 991 300 336 351 542 242 325 834 118 506 801
Total 614 483 ~ ~ lli...:l2l 1 022 224 §R111. 1 682 228 ~ Busan
ContRinerized 147 495 91 658 348 536 212 288 252 941 162 30B 614 609 368 680
Total 179 568 114 982 391 028 243 775 317 652 209 591 698 352 421'1 606
lnchon Containerized 59 318 46 123 126 051 88 048 98 413 80 017, 219 105 138 121
Total 63 003 48 616 129 000 89 122 108 748 92063 227 363 143 336
Si!!Ej8Eore Con t ainerized 169 216 114 085 Y.054o 220 124 306 823 214 703 619 198 421 065
Total 1 1:2Q 222 1 22§ 202 1 ~12 602 1 612 ~1~ 2 26~ 012 2 1~~ 611 2 22§ ~~ 2 708 Z7Q SingApore
Con tai nerized 169 216 114 085 y.o 540 220 124 306 823 214' 703 619 198 421 065
Tota l 1 150 970 1 298 209 1 519 607 1 617 515 2 263 01 9 2 153 611 2 998 363 2 708 770
Federal Republic o f Germany Con tainerized 84 812 63 915 157 161 123 495 162 026 118 954 295 761 221 336
Total ~ ~ ~ 2§..L22Z ~ ~ ~ ~ Hamburg
Con taineri zed 57 148 46 145 110 519 91 209 117 022 87084 222 888 164 439
Total 111 058 79 464 146 593 126 248 197 043 172 919 285 350 235 030
AuatrAli a Containerized 74 321 73 231 117 085 114' 723 138 335 131 976 222 061 205 380
Total ~ ~ ~ .m..2.2l 1 :222 212 1 ~~4 Z§~ 1 82Q 2~2 1 6~ 846
Melbourne Con tainerized 31 619 27 166 53 494 47 759 53 914 46 987 97 772 83 867 Total 32 102 27 166 54403 47 759 54 397 47067 98 681 84 084
Sydney Containerized 23 271 22 883 34 181 33 795 47 420 46 663 71 195 69073 Total 24 377 22 912 35 916 33830 107 946 229007 142 452 282 001
Thailand Con tainerized 69065 43 175 137 585 85 774 126 705 86057 251 142 170 936 Total ~ ~ ~ 248 034 'B1 81~ ~ 528 604 ~
Bangkok Con tainerized 69 065 43 175 137 585 85774 126 705 ,86 057 251 142 170 936 Total 160 432 158 912 264 903 247694 314 810 300 205 510 581 477 913
- 47 -
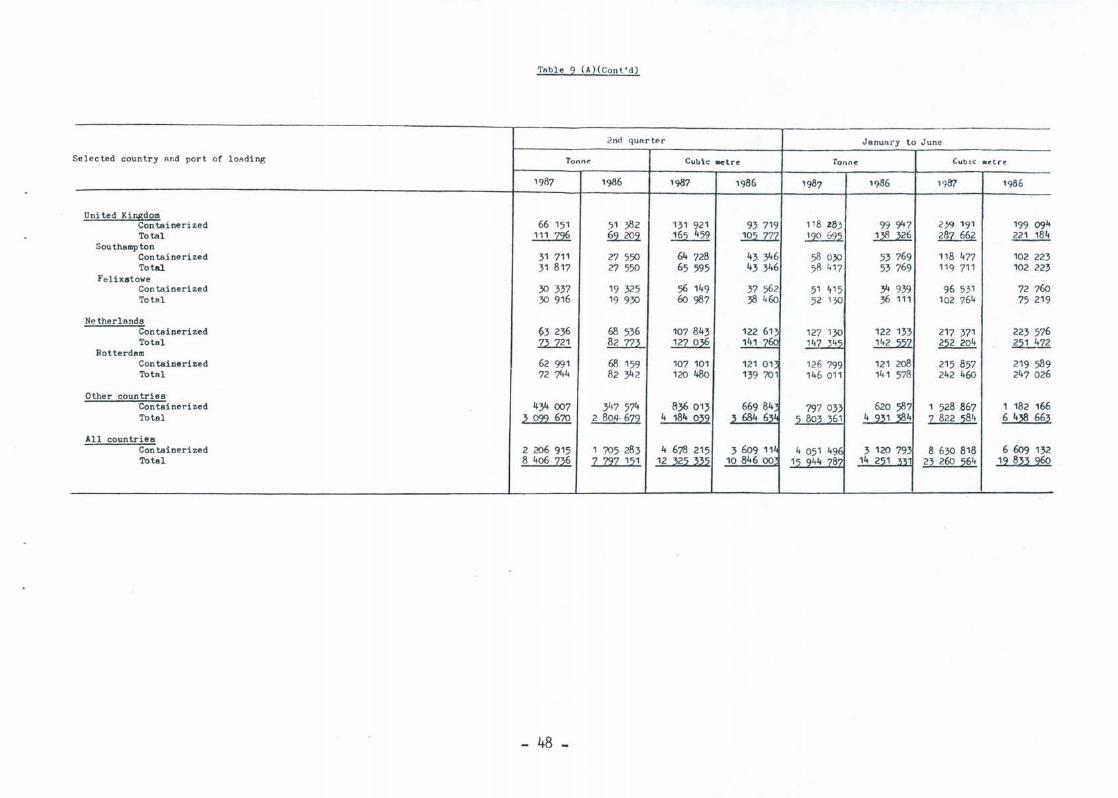
Table 9 (A)( Cont'd )
2nd qUArter January to June
Se l ected country And port of lOAding Tonne Cubic lIItCtre t onne CublC .~tre
1987 1986 1987 1986 1987 1986 1987 1986
Uni ted Kingdom Containeri zed 66 151 51 38 2 131 921 93 719 118 Z83 99 947 259 191 199 094 Total ~ ~ 165 459 ..!Q.5...1Z7. 190 695 ~ 287 662 ~
Sou thamp ton Containerized 31 711 27 550 64 728 43 :;46 58 030 53 769 118 477 102 223 Total 31 817 27 550 65 595 43 346 58 417 53 769 119 711 102 223
Fe lixatowe Con tainerized 30 337 19 325 56 149 37 562 51 ~1 5 :;4 939 96 531 72 760 Total 30 916 19 930 60 987 38460 52 130 36 111 102 764 75 219
Ne therlands Con tainerized (i3 236 68 536 107 843 122 613 127 130 122 133 217 371 223 576 Total .ll....m. ~ ~ 141 7&:' 147 345 ~ 252 204 m....lli -Rotterdam Con tainerized 62 991 68 159 107 101 121 01" 126 799 121 208 215 857 219 589 Total 72 744 82 :;42 120 480 139 701 146 011 141 578 242 460 247 026
Other countries Containerized 4:;4007 :;47 574 836 013 669 84 797 033 620 587 1 528 .867 1 182 166 Total ~ Q22 670 2 804- 6Z;l 4 184 O~;l .3 61)4 63L 5 803 361 4 'H1 384 Z 822 ~84 6 4~ 66~
All countries Con tainerized 2 206 915 1 705 283 4 678 215 3 609 11L 4 051 49E 3 120 79~ 8 630 818 6 609 132 Total 8 406 Z~6 Z 'l1Z 1~1 12 ~2~ ~~~ 10 846 00 15 944 78? 14 251 33-' 23 -260 ~64 12 8~~ 960
- 48 -
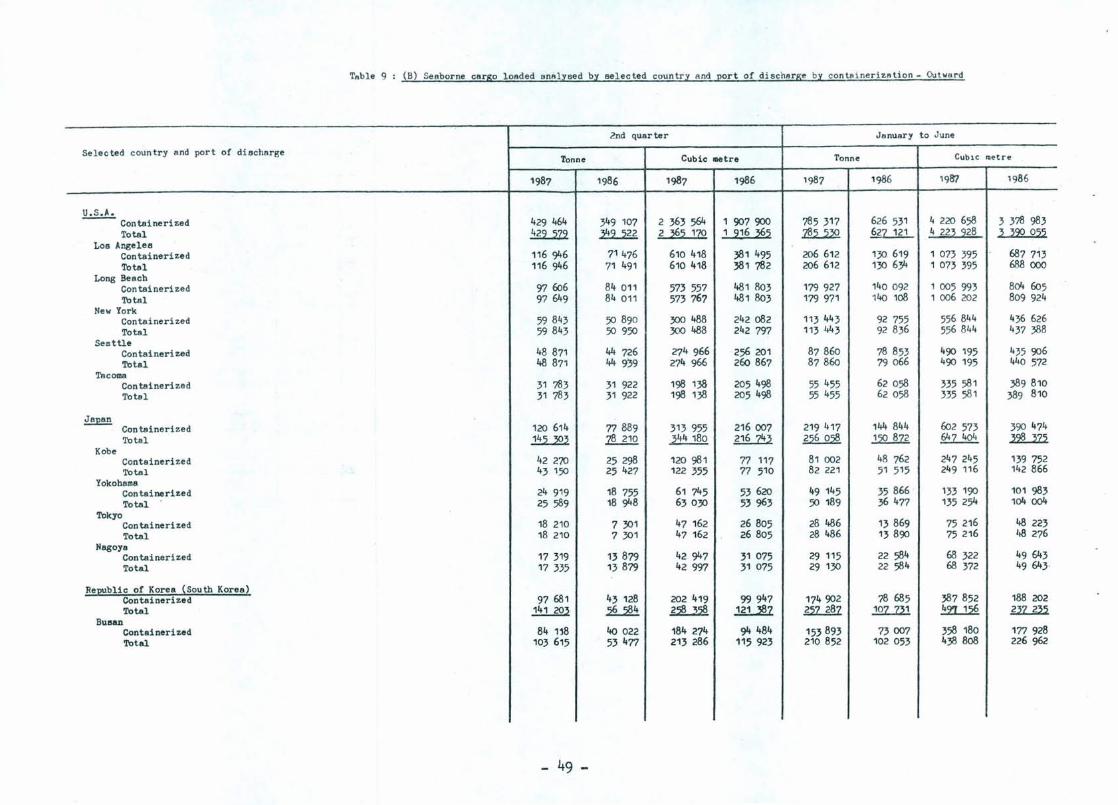
TAble 9 (Bl Seaborne cargo loaded anillysed by selected country and port of discharge by contai nerizAtion - Out ward
2nd quarter January to June
Se lected country and port of discharge Tonne Cubic metre Tonne CUbiC ruetre
1987 1986 1987 1986 1987 1986 1987 1986
.l!d:h Containerized 429 464 349 107 2 363 564 1 907900 785 317 626 531 4 220 658 3 378 983 Total ~ ~ 2 ~:2 1ZQ 1 216 ~:2 :&u2Q 62Z 121 4 22~ 228 3 320 0:2:2
Los Angeles Containerized 116 946 71 476 610 418 381 495 206 612 130 619 1 073 395 687 7';3 Total 116 946 71 491 610 418 :581 782 206 612 130 634 1 073 395 688 000
Long Beach Con tai neri zed 97606 84 011 573 557 481 803 179 927 140 092 1 005 993 804 605 Total 97649 84 011 573 767 481 803 179 971 140 108 1 006 202 809 924
New York Containerized 59 843 50 890 300 488 242 082 113 443 92 755 556 844 436 626 Total 59 843 50 950 300 488 242 797 113443 92 836 556 844 437 388
See ttle Containerized 48 871 44 726 274 966 256201 87860 78 853 490 195 435 906 Total 48 871 44 939 274 966 260 867 87860 79 066 490 195 440 572
Tacoma Con tainerized 31 783 31 922 198 138 205498 55 455 62058 335 581 389 810 Total 31 783 31 922 198 138 205 498 55 455 62 058 335 581 389 810
Japan 120 614 Con tainerized 77889 313 955 216007 219 417 144 844 602 573 390 474
Total ~ 1!U.!Q. 344180 ~ ~ ~ 64Z 404 ~ Kobe
Containerized 42 270 25298 120981 77 117 81 002 48 762 247 245 139 752 Total 43 150 25 427 122 355 77 510 82 221 51 515 249 116 142 866
Yokohama Containerized 24 919 18 755 61 745 53620 49 145 35 866 · 133 190 101 983 Total 25 589 18 948 63030 53 963 50 189 36 477 135 254 104 004
Tokyo Containerized 18 210 7 301 47 162 26 805 28 486 13 869 75 216 48 223 Total 18 210 7 301 47 162 26805 28 486 13890 75 216 'IB 276
Nagoya Containerized 17 319 13879 42 947 31 075 29 115 22 584 68 322 49643 Total 17 335 13879 42 997 31 075 29 130 22 584 68 372 49643
Republic of Korea (South Korea) Containerized 97681 43 128 202 419 99 947 174902 78 685 387 852 188 202 Total 141 203 ~ ~ ~ m.1§1 .12.Z..1.ll ~ m...m
Buaan Containerized 84 118 40 022 184 274 94 484 153 893 73007 358 180 177 928 Total 103 615 53477 213 286 115 923 210 852 102 053 438 808 226 962
- 49 -
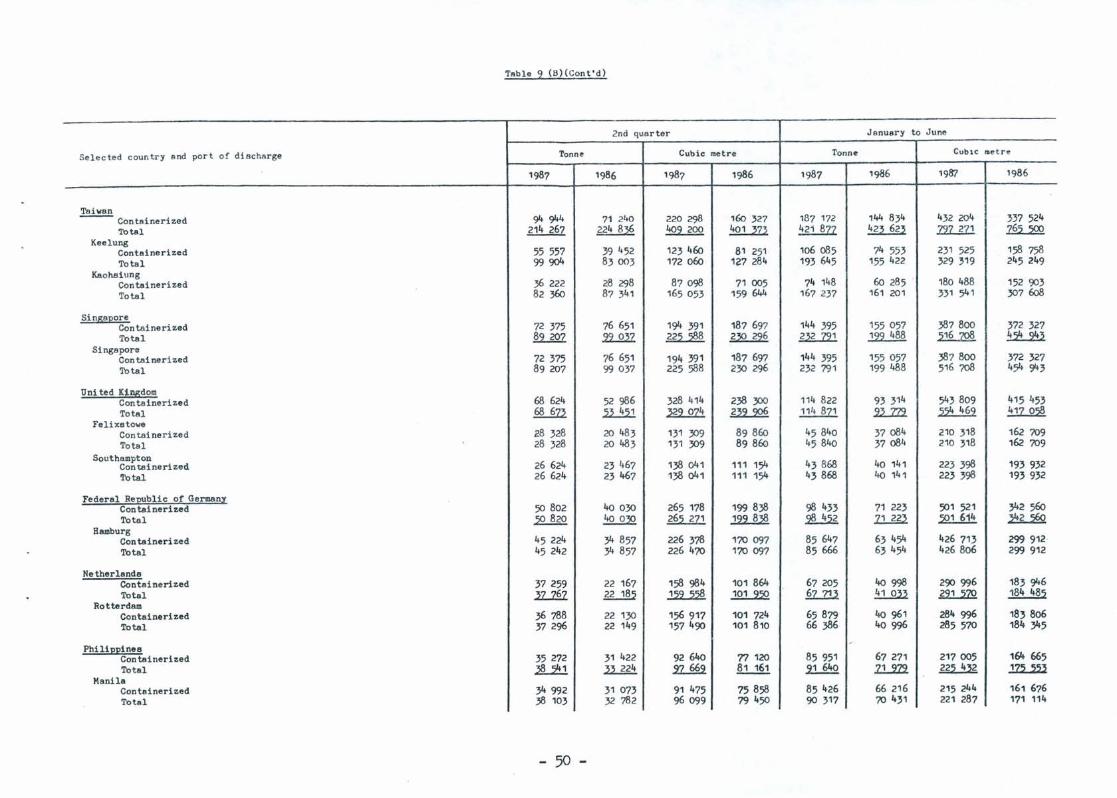
T"ble 9 (B)(Cont'd)
2nd qu"rter January to June
Selected country and port of discharge Tonne Cubic metre Tonne CUblC nu~t r~
1987 1986 1987 1986 1987 1986 1987 1986
~ 94 944 220 298 144 834 432 204 Containerized 71 240 160 327 187 172 337 524 Total 214 267 ~ 409 200 ~ ~ ~ 1J1.....1:D. ~
Keelung Containerized 55 557 39 452 123 460 81 251 . 106 oB5 74 553 231 525 158 758 Total 99904 83003 172 060 1~7 28" 193 6"5 155 422 329 319 245 249
Kaohsiung Containerized 36 222 28 298 87098 71 005 74 148 60 285 180 "88 152 903 Total 82 360 87 341 165 053 159 644 167 237 161 201 331 541 307 608
Singapore Containerized 72 375 76 651 194 391 187 697 144 395 155 057 387800 372 327 Total ~ .29..22Z ~ ~ ~ ~ ~ ~
Singapore Con tai nerized 72 375 76 651 194 391 187 697 144 395 155 057 387800 372 327 Total 89207 99 037 225 588 230 296 232 791 199 488 516 708 454 9'+3
Uni ted Kingdom Containerized 68 624 52 986 328 414 238 300 114 822 93 314 543809 415 453 Total ~ ~ ~ m2 ~ .2.L'Z'Z2 ~ ~
Felixsto"e Con tai ne ri ze d 28 328 20 483 131 309 89860 45840 37 oB" 210 318 162 709 Total 28 328 20 483 131 309 89860 45 8'+0 37 oB4 210 318 162 709
Southampton 26 624 23 467 138 041 43 868 223398 Con tainerized 111 154 '+0 141 193 932
'I'otal 26 624 23 467 138041 111 154 43868 '+0 1" 1 223 398 193 932
Federal Republic of Germany Con tai nerized 50 802 '+0 030 265 178 199 838 98 433 71 223 501 521 342560 Total ~ ~ M.m ~ ~ 1.Lm ~ ~
Hamburg Containerized 45 224 34 857 226 378 170 097 85 647 63454 426 713 299 912 · Total "5 242 34 857 226 470 170097 85 666 6345" 426806 299 912
Netherlands Containerized 37 259 22 167 158 984 101 864 67205 '+0998 290996 183 946 Total l1..:1£1. 22 185 ~ ~ §.:Z....Zll ll..W. ~ 184 485
Rotterdam Containerized 36 788 22 130 156 917 101 724 65879 40 961 284 996 183 806 Total 37296 22 149 157 490 101 810 66 386 40 996 285 570 184 345
Philippines Con teinerized 35 272 31 422 92 640 71120 85 951 67271 217005 164 665 Total ~ ..llEi ~ 81 161 91 640 1UZ2. ~ .!22..ID
Manila Containerized 34992 31 073 91 "75 75858 85426 66 216 215 24" 161 676 Total 38 103 32 782 96099 79450 90 317 70 431 221 287 171 114
- 50 -
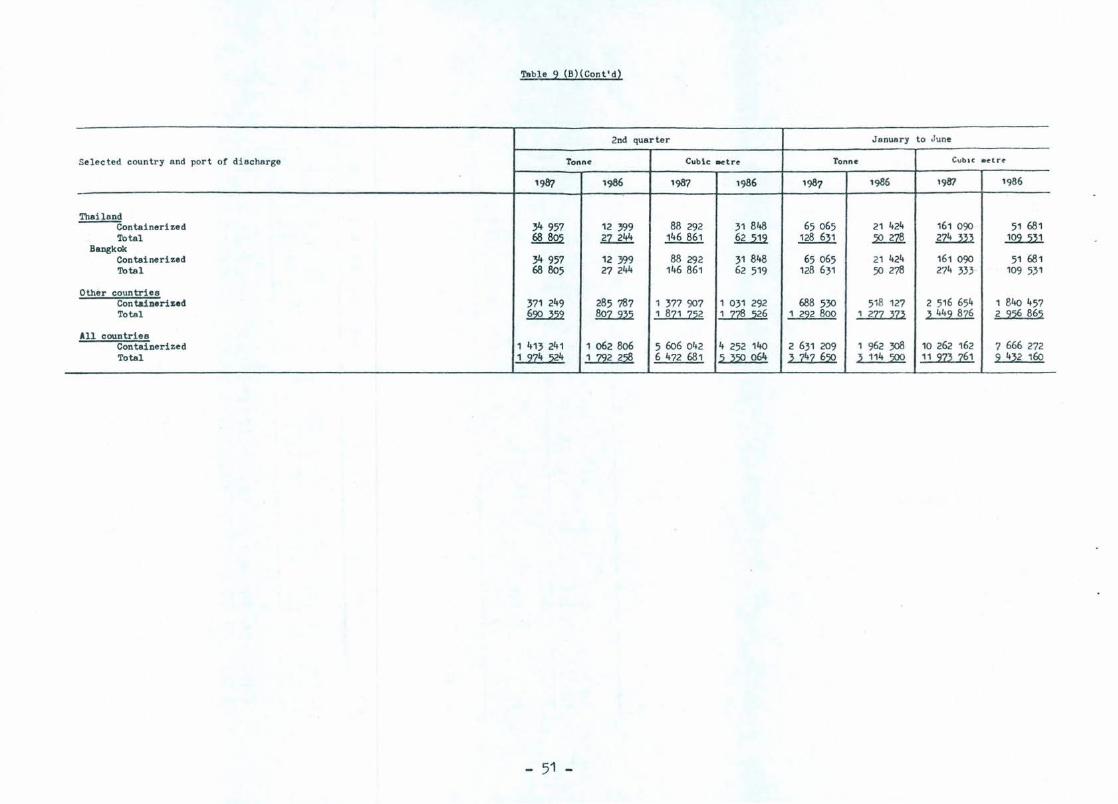
Table 9 (B)(Cont'd)
2nd quarter January to .June
Selected country and port of discharge Tonne Cubic _tre Tonne Cubic .e"tr~
1987 1986 1987 1986 1987 1986 1987 1986
Thailsnd Containerized ~ 957 12 399 88 292 31 848 65065 21 424 161 090 51 681 Total 68 805 27 244 .1'!.U§l ~ 128 631 .2U1§. ~ 2Q2....ill
Bangkok Containerized ~ 957 12 399 88 292 31 848 65 065 21 424 161 090 51 681 Total 68 805 27244 146 861 62 519 128 631 50 278 274 333- 109 531
Other countries Containerized 371 249 285 787 1 377 907 1 031 292 688530 518 127 2 516 654 1 840 457 Total ~ ~ 1 8Z1 Z:22 1 zZ§ :226 1 222 800 1 2ZZ :m ~ 442 8Z6 2 2:26 86:2
All countries Containerized 1 413 241 1 062 806 5606042 4 252 140 2 631 209 1 962 308 10 262 162 7 666 272 Total 1 2Z4 :24 1 222 22§ 6 472 681 :z ~:2Q 064 ~ Z4Z 6:2Q ~ 114 :2QQ 11 2Z~ Z61 2 4~2 160
- 51 -
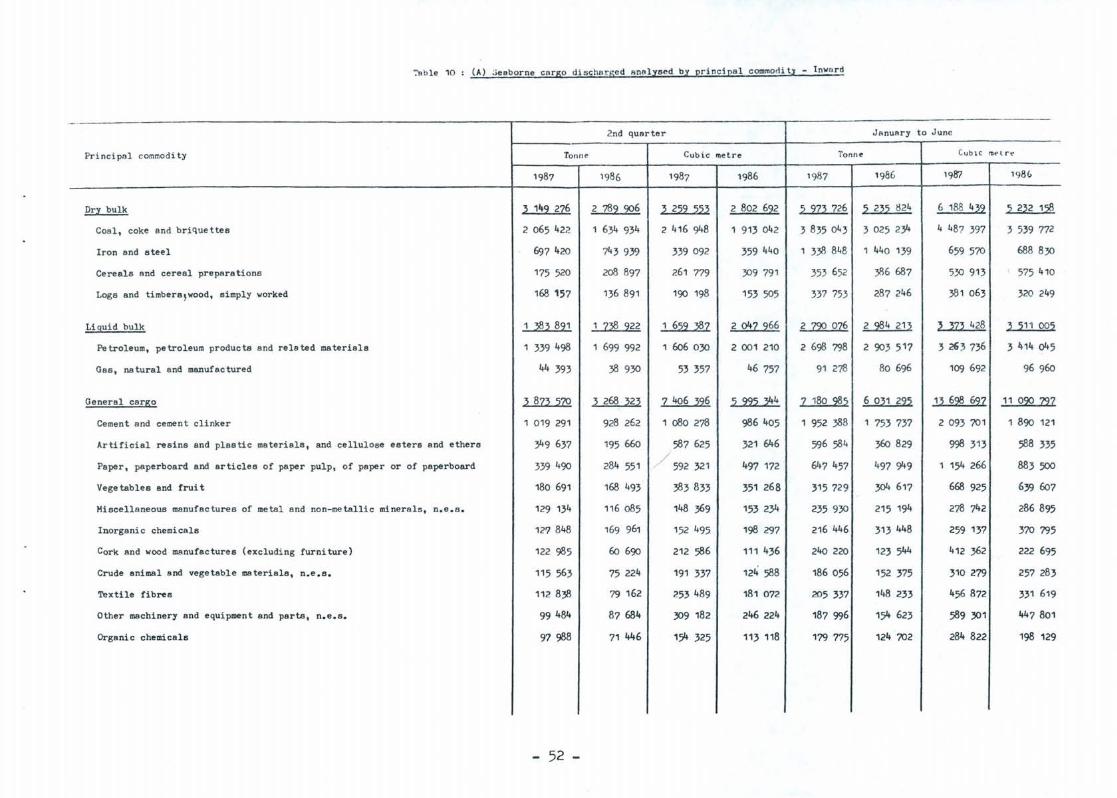
':'able 10 (A) Seaborne carBO discharsed analysed by principal commodi ty - Inward
- '
2nd quarter January to June
Principal commodity Ton ne Cubic metre l'onn~ CUb lC i'Ut" t rt"
1987 1986 1987 1986 1987 1986 1987 198<-
Dr:£ bulk ~ 1"2 226 2 782 226 ~ 2:22 :2:2~ 2 802 622 :2 22~ 226 :2 2~:2 tl24 6 188 4~2 :2 2~2 1:2§
Coal, coke and brique ttes 2 065 422 1 634 934 2 416 948 1 913 042 3 835 043 3 025 234 4 487 397 3 539 772
Iron and steel 697 420 743 939 339 092 359 440 1 338 848 1 440 139 659 570 688830
Cereals and cereal prepara tions 175 520 208 897 261 779 309 791 353 652 386 687 530 913 I 575 410
Logs and timbera!wood, simply worked 168 157 136 891 190 198 153 505 337 753 287 246 38 1 063 320 249
Liguid bulk 1 ~~ 821 1 2~ 222 1 6:22 ~2 2 042 266 2 :lZQ 026 2 2§4 2 1 ~ , ~2~ 428 ~ :2 11 00:2
Petroleum, petroleum products and related materials 1 339 498 1 699 992 1 606030 2 001 210 2 698 798 2 903 5 17 3 26 3 736 3 414 045
Gss, natursl snd manufactured 44 393 38 930 53 357 46 757 91 278 80 696 109 692 96960
General csrs;o ~ 82~ :2Z2 ~ 268 ~2~ 2 406 ~26 :2 22:2 ~4 2 180 2§:2 6 0~1 22:2 1~ 62§ 622 11 022 'l22
Cement and cemen t clinker 1 019 291 928 262 1 080 278 986405 1 952 388 1 753 737 2 093 701 1 890 121
Artificial resins and plastic materials, and cellulose esters and ethers 349 637 195 660 587 625 321 646 596 584 360 829 998 313 588 335 /
Paper, paperboard and articles of paper pulp, of paper or of paperboard 339 490 284 551 / 592 321 497 172 647457 497 949 1 154 266 883 500
Vege tables and frui t 180 691 168 493 383833 351 268 315 729 304 617 668 925 639 607
Miscellaneous manufac tures of metal and non-metallic minerals, n.e.s. 129 134 116 085 148 369 153 234 235 930 215 194 278 742 286 895
Inorganic chemicals 127 848 169 961 152 495. 198 297 216 446 313 448 259 137 370 795
Cork and wood manufactures (excluding furniture) 122 985 60 690 212 586 111 436 240 220 123 544 412 362 222 695
Crude animal and vegetable materials, n.e.s. 115 563 75 224 191 337 124 588 186 056 152 375 310 279 257 283
Textile fibres 112 838 79 162 253489 181 072 205 337 148 233 456 872 331 619
Other machinery and equipment and parts, n.e.s. 99 484 87684 309 182 246 224 187 996 154 623 589 301 447 801
Organic chemicals 97 988 71 446 154 325 113 118 179 775 124 702 284 822 198 129
- 52 -
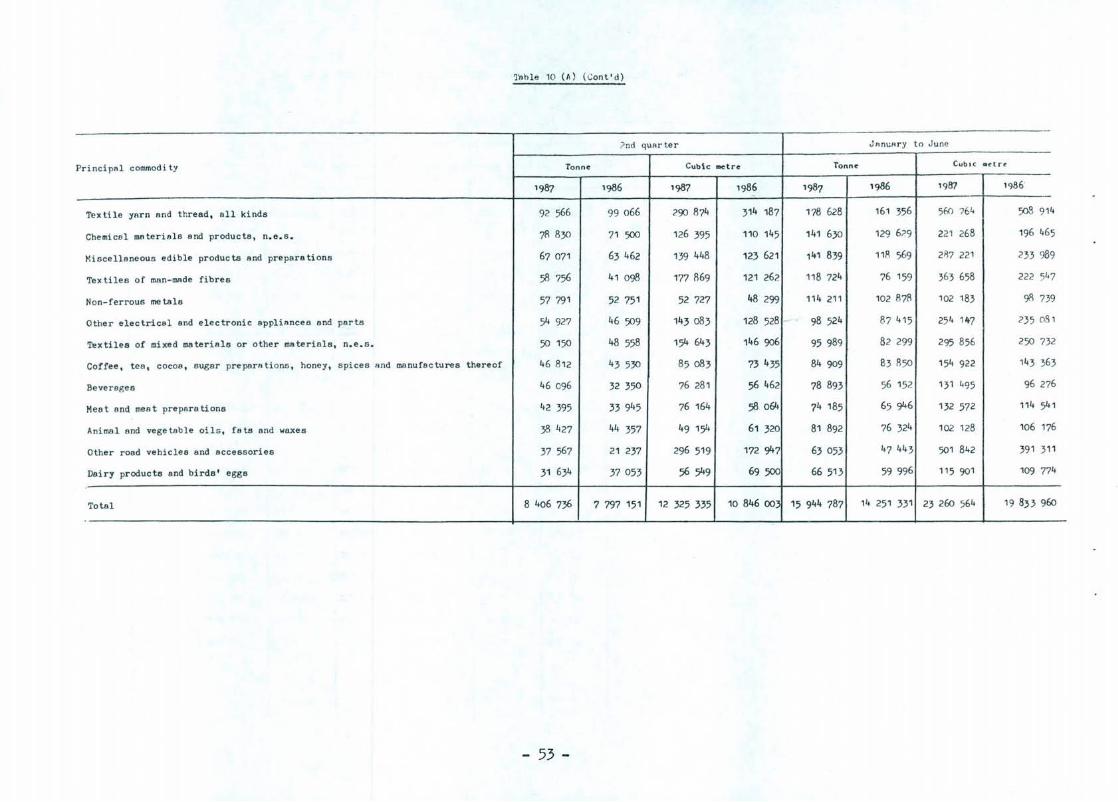
TAble 10 (A) (Cont'd)
?nd qURr te r JAnuAry to June
Principal commodity Tonne Cubic ooetre Tonne Cubac &elr~
1987 1986 1987 1986 1987 1986 1987 1986-
Textile yarn and thread, all kinds 92 566 99 066 290 874 314 187 178 628 161 356 560 764 508 914
Chemical materials and products, n.e.s. 78 830 71 500 126 395 110 145 141 630 129 6?9 221 268 196 465
Miscellaneous edible produc ts and prepara tions 67 071 63 462 139 448 123 621 11t1 839 11R 569 21\7 221 233 ')89
Textiles of man-made fibres 58 756 41 098 177 869 121 262 118 724 76 159 363 658 222 547
Non-ferrous me tels 57 791 52 751 52 727 48 299 114 211 102 878 102 183 98 739
Other electrical and electronic appliancea and parts 54 927 46 509 143 083 128 528 - 98 524 87 415 254 11t7 235 081
Textiles of mixed materials or other materials, n.e.s. 50 150 48 558 154 643 146 906 95 989 82 299 295 856 250 732
Coffee, tea, cocoa, sugar preparRtions, honey, spices and manufsctures thereof 46 812 43 530 85083 73 435 84 909 83 B50 154 922 143 363
Beverages 46 096 32 350 76 281 56 462 78 893 56 152 131 495 96 276
Mea t and meA t prepara tions 42 395 33945 76 164 58 064 74 185 65 946 132 572 114 541
Animal and vegetable oils, fa ts and wexe s 3B 427 44 357 49 154 61 320 81 892 76 324 102 128 106 176
Other road vehicles and accessories 37 567 21 237 296 519 172 947 63 053 47 443 501 842 391 311
Dairy products and birds' eggs 31 634 37 053 56 549 69500 66 51 3 59 996 115 901 109 774
Total 8 406 736 7 797 151 12 325 335 10 846 om 15 944 787 14 251 331 23 260 564 19 833 960
- 53 -
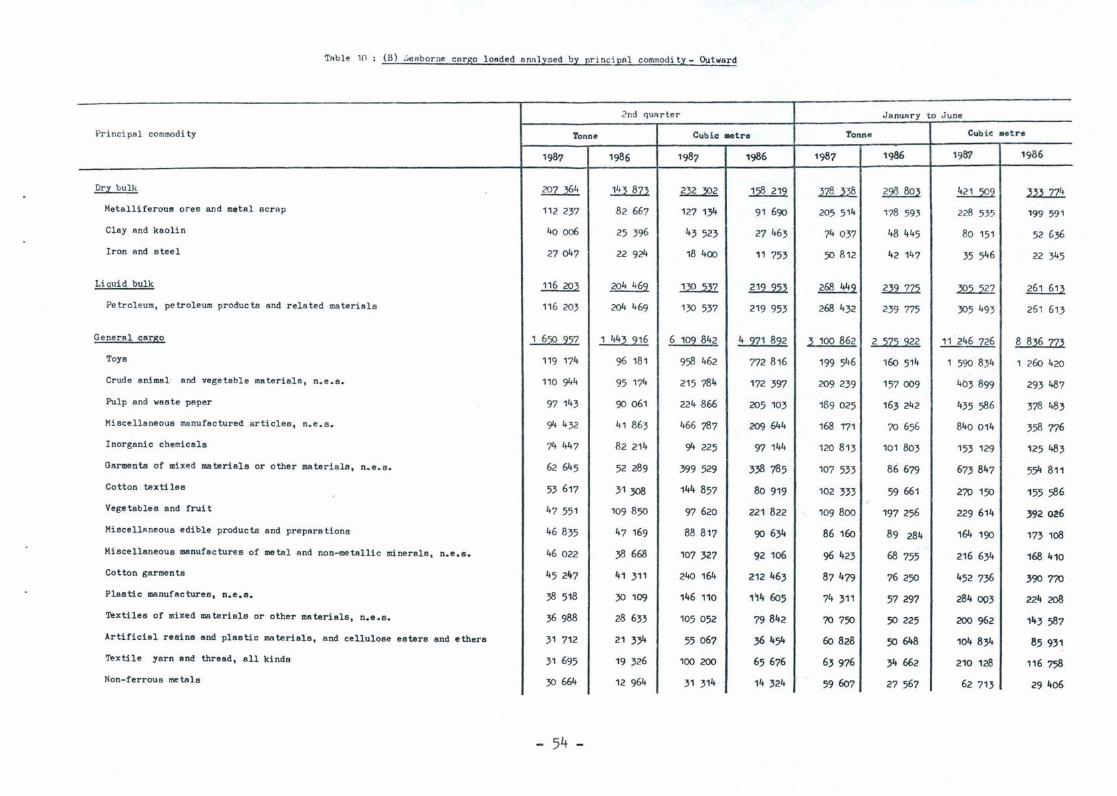
TAble 10 (B) ~enborne cargo loaded annlys ed by principnl commodity- Outward
Pri ncipal commodity
Dry bulk
Metalliferous ores and metal scrap
Clay And kaolin
Iron and s tee 1
Liquid bulk
Petroleum, petroleum products and related materials
General cargo
Toys
Crude animal' and vegetable materials, n.e.a.
Pulp and waate paper
Miscellaneous manufactured articles, n.e. s.
Inorganic chemicala
Garments of mixed materials or other materials, n.e.s.
Cotton texti les
Vegetsbles and frui t
Miscellaneous edible products and preparations
Miscellaneous manufactures of mets'l and non-metsllic minerals, n.e.s.
Cotton garmenta
Plaatic manufactures, n.e.s.
Textiles of mixed materiala or other materiala, n.e.a.
Artificial resins and plaatic materiala, and celluloae eatera and ethera
Textile yarn nnd thrend, nIl kinda
Non-ferrous me tsla
Tonne
~
112 237
40006
27047
116 203
116 203
1 650 957
119 174
110 944
97 143
94 432
74 447
62 645
53 617
47 551
46835
46 022
45 2'+7
38 518
36 988
31 712
31 695
30 664
- 54 -
2nd qURrter
Cubi c _tre
1!..l..!.tU 82 667
25 396
22 924
1 443 916
96 181
95 174
90 061
41 863
82 214
52 289
31 308
109 850
47 169
38 668
41 311
3010')
28 633
21 334
19 326
12 964
~
127 134
43 523
18 400
~
130 537
6 109 842
958 462
215 784
224866
466 787
94 225
399529
144 857
97 620
88 817
107 327
240 164
146 110
105 052
55067
100 200
31 314
1<)86
~
91 690
27 463
11 753
~
219 953
4 971 892
772 816
172 397
205 103
209 644
97 144
338 785
80 919
221 822
90 634
92 106
212 463
1'14 605
79 842
36 454
65676
14 324
JanUAry to June
Tonne
~
205 514
74 037
50 812
268 449
268 432
3 100 862
199 546
209 239
189 025
168 171
120 813
107 533
102 3~3
109800
86 160
96 423
87479
74 311
70 750
60 828
63976
59607
1<)86
~
178 593
48 445
42 147
.lli.....Z72
239 775
2 575 922
160 514
157009
163 242
70 656
101 803
86679
59 661
197 256
89 284
68 755
76250
57 297
50 225
59648
34 662
27 567
Cubi c .etre
1987
228 535
80 151
35 546
~
305 493
11 246 726
1 590 834
403 899
435 586
840 014
153 129
673 847
270 150
229 614
164 190
216 634
452 736
284003
200 962
104 834
210 128
62 713
1986
~
199 591
52 636
22 345
261 613
261 613
8 836 773
1 260 420
293 487
378 483
358 776
125 483
554 811
155 586
392 o~6
173 108
168 410
390 770
224 208
143 587
85931
116 7sB
29406
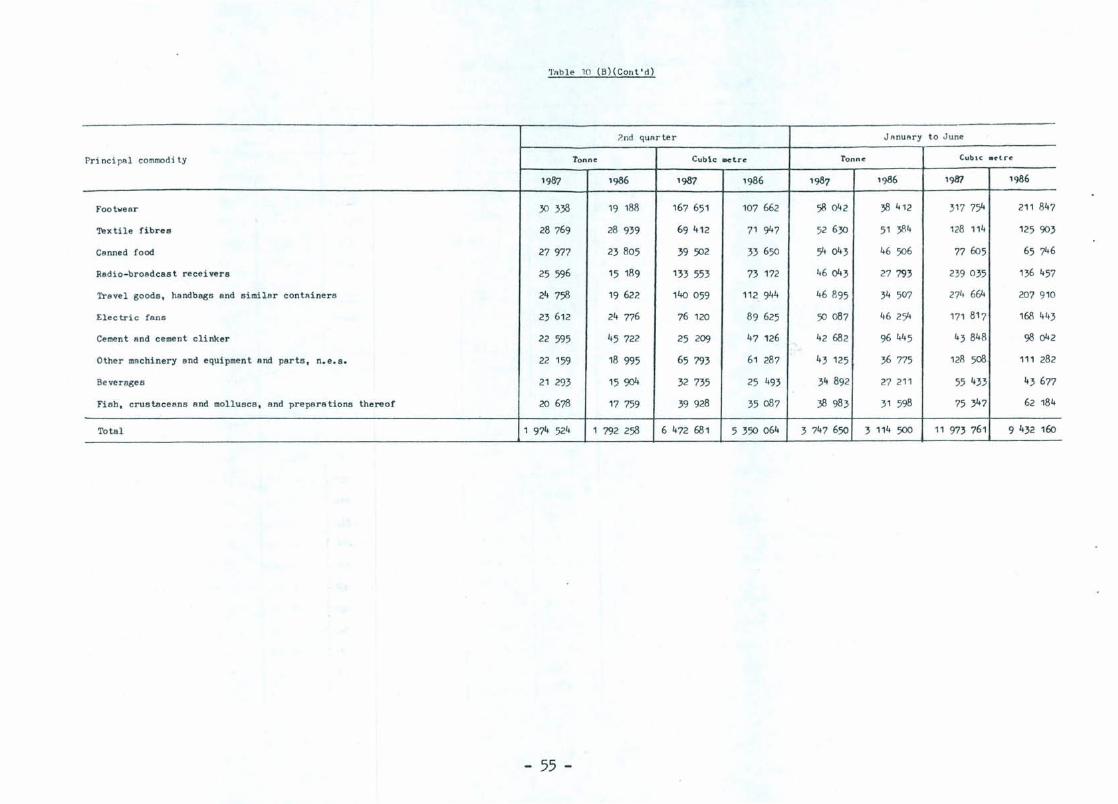
Tnb l e 10 (B)(Cont'd)
2nd qURrter J nnuery to June
Princi pAl commod ity Tonne Cubic metre tonne CUblC .etr~
1987 1986 1987 1986 1987 1986 19lfl 1986
Footwear :;0 338 19 188 167 651 107 662 58 042 3Il 412 317 754 211 847
Textile fibres 28 769 28 939 69 412 71 947 52 6:;0 51 }'\4 128 114 125 903
Ca nned food 27 977 23805 39 502 33 650 54 043 46 506 77 605 65 746
Radio-broadcast receivers 25 596 15 1119 133 553 73 172 46 043 27 793 239 035 136 457
Travel goods, handbags and sirni lar contRiners 24 758 19 622 140 059 112 944 461195 34 507 271, 664 207 910
El e c tric fans 23 612 24 776 76 120 89 625 50 087 46 254 171 817 168 443
Cement a nd cement clinker 22 595 45 722 25 209 47 126 42 682 96 445 43 848 98 042
Other ma chinery a nd equipment and parts, n.e.s. 22 159 18 995 65 793 61 287 43 125 36 775 128 508. 111 282
Beverages 21 293 15 904 32 735 25 493 34 892 27 211 55 433 43 677
Fish, crustacea ns and molluscs, and prepara tions thereof 20 678 17 759 39 928 35087 38 983 31 598 75 347 62 184
Total 1 974 524 1 792 258 6 472 681 5 350 064 3 747 650 3 114 500 11 973 761 9 432 160
- 55 -
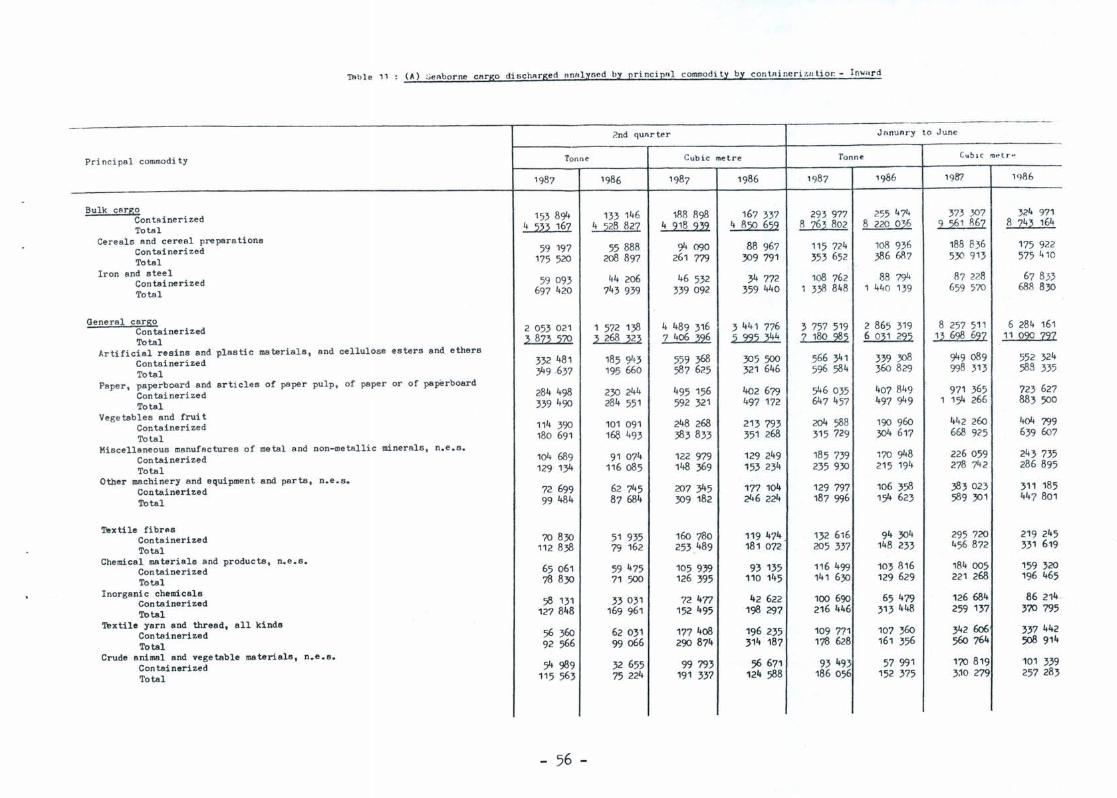
Thble 11 (A) ~eAborne carso dischArged Ana lysed by princip .. l commodity by contnincri zulior - Inward
2nd 'lunr ter JonuAr'Y to June
Principal commodity Tonne Cubic metre Tonne Cub Ic m~t r~
1987 1986 1987 1986 1987 1986 198'7 1986
Bulk cargo Containerized 153 894 133 146 188 898 167 337 293 977 255 474 373 307 324 971
Total 4 ~~ 16Z 4 :228 82Z 4 218 2~2 4 822 6:22 8 Z6~ 802 8 220 03.6 2 22' R6Z 8 Z4~ 164
Cereals and cereal preparations 94 090 108 936 188 836
Containerized 59 197 55 888 88 967 115 724 175 922
Total 175 520 208 897 261 779 309 791 353 652 386 6B7 530 913 575 410
Iron and steel Containerized 59 093 44 206 46 532 34 772 108 762 88 794 87 228 67 833
Total 697 420 743 939 339 092 359 440 1 338 848 1 440 139 659 570 688830
General csrgo Con tainerized 2 053 021 1 572 138 4 489 316 3 441 776 3 757 519 2 865 319 8 257 511 6 284 161
Total ~ 8Z~ :2ZQ 3. 268 3.23. 7 406 3.26 :2 22:2 ~4 Z 180 ~:2 6 03.1 22:2 13. 6~ 6n 11 02Q Z2Z
Artificial resins and plastic materials, and cellulose esters and ethers Containerized 332 481 185 943 559 368 305 500 566 341 339 308 949 089 552 324
Total 349-637 195 660 587 625 321 646 596 584 360 829 998 313 588 335
Paper, paperboard and articles of paper pulp, of paper or of pBperboard Containerized 284 498 230 244 495 156 402 679 546 035 407 849 971 365 723 627
Total 339 490 284 551 592 321 497 172 647 457 497 949 1 154 266 883 500
Vegetables and fruit Containerized 114 390 101 091 248 268 213 793 204 588 190 960 442 260 404 799
Total 180 691 168 493 383 833 351 268 315 729 304 617 668 925 639 607
Miscellaneous manufactures of metal and non-metallic minerals, n.e.B. Containerized 104 689 91 074 122 979 129 249 185 739 170 948 226 059 243 735
Total 129 134 116 085 148 369 153 234 235 930 215 194 278 742 286 895
Other machinery and equipment and parts, n.e.B. Con tainerized 72 699 62 745 207 345 177 104 129 797 106 358 383 023 311 185
Total 99484 87684 309 182 246 224 187 996 154 623 589 301 447 801
Textile fibres Containerized 70830 51 935 160 780 119 474 132 616 94 304 295 720 219 245
Total 112 838 79 162 253 .489 181 072 205 337 148 233 456 872 331 619
Chemical materials and products, n.e.B. Containerized 65 061 59 475 105 939 93 135 116 499 103 816 184 005 159 320
Total 78830 71 500 126 395 110 145 141 630 129 629 221 268 196 465
Inorganic chemicals Containerized 58 131 33031 72 477 42 622 100 690 65479 126 684 86 214 .
Total 127 848 169 961 152 495 198 297 216 446 313 448 259 137 370 795
Textile yarn and thread, all kinds Containerized 56 360 62 031 177 408 196 235 109 771 107 360 342 606 337 442
Total 92 566 99066 290 874 314 187 178 628 161 356 560 764 508 914
Crude animal and vegetable materials, n.e.B. Containerized 54 989 32 655 99793 56 671 93 493 57 991 170 819 101 339
Total 115 563 75 224 191 337 124 588 186 056 152 375 3~0 279 257 283
- 56 -
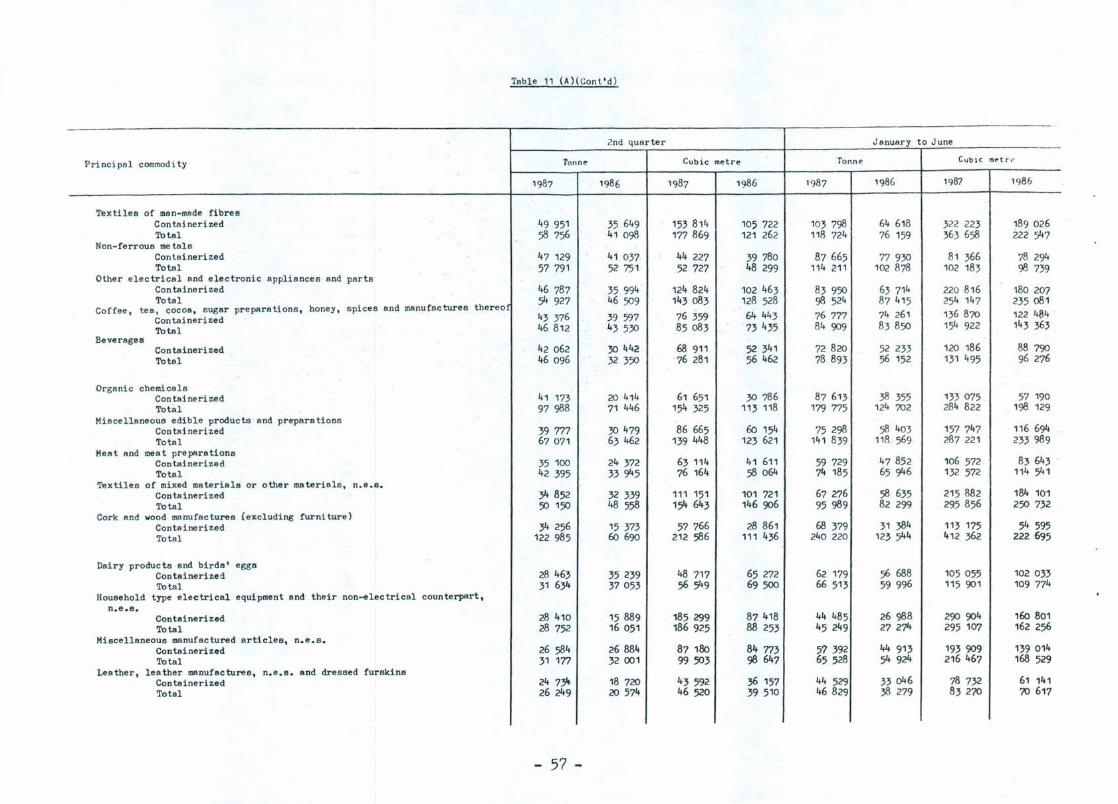
Table 11 (A)(Cont'd)
2nd quarter J "nuary to June
Principal commodity Tonne Cubic metre Tonne Cyblc f'IIe-t ri-
1987 1986 1987 1986 1987 1986 1987 1986
Textiles of man-made fibres Containerized 49951 35 649 153 814 105 722 103 798 64 618 322 223 189 026 Total 58 756 41 098 177 869 121 262 118 724 76 159 363 658 222 547
Non-ferrous me tals Containerized 47 129 41 037 44 227 39 780 87 665 77 930 81 366 78 294 Total 57 791 52751 52 727 48 299 114 211 102 878 102 183 98 739
Other electrical and electronic appliances and parts Con tainerized 46 787 35 994 124 824 102 463 83 950 63 714 220 816 180 207 Total
thereof 54 927 46 509 143 083 128 528 98 524 87 415 254 147 235 081 Coffee, tea, cocoa, sugar prepara tions, honey, s pices and manufactures.
76 359 64 443 76 777 74 261 136 870 122 484 . Contai nerized 43 376 39 ~7 Total 46 812 43530 85083 73 435 84 909 83850 154 922 143 363
Beverages Containerized 42 062 30 442 68 911 52341 72820 52 233 120 186 88 790 Total 46096 32 350 76 281 56 462 78 893 56 152 131 495 96 276
Organic chemicals Containerized 41 173 20 414 61 651 30 786 87 613 38 355 133 075 57 190 Total 97 988 71 446 154 325 113 118 179 775 124 702 284 822 198 129
Miscellaneous edible producta and preparations Containerized 39 777 30 479 86 665 w154 75 298 58 403 157 747 116 694 Total 67071 63 462 139 448 123 621 141 839 118 569 287 221 233989
Meat and meat preparations 47852 106 572 83 643 Containerized 35 100 24372 63 114 41 611 59 729
Total 42 395 33945 76 164 58 064 74 185 65 946 132 572 114 541 Textiles of mixed materials or other materials, n.e.s.
Con tainerized 34 852 32 339 111 151 101 721 67 276 58 635 215 882 184 101 Total 50150 48 558 154 643 146 906 95989 82 299 295856 250 732
Cork and wood manufactures {excluding furniture) Containerized 34 256 15 373 57 766 28 861 68 379 31 384 113 175 54 595 Total 122 985 W 690 212 586 111 436 240 220 123 544 412 362 222695
Dairy products and birds' eggs Containerized 28 463 35 239 48 717 65272 62 179 56 688 105 055 102 033 To·tal 31 634 37 053 56 549 69500 66 513 59 996 115 901 109 774
Household type electrical equipment and their non-electrical counterpart, n.e.e.
ContBinerized 28 410 15889 185 299 87 418 44 485 26 988 290904 1W 801 Total 28 752 16 051 186 925 88 253 45 249 27 274 295 107 162 256
Miacellaneous manufactured articles, n.e.s. Containerized 26 584 26 884 87 180 84 773 57 .392 44 913 193 909 139 014 Total 31 177 32001 99 503 98 647 65 528 54 924 216 467 168 529
Leather, leather manufactures, n.e.s. snd dressed furskins Containerized 24 73'1 18 720 43 592 36 157 44 529 33 046 78 732 61 141 Total 26 249 20 574 46520 39 510 46 829 38 279 83 270 70 617
- 57 -

'!'Able 11 (A)(Cont'd)
2nd qunr ter JanuRry to June
Principal commodity Tonne Cubic a.etre Tonne CUblC .t!'tre
1987 19S6 19S7 1986 19S7 19S6 198'7 1986
Plastic manufactures, n.e.s. Containerized 23 545 21 926 75 169 61 373 44 700 35 169 139 398 97 601 Total 27047 27 731 86 417 78 462 53 077 45050 166 580 128 185
Essential oils and perfume materiAls; toilet, polishing Rnd cleansing preparstions
Containerized 19404 18 286 44 017 39 780 33013 31 288 73 410 66 411 Total 21 793 27802 48 329 53 609 35 637 46 854 78 .204 90 045
Dyeing, tanning and colouring ma teriale Con tainerized 17 872 12 225 30 465 23058 30 940 24 588 53 250 43493 Total 20 488 13 564 34 258 25 402 34 747 27 514 59 17 48 693
Furniture and parte thereof Con tainerized 14 538 13 758 81 374 73 797 25 947 25 308 156 714 142 806 Total 15 4.14 14 506 86 349 78 057 27 404 26 329 164 90E 148 614
All commodi ties Containerized 2 206 915 1 705 283 4 678 215 3 609 114 4 051 496 3 120 793 8 630 818 6 609 132 Total 8 406 736 7 797 151 12 325 335 10 846 00 15 944 787 14 251 331 23 260 564 19 833 960
- 58 -

Tnhle 11 (Il) """borne cnrgo lOAded analysed by principal cOlMlodity by con·tnineriz6tion - Oqt"'''rd
2nd qUArter JnnuAry to June
Principal commodity Tonne Cubic metre Tonne CUblC Rletre
1987 1986 1987 1986 1987 1986 1987 1986
Bulk carfio Con tainerized 64 034 41 050 90 488 69 417 114 528 82 292 167 444 '38 836
Total ~ ~ ~ 2Z§...m 646 787 ~ 'E1...2)§. 292l§1
Metalliferous ores and metal scrap Containerized 27290 21 275 36 148 32 296 45 937 41 056 61 764 62 187
Total 112 237 82 667 127 134 91 690 205 514 178 593 228 535 199 591
General carfio Containerized 1 349 207 1 021 756 5 515 555 4 182 722 2 516 681 1 880 016 10 094 719 7 527 435
Total 1 6:iQ 222 1 44~ 2,6 6 102 842 4 271 892 ~ 100 862 2 272 222 11 246226 8 8~6 2~
Toys 770 372 198 573 582 782 225 596 Containerized 118 856 95 733 956 699 159 521 1 1
Total 119 174 96 181 958 462 772 816 199 546 160 514 1 590 834 1 260 420
Miacellaneous manufactured articles, n.e.s. Containerized 90 780 39 269 450 110 196 679 162 085 66 564 812 623 338 203
Total 94 432 41 863 466 787 209 644 168 171 70 656 840 014 358 776
Crude animal and vegetable materials, n.e.s. Con ta ineri zed 66 413 42 772 146 573 99790 128 829 77870 281 366 185 830
Total 110 944 95 174 215 784 172 397 209 239 157 009 403 899 293 487
Garments of mixed materials or other ma terials, n.e.s. Containerized 62 227 52 132 397 717 338 053 106 933 86 284 617 459 553 047
Total 62 645 52 21\9 399 529 338 785 107 533 86 679 673 847 554 811
Cotton textiles Con tainerized 52 384 30 333 140 931 78 322 100 518 57 528 264 693 149931
Total 53 617 31 308 144 857 80 919 102 333 59 661 270 '50 155586
Cotton garments Containerized 45 247 41 249 240 164 212 301 87 469 76 045 452 693 390 218
Total 45 247 41 ~11 240 164 212 463 87479 76 250 452 736 390 770
Inorganic chemicals Containerized 41 064 12 801 53 473 17 780 69 82C 22 809 9' 653 31 588
Total 74447 82 214 94 225 97 144 120 81 10' 803 153 129 125 483
Miscellaneous manufactures of metal snd non-metallic minerals, n.e.s. Con tainerized 40 278 3' 662 97 611 77 45' 80 16c 56 745 188 815 ,42 721
Total 46 022 38 668 107 327 92 106 96 42 68 755 216 634 168 410
Plastic mAnufacturea, n.e .s. Containerized 38 279 29 511 145 031 112 868 73 66E 56074 281 334 220 384
Total 38 518 30 109 146 110 114 605 74 31 57 297 284003 224 20B
Miscellaneous edible products and preparations Containerized 38 109 38 339 74 123 7550S 72 88 68 707 141 493 137 851
Total 46835 47 169 88 817 90 634 8(i 16<: 8928 .. 16'+ 1~ 17} 108
- 59 ' -

Table 11 (B)(Cont'd)
2nd quarter January to June
Princi p"l commodi ty Tonne Cubic metre Tonne Cubic raetre
1987 1986 1987 1986 1987 1986 198'7 1986
Ve~etahles and fruit Containerized 35756 50 773 70 088 90 262 84 318 108 407 168 287 197 518
Total 47 551 109 850 97 620 221 822 109 800 197 256 229 614 392 026 Textiles of mixed materials or other mn terials, n.e.B.
Containerized 35 301 27 665 99 B38 77 021 67 ooIl 47 939 189 175 136 668
Total 36 988 28 633 105 052 79 842 70 750 50 225 200 962 143 587 Textile yarn And threAd, all kinds
Con ta inerized 30 575 16 737 96 745 57 238 61 252 28 843 201 537 97 831 Total 31 695 19 326 100 200 65676 63 976 34 662 210 128 116 758
FootweAr Con tAineri zed 30 241 18 846 167 273 106 088 57 774 37 831 316 619 209 339 Total 30 338 19 188 167 651 107 662 58 042 38 412 317 754 211 847
Cllnned food Con tai neri zed 27 793 23 719 39 246 33524 53 786 46 276 77246 65 356 Total 27977 23 805 39 502 33650 54 043 46 506 77605 65 746
Radio-broadcast receivers Containerized 25 218 14 974 130 794 72 194 45470 27 499 235084 135 106 Total 25 596 15 189 133 553 73 172 46 043 27 793 239 035 136 457
Travel goods, handbags and similar containers Containerized 24 732 19 546 139 977 112 503 46796 34 393 274 153 207 367 Total 24 758 19 622 140 059 112 944 46 895 34 507 274 664 207910
Arti ficial resins and plastic materials, and cellulose esters And ethers Containerized 24 551 14 997 43 101 25 677 46 970 32 833 81 477 55 ge8 Total 31 712 21 334 55 067 36 454 60 828 50 648 104 834 85 931
Non-ferrous metals Containerized 23 327 7883 24994 9645 41 935 15 951 48 585 18 979 Total 30 664 12 964 31 314 14 324 59 607 27 567 62 713 29406
Electric fans Con tainerized 23 307 24 706 75404 89 388 49 747 46 162 171 048 168081
Total 23 612 24 776 76 120 89 625 50 087 46 254 171 817 168 443
BeverAges Containerized 21 109 15 295 32 448 24 519 34 527 26380 54 848 42 278 Total 21 293 159Q4 32 735 25 493 34 892 27 211 55 433 43677
BAmboo wnre, rattan ware, fern, willow and strAwloBre (excluding furni ture) Containerized 20 246 13 281 234 100 144 349 38 058 27 378 438 820 303895 Total 20 246 13 513 234 100 146 334 38 095 27 682 439 131 306 664
Fish, crustaceans and molluscs, and prepara lions thereof Containerized 19 941 17 586 38 352 34 799 38 129 30 816 73 554 60 789 Total 20 678 17759 39 928 35087 38 98~ 31 598 75 347 62 184
Printed mAtter, pictures and paintings Containerized 19 689 13987 35 115 24 970 3056 23 717 54 191 42 264
Total 20 471 14 305 36 536 25508 31 85; 24 461 56 451 43 425
Pulp nnd waste paper Containerized 18 860 9756 45 617 23 563 36848 28 609 89428 72408
Tot"l 97 143 90 061 224 866 205 103 189 02' 163 242 435 586 378 483
- 60 -
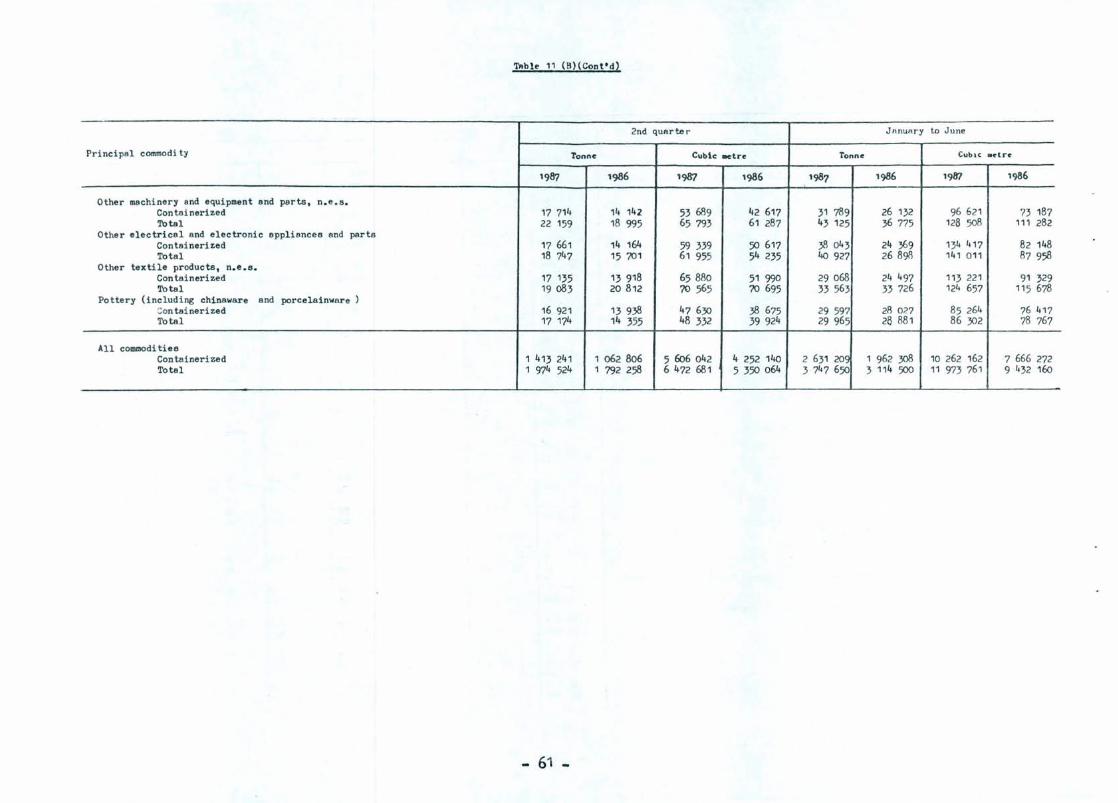
TRble 11 (B)(Cont'd)
2nd quarter JnnuAry to June
Principal commodity Tonne Cubic: _tre Tonn~ CUbiC .~tr~
1987 1986 1987 1986 1987 1986 1987 1986
Other machinery and equipment and parts, n.e.B. Con tsi nerized 17 714 14 142 53 689 42 617 31 789 26 132 96 621 73 187 Totsl 22 159 18 995 65 793 61 287 43 125 36 775 128 50B 111 282
Other electrical and electronic spplisncea snd partB Contsinerized 17 661 14 164 59 339 50 617 38 043 24 369 134 417 82 148 Total 18 747 15 701 61 955 54 235 40 927 26898 141 011 87 958
Other textile products, n.e.e. Containerized 17 135 13 918 65880 51 990 29068 24 497 113 221 91 329 Total 19 083 20 812 70 565 70 695 33 563 33 726 124 657 115 678
Pottery (including chinaware snd porcelainware ) ::on tainerized 16 921 13 938 47 630 38 675 29 597 28 027 85 264 76 417 Total 17 174 14 355 48 332 39 924 29 965 28 881 86 302 78 767
All commoditiea Containerized 1 413 241 1 062806 5 606042 4 252 140 2 631 209 1 962 3GB 10 262 162 7 666 272 Total 1 974 524 1 792 258 6 472 681 5 350 064 3 747 650 3 114 500 11 973 761 9 432 160
- 61 -
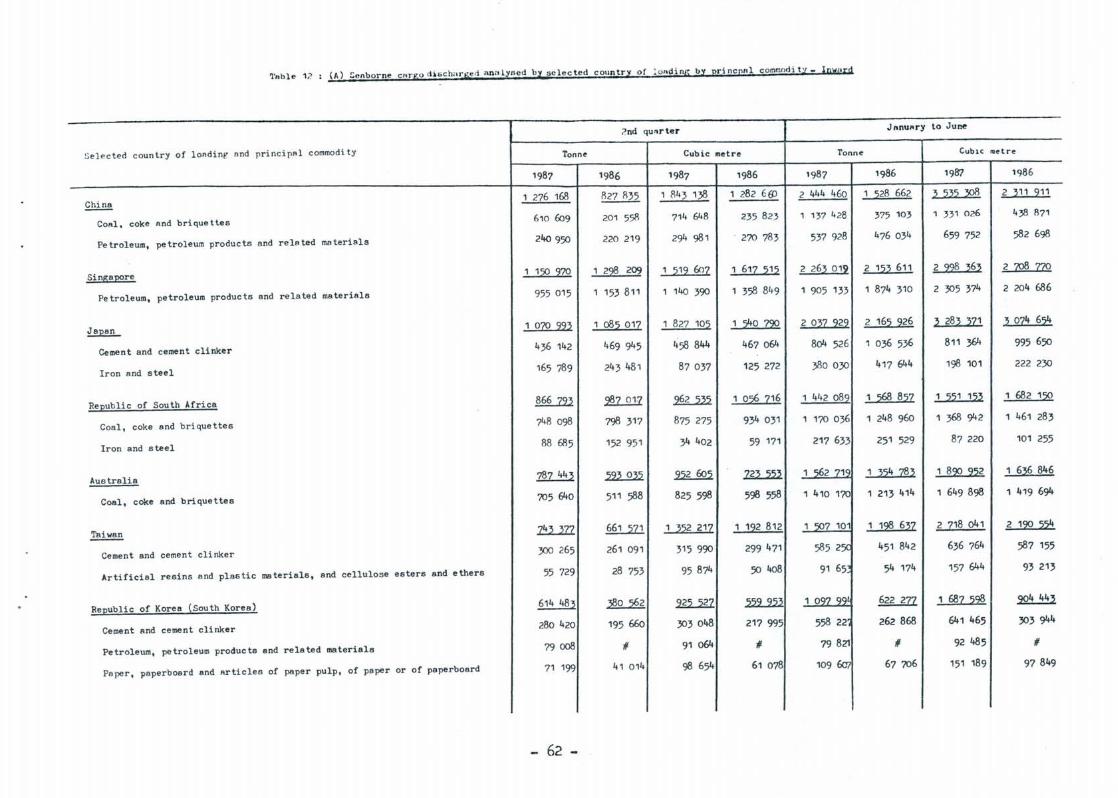
~'"ble 12 (A) :;enborne CAr 0 d'6char "e d analysed b III c ommodi t , _
2nd qu~rter JAnuAry to June
Selec ted country of londin~ and principAl commodity Tonne Cubic metre Tonne CubiC raetre
1987 1986 1987 1986 1987 1986 1987 1986
~ 1 276 168 fl27 fl35 1 fl 43 138 1 282 E(p 2 444 460 1 :22fl 662 ~ :2~:2 308 2 ~11 211
CORl, coke And brique ttes 610 609 201 551\ 714 648 235 823 1 137 428 375 103 1 331 026 438 871
Petroleum, petroleum products and relAted materials 240 950 220 219 294 981 270 783 537 928 476 034 659 752 582698
Sin!!ia~re 1 l!iQ 270 1 22§ 209 1 ~12 60Z 1 61Z :21:2 2 26~ 012 2 1:2~ 611 2 22§ ~6~ 2 ~ Z12
Petr oleum, petroleum products and rela ted materials 955 015 1 153 811 1 140 390 1 358 849 1 905 133 1 874 310 2 305 374 2 204 686
Jspan 1 012 22~ 1 08~ 01Z 1 827 10~ 1 5!!0 72Q 2 O~Z 222 2 16:2 226 ~ 28~ ~Zl ~ OZ4 65!!
Cement and cement clinker 436 142 469 945 458 844 467 064 804 526 1 036 536 811 364 995 650
Iron and steel 165 789 243 48 1 87037 125 272 380 030 417 644 198 101 222 230
Republic of South Africa §.§....ID ~ ~ 1 0:2§ Z16 1 442 082 1 :2§§ 8:2Z 1 ~:21 1:2~ 1 682 1:2Q
Coal, coke and br iquettes 74fl 098 798 317 875 275 934 031 1 170 036 1 248 960 1 368 942 1 461 283
Iron and steel 88 6fl5 152 951 34402 59 171 217 633 251 529 87 220 101 255
Australia 787 443 ~ ~ ~ 1 562 71G 1 ~:24 Z!l~ 1 82Q 2:22 1 6~6 846
Coal, coke and briquettes 705640 51 1 588 825 598 598 558 1 410 170 1 213 414 1 649 898 1 419 694
~ 1!!2...J11 ~ 1 ~:22 21Z 1 122 812 1 507 101 1 12§ 6~Z 2 Z18 041 2 12Q :2~
Cement and cemen t cli nker 300 265 261 091 315 990 299 471 585 25C 451 842 636 764 587 155
Artificial resins a nd plastic materials, and cellulose esters and ethers 55 729 28 753 95874 50408 91 65 54 174 157 644 93 213
ReIlublic of Korea (South Korea) 614 483 ~ ~ ~ 1 Oq? qql §SUIl 1 68Z:22§ ~
Cement and cement clinker 280 420 195 660 303048 217 995 558 22 262868 641 465 303 944
Petroleum, petroleum products and related materials 79008 # 91 064 # 79 821 # 92485 #
Pape r, paperboard and articles of paper pulp, of paper or of paperboard 71 199 41 014 98 654 61 078 109 6aI 67 706 151 189 97849
- 62 -
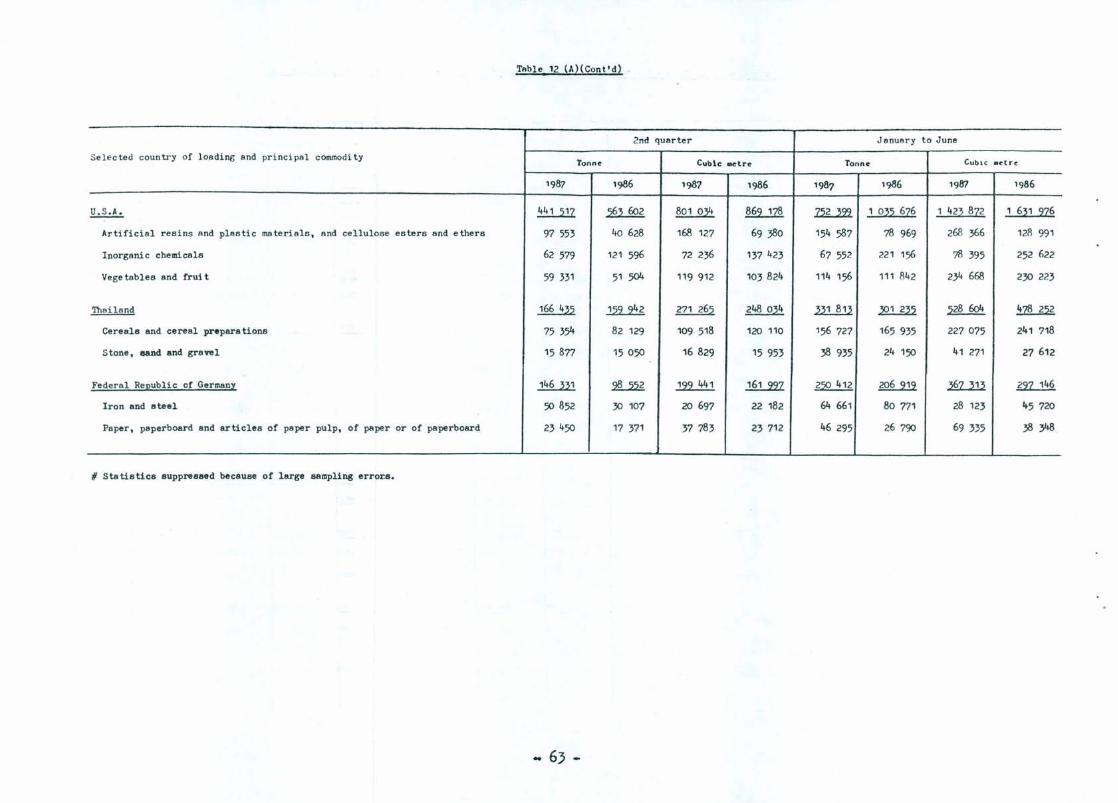
Table 12 (A)(Cont'd)
2nd quarter January to June
Se l e cted country of loading and principal commodity Tonne CUbl.c _tre Tonne CublC .~lr~
'987 '986 '987 '986 '987 1986 1987 '986
.!!..:.1:l.:. ~ ~ ~ ~ ..:z.2...l2! 1 O~~ 6Z6 1 42~ 8Z2 1 6~1 2Z6
Artificial resins and plastic msterials, And cellulose esters and ethers 97 553 40 628 168 127 69380 154 587 78 969 268 366 1211 991
Inorganic chemicals 62 579 121 596 72 236 137 423 67 552 221 156 78 395 252 622
Vege tables and fruit 59 331 51 504 119 912 103 824 114 156 111 842 234 668 230 223
Thailand ~ ~ 271 265 248 034 m!ll 19.1....lli. 528 604 ~
Cereals and cereal prepara tions 75354 82 129 109 518 120 110 156 727 165 935 227 075 241 718
Stone, sand and gravel 15877 15050 ,6 829 15 953 38 935 24 150 41 271 27 612
Federal ReEublic of German;:t: ~ ~ ~ ~ ~ ~ ~ ~
Iron and ateel 50 852 30 107 20 697 22 182 64 661 80 771 28 123 45 720
Paper, paperboard and articles of paper pulp, of paper or of paperboard 23 450 17 371 37783 23 712 46 295 26 790 69 335 38348
# Statistics SupprRssed because of large sampling errOl::S.
- 63 -
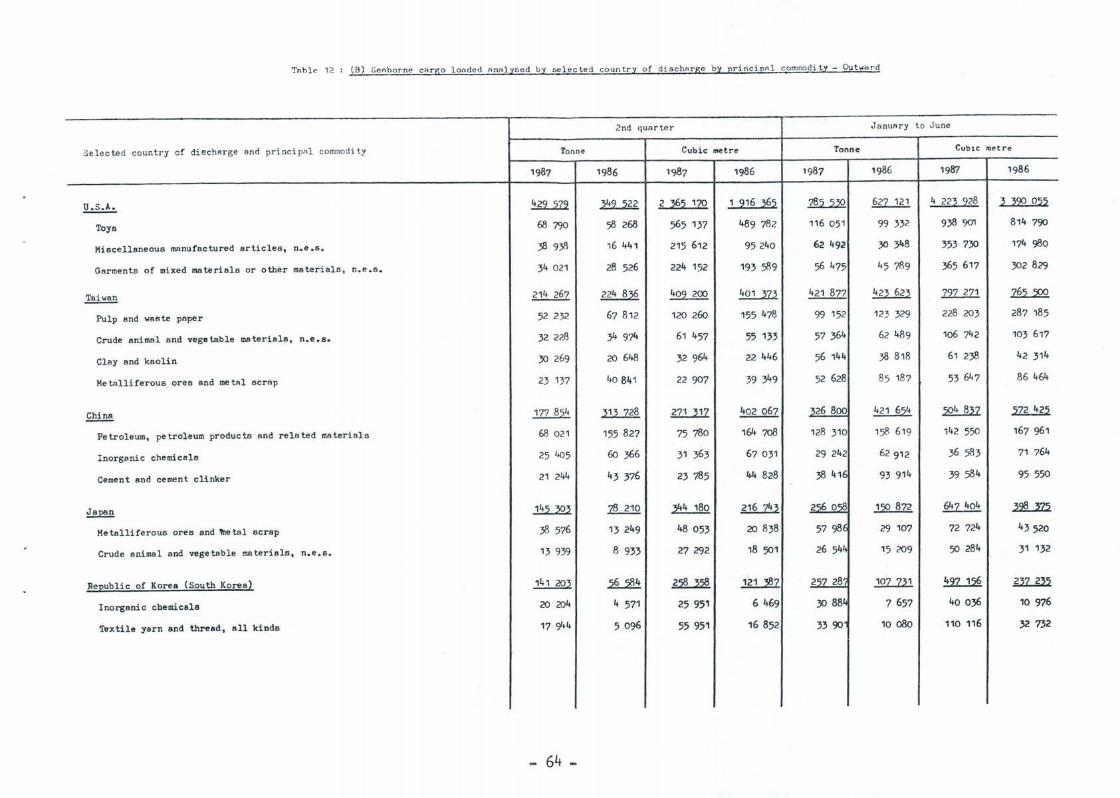
Tnbl e 12 (B ) kie nhorne cRrg o lORd e d nnnlyse d b y se l ected co un t ry o f dischArge by pri nc ipnl commod i ty - Out WHrd
2nd quarter J anuAry to June
Selec ted countr y of discha r ge and pr inci pA l commodi ty Tonn~ Cubic metre Tonne CUbiC metre
1987 1986 1987 1986 1987 1986 198'7 1986
~ ~ ~ 2 ~~ 122 1 ~,!16 ~6~ ~ 627 121 4 22~ 228 ~ ~~ 0~:2
Toys 68 790 58 268 565 137 489 782 116 051 99 332 938 901 814 790
Miscellaneous manufactured articles, n.e.s . 38 938 16 441 215 612 95240 62492 30 348 353 730 174 980
Garments of mixed materials or other materi als, n.e.B. 34 021 28 526 224 152 193 589 56 475 45 789 365 617 302829
~ 214 267 224 836 402 200 ~ 421 877 ~ 12Z....lll ~
Pulp and waste paper 52 2 )2 67 812 120 260 155 478 99 152 12) 329 228 203 287 185
Crude animal and vegetable materials, n.e.s. 32 228 34 974 61 457 55 133 57 364 62 489 106 742 103 617
Clay and kaolin 30 269 20 648 32 964 22 446 56 144 38 818 61 238 42 314
Metalliferous ores and metRl scrap 23 1) 7 40841 22907 39 349 52 628 85 187 5) 647 86 464
~ 177 854 ..lll..E.§. m..m 402067 '326800 421 654 ~ ~
Petroleum, petroleum products and related materials 68 021 155 827 75 780 164 ?08 128 310 158 61 9 142 550 167 961
Inorgsnic chemicals 25 405 60 366 31 363 67031 29 242 62 912 36 583 71 764
Cement and cement clinker 21 244 43 376 23 785 44 828 38 41l 93 914 39 584 95 550
Japan ~ .z§...£JQ ~ ~ 2% 0'58 ~ 647 404 ~
Metalliferous ores and 'lnetal scrap 38 576 13 249 48053 20 838 57 98l 29 107 72 724 43520
Crude animal and vegetable materials, n.e.6. 13 939 8 933 27292 18 501 26 544 15 209 50 284 31 132
ReEublic of Korea (South Korea2 141 203 ~ ~ .1Ul!l.Z 257 28 1Q.Z..lli ~ ~
Inorganic chemicala 20 204 4 571 25 951 6 469 30 88L 7 657 40036 10 976
Textile yarn and thread, all kinds 17 944 5 096 55 951 16852 3390 10 080 110 116 32 732
- 64 -
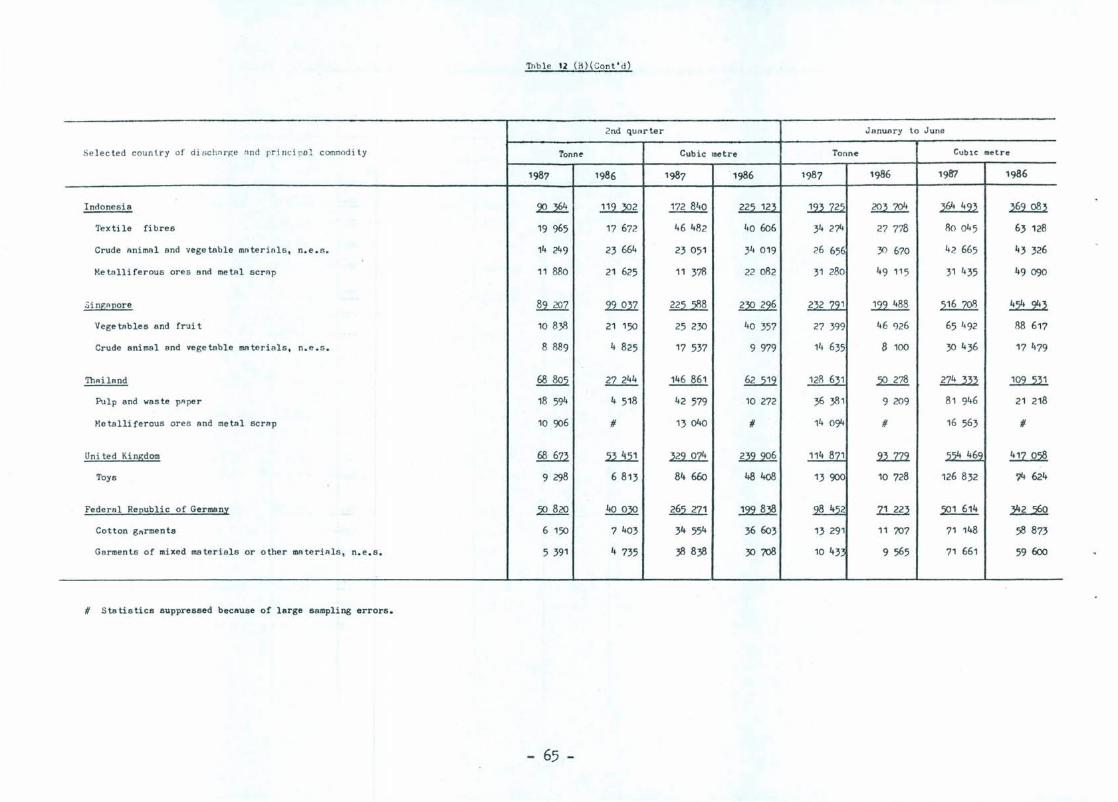
Tnb le 12 (B)( Cont'd)
2nd qUflrter J snunry to June
Selected country of dischnrf(e ~nd pr incbo l commodi ty Tonne Cubic lIIetre Tonne CUbiC lDetre
1987 1986 1987 1986 1987 1986 1987 1986
Indonesia ~ ~ 172 840 225 123 .!2l.E2 203 704 ~ ~
Textile fibres 19 965 17 672 46 482 40606 34 274 27 778 80 045 63 128
Crude animal and vege table mo teri fl l s , n.e.s. 14 249 23 664 23 051 34 019 26 656 30 670 42 665 43 326
Hetalliferous ores end metel scr"p 11 880 21 625 11 378 22 0112 31 280 49 115 31 435 49090
.3 ingREore 89 207 22..22Z ~ ~ 232 791 ~ ~ ~
Vegetnbles and frui t 10 83il 21 150 25 230 40 357 27 399 46 <)26 65 492 88 617
Crude animal and vegetable mn teri als, n.e .5. 8 889 4 825 17 537 9 979 14 635 8 100 30 436 17479
ThAiland 68 805 27244 146 861 ~ 128 631 ~ .?1!!...m. ..!Q2....lli
Pulp end waste pApe r 18 594 4 518 42 579 10 272 36 381 9209 81 946 21 218
~le telli f e rous ores end metal scrAp 10 906 # 13040 # 14 094 # 16 563 #
Uni ted Kingdom ~ .ll.lli ~ ~ 114 871 li..1l:l 554 469 ~
Toys 9 298 6 813 84 660 48408 13 900 10 728 126 832 ')4 624
Federal Reeublic of German:z: ~ .!!Q...Q2Q ~ ~ ~ 11..m ~ ~ Cotton gArmenta 6150 7403 34 554 36 603 13 291 11 707 71 148 58 873
Garments of mixed materials or other mRteriAls , n.e.B. 5 391 4 735 38838 30708 10 43~ 9 565 71 661 59600
# Statistics suppressed because of large sampling errora.
- 65 -
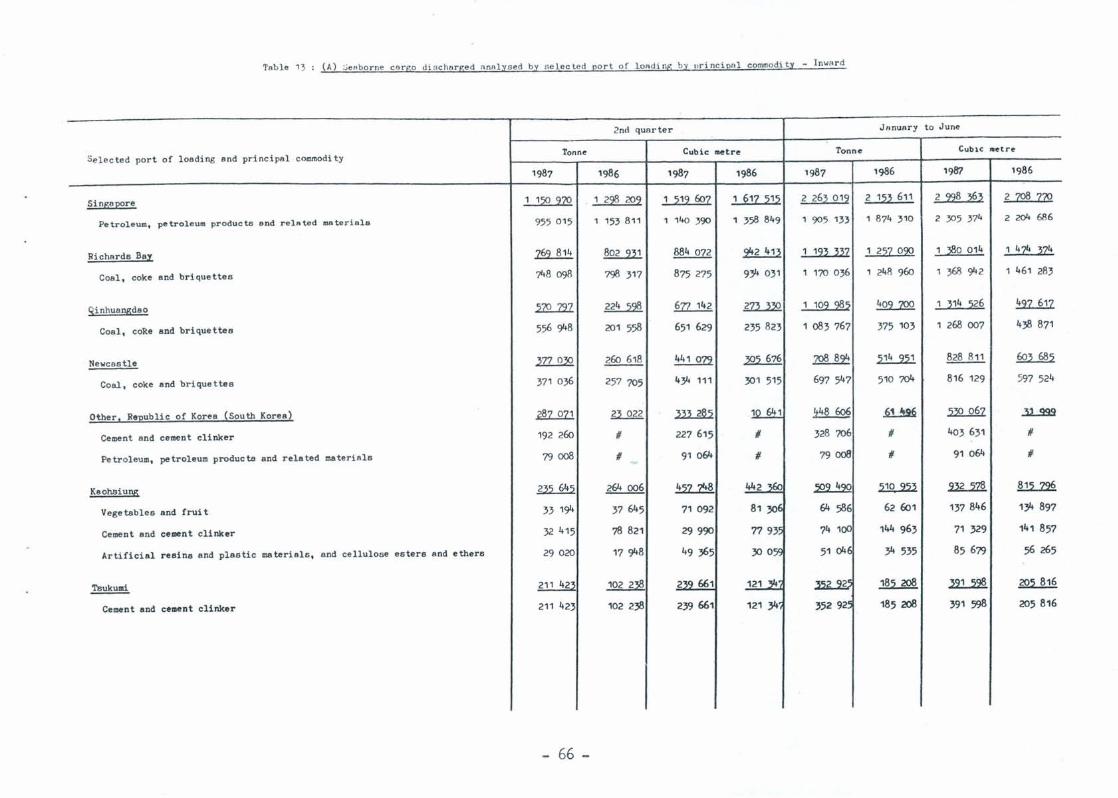
Tabl e 13 ( A) :;eabor ne ca r go di s char ged nna l ysed by s ele c ted port of londing by nrincipol commodity - I nwa r d
2nd qua rter JanuAry t o June
Selec ted port of loading and principal commodity Tonne Cubic .... tre Tonne CubiC raetre
1987 1986 1987 1986 1987 1986 198'7 1986
Singae2re 1 12Q 2ZQ , 22§ 202 , ~'2 &'12 , 2'2 ~,~ 2 262 0'2 2 1~2 611 2 228 222 2 ZQ§ 2ZQ
Petroleum, petrole um products and related materials 955 0 15 1 153 811 1 140 390 1 358 849 1 905 133 1 8 74 310 2 305 374 2 204 686
Richards BaX 1§2.Jlli. ~ 884 022 ~ 1 122 222 1 2~Z 02Q 1 ~O 014 1 4Z4 2Z4
Coal , coke and briquettes 748 091l 798 317 875 275 934 031 1 170 036 1 2411 9&'1 1 368 942 1 461 2113
Si nhua!!l!idao m..:m. ~ ~ ~ 1 102 2§2 ~ 1 214 ~26 ~
Coa l, coRe and briquettes 556 948 201 558 651 629 235 823 1 083 767 375 103 1 268007 438 871
Newcastle .2ZZ...Q2Q 2&'1 618 ~ ~ 708 824 ~ 828 8 11 ~
Coal , coke and briquettes 371 036 257 705 434 111 301 515 697 547 510 7Q4 816 129 597 524
Othe r, RSEublic o f Korea ~South Korea) .&z...QZ1 22 022 ill...&l ~ 't48 606 ~ ~ ~
Cement and cement clinker 192 2&'1 # 227 615 # 328 706 # 403 631 #
Pe t roleum, petroleum products and related ma te r i als 79008 # 91 064 # 79008 # 91 064 #
Kaohai u!!l!i ~ 264006 ~ 442 ~ ~ ~ ~ ~
Vegetablea and frui t 33 194 37645 71 092 81 30E 64 586 62 &'11 137 846 134 897
Cement and cement clinker 32 415 78 821 29990 7793' 74 100 144 963 71 329 141 857
Artificial resins and plastic materials, and cellulose esters and ethers 29020 17 948 49365 30 05'; 51 046 34 535 85679 56 265
~ 211 422 ~ 2'39 661 121 '34~ ~C;2 92' 185 208 ~ 205 816 -Cement and cement clinker 211 423 102 238 239 661 121 34 352 92' 185 208 391 598 205 816
- 66 -
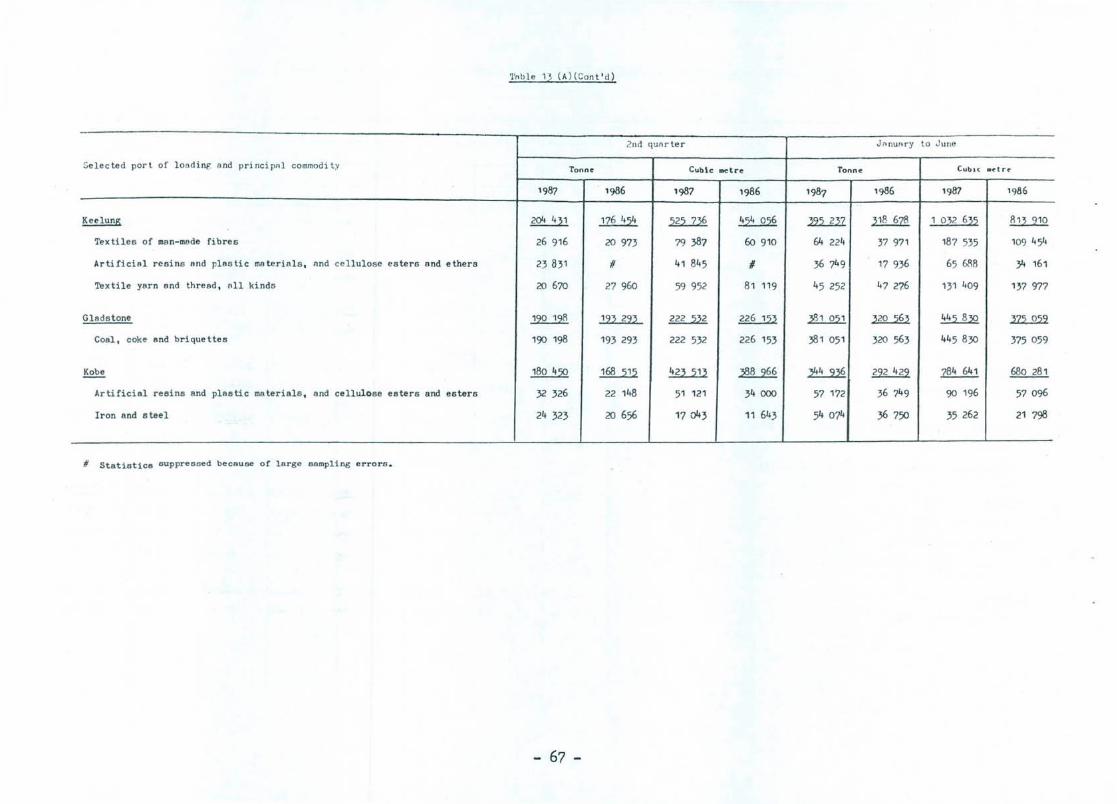
1'nbl e 13 (A) (Cant Id)
2nd qunr ter J~nunry to J une
Selected port of loading a nd principAl commadi t y Tonne Cubic .etre Tonne CUblC .~trr:
1987 1986 1987 1986 1987 1986 1987 1986
Keelung 204 431 176 454 ~ ~ 22.2...1.2Z ~ 1 ov 6~2 ~ Textiles of man-mode fibres 26 916 20 973 79 387 60 910 64 224 37 971 187 535 109 454
Artificial resins and plastic materials, and ce llulose esters and ethers 23 831 11 41 845 11 36 749 17 936 65 688 34 161
Textile yarn and thread, all kinds 20 670 27 960 59 952 81 119 45 252 47 276 131 409 137 977
Gladstone ~ 12~ 22~ ~ ~ ~ ~ ~ ~
Coal, cake and briquettes 190 198 193 293 222 532 226 153 381 051 320 563 445 830 375059
~ ~ ~ ~ ~ ~ ~ 784 641 680 281
Artificisl resins and plastic materials, and cellulose esters and esters 32 326 22 148 51 121 34000 57 172 36 749 90 196 57 096
Iron and 6 tee 1 24 323 20 656 17043 11 643 54 074 36 750 35 262 21 798
# Statistics suppress ed because of large sampling errors.
- 67 -
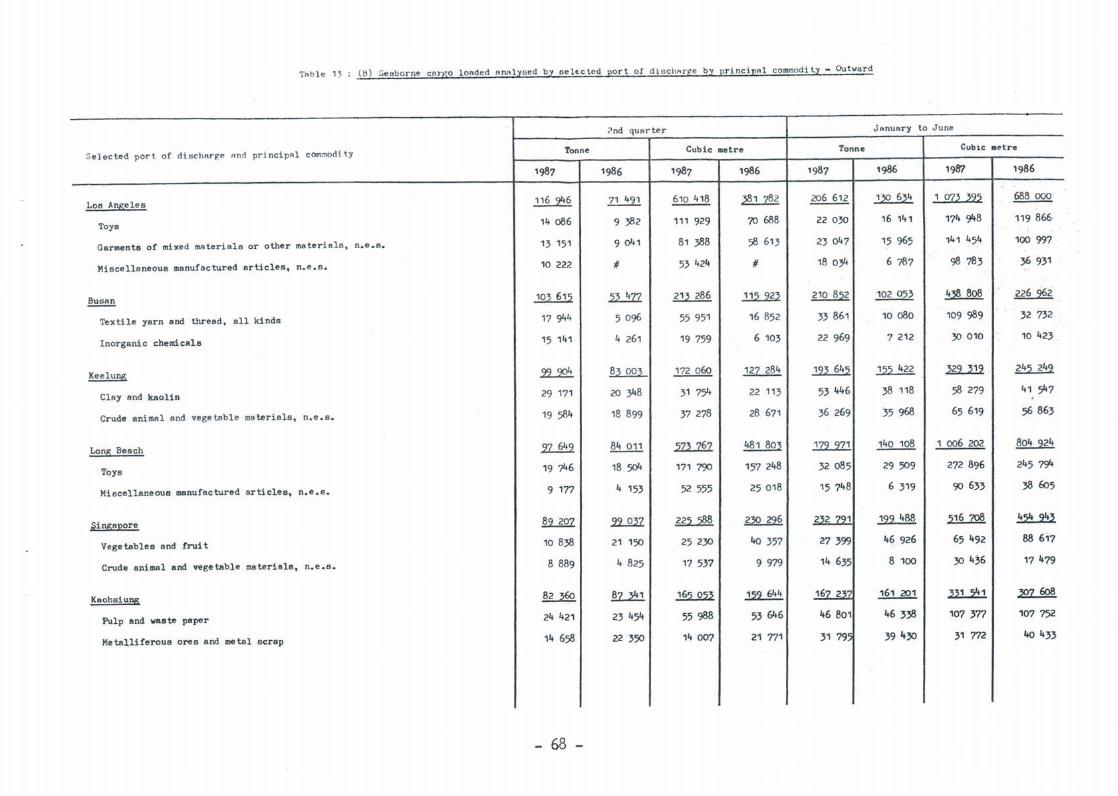
'I'Rb le 13 (B) Seaborne carBO lORded "",,lysed by selEcted port of d i s chRrge by principRl commod i ty - Outward
?nd qUArter J " nuary to June
Selected port of discllRrge Rnd principRl commodi t y Tonne Cubic .... tre Tonne CUbiC .~tre
1987 1986 1987 1986 1987 1986 1987 1986
Los A!:!£ieles ~ 71 491 610 418 ~ ~ ~ 1 0Z~ ~22 .@§....QQQ.
Toys 14086 9 382 111 929 70 688 22 030 16 141 174 948 119 866
Garments of mixed materials or other materials, n.e.B. 13 151 9041 81 388 58 613 23047 15 965 141 454 lOO 997
Miscellaneous manufactured articles, n.e.s. 10 222 # 53 424 # 18 034 6 787 98 783 36 931
~ ~ ~ 213 286 .!.12...ill. 210 852 ~ ~ 226 962
Textile yarn and thread, all kinds 17 944 5096 55 951 16 852 33 861 10 080 109 989 32 732
Inorganic chemicals 15 141 4 261 19 759 6 103 22 969 7 212 30 010 10 423
Keelung ~ .!!l...QQ.l.. 172 060 12Z 284 ~ .!22..lli ~ ~
Clay and kaolin 29 171 20 348 31 754 22 113 53 446 38 118 58 279 41 547
Crude animal and vege table ma terials, n.e. s. 19 584 18 899 37 278 28 671 36 269 35968 65 619 56 863
Long Beach ~ 84 011 m:J.§:L 481 803 .!Z2....2Zl 140 108 1 006 202 804 924
Toys 19 746 18 504 171 790 157 248 32085 29509 272 896 245 794
Miscellaneous manufactured articles, n.e.B. 9 177 4 153 52 555 25 018 15 748 6 319 90 633 38 605
lli ngaEore ~ .22...Q!l ~ ~ ~ ~ ~ ~
Vegetables and fruit 10838 21 150 25230 40 357 27399 46 926 65 492 88 6i7
Crude animal and vegetable materials, n.e.a. 8 889 4 825 17 537 9979 14 635 8 lOO 30 436 17479
Kaohsiu!!5 82 360 ~ ~ ~ 167 2~7 ~ :m...2U ~
Pulp and waste paper 24 421 23454 55 988 53646 46801 46338 107 377 107 752
Metalliferous ores and metal acrap 14 658 22 350 14 007 21 771 31 79~ 39 '+30 31 772 40 433
- 68 -
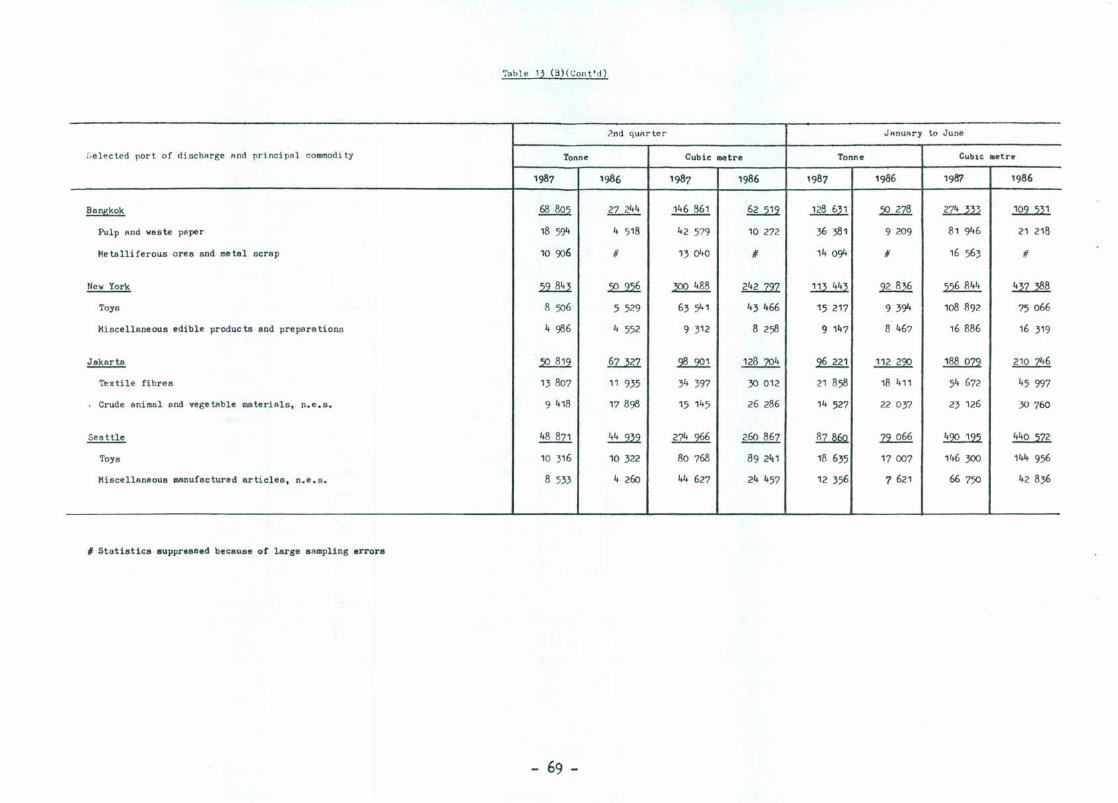
Tahl e 13 (B)( Cont' d )
2nd qUArter JAnuRry to June
,;elected port of dischArge And pr i ncipa l commodity Tonne Cubic metre Tonne CUbiC ClC!tre
1987 1986 1987 1986 1987 1986 1987 1986
Bangkok 68 805 ll2!i 146 861 ~ 128 631 ~ ll!!....lli ~ Pulp and waste paper 18 594 4 518 42 579 10 272 36 381 9 209 81 946 21 218
Metalliferous ores and metal scrap 10 9J6 # 13 040 # 14 094 # 16 563 #
New York ~ ~ ~ ~ 2ll..lli ~ ~ lli..l§.§.
Toys 8 506 5 529 63 541 43 466 15 217 9 394 108 892 75 066
Miscellaneous edible products and preparations 4 986 4 552 9 312 8 258 9 147 8 467 16 886 16 319
~ ~ §:Un ~ ~ ~ .D.U2Q. .!§.!LQZ2 210 746
Textile fibres 13 807 11 935 34 397 30 012 21 858 18 411 54 672 45 997
Crude animal and vege t8ble materials, n.e.s. 9 418 17 898 15 145 26 286 14 527 22 0 37 23 126 30 760
~ 48 871 !!!..22.2 n!!..J§.§. 260 867 ~ ~ ~ ~
Toys 10 316 10 322 80 768 89 241 18 635 17007 146 300 144 956
Miscellaneous manufa ctured articles , n. e. B. 8 533 4 260 44 627 24 457 12 356 7 621 66 750 42 836
# Statistics suppressed because of large sampli ng errors
- 69 -
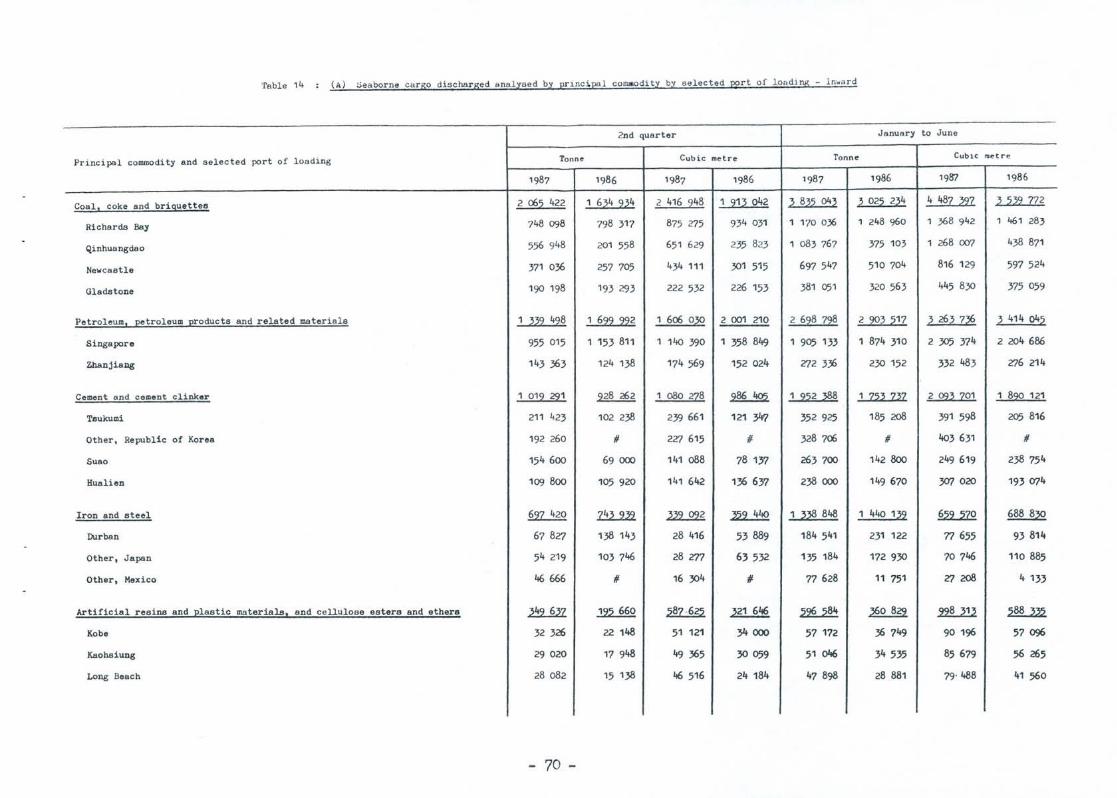
Table 14 (A) ~eaborne carBO discharged a nalysed by pri nc ~pal cOmModity by selected port of loading - Inwa rd
2nd quarter January to June
Principal commodity and selected port of loading Tonne Cubic metre Tonne CUbiC metre
1987 1986 1987 1986 1987 1986 1987 1986
Coal l coke and bri9uettes 2 C6:2 422 1 6~4 2~4 2 416 248 1 21~ 042 ~ 8~:2 04~ ~ 02:2 2~4 4 48Z ~2Z ~ :2~2 772
RichardB Bay 748 098 798 317 875 275 934 031 1 170 0}6 1 248 960 1 }68 942 1 461 283
Qinhuangdao 556 948 201 558 651 629 235 823 1 083 767 375 103 1 268 007 438 871
NewcaBtle 371 036 257 705 434 111 301 515 697 547 510 704 816 129 597 524
GladBtone 190 198 193 293 222 532 226 153 381 051 320 563 445 830 375 059
Petroleum l ~troleum products and related materials 1 ~22 428 1 622 222 1 6C6 030 2 001 210 2 628 7~ 2 223 ~17 3 262 7~ 2 414 04~
Singapore 955 015 1 153 811 1 140 390 1 358 849 1 905 133 1 874 310 2 305 374 2 204686
Zhanjiang 143 363 124 138 174569 152 024 Zl2336 230 152 332 483 Zl6 214
Cement and cement clinker 1 012 ~1 228 262 1 080 2Z8 ~ 1 2.:22 ~ 1 Z:2~ Z~Z 2 Q2~ Z01 1 82Q 121
Tsukumi 211 423 102 238 239 661 121 347 352 925 185 208 391 598 205 816
Other, Republic of Korea 192 260 # 2Zl 615 # 328 7C6 # 403 631 #
Suao 154 600 69 000 141 088 78 137 263 700 142 800 249 619 238 754
HuaHen 109 800 105 920 141 642 136 637 238 000 149 670 3Cf7 020 193074
Iron and Bteel ~ ~ ~ ~ 1 2~ 848 1 440 122 §.a2ZQ ~
Durban 678Zl 138 143 28 416 53889 184 541 231 122 77 655 93 814
Other, Japan 54 219 103 746 28 Zl7 63532 135 184 172 930 70746 110 885
Other, Mexico 46 666 # 16 304 # 77 628 11 751 Zl208 4 133
Artificial resins and plastic materialsa and cellulose esters and ethers ~ .J.22..§§.2 ~ 221 646 ~ ~ ~ ~
Kobe 32326 22148 51 121 34000 57 172 36 749 90 196 57096
Kaohsiung 29 020 17 948 49 365 30 059 51 046 34535 85679 56 265
Long Beach 28082 15 138 46 516 24 184 47 898 28 881 79 ' 488 41 560
- 70 -
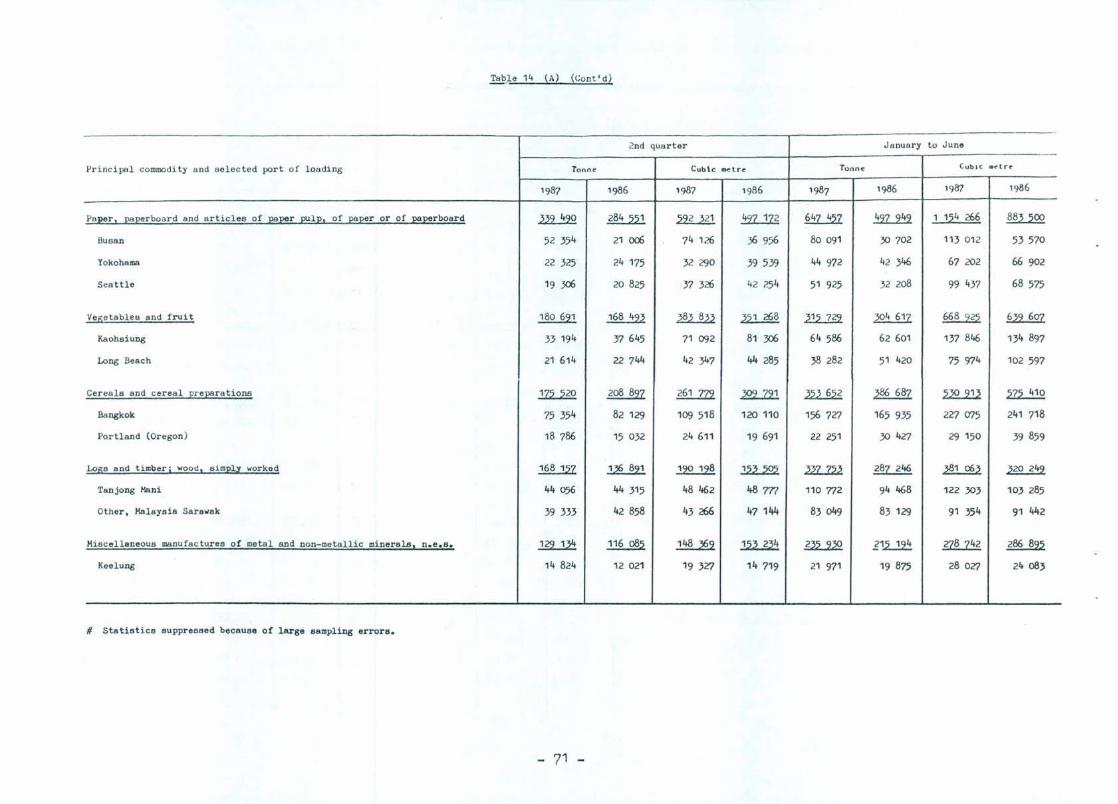
Table 14 (A) ({;ont 0 d)
2nd quarter J anuary to June
Principal commodi ty and selected port of loading Ton(\e Cubic ID<etre Tonne CublC tIIetre
1987 1986 1987 1986 1987 1986 19157 1986
Pa~rl EaEerboard and articles of ~~r ~lEI of ~Eer or of ~~rboard ~ ~ ~ .m..m ~ ~ 1 1:14 266 ~
Busan 52 354 21 oa; 74 126 36 956 80 091 30 702 113 01 2 53570
Yokohama 22 325 24 175 32 290 39539 44 972 42 346 67 202 66 902
Seattle 19 306 20 825 37 326 42 254 51 925 32 208 99 437 68 575
Ve5e t ables and fruit 180 691 ~ &.m ~ ~ ~ §§...82. ~
Kaohsiung 33 194 37 645 71 092 81 306 64586 62 601 137 846 134 897
Long Beach 21 614 22744 42 347 44 285 38 282 51 420 75 974 102 597
Cereala and cereal Ere~rations .112....2Q ~ ~ ELZ21 .22ll2 ~ ~ ~ Bangkok 75 354 82 129 109 518 120 110 156 727 165 935 227 075 241 718
Portland (Oregon ) 18 786 15 032 24 611 19 691 22 251 30 427 29 150 39 859
Lo5s and timberj wood a s imEl;( worked ~ ~ ~ ~ ~ 287 246 ~ 320 249
Tanjong Mani 44056 44 315 48 462 48m 110 772 94 468 122 303 103 285
Other, Malaysia Sarawsk 39 333 42 858 43266 47 144 83049 83 129 91 354 91 442
Miscellaneous manufac tures of metsl and non-metallic minerals I n.e.s. ~ 116 08:1 ~ ~ n.2....2.22 :?~ Kl§...lli ~
Keelung 14 824 12 021 19 327 14 719 21 971 19 875 28027 24083
# Statistics suppressed because of large sampling errors.
- 71 -
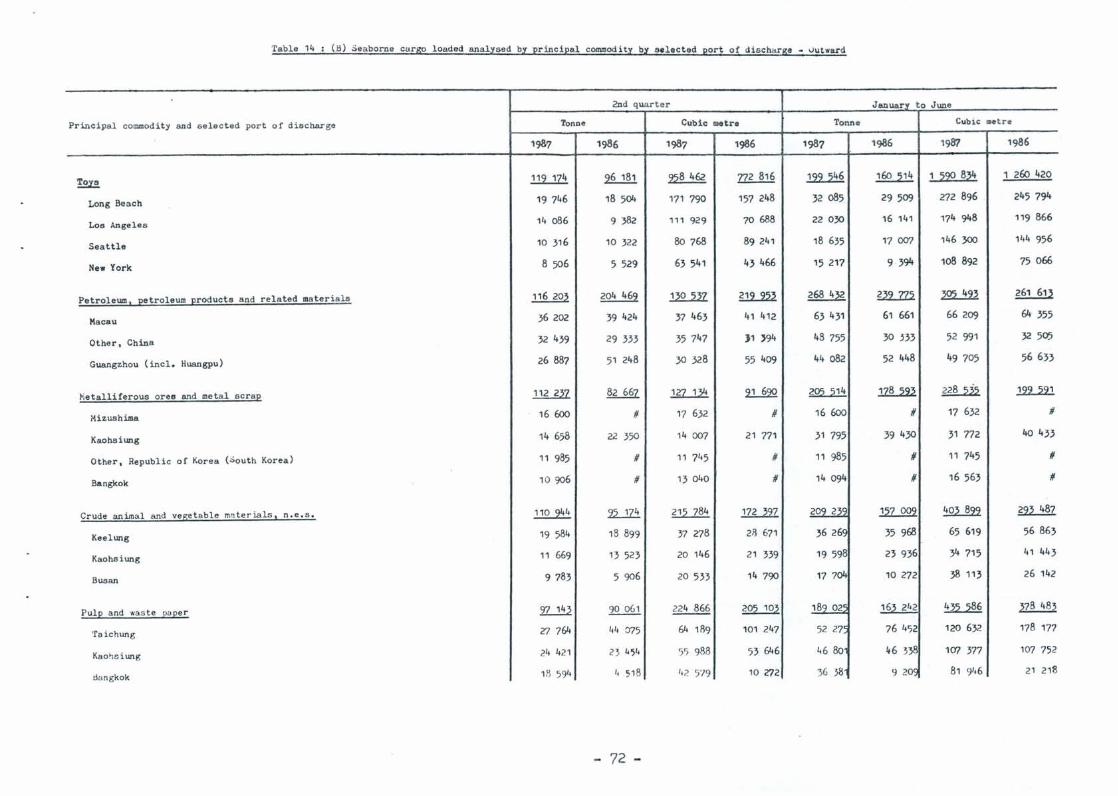
Table 14 (B) Seaborne cargo loaded analysed by principal commodity by selected port of dis char ge _ uutward
2nd quarter January t o June
Principal commodity and s elec t ed port of d i s charge Tonne Cubic "",tre Tonne Cub i c aetre
19&7 1986 1987 1986 1987 1986 1987 1986
'Toys ~ ~ ~ ~ l22....2!§. 160 514 1 ~2Q 8~4 1 260 420
Long Beach 19 746 18 504 171 790 157 248 32 085 29509 272 896 245 794
Los Angeles 14 086 9 382 111 929 70688 22030 16 141 174 948 119 866
Seattle 10 316 10 322 80 768 89 241 18 635 17 007 146 300 144 956
New York 8 506 5 529 63 541 43 466 15 217 9 ,394 108 892 75 066
Petroleum I petroleum products a nd r elated ma terials 116 203 204 469 ~' ~ 268 432 U2....ZZ.2 &.lli 261 61}
Macau 36 202 39 424 37 463 41 412, 63 431 61 661 66209 64 355
Other. China 32 439 29 333 35 747 )1 }94 48 755 30 533 52 991 32 505
Guangzhou (incl. Huangpu) 26 887 51 248 30 328 55 409 44082 52 448 49 705 56 633
~i etalliferous oreB and meta l s cra;e .!R.m 82 667 ~ 21....§2Q ~ ~ ~ m..22l
Mizushima 16 600 # 17 632 # 16 600 # 17 632 #
Kaohsiung 14 658 22 350 14 007 21 771 31 795 39 430 31 772 40 433
Other. Republic of Korea ( ~outh Korea) 11 985 # 11 745 # 11 985 # 11 745 #
Bangkok 10906 # 13 040 # 14 094 # 16 563 #
Crude an ima l and vege t able ma ter ials J n.e. s . ~ 12..Jl!!. 215 784 172 397 209 235 .121....Q22 ~ ~
Keelung 19 584 18 899 37 278 28 671 36 265 35 968 65 619 56 863
Kaohsiung 11 669 13 523 20 146 21 339 19 598 23 936 34 715 41 443
Busan 9 783 5 906 20 533 14 790 17 7011 10 272 38 113 26 142
Pule and was te Ea eer ~ 90 06 1 224 866 ~ ~ 163 242 ~ ~
Taichung 27 764 1,4 075 64 189 101 247 52 27~ 76 452 120 632 178 177
Kaohs iung 2"
421 23 4'54 5'; 988 53 646 46 80 46 338 107 377 107 752
tlangkok 18 594 I, 51 8 '.2 5"/9 10 272 36 381 <) 209 81 <)1.6 21 218
- 72 -
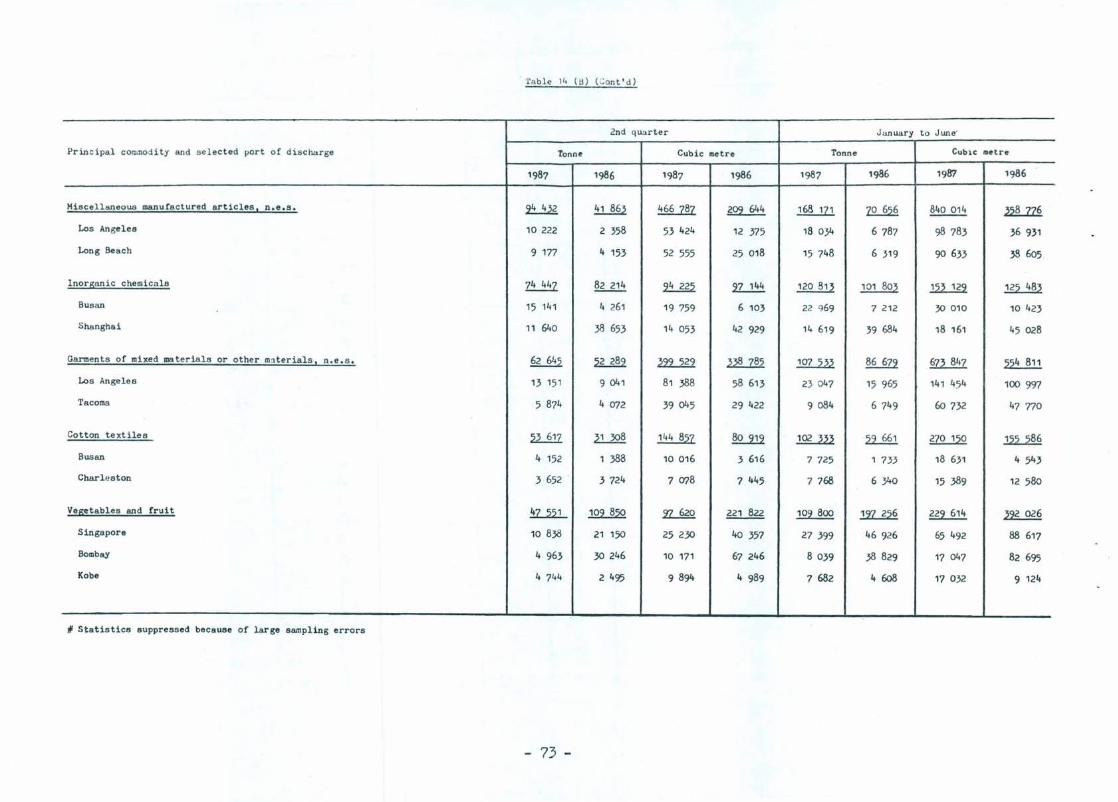
· Tab le 14 (U) (Cont Od)
2nd quarter January to JWle'
~rin cipal commodity and selected port of discharge Tonn~ Cubic metre Tonne CUbiC lD~tre
1987 1986 1987 1986 1987 1986 198'1 1986
Miscellaneous manufactured articles. n.e.s. ~ 41 863 ~ ~ ~ ~ 840 014 ~ Los Angeles 10 222 2 358 53 424 12 375 18 034 6 787 98 783 36 931
Long Beach 9 177 4 153 52 555 25 018 15 748 6 319 90 633 38 605.
lnorflanic chemicals 74 447 82 214 ~ 97 144 120 813 101 803 ~ ~ Busan 15 141 4 261 19 759 6 103 22 969 7 212 30 010 10 423
Shanghai 11 640 38 653 14 053 42 929 14 619 39 684 18 161 45 028
Garments of mixed mater ials or other m~terials. n.e.s. 62 645 ~ ~ ~ ~ 86 679 ~ 22.'!..JW. Los Angeles 13 151 9 041 81 388 58 613 23 047 15 965 141 454 100 997
Tacoma 5 874 4 072 39045 29 422 9084 6749 60 732 47 770
Cotton textiles 22....§12. 31 308 ~ ~ .!2L.m '.2L§§.! 270 150 ~ Busan 4 152 1 388 10 016 3 616 7 725 1 733 18 631 4 543
Charleston 3 652 3 724 7 078 7 445 7768 6340 15 389 12 580
Ve~tables and fruit !!Z...2.2.l.. 1Q2...§.2Q 2l...§gQ 221 822 109 800 ~ 229 614 392 026
Singapore 10 838 21 150 25 230 40 357 27 399 46 926 65 492 88 617
Bombay 4 963 30 246 10 171 67 246 8 039 38 829 17 047 82 695
Kobe 4 744 2495 9 894 4 989 7 682 4 608 17 032 9 124
# Statistics suppressed because of large sampling errors
- 73 -
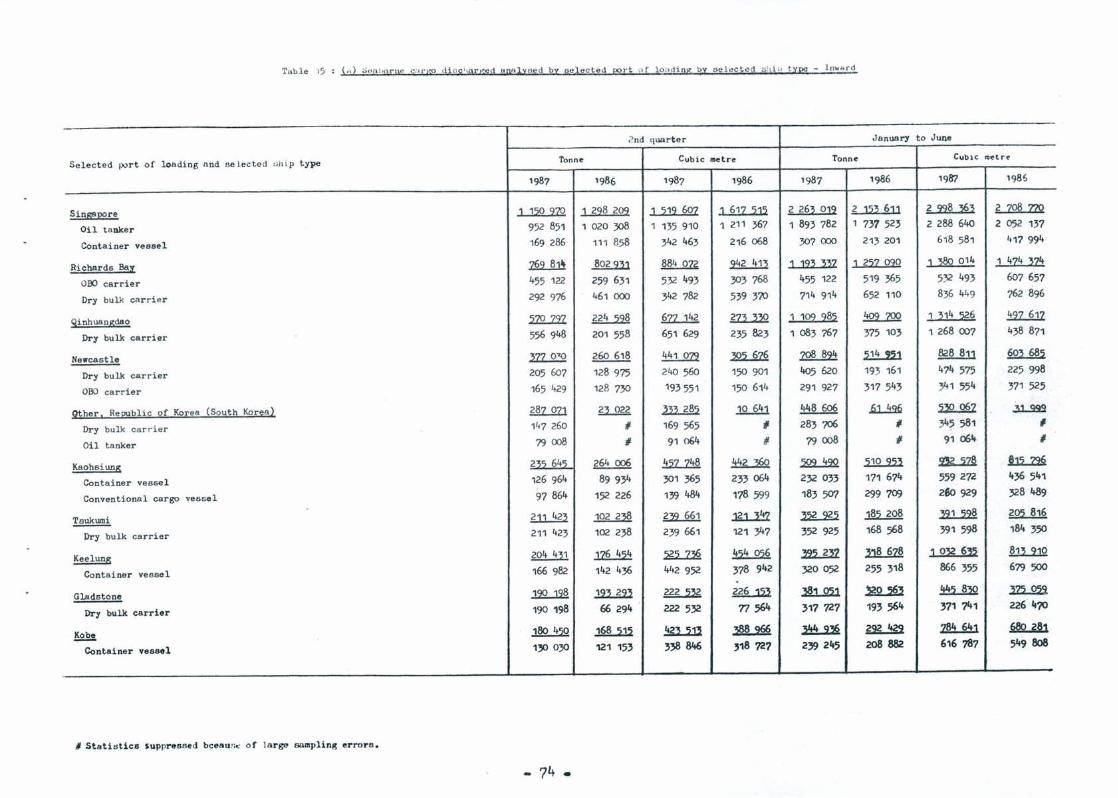
Table "15 Cd ,sea\,or ne cartro d i s c :mr".ect ttQo ly sed by se lec ted port n f loa ding b y selected s:l i tl type - lnwbrd
2nd quarter J anuary to June
Select e d port of loading a nd s elected Ghi.p type Tonne Cubic metre Tonne CUblC ftlrtre
1987 1986 1987 1986 1987 1986 1987 1985
Sin~E2re 1 12Q 222 J 228 2Q2 1 :212 60Z J 612 2J2 2 26~ 0J2 2 J2~ 6JJ 2 228 ~~ 2 208 ZlfJ.
Oil tanker 952 851 1 020 308 1 135 910 1 211 367 1 893 782 1 737 523 2288 640 2 052 137
Container veaael 169 286 111 858 342 463 216 068 307 000 213 201 618 581 417 994
Richards Sa;x: ~ ~ 884 OR ~ 1 J2~ ~~Z l 2:2Z Q20 l "380 014 1 4Z4 ~Z4
000 carrier 455 122 259 631 532 493 303 768 455 122 519 365 532 493 607 657
Dry bulk ca rrie r 292 976 461 000 342 782 539 370 714 914 652 110 836 449 762 896
9,inhuansdao 2ZQ22Z ~ ~ ~ 1 '22 28:2 !m..1QQ 1 ~14 26 ~
Dry bulk carrier 556 948 201 558 651 629 235 823 1 083 767 375 103 1268 007 438 871
Newcastle ~ ~ ~ ~ ~ .21!..l21 828 811 603 685
Dry bulk carrier 205 607 128 975 240 560 150 901 405 620 193 161 474 575 225 998
000 carrier 165 429 128 730 193551 150 614 291 927 317 543 341 554 371 525
2!her , Re~blic of Korea (South Korea) ill..QZ1 2~ 022 ~ 10 64J ~ .ll..!!!lfi ~ .ll..999
Dry bulk carr ier 147 260 11- 169 565 ., 283 706 11- 345 581 ., Oil tanker 79008 '# 91 064 # 79 008 11- 91 06'+ .,
Kaohsiun!!i 2~C; 64'5 264 006 ~ ~ ~ ~ ~ il2...Zi2 Container vessel 126 964 89934 301 365 233 064 2}2 033 171 674 559272 '+36 5'+1
Conventional cargo vessel en 864 152 226 139 484 178 599 183 50? 299 709 260929 328 489
~ ~ ~ m.Ml .1ll..J!Z ~ 182 208 ~ ~
Dry bulk ca rrier 211 423 102 238 239 661 121 347 352 925 168 568 391 598 184 350
Keelun!!i 204 431 .lli.lli ~ ~ m.m ~ J O~ 6~ !ll..2.1Q
Container vessel 166 982 142 436 442 952 378 . 942 }20052 255 318 866 355 679 500
Gladstone ~ ~ 222 532 ~ ~ ~ ~ ~
Dry bulk carrier 190 198 66 294 222 532 71564 317 727 193 564 371 741 226 lt70
~ ~ ~ !:!ll...m ~ ~ ~ ~ ~
Container vessel 130 030 121 153 338 846 318 727 239 245 208 882 616 ?87 549 808
I Statistics suppr .. ssed bceau,';<: of large sampling errors.
- 74 -
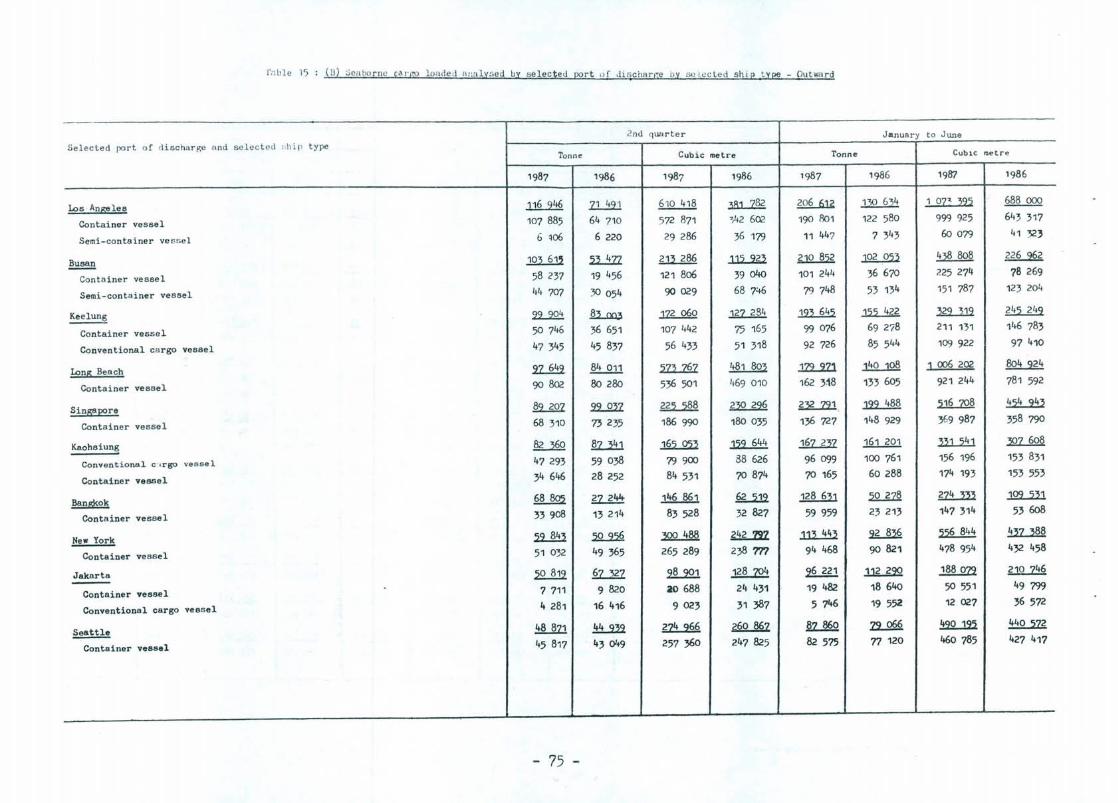
[':!bIe 15 ( U) :ica bo rnc cat'j\O loaded H'''l l y5ed by se lected port of di s chan;e by se I.ec t ed shi p t ype - Outward
2nd quarter January t o June Selected port of discharge and selected !;hir type
Tonn e Cubic metre Tonne CUbiC metre
1987 1986 1987 1986 1987 1986 1987 1986
los An!!.'!!les 116 946 1J..J.21 610 418 ~ ~ ~ 1 oz" ~~2 688 000
Container vesse l 107 885 64 710 572 871 '142 602 190 801 122 580 999 925 643 317
Semi-container ve sse l 6 ~06 6 220 29 286 36 179 11 447 7 343 60 079 41 32'
~ ~ li.!m. 213 286 ~ ~ ~ 438 808 226 962
Conta iner vessel 58 237 19 456 121 806 39040 101 2411 36 670 225 274 78 269
Semi-conta iner vessel 44 707 30 054 90 029 68 746 79 748 53 134 151 787 123 204
Keelung ~ ~ 172 060 127 234 .m...ill ~ ~ ~
Container vessel 50 746 36 651 107 442 75 165 99 076 69278 211 131 146 783
Conventional cargo vessel 47 345 45 837 56 433 51 318 92 726 85 544 109 922 97 410
long Beach ~ .!li..Q11 lli..Z€1 481 803 .J:lL2Z1 140 108 ] 006 202 804924
Container vessel 90 802 80280 536 501 469 010 162 318 133 605 921 244 781 592
SinS!!E2re ~ ~ ~ ~ ~, ~ 2J2...ZQ§ ~
Container vessel 68 310 73 235 186 990 180 035 136 727 148 929 369 987 358 790
Kaohsiung ~ ~ ~ ~ .1§.Z...D1 161 201 ill...'2il ~
Conventional c "Jrgo vessel 47 293 59 038 79 900 88 626 96099 100 761 156 196 153 831
Container vessel 34 646 28252 84531 70 874 70 165 60288 174 193 153 553
Banp;kok 2l!.Jl9.i 27 244- ~ ~ ~ 2Q..n§ ~ .lQ2....ill.
Container vessel 33908 13 214 83528 32 827 59 959 23 213 147 314 53608
New York liID ~ ~ &...m ~ ~ ~ ~
Container vessel 51 032 49 365 265 289 238 m 94 468 90 821 478 954 432 458
Jakarta 22....§.12. .2Z...Xl 2t.22.1 ~ 96 221 ~ ~ ~ ---Container vessel 7 711 9 820 ao 688 24 431 19 482 18640 50 551 49 799
Conventional cargo vessel 4 281 16 416 9023 31 387 5 746 19 552 12 027 36 572
.2!!!!lli 48 871 .!i!Llli. ~ 260 867 ~ ~ ~ 440 212
Container vessel 45 817 43049 257 360 247 825 82 575 77 120 460 785 427 417
- 75 -
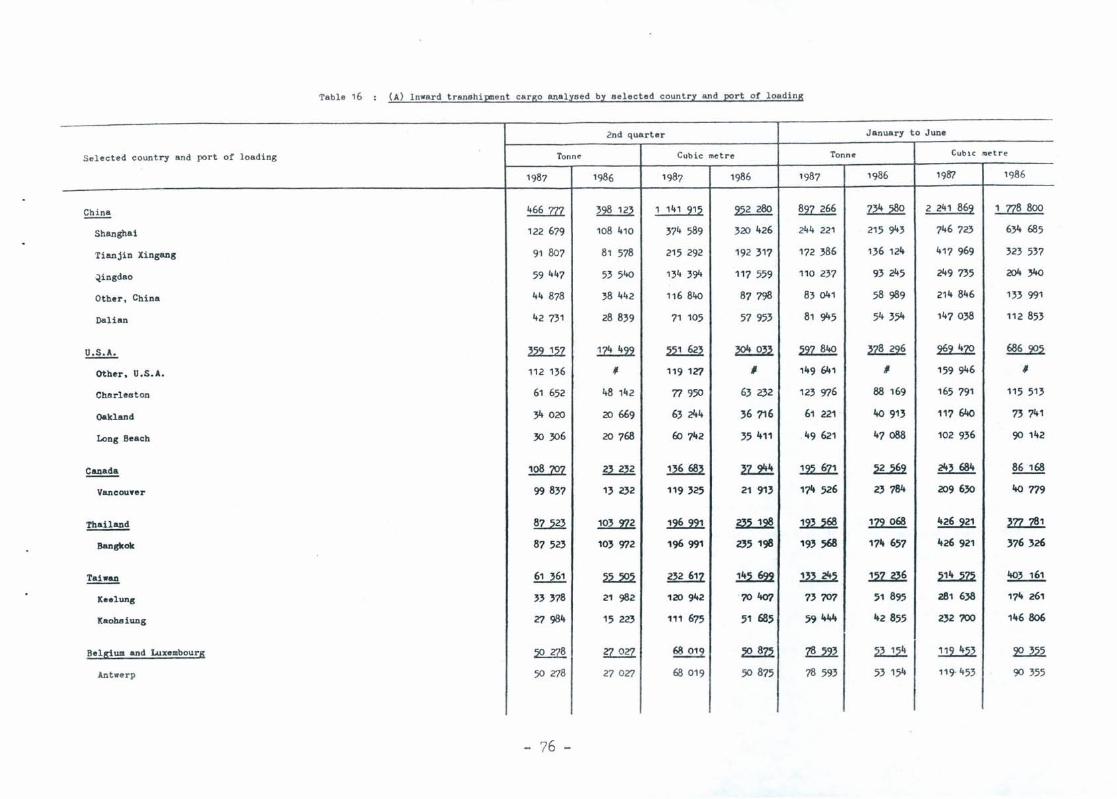
Table 16 CA) Inward transhipment carso analysed by selected country and port of loadins
2nd quarter January to June
Selected country and port of loading Tonne Cubic metre ronn~ Cub,c tDetr e
1987 1986 1987 1986 1987 1986 1987 1986
£!!l.!!! lli...Zll ~ 1 141 21~ ~ ~ ~ 2 241 862 1 n8 800
Shanghai 122 679 108 410 374 589 320 426 244 221 215 943 746723 634 685
Tianjin Xingang 91 807 81 578 215 292 192 317 172 386 136 124 417 969 323 537
~ingdao 59447 53540 134 394 117 559 110 237 93245 249 735 204 340
Other. China 44 878 38 442 116 840 87798 83041 58 989 214 846 133 991
Dalian 42 731 28839 71 105 57 953 81 945 54 354 147038 112 853
~ lli..lli ~ ~ ~ ~ ~ ~ ~
Other. U.S.A. 112 136 I 1191n I 149 641 I 159 946 I
Charleston 61 652 48 142 71 950 63 232 123 976 88 169 165 791 115 513
Oakland 34 020 20 669 63 244 36716 61 221 · 40 913 117 640 73 741
Long Beach 30 306 20 768 W 742 35 411 . 49 621 47088 102 936 90 142
~ 12lL2Qz ~ ~ ~ ~ ~ 24, 684 86 168
Vancou.,er 99 837 13 232 119 '25 21 913 174 526 23784 209 630 40 779
Thailand 87523 12l..m 12.U.2.l ~ 12l..i§!! ~ 426921 ~
Bangkok 87 523 103 972 196991 235 198 193 568 171t 657 1t26921 376326
~ 61 361 2U22 232 617 &§.22 ~ ~ ill....m 403 161
Xeelung 33378 21 982 120942 '704fYl 73707 51 895 281 638 174 261
Kaoh8iung n 98'+ 15 223 111 675 51 685 59 1t44 1t2 855 232 700 1'+6806
Belgium and Luxembourg :2Q...£& ~ 68 019 ~ ~ ~ ~ 22...lli.
Ant werp 50 n8 27 on 68 019 5<> 875 78 593 53 154 119· 453 90 355
- 76 -
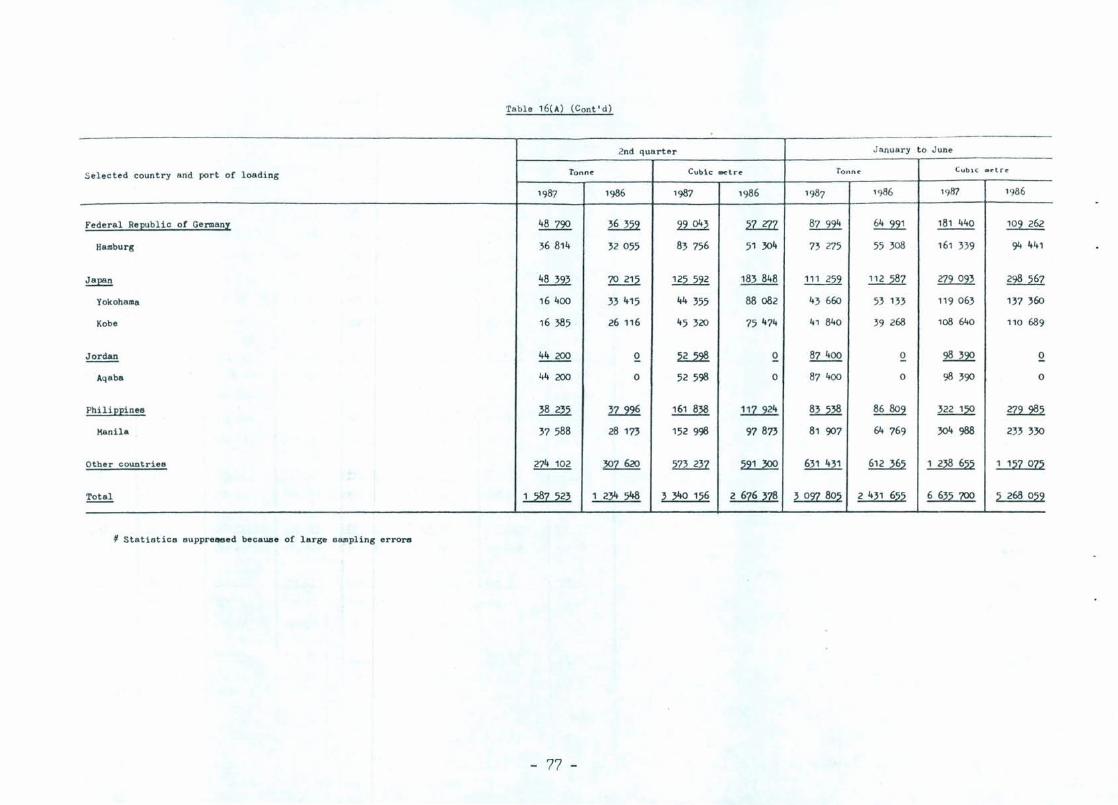
Table 16(A) (Cont'd)
2nd quarter January to June
Selected country and port of loading tonne Cubic atetre Tonn~ CUblC .t'lrl!
1987 1986 1987 1986 1987 '986 1987 1986
Federal Republic of Germany 48 7<rJ 36 359 99043 'iL?l1. 87 994 ~ 18, 440 109 262
Hamburg 36 814 32055 83 756 51 304 73 275 55 308 ,6, 339 94 441
Japan ~ 70 215 ~ 183 848 ,11 259 112 587 279 093 ~
Yokohama 16400 33 415 44 355 88082 43 660 53 133 119 063 137 360
Kobe 16 385 . 26 116 45 320 75474 41 840 39 268 108 640 110 689
Jordan 44 200 £ ~ Q 87400 £ 2U.2£ Q
Aqaba 44 200 0 52 598 0 87 400 0 98 3<rJ 0
Philippines 38 235 ~ 161 838 ~ 83 538 86809 lli....!2£ ~ Manila 37 588 28 173 152 998 97873 81 <rJ7 64 769 304 988 233 330
Other countries 274 102 307 620 573 237 22UQ£ 631 431 612 365 1 238 655 1 157 075
Total 1 2§z 223 , 234 548 3 340 '26 2 6Z6 ~Z8 3 021 802 2 431 622 6 632 700 2 268 022
¥ Statistics suppre~ed because of large sampling errore
- 77 -

Table 16 (B ) Outward tnlnsilipment cargo analysed by selected country and port of discharge
2nd quarter January to June
Selec t ed country and port of discharge Tonne Cubic me t re Tonne CUb iC metre
1987 1986 1987 1986 1987 1986 1987 1986
~ ~ ~ 448 251 292 570 ~ 441 647 ~ ~
Shanghai 118 823 72 679 150 444 108 896 194 912 164 888 269 728 245 966
Tian jin Xi ngang 37 327 52 398 61 605 66 606 111 133 101 941 171 969 147 420
Zhang j iagang 27 222 22 687 28 316 23369 56733 64 497 59 397 59 524
Fuzhou 24 944 # 28 786 # 37 666 # 47 638 #
Other. China 24 004 7 179 24 787 9 989 44 342 11 947 47 506 15 533
~ 22U.Z.l ~ 646 718 ~ ~ ~ 1 ~8 Z42 1 1IZ 612
Long Beach 49 155 42 110 1'10 631 172099 103 934 90 670 344 317 331 886
Los Angelea 33 288 15 538 127 801 56 254 62 390 28 712 235 679 101 984
New York 23 852 21 324 74 378 54209 54 992 51 806 166 263 140 119
OakJ.and 16 801 19 827 39 615 42232 35 557 49 311 82 752 96 306
Philippines ~ 69 444 ~ ~ ~ 119 210 ~ ~
Manila 106 103 67 322 190 637 117 640 180 060 115 643 330 160 205 571
Taiwan .§1..2!2 68 178 ~ .lll.1lQ .!.€U22. ~ ~ ~ Keelung 54 795 38 982 100892 60 982 99 120 75 442 184 354 126 882
Ksohsiung 30 355 25079 50 025 44 706 56 922 53 537 98972 93506 .,
Netherlands ~ ~ ~ ~ ~ ~ ~ 264 Z86
Ro t to rdd 80809 55566 199 870 134528 154 356 107 122 385 066 264 566
Federal Republic of Germany '.lZ..M 2.!L,m 209 404 ~ ~ ~ ~ ~ Hamburg 67 811 50 013 174 113 132 554 142 833 95 154 370 169 264 410
- 78 -
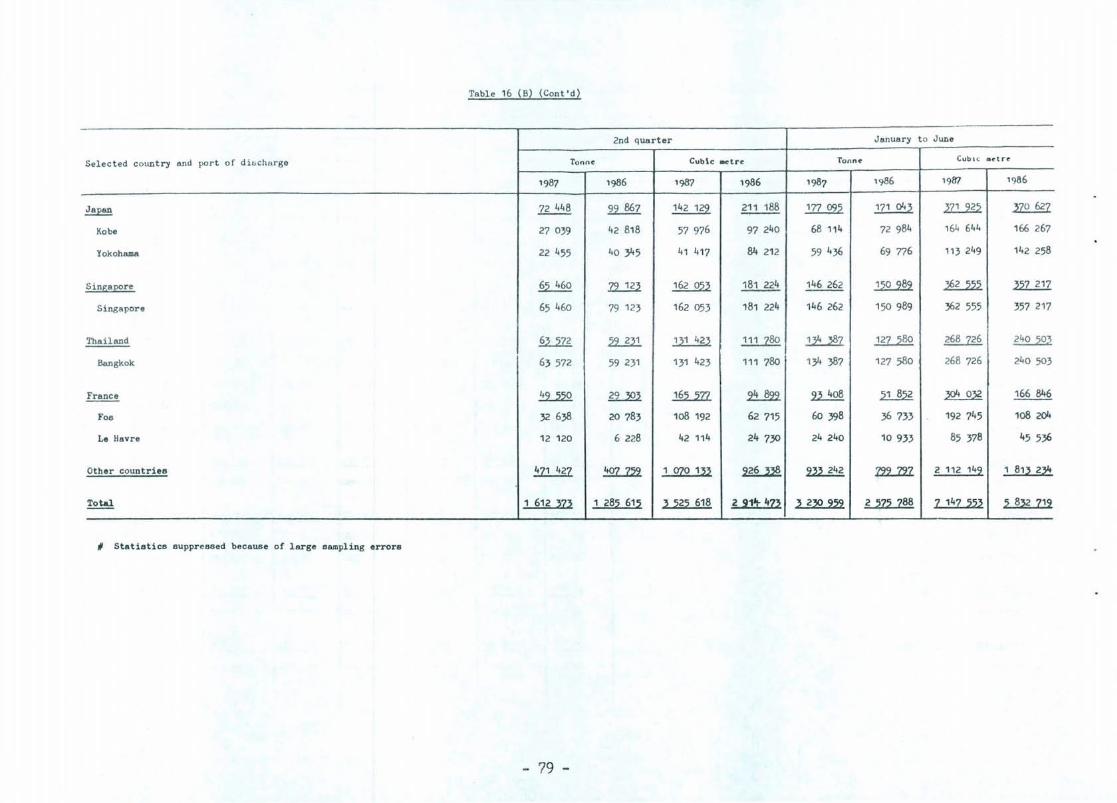
Table 16 (B) (Cont'd)
2nd quarter January to June
Selected country and port of di6charge Tonne Cubic ...,tre Tonne CUblC CII ~tr('
1987 1986 1987 1986 1987 1986 1987 1986
~ 72 448 99 867 142 129 211 188 177 095 171 043 ~ 2l0!31
Kobe 27 039 42 818 57 976 97 240 68 114 72 984 164 644 166 267
Yokohama 22 455 40345 41 417 84 212 59 436 69 776 113 249 142 258
Singapore 65 460 12..2.?l ~ 181 224 146 262 ~ ~ .ill...ill
Singapore 65 460 79 123 162 053 181 224 146 262 150 989 362 555 357 217
Thailand ~ ..22..n.:!.. ~ 111 780 ~ ~ 268 726 ~ I
Bangkok 63572 59 231 131 423 111 780 134 387 127 580 268 726 240 503
France ~ ~ .1§2..m ~ ~ ~ ~ 166 846
Fos 32 638 20 783 108 192 62 715 60 398 36 733 192 745 108 204
Le Havre 12 120 6 228 42 114 24730 24 240 10 933 85 378 45536
Other countries ~ ~ 1 070 133 ~ ~ 'Ut..ZE. 2 112 149 1 813 234
~ 1 612 ~Zi 1 28:2 61:2 ~ :22:2 618 2 ll1't- 4Zi i 2iQ 2:22 2 ::!Z::! Z88 Z 14Z :2:2~ :2 8i2 Z12
~ Statistice suppressed because of large sampling errors
- 79 -
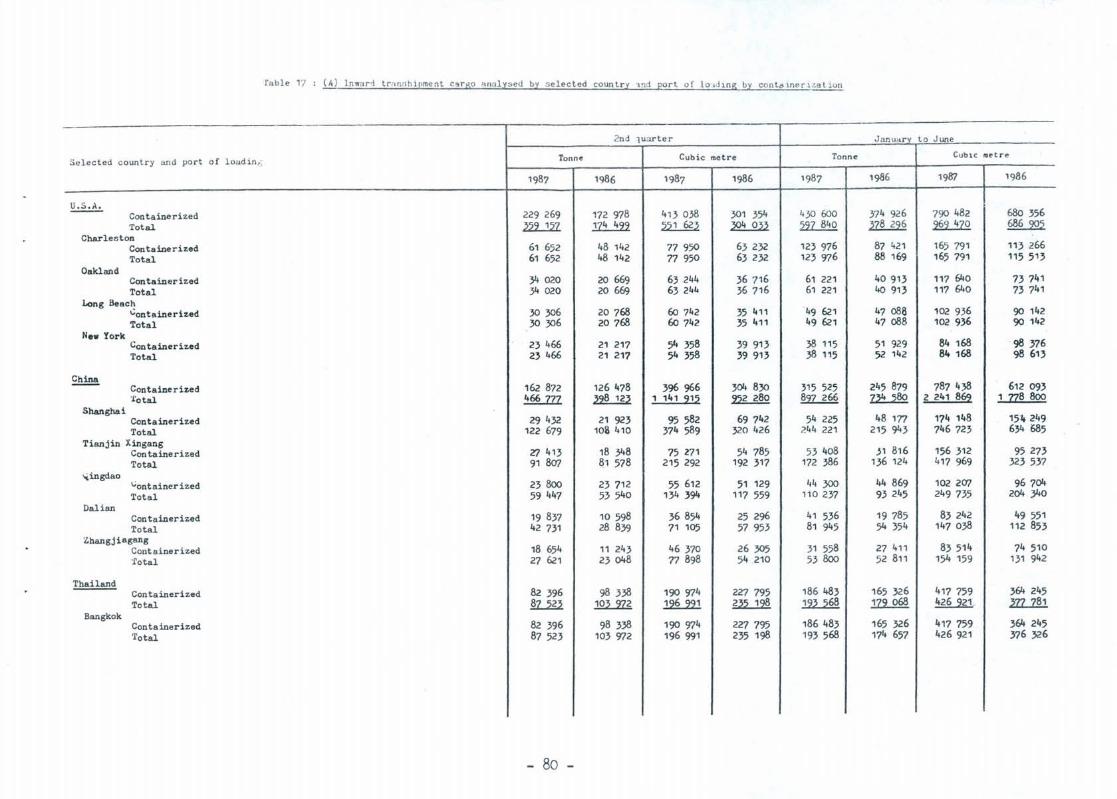
!'able 17 (A ) I n,,,,,d trit n:;h ipment cargo ,",,;)lysed by selected country ~"d port of lo ',dlng by con tl;l1neri l ation
2nd luarter Januarv to June
Selected coun try and port of loud in ,; Tonne Cubic metre Tonne CUblC t1I~t r e
1987 1986 1987 1986 1987 1986 1987 1986
~ 229 269 172 978 413 038 790 482 680 356 Containerized 301 354 430 600 374 926
Total ~ ~ ~ ~ m...§!!Q ~ ~ ~ Charleston
Containerized 61 652 48 142 77 950 63 232 123 976 87 421 165 791 113 266 Total 61 652 48 142 77 950 63 232 123 976 88 169 165 791 115 513
Oakland Containerized 34 020 20 669 63 244 36 716 61 221 40 913 117 640 73 741 Total 34 020 20 669 63 244 36 716 61 221 40 913 117 640 73 741
Long Beac~ 30 306 20768 6c 742 '49 621 47 088 102 936 "ontainerized 35 411 90 142
Total 30 306 20768 6c 742 35 411 49 621 47 088 102 936 90 142 New York
Containerized 23 466 21 217 54 358 39 913 38 115 51 929 84 168 ' 98 376 Total 23 466 21 217 54 358 39 913 38 115 52 142 84 168 98 613
~ 162 872 126 478 396 966 304 830 245 879 787 438 Containerized 315 525 612 093 'i'otal 466777 ~ 1 141 21:2 ~ ~ ~ 2 241 8!12 1 118 800
Shanghai Containerized 29 432 21 923 95 582 69 742 54 225 48 177 174 148 154 249 Total 122 679 108 410 374 589 320 426 244 221 215 943 746 723 634 685
Tianjin Xingang Containerized 27 413 18 348 75 271 54 785 53 408 j1 816 156 312 95 273 Total 91 807 81 578 215 292 192 317 172 386 136 124 417 969 323 537
... ingdao (;ontainer ized 23800 23 712 55 612 51 129 44 300 44 869 102 207 96704 Total 59 447 53 540 134 394 117 559 110 237 93 245 249735 204 340
Dalian Containerized 19 837 10 598 36 854 25 296 41 536 19 785 83 242 49 551 Total 42 731 28 839 71 105 57 953 81 945 54 354 147 038 112 853
l.hangjiagang Containerized 18 654 11 243 46 370 26305 31 558 27 411 83 514 74 510 'l'otal 27 621 23048 77 898 54 210 53800 52 811 154 159 131 942
Thailand Containerized 82 396 98 338 190974 227 795 186 483 165 326 417 759 364 245 Total ~ .lQ2.....m ~ ~ ~ ~ 426 921 ~ 2:lZ..ili
Bangkok Containerized 82 396 98 338 190974 227 795 186 483 165 326 417 759 364 245 Total 87 523 103 972 196 991 235 198 193 568 174 657 426 921 376 326
- 80 -
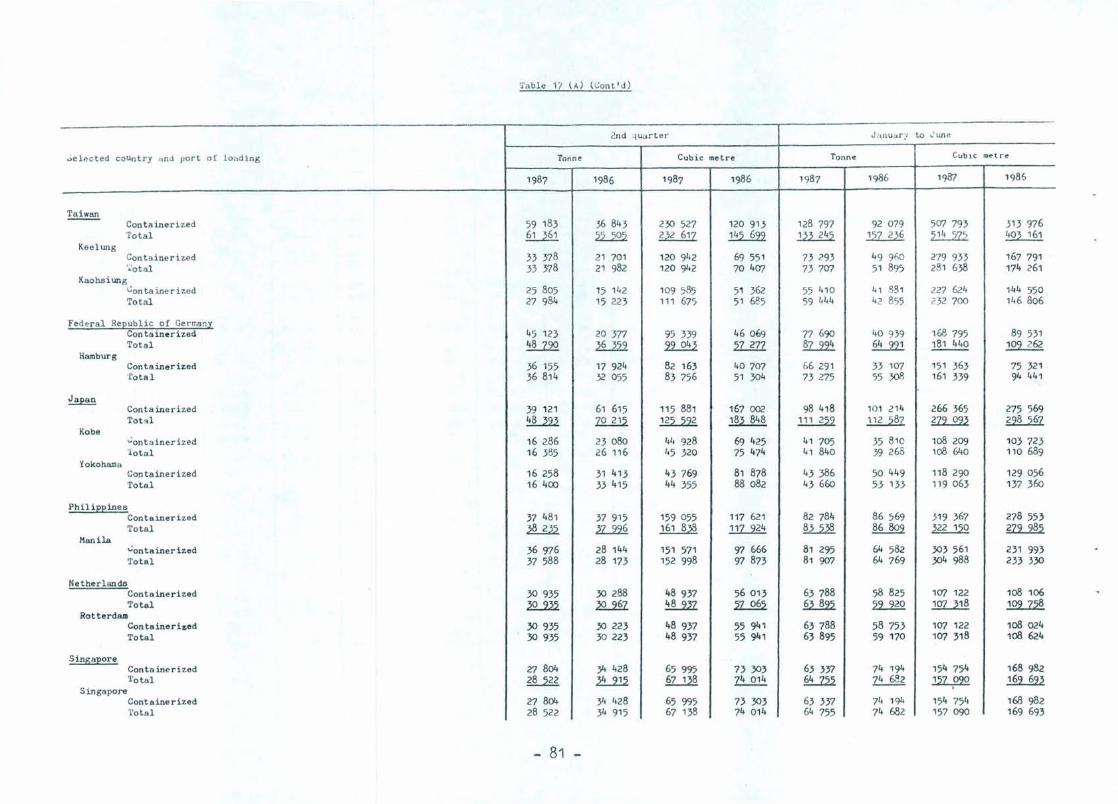
'rable 1? (A) (Conl'd)
-2nd quarter Jiln u.::a r :, to .... I une
~e lec ted country and port of louding Tonne Cubic metre Tonne Cub,C ruet r e
1987 1986 1987 1986 1987 1986 1987 1986
Taiwan Containerized 59 183 36 843 230 527 120 913 128 797 92 079 507 793 313 976 Total £U.§l 2L.2.Q2 QU1l ~ lli..S!.'2. 157 236 ~ 403 161
Keelung Cont 9inerized 33 378 21 701 120 942 69 551 73 293 49 960 279 933 167 791 ';"otal 33 378 21 982 120 942 70407 73 707 51 895 281 638 174 261
Kaohsiung Con t a iner ized 25 805 15 142 109 585 51 362 55 410 41 881 227 621, 144 550 Total 27 984 15 223 11 1 675 51 685 59 444 42 855 " 32 700 146 806
Fed er al Rep ublic of Ge rmany Containerized 45 123 20 377 95 339 46 069 77 690 40 939 168 795 89 531 Total 48 790 ~ ~ 57 277 ~ ~ 181 440 109 262
Hamburg Con ta iner ized 36 155 17 924 82 163 40 707 66 291 33 107 151 363 75 321 'l'otal 36 814 32 055 83 756 51 304 73 275 55 308 161 339 94 441
Japan Containerized 39 121 61 615 115 881 167 002 98 418 101 2 14 266 365 275 569 Tot '! l ~ 1Q...£1.2. ~ 183 848 .l2.l.1.22 1E..2.§l m....222 ~
Kobe "':ont a iner i zed 16 286 23 080 1,4 928 69 425 41 705 35 810 108 209 103 723 Total 16 385 26 116 45 320 75 474 41 840 39 265 108 640 110 689
Yokohama Con tainer ized 16 258 31 413 43 769 81 878 43 386 50 449 118 290 129 056 Total 16 400 33 415 44 355 88 082 43 660 53 133 119 063 137 360
Philippines Con tainer ized 37 481 37 915 159 055 117 621 82 784 86 569 319 367 278 553 Total ~ ~ ~ .ill...lli. 83 538 86 809 ~ m.2§2
Manila ';ontainerized 36 976 28 144 151 571 97 666 81 295 64 582 303 561 231 993 'fo tal 37 588 28 173 152 998 97 873 81 907 64 769 304 988 233 330
Netherlands Containerized 30 935 30 288 48 937 56 013 63 788 58 825 107 122 108 106 Total 2Q...22.2 ~ ~ 2Z...Q§2 ~ ~ ~ ~
Rotterdam Con tainerized 30 935 30 223 48 937 55 941 63 788 58 753 107 122 108 024 Total 30 935 30 223 48 937 55 941 63 895 59 170 107 318 108 624
Singa)1ore Containerized 27 804 34 428 65 995 73 303 63 337 74 194 154 754 168 982 'l'otal 28 522 ~ 67 138 74 014 ~ 74 682 ~ ~ Singapore Containerized 27 804 34 428 65 995 73 303 63 337 74 194 154 754 168 982 Total 28 522 34 915 67 138 74 014 64 755 74 682 157 090 169 693
- 81 -
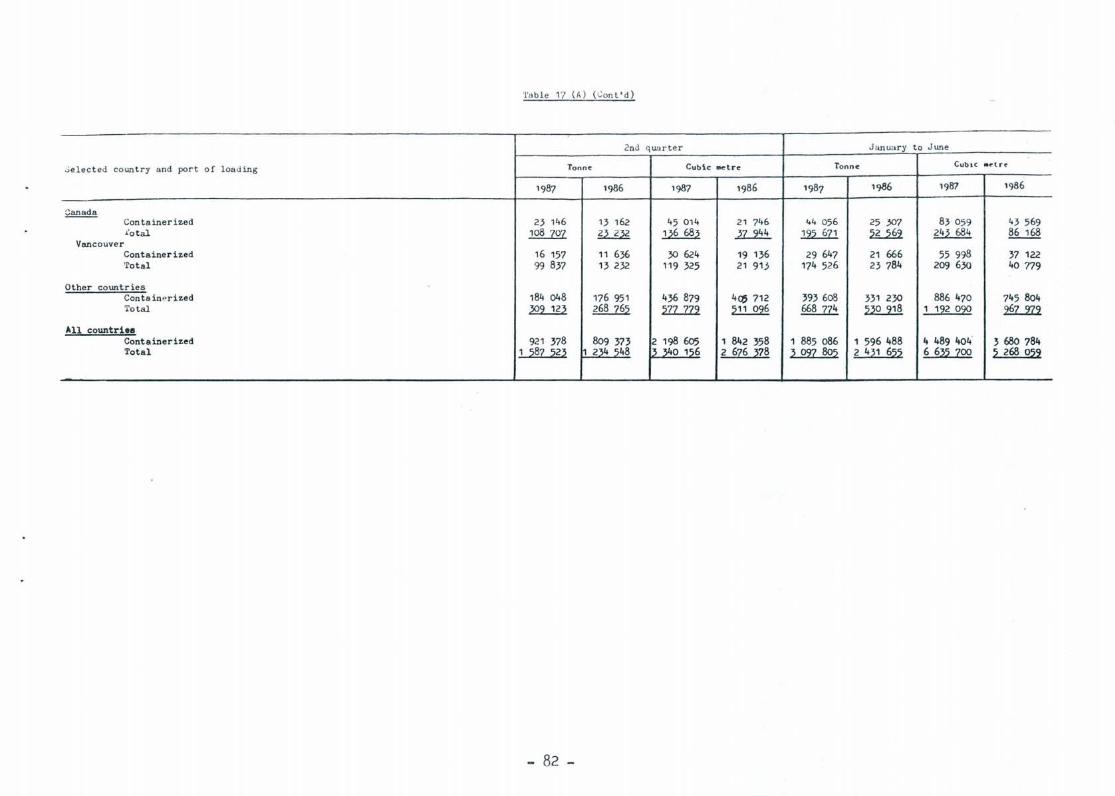
Tabl e 17 (,q ( Cont'd)
2nd quarter Januar y to June
~elec t ed country and port of loa d ing Tonn e Cubic .. t re Tonne CUblC .It'tr ~
1987 1986 1987 1986 1987 1986 1987 1966
~ 83059 Con tainer ized 23 146 13 162 45 014 21 746 44 056 25 307 43 569
J.·otal ~ ~ ~ ~ .w....§Zl ~ 243 684 86 168 Vancouver
Container ized 16 157 11 636 30 624 19 136 29 647 21 666 55 998 37 122 'fotal 99 837 13 232 119 325 21 913 174 526 23 784 209 630 40 779
Other countries Contain~rized 184 048 176 951 436 879 4(1) 712 393 608 331 230 886 470 745 804 Total ~ ~ 'i11...Il:t ~ 668 774 ~ 1 '22 02Q '121....:1l:l
All countries Containerized 921 378 809 373 2 198 605 1 842 358 1 885 086 1 596 488 4 489 404 3 680 784 Total 1 ~8Z ~2~ 1 234 548 13 340 156 2 6Z6 ~78 ~ Q2Z 8o~ 2 42' 6~~ 6 6~ ZOO ~ 268 0~2
- 82 -
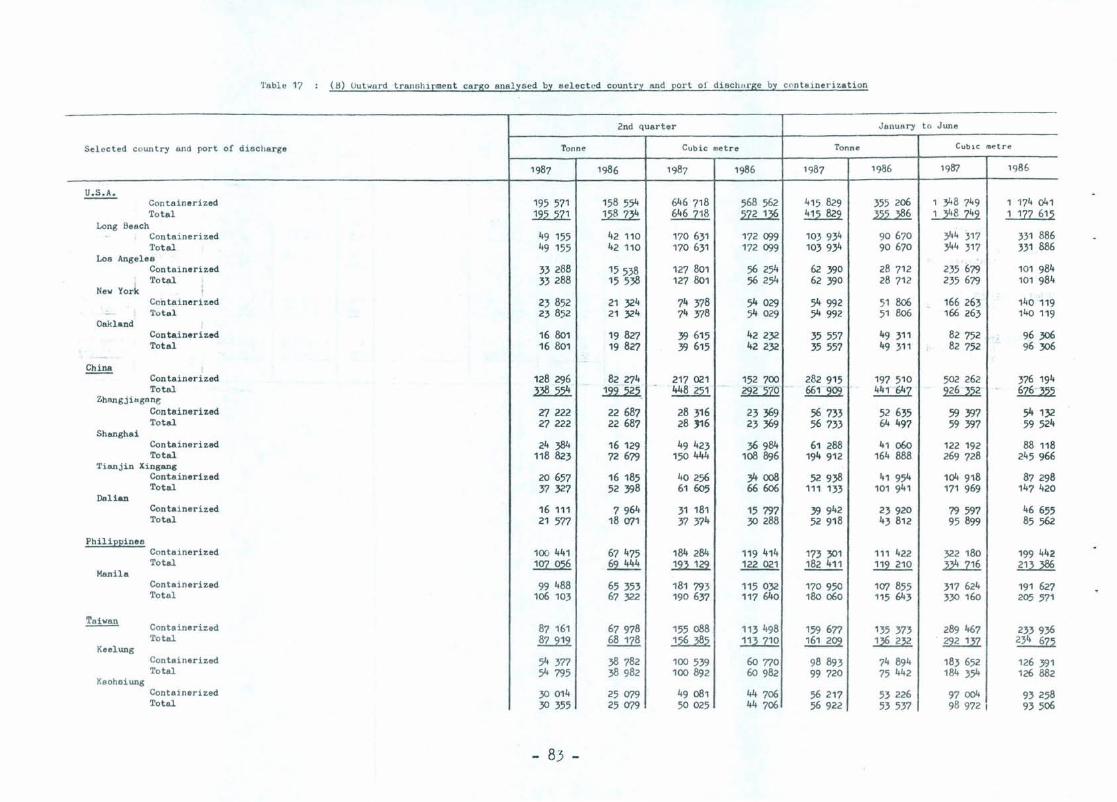
Table 17 (Ill Outward transhipment cargo analysed by selected country and port of disch"rge by containerization
2nd quarter January to June
Selected country and port of discharge Tonne Cubic metre Tonne CUblc metre
1987 1986 1987 1986 1987 1986 1987 1986
.!!.:2..± 158 554 646 718 568 562 415 829 355 206 y.8 749 174 041 Containerized 195 571 1 1
Total 2.22....211. ~ 646 718 ~ ~ ~ 1 ~8 242 1 127 61~ Long Beach
Containerized 49 155 42 110 170 631 172 099 103 934 90670 y.4 317 331 886 Total 49 155 42 110 170 631 172 099 103 9Y. 90 670 y.4 317 331 886
Los Angeles Containerized 33 288 15538 127 801 56 254 62 390 28 712 235 679 101 984
New York Total 33 288 15 538 127 801 56 254 62 390 28 712 235 679 101 984
; Containerized 23 852 21 324 74 378 54 029 54 992 51 806 - 166 263 140 119
- Total 23 852 21 324 74 378 54029 54 992 51 806 166 263 140 119 Oakland
Containerized 16 801 19 827 39 615 42232 35 557 49 311 82 752 96 306 Total 16 801 19 827 39 615 42232 35 557 49 311 82 752 96 306
-China
Containerized 128 296 82 274 217 021 152 700 282 915 197 510 502 262 376 194 Total ~ ~.
- . 448 251 - m...22Q ~ 441 642 ~ ~ Zhangj i .. gane; Con taineri zed 27 222 22 687 28 316 23369 56 733 52 635 59 397 54132 Total 27 222 22 687 28 }16 23369 56 733 64 497 59 397 59 524
Shanghai Con tainerized 24 384 16 129 49 423 36 984 61 288 41 060 122 192 88 118 Total 118 823 72679 150 444 108896 194 912 164 888 269 728 245 966
Tianjin Xingang Containerized 20 657 16 185 40256 34008 52 938 41 954 104 918 87 298 Total 37 327 52 398 61 605 66 606 111 133 101 941 171 969 147 420
Dalian Containerized 16 111 7 964 31 181 15 797 39 942 23 920 79 597 46 655 Total 21 577 18 071 37 374 30 288 52 918 43 812 95 899 85562
Phili22ines Containerized 100 441 67 475 184 284 119 414 173 301 111 422 322 180 199 442 Total
Manila ~ 69444 ~ ~ 182 411 ~ ~ ~
Containerized 99 488 65 353 181 793 115 032 170950 107 855 317 624 191 627 Total 106 103 67 322 190 637 117 640 180060 115 643 330 160 205 571
Taiwan Containerized 87 161 67 978 155088 113 498 159 677 135 373 289 467 233936 Total ~ 68 178 ~ lli...Z1Q ~ ~ .~ ~ Keelung Containerized 54 377 38 782 100 539 60 770 98 893 74 894 183 652 126 391 Total 54 795 38 982 100892 60 982 99 720 75 442 184 354 126 882
Kaohsiung Containerized 30 014 25 079 49 081 44 706 56 217 53 226 97004 93 258 Total 30 355 25079 50 025 44 706 56 922 53 537 98 972 I 93506
- 83 -
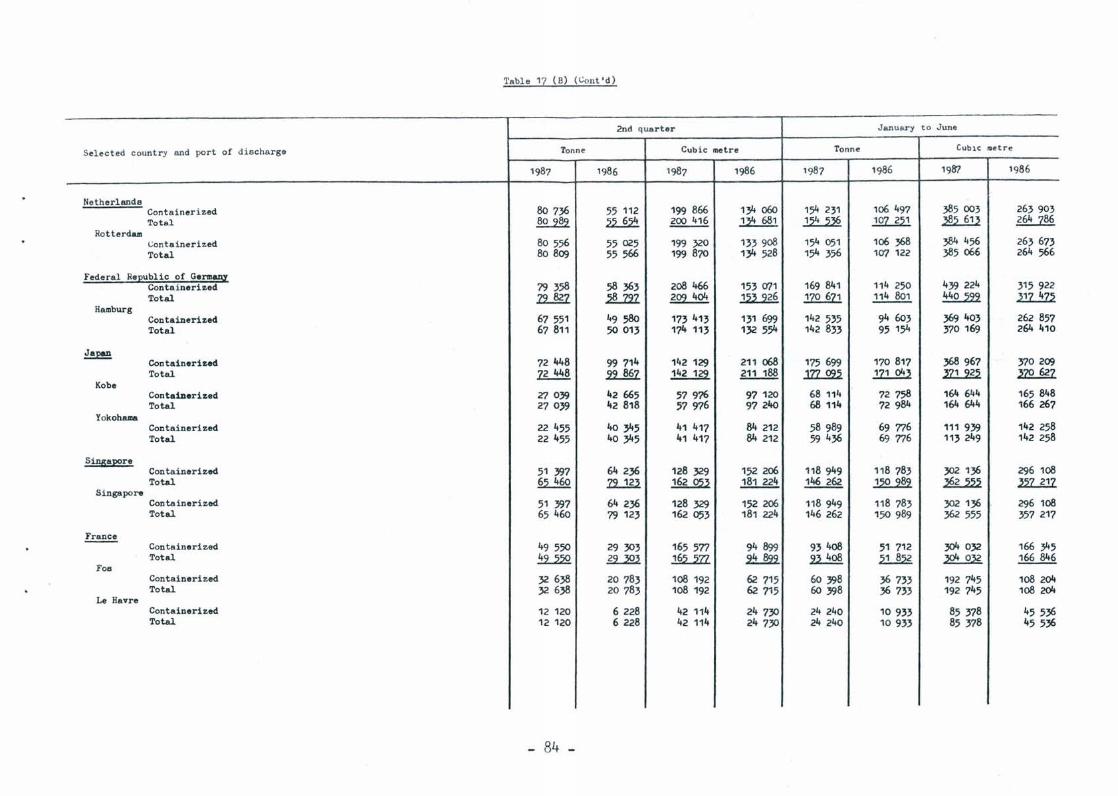
Tabl e 17 (B) (Cont' d)
2nd quarter January to June
Select ed country and port of dischar ge Tonne Cub ic metre Tonne CUb l C raetre
1987 1986 1987 1986 1987 1986 1987 1986
Netherlands Containeri zed 807}6 55 112 199 866 134 060 1~ 231 106 497 385 003 263903 Total ~ ~ 200 416 ~ ~ ~ ~ 264 786
Rotterdam Containerized 80 556 55025 199 320 133 908 154 051 106 }68 384 456 263 673 Total 80809 55566 199 870 134 528 1~ 356 107 122 385 066 264 566
Federal Republic of GermapY Conta inerized 79 358 58 }63 208 466 153 071 169 841 114 250 439 224 315 922 Total zz..m. 2§....Z21 209 404 ~ .!Z£...2Z1 114 801 ~ 2!Llli
Hamburg Containerized 67 551 49 580 173 413 131 699 142 535 94 603 }69 403 262 857 Total 67 811 50 013 174 113 132 5~ 142 833 95 1~ 370 169 264 410
~ 72448 99 714 142 129 211 068 175 699 170817 }68 967 Containeri~ed 370209
Total 72448 .22..M2. ~ 211 188 .J:l1.2t2 ~ ~ ~ Kobe
Cont.iIleri~ed Zl 039 42 665 57976 97120 68 114 72 758 164 644 165 848 Total 27 039 42 818 57 976 97240 68 114 72984 164 644 166 267
Yokohama Containerized 22 455 40 345 41 417 84 212 58 989 69 776 111 939 142 258 Total 22 455 40345 41 417 84 212 594}6 69 776 113 249 142 258
S!!!.l5a22re Containerized 51 397 64 2}6 128 329 152 206 118 949 118 783 302 1}6 296 108 Total 65460 .z2....m ~ 181 224 146 262 ~ ~ ill....ill.
Singapore Containerized 51 397 642}6 128 329 152 206 118 949 118 783 3021}6 296 108 Total 65460 79 123 162 053 181 224 146 262 150 989 }62 555 357 217
France Containerized 49 550 29 303 165 577 94899 93408 51 712 3Q4 032 166 345 Total !!2..22Q ~ .!§2...2ZZ. .2L§.22. ~ ~ ~ 166 846
Fos Containerized 32 638 20 783 108 192 62 715 60398 }6 733 192 745 108 204 Total 32 638 20 783 108 192 62 715 60 398 }6 733 192 745 108 204
Le Havre Containerized 12 120 6 228 42 114 24730 24 240 10 933 85 378 455}6 Total 12 120 6 228 42 114 24730 24 240 10933 85 378 45536
- 84 -
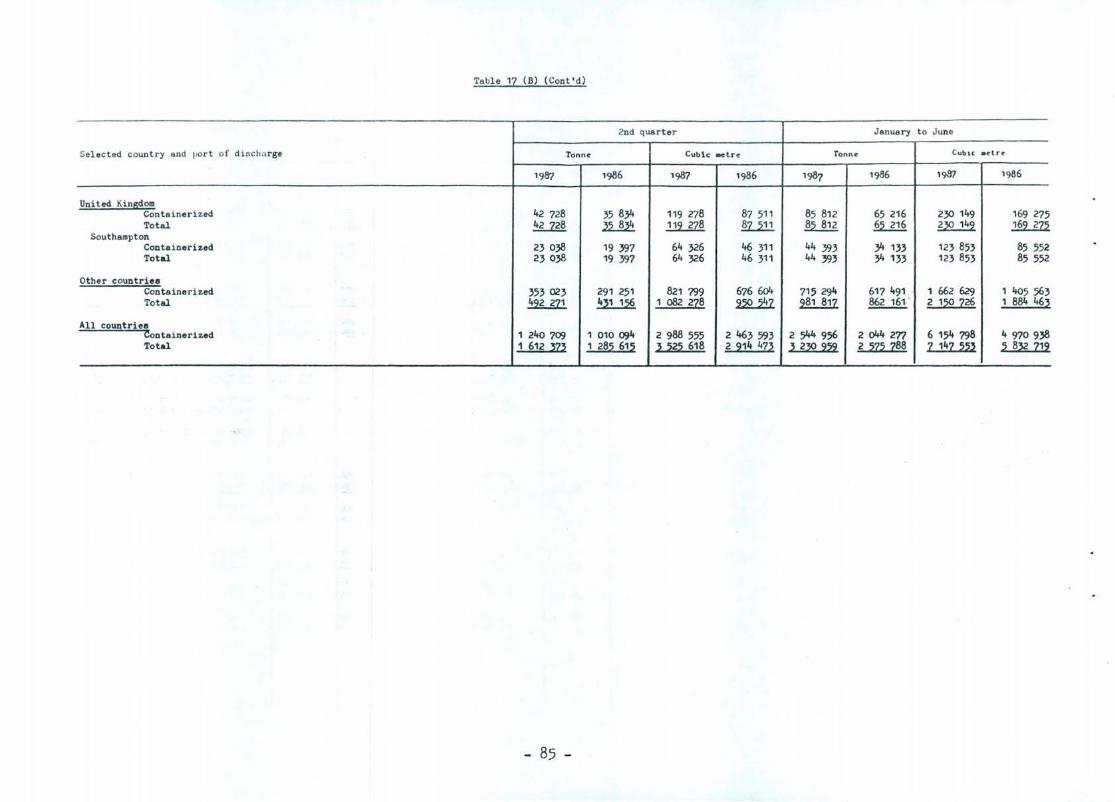
Table 17 (B) (Cont'd )
2nd quarter January to June
Selected country and port of disc harge Tonne Cubic ooetre Tonne CublC .('tre-
1987 1986 1987 1986 1987 1986 1987 1986
United Kingdom Containerized 42 728 35834 119 278 87 511 85 812 65 216 230 149 169 275 Total 42 728 ~ ~ ~ 85 812 65 216 ~ ~
Southampton Containerized 23038 19 397 64 326 46 311 44 393 34 133 123 853 85 552 Total 23038 19 397 64 326 46 311 44 393 34 133 123 853 85 552
Other countries Containerized 353023 291 251 821 799 676 604 715 294 617 491 1 662 629 1 405 563 Total ~ ~ 1 082 2Z8 ~ ~ ~' 2 1~ Z26 1 884 46~
All countries Containerized 1 240 7~ 1 010 ~4 2 988 555 2 463 593 2 544 956 2 044 271 6 154 798 4 970938 Total 1 612 :m 1 28:2 61:2 ~ ~2~ 618 2 2,4 47~ ~ 2~ 222 2 ~Z:2 Z88 Z 14Z 22:2 2 88 Z
'2
- 85 -

Table 18 (A) Inward transhipment cargo analysed by principal commodity
Principal commodity
Bulk cargo
Fertilizers, manufactured
Iron and steel
Cereals and cereal preparations
General cargo
Organic chsmicals
Textile fibres
Canned food
Artificial resins and plastic materials·, and cellulose esters and etbers
Crude animal and vegetable I118terials, n.e.s.
Inorganic chemicals
Miscellaneous manufactures of metal and non-metallic minerals, n.e.B.
Pulp and waste paper
Paper, paperboard and articles of paper pulp, of paper or of paperboard
Other machinery and equipment and parts, n.e.8.
Vegetables and fruit
Chemical materials and products, n.e.B.
Garments of mixed materials or other materials, n.e;s.
Cotton textiles
Miscellaneous edible products and preparations
Other textile products, n.e.s.
Tools, hand and powered
Total
Tonne
~
290 319
69 625
21 293
1 164 558
84 914
76260
74 516
74 508
63 592
54 763
51 312
48890
45 267
45 024
38 520
34 666
31 578
24164
23 387
22 212
20 279
1 587 523
- 86 -
2nd quarter
Cubic metre
141 011
8371
76 195
17 785
1 09' 5'7
73090
67 969
64 247
80 570
70008
31 911
35 035
42040
39 311
45039
35 069
' 9 204
26 957
15 255
29 485
25 961
11 278
1 234 548
~
313 511
44 611
33 560
2 889 615
10' 705
;78 65'
106 542
125 650
11' 486
65 514
80 057
99622
90 195
120 9~
72841
55034
195 4~
58 910
48 711
65438
427,6
3 340 156
1986
25" 895
9,420
169700
90 993
136750
131 278
40 404
59697
71 154
75 647
127 261
67537
60 837
161 606
35719
60 338
74 231
21 559
2 676378
Tonne
~
501 265
117 596
47 265
2 348 666
177 962
141 310
156 173
155 716
1'7 547
91 604
95 197
~ 909
108 285
89 594
78 510
69 326
68 561
52 037
51 185
44 895
35 522
3 097 805
J anuary to June
CUbiC Rletre
1986
271 880
16 745
154 858
33 374
2 153 715
150 828
127 210
130 193
152 568
122 536
59 925
67 212
108 851
74 603
86 075
66466
68 035
49 On
36920
43 534
46718
19013
2 431 655
798808
537 192
72 169
~ 394
5 8,6 892
223 814
335 545
222 156
265 535
241 061
108 740
150 959
150 694
213 145
247 313
149 378
109 991
411 332
127 194
108 ,87
131 261
74846
6 635 700
1986
266 135
17 972
97 965
51 593
:; 001 924
196 572
301 956
183 185
267 542
222 188
73 627
113 160
193 664
146 190
248 901
125 723
106 332
290545
88 797
87526
136 499
37902
5 268 059
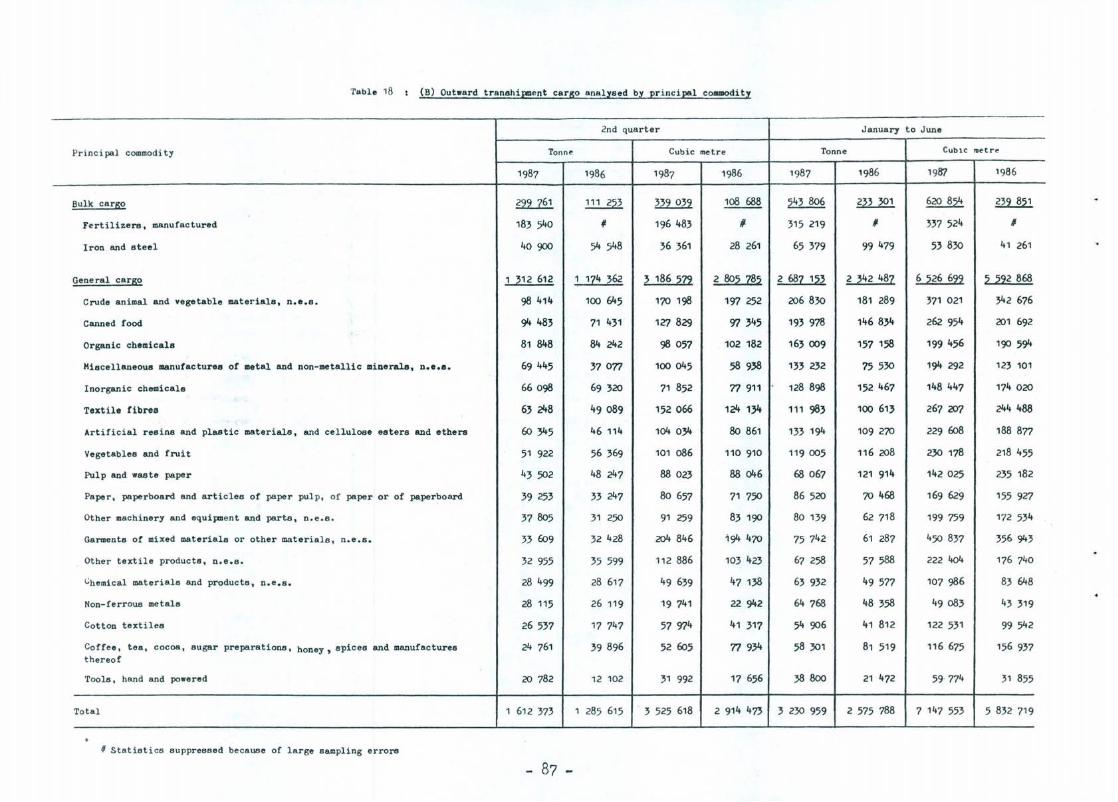
'rable 18 (B) Outward transhipment cargo analysed by principal commodity
Principal commodity
Bulk cargo
fertilizers, manufactured
Iron and steel
General cargo
Crude animal and vegetable materials, n.e.s.
Canned food
Organic chemicals
Hiscellaneous manufactures of metal and non-metallic minerals. n.e.8.
Inorganic chemicals
Textile fibres
Artificial resins and plastic materials, and cellulose esters and ethers
Vegetables and fruit
Pulp and waste paper
Paper, paperboard and articles of paper pulp, of paper or of paperboard
Other machinery and equipment and parts, n.e.s.
Garments of mixed materials or other materials , n.e.s.
Other textile products, n.e.s.
Chemical materials and products, n.e.s.
Non-ferroUB metals
Cotton textiles
Coffee, tea, cocoa, sugar preparations, honey. spices and manufactures thereof
Tools, hand and powered
Total
~ Statistics suppressed because of large sampling errore
Tonne
1 312 612
98 414
94 483
81 848
69 445
66098
63 248
60 ~5
51 922
43502
39 253
37805
33 609
32 955
28 499
28 115
26 537
24 761
20 782
1 612 373
- 87 -
2nd quarter
Cubic metre Tonne
1 174 362
100 645
71 431
84 242
37077
69320
49089
46 114
56 369
48 247
33 247
31 250
32 428
35 599
28 617
26 119
17 747
39896
12 102
1 285 615
339039
196 483
36 361
3 186 572
170 198
127 829
98 051
100045
71 852
152 066
104 O~
101 086
88 023
80 657
91 259
204 846
112 886
49 639
19 741
51974
52 605
31 992
3 525 618
108 688 543 806
# 315 219
28 261 65 379
2 805 185 2 687 153
191 252
97 345
102 182
77 911
124 1~
80 861
110 910
88 046
71 150
83 190
194 470
103 423
41 138
206830
193 918
163 009
133 232
128 898
111 983
133 194
119 005
68 061
86520
80 139
75 742
67 258
63 932
22 942 64 768
41 317 54 906
77 9~ 58301
17 656 38 800
2 914 473 3 230 959
January to June
CublC met re
1986
2;P 301
#
99 479
2 342 481
181 289
146 834
151 158
15530
152 467
100 613
109 270
116 208
121 914
70 468
62 718
61 287
57588
49577
48358
41 812
81 519
21 472
2 575 788
~
:537524
53830
6526 629
371 021
262 954
199 456
194 292
148 447
267 207
229 608
230 178
142 025
169 629
199 759
450 837
222 404
107 986
49083
122 531
116 675
59, 774
7 147 553
1986
41 261
5 592 868
~2 616
201 692
190 594
123 101
174 020
244488
188 877
218 455
235 182
155 927
172 534
356 943
176 740
83 648
43 319
99542
156 937
31 855
5 832 719
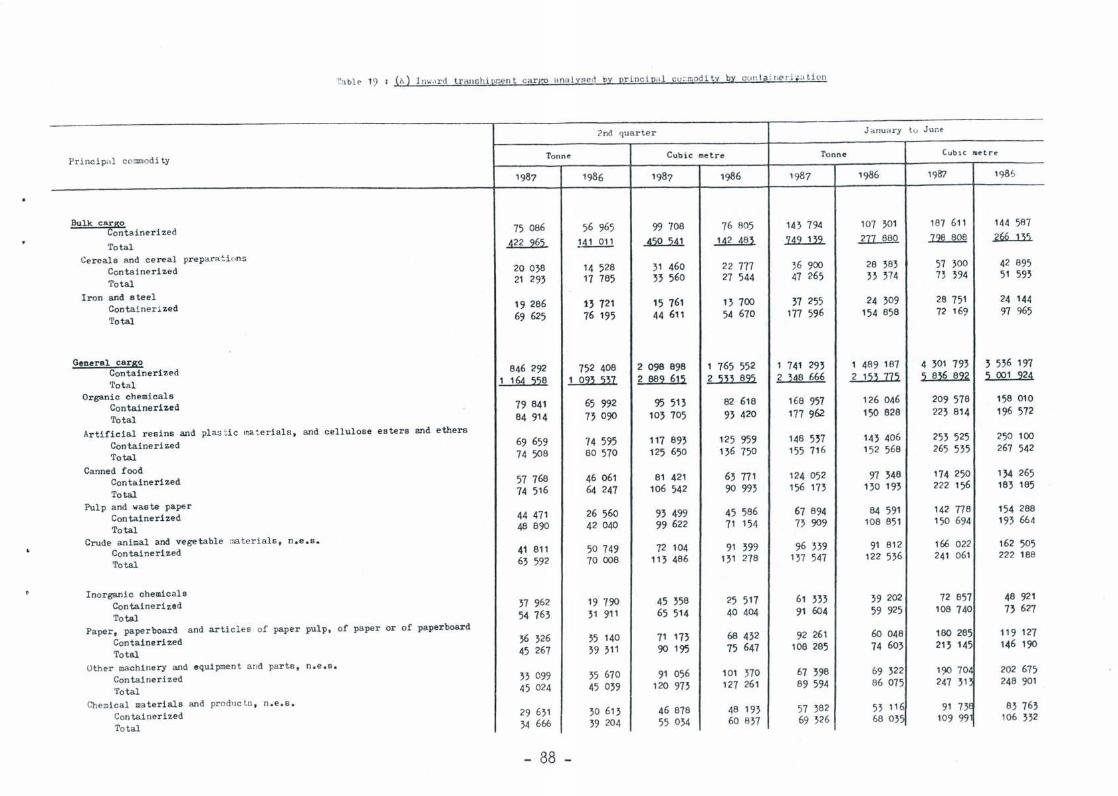
'['ablp 1') (1\ ) In" " rd transhi pr.lent cargo a nalysed by princi pa l co:.mod i t y by c(Jl! la ine! 'i p tion
2nd quar te r J anu rtry t o June
Pri nc ipal cO!lllllodi ty Tonne Cubic metre Tonne CubiC l'Detr ~
1987 1986 1987 1986 1987 1986 1987 1986
Bulk cargo Conta ineri zed 75 086 56 965 99 708 76 805 14~ 794 107 ~01 187 611 144 587
Total ~22 26:;1 1.1L2.ll .A2Q..5~ 1!l2 ~8~ H2 1~2 211 880 ~ 1.6Llli.
Cereals and cereal prepa ca t i (Jn s
Containerized 20 0~8 14 528 ~1 460 22 777 36 900 28 ~8~ 57 )00 42 895
Total 21 29~ 17 785 ~3 560 27 544 47 265 ~3 374 73 ~94 51 59~
Iron and steel Contai neri zed 19 286 1} 721 15 761 1~ 700 ;7 255 24 ~09 28 751 24 144
Total 69 625 76 195 44 611 54 670 177 596 154 858 72 169 97 965
General cars;o Containerized 846 292 752 408 2 098 898 1 765 552 1 741 29~ 1 489 187 4 301 79; 3 5~6 197
'fotal 1 1~ ~~8 1 02~ ~~1 2 882 6l~ 2 ~~~ 82:;1 2 ~~8 666 2 1:;1~ 11~ ~ 8~6 822 ~ 001 22!l
Organic chemicals Containerized 79 841 65 992 95 513 82 618 168 957 126 046 209 578 158 010
Total 84 914 7; 090 103 705 9~ 420 177962 150 828 223 814 196 572
Artificial resins and plastic ,"a~el'ials, and cellulose esters and ethers
Containerized 69 659 74 595 117 89~ 125 959 148 537 143 406 253 525 250 100
Total 74 508 80 570 125 650 1;6 750 155 716 152 568 265 535 267 542
Canned food Containerized 57 768 46 061 81 421 6~ 771 124 052 97 348 174 250 1 ~4 265
Total 74 516 64 247 106 542 90 99~ 156 173 1~0 193 222 156 18~ 185
Pulp and waste paper Con taineri zed 44 471 26 560 9~ 499 45 586 67 894 84 591 142 778 154 288
Total 48 890 42 040 99 622 71 154 7~ 909 108 851 150 694 19~ 664
Crude animal and vegetable :na t erials, n.e.s. Containerized 41 811 50 749 72 104 91 ~99 96 ~~9 91 812 166 022 162 505
Total 63 592 70008 11~ 486 1~1 278 1 ~7 547 122 536 241 061 222 188
Inorganic chemicals Con tainerized ~7 962 19 790 45 ~58 25 517 61 :m 39 202 72 857 48 921
Total 54 76~ 31 911 65 514 40 404 91 604 59 925 108 740 7~ 627
Paper, paper board and arti cl es of paper pulp, of paper or of paperboard
Containerized 36 326 35 140 71 173 68 432 92 261 60 048 180 285 119 127
Total 45 267 ~9 ;11 90195 75 647 108 285 74 60; 21; 145 146 190
Ot her machinery and eqUipment and parts, n.e.B.
Con taineri zed ~3 099 35 670 91 056 101 370 67 398 69 322 190 70~ 202 675
'fotal 45 024 45 039 120 973 127 261 89 594 86 075 247 31' 248 901
Chemical materials and pr odnc t.o , n.e.s.
Containerized 29 6~1 ~O 61; 46 878 48 19; 57 382 53 116 91 73E 8~ 76;
Total ~4 666 39 204 55 034 60 837 69 326 68 03'; 109 99 106 332
- 88 -
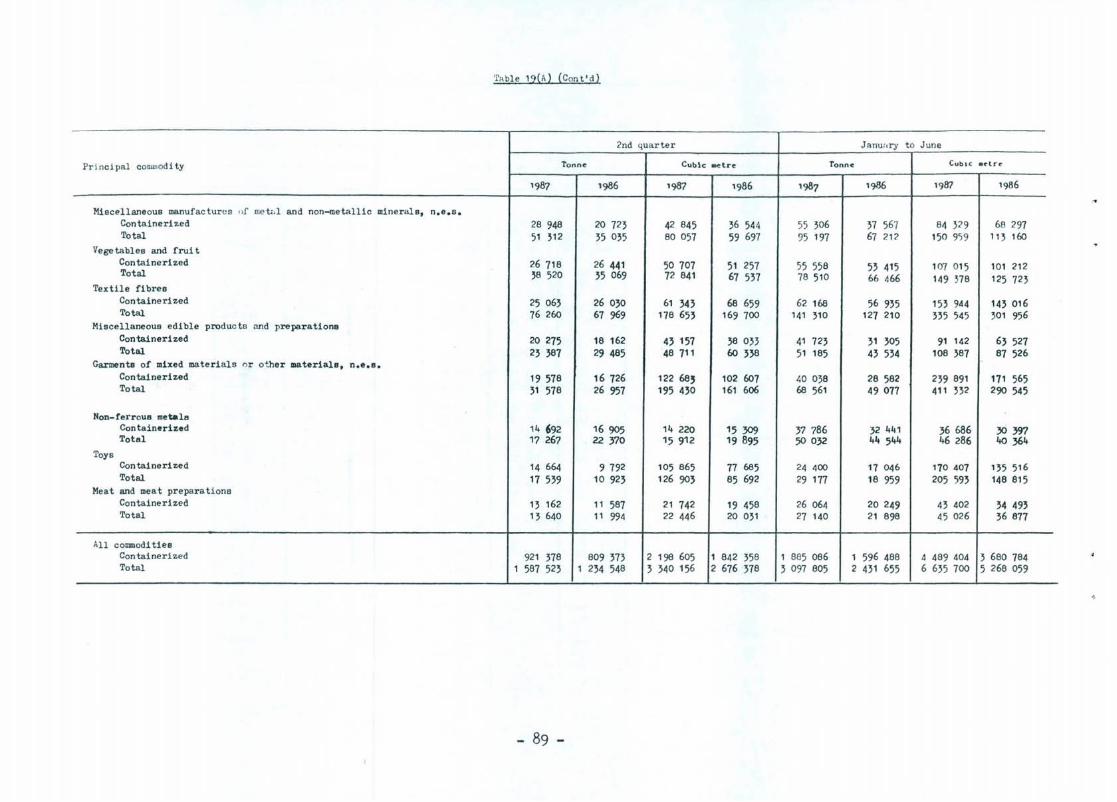
'fable 19(A) (Con t'd)
2nd quarter Janu;,ry t o J une
Principal conulLodi ty Tonne Cubic .e tre Tonne CUblC .~t('"~
1987 1986 1987 1986 1987 1986 1987 1986
Miscellaneous manufactures or met:. l and non-meta llic minerals, n.s.s. Conta inerized 28 948 20 72"5 42 845 "56 544 55 "506 "57 567 84 329 68 297 Total 51 312 "55 035 80 057 59 697 95 197 67 212 150 9'i9 113 160
Vegetables and fruit Containerized 26 718 26 441 50 707 51 257 55 558 53 415 107 015 101 212 Total "58 520 "55 069 72 841 67 537 78 510 66 466 149 n8 125 723
Textile fibres Containerized 25 06"5 26 0"50 61 343 68 659 62 168 56 935 153 944 143 016 Total 76 260 67 969 178 653 169 700 141 310 127 210 335 545 301 956
Miscellaneous edible products and preparations Containerized 20 275 18 162 43 157 38 033 41 723 31 305 91 142 63 527 Total 23 387 29 485 48 711 60 338 51 185 43 534 108 387 87 526
Garments of mixed materials or other materials, n.e.s. Containerized 19 578 16 726 122 68, 102 607 40 038 28 582 239 891 171 565 Total 31 578 26 957 195 430 161 606 68 561 49077 411 332 290 545
Non-ferrous metals Containerized 14 692 16905 14 220 15 309 37 786 32 441 36 686 30 397 Total 17 267 22 370 15 912 19 895 50 032 44 544 46 286 40 364
Toys Containerized 14 664 9 792 105 865 77 685 24 400 17 046 170 407 135 516 Total 17 539 10 923 126 903 85 692 29 177 18 959 205 593 148 815
Meat and meat preparations Containerized 1"5 162 11 587 21 742 19 458 26 064 20 249 43 402 34 493 Total 13 640 11 994 22 446 20 031 27 140 21 898 45 026 36 877
All commodities Containerized 921 378 809 373 2 198 605 1 842 358 1 885 086 1 596 488 4 489 404 3 680 784 Total 1 587 523 1 234 548 3 340 156 2 676378 "5 097 805 2 431 655 6 6"55 700 5 268 059
- 89 -
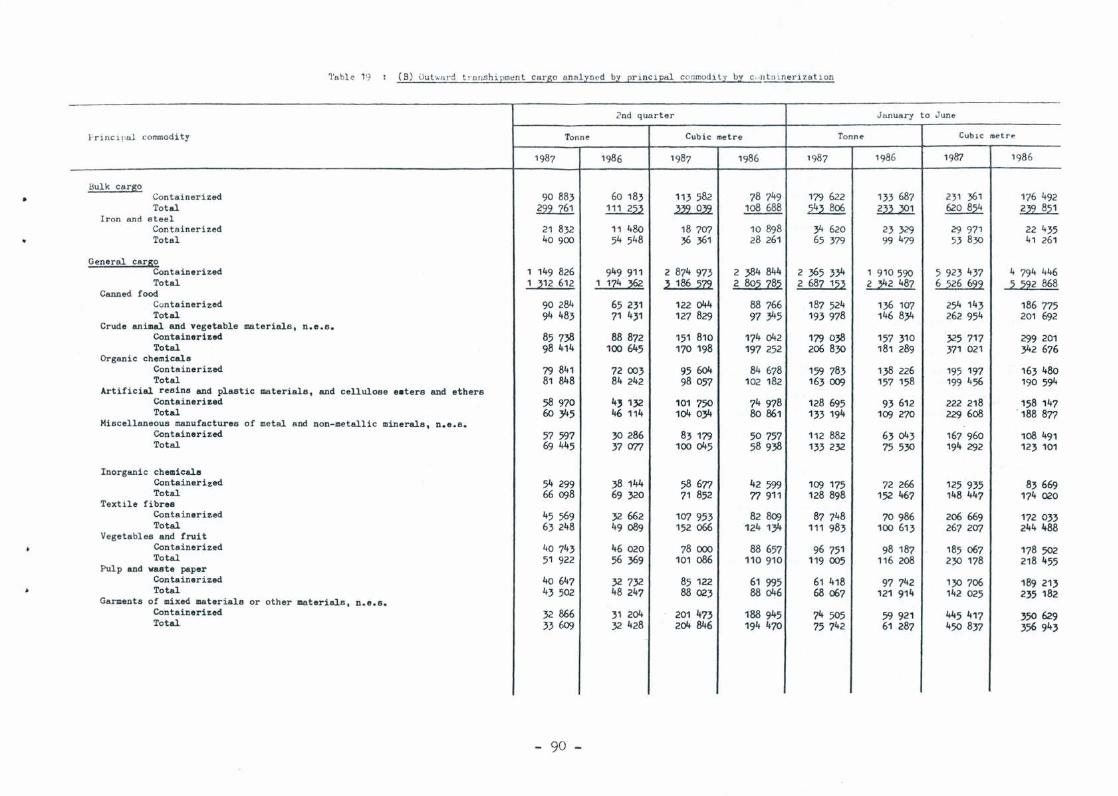
Table 19 (B) Oubmrd t! 'o llshipment cargo analysed by pr i ncipal commodit y by c"llt lll nerizatlon
2nd quarter January to June
~ rinc i pal commodi ty Tonne Cubic metre Tonn~ CUblC n:letr~
1987 1986 1987 1986 1987 1986 1987 1986
Bulk cargo • Containerized 90 883 60 183 113 582 78 749 179 622 133 687 231 361 176 492
Total ~ ~ ..m....922. 108 688 ~ .?..ll..l£2 620 854 ~ Iron and steel
Containerized 21 832 11 480 18 707 10 898 34 620 23 329 29 971 22 435 Totsl 40900 54 548 36 361 28 261 65 379 99 479 53 830 41 261
General cargo Containerized 1 149 826 949 911 2 874 973 2 384 844 2 365 334 1 910 590 5 923 437 4 794 446 Total 1 ~12 612 1 1Z4 ~ ~ 186 21.2 2 802 Z82 2 68Z 12~ 2 ~2 487 6 226 622 2 222 868
Canned food Containerized 90 284 65 231 122 044 88 766 187 524 136 107 254 143 186 775 Total 94 483 71 431 127 829 97 345 193 978 146 834 262 954 201 692
Crude animal and vegetable materials, n.e.8. Containerized 85 738 88 872 151 810 174 042 179 038 157 310 325 717 299 201 Total 98 414 100645 170 198 197 252 206 830 181 289 371 021 342 676
Organic chemicals Containerized 79 841 72003 95 604 84 678 159 783 138 226 195 197 163 480 Total 81 848 84 242 98 057 102 182 163 009 157 158 199 456 190 594
Artificial resins and plastic materials, and cellulose e.ters and ethers Containerized 58 970 4, 132 101 750 74 978 128 695 93 612 222 218 158 147 Total 60 345 46 114 104 034 80 861 133 194 109 270 229 608 . 188 877
Miscellaneous manufactures of metal and non-metallic minerals, n.e.s. Containerized 57 597 30 286 83 179 50757 112 882 63043 167 960 108 491 Total 69 445 37071 100045 58938 133 232 75530 194 292 123 101
Inorganic chemicals Con tainerized 54299 38 144 58 677 42599 109 175 72 266 125 935 83 669 Total 66 098 69 320 71 852
Textile fibres 77 911 128 898 152 467 148 447 174 020
Containerized 45 569 32 662 107 953 82 809 87 748 70 986 206 669 172 033 Total 63 248 49089 152 066 124 134 111 983 100 613 267 207 244 488
Vegetables and fruit Containerized 40 743 46 020 78000 88 657 96 751 98 187 185 067 178 502 Total 51 922 56 369 101 086 110 910 119 005 116 208 230 178 218 455
Pulp and waste paper Containerized 40 647 32 732 85 122 61 995 61 418 97 742 130 706 189 213 Total 43 502 48 247 88 023 88 046 68 067 121 914 142 025 235 182
Garments of mixed materials or other materials, n.e.s. Containerized 32 866 31 204 201 473 188 945 74 505 59 921 445 417 350629 Total 33609 32 428 204 846 194 470 75 742 61 287 450 837 356 943
- 90 -
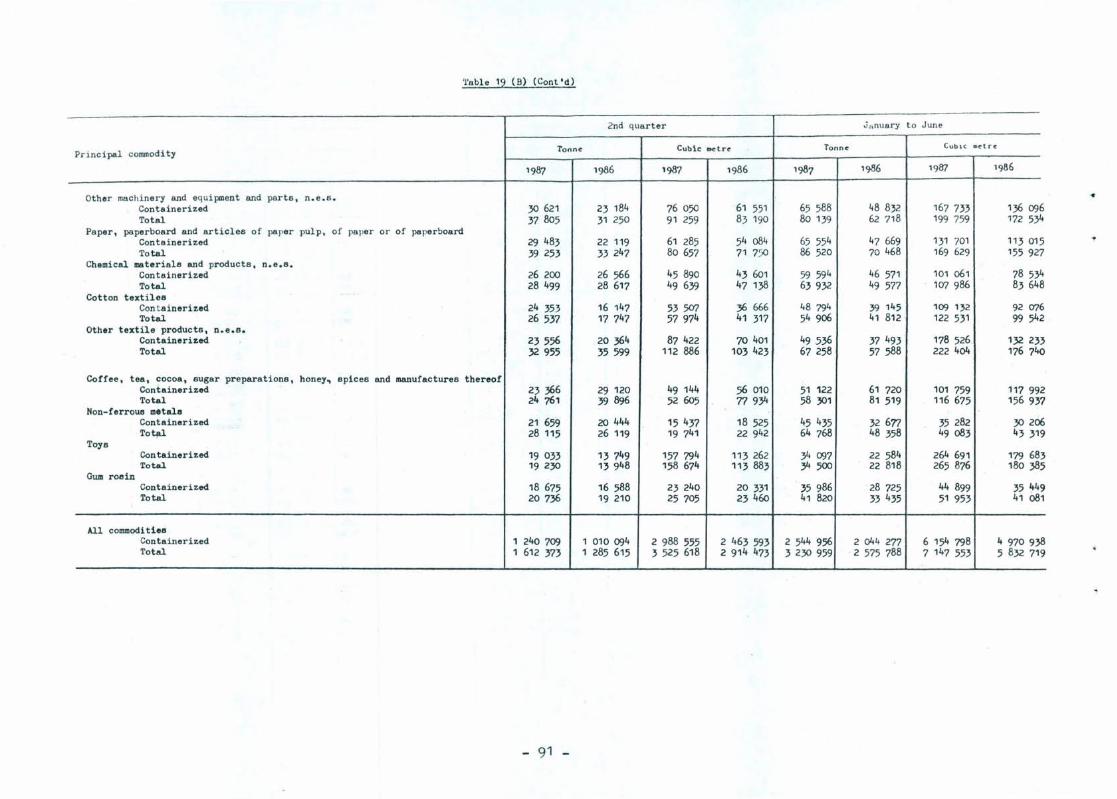
'rable 19 (B) (Cont 'd)
2nd quarter J(lnuary to June
Tonne Cub ic IlDetre Tonn~ CublC _etre Principal commodity
1987 1986 1987 1986 1987 1986 1987 1986
Other machinery and equipment and parts, n.e.8. • Containerized 30 621 23 184 76 050 61 551 65 588 48 832 167 733 136 096 Total 37 805 31 250 91 259 83 190 80 139 62 718 199 759 172 534
Paper, paperboard and articles of paper pulp, of paper or of paperboard Containerized 29 483 22 119 61 285 54 084 65 554 47 669 131 701 113 015 Total 39 253 33 247 80 657 71 750 86 520 70 468 169 629 155 927
Chemical materials and products, n.e.8. Containerized 26 200 26 566 45 890 43 601 59 594 46 571 101 061 78 534 Total 28 499 28 617 49 639 47 138 63932 49 577 107 986 83 648
Cotton textilss Con tainerized 24 353 16 147 53507 36 666 48 794 39 145 109 132 92 076 Total 26 537 17 747 57 974 41 317 54 906 41 812 · 122 531 99 542
Other textils products, n.e.s. Containerized 23556 20364 87 422 70 401 49536 37 493 178 526 132 233 Total 32 955 35 599 112 886 103 423 67 258 57 588 222 404 176 740
Coffee, tea, cocoa, sugar preparations, honey, spices and manufactures thereof Containerized 23366 29 120 49 144 56 010 51 122 61 720 101 759 117 992 Total 24 761 39896 52 605 77934 58 301 81 519 116 675 156 937
Non-ferrous metals Containerized 21 659 20 444 15 437 18 525 45 435 32 671 35 282 30 206 Total 28 115 26 119 19 741 22 942 64 768 48 358 49083 43 319
Toys Containerized 19 033 13 749 157 794 113 262 34 097 22 584 264 691. 179 683 Total 19 230 13948 158 674 113 883 34 500 22 818 265 876 180 385
Gum roein Containerized 18 675 16 588 23 240 20 331 35 986 ·28 725 44 899 35449 Total 20736 19 210 25 705 23460 41 820 33 435 51 953 41 081
All commodi ties Containerized 1 240 709 1 010 094 2 988 555 2 463 593 2 544 956 2 044 277 6 154 798 4 970 938 Total 1 612 373 1 285 615 3 525 618 2 914 473 3230 959 · 2 575 788 7 147 553 5 832 719
- 91 -
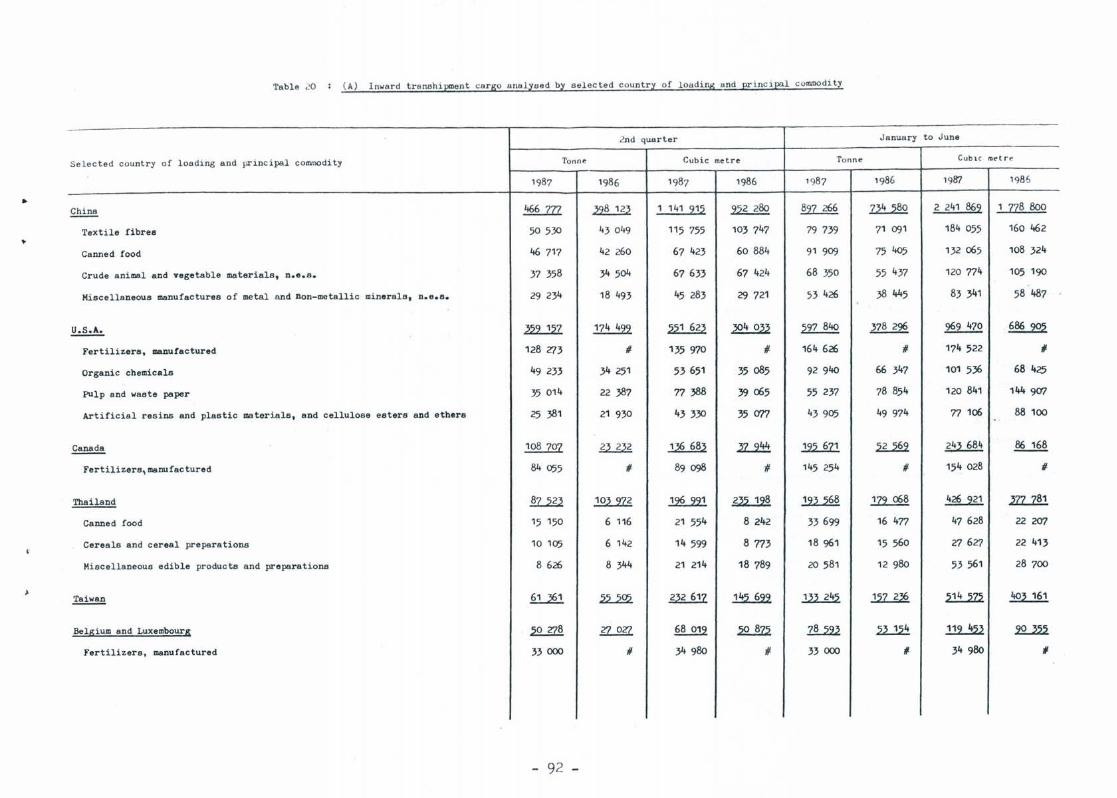
Table 20 (A) ln~ard transhi pment cargo analysed by selec ted country of loadi ng and principal commodity
2nd quarter January to June
Se l ec t ed count r y of loading and princ i pal commodi ty Ton n e Cubic met re To nne CUb l C metre
1987 1986 1987 1986 1987 1986 1987 1986
China ~ ~ 1 141 212 ~ 821 266 ~ 2 241 862 1 ZZ8 800
Textile fibres 50530 43 049 115 755 103 747 79 739 71 091 184 055 160 462
Canned food 46 717 42 260 67 423 60 884 91 909 75 405 132 065 108 324
Crude animal and vegetable materials, n.e.s. 37 358 34 504 67 633 67 424 68 350 55 437 120 774 105 190
Miscellaneous manufactures of metal and non-metallic minerals, n.e.s. 29 234 18 493 45 283 29 721 53 426 38 445 83 341 58 487
~ ~ ~ 221..lli ~ 597 840 378 296 969 470 ~
Fertilizers, manufactured 128 273 # 135 970 # 164 626 # 174 522 #-
Organic chemicals 49 233 34 251 53651 35 085 92940 66 347 101 536 68 425
PUlp and waste paper 35 014 22 387 77 388 39 065 55 237 78 854 120 841 144 907
Artificial resins and plastic materials, and cellulose esters and ethers 25 381 21 930 43330 35 077 43905 49 974 77106 88 100 -.
~ 108 70Z ~ ~ ~ ~ ~ 243 684 86 168
Fertilizers, manufactured 84055 # 89 09B # 145 254 # 154 028 I-
Thailand .llL22 ~ ~ ~ ~ ~ 426 221 .m....:z!!1 Canned food 15 150 6 116 21 554 8 242 33 699 16 477 47 628 22 207
Cereals and cereal preparations 10 105 6 142 14599 8773 18 961 15 560 27 627 22 413
Miscellaneous edible products and preparations 8 626 8 344 21 214 18 789 20 581 12 980 53 561 28 700
~ ll.l§1 ~ ~ ~ ~ ~ ~ 403 161
Belsium and Luxembours 2.Q.£l§. n.gz 68 012 ~ ~ ~ ~ .22..1.22
Fertilizers , manufactured 33000 11 34980 # 33000 I- 34980 -I
- 92 -
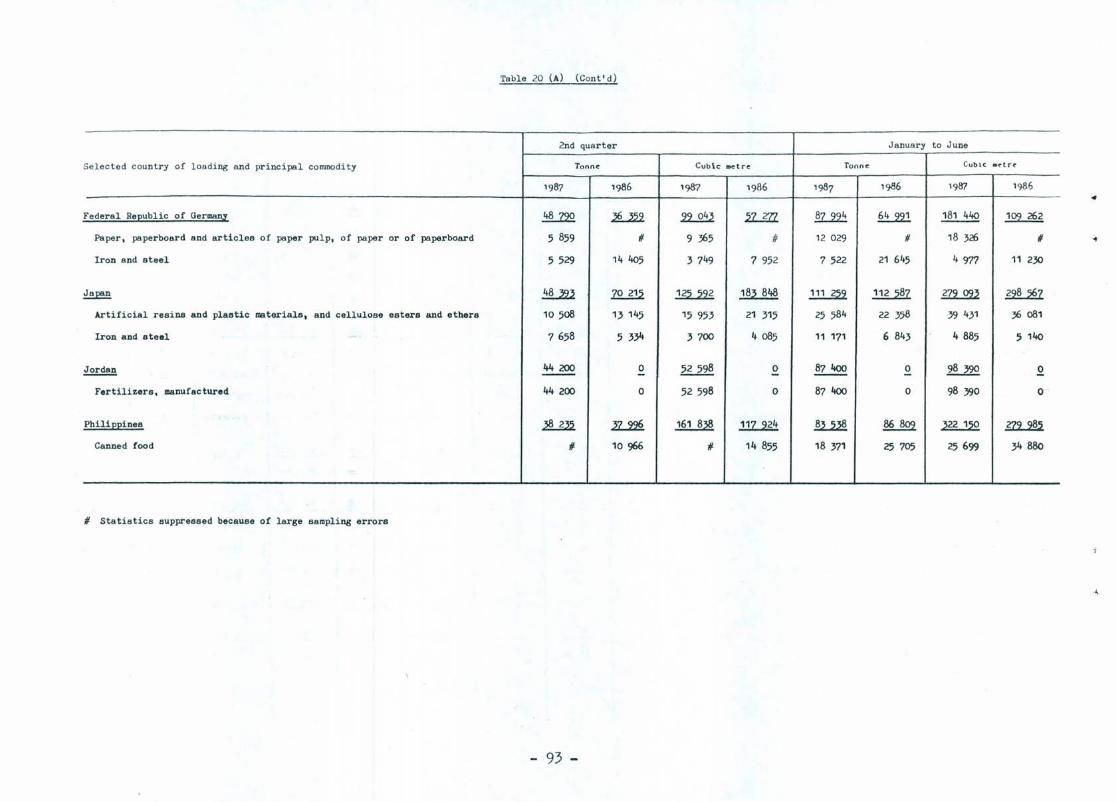
Table 20 (A) (Cont'd)
2nd quarter January to June
Selected country of loading and principal commodity Tonne Cubic ~tre Tonne Cub i c .~tre
1987 1986 1987 1986 1987 1986 1967 1986
Federal ReEublic of Germanl ~ ~ ~ 2:Lff1 ~ ~ ~ ~ Paper, paperboard and articles of paper pulp, of paper or of paperboard 5 859 11 9 365 # 12 029 11 18 326 11
Iron and steel 5529 14 405 3749 7 952 7 522 21 645 4977 11 230
~ ~ 122!.2 ~ 183 848 ~ .!.!U.§1 ~ ~
Artificial resins and plastic materials, and cellulose estars and ethers 10508 13 145 15 953 21 315 25 584 22 358 39 431 36 081
Iron and steel 7 658 5 334 3700 4085 11 171 6 843 4 885 5 140
~ 44 200 0 52 598 0 87400 0 98 390 0 --- - - -Fertilizers, manufactured 44200 0 52 598 0 87 400 0 98 390 0-
PhiliEEines ~ 2l.:1:l§. ~ ~ ~ ~ ~ ~
Canned food 11 10966 11 14855 18 371 25 705 25699 34880
11 statistics suppressed because of large sampling errors
- 93 -
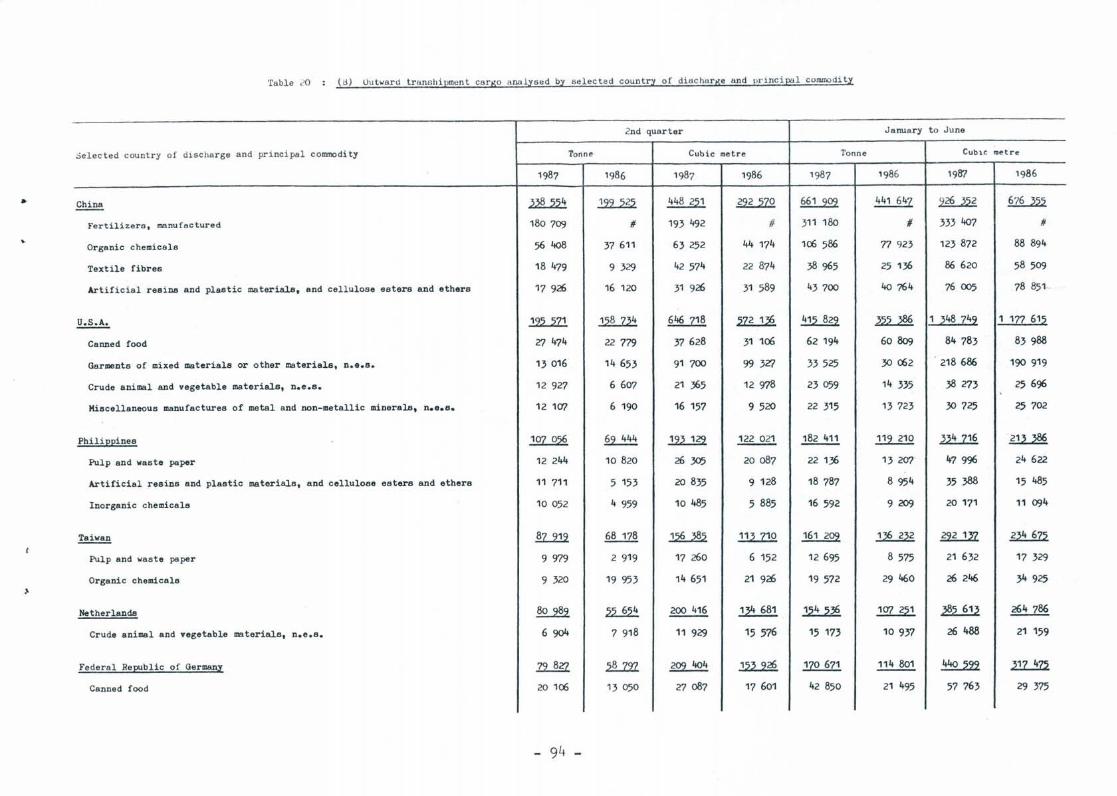
Table ,,0 ( ll) Outwar d transhipment carKo BllDlyse d by sel ected country of discharlle and principal commodity
2nd quarter January t o June
Selected country of discharge and principal commodity Ton ne Cubic metre Tonne CUblC raetre
1987 1986 1987 1986 1987 1986 198'7 1986
China ~ .222....22. 448 251 ~ ~ 441 647 ~ ~
Fertilizers, manufactured 180 709 "# 193 492 #- 311 180 # 333 407 #
Organic chemicals 56408 37 611 63 252 44 174 106 586 77 923 123 872 88 894
Textile fibres 18 479 9 329 42 574 22 874 38 965 25 136 86 620 58509
Artificial resins and plastic materials, and cellulose esters and ethers 17 926 16 120 31 926 31 589 43700 40 764 76 005 78 851 ..
~ 12.2.....2.Z.! ~ 646 718 ~ ~ ~ 1 ~48 Z42 1 177 61~
Canned food 27 474 22 779 37628 31 106 62 194 60809 84783 83988
Garments of mixed materials or other materials, n.8.8. 13 016 14653 91 700 99 3Z7 33525 30 062 218 686 190 919
Crude animal and vegetable materials, n.e.s. 12 927 6 607 21 365 12 978 23059 14 335 38 273 25696
Miscellaneous manufactures of metal and non-metallic minerals, n.e.8. 12 107 6 190 16 157 9520 22 315 13 723 30 725 25 702
PhiliEEines ~ 62 444 ~ ~ 182 411 119 210 ~ mA Pulp and waste paper 12 244 10820 26305 20 087 22 136 13 207 47996 24 622
Artificial resins and plastic materials, and cellulose esters and ethers 11 711 5 153 20 835 9 128 18 787 8 954 35 388 15 485
Inorganic chemicals 10 052 4 959 10 485 5 885 16 592 9 209 20 171 11 094
~ ~ 68 178 ~ .!.ll.1!2. ~ ~ ~ ~
Pulp and wasta paper 9 979 2 919 17 260 6 152 12695 8 575 21 632 17 329
Organic chemicals 9 320 19 953 14 651 21 926 19572 29 460 26 246 34 925
Netherlands ~ ~ 200 416 ~ ~ 107 251 ~ 264786
Crude animal and vegetable materials, n.e.B. 6 ')04 7 918 11 929 15576 15 173 10937 26488 21 159
Federal Re~blic of Germanl ~ 2.§....Z21 ~ ~ 1Z0 671 114 801 ~ ~
Canned food 20 106 13 050 27087 17 601 42850 21 495 57 763 29 375
- 94 -
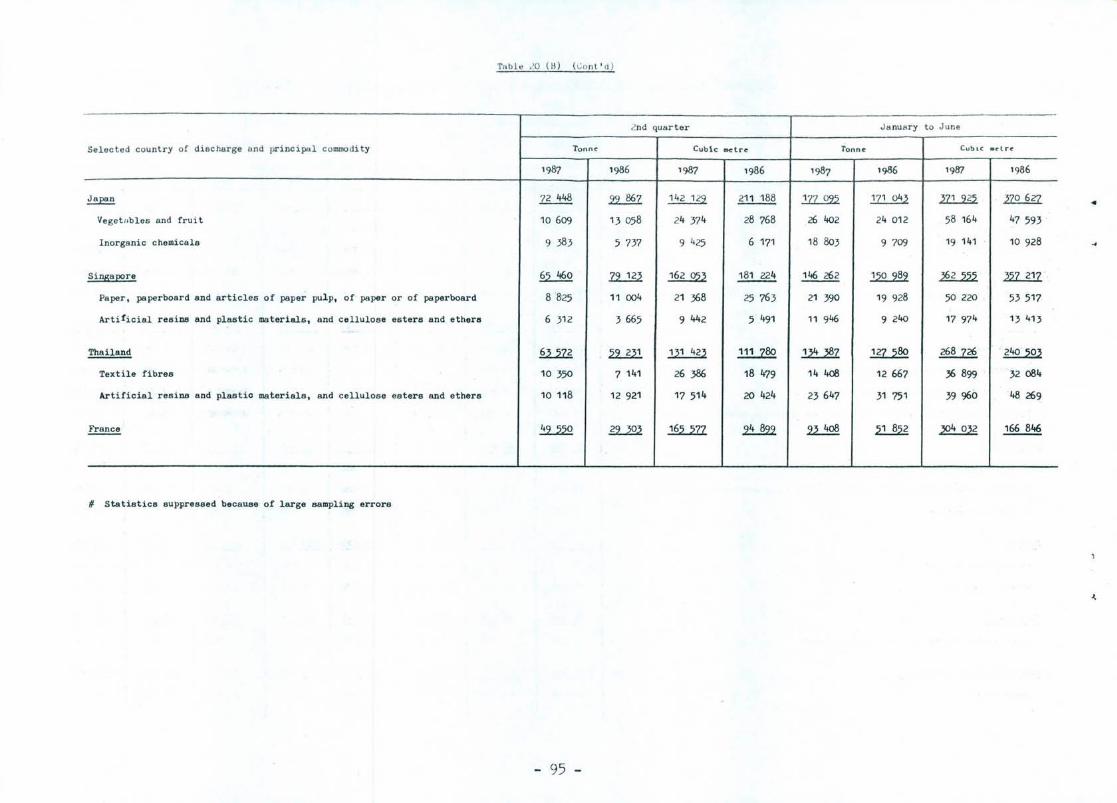
'!'"ble 20 (B) (Conl' d )
2nd quarter J anuary to June
Selected country of discharge and principal commo dity Tonne Cubic metre Tonne Cutu c .<r-lre-
1987 1986 1987 1986 1987 1986 1987 1986
~ '12 448 ~ 142 129 211 188 ~ 171 043 2l.l..2?2. ~ .. Vegetllb l es and frui t 10609 13 058 24 374 28 768 26 402 24 012 . 58 164 47 593
Inorganic chemicals 9 383 5 737 9 425 6 171 18 803 9 709 19 141 10 928
Si!!£jsE2re 65 460 12.....!Q ~ 181 224 ~ ~ ~ 22.Z2!1 Paper, paperbosrd and articles of paper pulp, of paper or of paper board 8825 11 004 21 368 25 76 3 21 390 19 928 50 220 53 517
Artificial resins and plastic materials, and cellulose esters and ethers 6 312 3665 9 442 5 491 11 946 9240 17 974 13 413
Thailand ll2E. ~ ~ 111 780 ~ ~ 268726 .. 240 503
Textile fibres 10 350 7 141 26 386 18 479 14 408 12 667 36 899 32084
Artificial resins and plastic materials, and cellulose esters and ethers 10 118 12 921 17 514 20 424 23 647 31 751 3996b "48 269
Frsnce ~ ~ 2§2..m 2U22 ~ ~ ~ ~
# statistics suppressed because of large B8mpling errors
- 95 -
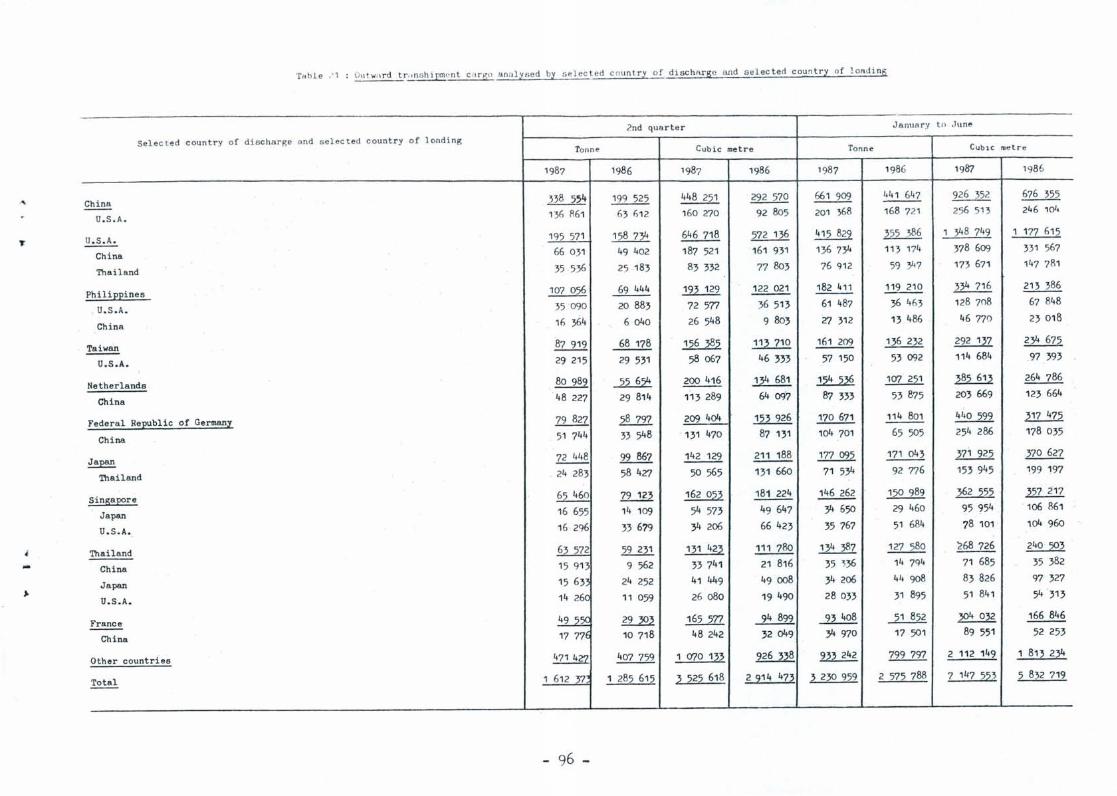
Table <' 1 Outward tr.onshipmcnt cilr~o '''I''lysed by "elected country of dischArge and selec terl country of lORdi ng
2nd quarter January t o June
Selec t ed country of dischar~e and select ed country of loading Tonne Cubic metre Tonne CUbiC metr e
1987 1986 1987 1986 1987 1986 198'7 1986
' .. China 338 554 199 525 448 251 292 570 661 909 441 647 926 ~52 676 355
U.S.A. 13/) 1\61 63 /)12 160 270 92 805 201 368 168 721 256 513 246 104
~ 195 571 158 734 646 718 572 136 415 829 355 386 1 348 749 1 177 615
China 66 031 49 402 187 521 161 931 136 734 113 174 378 609 331 567
Thailand 35536 25 183 83 332 77 803 76 912 59 347 173 671 147 781
Philippines 107 056 69 444 193 129 ~ 182 411 119 210 334 716 213 386
U.S.A. 35090 20 883 72 571 36 513 61 487 36 4/)3 128 7()8 67 848
China 16 364 6 040 26 548 9 803 27 312 13 ,486 46 770 23 018
~ 87 919 68 178 156 385 113 710 161 209 136 232 292 137 234 675
U.S.A. 29 215 29 531 58 067 46 333 57 150 53 092 114 684 ,97 393
Netherlands 80 989 ~ 200 416 ~ ~ 107 251 ~ 264 786
China 48 227 29 814 113 289 64 097 87 333 53 875 203 669 123 664
Federal Republic of Germany 79 827 58 797 209 404 .12L.2?i 170 671 114 801 440 599 317 475
China 51 744 33 548 ' 131 470 87 131 104 701 65 505 254 286 178 035
~ 72 448 99 867 142 129 ~ 177 095 171 043 371 925 370 627
Thailand 24 283 58 427 50 565 131 660 71 534 92 716 153 945 1,99 197
Singapore ~ 79 123 ~ 181 224 146 262 150 989 362 555 357 217
Japan 16 655 14 109 54 573 49 647 34 650 29 460 95 954 106 861
U.S.A. 16296 33 679 34 206 66 423 35 767 51 684 78 101 104 960
... Thailand ll..ZE 59 231 131 423 111 780 134 387 127 580 ~68 726 240 503
China 15 913 9 562 33 741 21 816 35 ~36 14 794 71 685 35 382
Japan 15 63~ 24 252 41 449 49 008 34 206 44 908 83 826 97 327
U.S.A. 14 260 11 059 26080 19 490 28033 31 895 51 841 54313
France ~ 29 303 165 571 94 899 93 408 51 852 ~ 166 846
China 17 776 10 718 48242 32049 34 970 17 501 89 551 52 253
Other countries ~ 407 759 1 070 1~3 926 }38 933 242 199 797 2 112 149 1 813 234
Total 1 612 37 1 285 615 ~ 522 618 2214 473 ~ 230 959 2 575 788 7 147 523 5 832 719
- 96 -
..
...
11/87 $19.5--J590287