
Hochleistungsrechnen in Baden-Württemberg - Karlsruher ...
250
Hochleistungsrechnen in Baden-Württemberg Ausgewählte Aktivitäten im bwGRiD Beiträge zu Anwenderprojekten und Infrastruktur im bwGRiD 2012 Janne Chr. Schulz und Sven Hermann (Hrsg.)
-
Upload
khangminh22 -
Category
Documents
-
view
0 -
download
0
Transcript of Hochleistungsrechnen in Baden-Württemberg - Karlsruher ...
Hochleistungsrechnen in Baden-Württemberg Ausgewählte Aktivitäten im bwGRiD
Beiträge zu Anwenderprojekten und Infrastruktur im bwGRiD 2012
Janne Chr. Schulz und Sven Hermann (Hrsg.)


Janne Chr. Schulz und Sven Hermann (Hrsg.)
Hochleistungsrechnen in Baden-Württemberg — Ausgewählte Aktivitäten im bwGRiD 2012
Beiträge zu Anwenderprojekten und Infrastruktur im bwGRiD im Jahr 2012

Hochleistungsrechnen in Baden-Württemberg — Ausgewählte Aktivitäten im bwGRiD 2012
Beiträge zu Anwenderprojekten und Infrastruktur im bwGRiD 2012
von Janne Chr. SchulzSven Hermann (Hrsg.)

Print on Demand 2014
ISBN 978-3-7315-0196-1 DOI 10.5445/KSP/1000039516
This document – excluding the cover – is licensed under the Creative Commons Attribution-Share Alike 3.0 DE License
(CC BY-SA 3.0 DE): http://creativecommons.org/licenses/by-sa/3.0/de/
The cover page is licensed under the Creative Commons Attribution-No Derivatives 3.0 DE License (CC BY-ND 3.0 DE):
http://creativecommons.org/licenses/by-nd/3.0/de/
Impressum
Karlsruher Institut für Technologie (KIT) KIT Scientific Publishing Straße am Forum 2 D-76131 Karlsruhe
KIT Scientific Publishing is a registered trademark of Karlsruhe Institute of Technology. Reprint using the book cover is not allowed.
www.ksp.kit.edu
Vorwort
Das bwGRiD, eine einzigartige Kooperation zwischen den Hochschulendes Landes Baden-Württemberg, blickt inzwischen auf eine vierjährige Er-folgsgeschichte zurück. Das Projekt startete im Jahr 2008 an acht Universi-täten des Landes Baden-Württemberg, um Wissenschaftlern aller Diszipli-nenen Ressourcen im Bereich des High Performance Computings effizientund hochverfügbar zur Verfügung zu stellen. Im Vordergrund steht der Auf-bau einer dezentralen Grid-Infrastruktur, bei der homogene Parallelrechner-Cluster transparent zu einem Grid-Verbund gekoppelt werden. Das Projektsoll die Machbarkeit und den Nutzen von Grid-Konzepten für die Wissen-schaft nachweisen und bisherige Organisations- und Sicherheitsproblemati-ken überwinden. Die Grid-Struktur ermöglicht eine Spezialisierung der ein-zelnen Rechenzentren im Anwendungs- und Hardwarebereich, sowie dieEntwicklung neuer Cluster- und Softwarewerkzeuge. Das bwGRiD wurdedarüberhinaus Bestandteil der bundesweiten D-Grid-Initative.Das Bundesministerium für Bildung und Forschung (BMBF) und das Mi-nisterium für Wissenschaft, Forschung und Kunst in Stuttgart haben zurRealisierung insgesamt über 5 Mio. Euro bereitgestellt, die sowohl in denAufbau der Hardware-Infrastruktur als auch in die Betreuung des Gridsfliessen. In Bezug auf die Form der Zusammenarbeit der Hochschulrechen-zentren und im Vergleich zu ähnlichen Strukturen in anderen Bundeslän-dern ist diese Infrastruktur einzigartig. Die bwGRiD-Nutzer finden seit Mit-te 2010 an allen acht bwGRiD Cluster-Standorten eine Einheitsumgebungvor, die es ihnen ermöglicht, mit ihren Anwendungen problemlos von ei-nem Standort zu einem anderen zu wechseln, ohne das die Programme neukonfiguriert oder eingerichtet werden müssen. Auf diese Weise werden diegroßen Rechenressourcen optimal genutzt.
I
Das bwGRiD bietet seinen Nutzern mit täglich insgesamt über 340 TausendCPUh eine große Rechenkapazität an, die weit über das an einem Universi-tätsrechenzentrum üblicherweise verfügbare Maß hinaus geht. Zudem ent-stand durch Profilbildung bei der Auswahl der unterstützten Software einelandesweite Kooperation bei der Nutzerunterstützung.
Durch eine Erweiterung des Projektes im vergangenen Jahr mit den soge-nannten ”ergänzenden Maßnahmen” für den Zeitraum von Juli 2011 bisEnde Juni 2013 sollen die Weichen für die Zukunft des bwGRiDs gestelltwerden: Die standortunabhängige Nutzung soll weiter verbessert, der Zu-griff weiter erleichtert und der Kreis der Nutzer sowie die zugehörige Be-treuung ausgeweitet werden. Die ”ergänzenden Maßnahmen” bieten gleich-zeitig die Grundlage für zukünftige HPC-Entwicklungen im Lande.
Das Projekt kann als eine Antwort auf die Erkenntnis verstanden werden,dass die heutigen Anforderungen in der Wissenschaft, sowohl bezogen aufdie angeforderte Rechenkapazität, die Flexibilität der Bereitstellung oderdie Vielfalt der untersuchten Problemstellungen und hierfür eingesetztenSoftware, als auch die breite Nutzerunterstützung und die standortübergrei-fende Benutzerverwaltung, nicht mehr von einem einzelnen Universitätsre-chenzentrum gelöst werden können. Tendenzen im kommerziellen Umfeldwie das Cloud-Computing und die Konzentration bestimmter Standardser-vices zeigen, dass nur durch Konzentration und Spezialisierung die notwen-digen Kapazitäten für ein breites Angebot geschaffen werden können.
Durch die nun über vierjährige Zusammenarbeit der Rechenzentren im Lan-de hat sich eine neue Kooperationskultur herausgebildet, die sich in ande-ren gemeinsamen Projekten manifestiert. Das Projekt bwIDM beschäftigtsich mit den Grundlagen eines landesweiten Identity Managements, wel-ches nicht nur für die heutigen bwGRiD-Strukturen sondern auch für ande-re gemeinsame Landesdienste und zukünftige HPC-Projekte eine zentraleRolle spielt. Mit dem Projekt bwFLA werden Überlegungen und Konzep-te für einen langfristigen Zugriff auf digitale Daten und Umgebungen, wiesie auch im Forschungsdatenmanagement benötigt werden, entwickelt undrealisiert. Nicht zuletzt manifestiert sich das bwGRiD und die etablierte Ko-operation der Rechenzentren in den Konzepten für die nächste Generationdes High Performance Computings im Lande indem die Erfahrungen des
II
bwGRiD Projektes genutzt und auf Basis der erfolgreich kooperierendenArbeitsgruppen neue Ansätze verfolgt werden.Der 8. bwGRiD/BFG Workshop in Freiburg bot die Chance, einen breitenÜberblick sowohl zum technischen und organisatorischen Stand des Pro-jektes zu verschaffen, Anwender und Administratoren gleichsam zu Wortkommen zu lassen und den Austausch zwischen den Anwender–Commu-nities zu fördern. Zudem erlaubte der Workshop nach vier Jahren Projekt-laufzeit ein Zwischenfazit des Erreichten zu ziehen und mögliche zukünfti-ge Entwicklungen zu diskutieren. Mit diesem Hintergedanken erfolgte dieAuswahl der eingeladenen und aus einem Call-for-Papers hervorgegange-nen Beiträge, die den Peer-Review Prozess erfolgreich überstanden haben.Aus diesen Beiträgen konnte ein breites Programm zusammengestellt wer-den, welches in der Keynote auf die Vorgeschichte des bwGRiDs einging,eine Reihe spannender Anwendungen des HPC vorstellte und verschiedeneadministrative Fragestellungen diskutierte.Die Veranstalter möchten sich bei den Autoren für die eingereichten Bei-träge, bei dem Programmkommitee für die Auswahl und bei den Organisa-toren für die Durchführung des Workshops ganz herzlich bedanken. Nichtalle eingereichten Beiträge konnten für das Vortragsprogramm oder denhier vorliegenden Sammelband wegen des begrenzten Zeit- oder Platzum-fangs vorgesehen werden. Der vorliegende Band verfolgt einen dreiteiligenAufbau.Der erste Teil ist der Geschichte und dem aktuellen Status des bwGRiDsgewidmet. Dazu kommen einerseits das Ministerium durch ein Geleitwortund andererseits einer der Väter des Projekts zur ”Geburt des bwGRiD” zuWort. Der gemeinsame Beitrag von Mitarbeitern des bwGRiDs mit einerBestandsaufnahme rundet den ersten Teil ab.Im zweiten Teil kommen die bwGRiD-Anwender zu Wort, die beeindru-ckende Projekte aus den unterschiedlichsten Disziplinen präsentieren. DieAutoren Karsten Fischer et al. präsentieren Ergebnisse aus der geomecha-nischen Forschung während die Autoren Vincent Heuveline et al. Metho-den für die Berechnung von Flüssigkeiten im 3D-Raum untersuchen. Einenaktuellen Einblick in die Forschung und in die Anwendung von Computer-Clustern im Bereich der Linguistik bietet der Beitrag von Ulrike Schneider
III

und die Autoren Jan P. Meier-Kolthoff et al. stellen einen Ansatz zur effizi-enten Verarbeitung von Genomdaten auf dem bwGRiD vor.Der dritte, mit ”Administration” überschriebene Teil, ist eher technisch ori-entiert und befasst sich mit verschiedenen Aspekten des HPC-Betriebs, dievon Fragen des effektiven Deployments bis hin zu Herausforderungen beider richtigen Wahl der Netzwerkschnittstellen und Dateisysteme liegen.
Abschließend kann festgehalten werden, dass das bwGRiD zu einem wert-vollen, nützlichen und unverzichtbaren Werkzeug für viele Forscherinnenund Forscher geworden ist, wie die Vielfalt der in diesem Sammelband vor-liegenden Beiträge und wie der dreitägige bwGRiD/BFG Workshop in Frei-burg zeigen.
Sven Herrman und Gerhard SchneiderFreiburg, den 25. Mai 2012
IV


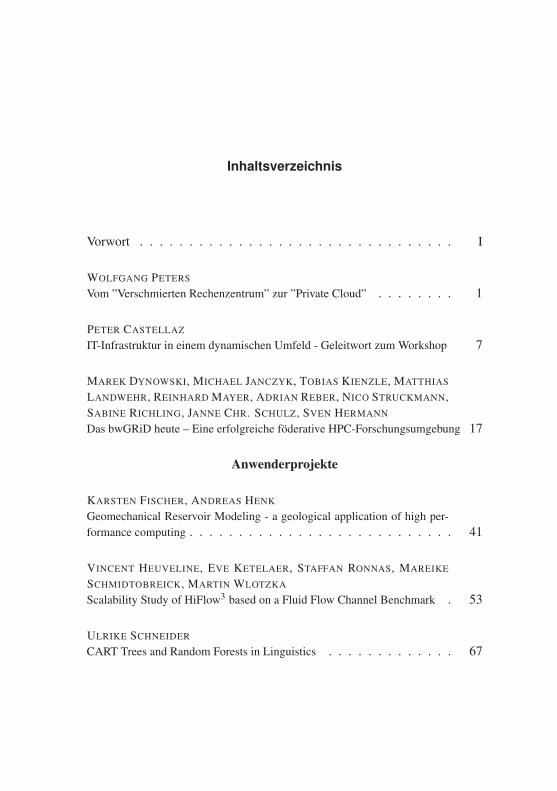
Inhaltsverzeichnis
Vorwort . . . . . . . . . . . . . . . . . . . . . . . . . . . . . . . . I
WOLFGANG PETERS
Vom ”Verschmierten Rechenzentrum” zur ”Private Cloud” . . . . . . . . 1
PETER CASTELLAZ
IT-Infrastruktur in einem dynamischen Umfeld - Geleitwort zum Workshop 7
MAREK DYNOWSKI, MICHAEL JANCZYK, TOBIAS KIENZLE, MATTHIAS
LANDWEHR, REINHARD MAYER, ADRIAN REBER, NICO STRUCKMANN,SABINE RICHLING, JANNE CHR. SCHULZ, SVEN HERMANN
Das bwGRiD heute – Eine erfolgreiche föderative HPC-Forschungsumgebung 17
Anwenderprojekte
KARSTEN FISCHER, ANDREAS HENK
Geomechanical Reservoir Modeling - a geological application of high per-formance computing . . . . . . . . . . . . . . . . . . . . . . . . . . . 41
VINCENT HEUVELINE, EVE KETELAER, STAFFAN RONNAS, MAREIKE
SCHMIDTOBREICK, MARTIN WLOTZKA
Scalability Study of HiFlow3 based on a Fluid Flow Channel Benchmark . 53
ULRIKE SCHNEIDER
CART Trees and Random Forests in Linguistics . . . . . . . . . . . . . 67
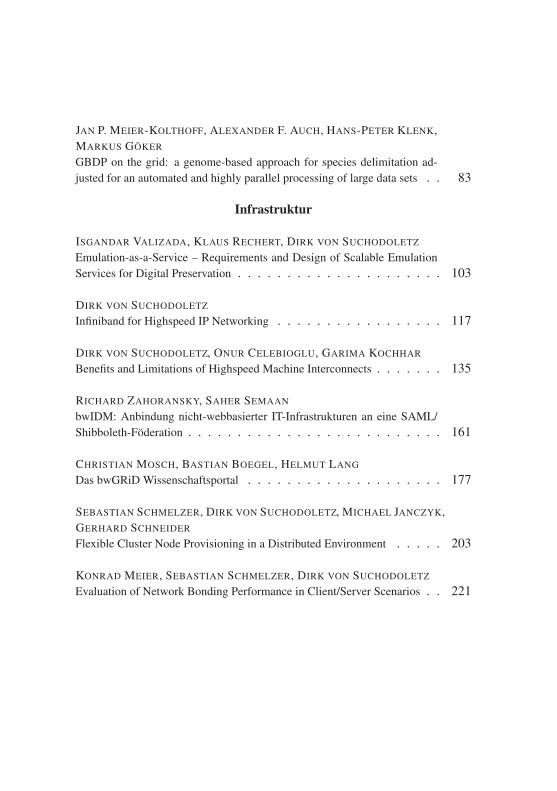
JAN P. MEIER-KOLTHOFF, ALEXANDER F. AUCH, HANS-PETER KLENK,MARKUS GÖKER
GBDP on the grid: a genome-based approach for species delimitation ad-justed for an automated and highly parallel processing of large data sets . . 83
Infrastruktur
ISGANDAR VALIZADA, KLAUS RECHERT, DIRK VON SEmulation-as-a-Service – Requirements and Design of Scalable EmulationServices for Digital Preservation . . . . . . . . . . . . . . . . . . . . . 103
DIRK VON SInfiniband for Highspeed IP Networking . . . . . . . . . . . . . . . . . 117
DIRK VON S , ONUR CELEBIOGLU, GARIMA KOCHHAR
Benefits and Limitations of Highspeed Machine Interconnects . . . . . . . 135
RICHARD ZAHORANSKY, SAHER SEMAAN
bwIDM: Anbindung nicht-webbasierter IT-Infrastrukturen an eine SAML/Shibboleth-Föderation . . . . . . . . . . . . . . . . . . . . . . . . . . 161
CHRISTIAN MOSCH, BASTIAN BOEGEL, HELMUT LANG
Das bwGRiD Wissenschaftsportal . . . . . . . . . . . . . . . . . . . . 177
SEBASTIAN SCHMELZER, DIRK VON S , MICHAEL JANCZYK,GERHARD SCHNEIDER
Flexible Cluster Node Provisioning in a Distributed Environment . . . . . 203
KONRAD MEIER, SEBASTIAN SCHMELZER, DIRK VON SEvaluation of Network Bonding Performance in Client/Server Scenarios . . 221
UCHODOLETZ
UCHODOLETZ
UCHODOLETZ
UCHODOLETZ
UCHODOLETZ
Vom „Verschmierten Rechenzentrum“ zur„Private Cloud“
Wolfgang Peters
Ministerium für Wissenschaft, Forschung undKunst Baden-Württemberg (a.D.)
Motivation – wissenschaftliches Rechnen in Deutschland
Bereits der EDV-Gesamtplan III von 1989 postulierte als eine der Forderun-gen an die IT in Forschung und Lehre die Steigerung des Technologietrans-fers zwischen Hochschulen und Wirtschaft zur Verbesserung der volkswirt-schaftlichen Leistungsfähigkeit. Konsequenterweise stand dies besondersbeim Einsatz der Höchstleistungsrechner immer im Blickpunkt und war1996 eine Motivation zur Gründung der hww, der Höchstleistungsrech-nerbetriebsgesellschaft für Wissenschaft und Wirtschaft. Die Betriebsge-sellschaft wandelt sich aktuell zu einer Vermarktungsgesellschaft, was denCharakter des Technologietransfers eher noch betont. Dabei geht es weni-ger um das große Geldverdienen (die Kosten für das Land reduzieren sichgerade mal im einstelligen Prozentbereich) als vielmehr darum, in unsererWirtschaft möglichst frühzeitig die neuesten Computertechnologien einzu-setzen und damit zu deren Konkurrenzfähigkeit beizutragen. Eine ähnlicheVorstellung: Damals bei der Planung zu BW-Grid war es meine Absicht,durch die IT die Wissenschaft im Land voranzubringen, zumal durch dieregionale Aufstellung der Cluster eine Affinität zur der jeweiligen Wirt-schaftsregion gegeben war.
Ich war und bin überzeugt davon, dass zum Beispiel die Simulation tech-nischer, naturwissenschaftlicher oder auch biologischer Vorgänge auf Rech-nern enorme Vorteile gegenüber dem wissenschaftlichen Experiment ha-ben kann. Anfang des neuen Jahrtausends habe ich diese Überzeugung in

meinem Ministerium gegen die sich verbreitende Skepsis gegenüber neu-en Höchstleistungsrechner bzw. einen Investitionsbedarf von damals ca. 35Millionen Euro alle fünf Jahre vertreten. Grundsätzlich ist es zwar rich-tig, dass Computerleistung ca. alle fünf Jahre um den Faktor zehn billigerwird. Die Frage ist nur, ob die wissenschaftlichen Fragestellungen bis da-hin nicht bereits von anderen auf der Welt gelöst wurden. Für den Wis-senschaftsstandort Baden-Württemberg war und ist die Investition in dieleistungsfähigsten Rechner daher unverzichtbar. Andererseits hilft auch dieneueste Hardware nicht viel, wenn der Nutzer sein wissenschaftliches Mo-dell erst fertig hat, wenn der Rechner bereits wieder veraltet ist. Neben derInvestition in Hardware war es daher auch notwendig, die Nutzerinnen undNutzer bzw. deren Projekte fit für den Rechner zu machen. Eine zentraleRolle in diesem Kontext sollte BW-Grid einnehmen.
Das BW-Grid oder vom „Verschmierten Rechenzentrum“ zur„Private Cloud“
BW-Grid1 war der Versuch, die Rechenzentren der Universitäten in Baden-Württemberg zur Zusammenarbeit zu verpflichten. Durch Arbeitsteilungbzw. weniger Doppelarbeit sollten sie in die Lage versetzt werden, insge-samt den Beratungs- und Benutzerservice gegenüber den wissenschaftli-chen Nutzerinnen und Nutzern zu verbessern. Es war in gewissem Sinneein trojanisches Pferd zum Wohle von Forschung und Lehre in Baden-Württemberg. Möchte man die Geschichte von BW-Grid verstehen, mussman eine ganze Reihe von Jahren zurückgehen.
BELWUE
Vor ziemlich genau 25 Jahren, am 1. Juni 1987, wurde das Baden ExtendedLan Wuerttemberg (BELWUE) ins Leben gerufen. An diesem Tag hatte dieLandesregierung beschlossen, Mittel für das neuartige Netz zur Verfügungzu stellen. BELWUE – auch „schöne Aussicht“ – war nicht nur eine Buch-stabenkreation von Paul Christ und eine technische Meisterleistung, son-dern auch ein politisches Glanzstück. Es gelang nämlich, BELWUE gegenden OSI-Standard, für den sich das Bundesforschungsministerium mit dem
2 Wolfgang Peters
DFN stark gemacht hatte, und gegen den Quasi-Standard von IBM-SNA,den die Landesregierung für das Landessystemkonzept gewählt hatte, zuetablieren. Aus heutiger Sicht ist dies kaum noch nachvollziehbar, dennniemand würde auf die Idee kommen, etwas anderes als das IP-Protokollfür ein solches Netz zu verwenden. Auch die damalige Übertragungsleis-tung von 64 Kbit/s erscheint heute kurios. Ende der Achtziger aber war dasdas Maximum des technisch Machbaren, ebenso wie das finanzielle Vo-lumen von umgerechnet ca. 2 Millionen Euro pro Jahr. Der Leiter einesgroßen Uni-Rechenzentrums in Niedersachsen hielt 64 Kbit/s zur damali-gen Zeit sogar für die Obergrenze dessen, was die Universitäten jemals be-nötigen würden. Ende 1988 waren alle neun Universitäten an BELWUEangeschlossen, was Hans-Günter Schirdewahn zu folgendem Ausspruchveranlasste: „Mit BELWUE haben wir die Voraussetzungen für ein ver-schmiertes Universitätsrechenzentrum in Baden-Württemberg geschaffen.“Die Idee eines verteilten Rechenzentrums existierte also schon damals, vor25 Jahren. Allerdings mit einer etwas anderen Zielrichtung, verständlich,wenn man sich die Rechnerlandschaft der damaligen Zeit anschaut.
Die Rechnerlandschaft Ende der Achtziger
Mein Desktop-PC – Marke Eigenbau – hat eine Leistung von knapp 10.000MIPS, einen Hauptspeicher von acht Gigabytes und zusammen rund 1.000Gigabytes Festplattenspeicher. Die Leistung aller Universalrechnersystemeder neun Universitäten betrug Ende der Achtziger 112 (in Worten: einhun-dertzwölf) MIPS und 180 GByte Festplattenspeicher. Selbst die CRAY2,die wegen ihres großen Hauptspeichers berühmt war, hatte gerade mal einViertel meines Speicherausbaus. Mein PC hätte zur damaligen Zeit also lo-cker das ganze Land versorgen können. Er hat mich deutlich unter 1.000Euro gekostet; die Investitionssumme der damaligen Universalrechner imLand betrug knapp 80 Millionen DM oder 40 Millionen Euro. Die ältestein Betrieb befindliche Anlage war 1988 die Univac 1108 in Freiburg, mitelf Betriebsjahren ein wahrer Methusalem. Der Nachfolger, eine IBM 3090mit einem Kaufpreis von knapp 5 Millionen Euro war bereits installiert. Zudiesem Zeitpunkt waren fünf der neun Rechenzentren VM-Installationen,nur die kleinen Unis hatten noch Exoten, wie das BS2000 in Mannheim
Vom ”Verschmierten Rechenzentrum” zur ”Private Cloud” 3
oder das VME (ICL) in Hohenheim. Trotzdem hätte zumindest der Rech-nerumzug von Heidelberg nach Stuttgart Anfang der Neunziger vermiedenwerden können - falls das mit dem verschmierten Rechenzentrum geklappthätte. Aber auch so sind die blauen Riesen ausgestorben.
Ziel des „verschmierten“ Rechenzentrums war es, einen Lastverbundaufzubauen sowie einen Funktionsverbund dahingehend zu etablieren, denBetriebssystemwechsel für den Nutzer leichter verkraftbar zu machen.
Die Rechnerlandschaft hat sich natürlich in den letzten Jahren deutlichgewandelt. Gleich geblieben ist allerdings der Aufwand zur Beschaffung:Bis heute machen sich in neuen Rechenzentren alle paar Jahre ein paar Spe-zialisten auf den aufwändigen und steinigen Weg, eine europäische Aus-schreibung für einen neuen Rechner zu formulieren. Hierbei muss zunächstder künftige Bedarf beim Nutzer abgefragt werden, den dieser – wie einBlick in die Umfrageergebnisse gezeigt hat – meist selbst kaum abschätzenkonnte und kann.
Arbeitskreis der Leiter der Universitätsrechenzentren inBaden-Württemberg
Ohne den Arbeitskreis der Leiter der Universitätsrechenzentren in Baden-Württemberg (ALWR) hätte es BW-Grid – wie viele andere Projekte – ver-mutlich nie gegeben. Die Rechenzentrumsleiter waren für mich das wich-tigste Forum, Ideen zu präsentieren, zu diskutieren, zu verfeinern, sie ggf.zu verwerfen oder umzusetzen. Mit dem Konzept der Universitäten Stutt-gart und Ulm für ein gemeinsames UNIX-Cluster zur allgemeinen IT-Ver-sorgung der wissenschaftlichen Nutzer in Stuttgart und Ulm konnten wireinen ersten Durchbruch in Richtung „verschmiertes Rechenzentrum“ schaf-fen und damit sicherlich einen Vorläufer von BW-Grid. Sehr positiv warzudem, dass der Aufwand für die Ausschreibungen an dieser Stelle halbiertwerden konnte. Das Projekt BW-Grid konnte ebenfalls umgesetzt werden,auch wenn einige RZ-Leiter zunächst sehr skeptisch waren und in der End-phase der Projektkonkretisierung die Diskussion teilweise hektisch geführtwurde. Letzteres war allerdings eher dem Zeitdruck geschuldet, den dievom Kollegen Resch plötzlich aufgetane Geldquelle – Restmittel aus demD-Grid-Fördermitteltopf des BMBFT – mit sich brachte. Wir hätten BW-
4 Wolfgang Peters
Grid, wie zunächst geplant, auch ausschließlich aus Landesmitteln finan-zieren können, aber dann wäre es für andere Projekte wie z. B. das Landes-Storage-Programm, die Subvention des BW-PC oder die Begleitprojekte zuBW-Grid eng geworden.
Bruch in der Versorgungspyramide
Vor vielen Jahren prägte die DFG-Kommission für IT-Infrastruktur (DFG-KfR) den Begriff der Versorgungspyramide: Auf der unteren Ebene stehendie Institutsrechner, darüber die entsprechend leistungsfähigeren Universal-rechner der Rechenzentren. Reicht die Leistungsfähigkeit dieser Rechnernicht mehr aus, stehen als nächstes die vom Wissenschaftsrat so genanntenHochleistungsrechner bereit – in Baden-Württemberg der Landeshöchst-leistungsrechner – und auf der höchsten Stufe die eigentlichen Höchstleis-tungsrechner (laut Wissenschaftsrat Rechner mit einem Kaufpreis über 35Millionen DM – soweit ich weiß, wurde dies nie in Euro umgerechnet).In jüngster Zeit ist diese Pyramide noch um den PETA-Scale-Rechner imGauß-Center for Supercomputing erweitert worden, den schnellsten Com-puter in Deutschland.
Zwischen den lokalen Rechenzentrumsrechnern und den Hoch- oderHöchstleistungsrechnern bestand (und besteht nach meiner Beobachtungleider immer noch) ein Bruch. Die durch die Versorgungspyramide sugge-rierte Durchgängigkeit von einem Level auf den nächsten existiert nämlichnicht wirklich. Immerhin findet der Nutzer auf jeder Ebene mittlerweile alsBetriebssystem ein UNIX-Derivat, aber damit hören die Gemeinsamkei-ten bereits auf. Meine Vorstellung ist, dass der Nutzer seine Modelle aufeinem BW-Grid-Cluster entwirft und testet und dann ohne Systembruch,ohne neue Nutzer-ID, ohne Umprogrammierung etc. sein Projekt auf demnächst leistungsfähigeren Rechner zum Ablauf bringen kann. Das setzt vor-aus, dass neben einem einheitlichen Betriebskonzept eine einheitliche Nut-zerverwaltung, ein durchgängiges Sicherheitskonzept sowie ein landeswei-ter (ortsunabhängiger) Fileservice vorhanden sind. Dies sollte zumindestmittelfristig nicht nur auf den BW-Grid-Clustern, sondern in gleicher Weisenach oben auf den Landes- bzw. Bundeshöchstleistungsrechnern verfügbarwerden. Und wenn wir dies alles über eine einzige Web-Portalschnittstelle
Vom ”Verschmierten Rechenzentrum” zur ”Private Cloud” 5
anbieten und gleichzeitig die wissenschaftlichen Nutzer individuell unter-stützen können, dann müsste dies meiner Meinung nach zwangsläufig zueiner Effizienzsteigerung in der Wissenschaft führen.
Nachklapp oder die Zukunft des verschmiertenRechenzentrumsBereits in den 1990er Jahren hat Professor Rühle prophezeit, dass irgend-wann einmal Compute-Power wie Strom aus der Steckdose kommen wird.Ich habe das Gefühl, dass mit den Cloud-Modellen von Amazon u. a. derZeitpunkt nicht mehr weit weg ist. BW-Grid II wird exakt hiermit kon-kurrieren. Und auch wenn es niemand hören möchte: Es wird eine PrivateCloud sein. Wenn wir (vielleicht noch mehr als bisher) unsere Personalka-pazitäten bündeln und uns nicht vor Ort verzetteln, werden wir die kommer-zielle Konkurrenz nicht fürchten müssen. Der Schlüssel zum Erfolg werdenhierbei die Durchgängigkeit der Hardwarelösung, die Verfügbarkeit mög-lichst vieler Softwarepakete, die einfache Gestaltung des Zugangs sowie dieindividuelle Nutzerberatung sein. Die großen technischen Softwarepaketekosten bereits heute um den Faktor 10 mehr als die reine CPU-Power. We-nige Cent für eine Stunde CPU-Zeit in einer Cloud werden sich die großenInstitute locker leisten können; sie werden es aber nicht tun, solange derService der eigenen Rechenzentren stimmt. Dabei ist durchaus überlegens-wert, auch solche kommerziellen Cloud-Lösungen mit im Web-Portal desBW-Grid anzubieten.
6 Wolfgang Peters
IT-Infrastruktur in einem dynamischen Umfeld –Geleitwort zum Workshop
Peter Castellaz
Ministerium für Wissenschaft, Forschung undKunst Baden-Württemberg
Die Wissenschaft hat in den letzten beiden Dekaden erhebliche Umbrü-che hinsichtlich ihrer Arbeitsweise erlebt. Arbeitsmethoden und Arbeits-mittel waren einem teils dramatischen Wandel unterworfen. Neue,IT-gestützte Arbeitswerkzeuge haben mittlerweile in allen Wissenschafts-disziplinen Einzug gehalten. Der Zugriff auf Forschungsdaten und die Fä-higkeit, diese zeitnah zu analysieren, hat eine immense Bedeutung erhaltenund die Art und Weise, wie geforscht und gelehrt wird, nachhaltig verän-dert.
In diesem Umfeld kommt der IT-Infrastruktur in den Hochschulen ei-ne entscheidende Bedeutung als Basisinfrastruktur für die Wissenschaftzu. Der Wissenschaftler an seinem Arbeitsplatz steckt üblicherweise den(Strom-) Netzstecker in die Steckdose und den (Daten-) Netzstecker in dieEthernet-Buchse und erwartet, dass alles weitere reibungslos funktioniert.Und dies muss er auch erwarten dürfen – zumindest wenn die Hochschulenihrem Anspruch auf Exzellenz in der Wissenschaft gerecht werden wol-len. Die hinter dieser Ethernet-Buchse ablaufenden Workflows und Prozes-se sind mittlerweile so komplex geworden, dass nur noch leistungsfähige,dienstleistungsorientierte Rechenzentren in Kooperation mit den wissen-schaftlichen Bibliotheken die dafür notwendigen Dienste erbringen kön-nen. Die Rechenzentren sind dabei strategische Partner für Forschung undLehre und bilden mit den Bibliotheken zunehmend gut koordinierte Infor-mationszentren.
Neben Experiment und Theorie ist die dritte Säule der Wissenschaft Mo-dellierung und Simulation oder neudeutsch Computational Science and En-gineering (CSE), die in allen Phasen des wissenschaftlichen Arbeitsprozes-ses bis hin zur Publikation der Ergebnisse und der langfristigen Sicherungder Nachnutzung von Daten und Ergebnissen auf eine leistungsfähige IT-und Informationsinfrastruktur angewiesen ist. Insbesondere ComputationalScience and Engineering gewinnt für eine zunehmende Zahl von Wissen-schaftsbereichen an Bedeutung, wie dies auch im jüngst veröffentlichtenPositionspapier des Wissenschaftsrates zum Hoch- und Höchstleistungs-rechnen festgestellt wird.
Dabei ist ein interessanter Widerspruch zwischen Bedeutung und Sicht-barkeit entstanden. Die Herausforderungen wachsen stetig – hier seien nurdie Schlagworte Virtuelle Forschungsumgebungen, Forschungsdatenmana-gement und datengetriebene Forschung erwähnt. Das Veränderungstempogerade bei IT in der Wissenschaft wird künftig tendenziell eher zuneh-men. Dies wird die Bedeutung und die Komplexität der notwendigen IT-Dienstleistungen erhöhen, zugleich aber hohe Anforderungen an eine fürden Nutzer transparente, einfache Nutzbarkeit stellen. Die Kosten für IT-Infrastruktur und Informationsinfrastruktur werden sich also tendenziell er-höhen.
Gleichzeitig ist zu beobachten, dass die Leistungen der Rechenzentrenund Bibliotheken in diesem Umfeld bei weitem nicht so deutlich wahrge-nommen werden, wie sie es verdienen. Die Folge: Budgets in den Hoch-schulen (und, es sei zugegeben, auch im Wissenschaftsministerium) sta-gnieren oder werden gekürzt. Ein Grund dafür mag sein, dass „an der Ba-sis“ möglicherweise nur eine geringe Bereitschaft besteht, für eine funk-tionierende Basisinfrastruktur Geld bereitzustellen – sie ist notwendig, abernicht „sexy“ genug. Ich halte dies zwar für einen strategischen Fehler, denndadurch entstehen immer wieder kostspielige Reibungsverluste in den Hoch-schulen, muss aber fairerweise zugeben, dass angesichts knapper Kassen inden nächsten Jahren steigende Budgets kaum durchsetzbar sein werden.
Doch nicht nur die Anforderungen von innen wachsen, auch von außenstehen die Rechenzentren zunehmend unter Druck und müssen um ihre„Kunden“, die Wissenschaftler, kämpfen. In der Folge der Internetrevolu-
8 Peter Castellaz
tion und der Web 2.0–Aktivitäten sind eine Reihe von technischen Mög-lichkeiten entstanden, die derzeit im Hype um „die Cloud“ gipfeln undfür Wissenschaftler eine erhebliche Anziehungskraft entfalten. Ein aktu-elles Beispiel kann dies illustrieren: Gelockt durch zunächst kostenlosenSpeicherplatz haben viele Wissenschaftler den Weg zu „Dropbox-artigen“Angeboten gefunden. Der Charme solcher Lösungen liegt in der Kombi-nation aus Online-Speicher und Synchronisierungstool und deren einfacherHandhabung auf allen Endgeräten, also insbesondere auch auf den mobilenEndgeräten wie Tablets und Smartphones. Zwei an sich getrennte Dienste,geschickt kombiniert, erzeugen einen sehr attraktiven Mehrwert. MancherWissenschaftler mag sich kurz die Frage stellen „Warum kann mein Uni-rechenzentrum das nicht?“, bevor er flugs zur kommerziellen Konkurrenz„abwandert“. Dies ist nur ein Beispiel für die strategische Bedrohung fürden Stellenwert und die künftige Rolle der Rechenzentren, der sich die-se unbedingt stellen müssen. Das Thema Virtualisierung ist bereits in denHochschulen angekommen, die Zukunft liegt jedoch in noch viel weiterreichenden Konzepten wie Compute Clouds, Storage Clouds und ServiceClouds – geschickt kombiniert zu Community Clouds, die die spezifischenBedürfnisse von Gruppen von Wissenschaftlern adressieren und erfüllen.Eine diensteorientierte Sichtweise wird hier notwendig sein, um die Her-ausforderungen der Zukunft angemessen bewältigen zu können. WichtigeAspekte werden die bruchfreie Anbindung von mobilen Endgeräten sowiedie Kombination von Compute-Diensten, Speicherdiensten und Netzdiens-ten sein. Kein Rechenzentrum kann alle diese Herausforderungen alleinemeistern.
Ein Ausweg aus dieser Lage ist Kooperation. Bereits seit vielen Jah-ren kooperieren Rechenzentren der Hochschulen erfolgreich miteinander.Die Landesrektorenkonferenz der Universitäten hat Weitblick bewiesen,als sie 1981 den Arbeitskreis der Leiter der Wissenschaftlichen Rechen-zentren der Universitäten, kurz ALWR, als ständiges LRK-Gremium ein-richtete. Der Fachreferent im Wissenschaftsministerium genießt ständigesGastrecht in diesem Gremium, was den unmittelbaren Dialog über strate-gische Fragen zwischen Rechenzentren und Ministerium erleichtert. Da-durch können neue Entwicklungen schnell analysiert, aufgegriffen und in
IT-Infrastruktur in einem dynamischen Umfeld 9
konsistentes Förderhandeln des Landes umgesetzt werden. Diese Abstim-mung ermöglicht es auch, sich rasch über arbeitsteiliges, gemeinsames Vor-gehen bei wichtigen Fragen der Weiterentwicklung der IT-Infrastruktur inden Universitäten zu verständigen. Ich darf an dieser Stelle sagen, dass iches als Privileg empfinde, mit diesem Kreis zusammenzuarbeiten. Auch dieRechenzentrumsleiter der Hochschulen für angewandte Wissenschaften ha-ben einen Arbeitskreis, in dem über gemeinsame Aufgaben und Anliegendiskutiert wird.
Auch auf Arbeitsebene finden vielfältige Kooperationen zwischen denRechenzentren statt, ein wichtiges Beispiel ist der bwGRiD-Verbund. Hierwurde bereits früh eine Kooperationsstruktur geschaffen, die es ermög-licht hat, Infrastrukturbeschaffungen mit der arbeitsteiligen Entwicklungvon Diensten für das ganze Land zu koppeln.
bwGRiD: Herausforderungen und zukünftige Entwicklung
Eine intensive Kooperation ist gerade im Bereich des Computational Sci-ence and Engineering (CSE) unabdingbar. Der Wissenschaftsrat hat in sei-nem Positionspapier festgestellt, dass CSE sich immer stärker auch als ei-genständiges Forschungs– und Fachgebiet etabliert, er spricht in diesemZusammenhang sogar von einem Paradigmenwechsel. Wissenschaftsberei-che mit stark datengetriebener Forschung verschränken Datenanalyse undTheoriebildung immer enger miteinander. Simulationsmodelle werden inimmer mehr Wissenschaftsbereichen immer wichtiger und erschließen sichneue Anwendungsfelder. Insbesondere in den Natur- und Ingenieurwissen-schaften basieren Forschungs– und Entwicklungsergebnisse immer stärkerauf Modellierung, Simulation und Optimierung; dies wurde auch vom AL-WR in seinem Positionspapier zur IT-Infrastruktur in den Universitäten ausdem Jahr 2010 so gesehen. Simulationen und aufwändige Forschungsex-perimente erzeugen extrem große Datenbestände, die entsprechende Um-gebungen für die Analyse, Aufbereitung und Weiterverarbeitung der Datenbenötigen. Dies hat Rückwirkungen auf die benötigte Infrastruktur.
Auch volkswirtschaftlich gesehen ist es unbestritten, das CSE und HighPerformance Computing (HPC) als Schlüsseltechnologien anzusehen sind,die ein wesentlicher Faktor für die Zukunftsfähigkeit der deutschen Wissen-
10 Peter Castellaz
schaft sind. Auch die Wirtschaft setzt zunehmend Simulationsmethoden einzur Verbesserung von Produkten und Dienstleistungen. Die Verfügbarkeitvon HPC-Infrastrukturen ist deshalb für die Wettbewerbsfähigkeit Deutsch-lands unverzichtbar, dies gilt für Baden-Württemberg als stark technologie-und exportorientiertes Bundesland in besonderem Maße und hat sich in derHPC-Landesstrategie entsprechend niedergeschlagen.
Von der Nutzung her unterscheidet der Wissenschaftsrat drei Arten derNutzung von HPC-Ressourcen: Unter Capability Computing wird das Rech-nen einzelner komplexer Probleme oder Modelle verstanden, die in der Re-gel gut parallelisierbar sind. Hierfür werden Rechnersysteme der oberstenLeistungsklasse benötigt. Als Capacity Computing wird das gleichzeitigeRechnen vieler Probleme, Modelle oder Modellparameter bezeichnet. Hier-für werden leistungsfähige Rechnersysteme mit hohem Durchsatz benötigt.Das Real-Time Computing schließlich zeichnet sich durch Interaktivität ausund spielt z. B. im Bereich von Visualisierungen eine zunehmende Rolle.Hierfür wird spezielle Hard- und Software benötigt, die die hohen Anfor-derungen an Echtzeitanwendungen bedienen kann.
Der Wissenschaftsrat kommt in seinem Positionspapier zu einigen sehrwichtigen Schlussfolgerungen und Empfehlungen. So stellt er ausdrücklichfest, dass sich die aus verschiedenen Rechenleistungsstufen bestehende so-genannte Versorgungspyramide bewährt hat. Auf den einzelnen Rechen-leistungsstufen solle es jeweils mehrere, sich in Rechnerarchitektur undMethodenkompetenz gegenseitig ergänzende Zentren geben. Rechenkapa-zität und Methodenkompetenz sollen gleichwertig stark entwickelt und beisteigendem Bedarf ausgebaut werden. Die Ressourcen sollen durch HPC-Kompetenzzentren bereit gestellt werden, die sich durch eine enge Inte-gration von leistungsfähigen Rechnerinfrastrukturen, Methodenkompetenz,Anwenderberatung sowie universitäre Forschung und Lehre auszeichnen.
Die unterschiedlichen Leistungsklassen erfüllen dabei unterschiedlichgeartete Versorgungsaufträge. Der sogenannte Tier 3 umfasst die Bereitstel-lung von Rechenleistung für Einzelwissenschaftlerinnen, Forschergruppenund Institute in den Hochschulen und wird typischerweise durch Rechen-cluster in Instituten und Rechenzentren an Hochschulen realisiert. Zentrendes Tier 2 wie z.B. das Steinbuch Center for Computing des KIT überneh-
IT-Infrastruktur in einem dynamischen Umfeld 11
men regionale bzw. fachspezifische Aufgaben, sie sind in der Gauß-Allianzorganisiert. Die Zentren der Tiers 0 und 1, in Deutschland repräsentiertdurch die drei Zentren des Gauss Centre for Supercomputing in Stuttgart,München und Jülich, decken die obersten Leistungsklassen auf nationalerbzw. europäischer Ebene ab.
Dem Tier 3 kommt eine wichtige Rolle zu bei der Aus- und Weiterbil-dung des wissenschaftlichen Nachwuchses und beim Transfer von Wissenin die Wirtschaft, da diese sukzessive an das Potenzial der leistungsstar-ken Rechnersysteme herangeführt werden können. Dies macht auch auf derEbene des Tier 3 die Etablierung bzw. Stärkung von HPC-Kompetenzzen-tren sinnvoll, da diese für ihren jeweiligen Schwerpunkt als „HPC-Enabler“in die entsprechenden Scientific Communities hineinwirken.
HPC-Kompetenzzentren bündeln leistungsfähige Rechnerinfrastrukturenund Methodenkompetenz am selben Ort („Racks and Brains“), arbeiten in-tensiv mit Anwendungswissenschaftlerinnen und -wissenschaftlern in geo-graphischer Nähe zusammen und sorgen für eine enge Anbindung benach-barter Universitäten oder außeruniversitärer Forschungseinrichtungen.
Wenn man diese Gedanken konsequent weiterentwickelt und mit denaktuellen Entwicklungen in Richtung Community Clouds und ComputeClouds kombiniert, so gelangt man in logischer Konsequenz zum Umset-zungskonzept der Universitäten in Baden-Württemberg für das Hochleis-tungsrechnen, das die Basis zur Weiterentwicklung des bwGRid-Verbundesbildet. Es wurde vom ALWR in Kooperation mit Anwendern und Metho-denwissenschaftlern erarbeitet.
Dieses Konzept sieht insgesamt fünf Rechnercluster im Land vor, die alsTier 3 Systeme (bezogen auf den Betriebsstandort) in Baden-Württembergzentralisiert und landesweit genutzt werden, entweder für ausgewieseneFachwissenschaften im Falle der vier bwForCluster oder als Grundversor-gungssystem im Falle des bwUniCluster. Das bwGRid wird von einer Re-chenplattform zu einer Kooperations- und Kommunikationsplattform wei-terentwickelt und fungiert gleichzeitig als organisatorischer Verbund fürdie Entwicklung von landesweiten, föderativ erbrachten Diensten („bwSer-vices“). Die Neuordnung setzt auf Ausdifferenzierung der Rechenressour-cen, sich ergänzende Strukturen und den Aufbau von Kompetenzzentren.
12 Peter Castellaz

Die seit 1. Juli 2012 laufenden Landesprojekte „Föderatives Identitäts-management in Baden-Württemberg“ (bwIDM), „Erweiterung der LargeScale Data Facility zur Datenspeicherung für die baden-württembergischenHochschulen“ (bwLSDF) und „bwGRiD – Ergänzende Maßnahmen“(bwGRiD-EM) flankieren diese Fortentwicklung der Kooperation der Uni-versitätsrechenzentren. Sie setzen dabei auch auf den erfolgreichen Vorar-beiten des bwGRiD-Verbundes im Rahmen der Landesprojekte bwGRiD-System und bwGRiD-Portal auf, aber auch auf erfolgreichen Kooperations-projekten wie dem CUSS-Cluster der Universitäten Stuttgart und Ulm, derim bwUniCluster aufgehen wird.
Mit dem Umsetzungskonzept und den Landesprojekten wird die am 15.Juni 2010 von der Landesregierung beschlossene Investitionsplanung fürdas Hoch- und Höchstleistungsrechnen für den Zeitraum bis 2016 ergänztund durch flankierende Umsetzungsmaßnahmen abgesichert. Die EbeneTier 3 wird damit vollwertig in die HPC-Landesstrategie integriert, dievon Tier 0 bis Tier 3 alle Ebenen des High Performance Computing um-fasst. Ein föderatives Betriebs- und Nutzerunterstützungskonzept, das aufden Erfahrungen im bwGRiD-Verbund aufbaut, wird eine verbesserte an-wendungsdomänenbezogene Unterstützung der Nutzer ermöglichen. Da-bei fungieren die Projektpartner des bwGRiD-Verbundes auch als loka-le Know-how-Träger, die einen für den lokalen Nutzer transparenten Zu-gang zu den im Land verteilten HPC-Ressourcen der verschiedenen Tiersunterstützen. Gleichzeitig werden HPC-Kompetenzzentren im Sinne eines„HPC-Enabling“ geschaffen, die Community-spezifisch Methodenkompe-tenz, Anwender und Nutzerunterstützung zusammenführen. Der stärkereAnwenderbezug zeigt sich bereits bei der aktiven Einbeziehung der (For-schungs–) Anwender in die Antragstellung für die bwForCluster. Der Tier3 fungiert damit als Einstiegsebene für das größere Gebiet des Computa-tional Science and Engineering, die sowohl Aus- und Weiterbildung alsauch Technologie- und Wissenstransfer in die Wirtschaft noch besser un-terstützen kann. Die Einbindung in die HPC-Landesstrategie führt durcheine stärkere Koordination von Beschaffungen, Betrieb und Anwenderun-terstützung auch zu einer verbesserten Durchlässigkeit zu den Tiers 2 und0/1 für den Nutzer. Dabei muss im Rahmen der Umsetzung auch das The-
IT-Infrastruktur in einem dynamischen Umfeld 13
ma Softwarelizenzen adressiert werden; für wichtige Softwarepakete bietetes sich z. B. an, Landeslizenzen abzuschließen.
Gleichzeitig muss im Rahmen des Gesamtsystems auf der Ebene des Tier3 ein fairer Ausgleich von Lasten und Pflichten stattfinden, die sich aus An-schaffung, Betrieb und Nutzerunterstützung ergeben. Die hierzu notwen-digen Absprachen werden im ALWR im Einvernehmen mit dem Wissen-schaftsministerium ausgearbeitet.
Nicht zuletzt bildet der konsequent erfolgende Ausbau des Landeshoch-schulnetzes BelWue eine notwendige „physikalische“ Grundlage für dieKooperationsvorhaben der Rechenzentren.
Ausblick
Die zu beobachtende Konvergenz der Informationstechnologien legt koope-rative Versorgungsmodelle nahe. Auch ökonomisch ist es sinnvoll, die anden Universitäten vorhandenen Spezialisierungen zu bündeln und in föde-rativen Konzepten zum Einsatz zu bringen. Dies vermeidet unnötige Red-undanzen und ermöglicht es, in einem komplexer werdenden Umfeld mitden begrenzten Ressourcen vorhandene Dienste zu verbessern und neueDienste zu entwickeln und anzubieten.
Mit dem bwGRiD-Verbund als Basis für Community-spezifische Diens-te und Anwendungen soll in Zukunft eine breitere Palette von Diensten undAnwendungen erschlossen werden. Eine stärkere Koordination auf der stra-tegischen Ebene durch den ALWR und eine intensivere Koordination aufder technischen Ebene erlaubt es, die Stärken der einzelnen Rechenzentrenin gemeinsamen Konzepten für verbesserte und neue Dienste (bwServices)landesweit zum Einsatz zu bringen.
Neben dem Hoch- und Höchstleistungsrechnen gibt es eine ganze Rei-he von Themen, die gemeinsam in föderativen, aufeinander abgestimmtenKonzepten angegangen werden müssen, so z.B. im Bereich Datenmanage-ment und Speicher. Diese Konzepte müssen in aller Regel auch mit nationa-len und europäischen Entwicklungen und Konzepten harmonisiert werden,so beispielsweise beim Management großer wissenschaftlicher Datenmen-gen oder dem Thema (Langzeit-) Archivierung. Auch hier sind die Uni-
14 Peter Castellaz

versitäten auf einem guten Weg, ihre Führungsrolle im Hochschulsystemverantwortungsbewusst wahrzunehmen.
Durch die sehr erfolgreichen Vorarbeiten der Rechenzentren im Land,unter anderem durch den bwGRiD-Verbund, und durch die etablierten Ko-operationsbeziehungen im ALWR sind die Rechenzentren gut aufgestellt,um den Herausforderungen der Zukunft mit Mut und Entschlossenheit zubegegnen. Das Umsetzungskonzept der Universitäten des Landes für dasHochleistungsrechnen ist ein ausgezeichnetes Beispiel für die Zukunftsfä-higkeit der Rechenzentren. Die Beiträge in diesem Konferenzband zeigendas große Engagement und die hohe Fachkompetenz, mit dem die Mit-arbeiterinnen und Mitarbeiter der Rechenzentren an der Gestaltung dieserZukunft arbeiten.
IT-Infrastruktur in einem dynamischen Umfeld 15

Das bwGRiD heute – Eine erfolgreiche föderativeHPC-Forschungsumgebung
Marek Dynowski∗, Michael Janczyk†, Tobias Kienzle‡,Matthias Landwehr§, Reinhard Mayer¶, Adrian Reber‖,
Nico Struckmann∗∗, Sabine Richling††, Janne Chr. Schulz‡‡,Sven Hermann§§
Universität Tübingen
Zusammenfassung: Bedingt durch die zunehmende Bedeutung des „HighPerformance Computings “(HPC) für immer größere Teile der wissenschaft-lichen Forschung wurde in der Vergangenheit ein Ausbau der bisher an denUniversitäten vorhandenen Ressourcen erforderlich. Zur Deckung des zusätz-lichen Bedarfs initiierten 2007 acht Universitäten aus Baden-Württemberg dasbwGRiD Projekt mit dem Ziel, HPC-Systeme lokal auf Ebene der Rechenzen-tren für die wissenschaftliche Forschung im Land zur Verfügung zu stellen.Die Kosten für die Hardware des Projektes wurden vom Bundesministeriumfür Bildung und Forschung im Rahmen der D-Grid Initiative übernommen, dieFinanzierung der Personalstellen erfolgte durch das Ministerium für Wissen-schaft, Forschung und Kunst (MWK) Baden-Württemberg. Im Rahmen desProjektes wurden ursprünglich acht HPC-Cluster, bestehend aus identischerHardware, angeschafft. Diese werden transparent in einem Clusterverbund ansieben Universitätsstandorten im Bundesland betrieben und stehen Mitglie-dern des D-Grid Verbundes und Angehörigen der Hochschulen aus Baden-
∗ [email protected]† [email protected]‡ [email protected]§ [email protected]¶ [email protected]‖ [email protected]∗∗ [email protected]†† [email protected]‡‡ [email protected]§§ [email protected]
Württemberg unentgeltlich zur Verfügung. Im Jahr 2010 beteiligte sich danndie Hochschule Esslingen mit einem eigenen Cluster an dem erfolgreichenProjekt. Zu dem Erfolg trug unter anderem der Verzicht auf Zugangsbeschrän-kungen oder Antragstellungen zur Nutzung der bwGRiD-Ressourcen bei. Da-durch wird auch Anwendern aus nicht-klassischen HPC-Disziplinen der Ein-stieg in das wissenschaftliche Hochleistungsrechnen sowie die Durchführunginterdisziplinärer Projekte ermöglicht. Nicht zuletzt durch solche Maßnahmenhat sich das bwGRiD in den letzten fünf Jahren zu einem unverzichtbarenWerkzeug in weiten Teilen der Wissenschaft in Baden-Württemberg und dar-über hinaus entwickelt. Überdies können die im Umgang mit diesen HPC-System gewonnenen Erfahrungen und Kenntnisse in die zukünftige Projekt-planung einfließen und als Grundlage für Projekte auf größeren Hochleistungs-rechnern dienen. In diesem Artikel werden die bisher erreichten Ziele und diedafür erforderlichen Maßnahmen aufgezeigt.
1 Einleitung
Der in den letzten Jahren gestiegene Bedarf an ”High Performance Compu-ting”-Ressourcen (HPC) in der Wissenschaft führte zur Planung und Um-setzung neuer Konzepte im Bereich der Daten- und Compute-Cloud. Ausdiesen Überlegungen heraus entstand das bwGRiD-Konzept, welches einendezentralen Betrieb mehrerer HPC-Cluster in einem Clusterverbund vor-sieht. Hierzu sollen die über das gesamte Bundesland verteilten Ressour-cen mithilfe des Landeshochschulnetzes BelWü1 vernetzt und nach einemeinheitlichen Betriebsmodell betrieben werden. Das Projekt ist Teil der D-Grid-Initiative der Bundesregierung und wird mit zusätzlicher finanziel-ler Unterstützung für Personalmittel vom Ministerium für Wissenschaft,Forschung und Kunst (MWK) in Baden-Württemberg gefördert. Ursprüng-lich nahmen die Universitäten Freiburg, Heidelberg, Karlsruhe, Konstanz,Mannheim, Tübingen und Ulm und das „High Performance ComputingCenter Stuttgart“ (HLRS) in Stuttgart an dem Projekt teil. Anfangs über-nahm das HLRS die Projektkoordination, die dann im Januar 2010 auf dasKIT überging. Die zu Beginn des Projektes gemeinsam beschaffte Hard-ware bestand aus Komponenten des gleichen Typs, welche in unterschied-lichem Maße auf die jeweiligen Standorte verteilt wurden. Die beiden Clus-ter in Mannheim und Heidelberg sind seit 2009 über Infiniband-Glasfaser
1 Baden-Württembergs extended LAN: Das Netz der wissenschaftlichen Einrichtungen inBaden- Württemberg, http://www.belwue.de [aufgerufen: 31.04.2012]
18 Marek Dynowski, et al.
kopplung miteinander verbunden und werden seitdem als ein einziger Clus-ter mit gemeinsamer Nutzerverwaltung und gemeinsamen Batch-Systembetrieben. Im April 2010 beteiligte sich die Hochschule Esslingen mit ei-nem eigenen lokalen HPC-Cluster, bestehend aus 180 Rechenknoten, ambwGRiD-Projekt. Zurzeit besteht das bwGRiD somit aus sieben Compute-Clustern, die an acht Standorten in Baden-Württemberg betrieben werden.Zum bwGRiD gehört auch ein zentrales Storage-System in Karlsruhe, dasim Jahr 2009 aus Mitteln des MWK beschafft wurde. Das System stelltden bwGRiD-Nutzern einen Speicherplatz von insgesamt 128 TByte mitBackup und 256 TByte ohne Backup zur Verfügung. Die einzelnen Stand-orte sind mit einer Geschwindigkeit von 10 Gbit/s Lichtwellenleiter überdas BelWü-Netzwerk vernetzt.
2 Projektentwicklung
Grundvoraussetzung für den transparenten Betrieb eines Clusterverbundesist eine für die Anwender einheitliche Arbeitsumgebung an allen Stand-orten. Nur so kann diesen eine maximale Flexibilität bezüglich der Stand-ortwahl für die Berechnung ihrer Jobs garantiert werden. Daher sind dieErarbeitung, Umsetzung und Beibehaltung gemeinsamer Betriebsstandardswesentliche Aufgaben des Betriebs des bwGRiD-Clusterverbunds. Ziel die-ser Anstrengungen ist es, dem Anwender den Wechsel eines Cluster ohnevorheriges Anpassen seiner Skripte zu ermöglichen.Einen wichtigen Punkt stellt in diesem Zusammenhang die am jeweiligenStandort verfügbare Software dar, welche den bwGRiD-Administratorenvon den jeweils verantwortlichen Standorten als Modul zentral zur Verfü-gung gestellt wird. Die entsprechenden Software-Module können von An-wendern anhand des „Environment Modules Tools“2 geladen werden, wo-durch eine programm– und versionsspezifische Benutzerumgebung erzeugtwird. Um die Interoperabilität zwischen den Standorten zu gewährleisten,müssen die Namen der Softwaremodule und jeweiligen Benutzerumgebun-gen an den unterschiedlichen Clustern identisch sein. Dies wird dadurchsichergestellt, dass jeweils nur ein Standort für eine bestimmte Software
2 Projektwebseite: http://modules.sourceforge.net/ [aufgerufen: 18.05.2012]
Das bwGRiD heute 19
zuständig ist. Trotz erheblicher Anstrengungen, gemeinsam verpflichtendeStandards für die Erstellung und Namensgebung von Softwaremodulen zuentwickeln und umzusetzen, kam es jedoch in diesem Bereich in der Ver-gangenheit immer wieder zu Inkonsistenzen bzw. doppelten Arbeiten, damehrere Standorte unabhängig voneinander an demselben Softwaremodulgearbeitet haben. Infolgedessen wurde gemeinsam die Einführung soge-nannter „ITP-Requests“ beschlossen. Hierbei handelt es sich um eine stan-dardisierte E-Mail mit Informationen zu der jeweiligen Software. Vor derErstellung oder Pflege eines Softwaremoduls wird diese an die bwGRiD-interne E-Mail-Liste gesendet, so dass sich Standorte melden können, dieeventuell bereits mit der Software Erfahrungen haben. Die im Frühjahr desJahres 2012 beschlossene Maßnahme führte bereits nach kurzer Zeit zu ei-ner Verbesserung der internen Koordination der Wartung und Pflege derSoftwarebestände.Weiterhin konnte die Anwenderfreundlichkeit und Softwareadministrationdurch die Entwicklung eines Software-Browsers erheblich verbessert wer-den. Mit dem in Webseiten integrierbaren Tool kann der täglich aktuali-sierte Softwarestand auf allen Clustern des Verbundes abgefragt werden.Zusätzlich ist für die Administratoren ein Softwaretool zur Verfügung ge-stellt worden, das die Vollständigkeit der an einem Standort installiertenSoftware(-versionen) überprüft. Die Entwicklung und Bereitstellung die-ser Tools verbesserte die transparente Nutzung der Cluster erheblich undvereinfacht deren Administration. Trotz aller bisherigen Entwicklungen be-steht bei der transparenten Bereitstellung von Software für den Clusterver-bund noch Potenzial für Innovationen, sodass entsprechende Konzepte imRahmen des Arbeitspaketes 4.3 unter Leitung von Konstanz entwickelt undumgesetzt werden sollen.Die im bwGRiD mittlerweile auf fast allen Standorten installierten und ver-wendeten „Workspace Tools“ vereinfachen den Nutzern das standortunab-hängige Datenmanagement, da so temporärer Speicherplatz auf einer iden-tischen Abstraktionsebene auf den lokalen Lustre- Dateisystemen zur Ver-fügung gestellt werden kann. Aufgrund der Vorteile der Workspaces wurdederen Nutzung im bwGRiD-Portal für die zeitlich begrenzte Speicherungvon großen Datenmengen implementiert.
20 Marek Dynowski, et al.
3 Ergänzende Maßnahmen
Im Verlauf des bwGRiD-Projektes wurden verschiedene Anforderungenfür das Anbieten eines effizienten HPC-Dienstes für ein breites Spektrumwissenschaftlicher Anwender formuliert, die mit den zur Verfügung ste-henden Ressourcen nicht zu erfüllen waren. Für die Ausarbeitung entspre-chender Konzepte und deren Umsetzung waren zusätzliche Personal- undSachmittel erforderlich. Daraufhin wurden die einzelnen Punkte zu einemVollantrag zusammengefasst und dieser mit der Bezeichnung „bwGRiD –Ergänzende Maßnahmen“ beim Ministerium für Wissenschaft, Forschungund Kunst eingereicht. Die Maßnahmen wurden Juli 2010 vom MWK ge-nehmigt. Sie stellen die Weichen für die Zukunft des bwGRiD und auchfür zukünftige Projekte im Bereich des HPC. Insbesondere der Zugriff aufdie Ressourcen und deren Nutzung sollen erleichtert, die Interoperabilitätweiter erhöht sowie der Kreis der Nutzer und die dazugehörige Betreuungausgeweitet werden. Im folgenden Abschnitt werden die einzelnen Arbeit-spakte und vorläufigen Ergebnisse vorgestellt. Das Arbeitspaket 5 („Por-talabhängige Entwicklungen“) wird ausführlich einem eigenen Artikel indiesem Konferenzband behandelt und ist daher nicht aufgeführt.
3.1 Arbeitspaket 1 – Authentifizierung und Autorisierungmittels föderativer Mechanismen
Bisher basiert die Authentifizierung der Grid-Anwender im bwGRiD aufX.509-Zertifikaten. Bevor ein entsprechender Zugang für einen Benutzereingerichtet werden kann, muss dieser ein Grid-Nutzer-Zertifikat beantra-gen. Dieser Vorgang ist ein komplexer, mehrstufiger und daher fehleran-fälliger Prozess, der für viele Nutzer eine hohe Zugangshürde darstellt.Zwar werden hierfür über vielfältige Medien Schritt-für-Schritt Anleitun-gen angeboten, jedoch ist die Durchführung auch für den Nutzer mit er-heblichem Zeitaufwand verbunden. Im Rahmen der ergänzenden Maßnah-men soll deshalb ein neues und einfacheres Authentifizierungsverfahrenfür die Grid-Nutzung des bwGRiDs eingerichtet werden, mit dem sich dieAngehörigen der Universitäten in Baden-Württemberg an allen Gridstand-orten mit ihren lokalen Universitäts-Accounts einloggen können. Da es lan-
Das bwGRiD heute 21
desweit in Baden-Württemberg keine einheitliche Authentifizierungsinfra-struktur gibt, wird von dem bwIDM Projekt3 eine föderierte Lösung aufBasis von Shibboleth4 entwickelt und implementiert. Diese soll nicht nurvom bwGRiD-Projekt, sondern auch von anderen Landesdiensten wie bei-spielsweise dem IBS5 eingesetzt werden. Voraussetzung für den Einsatzvon Shibboleth im bwGRiD ist eine vollständige Unterstützung der zurzeiteingesetzten Zugangsmöglichkeiten. Stellenweise sind hierbei umfangrei-che Änderungen im Bereich Shibboleth notwendig. Im folgenden werdendie drei Möglichkeiten des Nutzerzugangs zu den bwGRiD Ressourcen vor-gestellt.
Zugri auf das bwGRiD Wissenschaftsportal Das bwGRiD–Wis-senschaftsportal ist eine Webapplikation, auf die mit Hilfe eines Browserszugegriffen wird. Da Shibboleth ursprünglich für webbasierte Dienste ent-wickelt wurde, kann die Technologie ohne großen Aufwand in das Wissen-schaftsportal integriert werden.
Konsolenbasierter Login Wesentlich größer sind die Anstrengungen,die Shibboleth-Infrastruktur mit den bislang bei den konsolenbasierten Log-ins verwendeten Authentifizierungsmechanismen zu verbinden. Die Inte-gration findet über die Erweiterung ECP6 von Shibboleth statt. Dazu wur-den von dem bwIDM-Projekt Werkzeuge (PAM und NSS Module) entwi-ckelt, mit denen auf den Grid-Knoten eine Authentifizierung gegen Shibbo-leth möglich wird. Die Adaption der für die bwGRiD-Infrastruktur entwi-ckelten Module wurde durchgeführt und in einer Testumgebung erfolgreichgetestet.
3 bwIDM: Übergreifendes Identitätsmanagement, http://www.bw-grid.de/
bwservices/bwidm/ [aufgerufen: 18.05.2012]4 Projektwebseite: http://shibboleth.net/ [aufgerufen: 18.05.2012]5 IBS: Projekt ingegriertes Bibliothekssystem Baden–Württemberg, Link: https://wiki.bsz-bw.de/lib/exe/fetch.php?media=l-team:ibs:flyer_adis_2012_04.pdf
[aufgerufen: 18.05.2012]6 ECP: Enhanced Client or Proxy, https://wiki.shibboleth.net/confluence/
display/SHIB2/ECP [aufgerufen: 17.05.2012]
22 Marek Dynowski, et al.
Portal-basierter Login via SSH auf die Grid-Knoten Da das Portalals Webapplikation als relativ leicht angreifbar angesehen wird, verbietet essich, dem Portal einfach ein passwortfreies Login auf die Grid-Knoten fürjeden User einzurichten. Gesucht ist eine Lösung, bei der sich das Portal nurals derjenige User einloggen kann, der auch am Portal angemeldet ist. Dafürbraucht man ein Feature, das man mit „Credential Delegation“ beschreibenkann, was aber von der Shibboleth-Architektur nicht unterstützt wird. Wirsehen daher zwei Möglichkeiten, eine solche Funktionalität zu realisieren:
1. Die Credential Delegation kann mit dem Shibboleth-Plugin uPortalerreicht werden. Dieses Modul müsste aber auf den Shibboleth-IdPsan allen Standorten installiert und gewartet werden.
2. Eine andere Möglichkeit ist eine Eigenentwicklung. Bei dieser Vari-ante müssten keine zusätzlichen Plugins auf den Shibboleth-Serverninstalliert werden, es genügen kleinere Konfigurationen. Es wird einSession-Passwort als Shibboleth-Attribut von dem Shibboleth-IdP andas Portal weitergegeben. Mit diesem Session-Passwort kann sichdann das Portal auf die Grid-Knoten einloggen. Die Session-Pass-wörter werden nur verschlüsselt übertragen, so kurz wie möglich ge-speichert und soweit möglich als Hash-Wert statt als Klartext gehal-ten. Diese Lösung ist in einer Testumgebung bereits erfolgreich ge-testet worden.
Derzeit werden die Vor- und Nachteile beider Lösungsansätze erörtert. Eineendgültige Entscheidung wurde noch nicht getroffen.
3.2 Arbeitspaket 2 – bwGRiD User und Operations Support
Zurzeit ist der (Nutzer-)Support für die bwGRiD-Ressourcen lokal an denjeweiligen Standorten organisiert. Da hierbei unterschiedliche Systeme undInfrastrukturen verwendet werden, müssen sich Nutzer bei standortspezifi-schen Supportanfragen erst über die jeweiligen Möglichkeiten informie-ren, was die Nutzerfreundlichkeit erheblich einschränkt. Auch kann es beifachbereichspezifischen oder gridweiten Supportanfragen unter Umstän-den zu Verzögerungen oder Kommunikationsproblemen kommen, da die
Das bwGRiD heute 23
korrekte Weiterleitung dem jeweiligen lokalen Ansprechpartnern obliegt.Zur Vermeidung der zuvor beschrieben Probleme soll im Rahmen diesesArbeitspaketes die Entwicklung eines bwGRiD-weiten First-Line- sowieOperations-Supports erfolgen. Dieser soll in enger Zusammenarbeit mitden bereits bestehenden NGI-DE-Support-Gruppen und unter Nutzung desNGI-DE-Support-Portals aufgebaut werden. Zukünftig dient das bwGRiD-First-Line-Support-Team als zentrale Anlaufstelle für alle Nutzerproblemeim bwGRiD. Hierzu sollen Expertengruppen im bwGRiD-Kontext gebil-det werden, die eng mit dem Supportteam zusammenarbeiten. Angestrebtwird eine Vernetzung der bereits bestehenden lokalen Servicedesks an denjeweiligen Standorten mit dem NGI-DE-Helpdesk. Durch die zusätzlicheSupportschicht im Rahmen des NGI-DE-Portals wird die Bearbeitung vonIncidents durch Mitarbeiter der bwGRiD-Standorte für alle Nutzer des bw-GRiD transparenter, ohne dass diese Kenntnis der am jeweiligen Stand-ort lokal vorhandenen Supportstrukturen benötigen. Aus den gelösten In-cidents entsteht außerdem mit der Zeit eine Wissensdatenbank für das bw-GRiD, die wiederum vom First-Line-Support genutzt werden kann.Ein zweiter Aufgabenbereich umfasst die Überwachung der vorhandenenInfrastruktur und der produktiven Dienste im bwGRiD, um im Problem-fall ein entsprechendes Ticket zu öffnen und die Behebung des Problemszu verfolgen bzw. zu begleiten und abzuschließen. Ziel ist die Bereitstel-lung von Werkzeugen für eine einheitliche Überwachung aller bwGRiD-Standorte, so dass Ausfälle und Wartungen für den Nutzer klar erkennbarwerden. Aufgrund des ähnlichen Setups der Standorte sollen Monitoring-Werkzeuge und bisher eingesetzte Prozesse zum Sammeln von Informatio-nen zu einer Standardlösung zusammengefasst werden, welche dann allenbwGRiD-Standorten für die Überwachung der Systeme zur Verfügung ge-stellt werden kann. Die Umsetzung des Arbeitspakets geschieht in engerZusammenarbeit mit dem NGI-DE-Operations-Team und wird vom Stand-ort Karlsruhe koordiniert.
3.3 Arbeitspaket 3.1 – Cluster-übergreifendes Scheduling
Ziel des Pakets ist die Optimierung der Auslastung freier Ressourcen zuerreichen und zudem eine standortunabhängige Nutzung der Hardware im
24 Marek Dynowski, et al.
bwGRiD zu ermöglichen sowie die Zugangsmechanismen für die Nutzerweiter zu vereinfachen. Dafür ist der Aufbau eines intelligenten Schedu-lings über die Cluster aller Standorte unumgänglich. Dazu werden unteranderem Scheduling-Policies benötigt, um die lokalen Scheduling-Systemesinnvoll zu einem globalen System miteinander zu verbinden, welches dieHeterogenität der Ressourcen an den einzelnen Standorten in Bezug auf dieHardwarekonfiguration und verfügbaren Software-Module sowie -Lizenzenberücksichtigt.Um Scheduling-Policies für eine Job-Migration zwischen Standorten unddie Anbindung an erste Werkzeuge aus Arbeitspaket 3.2 zwischen Stutt-gart und Karlsruhe zu realisieren, wird zunächst die Job-Migration zwi-schen verschiedenen MOAB Instanzen umgesetzt, jedoch zunächst lokalbegrenzt an einem Standort. Für das Umsetzen der Job-Migration zwischenverschiedenen MOAB Instanzen wurden zunächst zwei virtuelle Testclus-ter aufgesetzt, welche im nächsten Schritt mit dem realen Stuttgarter Clus-ter zu einem Schedulingsystem verbunden werden. Im Rahmen der Kon-figuration der Testumgebung sind verschiedene Probleme aufgetreten. Sohat sich herausgestellt, dass für die Grid-Funktionalität, die MOAB bietet,auch eine entsprechende Lizenz-Datei vorhanden sein muss. Auf Anfragewurde vom Software-Hersteller Adaptive Computing für die beiden virtu-ellen Test-Cluster auch eine entsprechende, aber zeitlich begrenzte Lizenzzur Verfügung gestellt. Ein weiterer wichtiger Punkt für die automatischeMigration ist die Voraussetzung, dass für jeden Benutzer auf allen Kno-ten ein passwortfreier SSH- oder GSI-SSH-Zugang vorhanden sein muss,damit auch die für einen Job benötigten Dateien übertragen und die Ergeb-nisse abgefragt werden können. Desweiteren funktionierte der automati-sche Datentransfer der Scheduling-Software MOAB nicht wie gewünscht.Zunächst lag die Ursache in der verwendeten Version von MOAB, wel-che in dieser Hinsicht noch fehlerhaft war. Ein Update der Testumgebungvon MOAB Version 6.1.2 auf die Version 6.1.4 hat die Probleme aber nurzum Teil gelöst. Größere Dateien konnten noch immer nicht automatischmigriert werden. Durch detaillierte Analysen der von MOAB für den Da-teitransfer verwendeten Perl-Skripte konnte die Ursache ermittelt und be-hoben werden. Darüber hinaus wurden die Skripte für den Dateitransfer so
Das bwGRiD heute 25
erweitert, dass auch ganze Verzeichnisse und reguläre Ausdrücken verwen-det werden können. Dies ist sinnvoll, da nicht immer absehbar ist, wie dieBenennung der erzeugten Ergebnis-Dateien lauten wird oder wie groß dieAnzahl der Dateien nach Abschluss der Berechnungen sein wird.Aktuell wird daran gearbeitet, die an den Standorten verfügbare Softwarebeim Scheduling mit zu berücksichtigen. Da MOAB von Haus aus nur inbegrenztem Umfang dafür Möglichkeiten bietet, die für unser Einsatzsze-nerio aufgrund der großen Anzahl nicht geeignet sind, muss dies durch eineeigene Implementierung realisiert werden. Hierfür sind die Anbindung andie „Authentication and Authorization Infrastructure“ (AAI) aus Arbeits-paket 1 und die Optimierung der Scheduling-Policies auf Basis ermittel-ter Daten zwingende Voraussetzungen. Im nächsten Schritt wird das realeStuttgarter Cluster in die Testumgebung eingebunden. Auch entsprechendePolicies für das Scheduling zwischen der virtuellen Umgebung und demrealen Cluster werden ermittelt. Darauf folgend wird der Standort Karlsru-he eingebunden. Bei stabilem Betrieb werden danach die restlichen Clus-ter der bwGRiD-Standorte mit einbezogen und die Scheduling-Policies ite-rativ optimiert. Einen offenen Punkt stellt die Dateiübertragung dar: Diezum Zeitpunkt des Login vom Benutzer verwendeten temporären GSISSHProxy Zertifikate sind häufig nicht mehr gültig bis die Ressourcen für eineBerechnung zur Verfügung stehen oder um die Ergebnisse danach abzuho-len. Ein Lösungsansatz wäre hierfür beim ersten Login eines Benutzers imHintergrund SSH-Schlüssel für den Datentransfer zu generieren und dieselandesweit zu verteilen. Da dies aus sicherheitstechnischer Sicht nicht dieoptimale Lösung darstellt, muss hier geprüft werden inwiefern zur Lösungdes Problems Shibboleth verwendet werden könnte. Zuletzt muss die Netz-werkauslastung der Standorte, die starken Schwankungen unterliegt, beimScheduling mit einbezogen werden. Dazu sind belastbare, regelmäßig ak-tualisierte Messwerte nötig, die im Scheduling angemessen berücksichtigtwerden müssen.
3.4 Arbeitspaket 3.2 – Werkzeuge zum Datenmanagement
Für die Speicherung von Daten stehen im bwGRiD lokale Speichersystemean den jeweiligen Standorten oder der zentrale Speicher in Karlsruhe zur
26 Marek Dynowski, et al.
Verfügung, wobei letzterer aufgrund der starken Nutzung die Kapazitäts-grenze bald erreichen wird.Es gibt im bwGRiD derzeit keine Möglichkeit von einem Standort auf dieDaten des anderen direkt zuzugreifen. Der Nutzer muss bisher ein Da-tentransfer manuell durchführen. Mechanismen zum automatischen Daten-transfer können die manuelle Organisation der Daten reduzieren und denAnwendern das Datenmanagement erheblich erleichtern. Daher werden indiesem Arbeitspaket bereits bestehende Tools zur Vereinfachung des Da-tentransfers und der Datenhaltung evaluiert und für den Einsatz innerhalbdes bwGRiDs angepasst. Ferner wird in Kooperation mit dem Arbeitspa-ket „clusterübergreifendes Scheduling“ (Arbeitspaket 3.1) ein Datenkon-zept für ein automatisiertes Datenmanagement des Schedulers entwickelt.Die Grundlage für die Datentransfers zwischen den bwGRiD Standortenbildet das BelWü-Netzwerk, das seit Januar 2012 alle Standorte mit ei-ner Geschwindigkeit von 10 Gbit/s Lichtwellenleiter verbindet. Die Per-formanz der Verbindung zwischen den Standorten ist entscheidend für dasclusterübergreifende Scheduling und das damit verbundene Datenmanage-ment. Da die bwGRiD-Cluster Heidelberg und Mannheim über eine In-finiband-Glasfaserkopplung miteinander verbunden sind und als ein Clus-ter betrieben werden, ergeben sich acht Endpunkte, zwischen denen Datentransferiert werden müssen: Mannheim (Mannheim / Heidelberg), Karlsru-he (KIT/SCC), Karlsruhe Speicher, Stuttgart (HLRS), Esslingen, Tübingen,Ulm und Freiburg. Für den Datentransfer stellt bisher jeder Standort im bw-GRiD das Globus Toolkit bereit. Das darin enthaltene Werkzeug GridFTPbietet sich daher an, um Daten zwischen den Frontendknoten der einzelnenClustern zu kopieren. Zur Überwachung des Netzwerkes und zur Ermitt-lung der erreichbaren Bandbreiten werden im Rahmen des Arbeitspaketesregelmäßige Netzwerktests durchgeführt und die Ergebnisse in Form vonkurzen Reports an alle Standorte kommuniziert. Hierfür werden die Da-ten grafisch7 aufbereitet (Abbildung 1) und zusätzlich in Tabellenform zurVerfügung gestellt. Durch die Netzwerktests konnten bereits Netzwerkpro-bleme entdeckt und gezielt gelöst werden, sodass nun alle Standorte mit der
7 GraphViz: Graph Visualization ist ein Open Source Projekt zur Visualisierung von Graphen(Netzwerk) von AT&T Research.
Das bwGRiD heute 27
maximalen Bandbreite kommunizieren können. Die kontinuierliche Steige-rung des Netzwerkdurchsatzes ist aus Abbildung 1 A – C ersichtlich. Zwarkonnte die jeweilige Performanz der einzelnen Standorte aneinander ange-passt werden, jedoch bestehen in diesem Bereich immer noch Unterschiede,die primär auf das LAN der Standorte inklusive Firewall und die Konfigu-ration der Endpunkte zurückzuführen sind.Zunächst wurden ausschließlich die TCP-Verbindungen mit Iperf8 getestet.Jede Verbindung wurde mehrfach für zehn Sekunden überprüft und die An-zahl der parallelen TCP-Verbindungen variiert. Um den täglichen Betriebmöglichst nicht zu behindern, wurden die Tests nachts und früh morgensdurchgeführt und die Ergebnisse für die anschließende Auswertung in ei-ner Datenbank gesammelt. Datentransfers mit GridFTP wurden etwas spä-ter ebenfalls regelmäßig nachts durchgeführt, da der Datentransfer Einflussauf die Ansprechbarkeit der Frontendknoten haben kann. Die Frontenkno-ten werden von den Benutzern auch zum Abschicken ihrer Jobs auf demCluster benötigt.Ein weiterer Aspekt dieses Arbeitspaketes ist die performante Anbindung
von Benutzern, die sehr große Datenmengen für ihre Berechnungen auf denbwGRiD Ressourcen transferieren müssen, wie z.B. BioQuant9. In diesemFall liegen die Daten auf lokalen Datenspeichern von BioQuant vor, dieaufgrund der physikalischen Distanz zu den bwGRiD Rechenressourcenspeziell angebunden werden müssen. Insgesamt beläuft sich der Datenbe-stand der Institution auf ein PByte, wobei ein einzelner Satz eine Größevon mehreren TByte erreichen kann. Um eine effektive Berechnung derBioQuant-Daten im bwGRiD zu gewährleisten, muss unter Berücksichti-gung der zugrunde liegenden Datenmengen, eine breitbandige Verbindungmit geeigneten Protokollen realisiert werden. Hierzu wurde vom Rechen-zentrum der Universität Heidelberg in Kooperation mit BioQuant ein Infra-strukturkonzept erarbeitet und mögliche Lösungsansätze diskutiert.
8 Iperf wurde entwickelt von NLANR /DAST als eine moderne Alternative zur Messung dermaximalen Bandbreite von TCP und UDP Verbindungen, http://iperf.sourceforge.net [aufgerufen: 31.04.2012]9 BioQuant: Center for Quantitative Analysis of Molecular and Cellular Biosystemsat Heidelberg University, http://www.bioquant.uni-heidelberg.de [aufgerufen:02.05.2012]
28 Marek Dynowski, et al.
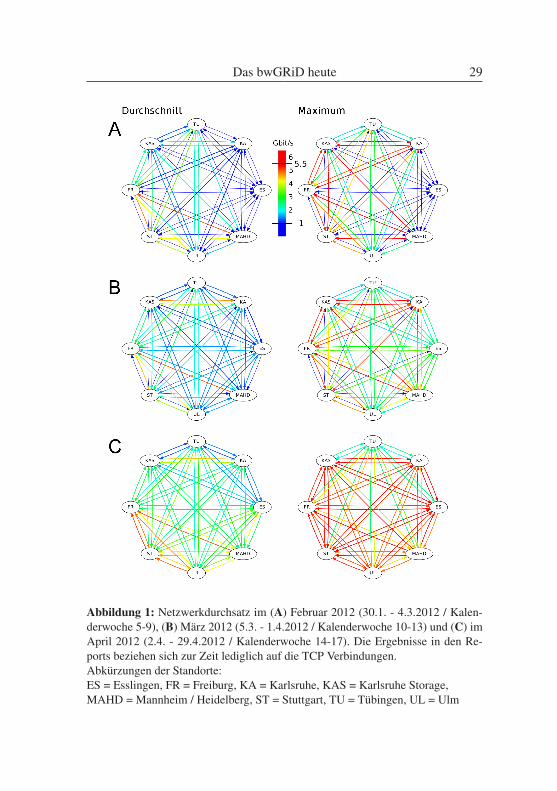
Abbildung 1: Netzwerkdurchsatz im (A) Februar 2012 (30.1. - 4.3.2012 / Kalen-derwoche 5-9), (B) März 2012 (5.3. - 1.4.2012 / Kalenderwoche 10-13) und (C) imApril 2012 (2.4. - 29.4.2012 / Kalenderwoche 14-17). Die Ergebnisse in den Re-ports beziehen sich zur Zeit lediglich auf die TCP Verbindungen.Abkürzungen der Standorte:ES = Esslingen, FR = Freiburg, KA = Karlsruhe, KAS = Karlsruhe Storage,MAHD = Mannheim / Heidelberg, ST = Stuttgart, TU = Tübingen, UL = Ulm
Das bwGRiD heute 29
Nachdem im Mai 2012 der BioQuant-Speicher (LSDF10) von „Scale-outFile Services“ (SoFS) zu IBM „Scale Out Network Attached Storage“ (SO-NAS) umgestellt wurde, sind die ursprünglich für SoFS erarbeiteten Ansät-ze nicht mehr anwendbar. Eine immer noch verfügbare Lösung stellt den-noch der Zugriff auf das LSDF als Block Device dar. So wäre es möglich,einen freien Storage-Bereich als Block Device an den Cluster anzuschlie-ßen. Jedoch müsste dann jeder Datensatz vor dem Berechnen auf den Clus-ter und die Ergebnisse wieder zurück kopiert werden. Ob der resultierendeVorteil durch die Anbindung des LSDF als Block Device die Nachteile derdoppelten Datenhaltung und der langen Transferzeiten durch die Kopier-vorgänge überwiegt, ist fraglich.Für eine Anbindung via NFS über eine breitbandige IP-Verbindung erwar-ten wir eine akzeptable Performanz. Zusätzlich wird ein Zwischenspeichernder Daten auf den bwGRiD-Clustern in Betracht gezogen. Die Visualisie-rung der Netzwerktests hat Transparenz geschaffen, um die Anbindung dereinzelnen Standorte miteinander besser vergleichen zu können. Die aus denMessungen resultierenden Daten dienen der realistischen Einschätzung be-züglich des Datentransfers für die Umsetzung eines landesübergreifendenSchedulings, wie es im Rahmen der ergänzenden Maßnahmen angedachtist. Zukünftig werden Lösungen evaluiert, um die großen Datenmengen,wie sie im bwGRiD-Projekt entstehen, zu verwalten.
3.5 Arbeitspaket 4.1 – Verbreitung, Förderung, Schulung undZugang
Die zentralen Fragestellungen, die im Rahmen des Arbeitspaketes beant-wortet werden sollen, lauten: Welche Informationen werden benötigt, umZugang zu dem bwGRiD zu bekommen? Wie können diese Informationenso aufbereitet werden, dass die notwendigen Prozeduren um beispielswei-se ein Grid-Nutzer-Zertifikat zu beantragen, so beschrieben werden, dasssie einfach, verständlich und nachvollziehbar sind? Der Fokus der Ziel-gruppe liegt auf Benutzer (-gruppen), die entweder bislang noch nicht mit
10 LSDF: Large Scale Data Facility for Life Sciences, http://www.bioquant.
uni-heidelberg.de [aufgerufen: 18.05.2012]
30 Marek Dynowski, et al.
dem bwGRiD gearbeitet haben oder die aus wissenschaftlichen Bereichenkommen, die nicht klassischerweise mit HPC-Ressourcen operieren. BeideBenutzer (-gruppen) benötigen individuelle Konzepte und Lösungen, ummit dem bwGRiD produktiv arbeiten zu können. Diese werden im Rahmendes Arbeitspakets 4.1 erarbeitet und entwickelt.
Zugang, Förderung und Schulung Die inhaltliche und visuelle Auf-bereitung der gesamten Prozedur, die notwendig ist, um ein Grid-Nutzer-Zertifikat zu beantragen, war eine der ersten Maßnahmen in dem Arbeit-spaket 4.1. Dieses Grid-Nutzer-Zertifikat wird benötigt, um grundsätzlichZugriff auf die bwGRiD-Ressourcen zu bekommen – entweder über dieKonsole oder über webbasierte Zugänge wie das bwGRiD Wissenschaft-sportal. Allerdings ist die Beantragung ein mehrstufiger, recht umständli-cher und daher fehleranfälliger Prozess. Gerade für Benutzer, die bislangkeine Erfahrungen im Umgang mit HPC-Ressourcen haben, ist dies eineEinstiegshürde, die nicht förderlich für die Akzeptanz des bwGRiDs ist.Die komplette Aufarbeitung dieser Prozedur führte zur Entwicklung einerSchritt-für-Schritt Anleitung, die sowohl als Webseiten als auch in gebun-den in Form eines „Handbuchs bwGRiD“ vorliegen. Sämtliche Maskensind als Screenshots abgebildet und enthalten farbige Markierungen undErklärungen, welche Daten an welcher Stelle eingetragen werden müssen.Mit dieser Schritt-für- Schritt-Anleitung konnte speziell für Benutzer aus„nicht-klassischen“ Bereichen der Zugang zu dem bwGRiD erheblich ver-einfacht werden.Für die Planung und Durchführung von wissenschaftlichen Projekten aufden bwGRiD-HPC-Ressourcen sind Informationen zur Softwareausstattungan den jeweiligen Standorten von essentieller Bedeutung. Nur so kann aucheine effiziente Nutzung der Ressourcen gewährleistet werden. Aus diesemGrund wurde ein web-basiertes System entwickelt, um eine aktuelle Über-sicht über die an den Standorten verfügbare Software liefern zu können,ohne dass die Benutzer bereits ein Grid- Nutzer-Zertifikat benötigen. Der„Cluster Software Browser“ (CSB)11 arbeitet mit zwei Komponenten: ei-
11 CSB: Cluster Software Browser, http://www.bw-grid.uni-freiburg.de/software[aufgerufen: 14.05.2012]
Das bwGRiD heute 31
nem Software-Agenten, der auf allen Standorten die dort verfügbare Soft-wareliste zusammenstellt und sie an eine zentrale Stelle übermittelt undeiner Weboberfläche, die die gesammelten Informationen grafisch aufberei-tet. Der Software-Agent wird dazu manuell gestartet und meldet sich mit-hilfe eines Grid-Nutzer-Zertifikat der Reihe nach auf allen Standorten an.Dort wird die Ausgabe des Programmes modules eingelesen und in ent-sprechende Datenstrukturen umgewandelt, die an eine zentrale Stelle (demWebserver, der auch die grafische Oberfläche bereitstellt) zur Speicherungübertragen werden. Die grafische Oberfläche bildet ein webbasiertes In-terface, mit dessen Hilfe nach beliebigen Softwarenamen oder innerhalbbestimmter Anwendungsgebiete gesucht werden kann. Die Weboberflächekann in die lokalen Content-Management-Systeme der bwGRiD-Standorteeingebaut und an das jeweilige Corporate Design angepasst werden. Aufdiese Weise können sich interessierte Benutzer schon im Vorfeld erkundi-gen, ob die benötigte Software in der entsprechenden Version vorliegt - undwenn ja, an welchen Standorten.
Verbreitung Neben Aufgaben zu Zugang, Förderung und Schulung hin-sichtlich des bwGRiDs, stellt die Verbreitung einen weiteren Schwerpunktdes Arbeitspaktes dar. Es werden kleine lokale Veranstaltungen mit interes-sierten (potenziellen) Anwendergruppen regelmäßig durchgeführt, die rela-tiv kurzfristig organisiert werden können. In diesem Zusammenhang wirdzum ersten Mal in der Geschichte des bwGRiD-Projektes vom 23. Mai bis25. Mai 2012 am Standort Freiburg in Kooperation mit dem „Black Fo-rest Grid“ (BFG) eine Konferenz stattfinden, auf der sowohl Anwender alsauch Betreiber ihre Arbeit vorstellen. Mit dieser Konferenz werden meh-rere Ziele verfolgt: (1) die Sichtbarkeit des bwGRiD-Projektes wird durchentsprechende Einladungen und Werbung deutlich erhöht, (2) die Nutzerdes bwGRiDs bekommen die Möglichkeit, ihre Projekte einem interessier-ten Fachpublikum vorzustellen und die Betreiber der Infrastruktur könneninteressante Entwicklungen vorstellen und (3) es soll die Vielfalt der fachli-chen Schwerpunkte der Benutzer dargestellt und der persönliche Austauschzwischen Benutzern und Betreibern intensiviert werden. Die Veranstaltungist mit einer Gesamtdauer von zweieinhalb Tagen konzipiert und wird mit
32 Marek Dynowski, et al.
einem internen Treffen der Projektmitglieder beginnen. Am Nachmittag desersten Tages beginnt der öffentliche Teil der Konferenz mit Grußworten undVorträgen zu generellen Fragestellungen rund um das Grid-Computing. Derzweite Tag ist den Anwendern und Administratoren gewidmet: dort werdenwissenschaftliche Projekte, die aus den unterschiedlichsten Fachbereichenstammen und die auf dem bwGRiD gerechnet wurden, einem breiten Fach-publikum vorgestellt. Dabei wird es Vorträge zu linguistischen Problem-stellungen genauso wie Vorträge über die neuesten Techniken zur Program-mierung von spezieller Hardware wie den GPGPU-Karten geben. Der dritteTag beendet die Konferenz mit einer praktischen „Hands-On Session“, beider interessierte Benutzer unter fachkundiger Anleitung ihre Grid-Nutzer-Zertifikate beantragen oder andere praktische Probleme gemeinsam mit denAdministratoren lösen können.Neben der Durchführung der Konferenz wurden auch von allen interessier-ten Anwendergruppen aus dem gesamten Bundesland Beiträge zu einemKonferenzband eingesammelt. Dieser Konferenzband soll einen Einblickin die Vielfalt der aktuellen Projekte ermöglichen und auch eine Art „Zu-standsbericht“ darstellen.Alle Maßnahmen, die im Rahmen des Arbeitspaketes 4.1 entwickelt wer-den, dienen der Verbesserung der Integration von neuen Benutzern und derVerbesserung des Austausches von Informationen rund um das bwGRiD-Projekt. Dabei wird jedes Mal die Perspektive der Benutzer eingenommen,um die notwendigen Angebote optimal auf die Bedürfnisse der Anwenderhin zu entwickeln.
3.6 Arbeitspaket 4.2 – Integration zusätzlicherwissenschaftlicher Nutzer und Fachgruppen mit speziellenAnforderungen
Eines der Ziele des bwGRiD-Projektes ist die Bereitstellung von HPC-Ressourcen für ein möglichst breites Anwenderspektrum. Dies ist durchdie zu Beginn des Projektes beschaffte Basis-Hardwareausstattung zwargewährleistet, jedoch sollen auch neue Anwender aus HPC-fernen Fach-gebieten mit speziellen Anforderungen sowohl im Bereich der Hard- alsauch Software an das bwGRiD herangeführt werden. Dazu wurde im Rah-
Das bwGRiD heute 33
men der ergänzenden Maßnahmen das Arbeitspaket 4.2 erarbeitet. Durchdie Beschaffung und Eingliederung spezialisierter Hard- und Software so-wie das Erarbeiten individueller Nutzungskonzepte sollen Anwender mitspeziellen Anforderungen in das bwGRiD integriert werden. Die Koordi-nation des Projektes für das bwGRiD übernimmt der Standort Tübingen.Seit Beginn des bwGRiD-Projektes begannen einige Standorte mit der Inte-gration eigener Hardware-Komponenten in die ursprünglich homogene Ba-sisausstattung ihrer HPC-Cluster, wobei die Gewährleistung der Interopera-bilität zwischen den einzelnen Standorten zwingend erforderlich war. Sol-che heterogenen Erweiterungen durch Integration von spezialisierten Hard-warearchitekturen steigern nicht nur die Attraktivität einzelner Standorte,sondern auch die des gesamten bwGRiDs. Insbesondere wenn die zusätz-lichen Ressourcen dem gesamten Clusterverbund zur Verfügung gestelltwerden. Diese können dadurch die optimale Hardware für die Lösung ihresProblems ermitteln und anschließend auch verwenden. Im besten Fall führtdieses nicht nur zu einer Nutzung der entsprechenden Hardware, sondernauch zu anwenderfinanzierten Neuanschaffungen, welche anschließend indie entsprechenden bwGRiD-Cluster integriert werden können.Unabhängig davon profitieren allerdings alle Nutzer allein schon durch dieEntlastung der Basis-Hardware. Ferner ermöglicht das Konzept der hetero-genen Hardware-Erweiterung die Evaluation verschiedener Rechnerarchi-tekturen im Produktionsbetrieb und die Erstellung spezieller Nutzungskon-zepte bei Neuanschaffungen. Der intensive Erfahrungsaustausch zwischenNutzern und Betreibern fördert auch den Aufbau von Kernkompetenzeneinzelner Standorte im Bereich Hard- und Software, von denen das gesam-te bwGRiD-Projekt profitiert.
Die Standorte Freiburg, Esslingen, Mannheim/Heidelberg, Stuttgart undTübingen haben im Laufe des Projektes die Grundausstattung ihrer Clusterdurch Betreiber- und Anwender-finanzierte Hardware kontinuierlich erwei-tert (Abbildung 2). In vielen Fällen steht die neue Hardware dem gesamtenbwGRiD zur Verfügung. So wurden am Standort Freiburg 18 Knoten mitgrößerem Hauptspeicher (16 x 24 GByte, 1 x 256 GByte, 1 x 512 GByte) vondem Lehrstuhl für Quantenoptik und Statistik angeschafft, in das bwGRiD-
34 Marek Dynowski, et al.
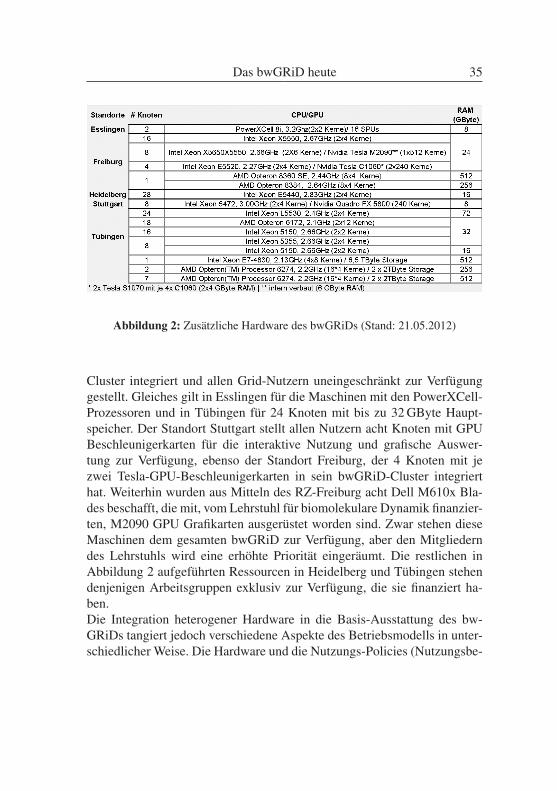
Abbildung 2: Zusätzliche Hardware des bwGRiDs (Stand: 21.05.2012)
Cluster integriert und allen Grid-Nutzern uneingeschränkt zur Verfügunggestellt. Gleiches gilt in Esslingen für die Maschinen mit den PowerXCell-Prozessoren und in Tübingen für 24 Knoten mit bis zu 32 GByte Haupt-speicher. Der Standort Stuttgart stellt allen Nutzern acht Knoten mit GPUBeschleunigerkarten für die interaktive Nutzung und grafische Auswer-tung zur Verfügung, ebenso der Standort Freiburg, der 4 Knoten mit jezwei Tesla-GPU-Beschleunigerkarten in sein bwGRiD-Cluster integrierthat. Weiterhin wurden aus Mitteln des RZ-Freiburg acht Dell M610x Bla-des beschafft, die mit, vom Lehrstuhl für biomolekulare Dynamik finanzier-ten, M2090 GPU Grafikarten ausgerüstet worden sind. Zwar stehen dieseMaschinen dem gesamten bwGRiD zur Verfügung, aber den Mitgliederndes Lehrstuhls wird eine erhöhte Priorität eingeräumt. Die restlichen inAbbildung 2 aufgeführten Ressourcen in Heidelberg und Tübingen stehendenjenigen Arbeitsgruppen exklusiv zur Verfügung, die sie finanziert ha-ben.Die Integration heterogener Hardware in die Basis-Ausstattung des bw-GRiDs tangiert jedoch verschiedene Aspekte des Betriebsmodells in unter-schiedlicher Weise. Die Hardware und die Nutzungs-Policies (Nutzungsbe-
Das bwGRiD heute 35
dingungen) müssen im Scheduling-System für die Nutzer transparent abge-bildet werden, ohne dabei die Interoperabilität des Grids zu beeinträchtigen.Entsprechende Konzepte sollen im Rahmen des Arbeitspaket 4.2 entwickeltund umgesetzt werden. Ein weiterer Aspekt betrifft die zentrale Bereitstel-lung von Softwaremodulen für das bwGRiD. Insbesondere ist die Frage zuklären, ob die mit der Bereitstellung von Standard-Softwaremodulen be-auftragen Personen auch für die Bereitstellung der Module für spezielleHardwarearchitekturen wie GPUs verantwortlich sind. Ferner muss auchgeprüft werden, inwieweit die Nutzung der unterschiedlichen Hardwarear-chitekturen über das bwGRiD-Portal ermöglicht werden soll. Dazu ist injedem Fall eine entsprechende Integration in das Ressourcenmanagementin das Portal erforderlich, die zum Teil schon abgeschlossen ist.Obwohl das bwGRiD-Projekt im Dezember 2012 offiziell ausläuft, wirdder Ausbau einiger Cluster geplant. An verschiedenen Standorten werdendie bwGRiD-Cluster noch über das offizielle Projektende hinaus betrieben.Dennoch werden jetzt nur noch Komponenten angeschafft, die gegebenen-falls eigenständig betrieben werden können oder sich auch in die HPC-Cluster des Nachfolgeprojektes integrieren lassen.
3.7 Arbeitspaket 4.3 – Anwendersoftware-Kompetenz-Netzwerk
Das Arbeitspaket 4.3 legt den Schwerpunkt auf die im bwGRiD verfüg-bare Software. Software ist eine der Kernkomponenten für eine erfolgrei-che Nutzung des bwGRiDs. Ohne eine ansprechende, umfangreiche undverfügbare Softwareausstattung ist es sehr schwer, neue Benutzer für dasbwGRiD zu gewinnen und Bestehende im System zu halten. Die Vertei-lung von Standard-Software soll verbessert und vereinheitlicht werden, uman möglichst allen Standorten eine homogene Umgebung für den Benut-zer bereitzustellen. Durch eine stärkere Automatisierung und Routinen zurautomatischen Funktionsprüfung der Software soll sich der Wartungsauf-wand für die lokalen Administratoren reduzieren. Gleichzeitig soll auchverstärkt spezielle Software für einzelne Benutzer auf das Grid gebrachtwerden. Der dazu zur Verfügung gestellte Installationssupport hilft demBenutzer in allen Phasen dieses Prozesses, angefangen von der Anpassung
36 Marek Dynowski, et al.
und Kompilierung der Software bis hin zur Installation und zur Problem-behebung während der Laufzeit. Neben dieser durch bwGRiD-Mitarbeiterangebotenen Unterstützung sollen die Benutzer auch untereinander in Kon-takt gebracht werden, um sich gemeinsam über die in Verwendung befind-liche Software auszutauschen. Hierzu werden entsprechende web-basierteKommunikationsmöglichkeiten geschaffen. Alle genannten Punkte bedin-gen eine verbesserte Präsentation der bwGRiD-Software und deren Mög-lichkeiten nach außen. Zu diesem Zweck muss die Webseite aktualisiert,übersetzt und insbesondere das Softwareangebot übersichtlich dargestelltwerden. Für die Koordinierung der Aufgaben wurde in Konstanz die Stelleeines Software-Koordinators geschaffen.Die beschriebenen Ziele im Arbeitspaket gliedern sich in vier wesentlicheMeilensteine. Der erste Meilenstein im Bereich Software-Verteilung ist dieSchaffung eines entsprechenden Repositorys mit Mechanismen zur Vertei-lung. Für diesen Meilenstein, der bis Juli 2012 erreicht werden soll, stelltesich nach eingehender Analyse heraus, dass zuerst ein vernünftiger Über-blick über den Soll- und Ist-Zustand der Software auf den einzelnen Kno-ten vorliegen muss. Gleichzeitig müssen diese Informationen auch über ei-ne Schnittstelle für andere Anwendungen im bwGRiD verfügbar sein. Ausdiesem Grund haben wir uns vor der Arbeit an diesem Meilenstein im Pro-jekt entschlossen, zuerst eine Software-Datenbank zu entwickeln, die die-se Information ermittelt, aufbereitet und sowohl intern als auch extern zurVerfügung stellt. Diese Datenbank wird an das Portal angedockt, das dabeials bewährtes Framework für die zu entwickelnden Softwarekomponentendient. Die so ermittelten Daten werden dann über einen bereits in Freiburgentwickelten Software-Browser komfortabel, übersichtlich und sortierbarauf der bwGRiD-Webseite für die Benutzer dargestellt. Bei der internenVerwendung werden die Daten genutzt, um Unterschiede zwischen demSoll- und dem Ist-Zustand darzustellen und den lokalen Administrator auf-zufordern, die neue verfügbare Software zu installieren. Dieser automatischgenerierte Überblick macht das manuelle Verfolgen der Softwareliste ob-solet. Als zweiter Meilenstein im Bereich der verbesserten Bereitstellungvon Software ist die Bereitstellung von automatischen Testroutinen für Juli2013 vorgesehen. Für diesen Meilenstein haben bisher nur grundlegende
Das bwGRiD heute 37
Überlegungen stattgefunden und in einem ersten Schritt eine Vereinheit-lichung der Notation von mitgelieferten Testcases in den beschreibendenModule-Dateien der Softwarepakete erreicht. Außerdem wurde als Vorstu-fe für automatisierte Tests ein Mechanismus integriert, der ein gegenseiti-ges manuelles Testen neuer Software beinhaltet. Als weitere Maßnahme imRahmen des Installationssupports wurde die Webseite um die Beschreibungvon Software, deren Installation und möglicher Probleme erweitert. Damitwird eine öffentlich sichtbare Seite geschaffen, auf der sowohl Benutzerals auch Mitarbeiter jederzeit nachlesen können, was bei der Installationvon bestimmter Software zu beachten ist. Durch das gute Google-Rankingder universitären Seiten ergibt sich als Nebeneffekt eine gute Werbung fürdas bwGRiD bei Personen, die allgemein nach der Software suchen. AufNachfrage von Benutzern wurden bereits mehrere Softwarepakete indivi-duell gebaut und im bwGRiD zum Einsatz gebracht. Der vierte Meilensteinschließt an den Installationssupport an und soll den Benutzern die Möglich-keit geben, sich selber über Software auf einer geeigneten Plattform auszu-tauschen. Als Moderator fungiert dabei der Software-Koordinator, der auchin diesem Benutzerforum aktiv Support geben soll. Da der Meilenstein erstfür Juli 2013 vorgesehen ist, wurde hier bisher nur als Vorarbeit die Über-setzung der Webseite ins Englische durchgeführt. Die bevorzugte Spracheder meisten Benutzer im bwGRiD ist englisch und eine gewünschte Dis-kussion kann nur in dieser Sprache forciert werden. Um eine homogeneEinbettung in die bestehende Webseite zu gewährleisten, muss diese logi-scherweise dann auch in englisch zur Verfügung stehen.
4 Fazit
Durch das bwGRiD-Projekt wurde in Baden-Württemberg im Laufe derletzten Jahre eine für Deutschland einzigartige HPC-Infrastruktur geschaf-fen, die HPC-Ressourcen für ein breites Anwenderspektrum aus der Wis-senschaft im Land und darüber hinaus zur Verfügung stellt. Voraussetzungdafür war das erfolgreiche Verbinden einzelner HPC-Standorte zu einemClusterverbund, unter Entwicklung und Einhaltung gemeinsamer Standardsbezüglich der Software, des Batchsystems und des Betriebskonzeptes. Nurdadurch konnte die für das Projekt so wichtige Interoperabilität gewährleis-
38 Marek Dynowski, et al.
tet werden, die Nutzern die gesamten Rechenressourcen flexibel und trans-parent zur Verfügung stellt. Die beträchtliche Anzahl an Veröffentlichungen(Referenz) aus verschiedensten wissenschaftlichen Fachrichtungen, für diedie Ressourcen der bwGRiD-Infrastruktur in Anspruch genommen wurden,beweist, dass sich das bwGRiD im Laufe der Zeit zu einem unverzicht-baren Werkzeug für eine große Anzahl von Wissenschaftlern entwickelthat. Mit dem „Ergänzenden-Maßnahmen-Paket“ wurde darüber hinaus einwichtiger Grundstein für die weitere erfolgreiche Entwicklung des HPC inBaden-Württemberg gelegt.
Nicht zuletzt durch das bwGRiD-Projekt hat das HPC eine herausra-gende Stellung im Land erlangt und stärkt durch die Bereitstellung seinerComputing-Ressourcen für die wissenschaftliche Gemeinschaft den Wis-senschaftsstandort Baden-Württemberg.
Das bwGRiD heute 39

Geomechanical Reservoir Modeling – a geologicalapplication of high-performance computing
Karsten Fischer∗, Andreas Henk†
Albert-Ludwigs-Universität FreiburgTechnische Universität Darmstadt
Abstract: Tectonic stresses affect the optimal exploitation of hydrocarbonand geothermal reservoirs in numerous ways. Amongst others, wellbore sta-bility and the orientation of hydraulically induced fracs depend on the recentin situ stresses. The local stress field can vary substantially in magnitude andorientation due to faults or changing rock types. In order to obtain a robustpre-drilling prediction of in situ stress fields and fracture networks, geome-chanical reservoir modeling incorporates the specific reservoir geometry, theremote stress field, as well as the mechanical properties of all participatinglithologies and faults. The numerical technique of the Finite Element Method(FEM) has the potential to describe the subsurface reservoir in sufficient de-tail. Reservoir dimensions, the required spatial resolution, and the amount ofincorporated faults representing non-linear structural discontinuities increasethe demand in computing power in a way that HPC solutions become oblig-atory. The bwGRiD cluster in Freiburg eventually allowed us to calculate ageomechanical FE-model of an entire reservoir comprising over 3.8 millionelements, three lithological layers with individual rock mechanical properties,and more than 80 faults cross-cutting the reservoir. Job-specific performancestatistics of differently sized models and multiple runs on various servers re-veal interesting aspects regarding the impact of processor type, way of paral-lelization and GPU acceleration on the computing time of our models. Theseinsights facilitate future work with the bwGRiD and other HPC clusters.
1 IntroductionCompressive stress is ubiquitous in the interior of the earth. The scientificfield of Geomechanics is the geological study of the behavior of soil and∗ [email protected]† [email protected]
rock under a given state of stress. Geomechanical aspects play an impor-tant role for the optimal exploration and production of a variety of reservoirtypes, for instance in conventional and unconventional hydrocarbon reser-voirs, in geothermal reservoirs, but also when it comes to underground se-questration of CO2 (CCS – carbon capture and storage). Amongst others,wellbore stability, the orientation of hydraulically induced fracs and - es-pecially in fractured reservoirs - permeability anisotropies depend on therecent in situ stresses.
While the regional tectonic stress field is mostly dictated by plate tecton-ics, the local state of stress in a reservoir is affected by faults, as well asvertical and lateral lithological changes, i.e. contrasts in rock mechanicalproperties (e.g., [Zoback2007, Fjaer2008]). Observations from surface andsubsurface studies indicate that such heterogeneities can substantially mod-ify the local magnitudes and orientations of the three principal stresses. Insome fault-controlled reservoirs, for example, local stress orientations dif-fering by up to 90 from the regional trend have been reported for individualfault compartments [Yale2003].
Such stress perturbations characterize not only the present-day in situstress regime in a reservoir. Similar, but differently oriented local stress de-viations must have existed during past tectonic stages, when the tectonicregime and, hence, paleo-stresses differed in magnitude and orientationfrom the present situation. Such paleo-stress field perturbations at timesof fracture formation and reactivation were responsible for the spatial vari-ations in fracture orientation, fracture type and fracture density observedtoday.
In order to minimize exploration risks and optimize drilling, a reliable,ideally “pre-drilling” prediction of tectonic stresses and fracture networksis desirable.
2 Geomechanical Modeling
A reliable prognosis requires the incorporation of the specific reservoir ge-ometry, the recent and paleo remote stress field, as well as the mechanicalproperties of all participating rock types and faults as detailed as possi-ble. The Finite Element Method (FEM) represents an appropriate numeri-
42 Karsten Fischer, et al.
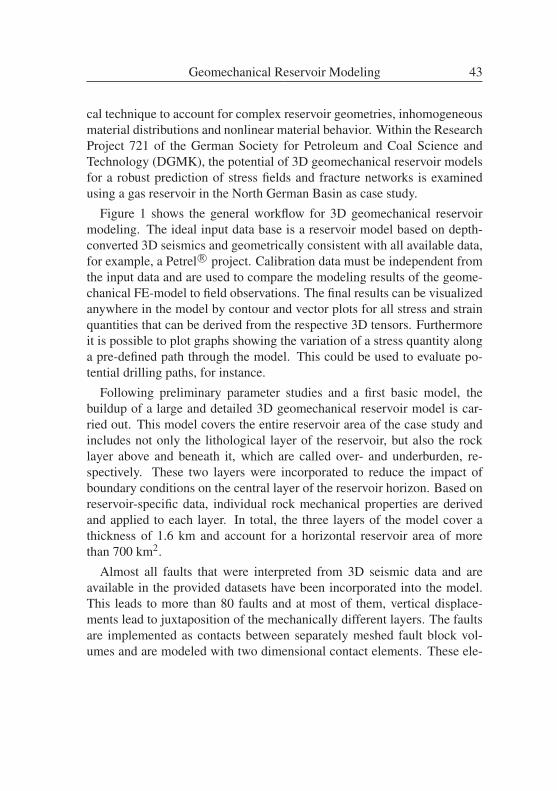
cal technique to account for complex reservoir geometries, inhomogeneousmaterial distributions and nonlinear material behavior. Within the ResearchProject 721 of the German Society for Petroleum and Coal Science andTechnology (DGMK), the potential of 3D geomechanical reservoir modelsfor a robust prediction of stress fields and fracture networks is examinedusing a gas reservoir in the North German Basin as case study.
Figure 1 shows the general workflow for 3D geomechanical reservoirmodeling. The ideal input data base is a reservoir model based on depth-converted 3D seismics and geometrically consistent with all available data,for example, a Petrel R© project. Calibration data must be independent fromthe input data and are used to compare the modeling results of the geome-chanical FE-model to field observations. The final results can be visualizedanywhere in the model by contour and vector plots for all stress and strainquantities that can be derived from the respective 3D tensors. Furthermoreit is possible to plot graphs showing the variation of a stress quantity alonga pre-defined path through the model. This could be used to evaluate po-tential drilling paths, for instance.
Following preliminary parameter studies and a first basic model, thebuildup of a large and detailed 3D geomechanical reservoir model is car-ried out. This model covers the entire reservoir area of the case study andincludes not only the lithological layer of the reservoir, but also the rocklayer above and beneath it, which are called over- and underburden, re-spectively. These two layers were incorporated to reduce the impact ofboundary conditions on the central layer of the reservoir horizon. Based onreservoir-specific data, individual rock mechanical properties are derivedand applied to each layer. In total, the three layers of the model cover athickness of 1.6 km and account for a horizontal reservoir area of morethan 700 km2.
Almost all faults that were interpreted from 3D seismic data and areavailable in the provided datasets have been incorporated into the model.This leads to more than 80 faults and at most of them, vertical displace-ments lead to juxtaposition of the mechanically different layers. The faultsare implemented as contacts between separately meshed fault block vol-umes and are modeled with two dimensional contact elements. These ele-
Geomechanical Reservoir Modeling 43
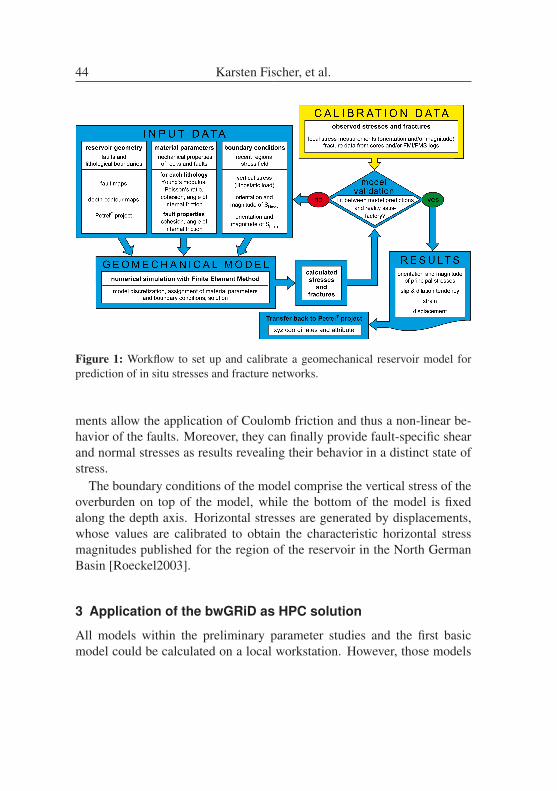
Figure 1: Workflow to set up and calibrate a geomechanical reservoir model forprediction of in situ stresses and fracture networks.
ments allow the application of Coulomb friction and thus a non-linear be-havior of the faults. Moreover, they can finally provide fault-specific shearand normal stresses as results revealing their behavior in a distinct state ofstress.
The boundary conditions of the model comprise the vertical stress of theoverburden on top of the model, while the bottom of the model is fixedalong the depth axis. Horizontal stresses are generated by displacements,whose values are calibrated to obtain the characteristic horizontal stressmagnitudes published for the region of the reservoir in the North GermanBasin [Roeckel2003].
3 Application of the bwGRiD as HPC solution
All models within the preliminary parameter studies and the first basicmodel could be calculated on a local workstation. However, those models
44 Karsten Fischer, et al.
included only one set of mechanical parameters, i.e. one type of material,4-15 faults, and no more than about 1 million elements.
The bwGRiD enabled us to build a full-scale reservoir model with an out-standing complexity, regarding for instance the number of faults and espe-cially the spatial resolution. While the rather thin central layer of the reser-voir horizon is divided vertically into 4 element layers, the much thickerover- and underburden are each divided into 6 element layers. In combi-nation with a horizontal element size of 100 m this yields more than 3.81million elements in total. Figure 2 shows one of more than 200 very differ-ently sized fault blocks of the model elucidating the layering and the highspatial resolution. It has to be kept in mind that the reservoir covers an areaof several hundreds of square kilometers. Together with the large amount ofnon-linear contacts representing faults, this large and detailed 3D geome-chanical model would result in absolutely unacceptable computing timeswhen calculated on the available local workstation (Intel Xeon Quad-CoreCPU, 12 GByte RAM).
Within the DGMK Research Project 721, the commercial FE-codeAnsys R© (Ansys Inc., Houston, USA) is used for pre- and post processing,as well as for solving the models. This highly facilitated the usage of thebwGRiD, because Ansys R© 13 SP1 had already been installed on all clus-ters. Inside Ansys R©, modeling is done using the Mechanical APDL (An-sys Parametric Design Language), which results in script files comprisinga section for pre-processing, solution specifications, and post-processing.These script files are read into Ansys R© and are solved as batch jobs usingthe sparse matrix direct solver.
A portlet programmed for the bwGRiD Portal Project by the very oblig-ing and helpful IT service of the University of Freiburg was used for sub-mitting ANSYS Mechanical jobs to the grid. This portlet is accessible viaweb browser and allows users to upload the Mechanical APDL script filesas well as to select the desired number of nodes, cores, type of paralleliza-tion and required main memory. The selectable queues depend on the ap-plied job specifications. After submitting the job, the portlet can be usedfor monitoring and to download the result files after the job is done. Mostcalculations were done on the bwGRiD Freiburg, mainly due to the higher
Geomechanical Reservoir Modeling 45
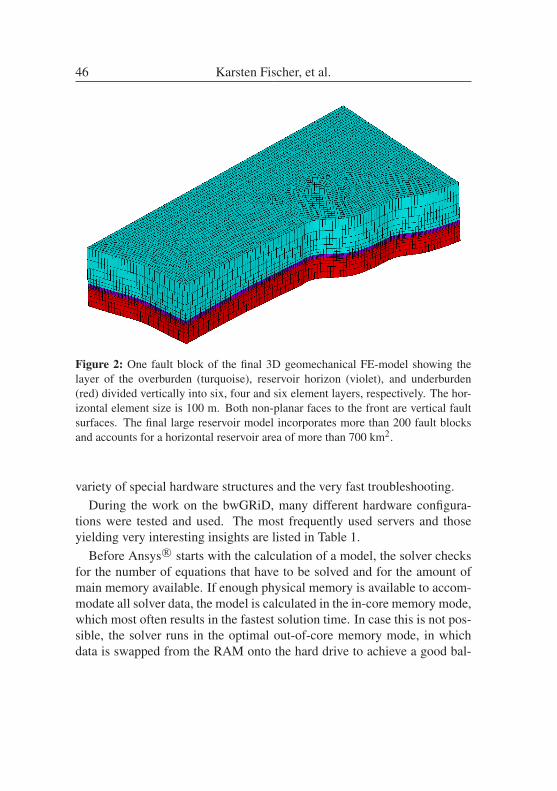
Figure 2: One fault block of the final 3D geomechanical FE-model showing thelayer of the overburden (turquoise), reservoir horizon (violet), and underburden(red) divided vertically into six, four and six element layers, respectively. The hor-izontal element size is 100 m. Both non-planar faces to the front are vertical faultsurfaces. The final large reservoir model incorporates more than 200 fault blocksand accounts for a horizontal reservoir area of more than 700 km2.
variety of special hardware structures and the very fast troubleshooting.During the work on the bwGRiD, many different hardware configura-
tions were tested and used. The most frequently used servers and thoseyielding very interesting insights are listed in Table 1.
Before Ansys R© starts with the calculation of a model, the solver checksfor the number of equations that have to be solved and for the amount ofmain memory available. If enough physical memory is available to accom-modate all solver data, the model is calculated in the in-core memory mode,which most often results in the fastest solution time. In case this is not pos-sible, the solver runs in the optimal out-of-core memory mode, in whichdata is swapped from the RAM onto the hard drive to achieve a good bal-
46 Karsten Fischer, et al.
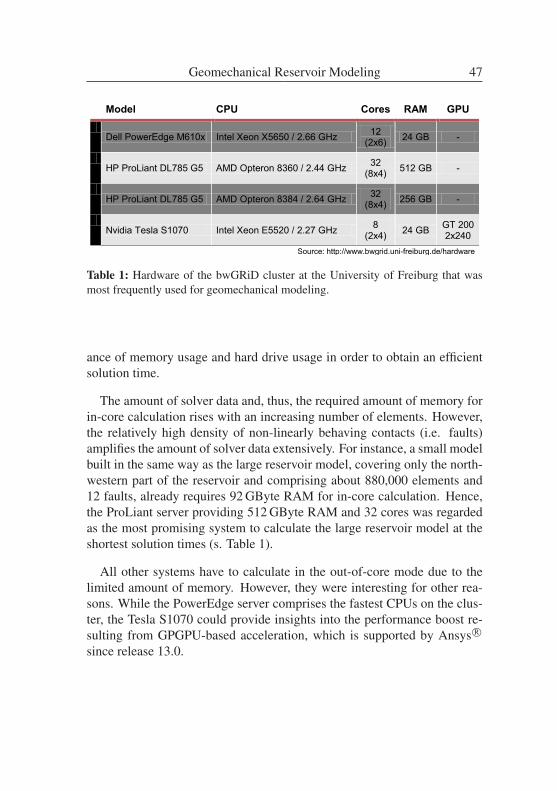
6
queues depend on the applied job specifications. After submitting the job, the portlet can be used for monitoring and to download the result files after the job is done. Most calculations were done on the bwGRiD Freiburg, mainly due to the higher variety of special hardware structures and the very fast troubleshooting.
During the work on the bwGRiD, many different hardware configurations were tested and used. The most frequently used servers and those yielding very interesting insights, are listed in Table 1.
Model CPU Cores RAM GPU
Dell PowerEdge M610x Intel Xeon X5650 / 2.66 GHz 12 (2x6) 24 GB -
HP ProLiant DL785 G5 AMD Opteron 8360 / 2.44 GHz 32
(8x4) 512 GB -
HP ProLiant DL785 G5 AMD Opteron 8384 / 2.64 GHz 32
(8x4) 256 GB -
Nvidia Tesla S1070 Intel Xeon E5520 / 2.27 GHz 8
(2x4) 24 GB GT 200 2x240
Source: http://www.bwgrid.uni-freiburg.de/hardware
Table 1 Hardware of the bwGRiD cluster at the University of Freiburg that was most frequently used for geomechanical modeling.
Before Ansys® starts with the calculation of a model, the solver checks for the number of equations that have to be solved and for the amount of main memory available. If enough physical memory is available to accommodate all solver data, the model is calculated in the in-core memory mode, which most often results in the fastest solution time. In case this is not possible, the solver runs in the optimal out-of-core memory mode, in which data is swapped from the RAM onto the hard drive to achieve a good balance of memory usage and hard drive usage in order to obtain an efficient solution time.
The amount of solver data and, thus, the required amount of memory for in-core calculation rises with an increasing number of elements. However, the relatively high density of non-linearly behaving contacts (i.e. faults) amplifies the amount of solver data extensively. For instance, a small model built in the same way as the large reservoir model, covering only the northwestern part of the reservoir and comprising about 880’000 elements and 12 faults, already requires 92 GB RAM for in-core calculation. Hence, especially the ProLiant server providing 512 GB RAM and 32 cores was regarded as the most promising system to calculate the large reservoir model at the shortest solution times (s. Table 1).
Table 1: Hardware of the bwGRiD cluster at the University of Freiburg that wasmost frequently used for geomechanical modeling.
ance of memory usage and hard drive usage in order to obtain an efficientsolution time.
The amount of solver data and, thus, the required amount of memory forin-core calculation rises with an increasing number of elements. However,the relatively high density of non-linearly behaving contacts (i.e. faults)amplifies the amount of solver data extensively. For instance, a small modelbuilt in the same way as the large reservoir model, covering only the north-western part of the reservoir and comprising about 880,000 elements and12 faults, already requires 92 GByte RAM for in-core calculation. Hence,the ProLiant server providing 512 GByte RAM and 32 cores was regardedas the most promising system to calculate the large reservoir model at theshortest solution times (s. Table 1).
All other systems have to calculate in the out-of-core mode due to thelimited amount of memory. However, they were interesting for other rea-sons. While the PowerEdge server comprises the fastest CPUs on the clus-ter, the Tesla S1070 could provide insights into the performance boost re-sulting from GPGPU-based acceleration, which is supported by Ansys R©
since release 13.0.
Geomechanical Reservoir Modeling 47
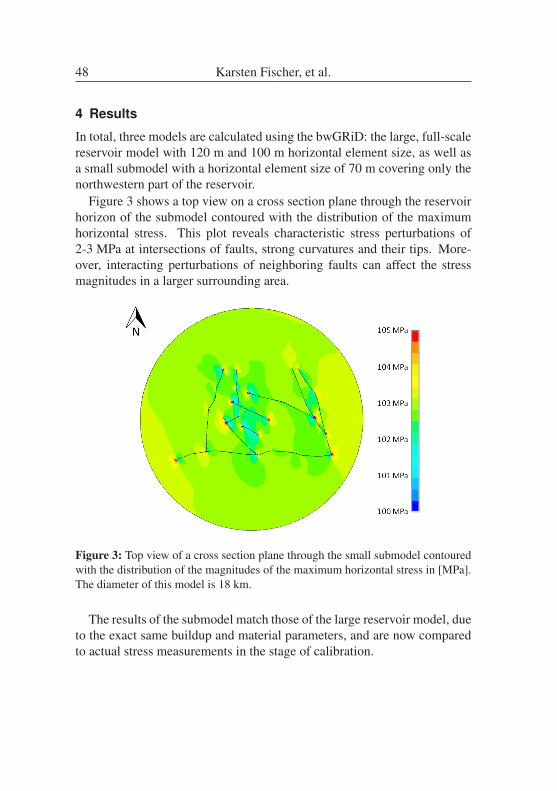
4 Results
In total, three models are calculated using the bwGRiD: the large, full-scalereservoir model with 120 m and 100 m horizontal element size, as well asa small submodel with a horizontal element size of 70 m covering only thenorthwestern part of the reservoir.
Figure 3 shows a top view on a cross section plane through the reservoirhorizon of the submodel contoured with the distribution of the maximumhorizontal stress. This plot reveals characteristic stress perturbations of2-3 MPa at intersections of faults, strong curvatures and their tips. More-over, interacting perturbations of neighboring faults can affect the stressmagnitudes in a larger surrounding area.
Figure 3: Top view of a cross section plane through the small submodel contouredwith the distribution of the magnitudes of the maximum horizontal stress in [MPa].The diameter of this model is 18 km.
The results of the submodel match those of the large reservoir model, dueto the exact same buildup and material parameters, and are now comparedto actual stress measurements in the stage of calibration.
48 Karsten Fischer, et al.
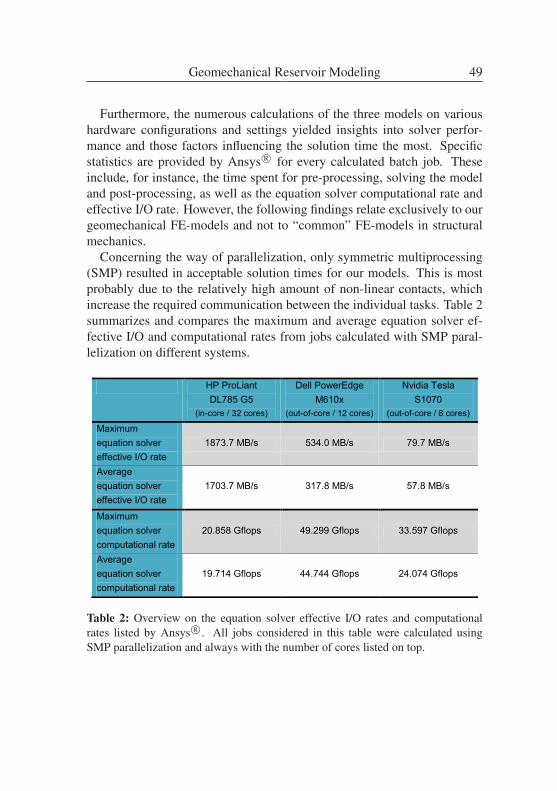
Furthermore, the numerous calculations of the three models on varioushardware configurations and settings yielded insights into solver perfor-mance and those factors influencing the solution time the most. Specificstatistics are provided by Ansys R© for every calculated batch job. Theseinclude, for instance, the time spent for pre-processing, solving the modeland post-processing, as well as the equation solver computational rate andeffective I/O rate. However, the following findings relate exclusively to ourgeomechanical FE-models and not to “common” FE-models in structuralmechanics.
Concerning the way of parallelization, only symmetric multiprocessing(SMP) resulted in acceptable solution times for our models. This is mostprobably due to the relatively high amount of non-linear contacts, whichincrease the required communication between the individual tasks. Table 2summarizes and compares the maximum and average equation solver ef-fective I/O and computational rates from jobs calculated with SMP paral-lelization on different systems.
8
The results of the submodel match with those of the large reservoir model, due to the exact same buildup and material parameters, and are now compared to actual stress measurements in the stage of calibration. Furthermore, the numerous calculations of the three models on various hardware configurations and settings yielded insights into solver performance and those factors influencing the solution time the most. Specific statistics are provided by Ansys® for every calculated batch job. These include, for instance, the time spent for pre-processing, solving the model and post-processing, as well as the equation solver computational rate and effective I/O rate. However, the following findings relate exclusively to our geomechanical FE-models and not to “common” FE-models in structural mechanics. Concerning the way of parallelization, only symmetric multiprocessing (SMP) resulted in acceptable solution times for our models. This is most probably due to the relatively high amount of non-linear contacts, which increase the required communication between the individual tasks. Table 2 summarizes and compares the maximum and average equation solver effective I/O and computational rates from jobs calculated with SMP parallelization on different systems.
HP ProLiant DL785 G5
(in-core / 32 cores)
Dell PowerEdge M610x
(out-of-core / 12 cores)
Nvidia Tesla S1070
(out-of-core / 8 cores)
Maximum equation solver effective I/O rate
1873.7 MB/s 534.0 MB/s 79.7 MB/s
Average equation solver effective I/O rate
1703.7 MB/s 317.8 MB/s 57.8 MB/s
Maximum equation solver computational rate
20.858 Gflops 49.299 Gflops 33.597 Gflops
Average equation solver computational rate
19.714 Gflops 44.744 Gflops 24.074 Gflops
Table 2 Overview on the equation solver effective I/O rates and computational rates listed by Ansys®. All jobs considered in this table were calculated using SMP parallelization and always with the number of cores listed on top.
As expected, the in-core memory mode yields by far the fastest I/O rates, whereas the jobs calculated out-of-core show a strong dependence of this rate to the
Table 2: Overview on the equation solver effective I/O rates and computationalrates listed by Ansys R©. All jobs considered in this table were calculated usingSMP parallelization and always with the number of cores listed on top.
Geomechanical Reservoir Modeling 49
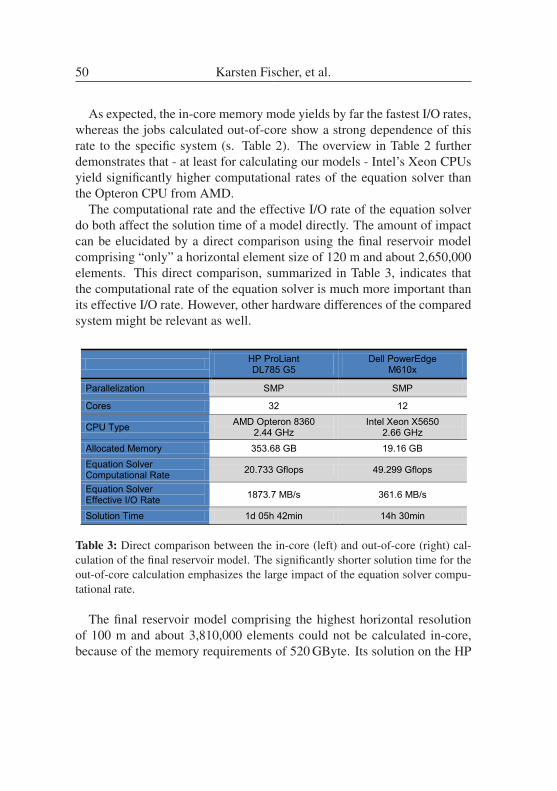
As expected, the in-core memory mode yields by far the fastest I/O rates,whereas the jobs calculated out-of-core show a strong dependence of thisrate to the specific system (s. Table 2). The overview in Table 2 furtherdemonstrates that - at least for calculating our models - Intel’s Xeon CPUsyield significantly higher computational rates of the equation solver thanthe Opteron CPU from AMD.
The computational rate and the effective I/O rate of the equation solverdo both affect the solution time of a model directly. The amount of impactcan be elucidated by a direct comparison using the final reservoir modelcomprising “only” a horizontal element size of 120 m and about 2,650,000elements. This direct comparison, summarized in Table 3, indicates thatthe computational rate of the equation solver is much more important thanits effective I/O rate. However, other hardware differences of the comparedsystem might be relevant as well.
9
specific system (s. Table 2). The overview in Table 2 further demonstrates that - at least for calculating our models - Intel’s Xeon CPUs yield significantly higher computational rates of the equation solver than the Opteron CPU from AMD.
The computational rate and the effective I/O rate of the equation solver do both affect directly the solution time of a model. The amount of impact can be elucidated by a direct comparison using the final reservoir model comprising “only” a horizontal element size of 120 m and about 2’650’000 elements. This direct comparison, summarized in Table 3, indicates that the computational rate of the equation solver is much more important than its effective I/O rate. However, other hardware differences of the compared system might be relevant as well.
HP ProLiant DL785 G5
Dell PowerEdge M610x
Parallelization SMP SMP
Cores 32 12
CPU Type AMD Opteron 8360 2.44 GHz
Intel Xeon X5650 2.66 GHz
Allocated Memory 353.68 GB 19.16 GB Equation Solver Computational Rate 20.733 Gflops 49.299 Gflops
Equation Solver Effective I/O Rate 1873.7 MB/s 361.6 MB/s
Solution Time 1d 05h 42min 14h 30min
Table 3 Direct comparison between the in-core (left) and out-of-core (right) calculation of the final reservoir model. The significantly shorter solution time for the out-of-core calculation emphasizes the large impact of the equation solver computational rate.
The final reservoir model comprising the highest horizontal resolution of 100 m and about 3’810’000 elements could not be calculated in-core, because of the memory requirements of 520 GB. Its solution on the HP ProLiant DL785 G5 using SMP parallelization with 32 cores took 2 days, 18 hours and 5 minutes (out-of-core memory mode). A direct comparison concerning the GPU acceleration was done using the small submodel. Exactly same model was solved on the Nvidia Tesla S1070 with and without the contribution of the GPU units, which resulted in calculation times of 152 minutes and 191 minutes, respectively.
Table 3: Direct comparison between the in-core (left) and out-of-core (right) cal-culation of the final reservoir model. The significantly shorter solution time for theout-of-core calculation emphasizes the large impact of the equation solver compu-tational rate.
The final reservoir model comprising the highest horizontal resolutionof 100 m and about 3,810,000 elements could not be calculated in-core,because of the memory requirements of 520 GByte. Its solution on the HP
50 Karsten Fischer, et al.
ProLiant DL785 G5 using SMP parallelization with 32 cores took 2 days,18 hours and 5 minutes (out-of-core memory mode).
A direct comparison concerning the GPU acceleration was done usingthe small submodel. The exact same model was solved on the Nvidia TeslaS1070 with and without the contribution of the GPU units, which resultedin calculation times of 152 minutes and 191 minutes, respectively.
The GPU acceleration thus only saves about 20% of solution time. Thereasons for this rather small acceleration, however, are manifold and requirefurther investigations.
5 Outlook
The following stage in the DGMK Research Project 721 covers the calibra-tion of the final geomechanical reservoir model. This will include multiplecalculations, which will be done again on the bwGRiD cluster in Freiburg.In addition, future research projects addressing geomechanical modelingwill benefit from the experiences gained on the bwGRiD as HPC solution.
References
[Fjaer2008] E. Fjaer, R. M. Holt, and P. Horsrud. Petroleum Related Rockmechanics. Elsevier Science and Technology, 2008.
[Roeckel2003] T. Röckel and C. Lempp. The state of stress in the northgerman basin; der spannungszustand im norddeutschen becken.Erdöl Erdgas Kohle, 119:73–79, 2003.
[Yale2003] D.P. Yale. Fault and stress magnitude controls on variationsin the orientation of in situ stress. Geological Society, London,Special Publications, 209(1):55–64, January 2003.
[Zoback2007] M.D. Zoback. Reservoir Geomechanics: Earth Stress andRock Mechanics Applied to Exploration, Production and Well-bore Stability. Cambridge Press, 2007.
Geomechanical Reservoir Modeling 51

AcknowledgementsThis work is part of DGMK Project 721 “Prediction of tectonic stresses andfracture networks with geomechanical reservoir models” funded by Exxon-Mobil Production Deutschland GmbH, Gaz de France Suez E&P Deutsch-land GmbH and RWE Dea AG. Their support is gratefully acknowledged.
52 Karsten Fischer, et al.
Scalability Study of HiFlow3 based on a FluidFlow Channel Benchmark
Vincent Heuveline∗, Eva Ketelaer†, Staffan Ronnas‡,Mareike Schmidtobreick§, Martin Wlotzka¶
Engineering Mathematics and Computing Lab (EMCL)Karlsruhe Institute of Technology (KIT)
Abstract: Exploiting the compute power of high performance com-puting clusters efficiently is a key ingredient in order to solve large,fully coupled systems modeled by partial differential equations withhigh accuracy. We study strong and weak scalability properties ofthe parallel Finite Element software package HiFlow3 for a challeng-ing instationary 3D fluid flow problem. For this benchmark study,we ran several simulations with up to 10 millions of unknowns us-ing up to 512 cores on the bwGRiD cluster in Karlsruhe. For largeproblem sizes, the software package showed good characteristics re-garding efficiency and speedup.
1 Introduction
Numerical simulations often play a key role in the analysis of complexphysical and technical processes. Many real world phenomena canbe modeled mathematically by partial differential equations (PDEs).Examples include the numerical simulation of tropical cyclones whichinfluence the global weather forecast, as well as computational stud-ies of the human respiratory system. Performing accurate simulations∗ [email protected]† [email protected]‡ [email protected]§ [email protected]¶ [email protected]
often relies on computational resources only available on high perfor-mance computing (HPC) platforms. Approximate solutions of theunderlying system of PDEs can be computed using appropriate nu-merical discretization methods. A common discretization approachis the Finite Element Method (FEM), which usually results in large,sparse, and fully coupled linear systems with up to several millionsof unknowns. In order to be able to solve such large problems, it isessential to use highly scalable finite element software.In this paper we analyze weak and strong scalability properties ofthe HiFlow3 Finite Element package [Heuveline2010] developed atthe Engineering Mathematics and Computing Lab (EMCL). Thissoftware platform aims at providing efficient and accurate solvers forcomplex models. The study is based on a 3D channel flow benchmarkproblem defined by the DFG [Turek1996]. It is defined as a fluid flowproblem inside a rectangular channel containing a block-shaped ob-stacle. This benchmark has previously been performed by a largecommunity using a variety of discretization methods and numericalsolvers with a strong emphasis on the accuracy of the solution. Onthe one hand the benchmark is a challenging problem for numericalsimulations, and on the other hand there are published results givinga point of comparison for the quality of our solutions. Our study wascarried out on the bwGRiD cluster located in Karlsruhe using up to512 cores distributed over 64 nodes.In Section 2, the mathematical problem, the solution method andimplementation are described. Additionally, in this section the setupfor the scalability study is presented. Section 3 is dedicated to thepresentation of the results, as well as their analysis. A conclusionand outlook are given in Section 4.
2 Benchmark Formulation
In this section, we present the mathematical setup on which our scal-ability study is based and depict how we validated the benchmarkimplementation. The second part of the section gives an overview ofthe test setup.
54 Vincent Heuveline, et al.
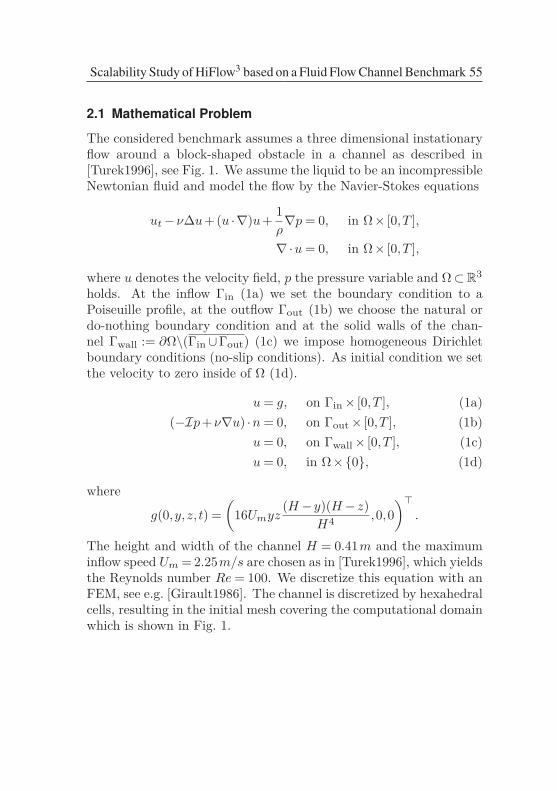
2.1 Mathematical Problem
The considered benchmark assumes a three dimensional instationaryflow around a block-shaped obstacle in a channel as described in[Turek1996], see Fig. 1. We assume the liquid to be an incompressibleNewtonian fluid and model the flow by the Navier-Stokes equations
ut−ν∆u+ (u ·∇)u+ 1ρ∇p= 0, in Ω× [0,T ],
∇·u= 0, in Ω× [0,T ],
where u denotes the velocity field, p the pressure variable and Ω⊂R3
holds. At the inflow Γin (1a) we set the boundary condition to aPoiseuille profile, at the outflow Γout (1b) we choose the natural ordo-nothing boundary condition and at the solid walls of the chan-nel Γwall := ∂Ω\(Γin∪Γout) (1c) we impose homogeneous Dirichletboundary conditions (no-slip conditions). As initial condition we setthe velocity to zero inside of Ω (1d).
u= g, on Γin× [0,T ], (1a)(−Ip+ν∇u) ·n= 0, on Γout× [0,T ], (1b)
u= 0, on Γwall× [0,T ], (1c)u= 0, in Ω×0, (1d)
where
g(0,y,z, t) =(
16Umyz(H−y)(H−z)
H4 ,0,0)>
.
The height and width of the channel H = 0.41m and the maximuminflow speed Um = 2.25m/s are chosen as in [Turek1996], which yieldsthe Reynolds number Re= 100. We discretize this equation with anFEM, see e.g. [Girault1986]. The channel is discretized by hexahedralcells, resulting in the initial mesh covering the computational domainwhich is shown in Fig. 1.
Scalability Study of HiFlow3 based on a Fluid Flow Channel Benchmark 55
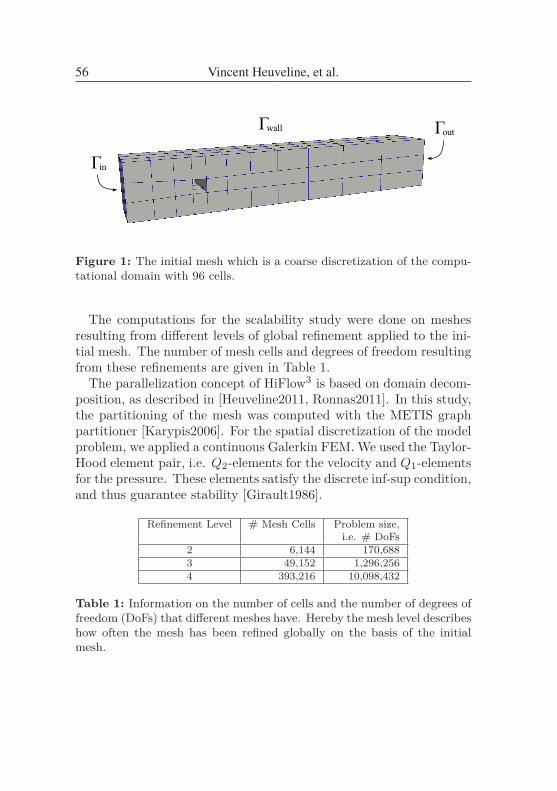
Figure 1: The initial mesh which is a coarse discretization of the compu-tational domain with 96 cells.
The computations for the scalability study were done on meshesresulting from different levels of global refinement applied to the ini-tial mesh. The number of mesh cells and degrees of freedom resultingfrom these refinements are given in Table 1.The parallelization concept of HiFlow3 is based on domain decom-
position, as described in [Heuveline2011, Ronnas2011]. In this study,the partitioning of the mesh was computed with the METIS graphpartitioner [Karypis2006]. For the spatial discretization of the modelproblem, we applied a continuous Galerkin FEM. We used the Taylor-Hood element pair, i.e. Q2-elements for the velocity and Q1-elementsfor the pressure. These elements satisfy the discrete inf-sup condition,and thus guarantee stability [Girault1986].
Refinement Level # Mesh Cells Problem size,i.e. # DoFs
2 6,144 170,6883 49,152 1,296,2564 393,216 10,098,432
Table 1: Information on the number of cells and the number of degrees offreedom (DoFs) that different meshes have. Hereby the mesh level describeshow often the mesh has been refined globally on the basis of the initialmesh.
56 Vincent Heuveline, et al.
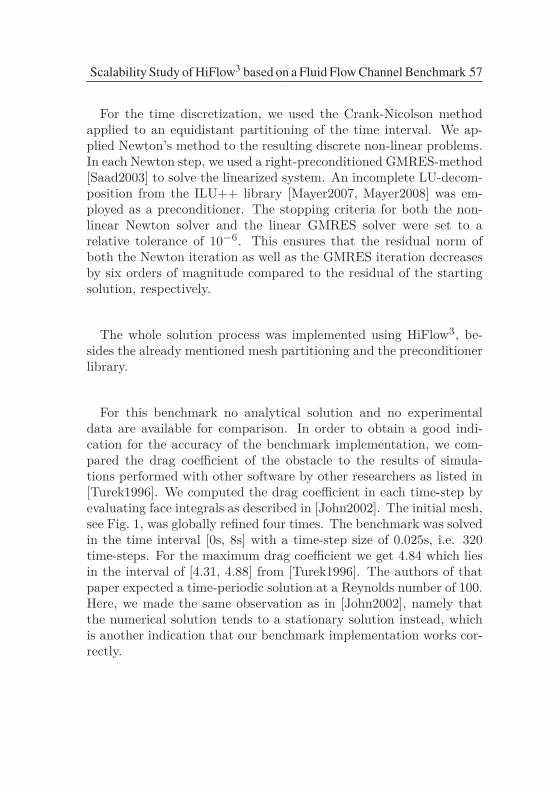
For the time discretization, we used the Crank-Nicolson methodapplied to an equidistant partitioning of the time interval. We ap-plied Newton’s method to the resulting discrete non-linear problems.In each Newton step, we used a right-preconditioned GMRES-method[Saad2003] to solve the linearized system. An incomplete LU-decom-position from the ILU++ library [Mayer2007, Mayer2008] was em-ployed as a preconditioner. The stopping criteria for both the non-linear Newton solver and the linear GMRES solver were set to arelative tolerance of 10−6. This ensures that the residual norm ofboth the Newton iteration as well as the GMRES iteration decreasesby six orders of magnitude compared to the residual of the startingsolution, respectively.
The whole solution process was implemented using HiFlow3, be-sides the already mentioned mesh partitioning and the preconditionerlibrary.
For this benchmark no analytical solution and no experimentaldata are available for comparison. In order to obtain a good indi-cation for the accuracy of the benchmark implementation, we com-pared the drag coefficient of the obstacle to the results of simula-tions performed with other software by other researchers as listed in[Turek1996]. We computed the drag coefficient in each time-step byevaluating face integrals as described in [John2002]. The initial mesh,see Fig. 1, was globally refined four times. The benchmark was solvedin the time interval [0s, 8s] with a time-step size of 0.025s, i.e. 320time-steps. For the maximum drag coefficient we get 4.84 which liesin the interval of [4.31, 4.88] from [Turek1996]. The authors of thatpaper expected a time-periodic solution at a Reynolds number of 100.Here, we made the same observation as in [John2002], namely thatthe numerical solution tends to a stationary solution instead, whichis another indication that our benchmark implementation works cor-rectly.
Scalability Study of HiFlow3 based on a Fluid Flow Channel Benchmark 57
2.2 Setup of Scalability Tests
We study strong and weak scalability for the following benchmarksetup. As benchmark metric, we measure the total run-time of thefirst ten time-steps of the solution process. The problem size is asso-ciated to the successively globally refined meshes mentioned in Sub-section 2.1. The refinement levels of the mesh and their resultingproblem sizes, i.e. the number of unknowns are listed in Table 1.This benchmark was done on the local part of the bwGRiD-cluster
in Karlsruhe. This system is a x86-cluster featuring 10 Blade centerseach of which contains 14 HS21 XM Blades. Each node has two quad-core Intel Xeon E5440 (Harpertown) processors with 2.83 GHz clockfrequency and 16GByte main memory. The nodes are connected viaInfiniband. The operating system is Scientific Linux 5.5.We executed the simulation with up to 512 cores; for more details
see Table 2. Furthermore we took into account the following twolimiting factors with respect to the dependency between the refine-ment levels and the number of cores. On the one hand the memoryavailable on a computing node is important: a minimum number ofnodes is needed to cover the memory required by the solver. On theother hand, problem instances with lower refinement levels requireless computational effort, which makes the use of a large number ofcores meaningless.
3 Results and AnalysisWe consider strong and weak scaling, which are the two commonconcepts of scalability in HPC. In both cases, the total run-time ondifferent numbers of processors is compared. For the strong scaling,the total problem size is fixed, while for the weak scaling the problemsize per process is kept constant.
3.1 Strong Scalability
For the strong scalability, we analyzed the speedup and efficiency foreach refinement level. The speedup S(p,N) of a parallel execution
58 Vincent Heuveline, et al.
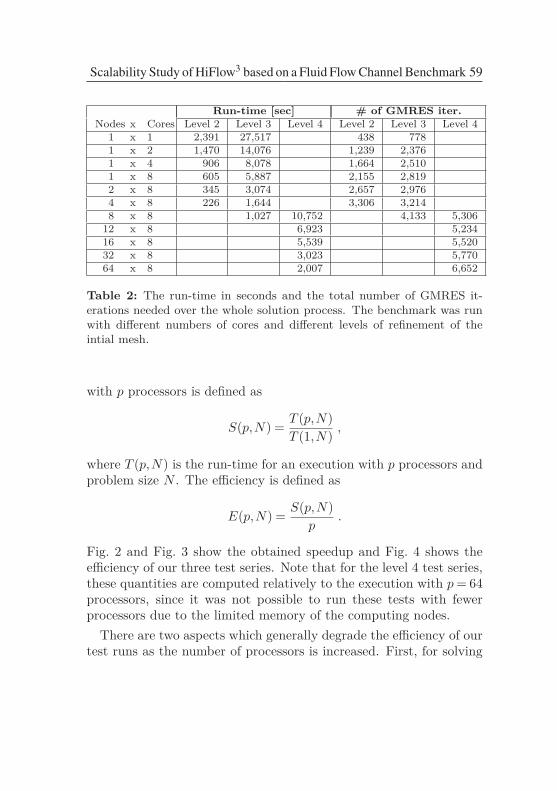
Run-time [sec] # of GMRES iter.Nodes x Cores Level 2 Level 3 Level 4 Level 2 Level 3 Level 4
1 x 1 2,391 27,517 438 7781 x 2 1,470 14,076 1,239 2,3761 x 4 906 8,078 1,664 2,5101 x 8 605 5,887 2,155 2,8192 x 8 345 3,074 2,657 2,9764 x 8 226 1,644 3,306 3,2148 x 8 1,027 10,752 4,133 5,30612 x 8 6,923 5,23416 x 8 5,539 5,52032 x 8 3,023 5,77064 x 8 2,007 6,652
Table 2: The run-time in seconds and the total number of GMRES it-erations needed over the whole solution process. The benchmark was runwith different numbers of cores and different levels of refinement of theintial mesh.
with p processors is defined as
S(p,N) = T (p,N)T (1,N) ,
where T (p,N) is the run-time for an execution with p processors andproblem size N . The efficiency is defined as
E(p,N) = S(p,N)p
.
Fig. 2 and Fig. 3 show the obtained speedup and Fig. 4 shows theefficiency of our three test series. Note that for the level 4 test series,these quantities are computed relatively to the execution with p= 64processors, since it was not possible to run these tests with fewerprocessors due to the limited memory of the computing nodes.There are two aspects which generally degrade the efficiency of our
test runs as the number of processors is increased. First, for solving
Scalability Study of HiFlow3 based on a Fluid Flow Channel Benchmark 59
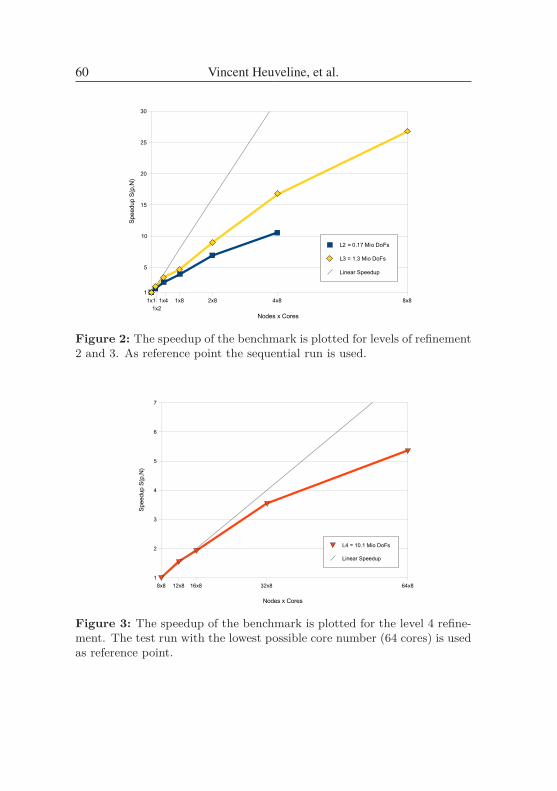
Figure 2: The speedup of the benchmark is plotted for levels of refinement2 and 3. As reference point the sequential run is used.
Figure 3: The speedup of the benchmark is plotted for the level 4 refine-ment. The test run with the lowest possible core number (64 cores) is usedas reference point.
60 Vincent Heuveline, et al.
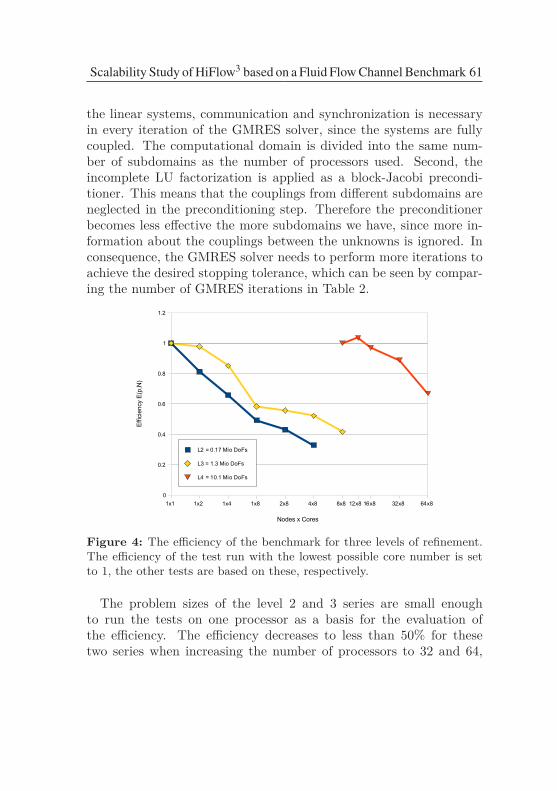
the linear systems, communication and synchronization is necessaryin every iteration of the GMRES solver, since the systems are fullycoupled. The computational domain is divided into the same num-ber of subdomains as the number of processors used. Second, theincomplete LU factorization is applied as a block-Jacobi precondi-tioner. This means that the couplings from different subdomains areneglected in the preconditioning step. Therefore the preconditionerbecomes less effective the more subdomains we have, since more in-formation about the couplings between the unknowns is ignored. Inconsequence, the GMRES solver needs to perform more iterations toachieve the desired stopping tolerance, which can be seen by compar-ing the number of GMRES iterations in Table 2.
Figure 4: The efficiency of the benchmark for three levels of refinement.The efficiency of the test run with the lowest possible core number is setto 1, the other tests are based on these, respectively.
The problem sizes of the level 2 and 3 series are small enoughto run the tests on one processor as a basis for the evaluation ofthe efficiency. The efficiency decreases to less than 50% for thesetwo series when increasing the number of processors to 32 and 64,
Scalability Study of HiFlow3 based on a Fluid Flow Channel Benchmark 61
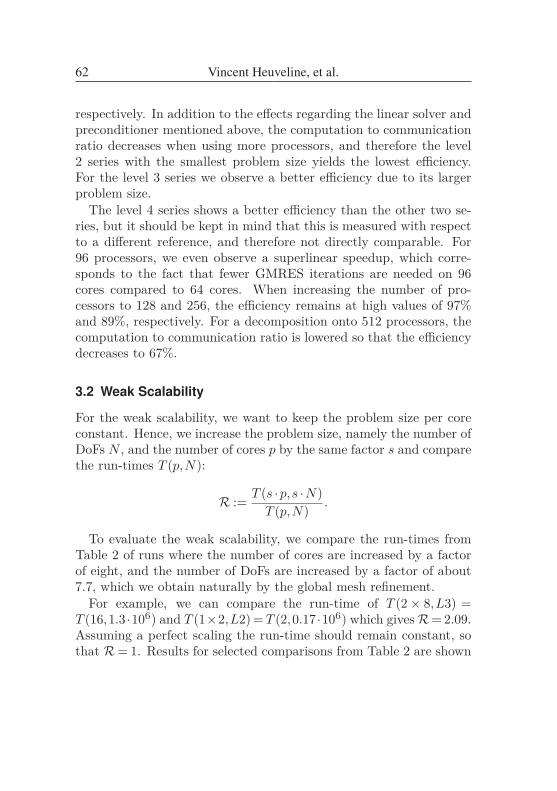
respectively. In addition to the effects regarding the linear solver andpreconditioner mentioned above, the computation to communicationratio decreases when using more processors, and therefore the level2 series with the smallest problem size yields the lowest efficiency.For the level 3 series we observe a better efficiency due to its largerproblem size.The level 4 series shows a better efficiency than the other two se-
ries, but it should be kept in mind that this is measured with respectto a different reference, and therefore not directly comparable. For96 processors, we even observe a superlinear speedup, which corre-sponds to the fact that fewer GMRES iterations are needed on 96cores compared to 64 cores. When increasing the number of pro-cessors to 128 and 256, the efficiency remains at high values of 97%and 89%, respectively. For a decomposition onto 512 processors, thecomputation to communication ratio is lowered so that the efficiencydecreases to 67%.
3.2 Weak Scalability
For the weak scalability, we want to keep the problem size per coreconstant. Hence, we increase the problem size, namely the number ofDoFs N , and the number of cores p by the same factor s and comparethe run-times T (p,N):
R := T (s ·p,s ·N)T (p,N) .
To evaluate the weak scalability, we compare the run-times fromTable 2 of runs where the number of cores are increased by a factorof eight, and the number of DoFs are increased by a factor of about7.7, which we obtain naturally by the global mesh refinement.For example, we can compare the run-time of T (2× 8,L3) =
T (16,1.3 ·106) and T (1×2,L2) = T (2,0.17 ·106) which givesR= 2.09.Assuming a perfect scaling the run-time should remain constant, sothat R= 1. Results for selected comparisons from Table 2 are shown
62 Vincent Heuveline, et al.
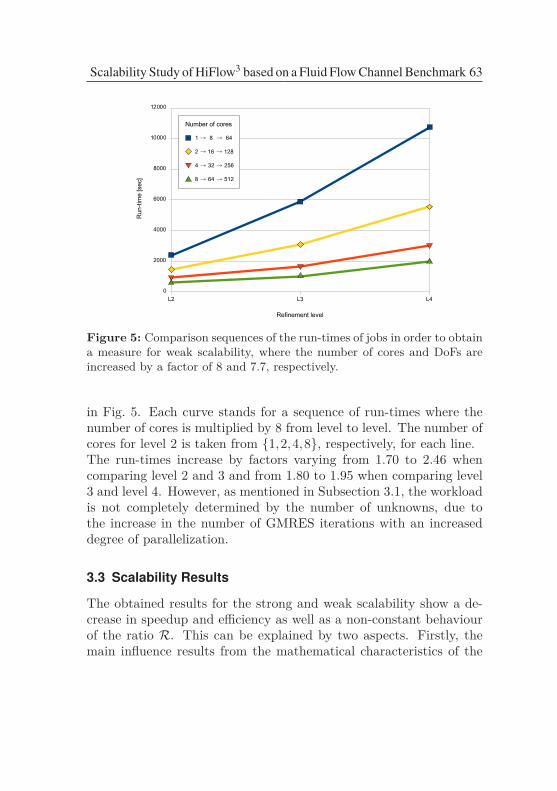
Figure 5: Comparison sequences of the run-times of jobs in order to obtaina measure for weak scalability, where the number of cores and DoFs areincreased by a factor of 8 and 7.7, respectively.
in Fig. 5. Each curve stands for a sequence of run-times where thenumber of cores is multiplied by 8 from level to level. The number ofcores for level 2 is taken from 1,2,4,8, respectively, for each line.The run-times increase by factors varying from 1.70 to 2.46 whencomparing level 2 and 3 and from 1.80 to 1.95 when comparing level3 and level 4. However, as mentioned in Subsection 3.1, the workloadis not completely determined by the number of unknowns, due tothe increase in the number of GMRES iterations with an increaseddegree of parallelization.
3.3 Scalability Results
The obtained results for the strong and weak scalability show a de-crease in speedup and efficiency as well as a non-constant behaviourof the ratio R. This can be explained by two aspects. Firstly, themain influence results from the mathematical characteristics of the
Scalability Study of HiFlow3 based on a Fluid Flow Channel Benchmark 63
block-Jacobi preconditioner as described in Subsection 3.1. Secondly,one cannot expect much better efficiency with a large number of pro-cessors for the small problem sizes of the level 2 and 3 test series.Due to memory limitations of the cluster, it was not possible to runthe tests with a refinement level higher than level 4, i.e. number ofDoFs N = 10,098,432.
4 Conclusion
In this paper we presented the mathematical setup of the scalabilitybenchmark implemented with the HiFlow3 Finite Element package.We executed different tests with varying numbers of cores and dif-ferent problem sizes. Based on the run-times, the weak and strongscalability were analyzed. Our conclusion is that both the weak andthe strong scalability are highly satisfactory and correspond to theexpected behaviour of a mature parallel FEM software package. Itturns out that the behaviour of the block-Jacobi preconditioner has astrong impact on the decrease of the scalability. Improvements withrespect to more efficient preconditioning techniques are planned andwill be included in a new release of HiFlow3. An extension of thisbenchmark on larger machines considering larger problems will bethe subject of further research.
References
[Girault1986] V. Girault and P.-A. Raviart. Finite element meth-ods for Navier-Stokes equations : theory and algorithms.Springer series in computational mathematics. Springer,Berlin, 1986.
[Heuveline2010] H. Anzt, W. Augustin, M. Baumann, H. Bockel-mann, T. Gengenbach, T. Hahn, V. Heuveline, E. Kete-laer, D. Lukarski, A. Otzen, S. Ritterbusch, B. Rocker,S. Ronnas, M. Schick, C. Subramanian, J.-P. Weiss, andF. Wilhelm. Hiflow3 – a flexible and hardware-aware par-
64 Vincent Heuveline, et al.
allel finite element package. EMCL Preprint Series, 2010.06:1-36.
[Heuveline2011] H. Anzt, W. Augustin, M. Baumann, T. Gengen-bach, T. Hahn, A. Helfrich-Schkarbanenko, V. Heuve-line, E. Ketelaer, D. Lukarski, A. Nestler, S. Ritterbusch,S. Ronnås, M. Schick, M. Schmidtobreick, C. Subrama-nian, J.-P. Weiss, F. Wilhelm, and M. Wlotzka. Hiflow3 -a hardware-aware parallel finite element package. In 5thParallel Tools Workshop. Springer, accepted.
[John2002] V. John. Higher order finite element methods and multi-grid solvers in a benchmark problem for the 3d navier-stokes equations. International Journal for NumericalMethods in Fluids, 40(6):775–798, 2002.
[Karypis2006] A. Abou-Rjeili and G. Karypis. Multilevel algorithmsfor partitioning power-law graphs. In 20th InternationalParallel and Distributed Processing Symposium, 2006.IPDPS 2006.
[Mayer2007] J. Mayer. A multilevel crout ilu preconditioner withpivoting and row permutation. Numerical Linear Algebrawith Applications, 14(10):771–789, 2007.
[Mayer2008] J. Mayer. Symmetric permutations for i-matrices to de-lay and avoid small pivots during factorization. SIAM J.Sci. Comput., 30(2):982–996, March 2008.
[Ronnas2011] S. Ronnås, T. Gengenbach, E. Ketelaer, and V. Heuve-line. Design and implementation of distributed meshes inhiflow3. In C. Bischof, H.-G. Hegering, W. E. Nagel, andG. Wittum, editors, Competence in High PerformanceComputing 2010, pages 61–71. Springer Berlin Heidel-berg, 2012.
Scalability Study of HiFlow3 based on a Fluid Flow Channel Benchmark 65
[Saad2003] Y. Saad. Iterative methods for sparse linear systems.SIAM, Society for Industrial and Applied Mathematics,Philadelphia, 2nd edition, 2003.
[Turek1996] S. Turek and M. Schäfer. Benchmark computations oflaminar flow around cylinder. In E.H. Hirschel, editor,Flow Simulation with High–Performance Computers II,volume 52 of Notes on Numerical Fluid Mechanics, pages547–566. Vieweg, 1996. co. F. Durst, E. Krause, R. Ran-nacher.
AcknowledgmentsWe thank Mehmet Soysal for his constant technical support as ad-ministrator of the bwGRiD cluster in Karlsruhe. Further the authorsthank Prof. Dr. Rudolf Lohner and Dr. Marcel Kunze for their kindsupport in the preparation of this paper.
66 Vincent Heuveline, et al.
CART Trees and Random Forests in Linguistics
Ulrike Schneider∗
Albert-Ludwigs-Universität Freiburg
Abstract: This paper investigates in how far usage-based factors, observablein bigram frequencies, transitional probabilities and other measures of associ-ation, influence the placement of hesitations in English. I focus on the place-ment of filled and unfilled pauses as well as discourse markers in the contextof prepositional phrases. The approach taken here makes use of classificationand regression trees (CART) and random forests implemented in R. Resultsindicate that there are frequency effects in the data: more coherent structuresare less likely to be interrupted than infrequent sequences with low internalattractions.
This paper is a loose summary of the more detailed argument presented in[SchneiderInPreparation].
1 Introduction
A central question in cognitive linguistics is how utterances are planned.Do we go ahead word by word filling a grammatical frame? In the case of aphrase like in the blue box, it is well imaginable that a speaker retrieves allwords separately from the mental lexicon and puts them in sequence as heplans the phrase. If the speaker were, however, planning a phrase like in theUnited States, which is structurally very similar to the first, he could still beexpected to go about differently. While he has separate entries in the lex-icon for united and states, there are reasons to expect that he additionallyhas a combined entry for United States, which he can insert into his phraseas a block or ‘chunk’. While United States is a comparatively frequentexpression, sequences may not even need to be frequent to be ‘chunked’.
The speaker may rarely talk about something which happened in the oldendays, yet olden days is likely to be chunked, because, nowadays, the archaicword olden can only be combined with days. Finally, some expressions areexpected to be chunked, because their semantics are non-compositional,which means that, as in the case of on the other hand, the meaning of thewhole expression cannot be deduced from the meaning of the individualwords in it. So, while linguists working in a usage-based framework gener-ally agree that “a large amount of language is not constructed from ‘basic’structures and a lexicon, but occurs in sequences [...] that are more or lessfixed in form” ([Hunston2000, p. 7]), there is yet no consensus about theconditions necessary for a sequence to get chunked. Neither is there agree-ment on the common size or nature of chunks (cf. for example [Biber2004],[Bybee2007], [Ellis2003], [Wray2002]).
One way to determine the conditions which facilitate chunking is tolook at hesitations in spoken language (cf. [Biber2004], [Erman2007],[Kapatsinski2005], [Fox2010], [Shriberg1996]). It is highly unlikely fora speaker to interrupt longer words to hesitate. Utterances such as *dooruh knob or *neighbour uh hood are highly unlikely, because the speaker re-trieves the entire word as one unit from the mental lexicon. Consequently, ifchunks are also retrieved ‘pre-assembled’ from the lexicon, neither shouldthey be interrupted by hesitations.
However, the model, as described up to this point, is somewhat over-simplistic, as it is unlikely that there is a strict division between words andchunks. Rather, we are dealing with a cline: activating one word in thelexicon always leads to the activation of others which hold some relation tothe initially activated one. The stronger the mutual activation between a pairor sequence of words, the easier for a speaker to retrieve it in combinationand the less likely the sequence is to be interrupted by hesitations.
The present paper analyses phrases in spoken language where the speakerneeds to hesitate. The analysis is based on the assumption that languageplanning is always slightly ahead of actually uttering the planned words, sothat speakers are subconsciously aware of upcoming planning trouble be-fore they have reached the ‘trouble spot’ in their utterance. Consequently,within a limited range of words, the speaker has a choice of where to halt
68 Ulrike Schneider
for a moment to plan the next part of the utterance. I hypothesise thatfrequency-based factors determine where the speaker pauses. Hence I in-vestigate the role co-occurrence frequencies and other probabilistic factorsplay in chunking. The present publication focusses on the computationalaspects of the study (for a more in-depth analysis see[SchneiderInPreparation]).
2 DesignIn the present study, chunking strength is measured at the bigram level;bigram being defined as two consecutive words which do not cross sentenceboundaries. A word, in turn, is defined as any word-form with an attachedpart-of-speech tag, separated by spaces from other word-forms. Hence, ina structure like the following
it_PRP ‘s_BES crazy_JJ. i_PRP do_VBP n’t_RB believe_ VB it_PRP.
it ’s, do n’t and believe it would be considered bigrams while crazyi would not. All bigrams are drawn from the Switchboard NXT corpus([NXTSwitchboardCorpus2008]), a collection of American telephone con-versations between strangers, collected by Texas Instruments in 1990/91. Iam not working with the actual recordings, but with an annotated transcrip-tion of the corpus, which contains a total of 830,000 words. It is further-more time-aligned, making it possible extract unfilled pauses.
The following frequency-based and probabilistic measures of associationserve as predictors of hesitation placement:
w.freq - Word frequency: How often the word occurs in the corpus.
bi.freq - Bigram frequency: How often the bigram occurs in the cor-pus.
TPD - Direct transitional probability: The probability of the secondword given the first; unidirectional (cf. [Kapatsinski2005, p. 6/7]).
TPB - Backwards transitional probability: The probability of the firstword given the second, unidirectional (cf. [Kapatsinski2005, p. 6/7]).
CART Trees and Random Forests in Linguistics 69
MI - Mutual Information score: Assesses how much more often thetwo words in the bigram occur together than would be expected bychance; bidirectional ([Wiechmann2008, p. 264/5]).
G - Lexical gravity G: Bidirectional measure similar to MI, thoughadditionally taking into account the restrictions grammar imposes onthe distributions of words in language ([Daudaravicius2004];[Gries2010]).
In summary, hesitation placement will be predicted by comparing fre-quencies and probabilistic properties of the bigrams in close proximity ofthe hesitation. This is, however, only possible if hesitations in comparablecontexts are selected. For the present study, contexts were therefore limitedto prepositional phrases with the structure ‘Preposition Determiner Noun’.This includes phrases such as during the dinner or in that regard. All 1,440hesitations occurring within or immediately preceding these prepositionalphrases were extracted from the corpus. The context considered for analy-sis consists of the three words in the phrase (w1 to w3), the two bigrams inthe phrase (bi1 and bi2; e.g. during the and the dinner) as well as the wordpreceding the phrase (w0) and the bigram containing w0 and w1 (bi0). Thisleaves three ‘slots’ for the speaker to place a hesitation: before the first wordin the phrase (position1), before the second word (position2) and before thethird (position3). As this represents a non-binary research question, bino-mial regression was not an option. Hence CART trees and random forestswere chosen as methods of regression. The following sections will dis-cuss their computation as well as their advantages and disadvantages whenapplied in linguistics.
3 Study I: CART TreesClassification and regression trees (CART), which are also known as “con-ditional inference trees” (cf. [Hothorn2006]), are a non-parametric ap-proach to regression ([Strobl2009, p. 5/6]). This data-driven method hasa number of advantages: It can handle multinomial outcomes, complexinteractions, unbalanced designs as well as collinear predictors and largenumbers of predictors ([TagliamonteToAppear, p. 22,30]).
70 Ulrike Schneider
The algorithm ‘grows’ trees through recursive binary partitioning of thedata, with the aim to create ever purer ‘branches’, i.e. subgroups of the data.At every splitting point, the algorithm selects the predictor best suited to re-duce impurity and the optimal splitting point for this predictor([Baayen2008, p. 149]; [Strobl2009, p. 8]). All branches end in termi-nal ‘leaf’ nodes which jointly make up the entire data-set ([Baayen2008,p. 149]). The more complex the model, the more splits and consequentlyterminal leaves are in the tree ([Hothorn2006, p. 13]). The final sequenceof splits reflects non-linear and non-monotone associations ([Strobl2009,p. 6]) as well as interactions ([Baayen2008, p. 154]; [Strobl2009, p. 11]).
In this paper, the CART mechanism applied is the ctree package forR ([Hothorn2006]). Unlike previous algorithms, ctree is claimed neitherto overfit ([Strobl2009, p. 10]) nor to favour predictors with many possiblesplits ([TagliamonteToAppear, p. 21]; [Strobl2009, p. 30]).
Figure 1 shows the resulting tree. Nodes are numbered from one through17. At each split, the selected predictor is given and branches are labelledfor whether they contain predictor values above or below the splitting point.The diagrams at the bottom represent terminal leaves. In each leaf, themost frequent outcome (hesitation in position1, 2 or 3) shows the model’sprediction for the entire leaf. Out of a total of n=1,440 data points, thistree predicts 924 correctly, which corresponds to a misclassification rate of35.83 per cent.
CART Trees and Random Forests in Linguistics 71
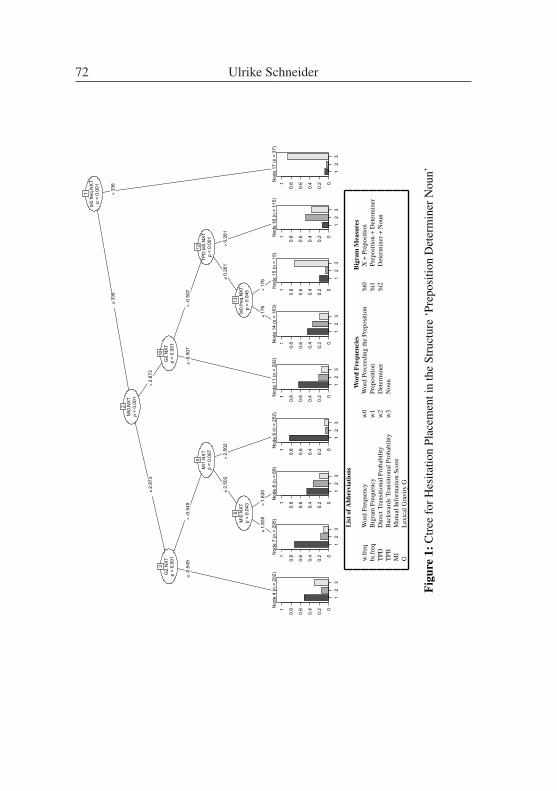
bi0.freq.NXT
p <
0.00
1
1
≤336
>336
MI0.NXT
p <
0.00
1
2
≤2.873
>2.873
G2.NXT
p <
0.00
1
3
≤-0.549
>-0.549
Nod
e 4
(n =
202
)
12
30
0.2
0.4
0.6
0.81
MI1.NXT
p =
0.00
7
5
≤2.502
>2.502
MI0.NXT
p =
0.04
3
6
≤1.835
>1.835
Nod
e 7
(n =
295
)
12
30
0.2
0.4
0.6
0.81
Nod
e 8
(n =
69)
12
30
0.2
0.4
0.6
0.81
Nod
e 9
(n =
252
)
12
30
0.2
0.4
0.6
0.81
G0.NXT
p <
0.00
1
10
≤-0.507
>-0.507
Nod
e 11
(n =
292
)
12
30
0.2
0.4
0.6
0.81
TPD.bi0.NXT
p <
0.00
1
12
≤0.261
>0.261
bi0.freq.NXT
p =
0.04
5
13
≤176
>176
Nod
e 14
(n =
163
)
12
30
0.2
0.4
0.6
0.81
Nod
e 15
(n =
15)
12
30
0.2
0.4
0.6
0.81
Nod
e 16
(n =
115
)
12
30
0.2
0.4
0.6
0.81
Nod
e 17
(n =
37)
12
30
0.2
0.4
0.6
0.81
Lis
tofA
bbre
viat
ions
Wor
dFr
eque
ncie
sB
igra
mM
easu
res
w.fr
eqW
ord
Freq
uenc
yw
0W
ord
Prec
eedi
ngth
ePr
epos
ition
bi0
X+
Prep
ositi
onbi
.freq
Big
ram
Freq
uenc
yw
1Pr
epos
ition
bi1
Prep
ositi
on+
Det
erm
iner
TPD
Dir
ectT
rans
ition
alPr
obab
ility
w2
Det
erm
iner
bi2
Det
erm
iner
+N
oun
TPB
Bac
kwar
dsTr
ansi
tiona
lPro
babi
lity
w3
Nou
nM
IM
utua
lInf
orm
atio
nSc
ore
GL
exic
alG
ravi
tyG
Figu
re1:
Ctr
eefo
rHes
itatio
nPl
acem
enti
nth
eSt
ruct
ure
‘Pre
posi
tion
Det
erm
iner
Nou
n’
72 Ulrike Schneider
Ctree does not provide a correlation coefficient or the variance resolu-tion. Consequently, the performance of the model needs to be assessed incomparison to a ‘baseline model’, which predicts all data points to havethe same realisation as the most frequent outcome ([Baayen2008, p. 153]).Here, hesitations are preferentially placed before the preposition, whichcorresponds to position1. The baseline model would therefore predict po-sition1 throughout, thus classifying 847 outcomes correctly (misclassifica-tion rate: 41.18 per cent). The tree’s performance is evaluated by com-paring the number of correct and wrong classifications of the tree (847 vs.516; observed) to those of the baseline model (924 vs. 516; expected) in achi2 test of significance. The p-value of p < .0001 shows that the ctree
model preforms highly significantly above baseline. In addition, the residu-als of the chisquared test provide a more cautious assessment of the ctree’sperformance. Residuals with a value exceeding two indicate a significantdifference. In the present case, residuals are 2.65 and -3.16, indicating asignificantly improved number of correct predictions (positive value) and asignificantly lower number of misclassifications (negative value)1.
As noted before, speakers tend to place hesitations before the preposi-tion, i.e. before the phrase, indicating an influence of structural factors. Thetree, however, reveals that the tendency to place hesitations at the phraseboundary increases the lower the attraction within bigram0, that is betweenthe preposition and the word preceding it. Apart from this, strong attrac-tion between the words in bigram0 means that the preposition is easily pre-dictable given the word preceding it. This is particularly the case in node17. Finally, the tree shows that hesitation placement before the prepositioncan also be caused by strong cohesion within the phrase (for a completeanalysis, see [SchneiderInPreparation]).
The choice of predictors in the tree furthermore indicates that more com-plex measures of association do not generally outperform simpler ones.While the Mutual Information score and lexical gravity G feature the mostin the tree, bigram frequency and direct transitional probability were alsoselected.
1 I acknowledge the help of Sascha Wolfer who suggested this way to compare model perfor-mances.
CART Trees and Random Forests in Linguistics 73
A great advantage of CART trees is the resulting clustering of the data,which allows for further analyses of the linguistic properties of the struc-tures in such homogenous groups as, for example, nodes nine and 17. Onthe downside, ctree does not plan ahead; all splits are only locally op-timal ([Strobl2009, p. 17]). Furthermore, reliance on a single tree withonly locally optimal splits means that minor changes in the dataset can leadto different splits in the tree, thus leading to variation in the predictions([Strobl2009, p. 13]).
4 Study II: Random Forests
The aforementioned issues resulting from the use of a single tree can beavoided by generating a range of trees, each based on a subsample of thedata points and predictors ([TagliamonteToAppear, p. 21]; [Strobl2009,p. 15/6]). This option is offered by random forests. In the present study, theforest generating mechanism applied is the cforest command in the partypackage for R ([Hothorn2006]; [Strobl2007]; [Strobl2008]). For each datapoint, prediction weights across all trees are averaged (R Documentation[help function] for cforest party, [TagliamonteToAppear, p. 22]).
While ctree analyses can be computed on home office computers,cforest is computationally intensive. Depending on the number of treesin the forest, the number of predictors and the complexity of the model,running cforest on a home computer can be rather time-consuming, ifnot computationally infeasible. The present model with 1,440 data-pointsand 20 predictors (all numeric, except hesitation type) tends to crash in Rversion 1.42 for Mac (release 2.13.1) on a MacBookPro (2.26 GHz Intelprocessor; 4 GByte RAM) if more than 1,000 trees are grown. Due to theresources and technical support of the bwGrid, these problems could be re-solved. If run on one node in the grid (nodes=1:ppn=8), scripts were stableand ran in up to 48 hours (for 1,000 forests of different sizes, see below).
The following is a overview of the fitting and results of a cforest
analysis of the influence of frequency-based predictors on hesitation place-ment in the context of the structure ‘Preposition Determiner Noun’. Proce-dure, scripts and interpretation are based on [Strobl2009], [Shih2011] and[TagliamonteToAppear]. For more details see [SchneiderInPreparation].
74 Ulrike Schneider
For a forest, which ideally fits the data, the “number of randomly pre-selected variables” (‘mtry’; R Documentation [help function] for cforestparty) and the number of trees (‘ntree’) need to be adjusted. There is nostandard procedure for either adjustment. For mtry, “[t]he square root ofthe number of variables” ([Strobl2009, Supplement:3]) has been suggestedas a default. Consequently, in the present study, which considers 20 pre-dictors, mtry was fixed at 5. Concerning ntree, it is commonly suggestedto use as many trees as computationally feasible ([Goldstein2011, p. 20];[Genuer2008, p. 16/7]; [Shih2011, p. 3]). The ctree model above, how-ever, suggests that trees resulting from the present analysis may not be toocomplex. So, forests with several thousands of trees may not be required.To see whether ever larger forests lead to improved results, 100 forests of100, 500, 1,000, 2,000, 3,000, 4,000, 5,000, 6,000, 7,000, 8,000 trees each(all with mtry= 5) were grown. Results can be seen in Figure 2. At first,variation decreases with increasing forest size. Though from about 2,000trees on, variation does not significantly decrease further and the mean isnear stable. To be cautious, ntree was fixed at 3,000.
The average forest with mtry= 5 and ntree= 3,000 predicts 1035 of the1440 outcomes correctly, corresponding to a misclassification rate of 28.13per cent. The chi-squared test shows that the cforest performs signifi-cantly better than the baseline model (p < .0001). Also, the residuals of6.46 and −7.72 show that the number of correct predictions has signifi-cantly increased.
Results from cforest can be somewhat “over-optimistic” ([Strobl2009,p. 19]). Therefore, it is more realistic to rely on more conservative resultsoffered by the ‘out-of-bag’ (OOB) observations ([Strobl2009, p. 19,29]).Each tree in a forest is fitted to a random subsample of the data points;all remaining observations form the OOB set ([Strobl2009, p. 19]). In thepresent study of hesitation placement in prepositional phrases (mtry= 5,ntree= 3,000), OOB predictions average 928 correct classifications (mis-classification rate of 35.56 per cent). Despite being more conservative thanthe original cforest result, this still highly significantly exceeds the per-formance of the baseline model (p < .0001, residuals: 2.78 and -3.33).
CART Trees and Random Forests in Linguistics 75
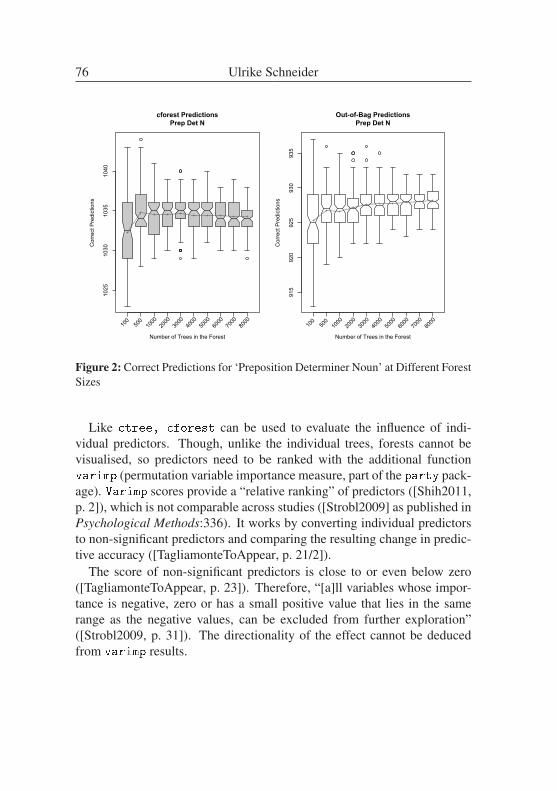
1025
1030
1035
1040
cforest PredictionsPrep Det N
Number of Trees in the Forest
Cor
rect
Pre
dict
ions
100
5001000
2000
3000
4000
5000
6000
7000
8000
915
920
925
930
935
Out-of-Bag PredictionsPrep Det N
Number of Trees in the Forest
Cor
rect
Pre
dict
ions
100
5001000
2000
3000
4000
5000
6000
7000
8000
Figure 2: Correct Predictions for ‘Preposition Determiner Noun’ at Different ForestSizes
Like ctree, cforest can be used to evaluate the influence of indi-vidual predictors. Though, unlike the individual trees, forests cannot bevisualised, so predictors need to be ranked with the additional functionvarimp (permutation variable importance measure, part of the party pack-age). Varimp scores provide a “relative ranking” of predictors ([Shih2011,p. 2]), which is not comparable across studies ([Strobl2009] as published inPsychological Methods:336). It works by converting individual predictorsto non-significant predictors and comparing the resulting change in predic-tive accuracy ([TagliamonteToAppear, p. 21/2]).
The score of non-significant predictors is close to or even below zero([TagliamonteToAppear, p. 23]). Therefore, “[a]ll variables whose impor-tance is negative, zero or has a small positive value that lies in the samerange as the negative values, can be excluded from further exploration”([Strobl2009, p. 31]). The directionality of the effect cannot be deducedfrom varimp results.
76 Ulrike Schneider
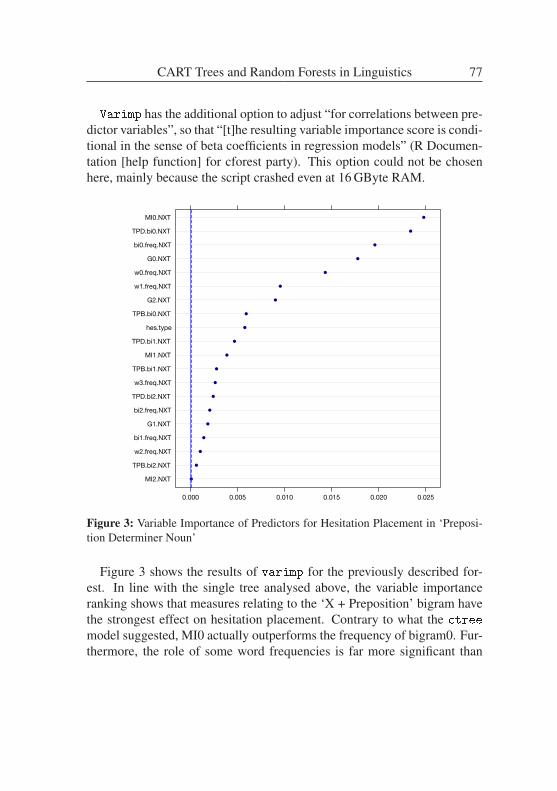
Varimp has the additional option to adjust “for correlations between pre-dictor variables”, so that “[t]he resulting variable importance score is condi-tional in the sense of beta coefficients in regression models” (R Documen-tation [help function] for cforest party). This option could not be chosenhere, mainly because the script crashed even at 16 GByte RAM.
sort(PDN.varimp)
MI2.NXT
TPB.bi2.NXT
w2.freq.NXT
bi1.freq.NXT
G1.NXT
bi2.freq.NXT
TPD.bi2.NXT
w3.freq.NXT
TPB.bi1.NXT
MI1.NXT
TPD.bi1.NXT
hes.type
TPB.bi0.NXT
G2.NXT
w1.freq.NXT
w0.freq.NXT
G0.NXT
bi0.freq.NXT
TPD.bi0.NXT
MI0.NXT
0.000 0.005 0.010 0.015 0.020 0.025
!
!
!
!
!
!
!
!
!
!
!
!
!
!
!
!
!
!
!
!
Figure 3: Variable Importance of Predictors for Hesitation Placement in ‘Preposi-tion Determiner Noun’
Figure 3 shows the results of varimp for the previously described for-est. In line with the single tree analysed above, the variable importanceranking shows that measures relating to the ‘X + Preposition’ bigram havethe strongest effect on hesitation placement. Contrary to what the ctree
model suggested, MI0 actually outperforms the frequency of bigram0. Fur-thermore, the role of some word frequencies is far more significant than
CART Trees and Random Forests in Linguistics 77
suggested by the ctree model. So, the general hypothesis that more com-plex measures of association perform better at predicting hesitation place-ment is not confirmed.
5 Summary and Conclusion
This paper focussed on a statistical methodology. It points out that recursivepartitioning, particularly when applied in ensemble methods, offers a solu-tion for multinomial problems in linguistics. Results show that word andbigram frequencies as well as transitional probabilities, the Mutual Infor-mation score and lexical gravity G are predictive of hesitation placement inprepositional phrases. Consequently, hesitation placement is not only gov-erned by grammatical, but also by frequency-based factors. For a theoryof chunking, this implies that hesitations can serve as indicators of chunkboundaries. Results furthermore allow conclusions about the importanceof individual predictors. While simple co-occurrence frequency was notthe best predictor, no one predictor clearly outperformed the others. As aconclusion, it can be assumed that high bigram frequency alone is not asufficient condition for chunking.
This paper showed that combining single trees with random forests canbe a useful procedure in linguistic analyses, as it combines the clusteringoffered by trees with the more stable analysis of random forests. It alsoshowed how linguists can profit from the computational possibilities of-fered by cluster computing.
References
[Baayen2008] R. H. Baayen. Analyzing Linguistic Data. A Practical In-troduction to Statistics using R. CUP, Cambridge, 2008.
[Biber2004] D. Biber, S. Conrad, and V. Cortes. If you look at... : Lexicalbundles in university teaching and textbooks. Applied Linguis-tics, 25(3):371–405, 2004.
[Bybee2007] J. Bybee. Frequency of Use and the Organization of Lan-guage. OUP, Oxford, 2007.
78 Ulrike Schneider
[Daudaravicius2004] V. Daudaravicius and R. Marcinkeviciene. Gravitycounts for the boundaries of collocations. International Jour-nal of Corpus Linguistics, 9(2):321–348, 2004.
[Ellis2003] N. C. Ellis. Handbook of Second Language Acquisition, chap-ter Constructions, chunking, and connectionism: The emer-gence of second language structure. Blackwell, Oxford, 2003.
[Erman2007] B. Erman. Cognitive processes as evidence of the idiom prin-ciple. International Journal of Corpus Linguistics, 12(1):25–53, 2007.
[Fox2010] B. A. Fox, Y. Maschler, and S. Uhmann. A cross-linguisticstudy of self-repair: Evidence from English, German and He-brew. Journal of Pragmatics, 42:2487–2505, 2010.
[Genuer2008] R. Genuer, J.-M. Poggi, and C. Tuleau. Random forests:some methodological insights. Rapport de Recherche, 6729:1–32, 2008.
[Goldstein2011] B. A. Goldstein, E. C. Polley, and F. B. S. Briggs. Ran-dom forests for genetic association studies. Statistical Appli-cations in Genetics and Molecular Biology, 10(1):1–34, 2011.
[Gries2010] S. Th. Gries and J. Mukherjee. Lexical gravity across varietiesof English: An ICE-based study of n-grams in Asian Englishes.International Journal of Corpus Linguistics, 15(4):520–548,2010.
[Hothorn2006] T. Hothorn, K. Hornik, and A. Zeileis. Unbiased recursivepartitioning: A conditional inference framework. Journal ofComputational and Graphical Statistics, 15(3):651–674, 2006.
[Hothorn2006a] T. Hothorn, P. Buehlmann, S. Dudoit, A. Molinaro, andM. van Der Laan. Survival ensembles. Biostatistics, 7(3):355–373, 2006.
CART Trees and Random Forests in Linguistics 79
[Hunston2000] S. Hunston and G. Francis. Pattern Grammar: A Corpus-Driven Approach to the Lexical Grammar of English. Ben-jamins, J., Amsterdam/Philadelphia, 2000.
[Kapatsinski2005] V. M. Kapatsinski. Measuring the relationship of struc-ture to use: Determinants of the extent of recycle in repetitionrepair. Berkeley Linguistics Society, 30:481–92, 2005.
[NXTSwitchboardCorpus2008] NXT Switchboard Corpus Public Release2008. Linguistic Data Consortium. Catalog #LDC2009T26,Philadelphia, 2008.
[SchneiderInPreparation] U. Schneider. Frequency, Hesitations andChunks. What Does the Placement of Hesitations Tell us Aboutthe Nature of Chunks? PhD Thesis, in preparation.
[Shih2011] S. S.-y. Shih. Random forests for classification trees and cate-gorical dependent variables: An informal quick start R guide,2011.
[Shriberg1996] E. Shriberg and A. Stolke. Word predictability after hes-itations: A corpus-based study. Proceedings of the Inter-national Conference on Spoken Language Processing (Vol.3),pages 1868–1871, 1996.
[Strobl2007] C. Strobl, A.-L. Boulestreix, A. Zeileis, and T. Hothorn. Biasin random forest variable importance measures: Illustrations,sources and a solution. BMC Bioinformatics, 8(25), 2007.
[Strobl2008] C. Strobl, A.-L. Boulestreix, T. Kneib, T. Augustin, andA. Zeileis. Conditional variable importance for random forests.BMC Bioinformatics, 9(307), 2008.
[Strobl2009] C. Strobl, J. Malley, and G. Tutz. An introduction to recur-sive partitioning: Rationale, application and characteristics ofclassification and regression trees, bagging and random forests.University of Munich, Department of Statistics, Technical Re-port Number 55. (Including Supplement), pages 1–42, 2009.
80 Ulrike Schneider
[TagliamonteToAppear] S. A. Tagliamonte and R. H. Baayen. Models,forests and trees of York English: Was/were variation as a casestudy for statistical practice. to appear.
[Wiechmann2008] D. Wiechmann. On the computation of collostructionstrength: Testing measures of association as expressions of lex-ical bias. Corpus Linguistics and Linguistic Theory, 4(2):253–290, 2008.
[Wray2002] A. Wray. Formulaic Language and the Lexicon. CUP, Cam-bridge, 2002.
CART Trees and Random Forests in Linguistics 81

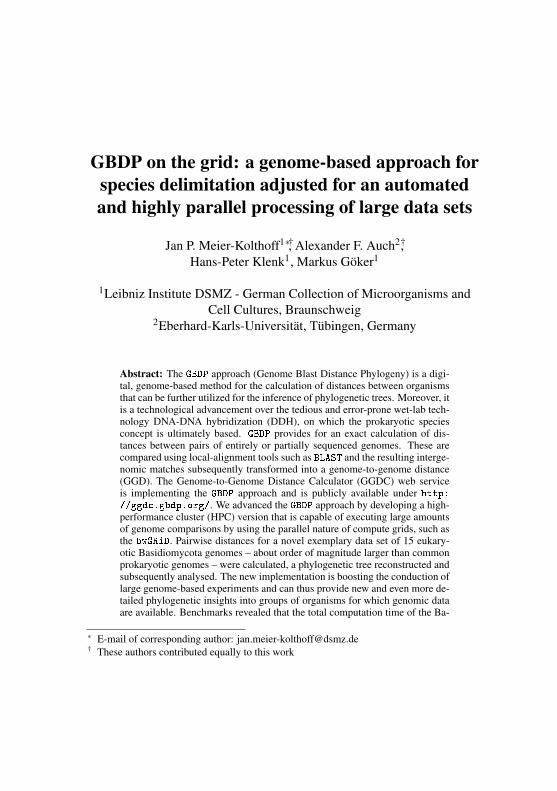
GBDP on the grid: a genome-based approach forspecies delimitation adjusted for an automatedand highly parallel processing of large data sets
Jan P. Meier-Kolthoff1∗†, Alexander F. Auch2†,Hans-Peter Klenk1, Markus Göker1
1Leibniz Institute DSMZ - German Collection of Microorganisms andCell Cultures, Braunschweig
2Eberhard-Karls-Universität, Tübingen, Germany
Abstract: The GBDP approach (Genome Blast Distance Phylogeny) is a digi-tal, genome-based method for the calculation of distances between organismsthat can be further utilized for the inference of phylogenetic trees. Moreover, itis a technological advancement over the tedious and error-prone wet-lab tech-nology DNA-DNA hybridization (DDH), on which the prokaryotic speciesconcept is ultimately based. GBDP provides for an exact calculation of dis-tances between pairs of entirely or partially sequenced genomes. These arecompared using local-alignment tools such as BLAST and the resulting interge-nomic matches subsequently transformed into a genome-to-genome distance(GGD). The Genome-to-Genome Distance Calculator (GGDC) web serviceis implementing the GBDP approach and is publicly available under http://ggdc.gbdp.org/. We advanced the GBDP approach by developing a high-performance cluster (HPC) version that is capable of executing large amountsof genome comparisons by using the parallel nature of compute grids, such asthe bwGRiD. Pairwise distances for a novel exemplary data set of 15 eukary-otic Basidiomycota genomes – about order of magnitude larger than commonprokaryotic genomes – were calculated, a phylogenetic tree reconstructed andsubsequently analysed. The new implementation is boosting the conduction oflarge genome-based experiments and can thus provide new and even more de-tailed phylogenetic insights into groups of organisms for which genomic dataare available. Benchmarks revealed that the total computation time of the Ba-
∗ E-mail of corresponding author: [email protected]† These authors contributed equally to this work
sidiomycota data set is almost negligible (within 1h) due to the linear speed-upprovided by the cluster.
1 Introduction
This article describes an HPC (high-performance cluster) implementationof Genome-Blast Distance Phylogeny [Henz2005, Auch2006, Auch2009,Auch2010, Auch2010a], a bioinformatics approach for the calculation ofdistances between completely or partially sequenced genomes. GBDP is abasis for the inference of phylogenetic trees or networks and can also beused as a technically improved genome-sequence-based alternative for te-dious and error-prone wet-lab techniques such as DNA-DNA hybridization(DDH).
The 2011 EHEC outbreak in Germany and other European countriescalled to mind that a quick identification and classification of pathogenicmicroorganisms is of utmost importance for proper reactions to such crises[Beutin2012]. Knowledge about key properties such as infectious spread-ing, antibiotic resistances, optimal growth conditions and morphology helpto develop a proper cure and to eliminate or at least to reduce the risk ofnew infections. For this and other reasons, one important sub-discipline inbiology is taxonomy; the identification and classification of species accord-ing to a given scheme. In recent decades, microbial taxonomy was richlyinformed by phylogenetics, the study of evolutionary relatedness amonggroups of organisms on the basis of molecular sequencing data. It reacheda preliminary climax in 1977 when Carl Woese used the DNA sequence ofthe 16S ribosomal subunits of bacterial strains to introduce a revolutionaryclassification scheme that contained the Archaea as a third domain alongwith Bacteria and Eucaryota [Woese1977]. These ribosomal sequences areancient and distributed over all lineages of life with little or no horizontalgene transfer. However, the more 16S sequences were obtained from bothBacteria and Archaea the more they turned out not to be suitable as soleuniversal phylogenetic marker [Klenk2010], i.e., sequences among somemicrobial groups are almost identical (high conservation), although the un-derlying organisms are only distantly related. Hence, new approaches wererequired and finally became apparent with the advent and rapid advances in
84 Jan P. Meier-Kolthoff, et al.
whole-genome sequencing [Mardis2011]. These offered new perspectivesfor genome-based identification and classification of microorganisms: byusing whole genomes – or at least a large number of gene-families – thephylogenetic resolution can be substantially increased [Henz2005].
This principle led to the aforementioned development of the Genome-Blast Distance Phylogeny approach (GBDP) that was originally devised in2005 [Henz2005] and subsequently improved. The latest installation of thesoftware is especially designed for the use on high-performance clusters –such as those provided by bwGRiD [bwgrid2012] – and thus capable of han-dling large data sets. The underlying principle of the GBDP software itselfis as follows: in the first step two genomes A and B are locally alignedusing tools such as BLAST [Altschul1990], which search for local simi-larities and thus produce a set of high-scoring segment pairs (HSPs; theseare intergenomic stretches matching up to a certain extent). In the secondstep, information contained in these HSPs (e.g., the total number of iden-tical base pairs) is transformed into a single genome-to-genome distancevalue (GGD) by the use of a specific distance formula. In principle, GBDPcould as well process proteomic data instead of genomic ones.
We describe the basic principle of the GBDP approach and the extensionsnecessary for running it on compute clusters. Finally, we demonstrate theimplementation on the basis of an exemplary data set of fungal genomes.These eukaryotic genomes are by an order of magnitude larger than thoseof Bacteria and Archaea thus making the computation of intergenomic dis-tances a more challenging task. We observed that the GBDP implementationis able to handle input of this size without requiring any extra adjustmentsto the algorithms. We further assessed the general suitability of our grid-based implementation for this kind of analyses and could confirm that thehighly parallel nature of the bwGRiD is boosting studies of the aforemen-tioned kind: overall computation times are significantly reduced, allowingour experiment to be completed within a single hour; computations thatwould have taken days – if not weeks – on a standard desktop PC.
GBDP on the grid 85
2 Materials and Methods
2.1 The GBDP principle
The GBDP approach has been discussed in several publications [Henz2005,Auch2006, Auch2009, Auch2010, Auch2010a], thus, we will only describethe basic mechanisms and principles of the algorithm. The pipeline isprimarily subdivided into two phases: in the first phase, a genome X isBLASTed against a genome Y and vice versa. Here, the term “BLASTed” de-notes the application of one out of six supported local-alignment programs:BLAST+ [Camacho2009], NCBI-BLAST [Altschul1990], MUMmer
[Kurtz2004], BLAT [Kent2002], WU-BLAST [Altschul1990] and BLASTZ
[Schwartz2003]. The resulting matches between both genomes are calledhigh-scoring segment pairs (HSPs). In a second phase, GBDP is filteringthese HSPs according to one out of three available algorithms: “greedy”,“greedy-with-trimming” or “coverage”. Each one of these is accountingdifferently for special cases such as overlapping HSPs (i.e., two HSPs thatshare a specific part within the query or subject genome). Briefly, the algo-rithms define (i) whether the smaller overlapping HSP is removed (called“greedy”; can lead to information loss but computationally fast), (ii) theoverlapping parts are merged (“greedy-with-trimming”; also prevents over-lapping genome parts to be considered twice but is more compute-intense)or (iii) only the amount of the genome is accounted that is actually coveredby HSPs. At the end of the second phase, these matches are transformed toa single distance value d(X ,Y ) by applying one out of ten available distanceformulas (d0 to d9). These formulas are basically different flavours of howdistances between genomes can be computed on the basis of their respectiveHSP sets. For example d4 and d5 are preferable when dealing with partiallyincomplete genomes, whereas d1 and d7 (and their logarithmized variantsd3 and d9) are especially suitable if two complete genomes are significantlydiffering in size (see [Auch2010] for detailed descriptions). Optional is thegeneration of bootstrap or jackknife replicate distances, which is based ona random sampling of the above mentioned HSPs (prior to the distance cal-culation). The GGDC can be requested to compute these replicates by addingeither a bootstrap or jackknife generator object to the YAML request (see
86 Jan P. Meier-Kolthoff, et al.
Fig. 3). These sampling implementations should not be confused withthe type of bootstrapping/jackknifing that is usually applied to multiple se-quence alignments.
Regarding the implementation, the first phase is encapsulated in a so-called “match request” which triggers the aforementioned comparison oftwo genomes and finally provides the results in a standardized output for-mat (see below for details). In turn, the latter output is read during thesecond phase and used by a separate “distance request” to finally comparedistance values that are also stored in a proper output format. The divi-sion into these two types of requests is due to the fact that distance requestscan be conducted under different settings without requiring the matchesrequests to be repeated. This procedure is saving both computation andstorage resources.
2.2 Adjusting GBDP for the bwGRiD
The GBDP software was originally devised to be run on local machines,thus requiring a couple of extensions to the initial concept [Auch2010a].The final workflow of the new pipeline is shown in Fig. 1. The followinglist summarizes the requirements of the implementation and how they werefinally embedded into the bwGRiD environment.
Languages The GBDP software is written in Java (1.5+) whereas the grid-related part (e.g., for the scheduling) is implemented in the Rubylanguage (1.8.7+).
Interfaces All request and output files are uniformly provided in the YAMLcross-language format – a human-readable data serialization format(http://www.yaml.org/). This allowed us to upload and/or down-load data to and from the bwGRiD. Fig. 2 and 3 show sample requestsand output files for both match and distance calculations.
Bulk generation of the request Most of the phylogenomic analyses con-ducted on the bwGRiD are based on comparably large sets of genomesthus requiring an automated generation of match and distance re-quests as well as a simultaneous validation of the genome files’ for-
GBDP on the grid 87
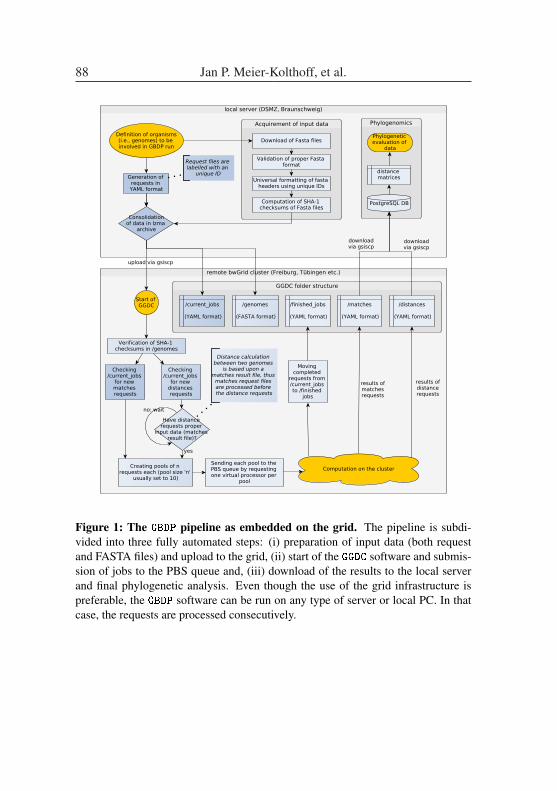
Figure 1: The GBDP pipeline as embedded on the grid. The pipeline is subdi-vided into three fully automated steps: (i) preparation of input data (both requestand FASTA files) and upload to the grid, (ii) start of the GGDC software and submis-sion of jobs to the PBS queue and, (iii) download of the results to the local serverand final phylogenetic analysis. Even though the use of the grid infrastructure ispreferable, the GBDP software can be run on any type of server or local PC. In thatcase, the requests are processed consecutively.
88 Jan P. Meier-Kolthoff, et al.
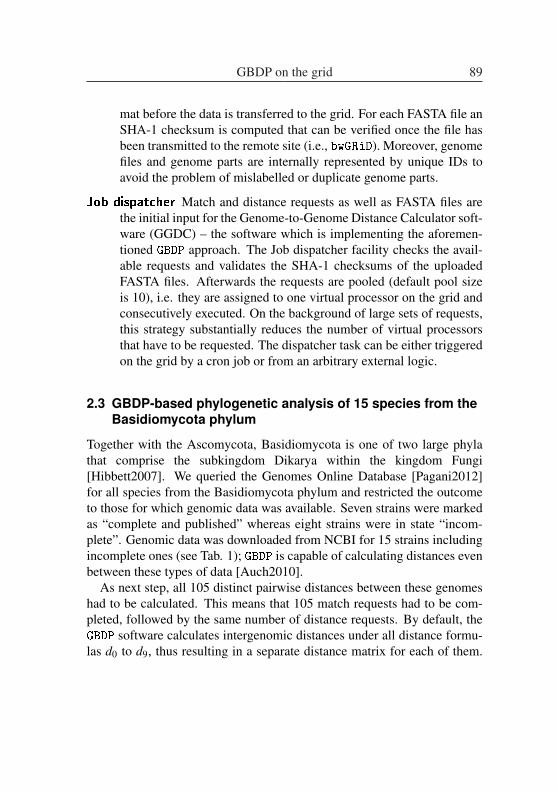
mat before the data is transferred to the grid. For each FASTA file anSHA-1 checksum is computed that can be verified once the file hasbeen transmitted to the remote site (i.e., bwGRiD). Moreover, genomefiles and genome parts are internally represented by unique IDs toavoid the problem of mislabelled or duplicate genome parts.
Job dispatcher Match and distance requests as well as FASTA files arethe initial input for the Genome-to-Genome Distance Calculator soft-ware (GGDC) – the software which is implementing the aforemen-tioned GBDP approach. The Job dispatcher facility checks the avail-able requests and validates the SHA-1 checksums of the uploadedFASTA files. Afterwards the requests are pooled (default pool sizeis 10), i.e. they are assigned to one virtual processor on the grid andconsecutively executed. On the background of large sets of requests,this strategy substantially reduces the number of virtual processorsthat have to be requested. The dispatcher task can be either triggeredon the grid by a cron job or from an arbitrary external logic.
2.3 GBDP-based phylogenetic analysis of 15 species from theBasidiomycota phylum
Together with the Ascomycota, Basidiomycota is one of two large phylathat comprise the subkingdom Dikarya within the kingdom Fungi[Hibbett2007]. We queried the Genomes Online Database [Pagani2012]for all species from the Basidiomycota phylum and restricted the outcometo those for which genomic data was available. Seven strains were markedas “complete and published” whereas eight strains were in state “incom-plete”. Genomic data was downloaded from NCBI for 15 strains includingincomplete ones (see Tab. 1); GBDP is capable of calculating distances evenbetween these types of data [Auch2010].
As next step, all 105 distinct pairwise distances between these genomeshad to be calculated. This means that 105 match requests had to be com-pleted, followed by the same number of distance requests. By default, theGBDP software calculates intergenomic distances under all distance formu-las d0 to d9, thus resulting in a separate distance matrix for each of them.
GBDP on the grid 89
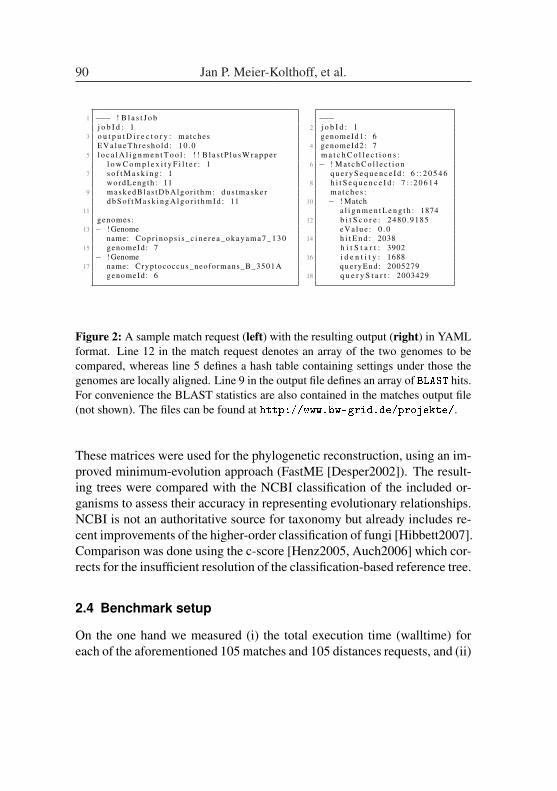
1 −−− ! B l a s t J o bj o b I d : 1
3 o u t p u t D i r e c t o r y : matchesE V a l u e T h r e s h o l d : 1 0 . 0
5 l o c a l A l i g n m e n t T o o l : ! ! B l a s t P l u s W r a p p e rl o w C o m p l e x i t y F i l t e r : 1
7 s o f t M a s k i n g : 1wordLeng th : 11
9 m a s k e dB l a s t D b A l g o r i t h m : d u s t m a s k e rd b S o f t M a s k i n g A l g o r i t h m I d : 11
11genomes:
13 − ! Genomename: C o p r i n o p s i s _ c i n e r e a _ o k a y a m a 7 _ 1 3 0
15 genomeId : 7− ! Genome
17 name: Cryptococcus_neoformans_B_3501AgenomeId : 6
−−−2 j o b I d : 1
genomeId1: 64 genomeId2: 7
m a t c h C o l l e c t i o n s :6 − ! M a t c h C o l l e c t i o n
q u e r y S e q u e n c e I d : 6 : : 2 0 5 4 68 h i t S e q u e n c e I d : 7 : : 2 0 6 1 4
m a t c h e s :10 − ! Match
a l i g n m e n t L e n g t h : 187412 b i t S c o r e : 2480 .9185
e V a l u e : 0 . 014 h i t E n d : 2038
h i t S t a r t : 390216 i d e n t i t y : 1688
que ryEnd : 200527918 q u e r y S t a r t : 2003429
Figure 2: A sample match request (left) with the resulting output (right) in YAMLformat. Line 12 in the match request denotes an array of the two genomes to becompared, whereas line 5 defines a hash table containing settings under those thegenomes are locally aligned. Line 9 in the output file defines an array of BLAST hits.For convenience the BLAST statistics are also contained in the matches output file(not shown). The files can be found at http://www.bw-grid.de/projekte/.
These matrices were used for the phylogenetic reconstruction, using an im-proved minimum-evolution approach (FastME [Desper2002]). The result-ing trees were compared with the NCBI classification of the included or-ganisms to assess their accuracy in representing evolutionary relationships.NCBI is not an authoritative source for taxonomy but already includes re-cent improvements of the higher-order classification of fungi [Hibbett2007].Comparison was done using the c-score [Henz2005, Auch2006] which cor-rects for the insufficient resolution of the classification-based reference tree.
2.4 Benchmark setup
On the one hand we measured (i) the total execution time (walltime) foreach of the aforementioned 105 matches and 105 distances requests, and (ii)
90 Jan P. Meier-Kolthoff, et al.
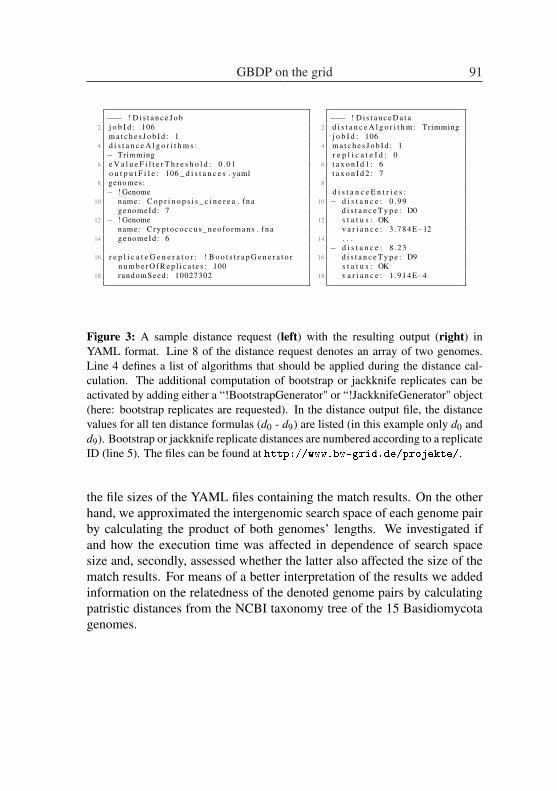
−−− ! D i s t a n c e J o b2 j o b I d : 106
m a t c h e s J o b I d : 14 d i s t a n c e A l g o r i t h m s :
− Trimming6 e V a l u e F i l t e r T h r e s h o l d : 0 . 0 1
o u t p u t F i l e : 106 _ d i s t a n c e s . yaml8 genomes:
− ! Genome10 name: C o p r i n o p s i s _ c i n e r e a . f n a
genomeId : 712 − ! Genome
name: C r y p t o c o c c u s _ n e o f o r m a n s . f n a14 genomeId : 6
16 r e p l i c a t e G e n e r a t o r : ! B o o t s t r a p G e n e r a t o rn u m b e r O f R e p l i c a t e s : 100
18 randomSeed: 10027302
−−− ! D i s t a n c e D a t a2 d i s t a n c e A l g o r i t h m : Trimming
j o b I d : 1064 m a t c h e s J o b I d : 1
r e p l i c a t e I d : 06 t a x o n I d 1 : 6
t a x o n I d 2 : 78
d i s t a n c e E n t r i e s :10 − d i s t a n c e : 0 . 9 9
d i s t a n c e T y p e : D012 s t a t u s : OK
v a r i a n c e : 3 .784E−1214 . . .
− d i s t a n c e : 8 . 2 316 d i s t a n c e T y p e : D9
s t a t u s : OK18 v a r i a n c e : 1 .914E−4
Figure 3: A sample distance request (left) with the resulting output (right) inYAML format. Line 8 of the distance request denotes an array of two genomes.Line 4 defines a list of algorithms that should be applied during the distance cal-culation. The additional computation of bootstrap or jackknife replicates can beactivated by adding either a “!BootstrapGenerator" or “!JackknifeGenerator" object(here: bootstrap replicates are requested). In the distance output file, the distancevalues for all ten distance formulas (d0 - d9) are listed (in this example only d0 andd9). Bootstrap or jackknife replicate distances are numbered according to a replicateID (line 5). The files can be found at http://www.bw-grid.de/projekte/.
the file sizes of the YAML files containing the match results. On the otherhand, we approximated the intergenomic search space of each genome pairby calculating the product of both genomes’ lengths. We investigated ifand how the execution time was affected in dependence of search spacesize and, secondly, assessed whether the latter also affected the size of thematch results. For means of a better interpretation of the results we addedinformation on the relatedness of the denoted genome pairs by calculatingpatristic distances from the NCBI taxonomy tree of the 15 Basidiomycotagenomes.
GBDP on the grid 91
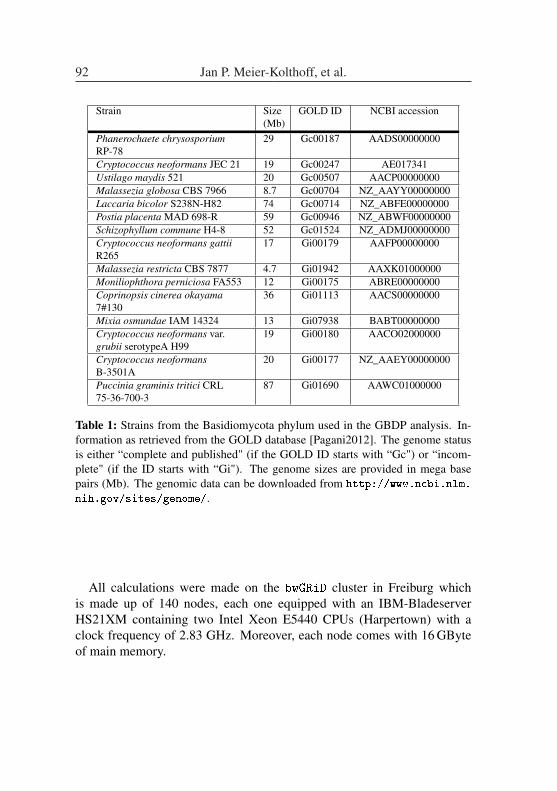
Strain Size(Mb)
GOLD ID NCBI accession
Phanerochaete chrysosporiumRP-78
29 Gc00187 AADS00000000
Cryptococcus neoformans JEC 21 19 Gc00247 AE017341Ustilago maydis 521 20 Gc00507 AACP00000000Malassezia globosa CBS 7966 8.7 Gc00704 NZ_AAYY00000000Laccaria bicolor S238N-H82 74 Gc00714 NZ_ABFE00000000Postia placenta MAD 698-R 59 Gc00946 NZ_ABWF00000000Schizophyllum commune H4-8 52 Gc01524 NZ_ADMJ00000000Cryptococcus neoformans gattiiR265
17 Gi00179 AAFP00000000
Malassezia restricta CBS 7877 4.7 Gi01942 AAXK01000000Moniliophthora perniciosa FA553 12 Gi00175 ABRE00000000Coprinopsis cinerea okayama7#130
36 Gi01113 AACS00000000
Mixia osmundae IAM 14324 13 Gi07938 BABT00000000Cryptococcus neoformans var.grubii serotypeA H99
19 Gi00180 AACO02000000
Cryptococcus neoformansB-3501A
20 Gi00177 NZ_AAEY00000000
Puccinia graminis tritici CRL75-36-700-3
87 Gi01690 AAWC01000000
Table 1: Strains from the Basidiomycota phylum used in the GBDP analysis. In-formation as retrieved from the GOLD database [Pagani2012]. The genome statusis either “complete and published" (if the GOLD ID starts with “Gc") or “incom-plete" (if the ID starts with “Gi"). The genome sizes are provided in mega basepairs (Mb). The genomic data can be downloaded from http://www.ncbi.nlm.
nih.gov/sites/genome/.
All calculations were made on the bwGRiD cluster in Freiburg whichis made up of 140 nodes, each one equipped with an IBM-BladeserverHS21XM containing two Intel Xeon E5440 CPUs (Harpertown) with aclock frequency of 2.83 GHz. Moreover, each node comes with 16 GByteof main memory.
92 Jan P. Meier-Kolthoff, et al.
3 Results3.1 Phylogenetic analysis of the Basidiomycota data set
The resulting branch support was uniformly high (see Fig. 4 for an exam-ple), but the c-scores varied, depending on the distance formula used andto a much lesser degree on whether “greedy”, “greedy-with-trimming” or“coverage” was used. The lowest c-scores of 0.333 (i.e., the least corre-spondence with the reference classification) were obtained with formulasd4 and d5, the highest c-scores of 0.917 with formulas d3 and d9. Whether“greedy”, “greedy-with-trimming” or “coverage” was used did not affectthe c-scores of formulas d3 and d9.
One of the best trees is shown in Fig. 4. The subphyla (Pucciniamy-cotina: Mixia and Puccinia; Ustilaginomycotina: Malassezia and Ustilago;Agaricomycotina: all other included organisms) are all well recovered.The sole discrepancy with the NCBI classification is that Phanerochaetaand Postia (“Agaricomycetes incertae sedis”) are placed within Agaricales,closer to the other Agaricales than Schizophyllum. Their names are boxedin Fig. 4. Because this discrepancy is caused by organisms of uncertaintaxonomic placement (“incertae sedis"), the GBDP phylogeny might wellbe regarded as in full agreement with the classification.
3.2 Benchmark results
The total execution time of all match requests added up to 19.75 hours andthat of the distance requests was 59.9 hours. The average execution time ofall match requests was about 11 minutes and that of the distance requestsabout 34 minutes. The average size of all match results was about 40 MByte(total size: 4 GByte). Fig. 5 shows the benchmark results.
4 Discussion4.1 Phylogenetic analysis
Distance formulas d4 and d5 (which is the logarithmized version of d4) ig-nore the genome lengths and only relate the total HSP length and the totalnumber of identical base pairs within HSPs to each other; in contrast, d3 and
GBDP on the grid 93
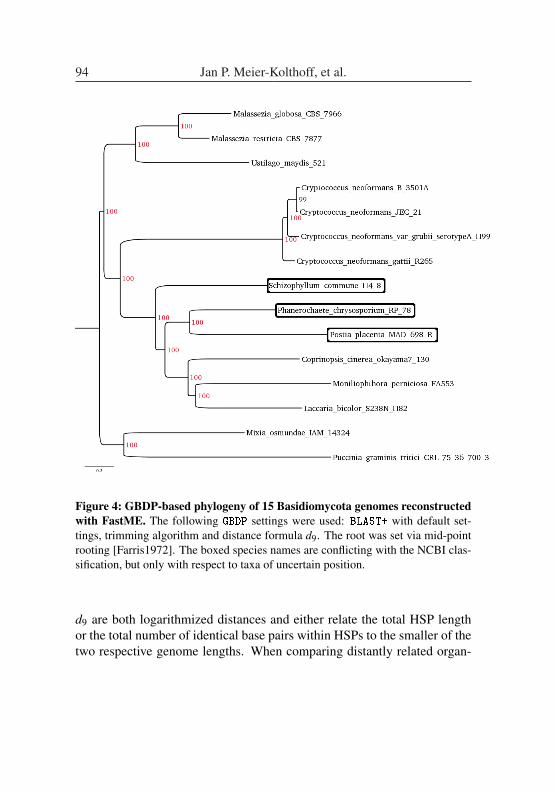
Figure 4: GBDP-based phylogeny of 15 Basidiomycota genomes reconstructedwith FastME. The following GBDP settings were used: BLAST+ with default set-tings, trimming algorithm and distance formula d9. The root was set via mid-pointrooting [Farris1972]. The boxed species names are conflicting with the NCBI clas-sification, but only with respect to taxa of uncertain position.
d9 are both logarithmized distances and either relate the total HSP lengthor the total number of identical base pairs within HSPs to the smaller of thetwo respective genome lengths. When comparing distantly related organ-
94 Jan P. Meier-Kolthoff, et al.
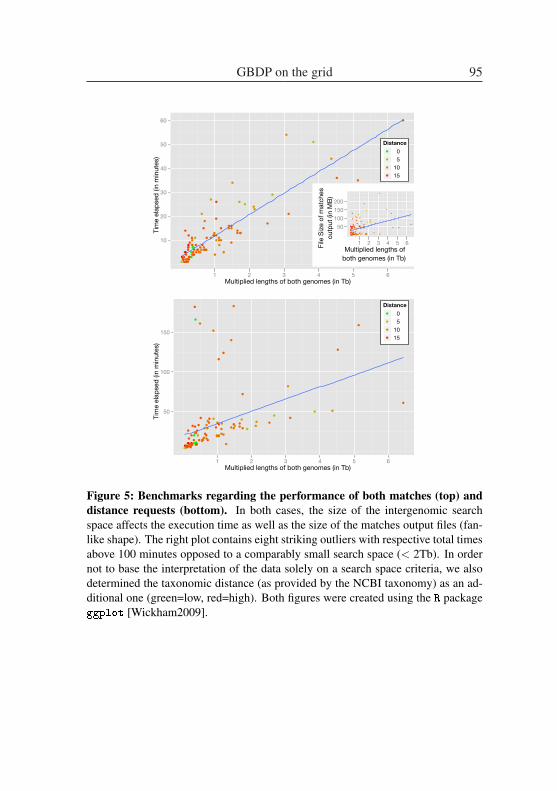
Multiplied lengths of both genomes (in Tb)
Tim
e el
apse
d (in
min
utes
)
10
20
30
40
50
60
lâââ
â
ââ
â
ââ
â
â
â
â
â
ââ
â
âââ
â
â
â
ââ
ââ â
â
âââ
â
â
â
ââ
â
â
â
ââ â
ââ
â
ââ
â
â
ââ â
â
â
â
ââ
â
ââ
â
â
â
â
â
â
â
ââ
â â
â â
â
âââ
â
â
â
â
â
â â
â
â
â
â
â
â
â
â
â
â
â
â
â
â
â
â
â
â
â
1 2 3 4 5 6
Distanceâ 0â 5â 10â 15
Multiplied lengths ofboth genomes (in Tb)
File
Siz
e of
mat
ches
outp
ut (i
n M
B)
50
100
150
200
ââââ
â
â
â
â
â
â
â
â
â
ââ
ââ
â
ââ
â
â
â
â
â
â
ââ â
â
â
â
â
â
â
â
â
â
â
â
â
â
ââ
â
â
â
â
â
â
â
â
ââ
â
â
â
â
â
â
â
â
â
â
â
â
â
â
â
â
â
â
â
â
â
â
â
â
ââ
â
â
â
ââ
â
â
â
â
â
â
â
â
â
â
â
â
â
â
â
â
â
â
â
â
1 2 3 4 5 6
Multiplied lengths of both genomes (in Tb)
Tim
e el
apse
d (in
min
utes
)
50
100
150
lâ
â
ââ
â
â
ââ
â
â
â
â
ââ
âââ ââ â
â âââ âââ ââââ ââ â ââ ââ â âââ âââ âââ ââ ââ ââ ââ â ââ
âââ ââ â âââââââââââââ â ââââââââ âââââââââââââ ââââ
1 2 3 4 5 6
Distanceâ 0â 5â 10â 15
Figure 5: Benchmarks regarding the performance of both matches (top) anddistance requests (bottom). In both cases, the size of the intergenomic searchspace affects the execution time as well as the size of the matches output files (fan-like shape). The right plot contains eight striking outliers with respective total timesabove 100 minutes opposed to a comparably small search space (< 2Tb). In ordernot to base the interpretation of the data solely on a search space criteria, we alsodetermined the taxonomic distance (as provided by the NCBI taxonomy) as an ad-ditional one (green=low, red=high). Both figures were created using the R packageggplot [Wickham2009].
GBDP on the grid 95
isms, d4 and d5 may suffer from saturation effects because the HSPs are re-duced to matches between strongly conserved genes. For this reason, d4 andd5 distances may even decrease with decreasing evolutionary relatedness.The main benefits of d4 and d5 are elsewhere [Auch2010, Auch2010a].Conversely, logarithmizing the distances helps against saturation, and us-ing the smaller of the two respective genome lengths as the denominatorin the distance formula corrects against huge differences between genomesizes [Henz2005]. Hence, the relative performance of the distance formulasin the phylogenomic problem studied here is not surprising, given previousresults [Henz2005, Auch2006]. Eukaryotic genomes, however, were testedhere for the first time, whereas earlier work with GBDP was restricted toprokaryotes or organelles of eukaryotes.
4.2 Benchmarks
The use of 15 eukaryotic (Basidiomycota) genomes was a special test casefor the presented grid-based implementation of GBDP as these comparablybig genomes had never been processed by that implementation before, thuswe entered new territory when assessing the scalability of the algorithmsand the hardware (e.g., memory usage). GBDP succeeded in processing thisdata and provided interesting insights into time and space complexity: ingeneral, we can assume a linear relationship between search space size andthe elapsed time for both types of requests. If the work load of a clusteris low, the cluster can process all requests in less than an hour, virtuallyproviding for a linear speed-up.
However, some outliers were detected among the computed distance re-quests which cannot be explained by the mere size of the respective inputdata they used (matches). Here, other effects must have occurred that mightbe due to the partial incompleteness of some genomes. A closer look at theinternal structure of these files revealed a high number of sequences (i.e.,headers) – ranging from hundreds to thousands of sequences – and thusmight have influenced the way GBDP is internally processing hits and trans-forming them to distance values. Moreover, the time measurement for eachrequest ranges from the process’ starting time till the time when the resultfile was completely written to the file system; measurement errors at any
96 Jan P. Meier-Kolthoff, et al.
of these stages might also be the case. Thus, a detailed benchmarking ofall the steps performed in a single request could presumably provide moreexplanations to the aforementioned outliers. On the background of this dataset, the taxonomic relatedness only had a minor effect on the computationtime.
The benchmark results provide for an estimated a priori calculation ofboth the expected computation time as well as the order of magnitude ofthe resulting matches files’ sizes. Hence, this information can be used toplan the requirements of future GBDP-based experiments.
4.3 Outlook
GBDP is using local-alignment tools such as BLAST+ for processing matchrequests. As the latter is providing multi-core support these could alsobe utilized for speeding-up the overall execution time. Even more speed-up would be achieved with highly-optimized GPU-BLAST software suites[Vouzis2011]. Even though the local alignment phase isn’t a computationalbottle-neck right now, optimized BLAST could be beneficial in the near fu-ture if more complete genomes are sequenced, especially from eukaryotes.In cooperation with Marek Dynowski (Rechenzentrum, University of Frei-burg) and Kevin Körner (Zentrum für Datenverarbeitung, University ofTübingen) we are currently working on a GGDC portlet for the bwGRiD. Theportlet is targeting the following aspects and features:
• The aforementioned grid-based GGDC variant should be provided tothe scientific community as a high-throughput tool. By means ofa web-based graphical user interface (similar to the web service al-ready available on http://ggdc.gbdp.org/), users should be ableto set-up and launch their HPC-based experiments.
• The conduction of large GBDP-based data sets/experiments in a rela-tively small amount of time should be possible, thus accessing newtypes of scientific questions that had previously only been possiblein theory.
GBDP on the grid 97
• Providing large amount of disk space even beyond common user quo-tas. Data management will be totally left to the portal, thus relievingthe user from this tedious task. Data will be always available via ajob monitoring and download portlet.
• Generation of match and distance requests: the portlet should trans-late the user-defined genome comparisons to the YAML request for-mat as required by the GGDC.
• Recycling of results: in order to avoid the repetition of popular ge-nome comparisons which have already been triggered by other usersbefore, the results of match and distance requests could be storedin a central repository such as the bwGRiD storage located at theKarlsruher Institut für Technologie (KIT). However, a concept forthis kind of central data management has to be developed beforehandand should preferably consider a broader spectrum of features. Thelatter would positively affect the development of new applications asthese could recourse to existing infrastructure via an universal appli-cation programming interface (API).
• GGDC’s job submission system will be adopted for grid computingusing the GATLET library (http://gatlet.scc.kit.edu/). Thepresented implementation is currently devised for sending requeststo a single cluster and is thus only using a specific part of the gridinstead of dynamically sending jobs to those cluster(s) having thesmallest work load at a particular time. This would provide for anadditional speed-up and, in principle, even allow for the processingof even larger data sets. Notifications would be brought to the user ina similar manner as already implemented on http://ggdc.gbdp.
org/.
• A permanent software infrastructure should be established that woulddirectly benefit from future hardware extensions such as those pro-vided by follow-up projects of the successful bwGRiD service.
The work presented here allows for a clearly optimistic view regardingGBDP’s suitability for the processing of large (eukaryotic) genomes. Since
98 Jan P. Meier-Kolthoff, et al.
each genome comparison is independent of the others, these calculationsperfectly fit to the distributed, node-based architecture of compute clusters.The highly parallel processing of genomic data sets thus leads to a dramat-ically reduced overall computation time, paving the way for experimentsthat have practically been impossible before.
Bibliography
[Altschul1990] S Altschul, W Gish, W Miller, E Myers, and D Lipman.Basic local alignment search tool. J Mol Biol, 215(3):403–410, 1990.
[Auch2006] A. F. Auch, S. Henz, B. Holland, and M. Göker. GenomeBLAST distance phylogenies inferred from whole plastid andwhole mitochondrion genome sequences. BMC bioinformat-ics, 7(1):350, 2006.
[Auch2009] A. F. Auch. A phylogenetic potpourri – Computational meth-ods for analysing genome-scale data. PhD thesis, UniversitätTübingen, Wilhelmstr. 32, 72074 Tübingen, 2009.
[Auch2010] A. F. Auch, M. von Jan, H.-P. Klenk, and M. Göker. Digi-tal DNA-DNA hybridization for microbial species delineationby means of genome-to-genome sequence comparison. Stan-dards in Genomic Sciences, 2(1):117–134, 2010.
[Auch2010a] A. F. Auch, H.-P. Klenk, and M. Göker. Standard operatingprocedure for calculating genome-to-genome distances basedon high-scoring segment pairs. Standards in Genomic Sci-ences, 2(1):142–148, 2010.
[Beutin2012] L. Beutin and A. Martin. Outbreak of Shiga Toxin-Producing Escherichia coli (STEC) o104:h4 Infection inGermany Causes a Paradigm Shift with Regard to HumanPathogenicity of STEC Strains. Journal of Food Protection,75(2):408–418, 2012.
GBDP on the grid 99
[Camacho2009] C. Camacho, G. Coulouris, V. Avagyan, N. Ma, J. Pa-padopoulos, K. Bealer, and T. Madden. BLAST+: architectureand applications. BMC Bioinformatics, 10(1):421, 2009.
[Desper2002] R. Desper and O. Gascuel. Fast and Accurate PhylogenyMinimum-Evolution Principle. Journal of Computational Bi-ology, 9(5):687–705, 2002.
[Farris1972] J. S. Farris. Estimating phylogenetic trees from distance ma-trices. American Naturalist, 106(951):645–667, 1972.
[Henz2005] S. R. Henz, D. H. Huson, A. F. Auch, K. Nieselt-Struwe, andS. C. Schuster. Whole-genome prokaryotic phylogeny. Bioin-formatics, 21(10):2329–2335, 2005.
[Hibbett2007] D. S. Hibbett, M. Binder, J. F. Bischoff, M. Blackwell,P. F. Cannon, O. E. Eriksson, S. Huhndorf, T. James, P. M.Kirk, R. Lücking, H. T. Lumbsch, F. Lutzoni, P. B. Ma-theny, D. J. McLaughlin, M. J. Powell, S. Redhead, C. L.Schoch, J. W. Spatafora, J. A. Stalpers, R. Vilgalys, M. C.Aime, A. Aptroot, R. Bauer, D. Begerow, G. L. Benny, L. A.Castlebury, P. W. Crous, Y.-C. Dai, W. Gams, D. M. Geiser,G. W. Griffith, C. Gueidan, D. L. Hawksworth, G. Hest-mark, K. Hosaka, R. A. Humber, K. D. Hyde, J. E. Iron-side, U. Kõljalg, C. P. Kurtzman, K.-H. Larsson, R. Licht-wardt, J. Longcore, J. Miadlikowska, A. Miller, J.-M. Mon-calvo, S. Mozley-Standridge, F. Oberwinkler, E. Parmasto,V. Reeb, J. D. Rogers, C. Roux, L. Ryvarden, J. Paulo Sam-paio, A. Schüßler, J. Sugiyama, R. G. Thorn, L. Tibell, W. A.Untereiner, C. Walker, Z. Wang, A. Weir, M. Weiss, M. M.White, K. Winka, Y.-J. Yao, and N. Zhang. A higher-level phy-logenetic classification of the Fungi. Mycological Research,111(5):509–547, 2007.
[Kent2002] W. Kent. BLAT – the BLAST-like alignment tool. GenomeRes, 12(4):656–664, 2002.
100 Jan P. Meier-Kolthoff, et al.
[Klenk2010] H.-P. Klenk and M. Göker. En route to a genome-based clas-sification of Archaea and Bacteria? Systematic and AppliedMicrobiology, 33(4):175–182, 2010.
[Kurtz2004] S. Kurtz, A. Phillippy, A. L. Delcher, M. Smoot,M. Shumway, C. Antonescu, and S. L. Salzberg. Versatile andopen software for comparing large genomes. Genome biology,5(2):R12, January 2004.
[Mardis2011] E. R. Mardis. A decade’s perspective on DNA sequencingtechnology. Nature, 470(7333):198–203, 2011.
[Pagani2012] I. Pagani, K. Liolios, J. Jansson, I-M. Chen, T. Smirnova,B. Nosrat, V. M. Markowitz, and N. C. Kyrpides. TheGenomes OnLine Database (GOLD) v.4: status of genomicand metagenomic projects and their associated metadata. Nu-cleic acids research, 40(Database issue):D571–D579, January2012.
[Schwartz2003] S. Schwartz, W. J. Kent, A. Smit, Z. Zhang, R. Baertsch,R. C. Hardison, D. Haussler, and W. Miller. Human - MouseAlignments with BLASTZ. Genome Research, 13(1):103–107, 2003.
[Vouzis2011] P. D. Vouzis and N. V. Sahinidis. GPU-BLAST: using graph-ics processors to accelerate protein sequence alignment. Bioin-formatics, 27(2):182–188, 2011.
[Wickham2009] H. Wickham. ggplot2: elegant graphics for data analysis.Springer New York, 2009.
[Woese1977] C. R. Woese and G. E. Fox. Phylogenetic structure of theprokaryotic domain: The primary kingdoms. Proceedings ofthe National Academy of Sciences, 74(11):5088–5090, 1977.
[bwgrid2012] BwGRiD. Member of the German D-Grid initiative, fundedby the Ministry of Education and Research and the Ministry
GBDP on the grid 101
for Science, Research and Arts Baden-Wuerttemberg (2007-2012). Technical report, Universities of Baden-Württemberg,2012.
AcknowledgmentMany thanks are addressed to Marek Dynowski, Rechenzentrum, Univer-sity of Freiburg, and Werner Dilling, Zentrum für Datenverarbeitung, Uni-versity of Tübingen, for granting access and for their technical support re-lated to the compute clusters of the bwGRiD [bwgrid2012].
FundingThis work was supported by the German Research Foundation (DFG) SF-B/TRR 51, which is gratefully acknowledged. The funders had no role instudy design, data collection and analysis, decision to publish, or prepara-tion of the manuscript.
102 Jan P. Meier-Kolthoff, et al.
Emulation-as-a-Service – Requirements andDesign of Scalable Emulation Services for Digital
Preservation
Isgandar Valizada∗, Klaus Rechert†, Dirk von Suchodoletz‡
University of Freiburg
Abstract: The goal of digital preservation activities is to research sustainableaccess strategies to digital objects over a long time period. The bwFLA – Func-tional Long-Term Access project develops automated workflows for object in-gest and access using emulation of original software environments. However,emulation of obsolete software environments is usually a non trivial task, be-cause it requires good knowledge on setup and preparation of the aforemen-tioned environments, e.g. operating systems/old software as well as detailedknowledge on emulators. Since emulation in digital preservation is becominga mainstream activity in archives and libraries, the demand for ready-made andeasy-to-use emulation services is growing. In order to provide a large varietyof user-friendly emulation services, especially in combination with authenticperformance and user-experience, a distributed system model and architectureis required, suitable to run on a heterogeneous Grid or Cluster infrastructure.In this article we develop requirements and a system model for emulation-as-a-service, suitable for a distributed environment thus encouraging the division oflabor. The design and architecture are discussed based on a real-life use-caseexample.
1 Introduction
Digital preservation (DP) is a rather new field of research in computer,archival and library sciences, addressing the problem of how to maintainaccess to data over long periods of time. Migration and emulation are
possible solution strategies to that problem [Thibodeau2002]. While mi-gration adapts digital artifacts to the actual digital working environments,emulation does not alter the object but re-enacts its original software andhardware environment. Emulation is a key strategy in DP for ensuring thatdigital objects can be rendered in their native environments and thus main-tain their original ”look” and ”feel” [Verdegem2006], [vSuchodoletz2010],[Guttenbrunner2010] as in most cases the applications or operating systemsdeveloped by the format vendors or software producers are the best candi-dates for handling a specific object of a certain type [Rothenberg1995].
Besides rendering of digital content, emulation can also be used to per-form format migration using the content’s original creation environment.Previous work demonstrated the feasibility of migration services using theapproach of interacting automatically with the original interactive basedsoftware environments [Rechert2009].
However, some important requirements should be taken into accountwhen dealing with emulation. The additional emulation layer requires sig-nificant CPU time and main memory. Furthermore, specialized knowledgeon the preparation of digital content and its environment is also important.The same applies for the preparation and maintenance of the emulatorsused. Thus, to lower the barriers in using emulation services and help inthe solution of a number of technical, legal and privacy issues of the arti-facts and the original environments, a separation of the actual service andthe user interface is desirable.
Hence, in order to provide a cost-efficient and scalable emulation ser-vice model, a large scale computing backend (e.g. Grid or Cluster) pairedwith a service model recently developed as so-called Cloud Software-as-a-Service (SaaS) model [Vaquero2009] could be used. The paper furtherfocuses on the above points in more detail and is structured as follows.After briefly discussing the concept of emulation in digital preservation weintroduce a novel service-model for emulation. Further, we discuss the gen-eral structure and functional requirements for central technical componentslike an abstract emulation module. The general design focuses creating in-dependent modules, which can be deployed and run as atomic units withina network cluster. Based on the proposed design we present a real world
104 Isgandar Valizada, et al.
use-case leveraging emulation as a format migration tool. Finally, openquestions concerning preservation planning, policies and administration areaddressed.
2 Emulation SaaS
As emulation services compiled from a wide variety of software compo-nents and workflows are often too complex to be handled by an averageuser who simply wants to render a certain artifact, remote access to a clus-ter or cloud SaaS could provide a solution. Ideally, instead of installing ahuge number of software packages which are difficult to maintain even for asmall number of platforms, the user should simply be able to install a singleor mobile application to access today’s and future services abstracting fromand translating the actual capabilities of the chosen remote platform. Thiscould therefore lead to a solution which allows access to a 1985 home com-puter, a game running on an Atari ST emulator, access to mid-2000 Linux,Windows or Solaris desktops, access to Nintendo Wii and some modern 3Dgames just through the same application representing a front-end interfaceto the emulation services. Specifically, this application has also to adapt todifferent input/output methods.
Remote access to emulation (services) has been discussed and researchedfor a while [Rechert2009]. Although more and more devices became mo-bile, they are still not powerful enough when compared to the advances inthe area of desktop computers over the last 25 years for example. They areusually limited by battery technology and requirements concerning dimen-sions. Tablet devices and smart phones thus do not fancy the desktop CPU,RAM and hard disk capacity and typically run different operating systemsthan their big counterparts. Nevertheless, more and more people like toaccess today’s and past systems via their mobile devices.
Remote access to virtual machines and emulation can significantly helpto separate content from the user accessing it. This concept is not new butoften deployed in business environments using restricted terminal services.The corresponding architecture simply hides the complexity of the originalenvironments and their components using the controlled environment ofthe service provider. Thus, no intellectual properties, bound software com-
Requirements and Design of Scalable Emulation Services 105
ponents and artifacts should be required to be transferred to the user side.The artifacts bitstream, including network traffic of distributed applications,never leave the cluster or cloud environment and only the renderings aretransfered. The components required in order to reproduce an original orsome compatible environment for the artifact do not need to be shipped andinstalled on the users’ systems thus avoiding the related challenges. Forinstance, the KEEP emulation framework [Lohman2011] demonstrates thelegal and technical challenges faced, when the original environment needsto get deployed on the user’s machine.
3 Scalable and Distributed Services for DP
Distributed services for digital preservation were at the core of the PLAN-ETS project [Farquhar2007] which introduced the ”Interoperability Frame-work” [King2009] as a Web service based architecture for the creation andexecution of complex distributed DP workflows. Thanks to this, com-plex preservation scenarios and specialization of cooperating institutionsbecame possible. bwFLA, a joint project of universities, state-libraries andstate-archives, adopts these ideas and defines processes and workflows foringestion of and access to complex digital objects.
Using scalable architectures is a rather new phenomenon within the DPresearch community [Strodl2011], [King2011]. However, motivated bythe rising number and complexity of digital objects, the development ofscalable DP services received additional attention. This set of problemis tackled, for instance, by the SCAPE project1 which develops scalableservices for the planning and execution of preservation actions. The goalis the development of an open source framework capable of orchestrat-ing semi-automated workflows for large-scale, heterogeneous collectionsof different types of digital artifacts, e.g. for non-uniform media objects[Schmidt2011].
In order to provide scalable emulation services, deployable in a Grid orCluster environments, specific DP requirements and use-cases need to beadopted for a distributed environment. Furthermore, a service-model is
1 Scalable Preservation Environments, http://www.scape-project.eu/.
106 Isgandar Valizada, et al.
required to integrate these services into exiting frameworks and make themaccessible to a large audience.
3.1 Emulation: A Functional Approach to Digital Preservation
The concept of emulation is not new to computer science. Emulators haveexisted for quite some time. Therefore, the list the available emulatorsis long and covers a fairly wide range of areas. Prominent examples forhardware emulation provided by the open source community are projectslike QEMU 2, Dioscuri 3, MESS 4 or MAME 5 [vdHoeven2008].
Generally, hardware emulation represents a software implementation ofCPU functionality combined with a complete system architecture. E.g.it can include a reimplementation of common hardware components of agiven obsolete computer system thus providing the broadest approach toemulation. Consequently, neither applications nor operating systems needto be rewritten in order to remain accessible in the future. By concentratingon the emulation of ancient computer architectures and the configuration ofobsolete operating systems running on them, emulation could significantlyreduce the future preservation action tasks, because the number of the ar-chitectures and systems altogether is quite small compared to the numberof applications and digital object types/formats currently in use (cf. Fig. 1).
These special properties of an emulation approach could therefore serveas a motivation for having a distributed service model for DP. However, inorder to run emulation in a distributed environment and to provide ready-made, easy-to-use emulation services, two additional design aspects needto be addressed:
• Independent atomic modules need to be developed, which are re-sponsible for running emulation sessions. When running the mod-ules in parallel, shared resources are to be managed and coordinated(if there are any). These might include, for example, the allocated
2 QEMU Open Source Processor Emulator, http://qemu.org/.3 Dioscuri – The Modular Emulator, http://dioscuri.sourceforge.net/.4 Multi Emulator Super System, http://mess.org/.5 Multiple Arcade Machine Emulator, http://mamedev.org/.
Requirements and Design of Scalable Emulation Services 107
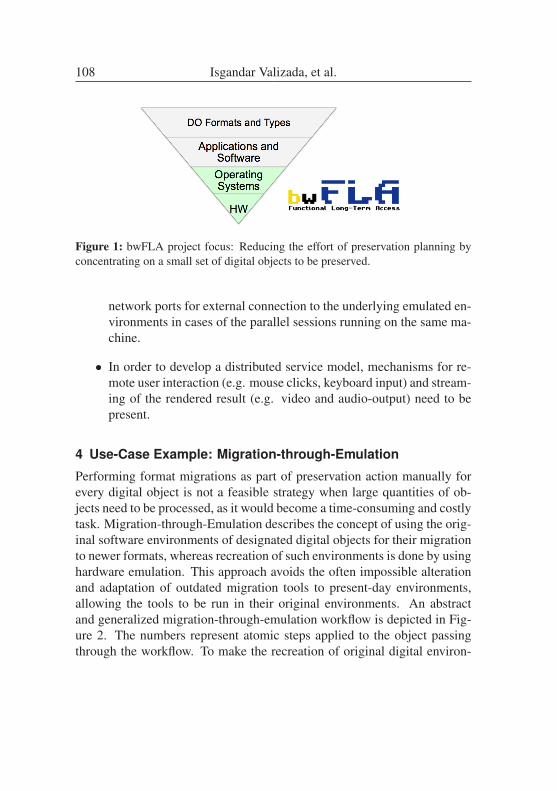
Figure 1: bwFLA project focus: Reducing the effort of preservation planning byconcentrating on a small set of digital objects to be preserved.
network ports for external connection to the underlying emulated en-vironments in cases of the parallel sessions running on the same ma-chine.
• In order to develop a distributed service model, mechanisms for re-mote user interaction (e.g. mouse clicks, keyboard input) and stream-ing of the rendered result (e.g. video and audio-output) need to bepresent.
4 Use-Case Example: Migration-through-Emulation
Performing format migrations as part of preservation action manually forevery digital object is not a feasible strategy when large quantities of ob-jects need to be processed, as it would become a time-consuming and costlytask. Migration-through-Emulation describes the concept of using the orig-inal software environments of designated digital objects for their migrationto newer formats, whereas recreation of such environments is done by usinghardware emulation. This approach avoids the often impossible alterationand adaptation of outdated migration tools to present-day environments,allowing the tools to be run in their original environments. An abstractand generalized migration-through-emulation workflow is depicted in Fig-ure 2. The numbers represent atomic steps applied to the object passingthrough the workflow. To make the recreation of original digital environ-
108 Isgandar Valizada, et al.
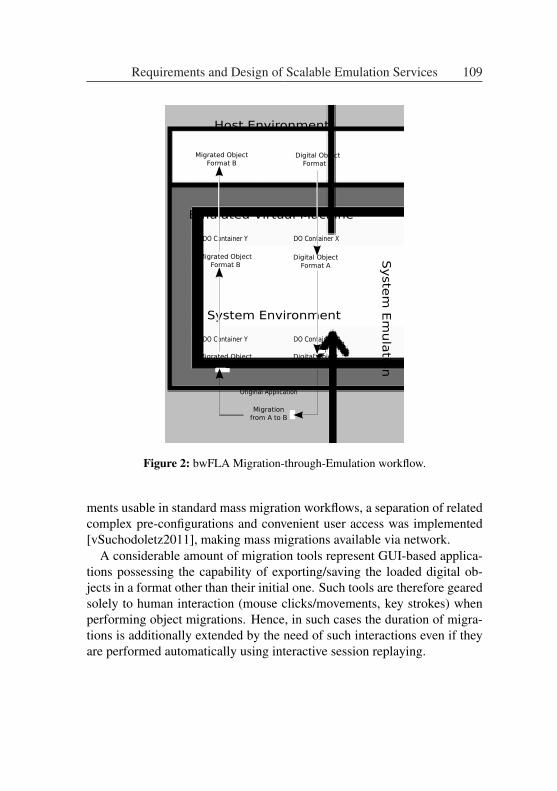
Host Environment
Emulated Virtual Machine
System Environment
Syste
m E
mu
latio
n
Migrated ObjectFormat B
Original Application
DO Container Y
Migrationfrom A to B
DO Container Y DO Container X
DO Container X
Migrated ObjectFormat B
Migrated ObjectFormat B
Digital ObjectFormat A
Digital ObjectFormat A
Digital ObjectFormat A
Figure 2: bwFLA Migration-through-Emulation workflow.
ments usable in standard mass migration workflows, a separation of relatedcomplex pre-configurations and convenient user access was implemented[vSuchodoletz2011], making mass migrations available via network.
A considerable amount of migration tools represent GUI-based applica-tions possessing the capability of exporting/saving the loaded digital ob-jects in a format other than their initial one. Such tools are therefore gearedsolely to human interaction (mouse clicks/movements, key strokes) whenperforming object migrations. Hence, in such cases the duration of migra-tions is additionally extended by the need of such interactions even if theyare performed automatically using interactive session replaying.
Requirements and Design of Scalable Emulation Services 109
Therefore, scaling up to thousands or even millions of objects of the sametype, the total runtime of a linear single migration session handling all theseobjects might last a considerable amount of time. For such cases it wouldmake sense to massively parallelize the involved workflows and use Clus-ter or Grid infrastructures. In order to run migration-through-emulationworkflows the required software and hardware dependencies have to beresolved for the designated object. This can be formalized by using theconcept of viewpaths (VP) [vdHoeven2009]. A viewpath describes thecomplete software and hardware stack required for the object (e.g. appli-cations, drivers, operating systems, hardware devices). In a second step aVP needs to be instantiated, i.e. a running instance of the correspondingenvironment needs to be created using a suitable hardware emulator andthe installable/runnable software dependencies of the object.
5 Software Design
The architecture of an emulation module providing the above-mentionedremote emulation services should be directed towards easy extendibilityallowing the wrapping of a given emulator functionality with minimal pro-gramming efforts.
Since most of the emulators are command line based applications, theirinvocation differs mostly in the formation of respective command line pa-rameters. This implies that the major functionality of a specific emulationmodule stays the same regardless of the emulator used. However, the casesin which a given emulator application also supports a run-time communica-tion with a calling side in order to, for example, change a removable deviceshould be considered separately.
Generally, an emulation module should support the capabilities that al-low the user to initiate/terminate the emulation session, attach/detach agiven container and obtain connection information allowing the interactivecontrol of the emulated environment. Any other capabilities are not to beexcluded during the design phase but should not be considered as substan-tial when considering the task of object rendering or migration.
Another important consideration is that the emulation module shouldavoid possessing the knowledge of any kind of viewpath schemes. The
110 Isgandar Valizada, et al.
motivation behind such a design is that a slight change in the represen-tation/understanding of what a viewpath is would result in the re-imple-mentation of emulation module functionality. The design of the emulationmodule isolated from such knowledge on the other hand would increase themodularity of a preservation system allowing the calling side to performonly atomic, emulation related operations.
Object Transport Containers The transportation of data to/from theemulated environment is a crucial capability that the emulation modulemust possess in order to support object rendering and/or migration[vSuchodoletz2010]. This is due to a fact that the installable dependencyobjects contained in the VP of a given object must be first injected into theoperating system from the host system of the emulation module in order toallow for the formation of the object’s native environment. Additionally, incase of migration, the resulting migrated object must be extracted from theemulated environment.
There are two main possibilities for such data exchange: via storage me-dia devices and transportation via network interfaces. The first case rep-resents an interesting possibility but is limited in its practical applicationsince it requires rather complex network related configurations both insideand outside of the emulated environment, which are hard to be automatedin a feasible way.
The second case is handled by the usage of so-called “containers”. Con-tainers are data files internally structured according to a given storage mediumthey represent. An example could be a 1.44 MByte sized binary file format-ted according to FAT16 file system, in which case such a file would repre-sent a virtual floppy disk. Usually, emulators provide a convenient wayfor attaching such virtual device files simply using a pair of command lineparameters.
Containers can be of different media type, file system format and capac-ity. Generally, three main operations should be supported for any container,namely: container creation, data injection and data extraction. In practice,however data extraction features can not always be provided in a feasibleway. E.g. extraction from optical devices like ISO CD-ROM disks would
Requirements and Design of Scalable Emulation Services 111
require an extra software layer in the guest system in order to allow datawriting.
Remote Access to Emulation The possibility of direct user control ofthe emulated environment is another important requirement for the emula-tion module as certain manual interactions might be necessary for objectrendering/migration in each specific case. Some existing emulators likeQEMU already have this requirement fulfilled, enabling run-time access tothe virtual screen and input devices.
6 Conclusion and OutlookUsage of emulation in DP is unavoidable when it comes to ensuring theoriginal “look & feel” of a digital object in its native environment. A clus-ter or cloud operation model allows to separate the artifact and its environ-ment from the actual rendering the user will experience. This requires aconvenient interface to the various emulators and virtual machines, whichshould optimally conform to a common standard. Providing emulation asa public service with a convenient user interface would allow even unex-perienced users to get hands-on practice on emulation techniques in DP,bringing more attention and further contributions to it.
Complex setups might be required, for example, in cases of networkedcomputer games or linked business processes. The network applications,like online games or content management systems consisting of a single ormultiple servers and (many) clients connecting to these servers can run ina controlled manner and be shielded from the outside world environment.This would even allow to create and maintain certain states of a given busi-ness process, database or game, e.g. before or after some “major event”.
With the ever-changing technology in IT the adaptation of emulators toevery new platform and device hitting the market can be avoided. Theuser would just need a generic remote access client made available for awide range of different architectures. This would allow memory and othercontent holding institutions to offer remote access to their artifacts moreeasily, independently of them being early years computer games, a widerange of outdated operating systems or other platforms like game consoles.
112 Isgandar Valizada, et al.
Furthermore, other hand a cloud SaaS could also help to solve the challengeof providing access to copyrighted material without releasing it to the user,making the implementation of privacy policies much easier.
Additionally, a service based model through a predefined API would al-low programmatic incorporation of emulation within more sophisticatedcustom preservation workflows thus making it possible to integrate theseservices in other digital preservation related projects.
However, more practical experiments are required in order to identifymain challenges in deploying emulation in a distributed environment likeGrid or Cluster. The presented ideas are work in progress and will be testedand refined throughout the bwFLA project.
Bibliography[Farquhar2007] Adam Farquhar and Helen Hockx-Yu. Planets: Integrated
services for digital preservation. International Journal ofDigital Curation, 2(2), 2007.
[Guttenbrunner2010] Mark Guttenbrunner, Christoph Becker, and An-dreas Rauber. Keeping the game alive: Evaluating strategiesfor the preservation of console video games. InternationalJournal of Digital Curation, 5(1), 2010.
[King2009] Ross King, Rainer Schmidt, Andrew N. Jackson, Carl Wil-son, and Fabian Steeg. The planets interoperability frame-work. In Proceedings of the 13th European Conference onDigital Libraries (ECDL09), pages 425–428, 2009.
[King2011] Ross King, Orit Edelstein, Michael Factor, Thomas Risse,Eliot Salant, and Philip Taylor. Evolving domains, prob-lems and solutions for long term digital preservation. InProceedings of the 8th International Conference on Preser-vation of Digital Objects (iPRES2011), pages 194–204,2011.
[Lohman2011] Bram Lohman, Bart Kiers, David Michel, and Jeffreyvan der Hoeven. Emulation as a business solution: The
Requirements and Design of Scalable Emulation Services 113
emulation framework. In 8th International Conference onPreservation of Digital Objects (iPRES2011), pages 425–428. National Library Board Singapore and Nanyang Tech-nology University, 2011.
[Rechert2009] Klaus Rechert, Dirk von Suchodoletz, Randolph Welte,Maurice van den Dobbelsteen, Bill Roberts, Jeffrey van derHoeven, and Jasper Schroder. Novel workflows for ab-stract handling of complex interaction processes in digitalpreservation. In Proceedings of the 6th International Con-ference on Preservation of Digital Objects (iPRES2009),pages 155–161, 2009.
[Rothenberg1995] Jeff Rothenberg. Ensuring the longevity of digital in-formation. Scientific American, 272(1):42–47, 1995.
[Schmidt2011] Rainer Schmidt and Matthias Rella. An approachfor processing large and non-uniform media objects onmapreduce-based clusters. In Lecture Notes in ComputerScience, volume 7008/2011, pages 172–181, 2011.
[Strodl2011] Stephan Strodl, Petar Petrov, and Andreas Rauber. Researchon digital preservation within projects co-funded by the eu-ropean union in the ict programme, 2011.
[Thibodeau2002] Kenneth Thibodeau. Overview of technological ap-proaches to digital preservation and challenges in comingyears. In The State of Digital Preservation: An Interna-tional Perspective, Conference Proceedings, pages 4–31,1755 Massachusetts Avenue, NW, Suite 500, 2002. Councilon Library and Information Resources.
[Vaquero2009] Luis M. Vaquero, Luis Rodero-Merino, Juan Caceres, andMaik Lindner. A break in the clouds: towards a cloud def-inition. ACM SIGCOMM Computer Communication Re-view, 39, January 2009.
114 Isgandar Valizada, et al.
[Verdegem2006] Remco Verdegem and Jeffrey van der Hoeven. Emula-tion: To be or not to be. In IS&T Conference on Archiving2006, Ottawa, Canada, May 23-26, pages 55–60, 2006.
[vSuchodoletz2010] Dirk von Suchodoletz, Klaus Rechert, Jeffrey van derHoeven, and Jasper Schroder. Seven Steps for ReliableEmulation Strategies – Solved Problems and Open Issues.In 7th International Conference on Preservation of DigitalObjects (iPRES2010), volume 262, pages 373–381. Aus-trian Computer Society, 2010.
[vSuchodoletz2011] Dirk von Suchodoletz, Klaus Rechert, and IsgandarValizada. Remote emulation for migration services in a dis-tributed preservation framework. In Proceedings of the 8thInternational Conference on Preservation of Digital Ob-jects (iPRES2011), pages 158–166, 2011.
[vdHoeven2008] Jeffrey van der Hoeven and Dirk von Suchodoletz. Em-ulation: From digital artefact to remotely rendered environ-ments. In Proceedings of the Fifth International Conferenceon Preservation of Digital Objects (iPRES2008), pages 93–98, The British Library, St. Pancras, London, 2008. TheBritish Library.
[vdHoeven2009] Jeffrey van der Hoeven and Dirk von Suchodoletz. Em-ulation: From digital artefact to remotely rendered envi-ronments. International Journal of Digital Curation, 4(3),2009.
AcknowledgmentsThe work presented in this publication is a part of the bwFLA project 6
sponsored by the federal state of Baden-Württemberg, Germany.
6 bwFLA – Functional Long-Term Access, http://bw-fla.uni-freiburg.de/.
Requirements and Design of Scalable Emulation Services 115

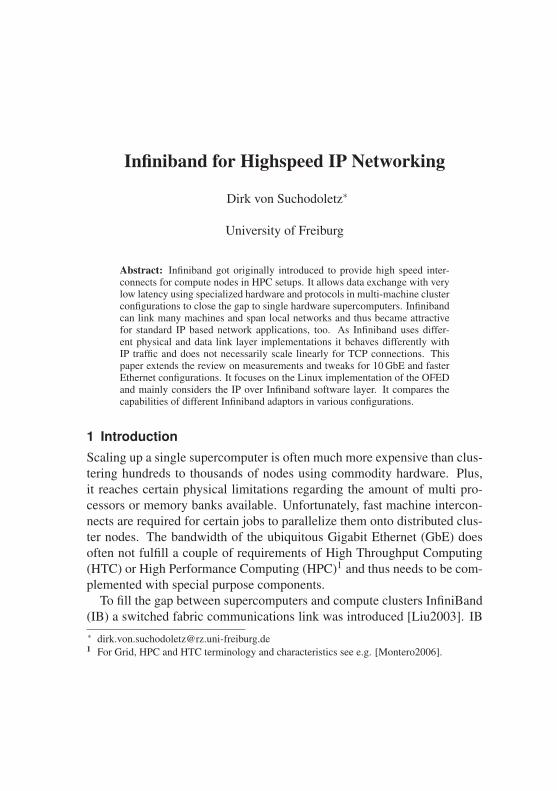
Infiniband for Highspeed IP Networking
Dirk von Suchodoletz∗
University of Freiburg
Abstract: Infiniband got originally introduced to provide high speed inter-connects for compute nodes in HPC setups. It allows data exchange with verylow latency using specialized hardware and protocols in multi-machine clusterconfigurations to close the gap to single hardware supercomputers. Infinibandcan link many machines and span local networks and thus became attractivefor standard IP based network applications, too. As Infiniband uses differ-ent physical and data link layer implementations it behaves differently withIP traffic and does not necessarily scale linearly for TCP connections. Thispaper extends the review on measurements and tweaks for 10 GbE and fasterEthernet configurations. It focuses on the Linux implementation of the OFEDand mainly considers the IP over Infiniband software layer. It compares thecapabilities of different Infiniband adaptors in various configurations.
1 IntroductionScaling up a single supercomputer is often much more expensive than clus-tering hundreds to thousands of nodes using commodity hardware. Plus,it reaches certain physical limitations regarding the amount of multi pro-cessors or memory banks available. Unfortunately, fast machine intercon-nects are required for certain jobs to parallelize them onto distributed clus-ter nodes. The bandwidth of the ubiquitous Gigabit Ethernet (GbE) doesoften not fulfill a couple of requirements of High Throughput Computing(HTC) or High Performance Computing (HPC)1 and thus needs to be com-plemented with special purpose components.
To fill the gap between supercomputers and compute clusters InfiniBand(IB) a switched fabric communications link was introduced [Liu2003]. IB∗ [email protected] For Grid, HPC and HTC terminology and characteristics see e.g. [Montero2006].
features serial, bi-directional point-to-point connections between CPUs andfor enterprise storage applications to highspeed peripherals like disks. IB isa scalable architecture and its design focuses on characteristics like low la-tency, throughput, quality of service and failover. The primary installationsof the bwGRiD feature local DDR IB interconnects [Dynowski2012] andcan be used to run specifically configured compute jobs. Nevertheless, itcould be attractive to re-use this high performance infrastructure to providetraditional IP services like network filesystems over it.
This paper extends upon the Benefits and Limitations of Highspeed Ma-chine Interconnects and concentrates mainly on the IP over InfiniBand(IPoIB) implementation [RFC4391, RFC4392]. Thus, it builds upon andmainly uses the same experiment setups as described there. The figuresproduced from the various experiments should not be interpreted in abso-lute terms but are to be read to compare a number of setups side-by-side.They can help to get an idea which measures need to be taken to optimizethe throughput for a given scenario.
The remainder of this paper is structured as follows: The next sectionpresents an overview on the IB standard and the hardware deployed in thedifferent setups of IP over InfiniBand. After having established the foun-dation, the different experiments and optimizations are discussed in moredepth, comparing the InfiniBand setups with each other. Finally, a con-clusion on IB deployment scenarios is given and it will be stated whichchallenges will have to be faced.
2 InfiniBand Interconnects
InfiniBand was originally developed to link highspeed compute node inter-connects in High Throughput Compute (HTC) clusters. To avoid overheadand reduce latency special protocols were introduced to copy data from thememory of connected nodes. As IB forms a low range network it was seenas an attractive addition to have IP traffic available on top of it. This opensup the opportunity to run a plethora of well established protocols for differ-ent network applications. As IB is still more expensive than most 10 Gbit/scomponents it is not expected to replace mainline HTC IP interconnectsthough.
118 Dirk von Suchodoletz
2.1 Software Stack
The InfiniBand specification does not define a standard programming API.This task is left to vendors, who agreed upon a de-facto standard which ismaintained by the OpenFabrics Alliance. The stack developed for FreeBSD,GNU/Linux, and MS Windows is released as “OpenFabrics Enterprise Dis-tribution (OFED)” [OFED2012]. The OFED2 provides tools and softwarefor several layers, starting e.g. with the mstflint utility for updating thefirmware of Mellanox adaptors, the kernel modules for the different adap-tors and the software IPoIB layer, up to programs like ibstatus to checkthe link status of the installed IB cards up to the Open Subnet Manageropensm. The Intel MPI Benchmark (IMB) suite is contained as well.
Distributions like RHEL 5.5 or 6.2 already contain the relevant Infini-Band adaptor kernel drivers. They are typically of older versions than thedrivers shipped with the latest OFED.
3 Experimental Setup
For the InfiniBand experiments two different sets of cluster equipment weredeployed: Dual-CPU configurations of DELL PowerEdge M610 and 710.While the M610 is a blade unit in a M1000e enclosure hosting up to 16computers, the 710 is a two height unit server machine. Both machine typescan host up to two Intel XEON CPUs. The machines were configured with24 GByte of RAM. The measurements were taken on idle machines and atleast repeated ten times. The IB network was separated or simply a one-to-one connection between two host adaptors. To check that there were nospecific influences during measurements each experiment was repeated atleast two times on another day to see if the results were in line with thefigures from the first run.
The IB network bandwidth and the capacity of the IO subsystem needs tobe balanced, as IB connections are specified for data rates up to 25.8 Gbit/sper lane. The setup of the blade units was fixed with Mellanox Technolo-gies MT26428 QDR dual-port cards. The first port of each adaptor was
2 See the OpenFabrics Alliance homepage https://www.openfabrics.org and the com-ments in [Carter2007, Auernhammer2007].
Infiniband for Highspeed IP Networking 119
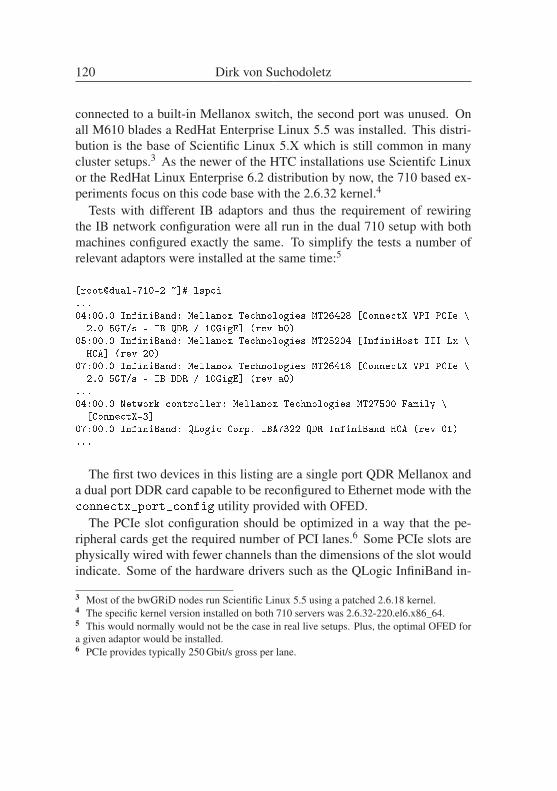
connected to a built-in Mellanox switch, the second port was unused. Onall M610 blades a RedHat Enterprise Linux 5.5 was installed. This distri-bution is the base of Scientific Linux 5.X which is still common in manycluster setups.3 As the newer of the HTC installations use Scientifc Linuxor the RedHat Linux Enterprise 6.2 distribution by now, the 710 based ex-periments focus on this code base with the 2.6.32 kernel.4
Tests with different IB adaptors and thus the requirement of rewiringthe IB network configuration were all run in the dual 710 setup with bothmachines configured exactly the same. To simplify the tests a number ofrelevant adaptors were installed at the same time:5
[root@dual-710-2 ~]# lspci
...
04:00.0 InfiniBand: Mellanox Technologies MT26428 [ConnectX VPI PCIe \
2.0 5GT/s - IB QDR / 10GigE] (rev b0)
05:00.0 InfiniBand: Mellanox Technologies MT25204 [InfiniHost III Lx \
HCA] (rev 20)
07:00.0 InfiniBand: Mellanox Technologies MT26418 [ConnectX VPI PCIe \
2.0 5GT/s - IB DDR / 10GigE] (rev a0)
...
04:00.0 Network controller: Mellanox Technologies MT27500 Family \
[ConnectX-3]
07:00.0 InfiniBand: QLogic Corp. IBA7322 QDR InfiniBand HCA (rev 01)
...
The first two devices in this listing are a single port QDR Mellanox anda dual port DDR card capable to be reconfigured to Ethernet mode with theconnectx_port_config utility provided with OFED.
The PCIe slot configuration should be optimized in a way that the pe-ripheral cards get the required number of PCI lanes.6 Some PCIe slots arephysically wired with fewer channels than the dimensions of the slot wouldindicate. Some of the hardware drivers such as the QLogic InfiniBand in-
3 Most of the bwGRiD nodes run Scientific Linux 5.5 using a patched 2.6.18 kernel.4 The specific kernel version installed on both 710 servers was 2.6.32-220.el6.x86_64.5 This would normally would not be the case in real live setups. Plus, the optimal OFED fora given adaptor would be installed.6 PCIe provides typically 250 Gbit/s gross per lane.
120 Dirk von Suchodoletz
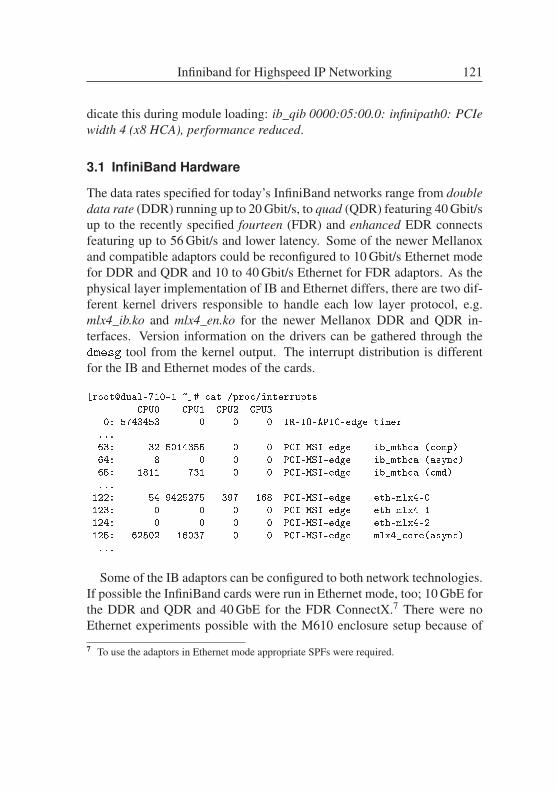
dicate this during module loading: ib_qib 0000:05:00.0: infinipath0: PCIewidth 4 (x8 HCA), performance reduced.
3.1 InfiniBand Hardware
The data rates specified for today’s InfiniBand networks range from doubledata rate (DDR) running up to 20 Gbit/s, to quad (QDR) featuring 40 Gbit/sup to the recently specified fourteen (FDR) and enhanced EDR connectsfeaturing up to 56 Gbit/s and lower latency. Some of the newer Mellanoxand compatible adaptors could be reconfigured to 10 Gbit/s Ethernet modefor DDR and QDR and 10 to 40 Gbit/s Ethernet for FDR adaptors. As thephysical layer implementation of IB and Ethernet differs, there are two dif-ferent kernel drivers responsible to handle each low layer protocol, e.g.mlx4_ib.ko and mlx4_en.ko for the newer Mellanox DDR and QDR in-terfaces. Version information on the drivers can be gathered through thedmesg tool from the kernel output. The interrupt distribution is differentfor the IB and Ethernet modes of the cards.
[root@dual-710-1 ~]# cat /proc/interrupts
CPU0 CPU1 CPU2 CPU3
0: 5743453 0 0 0 IR-IO-APIC-edge timer
...
63: 32 5014355 0 0 PCI-MSI-edge ib_mthca (comp)
64: 8 0 0 0 PCI-MSI-edge ib_mthca (async)
65: 1811 731 0 0 PCI-MSI-edge ib_mthca (cmd)
...
122: 54 9425275 397 168 PCI-MSI-edge eth-mlx4-0
123: 0 0 0 0 PCI-MSI-edge eth-mlx4-1
124: 0 0 0 0 PCI-MSI-edge eth-mlx4-2
125: 62502 16037 0 0 PCI-MSI-edge mlx4_core(async)
...
Some of the IB adaptors can be configured to both network technologies.If possible the InfiniBand cards were run in Ethernet mode, too; 10 GbE forthe DDR and QDR and 40 GbE for the FDR ConnectX.7 There were noEthernet experiments possible with the M610 enclosure setup because of
7 To use the adaptors in Ethernet mode appropriate SPFs were required.
Infiniband for Highspeed IP Networking 121
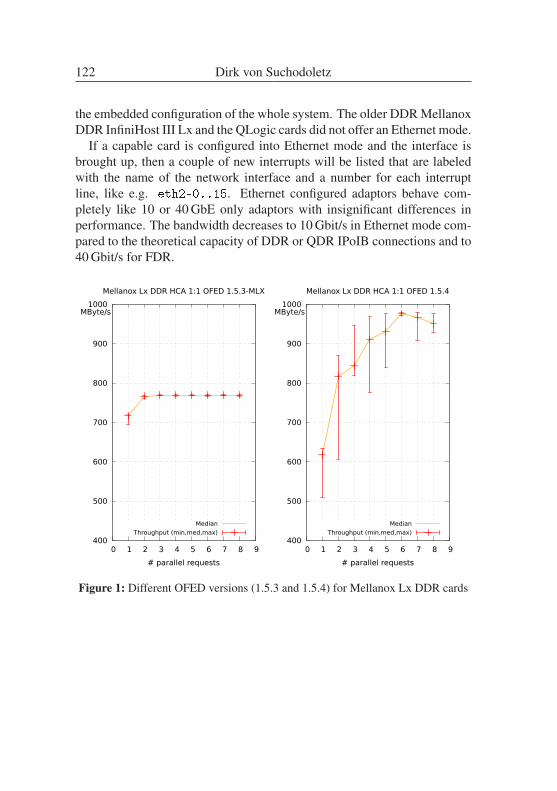
the embedded configuration of the whole system. The older DDR MellanoxDDR InfiniHost III Lx and the QLogic cards did not offer an Ethernet mode.
If a capable card is configured into Ethernet mode and the interface isbrought up, then a couple of new interrupts will be listed that are labeledwith the name of the network interface and a number for each interruptline, like e.g. eth2-0..15. Ethernet configured adaptors behave com-pletely like 10 or 40 GbE only adaptors with insignificant differences inperformance. The bandwidth decreases to 10 Gbit/s in Ethernet mode com-pared to the theoretical capacity of DDR or QDR IPoIB connections and to40 Gbit/s for FDR.
400
500
600
700
800
900
1000
0 1 2 3 4 5 6 7 8 9
MByte/s
# parallel requests
Mellanox Lx DDR HCA 1:1 OFED 1.5.3-MLX
MedianThroughput (min,med,max)
400
500
600
700
800
900
1000
0 1 2 3 4 5 6 7 8 9
MByte/s
# parallel requests
Mellanox Lx DDR HCA 1:1 OFED 1.5.4
MedianThroughput (min,med,max)
Figure 1: Different OFED versions (1.5.3 and 1.5.4) for Mellanox Lx DDR cards
122 Dirk von Suchodoletz
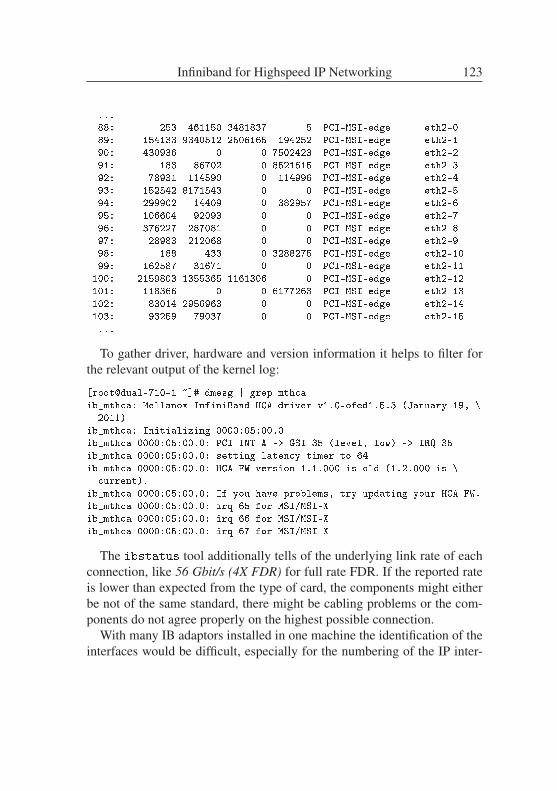
...
88: 253 461150 3481837 5 PCI-MSI-edge eth2-0
89: 154133 9340512 2506165 194252 PCI-MSI-edge eth2-1
90: 430936 0 0 7502423 PCI-MSI-edge eth2-2
91: 183 86702 0 8521615 PCI-MSI-edge eth2-3
92: 78931 114590 0 114996 PCI-MSI-edge eth2-4
93: 152542 8171543 0 0 PCI-MSI-edge eth2-5
94: 299902 14409 0 382957 PCI-MSI-edge eth2-6
95: 106604 92093 0 0 PCI-MSI-edge eth2-7
96: 376227 287081 0 0 PCI-MSI-edge eth2-8
97: 28983 212068 0 0 PCI-MSI-edge eth2-9
98: 188 433 0 3288275 PCI-MSI-edge eth2-10
99: 162587 31671 0 0 PCI-MSI-edge eth2-11
100: 2159803 1355365 1161306 0 PCI-MSI-edge eth2-12
101: 118366 0 0 6177263 PCI-MSI-edge eth2-13
102: 83014 2956963 0 0 PCI-MSI-edge eth2-14
103: 93259 79037 0 0 PCI-MSI-edge eth2-15
...
To gather driver, hardware and version information it helps to filter forthe relevant output of the kernel log:
[root@dual-710-1 ~]# dmesg | grep mthca
ib_mthca: Mellanox InfiniBand HCA driver v1.0-ofed1.5.3 (January 19, \
2011)
ib_mthca: Initializing 0000:05:00.0
ib_mthca 0000:05:00.0: PCI INT A -> GSI 35 (level, low) -> IRQ 35
ib_mthca 0000:05:00.0: setting latency timer to 64
ib_mthca 0000:05:00.0: HCA FW version 1.1.000 is old (1.2.000 is \
current).
ib_mthca 0000:05:00.0: If you have problems, try updating your HCA FW.
ib_mthca 0000:05:00.0: irq 65 for MSI/MSI-X
ib_mthca 0000:05:00.0: irq 66 for MSI/MSI-X
ib_mthca 0000:05:00.0: irq 67 for MSI/MSI-X
The ibstatus tool additionally tells of the underlying link rate of eachconnection, like 56 Gbit/s (4X FDR) for full rate FDR. If the reported rateis lower than expected from the type of card, the components might eitherbe not of the same standard, there might be cabling problems or the com-ponents do not agree properly on the highest possible connection.
With many IB adaptors installed in one machine the identification of theinterfaces would be difficult, especially for the numbering of the IP inter-
Infiniband for Highspeed IP Networking 123
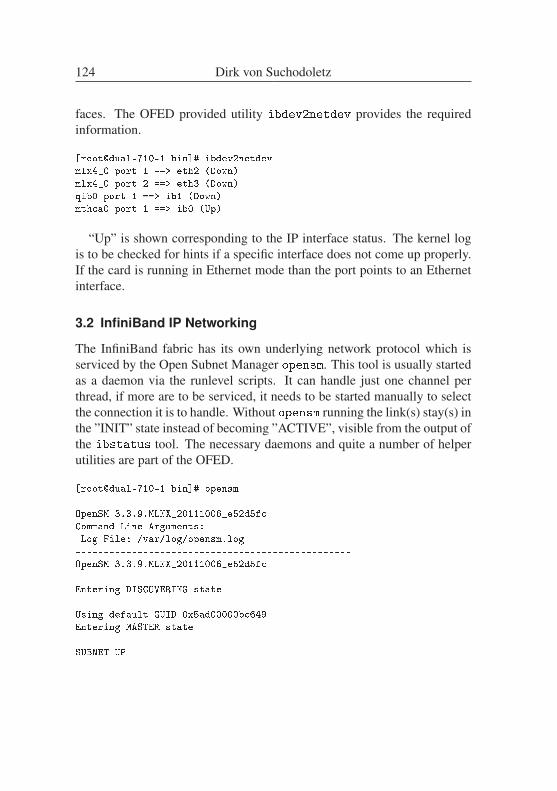
faces. The OFED provided utility ibdev2netdev provides the requiredinformation.
[root@dual-710-1 bin]# ibdev2netdev
mlx4_0 port 1 ==> eth2 (Down)
mlx4_0 port 2 ==> eth3 (Down)
qib0 port 1 ==> ib1 (Down)
mthca0 port 1 ==> ib0 (Up)
“Up” is shown corresponding to the IP interface status. The kernel logis to be checked for hints if a specific interface does not come up properly.If the card is running in Ethernet mode than the port points to an Ethernetinterface.
3.2 InfiniBand IP Networking
The InfiniBand fabric has its own underlying network protocol which isserviced by the Open Subnet Manager opensm. This tool is usually startedas a daemon via the runlevel scripts. It can handle just one channel perthread, if more are to be serviced, it needs to be started manually to selectthe connection it is to handle. Without opensm running the link(s) stay(s) inthe ”INIT” state instead of becoming ”ACTIVE”, visible from the output ofthe ibstatus tool. The necessary daemons and quite a number of helperutilities are part of the OFED.
[root@dual-710-1 bin]# opensm
-------------------------------------------------
OpenSM 3.3.9.MLNX_20111006_e52d5fc
Command Line Arguments:
Log File: /var/log/opensm.log
-------------------------------------------------
OpenSM 3.3.9.MLNX_20111006_e52d5fc
Entering DISCOVERING state
Using default GUID 0x5ad00000bc649
Entering MASTER state
SUBNET UP
124 Dirk von Suchodoletz
The characteristics of both network types, Ethernet and InfiniBand, dif-fer. While the Ethernet mode provides a functionality directly comparableto Ethernet adaptors, there is an added software network layer implement-ing IP over IB [RFC4391, RFC4392]. The IB protocol stack provides acomplementary protocol to ARP which maps to the IB low level addresses.Therefore, the low-level IB network configuration has to be run before anyIP connection can be configured.
With iperf run in single, double and quadruple streams, the resulting datatransfer rates on OFED 1.5.3 were 6.32 Gbit/s each time. The data transferrates achieved by the IMB and the tests run on IPoIB differ as expectedbecause of the different protocols.8 There were a couple of observationsfor IB networking:
• The kernel drivers and OFED version matter: Connectivity and trans-fer rates varied with different variants (Fig. 1, Fig. 3).9
• Especially interesting was the IPoIB behaviour of single thread trans-fers in some experiments ranging way below the expected figures, butscaling very well with parallel data streams up to nearly the resultsmeasured with the IMB on the same link. This seems to be related tothe several parallel physical links which seem not to get (very well)balanced with IPoIB.
• Ethernet, if available, and IB throughput differed for the same inter-face card as could be expected from the different data rate specifica-tions.
• The MTU setting plays a significant role: The usually cited MTU2044 [RFC4391, Bortolotti2011] significantly worsens the resultscompared to the device’s default setting of MTU 65520 (Fig. 5).
8 See e.g. [Hoefler2007] for additional experiments and figures. A study on QDR perfor-mance can be found in [Koop2008].9 In the experiments the Mellanox ConnectX DDR cards did not work with the OFED 1.5.4versions and the older Lx cards gained up to 20% more throughput with the 1.5.4 OFEDcompared to the version 1.5.3 shipped by Mellanox. The figures for the QDR and FDR cards,both using the same kernel driver, remained the same and fell slightly for the QLogic QDRcards. For further information check e.g. [Carter2007].
Infiniband for Highspeed IP Networking 125
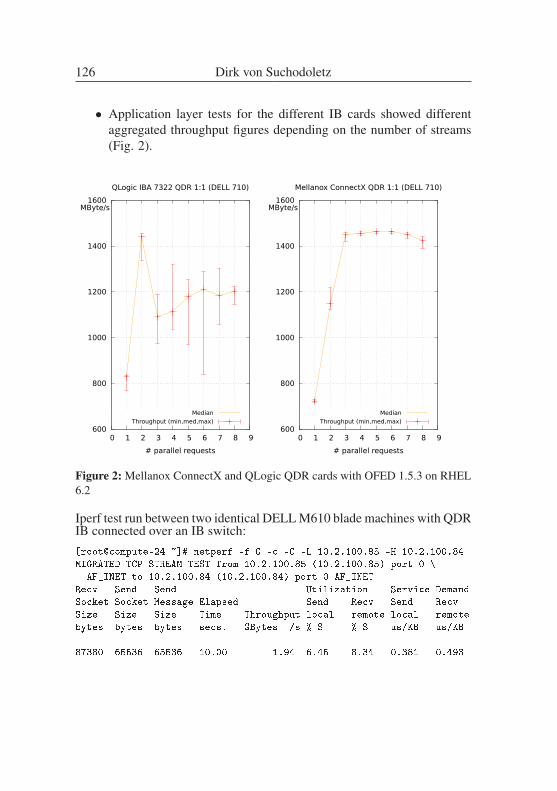
• Application layer tests for the different IB cards showed differentaggregated throughput figures depending on the number of streams(Fig. 2).
600
800
1000
1200
1400
1600
0 1 2 3 4 5 6 7 8 9
MByte/s
# parallel requests
QLogic IBA 7322 QDR 1:1 (DELL 710)
MedianThroughput (min,med,max)
600
800
1000
1200
1400
1600
0 1 2 3 4 5 6 7 8 9
MByte/s
# parallel requests
Mellanox ConnectX QDR 1:1 (DELL 710)
MedianThroughput (min,med,max)
Figure 2: Mellanox ConnectX and QLogic QDR cards with OFED 1.5.3 on RHEL6.2
Iperf test run between two identical DELL M610 blade machines with QDRIB connected over an IB switch:[root@compute-24 ~]# netperf -f G -c -C -L 10.2.100.85 -H 10.2.100.84
MIGRATED TCP STREAM TEST from 10.2.100.85 (10.2.100.85) port 0 \
AF_INET to 10.2.100.84 (10.2.100.84) port 0 AF_INET
Recv Send Send Utilization Service Demand
Socket Socket Message Elapsed Send Recv Send Recv
Size Size Size Time Throughput local remote local remote
bytes bytes bytes secs. GBytes /s % S % S us/KB us/KB
87380 65536 65536 10.00 1.94 6.45 8.34 0.381 0.493
126 Dirk von Suchodoletz
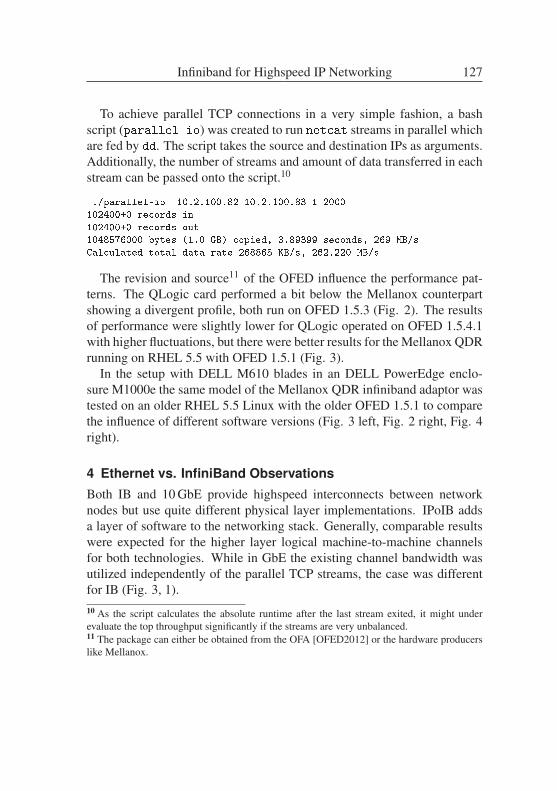
To achieve parallel TCP connections in a very simple fashion, a bashscript (parallel-io) was created to run netcat streams in parallel whichare fed by dd. The script takes the source and destination IPs as arguments.Additionally, the number of streams and amount of data transferred in eachstream can be passed onto the script.10
./parallel-io 10.2.100.82 10.2.100.83 1 2000
102400+0 records in
102400+0 records out
1048576000 bytes (1.0 GB) copied, 3.89399 seconds, 269 MB/s
Calculated total data rate 268865 KB/s, 262.220 MB/s
The revision and source11 of the OFED influence the performance pat-terns. The QLogic card performed a bit below the Mellanox counterpartshowing a divergent profile, both run on OFED 1.5.3 (Fig. 2). The resultsof performance were slightly lower for QLogic operated on OFED 1.5.4.1with higher fluctuations, but there were better results for the Mellanox QDRrunning on RHEL 5.5 with OFED 1.5.1 (Fig. 3).
In the setup with DELL M610 blades in an DELL PowerEdge enclo-sure M1000e the same model of the Mellanox QDR infiniband adaptor wastested on an older RHEL 5.5 Linux with the older OFED 1.5.1 to comparethe influence of different software versions (Fig. 3 left, Fig. 2 right, Fig. 4right).
4 Ethernet vs. InfiniBand ObservationsBoth IB and 10 GbE provide highspeed interconnects between networknodes but use quite different physical layer implementations. IPoIB addsa layer of software to the networking stack. Generally, comparable resultswere expected for the higher layer logical machine-to-machine channelsfor both technologies. While in GbE the existing channel bandwidth wasutilized independently of the parallel TCP streams, the case was differentfor IB (Fig. 3, 1).10 As the script calculates the absolute runtime after the last stream exited, it might underevaluate the top throughput significantly if the streams are very unbalanced.11 The package can either be obtained from the OFA [OFED2012] or the hardware producerslike Mellanox.
Infiniband for Highspeed IP Networking 127
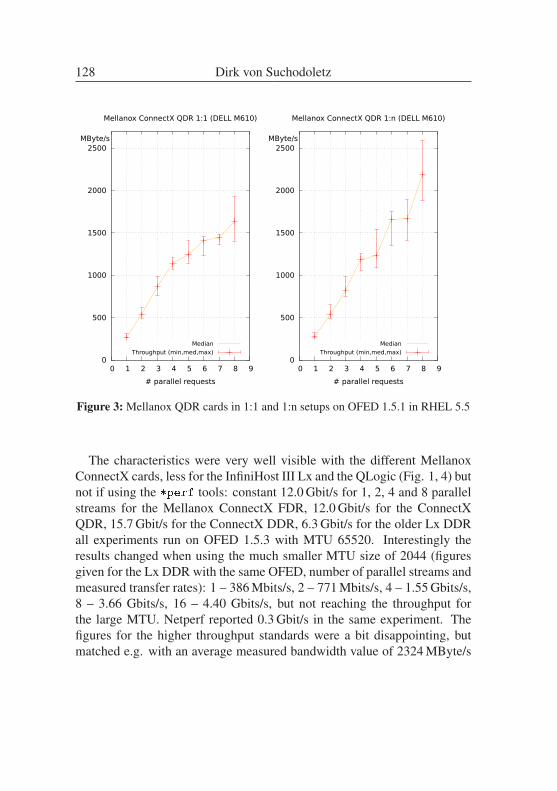
0
500
1000
1500
2000
2500
0 1 2 3 4 5 6 7 8 9
MByte/s
# parallel requests
Mellanox ConnectX QDR 1:1 (DELL M610)
MedianThroughput (min,med,max)
0
500
1000
1500
2000
2500
0 1 2 3 4 5 6 7 8 9
MByte/s
# parallel requests
Mellanox ConnectX QDR 1:n (DELL M610)
MedianThroughput (min,med,max)
Figure 3: Mellanox QDR cards in 1:1 and 1:n setups on OFED 1.5.1 in RHEL 5.5
The characteristics were very well visible with the different MellanoxConnectX cards, less for the InfiniHost III Lx and the QLogic (Fig. 1, 4) butnot if using the *perf tools: constant 12.0 Gbit/s for 1, 2, 4 and 8 parallelstreams for the Mellanox ConnectX FDR, 12.0 Gbit/s for the ConnectXQDR, 15.7 Gbit/s for the ConnectX DDR, 6.3 Gbit/s for the older Lx DDRall experiments run on OFED 1.5.3 with MTU 65520. Interestingly theresults changed when using the much smaller MTU size of 2044 (figuresgiven for the Lx DDR with the same OFED, number of parallel streams andmeasured transfer rates): 1 – 386 Mbits/s, 2 – 771 Mbits/s, 4 – 1.55 Gbits/s,8 – 3.66 Gbits/s, 16 – 4.40 Gbits/s, but not reaching the throughput forthe large MTU. Netperf reported 0.3 Gbit/s in the same experiment. Thefigures for the higher throughput standards were a bit disappointing, butmatched e.g. with an average measured bandwidth value of 2324 MByte/s
128 Dirk von Suchodoletz
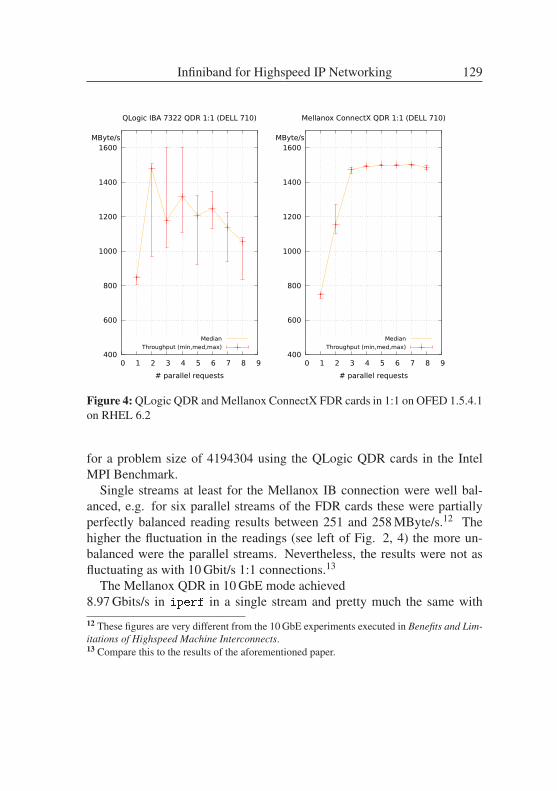
400
600
800
1000
1200
1400
1600
0 1 2 3 4 5 6 7 8 9
MByte/s
# parallel requests
QLogic IBA 7322 QDR 1:1 (DELL 710)
MedianThroughput (min,med,max)
400
600
800
1000
1200
1400
1600
0 1 2 3 4 5 6 7 8 9
MByte/s
# parallel requests
Mellanox ConnectX QDR 1:1 (DELL 710)
MedianThroughput (min,med,max)
Figure 4: QLogic QDR and Mellanox ConnectX FDR cards in 1:1 on OFED 1.5.4.1on RHEL 6.2
for a problem size of 4194304 using the QLogic QDR cards in the IntelMPI Benchmark.
Single streams at least for the Mellanox IB connection were well bal-anced, e.g. for six parallel streams of the FDR cards these were partiallyperfectly balanced reading results between 251 and 258 MByte/s.12 Thehigher the fluctuation in the readings (see left of Fig. 2, 4) the more un-balanced were the parallel streams. Nevertheless, the results were not asfluctuating as with 10 Gbit/s 1:1 connections.13
The Mellanox QDR in 10 GbE mode achieved8.97 Gbits/s in iperf in a single stream and pretty much the same with
12 These figures are very different from the 10 GbE experiments executed in Benefits and Lim-itations of Highspeed Machine Interconnects.13 Compare this to the results of the aforementioned paper.
Infiniband for Highspeed IP Networking 129
netperf. The figures for 2 and 4 parallel streams reached a median of9.30 Gbits/s with a minimum of 8.81 Gbit/s and a maximum of 9.36 Gbit/sfor six runs each.14 There exist more performance studies for UDP over IBand Gigabit-Ethernet by [Bortolotti2009] or for Java communication stacksby [Zhang2009].
5 Conclusion
InfiniBand configurations in compute clusters become more and more com-monplace. It makes sense to “re-use” them for IP based services like net-work filesystems as well and thus make the cluster nodes available for awider spectrum of different compute jobs. As they require an additionalinfrastructure and are still comparably expensive they will not necessarilymake the commonplace Ethernet obsolete if they are just considered forhigh performance IP interconnects.
Compared to the Ethernet world, the driver situation for IPoIB is morevolatile. Different OFEDs and hardware drivers produced varying resultsin the throughput experiments.15
The Mellanox Connect-X adaptors have an interesting feature for a fewscenarios as they allow to be configured to either IB or 10 GbE operationmode. The newer dual-port cards even allow to mix Ethernet and IB modes.This could be either helpful for space constrained machines offering notenough PCIe slots or to re-use outdated DDR adaptors after upgrades. Thelatter one requires rewiring of the setup as both technologies use a com-pletely different physical layer. Nevertheless, there is not much advantageif those adaptors are deployed in blade enclosures. Plus, compared to their10 Gbit/s Ethernet-only counterparts, there was no performance gain usingIB cards configured to the Ethernet physical layer.
Many of the experiments and tests were run in direct machine to machineconnections which are not likely to occur in real-life scenarios. They def-
14 Using a 10 GbE optical switch in between slightly reduced the numbers, but this could beexplained with a certain load from other traffic streams on the device.15 Including a non-functional IP link despite properly running IB connect. As the driversseem less mature then in the Ethernet domain, it is worth to check out different versions forthe actual hardware deployed as the performance gain could be significant.
130 Dirk von Suchodoletz
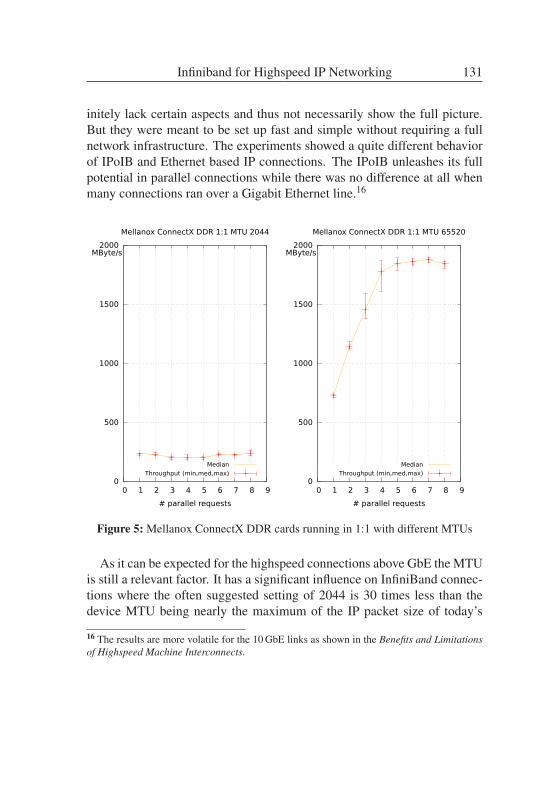
initely lack certain aspects and thus not necessarily show the full picture.But they were meant to be set up fast and simple without requiring a fullnetwork infrastructure. The experiments showed a quite different behaviorof IPoIB and Ethernet based IP connections. The IPoIB unleashes its fullpotential in parallel connections while there was no difference at all whenmany connections ran over a Gigabit Ethernet line.16
0
500
1000
1500
2000
0 1 2 3 4 5 6 7 8 9
MByte/s
# parallel requests
Mellanox ConnectX DDR 1:1 MTU 2044
MedianThroughput (min,med,max)
0
500
1000
1500
2000
0 1 2 3 4 5 6 7 8 9
MByte/s
# parallel requests
Mellanox ConnectX DDR 1:1 MTU 65520
MedianThroughput (min,med,max)
Figure 5: Mellanox ConnectX DDR cards running in 1:1 with different MTUs
As it can be expected for the highspeed connections above GbE the MTUis still a relevant factor. It has a significant influence on InfiniBand connec-tions where the often suggested setting of 2044 is 30 times less than thedevice MTU being nearly the maximum of the IP packet size of today’s
16 The results are more volatile for the 10 GbE links as shown in the Benefits and Limitationsof Highspeed Machine Interconnects.
Infiniband for Highspeed IP Networking 131
drivers (Fig. 5). The optimal MTU of 65520 can be generally consid-ered as IB networks usually span geographically limited networks with awell defined number of machines connected to them and no intermediateIP routers which might need to fragment. The TCP configuration should beoptimized for low latency and jitter networks as no WAN connections needto be considered.
Bibliography
[Auernhammer2007] F. Auernhammer, A. Doering, M. Gabrani, andP. Sagmeister. Extension of an infiniband host channel adaptermodel and performance analysis. In Baltic Conference onAdvanced Topics in Telecommunication, Riga, pages 55–70,2007.
[Bortolotti2009] D. Bortolotti, A. Carbone, D. Galli, I. Lax, U. Marconi,G. Peco, S. Perazzini, V.M. Vagnoni, and M. Zangoli. Com-parison of udp transmission performance between ip-over-infiniband and 10-gigabit ethernet. IEEE Transactions on Nu-clear Science, 58:1606–1612, 2011.
[Bortolotti2011] D. Bortolotti, A. Carbone, D. Galli, I. Lax, U. Marconi,G. Peco, S. Perazzini, V.M. Vagnoni, and M. Zangoli. IEEETransactions on Nuclear Science, 58:1606–1612, 2011.
[Carter2007] Steven Carter, Makia Minich, and Nageswara S. V. Rao. Ex-perimental evaluation of infiniband transport over local- andwide-area networks. In Proceedings of the 2007 spring simu-lation multiconference - Volume 2, SpringSim ’07, pages 419–426, San Diego, CA, USA, 2007. Society for Computer Sim-ulation International.
[Dynowski2012] Marek Dynowski, Michael Janczyk, Janne Schulz, Dirkvon Suchodoletz, and Sven Hermann. Das bwGRiD – HighPerformance Compute Cluster als flexible, verteilte Wis-senschaftsinfrastruktur. In Paul Müller, Bernhard Neumair,
132 Dirk von Suchodoletz
Helmut Reiser, and Gabi Dreo Rodosek, editors, 5. DFN-Forum Kommunikationstechnologien – Verteilte Systeme imWissenschaftsbereich, pages 95–105. Gesellschaft für Infor-matik e.V. (GI), 2012.
[Hoefler2007] Torsten Hoefler, Torsten Mehlan, Andrew Lumsdaine, andWolfgang Rehm. Netgauge: A network performance mea-surement framework. In Ronald Perrott, Barbara Chapman,Jaspal Subhlok, Rodrigo de Mello, and Laurence Yang, ed-itors, High Performance Computing and Communications,volume 4782 of Lecture Notes in Computer Science, pages659–671. Springer Berlin / Heidelberg, 2007.
[Koop2008] M.J. Koop, Wei Huang, K. Gopalakrishnan, and D.K. Panda.Performance analysis and evaluation of pcie 2.0 and quad-data rate infiniband. In 16th IEEE Symposium on High Per-formance Interconnects, 2008. HOTI ’08., pages 85–92, 2008.
[Liu2003] Jiuxing Liu, Jiesheng Wu, Sushmitha P. Kini, Darius Bunti-nas, Weikuan Yu, Balasubraman Chandrasekaran, Ranjit M.Noronha, Pete Wyckoff, and Dhabaleswar K. Panda. Mpiover infiniband: Early experiences. Technical Report OSU-CISRC-10/02-TR25, Computer and Information Science,Ohio State University, January 2003.
[Montero2006] R.S. Montero, E. Huedo, and I.M. Llorente. Benchmark-ing of high throughput computing applications on grids. Par-allel Computing, 32(4):267–279, 2006.
[OFED2012] OpenFabrics Alliance (OFA). OpenFabrics Enterprise Dis-tribution (OFED) – Overview, 2012.
[RFC4391] J. Chu and V. Kashyap. Transmission of IP over InfiniBand(IPoIB). RFC 4391 (Proposed Standard), April 2006.
[RFC4392] V. Kashyap. IP over InfiniBand (IPoIB) Architecture. RFC4392 (Proposed Standard), April 2006.
Infiniband for Highspeed IP Networking 133
[Zhang2009] Hongwei Zhang, Wan Huang, Jizhong Han, Jin He, andLisheng Zhang. A performance study of java communicationstacks over infiniband and gigabit ethernet. IAENG Interna-tional Journal of Computer Science, 36(4), 2009.
AcknowledgementsThe author would like to thank the people of the High Performance Com-puting group at DELL Research Labs Parmer South in Austin, Texas toprovide me with all the different hardware and valuable hints and tips howto configure and run it.
134 Dirk von Suchodoletz
Benefits and Limitations of Highspeed MachineInterconnects
Dirk von Suchodoletz∗, Onur Celebioglu†, Garima Kochhar‡
University of FreiburgDELL Computer Research Labs
Abstract: The ubiquitous Gigabit Ethernet interfaces in todays HTC clustersare getting stretched to their limits for high speed IP machine interconnects.10 Gigabit and the forthcoming 40 or even 100 Gigabit Ethernet offer pathsfor upgrades but does not necessarily scale linearly for TCP connections. Thispaper reviews the literature on performance tweaks and measurements from aLinux administrators point of view. It discusses the relevant metrics and in-troduces external Ethernet loopbacks for testing and compares different setupsof High Speed Ethernet connections in typical HTC setups and Internet serveroperation.
1 IntroductionWith the rising amount of data both in filesystems and exchanged betweenapplications, especially for High Throughput Computing (HTC) the re-quirements for higher bandwidth increase, too.1 Thus, the predominanttype of network interconnect, Gigabit Ethernet (GbE) can become a limita-tion. This paper gives an overview on and discusses the relevant parameterson network performance optimization according to the literature and theactual state on today’s deployed Linux systems. As most of the upcomingHTC installations use Scientifc Linux or the RedHat Linux Enterprise 6.2∗ [email protected]† [email protected]‡ [email protected] For the Grid, High Throughput Computing and High Performance Computing terminologyand different characteristics refer to e.g. [Montero2006].
distribution the first on is based on, this paper focuses on this code basewith the 2.6.32 kernel.2
While GbE connections are the standard for all modern server and desk-top machines many mobile devices like laptops or netbooks feature suchan interface too. Nevertheless, the machines have to have a fast enoughIO system to actually saturate the link. The challenge is not new and canbe tracked back to the first 10 and 100 Mbit/s Ethernet standards, when themachines of the respective era were not able to fully use the bandwidthavailable at the beginning. The network bandwidth and the capacity ofthe IO subsystem needs to be balanced, as e.g. the traditional PCI bushandled 133 MByte/s gross data rates at maximum, which could get eas-ily consumed with a single unidirectional GbE connection. The problemtranslates to the actual set of servers run in HPC setups and cluster com-puting, too. Adding a 10 Gbit/s interface card does not necessarily increasethe throughput by a magnitude of ten. Depending on the interface MTUconfiguration and the number of data streams transfered, the CPU has togenerate and handle between less then 200,000 in best and over 2 Millionpackets in worst case.3
Taking the generally accepted rule of thumb for non-optimized Ethernethardware and drivers into consideration, that one Hertz of CPU process-ing power is consumed to receive or send 1 bit/s of TCP data over IP links[Foong2003, Olsson2005, Leitao2009] it needs a capable processor to ac-tually exhaust a 10 Gbit/s or even more an 40 Gbit/s Ethernet link. Gener-ally, the actual usage scenarios of network servers could be quite different.They might exchange data between geographically distributed sites like inthe bwGRiD [Dynowski2012] or run as a large volume FTP or streamingserver with clients distributed all over the world. Or, they are deployed asa local file server or serve as a compute node with the need of high volumeof data exchange with neighboring machines.
2 The actual kernel version in use was 2.6.32-220.el6.x86_64.3 In the best case only full size packets of 9012 Bytes are sent, in the absolute worst case sce-nario having packets sent being equal or smaller than the minimum frame length of typically520 Byte the number increases significantly. Taking the next generation 40 GbE into consid-eration which becomes more widely available and would be of interest to equip some specialservers with the numbers simply quadruple.
136 , .Dirk von Suchodoletz, et al.
There is no definite solution to optimize for all use cases at the same time.In this paper, we discuss a couple of issues to seek improved performancefollowing a layered approach looking from the hardware layer up to thevarious network layers. The tests were conducted on different server hard-ware at the DELL Research Labs in Parmer South in Austin. The figuresproduced in the different tests should not be interpreted in absolute termsbut are to be read to compare a number of setups side-by-side. They give anindication on what kind of tweaks actually in- or decreased the achievablebandwidth in the tests run.
The remainder of this paper is organized as follows: The section on testsetup delivers an overview on the hardware used in the different setups andhow the tests were run. It introduces the concept of Ethernet loopback toexecute a couple of tests without the need of a second machine and addi-tional network equipment. In the next section we go into more detail on acouple of tools useful for network performance testing. After having estab-lished the foundation, we discuss the several optimizations on the severallayers in more depth, comparing different Ethernet scenarios and setups toeach other. Finally, we give a conclusion which performance tweaks areovercome by actual hardware improvements and where still challenges tobe faced.
2 Test Metrics and Setups
For most applications in HTC and HPC, storage and file services through-put is the most relevant metric, which is evident throughout the literature[Narayan2009, Leitao2009]. It is defined as the rate at which bulk datatransfers can be transmitted from one host to another over a sufficientlylong time period. The term has mostly the same meaning as data transferrate or digital bandwidth consumption and is thus used synonymously. Itdescribes the achieved average useful bit rate in a data network over a phys-ical communication link. It is usually measured above the physical and be-low the network layer and therefore includes some protocol overhead andtransmissions if occured. As with harddisks, the metric measurements will
Benefits and Limitations of Highspeed Machine Interconnects 137
be used, 1 Mbit/s translating to 1,000 Kbit/s and not 1,024 Kbit/s.4 Anothermetric is CPU utilization but it only relevant in some scenarios. Thus, theexperiments reported in this paper mainly focus on the first one and mentionthe latter one for the relevant experiments if there seems to be an influenceon the general networking performance. Other metrics relevant e.g. in mul-timedia live streaming protocols use the round trip time (RTT) or take thepacket jitter into account. For webservers the time to create and tear-downa socket is a relevant measure too. These metrics are not considered furtheron for this paper.
For the several experiments run, a staged approach was used, startingfrom ”external loopback”, having a server-to-server direct connection then,till finally getting to full networking with network components like switchesinvolved. This approach was designed to firstly baseline a number of ma-chine performance parameters and secondly to rule-out the influence of ac-tive network components as certain configurations might reduce the through-put. Additionally, the external loopback helps to save on precious hardwareas capable servers with 10 Gbit/s Ethernet (10 GbE) and especially 40 GbEcomponents tend to be more pricey then wide spread industry standardequipment. The test makes machines and network cards directly compa-rable to each other as external influence is ruled-out. The loopback testshould reveal some ground truth what a single machine is able to handle.As the same packets are sent and received on the same node, it kind of dou-bles the number of packets actually handled compared to an unidirectionalIP packet stream between two distinguished machines.
For the tests different server equipment was deployed: Single and Dual-CPU configurations of DELL PowerEdge 610, 710 and 810. While the 610is a one height unit server compared to the otherwise similar 710 machinewhich can host up to two Intel XEON CPUs, the architecture of the 810 isdifferent. Some of the tests were re-run later on with DELL M610 blades.All machines were configured with at least 24 GByte of RAM in singleCPU setup. The detailed configuration changes are described in a later
4 A couple of measurements in the experiments were taken on the application layer usingtools like dd. They will report little less data transfer rates then e.g. *perf utilities. dd givesit’s transfer rates in metric values which matches the network measurement methodology.
138 Dirk von Suchodoletz, et al.
section when optimizing the hardware layer.To establish some baseline IO figures the dd command was executed to
create a test file of 10 GByte size in machine RAM,5 using the e.g. /dev/shmdirectory.6 dd runs in direct IO mode, different to cp. Upon successfullcompletion the command usually gives an estimate on transfer speed, e.g.10240000000 bytes (10 GB) copied, 11.8114 s, 867 MB/s.
The results differ depending on the systems memory and IO performanceand vary with the blocksize given. In the setup used the best results wereachieved with blocksizes between 1 and 2 MByte, nearly tripling the val-ues of smaller and still outnumbering the values of larger blocksizes above2 MByte. Other machines behave slightly different. The idea here is justto get an estimate that the machine is fast enough to generate data or copywhich is used later on in similar experiments for network transfer tests.
2.1 External Loopbacks
For the operating system kernel it usually does not make sense and thusis not possible in standard configuration to send out packets physically onone interface and receive them on another. In the standard configurationthe packets are routed internally and never reach the hardware layer. Thethroughput and delay results could be directly compared to the loopbackinterface. Nevertheless, as the idea itself stirred some interest in the comu-nity7, several methods are suggested to achieve such a setup:
• Trick the kernel routing table by changing the source and destinationaddresses ”on the fly” by using Linux IPtables.8
• Use routing rule sets and move the local routing rule up in the stackotherwise it would be hit first every time. In older kernels of pre
5 This strategy rules out the influence of harddisk performance and block caching. To obtaininformation on harddisk related performance parameters nmon (systems administrator, tunerand benchmarking tool) can be useful.6 This is TEMPFS filesystem which usually can take 50 percent of the total memory installedin standard configuration, but could be re-configured to allow more or less with mount -o
remount,size=90% /dev/shm.7 E.g. used for IB performance measurements in [Auernhammer2007].8 See different blog posts on the net or see [Olsson2005].
Benefits and Limitations of Highspeed Machine Interconnects 139
2.6.35 this was impossible as this entry was fixed and unchangeable.This was supposed to be possible with newer kernels, but we werenot able to verify the expected outcome9 on newer Ubuntus and anOpenSuSE 12.1 featuring a recent 3.1.0 kernel.
• Apply a special loopback patch.10
The first method involves packet filtering and rewriting which adds to thepacket handling efforts the CPU has to master. The first two methods aresusceptible to general ARP problems, like that the kernel is not respondingto ARP requests of locally attached interfaces. This is taken care of with thethird, intrusive method. Here, a kernel patch is to be applied and the originalkernel to be replaced. After rebooting into the patched kernel two newkernel interface structures appear which allow switching on the loopback:echo 1 > /proc/sys/net/ipv4/conf/<ifN,M>/loopwhere if is the actual name of the Ethernet interface and the N and M thenumbers, like e.g. p4p1 and p4p2. In a next step IP addresses should be seton both interfaces which could be just point-to-point without any subnetsand finally the kernel routing table is to be modified:
ip a a 10.0.1.1 dev p2p1
ip a a 10.0.2.2 dev p2p2
ip route replace local 10.0.1.1 dev p2p1 scope host \
src 10.0.2.2 proto kernel
ip route replace local 10.0.2.2 dev p2p2 scope host \
src 10.0.1.1 proto kernel
ip route show table local
3 Tools for TestingThe authors of [Narayan2009] give an overview on network performancemeasurement, discuss experiments executed by other research groups andpresent a couple of open source and commercially available network per-formance measuring tools like iperf and netperf.11 The typical problem9 See http://lwn.net/Articles/364318.10 Refer to http://www.ssi.bg/~ja/\#loop for kernel patches for the different kernelversions.11 If referenced together we abbreviate them as *perf.
140 Dirk von Suchodoletz, et al.
faced by network and server administrators is to come up with test scenar-ios which model at least to a certain degree the actual usage pattern a serverand network is expected to experience. As this is often impossible at leasta number of different experiments could be run to establish a picture ondifferent aspects. Which tools to use depends on the actual requirements asthe tools presented measure different aspects. Thus, many results producedshould be not mistaken for achievable data rates in certain setups but, nev-ertheless, the figures will reveal some hints if a certain tweak influenced acertain test pattern.
The tools to measure data transfer rates and system performance are asvaried as the metrics which might be applied. Simple benchmarks can beestablished using the standard commands provided with the operating sys-tem, like dd, cp or netcat (nc) if just some measures are taken on how longa file transfer takes to run and how much processor time is consumed.12
Statistical information can be gathered with the netstat utility. For theseveral experiments classical network bandwidth testing and monitoringtools as well as simple network file copy experiments primarily with net-cat, and file copies on mounted NFS shares were run.
The Linux kernel provides with the packet generator a lowlevel methodalready built-in [Olsson2005]. It is activated by loading the pktgen.ko ker-nel module which will spawn a kernel thread for every CPU core present inthe machine. The operation of the packet generator via the /proc interfaceis not very convenient, though. As most applications in HPC use TCP asthe transport protocol we are concentrating on it for the remainder of thispaper.
3.1 Network TCP and Application Performance
The packet generators and TCP bandwith checkers iperf and netperfare more easy to use.13 Both tools operate in client-server mode and can
12 Further tools are fio which allows as well as iometer and vdbench multithreaded opera-tion – different to dd. They were not considered further in these experiments as not being partof the standard Linux distributions.13 Most distributions provide precompiled installation packets for both tools. See eitherhttp://iperf.sourceforge.net or http://www.netperf.org/netperf for further
Benefits and Limitations of Highspeed Machine Interconnects 141
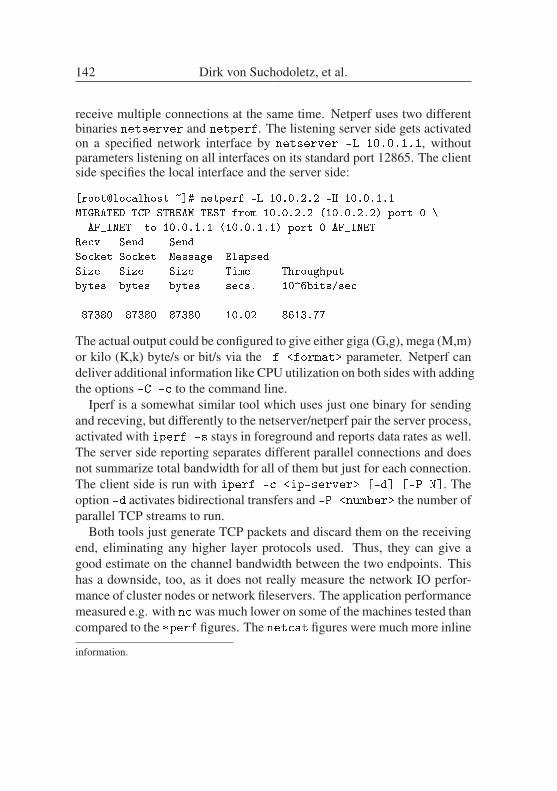
receive multiple connections at the same time. Netperf uses two differentbinaries netserver and netperf. The listening server side gets activatedon a specified network interface by netserver -L 10.0.1.1, withoutparameters listening on all interfaces on its standard port 12865. The clientside specifies the local interface and the server side:
[root@localhost ~]# netperf -L 10.0.2.2 -H 10.0.1.1
MIGRATED TCP STREAM TEST from 10.0.2.2 (10.0.2.2) port 0 \
AF_INET to 10.0.1.1 (10.0.1.1) port 0 AF_INET
Recv Send Send
Socket Socket Message Elapsed
Size Size Size Time Throughput
bytes bytes bytes secs. 10^6bits/sec
87380 87380 87380 10.02 8613.77
The actual output could be configured to give either giga (G,g), mega (M,m)or kilo (K,k) byte/s or bit/s via the -f <format> parameter. Netperf candeliver additional information like CPU utilization on both sides with addingthe options -C -c to the command line.
Iperf is a somewhat similar tool which uses just one binary for sendingand receving, but differently to the netserver/netperf pair the server process,activated with iperf -s stays in foreground and reports data rates as well.The server side reporting separates different parallel connections and doesnot summarize total bandwidth for all of them but just for each connection.The client side is run with iperf -c <ip-server> [-d] [-P N]. Theoption -d activates bidirectional transfers and -P <number> the number ofparallel TCP streams to run.
Both tools just generate TCP packets and discard them on the receivingend, eliminating any higher layer protocols used. Thus, they can give agood estimate on the channel bandwidth between the two endpoints. Thishas a downside, too, as it does not really measure the network IO perfor-mance of cluster nodes or network fileservers. The application performancemeasured e.g. with nc was much lower on some of the machines tested thancompared to the *perf figures. The netcat figures were much more inline
information.
142 Dirk von Suchodoletz, et al.
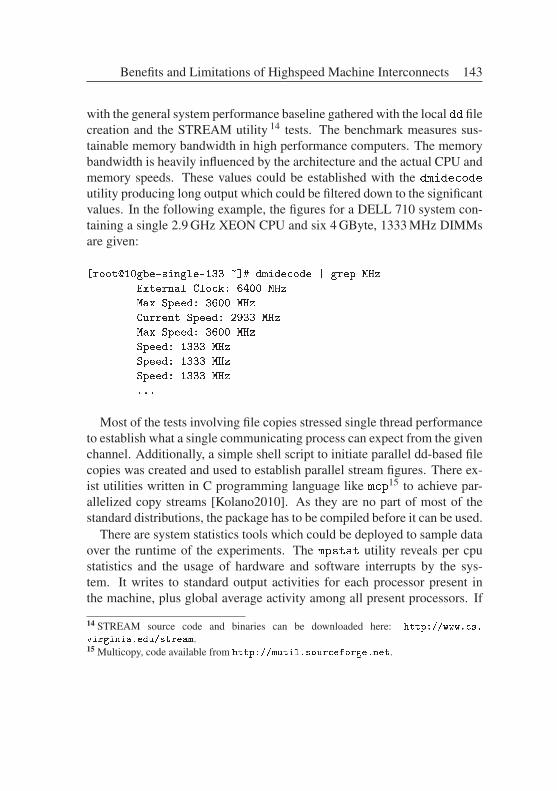
with the general system performance baseline gathered with the local dd filecreation and the STREAM utility 14 tests. The benchmark measures sus-tainable memory bandwidth in high performance computers. The memorybandwidth is heavily influenced by the architecture and the actual CPU andmemory speeds. These values could be established with the dmidecode
utility producing long output which could be filtered down to the significantvalues. In the following example, the figures for a DELL 710 system con-taining a single 2.9 GHz XEON CPU and six 4 GByte, 1333 MHz DIMMsare given:
[root@10gbe-single-133 ~]# dmidecode | grep MHz
External Clock: 6400 MHz
Max Speed: 3600 MHz
Current Speed: 2933 MHz
Max Speed: 3600 MHz
Speed: 1333 MHz
Speed: 1333 MHz
Speed: 1333 MHz
...
Most of the tests involving file copies stressed single thread performanceto establish what a single communicating process can expect from the givenchannel. Additionally, a simple shell script to initiate parallel dd-based filecopies was created and used to establish parallel stream figures. There ex-ist utilities written in C programming language like mcp15 to achieve par-allelized copy streams [Kolano2010]. As they are no part of most of thestandard distributions, the package has to be compiled before it can be used.
There are system statistics tools which could be deployed to sample dataover the runtime of the experiments. The mpstat utility reveals per cpustatistics and the usage of hardware and software interrupts by the sys-tem. It writes to standard output activities for each processor present inthe machine, plus global average activity among all present processors. If
14 STREAM source code and binaries can be downloaded here: http://www.cs.
virginia.edu/stream.15 Multicopy, code available from http://mutil.sourceforge.net.
Benefits and Limitations of Highspeed Machine Interconnects 143
no specific activity has been selected, then the default report is the CPU uti-lization report. The usual invocation is to give the number of repetitions andthe sampling interval: mpstat 5 10 to have five seconds interval betweenthe ten samples taken.vmstat on the other hand reports the vm page information, context
switch, total number of interrupts per seconds and gives information aboutprocesses, memory, paging, block IO, traps, and general cpu activity. Thefirst report produced gives averages since the last reboot. Additional re-ports provide data on running sampling with similar parameters: vmstat
<interval> <samples>. The process and memory reports are instanta-neous in either case.
Another tool in this domain is perf, a profiler tool for Linux based sys-tems that abstracts away CPU hardware differences. It offers a simple com-mandline interface which implements a set of commands like stat, record,report.16
4 Layers to Optimize
When trying to optimize a machine to a specific purpose there exist anumber of layers which could be tweaked: 1 The machine hardware hasa significant influence on the network performance as the CPU needs tobe fast enough to handle the required amount of packets. The IO subsys-tem should be able to cope with the data streams getting in and out of themachine. Fast enough paths between storage, memory and network periph-erals are required as well. 2 The network hardware is initialized and drivenby kernel modules. The performance is directly influenced by how theyare programmed and by how efficient they can make use of features likeprotocol offload provided by modern network adaptors. Plus, in multi-coresystems, interrupt routing has an impact on the system load and throughput[Leitao2009]. 3 On the layers above the hardware a number of parameterslike the queue length or the maximum transfer unit (MTU) can be adaptedin the Ethernet interface settings. 4 The core network settings influence e.g.the size of several read and write memory buffers [Cerf2011, Gettys2011].
16 Project homepage https://code.google.com/p/kernel/wiki/PerfUserGuide.
144 Dirk von Suchodoletz, et al.
5 As TCP is complex, implementing a sophisticated flow control, whichdirectly influences the network throughput, a couple of parameters mightbe tweaked here, too [Aggarwal2000].
While looking into 10 Gbit/s WAN networks, the authors of [Wu2010]discuss a number of measurement and performance tweaks to determinethe suitability of TCP parameters such as for Jumbo Frame size and thebuffer sizes of a TCP sender and receiver. The paper evaluates TCP per-formance measurement and network emulation tools for 10 Gbit/s high-speed optical networks. Finally, it compares the performance of TCP vari-ants with different metrics, such as throughput and fairness. Older paperslike [Schneider2007, Feng2003a] could be considered, too, but as much ofthem are a couple of years old, the hardware performs much better todayand the operating systems got a couple of improvements on handling high-throughput packet streams. Nevertheless, changing the parameters and con-figuration options might optimize a given setup for a certain usage scenario.
4.1 Machine Hardware
The configuration of the machine hardware directly influences the networkperformance of different job patterns. Especially single threaded tasksprofit from a fast CPU linked to fast memory. Comparing the, admittedlyrather artificial, dd-test on different machines in different settings, the re-sults for the 10 GByte file using the blocksize of 1 KByte file were giving atleast some parameter to compare the machines to each other. The STREAMutility is another indicator to use to evaluate machines single thread perfor-mance. In the various experiments with the different machines we proved,that:
• The memory configuration is significant. The optimal number ofmemory channels for the architecture should be used, e.g. three forthe most recent Intel XEON CPU’s and chipsets. Otherwise the max-imum performance will not be reached. Nevertheless, populating allmemory banks often reduces the performance again as the memorywill not be run at its maximum frequency for timing reasons. Thus,better use modules of larger size instead many of smaller capacity.
Benefits and Limitations of Highspeed Machine Interconnects 145
• A single CPU (somewhat similar to the observations in [Feng2003a])was a little bit faster than two physical CPU’s, but might be eas-ily overcompensated with a multi-CPU configuration under higherloads. In dual-CPU configuration the BIOS setting of memory inter-leave mode to ON or OFF was expected to influence the results, butdid not produce any statistically significant differences.
The PCIe slot configuration should be optimized in a way, that the periph-eral cards get the required number of PCI lanes.17 Some PCIe slots arephysically wired with fewer channels than the dimensions of the slot wouldindicate. Some of the hardware drivers indicate this during module load-ing. A 10 GbE card would require more than four lanes in PCIe version 2servers. 40 GbE cards often require PCIe version 3 systems to deliver fullperformance.
4.2 Ethernet Hardware
Every type of hardware is evolving over the time, so the same could be ob-served for 10 Gbit/s Ethernet. As the implementations between vendors andrevisions differ, the results of the various experiments are expected to differtoo. The Intel Ethernet controller Intel 82599EB e.g. performed roughly10 to 15 % better in the experiments run than its predecessor 82598EB. Asetup with two machines configured exactly the same featuring each oneof the controllers resulted in better performance for one direction which re-versed when the controllers were exchanged to cross-check the results. Thehigher and lower data transfer rate figures resulted when using the samecard (82598EB or 82599EB) on each side. An equally good performancewas achieved using Broadcom NetXtreme II BCM57711 adaptor togetherwith the newer Intel card.
The peripheral hardware tells the CPU by issuing an interrupt that itneeds attention, e.g. for arrived data. As the numbers of packets sent or
17 PCIe provides 0.25, 0.5, 1 GByte/s in version 1, 2, 3 gross per lane in each direction. Opti-mally the machine supports MSI-X interrupts.
146 Dirk von Suchodoletz, et al.
received by 10 Gbit/s adapters can trigger high IRQ activity.18 On a multi-core system it is recommended in the literature [Leitao2009], that all in-terrupts generated by a device queue are handled by the same CPU core toachieve code handling locality. Nevertheless, the totally different distribu-tion patterns of the MSI-edge interrupts of the Broadcom dual port adap-tor (all routed to the same CPU) and the Intel cards (equally distributed)did not show any difference in our experiments. To avoid equal distribu-tion over all cores, IRQ balancing needs to be disabled, or configured forthe non-network peripheral serving CPUs [Leitao2009]. A userspace dae-mon regulates the balancing and either could be switched off completelyby e.g. service irqbalance stop or better be configurated accordinglyvia /etc/sysconfig/irqbalance file.19 While it would be easy to blacklist theCPU core handling the network card in the Broadcom case it would bemore difficult to change it for the Intel card. In the loopback experiment itachieved an insignificantly faster filetransfer in some setups but no statisti-cally significant improvement in others.
4.3 Kernel Modules
The relevant hardware (network and Infiniband interfaces) and the networksoftware layers are represented by kernel modules. The Ethernet adaptormodules for the Intel and the Broadcom cards delivered with the operatingsystem (RHEL 6.2) were pretty recent. Newer versions were tried for theIntel card, but no significant improvements could be measured. The Intelmodule got recompiled for another reason, to test the New API (NAPI),which was to be activated by a compile time option.
Kernel modules honour a couple of module specific parameters, whichcould be discovered with the modinfo tool. One of those is the IRQ affinityshown in [Olsson2005], but no effects were measurable in the tests run onthe recent machines.18 A single CPU in traditional hardware would be unable to handle the packet stream of10 Gbit/s interfaces following [Foong2003, Olsson2005, Leitao2009]. This has changed,though, through a number of measures like protocol offload discussed later on.19 Different file location in different Linux distributions, for more information see http://
irqbalance.org/documentation.html.
Benefits and Limitations of Highspeed Machine Interconnects 147
To significantly reduce the CPU load when receiving Ethernet framesseveral mechanisms were introduced like interrupt moderation or coalesc-ing. When a new frame arrives, it gets saved in memory by the NIC, whichwill wait a receive delay to check if further frames get received. Then aninterrupt gets generated to signal that one or more frames have been re-ceived. This strategy reduces the number of context switches the kernelhas to make to service the interrupts on the penalty of added latency onframe reception. Additionally, interrupt coalescence avoids performancedegregation through IRQ storms during high traffic load and thus improvesthe CPU efficiency if properly tuned for specific network traffic. The ac-tual configuration is shown with ethtool -c <if> and set parateters withethtool -C <if> [adaptive-rx on|off] [rx-usecs N] [...].
NAPI is a feature available e.g. for the Intel 10 Gbit/s adaptors whichtackles the same issue that interrupts coalescence solved with lesser im-pact on latency. It was introduced in the Linux kernel to improve the per-formance of high-speed network connections without generating interruptstorms. NAPI basically deploys a combination of interrupts and polling,which means that in phases of high traffic the device interrupts get dis-abled and packets are received by polling. Compliant drivers could evendrop packets in the adaptor already if necessary, before reaching the ker-nel. In phases of relatively low traffic the kernel switches back to interrupthandling, to avoid high latencies because of device polling [Leitao2009].Nevertheless, no significant effects could be measured in the type of exper-iments run.
A measure to help the kernel during high traffic phases is by increasingthe receive and transmit descriptors buffer size. The default size is set to256 the maximum possible value is 2048.20
5 Network Layer Optimizations
Beside the evaluation of hardware layer configuration and tweaks, there arestill a couple of software layers left which are to be considered next. A cou-ple of configuration options are made to the network interface on different
20 See http://www.intel.com/support/network/sb/CS-025829.htm.
148 Dirk von Suchodoletz, et al.
ways, others are on a more general kernel level. The latter configurationworks via the /proc interface, either via direct writing into the appropriatefiles or via using the sysctl command.
A couple of parameters could be set for the network interface directlyusing the ip command like for the MTU. Larger MTUs reduce the absolutenumber of packets and result in better TCP responsiveness. Jumbo framesaccelerate the congestion window increase by a factor of six compared tothe standard MTU [Leitao2009]. The visibility of this effect depends on theCPU and IO speed of the machine and the application used. Transmissionqueue size defines the buffer that holds packets which are scheduled to besent to the card. Tuning this buffer size helps to avoid that packet descrip-tors are lost due to a lack of available space in memory. Depending on thetype of the network characteristics, the default queue length of 1000 pack-ets could be to small and should be raised then. A typical number given isaround 3000.21
Another issue is the flow control on Ethernet which could be observedwith the aformentioned ethtool -a <if> and set, e.g. ethtool -A p4p1
autoneg off rx on tx on. The flow control set to off on the M6220switch resulted in 40 MByte/s throughput compared to 115 MByte/s withflowcontrol on in Gigabit Ethernet.22
5.1 General Network Layer
IPv6 is the next generation of the Internet Protocol which will take overfrom IPv4 in the next couple of years definitely reaching the HPC do-main sooner or later, depending on the requirements for wider coopera-tion and cluster interaction. Especially because of a number of new fea-tures, new ways to (auto)configure and setup networks, the code base ismuch larger than IPv4. Thus, it was expected that losses in throughputwill occur and the CPU will be higher utilized. In early implementations,there was a performance drop in different metrics like latency, through-put, CPU utilization and connection count measurable when using IPv6
21 See the recommendations given in the literature or online.22 Some sources suggest to set the flowcontrol off for 10 GbE on the DELL 8024F switch.
Benefits and Limitations of Highspeed Machine Interconnects 149
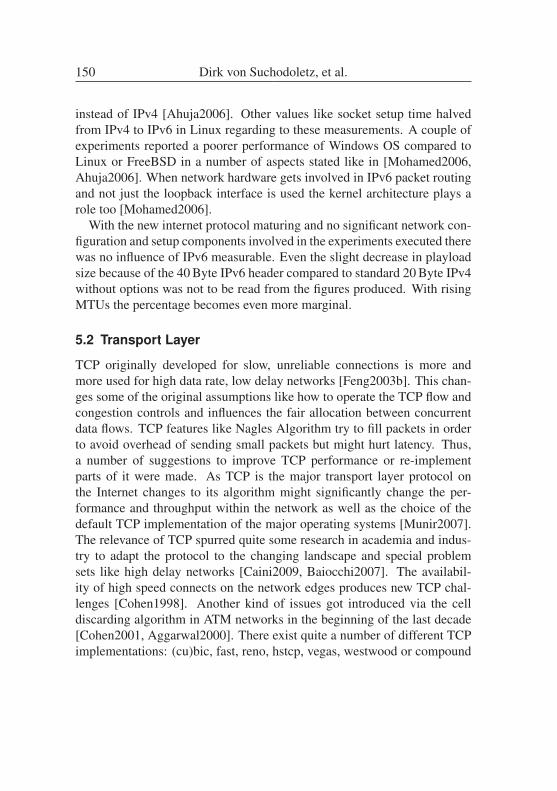
instead of IPv4 [Ahuja2006]. Other values like socket setup time halvedfrom IPv4 to IPv6 in Linux regarding to these measurements. A couple ofexperiments reported a poorer performance of Windows OS compared toLinux or FreeBSD in a number of aspects stated like in [Mohamed2006,Ahuja2006]. When network hardware gets involved in IPv6 packet routingand not just the loopback interface is used the kernel architecture plays arole too [Mohamed2006].
With the new internet protocol maturing and no significant network con-figuration and setup components involved in the experiments executed therewas no influence of IPv6 measurable. Even the slight decrease in playloadsize because of the 40 Byte IPv6 header compared to standard 20 Byte IPv4without options was not to be read from the figures produced. With risingMTUs the percentage becomes even more marginal.
5.2 Transport Layer
TCP originally developed for slow, unreliable connections is more andmore used for high data rate, low delay networks [Feng2003b]. This chan-ges some of the original assumptions like how to operate the TCP flow andcongestion controls and influences the fair allocation between concurrentdata flows. TCP features like Nagles Algorithm try to fill packets in orderto avoid overhead of sending small packets but might hurt latency. Thus,a number of suggestions to improve TCP performance or re-implementparts of it were made. As TCP is the major transport layer protocol onthe Internet changes to its algorithm might significantly change the per-formance and throughput within the network as well as the choice of thedefault TCP implementation of the major operating systems [Munir2007].The relevance of TCP spurred quite some research in academia and indus-try to adapt the protocol to the changing landscape and special problemsets like high delay networks [Caini2009, Baiocchi2007]. The availabil-ity of high speed connects on the network edges produces new TCP chal-lenges [Cohen1998]. Another kind of issues got introduced via the celldiscarding algorithm in ATM networks in the beginning of the last decade[Cohen2001, Aggarwal2000]. There exist quite a number of different TCPimplementations: (cu)bic, fast, reno, hstcp, vegas, westwood or compound
150 Dirk von Suchodoletz, et al.
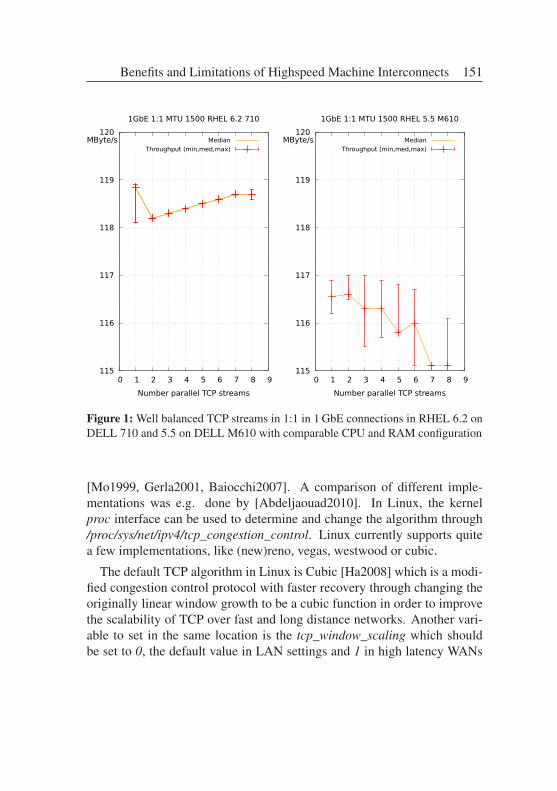
115
116
117
118
119
120
0 1 2 3 4 5 6 7 8 9
MByte/s
Number parallel TCP streams
1GbE 1:1 MTU 1500 RHEL 6.2 710
MedianThroughput (min,med,max)
115
116
117
118
119
120
0 1 2 3 4 5 6 7 8 9
MByte/s
Number parallel TCP streams
1GbE 1:1 MTU 1500 RHEL 5.5 M610
MedianThroughput (min,med,max)
Figure 1: Well balanced TCP streams in 1:1 in 1 GbE connections in RHEL 6.2 onDELL 710 and 5.5 on DELL M610 with comparable CPU and RAM configuration
[Mo1999, Gerla2001, Baiocchi2007]. A comparison of different imple-mentations was e.g. done by [Abdeljaouad2010]. In Linux, the kernelproc interface can be used to determine and change the algorithm through/proc/sys/net/ipv4/tcp_congestion_control. Linux currently supports quitea few implementations, like (new)reno, vegas, westwood or cubic.
The default TCP algorithm in Linux is Cubic [Ha2008] which is a modi-fied congestion control protocol with faster recovery through changing theoriginally linear window growth to be a cubic function in order to improvethe scalability of TCP over fast and long distance networks. Another vari-able to set in the same location is the tcp_window_scaling which shouldbe set to 0, the default value in LAN settings and 1 in high latency WANs
Benefits and Limitations of Highspeed Machine Interconnects 151
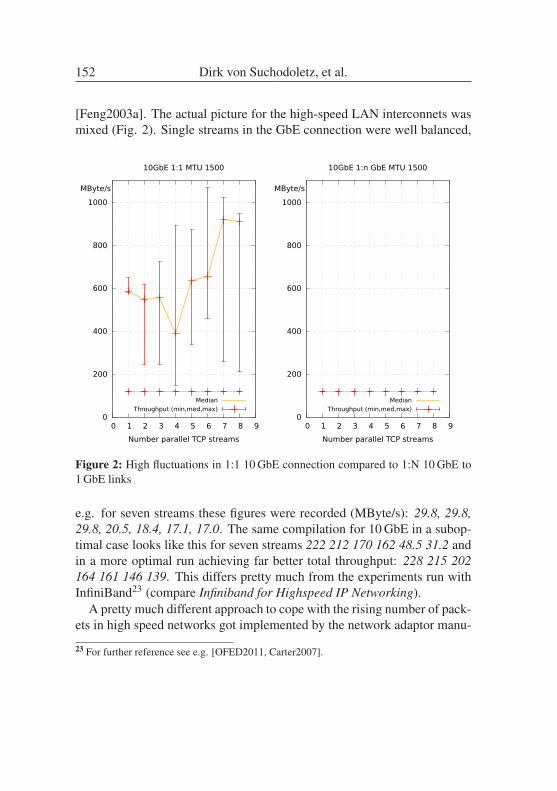
[Feng2003a]. The actual picture for the high-speed LAN interconnets wasmixed (Fig. 2). Single streams in the GbE connection were well balanced,
0
200
400
600
800
1000
0 1 2 3 4 5 6 7 8 9
MByte/s
Number parallel TCP streams
10GbE 1:1 MTU 1500
MedianThroughput (min,med,max)
0
200
400
600
800
1000
0 1 2 3 4 5 6 7 8 9
MByte/s
Number parallel TCP streams
10GbE 1:n GbE MTU 1500
MedianThroughput (min,med,max)
Figure 2: High fluctuations in 1:1 10 GbE connection compared to 1:N 10 GbE to1 GbE links
e.g. for seven streams these figures were recorded (MByte/s): 29.8, 29.8,29.8, 20.5, 18.4, 17.1, 17.0. The same compilation for 10 GbE in a subop-timal case looks like this for seven streams 222 212 170 162 48.5 31.2 andin a more optimal run achieving far better total throughput: 228 215 202164 161 146 139. This differs pretty much from the experiments run withInfiniBand23 (compare Infiniband for Highspeed IP Networking).
A pretty much different approach to cope with the rising number of pack-ets in high speed networks got implemented by the network adaptor manu-
23 For further reference see e.g. [OFED2011, Carter2007].
152 Dirk von Suchodoletz, et al.
facturers by offloading certain repetitive tasks to the peripheral card itself.It releases the CPU from executing usual networking tasks, like computingthe checksum and copying memory blocks [Leitao2009].
As other Ethernet configuration almost all offload features could be (de)-activated using the aforementioned ethtool utility. Set parameters can bechecked with ethtool -k <if>, resulting in a list like this:
Offload parameters for p2p1:
rx-checksumming: off
tx-checksumming: off
scatter-gather: off
tcp segmentation offload: off
udp fragmentation offload: off
generic segmentation offload: off
Large Receive Offload (LRO) is a technique that increases inbound through-put of high-traffic network connections by reducing CPU overhead. Itworks by aggregating on the adaptor itself, multiple incoming packets froma single stream into a larger buffer before they are handed over to the net-work stack. This mechanism reduces the total number of packets that haveto be processed, and removes all headers overhead [Menon2008]. A fur-ther option is to have multi-queuing on the receiving side when there aremultiple applications using the network.
5.3 Application Layer
The networked application is the relevant part in for HPC and server oper-ators. The application performance is influenced by the lower layers ofthe network stack and its programming. Thus, the dd and netcat ex-periments were a rather artificial setup demonstrating the limits of singlethread performance. As visible in Fig. 2 it thus does not necessarily ex-haust the 10 GbE connection capacity which is in line with the findings of[Microsoft2011]. Multiple TCP streams are required to actually utilize thebandwidth.
Usually a modern network application can run multi-threaded and makeuse of the CPU cores available like the kernel NFS server is doing. In a
Benefits and Limitations of Highspeed Machine Interconnects 153
one-to-one connection over a single 10 GbE link, the load got distributedon the server side over the CPU cores available.
The experiments were using dd in direct IO on a single larger file to ruleout any filesystem rescheduling and optimizations and make it more com-parable to the netcat test runs. This resulted in link saturation but renderedthe NFS client machine otherwise nearly unusable. With a rising amountof clients connecting to the same server, the load rises to the CPU limitsas the high level application cannot control which thread answers whichrequest, creating lots of cache misses and overhead. Thus, more availableNFS server processes do not necessarily result in better performance inmulti-client scenarios.
6 Conclusion
Most of today’s servers are well suited to handle 10 Gbit/s traffic. From thevery beginnings [Feng2003a, Feng2003b], when the machines were muchless capable, the drivers less mature and a number of tweaks required mostof the modern Linux distributions, modern machines provide a near to op-timal setup already. Depending on the actual profile the machine is runningon, the hardware could be optimized, especially for single thread scenar-ios platform and memory speed are relevant factors and improvements aredirectly measurable.
Many of the experiments and tests were run in direct machine to machineconnections which are not likely to occur in many real-life scenarios. Theydefinitely lack certain aspects and thus do not necessarily show the full pic-ture. But they were meant to be setup fast and simple without requiring afull network infrastructure. Nevertheless, these experiments were able toshow different behavior of Ethernet GbE and 10 GbE links, especially inparallel streams. While there was no difference at all how many connec-tions ran over a Gigabit Ethernet line, the figures for 10 GbE were muchmore fluctuating.
The experiments demonstrated the difference between the line speed andconnection tests of the *perf tools compared to the application level tests.The *perfs are good for establishing the network throughput and qualityon the way between two endpoints in a given network, but other means of
154 Dirk von Suchodoletz, et al.
measurement are required to evaluate the end-to-end application level per-formance. The measurement setups and load scenarios used in the teststhroughout this paper definitely could be refined. Especially in very unbal-anced 10 GbE scenarios the measured average throughput depending on thelast thread to end could result in figures well below the peak throughput inthis experiment.
As it can be expected for the high speed connections above GbE, theMTU can be still a relevant factor, depending on the machine power andapplication as the ratio between standard MTU and jumbo frames is 1:6.Jumbo frames in large installations spanning different network segmentswith different MTU settings, might be burdening the intermediate routerwith packet fragmentation.
The upcoming IPv6 does not threaten the throughput in any sense asit processes IP packets as fast as IPv4 on modern kernels. The slightlydecreased amount of payload resulting from the increased IPv6 header doesnot really influence the performance, especially not with larger MTUs.
The development of Ethernet does not stop at this point. 40 GbE adap-tors become available and new generations of server hardware provide thenecessary power and PCIe bandwidth to saturate such a link. The lateststandard, 100 Gbit/s Ethernet, has not hit the server market yet, but alreadybecomes available for high speed WAN connections like the FKZ to KITlink [Hoeft2011].
Bibliography
[Abdeljaouad2010] I. Abdeljaouad, H. Rachidi, S. Fernandes, and A. Kar-mouch. Performance analysis of modern tcp variants: A com-parison of cubic, compound and new reno. In 25th BiennialSymposium on Communications (QBSC), 2010, pages 80–83,2010.
[Aggarwal2000] A. Aggarwal, S. Savage, and T. Anderson. Understand-ing the performance of tcp pacing. In Nineteenth Annual JointConference of the IEEE Computer and Communications Soci-eties, volume 3, pages 1157–1165, 2000.
Benefits and Limitations of Highspeed Machine Interconnects 155
[Ahuja2006] Sanjay P. Ahuja and Krishna Dendukuri. An empirical eval-uation of ipv6 in linux and windows environments. Annualreview of communications, 59, 2006.
[Auernhammer2007] F. Auernhammer, A. Doering, M. Gabrani, andP. Sagmeister. Extension of an infiniband host channel adaptermodel and performance analysis. In Baltic Conference onAdvanced Topics in Telecommunication, Riga, pages 55–70,2007.
[Baiocchi2007] Angelo P. Castellani Andrea Baiocchi and FrancescoVacirca. Yeah-tcp: Yet another highspeed tcp. In Proceed-ings on PFLDnet Workshop, 2007, pages 37–42, 2007.
[Caini2009] C. Caini, R. Firrincieli, and D. Lacamera. Comparative per-formance evaluation of tcp variants on satellite environments.In IEEE International Conference on Communications, 2009,pages 1–5, 2009.
[Carter2007] Steven Carter, Makia Minich, and Nageswara S. V. Rao. Ex-perimental evaluation of infiniband transport over local- andwide-area networks. In Proceedings of the 2007 spring simu-lation multiconference - Volume 2, SpringSim ’07, pages 419–426, San Diego, CA, USA, 2007. Society for Computer Sim-ulation International.
[Cerf2011] Vint Cerf, Van Jacobson, Nick Weaver, and Jim Gettys.Bufferbloat: What’s wrong with the internet, a case study.ACM Queue, December 2011.
[Cohen1998] Reuven Cohen and Srinivas Ramanathan. Tuning TCP forHigh Performance in Hybrid Fiber Coaxial Broadband Ac-cess Networks. IEEE/ACM Transactions on Networking, 6,February 1998.
[Cohen2001] Reuven Cohen and Yaniv Hamo. Balanced packet discardin ATM networks. Computer Communications, 24(15–16),2001.
156 Dirk von Suchodoletz, et al.
[Dynowski2012] Marek Dynowski, Michael Janczyk, Janne Schulz, Dirkvon Suchodoletz, and Sven Hermann. Das bwGRiD – HighPerformance Compute Cluster als flexible, verteilte Wis-senschaftsinfrastruktur. In Paul Müller, Bernhard Neumair,Helmut Reiser, and Gabi Dreo Rodosek, editors, 5. DFN-Forum Kommunikationstechnologien – Verteilte Systeme imWissenschaftsbereich, pages 95–105. Gesellschaft für Infor-matik e.V. (GI), 2012.
[Feng2003a] Wu-chun Feng and Justin (Gus) Hurwitz. Initial end-to-endperformance evaluation of 10-gigabit ethernet. In 11th Sym-posium on High-Performance Interconnects, 2003.
[Feng2003b] Wu-chun Feng, Justin (Gus) Hurwitz, Harvey Newman, Syl-vain Ravot, R. Les Cottrell, Olivier Martin, Fabrizio Coccetti,Cheng Jin, Xiaoliang (David) Wei, and Steven Low. Opti-mizing 10-gigabit ethernet for networks of workstations, clus-ters, and grids: A case study. In Proceedings of the 2003ACM/IEEE conference on Supercomputing, SC ’03, pages 50–59, New York, NY, USA, 2003. ACM.
[Foong2003] Annie P. Foong, Thomas R. Huff, Herbert H. Hum, Jaidev P.Patwardhan, and Greg J. Regnier. Tcp performance re-visited.In IEEE International Symposium on Performance Analysis ofSystems and Software (ISPASS’03), pages 70–79, 2003.
[Gerla2001] M. Gerla, M.Y. Sanadidi, Ren Wang, A. Zanella, C. Casetti,and S. Mascolo. Tcp westwood: congestion window controlusing bandwidth estimation. In IEEE Global Telecommuni-cations Conference GLOBECOM ’01, volume 3, pages 1698–1702, 2001.
[Gettys2011] Jim Gettys and Kathleen Nichols. Bufferbloat: Dark buffersin the internet. Queue – Virtualization, 9, November 2011.
Benefits and Limitations of Highspeed Machine Interconnects 157
[Ha2008] Sangtae Ha, Injong Rhee, and Lisong Xu. Cubic: a newtcp-friendly high-speed tcp variant. SIGOPS Oper. Syst. Rev.,42:64–74, July 2008.
[Hoeft2011] Bruno Hoeft, Robert Stoy, Frank Schröder, Aurelie Reymund,Ralf Niederberger, Olaf Mextorf, and Sabine Werner. 100gethernet in the wild – first experiences. Journal of Physics:Conference Series, 331 part 5, 2011.
[Kolano2010] Paul Z. Kolano and Robert B. Ciotti. High performancemulti-node file copies and checksums for clustered file sys-tems. In Proceedings of LISA ’10: 24th Large InstallationSystem Administration Conference, San Jose, pages 15–28,2010.
[Leitao2009] Breno Henrique Leitao. Tuning 10gb network cards on linux– a basic introduction to concepts used to tune fast networkcards. In Linux Symposium, 2009, Montreal, Canada, pages169–184, 2009.
[Menon2008] Aravind Menon and Willy Zwaenepoel. Optimizing tcp re-ceive performance, 2008.
[Microsoft2011] Microsoft Corp. Windows 8 SMB 2.2 File Shar-ing Performance, 2011. http://msdn.microsoft.com/en-us/library/windows/hardware/hh457617.aspx.
[Mo1999] J. Mo, R.J. La, V. Anantharam, and J. Walrand. Analysis andcomparison of tcp reno and vegas. In Eighteenth Annual JointConference of the IEEE Computer and Communications Soci-eties, volume 3, pages 1556–1563, 1999.
[Mohamed2006] M.S. Buhari S.S. Mohamed and H. Saleem. Perfor-mance comparison of packet transmission over ipv6 networkon different platforms. IEE Proceedings-Communications,153(3):425–433, June 2006.
158 Dirk von Suchodoletz, et al.
[Montero2006] R.S. Montero, E. Huedo, and I.M. Llorente. Benchmark-ing of high throughput computing applications on grids. Par-allel Computing, 32(4):267–279, 2006.
[Munir2007] Kashif Munir, Michael Welzl, and Dragana Damjanovic.Linux beats windows! – or the worrying evolution of tcp incommon operating systems. In PFLDnet Workshop, 2007,pages 43–48, 2007.
[Narayan2009] Shaneel Narayan, Deryn Graham, and Robert H. Barbour.Generic factors influencing optimal lan size for commonlyused operating systems maximized for network performance.IJCSNS International Journal of Computer Science and Net-work Security, 9:63–72, June 2009.
[OFED2011] OpenFabrics Alliance (OFA). OpenFabrics Enterprise Dis-tribution (OFED) – Overview, 2011.
[Olsson2005] Robert Olsson. pktgen the linux packet generator. In Pro-ceedings of the Linux Symposium, Ottawa, pages 11–23, 2005.
[Schneider2007] Fabian Schneider, Jörg Wallerich, and Anja Feldmann.Packet capture in 10-gigabit ethernet environments using con-temporary commodity hardware. In Steve Uhlig, KonstantinaPapagiannaki, and Olivier Bonaventure, editors, Passive andActive Network Measurement, volume 4427 of Lecture Notesin Computer Science, pages 207–217. Springer Berlin / Hei-delberg, 2007. 10.1007/978-3-540-71617-4_21.
[Wu2010] Yixin Wu, Suman Kumar, and Seung-Jong Park. Mea-surement and performance issues of transport protocols over10 gbps high-speed optical networks. Computer Networks,54(3):475–488, 2010.
Benefits and Limitations of Highspeed Machine Interconnects 159

AcknowledgementsWe would like to thank a couple of people who helped to organize this re-search and experiment setup, just to mention a few: Reza Rooholamini andMartin Hintelmann for creating the opportunity to jointly work for nearlythree month at DELL Research Labs Parmer South in Austin and GerhardSchneider and the University of Freiburg to support this trip.
160 Dirk von Suchodoletz, et al.
bwIDM: Anbindung nicht-webbasierterIT-Infrastrukturen an eine
SAML/Shibboleth-Föderation
Richard Zahoransky∗, Saher Semaan†
Universität Freiburg
Zusammenfassung: Diese Arbeit beschreibt eine Proof-of-Concept Imple-mentation einer Föderation aus existierenden webbasierten und nicht-webba-sierter Diensten. Die Dienste der Föderation werden durch SAML / ECP ge-genseitig zugänglich gemacht, ohne eine zentrale Nutzerdatenbank vorhaltenzu müssen. Die einzelnen Föderationskomponenten vertrauen untereinanderdurch Zertifikate und Metadaten. Eine PAM-ECP-Implementierung wird ge-zeigt, die es ermöglicht, nicht-webbasierte Dienste mittels Shibboleth / ECPder Föderation anzuschließen. Die resultierenden Fragen des Datenschutzes,der Datenweitergabe und Sicherheit werden diskutiert.
1 Einleitung
Die Nutzung von organisationsübergreifenden Diensten innerhalb einer Fö-deration verschiedener Institutionen ist für viele Forschungsdisziplinen inder heutigen Zeit unvermeidlich und sogar notwendig. Das hier vorgestellteProjekt bwIDM1 hat das Ziel, verteilt angebotene Ressourcen und Diensteder Universitäten des Landes Baden-Württemberg aus einem lokalen Kon-text heraus zugänglich zu machen. Universitätsmitglieder sollen in der Lagesein, verschiedenste, auch nicht web-webbasierte Dienste (z.B. Desktop-Anwendungen, Grid- oder Cloud-Dienste) innerhalb und außerhalb der ei-
∗ [email protected]† [email protected] bwIDM: Übergreifendes Identitätsmanagement, http://www.bwidm.de/, letzter Aufruf:26.04.2012
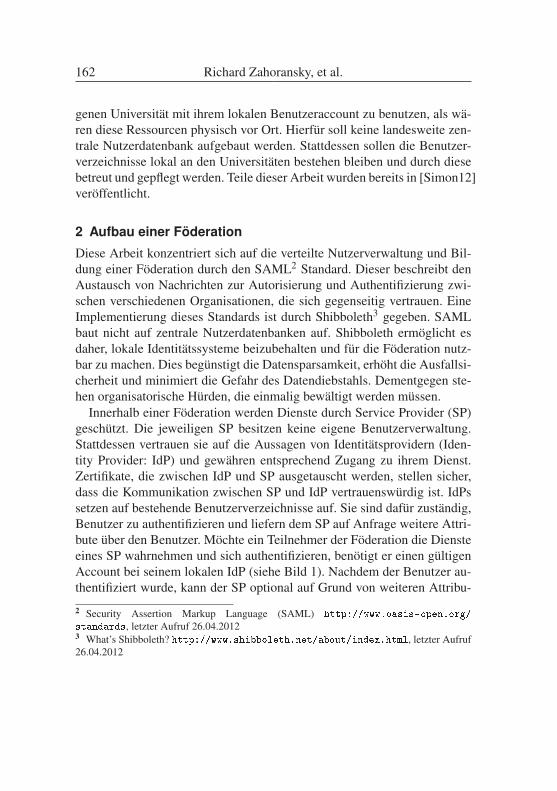
genen Universität mit ihrem lokalen Benutzeraccount zu benutzen, als wä-ren diese Ressourcen physisch vor Ort. Hierfür soll keine landesweite zen-trale Nutzerdatenbank aufgebaut werden. Stattdessen sollen die Benutzer-verzeichnisse lokal an den Universitäten bestehen bleiben und durch diesebetreut und gepflegt werden. Teile dieser Arbeit wurden bereits in [Simon12]veröffentlicht.
2 Aufbau einer Föderation
Diese Arbeit konzentriert sich auf die verteilte Nutzerverwaltung und Bil-dung einer Föderation durch den SAML2 Standard. Dieser beschreibt denAustausch von Nachrichten zur Autorisierung und Authentifizierung zwi-schen verschiedenen Organisationen, die sich gegenseitig vertrauen. EineImplementierung dieses Standards ist durch Shibboleth3 gegeben. SAMLbaut nicht auf zentrale Nutzerdatenbanken auf. Shibboleth ermöglicht esdaher, lokale Identitätssysteme beizubehalten und für die Föderation nutz-bar zu machen. Dies begünstigt die Datensparsamkeit, erhöht die Ausfallsi-cherheit und minimiert die Gefahr des Datendiebstahls. Dementgegen ste-hen organisatorische Hürden, die einmalig bewältigt werden müssen.
Innerhalb einer Föderation werden Dienste durch Service Provider (SP)geschützt. Die jeweiligen SP besitzen keine eigene Benutzerverwaltung.Stattdessen vertrauen sie auf die Aussagen von Identitätsprovidern (Iden-tity Provider: IdP) und gewähren entsprechend Zugang zu ihrem Dienst.Zertifikate, die zwischen IdP und SP ausgetauscht werden, stellen sicher,dass die Kommunikation zwischen SP und IdP vertrauenswürdig ist. IdPssetzen auf bestehende Benutzerverzeichnisse auf. Sie sind dafür zuständig,Benutzer zu authentifizieren und liefern dem SP auf Anfrage weitere Attri-bute über den Benutzer. Möchte ein Teilnehmer der Föderation die Diensteeines SP wahrnehmen und sich authentifizieren, benötigt er einen gültigenAccount bei seinem lokalen IdP (siehe Bild 1). Nachdem der Benutzer au-thentifiziert wurde, kann der SP optional auf Grund von weiteren Attribu-
2 Security Assertion Markup Language (SAML) http://www.oasis-open.org/
standards, letzter Aufruf 26.04.20123 What’s Shibboleth? http://www.shibboleth.net/about/index.html, letzter Aufruf26.04.2012
162 Richard Zahoransky, et al.
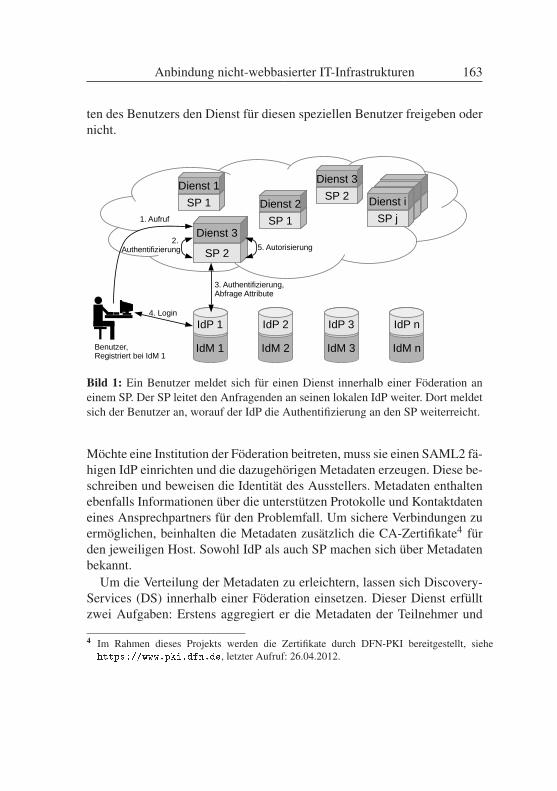
ten des Benutzers den Dienst für diesen speziellen Benutzer freigeben odernicht.
Benutzer,Registriert bei IdM 1
SP 1
Dienst 1
IdM 1
IdP 1
IdM 2
IdP 2
IdM 3
IdP 3
IdM n
IdP n
SP 2
Dienst 31. Aufruf
3. Authentifizierung,Abfrage Attribute
5. Autorisierung
4. Login
2. Authentifizierung
SP 1
Dienst 2SP 2
Dienst 3
SP j
Dienst i
SP j
Dienst i
SP j
Dienst i
Bild 1: Ein Benutzer meldet sich für einen Dienst innerhalb einer Föderation aneinem SP. Der SP leitet den Anfragenden an seinen lokalen IdP weiter. Dort meldetsich der Benutzer an, worauf der IdP die Authentifizierung an den SP weiterreicht.
Möchte eine Institution der Föderation beitreten, muss sie einen SAML2 fä-higen IdP einrichten und die dazugehörigen Metadaten erzeugen. Diese be-schreiben und beweisen die Identität des Ausstellers. Metadaten enthaltenebenfalls Informationen über die unterstützen Protokolle und Kontaktdateneines Ansprechpartners für den Problemfall. Um sichere Verbindungen zuermöglichen, beinhalten die Metadaten zusätzlich die CA-Zertifikate4 fürden jeweiligen Host. Sowohl IdP als auch SP machen sich über Metadatenbekannt.
Um die Verteilung der Metadaten zu erleichtern, lassen sich Discovery-Services (DS) innerhalb einer Föderation einsetzen. Dieser Dienst erfülltzwei Aufgaben: Erstens aggregiert er die Metadaten der Teilnehmer und
4 Im Rahmen dieses Projekts werden die Zertifikate durch DFN-PKI bereitgestellt, siehehttps://www.pki.dfn.de, letzter Aufruf: 26.04.2012.
Anbindung nicht-webbasierter IT-Infrastrukturen 163
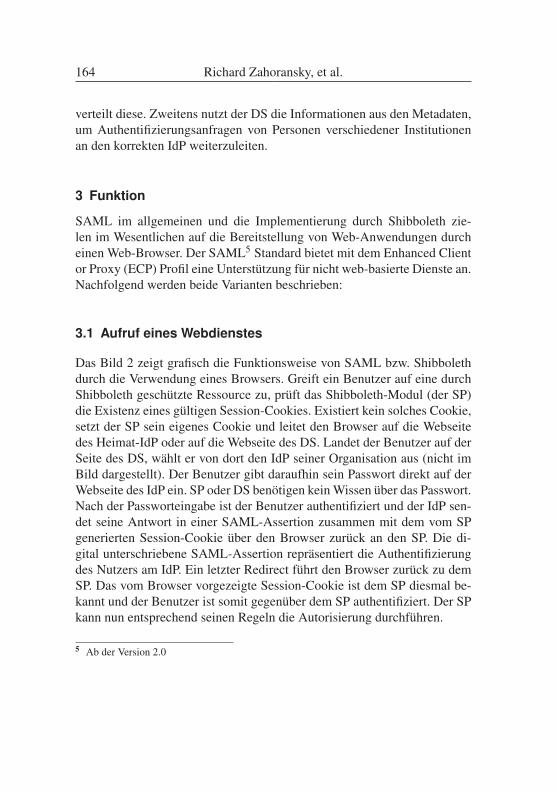
verteilt diese. Zweitens nutzt der DS die Informationen aus den Metadaten,um Authentifizierungsanfragen von Personen verschiedener Institutionenan den korrekten IdP weiterzuleiten.
3 Funktion
SAML im allgemeinen und die Implementierung durch Shibboleth zie-len im Wesentlichen auf die Bereitstellung von Web-Anwendungen durcheinen Web-Browser. Der SAML5 Standard bietet mit dem Enhanced Clientor Proxy (ECP) Profil eine Unterstützung für nicht web-basierte Dienste an.Nachfolgend werden beide Varianten beschrieben:
3.1 Aufruf eines Webdienstes
Das Bild 2 zeigt grafisch die Funktionsweise von SAML bzw. Shibbolethdurch die Verwendung eines Browsers. Greift ein Benutzer auf eine durchShibboleth geschützte Ressource zu, prüft das Shibboleth-Modul (der SP)die Existenz eines gültigen Session-Cookies. Existiert kein solches Cookie,setzt der SP sein eigenes Cookie und leitet den Browser auf die Webseitedes Heimat-IdP oder auf die Webseite des DS. Landet der Benutzer auf derSeite des DS, wählt er von dort den IdP seiner Organisation aus (nicht imBild dargestellt). Der Benutzer gibt daraufhin sein Passwort direkt auf derWebseite des IdP ein. SP oder DS benötigen kein Wissen über das Passwort.Nach der Passworteingabe ist der Benutzer authentifiziert und der IdP sen-det seine Antwort in einer SAML-Assertion zusammen mit dem vom SPgenerierten Session-Cookie über den Browser zurück an den SP. Die di-gital unterschriebene SAML-Assertion repräsentiert die Authentifizierungdes Nutzers am IdP. Ein letzter Redirect führt den Browser zurück zu demSP. Das vom Browser vorgezeigte Session-Cookie ist dem SP diesmal be-kannt und der Benutzer ist somit gegenüber dem SP authentifiziert. Der SPkann nun entsprechend seinen Regeln die Autorisierung durchführen.
5 Ab der Version 2.0
164 Richard Zahoransky, et al.
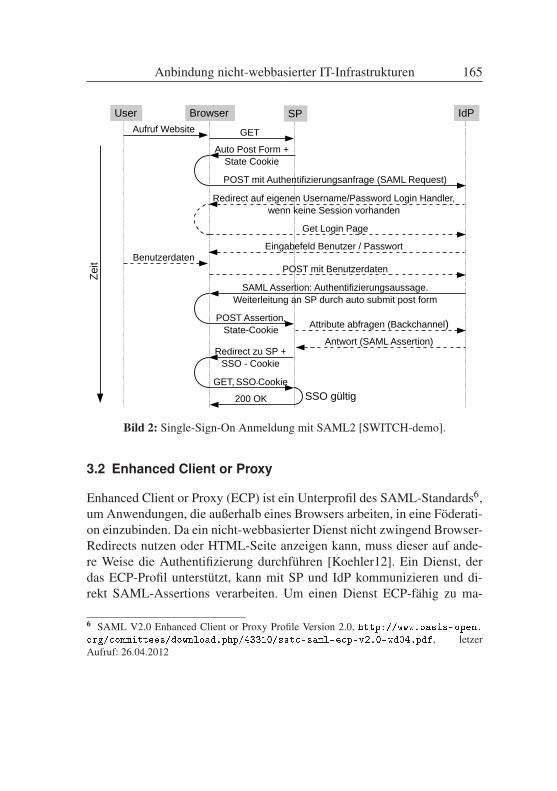
User Browser SP IdP
Aufruf Website GET
SAML Assertion: Authentifizierungsaussage. Weiterleitung an SP durch auto submit post form
POST Assertion, State-Cookie
Attribute abfragen (Backchannel)
Antwort (SAML Assertion)
200 OK
Redirect auf eigenen Username/Password Login Handler, wenn keine Session vorhanden
Benutzerdaten POST mit Benutzerdaten
Redirect zu SP + SSO - Cookie
GET, SSO-Cookie
Auto Post Form + State Cookie
POST mit Authentifizierungsanfrage (SAML Request)
Eingabefeld Benutzer / Passwort
Get Login Page
SSO gültig
Zei
t
Bild 2: Single-Sign-On Anmeldung mit SAML2 [SWITCH-demo].
3.2 Enhanced Client or Proxy
Enhanced Client or Proxy (ECP) ist ein Unterprofil des SAML-Standards6,um Anwendungen, die außerhalb eines Browsers arbeiten, in eine Föderati-on einzubinden. Da ein nicht-webbasierter Dienst nicht zwingend Browser-Redirects nutzen oder HTML-Seite anzeigen kann, muss dieser auf ande-re Weise die Authentifizierung durchführen [Koehler12]. Ein Dienst, derdas ECP-Profil unterstützt, kann mit SP und IdP kommunizieren und di-rekt SAML-Assertions verarbeiten. Um einen Dienst ECP-fähig zu ma-
6 SAML V2.0 Enhanced Client or Proxy Profile Version 2.0, http://www.oasis-open.org/committees/download.php/43310/sstc-saml-ecp-v2.0-wd04.pdf, letzerAufruf: 26.04.2012
Anbindung nicht-webbasierter IT-Infrastrukturen 165
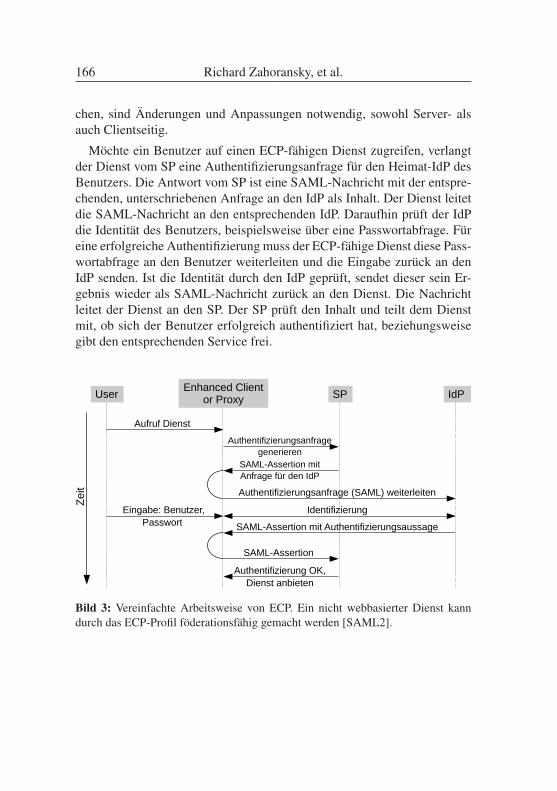
chen, sind Änderungen und Anpassungen notwendig, sowohl Server- alsauch Clientseitig.
Möchte ein Benutzer auf einen ECP-fähigen Dienst zugreifen, verlangtder Dienst vom SP eine Authentifizierungsanfrage für den Heimat-IdP desBenutzers. Die Antwort vom SP ist eine SAML-Nachricht mit der entspre-chenden, unterschriebenen Anfrage an den IdP als Inhalt. Der Dienst leitetdie SAML-Nachricht an den entsprechenden IdP. Daraufhin prüft der IdPdie Identität des Benutzers, beispielsweise über eine Passwortabfrage. Füreine erfolgreiche Authentifizierung muss der ECP-fähige Dienst diese Pass-wortabfrage an den Benutzer weiterleiten und die Eingabe zurück an denIdP senden. Ist die Identität durch den IdP geprüft, sendet dieser sein Er-gebnis wieder als SAML-Nachricht zurück an den Dienst. Die Nachrichtleitet der Dienst an den SP. Der SP prüft den Inhalt und teilt dem Dienstmit, ob sich der Benutzer erfolgreich authentifiziert hat, beziehungsweisegibt den entsprechenden Service frei.
UserEnhanced Client
or Proxy SP IdP
Aufruf Dienst
SAML-Assertion mit Anfrage für den IdP
Authentifizierungsanfrage (SAML) weiterleiten
Authentifizierung OK, Dienst anbieten
SAML-Assertion mit Authentifizierungsaussage
Eingabe: Benutzer, Passwort
SAML-Assertion
Authentifizierungsanfrage generieren
Identifizierung
Zei
t
Bild 3: Vereinfachte Arbeitsweise von ECP. Ein nicht webbasierter Dienst kanndurch das ECP-Profil föderationsfähig gemacht werden [SAML2].
166 Richard Zahoransky, et al.
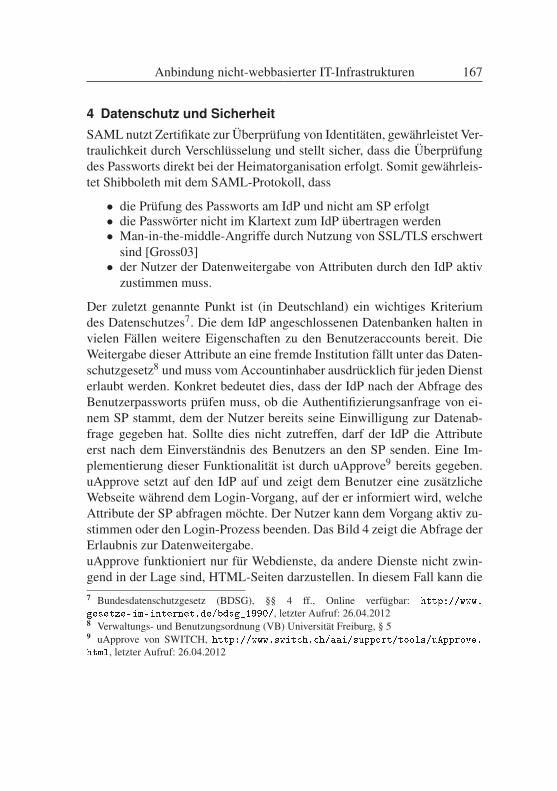
4 Datenschutz und SicherheitSAML nutzt Zertifikate zur Überprüfung von Identitäten, gewährleistet Ver-traulichkeit durch Verschlüsselung und stellt sicher, dass die Überprüfungdes Passworts direkt bei der Heimatorganisation erfolgt. Somit gewährleis-tet Shibboleth mit dem SAML-Protokoll, dass
• die Prüfung des Passworts am IdP und nicht am SP erfolgt• die Passwörter nicht im Klartext zum IdP übertragen werden• Man-in-the-middle-Angriffe durch Nutzung von SSL/TLS erschwert
sind [Gross03]• der Nutzer der Datenweitergabe von Attributen durch den IdP aktiv
zustimmen muss.
Der zuletzt genannte Punkt ist (in Deutschland) ein wichtiges Kriteriumdes Datenschutzes7. Die dem IdP angeschlossenen Datenbanken halten invielen Fällen weitere Eigenschaften zu den Benutzeraccounts bereit. DieWeitergabe dieser Attribute an eine fremde Institution fällt unter das Daten-schutzgesetz8 und muss vom Accountinhaber ausdrücklich für jeden Diensterlaubt werden. Konkret bedeutet dies, dass der IdP nach der Abfrage desBenutzerpassworts prüfen muss, ob die Authentifizierungsanfrage von ei-nem SP stammt, dem der Nutzer bereits seine Einwilligung zur Datenab-frage gegeben hat. Sollte dies nicht zutreffen, darf der IdP die Attributeerst nach dem Einverständnis des Benutzers an den SP senden. Eine Im-plementierung dieser Funktionalität ist durch uApprove9 bereits gegeben.uApprove setzt auf den IdP auf und zeigt dem Benutzer eine zusätzlicheWebseite während dem Login-Vorgang, auf der er informiert wird, welcheAttribute der SP abfragen möchte. Der Nutzer kann dem Vorgang aktiv zu-stimmen oder den Login-Prozess beenden. Das Bild 4 zeigt die Abfrage derErlaubnis zur Datenweitergabe.uApprove funktioniert nur für Webdienste, da andere Dienste nicht zwin-gend in der Lage sind, HTML-Seiten darzustellen. In diesem Fall kann die7 Bundesdatenschutzgesetz (BDSG), §§ 4 ff., Online verfügbar: http://www.
gesetze-im-internet.de/bdsg_1990/, letzter Aufruf: 26.04.20128 Verwaltungs- und Benutzungsordnung (VB) Universität Freiburg, § 59 uApprove von SWITCH, http://www.switch.ch/aai/support/tools/uApprove.html, letzter Aufruf: 26.04.2012
Anbindung nicht-webbasierter IT-Infrastrukturen 167
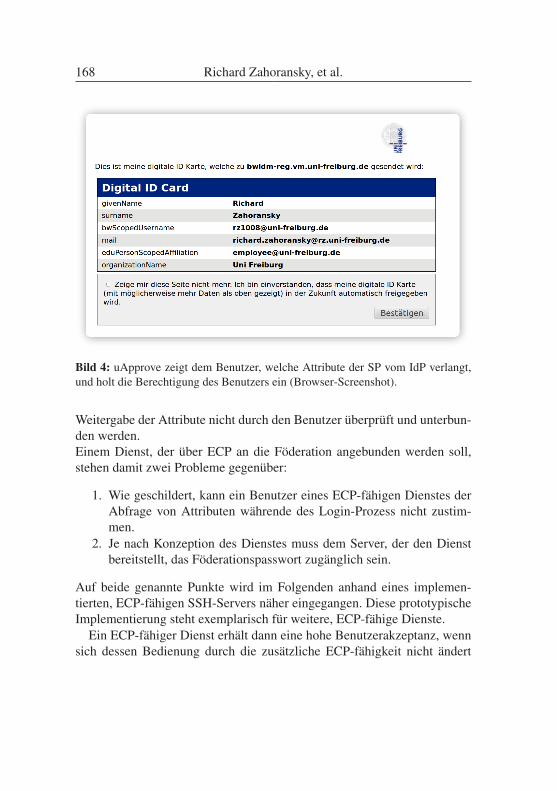
Bild 4: uApprove zeigt dem Benutzer, welche Attribute der SP vom IdP verlangt,und holt die Berechtigung des Benutzers ein (Browser-Screenshot).
Weitergabe der Attribute nicht durch den Benutzer überprüft und unterbun-den werden.Einem Dienst, der über ECP an die Föderation angebunden werden soll,stehen damit zwei Probleme gegenüber:
1. Wie geschildert, kann ein Benutzer eines ECP-fähigen Dienstes derAbfrage von Attributen währende des Login-Prozess nicht zustim-men.
2. Je nach Konzeption des Dienstes muss dem Server, der den Dienstbereitstellt, das Föderationspasswort zugänglich sein.
Auf beide genannte Punkte wird im Folgenden anhand eines implemen-tierten, ECP-fähigen SSH-Servers näher eingegangen. Diese prototypischeImplementierung steht exemplarisch für weitere, ECP-fähige Dienste.
Ein ECP-fähiger Dienst erhält dann eine hohe Benutzerakzeptanz, wennsich dessen Bedienung durch die zusätzliche ECP-fähigkeit nicht ändert
168 Richard Zahoransky, et al.
[Amberg03]. Für das hier gezeigte Proof-of-Concept ist das der Fall. DerSSH-Client bedarf keiner Modifikation und verhält sich für den Anwen-der wie gewohnt. Auf der Server-Seite wurde ein Pluggable Authenticati-on Module (PAM) [Morgan97] entwickelt, das die Authentifizierung durchECP am SP und IdP durchführt. Das bedeutet, dass nur der SSH-ServerECP-fähig ist und nur dieser die Authentifizierung mit dem SP und IdPabwickeln kann. Damit der Server die Authentifizierung im Namen desBenutzers durchführen kann, benötigt dieser das vom Benutzer geliefertePasswort, wie es in Bild 5 beschrieben ist. Hierdurch erhält der ECP-fähigeServer Zugang zu dem Benutzeraccount:
• Der ECP-fähige Dienst nimmt das Benutzerpasswort selbst entgegenund hat somit unkontrollierten Zugriff auf den Benutzeraccount.
• Der Dienst ist in der Lage, den IdP nach Attributen abzufragen, ohnedie Herausgabe dieser Attribute vom Benutzer erlauben zu lassen.
Diese beiden Punkte entsprechen weder dem SAML-Standard noch demDatenschutzgesetz. Die demonstrierte Beispielimplementierung bietet denFöderationsmitglieder mehrere Möglichkeiten, den SSH-Server zu nutzen.Somit lassen sich die beiden genannten Probleme umgehen. Eine vorge-schaltete Login-Seite stellt sicher, dass der Benutzer sein Föderationspass-wort dem SSH-Server nicht preisgeben muss, und gewährleistet, dass derBenutzer der Weitergabe seiner Attribute zustimmen muss. Im Folgendenwerden verschiedene Ansätze zur Ermöglichung eines ECP-fähigen SSH-Dienstes diskutiert. Darauf aufbauend wird die momentane Implementie-rung des Proof-of-Concepts eingehender beschrieben. Die Tabelle 1 zeigteine Übersicht der hier diskutierten, möglichen Varianten eines ECP-fähi-gen SSH-Dienstes an.
4.1 Anonymer Zugang
Mitgliedern der Föderation könnte es ermöglicht werden, sich mit ihremNutzernamen und ihrem Benutzerpasswort der Heimatorganisation direktam ECP fähigen SSH-Server anzumelden. Das Benutzerpasswort muss demSSH-Server anvertraut werden, damit dieser den Heimat-IdP fragen kann,
Anbindung nicht-webbasierter IT-Infrastrukturen 169
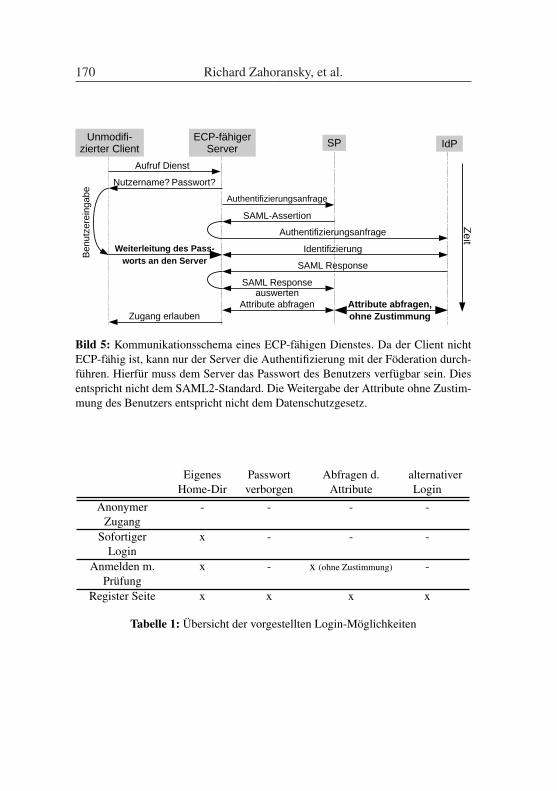
Unmodifi-zierter Client
ECP-fähiger Server SP IdP
Aufruf Dienst
Nutzername? Passwort?
Authentifizierungsanfrage
SAML Response auswerten
Zugang erlauben
SAML Response
Ben
utze
rein
gabe
SAML-Assertion
Authentifizierungsanfrage
Identifizierung
Zeit
Attribute abfragen Attribute abfragen,ohne Zustimmung
Weiterleitung des Pass-worts an den Server
Bild 5: Kommunikationsschema eines ECP-fähigen Dienstes. Da der Client nichtECP-fähig ist, kann nur der Server die Authentifizierung mit der Föderation durch-führen. Hierfür muss dem Server das Passwort des Benutzers verfügbar sein. Diesentspricht nicht dem SAML2-Standard. Die Weitergabe der Attribute ohne Zustim-mung des Benutzers entspricht nicht dem Datenschutzgesetz.
EigenesHome-Dir
Passwortverborgen
Abfragen d.Attribute
alternativerLogin
AnonymerZugang
- - - -
SofortigerLogin
x - - -
Anmelden m.Prüfung
x - x (ohne Zustimmung) -
Register Seite x x x x
Tabelle 1: Übersicht der vorgestellten Login-Möglichkeiten
170 Richard Zahoransky, et al.
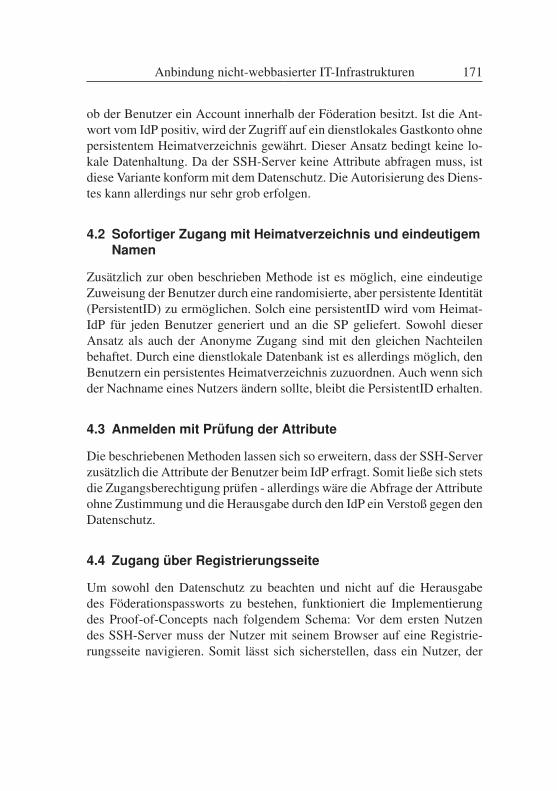
ob der Benutzer ein Account innerhalb der Föderation besitzt. Ist die Ant-wort vom IdP positiv, wird der Zugriff auf ein dienstlokales Gastkonto ohnepersistentem Heimatverzeichnis gewährt. Dieser Ansatz bedingt keine lo-kale Datenhaltung. Da der SSH-Server keine Attribute abfragen muss, istdiese Variante konform mit dem Datenschutz. Die Autorisierung des Diens-tes kann allerdings nur sehr grob erfolgen.
4.2 Sofortiger Zugang mit Heimatverzeichnis und eindeutigemNamen
Zusätzlich zur oben beschrieben Methode ist es möglich, eine eindeutigeZuweisung der Benutzer durch eine randomisierte, aber persistente Identität(PersistentID) zu ermöglichen. Solch eine persistentID wird vom Heimat-IdP für jeden Benutzer generiert und an die SP geliefert. Sowohl dieserAnsatz als auch der Anonyme Zugang sind mit den gleichen Nachteilenbehaftet. Durch eine dienstlokale Datenbank ist es allerdings möglich, denBenutzern ein persistentes Heimatverzeichnis zuzuordnen. Auch wenn sichder Nachname eines Nutzers ändern sollte, bleibt die PersistentID erhalten.
4.3 Anmelden mit Prüfung der Attribute
Die beschriebenen Methoden lassen sich so erweitern, dass der SSH-Serverzusätzlich die Attribute der Benutzer beim IdP erfragt. Somit ließe sich stetsdie Zugangsberechtigung prüfen - allerdings wäre die Abfrage der Attributeohne Zustimmung und die Herausgabe durch den IdP ein Verstoß gegen denDatenschutz.
4.4 Zugang über Registrierungsseite
Um sowohl den Datenschutz zu beachten und nicht auf die Herausgabedes Föderationspassworts zu bestehen, funktioniert die Implementierungdes Proof-of-Concepts nach folgendem Schema: Vor dem ersten Nutzendes SSH-Server muss der Nutzer mit seinem Browser auf eine Registrie-rungsseite navigieren. Somit lässt sich sicherstellen, dass ein Nutzer, der
Anbindung nicht-webbasierter IT-Infrastrukturen 171
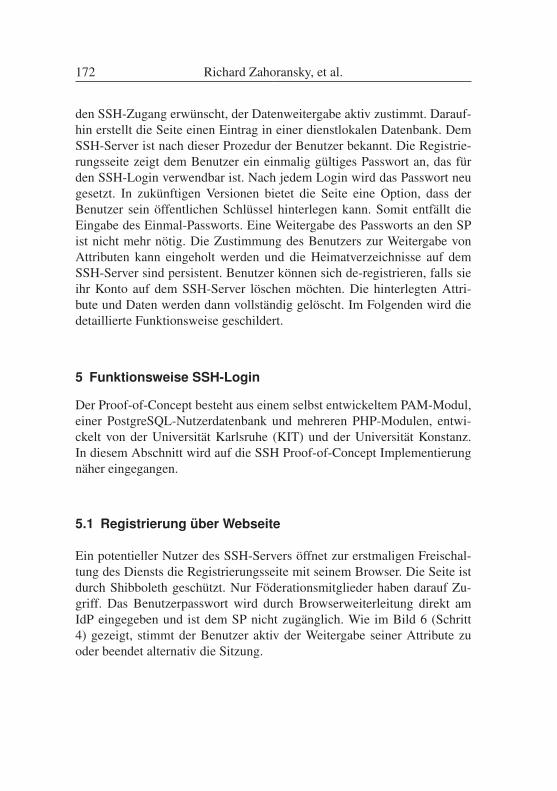
den SSH-Zugang erwünscht, der Datenweitergabe aktiv zustimmt. Darauf-hin erstellt die Seite einen Eintrag in einer dienstlokalen Datenbank. DemSSH-Server ist nach dieser Prozedur der Benutzer bekannt. Die Registrie-rungsseite zeigt dem Benutzer ein einmalig gültiges Passwort an, das fürden SSH-Login verwendbar ist. Nach jedem Login wird das Passwort neugesetzt. In zukünftigen Versionen bietet die Seite eine Option, dass derBenutzer sein öffentlichen Schlüssel hinterlegen kann. Somit entfällt dieEingabe des Einmal-Passworts. Eine Weitergabe des Passworts an den SPist nicht mehr nötig. Die Zustimmung des Benutzers zur Weitergabe vonAttributen kann eingeholt werden und die Heimatverzeichnisse auf demSSH-Server sind persistent. Benutzer können sich de-registrieren, falls sieihr Konto auf dem SSH-Server löschen möchten. Die hinterlegten Attri-bute und Daten werden dann vollständig gelöscht. Im Folgenden wird diedetaillierte Funktionsweise geschildert.
5 Funktionsweise SSH-Login
Der Proof-of-Concept besteht aus einem selbst entwickeltem PAM-Modul,einer PostgreSQL-Nutzerdatenbank und mehreren PHP-Modulen, entwi-ckelt von der Universität Karlsruhe (KIT) und der Universität Konstanz.In diesem Abschnitt wird auf die SSH Proof-of-Concept Implementierungnäher eingegangen.
5.1 Registrierung über Webseite
Ein potentieller Nutzer des SSH-Servers öffnet zur erstmaligen Freischal-tung des Diensts die Registrierungsseite mit seinem Browser. Die Seite istdurch Shibboleth geschützt. Nur Föderationsmitglieder haben darauf Zu-griff. Das Benutzerpasswort wird durch Browserweiterleitung direkt amIdP eingegeben und ist dem SP nicht zugänglich. Wie im Bild 6 (Schritt4) gezeigt, stimmt der Benutzer aktiv der Weitergabe seiner Attribute zuoder beendet alternativ die Sitzung.
172 Richard Zahoransky, et al.
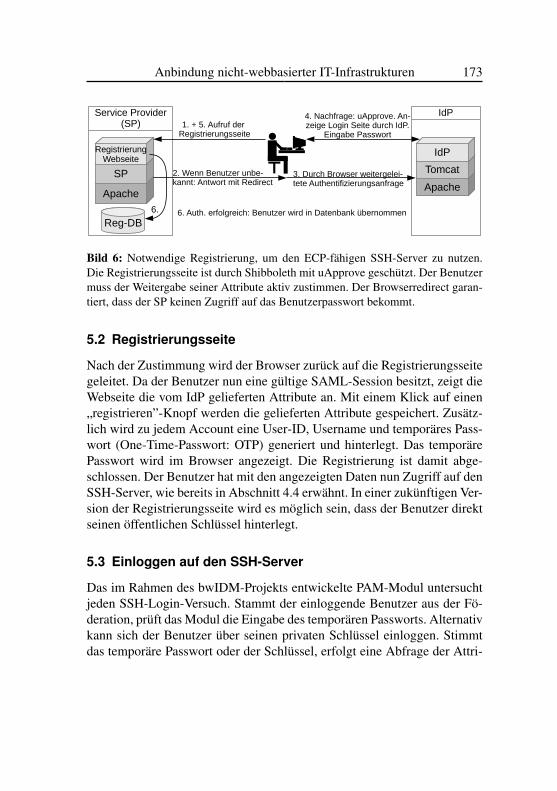
Service Provider (SP)
Apache
SP
RegistrierungWebseite
Reg-DB
IdP
Apache
Tomcat
IdP
6. Auth. erfolgreich: Benutzer wird in Datenbank übernommen6.
1. + 5. Aufruf der Registrierungsseite
2. Wenn Benutzer unbe-kannt: Antwort mit Redirect
3. Durch Browser weitergelei-tete Authentifizierungsanfrage
4. Nachfrage: uApprove. An-zeige Login Seite durch IdP.
Eingabe Passwort
Bild 6: Notwendige Registrierung, um den ECP-fähigen SSH-Server zu nutzen.Die Registrierungsseite ist durch Shibboleth mit uApprove geschützt. Der Benutzermuss der Weitergabe seiner Attribute aktiv zustimmen. Der Browserredirect garan-tiert, dass der SP keinen Zugriff auf das Benutzerpasswort bekommt.
5.2 Registrierungsseite
Nach der Zustimmung wird der Browser zurück auf die Registrierungsseitegeleitet. Da der Benutzer nun eine gültige SAML-Session besitzt, zeigt dieWebseite die vom IdP gelieferten Attribute an. Mit einem Klick auf einen„registrieren”-Knopf werden die gelieferten Attribute gespeichert. Zusätz-lich wird zu jedem Account eine User-ID, Username und temporäres Pass-wort (One-Time-Passwort: OTP) generiert und hinterlegt. Das temporärePasswort wird im Browser angezeigt. Die Registrierung ist damit abge-schlossen. Der Benutzer hat mit den angezeigten Daten nun Zugriff auf denSSH-Server, wie bereits in Abschnitt 4.4 erwähnt. In einer zukünftigen Ver-sion der Registrierungsseite wird es möglich sein, dass der Benutzer direktseinen öffentlichen Schlüssel hinterlegt.
5.3 Einloggen auf den SSH-Server
Das im Rahmen des bwIDM-Projekts entwickelte PAM-Modul untersuchtjeden SSH-Login-Versuch. Stammt der einloggende Benutzer aus der Fö-deration, prüft das Modul die Eingabe des temporären Passworts. Alternativkann sich der Benutzer über seinen privaten Schlüssel einloggen. Stimmtdas temporäre Passwort oder der Schlüssel, erfolgt eine Abfrage der Attri-
Anbindung nicht-webbasierter IT-Infrastrukturen 173
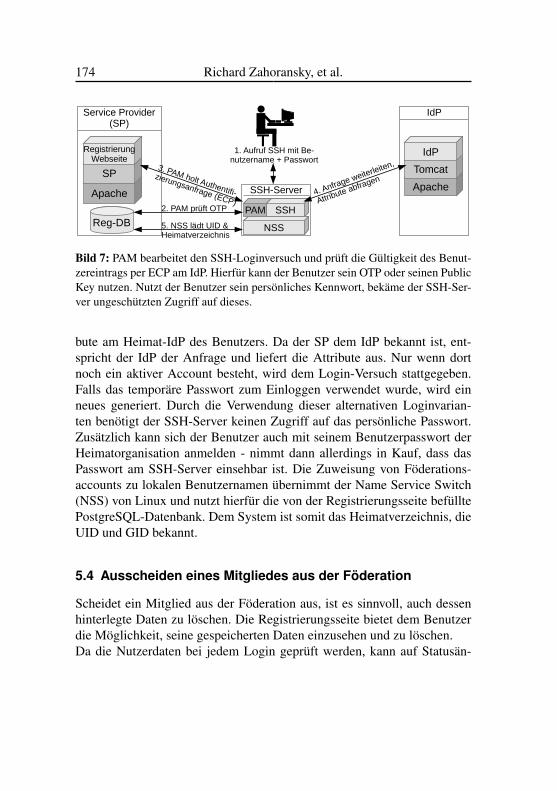
IdP
Apache
Tomcat
IdP
Service Provider (SP)
Apache
SP
RegistrierungWebseite
Reg-DB
SSH-Server
PAM SSH
NSS
1. Aufruf SSH mit Be-nutzername + Passwort
2. PAM prüft OTP
3. PAM holt Authentifi-
zierungsanfrage (ECP)4. Anfrage weiterleiten,
Attribute abfragen
5. NSS lädt UID & Heimatverzeichnis
Bild 7: PAM bearbeitet den SSH-Loginversuch und prüft die Gültigkeit des Benut-zereintrags per ECP am IdP. Hierfür kann der Benutzer sein OTP oder seinen PublicKey nutzen. Nutzt der Benutzer sein persönliches Kennwort, bekäme der SSH-Ser-ver ungeschützten Zugriff auf dieses.
bute am Heimat-IdP des Benutzers. Da der SP dem IdP bekannt ist, ent-spricht der IdP der Anfrage und liefert die Attribute aus. Nur wenn dortnoch ein aktiver Account besteht, wird dem Login-Versuch stattgegeben.Falls das temporäre Passwort zum Einloggen verwendet wurde, wird einneues generiert. Durch die Verwendung dieser alternativen Loginvarian-ten benötigt der SSH-Server keinen Zugriff auf das persönliche Passwort.Zusätzlich kann sich der Benutzer auch mit seinem Benutzerpasswort derHeimatorganisation anmelden - nimmt dann allerdings in Kauf, dass dasPasswort am SSH-Server einsehbar ist. Die Zuweisung von Föderations-accounts zu lokalen Benutzernamen übernimmt der Name Service Switch(NSS) von Linux und nutzt hierfür die von der Registrierungsseite befülltePostgreSQL-Datenbank. Dem System ist somit das Heimatverzeichnis, dieUID und GID bekannt.
5.4 Ausscheiden eines Mitgliedes aus der Föderation
Scheidet ein Mitglied aus der Föderation aus, ist es sinnvoll, auch dessenhinterlegte Daten zu löschen. Die Registrierungsseite bietet dem Benutzerdie Möglichkeit, seine gespeicherten Daten einzusehen und zu löschen.Da die Nutzerdaten bei jedem Login geprüft werden, kann auf Statusän-
174 Richard Zahoransky, et al.
derungen eines Benutzers reagiert werden, ohne dass es einer manuellen,lokalen Datenbankpflege benötigt. Das PAM-Modul prüft bei jedem Lo-gin eines authentifizierten Nutzers dessen Attribute. Dabei wird geprüft, obdem Nutzer immer noch die nötigen Rechte innerhalb der Föderation zuge-wiesen sind und der Benutzer immer noch Teil der Föderation ist. Zugangwird gewährt, wenn sowohl die Zugangsdaten als auch die zugewiesene At-tribute gültig sind. Ändern sich die Attribute, werden diese Änderungen inder dienst-lokalen Datenbank übernommen. Scheidet ein Teilnehmer ausder Föderation aus, verweigert auch der SSH-Server den Zugang.
6 FazitIn dieser Arbeit wurde ein Überblick der SAML-Föderation gegeben. Eswurde gezeigt, dass SAML und Shibboleth konform mit den herrschendenDatenschutzbestimmungen arbeiten. Da sich manche Dienste nicht web-fä-hig machen lassen, besteht die Notwendigkeit, eine Authentifizierung ohnedie Anzeige von HTML-Seiten und HTTP-Redirects durchzuführen. Das inSAML integrierte ECP-Profil bietet diese Funktionalität. Anhand eines ex-emplarischen, ECP-fähigen SSH-Dienstes wurde gezeigt, dass nicht web-fähige Dienste über ECP in eine Föderation integrierbar sind. Eine im Rah-men des bwIDM-Projekts entwickelte Registrierungsseite ermöglicht ei-nem Benutzer, seine Datenfreigabe einzusehen und der Datenweitergabezuzustimmen. Ebenfalls ist dem Nutzer die Möglichkeit gegeben, alterna-tive Techniken für den Login zu nutzen. Die Weitergabe des Föderations-passworts an den Dienst ist nicht nötig. So bleiben die Datenschutzbestim-mungen berücksichtigt, und ein ECP-fähiger Dienst darf konform mit dengeltenden Bestimmungen auf die Attribute eines Benutzers zugreifen.
Anbindung nicht-webbasierter IT-Infrastrukturen 175
Literaturverzeichnis[Amberg03] Michael Amberg, Markus Hirschmeier und Deniz Schobert.
Dart - Ein Ansatz zur Analyse und Evaluierung der Benut-zerakzeptanz. In Wirtschaftinformatik Proceedings 2003.
[Gross03] T. Gross. Security analysis of the SAML single sign-on brow-ser/artifact profile. In Computer Security Applications Confe-rence, 2003. Proceedings. 19th Annual, pages 298 – 307, De-zember 2003.
[Koehler12] J. Köhler, S. Labitzke, M. Simon, M. Nussbaumer und H. Har-tenstein. FACIUS: An Easy-to-Deploy SAML-based Approachto Federate Non Web-Based Services. In IEEE Internatio-nal Conference on Trust, Security and Privacy in Compu-ting and Login-Node Communications (TrustCom-2012), Li-verpool, UK, Juni 2012.
[Morgan97] Andrew G. Morgan. Pluggable Authentication Modules forLinux: An implementation of a user-authentication API. LinuxJ., 1997(44es), Dezember 1997.
[SAML2] OASIS. Profiles for the OASIS Security Assertion MarkupLanguage (SAML) V2.0. Technical report, OASIS Standard,März 2005.
[SWITCH-demo] SWITCH. Expert AAI Demo. Online verfüg-bar: http://www.switch.ch/aai/demo/2/expert.html,Letzter Aufruf 25.04.2012.
[Simon12] Michael Simon, Marcel Waldvogel, Sven Schober, Saher Se-maan und Martin Nussbaumer. bwIDM: Föderieren auch nicht-webbasierender Dienste auf Basis von SAML. In DFN ForumKommunikationstechnologien, volume 5 of Lecture Notes inInformatics (LNI - Proceedings, GI-Edition), pages 119–128,Germany, Regensburg, Mai 2012.
176 Richard Zahoransky, et al.
Das bwGRiD Wissenschaftsportal
Christian Mosch∗, Bastian Boegel†, Helmut Lang‡
Universität Ulm
Zusammenfassung: Das bwGRiD Wissenschaftsportal [Mosch2011] bietetWissenschaftlern im Land Baden-Württemberg einen vereinfachten komman-dozeilenfreien Zugang zum bwGRiD [Dynowski2012] und dessen Applika-tionen. Neben umfangreichen Funktionen zum standortübergreifenden Job-und Datenmanagement stellt das Portal auch einfache webbasierte Benutzer-schnittstellen (Portlets) [Kussmaul2005] zu ausgewählten Programmen derThemenbereiche Chemie, Mikrosystemtechnik, Medizin, Ingenieurswissen-schaften, Workflowmanagement und Bioinformatik zur Verfügung. Anhandder grafischen Benutzerschnittstelle zu den Chemieapplikationen Gaussian[Frisch2009] und NWChem [Valiev2010] werden im Rahmen dieses Beitragseinige didaktische Konzepte zur Einbindung von Portlets in die Lehre erläu-tert. Um eine effiziente und schnelle Integration weiterer Applikationen in dasPortal zu ermöglichen, wurde eine Klonfunktionalität entwickelt, welche amBeispiel des Dacapo-Portlets vorgestellt wird. Sowohl neue als auch erfahreneNutzer profitieren von der Unterstützung durch einen Avatar, der die Anwen-der in Schritten durch Aufgaben leiten, zu einzelnen Portalelementen gezielteHilfestellungen geben und allgemeine Fragen beantworten kann. Die Basis fürdas Portal bildet die in einer Kooperation mit Kollegen am Karlsruher Institutfür Technologie (KIT) entwickelte Java-Bibliothek Gatlet [Bozic2011], wel-che die Schnittstelle zwischen Portal und Grid bereitstellt.
1 Einleitung und Übersicht
Das bwGRiD [Dynowski2012] ist ein Verbund von Hochleistungsrechnern,der im Rahmen einer Kooperation zwischen neun Universitäten, Fachhoch-schulen und Forschungseinrichtungen in Baden-Württemberg an mehrerenStandorten verteilt betrieben wird. Dabei soll die außerordentliche Rechen-leistung des bwGRiDs den Wissenschaftlerinnen und Wissenschaftlern imLand möglichst einfach und effizient zur Verfügung gestellt werden. Es hat
sich jedoch herausgestellt, dass der kommandozeilenbasierte Zugang mit-tels der Grid-Middleware Globus [Foster2006] und die Nutzung von Soft-ware über die Kommandozeile für Nutzer mit wenig Computererfahrungeine große Hürde sein kann. Daher ist ein wesentlicher Fokus der Entwick-lungen im bwGRiD eine Vereinfachung des Zugangs zum Grid. Das Absen-ken dieser Hürde war einer der Kernaspekte des bwGRiD Portalprojektes[Mosch2011], welches im Arbeitspaket 5 der ergänzenden Maßnahmen1
fortgeführt wird.Um dieses Ziel zu verwirklichen, muss folglich die obligatorische Ver-
wendung der Kommandozeile als Benutzerschnittstelle vermieden werden.Wesentliche Softwarepakete sollen durch eine grafische Benutzeroberflä-che erreichbar sein. Darüber hinaus muss sichergestellt werden, dass dieBenutzerschnittstellen bei Änderungen in der Softwarestruktur am Grid,zum Beispiel wenn sich der Name der Binärdatei einer Software ändert,möglichst zeitnah und für alle Nutzer transparent angepasst werden kön-nen. Auch sollen Nutzer verschiedener Betriebssysteme von unserem An-gebot in vollem Umfang profitieren. Ein portal- und browserbasierter An-satz kann diese Forderungen unmittelbar erfüllen und wurde deshalb auchausgewählt.
Aufgrund der hohen Komplexität der Vorgänge, welche bei der Ab-bildung von Gridmechanismen mit Zertifikaten und bei der Einbindungwissenschaftlicher Applikationen auftreten können, ist ein javabasiertesPortalsystem eine sinnvolle Ausgangsbasis für das Projekt. Dies wirdauch dadurch gestützt, dass viele Bibliotheken und Hilfsprogramme indiesem Umfeld in Java programmiert sind, zum Beispiel [Foster2006,Nieuwpoort2007, Hook2005, Herraez2007, ChemAxon2011]. Außerdembieten Portalsysteme in der Regel bereits ohne weiteren Programmierauf-wand wichtige Servicefunktionen, wie beispielsweise eine Nutzerverwal-tung und das Management von Portlets [Kussmaul2005]. Ausgehend voneiner Empfehlung des D-Grids2 und nach weiterer eigener Evaluation wur-de beim Start des Projektes das GridSphere Portal [Novotny2004] als Ba-sis für die Entwicklung unseres eigenen Portalsystems gewählt. Neben derunmittelbaren Unterstützung von Grid-Basisfunktionen waren dabei auch
1 http://www.bw-grid.de/bwservices/bwgrid-ergaenzende-massnahmen (Zu-griff 2012-05-21)2 http://iwrwww1.fzk.de/dgrid-neu/index.php?id=81 (Zugriff 2012-05-14)
178 Christian Mosch, et al.
das Zusammenspiel mit Portlets gemäß JSR168 Standard3 [Abdelnur2003]und die freie Verfügbarkeit im Rahmen von „Open Source“ ausschlagge-bend. Leider wurde die Weiterentwicklung von GridSphere während derProjektlaufzeit eingestellt. Dadurch fehlt zum Beispiel die Unterstützungfür den JSR286 Standard4 [Hepper2008] und es gibt keine Sicherheitsup-dates mehr. Daher wurde ein Umstieg auf ein anderes Portalsystem unver-meidbar. Nach einer ausführlichen Evaluation der am Markt verfügbaren„Open Source“ Portalsysteme mit JSR286 Unterstützung5, haben wir unsvor kurzem dazu entschlossen, alle Basisfunktionen und wesentliche Appli-kationsportlets zu dem Portalframework Liferay [Sezov2011] zu portieren.Neben den oben genannten Kriterien hat Liferay eine um Größenordnun-gen aktivere Community als vergleichbare Projekte und bietet außerdemauch kommerziellen Support. Bei der Portierung soll noch stärker auf ei-ne portalunabhängige Umsetzung geachtet werden. Alle über den StandardJSR286 hinausgehenden, für die Portlets unbedingt notwendigen Funktio-nen, zum Beispiel die Abfrage der Daten des aktuellen Nutzers mit seinenBerechtigungen oder die Interaktion mit dem Grid, werden dabei von dervon uns entwickelte Bibliothek Gatlet [Bozic2011] bereitgestellt.
Gatlet wird auch im bisherigen GridSphere-basierten Portal bereits in-tensiv verwendet und stellt wichtige Funktionen für den Zugriff auf dasGrid in einfacher Weise zur Verfügung. Einerseits erleichtert sich dadurchdie Portierung der Applikationsportlets erheblich, andererseits ermöglichendie Gatletmethoden den Portletprogrammierern eine effiziente und schnel-le Implementierung der Interaktion ihrer Portlets mit dem Grid. Gatletstellt jedoch nicht nur die Schnittstelle zum Grid bereit. Es verfügt dar-über hinaus auch über eine automatische Accountverwaltung, eine Res-sourcendatenbank, einen Ressourcenmonitor, einen Jobmonitor, einen Da-teibrowser, ein Metasubmit-System, ein E-Mail-System und viele weiterehilfreiche Funktionen. Zusätzlich stehen den Entwicklern mittels einer Tag-
3 Der JSR (Java Specification Request) 168 Standard beschreibt, wie Portlets beschaffen seinmüssen, damit sie gemeinsam reibungslos in einem Portal genutzt werden können.4 Der JSR 286 Standard ist eine Erweiterung des JSR 168 Standards.5 Siehe zum Beispiel http://holisticsecurity.wordpress.com/2011/06/
14/which-portal-solution-should-i-use und http://fleksray.org/
vergleich-enterprise-portale.html (Zugriff 2012-05-16).
Das bwGRiD Wissenschaftsportal 179
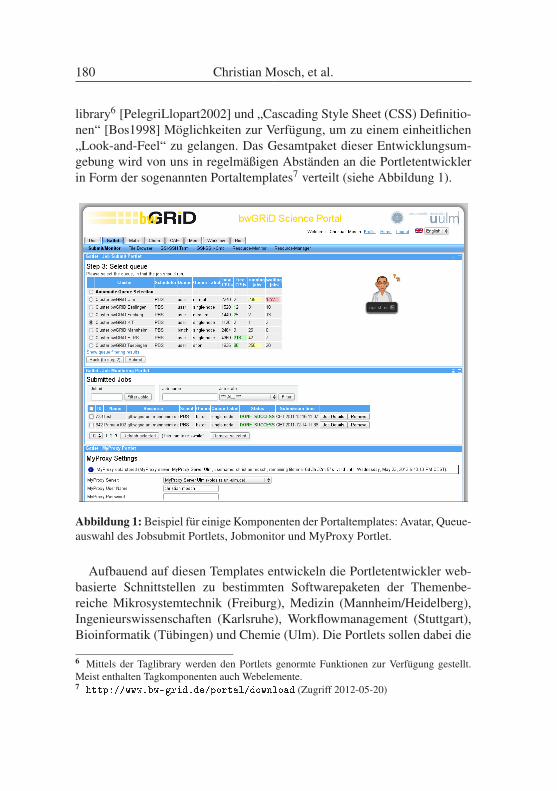
library6 [PelegriLlopart2002] und „Cascading Style Sheet (CSS) Definitio-nen“ [Bos1998] Möglichkeiten zur Verfügung, um zu einem einheitlichen„Look-and-Feel“ zu gelangen. Das Gesamtpaket dieser Entwicklungsum-gebung wird von uns in regelmäßigen Abständen an die Portletentwicklerin Form der sogenannten Portaltemplates7 verteilt (siehe Abbildung 1).
Abbildung 1: Beispiel für einige Komponenten der Portaltemplates: Avatar, Queue-auswahl des Jobsubmit Portlets, Jobmonitor und MyProxy Portlet.
Aufbauend auf diesen Templates entwickeln die Portletentwickler web-basierte Schnittstellen zu bestimmten Softwarepaketen der Themenbe-reiche Mikrosystemtechnik (Freiburg), Medizin (Mannheim/Heidelberg),Ingenieurswissenschaften (Karlsruhe), Workflowmanagement (Stuttgart),Bioinformatik (Tübingen) und Chemie (Ulm). Die Portlets sollen dabei die
6 Mittels der Taglibrary werden den Portlets genormte Funktionen zur Verfügung gestellt.Meist enthalten Tagkomponenten auch Webelemente.7 http://www.bw-grid.de/portal/download (Zugriff 2012-05-20)
180 Christian Mosch, et al.
Nutzer bei der Interaktion mit dem Grid bestmöglich unterstützen. Das be-deutet zum Beispiel, dass soweit möglich die Parameter für das Queueing-system automatisch gesetzt oder dass zumindest sinnvolle Standardwertemit klaren Hilfstexten zu den möglichen Wertebereichen angeboten wer-den. Darüber hinaus sollten die applikationsspezifischen Portlets die Nutzerbei der Verwendung der Softwarepakete unterstützen, etwa bei der Erzeu-gung von Eingabedaten oder beim Auswerten der Ergebnisse.
Ohne ein leistungsfähiges Hilfesystem wäre die Benutzerschnittstelledes Portals weniger komfortabel und effizient. Daher wurde zur Unter-stützung und Leitung des Nutzers ein Avatar entwickelt und in das Portalintegriert. Er bietet umfangreiche Hilfestellungen zu interaktiven Elemen-ten des Portals an, kann den Nutzer Schritt für Schritt durch verschiedeneAufgaben führen und besitzt die Fähigkeit, auf frei formulierte Fragen zuantworten. Sowohl Anfänger als auch erfahrene Nutzer profitieren von derUnterstützung durch den Avatar, da dieser den Nutzern die Kontrolle überden Ort und den Umfang der Hilfestellung lässt. Das Avatarsystem stehtdabei als Framework zur Verfügung, welches von den einzelnen Anwen-dungskomponenten verwendet werden kann.
Da die meisten Funktionen des Portals im Gatlet-Framework verankertsind und somit Gatlet die wesentliche Komponente für die Portlets ist,wird im Kapitel 2 eine Übersicht über die Struktur des Portals und dieFunktionen von Gatlet gegeben. Eine Möglichkeit für eine effiziente undschnelle Integration weiterer Applikationen in das Portal wird in Kapitel3 anhand der Klonfunktionalität des Dacapo-Portlets vorgestellt. Am Bei-spiel der grafischen Benutzerschnittstelle zu den Chemieapplikationen NW-Chem und Gaussian werden im Kapitel 4 einige didaktische Konzepte zurEinbindung von Portlets in die Lehre erläutert. Der aus Sicht des Nutzersunmittelbar und zu jeder Zeit hilfsbereite Avatar wird mit seinen im gesam-ten Portal wirkenden Möglichkeiten im Kapitel 5 präsentiert. Abschließendwerden im Kapitel 6 die weiteren Pläne bezüglich des Portals diskutiert.
2 Gatlet und die Portaltemplates
Alle im bwGRiD entwickelten Applikationsportlets basieren auf den vonUlm zur Verfügung gestellten Portaltemplates. Neben der rein funktionel-len Seite der Portaltemplates, die weiter unten beschrieben wird, besitzendie Templates auch mehrere logistische Funktionen. Zum einen fassen sie
Das bwGRiD Wissenschaftsportal 181
alle für die Entwicklung und den Betrieb erforderlichen Komponenten, wiezum Beispiel den Apache Tomcat Webserver [Vukotic2011], GridSphere[Novotny2004], JavaGAT [Nieuwpoort2007] (Grid Application Toolkit),Gatlet [Bozic2011] und mehrere Basis-, Service- und Beispielportlets zueinem Paket mit automatischer Installation zusammen. Dies reduziert fürdie Applikationsentwickler erheblich den Aufwand bei der Installation undsorgt dafür, dass die Entwickler schneller produktiv werden können. Zumanderen sorgt ein einheitliches Templatesystem dafür, dass alle Entwicklerauf der gleichen Basis arbeiten und so die Interoperabilität und Homogeni-tät der individuell erstellten, aber im gemeinsamen Portal bereitgestelltenPortlets einfacher sichergestellt werden kann.
Die zentrale Komponente des Portals ist Gatlet, welches mit Hilfe vonJavaGAT auf die Globus-Server des bwGRiDs zugreift. Abbildung 2 zeigteine Übersicht der verschiedenen Komponenten des Portals. In den folgen-den Absätzen wird beschrieben, wie die Komponenten des Diagramms beiden verschiedenen Abläufen im Portal zusammenspielen.
Beim ersten Zugriff auf das Portal authentifiziert sich der Benutzer viaHTTPS (Hypertext Transfer Protocol Secure) mittels seines im Browsergespeicherten Grid Nutzerzertifikats, ausgestellt von dem Deutschen For-schungsnetz (DFN)8. Danach kann der Nutzer auf alle Seiten des Portalszugreifen, jedoch noch nicht auf das Grid und auch nicht auf die Portlets,die ohne Gridzugriff nicht funktionieren können. Im nächsten Schritt lädtder Nutzer mittels des von uns für den Firefox entwickelten Grid ProxyManagers [Boegel2011] (siehe Abbildung 3) ein in der Regel sieben Ta-ge gültiges und mit einem Passwort geschütztes Proxyzertifikat9 auf einenMyProxy Server10 [Fleury2006]. Im letzten Schritt wird dann im Portalmittels des MyProxy Portlets (siehe Abbildung 1) aus dem Proxyzertifikatam MyProxy Server ein kurzlebiges Portal Proxyzertifikat abgeleitet. Nunhat der Nutzer den vollen Zugriff auf seine Accounts an allen Gridstand-orten.8 https://www.pki.dfn.de/grid (Zugriff 2012-05-18)9 Ein Proxyzertifikat ist ein Zertifikat mit kurzer Laufzeit, welches von dem ursprünglichenNutzerzertifikat abgeleitet worden ist.10 Unser MyProxy Server ist über das Internet direkt erreichbar. Das Übertragen und Speichernder Proxyzertifikate erfolgt ausschließlich authentifiziert und verschlüsselt.
182 Christian Mosch, et al.
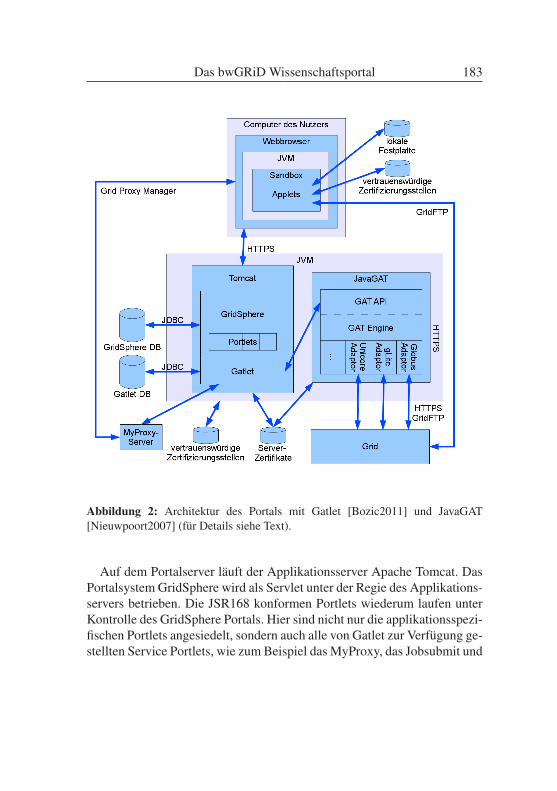
Abbildung 2: Architektur des Portals mit Gatlet [Bozic2011] und JavaGAT[Nieuwpoort2007] (für Details siehe Text).
Auf dem Portalserver läuft der Applikationsserver Apache Tomcat. DasPortalsystem GridSphere wird als Servlet unter der Regie des Applikations-servers betrieben. Die JSR168 konformen Portlets wiederum laufen unterKontrolle des GridSphere Portals. Hier sind nicht nur die applikationsspezi-fischen Portlets angesiedelt, sondern auch alle von Gatlet zur Verfügung ge-stellten Service Portlets, wie zum Beispiel das MyProxy, das Jobsubmit und
Das bwGRiD Wissenschaftsportal 183
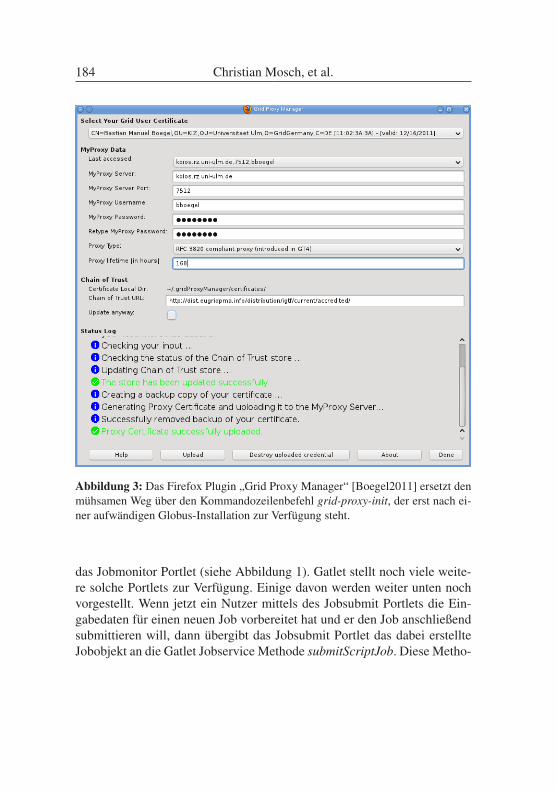
Abbildung 3: Das Firefox Plugin „Grid Proxy Manager“ [Boegel2011] ersetzt denmühsamen Weg über den Kommandozeilenbefehl grid-proxy-init, der erst nach ei-ner aufwändigen Globus-Installation zur Verfügung steht.
das Jobmonitor Portlet (siehe Abbildung 1). Gatlet stellt noch viele weite-re solche Portlets zur Verfügung. Einige davon werden weiter unten nochvorgestellt. Wenn jetzt ein Nutzer mittels des Jobsubmit Portlets die Ein-gabedaten für einen neuen Job vorbereitet hat und er den Job anschließendsubmittieren will, dann übergibt das Jobsubmit Portlet das dabei erstellteJobobjekt an die Gatlet Jobservice Methode submitScriptJob. Diese Metho-
184 Christian Mosch, et al.
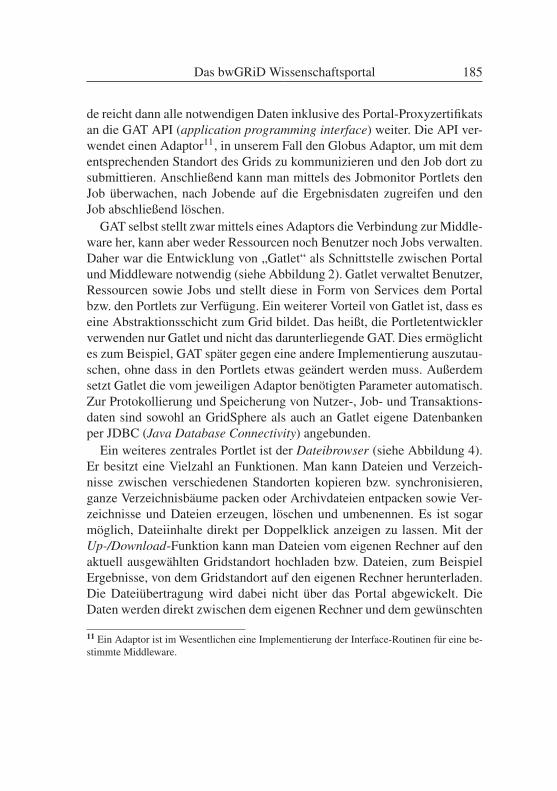
de reicht dann alle notwendigen Daten inklusive des Portal-Proxyzertifikatsan die GAT API (application programming interface) weiter. Die API ver-wendet einen Adaptor11, in unserem Fall den Globus Adaptor, um mit dementsprechenden Standort des Grids zu kommunizieren und den Job dort zusubmittieren. Anschließend kann man mittels des Jobmonitor Portlets denJob überwachen, nach Jobende auf die Ergebnisdaten zugreifen und denJob abschließend löschen.
GAT selbst stellt zwar mittels eines Adaptors die Verbindung zur Middle-ware her, kann aber weder Ressourcen noch Benutzer noch Jobs verwalten.Daher war die Entwicklung von „Gatlet“ als Schnittstelle zwischen Portalund Middleware notwendig (siehe Abbildung 2). Gatlet verwaltet Benutzer,Ressourcen sowie Jobs und stellt diese in Form von Services dem Portalbzw. den Portlets zur Verfügung. Ein weiterer Vorteil von Gatlet ist, dass eseine Abstraktionsschicht zum Grid bildet. Das heißt, die Portletentwicklerverwenden nur Gatlet und nicht das darunterliegende GAT. Dies ermöglichtes zum Beispiel, GAT später gegen eine andere Implementierung auszutau-schen, ohne dass in den Portlets etwas geändert werden muss. Außerdemsetzt Gatlet die vom jeweiligen Adaptor benötigten Parameter automatisch.Zur Protokollierung und Speicherung von Nutzer-, Job- und Transaktions-daten sind sowohl an GridSphere als auch an Gatlet eigene Datenbankenper JDBC (Java Database Connectivity) angebunden.
Ein weiteres zentrales Portlet ist der Dateibrowser (siehe Abbildung 4).Er besitzt eine Vielzahl an Funktionen. Man kann Dateien und Verzeich-nisse zwischen verschiedenen Standorten kopieren bzw. synchronisieren,ganze Verzeichnisbäume packen oder Archivdateien entpacken sowie Ver-zeichnisse und Dateien erzeugen, löschen und umbenennen. Es ist sogarmöglich, Dateiinhalte direkt per Doppelklick anzeigen zu lassen. Mit derUp-/Download-Funktion kann man Dateien vom eigenen Rechner auf denaktuell ausgewählten Gridstandort hochladen bzw. Dateien, zum BeispielErgebnisse, von dem Gridstandort auf den eigenen Rechner herunterladen.Die Dateiübertragung wird dabei nicht über das Portal abgewickelt. DieDaten werden direkt zwischen dem eigenen Rechner und dem gewünschten
11 Ein Adaptor ist im Wesentlichen eine Implementierung der Interface-Routinen für eine be-stimmte Middleware.
Das bwGRiD Wissenschaftsportal 185
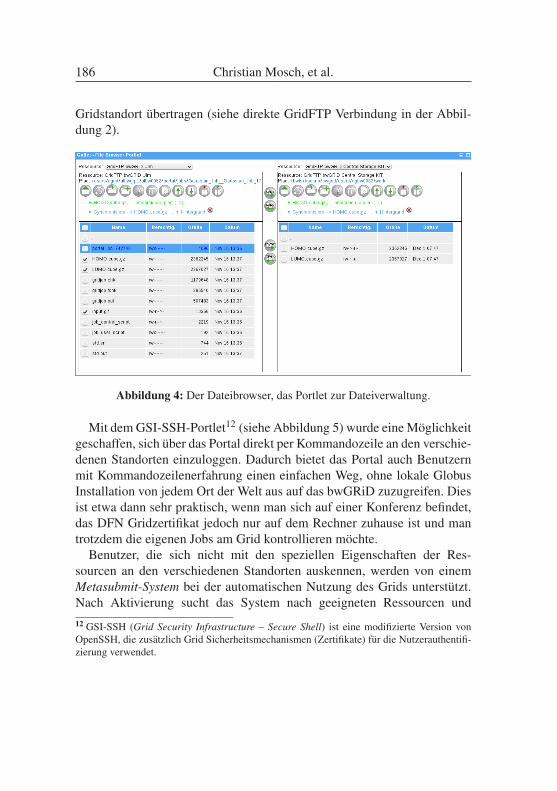
Gridstandort übertragen (siehe direkte GridFTP Verbindung in der Abbil-dung 2).
Abbildung 4: Der Dateibrowser, das Portlet zur Dateiverwaltung.
Mit dem GSI-SSH-Portlet12 (siehe Abbildung 5) wurde eine Möglichkeitgeschaffen, sich über das Portal direkt per Kommandozeile an den verschie-denen Standorten einzuloggen. Dadurch bietet das Portal auch Benutzernmit Kommandozeilenerfahrung einen einfachen Weg, ohne lokale GlobusInstallation von jedem Ort der Welt aus auf das bwGRiD zuzugreifen. Diesist etwa dann sehr praktisch, wenn man sich auf einer Konferenz befindet,das DFN Gridzertifikat jedoch nur auf dem Rechner zuhause ist und mantrotzdem die eigenen Jobs am Grid kontrollieren möchte.
Benutzer, die sich nicht mit den speziellen Eigenschaften der Res-sourcen an den verschiedenen Standorten auskennen, werden von einemMetasubmit-System bei der automatischen Nutzung des Grids unterstützt.Nach Aktivierung sucht das System nach geeigneten Ressourcen und12 GSI-SSH (Grid Security Infrastructure – Secure Shell) ist eine modifizierte Version vonOpenSSH, die zusätzlich Grid Sicherheitsmechanismen (Zertifikate) für die Nutzerauthentifi-zierung verwendet.
186 Christian Mosch, et al.
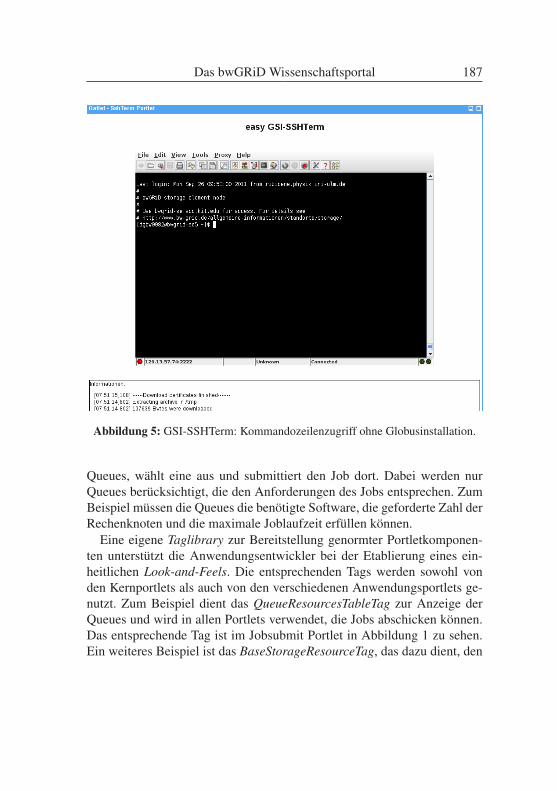
Abbildung 5: GSI-SSHTerm: Kommandozeilenzugriff ohne Globusinstallation.
Queues, wählt eine aus und submittiert den Job dort. Dabei werden nurQueues berücksichtigt, die den Anforderungen des Jobs entsprechen. ZumBeispiel müssen die Queues die benötigte Software, die geforderte Zahl derRechenknoten und die maximale Joblaufzeit erfüllen können.
Eine eigene Taglibrary zur Bereitstellung genormter Portletkomponen-ten unterstützt die Anwendungsentwickler bei der Etablierung eines ein-heitlichen Look-and-Feels. Die entsprechenden Tags werden sowohl vonden Kernportlets als auch von den verschiedenen Anwendungsportlets ge-nutzt. Zum Beispiel dient das QueueResourcesTableTag zur Anzeige derQueues und wird in allen Portlets verwendet, die Jobs abschicken können.Das entsprechende Tag ist im Jobsubmit Portlet in Abbildung 1 zu sehen.Ein weiteres Beispiel ist das BaseStorageResourceTag, das dazu dient, den
Das bwGRiD Wissenschaftsportal 187
Inhalt von Verzeichnissen anzuzeigen. Die Datei- und Verzeichnisfunktio-nen werden dabei direkt im Tag verarbeitet. Der Portletentwickler kann ein-fach das Tag in seinem Portlet verwenden und erhält damit automatischdie gesamte Funktionalität des Tags. Zwei dieser Tags nebeneinander sindin der Abbildung 4 zu sehen. Ein weiterer Vorteil der Taglibrary ist, dassÄnderungen an einem Tag automatisch allen Applikationen zur Verfügungstehen. Wenn also eine neue Tabellenspalte zu einem Tag mit Tabelle hin-zugefügt wird, so wird diese Änderung automatisch ohne Eingriff der Port-letentwickler in allen Portlets sichtbar.
Die Eigenschaften der Ressourcen am bwGRiD ändern sich von Zeitzu Zeit, wenn unter anderem eine Software an einem Standort installiertoder die maximale Queuelaufzeit angepasst wird. Der Grid-Ressourcen-Importer vereinfacht die Aktualisierung der Ressourcen der Test- und Pro-duktivportale, indem er alle für das Portal benötigten Ressourcen-Daten auseiner XML-Datei lädt. Neben vielen weiteren Daten enthält die Datei In-formationen zu den Site-, Cluster-, Globus-, Login-, GridFTP-, MyProxy-,Software- und Queue-Ressourcen. Die Datei wird regelmäßig aktualisiertund liegt den Portaltemplates in der jeweils aktuellen Fassung bei. Sie kannbei Bedarf auch separat verteilt werden. Beim Import werden bereits impor-tierte Ressourcen aktualisiert. Der Importmechanismus erspart dem Admi-nistrator eines Portals, also auch den Portletentwicklern mit Testportalen,das individuelle Einrichten bzw. Aktualisieren der einzelnen Ressourcen(siehe Abbildung 6).
Gatlet fragt regelmäßig den Status der Queues der Grid-Ressourcen abund überwacht so deren Verfügbarkeit. Dies ermöglicht, nicht verfügba-re Grid-Ressourcen im Portal temporär zu deaktivieren, falls an der Grid-Ressource Wartungsarbeiten durchführt werden. Diese Ressourcen werdendem Benutzer also gar nicht für den Submit vorgeschlagen. Sollte die Res-source wieder erreichbar sein, wird sie automatisch wieder aktiviert.
Mit dem umfangreichen Angebot an Basisportlets und Gatletdienstenstehen sowohl den Nutzern als auch den Programmieren viele hilfreicheWerkzeuge zur Verfügung. Es wird jedoch aufgrund der Komplexität derAufgabenstellung, insbesondere von Seiten der wissenschaftlichen Appli-kationen, aber auch durch die Heterogenität und Eigenentwicklung des
188 Christian Mosch, et al.
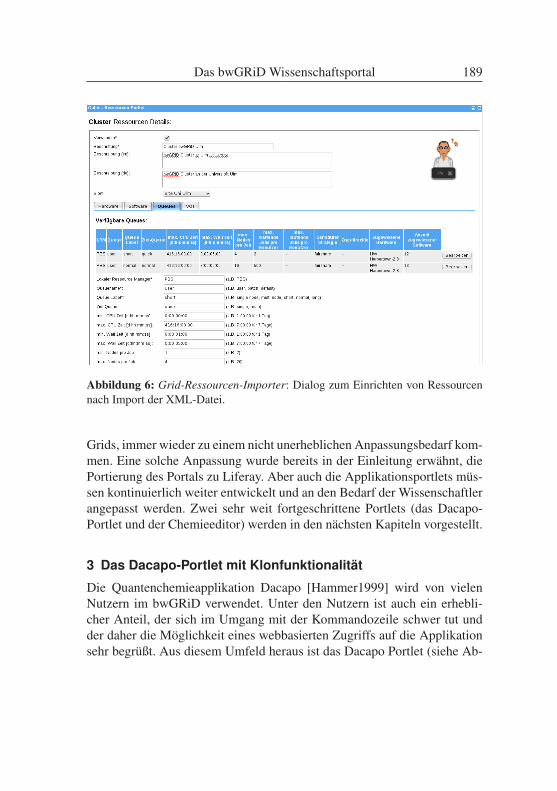
Abbildung 6: Grid-Ressourcen-Importer: Dialog zum Einrichten von Ressourcennach Import der XML-Datei.
Grids, immer wieder zu einem nicht unerheblichen Anpassungsbedarf kom-men. Eine solche Anpassung wurde bereits in der Einleitung erwähnt, diePortierung des Portals zu Liferay. Aber auch die Applikationsportlets müs-sen kontinuierlich weiter entwickelt und an den Bedarf der Wissenschaftlerangepasst werden. Zwei sehr weit fortgeschrittene Portlets (das Dacapo-Portlet und der Chemieeditor) werden in den nächsten Kapiteln vorgestellt.
3 Das Dacapo-Portlet mit Klonfunktionalität
Die Quantenchemieapplikation Dacapo [Hammer1999] wird von vielenNutzern im bwGRiD verwendet. Unter den Nutzern ist auch ein erhebli-cher Anteil, der sich im Umgang mit der Kommandozeile schwer tut undder daher die Möglichkeit eines webbasierten Zugriffs auf die Applikationsehr begrüßt. Aus diesem Umfeld heraus ist das Dacapo Portlet (siehe Ab-
Das bwGRiD Wissenschaftsportal 189
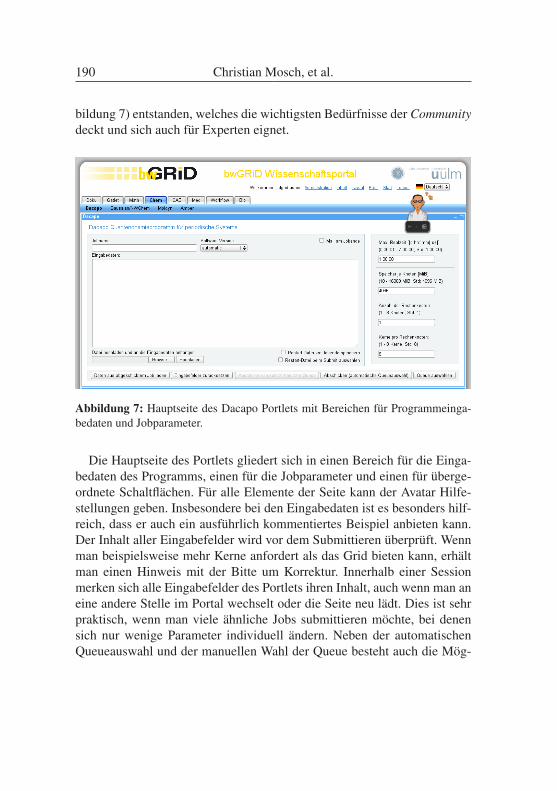
bildung 7) entstanden, welches die wichtigsten Bedürfnisse der Communitydeckt und sich auch für Experten eignet.
Abbildung 7: Hauptseite des Dacapo Portlets mit Bereichen für Programmeinga-bedaten und Jobparameter.
Die Hauptseite des Portlets gliedert sich in einen Bereich für die Einga-bedaten des Programms, einen für die Jobparameter und einen für überge-ordnete Schaltflächen. Für alle Elemente der Seite kann der Avatar Hilfe-stellungen geben. Insbesondere bei den Eingabedaten ist es besonders hilf-reich, dass er auch ein ausführlich kommentiertes Beispiel anbieten kann.Der Inhalt aller Eingabefelder wird vor dem Submittieren überprüft. Wennman beispielsweise mehr Kerne anfordert als das Grid bieten kann, erhältman einen Hinweis mit der Bitte um Korrektur. Innerhalb einer Sessionmerken sich alle Eingabefelder des Portlets ihren Inhalt, auch wenn man aneine andere Stelle im Portal wechselt oder die Seite neu lädt. Dies ist sehrpraktisch, wenn man viele ähnliche Jobs submittieren möchte, bei denensich nur wenige Parameter individuell ändern. Neben der automatischenQueueauswahl und der manuellen Wahl der Queue besteht auch die Mög-
190 Christian Mosch, et al.
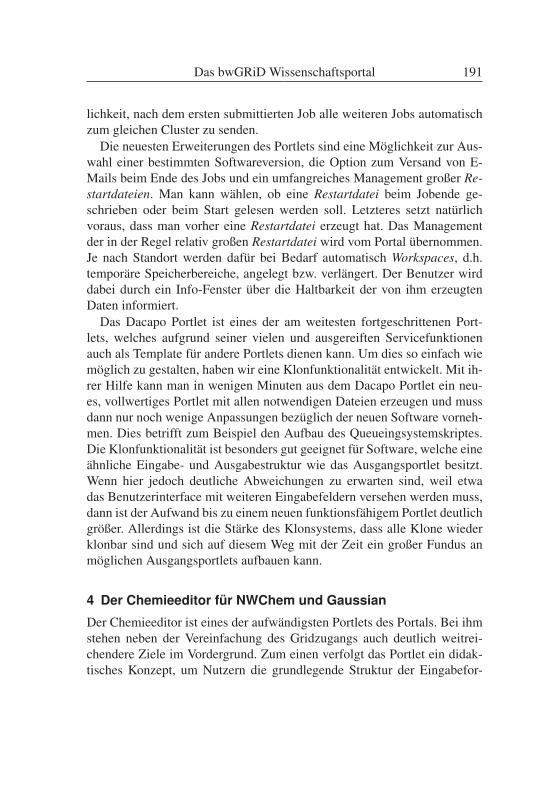
lichkeit, nach dem ersten submittierten Job alle weiteren Jobs automatischzum gleichen Cluster zu senden.
Die neuesten Erweiterungen des Portlets sind eine Möglichkeit zur Aus-wahl einer bestimmten Softwareversion, die Option zum Versand von E-Mails beim Ende des Jobs und ein umfangreiches Management großer Re-startdateien. Man kann wählen, ob eine Restartdatei beim Jobende ge-schrieben oder beim Start gelesen werden soll. Letzteres setzt natürlichvoraus, dass man vorher eine Restartdatei erzeugt hat. Das Managementder in der Regel relativ großen Restartdatei wird vom Portal übernommen.Je nach Standort werden dafür bei Bedarf automatisch Workspaces, d.h.temporäre Speicherbereiche, angelegt bzw. verlängert. Der Benutzer wirddabei durch ein Info-Fenster über die Haltbarkeit der von ihm erzeugtenDaten informiert.
Das Dacapo Portlet ist eines der am weitesten fortgeschrittenen Port-lets, welches aufgrund seiner vielen und ausgereiften Servicefunktionenauch als Template für andere Portlets dienen kann. Um dies so einfach wiemöglich zu gestalten, haben wir eine Klonfunktionalität entwickelt. Mit ih-rer Hilfe kann man in wenigen Minuten aus dem Dacapo Portlet ein neu-es, vollwertiges Portlet mit allen notwendigen Dateien erzeugen und mussdann nur noch wenige Anpassungen bezüglich der neuen Software vorneh-men. Dies betrifft zum Beispiel den Aufbau des Queueingsystemskriptes.Die Klonfunktionalität ist besonders gut geeignet für Software, welche eineähnliche Eingabe- und Ausgabestruktur wie das Ausgangsportlet besitzt.Wenn hier jedoch deutliche Abweichungen zu erwarten sind, weil etwadas Benutzerinterface mit weiteren Eingabefeldern versehen werden muss,dann ist der Aufwand bis zu einem neuen funktionsfähigem Portlet deutlichgrößer. Allerdings ist die Stärke des Klonsystems, dass alle Klone wiederklonbar sind und sich auf diesem Weg mit der Zeit ein großer Fundus anmöglichen Ausgangsportlets aufbauen kann.
4 Der Chemieeditor für NWChem und Gaussian
Der Chemieeditor ist eines der aufwändigsten Portlets des Portals. Bei ihmstehen neben der Vereinfachung des Gridzugangs auch deutlich weitrei-chendere Ziele im Vordergrund. Zum einen verfolgt das Portlet ein didak-tisches Konzept, um Nutzern die grundlegende Struktur der Eingabefor-
Das bwGRiD Wissenschaftsportal 191
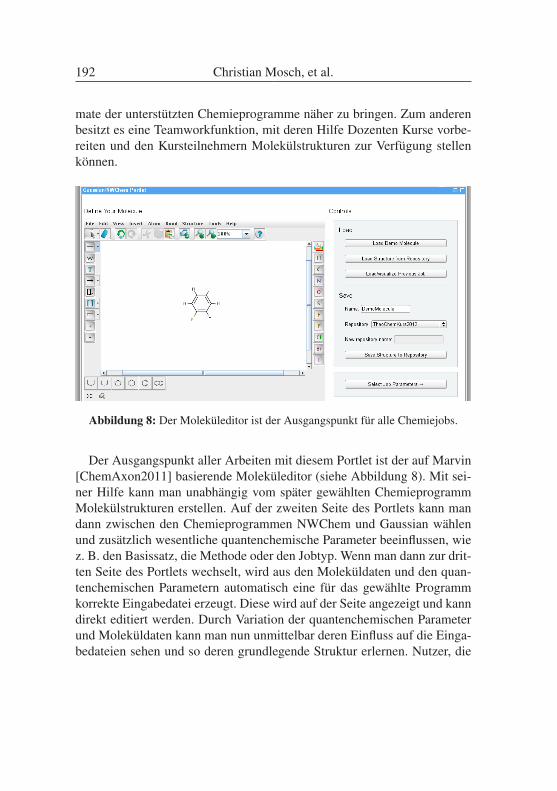
mate der unterstützten Chemieprogramme näher zu bringen. Zum anderenbesitzt es eine Teamworkfunktion, mit deren Hilfe Dozenten Kurse vorbe-reiten und den Kursteilnehmern Molekülstrukturen zur Verfügung stellenkönnen.
Abbildung 8: Der Moleküleditor ist der Ausgangspunkt für alle Chemiejobs.
Der Ausgangspunkt aller Arbeiten mit diesem Portlet ist der auf Marvin[ChemAxon2011] basierende Moleküleditor (siehe Abbildung 8). Mit sei-ner Hilfe kann man unabhängig vom später gewählten ChemieprogrammMolekülstrukturen erstellen. Auf der zweiten Seite des Portlets kann mandann zwischen den Chemieprogrammen NWChem und Gaussian wählenund zusätzlich wesentliche quantenchemische Parameter beeinflussen, wiez. B. den Basissatz, die Methode oder den Jobtyp. Wenn man dann zur drit-ten Seite des Portlets wechselt, wird aus den Moleküldaten und den quan-tenchemischen Parametern automatisch eine für das gewählte Programmkorrekte Eingabedatei erzeugt. Diese wird auf der Seite angezeigt und kanndirekt editiert werden. Durch Variation der quantenchemischen Parameterund Moleküldaten kann man nun unmittelbar deren Einfluss auf die Einga-bedateien sehen und so deren grundlegende Struktur erlernen. Nutzer, die
192 Christian Mosch, et al.
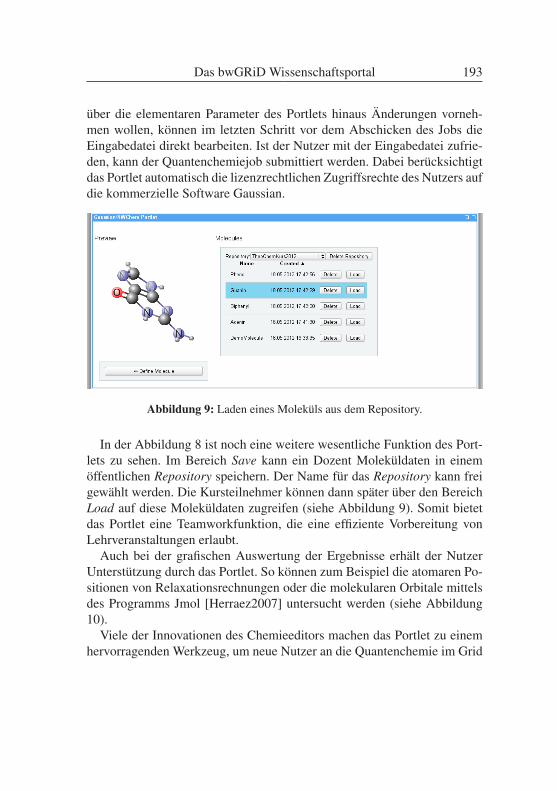
über die elementaren Parameter des Portlets hinaus Änderungen vorneh-men wollen, können im letzten Schritt vor dem Abschicken des Jobs dieEingabedatei direkt bearbeiten. Ist der Nutzer mit der Eingabedatei zufrie-den, kann der Quantenchemiejob submittiert werden. Dabei berücksichtigtdas Portlet automatisch die lizenzrechtlichen Zugriffsrechte des Nutzers aufdie kommerzielle Software Gaussian.
Abbildung 9: Laden eines Moleküls aus dem Repository.
In der Abbildung 8 ist noch eine weitere wesentliche Funktion des Port-lets zu sehen. Im Bereich Save kann ein Dozent Moleküldaten in einemöffentlichen Repository speichern. Der Name für das Repository kann freigewählt werden. Die Kursteilnehmer können dann später über den BereichLoad auf diese Moleküldaten zugreifen (siehe Abbildung 9). Somit bietetdas Portlet eine Teamworkfunktion, die eine effiziente Vorbereitung vonLehrveranstaltungen erlaubt.
Auch bei der grafischen Auswertung der Ergebnisse erhält der NutzerUnterstützung durch das Portlet. So können zum Beispiel die atomaren Po-sitionen von Relaxationsrechnungen oder die molekularen Orbitale mittelsdes Programms Jmol [Herraez2007] untersucht werden (siehe Abbildung10).
Viele der Innovationen des Chemieeditors machen das Portlet zu einemhervorragenden Werkzeug, um neue Nutzer an die Quantenchemie im Grid
Das bwGRiD Wissenschaftsportal 193
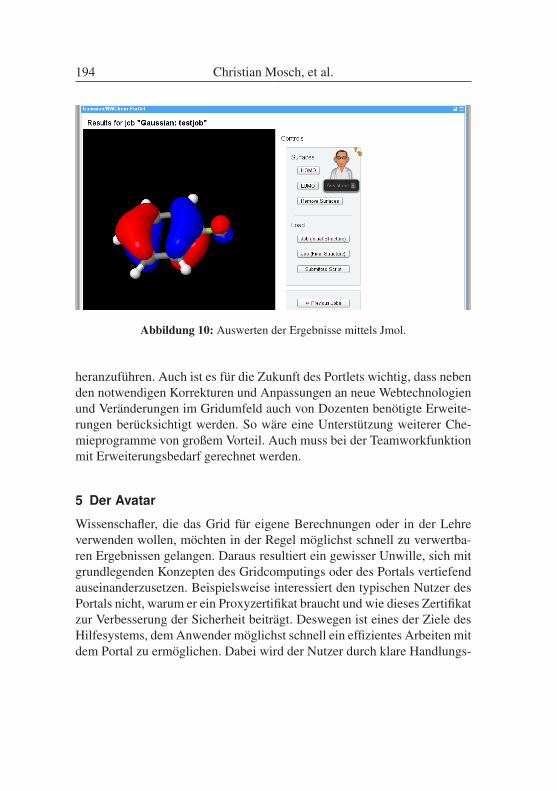
Abbildung 10: Auswerten der Ergebnisse mittels Jmol.
heranzuführen. Auch ist es für die Zukunft des Portlets wichtig, dass nebenden notwendigen Korrekturen und Anpassungen an neue Webtechnologienund Veränderungen im Gridumfeld auch von Dozenten benötigte Erweite-rungen berücksichtigt werden. So wäre eine Unterstützung weiterer Che-mieprogramme von großem Vorteil. Auch muss bei der Teamworkfunktionmit Erweiterungsbedarf gerechnet werden.
5 Der Avatar
Wissenschafler, die das Grid für eigene Berechnungen oder in der Lehreverwenden wollen, möchten in der Regel möglichst schnell zu verwertba-ren Ergebnissen gelangen. Daraus resultiert ein gewisser Unwille, sich mitgrundlegenden Konzepten des Gridcomputings oder des Portals vertiefendauseinanderzusetzen. Beispielsweise interessiert den typischen Nutzer desPortals nicht, warum er ein Proxyzertifikat braucht und wie dieses Zertifikatzur Verbesserung der Sicherheit beiträgt. Deswegen ist eines der Ziele desHilfesystems, dem Anwender möglichst schnell ein effizientes Arbeiten mitdem Portal zu ermöglichen. Dabei wird der Nutzer durch klare Handlungs-
194 Christian Mosch, et al.
anweisungen zu konkreten Zielen geführt. Die zugrundeliegenden komple-xen Konzepte werden in diesem Fall nicht näher erläutert, da diese für dasErreichen des Ziels irrelevant sind.
Wie diese Aufgabenstellung mit dem hier beschriebenen avatarbasiertemHilfesystem gelöst wurde, zeigt das Beispiel in den folgenden Absätzen.Angenommen ein Nutzer möchte mit dem in Kapitel 3 beschriebenem Port-let einen Dacapo-Job submittieren. Nachdem er sich im Portal eingeloggthat und zur entsprechenden Seite für Dacapo gelangt ist, wird ihm aller-dings vom Dacapo-Portlet nur eine Warnung angezeigt, dass kein „aktivesCredential“ gefunden wurde. Einem typischen Chemiker, der zum erstenmal mit dem Grid arbeiten möchte, ist der Begriff „Credential“ normaler-weise nicht geläufig. Daher weiß er nicht, was er in dieser Situation tunsoll, und ist zunächst frustriert.
Eine konventionelle Herangehensweise an dieses Problem wäre es jetzt,einen Hilfebereich im Portal anzubieten, in dem das Konzept eines Proxy-zertifikats beschrieben wird und der erläutert, wie man an ein solches ge-langt. Dabei ergeben sich aber einige für diese Art von Hilfestellung ty-pische Probleme. Zum Beispiel erhöht sich die kognitive Belastung desNutzers [Chandler1991] und es kann eine „Lost in Hyperspace“-Situationentstehen [Theng1998].
Beim vorliegenden System wird der Avatar als kleines Icon dargestellt(siehe Abbildung 7) und steht immer zur Verfügung. Benötigt der NutzerHilfe, wie in der Situation aus dem Beispiel, aktiviert er den Avatar durcheinen Klick auf „Hilfe“. Der Avatar bietet dann verschiedene Möglichkei-ten zur Unterstützung an. Eine der Optionen startet abhängig vom aktuel-len Kontext eine Schritt-für-Schritt Anleitung. Auf der Seite des Dacapo-Portlets werden nun alle Elemente markiert und nummeriert, die zur Erzeu-gung eines Proxyzertifikates und dem anschließenden Erstellen und Sub-mittieren eines Dacapo-Jobs benötigt werden. Dabei gibt der Avatar klareAnweisungen, welche Eingaben in welches Feld gemacht werden müssen(siehe Abbildung 11).
Während dieser Schritt-für-Schritt-Anleitungen werden vom Avatar le-diglich die Eingabefelder besucht, die für die Erfüllung der Aufgabe es-sentiell sind. Dies spiegelt die Zielsetzung wieder, den Benutzer möglichst
Das bwGRiD Wissenschaftsportal 195

Abbildung 11: Schritt-für-Schritt-Anleitung: Der Avatar erläutert Schritte zur Er-stellung eines Dacapo-Jobs.
schnell zu einem ersten Erfolgserlebnis – einem im Grid laufenden Job –zu führen. Die Vorteile dieses Ansatzes konnten in einer Nutzerevaluationgezeigt werden. Die benötigte Zeit zum Submittieren eines Dacapo-Jobswurde unter Verwendung des Avatars von 22 Minuten bei konventionellerHilfe auf Basis von HTML Texten auf 12 Minuten reduziert.
Ausgehend von dem Wissen, welches der Nutzer durch die Schritt-für-Schritt-Anleitungen erworben hat, kann er die Parameter seiner Berechnun-gen an eigene Bedürfnisse anpassen. Die dazu benötigte Hilfe zu weiterenElementen der Benutzerschnittstelle bietet der Avatar über die Option „Hilfmir mit einem Element auf dieser Seite“. Wird diese gewählt, werden al-le Elemente, zu denen der Avatar weitere Informationen besitzt, markiert.Klickt der Nutzer auf eine dieser Markierungen wird der entsprechendeText angezeigt.
Ein zusätzlicher Anwendungsfall, den das System abdeckt, richtet sichan interessierte Benutzer, die beispielsweise doch gerne näheres zu Proxy-zertifikaten wissen möchten. Dazu bietet der Avatar die Möglichkeit zurEingabe von Fließtextfragen. Antworten auf solche Fragen können die be-reits erläuterten Schritt-für-Schritt Anleitungen, einfache Antworten in ei-
196 Christian Mosch, et al.
ner Sprechblase oder komplexere Antworten sein. Bei komplexen Antwor-ten wird eine Art Präsentation gestartet, bei der beliebige HTML-Inhaltegezeigt werden und der Avatar Bemerkungen zu einzelnen Bereichen derdargestellten Inhalte machen kann.
Die Funktionalität des Avatars bietet sowohl neuen als auch erfahrenenNutzern eine wertvolle Unterstützung. Durch seinen modularen Aufbauund seine Integration in das Portletkonzept eignet er sich hervorragend zurIntegration in die Applikationsportlets an den verschiedenen Standorten.
6 Zusammenfassung und AusblickDas bwGRiD Wissenschaftsportal bietet den Nutzern umfangreiche Mög-lichkeiten zum Job- und Datenmanagement und wird bereits landesweiteingesetzt. Zusammen mit der Klonfunktionalität sind die bis ins Detailausgearbeiteten Funktionen des Dacapo-Portlets der Ausgangspunkt für ei-ne neue Generation von Portlets, die für die Nutzer einfach und effizient zubedienen sind und die vom Portletprogrammierer zügig erstellt werde kön-nen. Die neuen Didaktik- und Teamworkkonzepte im Chemieeditor Portletbieten zusätzliches Potential, um weitere Nutzer zu akquirieren. Entspre-chende Anfragen liegen uns von Dozenten mehrerer Universitäten im Landvor. Der Avatar rundet das Gesamtkonzept mit seinen verschiedenen Mög-lichkeiten zur Unterstützung des Nutzers ab.
Aktuelle Entwicklungen im Bereich der Portale, Java und Webtechno-logien sowie der Zugangsverfahren zu den Clustern erfordern Anpassun-gen, die zur Zeit im Rahmen der ergänzenden Maßnahmen13 vorgenommenwerden. Dabei wäre zum einen die Portierung zum Liferay-Portalsystem zunennen, die etwas aufwändiger ist, als dies ursprünglich geplant war. Weitersoll für zukünftige Clustersysteme neben dem zertifikatbasierten Zugangauch ein neues einfacheres Verfahren auf Basis des bwIDM Systems14 im-plementiert werden. Ein erstes Konzept hierfür wird zur Zeit in Zusammen-arbeit mit den Kollegen von Arbeitspaket 1 der ergänzenden Maßnahmenerstellt. Der Wechsel vieler Linux-Distributionen weg von Oracle Java zu
13 http://www.bw-grid.de/bwservices/bwgrid-ergaenzende-massnahmen (Zu-griff 2012-05-21)14 http://www.bw-grid.de/bwservices/bwidm (Zugriff 2012-05-21)
Das bwGRiD Wissenschaftsportal 197
anderen Java-Varianten führt insbesondere bei der Interaktion mit Zertifi-katen, aber auch an anderen Stellen zu Problemen. Hier muss eine Lösunggesucht werden, wobei durch den Wechsel zu bwIDM vermutlich einigeder Probleme wegfallen. Langfristig sollten auch neuere Webtechnologi-en, etwa der Trend zu HTML5, in die zukünftige Entwicklung des Portalseinfließen.
Literaturverzeichnis[Abdelnur2003] Alejandro Abdelnur und Stefan Hepper. JSR 168:
Portlet Specification. URL http://www.jcp.org/en/jsr/
detail?id=168 (Zugriff 2012-05-21), Oktober 2003.
[Boegel2011] Bastian Boegel und Christian Mosch. Grid Proxy Mana-ger 1.7. URL http://addons.mozilla.org/de/firefox/
addon/grid-proxy-manager/ (Zugriff 2012-05-18), 2011.
[Bos1998] Bert Bos, Håkon Wium Lie, Chris Lilley und Ian Jacobs.Cascading Style Sheets, level 2: CSS2 Specification. URLhttp://www.w3.org/TR/2008/REC-CSS2-20080411/
(Zugriff 2012-05-20), Mai 1998.
[Bozic2011] Stefan Bozic. Gatlet – a Grid Portal Framework. IS-GC International Symposium on Grids and Clouds, Tai-pei, Taiwan, 2011. URL http://event.twgrid.org/
isgc2011/slides/MiddlewareandInteroperability/
2/ISGC2011_Presentation_Gatlet.pdf (Zugriff 2012-05-16).
[Chandler1991] Paul Chandler und John Sweller. Cognitive Load Theo-ry and the Format of Instruction. Cognition and Instruction,8(4):293–332, 1991.
[ChemAxon2011] Marvin – a collection of tools to draw and visualize che-mistry. ChemAxon Kft. Záhony u. 7, Building HX 1031 Bu-dapest, Hungary, 2011. URL http://www.chemaxon.com/
products/marvin (Zugriff 2012-05-19).
198 Christian Mosch, et al.
[Dynowski2012] M. Dynowski, M. Janczyk, J. Chr. Schulz, D. von Sucho-doletz und S. Hermann. Das bwGRiD – High Performan-ce Compute Cluster als flexible, verteilte Wissenschaftsinfra-struktur. In P. Müller, B. Neumair, H. Reiser und G. Dreo Ro-dosek, Herausgeber, 5. DFN-Forum Kommunikationstechnolo-gien – Verteilte Systeme im Wissenschaftsbereich, pages 95 –105. Gesellschaft für Informatik e.V. (GI), 2012. Siehe auchhttp://www.bw-grid.de (Zugriff 2012-05-14).
[Fleury2006] Terry Fleury, Jim Basney und Von Welch. Single Sign-Onfor Java Web Start Applications Using MyProxy. In Procee-dings of the ACM Workshop on Secure Web Services (asso-ciated with the 13th ACM Conference on Computer and Com-munications Security), November 2006. URL http://grid.
ncsa.illinois.edu/myproxy/ (Zugriff 2012-05-18).
[Foster2006] Ian Foster. Globus Toolkit Version 4: Software for Service-Oriented Systems. J. Comput. Sci. and Technol., 21(4):513–520, 2006. URL http://www.globus.org/alliance/
publications/papers/IFIP-2006.pdf (Zugriff 2012-05-15).
[Frisch2009] M. J. Frisch, G. W. Trucks, H. B. Schlegel, G. E. Scuse-ria, M. A. Robb, J. R. Cheeseman, G. Scalmani, V. Baro-ne, B. Mennucci, G. A. Petersson, H. Nakatsuji, M. Caricato,X. Li, H. P. Hratchian, A. F. Izmaylov, J. Bloino, G. Zheng,J. L. Sonnenberg, M. Hada, M. Ehara, K. Toyota, R. Fuku-da, J. Hasegawa, M. Ishida, T. Nakajima, Y. Honda, O. Ki-tao, H. Nakai, T. Vreven, J. A. Montgomery, Jr., J. E. Peralta,F. Ogliaro, M. Bearpark, J. J. Heyd, E. Brothers, K. N. Ku-din, V. N. Staroverov, R. Kobayashi, J. Normand, K. Ragha-vachari, A. Rendell, J. C. Burant, S. S. Iyengar, J. Tomasi,M. Cossi, N. Rega, J. M. Millam, M. Klene, J. E. Knox, J. B.Cross, V. Bakken, C. Adamo, J. Jaramillo, R. Gomperts, R. E.Stratmann, O. Yazyev, A. J. Austin, R. Cammi, C. Pomelli,J. W. Ochterski, R. L. Martin, K. Morokuma, V. G. Zakrzewski,
Das bwGRiD Wissenschaftsportal 199
G. A. Voth, P. Salvador, J. J. Dannenberg, S. Dapprich, A. D.Daniels, Ö. Farkas, J. B. Foresman, J. V. Ortiz, J. Cioslow-ski und D. J. Fox. Gaussian 09 Revision B.1. GaussianInc. Wallingford CT 2009, URL http://www.gaussian.com
(Zugriff 2012-05-15).
[Hammer1999] B. Hammer, L. B. Hansen und J. K. Nørskov. Improvedadsorption energetics within density-functional theory usingrevised Perdew-Burke-Ernzerhof functionals. Phys. Rev. B,59(11):7413–7421, 1999. Rep. Sci. Res. Inst. 4, 56 2002;URL http://www.camp.dtu.dk/software and https://
wiki.fysik.dtu.dk/dacapo (Zugriff 2012-05-14).
[Hepper2008] Stefan Hepper. JSR 286: Portlet Specification 2.0.URL http://www.jcp.org/en/jsr/detail?id=286 (Zu-griff 2012-05-21), Juni 2008.
[Herraez2007] Angel Herráez. How to use Jmol to study and pre-sent molecular structures. Lulu Enterprises: Morrisville, NC,USA, 2007. ISBN 978-1847992598, URL http://jmol.
sourceforge.net (Zugriff 2012-05-18).
[Hook2005] David Hook. Beginning Cryptography with Java. Wrox; 1stedition, 2005. ISBN 978-0764596339, URL http://www.
bouncycastle.org (Zugriff 2012-05-17).
[Kussmaul2005] Timo Kussmaul. Die Java-Portlet-Spezifikation. Ja-vaSPEKTRUM, SIGS-DATACOM Verlag, Vol. 3, pages 39 –43, 2005. URL http://www.sigs.de/publications/js/
2005/03/kussmaul_JS_03_05.pdf (Zugriff 2012-05-15).
[Mosch2011] Christian Mosch, Bastian Boegel, Helmut Lang, KieronTaylor, Marek Dynowski, Jürgen Hesser, Siarhei Yakushe-vich, Alexander Zyl, Elisabeth Syrjakow, Yuriy Yudin, Ta-tyana Krasikova, Denis Nurmukhametov, Stephan Storch undKevin Körner. Abschlussbericht für das bwGRiD Portalpro-jekt 2010 – 2011. Ministerium für Wissenschaft, Forschung
200 Christian Mosch, et al.
und Kunst, Baden-Württemberg, 2011. Siehe auch http:
//www.bw-grid.de/portal (Zugriff 2012-05-14).
[Nieuwpoort2007] Rob V. van Nieuwpoort, Thilo Kielmann und Hen-ri E. Bal. User-Friendly and Reliable Grid ComputingBased on Imperfect Middleware. In Proceedings of theACM/IEEE Conference on Supercomputing (SC’07), Novem-ber 2007. URL http://www.cs.vu.nl/ibis/papers/
nieuwpoort_sc_2007.pdf und http://gforge.cs.vu.
nl/gf/project/javagat (Zugriff 2012-05-17).
[Novotny2004] J. Novotny, M. Russell und O. Wehrens. GridSphe-re: an advanced portal framework. In Euromicro Con-ference, Proceedings. 30th, pages 412–419, August 2004.URL http://java-source.net/open-source/portals/
gridsphere (Zugriff 2012-05-14).
[PelegriLlopart2002] Eduardo Pelegri-Llopart und Anil Vijendran. JSR52: A Standard Tag Library for JavaServer Pages. URL http:
//www.jcp.org/en/jsr/detail?id=52 (Zugriff 2012-05-20), Juli 2002.
[Sezov2011] Richard Sezov. Liferay in Action. Manning, 2011. ISBN978-1935182825, URL http://www.liferay.com (Zugriff2012-05-19).
[Theng1998] Yin Leng Theng und Harold Thimbleby. Addressing Designand Usability Issues in Hypertext and on the World Wide Webby Re-Examining the “Lost in Hyperspace"Problem. Journalof Universal Computer Science, 4(11):839–855, 1998.
[Valiev2010] M. Valiev, E.J. Bylaska, N. Govind, K. Kowalski, T.P.Straatsma, H.J.J. van Dam, D. Wang, J. Nieplocha, E. Apra,T.L. Windus und W.A. de Jong. NWChem: a comprehensiveand scalable open-source solution for large scale molecular si-mulations. Comput. Phys. Commun., 181:1477, 2010. URLhttp://www.nwchem-sw.org (Zugriff 2012-05-15).
Das bwGRiD Wissenschaftsportal 201
[Vukotic2011] Aleksa Vukotic. Apache Tomcat 7. Apress, 2011. ISBN978-1430237235, URL http://tomcat.apache.org (Zu-griff 2012-05-18).
DanksagungenAn erster Stelle möchten wir dem Ministerium für Wissenschaft, Forschungund Kunst Baden-Württemberg für die finanzielle Förderung und HerrnCastellaz, Frau Illison und Herrn Peters für die hervorragende Unterstüt-zung des Projektes danken. Ebenso geht großer Dank an Herrn Prof. Dr.Großmann des Kommunikations- und Informationszentrums der Universi-tät Ulm für die Initiierung und Begleitung des Projektes.
Weiter möchten wir den Kolleginnen und Kollegen am Karlsruher Insti-tut für Technologie (KIT) und an der Universität Ulm sowie den Mitarbei-terinnen und Mitarbeitern des gesamten bwGRiD Projektes für ihre Unter-stützung danken. Großer Dank geht auch an alle Kolleginnen und Kollegendes bwGRiD Portalprojektes, die die applikationsspezifischen Portlets ent-wickelt haben. Für Details zu den Portlets und den Entwicklern sei hier aufden Abschlussbericht des Portalprojektes beim Ministerium verwiesen.
Wesentliche Teile von Gatlet und den Portaltemplates stammen von Bas-tian Boegel (Ulm) und Stefan Bozic (KIT). Der Avatar wurde von HelmutLang (Ulm) entwickelt. Neben den Autoren des Artikels hat auch ChristianSpann (Ulm) entscheidend zum Dacapo-Portlet beigetragen. Der ursprüng-liche Entwurf des Chemieeditor Portlets von Dr. Kieron Taylor und Dr.David Benoit (Ulm) wurde später durch die Autoren erheblich erweitert.Abschließend möchten wir Ceriel Jacobs von der Freien Universität Ams-terdam für die Unterstützung bezüglich des GAT-Frameworks danken.
202 Christian Mosch, et al.
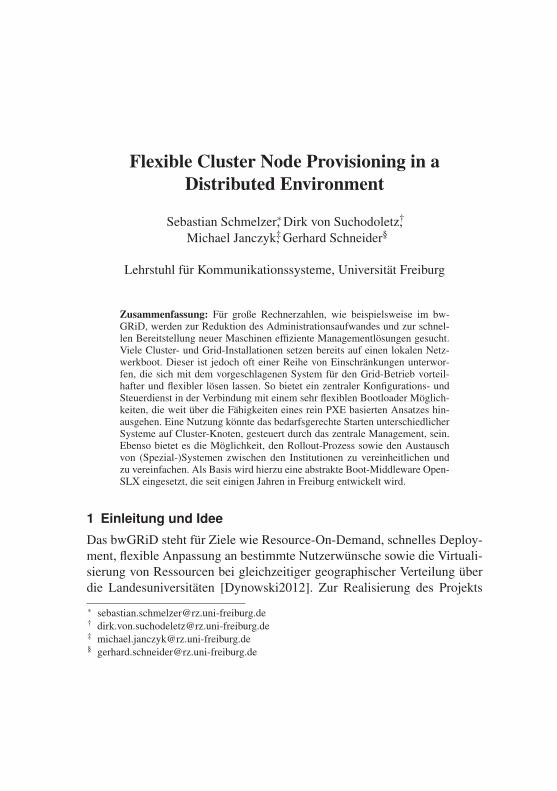
Flexible Cluster Node Provisioning in aDistributed Environment
Sebastian Schmelzer∗, Dirk von Suchodoletz†,Michael Janczyk‡, Gerhard Schneider§
Lehrstuhl für Kommunikationssysteme, Universität Freiburg
Zusammenfassung: Für große Rechnerzahlen, wie beispielsweise im bw-GRiD, werden zur Reduktion des Administrationsaufwandes und zur schnel-len Bereitstellung neuer Maschinen effiziente Managementlösungen gesucht.Viele Cluster- und Grid-Installationen setzen bereits auf einen lokalen Netz-werkboot. Dieser ist jedoch oft einer Reihe von Einschränkungen unterwor-fen, die sich mit dem vorgeschlagenen System für den Grid-Betrieb vorteil-hafter und flexibler lösen lassen. So bietet ein zentraler Konfigurations- undSteuerdienst in der Verbindung mit einem sehr flexiblen Bootloader Möglich-keiten, die weit über die Fähigkeiten eines rein PXE basierten Ansatzes hin-ausgehen. Eine Nutzung könnte das bedarfsgerechte Starten unterschiedlicherSysteme auf Cluster-Knoten, gesteuert durch das zentrale Management, sein.Ebenso bietet es die Möglichkeit, den Rollout-Prozess sowie den Austauschvon (Spezial-)Systemen zwischen den Institutionen zu vereinheitlichen undzu vereinfachen. Als Basis wird hierzu eine abstrakte Boot-Middleware Open-SLX eingesetzt, die seit einigen Jahren in Freiburg entwickelt wird.
1 Einleitung und Idee
Das bwGRiD steht für Ziele wie Resource-On-Demand, schnelles Deploy-ment, flexible Anpassung an bestimmte Nutzerwünsche sowie die Virtuali-sierung von Ressourcen bei gleichzeitiger geographischer Verteilung überdie Landesuniversitäten [Dynowski2012]. Zur Realisierung des Projekts
∗ [email protected]† [email protected]‡ [email protected]§ [email protected]
werden die lokalen HPC-Cluster für die Nutzer transparent über das 10 GB/sNetz BelWü1 zu einem Verbund zusammengeschlossen, um sicherzustel-len, dass verfügbare Computing-Ressourcen für die akademische Forschungstandortunabhängig und hochverfügbar bereitstehen. Geprägt wird dieseInfrastruktur durch gemeinsame Standards beim Zugriff auf die Ressour-cen, bei der Authentifizierung und bei der Verteilung der Jobs. Zu Projekt-beginn wurde eine einheitliche Hardwareausstattung gemeinsam beschafft,um die Vorteile eines solchen Vorgehens zu evaluieren und eine einfacheVerteilung von Betriebssystem-Installationen zu erlauben.
Durch die unterschiedlichen Anforderungen der Standorte, die voneinan-der abweichenden Jobprofile und den beständigen Ausbau der Infrastrukturentwickelt sich eine Hardwarelandschaft automatisch auseinander, da diePartner eine gewisse Unabhängigkeit genießen und Erfahrungen mit un-terschiedlichen Konfigurationen gesammelt werden sollen. Trotzdem ist eswünschenswert, eine gemeinsame Grundinstallation beizubehalten, die aufjeder eingesetzten Hardware läuft. Hierbei sollten zudem die Anpassungenan die jeweiligen Gegebenheiten an wenigen, gut dokumentierten Stellenerfolgen.
Aus einem ursprünglich einheitlichen Ansatz, der sich um eine Skript-Sammlung mit vielen lokalen, statischen Anpassungen dreht, ist eine un-übersichtliche Situation entstanden, die einerseits eine Auseinanderentwick-lung des Basissystems nicht verhinderte und andererseits eine zentrale Pfle-ge zunehmend schwierig macht. Die derzeitige Situation erschwert es zu-dem, einen Parallelbetrieb verschiedener Varianten des Grundsystems zuerlauben, um beispielsweise auf spezielle Jobprofile oder Anwenderwün-sche einzugehen oder einfache Tests für aktualisierte und zukünftige Grund-systemversionen durchzuführen. So bleibt die Konfiguration der einzelnenCluster-Segmente trotz aktueller Entwicklungen im Bereich des Software-Deployments immer noch aufwändig und bindet Personal. Damit vergehtoft wertvolle Zeit, bis neu beschaffte Maschinen tatsächlich den bwGRiD-Anwendern bereitgestellt werden können, was bei der typischerweise ho-hen Anzahl an neuen Rechenknoten eine nicht unerhebliche Ressourcen-verschwendung bedeuten kann. Deshalb empfiehlt es sich, einen koordi-
1 Landeshochschulnetz Baden-Württemberg, http://www.belwue.de
204 Sebastian Schmelzer, et al.
nierten, übergreifenden Ansatz für einen flexibles netzbasiertes Deploy-ment zu entwickeln.
Dieser Artikel diskutiert nach der Darstellung des Status Quo im bw-GRiD ein verteiltes Remote-Boot-Konzept, welches seit einiger Zeit amRechenzentrum der Universität Freiburg in verschiedenen Einsatzszenarienerprobt wird [Schmelzer2011a, Schmelzer2011b]. Das Konzept nutzt hier-zu verschiedene Varianten des jahrelang erprobten und eingesetzten LAN-Boots und kombiniert diese mit einem zustandslosen Betrieb der Rechner-knoten, die bei jedem Hochfahren dynamisch anhand genau definierter Pro-zeduren konfiguriert werden. Schnelle Datennetze wie das BelWü erlaubendabei sogar eine Bereitstellung von Grundsystemen über Standorte hinweg,um auf diesem Wege einfache Tests zu ermöglichen. Damit kann das vor-gestellte System sowohl lokal an einer Einrichtung als auch als zentralerDienst, der von mehreren Einrichtungen gemeinsam eingesetzt wird, reali-siert werden. Eine Nutzung in verteilten Rollen, die den einzelnen Admi-nistratoren erlaubt, verschiedene lokale oder entfernte Basis-Systeme anzu-bieten, ist dabei leicht umsetzbar.
2 Grundlagen des Remote-Boots
Festplattenlose beziehungsweise Stateless-Boots über das Netzwerk wer-den im Linux-Bereich und insbesondere im HPC-Umfeld schon sehr langepraktiziert [McQuillan2000, Katz2002]. Die eigentliche Betriebssystemin-stallation liegt hierbei auf einem Server und wird mehreren Clients bezie-hungsweise den Cluster-Nodes zur Verfügung gestellt. Hierbei nutzt derClient die BIOS Erweiterung PXE,2 um aus dem Netzwerk einen Kernelsowie ein initramfs-Container zu beziehen und diese zu starten. Zusätz-lich zu dem Vorgehen, wie es bei einem lokalen Bootvorgang üblich wäre,muss in der im initramfs enthaltenen init-Script die Einrichtung der Netz-werkkarte und anschließend das Einbinden des Root-Filesystems über dasNetzwerk erfolgen. Dessen Bereitstellung erfolgt über Netzwerkdateisyste-me oder -Block-Devices, wie beispielsweise NFS oder NBD. Dabei genügtbereits eine Bandbreite von 1 GBit/s auf Clientseite. Auf der Serverseite
2 Preboot Execution Environment, siehe beispielsweise [Intel2000].
Flexible Cluster Node Provisioning in a Distributed Environment 205
empfiehlt sich eine 10 GBit/s Anbindung, um mehrere hundert Knoten miteinem Remote-System zu versorgen. Für den Start eines Linux-Systemswerden etwa 50 – 80 MByte übertragen. Einmal in Betrieb genommen, ver-ursachen die Clients eine sehr geringe Netzlast, da Programme und Biblio-theken, wenn sie einmal angefordert wurden, im Cache des Betriebssys-temkerns erhalten bleiben.
Da alle Clients auf ein gemeinsames Rootdateisystem zugreifen, wirddieses schreibgeschützt exportiert. Ansonsten würden die Änderungen ei-nes Clients mit allen anderen Rechner interferieren. Auf Grund dessen wirdüber das nur lesbare Dateisystem eine beschreibbare Schicht unter Zuhil-fenahme eines Union File Systems gelegt, die die Änderungen auf demDateisystem im Arbeitsspeicher ablegt. So kann das laufende Betriebssys-tem wie auf einem schreibbaren Root-Filesystem agieren.
Große Vorteile des Remote-Boots sind zum einen Tests eines Systemsvor der eigentlichen Übernahme in die Produktivnutzung, das Ausprobierenverschiedener Software- und Systemumgebungen sowie der unkomplizier-te, schnelle und flexible Einsatz, ohne eine bestehende Infrastruktur zu be-einträchtigen. So kann eine neue Systemumgebung ohne großen Mehrauf-wand gestartet und getestet werden. Zum anderen wird das „zustandslose“System bei Neustart der Rechner wieder auf den Urzustand zurückgesetzt.Diese Systeme sind somit gegen versehentliche oder böswillige Manipula-tion weniger anfällig, da sie einfach wiederhergestellt werden können.
3 Status Quo: Remote-Boot im bwGRiD
Die bisherige Remote-Boot-Konfiguration im bwGRiD wurde für die an-fänglich homogene Hardware-Ausstattung erstellt und macht unter Um-ständen bei einer nachträglichen Beschaffung neuer, zum bisherigen Ma-schinentyp heterogener Rechenknoten eine Anpassung der Konfigurations-skripten notwendig. Diese Software-Sammlung wird am Höchstleistungs-rechenzentrum Stuttgart (HLRS) entwickelt und gepflegt. Sie wurde jedochbisher an mehreren Standorten lokal verändert und erweitert. Durch die lo-kalen Anpassungen wird die Entwicklung erschwert, da diese Änderungennicht an die Entwickler zurückfließen und unter Umständen wieder lokalangepasst werden müssen. Die Skriptsammlung dient lediglich dazu, ein
206 Sebastian Schmelzer, et al.
Betriebssystem für den Remote-Boot vorzubereiten. Es besteht weder dieMöglichkeit der Konfiguration dieses Systems noch der Koordination ei-ner einheitlichen Softwareumgebung, wie sie in Grids, insbesondere dembwGRiD, gefordert wird. Eine modulare Weiterentwicklung des Remote-Boot-Systems ist derzeit nicht möglich.
Neue Client-Systeme werden über aufeinanderfolgende Skriptaufrufe er-stellt und folgen grob einem Schema, das mit anderen Remote-Boot-Lösun-gen vergleichbar ist. Zunächst muss ein Referenzsystem angelegt und kon-figuriert werden. Das Betriebssystem ist auf Scientific-Linux 5, ein RedHat-Enterprise-Linux-Derivat, beschränkt. Derzeit wird im bwGRiD die Versi-on 5.5 eingesetzt. Ein minimales gemeinsames Softwarespektrum wird mitHilfe eines Installationsskripts eingepflegt, durch welches die meisten Soft-waregruppen in das Betriebssystem installiert werden. Anschließend wer-den alle nicht benötigten Dienste deaktiviert. Die Konfiguration der Clientskann im Referenzsystem erfolgen. Einige Standorte nutzen dazu jedoch dieManagement-Software CFEngine.3 Nach der Konfiguration des Systemswird es mit Hilfe eines weiteren Skripts und rsync in ein Unterverzeich-nis auf dem Server übertragen. Dabei werden weitere Anpassungen vor-genommen. Es werden beispielsweise einige Dateien unterhalb von /etc
durch Links ersetzt. Die eigentlichen Dateien werden beim Boot des Sys-tems in ein tempfs kopiert, auf das die Links verweisen. So können dieseDateien trotz einem schreibgeschützt eingebundenen Dateisystem beschrie-ben werden. Außerdem wird ein initramfs-Container erstellt, der die Netz-werkkartentreiber beinhaltet, die beim Booten für das Einbinden des Root-Filesystems benötigt werden. Netzwerk und ramfs werden durch ein zu-sätzliches Runlevel-Skript konfiguriert, das direkt nach Ende des initramfsgestartet wird. Die wenigen Skripte erlauben eine schnelle und geschick-te Möglichkeit, Remote-Boot-Systeme zu generieren. Die Einfachheit er-leichtert die Pflege und die Fehlersuche, sie macht die Lösung aber auchstarr und bietet nur minimale Konfigurationsmöglichkeiten.
3 Webseite der Management-Software CFEngine, http://cfengine.com.
Flexible Cluster Node Provisioning in a Distributed Environment 207
4 Anforderungen an ein Site-übergreifendes Boot-Framework
Die meisten Grid- und Cluster-Installationen gehen in der Regel von einerweitestgehend einheitliche Hardwarekonfiguration aus. Dies ist jedoch aufDauer nicht immer durchführbar. Ein Remote-Boot-System muss deshalbflexibel ausgelegt sein, um unterschiedlichste Hardware unterstützen undneue Komponenten integrieren zu können. Das wird seitens einer entspre-chenden Remote-Boot-Umgebung durch die dynamische Hardwareeinrich-tung beim Start der Clients und der Konfiguration einer breiten Palette vonNetzwerkkartenmodulen für den Start erreicht.
Generisches Basis-System & lokale Erweiterungen Weiterhin solldas Basis-Betriebssystem sowie der Softwarebestand über die im Verbundvertretenen Institutionen einheitlich sein.4 Zur Abbildung lokaler Anforde-rungen und Konfigurationen können stattdessen modulare Erweiterungeneingesetzt werden. Bereits jetzt wird das Softwarepaket modules5 einge-setzt, um diverse Versionen einer Software in einem System parallel an-bieten zu können. Dieses kann auch weiterhin genutzt werden, um tem-poräre wie lokale Änderungen auf der Shell-Ebene durchzuführen. Die-se Konfigurationsmöglichkeit reicht unter Umständen jedoch nicht aus. Sosoll es außerdem möglich sein, spezielle Job-Umgebungen anzubieten, umeventuelle Unzulänglichkeiten der Standardumgebung ausgleichen zu kön-nen. Eigene Umgebungen für veraltete Bibliotheken, aber auch für spezielleHardware wie GPUs und Anwendungsfelder wie interaktive Jobs und Vi-sualisierung können erforderlich sein. Darüber hinaus ist es möglich, neueUmgebungen zu testen und Updates, die nicht im laufenden Betrieb durch-geführt werden können, anzubieten.6
4 Vergleiche hierzu beispielsweise [Dynowski2012].5 Das Modules-Paket manipuliert bei Bedarf die Shell-Umgebung. Insbesondere werden$LD_LIBRARY_PATH und $PATH für die zu betreibende Software angepasst. Projektseite:http://modules.sourceforge.net.6 Die Updates werden hierbei in das Vorlagensystem installiert und dieses als neue Umge-bung zur Verfügung gestellt.
208 Sebastian Schmelzer, et al.
Kontinuierliche Systemupdates Cluster werden je nach Art der ab-gearbeiteten Jobs üblicherweise mehrere Monate ohne einen Neustart derSysteme betrieben. Für einen definierten Zustand über diesen Zeitraum sindatomare Kopiervorgänge bei Online-Updates essentiell. Es sollte sicherge-stellt sein, dass eine Datei oder ein Ordner nicht zwischenzeitlich fehlt odereine ältere Version eingespielt wird. Die Konfiguration der Clients sollte ineinem globalen Verzeichnis auf dem Server erfolgen und beim Update desClient-Systems automatisch in dieses übertragen werden. Die Systemum-gebung muss für alle Clients auch nach einer Änderung auf dem Server ho-mogen bleiben, ansonsten kann keine reibungslose Abarbeitung von Jobsgewährleistet werden.
Essentiell ist zudem die Möglichkeit, Clients einzeln konfigurieren zukönnen. Zusätzliche Hardware-Konfigurationen wie von GPUs benötigt undspezielle Umgebungen zur Visualisierung und für interaktiven Jobs könnenüber eine gesonderte Client-Konfiguration erfolgen. Dies kann dynamischbeim Start des Systems oder statisch auf dem Server geschehen.
Eziente Verteilung der Root-Filesysteme In WAN-Umgebungenexistieren weitergehende Anforderungen an den Transport und die Sicher-heit der Daten. Um Latenzen bei Dateizugriffen so gering wie möglich zuhalten, werden schnelle Netzwerkdateisysteme beziehungsweise -Block-Devices, die den Anforderungen des Betriebs über Weitverkehrsnetze ge-nügen, benötigt. Zum Ausgleich der Netzwerklatenz und der Bandbrei-tenschwankungen, die durch die gleichzeitige Nutzung mehrerer Dienstean den Hochschulen, wie dem derzeit im Aufbau befindlichen Landes-Hochschul-Datenspeicher,7 entstehen können, wird ein Proxy-Server fürden Remote-Boot-Service entwickelt. Vorteile solcher Proxies sind die ein-fachere Aktualisierbarkeit eines Systems und Redundanz des Services. Au-ßerdem obliegt ein Proxy der Kontrolle eines lokalen Administrators, derfür die lokale Sicherheit des Systems zuständig ist und einen autarken Be-trieb der Remote-Boot-Services ermöglicht. Die globalen Update-Zyklenerhalten die Homogenität der Systemumgebungen.
7 bwLSDF: Large-Scale Data Facility, http://www.bw-grid.de/bwservices/bwlsdf.
Flexible Cluster Node Provisioning in a Distributed Environment 209
Sicherheit Um versehentliche beziehungsweise böswillige Veränderun-gen des Systems auf dem Transportweg über Weitverkehrsnetzwerke zuverhindern, sollen sich Absicherungsmechanismen in den Service integrie-ren lassen. Ein möglicher Ansatz hierfür ist die Verwendung eines durcheine PKI gesicherten Vertrauensankers auf der Clientseite, mit dessen HilfeIntegritätsüberprüfungen des Dateisystems ermöglicht werden. Als ein sol-cher Vertrauensanker könnte beispielsweise der Netzwerk-Bootloader iP-XE 8 mit einem eingebetteten Zertifikat dienen. Ein weiterer Ansatz wäredie (vollständige) Verschlüsselung des Netzwerkblock-Geräts.
Neben der Absicherung der generischen Root-Dateisysteme sollte dieKonfiguration der Clients geschützt werden. Diese beziehen die Nodes beimBoot über den zentralen webbasierten Konfigurationsdienst. Hier werdenauch sicherheitskritische Einstellungen wie für die Anbindung an Authen-tifizierungsdienste oder Zertifikate ausgetauscht. Deswegen ist hierfür einAustausch der Daten über eine gesicherte Verbindung vorgesehen.
5 Ausgangspunkt: OpenSLX, ein Remote-Boot-Service derUniversität Freiburg
Das an der Universität Freiburg entwickelte Komponentenset zum Betriebeines Remote-Boot-Service (OpenSLX) wird dort seit einigen Jahren fürden Betrieb netzwerkbootender Lehrpools eingesetzt [vSuchodoletz2007].Zudem wird es für den Betrieb der Cluster Nodes des Black Forest Grids9
genutzt. Neben dem Standardbetrieb wurde das ursprüngliche System amRechenzentrum in Freiburg für Einsatz über Weitverkehrsnetze erweitert[Schmelzer2011b, Schmelzer2009]. Das Open-Source-Softwarepaket Open-SLX stellt dabei ein allgemeines Framework für die Einrichtung, Konfi-guration und Verwaltung eines Remote-Boot-Dienstes bereit.10 OpenSLXvereinheitlicht hierzu die verschiedenen und teilweise unvollständigen An-
8 iPXE Homepage, http://ipxe.org.9 Das BFG, http://www.bfg.uni-freiburg.de, besteht aus einer interdisziplinärenGruppe von Forschern, von zur Zeit etwa 20 Instituten der Universität Freiburg sowie vonverschiedenen externen Einrichtungen.10 Siehe hierzu die Projektseiten: http://openslx.org sowie http://lab.openslx.
org.
210 Sebastian Schmelzer, et al.
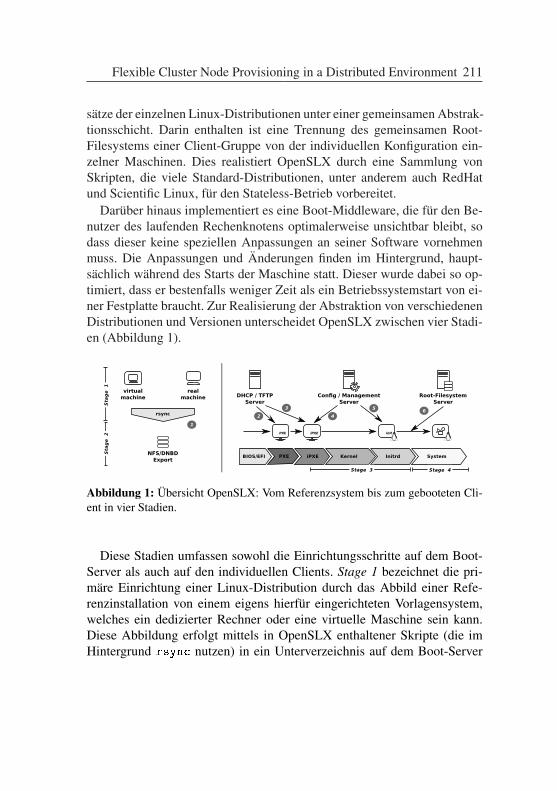
sätze der einzelnen Linux-Distributionen unter einer gemeinsamen Abstrak-tionsschicht. Darin enthalten ist eine Trennung des gemeinsamen Root-Filesystems einer Client-Gruppe von der individuellen Konfiguration ein-zelner Maschinen. Dies realistiert OpenSLX durch eine Sammlung vonSkripten, die viele Standard-Distributionen, unter anderem auch RedHatund Scientific Linux, für den Stateless-Betrieb vorbereitet.
Darüber hinaus implementiert es eine Boot-Middleware, die für den Be-nutzer des laufenden Rechenknotens optimalerweise unsichtbar bleibt, sodass dieser keine speziellen Anpassungen an seiner Software vornehmenmuss. Die Anpassungen und Änderungen finden im Hintergrund, haupt-sächlich während des Starts der Maschine statt. Dieser wurde dabei so op-timiert, dass er bestenfalls weniger Zeit als ein Betriebssystemstart von ei-ner Festplatte braucht. Zur Realisierung der Abstraktion von verschiedenenDistributionen und Versionen unterscheidet OpenSLX zwischen vier Stadi-en (Abbildung 1).
Abbildung 1: Übersicht OpenSLX: Vom Referenzsystem bis zum gebooteten Cli-ent in vier Stadien.
Diese Stadien umfassen sowohl die Einrichtungsschritte auf dem Boot-Server als auch auf den individuellen Clients. Stage 1 bezeichnet die pri-märe Einrichtung einer Linux-Distribution durch das Abbild einer Refe-renzinstallation von einem eigens hierfür eingerichteten Vorlagensystem,welches ein dedizierter Rechner oder eine virtuelle Maschine sein kann.Diese Abbildung erfolgt mittels in OpenSLX enthaltener Skripte (die imHintergrund rsync nutzen) in ein Unterverzeichnis auf dem Boot-Server
Flexible Cluster Node Provisioning in a Distributed Environment 211
(1). Diese Grundinstallation kann durch lokale Anpassungen seitens desAdministrators oder durch Zusatzkomponenten erweitert werden. Im an-schließenden Stage 2 werden hieraus Root-Dateisystem-Exporte erzeugt,die auf verschiedene Weise bereitgestellt werden. Dabei kann es sich um einvia NFS angebotenes Unterverzeichnis oder einen per Blockdevice bereit-gestellten SquashFS-Container11 handeln. Das Ganze ist so angelegt, dasssich von einem Server eine Reihe solcher Installationen verwalten und an-bieten lässt. Neben der Bereitstellung der Dateisysteme ist der Boot-Serverauch für die Erzeugung angepasster initramfs-Container zuständig.
Während Stage 1 und 2 die Vorbereitung des Betriebssystems auf demServer beschreiben, stehen die darauf folgenden Stages für die Stufen desBootvorgangs des individuellen Clients. Der Client bootet wie in einemvergleichbaren Remote-Boot-Setup zunächst über PXE (2). Jedoch wird indem hier vorgestellten Ansatz nicht direkt das eigentliche System gebootet,sondern zunächst die freie PXE Implementierung iPXE geladen (3). iPXEist in der Lage, Konfigurationsdaten nicht nur über TFTP zu beziehen, son-dern unterstützt zusätzliche Netzwerkprotokolle wie beispielsweise HTTPoder FTP. Dieser Umweg ermöglicht eine dynamische Entscheidung zumZeitpunkt des Bootvorgangs, welches System zu starten ist, da die Konfigu-ration von iPXE direkt durch eine Schnittstelle der webbasierten zentralenVerwaltung erzeugt wird (4).
Anschließend werden Kernel und der initramfs-Container des zu boo-tenden Systems geladen und gestartet. Ab diesem Punkt wird vom soge-nannten Stage 3 gesprochen. Der initramfs-Container ist ein komprimiertesCPIO-Paket,12 welches neben dem Init-Skript und einigen Kernel-Modulenfür ein erstes Hardware-Setup eine auf BusyBox13 basierende minimaleSystemumgebung enthält. Am Ende des Bootvorgangs des Linux-Kernelsentpackt dieser den Inhalt des initramfs-Archivs in ein im Arbeitsspeicherliegendes Filesystem und startet die darin enthaltene init. Im folgenden fin-det zunächst die Einrichtung der Netzwerk-Hardware sowie das Einbinden
11 Komprimierter Filesystem-Container, vergleiche hierzu http://squashfs.
sourceforge.net.12 Hierbei handelt es sich um ein einfaches Datei-Archiv-Format.13 Kompaktes Paket diverser Core-Utilities, http://busybox.net.
212 Sebastian Schmelzer, et al.
des Root-Dateisystems statt. Darauf folgend wird das individuelle Setupdes einzelnen Clients durch die von OpenSLX erzeugten Skripten durchge-führt, welche bei Bedarf mit dem zentralen Konfigurationsdienst kommu-nizieren (5). Im letzten Stage übergibt das OpenSLX-Init an das jeweils an-gepasste Runlevel-System der Distribution [Schmelzer2009], wobei es mitsehr verschiedenen Ansätzen, angefangen vom klassischen Sys-V-Init
mit seinen optimierten Fassungen, Upstart bis hin zum SystemD umge-hen kann.
6 Erweiterungen für den Grid-BetriebAusgehend von dem erprobten, bestehenden Setup für den Remote-Boot ander Universität Freiburg, gilt es, die Erfahrungen, die mit der Forschung imBereich WAN-Boot14 sowie mit den aktuellen Entwicklungen von verteil-ten Netzwerk-Blockdevices gesammelt wurden, in einem neuen, attraktivenDienst zusammenzuführen, bei dessen Entwicklung auch die Anforderun-gen des Grid-Betriebs betrachtet werden. Hierzu müssen eine Reihe vonKomponenten mit einem bestimmten Featureset zusammenspielen, um dasgeplante System zu realisieren.
6.1 Dynamisches Boot-Framework
Um eine dynamische Entscheidung über das zu bootende System zu ermög-lichen, wird im hier beschriebenen Ansatz auf die freie PXE Implemen-tierung iPXE zurückgegriffen, welche im Funktionsumfang dahingehenderweitert wurde, dass neben TFTP auch andere Protokolle, wie beispiels-weise HTTP, zum Empfang von Menü- und Konfigurationsdaten genutztwerden können. Das Bootmenü und damit die Bootentscheidung könnensomit bei jedem Startvorgang dynamisch erzeugt werden. Dies ermöglichtes auf Seiten des Web-Interfaces weiteren Kriterien, wie IP-Adresse, Uhr-zeit oder der Auslastung des Clusters für die Bootentscheidung zu Hilfe zunehmen. Ein weiterer Vorteil des Verfahrens ist, dass damit jeder Start einesCluster-Nodes (sowie welches System gestartet wurde) an zentraler Stelleprotokolliert werden kann.14 Vergleiche hierzu die Überlegungen in [Schmelzer2011a].
Flexible Cluster Node Provisioning in a Distributed Environment 213
6.2 Zentraler Konfigurationsdienst
Neben der Verwaltung der ihm bekannten Clients und der Regeln, welcheSysteme nach welchen Bedingungen gestartet werden sollen, ist die Auf-gabe des zentralen Konfigurations- und Management-Dienstes (Abbildung1: Config/Management Server) die Verwaltung von Client- bzw. Gruppen-spezifischen Einstellungen und Erweiterungen. Der Dienst bietet zum einenein Web-Interface zur Administration durch den Anwender, zum anderenstellt er die entsprechenden Schnittstellen zur Verfügung, auf die die Skrip-te während des Bootprozesses auf dem Client zurückgreifen. Das Konzepthat sich bereits in prototypischer Form bewährt (siehe [Schmelzer2009])und wird im Moment in die nächste Generation von OpenSLX integriert.Zu einem späteren Zeitpunkt soll dieser auch die Erzeugung der initramfs-Archive steuern, die zur Zeit noch von einem Skript aus der klassischenOpenSLX Umgebung erzeugt werden.
Ziel ist es, eine logische Trennung von Maschinenkonfiguration und Be-reitstellung der Root-Filesysteme für die verschiedenen Linux-Variantenzu erreichen. Dies wird durch die Abstraktion von Standardaufgaben mitder Hilfe von Plugins ermöglicht. So sollen beispielsweise Aufgaben wiedie Konfiguration der User-Authentifizierung, das Einbinden von lokalenNetz-Laufwerken, die Anbindung an einen zentralen Logging-Dienst odervergleichbare Dienste steuerbar sein. Auch bietet eine einheitliche API fürErweiterungen die Möglichkeit, auch in Zukunft das System einfach anneue Erfordernisse anzupassen. So wäre beispielsweise eine Anbindung anden bwLSDF für das Verarbeiten großer Datenmengen denkbar (siehe auch[Garcia2011]).
Daraus folgen zwei elementare Vorteile: Zum einen ermöglicht es demAnwender, das Dateisystem-Abbild generisch zu halten, zum anderen lässtsich somit die Konfiguration für die Einbindung in die lokale Infrastruktureinfach auf andere Grundsysteme transferieren.
6.3 Assistierte Image-Erstellung
Eine weitere webbasierte Komponente zur Erleichterung der Administra-tion stellt das Interface für die Erstellung, Verwaltung und Verteilung der
214 Sebastian Schmelzer, et al.
Root-Filesysteme dar (RootFS Server). Die wichtigsten Funktionen werdendie Möglichkeit, Grund-Systeme von anderen Institutionen zu importieren,und die assistierte Erstellung neuer Systeme sein. Dieses soll dem Wunschnach Vereinheitlichung der Grund-Systeme Rechnung tragen und den Ad-ministrationsaufwand verringern.
Die Erstellung neuer Grund-Systeme soll so erleichtert werden, dass auchAdministratoren von anderen Forschungsgruppen in der Lage sind, spezi-ell auf ihr Anwendungsgebiet angepasste Systeme zu erzeugen. Der Ar-beitsablauf soll den Anwender dabei unterstützen, ein bereits eingerichte-tes Referenzsystem in ein neues Grund-System zu überführen, und hierbeibeispielsweise auf fehlende Abhängigkeiten oder ähnliches hinweisen. DerImport selbst wird durch einen zusätzlichen Dienst im Hintergrund abgewi-ckelt, dessen Status sich über das Web-Interface jederzeit verfolgen lässt.
6.4 Site-übergreifender Austausch von Grund-Systemen
Neben dem parallelen Betrieb mehrerer Systeme an einem Standort, bei-spielsweise um die nächste Generation der zugrundeliegenden Distributi-on zu testen, bietet das vorgeschlagene Framework die Möglichkeit, auchBasis-Systeme anderer Institutionen zu nutzen. Dies hat den Vorteil, dasssich die einzelnen Einrichtungen auf bestimmte Anwendungsbereiche spe-zialisieren und die Systeme daraufhin optimieren können. Für die Gewähr-leistung eines reibungslosen Austauschs von Systemen bedarf es eines da-für geeigneten Netzwerkspeichers. Elementar ist hierbei die Möglichkeit,ein entferntes System im lokalen Netz dynamisch zwischenzuspeichern(Caching) als auch eine Versionskontrolle der bereitgestellten Images. Hier-für befindet sich ein spezielles Distributed Network Block Device in Ent-wicklung und Erprobung.
Der bereits vorgestellte RootFS Server bildet den administrativen Über-bau für den Austausch und die Verwaltung der Systeme. Eine schematischeDarstellung eines institutionenübergreifenden Setups zeigt die Abbildung 2.
Distributed Network Block Device 3 Traditionell kommt für die Ver-teilung des Root-Filesystems über das Netz bootender Cluster-Knoten NFS
Flexible Cluster Node Provisioning in a Distributed Environment 215
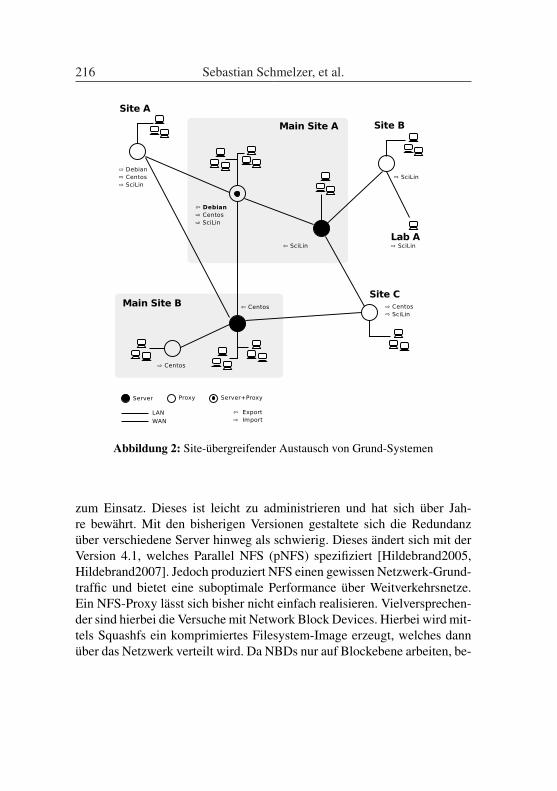
Abbildung 2: Site-übergreifender Austausch von Grund-Systemen
zum Einsatz. Dieses ist leicht zu administrieren und hat sich über Jah-re bewährt. Mit den bisherigen Versionen gestaltete sich die Redundanzüber verschiedene Server hinweg als schwierig. Dieses ändert sich mit derVersion 4.1, welches Parallel NFS (pNFS) spezifiziert [Hildebrand2005,Hildebrand2007]. Jedoch produziert NFS einen gewissen Netzwerk-Grund-traffic und bietet eine suboptimale Performance über Weitverkehrsnetze.Ein NFS-Proxy lässt sich bisher nicht einfach realisieren. Vielversprechen-der sind hierbei die Versuche mit Network Block Devices. Hierbei wird mit-tels Squashfs ein komprimiertes Filesystem-Image erzeugt, welches dannüber das Netzwerk verteilt wird. Da NBDs nur auf Blockebene arbeiten, be-
216 Sebastian Schmelzer, et al.
sitzen sie wesentlich weniger Overhead und profitieren vom Block-Cachedes Linux-Kernels. In Frage kommen hierfür das bereits im Kernel enthal-tene NBD sowie das an der Universität Freiburg entwickelte DistributedNetwork Block Device (DNBD). Das DNBD in der aktuellen Version 315
ist eine vollständige Neuentwicklung, dessen Hauptziel es ist, die Vorteiledes NBD und seiner Vorgänger zu vereinen. Die maximale Auslastung derzur Verfügung stehenden Bandbreite wird durch eine starke Parallelisierungund die Auslagerung der I/O intensiven Operationen in den Linux Kernelerreicht. Mit der Verwendung von redundanten Servern und der Möglich-keit der Clients, selbstständig einen optimalen Server zu wechseln, wirddie Ausfallsicherheit und Lastverteilung des Setups sichergestellt. Zudembietet der DNBD3 einem einfachen Proxy-Dienst, der die schnelle Anbin-dung einer großen Anzahl Clients im lokalen Netz an externe Ressourcenermöglicht.
7 Ausblick
Das Prinzip des Netzwerk-Boots hat sich seit Jahren bewährt und wird des-halb in vielen Cluster- und Grid-Infrastrukturen eingesetzt. Das bisherigeBetriebsmodell des bwGRiD stößt an seine konzeptionellen Grenzen, diesich als zu einschränkend für zukünftige Entwicklungen des Projekts her-ausstellen könnten. Alternativkonzepte liegen bereits vor und sind an ande-ren Stellen, wie beispielsweise im BFG, bereits erfolgreich getestet worden.Damit existieren Prototypen, welche eine Grundlage für einen Testlauf imbwGRiD bilden können. Bisher existierten die verschiedenen Bereiche ge-trennt nebenander. Mit der zunehmenden Grid- und Compute-Joberfahrungam Rechenzentrum in Freiburg ließen sich jedoch Testläufe organisieren.Hierfür ist ist entsprechende Koordination von Administratoren und An-wendern wünschenswert, um eine sinnvolle Planung und Evaluation zu er-lauben.
So bietet ein zentraler Konfigurations- und Steuerdienst in der Verbin-dung mit einem flexibleren Bootloader beziehungsweise Bootloader-ErsatzMöglichkeiten, die weit über die Fähigkeiten eines rein PXE-basierten An-
15 Webseite des DNBD3 Kernel-Moduls, http://lab.openslx.org/projects/dnbd3.
Flexible Cluster Node Provisioning in a Distributed Environment 217
satzes hinausgehen. Eine Nutzung könnte das bedarfsgerechte Starten un-terschiedlicher Systeme auf Cluster-Knoten, gesteuert durch das zentraleManagement, sein. Das vorgeschlagene Konzept erhebt keinen Ausschließ-lichkeitsanspruch, sondern sieht die Verteilung von Administrationsrollenvor, welche eine Koexistenz verschiedener Boot-Lösungen erlaubt.
Literaturverzeichnis[Dynowski2012] M. Dynowski, M. Janczyk, J. Schulz, D. v. Suchodoletz
und S. Hermann. Das bwGRiD – High Performance Com-pute Cluster als flexible, verteilte Wissenschaftsinfrastruktur.In Paul Müller, Bernhard Neumair, Helmut Reiser und Ga-bi Dreo Rodosek, Herausgeber, 5. DFN-Forum Kommunikati-onstechnologien – Verteilte Systeme im Wissenschaftsbereich,pages 95–105. Gesellschaft für Informatik e.V. (GI), 2012.
[Garcia2011] A.O. Garcia, S. Bourov, A. Hammad, J. van Wezel, B. Neu-mair, A. Streit, V. Hartmann, T. Jejkal, P. Neuberger undR. Stotzka. The Large Scale Data Facility: Data IntensiveComputing for Scientific Experiments. In Parallel and Dis-tributed Processing Workshops and Phd Forum (IPDPSW),2011 IEEE International Symposium on, pages 1467 –1474,Mai 2011.
[Hildebrand2005] D. Hildebrand und P. Honeyman. Exporting StorageSystems in a Scalable Manner with pNFS. In CITI TechnicalReport 05-01, pages 106–111. University of Michigan, 2005.
[Hildebrand2007] D. Hildebrand und P. Honeyman. Direct-pNFS: scala-ble, transparent, and versatile access to parallel file systems.In Proceedings of the 16th international symposium on Highperformance distributed computing, HPDC ’07, pages 199–208, New York, NY, USA, 2007. ACM.
[Intel2000] Intel Corp. Preboot Execution Environment (PXE) specifica-tion version 2.0, 2000. http://www.pix.net/software/
pxeboot/archive/pxespec.pdf.
218 Sebastian Schmelzer, et al.
[Katz2002] M.J. Katz, P.M. Papadopoulos und G. Bruno. Leveragingstandard core technologies to programmatically build Linuxcluster appliances. In Conference on Cluster Computing –Proceedings, 2002, pages 47–53, 2002.
[McQuillan2000] J. McQuillan. The Linux Terminal Server Project: Thinclients and Linux. In 4th Annual Linux Showcase & Confe-rence, Atlanta, 2000.
[Schmelzer2009] S. Schmelzer und D. v. Suchodoletz. Net-work Linux Anywhere. LinuxTag 2009, Juni 2009.http://blog.openslx.org/wp-content/uploads/
2009/07/networklinuxanywhere-paper.pdf.
[Schmelzer2011a] S. Schmelzer, D. v. Suchodoletz, G. Schneider,D. Weingaertner, L.C.E. d. Bona und C. Carvalho. Universalremote boot and administration service. In Network Operati-ons and Management Symposium (LANOMS), 2011 7th LatinAmerican, pages 1–6, 2011.
[Schmelzer2011b] S. Schmelzer, D. v. Suchodoletz und G. Schneider.Netzwerkboot uber Weitverkehrsnetze – Ansatz zur zentra-len Steuerung und Verwaltung von Betriebssystemen uber dasInternet. In Paul Müller, Bernhard Neumair und Gabi DreoRodosek, Herausgeber, 4. DFN-Forum Kommunikationstech-nologien, pages 37–46. Bonner Köllen Verlag, 2011.
[vSuchodoletz2007] D. v. Suchodoletz. Neue Konzepte für flexibleMultimedia-Schulungsumgebungen. In Neue Medien alsstrategische Schrittmacher an der Universität Freiburg, pages97–100. Universitätsverlag Freiburg, 2007.
Flexible Cluster Node Provisioning in a Distributed Environment 219

Evaluation of Network Bonding Performance inClient/Server Scenarios
Konrad Meier∗, Sebastian Schmelzer†, Dirk von Suchodoletz‡
University of Freiburg
Abstract: Fast data networks play a major role in high performance com-puting for node interconnects, network filesystems or blockdevices and dis-tributed network applications. With the rising demand for compute power,larger amount of data is transferred and the existing Ethernet connection speedsbecome insufficient. Often it is costly to update the whole network infras-tructure only to remove individual bottlenecks in the existing configuration.Ethernet bonding is a method to bind several independent Ethernet links to asingle, virtual one and therefor provides a good compromise in order to addnetwork bandwidth on critical links. This paper dicusses the actual state ofLinux Ethernet network bonding in the field of high performance networking,storage and client root filesystem provisioning. It compares the different bond-ing modes regarding performance, throughput and balanc of traffic flows andpresents recommendations for certain network configurations.
1 Introduction
Ethernet is one of the most popular networking technologies of today andavailable in nearly every network device ranging from the traditional ap-plication in servers and desktops to the domain of appliances and homenetworking. The standard itself is rather old and dates back to the end ofthe 1970ies [Brock2003]. Since then, a race could be observed: New Ether-net standards were introduced often well ahead of the actual capabilities ofthe average hardware available. Over time the hardware caught up, but the
bandwidth demands exceeded the installed network equipment. Sometimesan upgrade to the next generation is a good option, but more often newernetwork components are highly expensive or not yet available. Not only thenetwork adapters in the core servers are to be upgraded, but also a numberof components, e.g. the core switches and routers. Therefore, hardwaremanufacturers in cooperation with operating system vendors introduced inthe 1990s the possibility to combine two more physical Ethernet links toone logical channel. This technique takes into account the fact that admin-istrators and users would be happy with just doubling or tripling the net-work capacity without jumping directly to the next Ethernet generation. Atthe beginning, a special hardware was required or at least identical Ethernetinterface cards. Many manufacturer offered their own implementations, e.gEtherchannel by Cisco, Port Aggregation by Hewlett-Packard or Trunkingby Sun Microsystems. At the beginning many of those techniques wereproprietary implementations mainly to aggregate multiple links betweenswitches. Today, combining multiple links is known as Ethernet bonding,link aggregation or in other environments called teaming, port aggregationor trunking.
As Linux is the predominantly applied operating system for high per-formance computing (HPC) we will focus solely on the Linux implemen-tation throughout this paper. A recent overview and practical applicationon Linux bonding can be found in [Rankin2011]. The articles [Aust2006,Hsueh2006] give a wider overview on Linux bonding. The discussion ofbonding as a typical means for network performance improvement in clus-ter application can be found e.g. in [Watanabe2008].
This paper is structured as follows: Section 2 introduces the differentbonding modes, their requirements and operating modes. In section 3 weexplain the two major test setups we use for our experiments. These testsevaluate the different bonding modes and compare a single link with nextgeneration Ethernet technology. Section 4 summarizes the findings anddiscusses their practical impact.
222 Konrad Meier, et al.
2 Bonding Requirements and Operating Modes
The idea of bonding is to join a number of interfaces usually of the samelink speed to create a virtual interface aggregating the link speeds. In orderto achieve a high availability multiple links also create a redundant setup.Several bonding modes are predefined and can be set via the kernel mod-ule loading parameter mode.1 Every bonding consists of a virtual bondinginterface and a number of attached slave interfaces. An example config-uration for Debian-Linux is given in the appendix. The various bondingmodes achieve different objectives. For example, a redundant connectionto the server is achieved best by mode 1 (active backup), but the othermodes also have a fault tolerance although it is not their primary feature. Acommon objective is to aggregate multiple links to increase the maximumthroughput; this can be achieved by mode 0 (balance-rr), 2 (balance-xor), 5(balance-tlb) or mode 6 (balance-alb). Though all provide a somewhat in-creased throughput they do not fit all scenarios: Set to mode 0 two gigabitlinks combined to one virtual link almost double the data rate of a singleconnection. Optimizing power consumption could be another objective likediscussed in [Koibuchi2009].In this paper we focus on bonding modes that provide load balancing andthus increase the maximum throughput on the server side. The followingmodes are evaluated in this paper:
• Mode 0 (balance-rr)
• Mode 2 (balance-xor) and Mode 4 (IEEE 802.3ad)
• Mode 5 (alance-tlb) and Mode 6 (balance-alb)
The bonding modes can be sorted into three different groups. The firstgroup contains packet orientated transmitting policies, which only includesmode 0 (balance-rr). The second group bases on XOR policies for link se-lection and consists of mode 2 and 4. Mode 5 and 6 belong to the last groupwhich is based on a connection orientated policy.
1 For detailed information see: http://www.kernel.org/doc/Documentation/networking/bonding.txt
Evaluation of Network Bonding Performance 223

Mode Algorithm Description
0 balance-rr Round-robin policy: This mode simply transmitspackets in a sequential order from the first avail-able slave through the last. With this mechanismit provides both load balancing and fault tolerance.
1 active-backup Active-backup policy. Only one slave in the bondis actually transmitting packets. The other one isused if the first slave fails.
2 balance-xor XOR policy: This mode selects a slave devicebased on XOR transmission policy. This modeenables load balancing and fault tolerance.
3 broadcast Broadcast policy: A simple broadcast policywhich transmits all packets on all slave interfacesand thus offers fault tolerance.
4 802.3ad Dynamic link aggregation: IEEE standard con-forming 802.3ad dynamic link aggregation. Thismode utilizes all slaves in the active aggregatoraccording to the 802.3ad specification.
5 balance-tlb Adaptive transmit load balancing: The outgoingtraffic is distributed according to the current load(computed relative to the speed) on each slave.This mode also provides fault tolerance.
6 balance-alb Adaptive load balancing: It combines balance-tlbwith receive load balancing (rlb) for IPV4 traffic.The receive load balancing is achieved by ARPnegotiation. Like mode 5 this mode also providesfault tolerance.
Table 1: Supported Bonding Modes by the Linux Kernel
Mode 4 is an exception as it requires a switch that supports the IEEE802.3ad standard. All other modes mostly work without specially config-ured switches. For the XOR based bonding modes the slave link is selected
224 Konrad Meier, et al.
according to packet information from either layer 2 or layer 3 and 4. Forexample, link selection based on layer 2 information is calculated as fol-lows:
link = (([source MAC] XOR [destination MAC]) MOD count)
Besides configuring the bonding mode, a couple of options can be set us-ing parameters during module load. The arp_interval defines the ARP linkmonitoring frequency in milliseconds. The default setting, value 0, disablesthe monitoring. For values greater zero the arp_ip_target is to be set, whichspecifies the IP addresses to use as ARP monitoring peers.2 The downde-lay is valid only for the miimon 3 link monitor and specifies the time (inmilliseconds) to be waited before disabling a slave in case of a failure. Theopposite value is the updelay, it defins the time to be waited before enablinga slave after the link recovered. If the 802.3ad mode is selected, lacp_rateset to 0 would request the partner to transmit LACPDUs every 30 seconds,with a value of 1 to transmit every second. primary is a string value of eth0,eth1, ... which specifies the primary slave for the virtual bonding interface.
3 Test SetupHPC setups commonly require fast fileservers both for the root filesystemof the cluster nodes and for a readable and writable share to provide andreceive user and job data. Fast fileservers usually require read-only exportsto the clients, as all clients share a common filesystem when booting fromthe network. A block device with a suitable filesystem like SquashFS orNFS provide a solution. Read- and writeable shares are usually achievedby network filesystems like NFS or Lustre. [Hildebrand2007]File servers typically require a high network throughput with a scalablenumber of connections. Two different setups cover the main requirements:
• NBD block device server provides a read-only filesystem for Linuxnetwork booted compute cluster nodes and desktop machines.
2 An example to monitor multiple IP addresses would look like arp_ip_target=172.16.1.254,172.16.1.212. One address is usually the router’s.3 Media Independent Interface Link Monitoring
Evaluation of Network Bonding Performance 225
• NFSv3 server provides a fast read-write network filesystem for alarge number of cluster nodes.
As a preliminary requirement: a fast Machine is necessary to saturate onelink. Additional CPU load caused by the bonding method must also beconsidered.
3.1 Machine Hardware and Software Configuration
A test setup is required to compare the different bonding modes. The com-plete setup consists of one server one high bandwidth client and 61 clients.The hardware is given in table 2. To generate network traffic for a realistic
Server CPU: Dual AMD Opteron 2.3 GHz 6134RAM: 64 GByte DDR3Network 1: Intel Ethernet X520 Server AdapterNetwork 2: 3 x Intel Ethernet I350-T4 quad-portgigabit Adapter
High BandwidthClient
CPU: Dual Intel Xenon 2.3 GHz E5520RAM: 24 GByte DDR3 RAMNetwork: Intel Ethernet X520 Server Adapter
Client CPU Dual Core AMD or IntelRAM: 4 GByte RAMNetwork: Single Gigabit Ethernet link
Switch Alcatel-Lucent OmniSwitch 6850E
Table 2: Hardware deployment for the experiments run
test scenario a network block device is installed. The software DNBD3 4 isused as both the block device server and client. Through this block devicea 6 GByte file is shared to the clients.
4 DNBD3: Distributed Network Block Device 3: http://lab.ks.uni-freiburg.de/projects/ma-dnbd3 DNBD3 is a in-house special purpose development of at the University of Freiburg andis similar to the linux kernels NBD, Network Block Device http://nbd.sourceforge.net
226 Konrad Meier, et al.
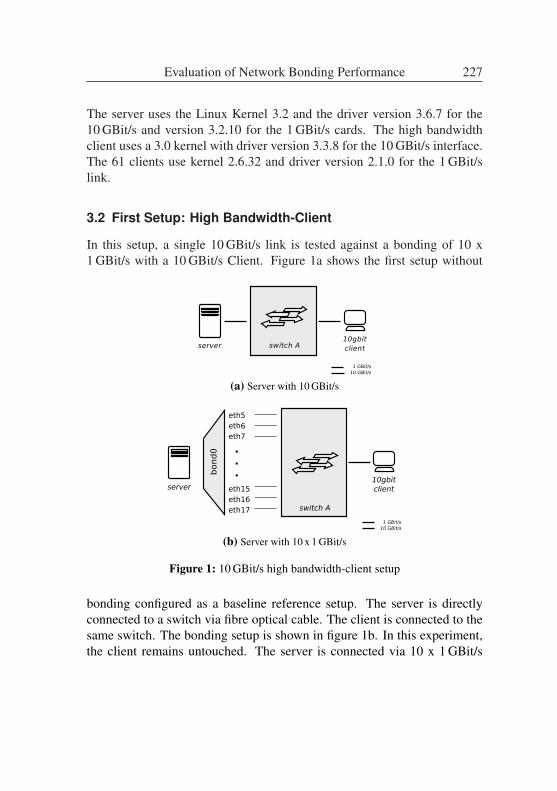
The server uses the Linux Kernel 3.2 and the driver version 3.6.7 for the10 GBit/s and version 3.2.10 for the 1 GBit/s cards. The high bandwidthclient uses a 3.0 kernel with driver version 3.3.8 for the 10 GBit/s interface.The 61 clients use kernel 2.6.32 and driver version 2.1.0 for the 1 GBit/slink.
3.2 First Setup: High Bandwidth-Client
In this setup, a single 10 GBit/s link is tested against a bonding of 10 x1 GBit/s with a 10 GBit/s Client. Figure 1a shows the first setup without
(a) Server with 10 GBit/s
eth5eth6eth7
eth15eth16eth17
.
.
.bond0
switch A
1 GBit/s10 GBit/s
server10gbitclient
(b) Server with 10 x 1 GBit/s
Figure 1: 10 GBit/s high bandwidth-client setup
bonding configured as a baseline reference setup. The server is directlyconnected to a switch via fibre optical cable. The client is connected to thesame switch. The bonding setup is shown in figure 1b. In this experiment,the client remains untouched. The server is connected via 10 x 1 GBit/s
Evaluation of Network Bonding Performance 227
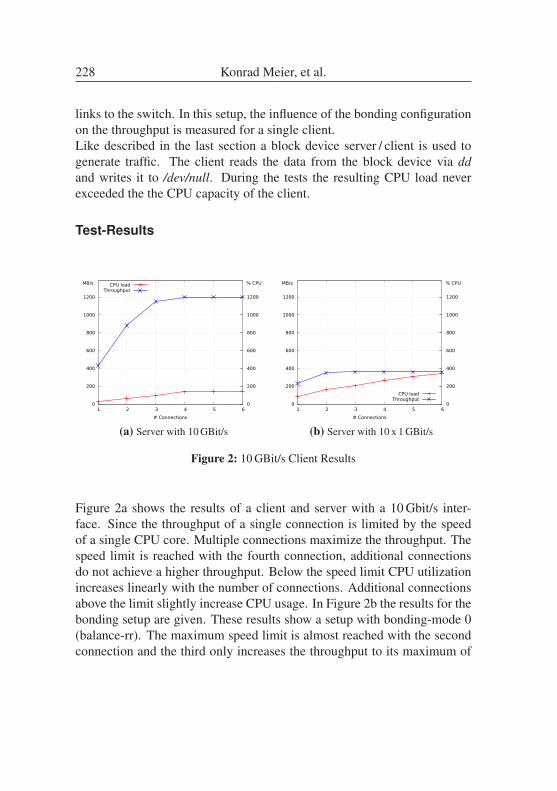
links to the switch. In this setup, the influence of the bonding configurationon the throughput is measured for a single client.Like described in the last section a block device server / client is used togenerate traffic. The client reads the data from the block device via ddand writes it to /dev/null. During the tests the resulting CPU load neverexceeded the the CPU capacity of the client.
Test-Results
0
200
400
600
800
1000
1200
1 2 3 4 5 6 0
200
400
600
800
1000
1200
MB/s % CPU
# Connections
CPU loadThroughput
(a) Server with 10 GBit/s
0
200
400
600
800
1000
1200
1 2 3 4 5 6 0
200
400
600
800
1000
1200
MB/s % CPU
# Connections
CPU loadThroughput
(b) Server with 10 x 1 GBit/s
Figure 2: 10 GBit/s Client Results
Figure 2a shows the results of a client and server with a 10 Gbit/s inter-face. Since the throughput of a single connection is limited by the speedof a single CPU core. Multiple connections maximize the throughput. Thespeed limit is reached with the fourth connection, additional connectionsdo not achieve a higher throughput. Below the speed limit CPU utilizationincreases linearly with the number of connections. Additional connectionsabove the limit slightly increase CPU usage. In Figure 2b the results for thebonding setup are given. These results show a setup with bonding-mode 0(balance-rr). The maximum speed limit is almost reached with the secondconnection and the third only increases the throughput to its maximum of
228 Konrad Meier, et al.
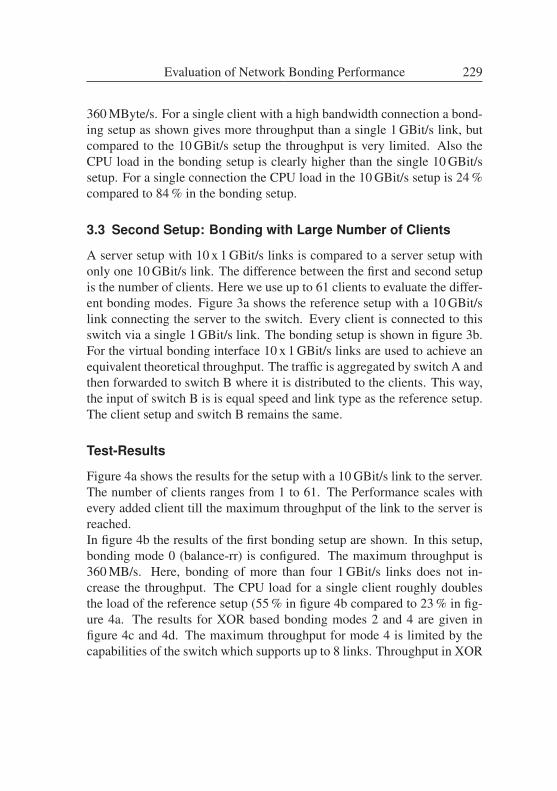
360 MByte/s. For a single client with a high bandwidth connection a bond-ing setup as shown gives more throughput than a single 1 GBit/s link, butcompared to the 10 GBit/s setup the throughput is very limited. Also theCPU load in the bonding setup is clearly higher than the single 10 GBit/ssetup. For a single connection the CPU load in the 10 GBit/s setup is 24 %compared to 84 % in the bonding setup.
3.3 Second Setup: Bonding with Large Number of Clients
A server setup with 10 x 1 GBit/s links is compared to a server setup withonly one 10 GBit/s link. The difference between the first and second setupis the number of clients. Here we use up to 61 clients to evaluate the differ-ent bonding modes. Figure 3a shows the reference setup with a 10 GBit/slink connecting the server to the switch. Every client is connected to thisswitch via a single 1 GBit/s link. The bonding setup is shown in figure 3b.For the virtual bonding interface 10 x 1 GBit/s links are used to achieve anequivalent theoretical throughput. The traffic is aggregated by switch A andthen forwarded to switch B where it is distributed to the clients. This way,the input of switch B is is equal speed and link type as the reference setup.The client setup and switch B remains the same.
Test-Results
Figure 4a shows the results for the setup with a 10 GBit/s link to the server.The number of clients ranges from 1 to 61. The Performance scales withevery added client till the maximum throughput of the link to the server isreached.In figure 4b the results of the first bonding setup are shown. In this setup,bonding mode 0 (balance-rr) is configured. The maximum throughput is360 MB/s. Here, bonding of more than four 1 GBit/s links does not in-crease the throughput. The CPU load for a single client roughly doublesthe load of the reference setup (55 % in figure 4b compared to 23 % in fig-ure 4a. The results for XOR based bonding modes 2 and 4 are given infigure 4c and 4d. The maximum throughput for mode 4 is limited by thecapabilities of the switch which supports up to 8 links. Throughput in XOR
Evaluation of Network Bonding Performance 229
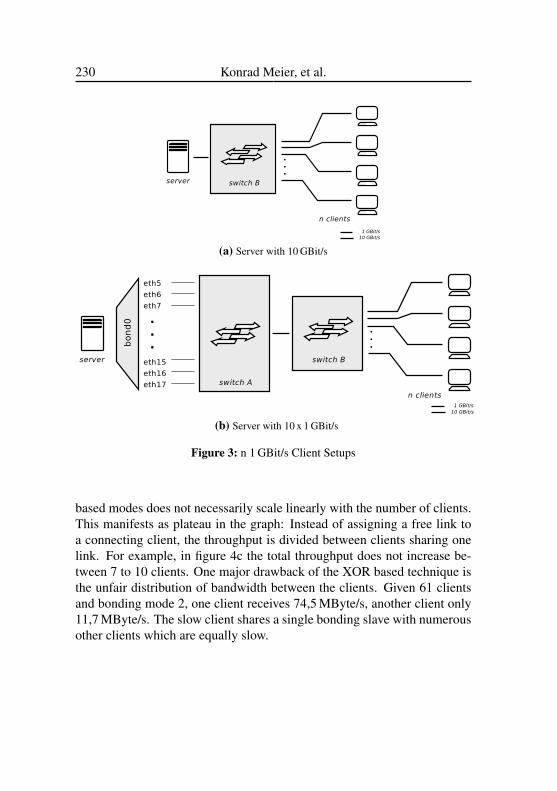
(a) Server with 10 GBit/s
(b) Server with 10 x 1 GBit/s
Figure 3: n 1 GBit/s Client Setups
based modes does not necessarily scale linearly with the number of clients.This manifests as plateau in the graph: Instead of assigning a free link toa connecting client, the throughput is divided between clients sharing onelink. For example, in figure 4c the total throughput does not increase be-tween 7 to 10 clients. One major drawback of the XOR based technique isthe unfair distribution of bandwidth between the clients. Given 61 clientsand bonding mode 2, one client receives 74,5 MByte/s, another client only11,7 MByte/s. The slow client shares a single bonding slave with numerousother clients which are equally slow.
230 Konrad Meier, et al.
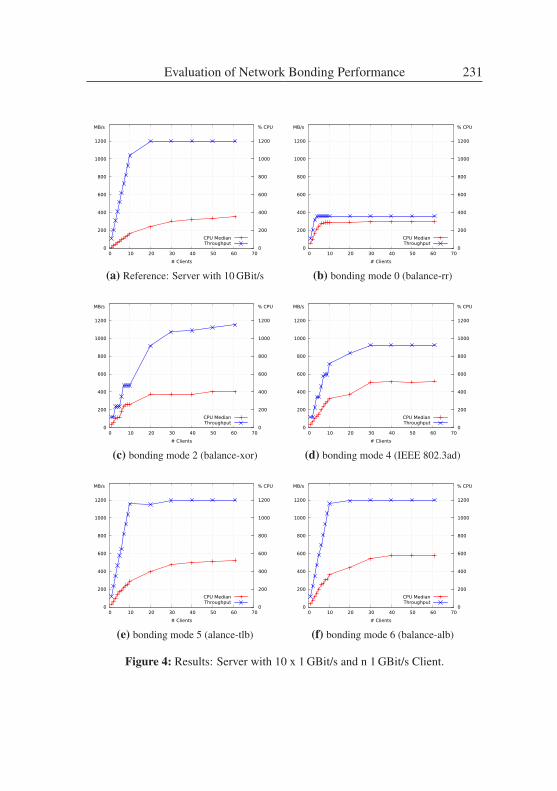
0
200
400
600
800
1000
1200
0 10 20 30 40 50 60 70 0
200
400
600
800
1000
1200
MB/s % CPU
# Clients
CPU MedianThroughput
(a) Reference: Server with 10 GBit/s
0
200
400
600
800
1000
1200
0 10 20 30 40 50 60 70 0
200
400
600
800
1000
1200
MB/s % CPU
# Clients
CPU MedianThroughput
(b) bonding mode 0 (balance-rr)
0
200
400
600
800
1000
1200
0 10 20 30 40 50 60 70 0
200
400
600
800
1000
1200
MB/s % CPU
# Clients
CPU MedianThroughput
(c) bonding mode 2 (balance-xor)
0
200
400
600
800
1000
1200
0 10 20 30 40 50 60 70 0
200
400
600
800
1000
1200
MB/s % CPU
# Clients
CPU MedianThroughput
(d) bonding mode 4 (IEEE 802.3ad)
0
200
400
600
800
1000
1200
0 10 20 30 40 50 60 70 0
200
400
600
800
1000
1200
MB/s % CPU
# Clients
CPU MedianThroughput
(e) bonding mode 5 (alance-tlb)
0
200
400
600
800
1000
1200
0 10 20 30 40 50 60 70 0
200
400
600
800
1000
1200
MB/s % CPU
# Clients
CPU MedianThroughput
(f) bonding mode 6 (balance-alb)
Figure 4: Results: Server with 10 x 1 GBit/s and n 1 GBit/s Client.
Evaluation of Network Bonding Performance 231
Bonding mode 5 and 6 scale very well as shown in figure 4e and 4f. Thethroughput increases linearly with the number of clients up to the maxi-mum link speed. The throughput measurements are almost identical forboth modes. The CPU load for mode 5 is slightly lower than mode 6. Bothbonding modes, however, provide a significantly reduced CPU load com-pared to the single 10 GBit/s link.
4 ConclusionBonding is a sensible solution if the throughput in a high performance net-work only needs to be doubled or tripled. Often an update to the nextlevel of Ethernet requires upgrading the network components, too, whichto a certain degree is hereby avoidable. Especially in high performancecomputing the existing hardware can further be used if the network inter-connections between nodes are the limiting factor. In addition to increasingbandwidth, includes a simple network link failover solution. In connection-oriented scenarios with a large number of clients a bonding of 10 x 1 Gbit/sinterfaces offers a good alternative to a single 10 Gbit/s card. If bondingmode 5 or 6 is set, the throughput is identical to a single 10 Gbit/s inter-face. Nevertheless, if the ten server connections require the installation of anew switch, the upgrade to 10 Gbit/s is considerable. Especially for a lowernumber of aggregated links, there the required port is often already avail-able on the installed network equipment. A larger number of connectionsrequires a higher amount of energy which has to be considered as wellas the expenses for the network equipment. The expenses for the serverequipment used in the test setup is nearly the same for one 10 GBit/s or12 x 1 GBit/s ports. Of course is the number of required PCIe slots for thethe 10 x 1 GBit/s higher than a single 10 GBit/s card. The introduced testsetup needed three PCIe x4 slots.As bonding creates its own virtual interface, processing the Ethernet pack-ets passing through, it adds extra load to the CPU depending on a predefinedmode. For example, if setting mode 0, the additional CPU load is relativelyhigh compared to other modes. In all other modes the additional CPU loadis mensurable but is not a limiting factor.
232 Konrad Meier, et al.
When demands for throughput exceed a certain threshold (dependingon factors such as ports, pre-existing cable and component infrastructure)switching to the next standard is inevitable. Especially with high bandwidthclients in the network, as shown in section 3.2, an upgrade is necessary; oth-erwise the client throughput is very limited.A new alternative to bonding drivers called team devices 5 was includedinto the Linux kernel with the version 3.3. This feature is designed as auser-space program and is supposed to be a fast and simple implementationalternative to bonding. Currently, this alternative is still in development(04/2012).
Bibliography[Aust2006] S. Aust, Jong-Ok Kim, P. Davis, A. Yamaguchi, and S. Obana.
Evaluation of linux bonding features. In International Confer-ence on Communication Technology (ICCT), 2006.
[Brock2003] G.W. Brock. The second information revolution. HarvardUniv Pr, 2003.
[Hildebrand2007] Dean Hildebrand and Peter Honeyman. Direct-pnfs:scalable, transparent, and versatile access to parallel file sys-tems. In Proceedings of the 16th international symposium onHigh performance distributed computing, HPDC ’07, pages199–208, New York, NY, USA, 2007. ACM.
[Hsueh2006] Chin-Wen Hsueh, Hsin-Hung Lin, and Guo-Chiuan Huang.Boosting ethernet using regular switching hubs. Journal ofInformation Science and Engineering, 22:721–734, 2006.
[Koibuchi2009] Michihiro Koibuchi, Tomohiro Otsuka, Hiroki Matsutani,and Hideharu Amano. An on/off link activation method forlow-power ethernet in pc clusters. In IEEE International Sym-posium on Parallel & Distributed Processing (IPDPS), 2009,2009.
5 first announcement of the team device: http://git.kernel.org/?p=linux/kernel/git/torvalds/linux-2.6.git;a=commitdiff;h=3d249d4ca7d0ed6629a135ea1ea21c72286c0d80
Evaluation of Network Bonding Performance 233

[Rankin2011] Kyle Rankin. Hack and /- bond, ethernet bond. Linux Jour-nal, 2011.
[Watanabe2008] T. Watanabe, M. Nakao, T. Hiroyasu, T. Otsuka, andM. Koibuchi. The impact of topoloy and link aggregation onpc cluster with ethernet. In IEEE International Conference onCluster Computing (Cluster2008), pages 280–285, 2008.
234 Konrad Meier, et al.


Hochleistungsrechnen in Baden-Württemberg Ausgewählte Aktivitäten im bwGRiD
bwGRiD bezeichnet eine einzigartige Kooperation zwischen den Hoch-
schulen des Landes Baden-Württtemberg, die Wissenschaftlern aller
Disziplinenen Ressourcen im Bereich des HPCs effizient und hochverfügbar
zur Verfügung zu stellt. Im Vordergrund steht der Aufbau einer dezen-
tralen Grid-Struktur, bei der homogene Parallelrechner-Cluster transpa-
rent zu einem Grid-Verbund gekoppelt werden. Das Projekt sollte die
Machbarkeit und den Nutzen von Grid-Konzepten für die Wissenschaft
nachweisen und bisherige Organisations- und Sicherheitsproblematiken
überwinden. Der in diesem Band präsentierte 8. bwGRiD-Workshop in
Freiburg bot die Chance, einen breiten Überblick sowohl zum techni-
schen und organisatorischen Stand des Projektes zu verschaffen, An-
wender und Administratoren gleichsam zu Wort kommen zu lassen und
den Austausch zwischen den Fach-Communities zu fördern.
9 783731 501961
ISBN 978-3-7315-0196-1