HO WEST DISTRICT - Ghana Statistical Services.
79
HO WEST DISTRICT
-
Upload
khangminh22 -
Category
Documents
-
view
0 -
download
0
Transcript of HO WEST DISTRICT - Ghana Statistical Services.

HO WEST DISTRICT

ii
Copyright © 2014 Ghana Statistical Service

iii
PREFACE AND ACKNOWLEDGEMENT
No meaningful developmental activity can be undertaken without taking into account the
characteristics of the population for whom the activity is targeted. The size of the population
and its spatial distribution, growth and change over time, in addition to its socio-economic
characteristics are all important in development planning.
A population census is the most important source of data on the size, composition, growth
and distribution of a country’s population at the national and sub-national levels. Data from
the 2010Population and Housing Census (PHC) will serve as reference for equitable
distribution of national resources and government services, including the allocation of
government funds among various regions, district sand other sub-national populations to
education, health and other social services.
The Ghana Statistical Service (GSS) is delighted to provide data users, especially the
Metropolitan, Municipal and District Assemblies, with district-level analytical reports based
on the 2010 PHC data to facilitate their planning and decision-making.
The District Analytical Report for the Ho West District is one of the 216 district census
reports aimed at making data available to planners and decision makers at the district level. In
addition to presenting the district profile, the report discusses the social and economic
dimensions of demographic variables and their implications for policy formulation, planning
and interventions. The conclusions and recommendations drawn from the district report are
expected to serve as a basis for improving the quality of life of Ghanaians through evidence-
based decision-making, monitoring and evaluation of developmental goals and intervention
programmes.
For ease of accessibility to the census data, the district report and other census reports
produced by the GSS will be disseminated widely in both print and electronic formats. The
report will also be posted on the GSS website: www.statsghana.gov.gh.
The GSS wishes to express its profound gratitude to the Government of Ghana for providing
the required resources for the conduct of the 2010 PHC. While appreciating the contribution
of our Development Partners (DPs) towards the successful implementation of the Census, we
wish to specifically acknowledge the Department for Foreign Affairs, Trade and
Development (DFATD) formerly the Canadian International Development Agency (CIDA)
and the Danish International Development Agency (DANIDA) for providing resources for
the preparation of all the 216 district reports. Our gratitude also goes to the Metropolitan,
Municipal and District Assemblies, the Ministry of Local Government, Consultant Guides,
Consultant Editors, Project Steering Committee members and their respective institutions for
their invaluable support during the report writing exercise. Finally, we wish to thank all the
report writers, including the GSS staff who contributed to the preparation of the reports, for
their dedication and diligence in ensuring the timely and successful completion of the district
census reports.
Dr. Philomena Nyarko
Government Statistician

iv
TABLE OF CONTENTS
PREFACE AND ACKNOWLEDGEMENT .................................................................. iii
LIST OF TABLES ......................................................................................................... vi
LIST OF FIGURES ...................................................................................................... vii
ACRONYMS AND ABBREVIATIONS....................................................................... viii
EXECUTIVE SUMMARY ............................................................................................. ix
CHAPTER ONE: INTRODUCTION............................................................................. 1 1.1 Introduction .................................................................................................................... 1
1.2 Physical Features ....................................................................................................... 1
1.3 Political and Administrative Structure ........................................................................... 3
1.4 Social and Cultural Structure ......................................................................................... 3
1.5 Economy ........................................................................................................................ 4
1.6 Census Methodology, Concepts and Definitions ........................................................... 5
1.7 Organization of the Report........................................................................................... 14
CHAPTER TWO: DEMOGRAPHIC CHARACTERISTICS .............................................. 16
2.1 Introduction .................................................................................................................. 16
2.2 Population Size and Distribution ................................................................................. 16
2.3 Age- Sex Structure ....................................................................................................... 16
2.4 Fertility, Mortality and Migration ................................................................................ 18
2.5 Mortality ...................................................................................................................... 20
CHAPTER THREE: SOCIAL CHARACTERISTICS ........................................................... 23
3.1 Introduction .................................................................................................................. 23
3.2 Household Size, Composition and Headship ............................................................... 23
3.4 Marital Status ............................................................................................................... 25
3.5 Nationality.................................................................................................................... 29
3.6 Religious Affiliation .................................................................................................... 29
3.7 Literacy and Education ................................................................................................ 29
CHAPTER FOUR: ECONOMIC CHARACTERISTICS ...................................................... 34
4.1 Introduction .................................................................................................................. 34
4.2 Economic Activity Status ............................................................................................ 34
4.3 Occupation ............................................................................................................... 36
4.4 Industry ........................................................................................................................ 37
4.5 Employment Status ...................................................................................................... 38
4.6 Employment Sector ...................................................................................................... 39
CHAPTER FIVE: INFORMATION COMMUNICATION TECHNOLOGY ................ 40
5.1 Introduction .................................................................................................................. 40
5.2 Ownership of Mobile Phones....................................................................................... 40
5.3 Use of Internet.............................................................................................................. 40
5.4 Household Ownership of Desktop or Laptop computers ............................................. 41
CHAPTER SIX: DISABILITY ........................................................................................................ 42
6.1 Introduction .................................................................................................................. 42
6.2 Population with Disability ........................................................................................... 42
v
6.3 Type of Disability ........................................................................................................ 42
6.4 Distribution by Type of Locality ................................................................................. 42
6.6 Disability, Education and Literacy .............................................................................. 43
CHAPTER SEVEN: AGRICULTURAL ACTIVITIES .......................................................... 45
7.1 Introduction .................................................................................................................. 45
7.2 Households in Agriculture ........................................................................................... 45
7.3 Types of Farming ......................................................................................................... 45
7.4 Distribution of Livestock and Other Animals .............................................................. 45
CHAPTER EIGHT: HOUSING CONDITIONS ....................................................................... 47
8.1 Introduction .................................................................................................................. 47
8.2 Housing Stock .............................................................................................................. 47
8.3 Type of Dwelling, Holding and Tenancy Arrangement .............................................. 48
8.4 Construction Materials ................................................................................................. 50
8.5 Room Occupancy ......................................................................................................... 52
8.6 Access to Utilities and Household Facilities ............................................................... 53
8.7 Main Source of Water for Drinking and for Other Domestic Use ............................... 55
8.8 Bathing and Toilet Facilities ........................................................................................ 56
8.9 Method of Waste Disposal ........................................................................................... 57
CHAPTER NINE: SUMMARY OF FINDINGS AND POLICY IMPLICATIONS ....... 59
9.1 Introduction .................................................................................................................. 59
9.2 Summary of Findings ................................................................................................... 59
9.3 Policy Implications ...................................................................................................... 62
REFERENCES ....................................................................................................................................... 63
APPENDICES ........................................................................................................................................ 64
LIST OF CONTRIBUTORS ............................................................................................................. 68

vi
LIST OF TABLES
Table 2.1: Population distribution by age and sex .................................................................. 17
Table 2.2: Reported total fertility rate, general fertility rate and crude birth rate
by district, Volta Region ........................................................................................ 19
Table 2.3: Female population 12 years and older by age, children ever born,
children surviving and sex of child ........................................................................ 20
Table 2.4: Total population, deaths in households and crude death rate ................................ 21
Table 2.5: Birthplace by duration of residence of migrants .................................................... 22
Table 3.1: Household size by locality type ............................................................................. 23
Table 3.2: Household population by composition and sex ..................................................... 24
Table 3.3: Household population by structure and sex ........................................................... 24
Table 3.4: Persons 12 years and older by sex, age-group and marital status .......................... 25
Table 3.5: Persons 12 years and older by sex, marital status and level of education ............. 26
Table 3.6: Persons 12 years and older by sex, marital status and economic activity status ... 28
Table 3.7: Population by nationality and sex .......................................................................... 29
Table 3.8: Population by religion and sex .............................................................................. 29
Table 3.9: Population 11 years and older by sex, age and literacy status ............................... 31
Table 3.10:Population 3 years and older by level of education, school attendance and sex ... 33
Table 4.1: Population 15 years and older by activity status and sex ...................................... 35
Table 4.2: Economic activity status of population 15 years and older by sex and age .......... 36
Table 4.3: Employed population 15 years and older by occupation and sex .......................... 37
Table 4.4: Employed population 15 years and older by industry and sex .............................. 38
Table 4.5: Employed population 15 years and older by employment status and sex ............. 39
Table 4.6: Employed population 15 years and older by employment sector and sex ............. 39
Table 5.1: Population 12 years and older by mobile phone ownership, internet
facility usage, and sex ............................................................................................ 41
Table 5.2: Households having desktop/laptop computers, fixed telephone lines and sex
of head .................................................................................................................... 41
Table 6.1: Population by type of locality, disability type and sex .......................................... 43
Table 6.2: Persons 3 years and older by sex, disability type and level of education .............. 44
Table 7.1: Households by agricultural activities and locality ................................................. 45
Table 7.2: Distribution of livestock, other animals reared and keepers.................................. 46
Table 8.1: Stock of houses and households by type of locality .............................................. 47
Table 8.2: Ownership status of dwelling by sex of household head and type of locality ....... 49
Table 8.3: Type of occupied dwelling unit by sex of household head and type of locality ... 50
Table 8.4: Main construction material for outer wall of dwelling unit by type of locality .... 51
Table 8.5: Main construction materials for the floor of dwelling unit by type of locality ..... 51
Table 8.6: Main construction material for roofing of dwelling unit by type of locality ......... 52
Table 8.7: Household size and number of sleeping rooms occupied in dwelling unit ........... 52

vii
Table 8.8: Main source of lighting of dwelling unit by type of locality ................................. 53
Table 8.9: Main source of cooking fuel, and cooking space used by households ................. 54
Table 8.10: Main source of cooking fuel, and cooking space used by households ................. 54
Table 8.11: Main source of water of dwelling unit for drinking and other domestic
purpose .................................................................................................................. 55
Table 8.12: Toilet facilities used by households ...................................................................... 56
Table 8.13: Bathing facilities used by household .................................................................... 57
Table 8.14: Method of solid waste disposal by households..................................................... 57
Table 8.15: Method of rubbish and liquid waste disposal by households ............................... 58
Table A1: Highest level of school attended or attending ....................................................... 64
Table A2: Population by sex, number of households and houses in the 20 ........................... 66
largest communities .............................................................................................. 66
Table A3: Population by age group in the 20 largest communities ....................................... 67
LIST OF FIGURES
Figure 1.1: Map Ho West District............................................................................................. 2
Figure 2.1: Population pyramid .............................................................................................. 18
Figure 2.2: Reported age specific death rate by sex ............................................................... 20
Figure 3.1: Population 11 years and older by literacy status and sex ..................................... 30
Figure 8.1: Percentage distribution of houses by locality ....................................................... 48

viii
ACRONYMS AND ABBREVIATIONS
CBR Crude Birth Rate
CHPS Community-based Health Planning and Service
DMTDP District Medium Term Development Plan
ECOWAS Economic Community of West African States
fCUBE Free Compulsory Universal Basic Education
GFR General Fertility Rate
ICT Information and Communication Technologies
JHS Junior High School
JSS Junior Secondary School
Km2 Kilometer squared
KVIP Kumasi Ventilated Improved Pit
LI Legislative Instrument
MDG Millennium Development Goal
NGO Non-Governmental Organisations
PDA Personal Digital Assistant
PHC Population and Housing Census
PWD Persons with Disability
SHS Senior High School
SSS Senior Secondary School
TFR Total Fertility Rate
UN United Nations
UNDP United Nations Development Programme
UNICEF United Nations Children’s Fund
WC Water Closet
WHO World Health Organisation
ix
EXECUTIVE SUMMARY
Introduction
The District census report is the first of its kind since the first post-independence census was
conducted in 1960. The report provides basic information about the District. It gives a brief
background of the District, describing its physical features, political and administrative
structure, socio-cultural structure and economy. Using data from the 2010 Population and
Housing Census (2010 PHC), the report discusses the population characteristics of the
District, fertility, mortality, migration, marital status, literacy and education, economic
activity status, occupation, employment; Information Communication Technology (ICT),
disability, agricultural activities and housing conditions of the District. The key findings of
the analysis are as follows (references are to the relevant sections of the report):
Population size, structure and composition
The population of Ho West according to the 2010 Population and Housing Census is 94600.
Males constitute 48 percent and females represent 52 percent. The Urban –Rural divide is
10.9 and 89.1percent respectively and has a sex ratio of 92.1the age group 0-14 forms 36.5
percent of the Districts population, this implies that the District’s population is youthful. This
is shown in the broad base population pyramid which narrowed off with a small number of
elderly persons. The total age dependency ratio for the District is 81.9, with males having a
higher dependency ratio of 86.2 as against 78 for females. The dependency ratio for the rural
as compared to the urban is 82.6 and 76.3 respectively.
Fertility, mortality and migration
The Total Fertility Rate for the District is 3.6 with a General Fertility Rate of 104.6 births per
1000 women aged 15-49 years which is higher than the regions rate of 99.2 The Crude Birth
Rate (CBR)is 24.2 per 1000 population. The crude death rate for the District is 12.5 per
1000.Majority of migrants (74.0%) living in the district was born elsewhere in the region
whiles the remaining were born elsewhere in another region. Most of the migrants born
elsewhere in other regions were born in the Greater Accra region (6.4%)
Household size, composition and structure
The District has a household population of 93,523 with a total number of 23,875households.
The average household size in the District is 4.0 persons per household. Children constitute
the largest proportion of the household structure accounting for 36.8 percent. The nuclear
households system (head, spouse(s) and children) constitute 24.2 percent of the total number
of households in the District
Marital status
Almost four in ten (38.1%) of the population aged 12 years and older are married, 35.5
percent have never married, 10 percent are in consensual unions,8.1 percent are widowed, 3.6
percent are divorced and 4.7 percent are separated. Among the married, 17.9percent have no
education whiles4.4percent of the never married have never been to school. About
82.5percent of the married population are employed, 2.1 percent are unemployed and
15.3percent are economically not active.

x
Nationality
The proportion of Ghanaians by birth in the District is 92.1 percent. Those who have
naturalized constitute 1.7 percent and the non-Ghanaian population in the District is 0.8.
percent.
Literacy and education
Of the population 11 years and older, 85.9 percent are literate and 14.1 percent are non-
literate. The proportion of literate males (91.5%) is higher than that of females (80.9%).Six
out of ten people (66.2%) indicated they could read and write both English and Ghanaian
language. Also, 46.2 percent of the population (three years and older) currently attending
school are in primary school
Economic activity status
About 69.5 percent of the population aged 15 years and older is economically active while
30.5 percent are economically not active. Of the economically active population, 95.9 percent
are employed while 4.1 percent are unemployed. For those who are economically not active,
59.4 percent are students, 17.5 percent perform household duties and 11.0 percent are
disabled or too sick to work.
Occupation
Of the employed population, 58.4 percent are engaged as skilled agricultural, forestry and
fishery workers, 13 percent as service and sales workers, 16 percent in craft and related trade,
and 7.4 percent are engaged as managers, professionals, and technicians put together.
Employment status and sector
Of the population 15 years and older 77.5 percent are self-employed without employees, 10
percent are employees, 7.6percent are contributing family workers,0.6 percent are casual
workers and 0.4 percent are domestic employees (house helps). The private informal sector
is the largest employer in the District, employing 91.4 percent of the population followed by
the public sector with 6.1 percent and the private formal engaging 2.1 percent.
Information Communication Technology
The District has 36.7 percent of its population 12 years and above, having mobile phones.
More males (42.7%) own mobile phones than females (31.4%). Less than five percent (2.8%)
of the population 12 years and older uses internet facilities in the District with only 1.9
percent of households in the District having desktop/laptop computers.
Disability
About 6 percent of the District’s total population has one form of disability or the other. The
proportion (6.3%) of the female population who are disabled is slightly higher than the
proportion of male population disabled (5.7%).Further, the most common disability is Sight
(47.1%) for both males and females though the proportions affected vary between the two
sexes. For those with disability, majority of them are economically active (52.3%). Also 51.2
percent of people with disability are employed as against 1.3 percent who is unemployed. Of
the population disabled, 30.2 percent have never been to school and only 10.5 percent of the
disabled population has Sec/SHS and higher.

xi
Agriculture
More than half (73.5%) percent of households in the District are engage in agriculture. In the
rural localities, more than eight out of ten households (88.7%) are agricultural households
while in the urban localities, 11.3 percent of households are into agriculture. Most households
in the district (95.2%) are involved in crop farming. Poultry (chicken) is the dominant animal
reared in the district and the average number per keeper is 20
Housing
The housing stock of Ho West is 22346. The average household size in the district is 4...
Type, tenancy arrangement and ownership of dwelling units
There are 23875 dwelling units in the district with the rural setting having majority. More
than half (55.3%) of all dwelling units in the district are separate houses; 31.5 percent are
compound houses. Two-thirds (66.5%) of the dwelling units in the district are owned by
members of the household; 21 percent are owned by relatives not a household member. Only
0.6 percent is owned by public or government.
Material for construction of outer wall, floor and roof
The main construction material for outer walls of dwelling units in the District is mud
brick/earth accounting for 53 percent with cement/concrete constituting 41 percent of outer
walls of dwelling units in the District. Cement/concrete (81.8%) is the main materials used in
the construction of floors of dwelling units in the District. Metal sheet (78.8%) is the main
roofing materials for dwelling units in the District with Thatch/Palm leaf or Raffia
constituting 15.9 percent.
Room occupancy
One room constitutes the highest percentage (46.9%) of sleeping rooms occupied by
households in housing units in the District. About 7 percent of households with 10 or more
members occupy one room in the District.
Utilities and household facilities
The main source of lighting in dwelling units in the District is electricity from the national
grid which constitutes 51.8 percent. The main source of fuel for cooking for most households
in the District is wood (73.8%), with 16.6 percent using charcoal. A little over a third of
households (41.2%) cook in separate rooms for exclusive use of household, with 7.6 percent
using the veranda to cook. The main sources of water in the District for drinking are
Borehole/Pump/Tube well.
The main Toilet facility use by households in the District is Public Toilet (34.9%), 22.5
percent have no toilet facility and therefore resort to the bush/beach/field. A little over a third
(37.4%) of households in the District Own bathroom for exclusive use for households
Waste disposal
The most commonly method of solid waste disposal is by public dump in the open space
accounting for 56.5 percent. For liquid waste disposal, throwing waste onto the compound
(48.9 %) and unto the street/outside (30.5%) are the two common methods used by
households in the Municipality.

1
CHAPTER ONE
INTRODUCTION
1.1 Introduction
Ho West District is one of the 25 districts in the Volta Region of Ghana. It was established by
the Legislative Instrument (LI) 2083 of 2012. It was carved out of Ho Municipality in
January 2012 and inaugurated in June 2013.
This chapter gives a brief background of Ho West District. Issues focused on are the history
of the District, physical features, political and administrative structure, social administration
and structure, economy, demographic dynamics of the District. The chapter also presents the
census methodology and definition of concepts used in the 2010 Population and Census as
well as the organization of the report.
1.2 Physical Features
1.2.1 Location and size
Ho West District is located between latitudes 6.33o
32” N and 6.93o
63” N and longitudes
0.17o 45
” E and 0.53
o 39
” E. It shares boundaries with Adaklu District to the South, Afadjato
South District to the North, Ho Municipality and the Republic of Togo to the East and South
Dayi District to the West. It has a total land area of 1,002.79 square kilometres and a
population density of 94.3 based on a population of 94,600.
1.2.2 Climate (Temperature)
Mean temperature in the District range between 220 C and 32
0 C while annual mean
temperature range from 16.50 C to 37.8
0C.In effect, temperatures are generally high
throughout the year which is good for plants and food crop farming. It is however very low
(16.60C) around Amedzofe and its peripheral communities and this makes it a preferred
destination for most many tourists from Western countries who visit the region.
1.2.3 Rainfall
The rainfall pattern is characterized by two rainy seasons referred to as the major and the
minor seasons. The major season is from March to June while the minor one is from July to
November. The rest of the year is a dry season. Mean annual rainfall figures are between
120.1mm and 192mm. The highest rainfall occurs in June and has mean value of 192mm
while the lowest rainfall is in November recording about 120.1mm.
1.2.4 Vegetation
Ho West District falls into two main types of vegetation zones, these are the moist semi-
deciduous forest which mostly covers the hills in the District and savannah woodland. The
District is endowed with several tree species for construction and commercial uses such as
wawa and mahogany among others.

2
Figure 1.1: Map Ho West District
Source: Ghana Statistical Service, GIS

3
1.2.5 Soils
There are several soil types in the District. These are forest soils which include forest
ochrosols, lethosols and intergrades soil found in the mountainous and wetter areas in the
District. The forest soils support perennial crops such as cocoa, oil palm, coffee, avocado,
plantain and banana while the savanna soils support crops like maize, cassava, yams,
groundnuts, legumes and variety of vegetables.
1.2.6 Relief and drainage
The general relief of the District falls into two main parts: mountainous and lowland areas.
The mountainous areas are mostly to the north and north-east which are part of Togo Ranges
and have heights between 183metres and 853 metres. The notable areas are Awudome Stretch
in the south-west to Avatime and Ashanti Kpoeta in the north-east. The lowland areas are to
the south of the District and have heights between 60 metres and 152 metres.
The topography is relatively steep and imposes rapid run-offs during the rainy season. The
general drainage pattern is southwards and dominated by rivers like Tsawe (Alabo) and
Kalakpa, which eventually flow into the lower Volta or Avu Lagoon. Despite the numerous
tributaries which serve the District, their flow during the dry seasons is much reduced and
practically cease in some of their courses. The rivers therefore do not provide all year round
dependable source of water supply to the communities around them.
1.3 Political and Administrative Structure
The District Assembly consists of eleven decentralised departments, eight Town and Area
Council sand25 Unit Committees. The District Assembly is made up of 37 members,
comprising 25 elected members, 10 Government appointees, one District Chief Executive
and one Member of Parliament.
The District is headed by the District Chief Executive who is the political and administrative
head. He is responsible to the President via the Regional Minister who is the head of the
Region. However, the District Co-ordinating Director is the chief advisor and secretary to the
District Chief Executive and the Assembly. The District Planning Co-ordinating Unit
(DPCU), which embraces technocrats from various Decentralised Departments and Heads of
Core Units of the Assembly, helps the Chief Executive in formulating and implementing
government policies, programmes and projects.
1.4 Social and Cultural Structure
1.4.1 Chieftaincy
There are three Traditional Councils and sixteen traditional areas in the District. These three
councils collaborate in promoting the development of the District. Various communities have
their Chiefs who owe allegiance to the Paramount Chiefs of their respective traditional
councils.
1.4.2 Festivals
The traditional areas are endowed with some cultural practices and festival. The Yam Festival
for instance is practiced by the people of the Awudome and Hokpe traditional areas and the
Kimini festival for the chiefs and people of Avatime. Traditional dances such as Adabatram,
Zigi, Borborbor and Zagada are also popular with the people in the District

4
1.4.3 Religion
The people in the District are predominantly Christians, with other religions such as Islam
and traditional African religions existing side by side. However, most people are actually
multiple religious believers with widespread practice of traditional religious rituals alongside
Christianity and Islam in the District.
1.4.4 School infrastructure
The current educational infrastructure in the District is listed as follows:
S/N Type of Institution Number
1 College of Education 1
2 Senior High Schools 8
3 Junior High School 49
4 Primary School 80
5 Kindergarten 77
The state of educational infrastructure at the basic level requires general maintenance works.
The schools do not have adequate library facilities and workshops for technical and
vocational training.
1.4.5 Health
Good health is critical to socio-economic development. The health status of the citizenry is a
critical indicator of their productivity. The Ho West District has 20 health facilities of various
categories of which one is private clinic (Gisela Memorial Clinic, Abutia Kpota).
1.4.6 Telecommunication
Various telecommunication companies have their masks erected at strategic points in the
District. This has enhanced communication within and outside the District. There are
however, a few communities that have challenges in accessing some networks. One state of
the art ICT centre has been constructed at Hlefi to provide the District with ICT training. The
office complex is earmarked to provide other financial institutions with office space to
operate.
1.5 Economy
1.5.1 Agriculture
Agriculture is the mainstay of Ho West District economy. It employs about 95 percent of
labour force. Farming in the District is largely carried out on small-scale basis. The average
acreage cultivated ranges between four and six acres for all crops. Major crops cultivated
include maize, rice, cassava, and beans. Cash crops such as cocoa and palm plantation are
gaining ground steadily in the District. Farmer groups have also diversified into bee-keeping,
snail farming, grass cutter rearing which enhance their incomes.

5
1.5.2 Tourism
This district has a high level of untapped tourist potential which needs to be harnessed. The
tourist attractions are numerous namely: Aya-fie Waterfall, Amedzofe Waterfalls, Mount
Gemi, Handicrafts, Ancient Colonial Buildings and Ancestral Caves at Amedzofe, kalakpa
game reserves at Abutia, music and dances. There are five guest houses and one two-star
Hotel in the District. Several restaurants and drinking bars exist in the District.
1.5.3 Markets
The District has a number of viable markets located at Kissiflui, Kpedze, Tsito, Amedzofe,
Vane and Dededo.
1.5.4 Industrial opportunities
There exist potential for the development of light industries such as cassava processing,
garment and textile manufacturing, vegetable oil extraction and saw milling.
1.6 Census Methodology, Concepts and Definitions
1.6.1 Introduction
Ghana Statistical Service (GSS) was guided by the principle of international comparability
and the need to obtain accurate information in the 2010 Population and Housing Census
(2010 PHC). The Census was, therefore, conducted using all the essential features of a
modern census as contained in the United Nations Principles and Recommendations for
countries taking part in the 2010 Round of Population and Housing Censuses.
Experience from previous post independence censuses of Ghana (1960, 1970, 1984 and 2000)
was taken into consideration in developing the methodologies for conducting the 2010 PHC.
The primary objective of the 2010 PHC was to provide information on the number,
distribution and social, economic and demographic characteristics of the population of Ghana
necessary to facilitate the socio-economic development of the country.
1.6.2 Pre-enumeration activities
Development of census project document and work plans
A large scale statistical operation, such as the 2010 Population and Housing Census required
meticulous planning for its successful implementation. A working group of the Ghana
Statistical Service prepared the census project document with the assistance of two
consultants. The document contains the rationale and objectives of the census, census
organization, a work plan as well as a budget. The project document was launched in
November 2008 as part of the Ghana Statistics Development Plan (GSDP) and reviewed in
November 2009.
Census secretariat and committees
A well-structured management and supervisory framework that outlines the responsibilities
of the various stakeholders is essential for the effective implementation of a population and
housing census. To implement the 2010 PHC, a National Census Secretariat was set up in
January 2008 and comprised professional and technical staff of GSS as well as staff of other
Ministries, Departments and Agencies (MDAs) seconded to GSS. The Census Secretariat was
primarily responsible for the day-to-day planning and implementation of the census activities.

6
The Secretariat had seven units, namely; census administration, cartography, recruitment and
training, publicity and education, field operations and logistics management, data processing,
and data analysis and dissemination.
The Census Secretariat was initially headed by an acting Census Coordinator engaged by the
United Nations Population Fund (UNFPA) in 2008 to support GSS in the planning of the
Census. In 2009, the Census Secretariat was re-organised with the Government Statistician
as the National Chief Census Officer and overall Coordinator, assisted by a Census
Management Team and a Census Coordinating Team. The Census Management Team had
oversight responsibility for the implementation of the Census. It also had the responsibility of
taking critical decisions on the census in consultation with other national committees. The
Census Coordinating Team, on the other hand, was responsible for the day-to-day
implementation of the Census programme.
A number of census committees were also set up at both national and sub-national levels to
provide guidance and assistance with respect to resource mobilization and technical advice.
At the national level, the committees were the National Census Steering Committee (NCSC),
the National Census Technical Advisory Committee (NCTAC) and the National Census
Publicity and Education Committee (NCPEC). At the regional and district levels, the
committees were the Regional Census Implementation Committee and the District Census
Implementation Committee, respectively.
The Regional and District Census Implementation Committees were inter-sectoral in their
composition. Members of the Committees were mainly from decentralized departments with
the Regional and District Coordinating Directors chairing the Regional Census
Implementation Committee and District Census Implementation Committee, respectively.
The Committees contributed to the planning of district, community and locality level
activities in areas of publicity and field operations. They supported the Regional and District
Census Officers in the recruitment and training of field personnel (enumerators and
supervisors), as well as mobilizing logistical support for the census.
Selection of Census topics
The topics selected for the 2010 Population and Housing Census were based on
recommendations contained in the UN Principles and Recommendations for 2010 Round of
Population and Housing Censuses and the African Addendum to that document as well as the
needs of data users. All the core topics recommended at the global level, i.e., geographical
and internal migration characteristics, international migration, household characteristics,
demographic and social characteristics such as age, date of birth, sex, and marital status,
fertility and mortality, educational and economic characteristics, issues relating to disability
and housing conditions and amenities were included in the census.
Some topics that were not considered core by the UN recommendations but which were
found to be of great interest and importance to Ghana and were, therefore, included in the
2010 PHC are religion, ethnicity, employment sector and place of work, agricultural activity,
as well as housing topics, such as, type of dwelling, materials for outer wall, floor and roof,
tenure/holding arrangement, number of sleeping rooms, cooking fuel, cooking space and
Information Communication Technology (ICT).

7
Census mapping
A timely and well implemented census mapping is pivotal to the success of any population
and housing census. Mapping delineates the country into enumeration areas to facilitate
smooth enumeration of the population. The updating of the 2000 Census Enumeration Area
(EA) maps started in the last quarter of 2007 with the acquisition of topographic sheets of all
indices from the Survey and Mapping Division of the Lands Commission. In addition, digital
sheets were also procured for the Geographical Information System Unit.
The Cartography Unit of the Census Secretariat collaborated with the Survey and Mapping
Division of the Lands Commission and the Centre for Remote Sensing and Geographic
Information Services (CERSGIS) of the Department of Geography and Resource
Development, University of Ghana, to determine the viability of migrating from analog to
digital mapping for the 2010 PHC, as recommended in the 2000 PHC Administrative Report.
Field cartographic work started in March 2008 and was completed in February 2010.
Development of questionnaire and manuals
For effective data collection, there is the need to design appropriate documents to solicit the
required information from respondents. GSS consulted widely with main data users in the
process of the questionnaire development. Data users including MDAs, research institutions,
civil society organizations and development partners were given the opportunity to indicate
the type of questions they wanted to be included in the census questionnaire.
Documents developed for the census included the questionnaire and manuals, and field
operation documents. The field operation documents included Enumerator’s Visitation
Record Book, Supervisor’s Record Book, and other operational control forms. These record
books served as operational and quality control tools to assist enumerators and supervisors to
control and monitor their field duties respectively.
Pre-tests and trial census
The trial census provided GSS with an opportunity to assess its plans and procedures as well
as the state of preparedness for the conduct of the 2010 PHC. The common errors found
during editing of the completed questionnaires resulted in modifications to the census
questionnaire, enumerator manuals and other documents. The results of the trial census
assisted GSS to arrive at technically sound decisions on the ideal number of persons per
questionnaire, number of persons in the household roster, migration questions, placement of
the mortality question, serial numbering of houses/housing structures and method of
collection of information on community facilities. Lessons learnt from the trial census also
guided the planning of the recruitment process, the procedures for training of census field
staff and the publicity and education interventions.
1.6.3 Census Enumeration
Method of enumeration and field work
All post- independence censuses (1960, 1970, 1984, and 2000) conducted in Ghana used the
de facto method of enumeration where people are enumerated at where they were on census
night and not where they usually reside. The same method was adopted for the 2010 PHC.
The de facto count is preferred because it provides a simple and straight forward way of
counting the population since it is based on a physical fact of presence and can hardly be
misinterpreted. It is thought that the method also minimizes the risks of under-enumeration

8
and over enumeration. The canvasser method, which involves trained field personnel visiting
houses and households identified in their respective enumeration areas, was adopted for the
2010 PHC.
The main census enumeration involved the canvassing of all categories of the population by
trained enumerators, using questionnaires prepared and tested during the pre-enumeration
phase. Specific arrangements were made for the coverage of special population groups, such
as the homeless and the floating population. The fieldwork began on 21st September 2010
with the identification of EA boundaries, listing of structures, enumeration of institutional
population and floating population.
The week preceding the Census Night was used by field personnel to list houses and other
structures in their enumeration areas. Enumerators were also mobilized to enumerate
residents/inmates of institutions, such as, schools and prisons. They returned to the
institutions during the enumeration period to reconcile the information they obtained from
individuals and also to cross out names of those who were absent from the institutions on
Census Night. Out-door sleepers (floating population) were also enumerated on the Census
Night.
Enumeration of the household population started on Monday, 27th
September, 2010.
Enumerators visited houses, compounds and structures in their enumeration areas and started
enumerating all households including visitors who spent the Census Night in the households.
Enumeration was carried out in the order in which houses/structures were listed and where
the members of the household were absent, the enumerator left a call-back-card indicating
when he/she would come back to enumerate the household. The enumeration process took off
smoothly with enumerators poised on completing their assignments on schedule since many
of them were teachers and had to return to school. However, many enumerators ran short of
questionnaires after a few days’ work.
Enumeration resumed in all districts when the questionnaire shortage was resolved and by
17th
October, 2010, enumeration was completed in most districts. Enumerators who had
finished their work were mobilized to assist in the enumeration of localities that were yet to
be enumerated in some regional capitals and other fast growing areas. Flooded areas and
other inaccessible localities were also enumerated after the end of the official enumeration
period. Because some enumeration areas in fast growing cities and towns, such as, Accra
Metropolitan Area, Kumasi, Kasoa and Techiman were not properly demarcated and some
were characterized by large EAs, some enumerators were unable to complete their assigned
tasks within the stipulated time.
1.6.4 Post Enumeration Survey
In line with United Nations recommendations, GSS conducted a Post Enumeration Survey
(PES) in April, 2011 to check content and coverage error. The PES was also to serve as an
important tool in providing feedback regarding operational matters such as concepts and
procedures in order to help improve future census operations. The PES field work was
carried out for 21 days in April 2011 and was closely monitored and supervised to ensure
quality output. The main findings of the PES were that:
97.0 percent of all household residents who were in the country on Census Night (26th
September, 2010) were enumerated.
1.3 percent of the population was erroneously included in the census.
9
Regional differentials are observed. Upper East region recorded the highest coverage
rate of 98.2 percent while the Volta region had the lowest coverage rate of 95.7
percent.
Males (3.3%) were more likely than females (2.8%) to be omitted in the census. The
coverage rate for males was 96.7 percent and the coverage rate for females was 97.2
percent. Also, the coverage rates (94.1%) for those within the 20-29 and 30-39 age
groups are relatively lower compared to the coverage rates of the other age groups.
There was a high rate of agreement between the 2010 PHC data and the PES data for
sex (98.8%), marital status (94.6%), relationship to head of household (90.5%) and
age (83.0%).
1.6.5 Release and dissemination of results
The provisional results of the census were released in February 2011 and the final results in
May 2012. A National Analytical report, six thematic reports, a Census Atlas, 10 Regional
Reports and a report on Demographic, Social, Economic and Housing were prepared and
disseminated in 2013.
1.6.6 Concepts and definitions
Introduction
The 2010 Population and Housing Census of Ghana followed the essential concepts and
definitions of a modern Population and Housing Census as recommended by the United
Nations (UN). It is important that the concepts, definitions and recommendations are adhered
to since they form the basis upon which Ghana could compare her data with that of other
countries.
The concepts and definitions in this report cover all sections of the 2010 Population and
Housing Census questionnaires (PHC1A and PHC1B). The sections were: geographical
location of the population, Household and Non-household population, Literacy and
Education, Emigration, Demographic and Economic Characteristics, Disability, Information
and Communication Technology (ICT), Fertility, Mortality, Agricultural Activity and
Housing Conditions.
The concepts and definitions are provided to facilitate understanding and use of the data
presented in this report. Users are therefore advised to use the results of the census within the
context of these concepts and definitions.
Region
There were ten (10) administrative regions in Ghana during the 2010 Population and Housing
Census as they were in 1984 and 2000.
District
In 1988, Ghana changed from the local authority system of administration to the district
assembly system. In that year, the then existing 140 local authorities were demarcated into
110 districts. In 2004, 28 new districts were created; this increased the number of districts in
the country to 138. In 2008, 32 additional districts were created bringing the total number of
10
districts to 170. The 2010 Population and Housing Census was conducted in these 170
administrative districts (these are made-up of 164 districts/municipals and 6 metropolitan
areas). In 2012, 46 new districts were created to bring the total number of districts to 216.
There was urgent need for data for the 46 newly created districts for planning and decision-
making. To meet this demand, the 2010 Census data was re-programmed into 216 districts
after carrying out additional fieldwork and consultations with stakeholders in the districts
affected by the creation of the new districts.
Locality
A locality was defined as a distinct population cluster (also designated as inhabited place,
populated centre, settlement) which has a NAME or LOCALLY RECOGNISED STATUS. It
included fishing hamlets, mining camps, ranches, farms, market towns, villages, towns, cities
and many other types of population clusters, which meet the above criteria. There were two
main types of localities, rural and urban. As in previous censuses, the classification of
localities into ‘urban’ and ‘rural’ was based on population size. Localities with 5,000 or more
persons were classified as urban while localities with less than 5,000 persons were classified
as rural.
Population
The 2010 Census was a “de facto” count and each person present in Ghana, irrespective of
nationality, was enumerated at the place where he/she spent the midnight of 26th September
2010.
Household
A household was defined as a person or a group of persons, who lived together in the same
house or compound and shared the same house-keeping arrangements. In general, a
household consisted of a man, his wife, children and some other relatives or a house help who
may be living with them. However, it is important to remember that members of a household
are not necessarily related (by blood or marriage) because non-relatives (e.g. house helps)
may form part of a household.
Head of household
The household head was defined as a male or female member of the household recognised as
such by the other household members. The head of household is generally the person who has
economic and social responsibility for the household. All relationships are defined with
reference to the head.
Household and non-household population
Household population comprised of all persons who spent the census night in a household
setting. All persons who did not spend the census night in a household setting (except
otherwise stated) were classified as non-household population. Persons who spent census
night in any of the under listed institutions and locations were classified as non-household
population:
(a) Educational Institutions
(b) Children's and Old People’s Homes
(c) Hospitals and Healing Centres
11
(d) Hotels
(e) Prisons
(f) Service Barracks
(g) Soldiers on field exercise
(h) Floating Population: The following are examples of persons in this category:
i. All persons who slept in lorry parks, markets, in front of stores and offices, public
bathrooms, petrol filling stations, railway stations, verandas, pavements, and all
such places which are not houses or compounds.
ii. Hunting and fishing camps.
iii. Beggars and vagrants (mentally sick or otherwise).
Age
The age of every person was recorded in completed years disregarding fractions of days and
months. For those persons who did not know their birthdays, the enumerator estimated their
ages using a list of district, regional and national historical events.
Nationality
Nationality is defined as the country to which a person belongs. A distinction is made
between Ghanaians and other nationals. Ghanaian nationals are grouped into Ghanaian by
birth, Ghanaian with dual nationality and Ghanaian by naturalization. Other nationals are
grouped into ECOWAS nationals, Africans other than ECOWAS nationals, and non-
Africans.
Ethnicity
Ethnicity refers to the ethnic group that a person belonged to. This information is collected
only from Ghanaians by birth and Ghanaians with dual nationality. The classification of
ethnic groups in Ghana is that officially provided by the Bureau of Ghana Languages and
which has been in use since the 1960 census.
Birthplace
The birthplace of a person refers to the locality of usual residence of the mother at the time of
birth. If after delivery a mother stayed outside her locality of usual residence for six months
or more or had the intention of staying in the new place for six or more months, then the
actual town/village of physical birth becomes the birthplace of the child.
Duration of residence
Duration of residence refers to the number of years a person has lived in a particular place.
This question is only asked of persons not born in the place where enumeration took place.
Breaks in duration of residence lasting less than 12 months are disregarded. The duration of
residence of persons who made multiple movements of one (1) year or more is assumed to be
the number of years lived in the locality (town or village) since the last movement.

12
Religion
Religion refers to the individual’s religious affiliation as reported by the respondent,
irrespective of the religion of the household head or the head’s spouse or the name of the
person. No attempt was made to find out if respondents actually practiced the faith they
professed.
Marital status
Marital status refers to the respondent’s marital status as at Census Night. The question on
marital status was asked only of persons 12 years and older. The selection of the age limit of
12 years was based on the average age at menarche and also on the practice in some parts of
the country where girls as young as 12 years old could be given in marriage.
Literacy
The question on literacy referred to the respondent's ability to read and write in any language.
A person was considered literate if he/she could read and write a simple statement with
understanding. The question on literacy was asked only of persons 11 years and older.
Education
School Attendance
Data was collected on school attendance for all persons three (3) years and older. School
attendance refers to whether a person has ever attended, was currently attending or has never
attended school. In the census, school meant an educational institution where a person
received at least four hours of formal education.
Although the lower age limit of formal education is six years for primary one, eligibility for
the school attendance question was lowered to three years because pre-school education has
become an important phenomenon in the country.
Level of Education
Level of education refers to the highest level of formal school that a person ever attended or
was attending. This information was obtained for persons 3 years and older.
Activity status
Activity status refers to economic or non-economic activity of respondents during the 7 days
preceding census night. Information on type of activity was collected on persons 5 years and
older. A person was regarded as economically active if he/she:
a. Worked for pay or profit or family gain for at least 1 hour within the 7 days preceding
Census Night. This included persons who were in paid employment or self-
employment or contributing family workers.
b. Did not work, but had jobs to return to.
c. Were unemployed.
The economically not active were persons who did not work and were not seeking for work.
They were classified by reasons for not being economically active. Economically not active

13
persons included homemakers, students, retired persons, the disabled and persons who were
unable to work due to their age or ill-health.
Occupation
This referred to the type of work the person was engaged in at the establishment where he/she
worked. This was asked only of persons 5 years and older who worked 7 days before the
census night, and those who did not work but had a job to return to as well as those
unemployed who had worked before. All persons who worked during the 7 days before the
census night were classified by the kind of work they were engaged in. The emphasis was on
the work the person did during the reference period and not what he/she was trained to do.
For those who did not work but had a job to return to, their occupation was the job they
would go back to after the period of absence. Also, for persons who had worked before and
were seeking for work and available for work, their occupation was on the last work they did
before becoming unemployed. If a person was engaged in more than one occupation, only the
main one was considered.
Industry
Industry referred to the type of product produced or service rendered at the respondent’s work
place. Information was collected only on the main product produced or service rendered in
the establishment during the reference period.
Employment status
Employment status refers to the status of a person in the establishment where he/she currently
works or previously worked. Eight employment status categories were provided: employee,
self-employed without employees, self-employed with employees, casual worker,
contributing family worker, apprentice, domestic employee (house help). Persons who could
not be classified under any of the above categories were classified as “other”.
Employment sector
This refers to the sector in which a person worked. The employment sectors covered in the
census were public, private formal, private informal, semi-public/parastatal, NGOs and
international organizations.
Disability
Persons with disability were defined as those who were unable to or were restricted in the
performance of specific tasks/activities due to loss of function of some part of the body as a
result of impairment or malformation. Information was collected on persons with visual/sight
impairment, hearing impairment, mental retardation, emotional or behavioural disorders and
other physical challenges.
Information Communication Technology (ICT)
ICT questions were asked for both individuals and households. Persons having mobile
phones refer to respondents 12 years and older who owned mobile phones (irrespective of the
number of mobile phones owned by each person). Persons using internet facility refers to
those who had access to internet facility at home, internet cafe, on mobile phone or other
mobile device. Internet access is assumed to be not only via computer, but also by mobile
phones, PDA, game machine and digital television.

14
Households having Personal Computers/Laptops refer to households who own
desktops/laptop computers. The fixed telephone line refers to a telephone line connecting a
customer’s terminal equipment (e.g. telephone set, facsimile machine) to the public switch
telephone network.
Fertility
Two types of fertility data were collected: lifetime fertility and current fertility. Lifetime
fertility refers to the total number of live births that females 12 years and older had ever had
during their life time. Current fertility refers to the number of live births that females 12-54
years old had in the 12 months preceding the Census Night.
Mortality
Mortality refers to all deaths that occurred in the household during the 12 months preceding
the Census Night. The report presents information on deaths due to accidents, violence,
homicide and suicide. In addition, data were collected on pregnancy-related deaths of
females 12-54 years.
Agriculture
The census sought information on household members who are engaged in agricultural
activities, including the cultivation of crops or tree planting, rearing of livestock or breeding
of fish for sale or family consumption. Information was also collected on their farms, types of
crops and number and type of livestock.
Housing conditions and facilities
The UN recommended definition of a house as “a structurally separate and independent place
of abode such that a person or group of persons can isolate themselves from the hazards of
climate such as storms and the sun’’ was adopted. The definition, therefore, covered any type
of shelter used as living quarters, such as separate houses, semi-detached houses,
flats/apartments, compound houses, huts, tents, kiosks and containers.
Living quarters or dwelling units refer to a specific area or space occupied by a particular
household and therefore need not necessarily be the same as the house of which the dwelling
unit may be a part.
Information collected on housing conditions included the type of dwelling unit, main
construction materials for walls, floor and roof, holding/tenure arrangement, ownership type,
type of lighting, source of water supply and toilet facilities. Data was also collected on
method of disposal of solid and liquid waste.
1.7 Organization of the Report
The report consists of nine chapters. Chapter one provides basic information about the
district. It gives a brief background of the district, describing its physical features, political
and administrative structure, social and cultural structure, economy and the methodology and
concepts used in the report. Chapter two discusses the population size, composition and age
structure. It also discusses the migratory pattern in the district as well as fertility and
mortality.
In chapter three, the focus is on household size, composition and headship as well as the

15
marital characteristics and nationality of the inhabitants of the district. The chapter also
discusses the religious affiliations and the educational statuses of the members of the district.
Chapter four focuses on economic characteristics such as economic activity status,
occupation, industries and the employment status and sectors that the people are employed.
Information Communication Technology (ICT) is discussed in chapter five. It analyses
mobile phone ownership, internet use and ownership of desktop/laptop computers while
chapter six is devoted to Persons living with disabilities (PWDs) and their socio-demographic
characteristics. Chapter seven concentrates on the agricultural activities of the households,
describing the types of farming activities, livestock rearing and numbers of livestock reared.
In chapter eight, housing conditions such as housing stock, type of dwelling and construction
materials, room occupancy, holding and tenancy, lighting and cooking facilities, bathing and
toilet facilities, waste disposal and source of water for drinking or for other domestic use in
the district are discussed and analyzed in detail. The final chapter, chapter nine presents the
summary of findings and policy implications of these findings.

16
CHAPTER TWO
DEMOGRAPHIC CHARACTERISTICS
2.1 Introduction
Population size, composition and age-sex structure are important characteristics that have
many social and economic implications. Population size and composition influence the
district’s potential human resource requirement and level of provision of social infrastructure
such as schools, hospitals/clinics and housing. Fertility, mortality and migration are the three
components of population change that determine the size, age-sex composition and
distribution of the population at a particular point in time. Data on these three components are
useful for planning the overall socio-economic development of the district. This chapter
presents information of the population size and distribution, age-sex structure, migration,
fertility, and mortality patterns in the district.
2.2 Population Size and Distribution
2.2.1 Population size
Table 2.1 presents information on population distribution, sex ratio, age-sex structure and
dependency ratio. The total population of the district is 94,600.Males (45,361)account for 48
percent and females (49,239)account for the remaining 52 percent meaning that there are
more females than males in the district.
2.2.2 Population distribution
Table 2.1 further shows that majority (89.1%) of the population in the district live in the rural
areas compared to 10.9 percent in the urban areas. This means that the district is mostly rural
with its attendant socio-economic challenges of providing for the people basic social
amenities such as potable water, good schools and quality health facilities among others.
2.3 Age- Sex Structure
2.3.1 Age structure
Table2.1 again depicts the age-sex structure of the population in the District by type of
locality. This age structure is the result of past fertility, mortality and migration in the
District. It is in the form of a pyramid, with a broad base of the younger population and a
narrow apex of the older population. With increasing age, the age-sex structure looks slightly
thinner for the males than for the females, indicating that at older ages, the proportion of
males is lower than that of females. There are more males than females for the age groups 0-
19 years. The Table also shows that a large proportion of the population in the District are
found in 0-19 years indicating that the population in the district has the potential to grow for
a considerable number of years. This has implications for the economic development of the
District.

17
2.3.2 Sex ratio
The sex ratio for the district is 92.1. This means that for every 100 females in the population
there are 92 males. The sex ratio is higher for males, from age 0 to 19 years and progressively
reduces from age 20 to 99 and older years.
2.3.3 Dependency Ratio
Dependency ratio is one of the key indicators of socio-economic development. Table2.1
presents the dependency ratios for both sexes and urban and rural populations of the District.
The District dependency ratio is quite high at about 82 dependants (children and aged) for
every 100 people working compared to the regional average of 81 dependants for every 100
people. The dependency ratio for the urban localities is lower (76.3) compared to that of the
rural areas (82.6). Again, the dependency ratio is higher among males (86.2) than females
(78).
Table 2.1: Population distribution by age and sex
Age Group Sex Sex
ratio Type of locality
Both Sexes Male Female Urban Rural All Ages
94,600 45,361 49,239
92.1
10,301 84,299
0 - 4
12,357 6,237 6,120
101.9
1,198 11,159
5 - 9
11,319 5,751 5,568
103.3
1,181 10,138
10-14
10,855 5,734 5,121
112
1,276 9,579
15 - 19
8,951 4,791 4,160
115.2
1,121 7,830
20 - 24
6,854 3,234 3,620
89.3
721 6,133
25 - 29
6,000 2,743 3,257
84.2
604 5,396
30 - 34
5,358 2,389 2,969
80.5
644 4,714
35 - 39
4,969 2,240 2,729
82.1
542 4,427
40 - 44
4,880 2,244 2,636
85.1
497 4,383
45 - 49
4,573 2,018 2,555
79
538 4,035
50 - 54
4,390 2,030 2,360
86
492 3,898
55 - 59
3,083 1,363 1,720
79.2
370 2,713
60 - 64
2,957 1,305 1,652
79
315 2,642
65 - 69
1,930 822 1,108
74.2
225 1,705
70 - 74
2,574 1,030 1,544
66.7
245 2,329
75 - 79
1,571 716 855
83.7
151 1,420
80 - 84
1,063 392 671
58.4
83 980
85+
916 332 594
157.4
98 818
All Ages
94,600 45,361 49,239
92.1
10,301 84,299
0-14
34,531 17,722 16,809
105.4
3,655 30,876
15-64
52,015 24,357 27,658
88.1
5,844 46,171
65+
8,054 3,282 4,772
68.8
802 7,252
Age-dependency
ratio 81.9 86.2 78 76.3 82.6 Source: Ghana Statistical Service, 2010 Population and Housing Census
18
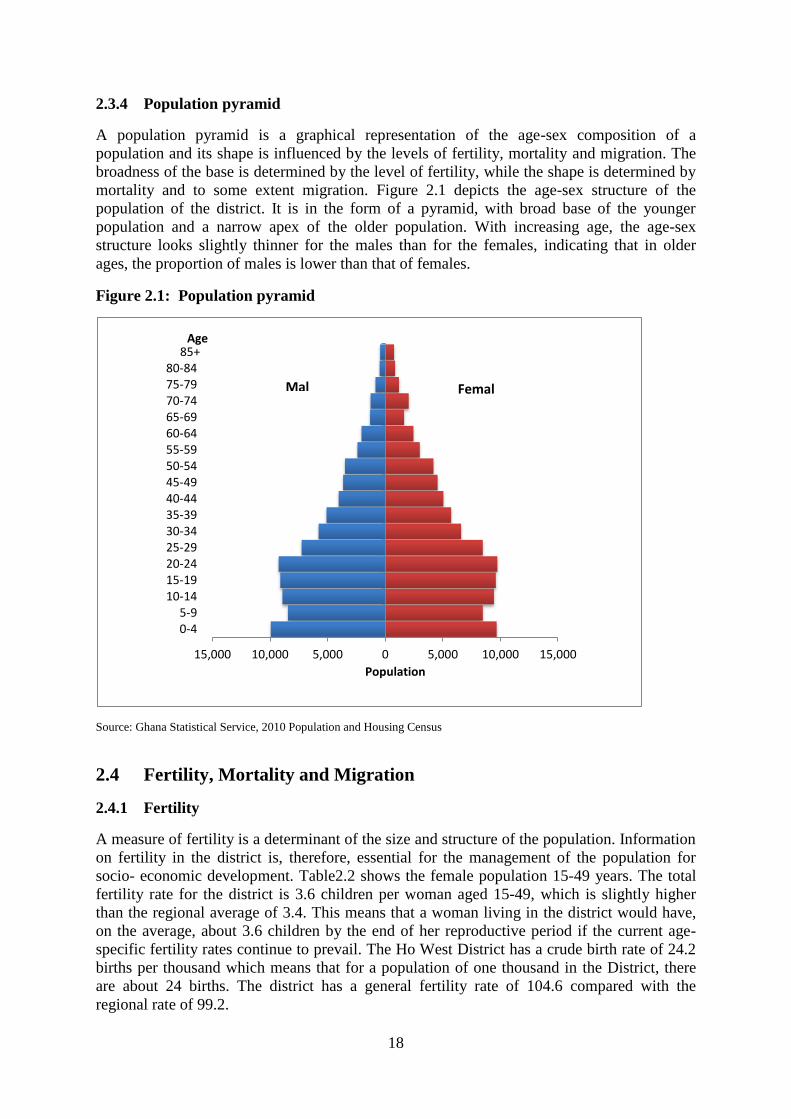
2.3.4 Population pyramid
A population pyramid is a graphical representation of the age-sex composition of a
population and its shape is influenced by the levels of fertility, mortality and migration. The
broadness of the base is determined by the level of fertility, while the shape is determined by
mortality and to some extent migration. Figure 2.1 depicts the age-sex structure of the
population of the district. It is in the form of a pyramid, with broad base of the younger
population and a narrow apex of the older population. With increasing age, the age-sex
structure looks slightly thinner for the males than for the females, indicating that in older
ages, the proportion of males is lower than that of females.
Figure 2.1: Population pyramid
Source: Ghana Statistical Service, 2010 Population and Housing Census
2.4 Fertility, Mortality and Migration
2.4.1 Fertility
A measure of fertility is a determinant of the size and structure of the population. Information
on fertility in the district is, therefore, essential for the management of the population for
socio- economic development. Table2.2 shows the female population 15-49 years. The total
fertility rate for the district is 3.6 children per woman aged 15-49, which is slightly higher
than the regional average of 3.4. This means that a woman living in the district would have,
on the average, about 3.6 children by the end of her reproductive period if the current age-
specific fertility rates continue to prevail. The Ho West District has a crude birth rate of 24.2
births per thousand which means that for a population of one thousand in the District, there
are about 24 births. The district has a general fertility rate of 104.6 compared with the
regional rate of 99.2.
15,000 10,000 5,000 0 5,000 10,000 15,000
0-4 5-9
10-14 15-19 20-24 25-29 30-34 35-39 40-44 45-49 50-54 55-59 60-64 65-69 70-74 75-79 80-84
85+
Population
Age
FemalMal

19
Table 2.2: Reported total fertility rate, general fertility rate and crude birth rate
by district
District Population
Number of
women 15-
49 years
Number of
births in last
12 months
Total
Fertility
Rate
*General
Fertility
Rate
**Crude
Birth
Rate
All Districts 2,118,252 517,313 51,292 3.38 99.2 24.2
South Tongu 87,950 21,325 2,209 3.6 103.6 25.1
Keta Municipal 147,618 36,102 3,204 3.1 88.7 21.7
Ketu South 160,756 41,944 3,887 3.1 92.7 24.2
Ketu North 99,913 24,604 2,439 3.4 99.1 24.4
Akatsi South 98,684 24,782 2,389 3.4 96.4 24.2
Central Tongu 59,411 14,512 1,377 3.3 94.9 23.2
Agotime Ziope 28,013 6,843 747 3.8 109.2 26.7
Ho Municipal 177,281 49,729 3,702 2.6 74.4 20.9
South Dayi 46,661 11,048 1,052 3.3 95.2 22.5
Kpando Municipal 53,736 13,506 1,177 3 87.1 21.9
Hohoe Municipal 167,016 42,220 4,052 3.3 96 24.3
Biakoye 65,901 15,067 1,484 3.4 98.5 22.5
Jasikan 59,181 13,924 1,455 3.5 104.5 24.6
Kadjebi 59,303 13,652 1,430 3.6 104.7 24.1
Krachi East 116,804 26,146 3,319 4.3 126.9 28.4
Krachi West 49,417 11,225 1,245 3.7 110.9 25.2
Nkwanta South 117,878 27,226 3,304 4 121.4 28
Nkwanta North 64,553 14,758 2,043 4.6 138.4 31.6
North Tongu 89,777 22,874 1,931 2.9 84.4 21.5
Akatsi North 29,777 7,143 826 4.1 115.6 27.7
Adaklu 36,391 9,351 666 2.4 71.2 18.3
Ho West 94,600 21,926 2,294 3.6 104.6 24.2
Afadzato South 95,030 21,842 2,373 3.9 108.6 25
North Dayi 39,913 9,115 865 3.3 94.9 21.7
Krachi Nchumuru 72,688 16,449 1,822 3.8 110.8 25.1 Source Ghana Statistical Service, 2010 Population and Housing Census Note: * Number of live births per 1,000 women aged 15-49 years ** Number of live births per 1,000 populations
2.4.2 Children ever born and surviving
Table2.3 shows females 12 years and older by age, children ever born, children surviving and
sex of child. It shows that 20 children were ever born to females 12-14 years in the District
and out of that 14 survived. The Table also shows that the total number of children ever born
to females 12 years and older were 109,917 with 94,252 children surviving.

20
Table 2.3: Female population 12 years and older by age, children ever born,
children surviving and sex of child
Age
Number of
Females
Children Ever Born Children Surviving
Both sexes Male Female
Both sexes Male Female
All ages 35,362 109,917 54,958 54,959
94,252 46,582 47,670
12 - 14 2,932 20 11 9
14 9 5
15 - 19 4,160 643 337 306
591 298 293
20 - 24 3,620 3,317 1,690 1,627
3,044 1,506 1,538
25 - 29 3,257 5,833 2,905 2,928
5,379 2,612 2,767
30 - 34 2,969 8,361 4,215 4,146
7,665 3,852 3,813
35 - 39 2,729 9,978 4,943 5,035
9,096 4,492 4,604
40 - 44 2,636 11,060 5,564 5,496
9,977 4,947 5,030
45 - 49 2,555 11,929 5,972 5,957
10,605 5,279 5,326
50 - 54 2,360 11,844 5,903 5,941
10,338 5,157 5,181
55 - 59 1,720 9,049 4,566 4,483
7,752 3,865 3,887
60 + 6,424 37,883 18,852 19,031 29,791 14,565 15,226
Source: Ghana Statistical Service, 2010 Population and Housing Census
2.5 Mortality
Data on mortality provide an indication of the health status of the population as well as a
measure of the living conditions of the people. It also provides information on the potential
growth of the population in the future. This section examines levels and trends in infant and
child mortality in the district.Table2.4 indicates that, the crude death rate for the district is
12.5 which means, there are about 13 deaths for one thousand people in the district which is
higher than the regional average of about nine deaths for one thousand people.
2.5.1 Age specific death rates
Figure 2.3 indicates the age specific death rate by sex for the district. It has an open U shape.
Overall, there is little difference in the reported age specific death rate (ASDR) for both sexes
for age range 5-44. However, there is a general rise in ASDRs for males over females from
age 50-54 upwards, thus suggesting a relatively higher life expectancy for females than males
(Figure 2.3).
Figure 2.2: Reported age specific death rate by sex
Source: Ghana Statistical Service, 2010 Population & Housing Census Note: * Number of deaths per 1,000 population
0
0.01
0.02
0.03
0.04
0.05
0.06
0.07
0.08
Under5
5-9 10-14 15-19 20-24 25-29 30-34 35-39 40-44 45-49 50-54 55-59 60-64 65-69 70+
Male Female
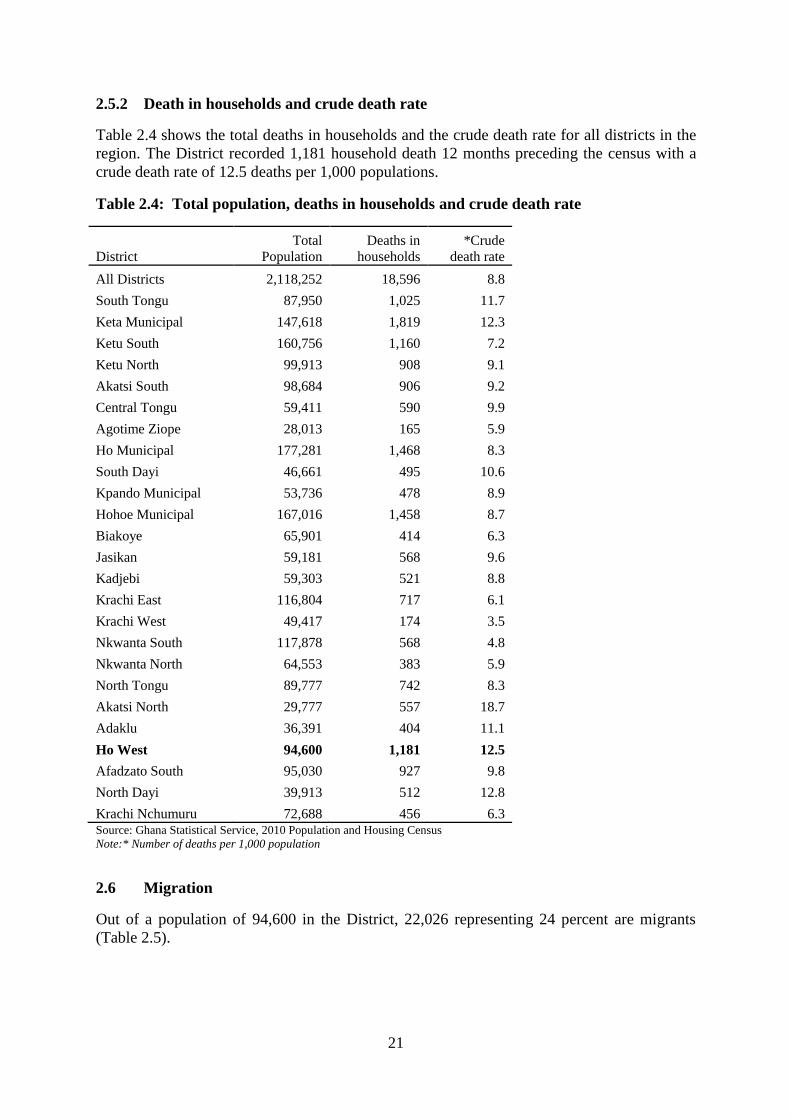
21
2.5.2 Death in households and crude death rate
Table 2.4 shows the total deaths in households and the crude death rate for all districts in the
region. The District recorded 1,181 household death 12 months preceding the census with a
crude death rate of 12.5 deaths per 1,000 populations.
Table 2.4: Total population, deaths in households and crude death rate
District
Total
Population
Deaths in
households
*Crude
death rate
All Districts 2,118,252 18,596 8.8
South Tongu 87,950 1,025 11.7
Keta Municipal 147,618 1,819 12.3
Ketu South 160,756 1,160 7.2
Ketu North 99,913 908 9.1
Akatsi South 98,684 906 9.2
Central Tongu 59,411 590 9.9
Agotime Ziope 28,013 165 5.9
Ho Municipal 177,281 1,468 8.3
South Dayi 46,661 495 10.6
Kpando Municipal 53,736 478 8.9
Hohoe Municipal 167,016 1,458 8.7
Biakoye 65,901 414 6.3
Jasikan 59,181 568 9.6
Kadjebi 59,303 521 8.8
Krachi East 116,804 717 6.1
Krachi West 49,417 174 3.5
Nkwanta South 117,878 568 4.8
Nkwanta North 64,553 383 5.9
North Tongu 89,777 742 8.3
Akatsi North 29,777 557 18.7
Adaklu 36,391 404 11.1
Ho West 94,600 1,181 12.5
Afadzato South 95,030 927 9.8
North Dayi 39,913 512 12.8
Krachi Nchumuru 72,688 456 6.3 Source: Ghana Statistical Service, 2010 Population and Housing Census
Note:* Number of deaths per 1,000 population
2.6 Migration
Out of a population of 94,600 in the District, 22,026 representing 24 percent are migrants
(Table 2.5).

22
Table 2.5: Birthplace by duration of residence of migrants
Birthplace Number
Duration of residence (%)
Less than
1 year
1-4
years
5-9
years
10-19
years
20+
years
Total 22,026 13.7 32.4 17.1 16.2 20.7
Born elsewhere in the region 16,298 12.9 30.9 16.6 17.0 22.7
Born elsewhere in another region:
Western 288 22.9 30.6 22.2 12.2 12.2
Central 194 27.8 28.4 20.1 10.8 12.9
Greater Accra 1,419 21.4 36.5 20.7 10.1 11.3
Volta - - - - - -
Eastern 1,004 20.8 32.4 13.5 15.2 18.0
Ashanti 365 13.4 35.6 20.0 14.0 17.0
Brong Ahafo 137 9.5 28.5 29.2 21.9 10.9
Northern 706 12.9 56.1 16.3 6.5 8.2
Upper East 60 15.0 46.7 10.0 6.7 21.7
Upper West 48 6.3 54.2 20.8 6.3 12.5
Outside Ghana 1,507 8.0 32.0 18.6 20.6 20.7
Source: Ghana Statistical Service, 2010 Population and Housing Census
The Table shows that out of the total number of migrants, those born elsewhere in the Volta
region stands at 16,298 constituting the majority (74%). Among the migrants who were born
outside the region, Greater Accra recorded the highest (1,419) followed by Eastern (1,004)
and Upper West region the least (48). The data shows that 20.7 percent of the migrants have
been in the district for 20 years or more, about 46 percent have been in the district for 4 years
or below and 17.1 percent between 5 to 9 years.
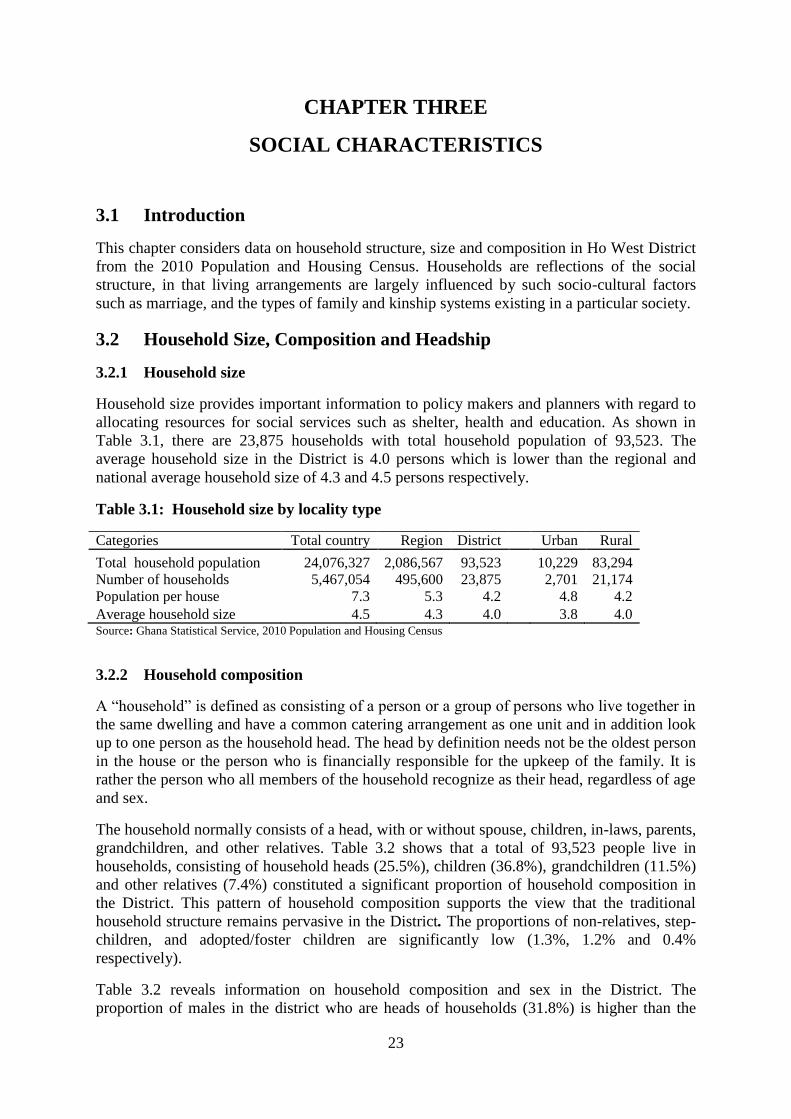
23
CHAPTER THREE
SOCIAL CHARACTERISTICS
3.1 Introduction
This chapter considers data on household structure, size and composition in Ho West District
from the 2010 Population and Housing Census. Households are reflections of the social
structure, in that living arrangements are largely influenced by such socio-cultural factors
such as marriage, and the types of family and kinship systems existing in a particular society.
3.2 Household Size, Composition and Headship
3.2.1 Household size
Household size provides important information to policy makers and planners with regard to
allocating resources for social services such as shelter, health and education. As shown in
Table 3.1, there are 23,875 households with total household population of 93,523. The
average household size in the District is 4.0 persons which is lower than the regional and
national average household size of 4.3 and 4.5 persons respectively.
Table 3.1: Household size by locality type
Categories Total country Region District Urban Rural
Total household population 24,076,327 2,086,567 93,523
10,229 83,294
Number of households 5,467,054 495,600 23,875
2,701 21,174
Population per house 7.3 5.3 4.2
4.8 4.2
Average household size 4.5 4.3 4.0 3.8 4.0 Source: Ghana Statistical Service, 2010 Population and Housing Census
3.2.2 Household composition
A “household” is defined as consisting of a person or a group of persons who live together in
the same dwelling and have a common catering arrangement as one unit and in addition look
up to one person as the household head. The head by definition needs not be the oldest person
in the house or the person who is financially responsible for the upkeep of the family. It is
rather the person who all members of the household recognize as their head, regardless of age
and sex.
The household normally consists of a head, with or without spouse, children, in-laws, parents,
grandchildren, and other relatives. Table 3.2 shows that a total of 93,523 people live in
households, consisting of household heads (25.5%), children (36.8%), grandchildren (11.5%)
and other relatives (7.4%) constituted a significant proportion of household composition in
the District. This pattern of household composition supports the view that the traditional
household structure remains pervasive in the District. The proportions of non-relatives, step-
children, and adopted/foster children are significantly low (1.3%, 1.2% and 0.4%
respectively).
Table 3.2 reveals information on household composition and sex in the District. The
proportion of males in the district who are heads of households (31.8%) is higher than the

24
proportion of females who are household heads (19.8%). It is observed that children
constitute the largest proportion of household members, followed by heads of household in
the District.
Table 3.2: Household population by composition and sex
Household composition
Total Male Female
Number Percent Number Percent Number Percent
Total 93,523 100.0
44,847 100.0
48,676 100.0
Head 54,474 25.5
14,248 31.8
9,627 19.8
Spouse (wife/husband) 22,964 10.0
633 1.4
8,716 17.9
Child (son/daughter) 17,445 36.8
17,574 39.2
16,812 34.5
Parent/Parent in-law 18,592 1.3
194 0.4
1,018 2.1
Son/Daughter in-law 711 0.8
188 0.4
517 1.1
Grandchild 5,426 11.5
5,477 12.2
5,238 10.8
Brother/Sister 7,303 3.9
1,792 4.0
1,826 3.8
Step child 2,327 1.2
593 1.3
535 1.1
Adopted/Foster child 802 0.4
194 0.4
209 0.4
Other relative 3,839 7.4
3,286 7.3
3,645 7.5
Non-relative 3,819 1.3 668 1.5 533 1.1 Source: Ghana Statistical Service, 2010 Population and Housing Census
3.2.3 Household structure
Household structure is defined as classification of ties of affiliation of persons who constitute
households. Table3.3 shows the distribution of household structure by sex in Ho West
District. Nuclear families constitute the highest proportion of households (24.2%), while
single parent extended plus non relatives constitute the lowest proportion of households
(1.3%). The proportion of male head of household with nuclear families (26.0%) is more than
that of female head with nuclear families (22.5%).
Table 3.3: Household population by structure and sex
Household structure
Total Male Female
Number Percent Number Percent Number Percent
Total 93,523 100.0
44,847 100.0
48,676 100.0
Head only 4,720 5.0
2,855 6.4
1,865 3.8
Head and a spouse only 1,616 1.7
810 1.8
806 1.7
Nuclear (Head spouse(s) children) 22,634 24.2
11,675 26
10,959 22.5
Extended (Head spouse(s) children Head's
relatives) 20,133 21.5
10,119 22.6
10,014 20.6
Extended + non relatives 1,275 1.4
640 1.4
635 1.3
Head spouse(s) and other composition 3,519 3.8
1,721 3.8
1,798 3.7
Single parent Nuclear 10,191 10.9
4,468 10
5,723 11.8
Single parent Extended 17,544 18.8
7,219 16.1
10,325 21.2
Single parent Extended + non relative 1,246 1.3
579 1.3
667 1.4
Head and other composition but no spouse 10,645 11.4 4,761 10.6 5,884 12.1 Source: Ghana Statistical Service, 2010 Population and Housing Census

25
3.4 Marital Status
The 2010 Census classified “marital status” into never married, living together/consensual
union, married, separated, divorced and widowed. Only those 12 years and older were
eligible to provide answers to this question. The definition of marriage includes persons in
any of the following types of marriages: civil, traditional and common law/consensual.
3.4.1 Marital status, by sex and age-group
In many societies in Ghana, males are more likely to delay marriage than females.
Nonetheless, more widespread education has extended the age at marriage for females. Table
3.4 shows the percentage distribution of marital status by sex and age-group. It shows
that38.1 percent of persons 12years and older are married, 35.5never married and 8.1 are
widowed. It also reveals that a higher proportion of females (39.2%) than males (36.9%)are
married. There are also substantially more females who are widowed (12.8%) than their male
counterparts (2.8%).Similarly, a higher proportion of females (4.2%) than males (2.9%) are
divorced. It is evident from Table3.4 that 96.1% of both males and females within the age
cohort of 12-14 had never married. In terms of age distribution, a higher proportion of
females than males, are married in the 30-34(60.8%, 45.5%) and 35-39 (63.1%, 57.2%)
respectively.
Table 3.4: Persons 12 years and older by sex, age-group and marital status
Sex/Age-
group Number Total
Never
married
Informal/
Consensual
union/Living
together Married Separated Divorced Widowed
Both Sexes
Total 66,316 100.0 35.5 10.0 38.1 4.7 3.6 8.1
12-14 6,247 100.0 96.1 1.1 2.8 0.0 0.0 0.0
15 - 19 8,951 100.0 91.4 3.3 4.9 0.2 0.0 0.1
20 - 24 6,854 100.0 62.6 13.9 20.7 1.9 0.4 0.4
25 - 29 6,000 100.0 37.3 17.9 40.1 2.8 1.3 0.5
30 - 34 5,358 100.0 18.6 18.8 54.0 5.1 1.9 1.5
35 - 39 4,969 100.0 10.9 17.6 60.4 5.8 3.2 2.1
40 - 44 4,880 100.0 7.7 14.8 61.9 7.0 4.8 3.6
45 - 49 4,573 100.0 5.7 12.7 61.3 8.2 5.8 6.3
50 - 54 4,390 100.0 4.2 9.9 60.3 8.8 8.5 8.2
55 - 59 3,083 100.0 3.6 7.0 58.1 9.5 7.5 14.3
60 - 64 2,957 100.0 3.7 5.3 51.8 10.2 8.4 20.6
65+ 8,054 100.0 2.6 3.2 39.1 6.4 8.1 40.7
Male
Total 30,954 100.0 44.5 9.1 36.9 3.8 2.9 2.8
12-14 3,315 100.0 96.1 0.9 3.0 0.0 0.0 0.0
15 - 19 4,791 100.0 96.5 1.0 2.4 0.0 0.0 0.0
20 - 24 3,234 100.0 81.6 6.3 11.1 0.8 0.2 0.1
25 - 29 2,743 100.0 52.3 15.3 29.2 1.7 1.0 0.5
30 - 34 2,389 100.0 29.0 18.9 45.6 4.1 1.7 0.8
35 - 39 2,240 100.0 16.0 17.8 57.2 5.1 2.8 1.0
40 - 44 2,244 100.0 11.7 15.6 61.8 6.1 3.3 1.5
45 - 49 2,018 100.0 9.0 15.1 61.3 7.0 4.8 2.9
50 - 54 2,030 100.0 6.2 11.6 64.7 8.1 7.0 2.3
55 - 59 1,363 100.0 4.7 8.6 68.9 7.3 6.2 4.4
60 - 64 1,305 100.0 5.3 7.1 67.1 8.0 7.4 5.0
65+ 3,282 100.0 3.9 4.9 59.0 7.3 8.4 16.5
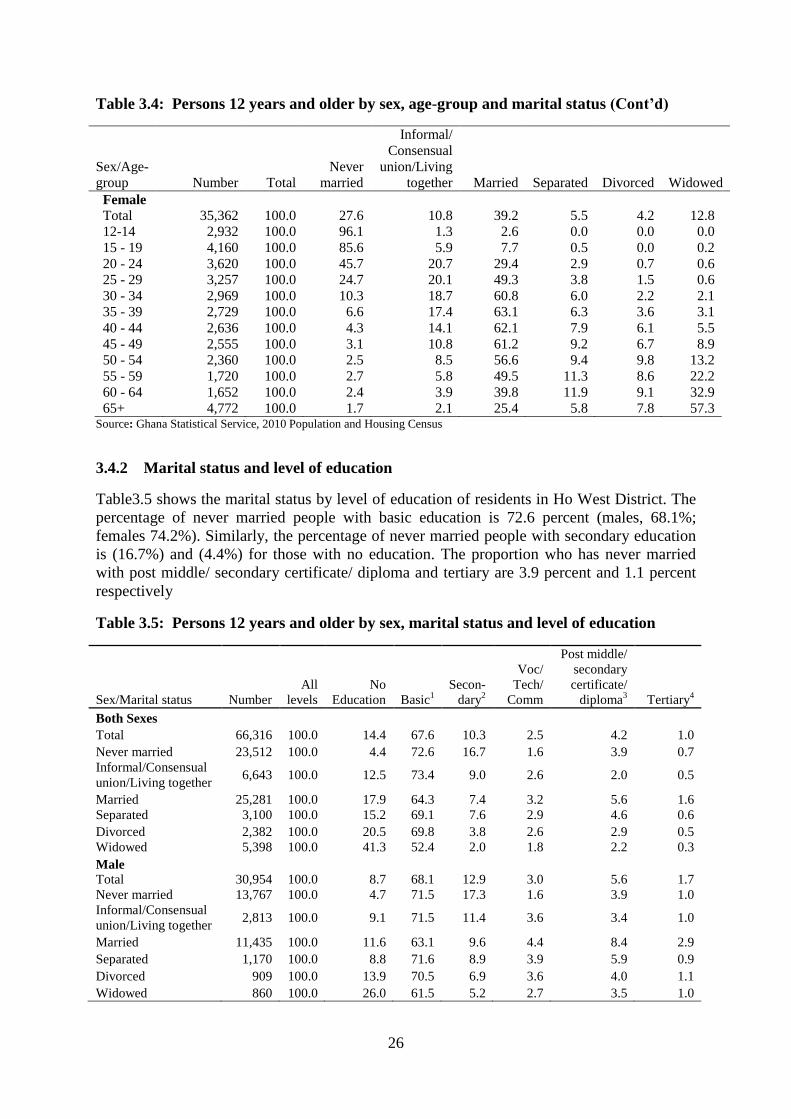
26
Table 3.4: Persons 12 years and older by sex, age-group and marital status (Cont’d)
Sex/Age-
group Number Total
Never
married
Informal/
Consensual
union/Living
together Married Separated Divorced Widowed
Female
Total 35,362 100.0 27.6 10.8 39.2 5.5 4.2 12.8
12-14 2,932 100.0 96.1 1.3 2.6 0.0 0.0 0.0
15 - 19 4,160 100.0 85.6 5.9 7.7 0.5 0.0 0.2
20 - 24 3,620 100.0 45.7 20.7 29.4 2.9 0.7 0.6
25 - 29 3,257 100.0 24.7 20.1 49.3 3.8 1.5 0.6
30 - 34 2,969 100.0 10.3 18.7 60.8 6.0 2.2 2.1
35 - 39 2,729 100.0 6.6 17.4 63.1 6.3 3.6 3.1
40 - 44 2,636 100.0 4.3 14.1 62.1 7.9 6.1 5.5
45 - 49 2,555 100.0 3.1 10.8 61.2 9.2 6.7 8.9
50 - 54 2,360 100.0 2.5 8.5 56.6 9.4 9.8 13.2
55 - 59 1,720 100.0 2.7 5.8 49.5 11.3 8.6 22.2
60 - 64 1,652 100.0 2.4 3.9 39.8 11.9 9.1 32.9
65+ 4,772 100.0 1.7 2.1 25.4 5.8 7.8 57.3 Source: Ghana Statistical Service, 2010 Population and Housing Census
3.4.2 Marital status and level of education
Table3.5 shows the marital status by level of education of residents in Ho West District. The
percentage of never married people with basic education is 72.6 percent (males, 68.1%;
females 74.2%). Similarly, the percentage of never married people with secondary education
is (16.7%) and (4.4%) for those with no education. The proportion who has never married
with post middle/ secondary certificate/ diploma and tertiary are 3.9 percent and 1.1 percent
respectively
Table 3.5: Persons 12 years and older by sex, marital status and level of education
Sex/Marital status Number
All
levels
No
Education Basic1
Secon-
dary2
Voc/
Tech/
Comm
Post middle/
secondary
certificate/
diploma3 Tertiary
4
Both Sexes
Total 66,316 100.0 14.4 67.6 10.3 2.5 4.2 1.0
Never married 23,512 100.0 4.4 72.6 16.7 1.6 3.9 0.7
Informal/Consensual
union/Living together 6,643 100.0 12.5 73.4 9.0 2.6 2.0 0.5
Married 25,281 100.0 17.9 64.3 7.4 3.2 5.6 1.6
Separated 3,100 100.0 15.2 69.1 7.6 2.9 4.6 0.6
Divorced 2,382 100.0 20.5 69.8 3.8 2.6 2.9 0.5
Widowed 5,398 100.0 41.3 52.4 2.0 1.8 2.2 0.3
Male
Total 30,954 100.0 8.7 68.1 12.9 3.0 5.6 1.7
Never married 13,767 100.0 4.7 71.5 17.3 1.6 3.9 1.0
Informal/Consensual
union/Living together 2,813 100.0 9.1 71.5 11.4 3.6 3.4 1.0
Married 11,435 100.0 11.6 63.1 9.6 4.4 8.4 2.9
Separated 1,170 100.0 8.8 71.6 8.9 3.9 5.9 0.9
Divorced 909 100.0 13.9 70.5 6.9 3.6 4.0 1.1
Widowed 860 100.0 26.0 61.5 5.2 2.7 3.5 1.0

27
Table 3.5: Persons 12 years and older by sex, marital status and level of education
Sex/Marital status Number
All
levels
No
Education Basic1
Secon-
dary2
Voc/
Tech/
Comm
Post middle/
secondary
certificate/
diploma3 Tertiary
4
Female
Total 35,362 100.0 19.5 67.2 8.0 2.0 3.0 0.4
Never married 9,745 100.0 4.1 74.2 15.8 1.7 3.9 0.4
Informal/Consensual
union/Living together 3,830 100.0 15.1 74.9 7.2 1.9 0.9 0.1
Married 13,846 100.0 23.0 65.3 5.7 2.3 3.2 0.5
Separated 1,930 100.0 19.0 67.6 6.8 2.3 3.8 0.5
Divorced 1,473 100.0 24.6 69.3 1.8 2.0 2.2 0.1
Widowed 4,538 100.0 44.2 50.6 1.3 1.7 1.9 0.2
Source: Ghana Statistical Service, 2010 Population and Housing Census
3.4.3 Marital status by economic activity
Table 3.6 shows marital status of persons 12 years and older by sex and economic activity
status in the district. Nearly two-thirds of those who have never married are economically not
active (64.8%). About 83 percent of those who are married are employed while about two
percent of those married are unemployed. About 15 percent of married persons (16.9%
females, 13.3% females) are economically not active.

28
Table 3.6: Persons 12 years and older by sex, marital status and economic activity status
Sex/marital status
Economically Active Economically
not active
Economically Active Economically
not active Total
Employed
Unemployed
Total
Employed
Unemployed
Number Number Number Number Percent Percent Percent Percent
Both Sexes
Total 66,316
40,758
1,717
23,841
100.0
61.5
2.6
36.0
Never married 23,512
7,455
829
15,228
100.0
31.7
3.5
64.8
Informal/Consensual
union/Living together 6,643
5,455
212
976
100.0
82.1
3.2
14.7
Married 25,281
20,867
543
3,871
100.0
82.5
2.1
15.3
Separated 3,100
2,404
68
628
100.0
77.5
2.2
20.3
Divorced 2,382
1,773
29
580
100.0
74.4
1.2
24.3
Widowed 5,398
2,804
36
2,558
100.0
51.9
0.7
47.4
Male
Total 30,954
19,227
678
11,049
100.0
62.1
2.2
35.7
Never married 13,767
4,807
459
8,501
100.0
34.9
3.3
61.7
Informal/Consensual
union/Living together 2,813
2,535
36
242
100.0
90.1
1.3
8.6
Married 11,435
9,755
154
1,526
100.0
85.3
1.3
13.3
Separated 1,170
930
21
219
100.0
79.5
1.8
18.7
Divorced 909
691
3
215
100.0
76.0
0.3
23.7
Widowed 860
509
5
346
100.0
59.2
0.6
40.2
Female
Total 35,362
21,531
1,039
12,792
100.0
60.9
2.9
36.2
Never married 9,745
2,648
370
6,727
100.0
27.2
3.8
69.0
Informal/Consensual
union/Living together 3,830
2,920
176
734
100.0
76.2
4.6
19.2
Married 13,846
11,112
389
2,345
100.0
80.3
2.8
16.9
Separated 1,930
1,474
47
409
100.0
76.4
2.4
21.2
Divorced 1,473
1,082
26
365
100.0
73.5
1.8
24.8
Widowed 4,538 2,295 31 2,212 100.0 50.6 0.7 48.7 Source: Ghana Statistical Service, 2010 Population and Housing Census

29
3.5 Nationality
Table 3.7 shows the population by nationality and sex of the people in Ho West District. The
Table indicates that the majority of residents in the District are Ghanaians. Those who are
Ghanaians by birth in the district constitute 92.1 percent of the total population, followed by
about five percent with dual nationality. About two percent of the residents are Ghanaians by
naturalization while less than one percent are ECOWAS citizens (non- Ghanaians).
Table 3.7: Population by nationality and sex
Nationality Both sexes Male Female
Number Percent Number Percent Number Percent Total 94,600 100.0
45,361 100.0
49,239 100.0
Ghanaian by birth 87,154 92.1
41,765 92.1
45,389 92.2
Dual nationality (Ghanaian & Other) 5,018 5.3
2,390 5.3
2,628 5.3
Ghanaian by naturalization 1,608 1.7
746 1.6
862 1.8
ECOWAS 782 0.8
436 1.0
346 0.7
African other than ECOWAS 21 0.0
16 0.0
5 0.0
Other 17 0.0 8 0.0 9 0.0 Source: Ghana Statistical Service, 2010 Population and Housing Census
3.6 Religious Affiliation
Table 3.8 shows population by religion and sex in Ho West District. Christianity is the dominant
religion in the district followed by Traditional African Religions and Islam. Christians (Catholic
[9.8%], Protestant [42.5%], Pentecostal [25.4%] and Other Christians [3.0]) constitute 90.7
percent of the population and are clearly the majority. The second largest group is adherents of
various African traditional religions who make up 3.8 percent of the population. About two
percent of the population practice Islam. The Table further shows that a higher proportion of
males (3.9%) than females (3.6%) practice traditional religion.
Table 3.8: Population by religion and sex
Nationality
Both sexes Male Female
Number
Percent
Number
Percent
Number
Percent Total 94,600 100.0
45,361 100.0
49,239 100.0
Ghanaian by birth 87,154 92.1
41,765 92.1
45,389 92.2
Dual nationality (Ghanaian &
Other) 5,018 5.3
2,390 5.3
2,628 5.3
Ghanaian by naturalization 1,608 1.7
746 1.6
862 1.8
ECOWAS 782 0.8
436 1.0
346 0.7
African other than ECOWAS 21 0.0
16 0.0
5 0.0
Other 17 0.0 8 0.0 9 0.0 Source: Ghana Statistical Service, 2010 Population and Housing Census
3.7 Literacy and Education
Education is essential for the development of the requisite human resources needed for
accelerated socio-economic development of the society. It is the process of acquiring knowledge,

30
skills, values and attitudes to fully develop individual capacities for societal well-being. There is
a relationship between education, human resource development and economic growth (United
Nations Development Programme, 2011).
In the 2010 census, literacy was defined as the ability to read and write a simple statement with
understanding. It is an indicator of the extent to which societal knowledge can be transmitted
from generation to generation in written form. Thus, literacy is important for the development of
the individual and society. The 2010 Population and Housing Census collected information from
persons aged 11 years and older on literacy in three languages; Ghanaian languages, English (the
official language), and French.
Figure3.1 shows that 85.5 percent of the population 11 years and older in Ho West District are
literate while 14.1 percent are not literate. Figure3.1 further shows that a greater proportion of
males (91.5%) than females (80.9%) are literate. Similarly, a higher proportion of females
(19.1%) than males (8.5%) are not literate.
Figure 3.1: Population 11 years and older by literacy status and sex
Source: Ghana Statistical Service, 2010 Population and Housing Census
3.7.1 Population 11 years and older by sex, age and literacy status
Table 3.9 presents the distribution of literacy levels for persons 11 years and older by sex, age
and literacy status in Ho West District. For the District, 9,638 of the population aged 11 years
and above are not literate while 58,674 are literate. Seven percent are literate in English only,
and 25.7 percent are literate in a Ghanaian language only, while 66.2 percent are literate in both
English and Ghanaian language. Table 3.9 further shows that less than one percent of the
population is literate in English and French, as well as all the three languages (English, French
and a Ghanaian language). In terms of absolute numbers the number of female literates (29,377)
is about the same as male literates (29,317).
14.1 8.5
19.1
85.9 91.5
80.9
0.0
10.0
20.0
30.0
40.0
50.0
60.0
70.0
80.0
90.0
100.0
Total Male Female
Per
cen
tage
sex
Not literate Literate

31
Table 3.9: Population 11 years and older by sex, age and literacy status
None
(not
literate)
Literate Total
English
only
Ghanaian
language
only
English and
Ghanaian
language
English
and
French
English,
French and
Ghanaian
language
Both sexes
Total 9,638 58,694 100.0 7.0 25.7 66.2 0.3 0.9
11-14 157 8,106 100.0 13.3 21.9 64.3 0.1 0.3
15-19 297 8,654 100.0 9.5 13.5 75.8 0.3 1.0
20-24 475 6,379 100.0 7.8 16.8 74.0 0.3 1.1
25-29 611 5,389 100.0 8.0 22.4 68.4 0.2 1.0
30-34 719 4,639 100.0 6.2 28.1 64.2 0.5 1.1
35-39 698 4,271 100.0 4.8 33.7 59.9 0.4 1.1
40-44 796 4,084 100.0 5.2 34.0 59.5 0.3 0.9
45-49 767 3,806 100.0 3.4 31.8 63.1 0.5 1.2
50-54 781 3,609 100.0 3.6 29.6 65.7 0.1 1.0
55-59 522 2,561 100.0 3.2 29.1 66.5 0.1 1.1
60-64 630 2,327 100.0 3.0 30.9 65.0 0.1 1.1
65+ 3,185 4,869 100.0 2.8 40.5 55.7 0.1 0.9
Male
Total 2,712 29,317 100.0 6.6 19.8 71.9 0.4 1.4
11-14 98 4,292 100.0 12.3 21.0 66.2 0.1 0.4
15-19 130 4,661 100.0 8.5 12.9 77.1 0.3 1.2
20-24 164 3,070 100.0 6.4 12.8 78.7 0.6 1.5
25-29 225 2,518 100.0 7.5 17.2 73.6 0.4 1.2
30-34 215 2,174 100.0 7.3 20.6 69.8 0.5 1.8
35-39 208 2,032 100.0 4.7 26.2 66.8 0.6 1.7
40-44 236 2,008 100.0 4.5 26.5 67.6 0.3 1.0
45-49 196 1,822 100.0 4.1 22.5 70.9 0.5 2.0
50-54 208 1,822 100.0 3.9 21.7 72.4 0.2 1.8
55-59 146 1,217 100.0 3.4 18.1 76.5 0.2 1.9
60-64 171 1,134 100.0 3.3 18.9 75.4 0.2 2.3
65+ 715 2,567 100.0 2.6 28.0 67.7 0.2 1.4
Female
Total 6,926 29,377 100.0 7.3 31.5 60.5 0.2 0.5
11-14 59 3,814 100.0 14.5 22.8 62.3 0.1 0.3
15-19 167 3,993 100.0 10.7 14.1 74.3 0.3 0.6
20-24 311 3,309 100.0 9.1 20.6 69.6 0.1 0.7
25-29 386 2,871 100.0 8.4 26.9 63.8 0.1 0.8
30-34 504 2,465 100.0 5.3 34.6 59.2 0.4 0.4
35-39 490 2,239 100.0 4.9 40.6 53.6 0.3 0.6
40-44 560 2,076 100.0 5.9 41.3 51.7 0.3 0.7
45-49 571 1,984 100.0 2.8 40.3 55.9 0.5 0.5
50-54 573 1,787 100.0 3.2 37.6 58.9 0.1 0.2
55-59 376 1,344 100.0 3.1 39.0 57.4 0.0 0.4
60-64 459 1,193 100.0 2.7 42.2 55.1 0.0 0.0
65+ 2,470 2,302 100.0 2.9 54.4 42.4 0.1 0.3 Source: Ghana Statistical Service, 2010 Population and Housing Census

32
3.7.2 Level of education, school attendance and sex
Current school attendance represents the human resource potential of the country. For this
reason, data on the population currently attending educational institutions is important for human
resource planning to sustain improvements to socio-economic conditions in the country. Again,
information on past school attendance provides an indication of formal schooling in society. In a
society where few people have attended formal school, there will be few people with the
requisite knowledge and skills needed for modernization of the society to meet the challenges of
globalization.
Table3.10 presents information on persons 3 years and older currently in school in the District
and the distribution of past school attendance for persons aged 3years and older classified by
highest level of schooling. Of the 33,656people currently attending school, 17,925 are males and
15,731 are females. About 89.1 percent are enrolled in basic school (Nursery, kindergarten,
primary, JSS/JHS/middle), about eight percent in secondary/senior high school, less than one
percent in vocational/technical/commercial school, and about two percent in tertiary institutions.
The Table also shows that at all levels of education there are more males than females enrolled in
the various educational levels except Nursery and post middle/secondary certificate holders. For
the District as a whole, the majority of people who have attended school previously (77.6%)
have attained at least the basic level that is, Primary, JSS/JHS and Middle schools

33
Table 3.10: Population 3 years and older by level of education, school attendance and sex
Level of education
Currently attending Attended in the past
Both sexes
Male
Female
Both sexes
Male
Female
Number Percent Number Percent Number Percent Number Percent Number Percent Number Percent
Total 33,656 100.0
17,925 100.0
15,731 100.0
41,941 100.0
19,963 100.0
21,978 100.0
Nursery 2,233 6.6
1,100 6.1
1,133 7.2
- 0.0
- 0.0
- 0.0
Kindergarten 5,203 15.5
2,717 15.2
2,486 15.8
- 0.0
- 0.0
- 0.0
Primary 15,991 47.5
8,288 46.2
7,703 49.0
7,557 18.0
2,831 14.2
4,726 21.5
JSS/JHS 6,704 19.9
3,751 20.9
2,953 18.8
10,388 24.8
4,456 22.3
5,932 27.0
Middle - 0
- 0.0
- 0.0
15,631 37.3
7,558 37.9
8,073 36.7
SSS/SHS 2,665 7.9
1,559 8.7
1,106 7.0
2,843 6.8
1,533 7.7
1,310 6.0
Secondary - 0
- 0.0
- 0.0
1,317 3.1
916 4.6
401 1.8
Vocational/Technical/
Commercial 186 0.6
111 0.6
75 0.5
1,440 3.4
811 4.1
629 2.9
Post middle/Secondary
certificate 205 0.6
80 0.4
125 0.8
1,261 3.0
731 3.7
530 2.4
Tertiary 469 1.4 319 1.8 150 1.0 1,504 3.6 1,127 5.6 377 1.7
Source: Ghana Statistical Service, 2010 Population and Housing Census

34
CHAPTER FOUR
ECONOMIC CHARACTERISTICS
4.1 Introduction
The overall development of a country is based, in part, on the production of goods and
services. Critical to the production process is the human resource of the country. The total
population that produces these goods and services are referred to as working population also
known as employed. The type of economic activity pursued is influenced by the nature of the
economy and level of socio-economic development (Hull, 2009).
This chapter examines data on the economic activity status of the population, age and sex
structure of the employed population, employment status, sector as well as the age and sex
composition of the unemployed population. The economic and social development of the
District is dependent upon the quality and quantity of its productive resources, of which the
labour force is very important.
4.2 Economic Activity Status
The potential work force of every district is derived from its adult population that is available
to work (aged 15 years to 64years).The economically not active persons are those who do not
work and are not seeking for work. The category includes homemakers, full time students,
retired persons, the disabled and persons who are unable to work because of their age or ill-
health. Table 4.1 shows the economic activity status of the population 15 years and older in
the district. The economically active population is 69.5 percent of which 95.9 percent are
employed and 4.1 percent are unemployed.
With regards to male-female activity status, the proportion of economically active males is
70.7 percent of which 96.5percent are employed and 3.5percent unemployed, while that for
the female economically active population is 68.6percent with 95.4percent employed while
4.6percent are unemployed.
Table 4.1 further shows that the economically not active population is 30.5 percent with those
in full time education recording the highest percentage of 45.6 percent of this economically
not active subpopulation. The proportion of males, who are economically not active,
29.3percent, is marginally lower than females 31.4 percent. Out of the economically not
active group, the proportion of males who are in full time education and are therefore not
available for work (59.4%) is almost twice that of females (34.7%) in full time education. In
the District, 16.7 percent of the economically not active population is too old or young to
work. One-quarter (25.0%) of economically not active females are engaged in home duties
(household chores) while only 8 percent of males are involved with home duties.
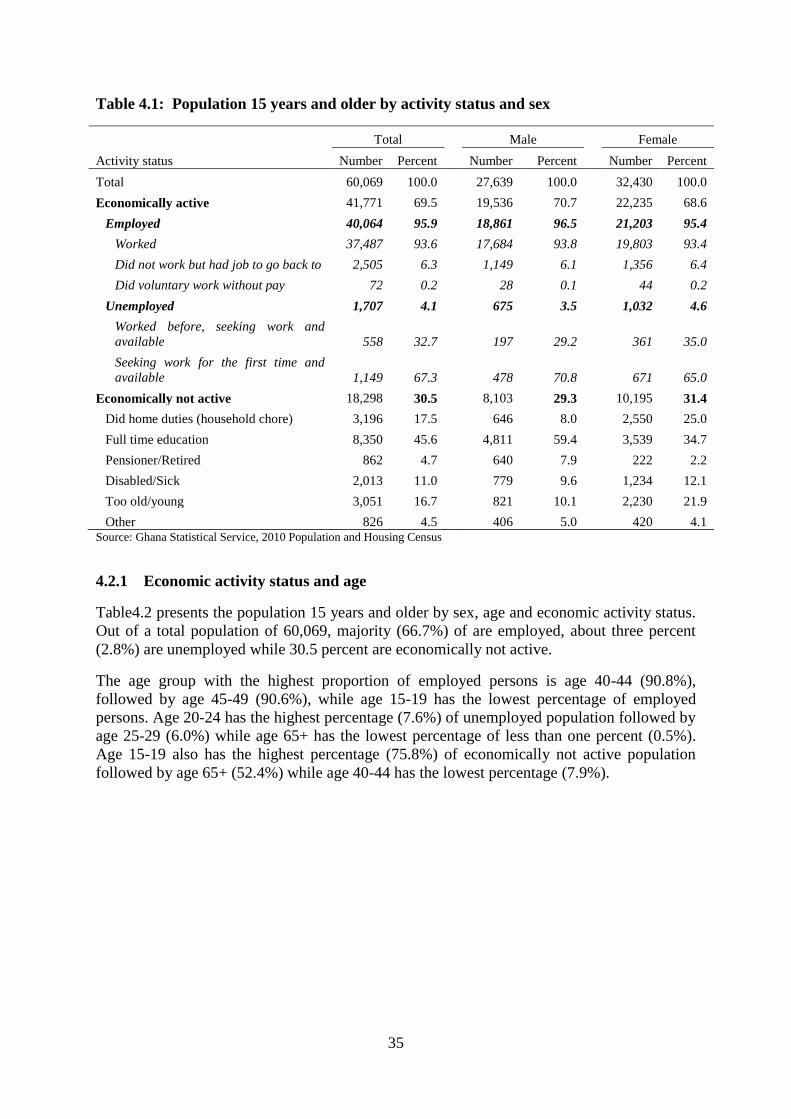
35
Table 4.1: Population 15 years and older by activity status and sex
Activity status
Total Male Female
Number Percent Number Percent Number Percent
Total 60,069 100.0
27,639 100.0
32,430 100.0
Economically active 41,771 69.5
19,536 70.7
22,235 68.6
Employed 40,064 95.9
18,861 96.5
21,203 95.4
Worked 37,487 93.6
17,684 93.8
19,803 93.4
Did not work but had job to go back to 2,505 6.3
1,149 6.1
1,356 6.4
Did voluntary work without pay 72 0.2
28 0.1
44 0.2
Unemployed 1,707 4.1
675 3.5
1,032 4.6
Worked before, seeking work and
available 558 32.7
197 29.2
361 35.0
Seeking work for the first time and
available 1,149 67.3
478 70.8
671 65.0
Economically not active 18,298 30.5
8,103 29.3
10,195 31.4
Did home duties (household chore) 3,196 17.5
646 8.0
2,550 25.0
Full time education 8,350 45.6
4,811 59.4
3,539 34.7
Pensioner/Retired 862 4.7
640 7.9
222 2.2
Disabled/Sick 2,013 11.0
779 9.6
1,234 12.1
Too old/young 3,051 16.7
821 10.1
2,230 21.9
Other 826 4.5 406 5.0 420 4.1 Source: Ghana Statistical Service, 2010 Population and Housing Census
4.2.1 Economic activity status and age
Table4.2 presents the population 15 years and older by sex, age and economic activity status.
Out of a total population of 60,069, majority (66.7%) of are employed, about three percent
(2.8%) are unemployed while 30.5 percent are economically not active.
The age group with the highest proportion of employed persons is age 40-44 (90.8%),
followed by age 45-49 (90.6%), while age 15-19 has the lowest percentage of employed
persons. Age 20-24 has the highest percentage (7.6%) of unemployed population followed by
age 25-29 (6.0%) while age 65+ has the lowest percentage of less than one percent (0.5%).
Age 15-19 also has the highest percentage (75.8%) of economically not active population
followed by age 65+ (52.4%) while age 40-44 has the lowest percentage (7.9%).

36
Table 4.2: Economic activity status of population 15 years and older by sex and age
Age group
All Status Employed Unemployed Economically not
active
Number Percent Number Percent Number Percent Number Percent
Both sexes
Total 60,069 100.0
40,064 66.7
1,707 2.8
18,298 30.5
15-19 8,951 100.0
1,867 20.9
299 3.3
6,785 75.8
20-24 6,854 100.0
3,510 51.2
518 7.6
2,826 41.2
25-29 6,000 100.0
4,553 75.9
359 6.0
1,088 18.1
30-34 5,358 100.0
4,570 85.3
169 3.2
619 11.6
35-39 4,969 100.0
4,388 88.3
100 2.0
481 9.7
40-44 4,880 100.0
4,429 90.8
67 1.4
384 7.9
45-49 4,573 100.0
4,143 90.6
54 1.2
376 8.2
50-54 4,390 100.0
3,915 89.2
37 0.8
438 10.0
55-59 3,083 100.0
2,673 86.7
20 0.6
390 12.7
60-64 2,957 100.0
2,224 75.2
46 1.6
687 23.2
65+ 8,054 100.0
3,792 47.1
38 0.5
4,224 52.4
Male
Total 27,639 100.0
18,861 68.2
675 2.4
8,103 29.3
15-19 4,791 100.0
1,022 21.3
109 2.3
3,660 76.4
20-24 3,234 100.0
1,633 50.5
200 6.2
1,401 43.3
25-29 2,743 100.0
2,123 77.4
168 6.1
452 16.5
30-34 2,389 100.0
2,098 87.8
65 2.7
226 9.5
35-39 2,240 100.0
2,046 91.3
31 1.4
163 7.3
40-44 2,244 100.0
2,096 93.4
30 1.3
118 5.3
45-49 2,018 100.0
1,878 93.1
19 0.9
121 6.0
50-54 2,030 100.0
1,879 92.6
14 0.7
137 6.7
55-59 1,363 100.0
1,243 91.2
11 0.8
109 8.0
60-64 1,305 100.0
1,034 79.2
14 1.1
257 19.7
65+ 3,282 100.0
1,809 55.1
14 0.4
1,459 44.5
Female
Total 32,430 100.0
21,203 65.4
1,032 3.2
10,195 31.4
15-19 4,160 100.0
845 20.3
190 4.6
3,125 75.1
20-24 3,620 100.0
1,877 51.9
318 8.8
1,425 39.4
25-29 3,257 100.0
2,430 74.6
191 5.9
636 19.5
30-34 2,969 100.0
2,472 83.3
104 3.5
393 13.2
35-39 2,729 100.0
2,342 85.8
69 2.5
318 11.7
40-44 2,636 100.0
2,333 88.5
37 1.4
266 10.1
45-49 2,555 100.0
2,265 88.6
35 1.4
255 10.0
50-54 2,360 100.0
2,036 86.3
23 1.0
301 12.8
55-59 1,720 100.0
1,430 83.1
9 0.5
281 16.3
60-64 1,652 100.0
1,190 72.0
32 1.9
430 26.0
65+ 4,772 100.0 1,983 41.6 24 0.5 2,765 57.9 Source: Ghana Statistical Service, 2010 Population and Housing Census
4.3 Occupation
Occupation refers to the type of work the person is engaged in at the establishment where
he/she works. This was asked only of persons 5 years and older who worked 7 days before
the census night, and those who did not work but had a job to return to as well as those
unemployed who had worked before. All persons who worked during the 7 days before the
census night were classified by the kind of work they were engaged in. For those who did
not work but had a job to return to, their occupation was the job they would go back to after
the period of absence. Also, for persons who had worked before and were seeking for work

37
and available for work, their occupation was on the last work they did before becoming
unemployed. If a person was engaged in more than one occupation, only the main one was
considered.
Table 4.3 shows employed population 15 years and older by occupation and sex. Majority of
the employed persons are engaged in skilled agricultural forestry and fishery workers. Nearly
six out of 10 persons (58.4%) in the district work as skilled agriculture forestry and fishery
workers. This is higher than the regional average for Volta Region of 50.1 percent. The
second highest proportion is craft and related trade workers (16%). About 7.3 percent also
work as managers, professionals, technicians and associate professionals. Clerical support,
plant and machine operators and assemblers and other occupations constitute 18.3 percent.
Compared with males (3.8%), a higher proportion of females (21.1%) work as service and
sales workers.
Table 4.3: Employed population 15 years and older by occupation and sex
Occupation
Both sexes Male Female
Number Percent Number Percent Number Percent
Total 40,064 100.0
18,861 100.0
21,203 100.0
Managers 577 1.4
231 1.2
346 1.6
Professionals 1,989 5.0
1,190 6.3
799 3.8
Technicians and associate
professionals 355 0.9
223 1.2
132 0.6
Clerical support workers 203 0.5
132 0.7
71 0.3
Service and sales workers 5,191 13.0
708 3.8
4,483 21.1
Skilled agricultural forestry and
fishery workers 23,400 58.4
11,877 63.0
11,523 54.3
Craft and related trades workers 6,396 16.0
3,125 16.6
3,271 15.4
Plant and machine operators and
assemblers 1,024 2.6
998 5.3
26 0.1
Elementary occupations 914 2.3
369 2.0
545 2.6
Other occupations 15 0.0 8 0.0 7 0.0 Source: Ghana Statistical Service, 2010 Population and Housing Census
4.4 Industry
Industry refers to the type of product produced or service rendered at the respondent’s work
place. Information was collected only on the main product produced or service rendered in
the establishment during the reference period.
Table 4.4 shows employed population 15 years and older by industry and sex. The three top
industries, agriculture, forestry and fishing, manufacturing, and wholesale and retail employ
80.6 percent of people 15 years and older with all the remaining industries employing 19.4
percent. The three industries combined have a higher proportion of females (85.1%) than
males (75.7%). Female dominance is evident in wholesale and retail compared to the male
counterparts (16.5% female versus 3.8% male). Male dominance is exhibited in the
construction industry compared with female (0.1% female versus 7.7% male). At the regional
level, the three industries employ 78.4 percent of the population 15 years and older.

38
Table 4.4: Employed population 15 years and older by industry and sex
Industry
Both sexes
Male
Female
Number Percent Number Percent Number Percent
Total 40,064 100.0
18,861 100.0
21,203 100.0
Agriculture forestry and fishing 23,416 58.4
11,951 63.4
11,465 54.1
Mining and quarrying 44 0.1
21 0.1
23 0.1
Manufacturing 4,676 11.7
1,597 8.5
3,079 14.5
Electricity gas stream and air
conditioning supply 27 0.1
21 0.1
6 0.0
Water supply; sewerage waste
management and remediation activities 101 0.3
48 0.3
53 0.2
Construction 1,474 3.7
1,454 7.7
20 0.1
Wholesale and retail; repair of motor
vehicles and motorcycles 4,207 10.5
713 3.8
3,494 16.5
Transportation and storage 796 2.0
783 4.2
13 0.1
Accommodation and food service
activities 1,172 2.9
89 0.5
1,083 5.1
Information and communication 37 0.1
31 0.2
6 0.0
Financial and insurance activities 34 0.1
25 0.1
9 0.0
Real estate activities 2 0.0
2 0.0
0 0.0
Professional scientific and technical
activities 123 0.3
67 0.4
56 0.3
Administrative and support service
activities 84 0.2
67 0.4
17 0.1
Public administration and defense;
compulsory social security 282 0.7
217 1.2
65 0.3
Education 1,985 5.0
1,179 6.3
806 3.8
Human health and social work activities 258 0.6
86 0.5
172 0.8
Arts entertainment and recreation 133 0.3
117 0.6
16 0.1
Other service activities 1,119 2.8
358 1.9
761 3.6
Activities of households as employers;
undifferentiated goods - and services -
producing activities of households for
own use
94 0.2
35 0.2
59 0.3
Activities of extraterritorial
organizations and bodies 0 0.0 0 0.0 0 0
Source: Ghana Statistical Service, 2010 Population and Housing Census
4.5 Employment Status
Employment status refers to the status of a person in the establishment where he/she currently
works or previously worked. Eight employment status categories were provided: employee,
self-employed without employees, self-employed with employees, casual worker,
contributing family worker, apprentice, domestic employee (house help). Persons who could
not be classified under any of the above categories were classified as “other”. Table 4.5
shows that employed population 15years and above are 40,064. Out of this 31,035
representing 77.5 percent are self-employed without employees, 10.0 percent are employees
while 7.6 percent are contributing family workers. Table 4.5 further reveals that a higher
proportion of females are self-employed (80.5%) compared to males (74.0%).
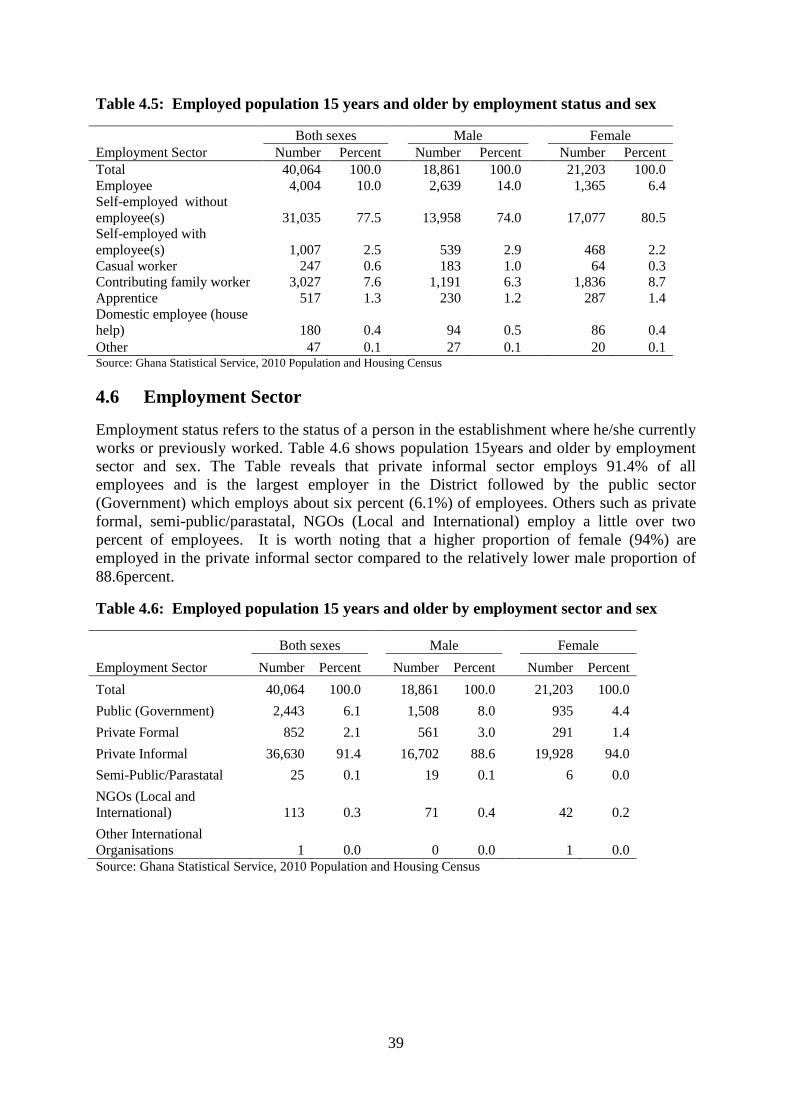
39
Table 4.5: Employed population 15 years and older by employment status and sex
Employment Sector
Both sexes Male Female
Number Percent Number Percent Number Percent
Total 40,064 100.0
18,861 100.0
21,203 100.0
Employee 4,004 10.0
2,639 14.0
1,365 6.4
Self-employed without
employee(s) 31,035 77.5
13,958 74.0
17,077 80.5
Self-employed with
employee(s) 1,007 2.5
539 2.9
468 2.2
Casual worker 247 0.6
183 1.0
64 0.3
Contributing family worker 3,027 7.6
1,191 6.3
1,836 8.7
Apprentice 517 1.3
230 1.2
287 1.4
Domestic employee (house
help) 180 0.4
94 0.5
86 0.4
Other 47 0.1 27 0.1 20 0.1 Source: Ghana Statistical Service, 2010 Population and Housing Census
4.6 Employment Sector
Employment status refers to the status of a person in the establishment where he/she currently
works or previously worked. Table 4.6 shows population 15years and older by employment
sector and sex. The Table reveals that private informal sector employs 91.4% of all
employees and is the largest employer in the District followed by the public sector
(Government) which employs about six percent (6.1%) of employees. Others such as private
formal, semi-public/parastatal, NGOs (Local and International) employ a little over two
percent of employees. It is worth noting that a higher proportion of female (94%) are
employed in the private informal sector compared to the relatively lower male proportion of
88.6percent.
Table 4.6: Employed population 15 years and older by employment sector and sex
Employment Sector
Both sexes Male Female
Number Percent Number Percent Number Percent
Total 40,064 100.0
18,861 100.0
21,203 100.0
Public (Government) 2,443 6.1
1,508 8.0
935 4.4
Private Formal 852 2.1
561 3.0
291 1.4
Private Informal 36,630 91.4
16,702 88.6
19,928 94.0
Semi-Public/Parastatal 25 0.1
19 0.1
6 0.0
NGOs (Local and
International) 113 0.3
71 0.4
42 0.2
Other International
Organisations 1 0.0 0 0.0 1 0.0
Source: Ghana Statistical Service, 2010 Population and Housing Census

40
CHAPTER FIVE
INFORMATION COMMUNICATION TECHNOLOGY
5.1 Introduction
Information Communications Technology (ICT) has become an important driver of economic
growth and shared social development in every country. Information Communication
Technology (ICT) has become an important tool in today’s knowledge-based information
society and economy. It is also recognized as an important component of socioeconomic
development. The recognition is reflected in actions such as the development and deployment
of a national ICT infrastructure, institutional and regulatory framework for managing the
sector, promoting the use of ICT in all sectors of the economy, implementing e-governance in
all government institutions and the construction of a National Data Centre as well as Regional
Innovation centres. This section presents information on access of individuals and households
to ICT in the Ho West District.
5.2 Ownership of Mobile Phones
Three decades ago, mobile phones seen as the tool of the affluent and busy executives in
society. Mobile phone is now the ICT that is reshaping and revolutionizing communications
globally. Its impact on the economic activities of nations, businesses, and small entrepreneurs
is phenomenal and is increasing everyday due to its affordability and ability to connect
people from anywhere in the world. The use of mobile phones has been an important mode of
communication for social and business activities for Ghanaians as far back as 2003. The
acceleration in the growth of use of mobile phones was a factor that influenced the Ghana
Statistical Service to rebase the economy of Ghana which resulted in the country being
classified as middle income in 2010.
Table 5.1 provides information on mobile phone ownership, internet facility usage
disaggregated by sex for the population 12 years and older in the Ho West District. Table 5.1
indicates that for the district as a whole, there are 24,316 persons 12 years and older who own
mobile phones and they constitute about 37 percent of the population 12 years and older.
About 42.7 percent of the male population in the District 12 years and older own mobile
phones compared to 31.4 percent of females in that category who own mobile phones.
Figure5.1 reinforces the earlier assertion that more males than female use mobile phone. The
Table further reveals that the use of mobile phone is more widespread than that of internet in
the District.
5.3 Use of Internet
The internet has become a vital communication facility for people, businesses and
organizations. Table 5.1 shows the percentage of population 12 years and older using internet
facility. The population using internet facilities are 1,882 constituting about three percent of
the population of the district. The proportion of males (4.1%) using internet facility at the
household in the district is higher than females (1.8%). This observation could be attributed
to the reflection of gender differences in educational attainment and/or employment in the
formal sector, both of which may be associated with the use of internet use and the types of
occupation and work opportunities available to men and women.

41
Table 5.1: Population 12 years and older by mobile phone ownership, internet
facility usage and sex
Sex
Population 12 years
and older Population having
mobile phone Population using
internet facility
Number Percent Number Percent Number Percent
Total 66,316 100.0
24,316 36.7
1,882 2.8
Male 30,954 46.7
13,223 42.7
1,257 4.1
Female 35,362 53.3 11,093 31.4 625 1.8 Source: Ghana Statistical Service, 2010 Population and Housing Census
5.4 Household Ownership of Desktop or Laptop computers
Ownership of desktop and laptop computers is a prerequisite for easy access to the internet,
electronic mail (e-mail) and other services. Table 5.2 shows the distribution of households
head by sex, ownership of desktop/laptop computers. Of the total number of households
(23,875) in the district, only 466 households have access to desktop or laptop computers
constituting 2 percent. With regard to sex, ownership of desktop/laptop computers is higher
for male-headed households (2.6%) compared to female-headed households (1.0%) in the
District.
Table 5.2: Households having desktop/laptop computers and sex of head
Sex
Number of households Households having
desktop/laptop computers
Number Percent Number Percent
Total 23,875 100.0
466 2.0
Male 14,248 59.7
367 2.6
Female 9,627 40.3 99 1.0 Source: Ghana Statistical Service, 2010 Population and Housing Census

42
CHAPTER SIX
DISABILITY
6.1 Introduction
Persons with disability (PWD) have been defined as those who are unable to or are restricted
in the performance of specific task/ activities due to loss of function of some part of the body
as a result of impairment or malformation (Ghana Statistical Service, 2012).
This chapter explores the characteristics of persons with disability in the District. The
development of a nation depends on the contributions of not only a segment of the population
but on the collective contributions of every individual, including persons with disabilities
(PWDs).
To this extent, government and civil society organizations in recent years have made progress
in addressing disability issues, resulting in some positive gains in improving the lives of
PWDs in the country. For instance the government of Ghana has enacted the Disability Act,
2006 , Act 715 to address issues of high poverty among PWDs due to low levels of education
and lack of employable skills; inaccessibility to public transport, and unfriendly
environmental facilities such as the widespread absence of ramps for PWDs and uncovered
drains and gutters.
6.2 Population with Disability
Out of a total population of 94,600, in the District 5,684 representing six percent of the
people have one form of disability or the other. This implies that about 94 percent of the
population in the district is without any form of disability. As shown in Table 6.1, the
proportion of females with disabilities (6.3%) is slightly higher than males (5.7%).
6.3 Type of Disability
Table 6.1 indicates PWDs by type of disability in the District. The commonest form of
disability in the District is sight impairment for which 47.1 percent of all disabled people are
afflicted with. This is followed by physical (34.4%). Other forms of disabilities include
emotional (26.1%), intellectual disability (19.3%) and speech (18.3%). The percentage of
females (47.9%) with sight disability is slightly higher than the corresponding proportion for
males (46.3%).
6.4 Distribution by Type of Locality
The locality of residence (rural-urban) of persons with disability has an impact on the ability
of PWDs to access social services and other facilities within the District. Table 6.1 further
shows the distribution of persons with disability by locality in the District. The percentage of
PWDs in the rural areas with sight disability (47.3%) is slightly higher than the urban areas
(44.9%).Furthermore, a slightly higher proportion of females in rural (47.9%) have sight
disability than the males (46.6%). On a whole the District figures are a reflection of the
regional scenario. For Volta region, sight disability affects 44.3 percent of all people who are
disabled while physically-disabled people constitute 29.1 percent of all people disabled.
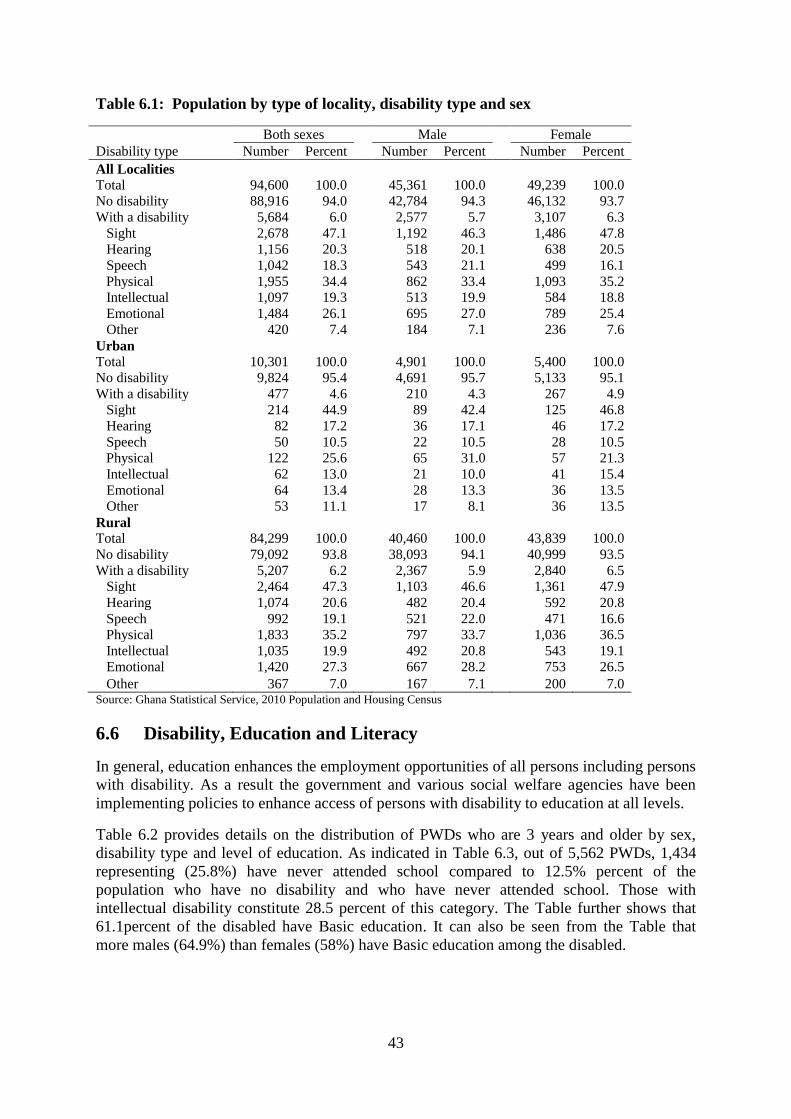
43
Table 6.1: Population by type of locality, disability type and sex
Disability type
Both sexes Male Female
Number Percent Number Percent Number Percent
All Localities
Total 94,600 100.0
45,361 100.0
49,239 100.0
No disability 88,916 94.0
42,784 94.3
46,132 93.7
With a disability 5,684 6.0
2,577 5.7
3,107 6.3
Sight 2,678 47.1
1,192 46.3
1,486 47.8
Hearing 1,156 20.3
518 20.1
638 20.5
Speech 1,042 18.3
543 21.1
499 16.1
Physical 1,955 34.4
862 33.4
1,093 35.2
Intellectual 1,097 19.3
513 19.9
584 18.8
Emotional 1,484 26.1
695 27.0
789 25.4
Other 420 7.4
184 7.1
236 7.6
Urban
Total 10,301 100.0
4,901 100.0
5,400 100.0
No disability 9,824 95.4
4,691 95.7
5,133 95.1
With a disability 477 4.6
210 4.3
267 4.9
Sight 214 44.9
89 42.4
125 46.8
Hearing 82 17.2
36 17.1
46 17.2
Speech 50 10.5
22 10.5
28 10.5
Physical 122 25.6
65 31.0
57 21.3
Intellectual 62 13.0
21 10.0
41 15.4
Emotional 64 13.4
28 13.3
36 13.5
Other 53 11.1
17 8.1
36 13.5
Rural
Total 84,299 100.0
40,460 100.0
43,839 100.0
No disability 79,092 93.8
38,093 94.1
40,999 93.5
With a disability 5,207 6.2
2,367 5.9
2,840 6.5
Sight 2,464 47.3
1,103 46.6
1,361 47.9
Hearing 1,074 20.6
482 20.4
592 20.8
Speech 992 19.1
521 22.0
471 16.6
Physical 1,833 35.2
797 33.7
1,036 36.5
Intellectual 1,035 19.9
492 20.8
543 19.1
Emotional 1,420 27.3
667 28.2
753 26.5
Other 367 7.0 167 7.1 200 7.0 Source: Ghana Statistical Service, 2010 Population and Housing Census
6.6 Disability, Education and Literacy
In general, education enhances the employment opportunities of all persons including persons
with disability. As a result the government and various social welfare agencies have been
implementing policies to enhance access of persons with disability to education at all levels.
Table 6.2 provides details on the distribution of PWDs who are 3 years and older by sex,
disability type and level of education. As indicated in Table 6.3, out of 5,562 PWDs, 1,434
representing (25.8%) have never attended school compared to 12.5% percent of the
population who have no disability and who have never attended school. Those with
intellectual disability constitute 28.5 percent of this category. The Table further shows that
61.1percent of the disabled have Basic education. It can also be seen from the Table that
more males (64.9%) than females (58%) have Basic education among the disabled.
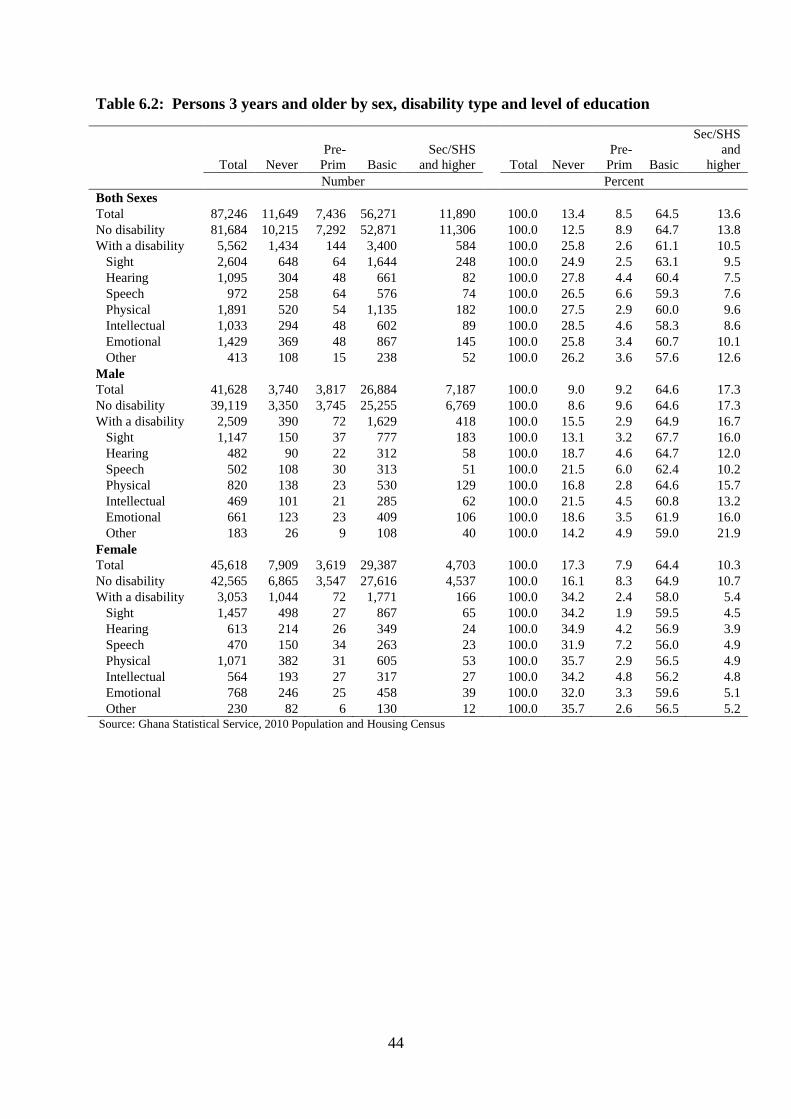
44
Table 6.2: Persons 3 years and older by sex, disability type and level of education
Total Never
Pre-
Prim Basic
Sec/SHS
and higher Total Never
Pre-
Prim Basic
Sec/SHS
and
higher
Number Percent
Both Sexes
Total 87,246 11,649 7,436 56,271 11,890
100.0 13.4 8.5 64.5 13.6
No disability 81,684 10,215 7,292 52,871 11,306
100.0 12.5 8.9 64.7 13.8
With a disability 5,562 1,434 144 3,400 584
100.0 25.8 2.6 61.1 10.5
Sight 2,604 648 64 1,644 248
100.0 24.9 2.5 63.1 9.5
Hearing 1,095 304 48 661 82
100.0 27.8 4.4 60.4 7.5
Speech 972 258 64 576 74
100.0 26.5 6.6 59.3 7.6
Physical 1,891 520 54 1,135 182
100.0 27.5 2.9 60.0 9.6
Intellectual 1,033 294 48 602 89
100.0 28.5 4.6 58.3 8.6
Emotional 1,429 369 48 867 145
100.0 25.8 3.4 60.7 10.1
Other 413 108 15 238 52
100.0 26.2 3.6 57.6 12.6
Male
Total 41,628 3,740 3,817 26,884 7,187
100.0 9.0 9.2 64.6 17.3
No disability 39,119 3,350 3,745 25,255 6,769
100.0 8.6 9.6 64.6 17.3
With a disability 2,509 390 72 1,629 418
100.0 15.5 2.9 64.9 16.7
Sight 1,147 150 37 777 183
100.0 13.1 3.2 67.7 16.0
Hearing 482 90 22 312 58
100.0 18.7 4.6 64.7 12.0
Speech 502 108 30 313 51
100.0 21.5 6.0 62.4 10.2
Physical 820 138 23 530 129
100.0 16.8 2.8 64.6 15.7
Intellectual 469 101 21 285 62
100.0 21.5 4.5 60.8 13.2
Emotional 661 123 23 409 106
100.0 18.6 3.5 61.9 16.0
Other 183 26 9 108 40
100.0 14.2 4.9 59.0 21.9
Female
Total 45,618 7,909 3,619 29,387 4,703
100.0 17.3 7.9 64.4 10.3
No disability 42,565 6,865 3,547 27,616 4,537
100.0 16.1 8.3 64.9 10.7
With a disability 3,053 1,044 72 1,771 166
100.0 34.2 2.4 58.0 5.4
Sight 1,457 498 27 867 65
100.0 34.2 1.9 59.5 4.5
Hearing 613 214 26 349 24
100.0 34.9 4.2 56.9 3.9
Speech 470 150 34 263 23
100.0 31.9 7.2 56.0 4.9
Physical 1,071 382 31 605 53
100.0 35.7 2.9 56.5 4.9
Intellectual 564 193 27 317 27
100.0 34.2 4.8 56.2 4.8
Emotional 768 246 25 458 39
100.0 32.0 3.3 59.6 5.1
Other 230 82 6 130 12 100.0 35.7 2.6 56.5 5.2 Source: Ghana Statistical Service, 2010 Population and Housing Census

45
CHAPTER SEVEN
AGRICULTURAL ACTIVITIES
7.1 Introduction
The Ghanaian economy is regarded as agrarian due to the number of population engaged in
the sector. The District has about 95percent of its population employed in the agricultural
sector. Agriculture plays a vital role in the socio-economic development of the Region and
the District for that matter. This chapter presents data on the agricultural activities in the
District, with focus on households in agriculture and types of farming engaged in. The
agricultural sector in the District comprises of crops, livestock, fisheries, agro forestry and
non-traditional commodities.
7.2 Households in Agriculture
A household is classified as an agricultural household if at least one of its members engages
in agricultural production even if not earning income directly from agricultural activity alone.
Out of total households of 23,875 in the District, 17,559 representing (73.5%) are engaged in
agriculture in one form of or the other. This implies that only (26.5%) of households are not
engaged in agricultural activities. It is also evident that out of the households engaged in
agriculture, (88.7%) are found in the rural localities whiles the remaining (11.3%) are in
urban localities (refer to Table 7.1).
Table 7.1: Households by agricultural activities and locality
Agricultural activities
Total Urban Rural
Number Percent Number Percent Number Percent
Total households 23,875 100.0
2,701 11.30
21,174 88.7
Households engaged in
agriculture 17,559 73.5
1,562 8.90
15,997 91.1
Crop farming 16,723 95.2
1,151 6.90
15,572 93.1
Tree planting 124 0.7
8 6.50
116 93.5
Livestock rearing 6,827 38.9
721 10.60
6,106 89.4
Fish farming 10 0.06 0 0.00 10 100.0 Source: Ghana Statistical Service, 2010 Population and Housing Census
7.3 Types of Farming
Table 7.1 shows that majority of the people are into crop farming (95.2%) with only (0.06%)
engaged in fish farming. In terms locality, 91.1 percent of all agricultural households are in
rural areas compared with about nine percent in urban areas. This picture cuts across all types
of farming. In all cases, as shown in Table 7.1, predominantly higher proportions of farming
households are in rural areas. This proportion ranges from 89.4 percent for livestock farming
to 100 percent for fish farming.
7.4 Distribution of Livestock and Other Animals
The census reported that a total of 147,871 livestock of different species are reared in the
District. This is shown in Table 7.2 which also denotes the distribution of livestock and the
keepers. Chicken alone constitute 60.8 percent of all the various types of livestock followed

46
by goats, 22.9 percent and sheep, 6.5 percent. This implies that out of the 19 livestock
identified, rearing of these three species accounts for 90.2 percent; the remaining 16 species
represent less than 10 percent. Out of a total number of 10,463 keepers engaged in livestock
rearing, 43percent are into chicken production, 37.9 percent are into goat production and 10.9
percent are involved in the production of sheep. Marine fishing has less than one percent
(0.03 %) of households engaged in this enterprise. There is no household engaged in inland
fishing.
Table 7.2: Distribution of livestock, other animals reared and keepers
Animals Keepers Average
Animal per
Keeper Livestock Number Percent Number Percent Total 147,871 100.0
10,463 100.0 14
Animals
Total 48,179 32.6
5,420 51.8 65
Cattle 2,285 1.5
108 1.0 21
Goat 33,831 22.9
3,964 37.9 9
Sheep 9,538 6.5
1,141 10.9 8
Pig 2,233 1.5
166 1.6 13
Rabbit 69 0.0
15 0.1 5
Grass-cutter 223 0.2
26 0.2 9
Birds
Total 94,251 63.7
4,926 47.1 83
Chicken 89,949 60.8
4,497 43.0 20
Dove 531 0.4
21 0.2 25
Duck 2,664 1.8
308 2.9 9
Guinea fowl 950 0.6
77 0.7 12
Ostrich 57 0.0
5 0.0 11
Turkey 100 0.1
18 0.2 6
Fish
Total 1,290 0.9
10 0.1 258
Fish farming 1,250 0.8
5 0.0 250
Inland fishing 0 -
0 0.0 0
Marine fishing 40 0.0
5 0.0 8
Beehives 2,520 1.7
29 0.3 87
Snail and silk worm
Total 1,213 0.8
18 0.2 242
Silk worm 342 0.2
14 0.1 24
Snail 871 0.6
4 0.0 218
Other 418 0.3 60 0.6 7 Source: Ghana Statistical Service, 2010 Population and Housing Census

47
CHAPTER EIGHT
HOUSING CONDITIONS
8.1 Introduction
The provision of periodic information on housing and housing condition is important both to
assess what has been achieved and to plan ahead. Information obtained from the census on
housing quality indicated by the materials used for constructing various housing units and the
availability of facilities such as water and sanitation and other housing conditions, will serve
as important indicators of the occupants quality of life. In this chapter, data on stock of
houses, facilities and amenities in the 2010 Population and Housing Census are presented.
8.2 Housing Stock
Figure 8.1 shows the distribution of housing units by locality. There are 22,346 houses in the
district. Out of this number, 20,190 houses (90.4%) are located in the rural areas while 2,156
(9.6%) are in the urban areas. Table 8.1 also indicates that the average households per house
is1.1compared to the regional figure of 1.2 and the national figure of 1.6. Population per
house, which is 4.2 persons, is lower than regional and national figures of 5.2 and 7.1
respectively. The average household size of 4.0 is lower than the regional and national figures
of 4.2 and 4.4 respectively. This implies that relatively fewer people live in a house in the
District as compared with the region and the country as a whole.
In terms of locality, the average household per house of 1.3 and population per house of 4.8
in urban areas are respectively higher than in rural localities of 1.0 and 4.2 respectively. It is
however interesting to note that average household size in the rural areas of 4.0 is higher than
the 3.8 recorded for urban areas.
Table 8.1: Stock of houses and households by type of locality
Categories
Total
District
Urban Rural Country Region
Total population 24,658,823 2,118,252
94,600
10,301 84,299
Total household population 24,076,327 2,086,567
93,523
10,229 83,294
Number of houses 3,392,745 399,953
22,346
2,156 20,190
Number of households 5,467,054 495,600
23,875
2,701 21,174
Average households per house 1.6 1.2
1.1
1.3 1
Population per house 7.3 5.3
4.2
4.8 4.2
Average household size 4.5 4.3 4 3.8 4 Source: Ghana Statistical Service, 2010 Population and Housing Census

48
Figure 8.1: Percentage distribution of houses by locality
Source: Ghana Statistical Service, 2010 Population and Housing Census
8.3 Type of Dwelling, Holding and Tenancy Arrangement
8.3.1 Ownership status of dwelling
Table 8.2 indicates that 23,875 dwelling units were in the District during the 2010 PHC
census. About 66.5 percent of the dwelling units are owned by household members and 21
percent by a relative not a household member. About ten percent (9.9%) are owned by other
private individuals. Government/ public ownership and houses purchased under mortgage
represent less than three percent of the dwelling units respectively.
With reference to ownership by sex, 69.5 percent of dwellings which are headed by males are
owned by a family member compared to the corresponding proportion of 62.1 percent for
females. In terms of locality; slightly higher proportions of dwelling units in the rural areas
are owned by household members (66.9%) as compared to (63.9%) in urban areas. Other
private individual ownership (9.9%) and government/public ownership (about 1.3%) are
higher in the urban areas as compared to proportions obtained in the rural areas of about ten
percent (9.6%) and close to one percent (0.9%) respectively.
Rural 90%
Urban 10%

49
Table 8.2: Ownership status of dwelling by sex of household head and type of locality
Ownership status
District
Total Male headed Female headed Urban Rural
Number Percent Number Percent Number Percent Number Percent Number Percent
Total 23,875 100.0
14,248 100.0
9,627 100.0
2,701 100.0
21,174 100.0
Owned by household member 15,884 66.5
9,906 69.5
5,978 62.1
1,725 63.9
14,159 66.9
Being purchased (e.g. mortgage) 63 0.3
36 0.3
27 0.3
3 0.1
60 0.3
Relative not a household member 5,013 21.0
2,453 17.2
2,560 26.6
506 18.7
4,507 21.3
Other private individual 2,365 9.9
1,465 10.3
900 9.3
324 12.0
2,041 9.6
Private employer 141 0.6
102 0.7
39 0.4
42 1.6
99 0.5
Other private agency 51 0.2
37 0.3
14 0.1
2 0.1
49 0.2
Public/Government ownership 302 1.3
211 1.5
91 0.9
92 3.4
210 1.0
Other 56 0.2 38 0.3 18 0.2 7 0.3 49 0.2 Source: Ghana Statistical Service, 2010 Population and Housing Census

50
8.3.3 Type of dwelling units (occupied)
Table 8.3 looks at occupied dwelling units by sex of household head and type of locality. It is
evident from the data that separate houses (55.3%) and compound houses(31.5%) altogether
constitute 86.8 percent of the dwelling units in the District. The remaining dwelling types
such as semi-detached, flat/apartment, hats/buildings, tent, improvised home, living quarters
attached to office, uncompleted building and others represent only 13.2 percent of all
dwellings. A higher proportion of male-headed households dwell in separate houses (57.1%)
as compared to the proportion of female-headed households (52.7%). The reverse is however
true with compound houses where the proportion of female-headed households (35.5%) is
higher than the male counterparts (28.9%). Separate houses constitute 57.0 percent of
dwelling units in rural areas compared with 42.4 percent in urban areas.
Table 8.3: Type of occupied dwelling unit by sex of household head and type of locality
Type of dwelling
Total
Country Region
District
Total Male
headed
Female
headed Urban Rural Number Percent
Total 5,467,054 495,600 23,875 100.0 100.0 100.0
100.0 100.0
Separate house 1,471,391 212,170 13,209 55.3 57.1 52.7
42.4 57.0
Semi-detached house 391,548 33,286 1,436 6.0 5.9 6.2
4.6 6.2
Flat/Apartment 256,355 7,668 132 0.6 0.7 0.4
1.0 0.5
Compound house (rooms) 2,942,147 219,276 7,527 31.5 28.9 35.5
48.4 29.4
Huts/Buildings (same compound) 170,957 15,705 1,113 4.7 5.5 3.5
1.9 5.0
Huts/Buildings (different
compound) 36,410 2,781 251 1.1 1.2 0.9
0.4 1.1
Tent 10,343 989 27 0.1 0.1 0.1
0.1 0.1
Improvised home
(kiosk/container etc.) 90,934 1,198 52 0.2 0.2 0.2
0.4 0.2
Living quarters attached to
office/shop 20,499 1,157 75 0.3 0.3 0.3
0.1 0.3
Uncompleted building 66,624 858 35 0.1 0.2 0.1
0.5 0.1
Other 9,846 512 18 0.1 0.1 0.1 0.1 0.1
Source: Ghana Statistical Service, 2010 Population and Housing Census
8.4 Construction Materials
8.4.1 Material of outer walls
The main construction materials for outer wall in the District are cement blocks/concrete and
brick/earth. Table 8.4 shows that over half of dwelling units are constructed with mud
brick/earth (53.0%) and 41.1 percent with cement blocks or concrete. The percentages
however vary within the urban and rural localities with 59.7 percent in urban localities using
cement block/concrete for their outer walls compared to 38.9 percent in rural localities. The
reverse is true with mud brick/earth where 56.1 percent of dwelling units in rural localities
use that material for outer walls compared to the corresponding proportion of 27.4 percent in
urban localities.

51
Table 8.4: Main construction material for outer wall of dwelling unit by type of locality
Material for Outer wall Total
Country Region
District
Total
Urban Rural Number Percent Total 5,817,607 550,006
27,322 100.0 100.0 100.0
Mud brick/Earth 1,991,540 264,357
14,486 53.0 27.4 56.1 Wood 200,594 4,900
257 0.9 1.6 0.9
Metal sheet/Slate/Asbestos 43,708 3,131
140 0.5 0.3 0.5 Stone 11,330 1,172
31 0.1 0.1 0.1
Burnt bricks 38,237 3,183
221 0.8 1.0 0.8 Cement blocks/Concrete 3,342,462 250,762
11,231 41.1 59.7 38.9
Landcrete 104,270 7,772
467 1.7 2.8 1.6 Bamboo 8,206 819
91 0.3 0.2 0.3
Palm leaf/Thatch
(grass)/Raffia 38,054 11,454
326 1.2 6.7 0.5 Other 39,206 2,456 72 0.3 0.2 0.3
Source: Ghana Statistical Service, 2010 Population and Housing Census
8.4.2 Floor material
Type of materials used for the floor of a house affects the aesthetic, quality and health status
of a house. This is because some floors are easily contaminated and are difficult to clean or
disinfect. As depicted in Table 8.5, floors are predominately made of cement, across the
various localities, 83.2% percent in the urban areas, 81.6 percent in rural areas, and 81.8
percent for the District as a whole. Other materials used constitute less than 20 percent in the
District.
Table 8.5: Main construction materials for the floor of dwelling unit by type of locality
Total
Country Region
District
Materials for the floor
Total
Urban Rural Number Percent Total 5,467,054 495,600
23,875 100.0 100.0 100.0
Earth/Mud 872,161 87,880
3,971 16.6 15.0 16.8
Cement/Concrete 4,255,611 397,467
19,534 81.8 83.2 81.6
Stone 32,817 1,842
56 0.2 0.3 0.2
Burnt brick 6,537 424
33 0.1 0.2 0.1
Wood 52,856 464
19 0.1 0.2 0.1
Vinyl tiles 57,032 1,237
45 0.2 0.1 0.2
Ceramic/Porcelain/Granite/Marble
tiles 88,500 3,754
141 0.6 0.8 0.6
Terrazzo/Terrazzo tiles 85,973 1,283
42 0.2 0.1 0.2
Other 15,567 1,249 34 0.1 0.2 0.1
Source: Ghana Statistical Service, 2010 Population and Housing Census
8.4.3 Roofing materials
Table 8.6 shows that in the District metal sheet is the most popular roofing material, and it is
used for 78.8 percent of dwelling units, followed by thatch /palm leaf or raffia (15.9%). The
use of metal sheet is predominant in both urban and rural locality. This accounts for (69.3%)
and (79.9%) respectively. The use of thatch/palm leaf or raffia (16.2%) is relatively high in
the rural localities compared to urban (13.7%). At the regional and national levels metal sheet
accounts for (70.7%) and (71.4%) respectively.

52
Table 8.6: Main construction material for roofing of dwelling unit by type of locality
Main Roofing material
Total
Country Region
District
Total
Urban Rural Number Percent Total 5,817,607 550,006
27,322 100.0
100.0 100.0
Mud/Mud bricks/Earth 80,644 3,576
157 0.6
0.4 0.6
Wood 45,547 3,000
156 0.6
0.8 0.5
Metal sheet 4,152,259 388,664
21,530 78.8
69.3 79.9
Slate/Asbestos 759,039 41,055
568 2.1
9.5 1.2
Cement/Concrete 141,072 4,810
253 0.9
1.1 0.9
Roofing tile 31,456 1,603
164 0.6
4.7 0.1
Bamboo 71,049 1,254
58 0.2
0.0 0.2
Thatch/Palm leaf or Raffia 500,606 102,769
4,343 15.9
13.7 16.2
Other 35,935 3,275 93 0.3 0.4 0.3 Source: Ghana Statistical Service, 2010 Population and Housing Census
8.5 Room Occupancy
The relationship between the number of rooms and the number of persons give the space
available per person. Table 8.7 shows the household size and the number of sleeping rooms
for households in the District. The data determine the extent of overcrowding of households
occupying dwelling units. Internationally accepted occupancy level is two persons per room,
any figure above this threshold is considered as evidence of overcrowding, which has both
health and social implications. Single sleeping room (one room) occupancy is relatively
higher compared to other dwelling units in the District. Close to fifty percent of households
(46.9%) have only one sleeping room. About 31 percent of households have two sleeping
rooms. Approximately one-third (31.7%) of all households with five members have only a
single sleeping room.
Table 8.7: Household size and number of sleeping rooms occupied in dwelling unit
House-
hold
size
Total Number of sleeping rooms
Number Percent
One
room
Two
rooms
Three
rooms
Four
rooms
Five
rooms
Six
rooms
Seven
rooms
Eight
rooms
Nine
rooms
or more
Total 23,875 100.0
46.9 30.9 12.3 5.2 2.4 1.1 0.5 0.3 0.3
1 4,720 100.0
87.0 8.9 2.2 1.1 0.4 0.1 0.1 0.0 0.2
2 3,653 100.0
57.3 33.8 6.0 1.4 0.7 0.4 0.1 0.1 0.2
3 3,573 100.0
47.9 35.2 11.9 2.6 1.4 0.6 0.2 0.1 0.2
4 3,440 100.0
40.2 39.5 12.5 4.7 1.6 0.9 0.3 0.2 0.1
5 2,827 100.0
31.7 40.1 16.9 6.8 3.0 0.8 0.2 0.2 0.3
6 2,125 100.0
26.4 38.9 19.1 9.4 3.1 1.9 0.7 0.2 0.4
7 1,356 100.0
18.1 36.9 24.0 11.9 5.5 1.8 0.8 0.5 0.4
8 863 100.0
12.4 36.5 23.5 14.0 5.3 4.6 1.4 1.0 1.2
9 523 100.0
8.0 32.5 24.9 17.8 10.7 3.4 1.3 0.8 0.6
10+ 795 100.0 7.0 19.7 28.1 15.8 11.9 7.2 4.4 3.0 2.8
Source: Ghana Statistical Service, 2010 Population and Housing Census
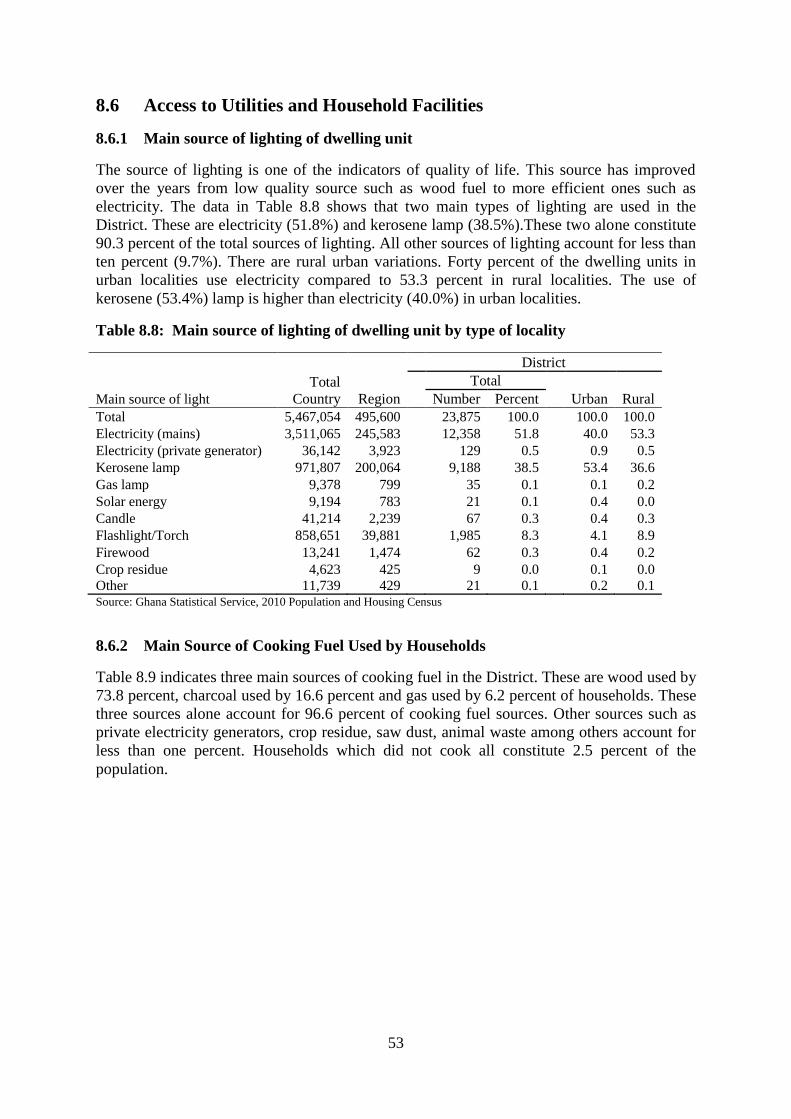
53
8.6 Access to Utilities and Household Facilities
8.6.1 Main source of lighting of dwelling unit
The source of lighting is one of the indicators of quality of life. This source has improved
over the years from low quality source such as wood fuel to more efficient ones such as
electricity. The data in Table 8.8 shows that two main types of lighting are used in the
District. These are electricity (51.8%) and kerosene lamp (38.5%).These two alone constitute
90.3 percent of the total sources of lighting. All other sources of lighting account for less than
ten percent (9.7%). There are rural urban variations. Forty percent of the dwelling units in
urban localities use electricity compared to 53.3 percent in rural localities. The use of
kerosene (53.4%) lamp is higher than electricity (40.0%) in urban localities.
Table 8.8: Main source of lighting of dwelling unit by type of locality
Main source of light
Total
Country Region
District
Total
Urban Rural Number Percent Total 5,467,054 495,600
23,875 100.0
100.0 100.0
Electricity (mains) 3,511,065 245,583
12,358 51.8
40.0 53.3
Electricity (private generator) 36,142 3,923
129 0.5
0.9 0.5
Kerosene lamp 971,807 200,064
9,188 38.5
53.4 36.6
Gas lamp 9,378 799
35 0.1
0.1 0.2
Solar energy 9,194 783
21 0.1
0.4 0.0
Candle 41,214 2,239
67 0.3
0.4 0.3
Flashlight/Torch 858,651 39,881
1,985 8.3
4.1 8.9
Firewood 13,241 1,474
62 0.3
0.4 0.2
Crop residue 4,623 425
9 0.0
0.1 0.0
Other 11,739 429 21 0.1 0.2 0.1 Source: Ghana Statistical Service, 2010 Population and Housing Census
8.6.2 Main Source of Cooking Fuel Used by Households
Table 8.9 indicates three main sources of cooking fuel in the District. These are wood used by
73.8 percent, charcoal used by 16.6 percent and gas used by 6.2 percent of households. These
three sources alone account for 96.6 percent of cooking fuel sources. Other sources such as
private electricity generators, crop residue, saw dust, animal waste among others account for
less than one percent. Households which did not cook all constitute 2.5 percent of the
population.

54
Table 8.9: Main source of cooking fuel, and cooking space used by households
Main source of cooking fuel
for household Total
Urban
Rural
Number Percent Number Percent Number Percent Total 23,875 100.0
2,701 100.0
21,174 100.0
None no cooking 585 2.5
74 2.7
511 2.4
Wood 17,611 73.8
1,404 52.0
16,207 76.5
Gas 1,492 6.2
346 12.8
1,146 5.4
Electricity 35 0.1
2 0.1
33 0.2
Kerosene 96 0.4
25 0.9
71 0.3
Charcoal 3,955 16.6
837 31.0
3,118 14.7
Crop residue 77 0.3
10 0.4
67 0.3
Saw dust 11 0.0
2 0.1
9 0.0
Animal waste 8 0.0
1 0.0
7 0.0
Other 5 0.0 - 5 0.0 Source: Ghana Statistical Service, 2010 Population and Housing Census
In terms of usage in localities, wood (76.5%) is predominantly used in the rural localities as
compared to the urban areas (52.0%). Other sources of cooking fuel in urban areas are
charcoal (31%). The use of gas for cooking is more prominent in urban areas (12.8%) than
rural localities (5.4%).
8.6.3 Main cooking space used by households
Information on cooking space used by household is presented in Table 8.9. There are 23,875
households in the District and 9,840of these households (41.2%) use separate room
exclusively devoted for cooking. Slightly above one in four households (26.2%) use
structures with roofs but without walls, almost five percent (4.5%) have no cooking space.
Other cooking spaces such as separate room shared with other households, enclosure without
roof, bedroom/hall/living room and verandah among others constitute 29.3 percent of the
total number of cooking spaces. About two out every 15 households (13.7%) cook in open
spaces in the compound.
Table 8.10: Main source of cooking fuel, and cooking space used by households
Cooking space used by household
Total
Urban
Rural
Number Percent Number Percent Number Percent
Total 23,875 100.0
2,701 100.0
21,174 100.0
No cooking space 1,086 4.5
111 4.1
975 4.6
Separate room for exclusive use of
household 9,840 41.2
1,101 40.8
8,739 41.3
Separate room shared with other
household(s) 810 3.4
114 4.2
696 3.3
Enclosure without roof 478 2.0
30 1.1
448 2.1
Structure with roof but without walls 5,971 25.0
415 15.4
5,556 26.2
Bedroom/Hall/Living room) 468 2.0
114 4.2
354 1.7
Verandah 1,820 7.6
327 12.1
1,493 7.1
Open space in compound 3,273 13.7
477 17.7
2,796 13.2
Other 129 0.5 12 0.4 117 0.6 Source: Ghana Statistical Service, 2010 Population and Housing Census

55
8.7 Main Source of Water for Drinking and for Other Domestic Use
Table 8.11 indicates the main sources of water used by households in the District. Bore
hole/tube well is the commonest source of drinking water used by 27.2 percent of households.
The second most popular source of drinking water is public tap/standpipe used by 22.7
percent of households. The next three most important sources of drinking water are
river/stream (17.6%), pipe borne water outside the dwelling (16.1%) and pipe borne water
inside the dwelling (5.6%). The same rankings of importance are also shown for the source of
water for other domestic uses with bore hole/tube wellbeing the most popular source.
Table 8.11: Main source of water of dwelling unit for drinking and other domestic
purpose
Sources of water
Total
Country Region
District
Total
Number Percent Urban Rural
Main source of drinking water for household Total 5,467,054 495,600
23,875 100.0
100.0 100.0
Pipe-borne inside dwelling 790,493 36,536
1,347 5.6
12.8 4.7
Pipe-borne outside dwelling 1,039,667 93,019
3,846 16.1
25.7 14.9
Public tap/Standpipe 712,375 95,209
5,426 22.7
41.2 20.4
Bore-hole/Pump/Tube well 1,267,688 81,286
6,492 27.2
0.8 30.6
Protected well 321,091 22,577
700 2.9
0.4 3.3
Rain water 39,438 15,627
411 1.7
2.0 1.7
Protected spring 19,345 1,626
65 0.3
0.0 0.3
Bottled water 20,261 761
19 0.1
0.3 0.1
Satchet water 490,283 16,196
343 1.4
3.0 1.2
Tanker supply/Vendor provided 58,400 2,120
84 0.4
1.9 0.2
Unprotected well 112,567 24,012
417 1.7
3.2 1.6
Unprotected spring 12,222 2,677
199 0.8
0.5 0.9
River/Stream 502,804 81,663
4,201 17.6
8.3 18.8
Dugout/Pond/Lake/Dam/Canal 76,448 21,897
321 1.3
0.0 1.5
Other 3,972 394
4 0.0
0.1 0.0
Main source of water for other
domestic use of household
Total 5,467,054 495,600
23,875 100.0
100.0 100.0
Pipe-borne inside dwelling 905,566 36,186
1,388 5.8
13.9 4.8
Pipe-borne outside dwelling 1,089,030 74,062
3,415 14.3
26.0 12.8
Public tap/Standpipe 704,293 83,508
4,705 19.7
27.8 18.7
Bore-hole/Pump/Tube well 1,280,465 73,484
6,274 26.3
0.8 29.5
Protected well 465,775 38,510
828 3.5
0.4 3.9
Rain water 39,916 14,834
512 2.1
1.8 2.2
Protected spring 18,854 1,986
75 0.3
0.2 0.3
Tanker supply/Vendor provided 100,048 2,325
87 0.4
2.0 0.2
Unprotected well 152,055 38,472
1,143 4.8
16.0 3.4
Unprotected spring 15,738 2,942
224 0.9
0.7 1.0
River/Stream 588,590 100,918
4,761 19.9
10.0 21.2
Dugout/Pond/Lake/Dam/Canal 96,422 27,098
394 1.7
0.1 1.8
Other 10,302 1,275 69 0.3 0.4 0.3 Source: Ghana Statistical Service, 2010 Population and Housing Census
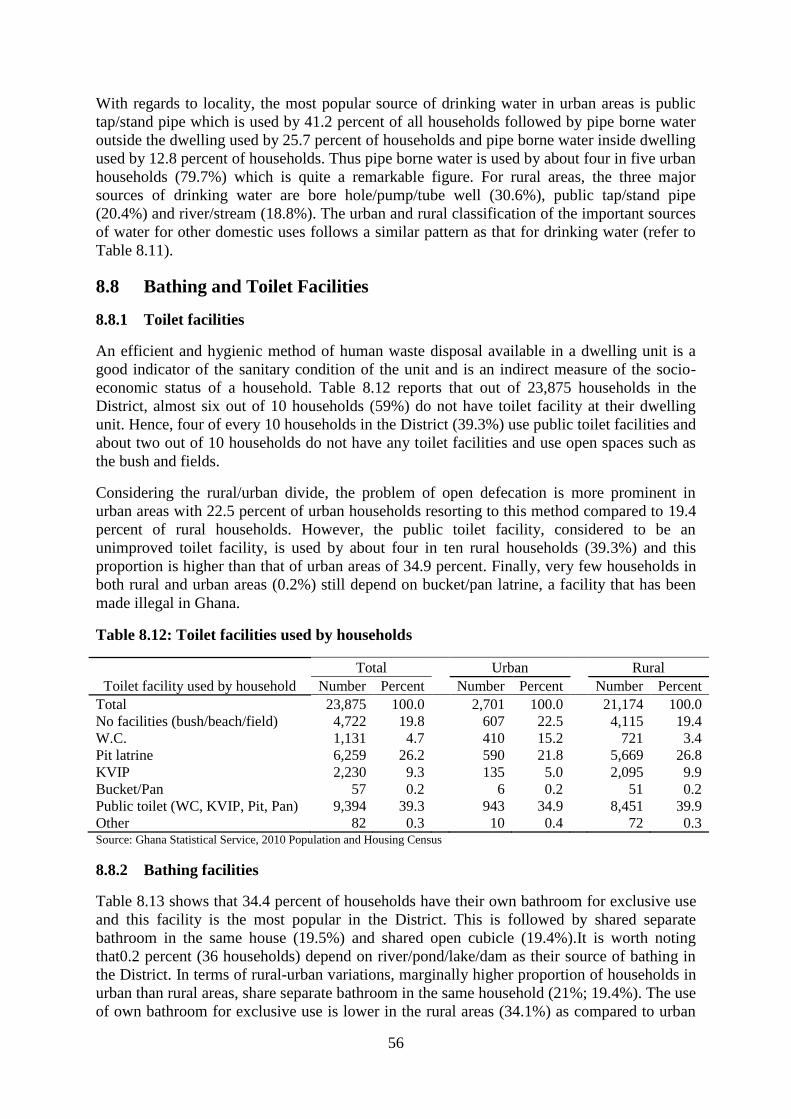
56
With regards to locality, the most popular source of drinking water in urban areas is public
tap/stand pipe which is used by 41.2 percent of all households followed by pipe borne water
outside the dwelling used by 25.7 percent of households and pipe borne water inside dwelling
used by 12.8 percent of households. Thus pipe borne water is used by about four in five urban
households (79.7%) which is quite a remarkable figure. For rural areas, the three major
sources of drinking water are bore hole/pump/tube well (30.6%), public tap/stand pipe
(20.4%) and river/stream (18.8%). The urban and rural classification of the important sources
of water for other domestic uses follows a similar pattern as that for drinking water (refer to
Table 8.11).
8.8 Bathing and Toilet Facilities
8.8.1 Toilet facilities
An efficient and hygienic method of human waste disposal available in a dwelling unit is a
good indicator of the sanitary condition of the unit and is an indirect measure of the socio-
economic status of a household. Table 8.12 reports that out of 23,875 households in the
District, almost six out of 10 households (59%) do not have toilet facility at their dwelling
unit. Hence, four of every 10 households in the District (39.3%) use public toilet facilities and
about two out of 10 households do not have any toilet facilities and use open spaces such as
the bush and fields.
Considering the rural/urban divide, the problem of open defecation is more prominent in
urban areas with 22.5 percent of urban households resorting to this method compared to 19.4
percent of rural households. However, the public toilet facility, considered to be an
unimproved toilet facility, is used by about four in ten rural households (39.3%) and this
proportion is higher than that of urban areas of 34.9 percent. Finally, very few households in
both rural and urban areas (0.2%) still depend on bucket/pan latrine, a facility that has been
made illegal in Ghana.
Table 8.12: Toilet facilities used by households
Toilet facility used by household
Total Urban Rural
Number Percent Number Percent Number Percent
Total 23,875 100.0
2,701 100.0
21,174 100.0
No facilities (bush/beach/field) 4,722 19.8
607 22.5
4,115 19.4
W.C. 1,131 4.7
410 15.2
721 3.4
Pit latrine 6,259 26.2
590 21.8
5,669 26.8
KVIP 2,230 9.3
135 5.0
2,095 9.9
Bucket/Pan 57 0.2
6 0.2
51 0.2
Public toilet (WC, KVIP, Pit, Pan) 9,394 39.3
943 34.9
8,451 39.9
Other 82 0.3 10 0.4 72 0.3 Source: Ghana Statistical Service, 2010 Population and Housing Census
8.8.2 Bathing facilities
Table 8.13 shows that 34.4 percent of households have their own bathroom for exclusive use
and this facility is the most popular in the District. This is followed by shared separate
bathroom in the same house (19.5%) and shared open cubicle (19.4%).It is worth noting
that0.2 percent (36 households) depend on river/pond/lake/dam as their source of bathing in
the District. In terms of rural-urban variations, marginally higher proportion of households in
urban than rural areas, share separate bathroom in the same household (21%; 19.4%). The use
of own bathroom for exclusive use is lower in the rural areas (34.1%) as compared to urban

57
localities of (37.4%), so it is with private open cubicle (16.1%) in rural areas, and (11.3%) in
urban localities.
Table 8.13: Bathing facilities used by household
Type of bathing facilities
Total Urban Rural
Number Percent Number Percent Number Percent
Total 23,875 100.0
2,701 100.0
21,174 100.0
Own bathroom for exclusive use 8,224 34.4
1,011 37.4
7,213 34.1
Shared separate bathroom in the same
house 4,666 19.5
566 21.0
4,100 19.4
Private open cubicle 3,705 15.5
305 11.3
3,400 16.1
Shared open cubicle 4,624 19.4
568 21.0
4,056 19.2
Public bath house 166 0.7
13 0.5
153 0.7
Bathroom in another house 805 3.4
49 1.8
756 3.6
Open space around house 1,541 6.5
163 6.0
1,378 6.5
River/Pond/Lake/Dam 36 0.2
19 0.7
17 0.1
Other 108 0.5 7 0.3 101 0.5 Source: Ghana Statistical Service, 2010 Population and Housing Census
8.9 Method of Waste Disposal
8.9.1 Solid waste disposal
Table 8.14 shows the main methods of solid waste disposal by type of locality in the District.
Out of the seven main disposal methods identified, public dump (open space) is the most
popular for disposing of solid wastes and this is used by 56.5 percent of households. This is
followed by disposal of waste by burning (19.7%).Households which dump waste
indiscriminately constitutes 10.7 percent of the total population. Collection of wastes is only
undertaken in about 1 in 28 households (3.6%). About two percent of households (1.8%) use
public dump (container) and 5.9 percent of household bury their wastes.
Almost four in ten households in urban areas (38.5%) public dump (open space) to dispose of
solid waste compared to about six in ten households (58.8%) in the rural areas. Thirty percent
of households in urban areas burn their solid waste compared to 18.4 percent in rural
localities. The proportion of households indiscriminately dumping their solid wastes is the
same in both urban and rural localities in the District (10.7%).
Table 8.14: Method of solid waste disposal by households
Method of rubbish disposal
by household
Total Urban Rural
Number Percent Number Percent Number Percent Total 23,875 100.0
2,701 100.0
21,174 100.0
Collected 858 3.6
125 4.6
733 3.5
Burned by household 4,711 19.7
810 30.0
3,901 18.4
Public dump (container) 436 1.8
50 1.9
386 1.8
Public dump (open space) 13,488 56.5
1,041 38.5
12,447 58.8
Dumped indiscriminately 2,559 10.7
288 10.7
2,271 10.7
Buried by household 1,405 5.9
300 11.1
1,105 5.2
Other 418 1.8 87 3.2 331 1.6 Source: Ghana Statistical Service, 2010 Population and Housing Census

58
8.9.2 Liquid waste disposal
The methods of disposal of liquid wastes in the District are shown in Table 8.15. Nearly half
of households (48.9%) dispose of their liquid waste by throwing onto their own compounds.
About three in 10 households (30.5%) throw their liquid waste onto the street/outside.
Disposal through sewage system is used by less than one percent of households. The ranking
importance of the sources of disposal of liquid wastes is similar in both rural and urban areas.
Table 8.15: Method of rubbish and liquid waste disposal by households
Method of rubbish disposal by
household
Total Urban Rural
Number Percent Number Percent Number Percent Total 23,875 100.0
2,701 100.0
21,174 100.0
Collected 858 3.6
125 4.6
733 3.5
Burned by household 4,711 19.7
810 30.0
3,901 18.4
Public dump (container) 436 1.8
50 1.9
386 1.8
Public dump (open space) 13,488 56.5
1,041 38.5
12,447 58.8
Dumped indiscriminately 2,559 10.7
288 10.7
2,271 10.7
Buried by household 1,405 5.9
300 11.1
1,105 5.2
Other 418 1.8 87 3.2 331 1.6 Source: Ghana Statistical Service, 2010 Population and Housing Census

59
CHAPTER NINE
SUMMARY OF FINDINGS AND POLICY
IMPLICATIONS
9.1 Introduction
The population census is the main source of information about the population and its
characteristics. The 2010 Population and Housing Census (PHC) collected data on the
demographic, social and economic characteristics, and housing conditions of the whole
population of Ho West District. Geographically, the census covered all localities, towns,
settlements within the district. This report is the first of its kind and provides analysis of the
2010 census data at the District level. The purpose is to provide valuable data for planners,
development partners, investors, researchers and policy makers to develop evidence-based
policy decisions and interventions required for advancing socio-economic development of the
District.
9.2 Summary of Findings
9.2.1 Population size, structure and density
The population of the district is 94,600 comprising of 45,361 males and 49,239 females. The
District has a sex ratio of 92.1, meaning for every 100 female population there are
approximately 92 males. The urban- rural split; shows that a smaller proportion of the
population in the District live in urban areas (10.9%) whiles the vast majority (89.1%) live in
rural localities.
9.2.2 Nationality
Nearly all residents in the district are Ghanaians (99%) categorized as follows: Ghanaians by
birth (92.1%), Ghanaian by dual nationality five percent, Ghanaians by naturalization two
percent, non-Ghanaians about one percent.
9.2.3 Fertility, mortality and migration
Fertility
Ho West District has a crude birth rate of 24.2 which means that for a female population of
one thousand in the District, there are about 24 births. The District has a general fertility rate
of 104.6 compared with the regional rate of 99.2. The District has a total fertility rate (TFR)
of 3.6 children per woman age 15-49; this means that a woman living in the District would
have, on average, about four children by the end of her reproductive period.
Mortality
The crude death rate for the District is 12.5 which means, there are about 13 deaths for one
thousand people in the District which is higher than the regional average of about nine deaths
for one thousand people

60
Migration
Out of a population of 94,600 in the District, 22,026 representing 24 percent are migrants.
Those born elsewhere in the Volta region are 16,298 constituting the majority (74%).
9.2.4 Household size, structure and composition
The census data indicate that there are 23,875 households. The average household size in the
District is 4.0 persons which is lower than the regional and national average household size of
4.3 and 4.5 respectively. Household heads (25.5%), children (36.8%), grandchildren (11.5%)
and other relatives (7.4%) constitute a significant proportion of household composition in the
District. The proportions of non-relatives, step-children, and adopted/foster children living in
the households are significantly low (1.3%, 1.2% and 0.4% respectively).
9.2.5 Marital status
The 2010 PHC data on marital status reveals that relatively higher proportion of females are
married (39.2%) than their male counterparts (36.9%). The proportion of the population
classified as widows is substantially higher for females (12.8%) than males (2.8%).Similarly,
a higher proportion of females (4.2%) than males (2.9%) are divorced. It is also evident that
(96.1%) of both males and females within the age cohort of 12-14 years have never married.
9.2.6 Religion
Christianity is the dominant religion in the District with Christians accounting for 90.7
percent of the population. Adherents of traditional religions constitute 3.8 percent of the
population and Muslims form about two percent of the people.
9.2.7 Literacy and education
About 85.9 percent of people eleven years and older in the District are literate while 14.1
percent are not literate. A greater proportion of males (91.5%) than females (80.9%) are
literate.
9.2.8 Economic activity
The proportion of the population 15 years and over which is economically active people is
69.5percentof which 95.9percentare employed and 4.1percent are unemployed. With regards
to male female activity status, the proportion of economically active male is 70.7percent of
which 96.5percent are employed and 3.5percent unemployed. The proportion of the female
population that is economically active is 68.6 percent with 95.4percent employed and
4.6percentunemployed.
9.2.9 Information Communication Technology
For the District as a whole, there are 24,316 persons 12 years and older with mobile phones
which constitute about 37percent of the population 12 years and older; 42.7percent of males
own mobile phone while 31.4percent of females own mobile phone.
The population using internet facilities are 1,882 constituting about three percent of the
population of the District. The proportion of males using internet facility in the District
(4.1%) is higher than females (1.8%).

61
Of the total number of households 23,875 in the District, only 466 households own desktop
or laptop computers constituting two percent of the household population. With regard to sex
of household head, ownership of desktop/laptop computers is higher for male-headed
households (2.6%) compared to female headed households (1.0%).
9.2.10 Disability
Out of a total district population of 94,600, 5,684 are persons with disability (PWD)
representing six percent of the population. Among PWDs, the commonest form of disability
is sight (47.1%), followed by physical (34.4%). Out of 5,562 PWDs who are three years and
older, 1,434 (25.8%) have never attended school compared to (12.5%) percent of the able-
bodied population.
9.2.11 Agricultural activities
Out of a total of 23,875 households in the District, 17,559 representing (73.5%) are engaged
in one form of agriculture or the other. For households in agriculture, the majority of these
people are into crop farming (95.2%) with less than one percent (0.06%) engaged in fish
farming. In terms of locality, 91.1 percent of all agricultural households are in rural areas
compared with nine percent in urban areas. This rural dominance of agriculture cuts across all
types of farming.
9.2.12 Housing conditions
There are 22,346 houses in the District. Out of this, 20,190 houses representing 90.4 percent
are located in the rural areas while 2,156 which constitute 9.6 percent are in the urban areas.
Average households per house is1.1 which is close to the regional figure of 1.2; however, it is
lower than the national figure of 1.6. Population per house which is 4.2 is lower than regional
and national figures of 5.2 and 7.1 respectively.
There are a total of 23,875 dwelling units in the district out of which 66.5 percent are owned
by household members and 21.0 percent owned by a relative who is not a household member.
About ten percent (9.9%) are owned by other private individuals. Government/ public
ownership of dwellings represents less than three percent of the dwelling units in the District.
Single room (one room) occupancy is relatively higher compared to other dwelling units in
the District. Close to fifty percent of households (46.9%) have only one sleeping room and
about 31 percent of households have two sleeping rooms. Among the five- member
households, 40.1 percent have only two sleeping rooms.
The major sources of water for both drinking and other domestic uses are bore-
hole/pump/tube well, public tap/stand pipe, river/stream, pipe borne water outside dwelling
and pipe borne water inside dwelling.
The three main sources of cooking fuel in the district in terms of the proportions of
households using the material are wood (73.8%), charcoal (16.6%) and gas (6.2%). These
three sources account for (96.6%) of the sources of cooking fuel.
Almost six out of 10 households in the District (59%) do not have toilet facility at their
dwelling unit. Four of every 10 households in the District (39.3%) use public toilet facilities
and about two out of 10 households do not have any toilet facilities and use open spaces such
as the bush/field.

62
The main methods of solid waste disposal methods in the District based on the proportions of
households using the method are public dump (open space) (56.5%), followed by burning by
household members (19.7%) and indiscriminate dumping (10.7%). Households dispose of
their liquid waste mainly through throwing them onto compound and onto the street/ outside.
9.3 Policy Implications
District Health Directorate should intensify health policies on family planning to help check
the rate of population growth especially among the teenagers. High incidence of mortality can
be curtailed through provision of quality health care services. For instance provision of at
least one District hospital within a strategic location could curb over dependence on the
regional hospital for health services. Posting of health personnel and provision of basic
hospital equipment and consumables to few existing health facilities will be in the right
direction.
Government interventions in the educational sector such as the School Feeding Programme,
the distribution of free school uniforms and exercise books to public schools should be
expanded in the District to reduce the rate of school dropouts. Vocational and technical
education should be introduced to provide the youth with employable skills.
A significant proportion of the employed in the District are engaged in skilled agriculture;
however, about 98percent of them are into subsistence production. These farmers need to be
encouraged to expand their production beyond subsistence needs so that they can raise more
income from selling their produce at markets.
There is the need to encourage the use of the internet especially by the youth possibly through
equipping the educational institutions with computer laboratories and the construction of
community information centres.
Schools, workplaces and public places should be made accessible for the disabled in the
District through provision of disability access ramps and their involvement in planning and
budgetary processes. Further, more attention need to be paid to disabled people with sight
impairment as this is a common disability that is increasing with the ageing of the population
of the District.
Close to half of households (46.9%) have only one sleeping room and this is a symptom of a
severe overcrowding problem that is associated with health problems. The government can
construct low cost housing estates to help ameliorate this situation.
Sanitation policies should be intensified and enforced by the District Assembly. More rubbish
containers should be provided by the District Assembly to the various communities to
promote refuse collection. The statutory planning committee and other concerned bodies
should insist on household places of convenience in building plans to reduce the dependency
on public toilet and eliminate open defecation.
LP Gas usage by households should be encouraged and promoted in the District for cooking
to curtail their dependency on the forest resources which mostly lead to deforestation.
The District Assembly should endeavour to extend pipe borne water to more communities
and also more houses should be connected to the national grid (electricity) which will help
improve on their standard of living.

63
REFERENCES
Hull, K (2009) Understanding the relationship between economic growth, employment and
Poverty
2010 Population and Housing Census, National Analytical Report.
2010 Population and Housing Census, Regional Analytical Report.
Ho Municipal 2010-2013 Medium Term Development Plan.

64
APPENDICES
Table A1: Highest level of school attended or attending
Total
Never
attended
Nursery
Kinder-
garten
Primary
JSS/JHS
Middle
SSS/
SHS
Secon
dary
Voc/
Tech/
Comm
Post
middle/
secondary
certificate
Post
secondary
diploma
Bachelor
degree
Post
graduate
(Cert.
Diploma
Masters
PHD etc)
Both Sexes
Total 87,246 11,649 2,233 5,203 23,548 17,092 15,631 5,508 1,317 1,626 1,466 1,315 560 98
No disability 81,684 10,215 2,198 5,094 22,370 16,448 14,053 5,354 1,197 1,503 1,352 1,262 543 95
With a disability 5,562 1,434 35 109 1,178 644 1,578 154 120 123 114 53 17 3
Sight 2,604 648 13 51 548 253 843 63 57 40 66 18 2 2
Hearing 1,095 304 3 45 269 141 251 27 18 19 9 6 1 2
Speech 972 258 9 55 263 156 157 25 10 24 8 4 3 -
Physical 1,891 520 9 45 416 214 505 35 33 42 46 15 11 -
Intellectual 1,033 294 1 47 270 148 184 30 27 13 10 4 5 -
Emotional 1,429 369 8 40 315 233 319 51 31 24 10 21 8 -
Other 413 108 4 11 100 48 90 15 12 6 10 7 2 -
Male
Total 41,628 3,740 1,100 2,717 11,119 8,207 7,558 3,092 916 922 811 922 440 84
No disability 39,119 3,350 1,080 2,665 10,599 7,913 6,743 2,994 820 846 731 872 425 81
With a disability 2,509 390 20 52 520 294 815 98 96 76 80 50 15 3
Sight 1,147 150 9 28 247 99 431 37 48 25 51 18 2 2
Hearing 482 90 1 21 132 58 122 16 18 8 7 6 1 2
Speech 502 108 4 26 150 83 80 15 8 13 8 4 3 -
Physical 820 138 3 20 179 94 257 23 25 29 30 12 10 -
Intellectual 469 101 - 21 136 64 85 22 22 4 6 4 4 -
Emotional 661 123 4 19 157 100 152 34 24 12 7 21 8 -
Other 183 26 2 7 38 29 41 13 8 2 8 7 2 -

65
Table A1: Highest level of school attended or attending (cont’d)
Total
Never
attended
Nursery
Kinder-
garten
Primary
JSS/JHS
Middle
SSS/
SHS
Secon
dary
Voc/
Tech/
Comm
Post
middle/
secondary
certificate
Post
secondary
diploma
Bachelor
degree
Post
graduate
(Cert.
Diploma
Masters
PHD etc)
Female
Total 45,618 7,909 1,133 2,486 12,429 8,885 8,073 2,416 401 704 655 393 120 14
No disability 42,565 6,865 1,118 2,429 11,771 8,535 7,310 2,360 377 657 621 390 118 14
With a disability 3,053 1,044 15 57 658 350 763 56 24 47 34 3 2 -
Sight 1,457 498 4 23 301 154 412 26 9 15 15 - - -
Hearing 613 214 2 24 137 83 129 11 - 11 2 - - -
Speech 470 150 5 29 113 73 77 10 2 11 - - - -
Physical 1,071 382 6 25 237 120 248 12 8 13 16 3 1 -
Intellectual 564 193 1 26 134 84 99 8 5 9 4 - 1 -
Emotional 768 246 4 21 158 133 167 17 7 12 3 - - -
Other 230 82 2 4 62 19 49 2 4 4 2 - - - Source: 2010 Population and Housing Census, Ghana Statistical Service

66
Table A2: Population by sex, number of households and houses in the 20
largest communities
S/No. Community Name Total Male Female House
holds Houses
1 Tsito 10,301 4,901 5,400 2,701 2,156
2 Kpedze (Awlime) 4,692 2,250 2,442 1,255 841
3 Anyirawase 3,774 1,825 1,949 969 747
4 Dededo 3,360 1,570 1,790 728 715
5 Dzolo Gbogame 2,833 1,347 1,486 685 663
6 Abuatia - Kloe 2,741 1,311 1,430 650 560
7 Abuatia - Teti 2,741 1,292 1,449 804 708
8 Avenui 2,163 972 1,191 509 516
9 Vane 1,949 973 976 534 526
10 Ashanty - Kpoeta 1,829 909 920 482 483
11 Tsibu 1,789 844 945 461 400
12 Abuatia - Kpota 1,676 861 815 424 392
13 Abuatia - Kissiflui 1,667 806 861 399 336
14 Anfoeta Tsebi 1,665 778 887 463 450
15 Saviefe - Agorkpo 1,576 715 861 324 285
16 Tsawoenu 1,562 726 836 359 316
17 Amedzofe 1,561 778 783 427 477
18 Saviefe - Gbogame 1,463 717 746 352 276
19 Dzolo - Kpuita 1,448 703 745 335 346
20 Dzogbefeme 1,292 630 662 264 278 Source: Ghana Statistical Service, 2010 Population and Housing Census
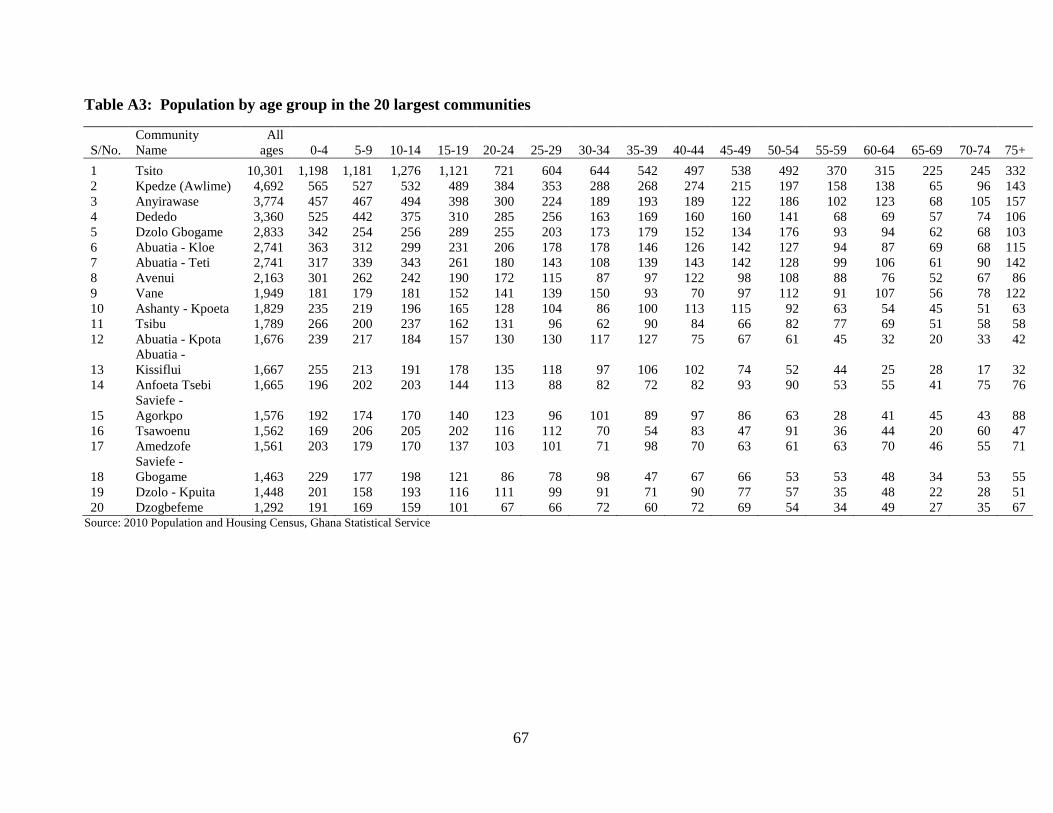
67
Table A3: Population by age group in the 20 largest communities
S/No.
Community
Name
All
ages 0-4 5-9 10-14 15-19 20-24 25-29 30-34 35-39 40-44 45-49 50-54 55-59 60-64 65-69 70-74 75+
1 Tsito 10,301 1,198 1,181 1,276 1,121 721 604 644 542 497 538 492 370 315 225 245 332
2 Kpedze (Awlime) 4,692 565 527 532 489 384 353 288 268 274 215 197 158 138 65 96 143
3 Anyirawase 3,774 457 467 494 398 300 224 189 193 189 122 186 102 123 68 105 157
4 Dededo 3,360 525 442 375 310 285 256 163 169 160 160 141 68 69 57 74 106
5 Dzolo Gbogame 2,833 342 254 256 289 255 203 173 179 152 134 176 93 94 62 68 103
6 Abuatia - Kloe 2,741 363 312 299 231 206 178 178 146 126 142 127 94 87 69 68 115
7 Abuatia - Teti 2,741 317 339 343 261 180 143 108 139 143 142 128 99 106 61 90 142
8 Avenui 2,163 301 262 242 190 172 115 87 97 122 98 108 88 76 52 67 86
9 Vane 1,949 181 179 181 152 141 139 150 93 70 97 112 91 107 56 78 122
10 Ashanty - Kpoeta 1,829 235 219 196 165 128 104 86 100 113 115 92 63 54 45 51 63
11 Tsibu 1,789 266 200 237 162 131 96 62 90 84 66 82 77 69 51 58 58
12 Abuatia - Kpota 1,676 239 217 184 157 130 130 117 127 75 67 61 45 32 20 33 42
13
Abuatia -
Kissiflui 1,667 255 213 191 178 135 118 97 106 102 74 52 44 25 28 17 32
14 Anfoeta Tsebi 1,665 196 202 203 144 113 88 82 72 82 93 90 53 55 41 75 76
15
Saviefe -
Agorkpo 1,576 192 174 170 140 123 96 101 89 97 86 63 28 41 45 43 88
16 Tsawoenu 1,562 169 206 205 202 116 112 70 54 83 47 91 36 44 20 60 47
17 Amedzofe 1,561 203 179 170 137 103 101 71 98 70 63 61 63 70 46 55 71
18
Saviefe -
Gbogame 1,463 229 177 198 121 86 78 98 47 67 66 53 53 48 34 53 55
19 Dzolo - Kpuita 1,448 201 158 193 116 111 99 91 71 90 77 57 35 48 22 28 51
20 Dzogbefeme 1,292 191 169 159 101 67 66 72 60 72 69 54 34 49 27 35 67 Source: 2010 Population and Housing Census, Ghana Statistical Service

68
LIST OF CONTRIBUTORS
Project Secretariat
Dr. Philomena Nyarko, Government Statistician
Mr. Baah Wadieh, Deputy Government Statistician
Mr. David Yenukwa Kombat, Acting Census Coordinator
Mr. Sylvester Gyamfi, DISDAP Project Coordinator
Mrs. Abena A. Osei-Akoto, Data Processing
Mr. Rochester Appiah Kubi Boateng, Data Processing
Mrs. Jacqueline Anum, Data Processing
Mrs. Samilia Mintah, Data Processing
Mr. Yaw Misefa, Data Processing
Mr. Ernest Enyan, Data Processing
Mr. Chris Amewu, Regional Statistician
Ms. Hanna Frempong Konadu, Formatting/Typesetting
Mrs. Hellen Ayitevie, Formatting/Typesetting
Mrs. Victoria Sottie, Formatting/Typesetting
Writers
Mr. Dickson Kwaku Agbenyah
Mr. Emmanuel Doh
Consultant
Dr. Augustine Ankomah
Editor/ Reviewers
Prof. Kwabena Asomanin Anaman
Mr. Emmanuel George Ossei