HIV Infection, Antiretroviral Therapy, and CD4 + Cell Count Distributions in African Populations
9
1450 • JID 2006:194 (15 November) • Williams et al. MAJOR ARTICLE HIV Infection, Antiretroviral Therapy, and CD4 + Cell Count Distributions in African Populations Brian G. Williams, 1 Eline L. Korenromp, 3,5 Eleanor Gouws, 4 George P. Schmid, 2 Bertran Auvert, 6,7,8 and Christopher Dye 1 1 Stop TB Department and 2 HIV/AIDS Department, World Health Organization, 3 The Global Fund to Fight AIDS, Tuberculosis and Malaria, and 4 Policy, Evidence and Partnerships Department, Joint United Nations Programme on HIV/AIDS, Geneva, Switzerland; 5 Department of Public Health, Erasmus MC, University Medical Centre Rotterdam, Rotterdam, The Netherlands; 6 INSERM U687 and 7 University of Versailles–Saint Quentin, Faculte ´ de Me ´ decine Paris-Ile-de-France-Ouest, Saint Maurice, and 8 AP-HP, Ho ˆpital Ambroise Pare, Boulogne, France Background. The variability in CD4 + cell counts within and among human immunodeficiency virus (HIV)– positive and –negative African populations has not been explained but has important implications for understanding the incidence of HIV-related opportunistic infections, especially tuberculosis, in both individuals and populations. Methods. In HIV-negative African adults, CD4 + cell counts vary within populations (interquartile ranges [IQRs], 169–603 cells/mL) and among populations (means vary from 699 to 1244 cells/mL), with similarly wide variations in HIV-positive adults. We developed dynamic mathematical models to predict the distribution of CD4 + cell counts in HIV-positive adults using the distribution in HIV-negative adults. Results. Under the assumption that survival is independent of the CD4 + cell count before seroconversion, we fitted the observed distributions in HIV-positive adults. At a CD4 + cell count of 200 cells/mL, the median life expectancy of HIV-positive Zambians (4.0 years) was predicted to be 1.7 times that of HIV-positive South Africans (2.3 years). Conclusions. The model provides a way to estimate the changing distribution of CD4 + cell counts and, hence, the changing incidence of HIV-related opportunistic infections as the epidemic matures. This could substantially improve the planning of health services, including the need and demand for antiretroviral therapy. Better data are needed to test the model and its assumptions more rigorously and to fully understand the variability in CD4 + cell counts within and among populations. CD4 + cells orchestrate the immune response to attack by HIV, but HIV invades CD4 + cells and uses them to replicate itself. Soon after infection with HIV, CD4 + cells counts decrease by approximately one-quarter and then decrease slowly thereafter [1]. When the CD4 + cell count reaches ∼350 cells/mL, HIV-related opportunistic infections become evident; at 200 cells/mL, the person Received 26 March 2006; accepted 5 June 2006; electronically published 3 October 2006. Financial support: Erasmus MC, University Medical Centre Rotterdam (Van Rijn fellowship to E.L.K.). Potential conflicts of interest: none reported. This article is the work of the authors and is not a policy statement of the World Health Organization, the Joint United Nations Programme on HIV/AIDS, or The Global Fund to Fight AIDS, TB and Malaria. Reprints or correspondence: Dr. Brian G. Williams, World Health Organization, WHO/CDS/HTM/STB/TME, 20 Ave. Appia, Geneva 1211 CH 1211, Switzerland ([email protected]). The Journal of Infectious Diseases 2006; 194:1450–8 2006 by the Infectious Diseases Society of America. All rights reserved. 0022-1899/2006/19410-0015$15.00 is classified as having AIDS regardless of the appearance of other opportunistic infections; and at ∼50 cells/mL, patients die. CD4 + cell counts have been studied as markers of the progression of HIV infection [2–4], as a measure of the relative risk of developing opportunis- tic infections [5], to estimate the impact of HIV and the use of antiretroviral drugs on the epidemiological progression of tuberculosis (TB) [1], and to estimate the proportion of malaria that is attributable to HIV in sub-Saharan Africa [6]. The World Health Organization (WHO) recommends antiretroviral therapy (ART) for people in WHO clinical disease stage IV, regardless of CD4 + cell count, those in stage III with CD4 + cell counts !350 cells/mL, and those with CD4 + cell counts !200 cells/mL, regardless of clinical stage [7]. CD4 + cells counts in HIV-negative people are influ- enced by genetic, immunological, physiological, and behavioral factors [8–14], and they vary widely both within and among populations. In the present article, by guest on May 30, 2016 http://jid.oxfordjournals.org/ Downloaded from
-
Upload
independent -
Category
Documents
-
view
0 -
download
0
Transcript of HIV Infection, Antiretroviral Therapy, and CD4 + Cell Count Distributions in African Populations
1450 • JID 2006:194 (15 November) • Williams et al.
M A J O R A R T I C L E
HIV Infection, Antiretroviral Therapy, and CD4+
Cell Count Distributions in African Populations
Brian G. Williams,1 Eline L. Korenromp,3,5 Eleanor Gouws,4 George P. Schmid,2 Bertran Auvert,6,7,8
and Christopher Dye1
1Stop TB Department and 2HIV/AIDS Department, World Health Organization, 3The Global Fund to Fight AIDS, Tuberculosis and Malaria,and 4Policy, Evidence and Partnerships Department, Joint United Nations Programme on HIV/AIDS, Geneva, Switzerland; 5Department of PublicHealth, Erasmus MC, University Medical Centre Rotterdam, Rotterdam, The Netherlands; 6INSERM U687 and 7University of Versailles–SaintQuentin, Faculte de Medecine Paris-Ile-de-France-Ouest, Saint Maurice, and 8AP-HP, Hopital Ambroise Pare, Boulogne, France
Background. The variability in CD4+ cell counts within and among human immunodeficiency virus (HIV)–positive and –negative African populations has not been explained but has important implications for understandingthe incidence of HIV-related opportunistic infections, especially tuberculosis, in both individuals and populations.
Methods. In HIV-negative African adults, CD4+ cell counts vary within populations (interquartile ranges[IQRs], 169–603 cells/mL) and among populations (means vary from 699 to 1244 cells/mL), with similarly widevariations in HIV-positive adults. We developed dynamic mathematical models to predict the distribution of CD4+
cell counts in HIV-positive adults using the distribution in HIV-negative adults.Results. Under the assumption that survival is independent of the CD4+ cell count before seroconversion, we
fitted the observed distributions in HIV-positive adults. At a CD4+ cell count of 200 cells/mL, the median lifeexpectancy of HIV-positive Zambians (4.0 years) was predicted to be 1.7 times that of HIV-positive South Africans(2.3 years).
Conclusions. The model provides a way to estimate the changing distribution of CD4+ cell counts and, hence,the changing incidence of HIV-related opportunistic infections as the epidemic matures. This could substantiallyimprove the planning of health services, including the need and demand for antiretroviral therapy. Better data areneeded to test the model and its assumptions more rigorously and to fully understand the variability in CD4+ cellcounts within and among populations.
CD4+ cells orchestrate the immune response to attack
by HIV, but HIV invades CD4+ cells and uses them to
replicate itself. Soon after infection with HIV, CD4+ cells
counts decrease by approximately one-quarter and then
decrease slowly thereafter [1]. When the CD4+ cell
count reaches ∼350 cells/mL, HIV-related opportunistic
infections become evident; at 200 cells/mL, the person
Received 26 March 2006; accepted 5 June 2006; electronically published 3October 2006.
Financial support: Erasmus MC, University Medical Centre Rotterdam (Van Rijnfellowship to E.L.K.).
Potential conflicts of interest: none reported.This article is the work of the authors and is not a policy statement of the
World Health Organization, the Joint United Nations Programme on HIV/AIDS, orThe Global Fund to Fight AIDS, TB and Malaria.
Reprints or correspondence: Dr. Brian G. Williams, World Health Organization,WHO/CDS/HTM/STB/TME, 20 Ave. Appia, Geneva 1211 CH 1211, Switzerland([email protected]).
The Journal of Infectious Diseases 2006; 194:1450–8� 2006 by the Infectious Diseases Society of America. All rights reserved.0022-1899/2006/19410-0015$15.00
is classified as having AIDS regardless of the appearance
of other opportunistic infections; and at ∼50 cells/mL,
patients die. CD4+ cell counts have been studied as
markers of the progression of HIV infection [2–4], as
a measure of the relative risk of developing opportunis-
tic infections [5], to estimate the impact of HIV and
the use of antiretroviral drugs on the epidemiological
progression of tuberculosis (TB) [1], and to estimate the
proportion of malaria that is attributable to HIV in
sub-Saharan Africa [6]. The World Health Organization
(WHO) recommends antiretroviral therapy (ART) for
people in WHO clinical disease stage IV, regardless of
CD4+ cell count, those in stage III with CD4+ cell counts
!350 cells/mL, and those with CD4+ cell counts !200
cells/mL, regardless of clinical stage [7].
CD4+ cells counts in HIV-negative people are influ-
enced by genetic, immunological, physiological, and
behavioral factors [8–14], and they vary widely both
within and among populations. In the present article,
by guest on May 30, 2016
http://jid.oxfordjournals.org/D
ownloaded from
HIV, ART, and CD4+ Distributions in Africa • JID 2006:194 (15 November) • 1451
we consider the implications of this variation on the distri-
bution of CD4+ cells within and among populations of HIV-
positive people as HIV epidemics mature. We have assembled
data on CD4+ cell count distributions and examined variability
among and within HIV-negative and -positive populations. We
have evaluated competing models of CD4+ cell count decrease
after infection with HIV and have shown that the distribution
of CD4+ cell counts in HIV-positive adults in Africa can be
predicted using the distribution in HIV-negative adults, time
trends in HIV prevalence, and the survival distribution after
infection, assuming only that survival is independent of the
preinfection CD4+ cell count. We have used the best-fitting
model to investigate the survival of HIV-positive people in
Zambia and South Africa in relation to their CD4+ cell counts.
METHODS
To account for the effect of the maturity of the HIV epidemic
on CD4+ cell counts in people infected with HIV, we used data
on time trends in HIV prevalence and on survival after sero-
conversion to estimate time trends in HIV incidence and mor-
tality (appendix, eqq. [1]–[3]). Knowing how many people were
infected during each calendar year and the survival distribution,
we calculated the distribution of time since infection at any
given time (appendix, eqq. [4] and [5]). From the distribution
of time since infection, we estimated the distribution of CD4+
cell counts (scaled as in the appendix, eq. [6]), which depended
on assumptions that we made about the decrease in CD4+ cell
count with time since infection (appendix, eq. [7]), and then
the distribution of the scaled CD4+ cell counts as a function
of time since infection (appendix, eq. [8]) for a given prein-
fection CD4+ cell count. Allowing for variation in the prein-
fection CD4+ cell count gave the actual distribution of CD4+
counts as a function of the time since infection (appendix, eq.
[9]). Finally, we were able to calculate the distribution of CD4+
cell counts at any given time (appendix, eq. [10]).
In applying this model, we assumed that survival is inde-
pendent of preinfection CD4+ cell counts, but we also consid-
ered a competing model in which survival depended entirely
on the preinfection CD4+ cell count. In both models, we as-
sumed that CD4+ cell counts decreased linearly with time after
the initial rapid decrease between infection and seroconversion.
We used data from population surveys in Africa about CD4+
distributions in HIV-positive and -negative people, data about
HIV prevalence from studies of women attending antenatal
clinics, and data about the pattern of decrease in CD4+ cell
counts from infection to death in HIV-positive people from
clinical cohorts.
Survey data. Population surveys of CD4+ cell count dis-
tributions among HIV-negative and -positive adults in Africa
were identified in PubMed, using the keywords “CD4,” “HIV,”
“survey,” “Africa,” and “adult.” References in relevant pub-
lications were checked to identify additional studies. Only stud-
ies of adults �15 years old were included, because CD4+ cell
counts are higher in children than in adults and are higher in
young children than in older children [8], so lower age cutoffs
would have made it more difficult to compare studies.
A study in Orange Farm, Gauteng, South Africa [15], gave
individual CD4+ cell counts and a study in Lusaka, Zambia
[16], gave the distribution of CD4+ cell counts in intervals of
100 cells/mL [16]. These studies were used to validate the model.
Of the remaining studies, most reported only median and in-
terquartile ranges (IQRs) for CD4+ cell counts, although some
reported mean values and certain deciles (table 1). To estimate
the proportion of people in each CD4+ cell count category, we
fitted the cumulative distributions to log-normal functions [25].
Both automated [8, 9, 15–17, 19, 21–23] and manual [20, 26]
techniques were used to measure CD4+ cell counts, and this may
have affected the measurements [26]. However, the 2 methods
used in most of the studies on which we report (FACScan and
FACScount) gave consistent results [27, 28], and laboratory
variations were generally much smaller than variations due to
physiological factors within and among individuals [14]. Both
the Zambian [16] and South African [15] studies used the
FACScount technique, which is a single-platform direct-mea-
surement technique. Measurement techniques were unlikely to
account for the differences in the CD4+ cell count distributions
in Zambia and South Africa or for much of the variation within
each study population.
Pattern of CD4+ cell count decrease. Several studies sup-
ported the assumption that survival is independent of the CD4+
cell count before HIV seroconversion. In an Italian cohort, the
CD4+ cell count soon after seroconversion was not associated
with progression to AIDS [29]. In a multicenter study, HIV-
positive people who progressed quickly, slowly, or not at all to
AIDS over the course of 2–6 years had similar CD4+ cell counts
at seroconversion [30, 31]. In a Swiss cohort, the rate of de-
crease was directly proportional to the initial CD4+ cell count
[32], as was predicted by our model. The results of a meta-
analysis suggested that the rate of decrease was higher at CD4+
cell counts !200 cells/mL, but the overall trend with time was
close to linear [1].
CD4+ cell counts decrease significantly immediately after in-
fection [2, 33–35]. In men in the United States, CD4+ cell counts
decreased by 203 cells/mL (24% of the preinfection level) [2], 221
cells/mL (22%) [35], and 1350 cells/mL (34%) within 6 months
of seroconversion [34]. In a Swiss cohort, the median CD4+ cell
count at a median 5.5 months after the estimated time of se-
roconversion was 546 cells/mL [32], which was considerably lower
than the typical value in HIV-uninfected Swiss adults [36]. In
Zambia, the CD4+ cell count in HIV-seropositive individuals at
by guest on May 30, 2016
http://jid.oxfordjournals.org/D
ownloaded from
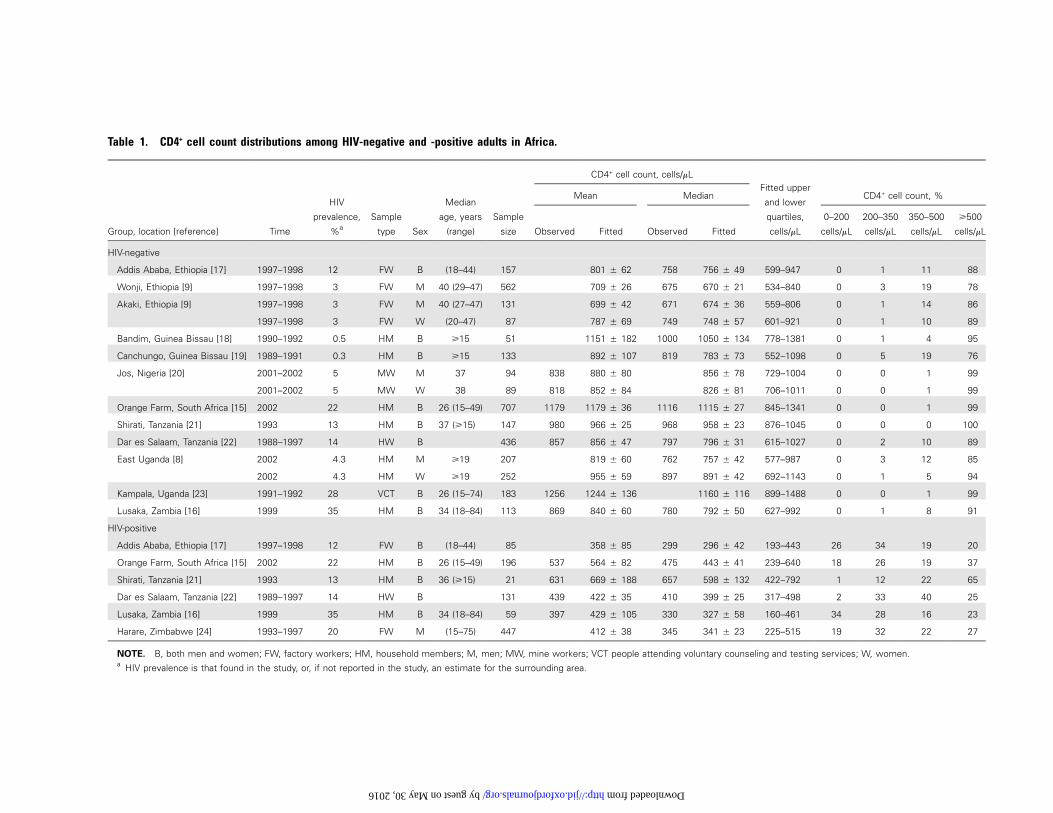
Table 1. CD4+ cell count distributions among HIV-negative and -positive adults in Africa.
Group, location [reference] Time
HIV
prevalence,
%a
Sample
type Sex
Median
age, years
(range)
Sample
size
CD4+ cell count, cells/mLFitted upper
and lower
quartiles,
cells/mL
Mean Median CD4+ cell count, %
Observed Fitted Observed Fitted
0–200
cells/mL
200–350
cells/mL
350–500
cells/mL
�500
cells/mL
HIV-negative
Addis Ababa, Ethiopia [17] 1997–1998 12 FW B (18–44) 157 801 � 62 758 756 � 49 599–947 0 1 11 88
Wonji, Ethiopia [9] 1997–1998 3 FW M 40 (29–47) 562 709 � 26 675 670 � 21 534–840 0 3 19 78
Akaki, Ethiopia [9] 1997–1998 3 FW M 40 (27–47) 131 699 � 42 671 674 � 36 559–806 0 1 14 86
1997–1998 3 FW W (20–47) 87 787 � 69 749 748 � 57 601–921 0 1 10 89
Bandim, Guinea Bissau [18] 1990–1992 0.5 HM B �15 51 1151 � 182 1000 1050 � 134 778–1381 0 1 4 95
Canchungo, Guinea Bissau [19] 1989–1991 0.3 HM B �15 133 892 � 107 819 783 � 73 552–1098 0 5 19 76
Jos, Nigeria [20] 2001–2002 5 MW M 37 94 838 880 � 80 856 � 78 729–1004 0 0 1 99
2001–2002 5 MW W 38 89 818 852 � 84 826 � 81 706–1011 0 0 1 99
Orange Farm, South Africa [15] 2002 22 HM B 26 (15–49) 707 1179 1179 � 36 1116 1115 � 27 845–1341 0 0 1 99
Shirati, Tanzania [21] 1993 13 HM B 37 (�15) 147 980 966 � 25 968 958 � 23 876–1045 0 0 0 100
Dar es Salaam, Tanzania [22] 1988–1997 14 HW B 436 857 856 � 47 797 796 � 31 615–1027 0 2 10 89
East Uganda [8] 2002 4.3 HM M �19 207 819 � 60 762 757 � 42 577–987 0 3 12 85
2002 4.3 HM W �19 252 955 � 59 897 891 � 42 692–1143 0 1 5 94
Kampala, Uganda [23] 1991–1992 28 VCT B 26 (15–74) 183 1256 1244 � 136 1160 � 116 899–1488 0 0 1 99
Lusaka, Zambia [16] 1999 35 HM B 34 (18–84) 113 869 840 � 60 780 792 � 50 627–992 0 1 8 91
HIV-positive
Addis Ababa, Ethiopia [17] 1997–1998 12 FW B (18–44) 85 358 � 85 299 296 � 42 193–443 26 34 19 20
Orange Farm, South Africa [15] 2002 22 HM B 26 (15–49) 196 537 564 � 82 475 443 � 41 239–640 18 26 19 37
Shirati, Tanzania [21] 1993 13 HM B 36 (�15) 21 631 669 � 188 657 598 � 132 422–792 1 12 22 65
Dar es Salaam, Tanzania [22] 1989–1997 14 HW B 131 439 422 � 35 410 399 � 25 317–498 2 33 40 25
Lusaka, Zambia [16] 1999 35 HM B 34 (18–84) 59 397 429 � 105 330 327 � 58 160–461 34 28 16 23
Harare, Zimbabwe [24] 1993–1997 20 FW M (15–75) 447 412 � 38 345 341 � 23 225–515 19 32 22 27
NOTE. B, both men and women; FW, factory workers; HM, household members; M, men; MW, mine workers; VCT people attending voluntary counseling and testing services; W, women.a HIV prevalence is that found in the study, or, if not reported in the study, an estimate for the surrounding area.
by guest on May 30, 2016 http://jid.oxfordjournals.org/ Downloaded from
HIV, ART, and CD4+ Distributions in Africa • JID 2006:194 (15 November) • 1453
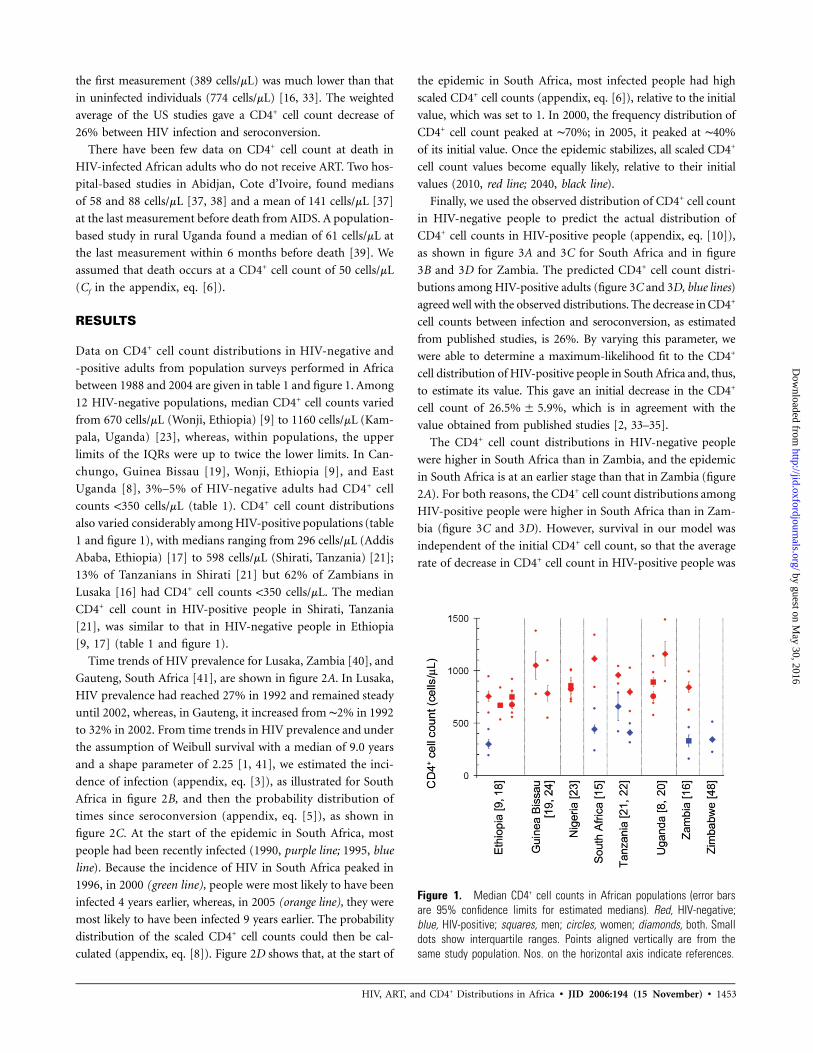
Figure 1. Median CD4+ cell counts in African populations (error barsare 95% confidence limits for estimated medians). Red, HIV-negative;blue, HIV-positive; squares, men; circles, women; diamonds, both. Smalldots show interquartile ranges. Points aligned vertically are from thesame study population. Nos. on the horizontal axis indicate references.
the first measurement (389 cells/mL) was much lower than that
in uninfected individuals (774 cells/mL) [16, 33]. The weighted
average of the US studies gave a CD4+ cell count decrease of
26% between HIV infection and seroconversion.
There have been few data on CD4+ cell count at death in
HIV-infected African adults who do not receive ART. Two hos-
pital-based studies in Abidjan, Cote d’Ivoire, found medians
of 58 and 88 cells/mL [37, 38] and a mean of 141 cells/mL [37]
at the last measurement before death from AIDS. A population-
based study in rural Uganda found a median of 61 cells/mL at
the last measurement within 6 months before death [39]. We
assumed that death occurs at a CD4+ cell count of 50 cells/mL
(Cf in the appendix, eq. [6]).
RESULTS
Data on CD4+ cell count distributions in HIV-negative and
-positive adults from population surveys performed in Africa
between 1988 and 2004 are given in table 1 and figure 1. Among
12 HIV-negative populations, median CD4+ cell counts varied
from 670 cells/mL (Wonji, Ethiopia) [9] to 1160 cells/mL (Kam-
pala, Uganda) [23], whereas, within populations, the upper
limits of the IQRs were up to twice the lower limits. In Can-
chungo, Guinea Bissau [19], Wonji, Ethiopia [9], and East
Uganda [8], 3%–5% of HIV-negative adults had CD4+ cell
counts !350 cells/mL (table 1). CD4+ cell count distributions
also varied considerably among HIV-positive populations (table
1 and figure 1), with medians ranging from 296 cells/mL (Addis
Ababa, Ethiopia) [17] to 598 cells/mL (Shirati, Tanzania) [21];
13% of Tanzanians in Shirati [21] but 62% of Zambians in
Lusaka [16] had CD4+ cell counts !350 cells/mL. The median
CD4+ cell count in HIV-positive people in Shirati, Tanzania
[21], was similar to that in HIV-negative people in Ethiopia
[9, 17] (table 1 and figure 1).
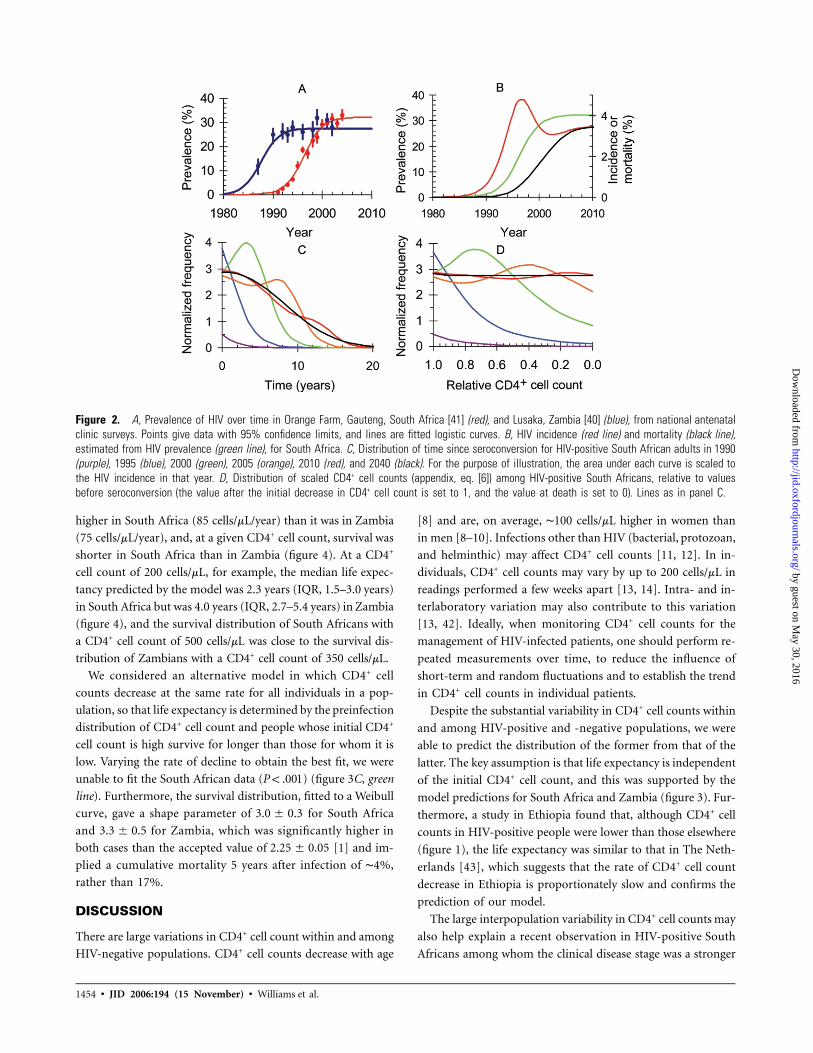
Time trends of HIV prevalence for Lusaka, Zambia [40], and
Gauteng, South Africa [41], are shown in figure 2A. In Lusaka,
HIV prevalence had reached 27% in 1992 and remained steady
until 2002, whereas, in Gauteng, it increased from ∼2% in 1992
to 32% in 2002. From time trends in HIV prevalence and under
the assumption of Weibull survival with a median of 9.0 years
and a shape parameter of 2.25 [1, 41], we estimated the inci-
dence of infection (appendix, eq. [3]), as illustrated for South
Africa in figure 2B, and then the probability distribution of
times since seroconversion (appendix, eq. [5]), as shown in
figure 2C. At the start of the epidemic in South Africa, most
people had been recently infected (1990, purple line; 1995, blue
line). Because the incidence of HIV in South Africa peaked in
1996, in 2000 (green line), people were most likely to have been
infected 4 years earlier, whereas, in 2005 (orange line), they were
most likely to have been infected 9 years earlier. The probability
distribution of the scaled CD4+ cell counts could then be cal-
culated (appendix, eq. [8]). Figure 2D shows that, at the start of
the epidemic in South Africa, most infected people had high
scaled CD4+ cell counts (appendix, eq. [6]), relative to the initial
value, which was set to 1. In 2000, the frequency distribution of
CD4+ cell count peaked at ∼70%; in 2005, it peaked at ∼40%
of its initial value. Once the epidemic stabilizes, all scaled CD4+
cell count values become equally likely, relative to their initial
values (2010, red line; 2040, black line).
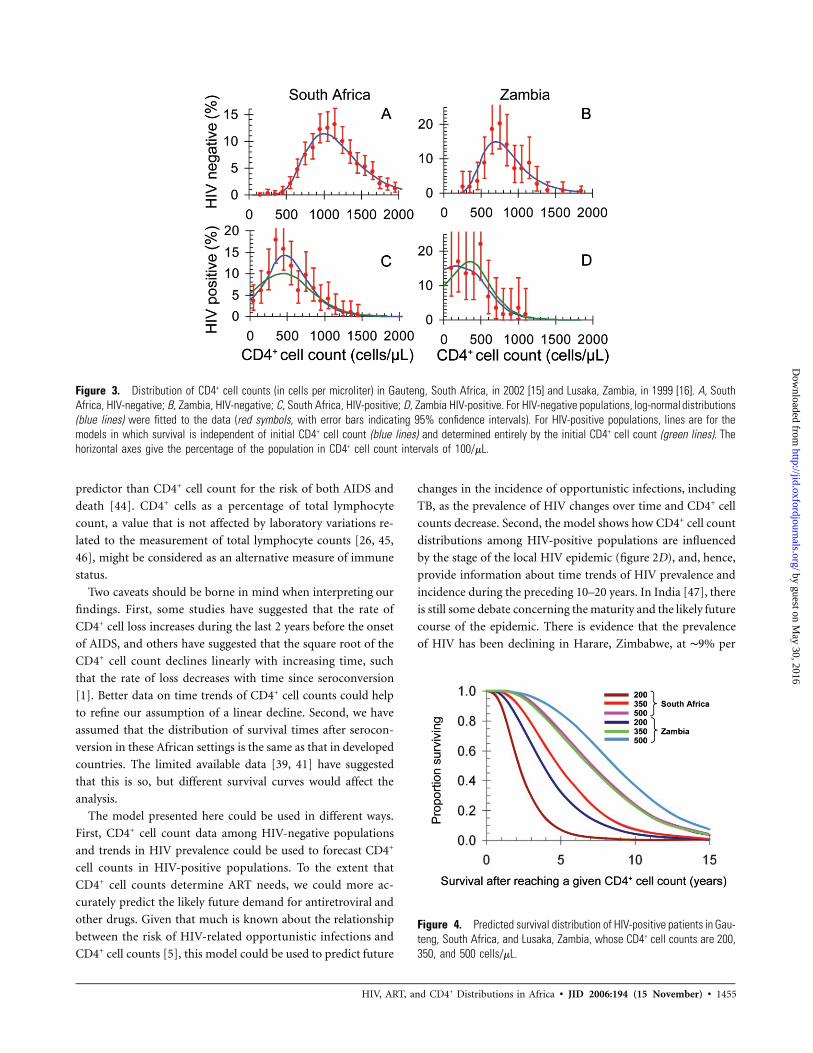
Finally, we used the observed distribution of CD4+ cell count
in HIV-negative people to predict the actual distribution of
CD4+ cell counts in HIV-positive people (appendix, eq. [10]),
as shown in figure 3A and 3C for South Africa and in figure
3B and 3D for Zambia. The predicted CD4+ cell count distri-
butions among HIV-positive adults (figure 3C and 3D, blue lines)
agreed well with the observed distributions. The decrease in CD4+
cell counts between infection and seroconversion, as estimated
from published studies, is 26%. By varying this parameter, we
were able to determine a maximum-likelihood fit to the CD4+
cell distribution of HIV-positive people in South Africa and, thus,
to estimate its value. This gave an initial decrease in the CD4+
cell count of , which is in agreement with the26.5% � 5.9%
value obtained from published studies [2, 33–35].
The CD4+ cell count distributions in HIV-negative people
were higher in South Africa than in Zambia, and the epidemic
in South Africa is at an earlier stage than that in Zambia (figure
2A). For both reasons, the CD4+ cell count distributions among
HIV-positive people were higher in South Africa than in Zam-
bia (figure 3C and 3D). However, survival in our model was
independent of the initial CD4+ cell count, so that the average
rate of decrease in CD4+ cell count in HIV-positive people was by guest on May 30, 2016
http://jid.oxfordjournals.org/D
ownloaded from
1454 • JID 2006:194 (15 November) • Williams et al.
Figure 2. A, Prevalence of HIV over time in Orange Farm, Gauteng, South Africa [41] (red), and Lusaka, Zambia [40] (blue), from national antenatalclinic surveys. Points give data with 95% confidence limits, and lines are fitted logistic curves. B, HIV incidence (red line) and mortality (black line),estimated from HIV prevalence (green line), for South Africa. C, Distribution of time since seroconversion for HIV-positive South African adults in 1990(purple), 1995 (blue), 2000 (green), 2005 (orange), 2010 (red), and 2040 (black). For the purpose of illustration, the area under each curve is scaled tothe HIV incidence in that year. D, Distribution of scaled CD4+ cell counts (appendix, eq. [6]) among HIV-positive South Africans, relative to valuesbefore seroconversion (the value after the initial decrease in CD4+ cell count is set to 1, and the value at death is set to 0). Lines as in panel C.
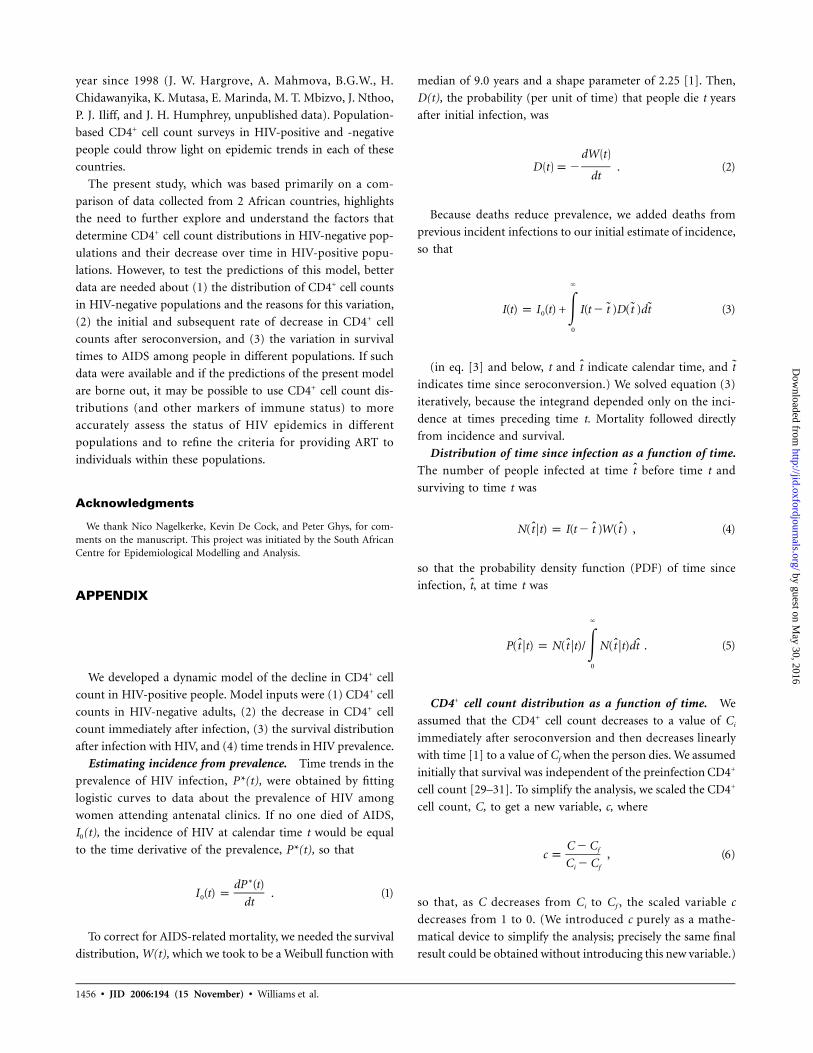
higher in South Africa (85 cells/mL/year) than it was in Zambia
(75 cells/mL/year), and, at a given CD4+ cell count, survival was
shorter in South Africa than in Zambia (figure 4). At a CD4+
cell count of 200 cells/mL, for example, the median life expec-
tancy predicted by the model was 2.3 years (IQR, 1.5–3.0 years)
in South Africa but was 4.0 years (IQR, 2.7–5.4 years) in Zambia
(figure 4), and the survival distribution of South Africans with
a CD4+ cell count of 500 cells/mL was close to the survival dis-
tribution of Zambians with a CD4+ cell count of 350 cells/mL.
We considered an alternative model in which CD4+ cell
counts decrease at the same rate for all individuals in a pop-
ulation, so that life expectancy is determined by the preinfection
distribution of CD4+ cell count and people whose initial CD4+
cell count is high survive for longer than those for whom it is
low. Varying the rate of decline to obtain the best fit, we were
unable to fit the South African data ( ) (figure 3C, greenP ! .001
line). Furthermore, the survival distribution, fitted to a Weibull
curve, gave a shape parameter of for South Africa3.0 � 0.3
and for Zambia, which was significantly higher in3.3 � 0.5
both cases than the accepted value of [1] and im-2.25 � 0.05
plied a cumulative mortality 5 years after infection of ∼4%,
rather than 17%.
DISCUSSION
There are large variations in CD4+ cell count within and among
HIV-negative populations. CD4+ cell counts decrease with age
[8] and are, on average, ∼100 cells/mL higher in women than
in men [8–10]. Infections other than HIV (bacterial, protozoan,
and helminthic) may affect CD4+ cell counts [11, 12]. In in-
dividuals, CD4+ cell counts may vary by up to 200 cells/mL in
readings performed a few weeks apart [13, 14]. Intra- and in-
terlaboratory variation may also contribute to this variation
[13, 42]. Ideally, when monitoring CD4+ cell counts for the
management of HIV-infected patients, one should perform re-
peated measurements over time, to reduce the influence of
short-term and random fluctuations and to establish the trend
in CD4+ cell counts in individual patients.
Despite the substantial variability in CD4+ cell counts within
and among HIV-positive and -negative populations, we were
able to predict the distribution of the former from that of the
latter. The key assumption is that life expectancy is independent
of the initial CD4+ cell count, and this was supported by the
model predictions for South Africa and Zambia (figure 3). Fur-
thermore, a study in Ethiopia found that, although CD4+ cell
counts in HIV-positive people were lower than those elsewhere
(figure 1), the life expectancy was similar to that in The Neth-
erlands [43], which suggests that the rate of CD4+ cell count
decrease in Ethiopia is proportionately slow and confirms the
prediction of our model.
The large interpopulation variability in CD4+ cell counts may
also help explain a recent observation in HIV-positive South
Africans among whom the clinical disease stage was a stronger
by guest on May 30, 2016
http://jid.oxfordjournals.org/D
ownloaded from
HIV, ART, and CD4+ Distributions in Africa • JID 2006:194 (15 November) • 1455
Figure 3. Distribution of CD4+ cell counts (in cells per microliter) in Gauteng, South Africa, in 2002 [15] and Lusaka, Zambia, in 1999 [16]. A, SouthAfrica, HIV-negative; B, Zambia, HIV-negative; C, South Africa, HIV-positive; D, Zambia HIV-positive. For HIV-negative populations, log-normal distributions(blue lines) were fitted to the data (red symbols, with error bars indicating 95% confidence intervals). For HIV-positive populations, lines are for themodels in which survival is independent of initial CD4+ cell count (blue lines) and determined entirely by the initial CD4+ cell count (green lines). Thehorizontal axes give the percentage of the population in CD4+ cell count intervals of 100/mL.
Figure 4. Predicted survival distribution of HIV-positive patients in Gau-teng, South Africa, and Lusaka, Zambia, whose CD4+ cell counts are 200,350, and 500 cells/mL.
predictor than CD4+ cell count for the risk of both AIDS and
death [44]. CD4+ cells as a percentage of total lymphocyte
count, a value that is not affected by laboratory variations re-
lated to the measurement of total lymphocyte counts [26, 45,
46], might be considered as an alternative measure of immune
status.
Two caveats should be borne in mind when interpreting our
findings. First, some studies have suggested that the rate of
CD4+ cell loss increases during the last 2 years before the onset
of AIDS, and others have suggested that the square root of the
CD4+ cell count declines linearly with increasing time, such
that the rate of loss decreases with time since seroconversion
[1]. Better data on time trends of CD4+ cell counts could help
to refine our assumption of a linear decline. Second, we have
assumed that the distribution of survival times after serocon-
version in these African settings is the same as that in developed
countries. The limited available data [39, 41] have suggested
that this is so, but different survival curves would affect the
analysis.
The model presented here could be used in different ways.
First, CD4+ cell count data among HIV-negative populations
and trends in HIV prevalence could be used to forecast CD4+
cell counts in HIV-positive populations. To the extent that
CD4+ cell counts determine ART needs, we could more ac-
curately predict the likely future demand for antiretroviral and
other drugs. Given that much is known about the relationship
between the risk of HIV-related opportunistic infections and
CD4+ cell counts [5], this model could be used to predict future
changes in the incidence of opportunistic infections, including
TB, as the prevalence of HIV changes over time and CD4+ cell
counts decrease. Second, the model shows how CD4+ cell count
distributions among HIV-positive populations are influenced
by the stage of the local HIV epidemic (figure 2D), and, hence,
provide information about time trends of HIV prevalence and
incidence during the preceding 10–20 years. In India [47], there
is still some debate concerning the maturity and the likely future
course of the epidemic. There is evidence that the prevalence
of HIV has been declining in Harare, Zimbabwe, at ∼9% per
by guest on May 30, 2016
http://jid.oxfordjournals.org/D
ownloaded from
1456 • JID 2006:194 (15 November) • Williams et al.
year since 1998 (J. W. Hargrove, A. Mahmova, B.G.W., H.
Chidawanyika, K. Mutasa, E. Marinda, M. T. Mbizvo, J. Nthoo,
P. J. Iliff, and J. H. Humphrey, unpublished data). Population-
based CD4+ cell count surveys in HIV-positive and -negative
people could throw light on epidemic trends in each of these
countries.
The present study, which was based primarily on a com-
parison of data collected from 2 African countries, highlights
the need to further explore and understand the factors that
determine CD4+ cell count distributions in HIV-negative pop-
ulations and their decrease over time in HIV-positive popu-
lations. However, to test the predictions of this model, better
data are needed about (1) the distribution of CD4+ cell counts
in HIV-negative populations and the reasons for this variation,
(2) the initial and subsequent rate of decrease in CD4+ cell
counts after seroconversion, and (3) the variation in survival
times to AIDS among people in different populations. If such
data were available and if the predictions of the present model
are borne out, it may be possible to use CD4+ cell count dis-
tributions (and other markers of immune status) to more
accurately assess the status of HIV epidemics in different
populations and to refine the criteria for providing ART to
individuals within these populations.
Acknowledgments
We thank Nico Nagelkerke, Kevin De Cock, and Peter Ghys, for com-ments on the manuscript. This project was initiated by the South AfricanCentre for Epidemiological Modelling and Analysis.
APPENDIX
We developed a dynamic model of the decline in CD4+ cell
count in HIV-positive people. Model inputs were (1) CD4+ cell
counts in HIV-negative adults, (2) the decrease in CD4+ cell
count immediately after infection, (3) the survival distribution
after infection with HIV, and (4) time trends in HIV prevalence.
Estimating incidence from prevalence. Time trends in the
prevalence of HIV infection, P*(t), were obtained by fitting
logistic curves to data about the prevalence of HIV among
women attending antenatal clinics. If no one died of AIDS,
I0(t), the incidence of HIV at calendar time t would be equal
to the time derivative of the prevalence, P*(t), so that
∗dP (t)I (t) p . (1)0 dt
To correct for AIDS-related mortality, we needed the survival
distribution, W(t), which we took to be a Weibull function with
median of 9.0 years and a shape parameter of 2.25 [1]. Then,
D(t), the probability (per unit of time) that people die t years
after initial infection, was
( )dW t( )D t p � . (2)
dt
Because deaths reduce prevalence, we added deaths from
previous incident infections to our initial estimate of incidence,
so that
�
˜ ˜ ˜I(t) p I (t) + I(t � t )D(t )dt (3)0 �0
(in eq. [3] and below, t and indicate calendar time, andˆ ˜t t
indicates time since seroconversion.) We solved equation (3)
iteratively, because the integrand depended only on the inci-
dence at times preceding time t. Mortality followed directly
from incidence and survival.
Distribution of time since infection as a function of time.
The number of people infected at time before time t andt
surviving to time t was
ˆ ˆ ˆN(tFt) p I(t � t )W(t ) , (4)
so that the probability density function (PDF) of time since
infection, , at time t wast
�
ˆ ˆ ˆ ˆP(tFt) p N(tFt)/ N(tFt)dt . (5)�0
CD4+ cell count distribution as a function of time. We
assumed that the CD4+ cell count decreases to a value of Ci
immediately after seroconversion and then decreases linearly
with time [1] to a value of Cf when the person dies. We assumed
initially that survival was independent of the preinfection CD4+
cell count [29–31]. To simplify the analysis, we scaled the CD4+
cell count, C, to get a new variable, c, where
C � Cfc p , (6)C � Ci f
so that, as C decreases from Ci to Cf , the scaled variable c
decreases from 1 to 0. (We introduced c purely as a mathe-
matical device to simplify the analysis; precisely the same final
result could be obtained without introducing this new variable.)
by guest on May 30, 2016
http://jid.oxfordjournals.org/D
ownloaded from
HIV, ART, and CD4+ Distributions in Africa • JID 2006:194 (15 November) • 1457
Then, if a person dies at time after seroconversion, the scaledt
CD4+ cell count c at time after seroconversion ist
tc p 1 � . (7)
t
The probability density function of could thus be given byt
, as defined in equation (2), so that the probability density˜D (t )
of c, at time could be given by . Fromˆ ˆ ˜ ˜t P (cFt ) dc p D (t ) dt
equation (7), we then obtained
2˜ ˆ ˜dt t tˆ ˜( ) ( )P cFt p D t p D . (8)( ) ˆdc 1 � c t
We also needed to allow for the distribution of the initial
CD4+ cell counts Ci. Let the PDF of the CD4+ cell count in
HIV-negative people be . Then the PDF of the CD4+ cellP (C )icount among those people who seroconverted at time beforet
the present time could be given as
�
ˆ ˆ( ) ( ) ( )P CFt p P cFt P C dC . (9)� i i
0
Finally, from equation (5), the PDF of the CD4+ cell count
in all HIV-seropositive people at time t was
�
ˆ ˆ ˆ( ) ( )( )P CFt p P CFt P tFt dt . (10)�0
We evaluated equation (10) numerically using Visual Basic
in Excel (version 2003; Microsoft).
Distribution of survival at a given CD4+ cell count.
Consider an HIV-infected person whose initial scaled CD4+ cell
count is a, who seroconverted at time before the present, andt
who dies at time after seroconversion. If their present scaledt
CD4+ cell count is c, their present life expectancy is ,˜ ˆt p t � t
where
˜ctt p . (11)
a
The PDF of the present life expectancy, t, for a given value
of c could then be determined using the formula
ˆ ˜ ˆ ˜( ) ( )( ) ( )P t dt p P a P t P t da dt dt , (12)���˜tpct/a
where the integral is over the surface defined by equation (11)
with t and c fixed. Equation (12) was evaluated using Monte
Carlo integration. We generated sets of points a, , and fromˆ ˜t t
the distribution appropriate to each; kept all points for which
the present CD4+ cell count lay within a small range of c (typ-
ically �10 cells/mL); and, for each point, calculated the cor-
responding value, and hence, the PDF, of t.
References
1. Williams BG, Dye C. Antiretroviral drugs for tuberculosis control inthe era of HIV/AIDS. Science 2003; 301:1535–7.
2. Detels R, English PA, Giorgi JV, et al. Patterns of CD4+ cell changesafter HIV-1 infection indicate the existence of a codeterminant of AIDS.J Acquir Immune Defic Syndr 1988; 1:390–5.
3. Dorrucci M, Balducci M, Pezzotti P, Sinicco A, Alberici F, Rezza G.Temporal changes in the rate of progression to death among Italianswith known date of HIV seroconversion: estimates of the populationeffect of treatment. Italian HIV Seroconversion Study (ISS). J AcquirImmune Defic Syndr 1999; 22:65–70.
4. Gottlieb GS, Sow PS, Hawes SE, et al. Equal plasma viral loads predicta similar rate of CD4+ T cell decline in human immunodeficiency virus(HIV) type 1– and HIV-2–infected individuals from Senegal, WestAfrica. J Infect Dis 2002; 185:905–14.
5. Freedberg KA, Losina E, Weinstein MC, et al. The cost effectivenessof combination antiretroviral therapy for HIV disease. N Engl J Med2001; 344:824–31.
6. Korenromp EL, Williams BG, de Vlas SJ, et al. Malaria attributable tothe HIV-1 epidemic, sub-Saharan Africa. Emerg Infect Dis 2005; 11:1410–9.
7. World Health Organization (WHO). Interim WHO clinical staging ofHIV/AIDS and HIV/AIDS case definitions for surveillance: Africanregion. Geneva: WHO, 2005:43.
8. Lugada ES, Mermin J, Kaharuza F, et al. Population-based hematologicand immunologic reference values for a healthy Ugandan population.Clin Diagn Lab Immunol 2004; 11:29–34.
9. Kassu A, Tsegaye A, Petros B, et al. Distribution of lymphocyte subsetsin healthy human immunodeficiency virus-negative adult Ethiopiansfrom two geographic locales. Clin Diagn Lab Immunol 2001; 8:1171–6.
10. Prins M, Robertson JR, Brettle RP, et al. Do gender differences in CD4cell counts matter? AIDS 1999; 13:2361–4.
11. Anzala AO, Simonsen JN, Kimani J, et al. Acute sexually transmittedinfections increase human immunodeficiency virus type 1 plasma vi-remia, increase plasma type 2 cytokines, and decrease CD4 cell counts.J Infect Dis 2000; 182:459–66.
12. Chirenda J. Low CD4 count in HIV negative malaria cases and normalCD4 count in HIV positive and malaria negative patients. CentralAfrican J Med 1999; 45:248.
13. Taylor JM, Tan SJ, Detels R, Giorgi JV. Applications of a computersimulation model of the natural history of CD4 T-cell number in HIV-infected individuals. AIDS 1991; 5:159–67.
14. Raboud JM, Haley L, Montaner JS, Murphy C, Januszewska M, Schech-ter MT. Quantification of the variation due to laboratory and physi-ologic sources in CD4 lymphocyte counts of clinically stable HIV-infect-ed individuals. J Acquir Immune Defic Syndr Hum Retrovirol 1995; 10(Suppl 2):S67–73.
15. Auvert B, Males S, Puren A, Taljaard D, Carael M, Williams B. Canhighly-active antiretroviral therapy reduce the spread of HIV?: a studyin a township of South Africa. J Acquir Immune Defic Syndr 2004;36:613–21.
16. Kelly P, Zulu I, Amadi B, et al. Morbidity and nutritional impairmentin relation to CD4 count in a Zambian population with high HIVprevalence. Acta Trop 2002; 83:151–8.
17. Kassa E, Rinke de Wit TF, Hailu E, et al. Evaluation of the WorldHealth Organization staging system for HIV infection and disease in
by guest on May 30, 2016
http://jid.oxfordjournals.org/D
ownloaded from
1458 • JID 2006:194 (15 November) • Williams et al.
Ethiopia: association between clinical stages and laboratory markers.AIDS 1999; 13:381–9.
18. Lisse IM, Poulsen AG, Aaby P, Knudsen K, Dias F. Serial CD4 andCD8 T-lymphocyte counts and associated mortality in an HIV-2-in-fected population in Guinea-Bissau. J Acquir Immune Defic SyndrHum Retrovirol 1996; 13:355–62.
19. Ricard D, Wilkins A, N’Gum PT, et al. The effects of HIV-2 infectionin a rural area of Guinea-Bissau. AIDS 1994; 8:977–82.
20. Aina O, Dadik J, Charurat M, et al. Reference values of CD4 T lym-phocytes in human immunodeficiency virus-negative adult Nigerians.Clin Diagn Lab Immunol 2005; 12:525–30.
21. Levin A, Brubaker G, Shao JS, et al. Determination of T-lymphocytesubsets on site in rural Tanzania: results in HIV-1 infected and non-infected individuals. Int J STD AIDS 1996; 7:288–91.
22. Urassa W, Bakari M, Sandstrom E, et al. Rate of decline of absolutenumber and percentage of CD4 T lymphocytes among HIV-1-infectedadults in Dar es Salaam, Tanzania. AIDS 2004; 18:433–8.
23. Tugume SB, Piwowar EM, Lutalo T, et al. Hematological reference rangesamong healthy Ugandans. Clin Diagn Lab Immunol 1995; 2:233–5.
24. Machekano R, Bassett M, McFarland W, Katzenstein D. Clinical signsand symptoms in the assessment of immunodeficiency in men withsubtype C HIV infection in Harare, Zimbabwe. HIV Clin Trials 2002;3:148–54.
25. Williams BG, Cutts FT, Dye C. Measles vaccination policy. EpidemiolInfect 1995; 115:603–21.
26. Fei DT, Paxton H, Chen AB. Difficulties in precise quantitation ofCD4+ T lymphocytes for clinical trials: a review. Biologicals 1993; 21:221–31.
27. Nicholson JK, Velleca WM, Jubert S, Green TA, Bryan L. Evaluationof alternative CD4 technologies for the enumeration of CD4 lympho-cytes. J Immunol Methods 1994; 177:43–54.
28. Dieye TN, Vereecken C, Diallo AA, et al. Absolute CD4 T-cell countingin resource-poor settings: direct volumetric measurements versus bead-based clinical flow cytometry instruments. J Acquir Immune Defic Syndr2005; 39:32–7.
29. Lyles CM, Dorrucci M, Vlahov D, et al. Longitudinal human immu-nodeficiency virus type 1 load in the Italian seroconversion study:correlates and temporal trends of virus load. J Infect Dis 1999; 180:1018–24.
30. Stein DS, Korvick JA, Vermund SH. CD4+ lymphocyte cell enumerationfor prediction of clinical course of human immunodeficiency virusdisease: a review. J Infect Dis 1992; 165:352–63.
31. Hughes MD, Stein DS, Gundacker HM, Valentine FT, Phair JP, Vol-berding PA. Within-subject variation in CD4 lymphocyte count inasymptomatic human immunodeficiency virus infection: implicationsfor patient monitoring. J Infect Dis 1994; 169:28–36.
32. Vanhems P, Lambert J, Guerra M, Hirschel B, Allard R, Swiss HIVcohort study. Association between the rate of CD4+ T cell decrease andthe year of human immunodeficiency virus (HIV) type 1 seroconver-sion among persons enrolled in the Swiss HIV cohort study. J InfectDis 1999; 180:1803–8.
33. Katubulushi M, Zulu I, Yavwa F, Kelly P. Slow decline in CD4 cellcount in a cohort of HIV-infected adults living in Lusaka, Zambia.AIDS 2005; 19:102–3.
34. Lang W, Perkins H, Anderson RE, Royce R, Jewell N, Winkelstein WJr. Patterns of T lymphocyte changes with human immunodeficiencyvirus infection: from seroconversion to the development of AIDS. JAcquir Immune Defic Syndr 1989; 2:63–9.
35. Lyles RH, Munoz A, Yamashita TE, et al. Natural history of humanimmunodeficiency virus type 1 viremia after seroconversion and prox-imal to AIDS in a large cohort of homosexual men. Multicenter AIDSCohort Study. J Infect Dis 2000; 181:872–80.
36. Bisset LR, Lung TL, Kaelin M, Ludwig E, Dubs RW. Reference valuesfor peripheral blood lymphocyte phenotypes applicable to the healthyadult population in Switzerland. Eur J Haematol 2004; 72:203–12.
37. Lucas SB, Hounnou A, Peacock C, et al. The mortality and pathologyof HIV infection in a West African City. AIDS 1993; 7:1569–79.
38. Grant AD, Djomand G, Smets P, et al. Profound immunosuppressionacross the spectrum of opportunistic disease among hospitalized HIV-infected adults in Abidjan, Cote d’Ivoire. AIDS 1997; 11:1357–64.
39. Morgan D, Mahe C, Mayanja B, Okongo JM, Lubega R, WhitworthJA. HIV-1 infection in rural Africa: is there a difference in mediantime to AIDS and survival compared with that in industrialized coun-tries? AIDS 2002; 16:597–603.
40. Joint United National Programme on HIV/AIDS (UNAIDS), UnitedNations Children’s Fund (UNICEF), World Health Organization(WHO). Epidemiological fact sheet on HIV/AIDS and sexually trans-mitted infections: Zambia. Geneva: UNAIDS, UNICEF, WHO, 2004.
41. Joint United National Programme on HIV/AIDS (UNAIDS) ReferenceGroup. Improved methods and assumptions for estimation of the HIV/AIDS epidemic and its impact: recommendations of the UNAIDS Ref-erence Group on Estimates, Modelling and Projections. AIDS 2002;16:W1–14.
42. Giorgi JV, Cheng HL, Margolick JB, et al. Quality control in the flowcytometric measurement of T-lymphocyte subsets: the multicenterAIDS cohort study experience. The Multicenter AIDS Cohort StudyGroup. Clin Immunol Immunopathol 1990; 55:173–86.
43. Mekonnen Y, Geskus RB, Hendriks JCM, et al. Low CD4 T cell countsbefore HIV-1 seroconversion do not affect disease progression in Ethi-opian factory workers. J Infect Dis 2005; 192:739–48.
44. Badri M, Bekker LG, Orrell C, Pitt J, Cilliers F, Wood R. Initiatinghighly active antiretroviral therapy in sub-Saharan Africa: an assess-ment of the revised World Health Organization scaling-up guidelines.AIDS 2004; 18:1159–68.
45. O’Gorman MR, Gelman R. Inter- and intrainstitutional evaluation ofautomated volumetric capillary cytometry for the quantitation of CD4-and CD8-positive T lymphocytes in the peripheral blood of personsinfected with human immunodeficiency virus. Site Investigators andthe NIAID New CD4 Technologies Focus Group. Clin Diagn Lab Im-munol 1997; 4:173–9.
46. Lau LG, Tan GB, Kuperan P. CD4 lymphocyte enumeration in patientswith human immunodeficiency virus infection using three-colour andfour-colour dual-platform flow cytometry: an inter-laboratory com-parative evaluation. Ann Acad Med Singapore 2002; 31:765–71.
47. Williams BG, Granich R, Chauhan LS, Dharmshaktu NS, Dye C. Theimpact of HIV/AIDS on the control of tuberculosis in India. Proc NatlAcad Sci USA 2005; 102:9619–24.
by guest on May 30, 2016
http://jid.oxfordjournals.org/D
ownloaded from