Hit or Miss? Test Taking Behavior in Multiple Choice Exams∗
54
* †‡ ¶ * † ‡ ¶
-
Upload
khangminh22 -
Category
Documents
-
view
5 -
download
0
Transcript of Hit or Miss? Test Taking Behavior in Multiple Choice Exams∗

Hit or Miss? Test Taking Behavior in Multiple
Choice Exams∗
Pelin Akyol †‡ James Key� Kala Krishna¶
December 29, 2020
Abstract
This paper is the �rst to model how a test candidate answers ques-tions in a multiple choice exam. We allow for the possibility of a penaltyfor a wrong answer which makes risk averse examinees more likely toskip questions. Despite the lack of item response data, we can esti-mate the model by using the insight that skipping behavior, togetherwith penalties for wrong answers, makes certain scores much more likelythan others. Using data from the Turkish University Entrance Exam,we estimate the model and �nd that candidates' attitudes towards riskdi�er according to their gender and ability with females and those withhigh ability being signi�cantly more risk-averse. However, the impact ofdi�erences in risk aversion on scores is small. A higher guessing penaltyincreases the precision of the exam, but at the cost of increasing thegender gap.JEL Classi�cation: I21, J24, D61, C11Keywords: Multiple-Choice Exams, Guessing Penalty, Risk Aversion.
∗We would like to thank Paul Grieco, Sung Jae Jun, Stephen Yeaple and Mark Robertsfor their helpful comments on an earlier draft. We would also like to thank seminar andconference participants at the WEAI 11th International Conference, 11th World Congressof the Econometric Society, 30th Congress of the European Economic Association, Confer-ence on the Economics of Health, Education, and Worker Productivity, Massey UniversityAlbany, Otago University, Victoria University Wellington, Monash University, HacettepeUniversity, Sabanci University and Bilkent University.†Corresponding Author‡Bilkent University, Turkey, e-mail: [email protected]�Frontier Economics, Australia, e-mail: [email protected]¶Penn State University, CES-IFO and NBER, United States, e-mail: [email protected]
1

1 Introduction
The multiple-choice test structure is commonly used to evaluate the knowl-edge of candidates in a wide variety of situations. Such exams are widely usedin practice being seen as objective, fair1 and low cost, especially when largenumbers of candidates are involved (Frederiksen (1984) and Becker and John-ston (1999)). University entrance exams in several countries, including Turkey,Greece, Japan, and China, are multiple-choice exams. In the US, the Scholas-tic Aptitude Tests (SATs) and Graduate Record Exams (GREs) that are takenbefore applying to undergraduate and graduate schools are also mostly of thisform. Such exams are also widely used to measure the e�ectiveness of schools,teachers, to enter the civil service, and to allocate open positions.2 Further-more, scores in such exams are likely to be important determinants of futurewages and occupations (Ebenstein et al. (2016)). Its main advantages are thatit allows a broader evaluation of the candidate's knowledge in a short time,it is easy to grade which matters more when large numbers of candidates areinvolved, and there is no subjective e�ect of the grader in the evaluation. Be-cause of these properties, it is preferred in both high and low stake exams inmany countries.
A disadvantage of such exams is that candidates may attempt to guess theanswer without having any knowledge of the answer3(see Budescu and Bar-Hillel (1993) and Kubinger et al. (2010)). In other exam types, such as shortanswer based exams, such uneducated responses are unlikely to reap any bene-�t. As a response to this problem, test designers may apply negative markingfor wrong answers (guessing penalty). Grading methods in multiple-choicetests may be designed in such a way that the expected score from randomlyguessing a question is equal to the expected score from skipping the question.This grading method would prevent guessing by risk averse candidates thatpossess no knowledge as to which answer is correct. However, if they have par-tial knowledge about the question, the candidate's decision to guess/attemptor skip/omit the question will not only depend on their knowledge, but alsoon their degree of risk aversion.4 This problem may undermine the validity
1A fair exam is one where the only relevant candidate characteristic is the candidate'sknowledge of the material.
2For example, in Turkey, public sector jobs are allocated according to the score obtainedin a multiple-choice central exam, called KPSS.
3For example, with no knowledge of the subject and four options on a question, acandidate would on average get 25% correct.
4A possible change in the exam grading method is removing penalties for wrong answers.This leads all candidates to answer all questions which would increase the noise associatedwith the score. (see Bereby-Meyer et al. (2002) and Kubinger et al. (2010))
2

and the fairness of test scores, reducing the e�cacy of the testing mechanismas well as biasing the estimates obtained by the item response theory models(IRT) such as Rasch model (one parameter logistic model (1PLM)), 2PLM and3PLM. IRT models would give biased results if there is a penalty for guessing.In this case, the candidate's decision would depend on risk aversion and theability of the candidate which will violate unidimensionality5 assumption ofIRT (Ahmadi and Thompson (2012)). Therefore, we argue that the standardapproaches to examining the performance of candidates taking multiple-choiceexams are inadequate in such settings and often misleading as they do not takeinto account skipping/omission behavior properly. Thus, improving on existingmethods is vital for understanding what lies behind performance di�erencesof di�erent groups and for policy making.6
In this paper, we specify and estimate what we believe is the �rst structuralmodel of candidates' exam taking behavior and explore how di�erent charac-teristics of candidates, like their ability and risk aversion7, a�ect their examperformance. Our objective is to understand how candidates behave when tak-ing these exams, whether exam taking behavior seems to di�er across groupsand to understand the consequences of these di�erences and their implicationsfor public policy. Our focus is on the trade-o� between precision and fairnessassuming that agents are risk averse.8 Negative marking reduces guessing,thereby increasing accuracy. However, it reduces the expected score of themore risk averse, discriminating against them. Our structural approach al-lows us to understand the performance of alternative exam designs in termsof precision and fairness through our counterfactual analysis.
Our work contributes to the literature in two ways. First, we provide aninnovative way to identify di�erences in risk preferences (with negative mark-ing for incorrect answers) even without having question-by-question responsesfor candidates9. Such penalties for guessing makes risk averse candidates lesswilling to guess and more likely to omit questions with consequent adversee�ects on the expected score. Our approach uses the insight that skippingbehavior, or a lack of it, make certain scores a lot more likely. Second, we
5Unidimensionality refers to the existence of a single trait or construct underlying a setof measures (Gerbing and Anderson (1988)).
6For example, females tend to perform worse in multiple-choice exams featuring negativemarking.
7In addition to risk aversion and ability (knowledge of the material), con�dence andresponse to high-pressure environments may a�ect candidates' performance and omissiondecisions.
8In an experimental setting, Baldiga (2014) and Funk and Perrone (2016) show thatindividuals behave in a risk-averse manner in multiple choice exams.
9Our approach can also be used with question-by-question responses.
3

provide a model that take into account omission due to risk aversion di�er-ent from the IRT models such as Rasch model used in the literature, see forexample Pekkarinen (2015).10 The Rasch model, using what is termed itemresponse theory, boils down to predicting the probability of a correct answerusing a logit setup, with individual and question �xed e�ects. The individ-ual �xed e�ect is thought of as ability, and the question �xed e�ect as thedi�culty of the question. By allowing for skipping, and relating this to riskaversion, we use all the information in the data, in contrast to the standardRasch model. By ignoring information on skipping, the Rasch model givesbiased estimates of a candidate's ability. To understand why this bias occurs,consider, for example, a setting where there is negative marking and all ques-tions are extremely di�cult so that candidates have little idea about the rightanswer, and all candidates have the same ability, though some are risk averse(and so are more likely to skip a question when they are unsure about it) whileothers are not. Say the risk averse group answers 20 of 80 questions getting 10right, while the risk neutral one answers 40 of 80 questions getting 15 right.In this case, the Rasch model would estimate the probability of answeringcorrectly for the risk averse group as 1/8 and that for the risk neutral groupanswering 40 questions and getting 15 right as 3/16. However, the di�erencein the two would be due to di�erences in risk aversion rather than ability.11
Such di�erences in risk aversion are likely to exist: candidates close to a cuto�for a highly desirable school may well be very risk averse, and it has beenargued, see for example Eckel and Grossman (2008a), Charness and Gneezy(2012) and Croson and Gneezy (2009), that females are more risk averse thanmales. In a multiple choice exam setting, Baldiga (2014) and Funk and Per-rone (2016) show that individuals behave in a risk-averse manner, and femalesare more risk averse relative to males. To disentangle ability and risk aversion,and obtain unbiased estimates of both risk aversion and ability, we need tospecify a complete setting, one that includes the choice of skipping the ques-tion as done here. It is worth noting that despite the interest in such examsin the Psychology, Education, and Economics literature, there is little formalmodeling and estimation based on the behavior of individual candidates.
We use administrative data from the Turkish University Entrance Exam(ÖSS) in our work. The ÖSS is a highly competitive, centralized examination
10While the Rasch model is often used to account for di�erences in di�culty acrossquestions in a test, we ignore this aspect in this paper due to data limitations, namely, wedo not observe individual item responses. On the other hand, the Rasch model does notdeal with skips.
11Depending on the setting, IRT treats omitted items as non-reached or missing, howeverthese approaches do not solve the problem.
4

that is held once a year. It is selective as only about a third of the examcandidates are placed at all, and admission to top programs is extremely com-petitive. College admission depends on the score obtained in the ÖSS, andthe high school GPA12, with at least 75% of the weight being given to theÖSS score. There are forty-�ve questions in each section of the exam, andeach question has �ve possible answers; for each correct answer the candidateobtains one point, and for each wrong answer she is penalized 0.25 points,while no points are awarded/deducted for skipping a question.13 Studentsexpend signi�cant time and e�ort to prepare for this exam and have a goodunderstanding of how the system works.
Our results show that candidates' attitudes towards risk di�er accordingto their gender and expected score. Females seem to be more risk averse at allscore levels than males. This is in line with the large literature14 that suggeststhat part of why females perform worse than males in college and in the jobmarket is due to their behavior which is less assertive and more risk averse.Students with low expected scores also tend to be less risk averse. This makessense as there is a cuto� score to qualify for possible placement and most likelya jump up in utility upon becoming eligible for placement.
We then run counterfactual experiments to investigate the e�ect of riskaversion on gender gap in performance. Since females tend to guess less of-ten than they should if they were maximizing their expected score, they tendto have lower scores, and less variance in their scores, than otherwise simi-lar males. This tends to make them under-represented at both the top andthe bottom end of the score distribution. The consequences of under rep-resentation at the top are particularly relevant when university entrance isvery selective. This is certainly the case in many developing countries whereonly a small fraction of candidates are able to proceed to university. In thebaseline model, the top 10% of candidates (by score) are 42% females. Butfemales are 44% of the Social Science track �rst time takers: we call this under-representation of females in the top 10% of scorers, a 2% gender gap againstfemales in this case. We �nd that risk aversion does not have a signi�cantimpact on the gender gap. Eliminating skipping, or eliminating risk aversiondi�erences between males and females have little impact on the gender gap inthe top 10% of scorers. We also investigate the impact of alternative designson the precision of the exam. Our results show that increasing the penalty for
12The high school GPA is normalized at the school-year level using school level examscores to make GPAs comparable across schools in each year. This also removes the incentiveto in�ate high school grades.
13Thus, the expected score from a random guess is over the �ve possible answers is zero.14see Croson and Gneezy (2009), Baldiga (2014) and Funk and Perrone (2016)
5

incorrect answers or increasing the number of questions in the exam improvesthe ability of exams to sort candidates in terms of their ability/knowledge ofthe material15. More precisely, increasing the number of questions from 45 to70 in an exam with a guessing penalty of 0.25 would sort candidates similarlywhen there are 45 questions with guessing penalty of 1.
1.1 Related Literature
The psychology and education literature has long been interested in devel-oping test designs that generate fair results. Baker et al. (2010) criticize the useof test results of students to evaluate the value-added of teachers and schoolspartly because of the measurement error generated by random guessing.
Risk attitudes of candidates are an important factor in the decision toattempt a question whenever there is uncertainty associated with the outcome(Espinosa and Gardeazabal (2013)). In the literature, females are shown to bemore risk averse than males in many settings (see Eckel and Grossman (2008b),Agnew et al. (2008) and Charness and Gneezy (2012)). To test the hypothesisthat females students skip more questions than males since they are morerisk averse, Ben-Shakhar and Sinai (1991) investigates test taking strategiesof students in Hadassah and PET tests in Israel and �nd that females do, infact, tend to skip more questions.
The empirical literature presents mixed evidence on the e�ects of risk aver-sion on the exam performance of the candidates. In a �eld experiment, Funkand Perrone (2016) �nd that although females are more risk averse relativeto males, the di�erences in risk aversion does not have any e�ect on the dif-ferences in exam scores. On the other hand, Baldiga (2014) shows in anexperimental setting that females are more risk averse than males and skipmore questions, and conditional on students' knowledge of the test material,those who skip more questions tend to perform worse suggesting that suchexams will be biased against groups who skip questions rather than guess.Iriberri and Rey-Biel (2019) show that female participants skip signi�cantlymore questions than their male counterparts when there is reward for omittedquestions, and this leads to a decrease in the score of females. Similarly, Co�-man and Klinowski (2020) show that removal of penalties for wrong answerson the national college entry examination in Chile decreased gender gap espe-cially among high-achievers. The di�erences in the characteristics of exams interms of di�culty and stakes might be the source of these mixed �ndings (see
15In a recent study, Direr (2020) shows that increasing the number of questions in amultiple choice test is an e�ective way to enhance score e�ciency.
6

Riener and Wagner (2017) and Atwater and Saygin (2020)).Burgos (2004) investigates score correction methods that reward partial
knowledge by using prospect theory.16 They compute a fair rule which is alsostrategically neutral so that an agent with partial knowledge will answer, whileone without any knowledge will not. Similarly, Bernardo (1998) analyzes thedecision problem of students in a multiple-choice exam to derive a �properscoring rule�, i.e., one that truthfully elicits the probability of each answerbeing correct.17 Espinosa and Gardeazabal (2010) models students' optimalbehavior in a multiple-choice exam and derives the optimal penalty that maxi-mizes the validity of the test, i.e., maximizes the correlation between students'knowledge and the test score by simulating their model under distributionalassumptions on students' ability, di�culty of questions and risk aversion. Us-ing simulations, the paper argues that the optimal penalty is relatively high.Even though the penalty discriminates against risk averse students, this ef-fect seems to be small compared with the measurement error that it prevents,especially for high ability students.
None of these works attempt to estimate ability and risk aversion of agentsor to test the implications of their models empirically as we do. We use a simpleBayesian setting where candidates of better ability get a more informativesignal about the correct answer. This feature, together with risk aversion,allows us to use the skipping behavior of candidates, as well as their accuracy,to estimate ability and risk aversion. The data we use in this study doesnot include information on the question-by-question responses. As a result,we cannot directly look at the probability of skipping and getting a correctanswer. Despite this, we are able to use information on the distribution ofscores in the presence of negative marking to infer skipping tendencies andability distributions as well as risk aversion, while allowing them to di�eracross groups. Thus, one of our contributions is to provide a way to estimatestructural parameters of the model with limited data on question-by-questionresponses. In addition, having a structural model lets us do counterfactualexercises.
16Prospect theory describes the way people choose between alternatives when the proba-bilities associated with them are known taking a behavioral approach such as loss aversion.
17Proper scoring rules have been developed to reward partial knowledge where studentsreport the subjective probability of each choice being correct rather than choose one answerso that more information is revealed. There are di�erent types of proper scoring rules,quadratic, spherical, and logarithmic (Bickel (2010)). The comparisons and the details ofthese methods are beyond the scope of this paper. In practice, the application of thesemethods is problematic, especially in large scale exams. Its complexity means that its rulesmay not be internalized by all students which could create another source of inequality.
7

In the next section, we present an overview of the data and testing environ-ment. The particular patterns seen in the multiple-choice tests are discussedin more detail in Section 3. In Section 4, the model is presented. Section 5details the estimation strategy with the results in Section 6. Section 7 con-tains counterfactual experiments and Section 8 concludes. Additional tablesand �gures are presented in Appendix A. Online Appendix B.2 extends theestimation to di�erent student types and presents the extended model thatcan be used with item-by-item response data.18
2 Background and Data
In this study, we use data from the Turkish university entrance exam.Our main source of data is administrative data from the Student Selectionand Placement Center (ÖSYM) and the high schools on a random sample ofroughly 10% of the 2002 university entrance exam candidates. The universityentrance exam is a multiple-choice exam with four test sections: Turkish,Social Science, Math, and Science19. Students are given 180 minutes for 180questions and can choose how to allocate their time between di�erent testsections; all four sections are taken at the same time. Each section of the testhas 45 questions, and each question has �ve possible answers. Students get onepoint for each correct answer, and they lose 0.25 points for each wrong answer.If they skip the question, they receive 0 points. The university entrance examis a paper-based exam; all students receive the same questions, and they donot receive any feedback on whether their answer is correct or not duringthe exam. Our data includes students' raw test scores in each test, weightedtest scores, high school, high school track, high school GPA, gender, and thenumber of previous attempts. The second source of data is the 2002 universityentrance exam candidate survey. This survey is �lled by all students while theyare making their application for this exam. This data set has information onstudents' family income, education level, and time spent and expenditure onpreparation. We have around 40,000 students from each high school track,Social Science, Turkish-Math, Science, and Language. Students choose one ofthe Science, Turkish-Math, Social Science, or Language tracks at the beginningof high school. Students' university entrance exam scores (ÖSS score by track)
18While the main body of the paper focuses on students in the Social Science track, thissection examines those in the Language and Turkish-Math tracks.
19There is also a separate multiple-choice language exam which is held one week afterthe main exam. This exam is taken by students who aim to get into college programs suchas English literature.
8

are calculated as a weighted average of raw scores in each test.In this paper, we focus on �rst time taker Social Science track students. The
track score in Social Science gives the highest weight (1.8) to the Turkish andSocial Science sections of the tests, while Math and Science have a relativelylow weight (0.4).20 (see Table B.121). For questions in the Turkish and SocialScience sections, students are likely to have partial knowledge, choosing thebest answer. This is exactly what we model and use to estimate risk aversion.In contrast, many math and science questions involve solving the problem sothat students are either quite certain of the answer or have failed to solve thequestion (thereby having no information regarding which answer is correct).In the former case, everyone answers, and in the latter, everyone skips wheneven slightly risk averse, which makes identi�cation of risk aversion impossiblewith the aggregate data. Therefore, our focus will be on Social Science trackstudents.
In Turkey, college admission is based entirely on an annual, nationwide,central university entrance exam. Most high school seniors take the exam andthere is no restriction on retaking.22 However, the score obtained in a yearcan be used only in that year. As retaking decision is endogeneous, includingrepeat takers into our analysis will not be informative without controlling forthe selection problem, therefore we focus on �rst time taker students.
For the Social Science track students, the placement score (Y-ÖSS) is acomposite of the track score (ÖSS-SÖZ) and the standardized GPA23 (AOBP).Students whose placement scores is above 105 points can submit preferences(submit an application) to 2-year college programs, while 120 points are neededto apply to 4-year college programs.
Table A.1 presents the summary statistics by gender for Social Sciencetrack students. Examining Social Science track students, the distributions ofweighted track scores (ÖSS-SÖZ) as well as normalized GPAs for �rst timetakers by gender are depicted in Figure 124. First, note that females seem to
20In the calculation of ÖSS scores, �rstly raw scores in each track are normalized so themean is 50 and the standard deviation is 10. Then these normalized scores are multipliedby the weights presented in Table B.1.
21The weights presented in this table are decided by ÖSYM.22It is important to note that to retake the exam students need to wait one more year.
So there is a signi�cant opportunity cost associated with retaking.23The standardized GPA is the GPA normalized by the performance of the school in
the university entrance exams which adjusts in e�ect for di�erent grading practices acrossschools.
24According to the two-sample Kolmogorov-Smirnov test, the distributions of OSS-SOZscore and normalized GPA for males and females are signi�cantly di�erent with the p-valueof 0.
9
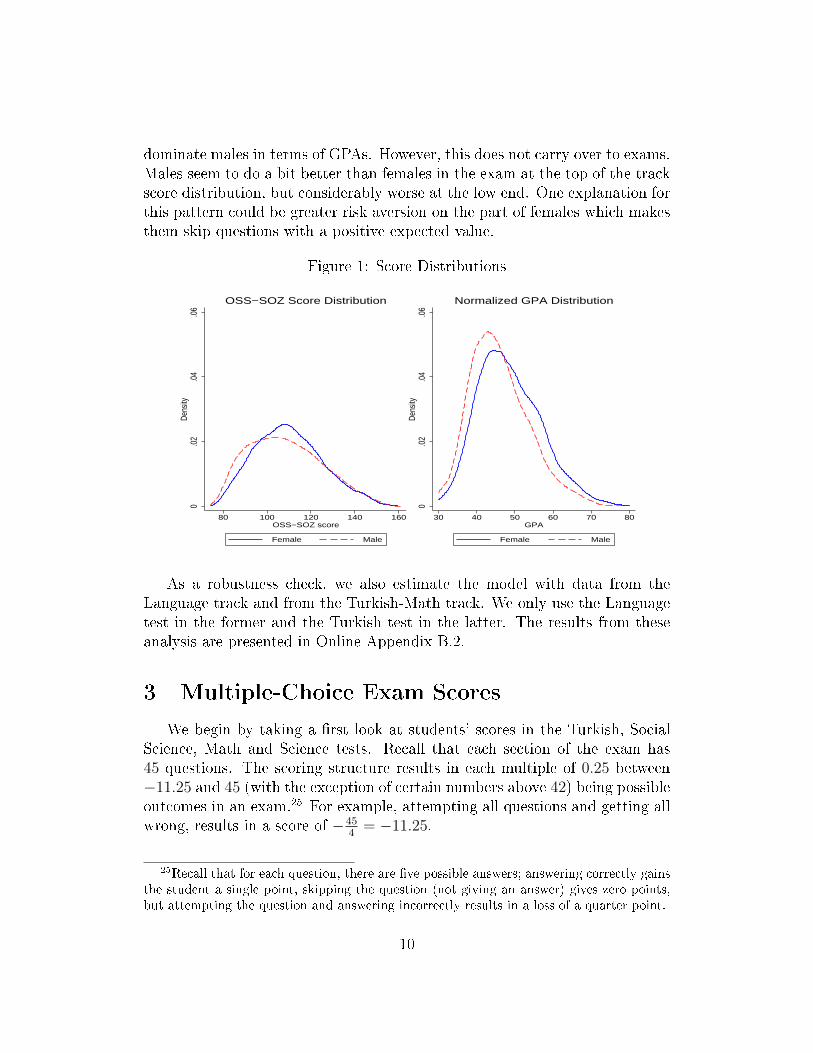
dominate males in terms of GPAs. However, this does not carry over to exams.Males seem to do a bit better than females in the exam at the top of the trackscore distribution, but considerably worse at the low end. One explanation forthis pattern could be greater risk aversion on the part of females which makesthem skip questions with a positive expected value.
Figure 1: Score Distributions
0.0
2.0
4.0
6De
nsity
80 100 120 140 160OSS−SOZ score
Female Male
OSS−SOZ Score Distribution
0.0
2.0
4.0
6De
nsity
30 40 50 60 70 80GPA
Female Male
Normalized GPA Distribution
As a robustness check, we also estimate the model with data from theLanguage track and from the Turkish-Math track. We only use the Languagetest in the former and the Turkish test in the latter. The results from theseanalysis are presented in Online Appendix B.2.
3 Multiple-Choice Exam Scores
We begin by taking a �rst look at students' scores in the Turkish, SocialScience, Math and Science tests. Recall that each section of the exam has45 questions. The scoring structure results in each multiple of 0.25 between−11.25 and 45 (with the exception of certain numbers above 42) being possibleoutcomes in an exam.25 For example, attempting all questions and getting allwrong, results in a score of −45
4= −11.25.
25Recall that for each question, there are �ve possible answers; answering correctly gainsthe student a single point, skipping the question (not giving an answer) gives zero points,but attempting the question and answering incorrectly results in a loss of a quarter point.
10

Most Social Science students do not even attempt the Math and Sciencesections of the exam and those that do fare badly as the mean score is closeto zero. This makes sense as these students are poorly prepared in Math andScience as they have not done much of it since the ninth grade and the questionsare very challenging. Also, Math and Science questions involve solving theproblem and are not amenable to guessing. Finally, Math and Science testscores have relatively little weight (0.4 each) in the track score for students inthe Social Science track. Turkish and Social Science scores, in contrast, have aweight of 1.8. Students are explicitly advised to spend less time on the Mathand Science test.26
Obtaining a particular raw subject score could happen in only one wayor in many ways. For example, there is only one way that a student couldobtain −11.25 or 45, similarly a score of 42.5 could only have arisen throughattempting all questions, getting 43 questions correct and 2 incorrect. On theother hand, a score of 40 has two possible origins: 40 correct and 5 skips,or 41 correct and 4 incorrect. It is impossible to achieve a score of 42.25:the student must have at least 43 questions correct, and at least 3 questionsincorrect, which is not possible given there are only 45 questions.
There are 220 possible raw scores one can reach, however if a studentattempts all the questions, not skipping any, there are only 46 raw scoresthat can occur. These are spaced 1.25 points apart, starting at −11.25, andending at 45 points. The distributions of raw subject scores in Social Scienceand Turkish for the �rst time takers by gender, as seen in Figures 2 and 3,have very prominent spikes.2728 It is no coincidence that the spikes appearevenly placed; they correspond to the 46 scores that occur after attemptingall questions and come from the fact that there is a mass of students, ofdi�ering abilities, who answer all the questions. This is an important part ofour identi�cation strategy as explained below as we do not have question-by-question data for students.
Math and Science test score distributions for Social Science track studentsdo not exhibit this pattern as most students obtain a score of zero (see FigureA.1). Nor do any of the subject score distributions for the Science track stu-dents exhibit this pattern of spikes across the entire support of the distribution.
26In the exam booklet there is a note before the Social Science/Turkish section of theexam that says: "If you want a higher score in ÖSS-SÖZ, it may be better for you to spendmore than 90 minutes on verbal section of the exam."
27According to Two-sample Kolmogorov-Smirnov test, the distributions of raw SocialScience and Turkish test scores for males and females are signi�cantly di�erent from eachother with p-values 0.
28Gridlines spaced 1.25 marks apart correspond with these spikes.
11

These spikes are only there for the top part of the distribution consistent withonly the very best students attempting all the questions.29 As Social Sciencetrack students do not spend much time on the Science and Math sections ofthe exam, we assume away the time constraint and restrict our attention toonly the Social Science and Turkish sections of the exam for Social Sciencetrack students.
Figure 2: Distribution of Social Science Test Scores
0.0
2.0
4.0
6.0
8.1
Den
sity
−11.25 −5 1.25 7.5 13.75 20 26.25 32.5 38.75 45Raw Social Science Score
Female
0.0
2.0
4.0
6.0
8.1
Den
sity
−11.25 −5 1.25 7.5 13.75 20 26.25 32.5 38.75 45Raw Social Science Score
Male
4 Model
Given the complex relationship between scores, admission outcomes andexpected utilities of those outcomes, we do not seek to obtain an explicitutility function (as a function of exam score) in this paper.30 We assumethat the candidate answers each test and each question in isolation.31 Havingutility increase with the score makes sense as a higher score increases thenumber of programs the student is eligible for, and so gives more options to astudent. We do not allow for outcomes in one section of the test to have any
29These �gures are available on request.30For the sake of tractability we assume that student i acts as if he has a CARA utility
function over exam score y, Ui(y) = 1− e−τiy.31We assume that questions are equally di�cult. However, if one has item response data,
this assumption can be relaxed (see Online Appendix ??).
12

Figure 3: Distribution of Turkish Test Scores
0.0
2.0
4.0
6.0
8D
ensi
ty
−11.25 −5 1.25 7.5 13.75 20 26.25 32.5 38.75 45Raw Turkish Score
Female
0.0
2.0
4.0
6.0
8D
ensi
ty
−11.25 −5 1.25 7.5 13.75 20 26.25 32.5 38.75 45Raw Turkish Score
Male
bearing on other sections. Expressed alternatively, we do not allow a studentsperceived performance in previous questions to impact behavior in subsequentquestions.32 Nor do we allow for any time pressure that results in skipping:students do not skip questions in order to improve their performance in otherquestions.33
Students decide whether to answer a question or skip it, to maximize theirexpected utility, depending on their probability of answering the question cor-rectly, PC . Formally, we can write the problem of the student as follows:
max I(answer) [PCU(1) + (1− PC)U(−k)] + I(skip)U(0)
where k is the penalty applied for the wrong answer, and k ≥ 0.So, the student will answer the question, if
PCU(1) + (1− PC)U(−k) > U(0)
PC >U(0)− U(−k)
U(1)− U(−k)= c
32Even if students are able to perceive that they are answering better than expected exante, they are not able to discern if this is due to luck in being asked questions which happento be well suited to their individual strengths, or if the exam is simply easier than average(implying that scores will be normalized downwards).
33In examining students in the Social Science track we believe this is appropriate, as thesestudents overwhelmingly skip the Science and Math sections of the test, as recommended byexaminers, allowing them ample time to focus on the Social Science and Turkish questions.
13

where c will be called attempt cuto�. If the student's probability of answeringthe question correctly is above this cuto�, he will answer the question, other-wise he will choose to skip it. c rises with the degree of risk aversion as shownbelow.
In this section, we will construct a model that allows us to structurally es-timate these attempt cuto�s as well as the ability distributions of the students(since ability a�ects the probability of answering the question correctly). Wemodel test taking behavior as follows. When a student approaches a question,he gets a signal for each of the �ve possible answers. The vector of signals forthe question is then transformed into a belief. This belief is the likelihood thatan answer is in fact the correct answer. The student then decides whether ornot to answer the question, and if so, which answer to choose.
Signals for each of the �ve answers depend on whether or not the answeris actually correct. Signals for incorrect answers are drawn from a distributionG, where G is Pareto with support [AI ,∞) and shape parameter β > 0. Thus,
the density of the signal x for an incorrect answer is βAβIxβ+1 for x > AI . The
mean signal is βAIβ−1 which is decreasing in β. Signals for correct answers are
drawn from a distribution F , where F is Pareto with support [AC ,∞) andshape parameter equal to α > 0, so that the density of the signal is αAαC
xα+1 forx > AC . The mean signal is αAC
α−1 which is decreasing in α.
Assumption 1 AI = AC = A.
This assumption rules out complete certainty that an answer is correct orincorrect.34
Suppose that the student observes �ve signals, given by the following vec-tor:
X = (x1, x2, x3, x4, x5) (1)
where xi is the signal that the student receives when examining answer i.Using Bayes' rule, the probability that answer i is correct conditional on X,can be expressed as:
Prob(Answer i is correct|X) =Prob(X|Answer i is correct)× Prob(Answer i is correct)
Prob(X)(2)
34Assuming that the lower bound for the correct one is higher, i.e., AC > AI , wouldmean that it is possible for student to be sure that an answer is wrong: i.e. to rule out awrong answer. It is also possible for a student to be sure he had the right answer: this wouldbe the case when all but one answer had a score between AI and AC . Assuming AC < AIwould make no sense if β ≥ α (implying that some answers are so bad they must be true!).
14
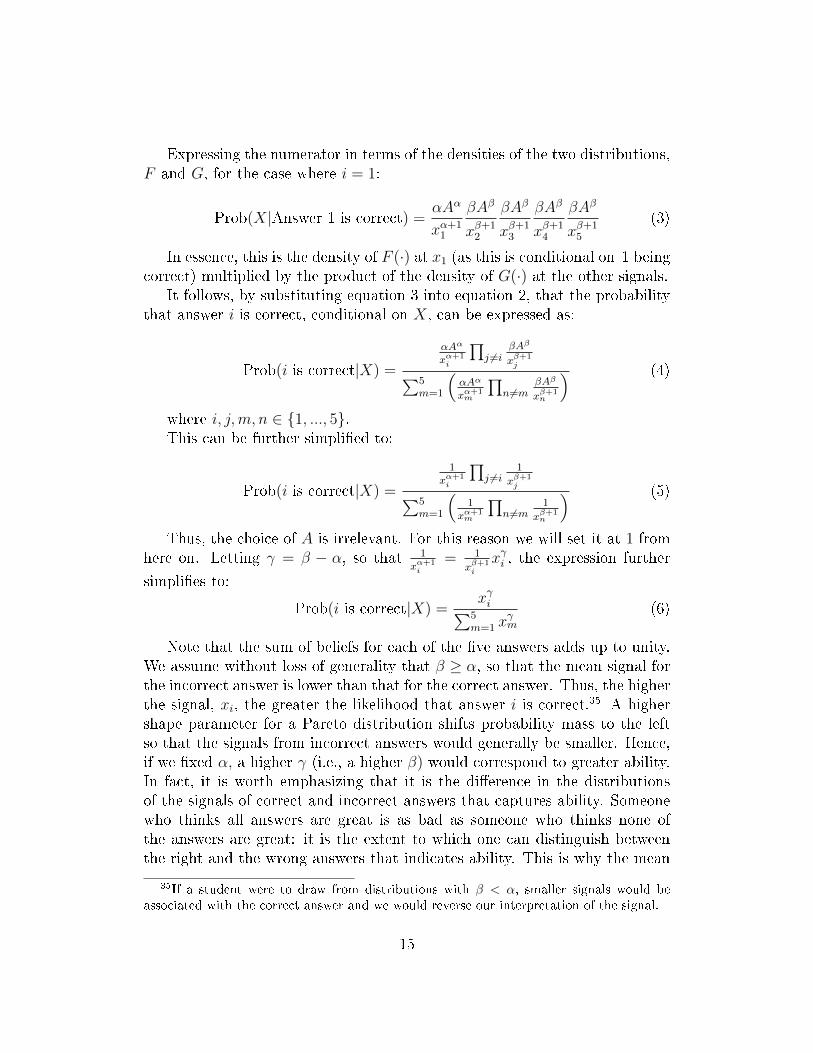
Expressing the numerator in terms of the densities of the two distributions,F and G, for the case where i = 1:
Prob(X|Answer 1 is correct) =αAα
xα+11
βAβ
xβ+12
βAβ
xβ+13
βAβ
xβ+14
βAβ
xβ+15
(3)
In essence, this is the density of F (·) at x1 (as this is conditional on 1 beingcorrect) multiplied by the product of the density of G(·) at the other signals.
It follows, by substituting equation 3 into equation 2, that the probabilitythat answer i is correct, conditional on X, can be expressed as:
Prob(i is correct|X) =
αAα
xα+1i
∏j 6=i
βAβ
xβ+1j∑5
m=1
(αAα
xα+1m
∏n 6=m
βAβ
xβ+1n
) (4)
where i, j,m, n ∈ {1, ..., 5}.This can be further simpli�ed to:
Prob(i is correct|X) =
1xα+1i
∏j 6=i
1
xβ+1j∑5
m=1
(1
xα+1m
∏n 6=m
1
xβ+1n
) (5)
Thus, the choice of A is irrelevant. For this reason we will set it at 1 fromhere on. Letting γ = β − α, so that 1
xα+1i
= 1
xβ+1i
xγi , the expression further
simpli�es to:
Prob(i is correct|X) =xγi∑5m=1 x
γm
(6)
Note that the sum of beliefs for each of the �ve answers adds up to unity.We assume without loss of generality that β ≥ α, so that the mean signal forthe incorrect answer is lower than that for the correct answer. Thus, the higherthe signal, xi, the greater the likelihood that answer i is correct.35 A highershape parameter for a Pareto distribution shifts probability mass to the leftso that the signals from incorrect answers would generally be smaller. Hence,if we �xed α, a higher γ (i.e., a higher β) would correspond to greater ability.In fact, it is worth emphasizing that it is the di�erence in the distributionsof the signals of correct and incorrect answers that captures ability. Someonewho thinks all answers are great is as bad as someone who thinks none ofthe answers are great: it is the extent to which one can distinguish betweenthe right and the wrong answers that indicates ability. This is why the mean
35If a student were to draw from distributions with β < α, smaller signals would beassociated with the correct answer and we would reverse our interpretation of the signal.
15

signals mean nothing: it is only the di�erence in their means that matters.In addition, we assume that the lower bound for signals for both correct andincorrect distributions is the same. Given these assumptions, we can rescaleso that the correct answer is drawn from a distribution where A = 1 and theshape parameter, α, is also 1, while the signal drawn for an incorrect answeris drawn from a distribution where A = 1 and the shape parameter is β
α> 1.
As a result, the structure of a student's signals can be represented by theshape parameter of the incorrect answer: β. A higher value of β draws the themass of the distribution towards the minimum, A = 1, allowing the student tomore clearly separate the incorrect signals from the signal given by the correctanswer. In other words, higher β students are what would be referred to ashigh ability students. Signal distributions for a student with ability β = 3(approximately median) are shown in Figure 4.
Figure 4: Distributions of signals for a student with β = 3
0.2
.4.6
.81
CD
F
1 3 5 7Signal
Correct Answer Incorrect Answer
The e�ect of a higher β on test outcomes can be decomposed into threee�ects. First, the correct answer has a higher probability of generating thehighest signal. Increasing β shifts the cumulative distribution function (CDF)of the incorrect answers' signals to the left, and the student's best guess (theanswer with the highest signal) will be correct more often. Second, when thecorrect answer actually gives the highest signal, the probability with which thestudent believes that it comes from the correct answer increases as the weightedsum of the incorrect signals decreases. If the �rst answer is the correct answer,lowering
∑5i=2 x
γi increases the student's belief that answer one is correct.
Finally, there is a subtle e�ect of β on tests. Students with high ability, i.e.a high value of β, will be more con�dent in their choices. Even with the same
16

signals, as we increase β, the student's belief that the highest signal comesfrom the correct answer increases.36 This is formally stated below:
Proposition 1 Suppose there are two students: one with ability parameter
β = b1 and the other with ability parameter β = b2 > b1. Suppose that the two
students receive identical signals X for a question. Let xmax = max{x1, ..., x5}.The student with the higher value of β has a higher belief that xmax is drawn
from the correct answer.
Proof. The belief is given by xγmax∑5m=1 x
γm. Taking logs, and di�erentiating with
respect to γ, yields the following expression:
d log(Belief)dγ
= log xmax−xγ1 log x1 + xγ2 log x2 + xγ3 log x3 + xγ4 log x4 + xγ5 log x5
xγ1 + xγ2 + xγ3 + xγ4 + xγ5(7)
Since log xmax ≥ log xi, and xi > 0,
dBeliefdγ
≥ 0 (8)
with the inequality strict unless x1 = x2 = x3 = x4 = x5.Once students have observed the signals for each of the �ve possible answers
to the question, they are faced with six possible alternatives: choosing one ofthe �ve answers, or skipping the question. Skipping the question does notchange their test score, answering correctly increases the score by 1, while an-swering incorrectly decreases the score by 0.25 points. Note that the expectedvalue of a random guess is (0.2)(1)− (0.8)(0.25) = 0.
If a student were to choose an answer, they would choose the one whichwas most likely to be correct. A slightly higher score is clearly preferred.In this model, the answer which is most likely to be correct is the one withthe highest value of xi. Also, this answer trivially has a probability of beingcorrect (conditional on observed signals and the student's ability) greater thanor equal to twenty percent.
As explained students have a cuto� for the belief, below which they willskip the question. If the student believes that the best answer (highest signal)has a probability of being correct greater than this cuto�, he will attempt the
36By signals we refer to the observed vector of x values. To see why ability matters,consider a vector of signals (3,1.2,1.1,1.3,1.2). A high ability student would interpret this asbeing favorable towards the �rst answer. A student with no ability, i.e. β = 1, obtains noinformation from the signals and can only conclude that all answers have an equal likelihoodof being correct.
17

question, choosing the best answer. This cuto� lies in the interval [0.2, 1].37
As shown below, a higher value for this cuto� implies a higher degree of riskaversion, while a cuto� of 0.2 would be supported by risk neutral preferences.
Proposition 2 There is a monotonically increasing relationship between the
risk aversion parameter, τ , and the attempt cuto�, c.
Proof. Proof is presented in Appendix B.Consider a student with ability parameter β (recall that α = 1) and at-
tempt cuto� c ∈ (0.2, 1). In order to answer a question, with answer i, thesignal drawn for answer i, xi, must satisfy two conditions. First, it must bethe highest signal. Second, it must be high enough (given the other signals,and ability β) that the belief that it is correct is greater than c, the cuto�required to attempt the question. A diagram showing choices conditional onsignal observations for a simpli�ed two answer setup (with β = 3 and c = .55)is shown in Figure 5. If the signal for j is su�ciently high, then j is selected.In between the two lines, where signals are very close to each other, the bestoption is to skip the question. This skip region is larger the greater the riskaversion of the agent (the greater the value of c).
Figure 5: Actions for a Question with Two Possible Answers
Choose Answer 1
Choose Answer 2
Skip
11
.21
.41
.61
.82
2.2
2.4
2.6
2.8
3A
nsw
er
2 S
ign
al
1 1.2 1.4 1.6 1.8 2 2.2 2.4 2.6 2.8 3Answer 1 Signal
37There will always exist an answer with probability of being correct greater than orequal to 0.2, therefore we do not consider a cuto� below 0.2, as they would result in thesame behavior: always attempting the question, never skipping.
18

5 Estimation Strategy
In our model, students' scores depend on students' ability (β) and attemptcuto�, c, which captures attitudes towards risk. In our data set we observeonly the student's score in each part of the exam, and not the question-by-question outcome. In this section, we explain how we can use our model toestimate the distribution of ability and attempt cuto�s, c, which captures theextent of risk aversion.
Estimation of the parameters of interest, the distribution of student abil-ity in Turkish and social science �elds β = (βT , βSS) and attempt cuto� c,is conducted separately for each gender. In addition, we recognize that therelationship between ÖSS-SÖZ score and utility is not necessarily constantthroughout the range of scores: the degree of risk aversion may be di�erent.In particular, we might expect that students anticipating low scores would beconsiderably less risk averse, since scores below a cuto� result in the sameoutcome: an inability to submit preferences/apply to universities. This wouldresult in a jump in the payo� function as students cross the cuto� score. Forthis reason we allow attempt cuto�s to vary by gender, and allow them to de-pend on the interval in which the student's predicted Social Science track score(ÖSS-SÖZ) lies, for example 120-130. This predicted score in e�ect proxies forability. We cannot use students' actual exam scores as a proxy for ability asthese are endogenous objects that are a�ected by students' risk taking behaviorin the exam. Therefore, we predict students' scores by using their observablecharacteristics. Speci�cally, GPA (adjusted for school quality)38, educationlevel of both parents, income levels/monthly income of parents, preparationon the four subject areas, and the school type. We run an OLS regressionseparately for males and females �rst time takers in the Social Science track,and use the results to predict track (ÖSS-SÖZ) scores for each student (seeTable B.2 in Online Appendix B).
5.1 Estimation
We divide students into groups, according to gender, and the range intowhich their predicted track score (ÖSS-SÖZ) lies: (0, 90), [90, 100), [100, 110),
38To adjust for school quality, we adjust the GPA of student within a school based onthe performance of the school in the exam. We observe normalized GPA for each student,which is converted to a ranking within the school. As we observe the mean and variance ofexam scores for each school, we can easily convert the GPA to a measure that re�ects thequality of the school.
19

[110, 120), [120, 130), [130, 140), and [140,∞).39 These groups do not containequal numbers of students, but do contain at least 100 students.40 For eachgroup, we examine the two subjects (Social Science and Turkish) jointly aswe allow correlation in the ability of a student in the two. We assume thatstudents in each score group have a common attempt cuto�, c, and drawfrom the joint distribution of ability (βTurkish, βSocialScience). The ability ofeach student in subject k ∈ (T, SS) is given by 1 + eψk , where (ψT , ψSS) aredistributed normally with mean µ = (µT , µSS) and covariance matrix Σ.41
This ensures that each student has an ability in both subjects greater than 1,and results in a log normal distribution (shifted 1 unit to the right).42 It alsoallows for abilities in the two subjects to be correlated, as would typically bethe case.43
Under the assumptions made, the probability of obtaining each score isapproximated through simulation. For student n, we take a draw from N(µ,Σ)and label the vector as ψn. From ψn, we �nd (βT , βSS) = (1+eψs(1), 1+eψs(2)),the student's ability vector. As we now have (βT , βSS, c) for student n, we cangenerate the simulated student's test outcome, namely the Turkish score andSocial Science score.
In order to estimate the relevant parameters for the group (cuto�, meansof ψT , ψSS, variances of ψT , ψSS and correlation between ψT and ψSS), we usesimulated method of moments. For every group we postulate a cuto�, themean of ψT , ψSS, the variance of ψT , ψSS and correlation between ψT and ψSS.We make 100 draws for each student in the group and construct the relevantmoments for the group. These moments are the mean scores in the two sub-jects, the variance of these scores, the correlation between the scores in thetwo subjects, and the intensity of the spikes in the two subjects. The di�er-ence between the mass of students with scores corresponding to attemptingall questions (i.e. 45, 43.75,..,−11.25) and the mass of students with scorescorresponding to skipping a single question (i.e. 44, 42.75,...,−11) is what we
39Most of the students in this bin has predicted scores between 140 and 150.40With the exception of females in the lowest expected score range.41In practice, correlation coe�cients ρ were obtained rather than covariance, to assist
the minimization procedure and for interpretation. The covariance obtained is thereforecov(T, SS) = ρσTσSS .
42It can be shown that the likelihood of answering correctly increases approximatelylinearly with respect to the log of ability, so that a log-normally distributed ability wouldgenerate the roughly normal score distribution observed.
43Within the Social Science track as a whole, the scores in the Turkish and Social Sciencesections are highly correlated, the correlation coe�cient is 0.78 with the p-value 0.
20
mean by the intensity of the spikes.44 If the spikes are very prominent, thisdi�erence will be large; if they are non-existent, this di�erence will be minimal.In a given exam, for each such pair, we �nd this di�erence and take its sum toget the overall measure of the spike intensity. This gives us two more momentsto match.45
We compare simulated test score moments to those observed in the dataand choose the parameters that minimize the objective function. Accordingly,the estimates of the vector θg = (cg, µg,Σg), cuto� c and ability distribution
parameters for each group g, denoted by the vector θg =(cg, µg, Σg
), are
estimated by minimizing the distance between the simulated moments, m(g),and the observed moments, m(g).
θg = arg minθ
(m(g)−m(g))′W−1T (m(g)−m(g)) (9)
where WT is the weighting matrix. As usual, we begin by using the identitymatrix as the weighting matrix thereby obtaining an estimate of the parame-ters of each group that is consistent and asymptotically normal. Applying thetwo step procedure,(Hansen (1982), Gourieroux and Monfort (1997), Du�eand Singleton (1993)) this estimate is used to generate a weighting matrix.Using the new weighting matrix, the procedure is repeated which improvesthe e�ciency of the estimate.
For a given c, the means of scores help pin down the means of the abilitydistributions that students are drawing from, and the variances/covariances ofscores help pin down the variances of the ability distributions and the correla-tion between ability draws. Identi�cation of the attempt cuto�, c, is achievedthrough matching the intensity of the spikes in the score distributions for Turk-ish and Social Science. If students are less risk averse then they will tend tonot skip, ceteris paribus. Thus, at low values of c, almost all of the probabilitymass of a given student's distribution will be located on scores correspondingto attempting all questions and resulting in spikes. As c increases, studentsbecome more and more likely to skip some questions, resulting in more masslying on scores unreachable by attempting all questions so that spikes can nolonger be seen.
44There are many ways to get a particular score. For example, 35 can be reached bycorrectly answering 35 and skipping 10, correctly answering 36 and skipping 9 (4 incorrect)or correctly answering 37 with 8 incorrect. This multiplicity is not generating the spikes.As seen in Figure 6 below, the prevalence of spikes is clearly driven by risk aversion.
45There are alternative ways to measure the intensity of the spikes. It is also possibleto de�ne the spike intensity for each section - Turkish and Social Science- separately. Wedo not need to do so as we have a single cuto� that de�nes risk aversion so that a singlemeasure su�ces for identi�cation.
21
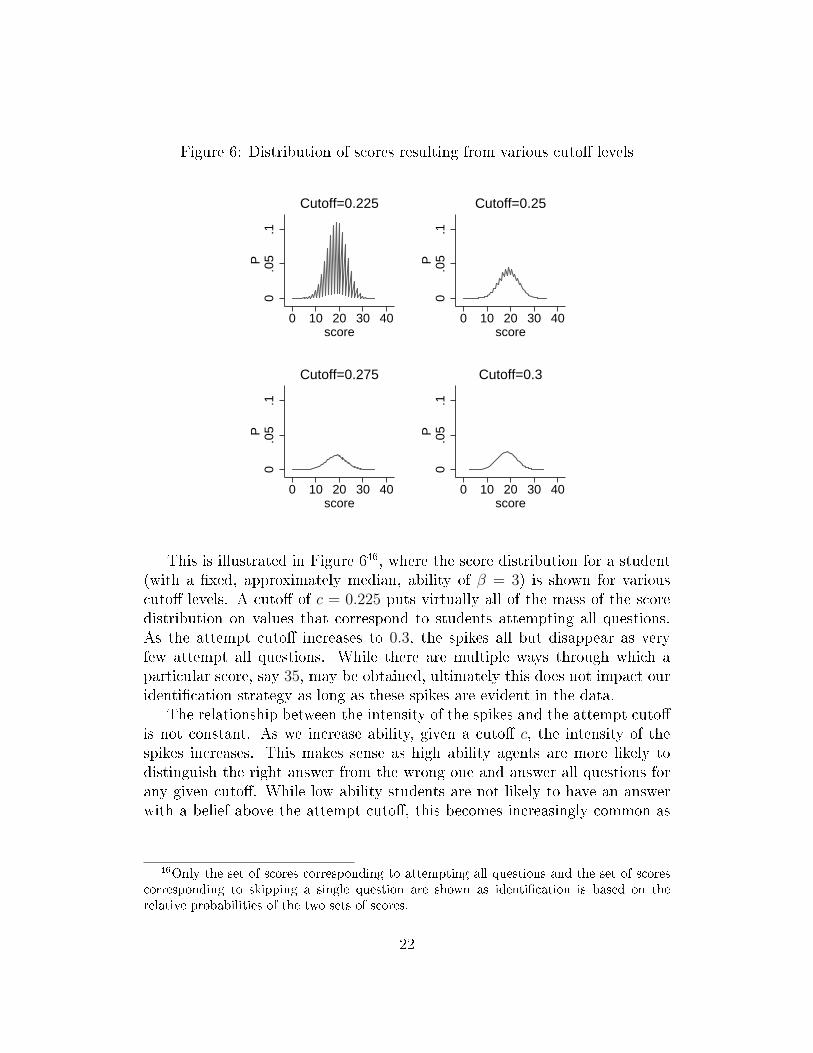
Figure 6: Distribution of scores resulting from various cuto� levels
0.0
5.1
P
0 10 20 30 40score
Cutoff=0.225
0.0
5.1
P
0 10 20 30 40score
Cutoff=0.25
0.0
5.1
P
0 10 20 30 40score
Cutoff=0.275
0.0
5.1
P
0 10 20 30 40score
Cutoff=0.3
This is illustrated in Figure 646, where the score distribution for a student(with a �xed, approximately median, ability of β = 3) is shown for variouscuto� levels. A cuto� of c = 0.225 puts virtually all of the mass of the scoredistribution on values that correspond to students attempting all questions.As the attempt cuto� increases to 0.3, the spikes all but disappear as veryfew attempt all questions. While there are multiple ways through which aparticular score, say 35, may be obtained, ultimately this does not impact ouridenti�cation strategy as long as these spikes are evident in the data.
The relationship between the intensity of the spikes and the attempt cuto�is not constant. As we increase ability, given a cuto� c, the intensity of thespikes increases. This makes sense as high ability agents are more likely todistinguish the right answer from the wrong one and answer all questions forany given cuto�. While low ability students are not likely to have an answerwith a belief above the attempt cuto�, this becomes increasingly common as
46Only the set of scores corresponding to attempting all questions and the set of scorescorresponding to skipping a single question are shown as identi�cation is based on therelative probabilities of the two sets of scores.
22

Figure 7: Distribution of scores resulting from di�erent ability levels
0.0
2.04
.06.
08.1
P
−10 0 10 20 30 40score
Ability=1.75
0.0
2.04
.06.
08.1
P
−10 0 10 20 30 40score
Ability=2.5
0.0
2.04
.06.
08.1
P
−10 0 10 20 30 40score
Ability=4.5
0.0
2.04
.06.
08.1
P
−10 0 10 20 30 40score
Ability=6
ability rises. This is shown in Figure 747, where the attempt cuto� is set to0.25 48.
The parameters of the distribution of the ability of a group of students,(µT , µSS) and Σ, are identi�ed by the distribution of scores. An increase in themean parameter µT moves the Turkish score distribution to the right, increas-ing the mean, while an increase in the variance parameter σ2
T increases thevariance of the Turkish score distribution. This is due to a strong relationshipbetween ability and exam scores. Similarly with the Social Science section.Finally, the correlation between Turkish and Social Science ability draws isre�ected in the correlation of scores.
47Only the set of scores corresponding to attempting all questions and the set of scorescorresponding to skipping a single question are shown as identi�cation is based on therelative probabilities of the two sets of scores.
48Ability ranges from approximately the 20th to the 80th percentiles, as estimated
23
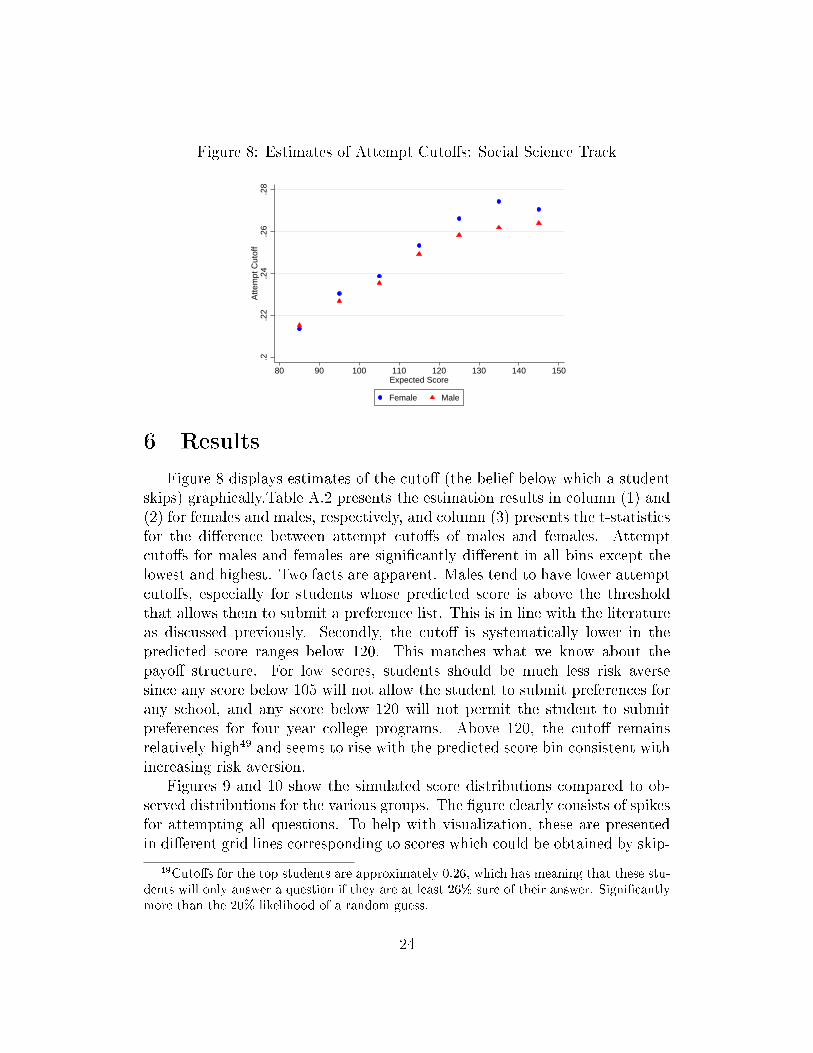
Figure 8: Estimates of Attempt Cuto�s: Social Science Track
.2.2
2.2
4.2
6.2
8A
ttem
pt C
utof
f
80 90 100 110 120 130 140 150Expected Score
Female Male
6 Results
Figure 8 displays estimates of the cuto� (the belief below which a studentskips) graphically.Table A.2 presents the estimation results in column (1) and(2) for females and males, respectively, and column (3) presents the t-statisticsfor the di�erence between attempt cuto�s of males and females. Attemptcuto�s for males and females are signi�cantly di�erent in all bins except thelowest and highest. Two facts are apparent. Males tend to have lower attemptcuto�s, especially for students whose predicted score is above the thresholdthat allows them to submit a preference list. This is in line with the literatureas discussed previously. Secondly, the cuto� is systematically lower in thepredicted score ranges below 120. This matches what we know about thepayo� structure. For low scores, students should be much less risk aversesince any score below 105 will not allow the student to submit preferences forany school, and any score below 120 will not permit the student to submitpreferences for four year college programs. Above 120, the cuto� remainsrelatively high49 and seems to rise with the predicted score bin consistent withincreasing risk aversion.
Figures 9 and 10 show the simulated score distributions compared to ob-served distributions for the various groups. The �gure clearly consists of spikesfor attempting all questions. To help with visualization, these are presentedin di�erent grid lines corresponding to scores which could be obtained by skip-
49Cuto�s for the top students are approximately 0.26, which has meaning that these stu-dents will only answer a question if they are at least 26% sure of their answer. Signi�cantlymore than the 20% likelihood of a random guess.
24

Figure 9: Data vs Simulated Score Distribution: Social Science
0.0
2.0
4.0
6.0
8D
ensi
ty
−11.25 −5 1.25 7.5 13.75 20 26.25 32.5 38.75 45Raw Social Science Score
Real Social Science Score
0.0
2.0
4.0
6.0
8D
ensi
ty
−11.25 −5 1.25 7.5 13.75 20 26.25 32.5 38.75 45Raw Social Science Score
Simulated Social Science Score
ping no questions. While the estimation procedure was designed only to matchsubgroups of the sample, the entire simulated distribution �ts the data rela-tively well overall. It is worth noting that estimation methods which groupedstudents based on actual track (ÖSS-SÖZ) score did better here.
Estimates of the parameters governing the distribution of ability for eachgroup are presented in Table A.3. Recall that ability is parametrized as (1 +eψ, 1 + eψ), where ψ ∼ N(µ,Σ). The means and variances of the componentsof ψ in each group are presented.
As we estimate the distributions for students in the Social Science track,di�erences in ability distributions could come from selection into this trackas well as di�erences given selection. For example, if the track was seen asfriendly to females in some way, it might attract more females, especiallyweak ones, with better females going into less female-friendly tracks. Withthis quali�cation, we see that females tend to have higher ability in Turkish,but slightly lower ability in Social Science, when compared to males in thecorresponding group.50 This is consistent with males having a comparativeand absolute advantage in Social Science and is consistent with �ndings inthe literature that females have the advantage in Language skills (See Lynn(1992)).
In addition, we observe that males tend to have higher variance in their
50The estimated ability distributions for the two sections of the test are depicted in FigureA.2-A.3b in Appendix A.
25

Figure 10: Data vs Simulated Score Distribution: Turkish
0.0
2.0
4.0
6.0
8D
ensi
ty
−11.25 −5 1.25 7.5 13.75 20 26.25 32.5 38.75 45Raw Turkish Score
Real Turkish Score
0.0
2.0
4.0
6.0
8D
ensi
ty
−11.25 −5 1.25 7.5 13.75 20 26.25 32.5 38.75 45Raw Turkish Score
Simulated Turkish Score
distribution of ability. In fact, the variance is greater for all groups.51 Thecorrelation between ability in Turkish and Social Science seems to be higherfor each deciles for females, as seen in Table A.4. This would tend to givefemales an advantage in terms of being at the top: in order to gain admissionstudents must perform well in both Turkish and Social Science. It would alsoexplain the higher variance for males.
We assume that all questions are at the same level of di�culty in both themodel and estimation procedure. This assumption is necessary as we do notobserve item level responses. Would this create biases in our estimation? Wecheck for this using simulations.
We examine data from a mock exam, aimed to prepare Social Sciencetrack students for the university entrance exam by using an extended versionof our model that can be used with a data set that includes item-by-itemresponses.52 Having recovered question di�culty parameters (in addition toindividual student ability and risk aversion), we are able to see the e�ect onscore distributions of having questions of a uniform level of di�culty. We �rst�nd the expected score of the median student with the original questions. Wethen �nd the level of di�culty which, if all questions were to have identicaldi�culty, would give the same expected score to the median student. Com-
51The estimated ability distributions for Turkish and Social Sciences by gender re�ectthis higher variance as in Figures A.2 and A.3a.
52The details of the model and the estimates are available upon request.
26

paring score distributions, we �nd that the variance of the median student'sscore would be 9% higher with questions of constant di�culty, as opposed tothe variance obtained with the original questions.53 On the one hand, havingmore homogeneous questions removes one source of variability. On the other,the level of di�culty matters: if the exam is di�cult, then the median stu-dent facing the average di�culty question will guess more often than when thequestions are of variable di�culty. For this reason, we think of our estimateson variance as being an upper bound, and this explains why some of them arelocated at the boundary.
We also run the model for the Language test in the Language track andthe Turkish exam in the Turkish-Math track as a robustness check. These arepresented in Appendix B.2. It is reassuring to note that the estimates look alot like those above, despite the raw data looking quite di�erent.
7 Counterfactuals
Having recovered the parameters regarding risk aversion exhibited by stu-dents in the multiple-choice tests, in addition to estimates regarding the dis-tribution of ability (as measured by β for each subject, the parameter in thePareto distribution that governs dispersion of signals), we are now able toperform counterfactual experiments.
In these experiments, we will compare outcomes of a number of testingregimes, and student behaviors. For example, how would exam outcomesdi�er if all students attempted (answered) every question, as would happen ifthe penalty for answering incorrectly were removed. This is relevant becauseit is fully feasible to change the testing regime, and the regime may well a�ectoutcomes. Our focus is on two points. First we look at the gender gap,de�ned as the over-representation of males at the top of the score distribution.This comes both from ability di�erences and from di�erences in behavior.In particular we will quantify the impact of risk aversion di�erences on testoutcomes as the test format changes. Second, we look at the e�ectiveness ofa test as the format varies. E�ectiveness is de�ned as the extent to whichperformance matches abilities. The rationale behind penalties is to reduce theamount of random guessing, therefore reducing score variance and improvinge�ectiveness. The downside is that as females seem to be signi�cantly more riskaverse than males, this accentuates the gender gap. Our focus is to understandthe extent of this trade-o�.
53Similar results when looking at the 25th and 75th percentile students: 10% and 7%(respectively) higher variance with constant di�culty.
27

For this reason we consider seven possible regimes in our counterfactualexperiments. These are:
1. The baseline model, as estimated in the previous section.
2. All students attempt all questions. This is equivalent to assuming thatall students are risk neutral, and identical to removing the penalty foranswering incorrectly. Both would cause rational students to answerevery question.54
3. Risk preferences of females are altered, so that the cuto� used by awoman in predicted ÖSS-SÖZ score interval k is changed to that used bya man in predicted ÖSS-SÖZ score interval k (labeled as �Equal Cuto�s�in the �gures). Note that the second regime eliminates risk aversiondi�erences across gender, and makes all agents risk neutral. The thirdregime keeps risk aversion, but eliminates the gender di�erences in riskaversion. While this is not feasible to perform in practice, we can usethe counterfactual exercise to quantify the e�ect of gender di�erences inrisk aversion in the current system.
4. Each question has only four answers to choose from, with the penalty foran incorrect answer adjusted accordingly. This will increase the impact ofrisk aversion and accentuate the gender gap and hinder the e�ectivenessof the exam. Reducing the number of choices makes the gamble involvedin answering have higher stakes. This should exacerbate the e�ect ofdi�erent risk preferences across the genders. In the default regime, thereare �ve answers, with a single point for correct answers and a quarterpoint lost for incorrect answers. This results in an expected gain ofzero from a random guess; accordingly, we set the penalty equal to onethird of a point in the four answer scenario, resulting in a random guesshaving an expected gain of zero. As a result, the cuto�s for attemptinga question must be di�erent. To convert cuto�s from the �ve answercase, we assume a CARA utility function, and solve for the risk aversionparameter that generates a given cuto�. This is repeated for each group.We then convert the risk aversion parameter to a cuto� in the four answercase.55 Note that having four answers instead of �ve, and increasing the
54In this case, scores would need to be rescaled to re�ect the absence of such a penalty:instead of ranging from −11.25 to 45, they would range from 0 to 45.
55For example, a cuto� of 0.240 in the �ve answer case implies risk aversion coe�cientof 0.383 (CARA utility), which results in a cuto� of 0.300 in the four answer case.
28

penalty accordingly, can increase variances of scores for a given studenteven in the absence of risk aversion.56
5. The penalty for answering incorrectly is increased from 0.25 points to1 point. This will accentuate the gender gap but increase e�ectivenessas guessing is reduced. This counterfactual is designed to elicit moreskipping from students and to amplify the impact of di�erences in riskpreference across the genders. As in the four-answer counterfactual,cuto�s are translated into implied CARA parameters and new cuto�sare obtained for both counterfactuals.
6. The number of questions in each section is doubled, from 45 to 90. Thiswill improve the e�ectiveness of the exam and can increase the gendergap if males are more prevalent at higher abilities. This allows us to placeresults in the context of a more precise exam: increasing the number ofquestions increases the ability of the exam to distinguish students basedon ability.
For each of the six possible regimes, we �nd the resulting distributions ofscores for the entire sample of (�rst time takers) students in the Social Sciencetrack.
We simulate the model using the parameters estimated,57 generating scoresin the Turkish and Social Science section, adding the two to generate an examscore for each student.58 We then segment students into bins by using thetotal score. The bins are constructed such that �ve percent of students are ineach bin, so that we observe the 5% of students who perform the worst, the5% who perform the best etc.59
We �rst examine the e�ect of the di�erent regimes on the ability of the examto select the most capable students. To do so we look into the relationshipbetween exam score percentile and (average log) ability in the two subjects,Turkish and Social Science. Figures 11 and 12 show the di�erence betweenthe counterfactual of interest and the baseline model. A positive value for a
56The standard deviation of the points earned for a single question is, for a student of(approximately median) ability β = 3, 0.66 (four answers) vs 0.62 (�ve answers) i.e. scoresare more precise when there are �ve answers than when there are four answers. For a studentof ability β = 6 (approximately the top 10%) the standard deviation is 0.58 vs 0.56.
571000 students were simulated for each student observed in the data.58We did not simulate scores from math and science as the majority of students skipped
these sections, and scores of those who attempted were close to zero.59As seen in Figures A.4a and A.4b in the Appendix, the exams do sort by ability as
higher score percentiles are associated with higher average ability in all the regimes studied.
29

score percentile means that the ability of students in that score percentile ishigher in the counterfactual than in the baseline model. A regime that deliversa positive value on the right (high scoring students) and a negative value onthe left (low scoring students) would be preferred to the baseline model, as itmore correctly identi�es the strong and weak students.
Figure 11: Turkish Ability (∆ vs baseline)
−.1
−.0
50
.05
.1∆
Ave
rage
log
Tur
kish
Abi
lity
0 20 40 60 80 100Score Percentile
Attempt All Equal Cutoffs Four Answers Quadrupled Penalty Number of Questions Doubled
As the Turkish and Social Science abilities show very similar patterns, theywill be discussed jointly. We see that the �Attempt All�, �equal cuto�s�, and�four answers� regimes show very little di�erence in terms of the quality of ad-mitted students in Figures 11 and 12 consistent with the small di�erences inrisk aversion estimated. Although the di�erences between the higher penaltyregime and the baseline are small, higher penalties clearly do a better jobat sorting. Average abilities under these regimes are lower than the baselineon the left (more accurately identifying weak students)60 and higher than the
60With the exception of the quadruple penalty regime for the lowest ventile. Examiningmore carefully, the lowest 5% actually has a higher average ability than the second lowest5% (see Figures A.4a and A.4b). This is not due to any risk aversion di�erences (the patternremains even if all students are given the same cuto� of 0.25). The explanation is simple:The bottom 5% tends to consist of students who attempted questions and had bad luck.Since attempting is related to a higher ability we observe this interesting pattern.
30

Figure 12: Social Science Ability (∆ vs baseline)
−.0
50
.05
.1∆
Ave
rage
log
Soc
ial S
cien
ce A
bilit
y
0 20 40 60 80 100Score Percentile
Attempt All Equal Cutoffs Four Answers Quadrupled Penalty Number of Questions Doubled
baseline on the right (more accurately identifying strong students). The pat-tern of di�erences between the baseline and the �number of questions doubled�regime is similar, suggesting this also improves sorting.
The reason for the higher e�ectiveness of the high penalty regime is simple.It strongly discourages attempting when the student is relatively uncertain oftheir answer. This results in much less guessing which reduces the variancein the score distributions of an individual student, resulting in a cleaner sig-nal. The downside is that their partial knowledge will not be conveyed asstudents will skip even when they have some knowledge of the right answerand di�erences in risk aversion by gender will have more of an impact.
Both greater penalties for wrong answers and more questions improve theability of the exam to sort students. How do they compare to each other?The impact of the increased penalties on average abilities of combined scorequantiles is most evident for the top quantiles. Note that the top 13.5%roughly get admission in the Social Science track. We �nd that an additional25 questions (70 in total) must be asked in each section in order for the baselinemodel to have a comparable admitted class, to the 45 question, quadrupled
31

penalty version.61
Finally, we examine the impact of the various regimes on the fraction ofmales in the di�erent score percentiles. In particular, we want to see if there isany e�ect on the (over)-representation of males in the top scoring percentiles:the gender gap. Lower risk aversion raises the presence of males at the topand the bottom. Thus the male fraction is U shaped as shown in Figure 13.
Figure 13: Male Fraction Counterfactuals
.5.5
5.6
.65
.7.7
5M
ale
Fra
ctio
n
0 20 40 60 80 100Score Percentile
Attempt All Equal Cutoffs Four Answers Quadrupled Penalty Number of Questions Doubled
In the baseline model, the top 10% of student (by score) are 42% females.But females are 44% of the Social Science track �rst time takers: a 2% gendergap against females. Examining Figure 14, we see that risk aversion doesnot appear to be a major component of the gender gap. There is a minimalreduction in the gender gap if we were to eliminate skipping, or eliminaterisk aversion di�erences. The impact on the gender gap of the remainingcounterfactuals, while slightly higher, remains small.
Why do risk aversion di�erences seem to matter so little? There are tworeasons. Firstly, there is a relatively low chance that a student has a belieflying between 0.23 and 0.25, for a given question. Secondly, if the belief does lie
61Alternatively, if the penalty were quadrupled, the number of questions in each sectioncould be reduced to only 27 yet would retain equivalent validity.
32

Figure 14: Male Fraction (∆ vs baseline)
−.0
4−
.02
0.0
2.0
4.0
6∆
Mal
e F
ract
ion
0 20 40 60 80 100Score Percentile
Attempt All Equal Cutoffs Four Answers Quadrupled Penalty Number of Questions Doubled
in this region, the expected gain from answering (and hence that from havinga low cuto�) is at most 0.0625 points. Even when the penalty is raised, leadingto more skipping behavior, the total e�ect on allocations is minor. Essentially,di�erences in choices made due to skipping behavior are not common, andwhen they do arise have small consequences. Intuitively, this is like sayingthat while ordering at a restaurant, the best option is usually clear, and whenit is not, the choice made has little consequence.
The small impact of risk aversion, especially for students with high ability,is clear when examining Table 1. A student with a cuto� of 0.275 with abilityβ = 4 (approximately top 25%) has an expected score 0.09 lower than a riskneutral student of the same ability. The impact on students in the top 10% iseven smaller.
33

Table 1: Question outcomes for various parameter values: probabilities ofskipping (S), being correct (C), being incorrect (I), expected score out of 45,and the reduction in expected score as compared to a risk neutral student ofthe same ability
β Cuto� Prob(S) Prob(C) Prob(I) Expected Score Loss vs Risk Neutral2 0.2 0 0.405 0.595 11.57 -2 0.225 0.012 0.403 0.585 11.57 0.002 0.25 0.085 0.386 0.529 11.43 0.142 0.275 0.192 0.359 0.449 11.12 0.452 0.3 0.303 0.328 0.370 10.58 0.992 0.325 0.403 0.297 0.300 9.99 1.583 0.2 0 0.535 0.465 18.86 -3 0.225 0.003 0.534 0.463 18.86 0.003 0.25 0.030 0.528 0.442 18.81 0.053 0.275 0.081 0.515 0.404 18.63 0.233 0.3 0.143 0.498 0.360 18.36 0.503 0.325 0.208 0.478 0.315 17.96 0.904 0.2 0 0.619 0.381 23.58 -4 0.225 0.001 0.619 0.380 23.58 0.004 0.25 0.017 0.616 0.368 23.58 0.004 0.275 0.049 0.608 0.344 23.49 0.094 0.3 0.091 0.596 0.314 23.27 0.314 0.325 0.137 0.581 0.281 23.00 0.58
34

8 Conclusions
In this paper, we construct a structural model of a student's decision toattempt/skip a question in a multiple-choice exam in the presence of a guessingpenalty. Di�erent from the Item Response Theory (IRT) models such as theRasch Model, our model can deal with skips. We identify the risk aversionparameter of the model by using the idea that the lack of risk aversion makescertain scores more likely which creates spikes in the score distribution. Byusing our model, we investigate two questions: the extent to which multiple-choice exams with negative marking are biased against females versus theirbetter performance in terms of the e�ectiveness of the exam.
It has long been a puzzle why females do worse than males in universityentrance exams, despite doing better in school. One reason might be greaterrisk aversion on the part of females which reduces their performance in multiplechoice exams. Overall we �nd that while females do act in a more risk-aversemanner, the impact of this is relatively limited in terms of performance andthe prevalence of females in the group admitted to the university.
Thus, we need to look elsewhere to match the above puzzle quantitatively.A hypothesis worth exploring is the extent to which this arises from femalesputting in less e�ort in high stakes exams because they have less at stake.To the extent that females are less likely to work, or more likely to take timeo�, their gains from expending e�ort would fall, and this could explain theirpoorer performance in high stakes exams.
We also �nd that negative marking has a considerable impact on the ef-fectiveness of the exam: a penalty of -1 is similar to doubling the number ofquestions. Moreover, it does so with a minimal impact on gender bias.
References
Agnew, J. R., Anderson, L. R., Gerlach, J. R., and Szykman, L. R. (2008).Who chooses annuities? an experimental investigation of the role of gender,framing, and defaults. The American Economic Review, 98(2):418�422.
Ahmadi, A. and Thompson, N. A. (2012). Issues a�ecting item response theory�t in language assessment: A study of di�erential item functioning in theiranian national university entrance exam. Journal of Language Teaching &Research, 3(3).
Atwater, A. and Saygin, P. O. (2020). Gender di�erences in leaving questionsblank on high-stakes standardized tests. Mimeo.
35

Baker, E. L., Barton, P. E., Darling-Hammond, L., Haertel, E., Ladd, H. F.,Linn, R. L., Ravitch, D., Rothstein, R., Shavelson, R. J., and Shepard, L. A.(2010). Problems with the use of student test scores to evaluate teachers,volume 278. Economic Policy Institute Washington, DC.
Baldiga, K. (2014). Gender di�erences in willingness to guess. Management
Science, 60(2):434�448.
Becker, W. E. and Johnston, C. (1999). The relationship between multiplechoice and essay response questions in assessing economics understanding.Economic Record, 75(4):348�357.
Ben-Shakhar, G. and Sinai, Y. (1991). Gender di�erences in multiple-choicetests: The role of di�erential guessing tendencies. The Journal of Educa-
tional Measurement, 28(1):23�35.
Bereby-Meyer, Y., Meyer, J., and Flascher, O. M. (2002). Prospect theoryanalysis of guessing in multiple choice tests. Journal of Behavioral DecisionMaking, 15(4):313�327.
Bernardo, J. (1998). A decision analysis approach to multiple-choice exami-nations. Applied Decision Analysis, IV:195�207.
Bickel, J. E. (2010). Scoring rules and decision analysis education. Decision
Analysis, 7(4):346�357.
Budescu, D. and Bar-Hillel, M. (1993). To guess or not to guess: A decision-theoretic view of formula scoring. Journal of Educational Measurement,30(4):277�291.
Burgos, A. (2004). Guessing and gambling. Economics Bulletin, 4(4):1�10.
Charness, G. and Gneezy, U. (2012). Strong evidence for gender di�erences inrisk taking. Journal of Economic Behavior & Organization, 83(1):50�58.
Co�man, K. B. and Klinowski, D. (2020). The impact of penalties for wronganswers on the gender gap in test scores. Proceedings of the National
Academy of Sciences, 117(16):8794�8803.
Croson, R. and Gneezy, U. (2009). Gender di�erences in preferences. Journalof Economic Literature, 47(2):448�474.
Direr, A. (2020). E�cient scoring of multiple-choice tests. Available at SSRN
3546770.
36

Du�e, D. and Singleton, K. J. (1993). Simulated moments estimation ofmarkov models of asset prices. Econometrica, 61(4):pp. 929�952.
Ebenstein, A., Lavy, V., and Roth, S. (2016). The long-run economic conse-quences of high-stakes examinations: evidence from transitory variation inpollution. American Economic Journal: Applied Economics, 8(4):36�65.
Eckel, C. C. and Grossman, P. J. (2008a). Forecasting risk attitudes: Anexperimental study using actual and forecast gamble choices. Journal of
Economic Behavior & Organization, 68(1):1�17.
Eckel, C. C. and Grossman, P. J. (2008b). Men, women, and risk aversion:Experimental evidence. Handbook of Experimental Economics, 1(113):1061�1073.
Espinosa, M. P. and Gardeazabal, J. (2010). Optimal correction for guessing inmultiple-choice tests. Journal of Mathematical Psychology, 54(5):415�425.
Espinosa, M. P. and Gardeazabal, J. (2013). Do students behave rationallyin multiple choice tests? evidence from a �eld experiment. Journal of Eco-nomics and Management, 9(2):107�135.
Frederiksen, N. (1984). The real test bias: In�uences of testing on teachingand learning. American Psychologist, 39(3):193.
Funk, P. and Perrone, H. (2016). Gender di�erences in academic performance:The role of negative marking in multiple-choice exams.
Gerbing, D. W. and Anderson, J. C. (1988). An updated paradigm for scaledevelopment incorporating unidimensionality and its assessment. Journal
of marketing research, 25(2):186�192.
Gourieroux, C. and Monfort, A. (1997). Simulation-based econometric meth-
ods. Oxford University Press.
Hansen, L. P. (1982). Large sample properties of generalized method of mo-ments estimators. Econometrica: Journal of the Econometric Society, pages1029�1054.
Iriberri, N. and Rey-Biel, P. (2019). Brave boys and play-it-safe girls: Genderdi�erences in willingness to guess in a large scale natural �eld experiment.
37

Kubinger, K. D., Holocher-Ertl, S., Reif, M., Hohensinn, C., and Frebort, M.(2010). On minimizing guessing e�ects on multiple-choice items: Superiorityof a two solutions and three distractors item format to a one solution and �vedistractors item format. International Journal of Selection and Assessment,18(1):111�115.
Lynn, R. (1992). Sex di�erences on the di�erential aptitude test in british andamerican adolescents. Educational Psychology, 12(2):101�102.
Pekkarinen, T. (2015). Gender di�erences in behaviour under competitivepressure: Evidence on omission patterns in university entrance examina-tions. Journal of Economic Behavior & Organization, 115(C):94�110.
Riener, G. and Wagner, V. (2017). Shying away from demanding tasks? ex-perimental evidence on gender di�erences in answering multiple-choice ques-tions. Economics of Education Review.
38
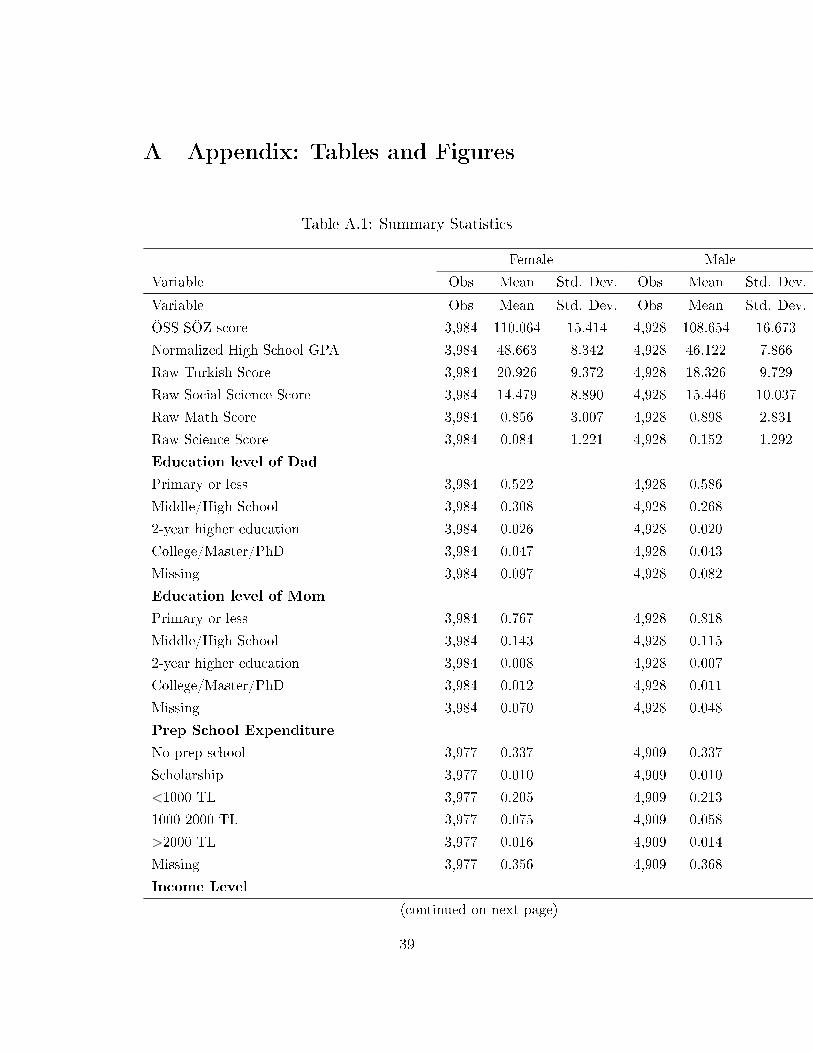
A Appendix: Tables and Figures
Table A.1: Summary Statistics
Female Male
Variable Obs Mean Std. Dev. Obs Mean Std. Dev.
Variable Obs Mean Std. Dev. Obs Mean Std. Dev.
ÖSS-SÖZ score 3,984 110.064 15.414 4,928 108.654 16.673
Normalized High School GPA 3,984 48.663 8.342 4,928 46.122 7.866
Raw Turkish Score 3,984 20.926 9.372 4,928 18.326 9.729
Raw Social Science Score 3,984 14.479 8.890 4,928 15.446 10.037
Raw Math Score 3,984 0.856 3.007 4,928 0.898 2.831
Raw Science Score 3,984 0.084 1.221 4,928 0.152 1.292
Education level of Dad
Primary or less 3,984 0.522 4,928 0.586
Middle/High School 3,984 0.308 4,928 0.268
2-year higher education 3,984 0.026 4,928 0.020
College/Master/PhD 3,984 0.047 4,928 0.043
Missing 3,984 0.097 4,928 0.082
Education level of Mom
Primary or less 3,984 0.767 4,928 0.818
Middle/High School 3,984 0.143 4,928 0.115
2-year higher education 3,984 0.008 4,928 0.007
College/Master/PhD 3,984 0.012 4,928 0.011
Missing 3,984 0.070 4,928 0.048
Prep School Expenditure
No prep school 3,977 0.337 4,909 0.337
Scholarship 3,977 0.010 4,909 0.010
<1000 TL 3,977 0.205 4,909 0.213
1000-2000 TL 3,977 0.075 4,909 0.058
>2000 TL 3,977 0.016 4,909 0.014
Missing 3,977 0.356 4,909 0.368
Income Level
(continued on next page)
39

Female Male
Variable Obs Mean Std. Dev. Obs Mean Std. Dev.
<250 TL 3,913 0.427 4,857 0.485
250-500 TL 3,913 0.409 4,857 0.372
500-750 TL 3,913 0.104 4,857 0.088
750-1000 TL 3,913 0.033 4,857 0.030
1000-1500 TL 3,913 0.015 4,857 0.014
1500-2000 TL 3,913 0.007 4,857 0.005
>2000 TL 3,913 0.005 4,857 0.005
Time Spent in Math Preparation
<100 hours 3,984 0.117 4,928 0.117
100-200 hours 3,984 0.078 4,928 0.068
>200 hours 3,984 0.022 4,928 0.014
Time Spent in Science Preparation
<100 hours 3,984 0.079 4,928 0.072
100-200 hours 3,984 0.017 4,928 0.013
>200 hours 3,984 0.004 4,928 0.004
Time Spent in Turkish Preparation
<100 hours 3,984 0.075 4,928 0.083
100-200 hours 3,984 0.104 4,928 0.103
>200 hours 3,984 0.046 4,928 0.039
Time Spent in Social Sci. Preparation
<100 hours 3,984 0.078 4,928 0.085
100-200 hours 3,984 0.100 4,928 0.093
>200 hours 3,984 0.064 4,928 0.065
40

Table A.2: Estimates of Risk Aversion Cuto�
Female Male t-stat for (female cuto�-male cuto�)=0(1) (2) (3)
(0,90) 0.2145 0.2151 -0.18(0.0030) (0.0018)
[90,100) 0.2304 0.2269 2.56(0.0011) (0.0008)
[100,110) 0.2387 0.2356 2.92(0.0008) (0.0007)
[110,120) 0.2533 0.2493 2.16(0.0014) (0.0011)
[120,130) 0.2662 0.2585 2.44(0.0027) (0.0017)
[130,140) 0.2744 0.2622 2.59(0.0040) (0.0025)
[140,∞) 0.2706 0.2638 1.23(0.0047) (0.0031)
Standard errors are reported in parentheses.
Table A.3: Estimates of Ability Distribution Parameters
Social Science TestFemale Maleµ σ µ σ
(0,90) -1.13 0.82 -1.37 0.95(0.24) (0.23) (0.17) (0.12)
[90,100) -0.65 0.71 -0.63 0.80(0.04) (0.04) (0.04) (0.03)
[100,110) -0.08 0.60 0.07 0.71(0.02) (0.02) (0.02) (0.02)
[110,120) 0.49 0.56 0.69 0.66(0.02) (0.03) (0.02) (0.02)
[120,130) 1.02 0.48 1.27 0.57(0.03) (0.04) (0.03) (0.03)
[130,140) 1.49 0.44 1.72 0.58(0.04) (0.07) (0.05) (0.04)
[140,∞) 1.92 0.43 2.22 0.34(0.06) (0.08) (0.05) (0.08)Turkish TestFemale Maleµ σ µ σ
(0,90) -0.36 0.69 -0.85 0.78(0.15) (0.12) (0.11) (0.09)
[90,100) 0.08 0.58 -0.15 0.67(0.03) (0.02) (0.03) (0.02)
[100,110) 0.57 0.54 0.39 0.61(0.02) (0.02) (0.02) (0.02)
[110,120) 1.10 0.53 0.92 0.57(0.02) (0.02) (0.02) (0.02)
[120,130) 1.67 0.46 1.43 0.52(0.03) (0.03) (0.03) (0.03)
[130,140) 2.23 0.42 1.98 0.56(0.05) (0.04) (0.05) (0.05)
[140,∞) 2.91 0.62 2.62 0.56(0.09) (0.08) (0.07) (0.09)
Standard errors are reported in parentheses.
41

Table A.4: Estimates of Correlation between logs of Turkish and Social ScienceAbility
Female 1st time takers Male 1st time takers(0,90) 1.000 0.788
n/a (0.021)[90,100) 0.916 0.847
(0.003) (0.004)[100,110) 0.949 0.889
(0.001) (0.002)[110,120) 0.919 0.927
(0.002) (0.001)[120,130) 0.991 0.894
(0.001) (0.004)[130,140) 1.000 0.950
n/a (0.003)[140,∞) 0.863 0.854
(0.018) (0.029)Standard errors are reported in parentheses. Because of thesmall number of observations in the female sample, (0,90)and [130,140) predicted score groups, standard errors can-not be calculated.
Figure A.1: Distribution of Math and Science Test Scores
0.5
11.
52
Den
sity
−11.25 −5 1.25 7.5 13.75 20 26.25 32.5 38.75 45Raw Math Score
Math Score
0.5
11.
52
Den
sity
−11.25 −5 1.25 7.5 13.75 20 26.25 32.5 38.75 45Raw Science Score
Science Score
42
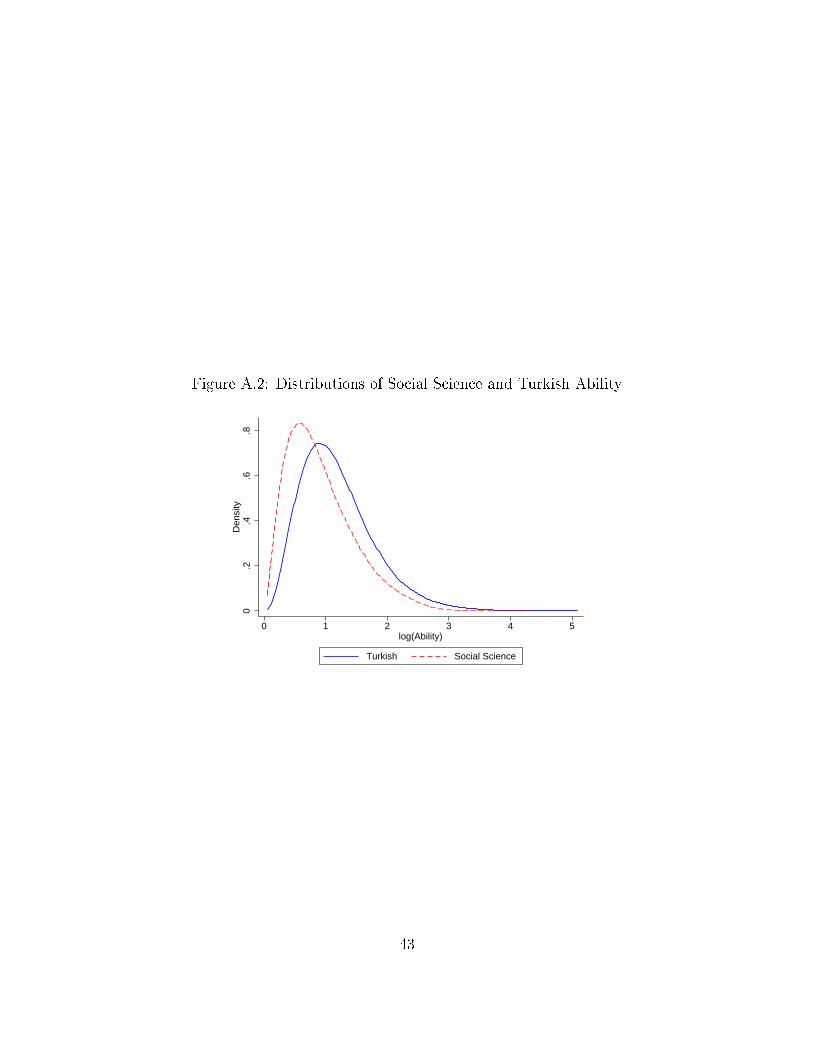
Figure A.2: Distributions of Social Science and Turkish Ability
0.2
.4.6
.8D
ensi
ty
0 1 2 3 4 5log(Ability)
Turkish Social Science
43

Figure A.3: Distributions of Ability by Gender
(a) Social Science
0.2
.4.6
.81
Den
sity
0 1 2 3 4log(Social Science Ability)
Female Male
(b) Turkish
0.2
.4.6
.8D
ensi
ty
0 1 2 3 4 5log(Turkish Ability)
Female Male
44

Figure A.4: Counterfactual Relationship between Ability and Scores
(a) Turkish Ability
.51
1.5
22
.5A
ve
rag
e lo
g T
urk
ish
Ab
ility
0 20 40 60 80 100Score Percentile
Attempt All Equal Cutoffs Four Answers Quadrupled Penalty Number of Questions Doubled
(b) Social Science Ability0
.51
1.5
22
.5A
ve
rag
e lo
g S
ocia
l S
cie
nce
Ab
ility
0 20 40 60 80 100Score Percentile
Attempt All Equal Cutoffs Four Answers Quadrupled Penalty Number of Questions Doubled
45

B Online Appendix
Table B.1: Test Weights
Math Science Turkish Social Science LanguageScience Track (ÖSS-SAY) 1.8 1.8 0.4 0.4 0Social Science Track (ÖSS-SÖZ) 0.4 0.4 1.8 1.8 0Turkish-Math Track (ÖSS-EA) 0.8 0.4 0.8 0.3 0Language Track (ÖSS-DIL) 0 0 0.4 0.4 1.8
B.1 Predicted Social Science Track (ÖSS-SÖZ) Score
Table B.2: Regression to Predict ÖSS-SÖZ Score
Variable Male FemaleNormalized High School GPA 0.760*** 0.643***
(0.013) (0.013)Income Level (base: <250 TL)
250-500 TL 0.359 0.373(0.369) (0.373)
500-750 TL -0.116 -0.361(0.622) (0.595)
750-1000 TL -0.191 -0.589(1.003) (0.985)
1000-1500 TL 0.444 -0.016(1.463) (1.443)
1500-2000 TL 4.522* 0.129(2.541) (2.146)
>2000 TL 4.178 5.668**(2.568) (2.485)
Education level of Mom (base: Primary or less)
Middle/High School 0.387 -0.310(0.566) (0.522)
2-year higher education -1.978 3.023(2.073) (1.874)
College/Master/PhD -0.314 2.369(continued on next page)
46

Variable Male Female(1.786) (1.829)
Missing -0.094 -0.591(0.997) (1.058)
Education level of Dad (base: Primary or less)
Middle/High School 1.292*** 1.059***(0.405) (0.399)
2-year higher education 0.166 -0.124(1.197) (1.070)
College/Master/PhD 2.287** 0.942(0.927) (0.946)
Missing -0.643 0.756(0.785) (0.923)
Time Spent in Math Preparation
<100 hours 2.504*** 3.206***(0.948) (1.081)
100-200 hours 3.876*** 4.742***(1.111) (1.197)
>200 hours 5.573*** 1.071(1.872) (1.718)
Time Spent in Science Preparation
<100 hours 1.981** 0.918(0.783) (0.760)
100-200 hours -0.477 -1.736(1.597) (1.430)
>200 hours -5.832** 2.519(2.933) (2.897)
Time Spent in Turkish Preparation
<100 hours -0.113 -1.416(1.202) (1.437)
100-200 hours -0.539 -1.740(1.183) (1.345)
>200 hours -1.090 -0.094(1.467) (1.552)
Time Spent in Social Science Preparation
<100 hours -1.079 1.954*(1.015) (1.176)
100-200 hours -0.430 2.141**(1.016) (1.091)
>200 hours 1.037 1.622(1.094) (1.170)
Prep School Expenditure (base: No prep school)
(continued on next page)
47

Variable Male FemaleScholarship 4.386** 5.521***
(1.744) (1.691)<1000 TL 5.548*** 3.947***
(0.599) (0.613)1000-2000 TL 5.167*** 5.080***
(0.899) (0.836)>2000 TL 6.247*** 5.371***
(1.655) (1.572)Missing -0.512 -0.219
(0.387) (0.395)Constant 28.128*** 37.628***
(1.400) (1.434)School Type Control Yes YesObservations 4,823 3,894R2 0.550 0.566
48

Proof of the Proposition 2.
∂c(τ)
∂τ=
∂[
exp(kτ)−1exp(kτ)−exp(−τ)
]∂τ
(10)
=k exp(kτ) [exp(kτ)− exp(−τ)]− [exp(kτ)− 1] [k exp(kτ) + exp(−τ)]
[exp(kτ)− exp(−τ)]2
=−k exp(kτ − τ)− exp(kτ − τ) + k exp(kτ) + exp(−τ)
[exp(kτ)− exp(−τ)]2
=−(k + 1) exp(kτ − τ) + k exp(kτ) + exp(−τ)
[exp(kτ)− exp(−τ)]2(11)
As the denominator of the expression is positive, it is enough to show thatthe nominator is positive.
We want to show that
k exp(kτ) + exp(−τ) > (k + 1) exp(kτ − τ)
Divide both sides of the equation by (k + 1) exp(kτ − τ)
k exp(kτ) + exp(−τ)
(k + 1) exp(kτ − τ)> 1
k
k + 1exp(τ) +
1
k + 1exp(−kτ) > 1
Since the exponential function is a strictly convex function, the followinginequality holds
k
k + 1exp(τ) +
1
k + 1exp(−kτ) > exp(
k
k + 1τ − 1
k + 1kτ) = exp(0) = 1
B.2 Other Tracks
So far we have focused on the Social Science track (ÖSS-SÖZ). Our ap-proach can be used for subjects where there is partial knowledge such as theTurkish component in the Turkish-Math and Language tracks. As seen in Ta-ble B.1, the Turkish-Math track (ÖSS-EA) also places high emphasis on theTurkish section of the exam, a section which is well described by the model.The model also applies to the Language section of the Language track (ÖSS-DIL), which as would be expected, accounts for a large part of the student's
49

admission score. We do not use our model on the Math and Science tests. Thisis because of the limited presence of spikes which are a key part of our identi-�cation strategy. The lack of spikes we hypothesize, comes from the questionsbeing of a di�erent type. Science and Math problems have to be worked outand if done correctly, this eliminates all but one answer. As a result, there isa lack of partial knowledge: either the signal is fully informative, or there isno information.
There are some di�erences between the Language exam and the regularexam. First, the Language exam is held separately, some time after the regular(Science, Math, Turkish and Social Science sections) exam. In addition to this,students are able to view the correct answers following the regular exam. Thiswould give the Language track students information regarding their score inthe regular exam. As the Social Science and Turkish sections contribute to theLanguage track score (albeit a small contribution) this information is relevant.Secondly, although the scoring system is the same for each question (1 pointfor correct, -0.25 for incorrect, 5 possibilities and the option to skip), there arein total 100 questions in the Language exam. As previously, we only observethe total section score.
We estimate the model for the Turkish-Math track students, examiningthe Turkish section only. We then estimate the model for the Language trackstudents, examining the Language exam only.
B.2.1 Estimation
Estimation follows that in the main body of the paper. After separat-ing �rst attempt students into predicted ÖSS score bins by gender, we usesimulated method of moments to obtain the distribution of ability, and the at-tempt cuto� for the group. As we are only examining one subject, the abilitydistribution is univariate. Moments to be matched are analogous to before.
To obtain the predicted score bins, we run a regression between score andobservable characteristics, and use predicted values. While the Turkish Mathsection binning process is the same as before, the Language track is slightlydi�erent. As students are able to see the general test questions and correctanswers after the exam, it is reasonable to expect students to accurately deter-mine their score from the Turkish and Social Science sections of the exam, atleast to a reasonable degree. We therefore use the students' actual performancein the general test when predicting their score in the Language exam.
50

B.2.2 Data
Focusing on students making their �rst attempt, we obtain 7972 femalesand 7919 males for the Turkish Math track, and we obtain 9280 females and3681 males for the Language track62.
Separating into score bins, we have sample sizes as shown in Tables B.3and B.4.
The aggregate score patterns can be seen in Figures B.1 and B.2.63 Whilethe Turkish exam section of the Turkish-Math track students looks relativelysimilar to previous histograms, the Language track students illustrate a muchdi�erent pattern. This is due to the large number of questions of the Languagesection: 100 compared to 45 in other sections. As a result, the medium abilitystudents will tend to skip enough questions for the spikes to diminish greatly.While in the other exam sections there were 45 opportunities for a studentto skip a question, in the Language section there are more than double theamount of chances to skip. It follows that there will be more skipped questions,which have the e�ect of reducing the intensity of the spikes, especially in themiddle of the distribution.64 Estimating the model for data showing a verydi�erent aggregate pattern also serves as a robustness check.
Table B.3: Number of observations vs predicted score bin, Turkish-Math track
80-90 90-100 100-110 110-120 120-130 130-140 > 140Male 69 1224 2407 2011 1302 711 195Female 21 825 2406 2137 1408 853 322
Table B.4: Number of observations vs predicted score bin, Language track
80-90 90-100 100-110 110-120 120-130 130-140 > 140Male 259 417 618 735 823 642 187Female 437 798 1299 1828 2181 2062 675
62There were three di�erent foreign language options, each with their own exam. Wechose to focus on the English language students as they were the vast majority. Samplesizes are those for the English language track.
63Gridlines are 1.25 points apart in Figure B.1 and 2.5 apart in Figure B.2.64This was also the location where the spikes were least intense in the social science and
Turkish sections
51

Figure B.1: Turkish Score Distribution of Turkish Math Track Students
0.0
2.0
4.0
6.0
8D
ensi
ty
−11.25 −5 1.25 7.5 13.75 20 26.25 32.5 38.75 45Raw Turkish Score
B.2.3 Results
Estimates of ability distributions for the di�erent groups. For the sake ofbrevity, only the attempt cuto�s are presented.
As before, there are two important patterns. First, as seen in Figures B.3and B.4, the cuto� increases as we move from students who expect to performpoorly to students who expect to perform well. This is in line with expecta-tions, given the payo� structure: students are less risk averse for low scoresas they are below the cuto� for applying. Secondly, males tend to have lowercuto�s than females, i.e., they are less risk averse, and this di�erence tends tobe signi�cant only in higher score bins. Another important observation is thatthese cuto� patterns are very similar to those observed in the Social Sciencetrack. Even the Language track, where the data exhibited very di�erent pat-terns, has a similar pattern of risk aversion, providing further support for themodel and empirical approach.
Note the magnitude of and patterns in the cuto�s, and the degree of dif-ferences between males and females, are relatively similar across tracks. In allthree tracks, cuto�s rise with score and males are less risk averse.
52

Figure B.2: Language Score Distribution of Language Track Students
0.0
2.0
4.0
6.0
8D
ensi
ty
−12.5 0 12.5 25 37.5 50 62.5 75 87.5 100Raw Language Score
Table B.5: Estimates of Attempt Cuto�s for Turkish-Math Track students -Turkish Section
< 90 90-100 100-110 110-120 120-130 130-140 > 140Male 0.2267 0.2338 0.2497 0.2606 0.2669 0.2711 0.2750Female 0.2240 0.2358 0.2534 0.2660 0.2783 0.2823 0.2881
Figure B.3: Estimates of Attempt Cuto�s: Turkish Math Track
.22
.24
.26
.28
.3A
tte
mp
t C
uto
ff
80 90 100 110 120 130 140 150Expected Score
Female Male
53

Figure B.4: Estimates of Attempt Cuto�s: Language Track (English)
.22
.23
.24
.25
.26
.27
Att
em
pt
Cu
toff
80 90 100 110 120 130 140 150Expected Score
Female Male
Table B.6: Estimates of Attempt Cuto�s for Language Track students - Lan-guage Section
<90 90-100 100-110 110-120 120-130 130-140 > 140Male 0.2252 0.2297 0.2395 0.2485 0.2554 0.2596 0.2622Female 0.2233 0.2329 0.2400 0.2525 0.2596 0.2672 0.2618
Table B.7: t-stat for test: (female cuto�-male cuto�)=0
<90 90-100 100-110 110-120 120-130 130-140 > 140Turkish Math Track -0.518 1.199 1.984 2.771 4.764 3.660 2.198Language Track -0.382 0.905 0.237 1.830 2.457 3.836 -0.089
54