Historical change in fish species distribution: shifting reference conditions and global warming...
13
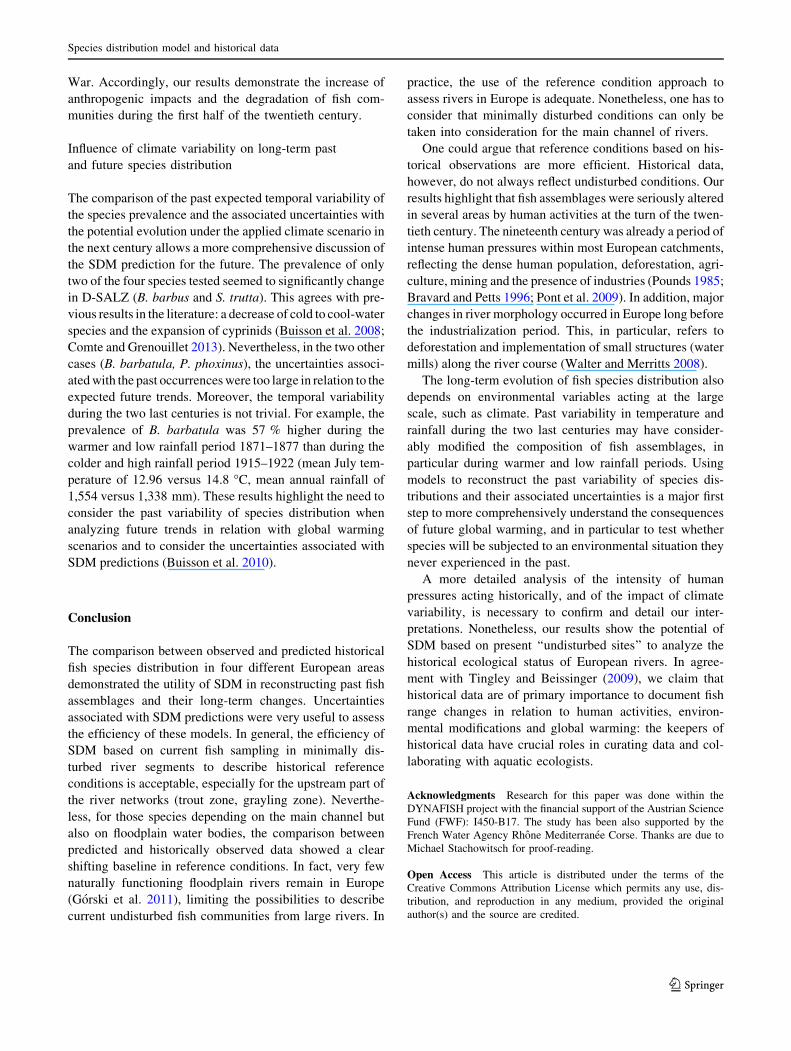
RESEARCH ARTICLE Historical change in fish species distribution: shifting reference conditions and global warming effects Didier Pont • M. Logez • G. Carrel • C. Rogers • G. Haidvogl Received: 17 May 2014 / Accepted: 18 November 2014 Ó The Author(s) 2014. This article is published with open access at Springerlink.com Abstract Species distributions models (SDM) that rely on estimated relationships between present environmental conditions and species presence-absence are widely used to forecast changes of species distributions caused by global warming but far less to reconstruct historical assemblages. By compiling historical fish data from the turn to the middle of the twentieth century in a similar way for several European catchments (Rho ˆne, Danube), and using already published SDMs based on current observations, we: (1) tested the predictive accuracy of such models for past cli- matic conditions, (2) compared observed and expected cumulated historical species occurrences at sub-catchment level, and (3) compared the annual variability in the pre- dictions within one sub-catchment (Salzach) under a future climate scenario to the long-term variability of occurrences reconstructed during an extended historical period (1800–2000). We finally discuss the potential of these SDMs to define a ‘‘reference condition’’, the possibility of a shift in baseline condition in relation with anthropogenic pressures, and past and future climate variability. The results of this study clearly highlight the potential of SDM to reconstruct the past composition of European fish assemblages and to analyze the historical ecological status of European rivers. Assessing the uncertainty associated with species distribution projections is of primary impor- tance before evaluating and comparing the past and future distribution of species within a given catchment. Keywords Historical data Á Species distribution model Á Fish Á Climate change Á Uncertainty Á Reference conditions Á Shifting baseline Introduction For decades, freshwater biodiversity has been recognized as highly threatened due to the long history of anthropo- genic modifications of continental aquatic ecosystems (Dudgeon et al. 2006). Among aquatic species, fish react to almost every kind of water quality and habitat alterations (Ormerod 2003). Fish sensitivity to human pressures is a basis for using fish-based biological monitoring tools to assess environmental change (Fausch et al. 1990). More recently, numerous papers have also pointed out the influence of climate modifications on freshwater ecosys- tems (Webb 1996) and in particular on fish species distributions (Xenopoulos et al. 2005; Graham and Harrod 2009). Long-term changes in climate during the last mil- lennia are well known, particularly those since the end of the little ice age in the mid-19th century (Schurer et al. 2013). Evidence is now accumulating that one of the main This article is part of the special issue ‘Historical ecology of riverine fish in Europe’. D. Pont (&) Irstea UR HBAN, 1 rue Pierre-Gilles de Gennes-CS 10030, 92761 Antony, France e-mail: [email protected] M. Logez Irstea UR HYAX, Po ˆle Onema-Irstea Hydroe ´cologie Plans d’eau, 3275, Route de Ce ´zanne-CS 4006, 13182 Aix-en-Provence Cedex 5, France G. Carrel Á C. Rogers Irstea UR HYAX, 3275 Route de Ce ´zanne-CS 4006, 13182 Aix-en-Provence Cedex 5, France G. Haidvogl Institute of Hydrobiology and Aquatic Ecosystem Management, University of Natural Resources and Life Sciences Vienna, Max-Emanuel-Strasse 17, 1180 Vienna, Austria Aquat Sci DOI 10.1007/s00027-014-0386-z Aquatic Sciences 123
Transcript of Historical change in fish species distribution: shifting reference conditions and global warming...

RESEARCH ARTICLE
Historical change in fish species distribution: shifting referenceconditions and global warming effects
Didier Pont • M. Logez • G. Carrel •
C. Rogers • G. Haidvogl
Received: 17 May 2014 / Accepted: 18 November 2014
� The Author(s) 2014. This article is published with open access at Springerlink.com
Abstract Species distributions models (SDM) that rely
on estimated relationships between present environmental
conditions and species presence-absence are widely used to
forecast changes of species distributions caused by global
warming but far less to reconstruct historical assemblages.
By compiling historical fish data from the turn to the
middle of the twentieth century in a similar way for several
European catchments (Rhone, Danube), and using already
published SDMs based on current observations, we: (1)
tested the predictive accuracy of such models for past cli-
matic conditions, (2) compared observed and expected
cumulated historical species occurrences at sub-catchment
level, and (3) compared the annual variability in the pre-
dictions within one sub-catchment (Salzach) under a future
climate scenario to the long-term variability of occurrences
reconstructed during an extended historical period
(1800–2000). We finally discuss the potential of these
SDMs to define a ‘‘reference condition’’, the possibility of
a shift in baseline condition in relation with anthropogenic
pressures, and past and future climate variability. The
results of this study clearly highlight the potential of SDM
to reconstruct the past composition of European fish
assemblages and to analyze the historical ecological status
of European rivers. Assessing the uncertainty associated
with species distribution projections is of primary impor-
tance before evaluating and comparing the past and future
distribution of species within a given catchment.
Keywords Historical data � Species distribution model �Fish � Climate change � Uncertainty �Reference conditions � Shifting baseline
Introduction
For decades, freshwater biodiversity has been recognized
as highly threatened due to the long history of anthropo-
genic modifications of continental aquatic ecosystems
(Dudgeon et al. 2006). Among aquatic species, fish react to
almost every kind of water quality and habitat alterations
(Ormerod 2003). Fish sensitivity to human pressures is a
basis for using fish-based biological monitoring tools to
assess environmental change (Fausch et al. 1990). More
recently, numerous papers have also pointed out the
influence of climate modifications on freshwater ecosys-
tems (Webb 1996) and in particular on fish species
distributions (Xenopoulos et al. 2005; Graham and Harrod
2009). Long-term changes in climate during the last mil-
lennia are well known, particularly those since the end of
the little ice age in the mid-19th century (Schurer et al.
2013). Evidence is now accumulating that one of the main
This article is part of the special issue ‘Historical ecology of riverine
fish in Europe’.
D. Pont (&)
Irstea UR HBAN, 1 rue Pierre-Gilles de Gennes-CS 10030,
92761 Antony, France
e-mail: [email protected]
M. Logez
Irstea UR HYAX, Pole Onema-Irstea Hydroecologie Plans
d’eau, 3275, Route de Cezanne-CS 4006,
13182 Aix-en-Provence Cedex 5, France
G. Carrel � C. Rogers
Irstea UR HYAX, 3275 Route de Cezanne-CS 4006,
13182 Aix-en-Provence Cedex 5, France
G. Haidvogl
Institute of Hydrobiology and Aquatic Ecosystem Management,
University of Natural Resources and Life Sciences Vienna,
Max-Emanuel-Strasse 17, 1180 Vienna, Austria
Aquat Sci
DOI 10.1007/s00027-014-0386-z Aquatic Sciences
123

species responses to global warming is a shift poleward or
upward in elevation to colonize favorable thermal habitats
(Parmesan and Yohe 2003; Crimmins et al. 2011; Comte
and Grenouillet 2013).
In both cases, human alteration and climate change, the
impact of environmental modifications on species distri-
butions is based on the comparison between an observed or
a predicted situation and a benchmark. In bioassessment
methods, a reference condition is determined from sites
undisturbed by anthropogenic stressors, thus representing
continuity with a former condition (Bailey et al. 1998). In
Europe, most catchment landscapes and rivers have
undergone modifications during the last two centuries.
Undisturbed habitats are becoming increasingly rare and
bioassessment methods generally rely on what are now
judged to be minimally-disturbed sites (Stoddard et al.
2006). Moreover, even for such sites, the distributions of
species could continuously evolve in response to large-
scale anthropogenic disturbance, past changing thermal and
rainfall conditions, and to the expected future climate trend
(Tingley and Beissinger 2009). The term ‘‘shifting base-
line’’ was developed to refer to such long-term changes
over generations which are difficult to recognize (Pauly
1995).
Historical reconstruction of species distribution could
allow testing such ‘‘shifting baseline’’ effects. Numerous
studies have used printed historical information on fish
communities from the late eighteenth and nineteenth cen-
turies to reconstruct the long-term evolution of fish faunas
(Rinne et al. 2005; Maceda-Veiga et al. 2010), to estimate
reference conditions (Carrel 2002; Wolter et al. 2005;
Winter et al. 2009) or to define specific conservation pro-
grams (Worthington et al. 2010). Different types of
historical sources have been identified depending on the
possibility to gain quantitative or only qualitative data at
different scales (Haidvogl et al. 2013a). From the late
eighteenth century on, early scientific fish ecological sur-
veys were conducted compiling scientific inventories and
systematic or selective enquiries of fishermen and fish-
mongers. From the second half of the nineteenth century,
fish distribution maps were also produced in several
catchments across Europe, localizing species occurrences
in precise rivers or river sections (Haidvogl et al. 2015;
Carrel 2002). As opposed to most other written sources,
historical maps are among the most informative because
the aim of the historical maps was to describe the complete
fish fauna and not only the species of commercial interest
(Haidvogl et al. 2013a).
Several authors have attempted to model historical fish
species distribution. Lassalle and Rochard (2009) compiled
literature on past occurrences of anadromous species to
model their distribution before the twentieth century and to
simulate potential change due to climate change. In a
recent work, Labay et al. (2011)—using both historical and
present data—applied species distribution models (SDM)
to establish baseline conditions and to assess the current
status of a river fish community. Such models are also
widely used to predict the change of fish distributions
under climate change scenarios (Austin 2007; Buisson
et al. 2008). A classical approach is to model present fish
distributions based on recent sampling surveys and to
compare the currently forecasted distribution with the
expected distribution under different climate conditions
(Buisson et al. 2008).
The main aim of the present paper was to examine the
ability of SDM to reconstruct historical freshwater fish
assemblages and discuss the implication of using baseline
conditions in the context of predicting species distribution
under changing environmental conditions. The already
published SDM used here are based on current observa-
tions from European rivers qualified as current ‘‘reference
sites’’ (Logez et al. 2012).
The analyses we presented are based on historical spe-
cies occurrence from two large catchments (Upper Danube,
Salzach catchment: late nineteenth—early twentieth cen-
tury, Rhone catchment: first half of the twentieth century).
Our objectives were: (1) to compile historical data in a
comparative manner for these two catchments, (2) to use
the previously published SDM (Logez et al. 2012) to pre-
dict the species occurrences in the historical period and to
compare them with the historical observations, (3) to
compare the SDM’s performances between catchments and
to analyze the capability of predicted occurrences to reflect
the historical community structure within the different
studied catchments, and (4) to compare the annual vari-
ability in the predictions within one sub-catchment
(Salzach) under a future climate scenario to that recon-
structed during an extended historical period (1800–2000).
The main aim of this last point is to evaluate the potential
importance of past and future climatic change on the spe-
cies distributions Finally, we discussed the potential of
these SDMs to define a ‘‘reference condition’’ and the
possibility of a shift in baseline condition within the last
century in relation with climatic variability and/or anthro-
pogenic modification of the river system.
Methods
SDM based on current observations
We applied SDM previously published by Logez et al.
(2012) to evaluate the ability of SDM, based on present
data, to correctly reconstruct historical fish species distri-
butions. These SDM were calibrated using a dataset of
1548 European sites considered as representative of
D. Pont et al.
123

reference conditions. These ‘‘minimally disturbed sites’’
(Stoddard et al. 2006) were selected using an explicit set of
water quality and physical-habitat criteria (Pont et al.
2006). The sites were sampled using electrofishing meth-
ods either by wading or by boat during the last 30 years
(1981–2007).
Four environmental variables were considered to esti-
mate the habitat requirements of species. The upstream
drainage area (UDA in km2) is a descriptor of the position
of the stream reach along the hydrographic network (Pont
et al. 2005) and also reflects habitat diversity because
stream complexity increases along the longitudinal gradi-
ent (Matthews 1998). Stream power (STP, watt m-1) is
‘the rate of potential energy expenditure over a reach or
STP per unit of stream length’ (Gordon et al. 2004). It
varies with both river slope and stream discharge and
reflects the power of a stream to move bed substrate and
change hydraulic conditions, two environmental variables
of primary importance for fish. The mean air temperature
in July (TJUL, �C) was used as a proxy for water tem-
perature, and the thermal amplitude between July and
January (TDIF, �C) allowed considering the annual vari-
ability of thermal condition and the differences between
oceanic and continental climates (definition of the growth
period of fish). TJUL and TDIF were also chosen for their
low correlation in order to limit the multicollinearity
between explanatory variables. As the objective was to
describe the habitat requirements of fish species ‘‘inde-
pendently’’ from local human alterations, these SDM
attempted to avoid parameters overly influenced by
anthropogenic disturbances. For example, the mean annual
discharge value used to estimate STP was a mean annual
run-off, depending only on the annual rainfall and the
annual evaporation over UDA. All the environmental
variables describing climatic conditions (temperature,
rainfall) were averaged over the 10 years before the sam-
pling date in order to consider the mean climatic conditions
prevailing during the life span of most of the fish species
considered.
Logistic regression, a special case of generalized linear
model (GLM) with binomial error distribution, is a clas-
sical statistical method and is recognized for its capability
to estimate a species’ niche (Austin 2007) when the model
includes quadratic terms for environmental variables. In
addition, GLM enables computing confidence intervals
around expected values for a future observation (CI)
(Faraway 2006).
Historical study area
The study area comprised river sections belonging to the
Danube (D) and to the Rhone (R) catchment (Fig. 1). The
Salzach River, with a total catchment area of 6,734 km2
(D-SALZ) is a 225-km-long tributary of the Inn River,
which is itself the largest sub-catchment of the Upper
Danube (251 m3 s-1 at the confluence of the Inn River).
The discharge regime is snow-dominated but with glacial
influences in the southern upstream part of the catchment
(Muhar et al. 1996). The mountainous climate is alpine
with low temperatures and a high annual rainfall.
Downstream from Lake Geneva, the average discharge
of the Rhone River is 340 m3 s-1. Within the French part
of the Rhone catchment (90,000 km2), the studied rivers
belong to three main sub-catchment types. The alpine
tributaries (R-ALPS), situated on the Rhone’s left eastern
bank, flow from the highest alpine mountains. They com-
prised the upper Rhone tributaries (upstream from Lyon),
the river Isere (11,890 km2, 333 m3 s-1) and the upper part
of the Durance catchment. The hydrological regime is both
influenced by rainfall and snowmelt due to the high ele-
vation of these catchments and the dominance of a
mountainous climate. The Rhone valley tributaries (R-
VALL), the most important of which are the rivers Ain
(3,765 km2, 123 m3 s-1), Ardeche (2,376 km2, 65 m3 s-1)
and Drome (1,663 km2, 20 m3 s-1), join the Rhone along
its course. Their catchments are mountainous but with a
hydrological regime linked to rainfall and a Mediterranean-
influenced climate for the southern rivers. Near its mouth,
the Rhone river discharge is 1,701 m3 s-1 with a pluvial
regime, whereas the streamflow regime of the Upper-
Rhone (upstream from the Saone River confluence)
remains influenced by snowmelt. Coming from the north,
the Saone River (R-SAON) is the largest tributary of the
Rhone River (29,950 km2, 400 m3 s-1). The catchment
comprises sedimentary plains surrounded by medium-sized
mountains. The climate is continental and the streamflow
regime depends on rainfall. Conversely to the three others
areas, R-SAON is characterized by a lower elevation and
the dominance of low to moderate river bed slopes.
Historical fish fauna data
Among the different types of written fish historical sources,
historical maps are one of the most informative because (1)
they are based on fish surveys conducted by experts edu-
cated in biology and aimed at depicting the occurrence of
all fish species, and (2) the species occurrences and species
range limits are located on precise river sections of a few
kilometers in length (Haidvogl et al. 2013a). These fish
maps are of great interest as they enable analyzing with
good accuracy the spatial distribution of species and their
habitat requirements during industrialization, prior to the
construction of the large dams and hydropower plants
(Carrel 2002) and just after the end of the little ice age.
Two main sources were used to describe the occurrences
of fish species at the turn of the twentieth century in
Species distribution model and historical data
123

D-SALZ (Fig. 1): the Kollmann’s map (1898) and the
Fishery Cadastre of the Federal State Salzburg (1904).
Information sources were questionnaires completed by the
responsible fishing right owners and administrative
authorities. They provided information about 26 occurring
fish species for the river segments within their responsi-
bility (Haidvogl et al. 2015).
Concerning the three areas within the Rhone catchment,
the historical occurrences of fish species were obtained
from 13 district or catchment fish maps (Fig. 1) drawn
from 1910 to 1956 by Louis Leger (1866–1948) and his
collaborators, providing information about 45 fish species
(Carrel 2002): six maps for R-ALPS (1910,1910,1913,
1931, 1934,1942), four maps for R-VALL (1927, 1945,
1954, 1955), three maps for R-SAON (1924, 1927, 1945).
By the end of the nineteenth century, extensive civil
engineering had already been carried out on Alpine tribu-
taries to provide protection against erosion damage and
flooding, and on the Rhone to improve navigation. No large
hydroelectric dams, however, were operating on the Rhone
itself, with few exceptions downstream of Lake Geneva
(Bravard and Petts 1996).
All these maps provided the list of species and their
location in the different river segments of the hydrographic
network (Fig. 2). For our analyses, fish species were
identified based on current taxonomy (Kottelat and Freyhof
2007). Most fish species could be determined without
doubt, but the identification of some at the species level is
not absolutely certain (e.g. Alburnus alburnus, Leuciscus
leuciscus, Petromyzontidae).
Associated environmental variables
We considered only river segments with an upstream
drainage area greater than 10 km2. The length of the river
segments increased from upstream (7.1 km median length
for upstream drainage area less than 50 km2) to down-
stream (23.7 median length for upstream drainage area over
1,000 km2). A GIS (Arc-GIS) and digital river networks
were used to delineate all river segments defined on the
historical maps and the associated historical fish occur-
rences (Austrian National River Network, French BD
Carthage river network).
In order to predict historical fish species occurrences
using the SDM from Logez et al. (2012), we estimated for
each river segment UDA, STP, TJUL and TDIF. By
intersecting the digital river network with digital elevation
models (Rhone: 250 m resolution, Salzach: 10 m resolu-
tion), we defined UDA for each river segment, the
elevation at the two extremities (of each river segment) and
the river bed slope. For D-SALZ, UDA was obtained from
the CCM-river network (v. 2.1; de Jager and Vogt 2010).
For the Rhone catchment, the air temperature and precip-
itation values were extracted from the Tyndall data center
(spatial resolution 10 9 10 min, Mitchell et al. 2004) for
the periods corresponding to the establishment of the dif-
ferent fish maps. For D-SALZ, the air temperature and
precipitation values were extracted from the Austrian his-
torical temperature database of Chimany et al. (2013)
(spatial resolution 5 min) for the period corresponding to
Kollmann’s map (1891–1899).
R-ALPS
R-SAON
R-VALL
Mediterranean Sea 0 100 km
0 40 km
D-SALZ
Rhône Danube
N
Fig. 1 Studied areas in the
Danube and Rhone catchments:
Salzach River (D-SALZ),
Rhone alpine tributaries (R-
ALPS), Rhone valley tributaries
(R-VALL) and Saone River (R-
SAON)
D. Pont et al.
123

A GIS layer was created for each monthly or yearly
period for, respectively, air temperature and precipitation.
For each river segment and for a considered time period,
the mean monthly air temperatures were obtained by
intersecting the corresponding temperature layers with the
digital river network. The intersection between the tem-
perature/precipitation layers and the layer defining the limit
of the upstream catchment of each of the river segments
allowed computing the mean annual values of temperature
and precipitation for each UDA. The final parameters
describing the climatic conditions (TJU and TDIF) were
averaged over the 10 years before the edition of the his-
torical maps.
Testing SDM for predicting historical observations
We focused on the 14 fish species common to the Rhone
and the Salzach catchments. We predicted their past
occurrences using Logez et al. (2012) SDM and environ-
mental conditions prevailing in the past; these were
compared with historical observations. The models’
goodness of fit was estimated by area under the receiver
operating characteristic curve, (AUC), sensitivity (% pre-
sence correctly predicted), specificity (% absence correctly
predicted) and the overall correct classification rate (Fie-
dling and Bell 1997; Hosmer and Lemeshow 2000). AUC
does not require transformation of the probability to binary
data, and we used this criterion to evaluate the performance
of the 14 models. AUC values range from 0 to 1, where 0.5
indicates that the model’s discrimination is no better than
random sorting and 1 indicates that the model discriminates
perfectly (Swets 1988). The application of these 14 SDM
on our historical data was a ‘‘true’’ external validation and
the AUC’s values were compared to the AUC values of the
cross validation realized by Logez et al. (2012) on present
data.
Fig. 2 Example of an historical map of the Rhone catchment: the Ain district map, upstream from the town of Lyon (Leger 1927). Details from
the area around the town of Pont d’Ain, along the course of the river Ain. The species names are indicated by capital letters
Species distribution model and historical data
123

Observed vs expected occurrences at the regional scale
There is a general scarcity of information at the local scale.
Accordingly, examination of species occurrences across
the watershed by combining historical observations yields
a better understanding of the influence of human activities
on the composition of the fish fauna at a given historical
period (Harding et al. 1998). To evaluate the ability of the
SDM to estimate the historical occurrences of each species
for all sites and at the sub-catchment scale (D-SALZ,
R-ALPS, R-VALL, R-SAON), we computed the cumulated
observed presences (OBS) and the cumulated expected
probabilities (EXP). For each species and each river seg-
ment, we computed the confidence interval (CI 95 %)
around the expected probability value and, by summing up
all the lower and the upper CI limits, we tested the sig-
nificance (5 % level) of the difference between OBS and
EXP; i.e. if OBS was within the range of the cumulated
confidence interval.
To compare the quality of our predictions at the scale of
each of the four areas, we regressed the cumulated
observed occurrences (OBS) of the 14 species on their
cumulated expected probabilities (EXP). If the whole
assemblage of a given area was correctly predicted, we
expected that the coefficient of determination of the
regression would be significant, that the intercept of the
regression line would not be significantly different from
zero, and that the slope would not differ from one (Obe-
rdorff et al. 2001).
Long-term past and future species occurrences
We compared the past variability of species occurrences
(1810–1999) in D-SALZ with the potential future vari-
ability (2000–2069) by computing the 260 annual predicted
probabilities of presence for each river segment. From
1810 to 1999, we used Chimany et al. (2013) to reconstruct
the annual evolution of the climate variables. To examine
the effect of climate change on the distribution of species
in the future, we used the Tyndall Centre for Climate
Change Research Set of Scenarios (Mitchell et al. 2004).
Potential future distributions (2000–2069) were predicted
by the climate expected under SRES scenario A1 (very
rapid economic growth, a global population that peaks in
mid-century, and rapid introduction of new and more
efficient technologies). Future climatic data were derived
and averaged from three global circulation models (GCM),
namely HadCM3 (Gordon et al. 2000), CGCM2 (Flato and
Boer 2001), CSIRO-Mk2 (Hirst et al. 2000). We limited
our predictions to the first two-thirds of the twenty first
century so as not to apply the SDM outside of the range of
the predictors used to calibrate the models. The associated
uncertainties were estimated by computing the ratio
between the mean difference between upper and lower
limits of CI at 95 % and the mean predicted probability
within a given time period. Results are presented for the
species showing the most contrasted temporal pattern.
Results
Within the 936 rivers segments considered (Table 1), 58
species were mentioned for a total number of 3,831 his-
torical occurrences. The 14 studied species represented
68.6 % of these occurrences (D-SALZ: 91 %, Rhone
catchment: 65 %) and they were mainly representative of
three of the classical river types (Huet 1959): from
upstream to downstream, the trout zone (Salmo trutta,
Cottus gobio, Phoxinus phoxinus, Barbatula barbatula),
the grayling zone (Thymallus thymallus) and the barbel
zone (Barbus barbus, Chondrostoma nasus, L. leuciscus,
Lota lota, Squalius cephalus). In contrast, species com-
monly inhabiting downstream river segments (bream zone)
were underrepresented (A. alburnus, Esox lucius, Perca
fluviatilis, Rutilus rutilus) due to the low number of river
segments belonging to this last river type.
SDM performance on historical data
Predictive performances of the models (Table 2) were con-
sidered as good to excellent for nine species (AUC [ 0.8),
acceptable for four species (0.7 \ AUC \ 0.8, S. trutta, P.
phoxinus, B. barbatula, T. thymallus) and poor for C. gobio
(AUC close to 0.5). For this last species, the sensitivity was in
particular very low. For the 13 remaining species, there was
no clear tendency toward a higher specificity than sensitivity
Table 1 Environmental characteristics within the four studied areas: median and minimal-maximal values between brackets
Areas N Elevation UDA SLOPE TJUL TDIF Pann
R-ALPS 240 710 (134–1,379) 63.5 (10.0–12,860) 24.7 (0.2–174.7) 14.33 (5.8–18.7) 15.5 (11.3–17) 1,058 (764–1,427)
R-VALL 316 417 (64–1,103) 39.9 (10.0–69,720) 26.1 (0.4–200.6) 16.5 (12.7–19.7) 14.4 (13–17.5) 796 (690–1,124)
D-SALZ 206 867 (327–2,154) 35.9 (10.1–3,381) 37.3 (1.1–276.9) 14.1 (7.1–17.4) 18 (14.8–22) 1,479 (1,202–1,819)
R-SAON 174 259 (165–594) 65.7 (10.2–27,930) 4.5 (0.1–72.5) 16.5 (14.6–17.9) 14.2 (13.6–17.3) 805 (743–1,065)
UDA upstream drainage area, SLOPE river slope, TJUL monthly temperature in July, TDIF annual temperature range, Pann annual precipitation
D. Pont et al.
123

(respective mean values 0.80 and 0.78). AUC estimated
based on historical data were greater than AUC estimated on
the present data used to calibrate SDM excepted for C. gobio
and S. trutta (Table 2).
Historical fish species distribution at the catchment
level
When considering all the studied sites (Table 3), the sum of
the observed historical occurrences of five species were
within the limits of the confidence intervals at 95 % of
EXP, and could thus be considered as correctly estimated
(B. barbatula, L. lota, P. fluviatilis, R. rutilus and T. thy-
mallus). The presence of A. alburnus, Esox Lucius and of
the four large rheophilic cyprinids C. nasus, L. leuciscus, S.
cephalus and B. barbus, were underestimated by the
models, especially the three last species. For these six last
species, the results were similar when considering the four
studied areas separately, except for R-VALL for E. lucius.
Conversely, S. trutta was the only species overestimated by
the models when considering all sites and three of the four
areas separately (correct estimation for R-ALPS). For the
other species, the ability of the SDM to correctly predict
the historical species occurrences varied between the four
studied areas (Table 3).
In D_SALZ and R-ALPS, OBS and EXP did not differ
for five and six species, respectively. But the occurrences
of only three and one species were correctly predicted in
R-VALL and R-SAON, respectively. In R-SAON, most of
the species were underestimated, except for S. trutta and T.
thymallus (overestimation).
The regressions (Fig. 3) of the 14 species-specific
OBS on the corresponding EXP were highly significant
for D-SALZ, R-ALPS and R_VALL (p \ 0.001), but
only at p \ 0.01 for R-SAON (Table 4). The
determination coefficients were excellent for R-ALPS
and D-SALZ (over 0.91) but lower for R-VALL (0.706).
For R-SAON, only 50 % of the variability of OBS was
explained by EXP. The intercept and the slope of the
regression lines were not statistically different from
respectively zero and one (Table 4) for D-SALZ,
R-ALPS and R-VALL. But these two parameters differed
significantly from, respectively, zero and one for
R-SAON.
Long-term variability
The reconstruction of the potential temporal variability of
the species’ mean annual probabilities of occurrence
enables comparing the past and the potential future species
distribution (Fig. 4). The mean annual rainfall (all mean
values as moving averages over the previous 10 years)
were similar during the nineteenth and twentieth centuries
(1,447 and 1,490 mm, respectively), as were the mean air
temperatures (4.48 and 4.69 �C, respectively). As a con-
sequence, the STP values were quite similar during these
two last centuries. From 2000 to 2069, the mean air tem-
perature would increase by 2.69 �C, rising to 8.4 �C. From
2010 on, the fish have been and will continue experiencing,
each year, a mean air temperature always higher than
maximum air temperature recorded during the last two
centuries (5.64 �C). In contrast, the range of the mean
annual rainfall expected during the first half of the twenty
first century is comparable to the range observed during the
nineteenth and the twentieth century (1,273–1,576 and
1,280–1,555 mm, respectively).
For the past period (1810–1999), the mean annual
expected probabilities and their range for all segments were
as follows: B. barbus 0.008 (0.002–0.028), B. barbatula
0.121 (0.090–0.155), P. phoxinus 0.198 (0.166–0.230) and
Table 2 Goodness-of-fit
statistics of the species
distribution models applied to
the historical data: species
prevalence (Prev), relative
occurrence in % (% Occ), area
under the receiver operating
characteristic curve (AUC),
sensitivity (Sens), specificity
(Spec) and overall correct
classification (OCC)
a AUC obtained by Logez et al.
(2012) with a cross-validation
exercise using the same models
with present data
Species Prev % Occ AUC Sens Spec OCC AUCa
Alburnus alburnus 83 8.9 0.901 0.843 0.803 0.807 0.804
Barbatula barbatula 225 24.0 0.782 0.831 0.653 0.696 0.659
Barbus barbus 105 11.2 0.881 0.800 0.828 0.825 0.859
Chondrostoma nasus 76 8.1 0.858 0.789 0.851 0.846 0.830
Cottus gobio 304 32.5 0.464 0.132 0.889 0.643 0.703
Esox lucius 125 13.4 0.873 0.864 0.764 0.778 0.761
Leuciscus leuciscus 88 9.4 0.880 0.932 0.748 0.765 0.780
Lota lota 40 4.3 0.902 0.850 0.886 0.885 0.741
Perca fluviatilis 86 9.2 0.876 0.826 0.780 0.784 0.744
Phoxinus phoxinus 362 38.7 0.736 0.638 0.739 0.700 0.627
Rutilus rutilus 81 8.7 0.908 0.877 0.796 0.803 0.764
Salmo trutta fario 737 78.7 0.711 0.682 0.698 0.686 0.764
Squalius cephalus 242 25.9 0.869 0.851 0.741 0.769 0.726
Thymallus thymallus 73 7.8 0.745 0.630 0.803 0.790 0.718
Species distribution model and historical data
123

S. trutta 0.961 (0.949–0.975). The associated uncertainties
were very high for B. barbus, high for B. barbatula and P.
phoxinus, and limited for S. trutta.
Under the climatic scenario used in this study, the mean
probabilities for the period 2000–2069 were 0.053 (B.
barbus), 0.168 (B. barbatula), 0.232 (P. phoxinus) and
0.942 (S. trutta) with associated uncertainties of 1.01, 0.58,
0.50 and 0.04, respectively. B. barbus probability
increased regularly and significantly until 2050 in relation
with the temperature change. P. phoxinus also tended to
increase its prevalence, but the associated CI showed that
this species remained in its previous range of variability.
The increase of B. barbatula was clearer, but the overlap
between the CI before and after 2000 was large. S. trutta
decreased quite clearly with a more limited CI overlap
between past and future conditions. Finally, only B. barbus
and S. trutta showed a clear potential change in their
probability of occurrence in the Salzach catchment within
the next century.
Discussion
In this paper, we predicted historical fish species occur-
rences from the nineteenth century to the two-thirds mark
of the twenty first century using present-data-based SDM
and compared these expected values with historically
observed occurrences from four different sub-catchments
located in France and Austria.
SDM performances for historical data
Our results highlight the good predictive performance of
the SDM on historical data for 13 of the 14 studied species.
For all of them except two, the AUC values associated with
the comparison between prediction and historical obser-
vations are higher than AUC values obtained by Logez
et al. (2012) with a cross-validation. In addition, the
present data used to calibrate the models and the historical
occurrences were not obtained using similar sampling
techniques. Present species occurrences were obtained
using classical electro-fishing techniques either by wading
or by boat, depending on stream depth (Pont et al. 2006).
Historical occurrences were based on fish surveys con-
ducted by experts educated in sciences and in collaboration
with professional fishermen.
A major classical problem with such historical data is
that, most of the time, absence is not really registered (i.e.
mainly presence-only data). In our study, this does not
seem to be the case. For the 13 species correctly predicted
by the models, the sensitivity was in general comparable to
specificity, and we conclude that our historical maps yield
accurate information about both species presence andTa
ble
3A
bil
ity
of
the
14
spec
ies-
spec
ific
mo
del
sto
pre
dic
tth
ecu
mu
late
do
bse
rved
his
tori
cal
spec
ies
pre
val
ence
for
all
site
san
dw
ith
inea
cho
fth
efo
ur
studie
dar
eas
(D-S
AL
Z,
R-A
LP
S,
R-V
AL
L,
R-S
AO
N):
cum
ula
ted
ob
serv
edp
rev
alen
ce(O
BS
),cu
mu
late
dex
pec
ted
pro
bab
ilit
ies
(EX
P)
and
95
%co
nfi
den
cein
terv
alas
soci
ated
(CI)
Spec
ies
All
site
sD
-SA
LZ
R-A
LP
SR
-VA
LL
R-S
AO
N
OB
SE
XP
[CI
95
%]
OB
SE
XP
[CI
95
%]
OB
SE
XP
[CI
95
%]
OB
SE
XP
[CI
95
%]
OB
SE
XP
[CI
95
%]
Alb
urn
us
alb
urn
us
83
23
.4[1
3.7
–3
8.4
]6
2.3
[1.3
–4
.3]
93
.3[1
.8–
6.3
]3
01
0.9
[6.6
–1
6.5
]3
86
.9[4
.0–
11
.3]
Ba
rba
tula
ba
rba
tula
22
52
12
.2[1
68
.7–
26
8.8
]7
24
.4[1
7.1
–3
5.8
]3
03
5.7
[25
.9–
51
.0]
10
08
5.2
[69
.9–
10
3.6
]8
86
6.8
[55
.9–
78
.5]
Ba
rbu
sb
arb
us
10
51
8.1
[9.7
–3
6]
10
1.4
[0.6
–3
.8]
30
3.1
[1.7
–7
.0]
45
10
.2[6
.0–
17
.6]
20
3.3
[1.5
–7
.5]
Ch
on
dro
sto
ma
na
sus
76
10
.4[4
.4–
25
.6]
14
0.5
[0.1
–2
.2]
91
.9[0
.9–
4.4
]2
87
.1[3
.1–
15
.8]
25
0.8
[0.2
–3
.1]
Co
ttu
sg
ob
io3
04
33
2.4
[27
0.5
–4
07.5
]8
15
8.9
[43
.9–
79
.0]
11
76
9.7
[53
.0–
92
.2]
34
12
1.7
[10
2.7
–1
42.6
]7
28
2.1
[70
.9–
93
.6]
Eso
xlu
ciu
s1
25
63
.6[4
5.0
–9
0.7
]2
25
.2[3
.3–
8.5
]1
99
.6[5
.9–
16
.1]
19
25
.3[1
8.3
–3
4.7
]6
52
3.5
[17
.5–
31
.3]
Leu
cisc
us
leu
cisc
us
88
60
.9[4
2.7
–8
7.0
]3
2.3
[1.3
–4
.4]
17
7.2
[4.5
–1
2.2
]1
22
9.1
[21
.2–
39
.5]
56
22
.3[1
5.8
–3
1.0
]
Lo
talo
ta4
03
9.1
[22
.4–
67
.3]
78
.6[5
.4–
13
.9]
79
.6[5
.0–
17
.9]
71
1.7
[6.6
–2
0.2
]1
99
.2[5
.4–
15
.3]
Per
cafl
uvi
ati
lis
86
62
.0[4
5.1
–8
6.0
]4
4.2
[2.7
–6
.9]
10
8.4
[5.5
–1
3.1
]1
72
8.8
[21
.8–
38
.1]
55
20
.6[1
5.1
–2
7.9
]
Ph
oxi
nus
ph
oxi
nu
s3
62
28
8.4
[23
6.1
–3
53.1
]4
24
0.1
[29
.4–
55
.4]
45
56
.9[4
2.8
–7
6.6
]1
70
11
2.5
[95
.3–
13
1.6
]1
05
78
.9[6
8.6
–8
9.5
]
Ru
tilu
sru
tilu
s8
18
1.6
[60
.7–
11
0.0
]3
4.5
[2.9
–7
.3]
12
11
.1[7
.5–
16
.8]
17
37
.5[2
8.9
–4
8.4
]4
92
8.5
[21
.4–
37
.4]
Sa
lmo
trutt
afa
rio
73
78
78
.7[8
52
.1–
89
6.1
]1
83
19
7.7
[19
2.0
–2
00.8
]2
23
22
8.9
[22
0.7
–2
33.3
]2
40
29
5.5
[28
8.7
–3
00.8
]9
11
56
.6[1
50
.7–
16
1.2
]
Sq
ua
liu
sce
ph
alu
s2
42
82
.3[6
2.1
–1
09
.1]
18
6.8
[4.5
–1
0.3
]4
71
2.1
[8.6
–1
7.6
]9
33
9.5
[31
.0–
50
.0]
84
23
.9[1
8.1
–3
1.2
]
Th
yma
llu
sth
yma
llu
s7
31
06
.6[6
8.3
–1
69
.4]
47
28
.6[1
8.3
–4
5.8
]1
22
5.0
[15
.1–
43
.6]
93
3.5
[21
.9–
51
.1]
51
9.5
[13
.1–
28
.9]
D. Pont et al.
123

absence. This contrasts with many other historical sources
(fisheries sources, fish trading sources, fish consumption
description), which typically focused only on particular
species of commercial interest (Haidvogl et al. 2013a). The
good performances of the present-data-based models tend
to demonstrate that, in the case of such historical fish maps,
the quality of the historical information provided by these
experts is comparable to that obtained from classical
electrofishing sampling. Nevertheless, as demonstrated by
Lahoz-Montfort et al. (2014), the imperfect detection of
species occurrence can have serious consequences for the
efficiency of SDM, and the quality of presence-absence
data remains a major objective for species distribution
modelling.
A potential limit of our work was the type of statistical
models we used: more recent techniques are considered to
outperform the traditional GLM (Buisson et al. 2010).
Among other methodological limits, SDM are very sensi-
tive to collinearity between predictor variables (Graham
2003). Collinearity has huge effects on prediction quality
as soon as the collinearity between the predictor variables
is modified or if the model is used to predict species’
distributions in new geographic regions or under changed
climatic conditions. Dormann et al. (2013), however,
demonstrated that more recent methods specifically
designed for collinearity did not outperform classical GLM
with respect to sensitivity to collinearity variation. More-
over, Lahoz-Montfort et al. (2014) recently demonstrated
that presence-background methods are equally affected by
false absence as the classical presence-absence method.
Logez et al. (2012) also showed that the model response to
different ecological gradients was in agreement with the
known ecology of the considered species, a point that is as
important as model performance (Austin 2007). Finally,
the ability to associate a confidence interval to the expected
probability provides the opportunity to more precisely
evaluate the quality of the fit between the model and the
observed occurrences at different scales (see below).
0 50 100 150 200
050
150
R-ALPS
0 50 150 250
010
020
030
0
R_VALL
0 50 100 150 200
050
100
200
Obs
erve
dH
ist.
Occ
urre
nces
(OB
S)
D-SALZ
0 50 100 150
050
100
150
Expected Historical Occurrences (EXP)
R-SAON
Fig. 3 Plots of expected (sum of probability values) vs historically
observed occurrence values of the 14 species (black dots) for the four
areas (D-SALZ, R-ALPS, R-VALL, R-SAON). Confidence interval
limits (95 %, hatched lines) around the regression lines (bold solid
lines). Regression line of slope 1 and intercept 0 (solid line)
Table 4 Regressions of the sum of the observed occurrences on the
sum of the predicted occurrences for each of the four studied areas:
determination coefficient (R2), intercept (between brackets: signifi-
cance of Student t test against zero), intercept (between brackets:
significance of Student t test against one)
Areas R2 Intercept Slope
D-SALZ 0.951 (p \ 0.001) 6.702 (ns) 0.916 (ns)
R-ALPS 0.914 (p \ 0.001) 9.065 (ns) 0.953 (ns)
R-VALL 0.736 (p \ 0.001) 11.728 (ns) 0.774 (ns)
R-SAON 0.506 (p \ 0.01) 35.460 (p \ 0.001) 0.508 (p \ 0.01)
Mea
nan
nual
prob
abili
tyM
ean
annu
alpr
obab
ility
Tem
pera
ture
(°C)
Rain
fall
(mm
)M
ean
annu
alpr
obab
ility
Mea
nan
nual
prob
abili
ty
0.10
0.15
0.00
0.05
0.88
0.92
0.96
0.15
0.20
0.25
O.30
0.10
0.15
0.20
0.25
4.0
6.0
8.0
10.0
1100
1300
1500
1800 1900 2000 1800 1900 2000
1800 1900 2000 1800 1900 2000
1800 1900 2000 1800 1900 2000
B. barbatula
P. phoxinus
B. barbus
S. Tru�a
Fig. 4 Evolution of the mean annual air temperature, the mean
annual rainfall (simple moving averages over the previous 10 years),
and the expected variability of four species occurrences within the
Salzach catchment (D-SALZ) from 1810 to 2069: B. barbatula, B.
barbus, P. phoxinus and S. trutta. Mean annual probability of
presence (bold solid line) and associated confidence interval (95 %,
grey lines). From 2000 on, the considered climate values are those
from the IPCC scenario A1
Species distribution model and historical data
123

Shifting baseline reference conditions
Beyond the classical analysis of models, examining species-
specific OBS and EXP at the regional level (sub-catchment)
allows interpreting discrepancies between observed and pre-
dicted historical species distributions within the four areas.
The seven species showing the same relationships between
OBS and EXP for each of the four areas are of primary interest.
The four large cyprinids (C. nasus, L. Leuciscus, S. cephalus
and B. barbus) were always underestimated by our current-
data-based SDM. These species are large rheophilic cyprinids
inhabiting medium-sized to large rivers (barbel zone). B.
Barbus, C. nasus and S. cephalus are potamodromic (Noble
et al. 2007) and undergo migration for reproduction within the
tributaries or the floodplain (Kirchhofer 1996; Schiemer 2000).
Since the late nineteenth century, most of rivers have been
channelized, diked and disconnected from their previous
floodplain (Petts 1984). In Austria, Haidvogl et al. (2013b),
analyzing the historical distributions of B. barbus and C. nasus
in the nineteenth century, showed that, nowadays, they occur in
only 58 and 68 % of their past distributional area.
Similarly, E. lucius occurrences were also underestimated
by SDM. This species lives in slow-flowing waters, migrates
towards floodplains during high discharge periods for
reproduction and has also been severely affected by chan-
nelization (Casselman and Lewis 1996). In addition, the
afforestation of most of the alpine catchments since the end
of the nineteenth century drastically reduced the coarse
sediment load within the river network and induced a shift in
the fluvial dynamics of rivers from aggradation to incision
(Pont et al. 2009). This led to a continuous shrinkage of their
associated floodplains and the favorable habitats for E. lucius
reproduction (D-SALZ, R-ALPS). Our present-data-based
SDMs were calibrated using a dataset of sites not or only
slightly impacted by local anthropogenic pressures. This was
done to describe a ‘‘reference situation’’, following the
minimally disturbed condition concept (Stoddard et al.
2006). Nevertheless, the quasi-absence of medium-sized to
large rivers unaffected by channelization and dike erection
lead to the selection of a calibration dataset of river segments
where the consequences of these long-term hydromorpho-
logical modifications of rivers on the fish communities
cannot be easily noticed. In the case of these four species (C.
nasus, B. barbus, S. cephalus, E. lucius), the shifting baseline
concept is applicable to describe this shift towards the
description of current reference condition differing from
those prevailing in rivers before the late nineteenth century.
Past historical anthropogenic alteration of fish
assemblages
In contrast, the brown trout S. trutta was overestimated by
SDM within each of the four studied areas. It is also the
only species for which AUC estimated based on historical
data were lower than AUC estimated on the present data
used to calibrate SDM. For almost a century, the European
brown trout populations have been largely affected by
stocking because of fishery interest (Bagliniere 1991). This
is one potential explanation for its increased occurrence
nowadays compared to the nineteenth century. In addition,
this species is classified as highly intolerant to human
disturbances (stenothermic, oxygen depletion intolerant
and reproducing only in fast-flowing habitat); it is under-
represented when degraded ecological conditions prevail
(Pont et al. 2006; Noble et al. 2007). Such an interpretation
could also be considered for T. thymallus, another well-
known intolerant species in the Rhone catchment
(R-ALPS, R-VALL, R-SAON). The overestimation of the
occurrence of these two species could then be related to
historical anthropogenic alterations of the studied rivers.
Such a possible impact of anthropogenic pressures can
be analyzed by comparing the ability of our SDM to cor-
rectly predict the historical fish assemblages between the
four studied areas. The high value of the determination
coefficients of the regressions between OBS and EXP for
D-SALZ and R-ALPS demonstrated that our models were
able to correctly describe the structure of the fish assem-
blages in these two areas. Forecasted fish assemblages were
probably not far from the fish assemblage that could be
expected in the absence of significant local anthropogenic
pressures. In contrast, the lower quality of the linear
regressions for R-VALL and R-SAON could be interpreted
as an impact of anthropogenic disturbances affecting the
fish assemblage (Oberdorff et al. 2001). In addition, in the
case of R-SAON, the significant differences of the slope
and the intercept of the regression line from zero and one
highlight the important deviation of the fish assemblage
from the expected one in the absence of major human
disturbance. At the end of the nineteenth century, the
R-VALL and R-SAON catchments were characterized by
high human densities and the dominance of cropland,
whereas the two alpine areas D-SALZ and R-ALPS were
less human-impacted (Goldewijk et al. 2010). The histor-
ical maps describing the R-SAON area reveal the presence
of numerous ponds and canals, and several cases of water
pollution are described (Hesse and Paris 1924). Such
altered ecological conditions could explain the SDM
underestimation of the occurrences of the two tolerant and
slow-flowing species P. fluviatilis and R. rutilus in
R-VALL and R-SAON (Noble et al. 2007), whereas the
observed occurrences of the intolerant species S. trutta and
T. thymallus are much lower than expected. Finally, note
that four of the seven fish maps from R-VALL and
R-SAON have been edited after the Second World War. In
contrast, the D_SALZ map and three of the six fish maps
for R-ALPS were edited before the end of the First World
D. Pont et al.
123
War. Accordingly, our results demonstrate the increase of
anthropogenic impacts and the degradation of fish com-
munities during the first half of the twentieth century.
Influence of climate variability on long-term past
and future species distribution
The comparison of the past expected temporal variability of
the species prevalence and the associated uncertainties with
the potential evolution under the applied climate scenario in
the next century allows a more comprehensive discussion of
the SDM prediction for the future. The prevalence of only
two of the four species tested seemed to significantly change
in D-SALZ (B. barbus and S. trutta). This agrees with pre-
vious results in the literature: a decrease of cold to cool-water
species and the expansion of cyprinids (Buisson et al. 2008;
Comte and Grenouillet 2013). Nevertheless, in the two other
cases (B. barbatula, P. phoxinus), the uncertainties associ-
ated with the past occurrences were too large in relation to the
expected future trends. Moreover, the temporal variability
during the two last centuries is not trivial. For example, the
prevalence of B. barbatula was 57 % higher during the
warmer and low rainfall period 1871–1877 than during the
colder and high rainfall period 1915–1922 (mean July tem-
perature of 12.96 versus 14.8 �C, mean annual rainfall of
1,554 versus 1,338 mm). These results highlight the need to
consider the past variability of species distribution when
analyzing future trends in relation with global warming
scenarios and to consider the uncertainties associated with
SDM predictions (Buisson et al. 2010).
Conclusion
The comparison between observed and predicted historical
fish species distribution in four different European areas
demonstrated the utility of SDM in reconstructing past fish
assemblages and their long-term changes. Uncertainties
associated with SDM predictions were very useful to assess
the efficiency of these models. In general, the efficiency of
SDM based on current fish sampling in minimally dis-
turbed river segments to describe historical reference
conditions is acceptable, especially for the upstream part of
the river networks (trout zone, grayling zone). Neverthe-
less, for those species depending on the main channel but
also on floodplain water bodies, the comparison between
predicted and historically observed data showed a clear
shifting baseline in reference conditions. In fact, very few
naturally functioning floodplain rivers remain in Europe
(Gorski et al. 2011), limiting the possibilities to describe
current undisturbed fish communities from large rivers. In
practice, the use of the reference condition approach to
assess rivers in Europe is adequate. Nonetheless, one has to
consider that minimally disturbed conditions can only be
taken into consideration for the main channel of rivers.
One could argue that reference conditions based on his-
torical observations are more efficient. Historical data,
however, do not always reflect undisturbed conditions. Our
results highlight that fish assemblages were seriously altered
in several areas by human activities at the turn of the twen-
tieth century. The nineteenth century was already a period of
intense human pressures within most European catchments,
reflecting the dense human population, deforestation, agri-
culture, mining and the presence of industries (Pounds 1985;
Bravard and Petts 1996; Pont et al. 2009). In addition, major
changes in river morphology occurred in Europe long before
the industrialization period. This, in particular, refers to
deforestation and implementation of small structures (water
mills) along the river course (Walter and Merritts 2008).
The long-term evolution of fish species distribution also
depends on environmental variables acting at the large
scale, such as climate. Past variability in temperature and
rainfall during the two last centuries may have consider-
ably modified the composition of fish assemblages, in
particular during warmer and low rainfall periods. Using
models to reconstruct the past variability of species dis-
tributions and their associated uncertainties is a major first
step to more comprehensively understand the consequences
of future global warming, and in particular to test whether
species will be subjected to an environmental situation they
never experienced in the past.
A more detailed analysis of the intensity of human
pressures acting historically, and of the impact of climate
variability, is necessary to confirm and detail our inter-
pretations. Nonetheless, our results show the potential of
SDM based on present ‘‘undisturbed sites’’ to analyze the
historical ecological status of European rivers. In agree-
ment with Tingley and Beissinger (2009), we claim that
historical data are of primary importance to document fish
range changes in relation to human activities, environ-
mental modifications and global warming: the keepers of
historical data have crucial roles in curating data and col-
laborating with aquatic ecologists.
Acknowledgments Research for this paper was done within the
DYNAFISH project with the financial support of the Austrian Science
Fund (FWF): I450-B17. The study has been also supported by the
French Water Agency Rhone Mediterranee Corse. Thanks are due to
Michael Stachowitsch for proof-reading.
Open Access This article is distributed under the terms of the
Creative Commons Attribution License which permits any use, dis-
tribution, and reproduction in any medium, provided the original
author(s) and the source are credited.
Species distribution model and historical data
123

References
Austin M (2007) Species distribution models and ecological theory: a
critical assessment and some possible new approaches. Ecol
Model 200:1–19
Bailey RC, Kennedy MG, Dervish MZ, Taylor RM (1998) Biological
assessment of freshwater ecosystems using a reference approach:
comparing predicted and actual benthic invertebrate communi-
ties in Yukon streams. Freshw Biol 39:765–774
Bagliniere JL (1991) La truite commune (Salmo trutta), son origine,
son aire de repartition, ses interets economique et scientifique.
In: Bagliniere JL, Maisse G (eds) La truite, biologie et ecologie.
INRA/ENSA, Paris, pp 11–22
Bravard JP, Petts GE (1996) The fluvial hydrosystems. Chapman,
London
Buisson L, Thuiller W, Casajus N, Lek S (2010) Uncertainty in
ensemble forecasting of species distribution. Glob Change Biol
16:1145–1157
Buisson L, Thuiller W, Lek S, Lim P, Grenouillet G (2008) Climate
change hastens the turnover of stream fish assemblages. Glob
Change Biol 14:2232–2248
Carrel G (2002) Prospecting for historical fish data from the Rhone
river basin: a contribution to the assessment of reference
conditions. Arch Hydrobiol 155:273–290
Casselman JM, Lewis CA (1996) Habitat requirements of northern
pike (Esox lucius). Can J Fish Aquat Sci 53:161–174
Chimany B, Matulla C, Bohm R, Hofstatter M (2013) A new high
resolution absolute temperature grid for the Greater Alpine
Region back to 1780. Int J Climatol 33:2129–2141
Comte L, Grenouillet G (2013) Do stream fish track climate change?
Assessing distribution shifts in recent decades. Ecography
36:1236–1246
Crimmins SM, Dobrowski SZ, Greenberg JA, Abatzoglou JT,
Mynsberge AR (2011) Changes in climate water balance drive
downhill shifts in plant species optimum elevations. Science
331:324–327
de Jager AL, Vogt JV (2010) Development and demonstration of a
structured hydrological feature coding system for Europe.
Hydrolog Sci J 55:661–675
Dormann CF, Elith J, Bacher S, Buchmann C, Carl G, Carre G,
Marquez JRG, Gruber B, Lafourcade B, Leitao PJ, Munkemuller
T, McClean C, Osborne PE, Reineking B, Schroder B, Skidmore
AK, Zurell D, Lautenbach S (2013) Collinearity: a review of
methods to deal with it and a simulation study evaluating their
performance. Ecography 36:27–46
Dudgeon D, Arthington AH, Gessner MO, Kawabata Z-I, Knowler
DJ, Leveque C, Naiman RJ, Prieur-Richard A-H, Soto D,
Stiassny MLJ, Sullivan CA (2006) Freshwater biodiversity:
importance, threats, status and conservation challenges. Biol Rev
81:163–182
Faraway JJ (2006) Extending the linear model with R. Generalized
linear, mixed effects and nonparametric regression models.
Chapman & Hall/CRC, Boca Raton
Fausch KD, Lyons J, Karr JR, Angermeier PL (1990) Fish commu-
nities as indicators of environmental degradation. Am Fish Soc
Symp 8:123–144
Fiedling AH, Bell JF (1997) A review of methods for the assessment
of prediction error in conservation presence/absence models.
Environ Conserv 24:38–49
Flato GM, Boer GJ (2001) Warming asymmetry in climate change
simulations. Geophys Res Lett 28:195–198
Goldewijk KK, Beusen A, van Drecht G, de Vos M (2010) The
HYDE 3.1 spatially explicit database of human-induced global
land-use change over the past 12,000 years. Glob Ecol Biogeogr
587:1–14
Gordon C, Cooper C, Senior CA, Banks H, Gregory JM, Johns TC,
Mitchell JFB, Wood RA (2000) The simulation of SST, sea ice
extents and ocean heat transports in a version of the Hadley
Centre coupled model without flux adjustments. Clim Dyn
16:147–168
Gordon ND, McMahon TA, Finlayson BL, Gippel CJ, Nathan RJ
(2004) Stream hydrology. An introduction for ecologists. Wiley,
New York
Gorski K, De Leeuw JJ et al (2011) Fish recruitment in a large,
temperate floodplain: the importance of annual flooding, tem-
perature and habitat complexity. Freshw Biol 56:2210–2225
Graham MH (2003) Confronting multicollinearity in ecological
multiple regression. Ecology 84:2809–2815
Graham CT, Harrod C (2009) Implications of climate change for the
fishes of the British Isles. J Fish Biol 74:1143–1205
Haidvogl G, Galik A, Pont D (2013a) Vers une histoire de labiodiversite piscicole du Danube autrichien: apports croises des
sources archeologiques et ecrites. Revue du Nord—Collection
Art et Archeologie 19 (Special Issue):131–142
Haidvogl G, Lajus D, Pont D, Schmid M, Jungwirth M, Lajus J
(2013b) Reconstructing historical changes of riverine fish: a
classification of written sources based on the examples of the
Austrian Danube and North-Russian Rivers. Ecol Freshw Fish.
doi:10.1111/eff.12103
Haidvogl G, Dolak H, Hohensimmer S, Pont D (2015) Long-term
evolution of fish communities in European mountainous rivers:
past log driving effects, river management and species introduction
(Salzach River, Danube). Aquat Sci (accepted, this issue)
Harding JS, Benfield EF, Bolstad PV, Helfman GS, Jones EBD
(1998) Stream biodiversity: the ghost of land use past. Proc Natl
Acad Sci USA 95:14843–14847
Hesse E, Paris P (1924) Cours d’eau de la Cote-d’Or—Dossiers
piscicoles—1. Bassins de l’Ouche et de la Vouge. Texte et Carte
au 1/100 000, Imprimerie Allier Pere et Fils, Grenoble
Hirst AC, O’Farrell SP, Gordon HB (2000) Comparison of a coupled
ocean–atmosphere model with and without oceanic eddy-
induced advection. 1. Ocean spin-up and control integrations.
J Clim 13:139–163
Hosmer DW, Lemeshow S (2000) Applied logistic regression. Wiley,
New York
Huet M (1959) Profiles and biology of western European streams as
related to fish management. Trans Am Fish Soc 88:155–163
Kirchhofer A (1996) Fish conservation in Switzerland: three case-
studies. In: Kirchhofer A, Hefti D (eds) Conservation of
endangered freshwater fish in Europe. Birkhauser, Basel,
pp 135–145
Kottelat M, Freyhof J (2007) Handbook of European freshwater
fishes. Publications Kottelat, Cornol
Labay B, Cohen AE, Sissel B, Hendrickson DA, Martin FD, Sarkar S
(2011) Assessing historical fish community composition using
surveys, historical collection data, and species distribution
models. PLoS One 6:e25145
Lahoz-Montfort JJ, Guillera-Arroita G, Wintle BA (2014) Imperfect
detection impacts the performance of species distribution
models. Glob Ecol Biogeogr 23:504–515
Lasalle G, Rochard E (2009) Impact of twenty-first century climate
change on diadromous fish spread over Europe, North Africa and
the Middle East. Glob Change Biol 15:1072–1089
Leger L (1927) Carte piscicole du departement de l’Ain avec une
notice explicative. Travaux du Laboratoire d’Hydrobiologie et
de Pisciculture de l’Universite de Grenoble 19:149–155
Logez M, Bady P, Pont D (2012) Modelling the habitat requirement
of riverine fish species at the European scale: sensitivity to
temperature and precipitation and associated uncertainty. Ecol
Freshw Fish 21:266–282
D. Pont et al.
123

Maceda-Veiga A, Monleon-Getino A, Caiola N, Casals F, de Sostoa
A (2010) Changes in fish assemblages in catchments in north-
eastern Spain: biodiversity, conservation status and introduced
species. Fresh Biol 55:1734–1746
Matthews WJ (1998) Patterns in freshwater fish ecology. Chapman &
Hall, New York
Mitchell TD, Carter TR, Jones PD, Hulme M, New M (2004) A
comprehensive set of high-resolution grids of monthly climate
for Europe and the globe: the observed record (1901–2000) and
16 scenarios (2001–2100). Tyndall Working Paper 55, Tyndall
Centre for Climate Change Research, Norwich
Muhar S, Kainz M, Kaufmann M, Schwarz M (1996) Ausweisung
flußtypspezi-fisch erhaltener Fließgewasserabschnitte in Osterr-
eich. Bundesministerium fur Land- und Forstwirtschaft,
Wasserwirtschaftskataster
Noble RAA, Cowx IG, Goffaux D, Kestemont P (2007) Assessing the
health of European rivers using functional ecological guilds of
fish communities: standardising species classification and
approaches to metric selection. Fish Manag Ecol 14:381–392
Oberdorff T, Pont D, Hugueny B, Chessel D (2001) A probabilistic
model characterizing fish assemblages of French rivers: a
framework for environmental assessment. Freshw Biol
46:399–415
Ormerod SJ (2003) Current issues with fish and fisheries: editor’s
overview and introduction. J Appl Ecol 40:204–213
Parmesan C, Yohe G (2003) A globally coherent fingerprint of
climate change impacts across natural systems. Nature
421:37–42
Pauly D (1995) Anecdotes and the shifting baseline syndrome of
fisheries. TREE 10:430–431
Petts GE (1984) Impounded rivers. Perspectives for ecological
management. Wiley, New York
Pont D, Hugueny B, Beier U, Goffaux D, Melcher A, Noble R,
Rogers C, Roset N, Schmutz S (2006) Assessing river biotic
condition at a continental scale: a European approach using
functional metrics and fish assemblages. J Appl Ecol 43:70–80
Pont D, Hugueny B, Oberdorff T (2005) Modelling habitat require-
ment of European fishes: do species have similar responses to
local and regional environmental constraints? Can J Fish Aquat
Sci 62:163–173
Pont D, Piegay H, Farinetti A, Allain S, Landon N, Liebault F,
Dumont B, Richard-Mazet A (2009) Conceptual framework and
interdisciplinary approach for the sustainable management of
gravel-bed rivers: the case of the Drome River basin (S.E.
France). Aquat Ecol 71:356–370
Pounds NJG (1985) An historical geography of Europe. Cambridge
University Press, Cambridge
Rinne J, Hughes R, Calamusso B (2005) Historical changes in large
river fish assemblages of the Americas. Changes in fish
community structures in large USA rivers. American Fisheries
Society, Phoenix
Schiemer F (2000) Fish as indicators for the assessment of the
ecological integrity of large rivers. Hydrobiologia
422(423):271–278
Schurer AP, Hegerl GC, Me Mann, Tett SB, Phipps SJ (2013)
Separating forced from chaotic climate variability over the past
millennium. J Clim 26:6954–6973
Swets K (1988) Measuring the accuracy of diagnostic systems.
Science 240:1285–1293
Stoddard JL, Larsen DP, Hawkins CP, Johnson RK, Norris RH (2006)
Setting expectations for the ecological condition of streams: the
concept of reference condition. Ecol Appl 16:1267–1276
Tingley MW, Beissinger SR (2009) Detecting range shifts from
historical species occurrences: new perspectives on old data.
TREE 24:625–633
Walter RC, Merritts DJ (2008) Natural streams and the legacy of
water-powered mills. Science 319:299–304
Webb BW (1996) Trends in water stream and river temperature.
Hydrol Process 10:205–226
Winter HV, Lapinska M, de Leeuw JJ (2009) The river Vecht fish
community after rehabilitation measures: a comparison to the
historical situation by using the river Biebrza as a geographical
reference. River Res Appl 25:16–28
Wolter C, Bischoff A, Wysujack K (2005) The use of historical data
to characterize fish-faunistic reference conditions for large
lowland rivers in northern Germany. In: Buijse AD, Klijn F,
Leuven RSEW, Middelkoop H, Schiemer F, Thorp JH, Wolfert
HP (eds) Rehabilitating large regulated rivers. Arch Hydrobiol
Suppl Large Riv 15:37–51
Worthington T, Kemp P, Osborne PE, Howes C, Easton K (2010)
Former distribution and decline of the burbot (Lota lota) in the
UK. Aquat Cons 20:371–377
Xenopoulos MA, Lodge DM, Alcamo J, Marker M, Schulze K, Van
Vuuren DP (2005) Scenarios of freshwater fish extinctions from
climate change and water withdrawal. Glob Change Biol
11:1557–1564
Species distribution model and historical data
123