A Methodological Proposal for Implementing Demand-Shifting ...
28
Citation: Domínguez-Garabitos, M.A.; Ocaña-Guevara, V.S.; Santos-García, F.; Arango-Manrique, A.; Aybar-Mejía, M. A Methodological Proposal for Implementing Demand-Shifting Strategies in the Wholesale Electricity Market. Energies 2022, 15, 1307. https://doi.org/10.3390/en15041307 Academic Editor: Jesús Manuel Riquelme-Santos Received: 20 January 2022 Accepted: 9 February 2022 Published: 11 February 2022 Publisher’s Note: MDPI stays neutral with regard to jurisdictional claims in published maps and institutional affil- iations. Copyright: © 2022 by the authors. Licensee MDPI, Basel, Switzerland. This article is an open access article distributed under the terms and conditions of the Creative Commons Attribution (CC BY) license (https:// creativecommons.org/licenses/by/ 4.0/). energies Review A Methodological Proposal for Implementing Demand-Shifting Strategies in the Wholesale Electricity Market Máximo A. Domínguez-Garabitos 1, *, Víctor S. Ocaña-Guevara 1,2 ,Félix Santos-García 1,2 , Adriana Arango-Manrique 3 and Miguel Aybar-Mejía 4 1 Basic Sciences, Instituto Tecnológico de Santo Domingo, Santo Domingo 10602, Dominican Republic; [email protected] (V.S.O.-G.);[email protected] (F.S.-G.) 2 Centre for Energy Studies and Environmental Technologies (CEETA), Carretera a Camajuaní Km 5 1/2, Universidad Central “Marta Abreu” de Las Villas, Villa Clara 50100, Cuba 3 Department of Electrical and Electronic Engineering, Universidad del Norte, Barranquilla 080001, Colombia; [email protected] 4 Engineering Area, Instituto Tecnológico de Santo Domingo, Santo Domingo 10602, Dominican Republic; [email protected] * Correspondence: [email protected]; Tel.: +1-829-213-6281 Abstract: The energy transition has shown that fossil generation can be complemented with renew- able energy and other resources capable of providing flexibility to the energy system’s operation, in compliance with the wholesale electricity market’s rules. This paper proposes a market-based methodology for introducing flexible demand in the energy dispatch, optimizing the scheduling of electricity system operation in the short-term, and considers the challenge of implementing an incentive scheme for participants in demand-response programs. The scheme includes the criteria of the elasticity of substitution and a renewable energy quota. This methodology is focused on a strategic demand shift to minimize the cost of supply; increase the dispatch of renewable energy; control CO 2 emissions; and satisfy the generation, demand, and transmission operating constraints. These conditions encourage the development of a simulation tool that allows a sensitivity analysis to aid decision-making by operators and agents. The proposed methodology optimizes the operational cost of generation supply and specific performance indicators to determine the percentages of demand shift, the amount of CO 2 emissions, the ratio of unserved power, the demand benefits obtained from an incentive scheme, and the natural market behavior. Keywords: demand response; elasticity of substitution; renewable energy; wholesale electricity market 1. Introduction This paper proposes an alternative methodology for evaluating the economic and environmental effects of applying an incentive-based demand-response program (DRP) based on load-shifting strategies. The fundamental criteria that allow the demand flexibility of resources are determined by employing demand segmentation and the constant elasticity of substitution (CES). This methodology considers the declared availability profiles for vari- able renewable energy production, maximizing its contribution. Additionally, the supply costs are minimized, in accordance with the constraints determining the generation, grid, and demand conditions. Limits are established for unserved energy and the displacement of fossil generation, and the reduction in CO 2 emissions is also evaluated. Considering that demand can provide operational flexibility, demand response (DR) has been defined as the ability to modify the profile of electricity consumption based on changes in price signals or incentives applied in the electricity market in order to induce the rational use of electricity and to mitigate vulnerable scenarios that threaten the reliability of the electricity supply in the system [1,2]. The benefits of DR involve additional revenue Energies 2022, 15, 1307. https://doi.org/10.3390/en15041307 https://www.mdpi.com/journal/energies
-
Upload
khangminh22 -
Category
Documents
-
view
2 -
download
0
Transcript of A Methodological Proposal for Implementing Demand-Shifting ...
�����������������
Citation: Domínguez-Garabitos,
M.A.; Ocaña-Guevara, V.S.;
Santos-García, F.; Arango-Manrique,
A.; Aybar-Mejía, M. A
Methodological Proposal for
Implementing Demand-Shifting
Strategies in the Wholesale Electricity
Market. Energies 2022, 15, 1307.
https://doi.org/10.3390/en15041307
Academic Editor: Jesús
Manuel Riquelme-Santos
Received: 20 January 2022
Accepted: 9 February 2022
Published: 11 February 2022
Publisher’s Note: MDPI stays neutral
with regard to jurisdictional claims in
published maps and institutional affil-
iations.
Copyright: © 2022 by the authors.
Licensee MDPI, Basel, Switzerland.
This article is an open access article
distributed under the terms and
conditions of the Creative Commons
Attribution (CC BY) license (https://
creativecommons.org/licenses/by/
4.0/).
energies
Review
A Methodological Proposal for Implementing Demand-ShiftingStrategies in the Wholesale Electricity MarketMáximo A. Domínguez-Garabitos 1,*, Víctor S. Ocaña-Guevara 1,2, Félix Santos-García 1,2 ,Adriana Arango-Manrique 3 and Miguel Aybar-Mejía 4
1 Basic Sciences, Instituto Tecnológico de Santo Domingo, Santo Domingo 10602, Dominican Republic;[email protected] (V.S.O.-G.); [email protected] (F.S.-G.)
2 Centre for Energy Studies and Environmental Technologies (CEETA), Carretera a Camajuaní Km 5 1/2,Universidad Central “Marta Abreu” de Las Villas, Villa Clara 50100, Cuba
3 Department of Electrical and Electronic Engineering, Universidad del Norte, Barranquilla 080001, Colombia;[email protected]
4 Engineering Area, Instituto Tecnológico de Santo Domingo, Santo Domingo 10602, Dominican Republic;[email protected]
* Correspondence: [email protected]; Tel.: +1-829-213-6281
Abstract: The energy transition has shown that fossil generation can be complemented with renew-able energy and other resources capable of providing flexibility to the energy system’s operation,in compliance with the wholesale electricity market’s rules. This paper proposes a market-basedmethodology for introducing flexible demand in the energy dispatch, optimizing the schedulingof electricity system operation in the short-term, and considers the challenge of implementing anincentive scheme for participants in demand-response programs. The scheme includes the criteria ofthe elasticity of substitution and a renewable energy quota. This methodology is focused on a strategicdemand shift to minimize the cost of supply; increase the dispatch of renewable energy; controlCO2 emissions; and satisfy the generation, demand, and transmission operating constraints. Theseconditions encourage the development of a simulation tool that allows a sensitivity analysis to aiddecision-making by operators and agents. The proposed methodology optimizes the operational costof generation supply and specific performance indicators to determine the percentages of demandshift, the amount of CO2 emissions, the ratio of unserved power, the demand benefits obtained froman incentive scheme, and the natural market behavior.
Keywords: demand response; elasticity of substitution; renewable energy; wholesale electricitymarket
1. Introduction
This paper proposes an alternative methodology for evaluating the economic andenvironmental effects of applying an incentive-based demand-response program (DRP)based on load-shifting strategies. The fundamental criteria that allow the demand flexibilityof resources are determined by employing demand segmentation and the constant elasticityof substitution (CES). This methodology considers the declared availability profiles for vari-able renewable energy production, maximizing its contribution. Additionally, the supplycosts are minimized, in accordance with the constraints determining the generation, grid,and demand conditions. Limits are established for unserved energy and the displacementof fossil generation, and the reduction in CO2 emissions is also evaluated.
Considering that demand can provide operational flexibility, demand response (DR)has been defined as the ability to modify the profile of electricity consumption based onchanges in price signals or incentives applied in the electricity market in order to induce therational use of electricity and to mitigate vulnerable scenarios that threaten the reliabilityof the electricity supply in the system [1,2]. The benefits of DR involve additional revenue
Energies 2022, 15, 1307. https://doi.org/10.3390/en15041307 https://www.mdpi.com/journal/energies
Energies 2022, 15, 1307 2 of 28
and energy efficiency for the provider and the increased reliability and optimization ofthe electricity infrastructure for all market players. The fundamental functions of DRinclude demand-increase and -decrease activities utilizing load control and other integratedresources, such as onsite generation and storage [3], allowing the injection of surplusesinto the grid. There are two strategies used in power system operation to meet demandprojections. One of these seeks a solution to the generation dispatch problem, and the otherfocuses on the flexibility and availability of resources on the demand side [4]. In the secondcase, utility providers and large consumers implement efficiency and load-managementprograms, since flexible demand is seen as a way to mitigate the challenges of increasinglyvolatile renewable energy sources (RESs), as it can ensure the security of supply [5,6]. Thefundamental goal of DR is to control the demand and move it along the time axis accordingto the generation availability [7,8].
In [9], a DR program for Singapore’s wholesale electricity market was investigated.The study included the constraints and modeling of an incentive payment mechanism. Thescheme proposed in [9] restricted the flexibility in response to price signals, limiting themaximization of the DR benefits, in contrast to what is proposed in this paper. The authorsof [10] present a mathematical model of the application of DR at the individual-household,aggregate-household, network, and market levels. Their approach left open the discussionof possible barriers related to market structure and policies; these are addressed in theproposal of this paper, which points out an opportunity to mitigate deviations in dispatchoperation programs.
According to [11], DR can be adapted to offer the following products and services tothe power system:
• Firm capacity during peak hours.• Delivery of energy from electricity generators to consumers under minimum cost
conditions.• Ancillary services to support grid stability.• A temporary reinforcement of congested elements in transmission networks (TNs)
and distribution networks (DNs).
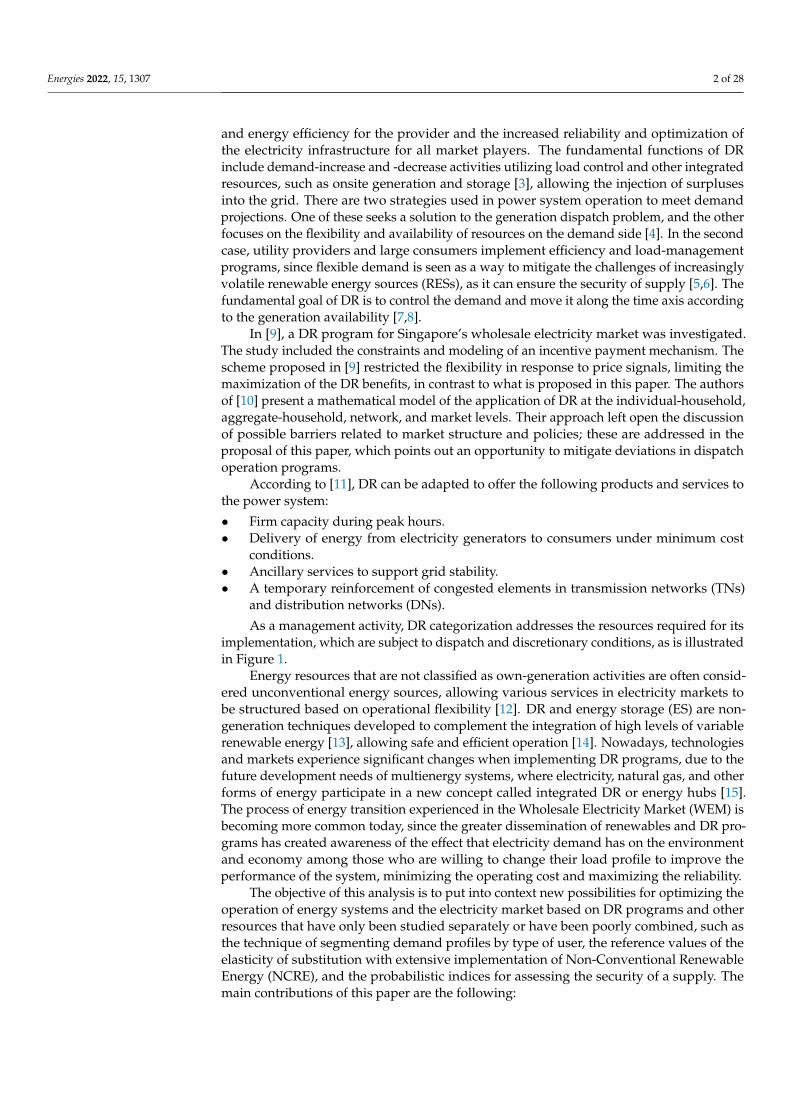
As a management activity, DR categorization addresses the resources required for itsimplementation, which are subject to dispatch and discretionary conditions, as is illustratedin Figure 1.
Energy resources that are not classified as own-generation activities are often consid-ered unconventional energy sources, allowing various services in electricity markets tobe structured based on operational flexibility [12]. DR and energy storage (ES) are non-generation techniques developed to complement the integration of high levels of variablerenewable energy [13], allowing safe and efficient operation [14]. Nowadays, technologiesand markets experience significant changes when implementing DR programs, due to thefuture development needs of multienergy systems, where electricity, natural gas, and otherforms of energy participate in a new concept called integrated DR or energy hubs [15].The process of energy transition experienced in the Wholesale Electricity Market (WEM) isbecoming more common today, since the greater dissemination of renewables and DR pro-grams has created awareness of the effect that electricity demand has on the environmentand economy among those who are willing to change their load profile to improve theperformance of the system, minimizing the operating cost and maximizing the reliability.
The objective of this analysis is to put into context new possibilities for optimizing theoperation of energy systems and the electricity market based on DR programs and otherresources that have only been studied separately or have been poorly combined, such asthe technique of segmenting demand profiles by type of user, the reference values of theelasticity of substitution with extensive implementation of Non-Conventional RenewableEnergy (NCRE), and the probabilistic indices for assessing the security of a supply. Themain contributions of this paper are the following:
Energies 2022, 15, 1307 3 of 28
Figure 1. Demand-response categories [1].
• A methodology for evaluating the optimal operating cost of a generation supplyin the short-term, emphasizing the proliferation of variable renewable energy andthe integration of flexible demand that incentivizes users to shift their load profileaccording to the constant elasticity of substitution determined by the market operator.
• The definition of the specifications for building a simulation tool to mitigate deviationsin the scheduling of an electric system’s operation, avoiding cost overruns due toforced generation dispatch.
• The identification of performance indicators by optimizing energy prices and quanti-ties in the market, based on criteria associated with demand-response programs andthe constant elasticity of substitution (CES) function.
This paper is structured as follows: Section 2 presents the structure and planningcriteria of the wholesale electricity market, including demand-response programs; Section 3describes flexible demand-side resources, with an emphasis on strategies for modifyingelectric load profiles and DR program specifications; Section 4 presents the applicability ofindicators for assessing DR programs; Section 5 explains the methodologies used to modelthe demand-response and sustainability dimensions; Section 6 discusses the expectedresults of the proposed methodology; and finally Section 7 provides conclusions related tothe contributions, limitations, and future directions of the study.
2. Wholesale Electricity Market: Structure and Planning Criteria UsingDemand Response
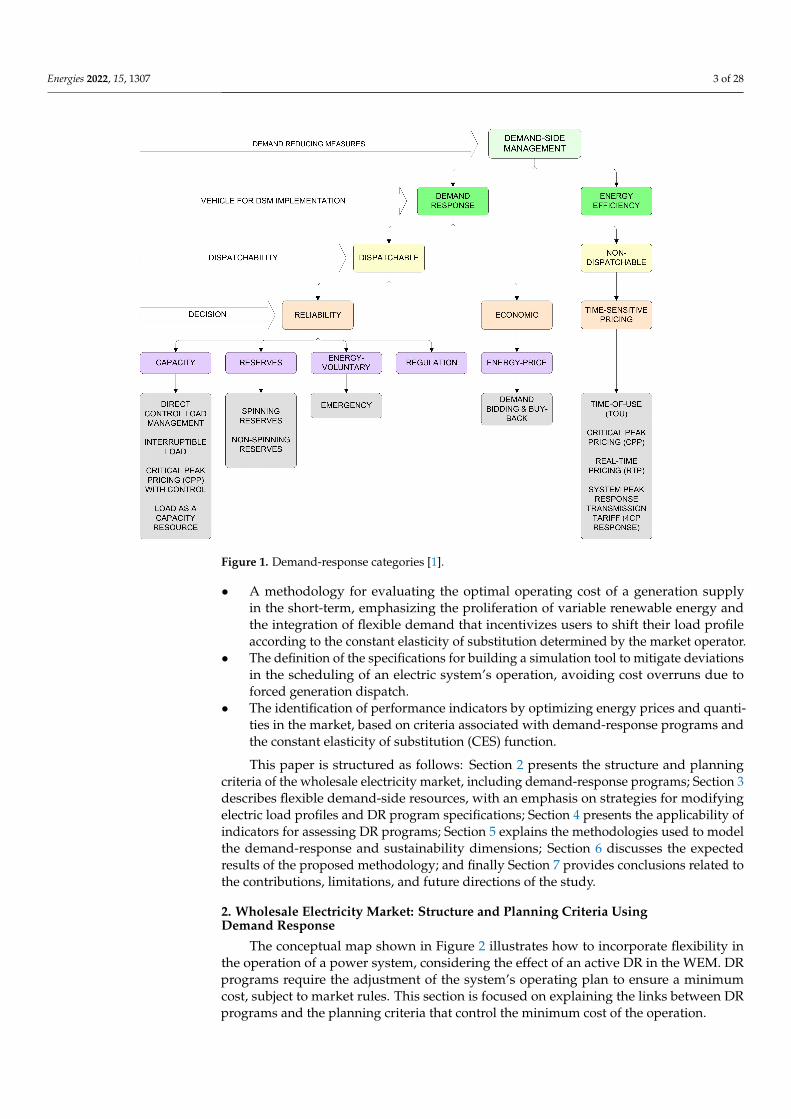
The conceptual map shown in Figure 2 illustrates how to incorporate flexibility inthe operation of a power system, considering the effect of an active DR in the WEM. DRprograms require the adjustment of the system’s operating plan to ensure a minimumcost, subject to market rules. This section is focused on explaining the links between DRprograms and the planning criteria that control the minimum cost of the operation.
Energies 2022, 15, 1307 4 of 28
Figure 2. Conceptual map of wholesale electricity market plan implementing demand response.
A unidirectional sequence of activities supports the traditional electricity businessmodel. In this scheme, the generators sell their energy on the WEM, electricity is transportedand distributed under the control of a system operator, and retailing companies buy in bulkand sell to end-users. The adequacy of the system and the provision of ancillary services thatsupport the reliability, efficiency, and quality of the services (such as frequency and reactiveenergy regulation) are mainly ensured by generators and some large consumers. Theregulator establishes rules and monitors compliance, while the market operator values thepurchases and sales of electricity, ancillary services, and other complementary regulatorymechanisms implemented.
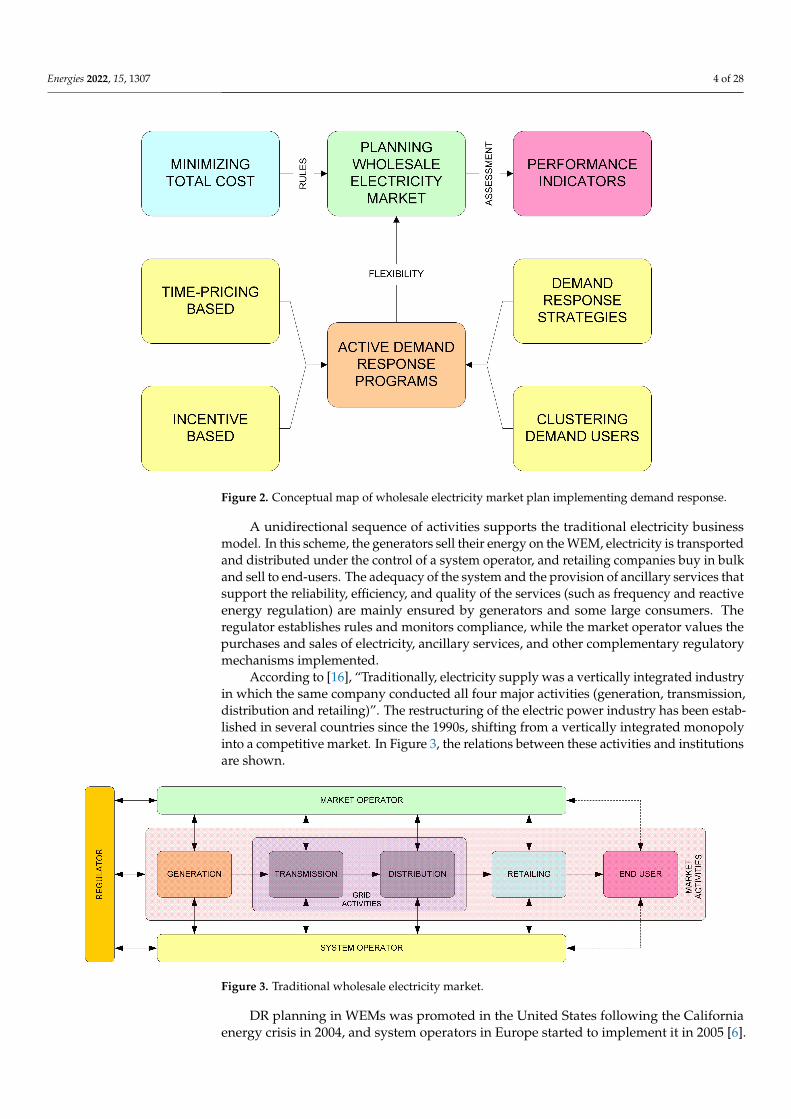
According to [16], “Traditionally, electricity supply was a vertically integrated industryin which the same company conducted all four major activities (generation, transmission,distribution and retailing)”. The restructuring of the electric power industry has been estab-lished in several countries since the 1990s, shifting from a vertically integrated monopolyinto a competitive market. In Figure 3, the relations between these activities and institutionsare shown.
Figure 3. Traditional wholesale electricity market.
DR planning in WEMs was promoted in the United States following the Californiaenergy crisis in 2004, and system operators in Europe started to implement it in 2005 [6].
Energies 2022, 15, 1307 5 of 28
In [17], it was concluded that the influence of DR on a WEM is more effective in a marketthat integrates CO2 costs and subsidies with nonpolluting technologies in the long term.Therefore, without proper DR planning, the effect of DR on the energy system/market maynot represent a substantial improvement [18].
Integrating energy resources, ES technologies, and DR have allowed emerging net-works to implement flexibility criteria [19]. In [20], the storage and service-control criteriaare used to assess the demand flexibility in the residential and commercial sectors.
In [21], the authors explain in physical terms the options that exist to support flexibilitymechanisms in power systems and ensure the balance of generation and demand in realtime. On the supply side, they make reference to ramp-capacity resources in conventionalpower plants, flexible generation, the diversification of the generation mix, etc. On thedemand side, the variety of options includes DR and energy-efficiency programs. Thedemands can be managed with storage; EVs; and residential, commercial, and industrialuser loads. In the case of networks, flexibility options would allow reconfigurations,meshed topologies, and the incorporation of technologies that allow for smart grid use.
The effect of applying flexibility mechanisms on the market may be permanent ortemporary. The first case pertains to the establishment of policies that prescribe fixed ormandatory resources or programs (e.g., energy efficiency), and the second case is moreoriented towards short-term mechanisms that can safely minimize a power system’s opera-tional costs (e.g., DR programs).
There are multiple challenges to integrating variable renewable energy with marketeconomics and system operation. However, we can consider as a case study Ireland’spower system, in which trials have concluded that renewable and flexible technologies,including wind energy, photovoltaic solar energy, demand-side management, and batterystorage, are admissible together with conventional generation [22].
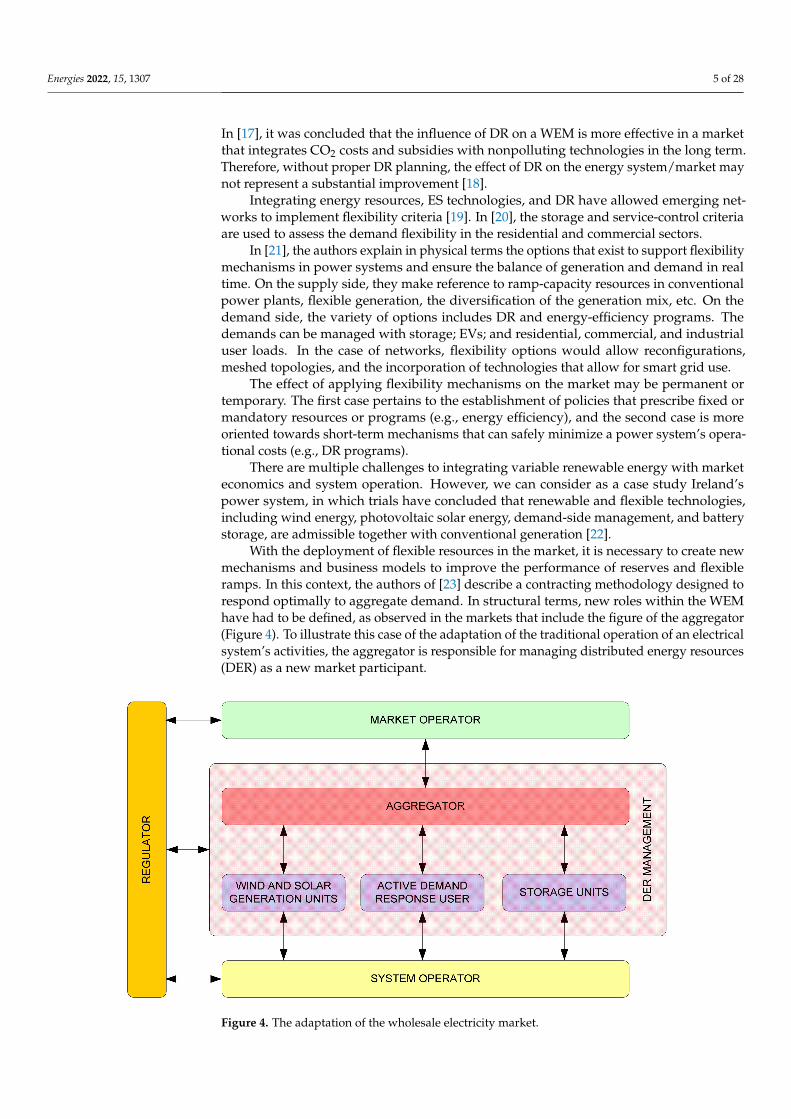
With the deployment of flexible resources in the market, it is necessary to create newmechanisms and business models to improve the performance of reserves and flexibleramps. In this context, the authors of [23] describe a contracting methodology designed torespond optimally to aggregate demand. In structural terms, new roles within the WEMhave had to be defined, as observed in the markets that include the figure of the aggregator(Figure 4). To illustrate this case of the adaptation of the traditional operation of an electricalsystem’s activities, the aggregator is responsible for managing distributed energy resources(DER) as a new market participant.
Figure 4. The adaptation of the wholesale electricity market.
Energies 2022, 15, 1307 6 of 28
Aggregators are mediators that offer DR services to market participants, system andmarket operators, and end-users [24,25]. The activity of the aggregator allows small group-ings of consumers, producers, and prosumers to participate in the electricity market as asingle entity, improving the operational flexibility of the system by managing and com-mercializing demand and generation resources. Figure 4 illustrates the role of aggregators,showing their value, their coordination with distribution system operators (DSO), and howthey can reduce market costs [26–29]. The proposed methodology is focused only on WEMactivities and does not consider the internal coordination that the aggregator must carryout with end-users
We conducted a literature review focusing on investigations associated with the modelin Figure 4. The authors of [30] indicate that residential customers can implement DRthrough household appliances such as refrigerators; freezers; washing machines; dryers;and HVAC (heating, ventilation, and air conditioning) systems. In [31], the authors presenta business model that includes the figure of the aggregator as a price taker in energy marketsand reserve services through the charging and discharging of EVs. The participation ofthe aggregator in the European energy balance markets is examined in [32]. Differentcontract-modeling strategies for the aggregator in the market, such as load cuts, loadshifting, distributed generation, and ES, are presented in [33].
In situations of congestion and failure to provide ancillary services, or when it doesnot have the availability of energy required, the aggregator may incur additional penaltiesand costs for transferring energy from one point to another [34,35]. It should be noted thatcongestion problems in DNs can influence TNs, causing congestion and the formation ofzonal prices. In [27], the economic fundamentals of the aggregator are assessed; the paperevaluates technological and regulatory scenarios, characterizing the added value from atransitory and opportunistic perspective.
The evolution of competitive electricity markets and the advancements in communica-tion technology and control engineering have created the conditions for the development ofsmart grids, motivating a reformation of the conventional DSM theoretical framework [36].The main DSM concepts are associated with energy efficiency and DR. Several works haveshown that DR contributes to system stability, service quality, the security of supply, andbetter market operation performance. Some authors use the terminology of Demand SideIntegration (DSI) to refer to the modern concept of DSM [4]. As DR is associated with DSI,we also considered integrated resource planning, reliability, security, and electricity prices.
3. The Demand as a Flexible Resource3.1. Strategies to Modify Load Profiles
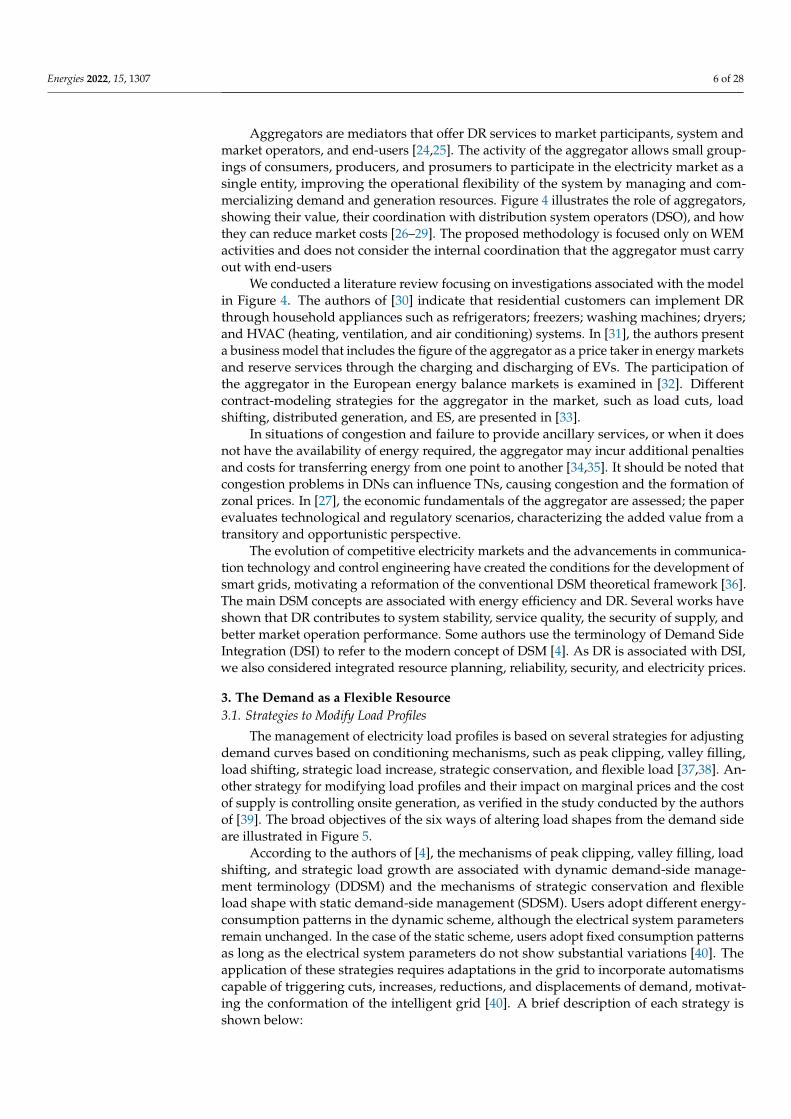
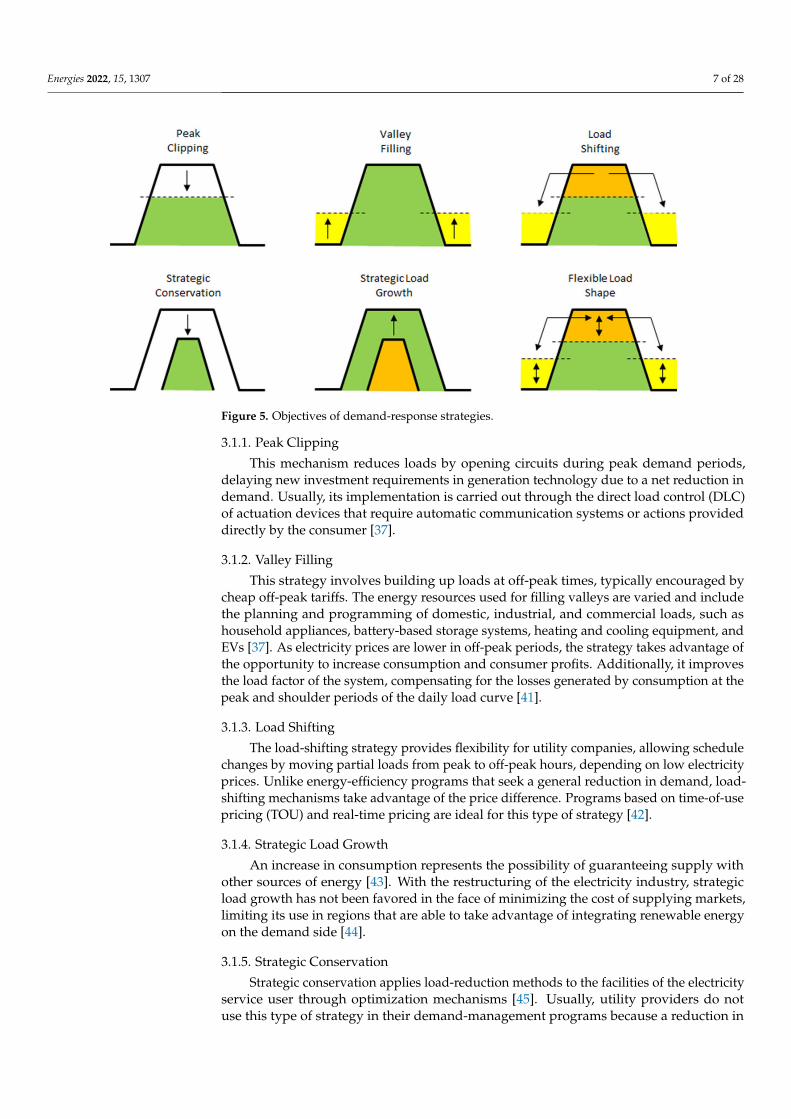
The management of electricity load profiles is based on several strategies for adjustingdemand curves based on conditioning mechanisms, such as peak clipping, valley filling,load shifting, strategic load increase, strategic conservation, and flexible load [37,38]. An-other strategy for modifying load profiles and their impact on marginal prices and the costof supply is controlling onsite generation, as verified in the study conducted by the authorsof [39]. The broad objectives of the six ways of altering load shapes from the demand sideare illustrated in Figure 5.
According to the authors of [4], the mechanisms of peak clipping, valley filling, loadshifting, and strategic load growth are associated with dynamic demand-side manage-ment terminology (DDSM) and the mechanisms of strategic conservation and flexibleload shape with static demand-side management (SDSM). Users adopt different energy-consumption patterns in the dynamic scheme, although the electrical system parametersremain unchanged. In the case of the static scheme, users adopt fixed consumption patternsas long as the electrical system parameters do not show substantial variations [40]. Theapplication of these strategies requires adaptations in the grid to incorporate automatismscapable of triggering cuts, increases, reductions, and displacements of demand, motivat-ing the conformation of the intelligent grid [40]. A brief description of each strategy isshown below:
Energies 2022, 15, 1307 7 of 28
Figure 5. Objectives of demand-response strategies.
3.1.1. Peak Clipping
This mechanism reduces loads by opening circuits during peak demand periods,delaying new investment requirements in generation technology due to a net reduction indemand. Usually, its implementation is carried out through the direct load control (DLC)of actuation devices that require automatic communication systems or actions provideddirectly by the consumer [37].
3.1.2. Valley Filling
This strategy involves building up loads at off-peak times, typically encouraged bycheap off-peak tariffs. The energy resources used for filling valleys are varied and includethe planning and programming of domestic, industrial, and commercial loads, such ashousehold appliances, battery-based storage systems, heating and cooling equipment, andEVs [37]. As electricity prices are lower in off-peak periods, the strategy takes advantage ofthe opportunity to increase consumption and consumer profits. Additionally, it improvesthe load factor of the system, compensating for the losses generated by consumption at thepeak and shoulder periods of the daily load curve [41].
3.1.3. Load Shifting
The load-shifting strategy provides flexibility for utility companies, allowing schedulechanges by moving partial loads from peak to off-peak hours, depending on low electricityprices. Unlike energy-efficiency programs that seek a general reduction in demand, load-shifting mechanisms take advantage of the price difference. Programs based on time-of-usepricing (TOU) and real-time pricing are ideal for this type of strategy [42].
3.1.4. Strategic Load Growth
An increase in consumption represents the possibility of guaranteeing supply withother sources of energy [43]. With the restructuring of the electricity industry, strategicload growth has not been favored in the face of minimizing the cost of supplying markets,limiting its use in regions that are able to take advantage of integrating renewable energyon the demand side [44].
3.1.5. Strategic Conservation
Strategic conservation applies load-reduction methods to the facilities of the electricityservice user through optimization mechanisms [45]. Usually, utility providers do notuse this type of strategy in their demand-management programs because a reduction in
Energies 2022, 15, 1307 8 of 28
electricity sales caused by this action does not always represent a reduction in the maximumdemand for the system.
3.1.6. Flexible Load
The flexible load shape is equivalent to combining peak clipping, valley filling, andload shifting. This modification of the daily load curve is more complicated for the systemoperator in terms of planning and operation. However, it responds with more elasticitydepending on the end-user’s needs [46]. An advantage of this practice is the value addedto the system’s reliability by identifying a flexible demand, especially during peak peri-ods [47]. Reducing demand through this scheme allows grid operators to interrupt loads,with consequent changes in the reliability and quality of the service [43]. The technolog-ical equipment applied with this technique can be autonomous or manually activated,employing controllable energy-management systems [37].
3.2. Demand-Response Programs
The design of DR programs is oriented towards one of two main groups, calledprice-based programs and incentive-based programs. In price-based programs, electricitycustomers modify their electricity-consumption pattern in response to the WEM price. Inthe case of incentive-based programs, a mechanism is structured to provide an economicstimulus based on the participants’ performance.
3.2.1. Price-Based DR (Time-Sensitive Pricing)
Time-of-use (TOU) pricing, critical peak pricing (CPP), real-time pricing (RTP), andpeak-time rebate (PTR) are rate schemes employed by price-based programs that provideeconomic signals to influence the reduction in energy consumption during peak periodsdue to the high prices that electricity reaches [48]. Price-responsive programs operate onpassive demand, based on voluntary actions by electricity consumers. Brief details for eachcase are shown below.
Time-of-Use (TOU) Pricing
In this program, the expected changes in the electricity consumption profile are con-ditioned by the prices set for each time block. Regularly, usage rates vary over severalperiods within a day. A typical scheme defines the daily peak, shoulder, and valley pricesaccording to the pattern of the daily load curve [1]. Time-of-use tariffs for the consump-tion of electricity motivate users to change their habits to take advantage of lower prices,reducing peak demand for electricity at critical times [49].
In the case of Malaysia, most consumers prefer static TOU rates applied in price-based DR programs due to the transition processes they must face with retailers whenformalizing plan changes [18]. A case study based on price responsiveness has beenmodeled on residential electricity demand, combining a TOU policy with a block pricingpolicy, verifying that this can help reduce the annual consumption of electricity below 1%.This effect is not desirable compared to the TOU scheme with a 1.4–3.0% reduction. Asnoted in the study, the combination of TOU with a block pricing policy performs worsein reducing electricity consumption, probably because the users do not know which pricethey should respond to and are confused about the nonlinear nature of block pricing [50].
The authors of [51] presented a simulation model of buildings in Ireland that allowedthem to calculate the effectiveness of DR programs based on rules and machine-learningalgorithms (predictive algorithms), applying different TOU rates. The results indicated thatit is possible to obtain reductions in end-use electricity expenditure, utility generation costs,and carbon emissions, with proportions close to 20% in the rule-based algorithm and 40%in the predictive algorithm.
Energies 2022, 15, 1307 9 of 28
Critical Peak Pricing (CPP)
Critical peak pricing is a dynamic way of applying prices via a TOU scheme whenshortage conditions are detected in the electrical system. In this case, users have to payhigher prices if there is no generation or if events disconnect grid elements [52]. Asindicated above, CPP is a variant of the TOU scheme that expresses the volatility of peakprices in the electricity market.
Real-Time Pricing (RTP)
RTP expresses the prices that result in the WEM at hourly intervals or other lengthsof time established by the regulations, exposing the user to the variability that representsthe real costs of supplying to utility providers and other consumers [11]. The study in [53]proposes a novel methodology that combines real-time pricing with real-time incentives.
Peak Time Rebate (PTR)
According to the authors of [54], PTR programs recognize users with monetary dis-counts that respond to a reduction in electricity consumption during peak hours, becausethe highest costs are reached in this block of hours. Consumers who do not display thisflexibility pay the standard tariff. For this reason, PTR programs typically see much higherparticipation rates than many other DR programs. In addition, PTR programs have highcustomer satisfaction ratings, and on the utility side, PTR programs do not require anychanges in rate design. PTR programs can benefit both customers and utility providers,resulting in a win-win outcome if PTR rebate levels are set correctly.
3.2.2. Incentive-Based DR
In literature reports, incentive-based programs are classified into classical and market-based programs. In the first group, participants receive credit or a discount during thebilling process for reducing their consumption. In the second group, participating usersreceive a reward proportional to the change in their electricity consumption during thepeak hour block [55]. The purpose of incentive-based programs is to flatten the daily loadcurve by taking advantage of market price variations. The demand reduction contractsare signed and activated when the market exhibits high prices or the system operatorunderstands that reliability is compromised [7].
The reliability of an electrical system can be evaluated over time through the dimen-sions of security, firmness, adequacy, and strategic planning. DR programs contribute tothe reliability of capacity, frequency-regulation reserves, and energy from the perspective ofthe service and the incentives involved. Additionally, flexibility and contingency could becategorized as special reserve markets for frequency regulation. In the case of a flexibilityservice, an additional load is required following significant unforecasted wind or solarramps, and a contingency service responds rapidly to a loss in supply energy [56]. Adescription of service attribute areas is given in [11]. Below is a brief review:
Capacity
This service offers a displacement of traditional generation, motivating the controlleddispatch of load through DR programs. The required balance between generation anddemand is preserved since an increased load in a bus of the system is offset by the de-creased load committed in the DR program in another bus, without dispatching addi-tional megawatts of generation. The participation of DR in capacity markets can combatthe increase in capacity prices, mitigating the challenge of integrating high levels of re-newables [57], strengthening supply security, and reducing residual loads in the peakperiod [58]. There are several metrics for measuring this resource. Among them are citedthe loss of load probability (LOLP), the loss of load expectation (LOLE), and the expectedunserved energy (EUE).
Energies 2022, 15, 1307 10 of 28
Frequency-Regulation Reserve
The effect of DR reserves is the same as synchronized spinning reserves, since theycan be activated automatically in a very short time, during the first seconds or minutesafter a failure. A frequency-regulation reserve provides the response required to balancegeneration and demand after a contingency event for a transmission failure or the loss of ageneration unit [59]. In the case of non-spinning and non-synchronized operating reserves,the actuation time can also be adjusted to use DR reserves according to the necessities ofthe system’s stability [60].
Emergency
From the operational planning perspective, the generation needs can be complementedwith the energy balance of DR programs, facilitating the optimization of the process,especially in emergency situations or shortages due to the lack of the reliability of generationunits [61]. A pilot study of this scheme is evaluated in [62].
4. Performance Indicators of Demand-Response Programs in WholesaleElectricity Markets
It is necessary to identify indicators to assess the performance of electricity markets;deciding which are directly related to the market being analyzed will favor the quality ofthe process assessment and the proposed decisions. Some authors present the followingcalculations as key performance indicators to respond to and evaluate market behavior:wholesale generation costs, acquisition costs of reserved generation capacity, environmentalimpact measured by the costs associated with CO2 emissions minus the costs avoidedby the reduction of SO2 and NOX emissions, reduction of peak prices, lost renewableenergy, valuation of unserved energy, percentage of renewable generation, and importednet energy [63].
Several works describe the energy market based on performance indicators. In [64,65],the generation costs are associated with CO2 emissions, the use of primary energy, the loadfactor of the generators, and the number of hours for which it is possible to disconnect thethermal generators to meet the demand for energy with renewables. In these cases, demandmanagement is expected to influence the efficient operation of electricity generation andthe increase in the implementation of RESs to meet the energy demand.
The future poses the challenges of generating electricity with low carbon emissionsand providing greater access to energy. For this reason, it is necessary to include objectivesrelated to social and environmental concerns in energy system design [66].
The use of storage systems helps increase the participation of renewable energies inthe coverage of demand and the use of available intermittent resources [67]. From theperspective of demand, the influence of the availability of renewable energy in distributedstorage systems will guide decision-making in managing the electricity market [68].
Other authors have shown that integrating different energy sources is essential forenergy management through intelligent systems [69] and increasing the implementationof renewables, thus reducing the instability of the quality parameters of the electricitysupply. In this sense, it is necessary to identify indicators that allow the valuation ofmarket scenarios.
• Key Performance Indicators related to DR
In energy-use management, DR has become a valuable mechanism that impacts costs,the environment, and the well-being of society; however, there are challenges to exploitingits potential, considering the technological and contextual diversity of its application byusers and utility providers. The following Key Performance Indicators (KPIs) are usedby the authors of [70] to assess the applicability of DR programs: Percentage of varia-tions in electricity load during the peak hour block, percentage of variations in electricityload during the off-peak hour block, percentage ratio of unserved energy from baselineconsumption, percentage of consumer participation, and percentage of consumer response.
Energies 2022, 15, 1307 11 of 28
In [71], the energy intensity of the industrial sector was related to the flexibility of loadper inhabitant and was used as a successful indicator of DR implementation. The studyverified that the number of energy-intensive industries is directly related to the potentialfor the deployment of DR. According to the authors of [18], in Malaysia, the intensityof electricity consumption increased favorably by 8.5% according to the gross domesticproduct due to the appropriate planning of the energy balance.
For the use of public funds, specifically in subsidies, a model can be used where theDR’s deployment level is established as a parameter [72]. This task involves the analysis ofthe electricity consumption and the required tariff structure to determine the will and thepayment capacity of the population.
The authors of [73] classified KPIs according to social, economic, technical, environ-mental, and legal concerns from the stakeholder perspective. In the group of technical KPIsrelated to DR in the WEM, they proposed: Percentage implementation of renewables tomeet thermal generation needs, percentage of energy resources distributed in the genera-tion mix, reduction percentage of peak plants based on the ratio of renewable energy tototal energy, and average interruption frequency and average interruption duration.
• The elasticity of the demand
The elasticity of demand measures the sensitivity or responsiveness experienced bythe quantity demanded when there is a percentage change in its price. Based on this simpledefinition, the elastic behavior of consumer demand indicates that minor variations inprices produce significant variations in the quantity demanded.
In WEMs, the participation of active demand directly affects prices and generationdispatch. This participation can be understood as a DR when it presents an elastic condition,especially in periods of high prices. The work carried out by the authors of [74] simulatesthe impact of demand price elasticity in programs based on real-time pricing (RTP) andpeak-time rebate (PTR). Other works that have modeled demand price elasticity in themarket can also be consulted [75–80]. Equation (1) represents the price elasticity of demand(ε) and is explained in [81].
ε =∆%D∆%P
=∆DD
∆PP
=
(D1−D0)D0
(P1−P0)P0
=(D1 − D0)
(P1 − P0)× P0
D0(1)
where ε = the price elasticity of demand; D1 = the quantity of demand 1; D0 = the quantityof demand 0; P1 = the price of demand 1; and P0 = the price of demand 0.
In [82], the behavior of price elasticity is compared across a time horizon, showing amore significant price in the long term. Consequently, electricity users are more sensitive toprice and policy changes in the long term, while in the short term, price policy may have amoderate impact, according to the investigations into residential customers.
• Constant elasticity of substitution
The elasticity of substitution indicates the level of sensitivity that the relationshipbetween two production or utility function factors displays when the marginal rate ofits products or profits varies. It measures the curvature of an isoquant, or a curve ofindifference, and the possibility of substituting factors or goods.
In [83], the substitution elasticity constant was used to develop a DR program applica-tion model derived from a time-based tariff. Unlike DR models based on price elasticity,the proposed model evaluated a continuous decision-making process, allowing greaterflexibility. Another model of elasticity of substitution, which considers the DR during peakand valley periods, is explained in [84], based on an incentive scheme that allows profitmaximization for an electricity retailer.
Usually, models use the price elasticity of demand, assuming that the consumerbehavior at a particular point of the demand curve is like any other. They linearize thedemand curve with a present value of the price elasticity, motivating assumptions thatproduce discontinuities in the decision-making process [83]. The appropriate treatment
Energies 2022, 15, 1307 12 of 28
is to overcome the elasticity of substitution instead of the price elasticity of demand. Thesubstitution elasticity function for two products (X1, X2) is presented in Equation (2):
U(X1, X2) = γ(
αX−ρ1 + (1 − α)X−ρ
2
)− ϑρ (2)
where γ = the efficiency parameter; α = the intensity factor of good X1; (1 − α) = theintensity factor of good X2; ϑ = the degree of scale; and ρ = the substitution parameter.
The utility function corresponding to the constant elasticity of substitution (CES) isprevalent in applications that include multiproduct scenarios in microeconomics [83].
The application of this function in the electricity market assumes that the energysupply is different for each period, motivating different prices in the consumer profile. Inthis case, the coefficient of elasticity of substitution can be determined from the expression(1 − ρ)−1. The elasticity substitution constant is usually applied to evaluate integratedgeneral equilibrium models [85].
The authors of [85] indicate that the flexibility of substituting demand in quantityand time can define the evaluation criteria for DR programs. Therefore, the elasticity ofsubstitution parameter is essential to determine the benefits of DR programs and to definewhether they are implemented according to the objective function of reducing the costsof the electricity supply, considering the ability of users to reschedule their consumptionroutines for different periods if given an incentive of reduced prices or other income.
5. Methodologies Used to Model Demand-Response and Sustainability Dimensions
Some authors have considered models for integrating decision variables to manage anadequate DR due to the flexibility conditions that it represents in the context of the planningand operation of the system and the electricity market. Technical, economic, social, andenvironmental parameters are considered for decision-making assistance, even if they aredispersed, due to the complexity of the electricity sector. Optimization tools are used torespond to these requirements, such as EFOM, OREM, GAMS, HOMER, EnergyPLAN, ED,OseMOSYS, PLEXOS, MESSAGE, MARKAL, TIMES, LEAP, and MATLAB [86–92].
• Methodologies used to model DR
In the literature, models for decision-making combine different technical aspects andscenarios with RESs to evaluate DR programs in WEMs, microgrids, or DNs.
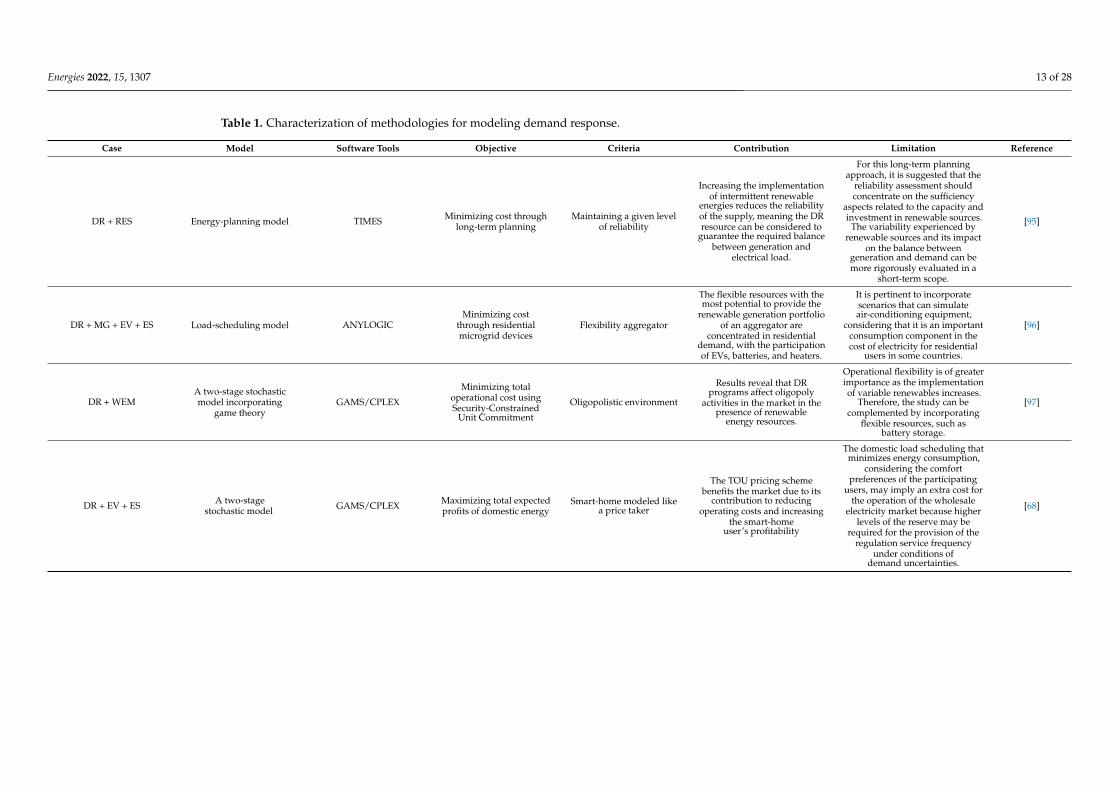
According to the authors of [93], the models that consider the integration of renewablesand the implementation of flexible resources, such as storage and DR, can be classified intothree general categories: optimization, partial or total equilibrium, and alternative models.In the first case, continuous, integer, and stochastic programming techniques are applied.In the second case, optimizations include functions that evaluate cost minimization. Inthe last category, models of probabilistic order, life-cycle evaluation, econometrics, and themodern theory of portfolio management are incorporated. In recent years, the perspectiveof Stackelberg has been analyzed as a case of game theory and used to model problems inthe context of the smart grid [94]. This classification of related works has been reviewedand summarized in Table 1, where DR is demand response, RESs are renewable energysources, WEM is wholesale electricity market, DN is distribution network, MG is microgrid,EV is electric vehicle, and ES is energy storage.
Energies 2022, 15, 1307 13 of 28
Table 1. Characterization of methodologies for modeling demand response.
Case Model Software Tools Objective Criteria Contribution Limitation Reference
DR + RES Energy-planning model TIMES Minimizing cost throughlong-term planning
Maintaining a given levelof reliability
Increasing the implementationof intermittent renewable
energies reduces the reliabilityof the supply, meaning the DRresource can be considered to
guarantee the required balancebetween generation and
electrical load.
For this long-term planningapproach, it is suggested that the
reliability assessment shouldconcentrate on the sufficiency
aspects related to the capacity andinvestment in renewable sources.
The variability experienced byrenewable sources and its impact
on the balance betweengeneration and demand can bemore rigorously evaluated in a
short-term scope.
[95]
DR + MG + EV + ES Load-scheduling model ANYLOGICMinimizing cost
through residentialmicrogrid devices
Flexibility aggregator
The flexible resources with themost potential to provide the
renewable generation portfolioof an aggregator are
concentrated in residentialdemand, with the participationof EVs, batteries, and heaters.
It is pertinent to incorporatescenarios that can simulateair-conditioning equipment,
considering that it is an importantconsumption component in thecost of electricity for residential
users in some countries.
[96]
DR + WEMA two-stage stochasticmodel incorporating
game theoryGAMS/CPLEX
Minimizing totaloperational cost usingSecurity-Constrained
Unit Commitment
Oligopolistic environment
Results reveal that DRprograms affect oligopoly
activities in the market in thepresence of renewable
energy resources.
Operational flexibility is of greaterimportance as the implementationof variable renewables increases.
Therefore, the study can becomplemented by incorporating
flexible resources, such asbattery storage.
[97]
DR + EV + ES A two-stagestochastic model GAMS/CPLEX Maximizing total expected
profits of domestic energySmart-home modeled like
a price taker
The TOU pricing schemebenefits the market due to its
contribution to reducingoperating costs and increasing
the smart-homeuser’s profitability
The domestic load scheduling thatminimizes energy consumption,
considering the comfortpreferences of the participating
users, may imply an extra cost forthe operation of the wholesale
electricity market because higherlevels of the reserve may be
required for the provision of theregulation service frequency
under conditions ofdemand uncertainties.
[68]
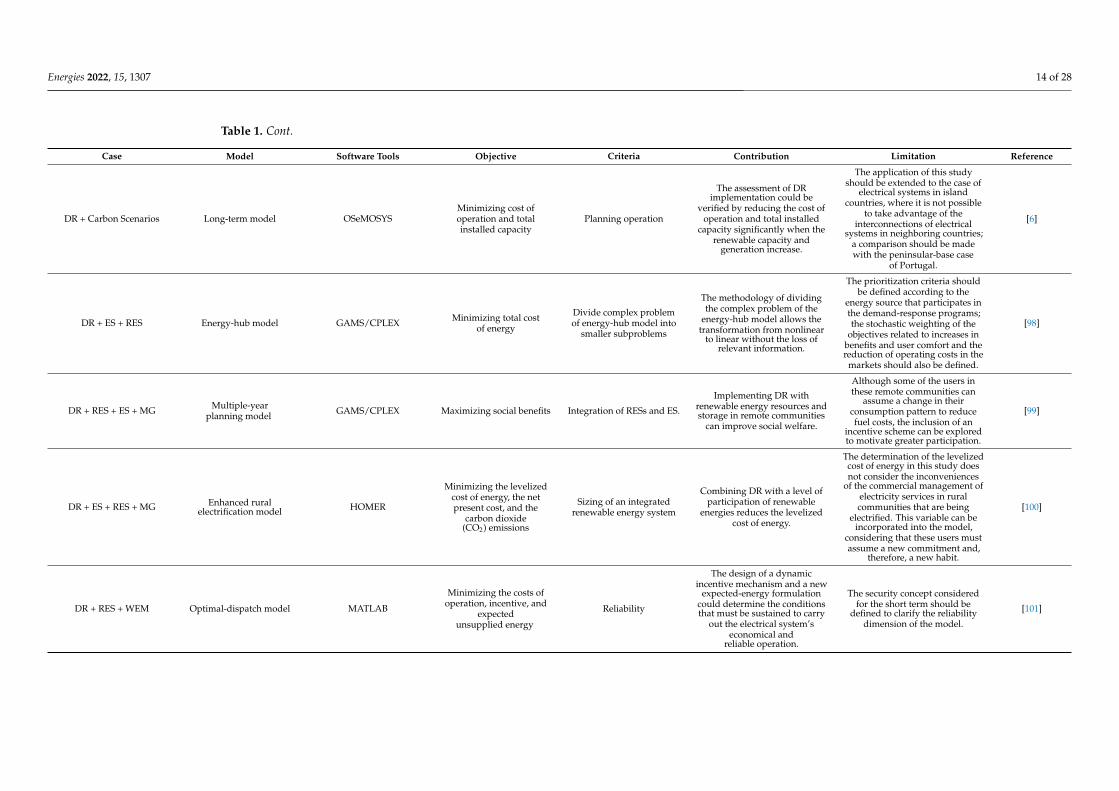
Energies 2022, 15, 1307 14 of 28
Table 1. Cont.
Case Model Software Tools Objective Criteria Contribution Limitation Reference
DR + Carbon Scenarios Long-term model OSeMOSYSMinimizing cost ofoperation and totalinstalled capacity
Planning operation
The assessment of DRimplementation could be
verified by reducing the cost ofoperation and total installed
capacity significantly when therenewable capacity and
generation increase.
The application of this studyshould be extended to the case of
electrical systems in islandcountries, where it is not possible
to take advantage of theinterconnections of electrical
systems in neighboring countries;a comparison should be madewith the peninsular-base case
of Portugal.
[6]
DR + ES + RES Energy-hub model GAMS/CPLEX Minimizing total costof energy
Divide complex problemof energy-hub model into
smaller subproblems
The methodology of dividingthe complex problem of the
energy-hub model allows thetransformation from nonlinear
to linear without the loss ofrelevant information.
The prioritization criteria shouldbe defined according to the
energy source that participates inthe demand-response programs;the stochastic weighting of the
objectives related to increases inbenefits and user comfort and thereduction of operating costs in the
markets should also be defined.
[98]
DR + RES + ES + MG Multiple-yearplanning model GAMS/CPLEX Maximizing social benefits Integration of RESs and ES.
Implementing DR withrenewable energy resources andstorage in remote communities
can improve social welfare.
Although some of the users inthese remote communities can
assume a change in theirconsumption pattern to reducefuel costs, the inclusion of an
incentive scheme can be exploredto motivate greater participation.
[99]
DR + ES + RES + MG Enhanced ruralelectrification model HOMER
Minimizing the levelizedcost of energy, the netpresent cost, and the
carbon dioxide(CO2) emissions
Sizing of an integratedrenewable energy system
Combining DR with a level ofparticipation of renewable
energies reduces the levelizedcost of energy.
The determination of the levelizedcost of energy in this study doesnot consider the inconveniences
of the commercial management ofelectricity services in ruralcommunities that are being
electrified. This variable can beincorporated into the model,
considering that these users mustassume a new commitment and,
therefore, a new habit.
[100]
DR + RES + WEM Optimal-dispatch model MATLAB
Minimizing the costs ofoperation, incentive, and
expectedunsupplied energy
Reliability
The design of a dynamicincentive mechanism and a new
expected-energy formulationcould determine the conditionsthat must be sustained to carry
out the electrical system’seconomical and
reliable operation.
The security concept consideredfor the short term should be
defined to clarify the reliabilitydimension of the model.
[101]
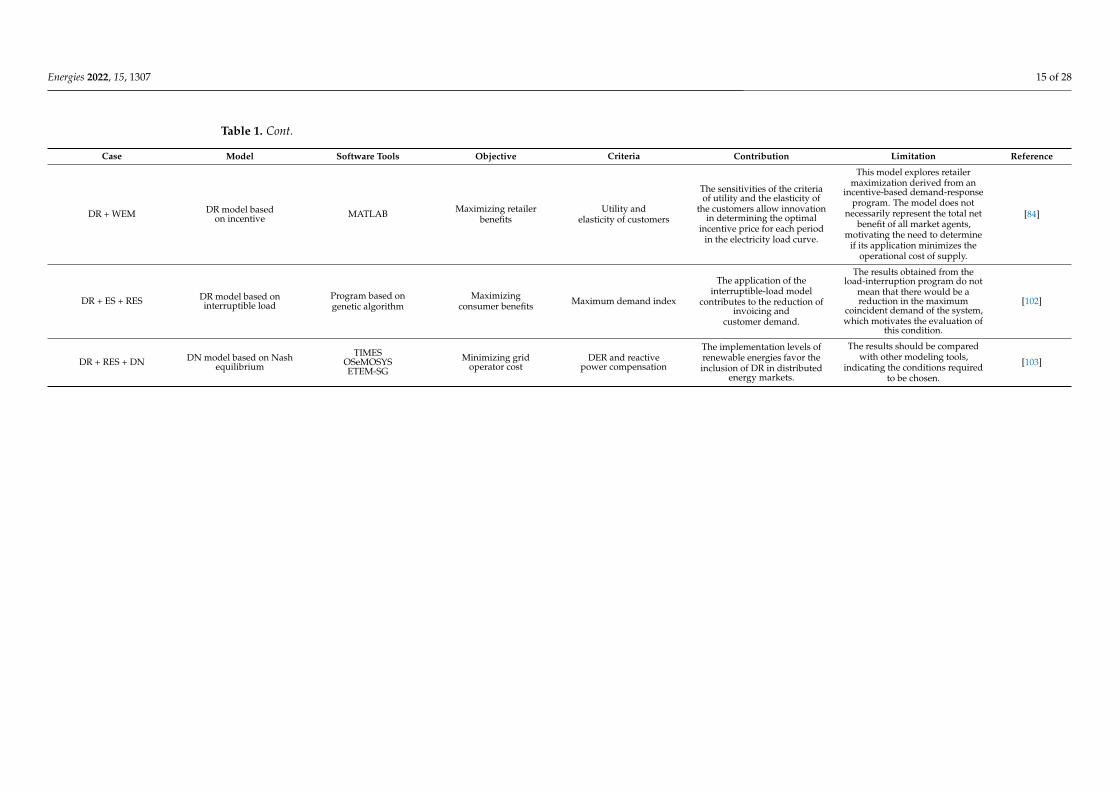
Energies 2022, 15, 1307 15 of 28
Table 1. Cont.
Case Model Software Tools Objective Criteria Contribution Limitation Reference
DR + WEM DR model basedon incentive MATLAB Maximizing retailer
benefitsUtility and
elasticity of customers
The sensitivities of the criteriaof utility and the elasticity of
the customers allow innovationin determining the optimal
incentive price for each periodin the electricity load curve.
This model explores retailermaximization derived from an
incentive-based demand-responseprogram. The model does not
necessarily represent the total netbenefit of all market agents,
motivating the need to determineif its application minimizes the
operational cost of supply.
[84]
DR + ES + RES DR model based oninterruptible load
Program based ongenetic algorithm
Maximizingconsumer benefits Maximum demand index
The application of theinterruptible-load model
contributes to the reduction ofinvoicing and
customer demand.
The results obtained from theload-interruption program do not
mean that there would be areduction in the maximum
coincident demand of the system,which motivates the evaluation of
this condition.
[102]
DR + RES + DN DN model based on Nashequilibrium
TIMESOSeMOSYSETEM-SG
Minimizing gridoperator cost
DER and reactivepower compensation
The implementation levels ofrenewable energies favor theinclusion of DR in distributed
energy markets.
The results should be comparedwith other modeling tools,
indicating the conditions requiredto be chosen.
[103]

Energies 2022, 15, 1307 16 of 28
• Sustainability dimensions in DR models
Energy modeling is a multidimensional concept that is challenging to explain from asingle methodological perspective. One of the most frequently used classifications in theliterature, dedicated to disaggregating the different dimensions applicable in developmentmodels, such as those that incorporate renewable energy and flexible resources in electricalsystems, is related to the concept of sustainable development (SD). This conception rests onthree fundamental pillars (social, economic, and environmental). It has been a ubiquitousconcept since 1987, when it was proposed by the United Nations as a process leading to“development that meets the needs of the present without compromising the ability offuture generations to meet their own need” [104,105]. The conditions required to maintainthe balance between the three components of SD are not easy to achieve, since the goals ofeach pillar must respect the interests of the remaining pillars [106]. Figure 6 summarizesthe taxonomy of SD in a Venn–Euler diagram.
Figure 6. Venn diagram of SD. Adapted from [106].
The analysis of energy demand is a vital part of planning studies for meeting theenergy needs of a nation and determining their impact on society, the economy, and theenvironment [107,108]. Table 2 contextualizes the research related to the evaluation of DRand its integration in the planning and operation of electrical systems.
Table 2. Sustainability categories used for assessing demand response.
Energy Activity Combined with DRSustainability Category From the Objective
Function Perspective Reference ModelIncluded Excluded
Microgrid + distributed ES devices Economic Environmental,Social Minimizing total cost of energy. [109]
Wind energy + pump storage Economic Environmental,Social
Maximizing net profit consideringrisk-averse day-ahead bidding. [110]
Energy hub Economic Environmental,Social Minimizing total cost of energy. [98]
Microgrid + storage + renewableenergy resources
Economic,Social Environmental Maximizing the social benefits of
the customers. [99]
Energy flexibility of buildings Environmental,Economic Social Price modulation to reduce CO2
emissions and cost savings. [111]
Microgrid + distributed energygeneration
Environmental,Economic Social Minimizing total cost of energy. [112]
Microgrid + storage Environmental,Economic Social
Minimizing levelized cost ofenergy, net present cost, and
carbon dioxide (CO2) emissions.[100,113]
Smart grid Environmental,Economic, social -
The implementation of theaggregator figure results to reduce
CO2, with social and economicbenefits for the customers.
[114]
Energies 2022, 15, 1307 17 of 28
Several methodologies for the economic assessment of DR programs differ primarilyby the perspective used to analyze the cost–benefit ratio.
• Based on the utility test
This perspective is often referred to as the Program Administrator Cost (PAC) or UtilityCost Test (UCT). This methodology measures the impact on the income company. Thebenefits included are the avoided transmission costs, including operation and maintenance(OM) costs. These costs have a more significant impact in the case of energy efficiencyprograms, where there is a net reduction in energy that the company sells to a customer.The energy-saving cost is a helpful metric for program administrators and regulators [115].
• Based on the participant cost test
This method compares bill savings against incremental costs of the efficient equip-ment [116]. The benefits include incentives received by the customer and reductions inenergy bills. This test is a good indicator of how acceptable a DR program would be forcustomers and therefore helps determine the likelihood of acceptance by clients.
• Based on the total resource cost test
This test measures the benefit–cost ratio from a broader perspective and includes allthe costs and benefits of a DR program. Benefits include the avoided costs of transmission,distribution, power generation capacity, and losses. Additionally, it considers OM costs,administrative costs, opportunity costs to reduce losses in networks, and investmentresources required in DR programs [115].
• Based on the total societal cost
This test only measures if the total cost is reduced by applying DR programs and,therefore, if the programs are beneficial to society. The other tests measure how the company,participants, and customers distribute the costs and benefits. This methodology comparesthe costs and benefits for utility providers, customers, and society [117].
6. Model Scheme Proposed Based on the Literature Review
The state of the art covered in this research on DR transcends the descriptive levelwhen verifying new possibilities in the WEM. The low number of publications addressingoperational flexibility is notable and is partly due to the traditional activities and rolesof the different agents that participate in the WEM. With this epistemological support, amethodology is constructed to model DR programs in the market, which considers theconcepts of segmentation, the elasticity of substitution, and DR programs, combined withhigh implementation levels of variable renewable energies. Therefore, several resources areassociated with the same operating model.
The complexity of a model grows with the number of variables and restrictions thatmust be considered to optimize an objective function. The proposed model shows a weeklyoperation program for an electrical power system that includes a generation mix with thesignificant participation of variable renewable energy, TNs, and end-users who are willingto receive an incentive for managing the demand with flexibility criteria.
The proposed methodology is based on the following elements: the prospecting ofvariable renewable energy; the segmentation of consumption profiles according to theelasticity of substitution; a program of DR based on incentives; and the determination ofthe cost of supply, considering economic, social, and environmental criteria. The novelty ofthis modeling method focuses on the combination of variable renewable energy prospectsand the application of segmentation techniques for consumer user profiles, based on thelevels of flexibility adjusted using CES applied to DR programs, which encourage theload-shifting strategy.
In the literature, some criteria have been used to validate the hypothesis that anincrease in the level of the participation of variable renewable energies in the WEM pro-duces a reduction in energy prices, especially in the short term. However, the premise
Energies 2022, 15, 1307 18 of 28
of reducing prices by increasing renewable generation may be conditioned by flexibilityincentives [118]. In [119], several studies are analyzed that evaluate the impact of variablerenewable energies in the wholesale generation markets of the United States, highlightingthe trend that an average reduction of -$0.37/MWh occurs with a 1% increase in the imple-mentation of variable renewable energies. These price variation conditions are subject tothe specifications of the markets and the electrical systems, such as the generation mix, theancillary services offered, the safety criteria required in the operation, and the regulatorypolicies established to minimize the generation dispatch cost and to maximize the net socialbenefit of the agents in the WEM.
In [76], the authors propose a price-based DR model for residential customers whocan change their consumption profile, maximizing profits. Although the model proposalresponds to an incentive-based design, it is complemented by the strategy of shifting loadbetween hourly blocks, from peak to valley and from shoulder to valley periods, through aprocess of iterations.
Additionally, this methodology considers a novel segmentation of demand, supportedby statistical criteria and a constant return to scale, ensuring that the budget destined for thepayment of energy consumption costs is not affected by increases in the price componentsof the hourly blocks. The effect of increasing the returns to scale of the CES function isshown in [120], demonstrating consistency with the average and marginal profits underconditions approaching the limits of the production factors.
Most of the mechanisms analyzed based on the CES function correspond to long-termprograms due to the essence of the macroeconomic problems of production and profits, asdeduced in [121–126]. This has led to a gap in the research exploring the behavior of theWEM in short-term applications, which is addresses in our methodology.
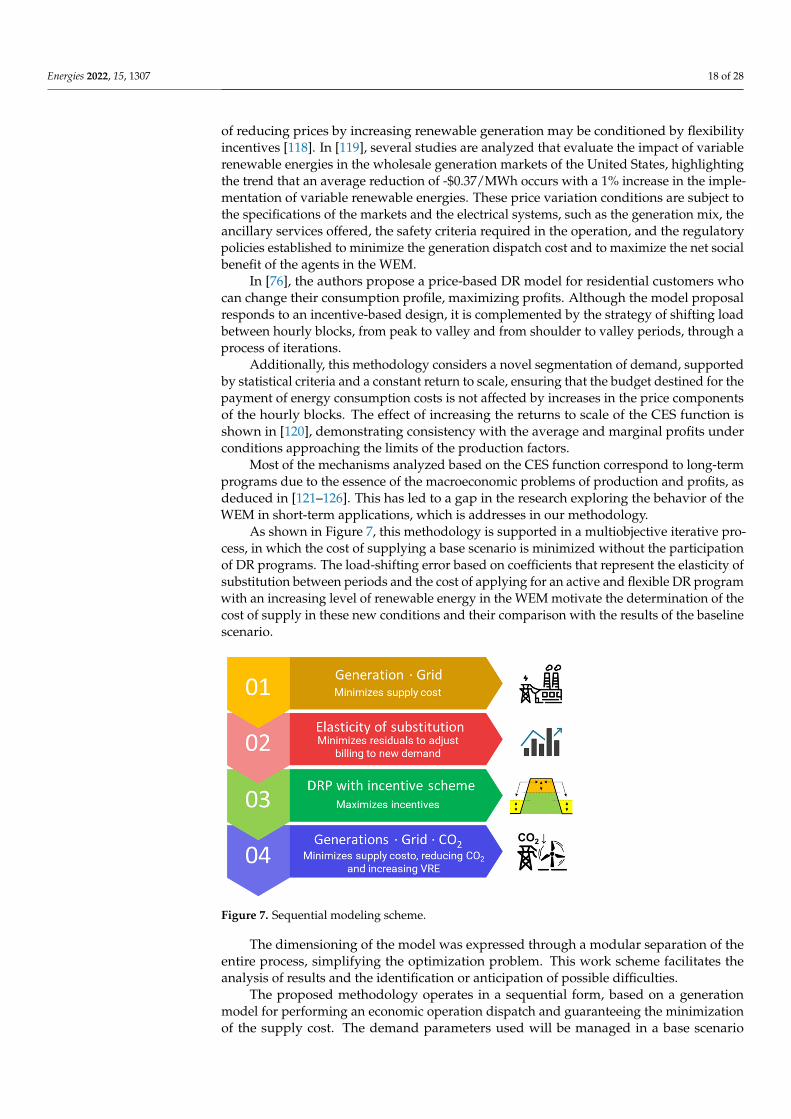
As shown in Figure 7, this methodology is supported in a multiobjective iterative pro-cess, in which the cost of supplying a base scenario is minimized without the participationof DR programs. The load-shifting error based on coefficients that represent the elasticity ofsubstitution between periods and the cost of applying for an active and flexible DR programwith an increasing level of renewable energy in the WEM motivate the determination of thecost of supply in these new conditions and their comparison with the results of the baselinescenario.
Figure 7. Sequential modeling scheme.
The dimensioning of the model was expressed through a modular separation of theentire process, simplifying the optimization problem. This work scheme facilitates theanalysis of results and the identification or anticipation of possible difficulties.
The proposed methodology operates in a sequential form, based on a generationmodel for performing an economic operation dispatch and guaranteeing the minimizationof the supply cost. The demand parameters used will be managed in a base scenario

Energies 2022, 15, 1307 19 of 28
that includes all demand. In an adjusted final case, part four of the sequential model, thecost of CO2 emissions and the segmentation of the flexible load profiles, defined by theelasticity of substitution model, are considered to apply the strategy of shifting demandfrom the peak periods of the daily load curve to the valley and shoulder periods. In thiscase, demand in the WEM is concentrated in large/industrial consumers and the figure ofthe retailing agent.
Usually, large/industrial consumers have the advantage of negotiating prices underunregulated conditions in the WEM. The participation of residential and commercial usersis more complicated, considering that they cannot establish significant modifications in therecords. The aggregators verify the consumption profiles, offering DR programs based onparticipation options that guarantee market incentives. Therefore, it is justified that utilityproviders and end-users study the different consumer segments based on characteristicsthat allow the management of previously identified user clusters.
The structure of the model takes into account concepts such as economic dispatch, asdeveloped by [90]; the treatment of renewable generation and demand response accordingto [83,127–129]; the coefficient of elasticity of substitution (CES) outlined by [130]; and CO2emission control described by [131], associated with the methodology of the Intergovern-mental Panel on Climate Change (IPCC), used to quantify CO2 emissions at three levelsof detail. The main modeling specifications for the proposed methodology are shown inTable 3. The details of the restrictions are not contemplated in this work; however, theyshould be considered during the development of the optimization program to delimitranges, ramps, reserves, and other aspects of the operation that respond to the topologicalparticularities of the network, the generation plants, the demand, and the market rules.
Table 3. Main modeling specifications.
Stage ConceptDescription Module 0 Module 1 Module 2 Module 3
Input Data
Start-up cost,shutdown cost,
variable productioncost, the value oflost load, watervalue, demand,
spinning reserve,technical characteristics
of generation,and network
Hourly demandand demand
grouped by blocks,participants in
DRP, parameters inCES function,marginal costs
Hourly demand anddemand grouped by
blocks, technicalcharacteristics of
demand, scenarios ofdemand probabilities
Includes data frommodules 0 and 2,
parameters for CO2emission control
ProcessDecision variables
Energy generation,demand pumping,unserved energy
Residuals from theCES function
Energy demandadjusted by DRP, the
incentive forparticipants in DRP
Energy generation,demand pumping,unserved energy,emissions of CO2
Objective function Minimizingoperation cost
Minimizingresiduals from the
approximateCES function
Maximizingincentive scheme
Minimizing operatingcost, including
emissions of CO2
Model type MIP NLP NLP MIP
Output Main results
Operating cost,power and reserve
outputs ofeach generator,marginal costs
New demandblocks
New hourly demand,the incentive for
participants in DRP
Operating cost, powerand reserve outputs of
each generator,marginal costs, CO2
emissions, profit, andKPIs to evaluate DRP
Table 4 summarizes some works that model energy management based on the elasticityof substitution constant, taken as a parameter for developing the methodology proposed in
Energies 2022, 15, 1307 20 of 28
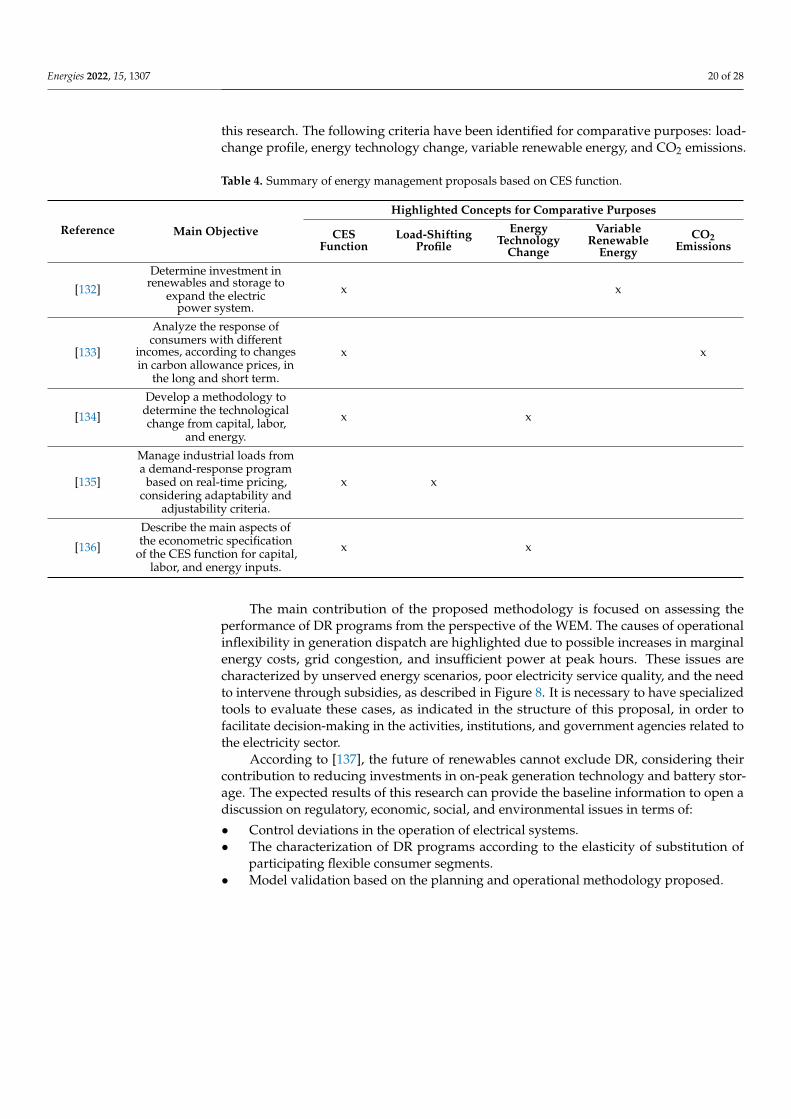
this research. The following criteria have been identified for comparative purposes: load-change profile, energy technology change, variable renewable energy, and CO2 emissions.
Table 4. Summary of energy management proposals based on CES function.
Reference Main Objective
Highlighted Concepts for Comparative Purposes
CESFunction
Load-ShiftingProfile
EnergyTechnology
Change
VariableRenewable
EnergyCO2
Emissions
[132]
Determine investment inrenewables and storage to
expand the electricpower system.
x x
[133]
Analyze the response ofconsumers with different
incomes, according to changesin carbon allowance prices, in
the long and short term.
x x
[134]
Develop a methodology todetermine the technologicalchange from capital, labor,
and energy.
x x
[135]
Manage industrial loads froma demand-response program
based on real-time pricing,considering adaptability and
adjustability criteria.
x x
[136]
Describe the main aspects ofthe econometric specification
of the CES function for capital,labor, and energy inputs.
x x
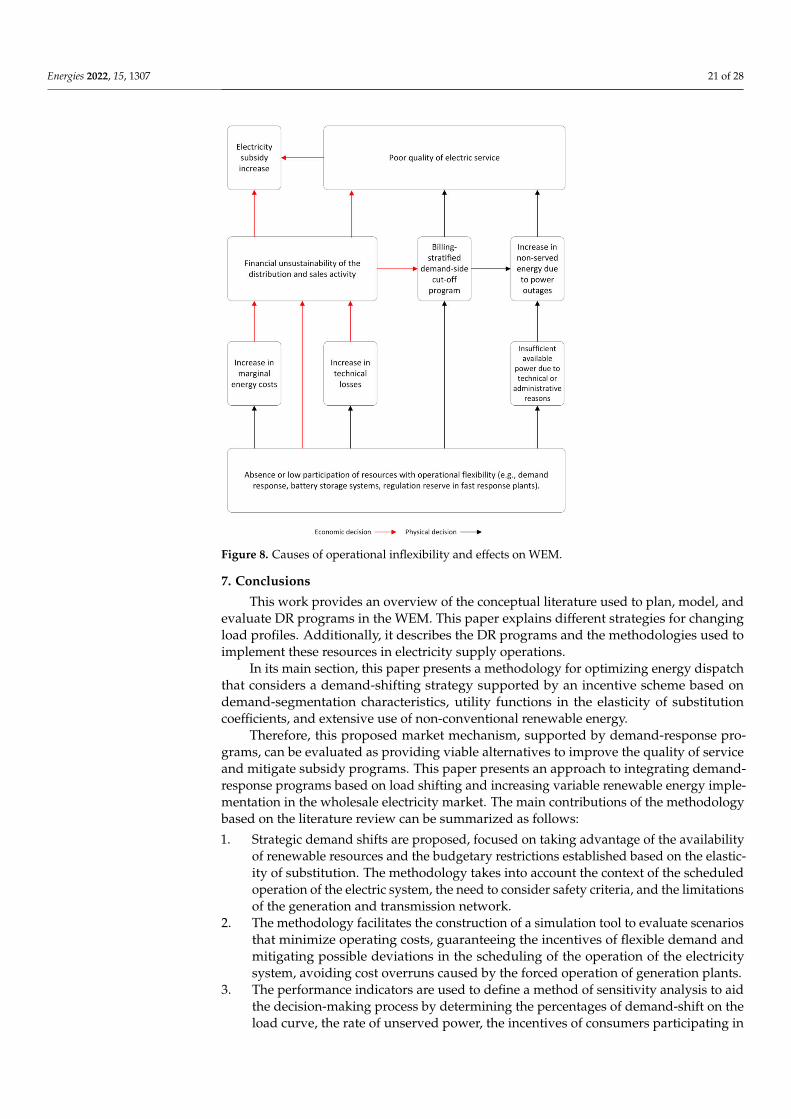
The main contribution of the proposed methodology is focused on assessing theperformance of DR programs from the perspective of the WEM. The causes of operationalinflexibility in generation dispatch are highlighted due to possible increases in marginalenergy costs, grid congestion, and insufficient power at peak hours. These issues arecharacterized by unserved energy scenarios, poor electricity service quality, and the needto intervene through subsidies, as described in Figure 8. It is necessary to have specializedtools to evaluate these cases, as indicated in the structure of this proposal, in order tofacilitate decision-making in the activities, institutions, and government agencies related tothe electricity sector.
According to [137], the future of renewables cannot exclude DR, considering theircontribution to reducing investments in on-peak generation technology and battery stor-age. The expected results of this research can provide the baseline information to open adiscussion on regulatory, economic, social, and environmental issues in terms of:
• Control deviations in the operation of electrical systems.• The characterization of DR programs according to the elasticity of substitution of
participating flexible consumer segments.• Model validation based on the planning and operational methodology proposed.
Energies 2022, 15, 1307 21 of 28
Figure 8. Causes of operational inflexibility and effects on WEM.
7. Conclusions
This work provides an overview of the conceptual literature used to plan, model, andevaluate DR programs in the WEM. This paper explains different strategies for changingload profiles. Additionally, it describes the DR programs and the methodologies used toimplement these resources in electricity supply operations.
In its main section, this paper presents a methodology for optimizing energy dispatchthat considers a demand-shifting strategy supported by an incentive scheme based ondemand-segmentation characteristics, utility functions in the elasticity of substitutioncoefficients, and extensive use of non-conventional renewable energy.
Therefore, this proposed market mechanism, supported by demand-response pro-grams, can be evaluated as providing viable alternatives to improve the quality of serviceand mitigate subsidy programs. This paper presents an approach to integrating demand-response programs based on load shifting and increasing variable renewable energy imple-mentation in the wholesale electricity market. The main contributions of the methodologybased on the literature review can be summarized as follows:
1. Strategic demand shifts are proposed, focused on taking advantage of the availabilityof renewable resources and the budgetary restrictions established based on the elastic-ity of substitution. The methodology takes into account the context of the scheduledoperation of the electric system, the need to consider safety criteria, and the limitationsof the generation and transmission network.
2. The methodology facilitates the construction of a simulation tool to evaluate scenariosthat minimize operating costs, guaranteeing the incentives of flexible demand andmitigating possible deviations in the scheduling of the operation of the electricitysystem, avoiding cost overruns caused by the forced operation of generation plants.
3. The performance indicators are used to define a method of sensitivity analysis to aidthe decision-making process by determining the percentages of demand-shift on theload curve, the rate of unserved power, the incentives of consumers participating in

Energies 2022, 15, 1307 22 of 28
demand-response programs, the natural behavior of prices in the market, and thereduction of CO2 emissions.
Finally, it is important to highlight that the proposed methodology is not a tool tominimize costs or reduce CO2 emissions for all cases. The optimization problem’s solutiondepends on the electrical system’s generation mix and the technologies used to compensatefor the fluctuations.
The future development of this research will contemplate the forecasting of variablerenewables, flexible demand segmentation, and the definition of a mechanism to recognizethe firm capacity contribution of variable renewable technologies and their remuneration,providing greater availability when complemented by demand-response programs duringgeneration shortage hours in the daily load curve.
Author Contributions: Conceptualization, M.A.D.-G. and A.A.-M.; methodology, M.A.D.-G.; inves-tigation, M.A.D.-G.; writing—original draft preparation, M.A.D.-G.; writing—review and editing,M.A.D.-G., A.A.-M. and M.A.-M.; supervision, V.S.O.-G. and F.S.-G. All authors have read and agreedto the published version of the manuscript.
Funding: This research received no external funding.
Institutional Review Board Statement: Not applicable.
Informed Consent Statement: Not applicable.
Data Availability Statement: Not applicable.
Acknowledgments: The authors would like to acknowledge OC (Organismo Coordinador del Sis-tema Eléctrico Nacional Interconectado), a nonprofit organization which plays the role of the operatorof the wholesale electricity market in the Dominican Republic. The OC provided the invaluablesupport of specialists to review the proposed methodology.
Conflicts of Interest: The authors declare no conflict of interest.
Abbreviations
CES Constant Elasticity of SubstitutionCPP Critical Peak PricingDDSM Dynamic Demand-Side ManagementDLC Direct Load ControlDNs Distribution NetworksDR Demand ResponseDSI Demand-Side IntegrationDSM Demand-Side ManagementDRP Demand-Response ProgramES Energy StorageEUE Expected Unserved EnergyEVs Electric VehiclesHVAC Heating, Ventilation, and Air ConditioningIPCC Intergovernmental Panel on Climate ChangeKPIs Key Performance IndicatorsLOLE Loss-Of-Load ExpectationLOLP Loss-Of-Load ProbabilityNCRE Non-Conventional Renewable EnergyO&M Operation and MaintenancePAC Program Administrator CostPTR Peak Time RebateRESs Renewable Energy Sources
Energies 2022, 15, 1307 23 of 28
RTP Real-Time PricingSD Sustainable DevelopmentSDSM Static Demand-Side ManagementTNs Transmission NetworksTOU Time-Of-Use PricingUCT Utility Cost TestWEM Wholesale Electricity Market
References1. NERC. Demand Response Availability Report; NERC: Atlanta, GA, USA, 2013; Available online: https://www.nerc.com (accessed
on 20 August 2021).2. Paterakis, N.G.; Erdinç, O.; Catalão, J.P.S. An overview of Demand Response: Key-elements and international experience. Renew.
Sustain. Energy Rev. 2017, 69, 871–891. [CrossRef]3. Wang, F.; Xu, H.; Xu, T.; Li, K.; Shafie-Khah, M.; Catalão, J.P.S. The values of market-based demand response on improving power
system reliability under extreme circumstances. Appl. Energy 2017, 193, 220–231. [CrossRef]4. Meyabadi, A.F.; Deihimi, M.H. A review of demand-side management: Reconsidering theoretical framework. Renew. Sustain.
Energy Rev. 2017, 80, 367–379. [CrossRef]5. Wohlfarth, K.; Klingler, A.-L.; Eichhammer, W. The flexibility deployment of the service sector—A demand response modelling
approach coupled with evidence from a market research survey. Energy Strategy Rev. 2020, 28, 100460. [CrossRef]6. Anjo, J.; Neves, D.; Silva, C.; Shivakumar, A.; Howells, M. Modeling the long-term impact of demand response in energy planning:
The Portuguese electric system case study. Energy 2018, 165, 456–468. [CrossRef]7. Lopes, F.; Coelho, H. Electricity Markets with Increasing Levels of Renewable Generation: Structure, Operation, Agent-Based Simulation,
and Emerging Designs; Springer: Berlin/Heidelberg, Germany, 2018; Volume 144.8. Vázquez-Canteli, J.R.; Nagy, Z. Reinforcement learning for demand response: A review of algorithms and modeling techniques.
Appl. Energy 2019, 235, 1072–1089. [CrossRef]9. Zhou, S.; Shu, Z.; Gao, Y.; Gooi, H.B.; Chen, S.; Tan, K. Demand response program in Singapore’s wholesale electricity market.
Electr. Power Syst. Res. 2017, 142, 279–289. [CrossRef]10. Patnam, B.S.K.; Pindoriya, N.M. Demand response in consumer-Centric electricity market: Mathematical models and optimization
problems. Electr. Power Syst. Res. 2021, 193, 106923. [CrossRef]11. Gagne, D.A.; Settle, D.E.; Aznar, A.Y.; Bracho, R. Demand Response Compensation Methodologies: Case Studies for Mexico.
Available online: https://www.osti.gov/biblio/1452706 (accessed on 20 July 2021).12. Huang, Y.; Pardalos, P.M.; Zheng, Q.P. Electrical Power Unit Commitment: Deterministic and Two-Stage Stochastic Programming Models
and Algorithms; Springer: Berlin/Heidelberg, Germany, 2017.13. Dadashi, M.; Zare, K.; Seyedi, H.; Shafie-khah, M. Coordination of wind power producers with an energy storage system for the
optimal participation in wholesale electricity markets. Int. J. Electr. Power Energy Syst. 2022, 136, 107672. [CrossRef]14. Dranka, G.; Ferreira, P. Review and Assessment of the Different Categories of Demand Response Potentials. Energy 2019, 179,
280–294. [CrossRef]15. Huang, W.; Zhang, N.; Kang, C.; Li, M.; Huo, M. From demand response to integrated demand response: Review and prospect of
research and application. Prot. Control. Mod. Power Syst. 2019, 4, 12. [CrossRef]16. Ventosa, M.; Linares, P.; Pérez-Arriaga, I.J. Power system economics. In Regulation of the Power Sector; Springer: Berlin/Heidelberg,
Germany, 2013; pp. 47–123.17. Cepeda, M.; Saguan, M. Assessing long-term effects of demand response policies in wholesale electricity markets. Int. J. Electr.
Power Energy Syst. 2016, 74, 142–152. [CrossRef]18. Sulaima, M.F.; Dahlan, N.Y.; Yasin, Z.M.; Rosli, M.M.; Omar, Z.; Hassan, M.Y. A review of electricity pricing in peninsular
Malaysia: Empirical investigation about the appropriateness of Enhanced Time of Use (ETOU) electricity tariff. Renew. Sustain.Energy Rev. 2019, 110, 348–367. [CrossRef]
19. Ghadi, M.J.; Rajabi, A.; Ghavidel, S.; Azizivahed, A.; Li, L.; Zhang, J. From active distribution systems to decentralized microgrids:A review on regulations and planning approaches based on operational factors. Appl. Energy 2019, 253, 113543. [CrossRef]
20. Kwon, P.S.; Østergaard, P. Assessment and evaluation of flexible demand in a Danish future energy scenario. Appl. Energy 2014,134, 309–320. [CrossRef]
21. Cruz, M.R.M.; Fitiwi, D.Z.; Santos, S.F.; Catalão, J.P.S. A comprehensive survey of flexibility options for supporting the low-carbonenergy future. Renew. Sustain. Energy Rev. 2018, 97, 338–353. [CrossRef]
22. Gaffney, F.; Deane, J.P.; Gallachóir, B.P.Ó. Reconciling high renewable electricity ambitions with market economics and systemoperation: Lessons from Ireland’s power system. Energy Strategy Rev. 2019, 26, 100381. [CrossRef]
23. Chinmoy, L.; Iniyan, S.; Goic, R. Modeling wind power investments, policies and social benefits for deregulated electricitymarket—A review. Appl. Energy 2019, 242, 364–377. [CrossRef]
24. Vahid-Ghavidel, M.; Javadi, M.S.; Santos, S.F.; Gough, M.; Mohammadi-Ivatloo, B.; Shafie-Khah, M.; Catalão, J.P.S. Novel HybridStochastic-Robust Optimal Trading Strategy for a Demand Response Aggregator in the Wholesale Electricity Market. IEEE Trans.Ind. Appl. 2021, 57, 5488–5498. [CrossRef]
Energies 2022, 15, 1307 24 of 28
25. Qaderi-Baban, P.; Menhaj, M.-B.; Dosaranian-Moghadam, M.; Fakharian, A. A Coordinated Performance of Power SystemOperated with Participants in Demand Response Programs Considering Environmental Pollution Constraints. J. Electr. Eng.Technol. 2021, 16, 15–29. [CrossRef]
26. Iria, J.; Soares, F.; Matos, M. Optimal supply and demand bidding strategy for an aggregator of small prosumers. Appl. Energy2018, 213, 658–669. [CrossRef]
27. Burger, S.; Chaves-Ávila, J.P.; Batlle, C.; Pérez-Arriaga, I.J. A review of the value of aggregators in electricity systems. Renew.Sustain. Energy Rev. 2017, 77, 395–405. [CrossRef]
28. Iria, J.; Scott, P.; Attarha, A.; Gordon, D.; Franklin, E. MV-LV network-secure bidding optimisation of an aggregator of prosumersin real-time energy and reserve markets. Energy 2021, 242, 122962. [CrossRef]
29. Hu, J.; Yang, G.; Ziras, C.; Kok, K. Aggregator operation in the balancing market through network-constrained transactive energy.IEEE Trans. Power Syst. 2018, 34, 4071–4080. [CrossRef]
30. Okur, Ö.; Voulis, N.; Heijnen, P.; Lukszo, Z. Aggregator-mediated demand response: Minimizing imbalances caused byuncertainty of solar generation. Appl. Energy 2019, 247, 426–437. [CrossRef]
31. Moghaddam, S.Z.; Akbari, T. Network-constrained optimal bidding strategy of a plug-in electric vehicle aggregator: A stochas-tic/robust game theoretic approach. Energy 2018, 151, 478–489. [CrossRef]
32. Machamint, V.; Oureilidis, K.; Efthymiou, V.; Georghiou, G.E. Investigation of the Role of an Aggregator Operating in theEuropean Spot and Balancing Markets; the Case of an Island. In Proceedings of the 2018 15th International Conference on theEuropean Energy Market (EEM), Lodz, Poland, 27–29 June 2018; pp. 1–5.
33. Parvania, M.; Fotuhi-Firuzabad, M.; Shahidehpour, M. Optimal demand response aggregation in wholesale electricity markets.IEEE Trans. Smart Grid 2013, 4, 1957–1965. [CrossRef]
34. Soares, T.; Sousa, T.; Andersen, P.B.; Pinson, P. Optimal offering strategy of an EV aggregator in the frequency-controlled normaloperation reserve market. In Proceedings of the 2018 15th International Conference on the European Energy Market (EEM), Lodz,Poland, 27–29 June 2018; pp. 1–6.
35. Wang, X.; Huang, T.; Zhang, S.H. Equilibrium Analysis of Electricity Market Considering Penalties for Wind Power’s BiddingDeviation. Power Syst. Technol. 2016, 40, 602–607.
36. Brown, M.A.; Chapman, O. The size, causes, and equity implications of the demand-response gap. Energy Policy 2021, 158, 112533.[CrossRef]
37. Gellings, C.W. Evolving practice of demand-side management. J. Mod. Power Syst. Clean Energy 2017, 5, 1–9. [CrossRef]38. Zhou, K.; Yang, S. Demand side management in China: The context of China’s power industry reform. Renew. Sustain. Energy Rev.
2015, 47, 954–965. [CrossRef]39. Renani, Y.K.; Ehsan, M.; Shahidehpour, M. Optimal transactive market operations with distribution system operators. IEEE Trans.
Smart Grid 2017, 9, 6692–6701. [CrossRef]40. Khan, I. Energy-saving behaviour as a demand-side management strategy in the developing world: The case of Bangladesh. Int.
J. Energy Environ. Eng. 2019, 10, 493–510. [CrossRef]41. Harish, V.S.K.V.; Kumar, A. Planning and implementation strategy of Demand Side Management in India. In Proceedings of the
2014 First International Conference on Automation, Control, Energy and Systems (ACES), Adisaptagram, India, 1–2 February2014; p. 1.
42. Chassin, D.P.; Rondeau, D. Aggregate modeling of fast-acting demand response and control under real-time pricing. Appl. Energy2016, 181, 288–298. [CrossRef]
43. Tahir, M.; Haoyong, C.; Ibn, I.; Ali, N.; Ullah, S. Demand Response Programs Significance, Challenges and Worldwide Scope inMaintaining Power System Stability. Int. J. Adv. Comput. Sci. Appl. (IJACSA) 2018, 9. [CrossRef]
44. Chuang, A.S.; Gellings, C.W. Demand-Side Integration in a Restructured Electric Power Industry. In Proceedings of the 42ndInternational Conference on Large High Voltage Electric Systems 2008, CIGRE, Paris, France, 24–29 August 2008.
45. Logenthiran, T.; Srinivasan, D. Multi-Agent System for Demand Side Management in Smart Grid. In Proceedings of the 2011IEEE Ninth International Conference on Power Electronics and Drive Systems, Singapore, 5–8 December 2011.
46. Pasetti, M.; Rinaldi, S.; Manerba, D. A Virtual Power Plant Architecture for the Demand-Side Management of Smart Prosumers.Appl. Sci. 2018, 8, 432. [CrossRef]
47. Longe, O. Time Programmable Smart Devices for Peak Demand Reduction of Smart Homes in a Microgrid. In Proceedings of the2014 IEEE 6th International Conference on Adaptive Science & Technology (ICAST), Lagos, Nigeria, 29–31 October 2014.
48. Li, H.; Wang, Z.; Hong, T.; Piette, M.A. Energy Flexibility of Residential Buildings: A Systematic Review of Characterization andQuantification Methods and Applications. Adv. Appl. Energy 2021, 3, 100054. [CrossRef]
49. Rahman, M.M.; Hettiwatte, S.; Shafiullah, G.M.; Arefi, A. An analysis of the time of use electricity price in the residential sector ofBangladesh. Energy Strategy Rev. 2017, 18, 183–198. [CrossRef]
50. Ye, B.; Ge, F.; Rong, X.; Li, L. The influence of nonlinear pricing policy on residential electricity demand—A case study of Anhuiresidents. Energy Strategy Rev. 2016, 13, 115–124. [CrossRef]
51. Pallonetto, F.; De Rosa, M.; Milano, F.; Finn, D.P. Demand response algorithms for smart-grid ready residential buildings usingmachine learning models. Appl. Energy 2019, 239, 1265–1282. [CrossRef]
52. Touma, H.J.; Mansor, M.; Rahman, M.S.A.; Kumaran, V.; Mokhlis, H.B.; Ying, Y.J.; Hannan, M.A. Energy management system ofmicrogrid: Control schemes, pricing techniques, and future horizons. Int. J. Energy Res. 2021, 45, 12728–12739. [CrossRef]
Energies 2022, 15, 1307 25 of 28
53. Xu, B.; Wang, J.; Guo, M.; Lu, J.; Li, G.; Han, L. A hybrid demand response mechanism based on real-time incentive and real-timepricing. Energy 2021, 231, 120940. [CrossRef]
54. Cao, K.; Choi, T.M. Optimal Trade-in Return Policies: Is it Wise to be Generous? Prod. Oper. Manag. 2021. [CrossRef]55. Hajibandeh, N.; Ehsan, M.; Soleymani, S.; Shafie-khah, M.; Catalão, J.P.S. The Mutual Impact of Demand Response Programs and
Renewable Energies: A Survey. Energies 2017, 10, 1353. [CrossRef]56. Olsen, D.; Kiliccote, S.; Sohn, M.; Dunn, L.; Piette, M.A. Taxonomy for Modeling Demand Response Resources; Lawrence Berkeley
National Laboratory: Berkeley, CA, USA, 2014.57. Lynch, M.Á.; Nolan, S.; Devine, M.T.; O’Malley, M. The impacts of demand response participation in capacity markets. Appl.
Energy 2019, 250, 444–451. [CrossRef]58. Khan, A.S.M.; Verzijlbergh, R.A.; Sakinci, O.C.; De Vries, L.J. How do demand response and electrical energy storage affect (the
need for) a capacity market? Appl. Energy 2018, 214, 39–62. [CrossRef]59. Motalleb, M.; Thornton, M.; Reihani, E.; Ghorbani, R. Providing frequency regulation reserve services using demand response
scheduling. Energy Convers. Manag. 2016, 124, 439–452. [CrossRef]60. Gjorgievski, V.Z.; Markovska, N.; Abazi, A.; Duic, N.J.R.; Reviews, S.E. The potential of power-to-heat demand response to
improve the flexibility of the energy system: An empirical review. Renew. Sustain. Energy Rev. 2021, 138, 110489. [CrossRef]61. Aalami, H.A.; Khatibzadeh, A. Regulation of market clearing price based on nonlinear models of demand bidding and emergency
demand response programs. Int. Trans. Electr. Energy Syst. 2016, 26, 2463–2478. [CrossRef]62. Chen, Y.; Zhang, L.; Xu, P.; Di Gangi, A. Electricity demand response schemes in China: Pilot study and future outlook. Energy
2021, 224, 120042. [CrossRef]63. Dallinger, B.; Schwabeneder, D.; Lettner, G.; Auer, H. Socio-economic benefit and profitability analyses of Austrian hydro storage
power plants supporting increasing renewable electricity generation in Central Europe. Renew. Sustain. Energy Rev. 2019, 107,482–496. [CrossRef]
64. Bracco, S.; Delfino, F.; Pampararo, F.; Robba, M.; Rossi, M. A mathematical model for the optimal operation of the University ofGenoa Smart Polygeneration Microgrid: Evaluation of technical, economic and environmental performance indicators. Energy2014, 64, 912–922. [CrossRef]
65. De Christo, T.M.; Perron, S.; Fardin, J.F.; Simonetti, D.S.L.; de Alvarez, C.E. Demand-side energy management by cooperativecombination of plans: A multi-objective method applicable to isolated communities. Appl. Energy 2019, 240, 453–472. [CrossRef]
66. Eriksson, E.L.V.; Gray, E.M. Optimization and integration of hybrid renewable energy hydrogen fuel cell energy systems—Acritical review. Appl. Energy 2017, 202, 348–364. [CrossRef]
67. Anderson, K.; Laws, N.D.; Marr, S.; Lisell, L.; Jimenez, T.; Case, T.; Li, X.; Lohmann, D.; Cutler, D. Quantifying and monetizingrenewable energy resiliency. Sustainability 2018, 10, 933. [CrossRef]
68. Gazafroudi, A.S.; Shafie-khah, M.; Heydarian-Forushani, E.; Hajizadeh, A.; Heidari, A.; Corchado, J.M.; Catalão, J.P.S. Two-stagestochastic model for the price-based domestic energy management problem. Int. J. Electr. Power Energy Syst. 2019, 112, 404–416.[CrossRef]
69. O’Dwyer, E.; Pan, I.; Acha, S.; Shah, N. Smart energy systems for sustainable smart cities: Current developments, trends andfuture directions. Appl. Energy 2019, 237, 581–597. [CrossRef]
70. Minou, M.; Thanos, G.; Vasirani, M.; Ganu, T.; Jain, M.; Gylling, A. Evaluating demand response programs: Getting the keyperformance indicators right. In Proceedings of the International Workshop on Demand Response, Bangalore, India, 7–10January 2013.
71. Gils, H.C. Assessment of the theoretical demand response potential in Europe. Energy 2014, 67, 1–18. [CrossRef]72. Olmos, L.; Rodilla, P.; Fernandes, C.; Frias, P.; Ahcin, P.; Morch, A.; Ostos, P. Definition of Key Performance Indicators for the
Assessment of Design Options. 2015. Available online: http://market4res.eu/wp-content/uploads/D3-3_20160111_KPI.pdf(accessed on 28 June 2021).
73. Pramangioulis, D.; Atsonios, K.; Nikolopoulos, N.; Rakopoulos, D.; Grammelis, P.; Kakaras, E. A Methodology for Determinationand Definition of Key Performance Indicators for Smart Grids Development in Island Energy Systems. Energies 2019, 12, 242.[CrossRef]
74. Mohajeryami, S.; Schwarz, P.; Baboli, P.T. Including the behavioral aspects of customers in demand response model: Real timepricing versus peak time rebate. In Proceedings of the 2015 North American Power Symposium (NAPS), Charlotte, NC, USA, 4–6October 2015; pp. 1–6.
75. Sharifi, R.; Fathi, S.H.; Anvari-Moghaddam, A.; Guerrero, J.M.; Vahidinasab, V. An economic customer-oriented demand responsemodel in electricity markets. In Proceedings of the 2018 IEEE International Conference on Industrial Technology (ICIT), Lyon,France, 19–22 February 2018; pp. 1149–1153.
76. Jalili, H.; Sheikh-El-Eslami, M.K.; Moghaddam, M.P.; Siano, P. Modeling of demand response programs based on market elasticityconcept. J. Ambient. Intell. Humaniz. Comput. 2018, 10, 2265–2276. [CrossRef]
77. Qu, X.; Hui, H.; Yang, S.; Li, Y.; Ding, Y. Price elasticity matrix of demand in power system considering demand responseprograms. In IOP Conference Series: Earth and Environmental Science; IOP Publishing: Bristol, UK, 2018.
78. Asadinejad, A.; Tomsovic, K. Optimal use of incentive and price based demand response to reduce costs and price volatility.Electr. Power Syst. Res. 2017, 144, 215–223. [CrossRef]
Energies 2022, 15, 1307 26 of 28
79. Zin, A.A.B.M.; Moradi, M. An experimental investigation of price elasticity in electricity markets using a response surfacemethodology. Energy Effic. 2018, 12, 667–680. [CrossRef]
80. Müller, M.F.; Thompson, S.E.; Gadgil, A.J. Estimating the price (in)elasticity of off-grid electricity demand. Dev. Eng. 2018, 3,12–22. [CrossRef]
81. Jiang, J.; Kou, Y.; Bie, Z.; Li, G. Optimal Real-Time Pricing of Electricity Based on Demand Response. Energy Procedia 2019, 159,304–308. [CrossRef]
82. Boogen, N.; Datta, S.; Filippini, M. Dynamic models of residential electricity demand: Evidence from Switzerland. Energy StrategyRev. 2017, 18, 85–92. [CrossRef]
83. Sharifi, R.; Anvari-Moghaddam, A.; Hamid Fathi, S.; Guerrero, J.; Vahidinasab, V. Economic Demand Response Model inLiberalized Electricity Markets with Respect to Flexibility of Consumers. IET Gener. Transm. Distrib. 2017, 11, 4291–4298.[CrossRef]
84. Chai, Y.; Xiang, Y.; Liu, J.; Gu, C.; Zhang, W.; Xu, W. Incentive-based demand response model for maximizing benefits of electricityretailers. J. Mod. Power Syst. Clean Energy 2019, 7, 1644–1650. [CrossRef]
85. Kaya, A.; Csala, D.; Sgouridis, S. Constant elasticity of substitution functions for energy modeling in general equilibriumintegrated assessment models: A critical review and recommendations. Clim. Change 2017, 145, 27–40. [CrossRef]
86. Arnette, A.; Zobel, C.W. An optimization model for regional renewable energy development. Renew. Sustain. Energy Rev. 2012, 16,4606–4615. [CrossRef]
87. Henao, F.; Cherni, J.A.; Jaramillo, P.; Dyner, I. A multicriteria approach to sustainable energy supply for the rural poor. Eur. J.Oper. Res. 2012, 218, 801–809. [CrossRef]
88. Amorim, F.; Pina, A.; Gerbelová, H.; Pereira da Silva, P.; Vasconcelos, J.; Martins, V. Electricity decarbonisation pathways for2050 in Portugal: A TIMES (The Integrated MARKAL-EFOM System) based approach in closed versus open systems modelling.Energy 2014, 69, 104–112. [CrossRef]
89. Hussain, I.; Mohsin, S.; Basit, A.; Khan, Z.A.; Qasim, U.; Javaid, N. A Review on Demand Response: Pricing, Optimization, andAppliance Scheduling. Procedia Comput. Sci. 2015, 52, 843–850. [CrossRef]
90. Soroudi, A. Power System Optimization Modeling in GAMS; Springer: Berlin/Heidelberg, Germany, 2017; Volume 78.91. Neves, D.; Pina, A.; Silva, C.A. Demand response modeling: A comparison between tools. Appl. Energy 2015, 146, 288–297.
[CrossRef]92. Ringkjøb, H.-K.; Haugan, P.M.; Solbrekke, I.M. A review of modelling tools for energy and electricity systems with large shares of
variable renewables. Renew. Sustain. Energy Rev. 2018, 96, 440–459. [CrossRef]93. Dagoumas, A.S.; Koltsaklis, N.E. Review of models for integrating renewable energy in the generation expansion planning. Appl.
Energy 2019, 242, 1573–1587. [CrossRef]94. Yu, M.; Hong, S.H. Incentive-based demand response considering hierarchical electricity market: A Stackelberg game approach.
Appl. Energy 2017, 203, 267–279. [CrossRef]95. Bouckaert, S.; Mazauric, V.; Maïzi, N. Expanding Renewable Energy by Implementing Demand Response. Energy Procedia 2014,
61, 1844–1847. [CrossRef]96. Gottwalt, S.; Gärttner, J.; Schmeck, H.; Weinhardt, C. Modeling and Valuation of Residential Demand Flexibility for Renewable
Energy Integration. IEEE Trans. Smart Grid 2017, 8, 2565–2574. [CrossRef]97. Hajibandeh, N.; Ehsan, M.; Soleymani, S.; Shafie-khah, M.; Catalão, J.P.S. Modeling price- and incentive-based demand response
strategies in the renewable-based energy markets. In Proceedings of the 2017 IEEE International Conference on Environment andElectrical Engineering, Milan, Italy, 6–9 June 2017; pp. 1–5.
98. Liu, T.; Zhang, D.; Wang, S.; Wu, T. Standardized modelling and economic optimization of multi-carrier energy systemsconsidering energy storage and demand response. Energy Convers. Manag. 2019, 182, 126–142. [CrossRef]
99. Karimi, E.; Kazerani, M. Impact of demand response management on improving social welfare of remote communities throughintegrating renewable energy resources. In Proceedings of the 2017 IEEE 30th Canadian Conference on Electrical and ComputerEngineering (CCECE), Windsor, ON, Canada, 30 April–3 May 2017; pp. 1–6.
100. Kumar, J.; Suryakiran, B.V.; Verma, A.; Bhatti, T.S. Analysis of techno-economic viability with demand response strategy ofa grid-connected microgrid model for enhanced rural electrification in Uttar Pradesh state, India. Energy 2019, 178, 176–185.[CrossRef]
101. Xu, Q.; Ding, Y.; Zheng, A. An Optimal Dispatch Model of Wind-Integrated Power System Considering Demand Response andReliability. Sustainability 2017, 9, 758. [CrossRef]
102. Conteh, A.; Lotfy, M.E.; Kipngetich, K.M.; Senjyu, T.; Mandal, P.; Chakraborty, S. An Economic Analysis of Demand SideManagement Considering Interruptible Load and Renewable Energy Integration: A Case Study of Freetown Sierra Leone.Sustainability 2019, 11, 2828. [CrossRef]
103. Babonneau, F.; Caramanis, M.; Haurie, A. A linear programming model for power distribution with demand response andvariable renewable energy. Appl. Energy 2016, 181, 83–95. [CrossRef]
104. Purvis, B.; Mao, Y.; Robinson, D. Three pillars of sustainability: In search of conceptual origins. Sustain. Sci. 2019, 14, 681–695.[CrossRef]
105. Emas, R. The Concept of Sustainable Development: Definition and Defining Principles. In Global Sustainable Development Report,2015 Edition; United Nations: New York, NY, USA, 2015.
Energies 2022, 15, 1307 27 of 28
106. Tomislav, K. The Concept of Sustainable Development: From its Beginning to the Contemporary Issues. Zagreb Int. Rev. Econ. Bus.2018, 21, 67–94. [CrossRef]
107. Ahmadi, S.; Fakehi, A.h.; vakili, A.; Haddadi, M.; Iranmanesh, S.H. A hybrid stochastic model based Bayesian approach for longterm energy demand managements. Energy Strategy Rev. 2020, 28, 100462. [CrossRef]
108. Riva, F.; Tognollo, A.; Gardumi, F.; Colombo, E. Long-term energy planning and demand forecast in remote areas of developingcountries: Classification of case studies and insights from a modelling perspective. Energy Strategy Rev. 2018, 20, 71–89. [CrossRef]
109. Zhou, K.; Wei, S. Time-of-use price model for user-side micro-grid based on power supply chain management. Energy Procedia2018, 152, 51–56. [CrossRef]
110. Yıldıran, U.; Kayahan, I. Risk-averse stochastic model predictive control-based real-time operation method for a wind energygeneration system supported by a pumped hydro storage unit. Appl. Energy 2018, 226, 631–643. [CrossRef]
111. Péan, T.; Salom, J.; Ortiz, J. Environmental and Economic Impact of Demand Response Strategies for Energy Flexible Buildings.In Proceedings of the 4th Building Simulation and Optimization Conference, Cambridge, UK, 11–12 September 2018.
112. Wang, Y.; Huang, Y.; Wang, Y.; Li, F.; Zhang, Y.; Tian, C. Operation Optimization in a Smart Micro-Grid in the Presence ofDistributed Generation and Demand Response. Sustainability 2018, 10, 847. [CrossRef]
113. Ji, X.; Li, Y.; Yu, Y.; Fan, S. Optimal dispatching and game analysis of power grid considering demand response and pumpedstorage. Syst. Sci. Control. Eng. 2018, 6, 270–277. [CrossRef]
114. Sharma, S.; Durvasulu, V.; Celik, B.; Suryanarayanan, S.; Hansen, T.M.; Maciejewski, A.A.; Siegel, H.J. Metrics-Based Assessmentof Sustainability in Demand Response. In Proceedings of the 2017 IEEE 19th International Conference on High PerformanceComputing and Communications, Bangkok, Thailand, 18–20 December 2017.
115. Hoffman, I.M.; Rybka, G.; Leventis, G.; Goldman, C.A.; Schwartz, L.; Billingsley, M.; Schiller, S. The Total Cost of Saving Electricitythrough Utility Customer-Funded Energy Efficiency Programs: Estimates at the National, State, Sector and Program Level; Technical Brief;Berkeley Lab: Berkeley, CA, USA, 2015; p. 22.
116. Caputo, S. Non-Energy Impacts Approaches and Values: An Examination of the Northeast, Mid-Atlantic, and Beyond; Northeast EnergyEfficiency Partnerships: Lexington, MA, USA, 2017.
117. Duncan, J.; Burtraw, D. Does Integrated Resource Planning Effectively Integrate Demand-Side Resources? Resources for the Future(RFF): Washington, DC, USA, 2018; p. 28.
118. Mays, J. Missing incentives for flexibility in wholesale electricity markets. Energy Policy 2021, 149, 112010. [CrossRef]119. Mills, A.D.; Levin, T.; Wiser, R.; Seel, J.; Botterud, A.J.R.; Reviews, S.E. Impacts of variable renewable energy on wholesale markets
and generating assets in the United States: A review of expectations and evidence. Renew. Sustain. Energy Rev. 2020, 120, 109670.[CrossRef]
120. Layson, S.K. The Increasing Returns to Scale CES Production Function and the Law of Diminishing Marginal Returns. South.Econ. J. 2014, 82, 408–415. [CrossRef]
121. Cao, J.; Ho, M.S.; Ma, R. Analyzing carbon pricing policies using a general equilibrium model with production parametersestimated using firm data. Energy Econ. 2020, 92, 104958. [CrossRef]
122. Wang, A.; Hu, S.; Lin, B. Can environmental regulation solve pollution problems? Theoretical model and empirical researchbased on the skill premium. Energy Econ. 2021, 94, 105068. [CrossRef]
123. Pothen, F.; Hübler, M. A forward calibration method for analyzing energy policy in new quantitative trade models. Energy Econ.2021, 100, 105352. [CrossRef]
124. Lin, B.; Wu, W. The impact of electric vehicle penetration: A recursive dynamic CGE analysis of China. Energy Econ. 2021,94, 105086. [CrossRef]
125. Ahn, K.; Chu, Z.; Lee, D. Effects of renewable energy use in the energy mix on social welfare. Energy Econ. 2021, 96, 105174.[CrossRef]
126. Lagomarsino, E. Estimating elasticities of substitution with nested CES production functions: Where do we stand? Energy Econ.2020, 88, 104752. [CrossRef]
127. Morales, J.M.; Conejo, A.J.; Madsen, H.; Pinson, P.; Zugno, M. Integrating Renewables in Electricity Markets: Operational Problems;Springer Science & Business Media: Berlin/Heidelberg, Germany, 2013; Volume 205.
128. Daraeepour, A.; Kazempour, S.J.; Patiño-Echeverri, D.; Conejo, A.J. Strategic demand-side response to wind power integration.IEEE Trans. Power Syst. 2015, 31, 3495–3505. [CrossRef]
129. McPherson, M.; Stoll, B. Demand response for variable renewable energy integration: A proposed approach and its impacts.Energy 2020, 197, 117205. [CrossRef]
130. Helali, K.; Kalai, M. Estimate of the Elasticities of Substitution of the CES and Translog Production Functions in Tunisia. Int. J.Econ. Bus. Res. 2015, 9, 245–253. [CrossRef]
131. Eggleston, S.; Buendia, L.; Miwa, K.; Ngara, T.; Tanabe, K. 2006 IPCC Guidelines for National Greenhouse Gas Inventories; U.S.Department of Energy, Office of Scientific and Technical Information: Washinton, DC, USA, 2006.
132. Carrara, S.; Marangoni, G. Including system integration of variable renewable energies in a constant elasticity of substitutionframework: The case of the WITCH model. Energy Econ. 2017, 64, 612–626. [CrossRef]
133. Fan, J.; Li, J.; Wu, Y.; Wang, S.; Zhao, D. The effects of allowance price on energy demand under a personal carbon trading scheme.Appl. Energy 2016, 170, 242–249. [CrossRef]

Energies 2022, 15, 1307 28 of 28
134. Zha, D.; Kavuri, A.S.; Si, S. Energy biased technology change: Focused on Chinese energy-intensive industries. Appl. Energy 2017,190, 1081–1089. [CrossRef]
135. Sharifi, R.; Anvari-Moghaddam, A.; Fathi, S.H.; Vahidinasab, V. A Flexible Responsive Load Economic Model for IndustrialDemands. Processes 2019, 7, 147. [CrossRef]
136. Brockway, P.E.; Heun, M.K.; Santos, J.; Barrett, J.R. Energy-extended CES aggregate production: Current aspects of theirspecification and econometric estimation. Energies 2017, 10, 202. [CrossRef]
137. Kirkerud, J.; Nagel, N.O.; Bolkesjø, T.F. The role of demand response in the future renewable northern European energy system.Energy 2021, 235, 121336. [CrossRef]