Highly Active (Co)MoS 2/Al 2O 3 Hydrodesulfurization Catalysts Prepared in Aqueous Solution
31
-
Upload
independent -
Category
Documents
-
view
0 -
download
0
Transcript of Highly Active (Co)MoS 2/Al 2O 3 Hydrodesulfurization Catalysts Prepared in Aqueous Solution

EUROPEAN ORGANIZATION FOR NUCLEAR RESEARCH
CERN{PPE/96-15
30 January 1996
Measurement of the partial decay
width R0b = �
b�b=�had of the Z with the
DELPHI detector at LEP
DELPHI Collaboration
Abstract
The partial decay width of the Z to bb quark pairs has been measured bythe DELPHI detector at LEP. B-hadrons, containing b-quarks, were taggedby several methods using tracks with large impact parameters to the primaryvertex complemented sometimes by event shape variables or using leptons withhigh transverse momentum relative to the hadron.In order to reduce the systematic uncertainties, in all methods the b-tagginge�ciency has been extracted directly from the data. Combining all methods,the value:
�b�b
�had
= 0:2216 � 0:0016(stat:)� 0:0021(syst:)
was found, where the cc production fraction was �xed to its Standard Modelvalue.
(To be submitted to Zeit. f. Physik C.)
ii
P.Abreu21, W.Adam50, T.Adye37, E.Agasi31 , I.Ajinenko42, R.Aleksan39 , G.D.Alekseev16 , R.Alemany49 ,P.P.Allport22, S.Almehed24, U.Amaldi9, S.Amato47, A.Andreazza28, M.L.Andrieux14 , P.Antilogus9 ,W-D.Apel17 , Y.Arnoud39, B.�Asman44, J-E.Augustin19 , A.Augustinus9 , P.Baillon9 , P.Bambade19, F.Barao21,R.Barate14, M.Barbi47 , D.Y.Bardin16, A.Baroncelli40 , O.Barring24 , J.A.Barrio26, W.Bartl50, M.J.Bates37,M.Battaglia15 , M.Baubillier23 , J.Baudot39, K-H.Becks52, M.Begalli6 , P.Beilliere8 , Yu.Belokopytov9;53 ,A.C.Benvenuti5, M.Berggren47 , D.Bertrand2, F.Bianchi45 , M.Bigi45 , M.S.Bilenky16 , P.Billoir23 , D.Bloch10 ,M.Blume52 , S.Blyth35 , T.Bolognese39 , M.Bonesini28 , W.Bonivento28 , P.S.L.Booth22, G.Borisov42 , C.Bosio40 ,S.Bosworth35, O.Botner48, E.Boudinov31 , B.Bouquet19 , C.Bourdarios9 , T.J.V.Bowcock22, M.Bozzo13,P.Branchini40 , K.D.Brand36, T.Brenke52, R.A.Brenner15, C.Bricman2, L.Brillault23 , R.C.A.Brown9,P.Bruckman18, J-M.Brunet8, L.Bugge33 , T.Buran33, T.Burgsmueller52 , P.Buschmann52 , A.Buys9, S.Cabrera49,M.Caccia28, M.Calvi28, A.J.Camacho Rozas41, T.Camporesi9, V.Canale38, M.Canepa13 , K.Cankocak44, F.Cao2,F.Carena9, L.Carroll22, C.Caso13, M.V.Castillo Gimenez49 , A.Cattai9, F.R.Cavallo5 , L.Cerrito38, V.Chabaud9 ,Ph.Charpentier9 , L.Chaussard25 , J.Chauveau23, P.Checchia36, G.A.Chelkov16, M.Chen2, R.Chierici45 ,P.Chliapnikov42 , P.Chochula7, V.Chorowicz9, J.Chudoba30 , V.Cindro43, P.Collins9 , J.L.Contreras19,R.Contri13, E.Cortina49, G.Cosme19, F.Cossutti46 , H.B.Crawley1, D.Crennell37 , G.Crosetti13,J.Cuevas Maestro34, S.Czellar15 , E.Dahl-Jensen29 , J.Dahm52, B.Dalmagne19 , M.Dam29, G.Damgaard29 ,P.D.Dauncey37 , M.Davenport9 , W.Da Silva23 , C.Defoix8, A.Deghorain2 , G.Della Ricca46 , P.Delpierre27 ,N.Demaria35, A.De Angelis9 , W.De Boer17, S.De Brabandere2 , C.De Clercq2, C.De La Vaissiere23 ,B.De Lotto46, A.De Min36, L.De Paula47 , C.De Saint-Jean39 , H.Dijkstra9, L.Di Ciaccio38 , F.Djama10,J.Dolbeau8 , M.Donszelmann9 , K.Doroba51, M.Dracos10, J.Drees52, K.-A.Drees52, M.Dris32 , Y.Dufour9,D.Edsall1 , R.Ehret17, G.Eigen4, T.Ekelof48, G.Ekspong44 , M.Elsing52 , J-P.Engel10, N.Ershaidat23 , B.Erzen43,M.Espirito Santo21, E.Falk24, D.Fassouliotis32 , M.Feindt9 , A.Fenyuk42, A.Ferrer49, T.A.Filippas32 ,A.Firestone1, P.-A.Fischer10, H.Foeth9, E.Fokitis32 , F.Fontanelli13 , F.Formenti9, B.Franek37, P.Frenkiel8 ,D.C.Fries17, A.G.Frodesen4, R.Fruhwirth50 , F.Fulda-Quenzer19 , J.Fuster49, A.Galloni22 , D.Gamba45 ,M.Gandelman6 , C.Garcia49, J.Garcia41, C.Gaspar9, U.Gasparini36 , Ph.Gavillet9 , E.N.Gazis32, D.Gele10 ,J-P.Gerber10, M.Gibbs22 , R.Gokieli51 , B.Golob43 , G.Gopal37 , L.Gorn1, M.Gorski51 , Yu.Gouz45;53 , V.Gracco13,E.Graziani40 , G.Grosdidier19 , K.Grzelak51, S.Gumenyuk28;53 , P.Gunnarsson44 , M.Gunther48, J.Guy37,F.Hahn9, S.Hahn52, Z.Hajduk18 , A.Hallgren48 , K.Hamacher52, W.Hao31, F.J.Harris35, V.Hedberg24,R.Henriques21 , J.J.Hernandez49, P.Herquet2, H.Herr9, T.L.Hessing35, E.Higon49 , H.J.Hilke9, T.S.Hill1 ,S-O.Holmgren44, P.J.Holt35, D.Holthuizen31 , S.Hoorelbeke2 , M.Houlden22 , J.Hrubec50, K.Huet2, K.Hultqvist44 ,J.N.Jackson22, R.Jacobsson44 , P.Jalocha18 , R.Janik7 , Ch.Jarlskog24, G.Jarlskog24, P.Jarry39, B.Jean-Marie19 ,E.K.Johansson44, L.Jonsson24, P.Jonsson24 , C.Joram9, P.Juillot10 , M.Kaiser17, F.Kapusta23, K.Karafasoulis11 ,M.Karlsson44 , E.Karvelas11 , A.Katargin42, S.Katsanevas3 , E.C.Katsou�s32, R.Keranen4, Yu.Khokhlov42 ,B.A.Khomenko16, N.N.Khovanski16, B.King22, N.J.Kjaer29, H.Klein9 , A.Klovning4 , P.Kluit31 , B.Koene31,P.Kokkinias11 , M.Koratzinos9 , K.Korcyl18, C.Kourkoumelis3 , O.Kouznetsov13;16 , P.-H.Kramer52,M.Krammer50, C.Kreuter17, I.Kronkvist24 , Z.Krumstein16 , W.Krupinski18 , P.Kubinec7 , W.Kucewicz18 ,K.Kurvinen15 , C.Lacasta49, I.Laktineh25 , S.Lamblot23 , J.W.Lamsa1, L.Lanceri46 , D.W.Lane1, P.Langefeld52 ,I.Last22, J-P.Laugier39, R.Lauhakangas15 , F.Ledroit14 , V.Lefebure2, C.K.Legan1, R.Leitner30 , Y.Lemoigne39 ,J.Lemonne2, G.Lenzen52 , V.Lepeltier19 , T.Lesiak36, D.Liko50 , R.Lindner52 , A.Lipniacka36 , I.Lippi36 ,B.Loerstad24, J.G.Loken35, J.M.Lopez41, D.Loukas11 , P.Lutz39, L.Lyons35, J.MacNaughton50, G.Maehlum17 ,A.Maio21, V.Malychev16 , F.Mandl50 , J.Marco41, R.Marco41, B.Marechal47 , M.Margoni36 , J-C.Marin9,C.Mariotti40 , A.Markou11, T.Maron52, C.Martinez-Rivero41 , F.Martinez-Vidal49 , S.Marti i Garcia49 , J.Masik30 ,F.Matorras41, C.Matteuzzi9, G.Matthiae38, M.Mazzucato36 , M.Mc Cubbin9 , R.Mc Kay1, R.Mc Nulty22 ,J.Medbo48, M.Merk31, C.Meroni28 , S.Meyer17, W.T.Meyer1, A.Miagkov42 , M.Michelotto36 , E.Migliore45 ,L.Mirabito25 , W.A.Mitaro�50 , U.Mjoernmark24, T.Moa44, R.Moeller29 , K.Moenig9, M.R.Monge13 ,P.Morettini13 , H.Mueller17 , L.M.Mundim6 , W.J.Murray37, B.Muryn18 , G.Myatt35, F.Naraghi14 , F.L.Navarria5,S.Navas49, K.Nawrocki51, P.Negri28, W.Neumann52 , N.Neumeister50, R.Nicolaidou3 , B.S.Nielsen29 ,M.Nieuwenhuizen31 , V.Nikolaenko10 , P.Niss44, A.Nomerotski36 , A.Normand35, W.Oberschulte-Beckmann17 ,V.Obraztsov42, A.G.Olshevski16 , A.Onofre21, R.Orava15, K.Osterberg15, A.Ouraou39, P.Paganini19 ,M.Paganoni9 , P.Pages10, H.Palka18, Th.D.Papadopoulou32 , K.Papageorgiou11 , L.Pape9, C.Parkes35,F.Parodi13 , A.Passeri40 , M.Pegoraro36, H.Pernegger50, M.Pernicka50 , A.Perrotta5, C.Petridou46 , A.Petrolini13 ,M.Petrovyck28;53 , H.T.Phillips37 , G.Piana13 , F.Pierre39, M.Pimenta21, M.Pindo28 , S.Plaszczynski19 ,O.Podobrin17 , M.E.Pol6, G.Polok18, P.Poropat46, V.Pozdniakov16 , M.Prest46, P.Privitera38 , N.Pukhaeva16 ,A.Pullia28 , D.Radojicic35 , S.Ragazzi28 , H.Rahmani32 , J.Rames12, P.N.Rato�20, A.L.Read33, M.Reale52 ,P.Rebecchi19 , N.G.Redaelli28 , M.Regler50 , D.Reid9 , P.B.Renton35, L.K.Resvanis3 , F.Richard19 , J.Richardson22 ,J.Ridky12 , G.Rinaudo45 , I.Ripp39, A.Romero45, I.Roncagliolo13 , P.Ronchese36 , L.Roos14, E.I.Rosenberg1 ,E.Rosso9, P.Roudeau19, T.Rovelli5 , W.Ruckstuhl31 , V.Ruhlmann-Kleider39 , A.Ruiz41 , K.Rybicki18 ,H.Saarikko15 , Y.Sacquin39 , A.Sadovsky16 , G.Sajot14, J.Salt49, J.Sanchez26, M.Sannino13 , M.Schimmelpfennig17 ,H.Schneider17 , U.Schwickerath17 , M.A.E.Schyns52, G.Sciolla45 , F.Scuri46 , P.Seager20, Y.Sedykh16 , A.M.Segar35,A.Seitz17, R.Sekulin37 , R.C.Shellard6 , I.Siccama31 , P.Siegrist39 , S.Simonetti39 , F.Simonetto36 , A.N.Sisakian16 ,B.Sitar7, T.B.Skaali33 , G.Smadja25 , N.Smirnov42, O.Smirnova16 , G.R.Smith37 , O.Solovianov42 , R.Sosnowski51 ,D.Souza-Santos6 , T.Spassov21, E.Spiriti40 , P.Sponholz52 , S.Squarcia13 , C.Stanescu40, S.Stapnes33 , I.Stavitski36 ,F.Stichelbaut9 , A.Stocchi19, J.Strauss50, R.Strub10, B.Stugu4, M.Szczekowski51 , M.Szeptycka51, T.Tabarelli28 ,
iii
J.P.Tavernet23, O.Tchikilev42 , A.Tilquin27 , J.Timmermans31 , L.G.Tkatchev16, T.Todorov10, D.Z.Toet31,A.Tomaradze2, B.Tome21, A.Tonazzo28, L.Tortora40, G.Transtromer24, D.Treille9 , W.Trischuk9, G.Tristram8,A.Trombini19 , C.Troncon28, A.Tsirou9, M-L.Turluer39 , I.A.Tyapkin16 , M.Tyndel37 , S.Tzamarias22 ,B.Ueberschaer52 , O.Ullaland9 , V.Uvarov42, G.Valenti5, E.Vallazza9 , C.Vander Velde2, G.W.Van Apeldoorn31 ,P.Van Dam31, W.K.Van Doninck2 , J.Van Eldik31 , N.Vassilopoulos35 , G.Vegni28, L.Ventura36, W.Venus37,F.Verbeure2, M.Verlato36, L.S.Vertogradov16, D.Vilanova39 , P.Vincent25, L.Vitale46 , E.Vlasov42 ,A.S.Vodopyanov16 , V.Vrba12, H.Wahlen52, C.Walck44, F.Waldner46 , M.Weierstall52 , P.Weilhammer9 ,C.Weiser17, A.M.Wetherell9 , D.Wicke52 , J.H.Wickens2, M.Wielers17 , G.R.Wilkinson35 , W.S.C.Williams35 ,M.Winter10 , M.Witek18, K.Woschnagg48 , K.Yip35, O.Yushchenko42, F.Zach25 , A.Zaitsev42 , A.Zalewska18 ,P.Zalewski51 , D.Zavrtanik43 , E.Zevgolatakos11 , N.I.Zimin16 , M.Zito39 , D.Zontar43 , R.Zuberi35 , G.C.Zucchelli44 ,G.Zumerle36
1Ames Laboratory and Department of Physics, Iowa State University, Ames IA 50011, USA2Physics Department, Univ. Instelling Antwerpen, Universiteitsplein 1, B-2610 Wilrijk, Belgiumand IIHE, ULB-VUB, Pleinlaan 2, B-1050 Brussels, Belgiumand Facult�e des Sciences, Univ. de l'Etat Mons, Av. Maistriau 19, B-7000 Mons, Belgium3Physics Laboratory, University of Athens, Solonos Str. 104, GR-10680 Athens, Greece4Department of Physics, University of Bergen, All�egaten 55, N-5007 Bergen, Norway5Dipartimento di Fisica, Universit�a di Bologna and INFN, Via Irnerio 46, I-40126 Bologna, Italy6Centro Brasileiro de Pesquisas F�isicas, rua Xavier Sigaud 150, RJ-22290 Rio de Janeiro, Braziland Depto. de F�isica, Pont. Univ. Cat�olica, C.P. 38071 RJ-22453 Rio de Janeiro, Braziland Inst. de F�isica, Univ. Estadual do Rio de Janeiro, rua S~ao Francisco Xavier 524, Rio de Janeiro, Brazil7Comenius University, Faculty of Mathematics and Physics, Mlynska Dolina, SK-84215 Bratislava, Slovakia8Coll�ege de France, Lab. de Physique Corpusculaire, IN2P3-CNRS, F-75231 Paris Cedex 05, France9CERN, CH-1211 Geneva 23, Switzerland
10Centre de Recherche Nucl�eaire, IN2P3 - CNRS/ULP - BP20, F-67037 Strasbourg Cedex, France11Institute of Nuclear Physics, N.C.S.R. Demokritos, P.O. Box 60228, GR-15310 Athens, Greece12FZU, Inst. of Physics of the C.A.S. High Energy Physics Division, Na Slovance 2, 180 40, Praha 8, Czech Republic13Dipartimento di Fisica, Universit�a di Genova and INFN, Via Dodecaneso 33, I-16146 Genova, Italy14Institut des Sciences Nucl�eaires, IN2P3-CNRS, Universit�e de Grenoble 1, F-38026 Grenoble Cedex, France15Research Institute for High Energy Physics, SEFT, P.O. Box 9, FIN-00014 Helsinki, Finland16Joint Institute for Nuclear Research, Dubna, Head Post O�ce, P.O. Box 79, 101 000 Moscow, Russian Federation17Institut f�ur Experimentelle Kernphysik, Universit�at Karlsruhe, Postfach 6980, D-76128 Karlsruhe, Germany18Institute of Nuclear Physics and University of Mining and Metalurgy, Ul. Kawiory 26a, PL-30055 Krakow, Poland19Universit�e de Paris-Sud, Lab. de l'Acc�el�erateur Lin�eaire, IN2P3-CNRS, Bat. 200, F-91405 Orsay Cedex, France20School of Physics and Materials, University of Lancaster, Lancaster LA1 4YB, UK21LIP, IST, FCUL - Av. Elias Garcia, 14-1o, P-1000 Lisboa Codex, Portugal22Department of Physics, University of Liverpool, P.O. Box 147, Liverpool L69 3BX, UK23LPNHE, IN2P3-CNRS, Universit�es Paris VI et VII, Tour 33 (RdC), 4 place Jussieu, F-75252 Paris Cedex 05, France24Department of Physics, University of Lund, S�olvegatan 14, S-22363 Lund, Sweden25Universit�e Claude Bernard de Lyon, IPNL, IN2P3-CNRS, F-69622 Villeurbanne Cedex, France26Universidad Complutense, Avda. Complutense s/n, E-28040 Madrid, Spain27Univ. d'Aix - Marseille II - CPP, IN2P3-CNRS, F-13288 Marseille Cedex 09, France28Dipartimento di Fisica, Universit�a di Milano and INFN, Via Celoria 16, I-20133 Milan, Italy29Niels Bohr Institute, Blegdamsvej 17, DK-2100 Copenhagen 0, Denmark30NC, Nuclear Centre of MFF, Charles University, Areal MFF, V Holesovickach 2, 180 00, Praha 8, Czech Republic31NIKHEF-H, Postbus 41882, NL-1009 DB Amsterdam, The Netherlands32National Technical University, Physics Department, Zografou Campus, GR-15773 Athens, Greece33Physics Department, University of Oslo, Blindern, N-1000 Oslo 3, Norway34Dpto. Fisica, Univ. Oviedo, C/P. P�erez Casas, S/N-33006 Oviedo, Spain35Department of Physics, University of Oxford, Keble Road, Oxford OX1 3RH, UK36Dipartimento di Fisica, Universit�a di Padova and INFN, Via Marzolo 8, I-35131 Padua, Italy37Rutherford Appleton Laboratory, Chilton, Didcot OX11 OQX, UK38Dipartimento di Fisica, Universit�a di Roma II and INFN, Tor Vergata, I-00173 Rome, Italy39Centre d'Etudes de Saclay, DSM/DAPNIA, F-91191 Gif-sur-Yvette Cedex, France40Istituto Superiore di Sanit�a, Ist. Naz. di Fisica Nucl. (INFN), Viale Regina Elena 299, I-00161 Rome, Italy41Instituto de Fisica de Cantabria (CSIC-UC), Avda. los Castros, S/N-39006 Santander, Spain, (CICYT-AEN93-0832)42Inst. for High Energy Physics, Serpukov P.O. Box 35, Protvino, (Moscow Region), Russian Federation43J. Stefan Institute and Department of Physics, University of Ljubljana, Jamova 39, SI-61000 Ljubljana, Slovenia44Fysikum, Stockholm University, Box 6730, S-113 85 Stockholm, Sweden45Dipartimento di Fisica Sperimentale, Universit�a di Torino and INFN, Via P. Giuria 1, I-10125 Turin, Italy46Dipartimento di Fisica, Universit�a di Trieste and INFN, Via A. Valerio 2, I-34127 Trieste, Italy
and Istituto di Fisica, Universit�a di Udine, I-33100 Udine, Italy47Univ. Federal do Rio de Janeiro, C.P. 68528 Cidade Univ., Ilha do Fund~ao BR-21945-970 Rio de Janeiro, Brazil48Department of Radiation Sciences, University of Uppsala, P.O. Box 535, S-751 21 Uppsala, Sweden49IFIC, Valencia-CSIC, and D.F.A.M.N., U. de Valencia, Avda. Dr. Moliner 50, E-46100 Burjassot (Valencia), Spain50Institut f�ur Hochenergiephysik, �Osterr. Akad. d. Wissensch., Nikolsdorfergasse 18, A-1050 Vienna, Austria51Inst. Nuclear Studies and University of Warsaw, Ul. Hoza 69, PL-00681 Warsaw, Poland52Fachbereich Physik, University of Wuppertal, Postfach 100 127, D-42097 Wuppertal 1, Germany53On leave of absence from IHEP Serpukhov
1
1 Introduction
In the past all LEP experiments have published accurate measurements of the relativedecay width of the Z into B-hadrons, R0
b =�b�b
�had[1{5]. Experimentally R
0b can be
obtained with only very small corrections from the ratio of cross sectionsRb = �(e+e� !b�b)=�(e+e� ! hadrons). The average value of R0
b [6] disagrees by about two standarddeviations with the prediction of the Standard Model. To resolve the question of whetherthis deviation is real, new analyses including more data are needed. This paper presentsthree measurements of Rb using data taken up to 1993 with the DELPHI detector atLEP.
The �rst analysis exploits the long lifetime of B-hadrons: b-quark hemispheres aretagged by the presence of large impact parameter tracks. Comparing single and doubletag rates, Rb can be measured together with the b-tagging e�ciency. The second analysisuses the same tagging method as the �rst, however the tagging e�ciency is obtained fromhemispheres opposite to a high pt lepton. Rb can then be measured from the single tagrate. Since the statistical precision is determined by the events having both an impactparameter tag and a lepton tag, the statistical correlation between the two methods issmall. The systematic uncertainties are also largely di�erent. Since the tagging methodis rather simple, the tagging e�ciency for light and c quark events can be estimatedreliably from simulation. In contrast, the third analysis uses a sophisticated taggingmethod combining thirteen vertex and event shape variables in a multivariate approach,so that all e�ciencies can be estimated from data, using a complex least squares �t.
The two �rst methods have been published recently [3] using data from the 1991 and1992 running periods, and are updated here using 1993 data. The third one, using the1992 and 1993 data, updates the 1991 result [7]. The three analyses are combined, takinginto account correlations.
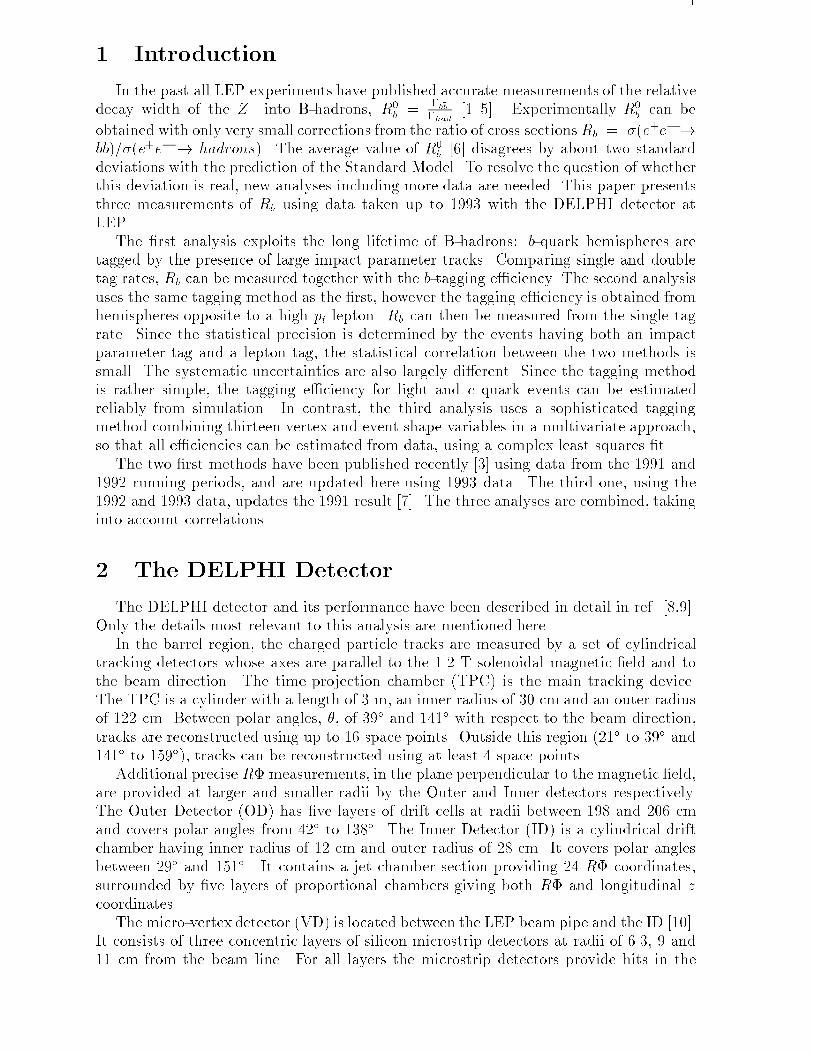
2 The DELPHI Detector
The DELPHI detector and its performance have been described in detail in ref. [8,9].Only the details most relevant to this analysis are mentioned here.
In the barrel region, the charged particle tracks are measured by a set of cylindricaltracking detectors whose axes are parallel to the 1.2 T solenoidal magnetic �eld and tothe beam direction. The time projection chamber (TPC) is the main tracking device.The TPC is a cylinder with a length of 3 m, an inner radius of 30 cm and an outer radiusof 122 cm. Between polar angles, �, of 39� and 141� with respect to the beam direction,tracks are reconstructed using up to 16 space points. Outside this region (21� to 39� and141� to 159�), tracks can be reconstructed using at least 4 space points.
Additional precise R� measurements, in the plane perpendicular to the magnetic �eld,are provided at larger and smaller radii by the Outer and Inner detectors respectively.The Outer Detector (OD) has �ve layers of drift cells at radii between 198 and 206 cmand covers polar angles from 42� to 138�. The Inner Detector (ID) is a cylindrical driftchamber having inner radius of 12 cm and outer radius of 28 cm. It covers polar anglesbetween 29� and 151� . It contains a jet chamber section providing 24 R� coordinates,surrounded by �ve layers of proportional chambers giving both R� and longitudinal zcoordinates.
The micro-vertex detector (VD) is located between the LEP beam pipe and the ID [10].It consists of three concentric layers of silicon microstrip detectors at radii of 6.3, 9 and11 cm from the beam line. For all layers the microstrip detectors provide hits in the
2
R�-plane with a measured intrinsic resolution of about 8 �m. The polar angle coveragefor charged particles hitting all three layers of the detector is 42.5� to 137.5�.
The barrel electromagnetic calorimeter (HPC) covers polar angles between 42� and138�. It is a gas-sampling device which provides complete three-dimensional charge in-formation in the same way as a time projection chamber. Each shower is sampled ninetimes in its longitudinal development. Along the drift direction, parallel to the DELPHImagnetic �eld, the shower is sampled every 3.5 mm; in the plane perpendicular to thedrift the charge is collected by cathode pads of variable size, ranging from 2.3 cm inthe inner part of the detector to 7 cm in the outer layers. The excellent granularity al-lows good separation between close particles in three dimensions and hence good electronidenti�cation even inside jets.
In the forward region the tracking is complemented by two sets of planar drift chambers(FCA and FCB), at distances of �165 cm and �275 cm from the interaction point. Alead glass calorimeter (EMF) is used to reconstruct electromagnetic energy in the forwardregion.
Muon identi�cation in the barrel region is based on a set of muon chambers (MUB),covering polar angles between 53� and 127�. It consists of six active cylinders of driftchambers, two inside the return yoke of the magnet after 90 cm of iron (inner layer) andfour outside after a further 20 cm of iron (outer and peripheral layers). The inner andouter modules have similar azimuthal coverage. The gaps in azimuth between adjacentmodules are covered by the peripheral modules. Therefore a muon traverses typicallyeither two inner layer chambers and two outer layer chambers, or just two peripherallayer chambers. Each chamber measures the R� coordinate to 2{3 mm. Measuring R�in both the inner layer and the outer or peripheral layer determines the azimuthal angleof muon candidates leaving the return yoke within about �1�. These errors are muchsmaller than the e�ects of multiple scattering on muons traversing the iron.
In the forward region the muon identi�cation is done using two sets of planar driftchambers (MUF) covering the angular region between 11� and 45�. The �rst set is placedbehind 85 cm of iron and the second one behind an additional 20 cm. Each set consistsof two orthogonal layers of drift chambers where the anode is read out directly and thecathode via a delay line to measure the coordinate along the wire. The resolution in bothcoordinates is about 4 mm.
3 Event Selection
The criteria to select charged tracks and to identify hadronic Z decays were identicalto those described in [3]. Charged particles were accepted if:
� their polar angle was between 20� and 160�,
� their track length was larger than 30 cm,
� their impact parameter relative to the interaction point was less than 2.5 cm in theplane perpendicular to the beam direction and less than 10 cm along the beam di-rection,
� their momentum was larger than 200 MeV=c with relative error less than 100%.

3
Neutral particles detected in the HPC were required to have measured energy largerthan 700 MeV , those detected in the EMF larger than 400 MeV .
Events have been selected by requiring:
� at least 7 reconstructed charged particles,
� the summed energy of the charged particles had to be larger than 15% of the centre ofmass energy, and at least 3% of it in each of the forward and backward hemisphereswith respect to the beam axis.
The e�ciency to �nd hadronic Z decays with these cuts was about 95% with onlyvery small bias towards a speci�c avour, and all backgrounds were below 0:1%.
About 700000 hadronic Z decays have been selected from each of the 1993 and 1992data samples, where the exact numbers vary slightly for the di�erent analyses due todi�erent requirements on the detector availability. The ratio of the cross section Z ! b�bto the total hadronic cross section varies very little at centre of mass energies close tothe Z mass. Thus no selection on the centre of mass energy has been made. Howeverthe validity of this assumption has been tested in sections 4.4 and 6.2. A sample abouttwice the data statistics of Z ! q�q events has been simulated using the Lund partonshower Monte Carlo JETSET 7.3 [11] (with parameters optimized by DELPHI) and theDELPHI detector simulation [9]. In addition dedicated samples of Z ! b�b events havebeen generated. The simulated events have been passed through the same analysis chainas the real ones.
4 The Impact Parameter Analysis
The method used for this measurement of Rb is nearly identical to the one describedin [3]. The basic feature of the method is the extraction of Rb from the comparison ofthe single and double tag rates:
RH = Rb � �b +Rc � �c + (1�Rb �Rc) � �uds; (1)
RE = Rb � f�2b + �b � (�b � �2b)g+Rc � �2c + (1�Rb �Rc) � �2uds; (2)
where RH is the fraction of tagged hemispheres and RE the fraction of events in whichboth hemispheres are tagged. �q is the e�ciency to tag a hemisphere originating from a
primary quark q (q = b; c; uds). The factor �b =�(d)
b��2
b
�b(1��b) accounts for hemisphere corre-
lations in the tagging e�ciencies for b quarks, where �(d)b is the double tag e�ciency for b
events. For the other quark species, these correlations can safely be neglected. If �b; �udsand �c are calculated from the simulation and Rc is imposed from other measurementsor from the Standard Model, Rb and �b can be measured simultaneously from the data.Thus a good knowledge of the details of B-hadron decays is not needed.
As the b-tagging variable, the probability PH that all tracks from a hemisphere orig-inate from a common primary vertex was used; this is identical to the tagging variabledescribed in [3]. Where to cut in PH is arbitrary; for the results presented here, the cutthat minimizes the total error has been chosen.
In the following, only the features di�erent from the 1992 analysis will be described indetail. Since for the measurement of impact parameters the VD is essential, the methodis limited to events with most tracks inside the VD acceptance. For this reason a cuton j cos �thrustj < 0:65 is applied. This cut is harder than the one applied in [3], because
4
in 1993, due to some inconsistency in the VD position between data and simulation, thedescription of the edge of the VD acceptance was slightly inaccurate.
Since for this analysis a good description of the data by the simulation for udsc quarksis required, some tuning of the impact parameter distribution in the simulation has to beperformed. This procedure has been re�ned with respect to the 1992 analysis, basicallyby taking into account small inhomogeneities in the azimuthal angle [12]. This leads tosubstantially smaller uncertainties due to the understanding of the detector resolution.
4.1 Estimates of E�ciencies and Correlations
The analysis was performed at many di�erent cut values. The total error was foundto be almost constant for cuts between log10PH < �2:7 and log10PH < �2:9. For hardercuts, the contribution of the statistical error to the total error is larger. Therefore thehardest of these cuts was chosen, to decrease the correlation between this analysis andthe others.
With this cut, the values of the non-b e�ciencies (�c, �uds) and the hemisphere corre-lation (�b) were extracted from the simulation, and the possible sources of uncertaintieswere included as systematic errors. In many cases, input parameters have to be chosenfrom measurements not made at LEP (branching ratios, lifetimes etc.). The LEP ex-periments have agreed on a common set of all these parameters, and on a procedure toevaluate the errors arising from them [6]. In all cases these recommendations have beenfollowed.
The values of the e�ciencies were found to be:
�uds = (0:260 � 0:013) � 10�2; (3)
�c = (1:67 � 0:15)� 10�2: (4)
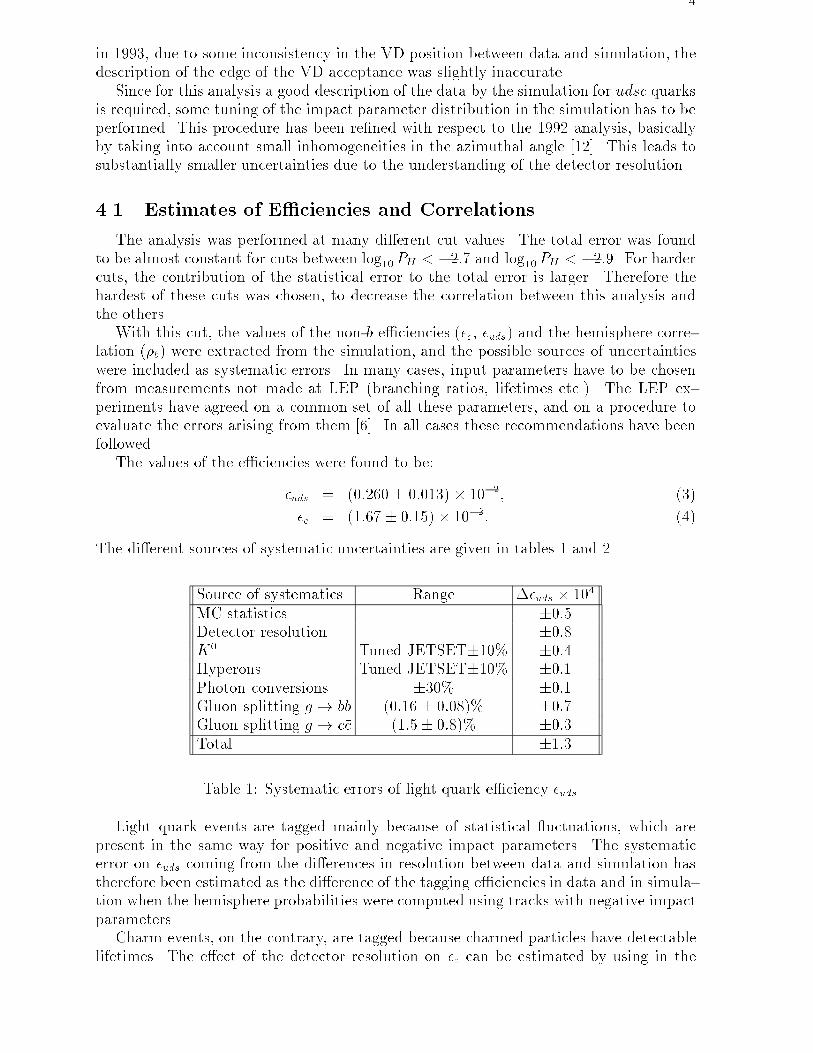
The di�erent sources of systematic uncertainties are given in tables 1 and 2.
Source of systematics Range ��uds � 104
MC statistics �0:5Detector resolution �0:8K
0 Tuned JETSET�10% �0:4Hyperons Tuned JETSET�10% �0:1Photon conversions �30% �0:1Gluon splitting g ! b�b (0:16 � 0:08)% �0:7Gluon splitting g ! c�c (1:5� 0:8)% �0:3Total �1:3
Table 1: Systematic errors of light quark e�ciency �uds.
Light quark events are tagged mainly because of statistical uctuations, which arepresent in the same way for positive and negative impact parameters. The systematicerror on �uds coming from the di�erences in resolution between data and simulation hastherefore been estimated as the di�erence of the tagging e�ciencies in data and in simula-tion when the hemisphere probabilities were computed using tracks with negative impactparameters.
Charm events, on the contrary, are tagged because charmed particles have detectablelifetimes. The e�ect of the detector resolution on �c can be estimated by using in the
5
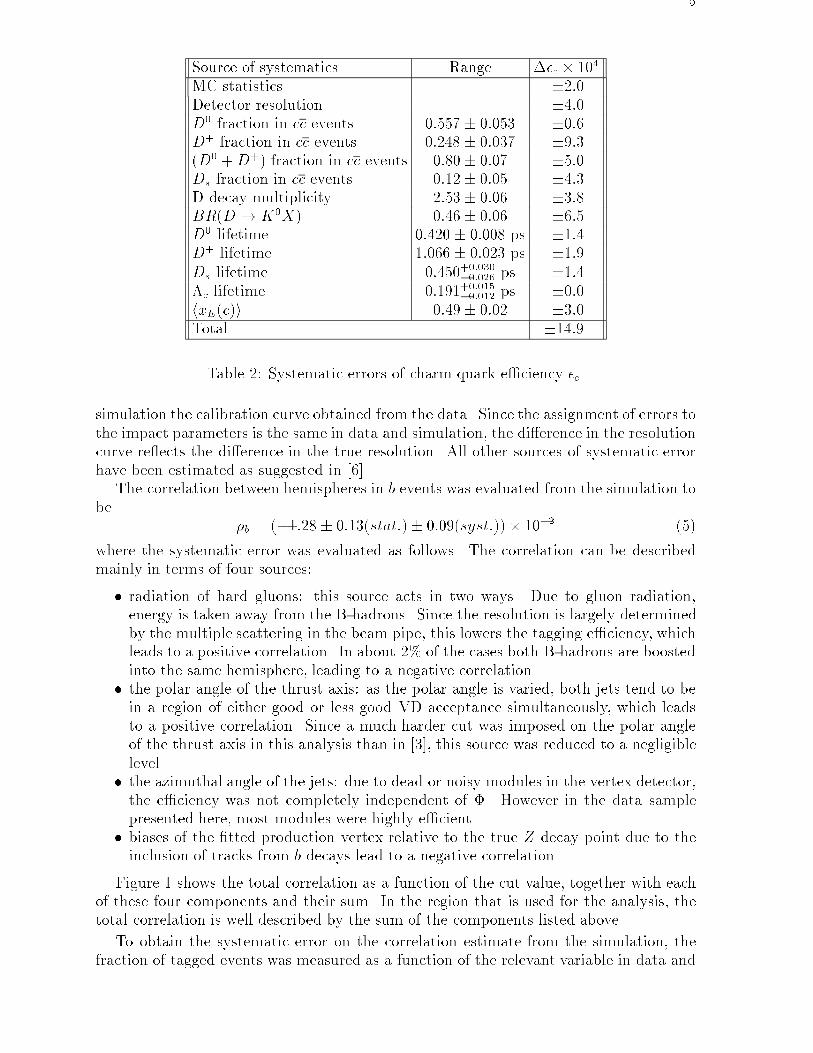
Source of systematics Range ��c � 104
MC statistics �2:0Detector resolution �4:0D
0 fraction in cc events 0:557 � 0:053 �0:6D
+ fraction in cc events 0:248 � 0:037 �9:3(D0 +D
+) fraction in cc events 0:80� 0:07 �5:0Ds fraction in cc events 0:12� 0:05 �4:3D decay multiplicity 2:53� 0:06 �3:8BR(D ! K
0X) 0:46� 0:06 �6:5
D0 lifetime 0:420 � 0:008 ps �1:4
D+ lifetime 1:066 � 0:023 ps �1:9
Ds lifetime 0:450+0:030�0:026 ps �1:4�c lifetime 0:191+0:015�0:012 ps �0:0hxE(c)i 0:49� 0:02 �3:0Total �14:9
Table 2: Systematic errors of charm quark e�ciency �c
simulation the calibration curve obtained from the data. Since the assignment of errors tothe impact parameters is the same in data and simulation, the di�erence in the resolutioncurve re ects the di�erence in the true resolution. All other sources of systematic errorhave been estimated as suggested in [6].
The correlation between hemispheres in b events was evaluated from the simulation tobe
�b = (�1:28 � 0:13(stat:)� 0:09(syst:))� 10�2 (5)
where the systematic error was evaluated as follows. The correlation can be describedmainly in terms of four sources:
� radiation of hard gluons: this source acts in two ways. Due to gluon radiation,energy is taken away from the B-hadrons. Since the resolution is largely determinedby the multiple scattering in the beam pipe, this lowers the tagging e�ciency, whichleads to a positive correlation. In about 2% of the cases both B-hadrons are boostedinto the same hemisphere, leading to a negative correlation.
� the polar angle of the thrust axis: as the polar angle is varied, both jets tend to bein a region of either good or less good VD acceptance simultaneously, which leadsto a positive correlation. Since a much harder cut was imposed on the polar angleof the thrust axis in this analysis than in [3], this source was reduced to a negligiblelevel.
� the azimuthal angle of the jets: due to dead or noisy modules in the vertex detector,the e�ciency was not completely independent of �. However in the data samplepresented here, most modules were highly e�cient.
� biases of the �tted production vertex relative to the true Z decay point due to theinclusion of tracks from b decays lead to a negative correlation.
Figure 1 shows the total correlation as a function of the cut value, together with eachof these four components and their sum. In the region that is used for the analysis, thetotal correlation is well described by the sum of the components listed above.
To obtain the systematic error on the correlation estimate from the simulation, thefraction of tagged events was measured as a function of the relevant variable in data and

6
-0.01
0
0.01
-5 -4 -3 -2 -1 0
calculated correlationcomponent sum
θφgluon radiationvertex bias
log10PH
ρ
Figure 1: Total hemisphere correlation and individual contributions as a function of thecut value log10 PH .
in simulation using all events. From this, the correlation due to that single variable wascalculated. The result was scaled by the ratio of the correlations in b�b events and in allevents obtained from the simulation. The larger of either a) the di�erence between thedata and simulation measurement, or b) the statistical error on this di�erence, was takenas the error estimate. However, for log10 PH < �2:9 the statistical error was always largerthan the di�erence.
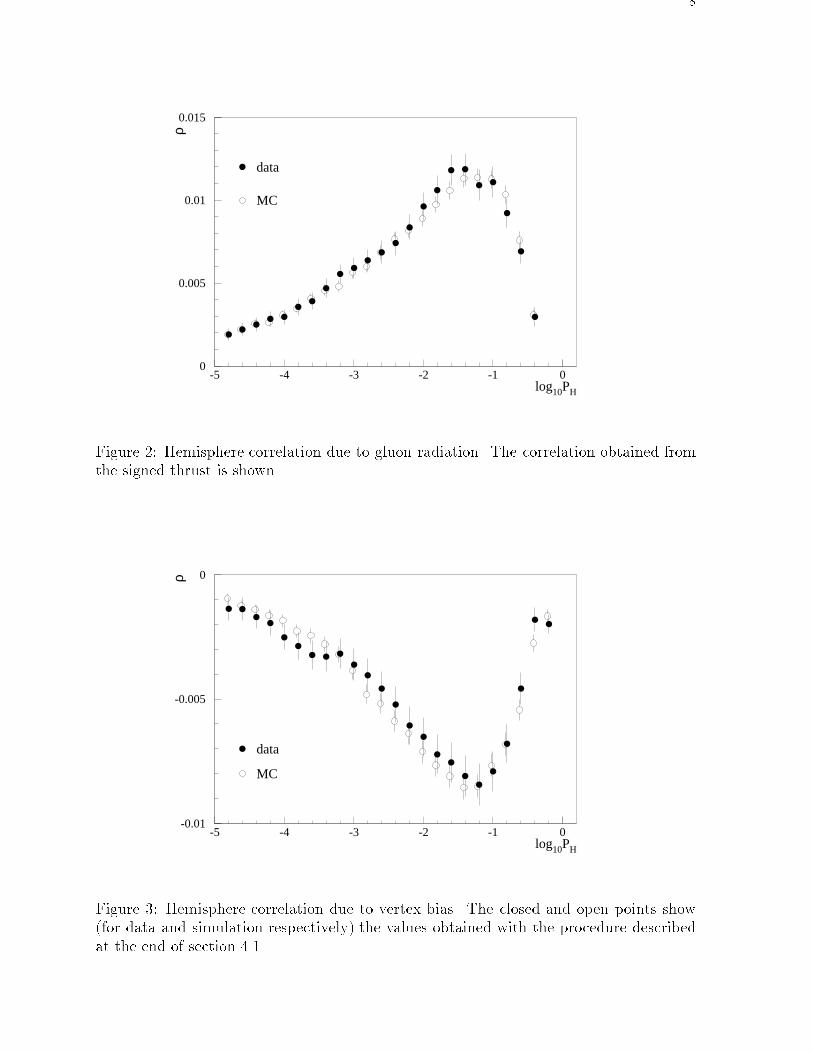
In the case of gluon radiation, thrust was used as the testing variable. To accountpartly for the cancellation of the two di�erent e�ects, the thrust was signed in eachhemisphere to be positive in the hemisphere with the larger invariant mass and negativein the other one. To verify that this procedure gives a reliable estimate of the uncertaintydue to gluon radiation, several tests were made with the Monte Carlo. Events wererejected if they had a) both b's in one hemisphere, b) a thrust value less than 0.96 or c)more than 3 jets. In each case, the total hemisphere correlation and the single sourcecorrelation from thrust were calculated, and compared with the values obtained fromall events. In all cases, the change in the single source correlation obtained from thrustwas larger than the change in the total hemisphere correlation. Thus all simulationproblems of these types would have been detected by the comparison made between dataand simulation. Figure 2 shows the correlation obtained from the signed thrust, whentagging on the opposite hemisphere to reduce the distortions from light quark events. Itshould be noted that the agreement between data and simulation is not a�ected either bytagging or not tagging on the opposite hemisphere, or by using the signed or the normalthrust. As an additional cross-check, the hemisphere correlation was calculated using1 million hadronic Z decays generated with the matrix element option of the JETSETMonte Carlo program [11]. Within the statistical errors, the same correlation was found.
7
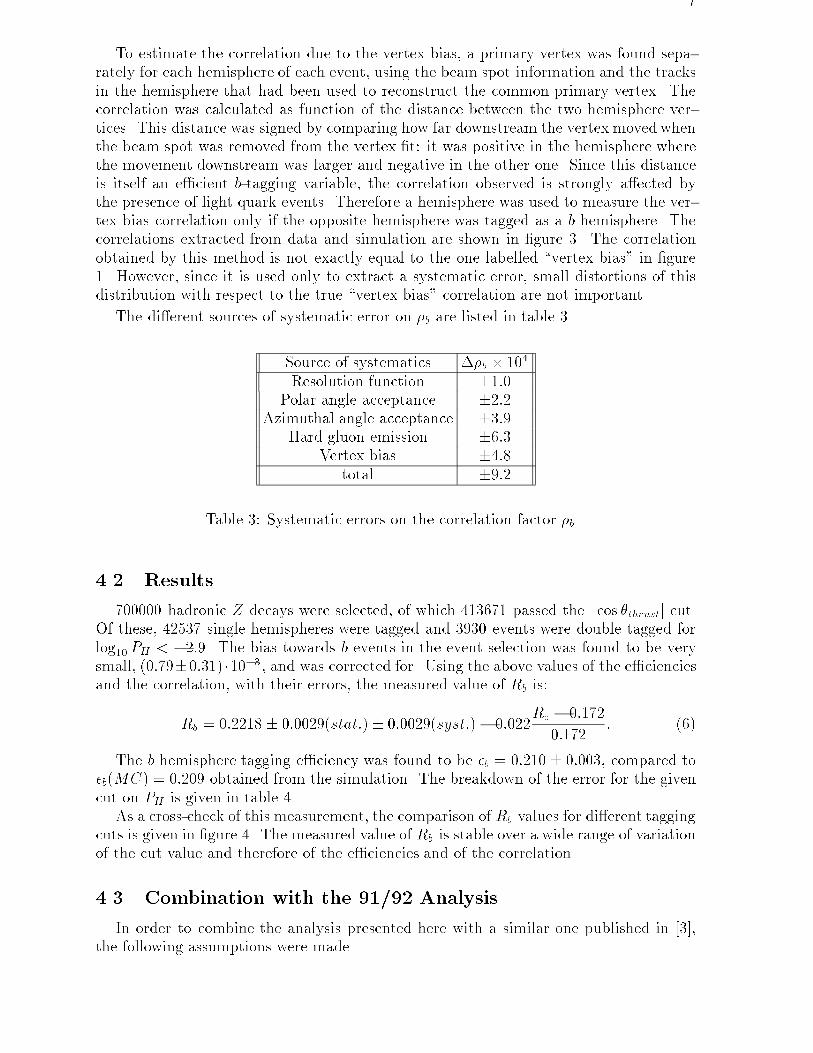
To estimate the correlation due to the vertex bias, a primary vertex was found sepa-rately for each hemisphere of each event, using the beam spot information and the tracksin the hemisphere that had been used to reconstruct the common primary vertex. Thecorrelation was calculated as function of the distance between the two hemisphere ver-tices. This distance was signed by comparing how far downstream the vertex moved whenthe beam spot was removed from the vertex �t: it was positive in the hemisphere wherethe movement downstream was larger and negative in the other one. Since this distanceis itself an e�cient b-tagging variable, the correlation observed is strongly a�ected bythe presence of light quark events. Therefore a hemisphere was used to measure the ver-tex bias correlation only if the opposite hemisphere was tagged as a b hemisphere. Thecorrelations extracted from data and simulation are shown in �gure 3. The correlationobtained by this method is not exactly equal to the one labelled \vertex bias" in �gure1. However, since it is used only to extract a systematic error, small distortions of thisdistribution with respect to the true \vertex bias" correlation are not important.
The di�erent sources of systematic error on �b are listed in table 3.
Source of systematics ��b � 104
Resolution function �1:0Polar angle acceptance �2:2
Azimuthal angle acceptance �3:9Hard gluon emission �6:3
Vertex bias �4:8total �9:2
Table 3: Systematic errors on the correlation factor �b.
4.2 Results
700000 hadronic Z decays were selected, of which 413671 passed the j cos �thrustj cut.Of these, 42537 single hemispheres were tagged and 3930 events were double tagged forlog10 PH < �2:9. The bias towards b events in the event selection was found to be verysmall, (0:79�0:31) �10�3 , and was corrected for. Using the above values of the e�cienciesand the correlation, with their errors, the measured value of Rb is:
Rb = 0:2218 � 0:0029(stat:)� 0:0029(syst:)� 0:022Rc � 0:172
0:172: (6)
The b hemisphere tagging e�ciency was found to be �b = 0:210 � 0:003, compared to�b(MC) = 0:209 obtained from the simulation. The breakdown of the error for the givencut on PH is given in table 4.
As a cross-check of this measurement, the comparison of Rb values for di�erent taggingcuts is given in �gure 4. The measured value of Rb is stable over a wide range of variationof the cut value and therefore of the e�ciencies and of the correlation.
4.3 Combination with the 91/92 Analysis
In order to combine the analysis presented here with a similar one published in [3],the following assumptions were made.
8
0
0.005
0.01
0.015
-5 -4 -3 -2 -1 0
data
MC
log10PH
ρ
Figure 2: Hemisphere correlation due to gluon radiation. The correlation obtained fromthe signed thrust is shown.
-0.01
-0.005
0
-5 -4 -3 -2 -1 0
data
MC
log10PH
ρ
Figure 3: Hemisphere correlation due to vertex bias. The closed and open points show(for data and simulation respectively) the values obtained with the procedure describedat the end of section 4.1.

9
Error Source �Rb � 103
Statistical error �2:9Light quark e�ciency �0:8Charm e�ciency �2:4
Correlation �1:5Total �4:1
Table 4: Sources of errors for the measurement of Rb.
� All statistical errors were assumed to be independent.� The errors in the hemisphere correlations due to hard gluon emission were assumedto be fully correlated between the two results, as were those for the polar angleacceptance. The uncertainty in the vertex bias is strongly connected with the un-certainty in the B-hadron lifetime. Therefore the vertex bias error in this analysiswas assumed to be fully correlated with the error labelled \B-hadron lifetime" in[3]. The errors related to azimuthal dependences were assumed to be uncorrelated,since the dependences arise mainly from dead VD modules, which are repaired yearby year.
� The tuning of the resolution function in the simulation is done year by year bycomparing the simulation with the data, so the errors due to the uncertainties in theresolution functions were also assumed to be independent.
� The errors due to the modelling of the light and charm quarks were assumed to befully correlated.
With these assumptions, the result for the combined 1991/92/93 data is:
Rb = 0:2219 � 0:0018(stat:)� 0:0028(syst:)� 0:022Rc � 0:172
0:172: (7)
4.4 Energy dependence
In 1993, data were taken at three di�erent centre of mass energies (ps =
89:49; 91:25; 93:08 GeV ). As photon exchange and � Z interference are strongly sup-pressed at energies close to the Z resonance, Rb(
ps) is predicted to be almost constant
in the Standard Model. However, if Rb is a�ected by the interference of the Z with aZ0 almost degenerate in mass, as recently suggested by Caravaglios and Ross [13], some
energy dependence can be expected if the mass and width of the Z 0 are not exactly equalto those of the Z. Since the b-tagging e�ciency varies only very little within the energyrange considered here, no complicated single to double tag comparison is needed to mea-
sure Rb(ps)
Rb(91:25 GeV ). Instead, simply the ratio of the fraction of tagged events can be used,
with small corrections due to changes in the b-tagging e�ciency and almost negligiblecorrections due to background. These corrections were calculated using the Monte Carlosimulation. The measurement was performed using event probabilities instead of hemi-sphere probabilities. Several di�erent values of the event probability cut were used, anda minimum statistical error was found at log10 PE < �1:6. At this value of the cut, theb-tagging e�ciency varied by a relative amount of �0:5% with respect to that at the Zpeak and was about 70%, while the e�ciency to tag c (uds) events was about 20% (4%).To avoid any systematic uncertainties due to time dependence of the b-tagging e�ciency,
the data taken in the �rst part of the year, where LEP ran only atq(s) = 91:25 GeV,

10
0.16
0.18
0.2
0.22
0.24
0.26
-5 -4.5 -4 -3.5 -3 -2.5 -2 -1.5 -1
Figure 4: The value of Rb with its total error as a function of the cut on log10 PH . Thehorizontal line corresponds to the value measured at the reference point, log10 PH < �2:9.The thin error bar corresponds to the total error, the thick one indicates the error on thechange in Rb from the value at the reference point.
on the Z peak, were neglected. With these requirements the following ratios were found:
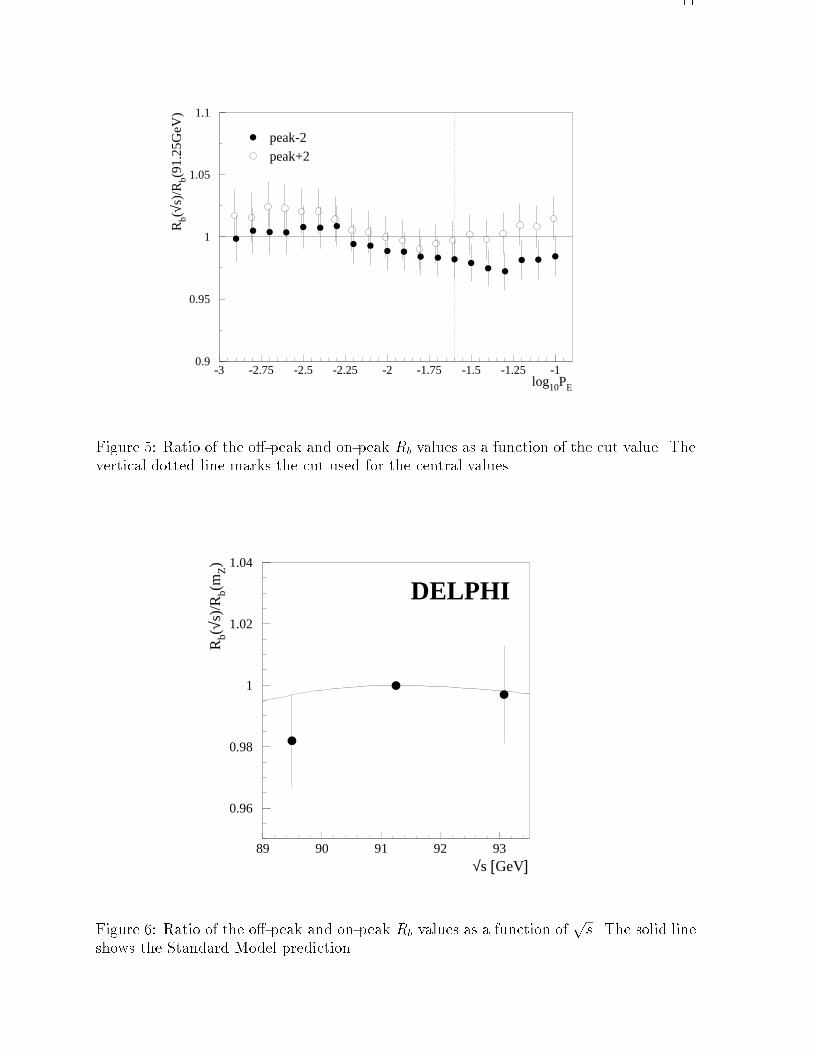
R�=Rb(89:49 GeV )
Rb(91:25 GeV )=0:982 � 0:015;
R+=Rb(93:08 GeV )Rb(91:25 GeV )
=0:997 � 0:016:
The error is statistical only, including the limited Monte Carlo statistics at the o�-peakpoints. All systematic uncertainties were found to be negligible. The Standard Modelpredicts a ratio of 0.997 (0.998) for R� (R+). Figure 5 shows the stability of the mea-surement with respect to the cut value. Figure 6 compares the result with the StandardModel prediction.
5 Mixed tag Analysis
This analysis used the impact parameter b-tagging technique described in section 4,but the e�ciency of the tag was measured using a sample of events enriched in semi-leptonic b decays. The track and event selections, including the polar angle cut, werebasically identical to the ones used in section 4.
The lepton identi�cation methods are described in [3]. To increase the fraction ofb events in the sample, a cut was applied to the transverse momentum of the leptonwith respect to the axis of the jet, after removal of the lepton itself (poutt ). The cutpoutt > 1:5 GeV=c was used. If �q is the probability of tagging one hemisphere using theimpact parameter technique when a avour q is produced in the Z decay, and Pq is the
11
0.9
0.95
1
1.05
1.1
-3 -2.75 -2.5 -2.25 -2 -1.75 -1.5 -1.25 -1
peak-2peak+2
log10PE
Rb(
√s)/
R b(91
.25G
eV)
Figure 5: Ratio of the o�-peak and on-peak Rb values as a function of the cut value. Thevertical dotted line marks the cut used for the central values.
0.96
0.98
1
1.02
1.04
89 90 91 92 93√s [GeV]
Rb(
√s)/
R b(m
Z)
DELPHI
Figure 6: Ratio of the o�-peak and on-peak Rb values as a function ofps. The solid line
shows the Standard Model prediction.

12
fraction of events from the avour q in the lepton subsample, then
f1 = �bRb + �cRc + �udsRuds;
f2 = cbl�bPb + c
cl�cPc + c
udsl �udsPuds;
(8)
where f1 is the fraction of hemispheres in hadronic Z events tagged by the impact pa-rameter selection, and f2 is the fraction of semileptonic decays tagged by the impactparameter selection in the hemisphere opposite to the lepton. To extract the e�ciencyof the lifetime tags with adequate precision, accurate knowledge of the avour composi-tion of the lepton sample, as expressed by the coe�cients Pq, is required. Section 5.1 isdevoted to this topic.
The coe�cients cql account for the correlations between the impact parameter and
lepton tags in opposite hemispheres, and were computed by simulation. Due to thesmallness of the contamination from c and light quarks, only the knowledge of cbl wasrelevant for the measurement. With the requirement log10 PH < �2:5, the e�cienciesfor tagging the di�erent avours and the correlation coe�cient cbl were estimated in thesimulation as:
�uds = (0:71� 0:01)%;
�c = (3:63� 0:04)%;
cbl = 1:014 � 0:008 � 0:005:
The systematic uncertainty on the correlation coe�cient cbl was determined in thesame way as that on the correlation �b in the impact parameter analysis.
The total data sample after all cuts consisted of 426786 events, in which 67717 hemi-spheres were tagged with the above probability cut. 11204 events with a high pt leptonwere found, 2891 of which were also b-tagged. From these numbers the values:
�datab = (30:63 � 0:51)%;
Rb = 0:2240 � 0:0039;
were derived, where the errors are only statistical. The value of �b given by the simulationwas (30:30 � 0:05)%. As the cut on the lepton p
outt is an arbitrary parameter, chosen to
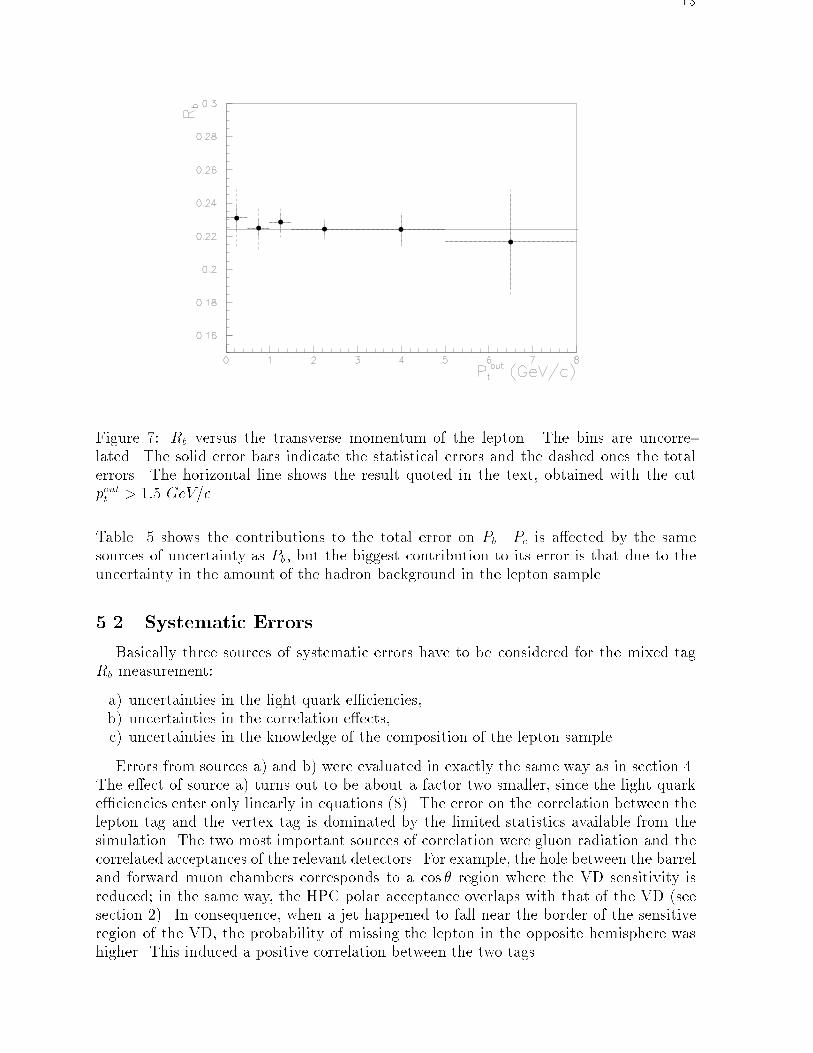
minimize the total error, the variation of the Rb value when changing the poutt selectionwas checked. Figure 7 shows the result of this test.
The systematic errors will be discussed in section 5.2.
5.1 The Composition of the Lepton Sample
A �t to the single and di-lepton distributions (performed on the 1993 data sample bythe method discussed in ref. [3] ) allowed a precise determination of the fractions Pb andPc of events from b and c quarks in the lepton sample. These fractions (called \purities"below) were computed as a function of poutt , in the subset of hadronic events selected forthe impact parameter analysis. The most energetic candidate was used when more thanone lepton was found in the event (due to the high p
outt cut, this applied to less than 1%
of the cases). The requirement poutt > 1:5 GeV=c was applied in order to minimize theoverall error on Rb. The purities of the sample were estimated as:
Pb = (81:17 � 0:79)%;
Pc = (9:56 � 0:76)%:
13
Figure 7: Rb versus the transverse momentum of the lepton. The bins are uncorre-lated. The solid error bars indicate the statistical errors and the dashed ones the totalerrors. The horizontal line shows the result quoted in the text, obtained with the cutpoutt > 1:5 GeV=c.
Table 5 shows the contributions to the total error on Pb. Pc is a�ected by the samesources of uncertainty as Pb, but the biggest contribution to its error is that due to theuncertainty in the amount of the hadron background in the lepton sample.
5.2 Systematic Errors
Basically three sources of systematic errors have to be considered for the mixed tagRb measurement:
a) uncertainties in the light quark e�ciencies,b) uncertainties in the correlation e�ects,c) uncertainties in the knowledge of the composition of the lepton sample.
Errors from sources a) and b) were evaluated in exactly the same way as in section 4.The e�ect of source a) turns out to be about a factor two smaller, since the light quarke�ciencies enter only linearly in equations (8). The error on the correlation between thelepton tag and the vertex tag is dominated by the limited statistics available from thesimulation. The two most important sources of correlation were gluon radiation and thecorrelated acceptances of the relevant detectors. For example, the hole between the barreland forward muon chambers corresponds to a cos � region where the VD sensitivity isreduced; in the same way, the HPC polar acceptance overlaps with that of the VD (seesection 2). In consequence, when a jet happened to fall near the border of the sensitiveregion of the VD, the probability of missing the lepton in the opposite hemisphere washigher. This induced a positive correlation between the two tags.

14
Source �Pb
Monte Carlo statistics 0.31Lepton Fit 0.36Model b! l 0.39Model c! l 0.31b! � ! l 0.03b! c! l 0.02b! J=! l 0.03c! l 0.34e misidenti�cation 0.12� misidenti�cation 0.14e identi�cation e�ciency 0.02� identi�cation e�ciency 0.04
Table 5: Systematic errors (%) on the purity Pb of the lepton sample when the selectionpoutt > 1:5 GeV=c was applied to the lepton transverse momentum.
The contributions due to the uncertainties in the purity of the lepton sample werethen added to the total error. Table 6 gives the detailed contributions of all the sourcesof uncertainty considered above. Thus the �nal result from the 1993 analysis is
Rb = 0:2240 � 0:0039(stat:)� 0:0040(syst:)� 0:015Rc � 0:172
0:172: (9)
Source of error �Rb
Statistical 0.0039Pb 0.0024Pc 0.0003Resolution Function 0.0011Vertex-lepton correlations 0.0022Charm e�ciency 0.0019uds e�ciency 0.0006total 0.0056
Table 6: Contributions to the total error in the mixed tag analysis.
5.3 Combination with the 1992 Analysis
In order to combine the results of this analysis and the 1992 one [3], all the statisticaluncertainties were treated as independent. For the combination of systematic errors:
� The errors on the two analyses due to gluon radiation were considered to be fullycorrelated, as were for those due to detector acceptance.
� The errors on the resolution functions were assumed to be independent, as for thelifetime analysis; the other uncertainties on the charm and light quarks e�ciencieswere treated as fully correlated.

15
� The errors on the lepton purity due to limited Monte Carlo statistics were assumedto be independent. The uncertainties due to the heavy avour decay models andbranching ratios, and also the errors due to the lepton e�ciencies and the backgroundestimation, were treated as fully correlated.
With these assumptions, the result for the combined 1992/93 data is
Rb = 0:2233 � 0:0029(stat:)� 0:0035(syst:)� 0:015Rc � 0:172
0:172: (10)
6 The Multivariate Analysis
In the impact parameter analysis, hemispheres are tagged simply as b and non-b. Thisleads to two equations with six unknowns, Rb, �b, Rc, �uds, �c and �b. Three of them,�uds, �c and �b, are then taken from simulation and Rc is �xed to the Standard Modelvalue. If the number of equations for physical observables were larger than the numberof unknowns, the latter could be extracted directly from the data, and the simulationwould be required only to estimate systematic errors and the in uence of hemispherecorrelations. That is the principle of this method of measuring Rb, which uses the 1992and 1993 data. The method was used previously to analyse the 1991 data [7]. Thecut j cos �thrust j< 0:75 was applied. This ensured that most of the tracks were withinthe acceptance of the microvertex detector. In order to reduce the correlation betweenopposite hemispheres as much as possible, a primary vertex was computed on each side;the position and dimensions of the beam spot were also used in these �ts.
To provide the necessary hemisphere tagging categories (physical observables), an in-volved multivariate analysis technique is used. This tagging algorithm combines thirteenmicrovertex and event shape variables. The details of the technique and a full descriptionof the variables can be found in [14] and were basically the same as those used for the1991 analysis. One variable (boosted sphericity) is computed with four-momenta only,the remaining ones use the reconstructed trajectories near the interaction point. Three ofthem are connected to the �2 �t of vertices associated with various sets of particles. Threeare distances between \candidate secondary vertices" and the primary vertex, and aresensitive to decay lengths. Another three variables are di�erent counters of \candidatesecondary particles" and the last two are estimates of the total energy and p
2t associated
with them. In order to improve the quality of the tagging as compared with that achievedin the 1991 analysis, the hemisphere probability variable PH used in the analyses pre-sented in sections 4 and 5 was also included, but in this analysis it was constructed usingthe primary vertex computed separately in each hemisphere.
The probabilities puds, pc and pb of observing the thirteen values of the variables foreach hemisphere are computed from model distributions taken from simulation. Thesethree probabilities are sorted in increasing order as pfirst, psecond and pthird. The hemi-spheres are �rst classi�ed as uds, c or b according to the highest probability, pfirst. Theuds tag is then subdivided into two categories (called uds-tight and uds-loose) and theb tag into three categories (b-loose, b-medium and b-tight). The categories are mutuallyexclusive and they have been ordered by increasing b purity. The subdivision inside theuds and b tags is based on a crucial classi�cation criterion �, called the winning margin,de�ned as
� = ln(pfirst=psecond); (11)

16
which is an indicator of tag clarity. The values of the cuts de�ning these categories were�cut
uds = 2:0, �cut;lowb = 4:0 and �cut;high
b = 8:0. They were chosen in order to minimise theerror.
The distribution of the winning margin � depends on the response of the trackingsystem, so that imperfect description of the detector accuracy could produce disagreementbetween data and simulation. The standard simulation described the distribution ofthe winning margin reasonably well, but not perfectly. The �nal e�ect on Rb of thesimulation not being fully realistic was expected to be small, because the e�ciencies andbackgrounds were estimated directly from the data, and almost independently of thesimulation. Nevertheless, in order to improve this agreement, the di�erent avours in thesimulated sample were weighted and moved around in such a way that the distributionin � for each tag coincided with that of the data sample. Even though this proceduredoes not ensure detailed agreement at the level of each avour contribution separately, itimproved the agreement in the description of the physical observables (de�ned in section6.1) used to perform theRb measurement. Figure 8 shows the winning margin distributionin the b tag after these corrections. Their �nal aim was only to improve the evaluationof the systematic errors.
1
10
10 2
10 3
10 4
0 5 10 15 20 25 30
Winning margin ∆
Even
ts/0.3 DELPHI
Figure 8: Distribution of the winning margin � in the b tag categories for data andfor simulation after correction. The di�erent types of shading show the di�erent avourcontributions to the simulated event sample. The simulation distributions are normalizedto the data statistics. The values of the cuts de�ning the three b tag categories are alsoindicated.
6.1 The �t procedure
The mathematical formalism of the �t procedure is described in reference [14]. Thetagging algorithm classi�ed the NF = 3 avours (uds, c and b) of the hadronic events into
17
NT categories. Even though the smallest number of categories to measure Rb with thismethod is NT = 4, the choice NT = 6 was made in order to overconstrain the problemand to minimise the error.
The �rst set of observables was the matrix DIJ (I,J = 1,...,NT), de�ned as the ob-served fraction of events tagged as I and J for hemispheres 1 and 2 respectively. Thecorresponding expected fraction of events TIJ can be written as
TIJ =Xq
�qI�
qJ(1 + �
qJI )Rq: (12)
In equation (12), the Rq are the avour fractions and �qI is the probability to classify
a hemisphere of avour q in category I. The 6 � 3 array �qI , called the classi�cation
matrix, was assumed to be the same for both hemispheres. In a �rst approximation, theprobability to classify an event of a avour q in one hemisphere is independent of theclassi�cation in the other hemisphere. In order to take inter-hemisphere correlations intoaccount, the matrix �
qJI was introduced. The values of these elements for b quarks, as
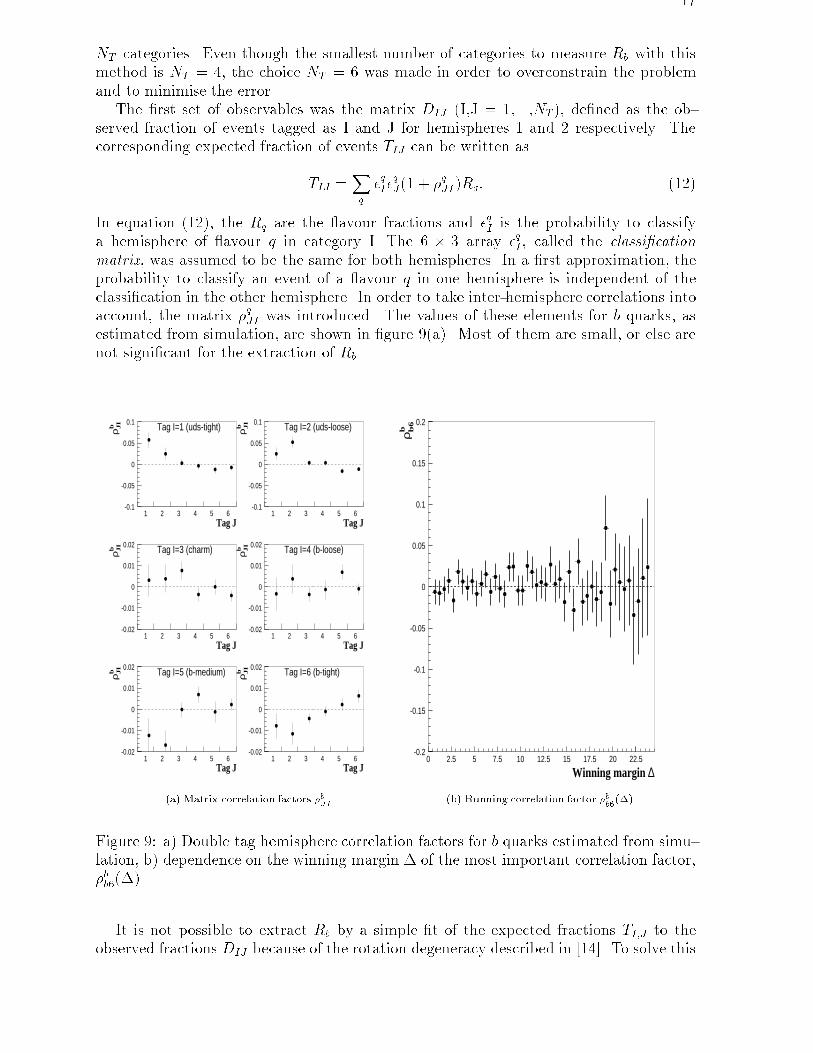
estimated from simulation, are shown in �gure 9(a). Most of them are small, or else arenot signi�cant for the extraction of Rb.
-0.1
-0.05
0
0.05
0.1
1 2 3 4 5 6Tag J
ρb JI Tag I=1 (uds-tight)
-0.1
-0.05
0
0.05
0.1
1 2 3 4 5 6Tag J
ρb JI Tag I=2 (uds-loose)
-0.02
-0.01
0
0.01
0.02
1 2 3 4 5 6Tag J
ρb JI Tag I=3 (charm)
-0.02
-0.01
0
0.01
0.02
1 2 3 4 5 6Tag J
ρb JI Tag I=4 (b-loose)
-0.02
-0.01
0
0.01
0.02
1 2 3 4 5 6Tag J
ρb JI Tag I=5 (b-medium)
-0.02
-0.01
0
0.01
0.02
1 2 3 4 5 6Tag J
ρb JI Tag I=6 (b-tight)
(a) Matrix correlation factors �bJI.
-0.2
-0.15
-0.1
-0.05
0
0.05
0.1
0.15
0.2
0 2.5 5 7.5 10 12.5 15 17.5 20 22.5
Winning margin ∆
ρb b
6
(b) Running correlation factor �bb6(�).
Figure 9: a) Double tag hemisphere correlation factors for b quarks estimated from simu-lation, b) dependence on the winning margin � of the most important correlation factor,�bb6(�).
It is not possible to extract Rb by a simple �t of the expected fractions TI;J to theobserved fractions DIJ because of the rotation degeneracy described in [14]. To solve this

18
problem, a second set of observables, the distributions of the category fractions fI(�),was used. fI(�) is de�ned as the fraction of the events tagged as b in one hemispherewith a winning margin in a given bin of �, �� �, that are classi�ed in category I in theother hemisphere. The main property of the fraction fI(�) is that its asymptotic valueprovides an estimate of the corresponding classi�cation probability �bI .
The correlations in the background terms were found to have only a small in uence,and were neglected. Then the fI(�) fractions can be expressed as
fI(�) = �bI
n1 + �
bbI(�)
o+ �I(�); (13)
with�I(�) = (�udsI � �
bI)Ruds(�) + (�cI � �
bI)Rc(�): (14)
where Ruds(�) and Rc(�) are the uds and c contaminations in the b-tagged hemisphereand are independent of the index I. From (13) and (14), the asymptotic value of fI(�) isn1 + lim�!1 �
bbI(�)
o�bI , provided high purity is achieved in the b-tagged hemisphere for
large values of �. That this high purity is indeed achieved can be seen in �gure 8. Thecoe�cients �bbI(�) in 13 are the running hemisphere correlation coe�cients as a functionof � for each tag I. The main correlation factor for the Rb measurement is �bb6. Figure9(b) shows the variation of this coe�cient with � in the simulated data. Within thestatistical errors it is very stable, even at large values of �, and is always compatiblewith zero.
In order to extract the asymptotic value of fI(�), an analytical parametrization ofthe �I(�) distributions must be used. It was found that the parametrization which bestdescribes the whole range of the contamination distributions Ruds(�) and Rc(�) for theDELPHI data is the product of an exponential with a Gaussian function.
In the 1991 analysis, equation (13) was used to �t the fractions fI(�) to extract theirasymptotes, �bI . The values of �bI were then inserted into a �nal �t to the matrix DIJ
to extract Rb [7]. The problem with this technique is to evaluate properly systematicerrors in the estimates of �bI. This di�culty has been avoided in the present analysisby combining the two �ts into one by minimizing the global objective �2(�;R) function,de�ned as
�2(�;R) =
XIJ
fDIJ � TIJg2
�2IJ
+XI;�
nfI(�)� �
bI
h1 + �
bbI(�)
i� �I(�)
o2
�2fI(�)
: (15)
This allows the simultaneous determination of the classi�cation matrix, the contaminationdistributions �I(�) and Rb. The �IJ are the statistical errors of the DIJ elements and�fI(�) are the experimental errors on fI(�) for each bin of �. With this function and inthe absence of correlations, a degeneracy in the udsc sector is still present but it can beremoved, for instance, by �xing Rc to the Standard Model value. This constraint has noe�ect on any parameter of the b sector [14].
Another advantage of this global �t is that it provides the unique solution that repro-duces the matrix population DIJ and the fI(�) fractions simultaneously. In addition,hemisphere correlation e�ects can be studied simultaneously for both terms of equation(15). The disadvantage is the introduction of a relatively large number of auxiliary pa-rameters in the minimization procedure.
19
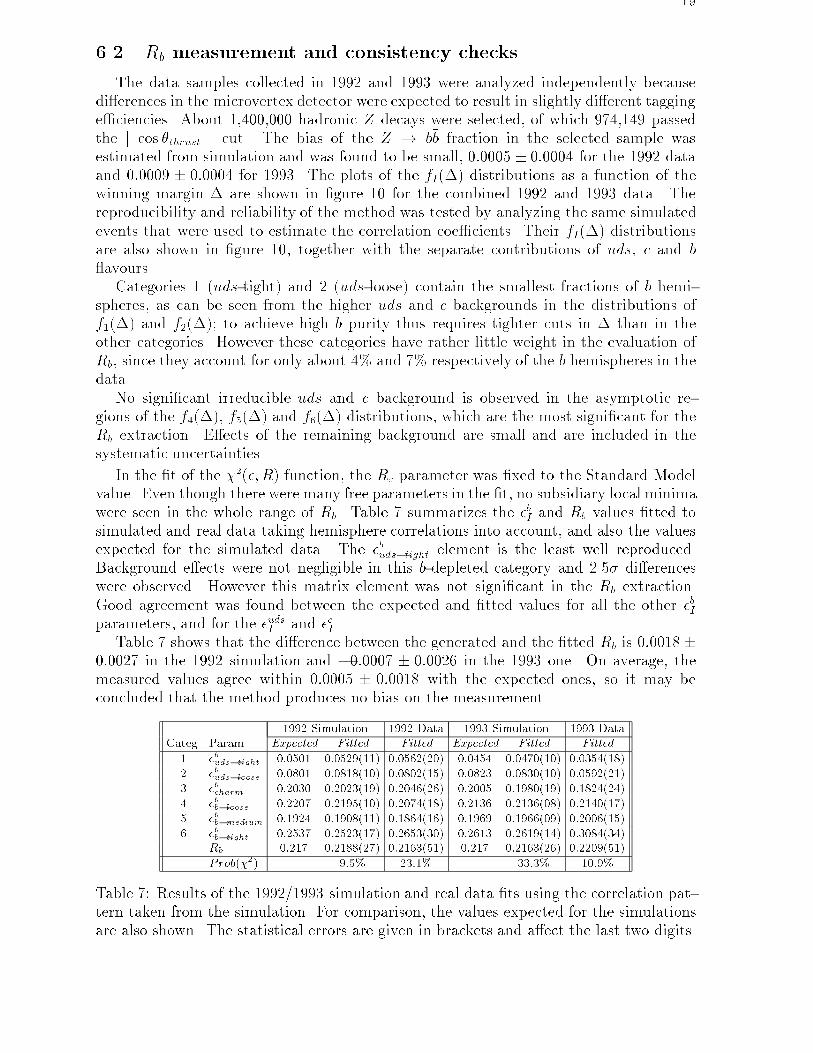
6.2 Rb measurement and consistency checks
The data samples collected in 1992 and 1993 were analyzed independently becausedi�erences in the microvertex detector were expected to result in slightly di�erent tagginge�ciencies. About 1,400,000 hadronic Z decays were selected, of which 974,149 passedthe j cos �thrust j cut. The bias of the Z ! b�b fraction in the selected sample wasestimated from simulation and was found to be small, 0:0005 � 0:0004 for the 1992 dataand 0:0009 � 0:0004 for 1993. The plots of the fI(�) distributions as a function of thewinning margin � are shown in �gure 10 for the combined 1992 and 1993 data. Thereproducibility and reliability of the method was tested by analyzing the same simulatedevents that were used to estimate the correlation coe�cients. Their fI(�) distributionsare also shown in �gure 10, together with the separate contributions of uds, c and b
avours.Categories 1 (uds-tight) and 2 (uds-loose) contain the smallest fractions of b hemi-
spheres, as can be seen from the higher uds and c backgrounds in the distributions off1(�) and f2(�); to achieve high b purity thus requires tighter cuts in � than in theother categories. However these categories have rather little weight in the evaluation ofRb, since they account for only about 4% and 7% respectively of the b hemispheres in thedata.
No signi�cant irreducible uds and c background is observed in the asymptotic re-gions of the f4(�), f5(�) and f6(�) distributions, which are the most signi�cant for theRb extraction. E�ects of the remaining background are small and are included in thesystematic uncertainties.
In the �t of the �2(�;R) function, the Rc parameter was �xed to the Standard Modelvalue. Even though there were many free parameters in the �t, no subsidiary local minimawere seen in the whole range of Rb. Table 7 summarizes the �bI and Rb values �tted tosimulated and real data taking hemisphere correlations into account, and also the valuesexpected for the simulated data. The �
buds�tight element is the least well reproduced.
Background e�ects were not negligible in this b-depleted category and 2.5� di�erenceswere observed. However this matrix element was not signi�cant in the Rb extraction.Good agreement was found between the expected and �tted values for all the other �bIparameters, and for the �udsI and �
cI .
Table 7 shows that the di�erence between the generated and the �tted Rb is 0:0018�0:0027 in the 1992 simulation and �0:0007 � 0:0026 in the 1993 one. On average, themeasured values agree within 0:0005 � 0:0018 with the expected ones, so it may beconcluded that the method produces no bias on the measurement.
1992 Simulation 1992 Data 1993 Simulation 1993 DataCateg. Param. Expected Fitted Fitted Expected Fitted Fitted
1 �buds�tight 0:0501 0:0529(11) 0:0562(20) 0:0454 0:0470(10) 0:0354(18)2 �buds�loose 0:0801 0:0818(10) 0:0802(15) 0:0823 0:0830(10) 0:0592(21)3 �b
charm0:2030 0:2023(19) 0:2046(26) 0:2005 0:1980(19) 0:1824(24)
4 �bb�loose 0:2207 0:2195(10) 0:2074(18) 0:2136 0:2136(08) 0:2140(17)5 �bb�medium 0:1924 0:1908(11) 0:1864(16) 0:1969 0:1966(09) 0:2006(15)6 �bb�tight 0:2537 0:2523(17) 0:2653(30) 0:2613 0:2619(14) 0:3084(34)
Rb 0:217 0:2188(27) 0:2163(51) 0:217 0:2163(26) 0:2209(51)
Prob(�2) 9:5% 23:1% 33:3% 10:9%
Table 7: Results of the 1992/1993 simulation and real data �ts using the correlation pat-tern taken from the simulation. For comparison, the values expected for the simulationsare also shown. The statistical errors are given in brackets and a�ect the last two digits.

20
DELPHI
10-4
10-3
10-2
10-1
0 5 10 15 20
Winning margin ∆
Fra
ctio
n f
1
10-4
10-3
10-2
10-1
0 5 10 15 20
Winning margin ∆
Fra
ctio
n f
2
10-3
10-2
10-1
0 5 10 15 20
Winning margin ∆
Fra
ctio
n f
3
10-3
10-2
10-1
0 5 10 15 20
Winning margin ∆
Fra
ctio
n f
4
10-3
10-2
10-1
0 5 10 15 20
Winning margin ∆
Fra
ctio
n f
5
10-3
10-2
10-1
0 5 10 15 20
Winning margin ∆
Fra
ctio
n f
6
Figure 10: The distributions of the fractions fI(�) with their �ts for the combined92+93 data. The dashed horizontal lines show the �bI values �tted from the data. Thedistributions for the simulation are also shown, together with the contributions of uds,c and b avours. To show the small backgrounds in the region of hard cuts, the verticalscale on each plot goes down to one per mil of the �tted value of �bI .

21
The o� peak and on peak data are expected to have almost the same fraction ofb�b events, since the hadronic cross sections at these energies are still dominated by Z
exchange. Analyses of the o� peak and on peak data taken in 1993 gave Rb(89:49 GeV ) =0:2220 � 0:0157, Rb(91:25 GeV ) = 0:2210 � 0:0059 and Rb(93:08 GeV ) = 0:2186 �0:0139. The corresponding �
2 probabilities of the �ts were 45.3%, 74.5% and 37.6%respectively. As the di�erences between the on peak and o� peak values of Rb are notsensitive to systematic e�ects, these numbers can be combined using only statisticalerrors. Before averaging them, the o� peak values of Rb were corrected for the smalldi�erences expected relative to the on peak value. These corrections were predicted byZFITTER [15] and changed the o� peak values by 0.0007 and 0.0005 for
ps = 89:49 GeV
andps = 93:08 GeV respectively. The value for 1993 data in table 7 is the result of
combining the three energies after these corrections. It agrees within three per mil withthe result obtained when all the statistics were analyzed together, which is a consistencycheck of the reproducibility and reliability of the method.
As a cross-check on the e�ect of correlations, the �ts shown in table 7 were repeatedtaking all correlation coe�cients equal to zero. The smallness of the change in the resultswas remarkable: the change in Rb was only 0:00103 � 0:00161 for the 1992 data and�0:00146 � 0:00150 for the 1993 data, where the errors are computed from the changein Rb obtained by moving the correlation coe�cients by their statistical errors. Thisdemonstrates the insensitivity of the method to the predicted pattern of correlations.
As another cross-check on the stability of Rb, the measurement was repeated for dif-ferent tagging cuts de�ning the three b categories. Figure 11 shows the di�erence of eachmeasurement with respect to the reference result as a function of �cut;high
b , taking �cut;lowb
to be always half of �cut;highb . The measured value is stable over a wide range of variation
of the e�ciencies inside each b category. Moreover, Rb was also measured using the min-imal con�guration of NT = 4 categories and the di�erence observed with respect to thereference result was 0.0011, well inside the statistical error on the di�erence of 0.0029.
-0.01
-0.008
-0.006
-0.004
-0.002
0
0.002
0.004
0.006
0.008
0.01
0 2 4 6 8 10 12 14 16 18 20
∆bcut,high
R b-Rb(re
feren
ce)
Figure 11: The value of Rb - Rb (reference), with its error, as a function of the cuts
de�ning the three b categories. �cut;lowb was taken as half of �cut;high
b . The reference valueof Rb is the value quoted in the text.

22
6.3 Systematic errors
Three kinds of systematic errors were studied separately: uncertainties coming frommodels, from detector e�ects and from the analysis method.
6.3.1 Model uncertainties
Most methods of Rb determination assume the knowledge of the b-tagging backgrounds[1{5]. These quantities, taken from simulation, are sensitive to theoretical uncertainties inthe uds and c sectors and are sources of systematic error. In this method, Rb is extractedsimultaneously with the e�ciencies and backgrounds by �tting the data. However, theanalysis assumes that for asymptotically hard cuts the contributions of uds and c arenegligible. In the absence of hemisphere correlations and remaining uds and c backgroundin the region of hard cuts, the Rb measurement is mathematically independent of thefactors that a�ect b production or decay, for example fragmentation functions or lifetimes.In that case the corresponding systematic errors are exactly zero. If the hypothesis isalmost true, second order e�ects on the Rb measurement can appear and should beincluded in the systematic uncertainties.
In the previous section it was shown that only a small di�erence in Rb is observed ifthe estimated correlation matrix is taken into account in the �t or if it is neglected. Thissuggests that the method is insensitive to the particular pattern of correlations. Thereis no evidence for a fundamentally di�erent correlation pattern in real data compared tothe simulation. The error made on data coming from correlations should be similar tothe one made on the simulation. An estimate of this error was obtained by varying theparameters of the simulation that could be sources of correlation.
By following the prescriptions described in reference [6], we have checked that errorsdue to modelling are of second order. Table 9 summarizes all the contributions to thesystematic error coming from model uncertainties.
Correlation e�ects can be described in terms of the following sources:
� Hadronic Z events with three or more jets di�er from those with a two jet topologyby the presence of one or more hard gluons in the �nal state. This e�ect includes thehard gluon emission producing a b�b pair in the same hemisphere. To estimate thesystematic error from this source, the number of events was measured in data and insimulation as a function of the thrust of the event. The simulation thrust distributionwas then corrected to reproduce the data distribution. The error was estimated asthe change in the �tted value of Rb, due to the change of correlations and e�ciencies,between the standard simulation and the corrected one. The magnitude of the e�ectwas 0.00061.
� The bias of the production vertex due to the inclusion of tracks from b decays canproduce a negative correlation. The lifetime of b-hadrons and the b fragmentationfunction are the most relevant parameters. The change in the correlations resultingfrom a change of the b lifetime was estimated by applying di�erent decay timeweighting functions to the simulated event sample. The change in the correlationsled to a change in Rb of 0.00022. The uncertainty due to the b fragmentation functionwas estimated similarly, by varying the Peterson parameter to reproduce the meanenergy of B-hadrons within its error limits. The resultant error was 0.00038.
� Finally, the uncertainties in the correlations coming from the limited simulationstatistics were included.

23
For the evaluation of the systematic uncertainty coming from the remaining uds andc background, the following contributions were considered:
� The dependence of Rb on the fraction of charm events (which should be distinguishedfrom the formal Rc parameter of the �t) was estimated by changing the c�c fraction inthe simulation around its Standard Model value. A dependence of �0:0049Rc�0:172
0:172
was found. In contrast, when the Rc �t parameter was varied the change of Rb wasexactly zero.
� The uncertainty due to the c fragmentation function was estimated similarly, byvarying the Peterson parameter to reproduce the uncertainty in the mean energy ofD-hadrons.
� The uncertainties from the relative production rates of D-hadrons, their lifetimes,their decay multiplicities and their inclusive branching ratios D ! K
0X were ob-
tained by varying these values about the measured ones according to [6].� The systematic error from uncertainties in the production of long-lived particles inlight quark events (K0, �, hyperons) was obtained by varying the correspondingproduction rates in the simulation by �10%.
� The systematic errors from uncertainties on the gluon splitting processes g ! b�b andg ! c�c were obtained by varying the fraction of such events by 50%.
To obtain the systematic error from these sources, the Monte Carlo simulated eventswere weighted as a function of the relevant model parameter. The weighted simulatedsample was then �tted, and the di�erence with respect to the �t to the standard simulatedsample was taken as the error.
6.3.2 Detector e�ects
The detector e�ects include all sources of uncertainties due to the apparatus and canbe described in the following terms:
� Detector response. Di�erences between data and simulation are not important inthe present analysis, because all e�ciencies and backgrounds are obtained directlyfrom the data; only a small model dependence remains due to hemisphere correla-tion e�ects and the possible background remaining in the region of hard cuts. Asexplained in section 6, the Monte Carlo sample was corrected to adjust the winningmargin distribution to the data. This procedure improves the agreement betweendata and simulation at the level of the DIJ matrix and the fI(�) distributions. Forthe uncertainty due to the knowledge of the detector response we therefore takethe di�erence between the measurements using the standard simulated sample andthe corrected one, and add in quadrature the error on this di�erence. The valuesobtained were 0.00038 for the 1992 sample and 0.00089 for 1993.
� The polar angle of the thrust axis. Correlation e�ects could be induced by the fallin tag e�ciency at the fringes of the vertex detector acceptance, where both jets arein a region of less good VD acceptance simultaneously. To obtain the systematicerror from this source, the number of b-tagged events was measured in data and insimulation as a function of j cos �thrust j. The simulation distribution was correctedin order to reproduce the corresponding data distribution and the e�ect on Rb wasdetermined. A contribution of 0.00042 for 1992 and 0.00041 for 1993 is quoted, usingthe same method as for the detector response.
� The azimuthal angle of the jets. Due to dead or noisy modules in the vertex detector,the e�ciency was not independent of the azimuthal angle. In particular, during

24
the 1992 running, one row of the DELPHI vertex detector in one layer was dead.In an almost back to back jet topology, hitting a bad module on one side thennormally results in hitting a good module on the other side, producing a negativecorrelation. The multivariate tagging is not sensitive to local defects, so the variationof the tag e�ciency with the azimuthal direction of the event axis is not important.Nevertheless, we have investigated the error due to the local drop of e�ciency, whichinduces a small negative correlation. The method used was the same as for the polarangle correlation. Contributions of 0.00034 for 1992 data and 0.00009 for 1993 datawere found.
� Beam spot constraint. This constraint can be a source of correlations owing to thebeam spot size, since the beam spot constraint is common to both hemispheres. A10% change (which corresponds to the accuracy of the size determination) was foundto change Rb by 0.00034 for both 1992 and 1993 data.
6.3.3 Analysis method
The �t to the simulation discussed in section 6.2 showed that the analysis method isunbiassed, within the accuracy of the limited Monte Carlo statistics. In particular, itwas shown that the di�erence between the generated and the �tted Rb is 0:0018� 0:0027in 1992, and �0:0007 � 0:0026 in 1993. On the other hand, as was indicated in section6.1, the method assumes that estimates of the �bI column of the classi�cation matrix canbe extracted asymptotically. The e�ect of this assumption can be tested by �tting Rb inthe simulation with the �bI parameters �xed to their true values. The di�erence obtainedwith respect to the full measurement was 0:0011� 0:0022 for 1992 and �0:0001� 0:0021for 1993, where the errors are due to Monte Carlo statistics. These values were usedto correct the Rb derived from the �ts to the data, and their errors were taken as asystematic uncertainty on the measurement due to the analysis method. This becomesthe most important contribution to the systematic error which is uncorrelated betweenthe di�erent years; it could be reduced with more simulation statistics.
Therefore we quote as �nal values, including acceptance and systematic corrections,
Rb = 0:2152 � 0:0051(stat:)� 0:0030(syst:)
andRb = 0:2210 � 0:0051(stat:)� 0:0030(syst:)
for 1992 and 1993 data respectively.
6.4 Combination of the 1991 to 1993 results
In order to combine the analyses presented here with the corresponding one made withthe 1991 data, the following assumptions are made.
� All statistical errors are assumed to be independent, including the data statisticalerror and the simulation statistical errors on the checks of the e�ects of correlationsand the analysis method.
� The errors due to model uncertainties on e�ciency correlations and b tag back-grounds are taken to be fully correlated.
� The error from acceptance bias was assumed to be uncorrelated.� All other errors from detector e�ects were taken to be zero in the 1991 analysis,because they were assumed to be well described within the statistical error from the
25
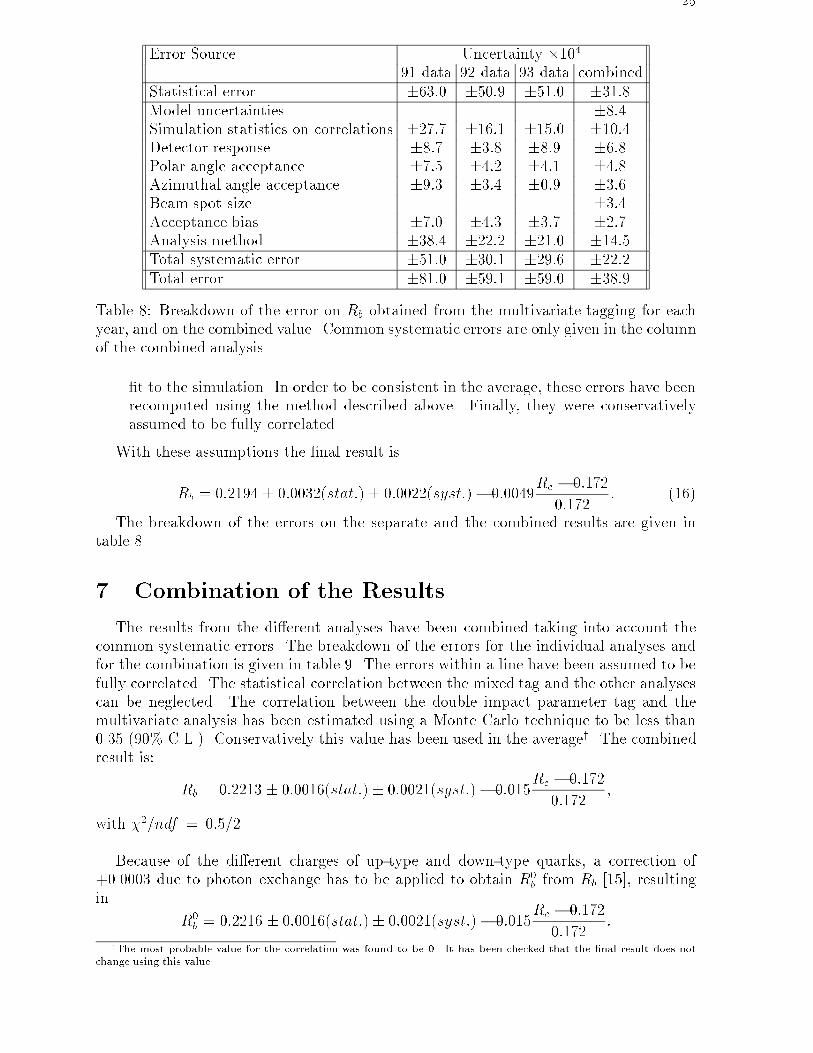
Error Source Uncertainty �10491 data 92 data 93 data combined
Statistical error �63:0 �50:9 �51:0 �31:8Model uncertainties �8:4Simulation statistics on correlations �27:7 �16:1 �15:0 �10:4Detector response �8:7 �3:8 �8:9 �6:8Polar angle acceptance �7:5 �4:2 �4:1 �4:8Azimuthal angle acceptance �9:3 �3:4 �0:9 �3:6Beam spot size �3:4Acceptance bias �7:0 �4:3 �3:7 �2:7Analysis method �38:4 �22:2 �21:0 �14:5Total systematic error �51:0 �30:1 �29:6 �22:2Total error �81:0 �59:1 �59:0 �38:9
Table 8: Breakdown of the error on Rb obtained from the multivariate tagging for eachyear, and on the combined value. Common systematic errors are only given in the columnof the combined analysis.
�t to the simulation. In order to be consistent in the average, these errors have beenrecomputed using the method described above. Finally, they were conservativelyassumed to be fully correlated.
With these assumptions the �nal result is
Rb = 0:2194 � 0:0032(stat:)� 0:0022(syst:)� 0:0049Rc � 0:172
0:172: (16)
The breakdown of the errors on the separate and the combined results are given intable 8.
7 Combination of the Results
The results from the di�erent analyses have been combined taking into account thecommon systematic errors. The breakdown of the errors for the individual analyses andfor the combination is given in table 9. The errors within a line have been assumed to befully correlated. The statistical correlation between the mixed tag and the other analysescan be neglected. The correlation between the double impact parameter tag and themultivariate analysis has been estimated using a Monte Carlo technique to be less than0.35 (90% C.L.). Conservatively this value has been used in the averagey. The combinedresult is:
Rb = 0:2213 � 0:0016(stat:)� 0:0021(syst:)� 0:015Rc � 0:172
0:172;
with �2=ndf = 0:5=2.
Because of the di�erent charges of up-type and down-type quarks, a correction of+0.0003 due to photon exchange has to be applied to obtain R
0b from Rb [15], resulting
in
R0b = 0:2216 � 0:0016(stat:)� 0:0021(syst:)� 0:015
Rc � 0:172
0:172:
yThe most probable value for the correlation was found to be 0. It has been checked that the �nal result does not
change using this value.
26
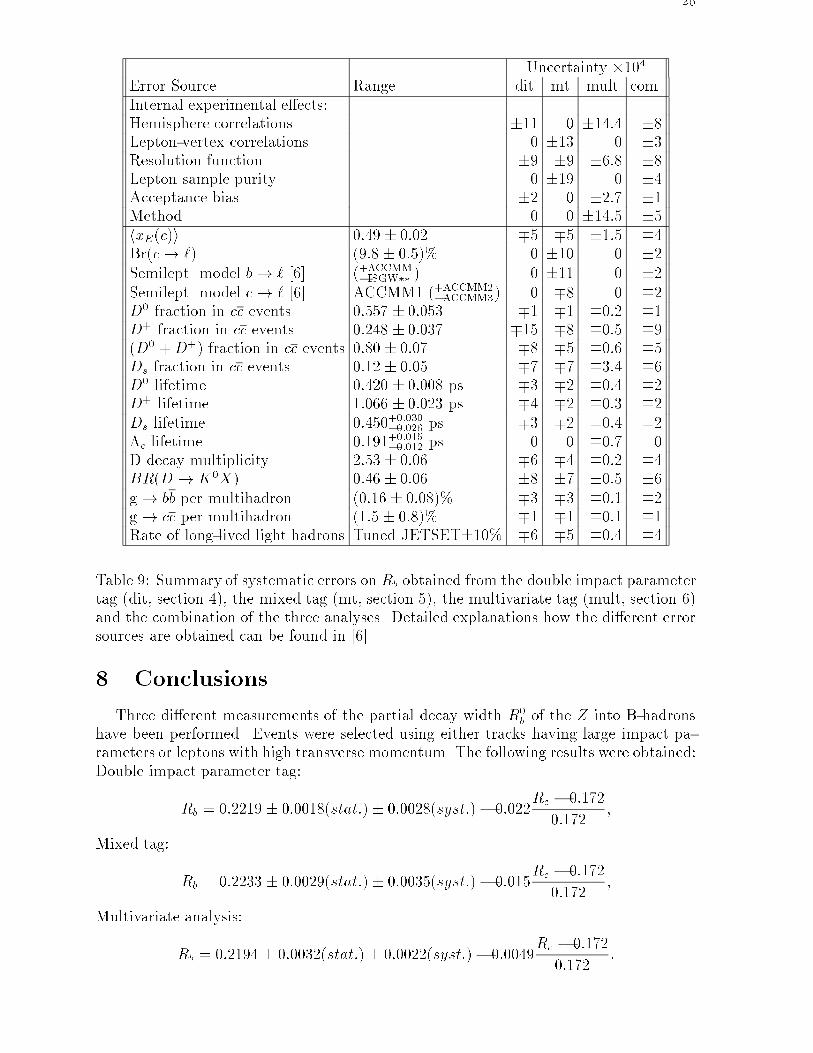
Uncertainty �104Error Source Range dit mt mult com.Internal experimental e�ects:Hemisphere correlations �11 0 �14:4 �8Lepton-vertex correlations 0 �13 0 �3Resolution function �9 �9 �6:8 �8Lepton sample purity 0 �19 0 �4Acceptance bias �2 0 �2:7 �1Method 0 0 �14:5 �5hxE(c)i 0:49 � 0:02 �5 �5 �1:5 �4Br(c! `) (9:8 � 0:5)% 0 �10 0 �2Semilept. model b! ` [6] (+ACCMM
�ISGW�� ) 0 �11 0 �2Semilept. model c! ` [6] ACCMM1 (+ACCMM2
�ACCMM3) 0 �8 0 �2D
0 fraction in cc events 0:557 � 0:053 �1 �1 �0:2 �1D
+ fraction in cc events 0:248 � 0:037 �15 �8 �0:5 �9(D0 +D
+) fraction in cc events 0:80 � 0:07 �8 �5 �0:6 �5Ds fraction in cc events 0:12 � 0:05 �7 �7 �3:4 �6D
0 lifetime 0:420 � 0:008 ps �3 �2 �0:4 �2D
+ lifetime 1:066 � 0:023 ps �4 �2 �0:3 �2Ds lifetime 0:450+0:030�0:026 ps �3 �2 �0:4 �2�c lifetime 0:191+0:015�0:012 ps 0 0 �0:7 0D decay multiplicity 2:53 � 0:06 �6 �4 �0:2 �4BR(D ! K
0X) 0:46 � 0:06 �8 �7 �0:5 �6
g ! bb per multihadron (0:16 � 0:08)% �3 �3 �0:1 �2g ! cc per multihadron (1:5 � 0:8)% �1 �1 �0:1 �1Rate of long-lived light hadrons Tuned JETSET�10% �6 �5 �0:4 �4
Table 9: Summary of systematic errors on Rb obtained from the double impact parametertag (dit, section 4), the mixed tag (mt, section 5), the multivariate tag (mult, section 6)and the combination of the three analyses. Detailed explanations how the di�erent errorsources are obtained can be found in [6].
8 Conclusions
Three di�erent measurements of the partial decay width R0b of the Z into B-hadrons
have been performed. Events were selected using either tracks having large impact pa-rameters or leptons with high transverse momentum. The following results were obtained:Double impact parameter tag:
Rb = 0:2219 � 0:0018(stat:)� 0:0028(syst:)� 0:022Rc � 0:172
0:172;
Mixed tag:
Rb = 0:2233 � 0:0029(stat:)� 0:0035(syst:)� 0:015Rc � 0:172
0:172;
Multivariate analysis:
Rb = 0:2194 � 0:0032(stat:)� 0:0022(syst:)� 0:0049Rc � 0:172
0:172:
27
Combining all numbers and correcting for photon exchange gave
R0b = 0:2216 � 0:0016(stat:)� 0:0021(syst:)� 0:015
Rc � 0:172
0:172:
For this number, all centre of mass energies at which LEP has run have been combined.All results are in agreement with those of other measurements at LEP [1,2,4,5]. Assuminga mass of the top quark of mt = 180 � 12 GeV=c2, as obtained from a simple average ofthe CDF [16] and the D0 [17] measurements, the Standard Model predicts R0
b = 0:2155�0:0005 [15]. This number is about 2.3 standard deviations lower than our measurement,assuming Rc = 0:172.
In addition, the variation of Rb between the on peak and o� peak energies has beenmeasured. The values
Rb(89:49 GeV )
Rb(91:25 GeV )= 0:982 � 0:015
Rb(93:08 GeV )
Rb(91:25 GeV )= 0:997 � 0:016
have been found, in agreement with the Standard Model prediction of 0.997 and 0.998respectively.
Acknowledgements
We are greatly indebted to our technical collaborators and to the funding agencies fortheir support in building and operating the DELPHI detector, and to the members ofthe CERN-SL Division for the excellent performance of the LEP collider.

28
References
[1] ALEPH Collaboration, D. Buskulic et al., Phys. Lett. B313 (1993) 535.[2] ALEPH Collaboration., D. Buskulic et al., Phys. Lett. B313 (1993) 549.[3] DELPHI Collaboration, P. Abreu et al., Z. Phys. C66 (1995) 323.[4] L3 Collaboration, O. Adriani et al., Phys. Lett. B307 (1993) 237.[5] OPAL Collaboration, P.D. Acton et al., Z. Phys. C65 (1995) 17.[6] The LEP collaborations, Combination of Heavy Flavour Electroweak Measurements
at LEP, Publication in preparation.[7] DELPHI Collaboration, P. Abreu et al., Z. Phys. C65 (1995) 555.[8] DELPHI Collaboration, P. Aarnio et al., Nucl. Inst. Meth. A303 (1991) 233.[9] DELPHI Collaboration, P. Abreu et al., Performance of the DELPHI detector,
CERN-PPE/95-194, submitted to Nucl. Inst. Meth.[10] N. Bingefors et al., Nucl. Inst. Meth. A328 (1993) 447.[11] T. Sj�ostrand et al., in \Z physics at LEP 1", CERN 89-08, CERN, Geneva, 1989;
Comp. Phys. Comm. 39 (1986) 347.[12] G. Borisov and C. Mariotti, Fine Tuning of Track Impact Parameter Resolution of
the DELPHI Detector, to be published in Nucl. Inst. Meth.[13] F. Caravaglios and G. Ross, Phys. Lett. B346 (1995) 159.[14] P. Billoir et al., Nucl. Inst. Meth. A360 (1995) 532.[15] D. Bardine et al., ZFITTER: An Analytical Program for Fermion Pair Production
in e+e� Annihilation, CERN-TH 6443/92 (May 1992).
[16] CDF Collaboration, F. Abe et al., Phys. Rev. Lett. 74 (1995) 2626.[17] D� Collaboration, S. Abachi et al., Phys. Rev. Lett. 74 (1995) 2632.