Chapter 13 Amines Intext Questions Pg-384 - Praadis Education
Upload
independentCategory
view
0download
0
Dynamic Article LinksC<Analyst
Cite this: Analyst, 2011, 136, 4492
www.rsc.org/analyst PAPER
High-throughput sensing microtiter plate for determination of biogenic aminesin seafood using fluorescence or eye-vision†
H. A. Azab,a S. A. El-Korashy,a Z. M. Anwar,a G. M. Khairy,a Mark-Steven Steinerb and Axel Duerkop*b
Received 20th January 2011, Accepted 12th August 2011
DOI: 10.1039/c1an15049a
A new optical sensing microplate was developed for rapid screening for the presence of biogenic amines
(BAs) in seafood samples with high sensitivity. The deposition of a sensing spot (containing
a chameleon dye (Py-1) in a polymeric cocktail) on the bottom of the wells of a standard microplate
renders the plate a new sensing tool for a rapid and parallel detection of up to 96 (real) samples. This
sensing microplate enables (1) a semi-quantitative readout of analyte concentration by eye-vision, (2)
a rapid fluorescence readout of 96 samples with standard instrumentation in less than two minutes
(unlike chromatographic and electrophoretic methods), (3) a statistically robust data evaluation (with
8–12 replicates) and (4) a rapid parallel sample preparation with standard 8 or 12-channel
micropipettes. On reaction with biogenic amines, the dye shows a significant visible color change from
blue over green to red color. The appearance of red color favorably coincides with the concentration of
BAs that can induce symptoms of poisoning. The linear ranges of fluorescence calibration data for six
biogenic amines cover the clinical toxicological relevant range of BAs that is too low to be detected by
the human nose. The LODs range from 0.16 to 0.56 mg mL�1, with correlation coefficients (r2) between
0.985 and 0.999. Finally, the evolution of spoilage of four fish samples (monitored by determination of
their BA status) and the increase of their total amine content were found to agree well with previous
data on time-dependent evolution of BAs in fish.
Introduction
Biogenic amines (BAs) are natural nutrition constituents and are
important from a hygienic point of view as they can induce food
poisoning and are able to initiate various pharmacological
reactions. Histamine (his), putrescine, cadaverine, tyramine, and
spermidine are considered to be the most important biogenic
amines occurring in foods.1,2 The term biogenic originates from
the fact that they are formed by the action of bacteria which
induce the decarboxylation of amino acids.3 Histamine has been
found to be the origin of food poisoning in several cases, while
hypertensive crisis was related to the action of tyramine.4–6 The
pharmacological effects of biogenic amines range from excitation
of the smooth muscles (of the uterus, the intestine and the
respiratory tract) to peripheral vasoconstriction, increase of
cardiac output, migraine and paresis of the extremities.7 Another
detrimental effect is the enhancement of the toxicity of histamine
in the presence of, e.g., cadaverine, putrescine, and tyramine.8,9
aChemistry Department, Faculty of Science, Suez Canal University, 41522Ismailia, EgyptbInstitute of Analytical Chemistry, Chemo- and Biosensors, University ofRegensburg, D-93040 Regensburg, Germany. E-mail: [email protected]
† Electronic supplementary information (ESI) available. See DOI:10.1039/c1an15049a
4492 | Analyst, 2011, 136, 4492–4499
Further on, biogenic amines containing additional secondary
amine groups have carcinogenic potential due to their reactions
with nitrites to form nitrosamines. Biogenic amines have been
determined in various types of foods like in cheese, fish, meat,
sauces, eggs and mushrooms.10–14 Several studies employ hista-
mine to trace the freshness of fish, especially of mackerel whose
muscle tissue is rich in free histidine.15 Most BA levels increase
with storage time and this makes their concentration a good
indicator for the freshness of food. These properties suggest their
use as an indicator not only to determine the aging of food but
also to control the purity of water and soil.
Several methods for histamine determination have been
described, and particularly fluorimetry and liquid chromatog-
raphy (LC) can be considered as the most common ones for
determination of biogenic amines in food.16 A spectro-
fluorimetric method (in agreement with AOAC) was used for
histamine determination in canned fish.17 Among the chro-
matographic methods, high performance liquid chromatography
(HPLC),18 capillary electrophoresis (CE),19 gas chromatography
coupled with mass spectrometry (GC-MS),20 and thin-layer
chromatography (TLC) can be mentioned.21 Furthermore, an
enzyme sensor array for the simultaneous determination of three
biogenic amines by pattern recognition using an artificial neural
network was shown.22 The time required for analysis of biogenic
amines using GC-MS20 is 45 min per sample, 100 min per sample
This journal is ª The Royal Society of Chemistry 2011
for HPLC,18 150 min for TLC,21 45 min per sample for CE19 and
23 min per sample for the enzyme sensor array.22 A disadvantage
of the TLC, HPLC, CE and GC-MS analyses in general is the
long and tedious sample pretreatment. In addition, the analysis
time is long although precolumn derivatization is already
included in the HPLC and CE analyses. A further principal
drawback of these methods is the requirement of (sometimes
harmful) organic solvents of HPLC grade quality, whereby the
cost for their purchase and disposal has to be taken into
consideration. Disposable screen-printed electrode biosensors
with enzymes have been shown as a step forward to reduced
sample pretreatment.23 Another approach uses a home-built
reflectometric sensing system to monitor the total volatile amines
in the headspace over fish samples.24,25 The color change shown
at various pH has potential to be applied in food packaging
sensors. A gas-mixing device required for calibration of these
sensors is potentially not available in many labs. Hence, rapid
and easy analytical methods working in standard microplates are
attractive in order to adapt BA measurements to high
throughput screening (HTS).
In this work, we sought to develop a high-throughput sensing
microplate for the quantitation of biogenic amines in real
samples (e.g. seafood) as a rapid screening tool prior to HPLC or
other more time-consuming methods. The new sensing plate
enables parallel and rapid (96 samples in 2 min) detection of BAs
(even by visible readout) with standard fluorescence equipment.
The sensing plate further enables time-saving 8–12 channel par-
allelized sample preparation and thus contributes to a robust
statistical evaluation of the fluorescence measurement. Upon
reaction with biogenic amines, the blue and virtually non-fluo-
rescent dye Py-1 is converted into a red conjugate which is
strongly fluorescent (lem ¼ 620 nm).19 The change of color has
the advantage that any unreacted (blue) label in the sample is not
‘‘seen’’ and not photoexcited by the excitation light of around 500
nm. As an example, the total amount of biogenic amines was
monitored in 4 seafood species (codfish, tuna, salmon and
shrimp) at different stages of spoilage.
Experimental
Materials
Hypan HN 80 polymer was obtained from Hymedix Inc. (www.
hymedix.com). Py-1 was from ActiveMotif Chromeon (www.
activemotif.com).26 All other chemicals were purchased from
Sigma (www.sigmaaldrich.com). They are as follows: spermi-
dine, putrescine, histamine, tyramine, 1-tetradecylamine and
benzylamine. The amines were of analytical grade and methanol
was of chromatographic grade.
Preparation of amine standard solutions
Specific amounts of each of the amines were dissolved in 5 mL of
methanol to obtain a primary stock solution of 10 mM of amine
as a free base. 1 mL of each amine primary stock solution was
placed in a 10 mL volumetric flask and 80 mL of trimethylamine
were added to deprotonate traces of protonated BAs. The
volume was completed to 10 mL with methanol to produce
a secondary stock solution containing 1 mM of each amine.
Working standard solutions were prepared by transferring 4.5,
This journal is ª The Royal Society of Chemistry 2011
22.5, 45, 90, 135, 180, 225, 270, 315, 360 and 450 mL of each
secondary stock solution into a vial and completing the volume
to 500 mL with methanol in order to obtain amine concentrations
of 1, 5, 10, 20, 30, 40, 50, 60, 70, 80, 100 mg mL�1, respectively. All
solutions were stored at 4 �C.
Fabrication of sensing microtiter plates
A 5% (weight) solution of Hypan HN 80 in DMSO (e.g. 1 g
Hypan + 19 g DMSO) is heated to 60 �C for 12–24 h and stirred
well until Hypan is dissolved completely and a clear yellowish
solution is obtained. A Py-1 stock solution of 5 mg of Py-1 in 1
mL of DMSO is made and stored at 4 �C in the dark. Subse-
quently, 10 mL of Hypan HN 80 solution and 4 mL of Py-1 stock
solution are injected into each well of a microtiter plate (no.
651001, 96 well microplates, V-bottom) from Greiner bio-one
(www.gbo.com) and finally the plate is shaken in a round motion
in an Eppendorf Thermomixer Comfort (www.eppendorf.com)
for 30 min at 40 �C to obtain deep blue colored spots in the
sensing microtiter plates as indicated in Fig. S1†. Those plates are
stored at 4 �C in the dark in a desiccator over solid KOH and
were used for sensing within one week. They are stable for at least
one month, whereby their stability was tested by photometric
measurement of the blue sensing layer.
Extraction of seafood samples
Seafood samples were purchased from a local supermarket. 10 g
of seafood sample were mixed with 100 mL of methanol in
a beaker and homogenized with an IKA Ultraturrax (www.ika.
com) at high speed for 2 min. A portion of the homogenisate
was transferred to a conical flask and placed in a 60 �C water
bath for 30 min to yield a yellowish clear solution. This extract
was filtered through a porcelain Buchner funnel with blue ribbon
filter paper (Schleicher und Sch€ull: 5893, www.whatman.com)
two or three times to yield samples free of visual particles. The
sample was centrifuged for 15 min at 3500 rpm, if an oil fraction
appeared on top of the methanol phase. After centrifugation, the
oil phase was removed with a pipette. Then, 80 mL of triethyl-
amine were added and the sample was stored at �18 �C.
Quantitation of BAs
50 mL of the respective working standard solutions were trans-
ferred into each well of a sensing microtiter plate for quantitation
of the amines. The measurement was performed at lex ¼ 485 nm
and lem ¼ 620 nm with a FLUOstar Optima microtiter plate
reader (from BMG LABTECH, Offenburg, Germany, www.
bmglabtech.com). A 10 min incubation time was adjusted and
5 s of shaking is recommended both before and at the end of the
incubation time. The temperature was set to 25 �C. The gain of
the microtiter plate reader was fixed at a value of 1550. The mean
fluorescence intensity was calculated as the average of five
independent measurements of each concentration of BAs.
A standard addition method was used for quantitation of the
amines in seafood. Increasing quantities of histamine (5, 10, 20,
30, 40 and 50 mg mL�1) were added to the fish sample by trans-
ferring 22.5, 45, 90, 135, 180 and 225 mL, respectively, of the 1
mM secondary stock solution of histamine to a diluted solution
(see the column of dilution factors in Table 3) of extracted
Analyst, 2011, 136, 4492–4499 | 4493
sample. The volume was filled to 500 mL with methanol and 5
replicates of 50 mL of each fish sample were injected into the
sensing microtiter plate. Hence, pure methanolic solutions are
analyzed in each well. Then, the plate was measured as described
above.
Results and discussion
Sensing plate, choice of dye and extraction method
The most novel aspect of the concept presented here is the
conversion of a standard microplate into a sensing tool for an
optical assay of BAs by the deposition of a sensor spot in each
well. This concept has many advantages: first, a semi-quantita-
tive readout by eye-vision is possible, similar to commonly used
test stripes. Second, a rapid fluorescence readout (96 samples) is
possible with standard instrumentation in less than two minutes
which is a huge advantage compared to chromatographic and
electrophoretic methods (see Table 2). Third, statistically robust
data can be easily obtained because microplates enable up to 12
replicate measurements of each sample in a row with a total
volume not higher than required for one measurement in a 1 cm
cell. Finally, the preparation of replicate samples may be done
with standard 8–12 channel micropipettes, which additionally
saves time in sample preparation. Hence, the sensing plate is
a rapid screening tool before applying more advanced and time-
consuming chromatographic or electrophoretic methods for
separation and quantitation of specific BAs.
Pyrylium ions are heterocyclic aromatic compounds that react
under mild conditions with amino groups by exchange of oxygen
with the amidic nitrogen. The dye used in the sensing microplates
is the 2,6-dimethyl-4-[(E)-2-(2,3,6,7-tetrahydro-1H,5H-pyrido
[3,2,1-ij]quinolin-9-yl)-vinyl]-pyranylium ion (Py-1). It offers one
of the smallest blue and fluorescent chromophores known, since
the reactive pyrylium group is a part of the chromophoric
system. The Py-1 dye exclusively reacts with primary amines and
primary amino groups of proteins26–28 to yield a red pyridinium
product. This is accompanied by a shortwave shift of the
absorbance from 620 nm to about 502 nm (from blue to red). The
red product shows strong fluorescence (quantum yield (f) up to
0.5) whereas f of the blue form is well below 0.01. This enables
the product to be fluorescently quantified in the presence of
unreacted dye.
Three procedures that seemed suitable for extraction of amines
from seafood samples were evaluated. The first one was the A.O.
A.C. official method (977.13) for histamine,29 the second one was
a trichloroacetic acid-based (TCA) method,30 and the third one
was the A.O.A.C. method 35.1.32, a methanolic extraction
procedure.31 The first two methods are not suitable for deter-
mination of BAs with the sensing plate because the extract itself
is too acidic to enable direct determination in the plate. Here, the
pyrylium ring of Py-1 is destroyed yielding an orange color of the
sensing spots (see Fig. S2†). Alkalinization to adjust a certain pH
following extraction was regarded too tedious as we intended to
develop an overall rapid and simple sample preparation. The
methanolic extraction procedure, however, works best in that it
is rapid, simple, and eliminates the interference of proteins.
Proteins denature and precipitate in methanol and can be
removed during the filtration steps. Moreover, the pretreatment
4494 | Analyst, 2011, 136, 4492–4499
at 60 �C for 30 min will render them insoluble by aggregation and
denaturation. Furthermore, Hypan has been found to efficiently
shield Py-1 from proteins (and labeling reactions with their lysine
side-chains) in sensing layers.32,34 Unlike in a cocktail for deter-
mination of BAs with test stripes,34 no additional dye for refer-
encing of the fluorescence signal is required in the sensing plates.
No decomposition of the sensing spots over 1 h was observed
after adding the methanolic extracts.
Visible readout, linear range and limits of detection
Representatives of aliphatic, aromatic, and heteroaromatic
biogenic amines (mono- and polyamines) were selected to
demonstrate that the sensing plate will work with various kinds
of biogenic primary amines. The calibration curves for determi-
nation of the biogenic amines were acquired by fluorescence
readout of the sensing plates. Tyramine, histamine, spermidine,
putrescine, 1-tetradecylamine, and benzylamine were tested in
the range of 0–100 mg mL�1. Calibration curves were acquired for
each biogenic amine in methanol using at least five increasing
concentrations in five replicates.
Increasing concentrations of histamine result in a color
gradient depending on the amine concentration (see Fig. 1). On
going from deep blue in the absence of histamine, a blue-greenish
color is seen after adding 1 mg mL�1 of histamine that becomes
deep green at higher amine concentrations, changes to green-red
at around 30 mg mL�1 and turns to bright red at 50 mg mL�1 and
higher concentrations.
Concentrations of clinical relevance (0.3–1 mM) which may
induce symptoms of poisoning can be well addressed.32 For
histamine, 0.3 mM corresponds to 33 mg mL�1, i.e. the borderline
between the deep green color and the appearance of the first
visible red color in Fig. 1. Hence, the change of color is distinct
enough even to enable a semi-quantitative sample readout on
potential toxicity by eye-vision. A red color can then be under-
stood as the warning color for a potentially poisoning sample.
Higher concentrations of histamine yield an even brighter red
color. This makes the sensing plate a viable tool to determine
biogenic amines in samples below the odor threshold for BAs of
the human nose (<1 mM).33
The luminescence-based calibration curve for histamine has
a sigmoidal shape (Fig. 2). The linear range is 0.2–60 mg mL�1
(r2 ¼ 0.998, n ¼ 5) as shown in the inset of Fig. 2 and in Table 1.
The linear range for tyramine, putrescine, and spermidine is
0.50–40 mg mL�1, for 1-tetradecylamine the linearity was in the
range from 0.60 to 30 mg mL�1 and for benzylamine the linearity
was in the range 0.30–20 mg mL�1 (Table 1). This corresponds to
linear calibration ranges of on average of 2.5 decades. The
squares of the correlation coefficients vary between 0.985 and
0.999, which is excellent for a rapid screening method. The
sensitivity, as indicated by the slopes, towards the various BAs
varies (not unexpectedly) by a factor of 2.5. The close similarity
of the linear ranges of all amines suggests determination of the
total amount of BAs in real samples. The limits of detection
(LODs) have been determined based on calibration curves using
LOD ¼ 3s/slope. The LODs are found in the range of 0.16–0.56
mg mL�1 (1.4–3.4 mM). All calibration data for the biogenic
amines are summarized in Table 1. These LODs are 6–70-fold
lower than those found recently for sensing stripes.34 For a CE
This journal is ª The Royal Society of Chemistry 2011
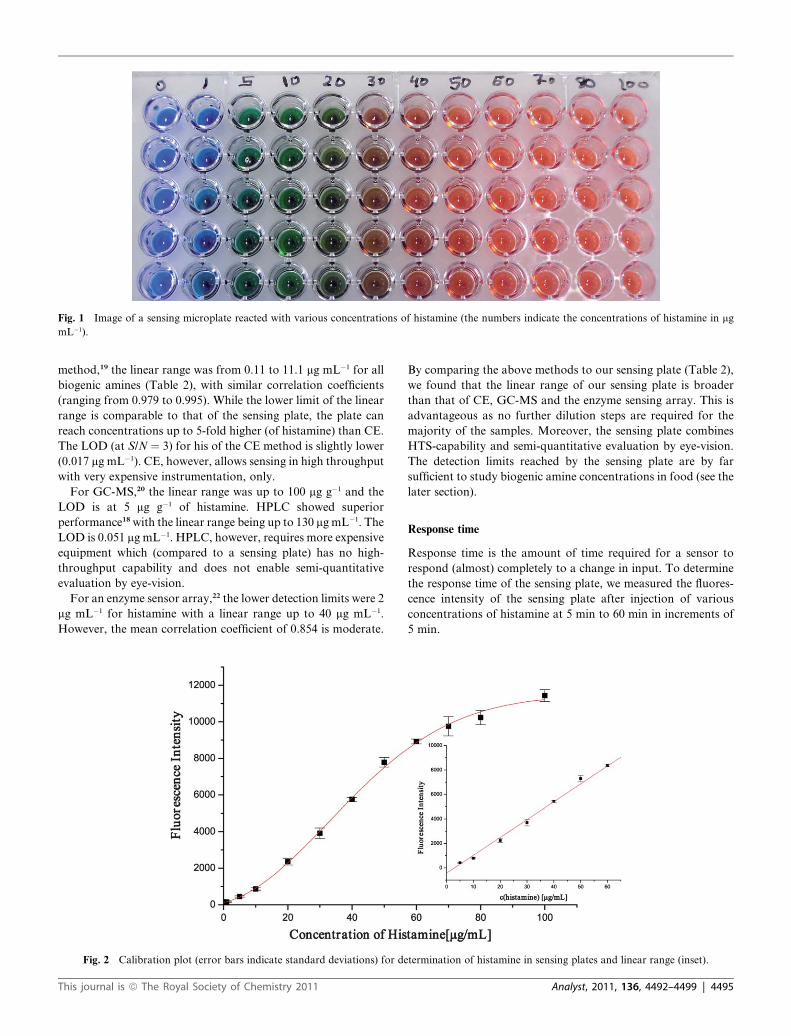
Fig. 1 Image of a sensing microplate reacted with various concentrations of histamine (the numbers indicate the concentrations of histamine in mg
mL�1).
method,19 the linear range was from 0.11 to 11.1 mg mL�1 for all
biogenic amines (Table 2), with similar correlation coefficients
(ranging from 0.979 to 0.995). While the lower limit of the linear
range is comparable to that of the sensing plate, the plate can
reach concentrations up to 5-fold higher (of histamine) than CE.
The LOD (at S/N ¼ 3) for his of the CE method is slightly lower
(0.017 mg mL�1). CE, however, allows sensing in high throughput
with very expensive instrumentation, only.
For GC-MS,20 the linear range was up to 100 mg g�1 and the
LOD is at 5 mg g�1 of histamine. HPLC showed superior
performance18with the linear range being up to 130 mg mL�1. The
LOD is 0.051 mg mL�1. HPLC, however, requires more expensive
equipment which (compared to a sensing plate) has no high-
throughput capability and does not enable semi-quantitative
evaluation by eye-vision.
For an enzyme sensor array,22 the lower detection limits were 2
mg mL�1 for histamine with a linear range up to 40 mg mL�1.
However, the mean correlation coefficient of 0.854 is moderate.
Fig. 2 Calibration plot (error bars indicate standard deviations) for de
This journal is ª The Royal Society of Chemistry 2011
By comparing the above methods to our sensing plate (Table 2),
we found that the linear range of our sensing plate is broader
than that of CE, GC-MS and the enzyme sensing array. This is
advantageous as no further dilution steps are required for the
majority of the samples. Moreover, the sensing plate combines
HTS-capability and semi-quantitative evaluation by eye-vision.
The detection limits reached by the sensing plate are by far
sufficient to study biogenic amine concentrations in food (see the
later section).
Response time
Response time is the amount of time required for a sensor to
respond (almost) completely to a change in input. To determine
the response time of the sensing plate, we measured the fluores-
cence intensity of the sensing plate after injection of various
concentrations of histamine at 5 min to 60 min in increments of
5 min.
termination of histamine in sensing plates and linear range (inset).
Analyst, 2011, 136, 4492–4499 | 4495
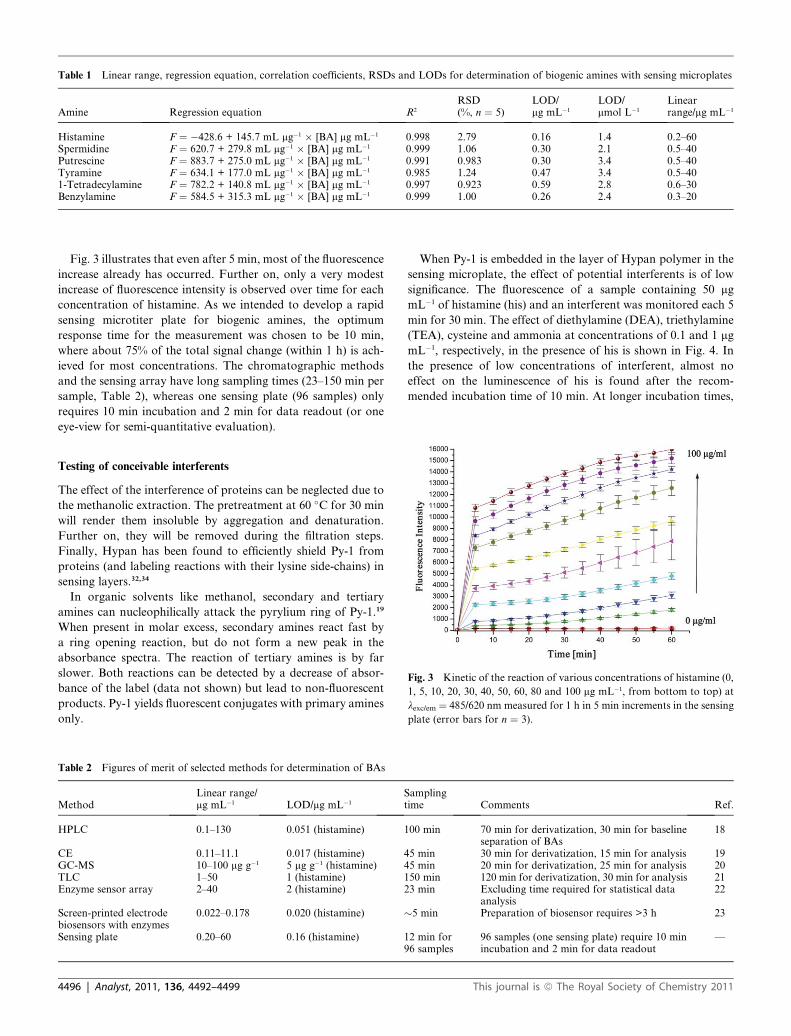
Table 1 Linear range, regression equation, correlation coefficients, RSDs and LODs for determination of biogenic amines with sensing microplates
Amine Regression equation R2
RSD(%, n ¼ 5)
LOD/mg mL�1
LOD/mmol L�1
Linearrange/mg mL�1
Histamine F ¼ �428.6 + 145.7 mL mg�1 � [BA] mg mL�1 0.998 2.79 0.16 1.4 0.2–60Spermidine F ¼ 620.7 + 279.8 mL mg�1 � [BA] mg mL�1 0.999 1.06 0.30 2.1 0.5–40Putrescine F ¼ 883.7 + 275.0 mL mg�1 � [BA] mg mL�1 0.991 0.983 0.30 3.4 0.5–40Tyramine F ¼ 634.1 + 177.0 mL mg�1 � [BA] mg mL�1 0.985 1.24 0.47 3.4 0.5–401-Tetradecylamine F ¼ 782.2 + 140.8 mL mg�1 � [BA] mg mL�1 0.997 0.923 0.59 2.8 0.6–30Benzylamine F ¼ 584.5 + 315.3 mL mg�1 � [BA] mg mL�1 0.999 1.00 0.26 2.4 0.3–20
Fig. 3 illustrates that even after 5 min, most of the fluorescence
increase already has occurred. Further on, only a very modest
increase of fluorescence intensity is observed over time for each
concentration of histamine. As we intended to develop a rapid
sensing microtiter plate for biogenic amines, the optimum
response time for the measurement was chosen to be 10 min,
where about 75% of the total signal change (within 1 h) is ach-
ieved for most concentrations. The chromatographic methods
and the sensing array have long sampling times (23–150 min per
sample, Table 2), whereas one sensing plate (96 samples) only
requires 10 min incubation and 2 min for data readout (or one
eye-view for semi-quantitative evaluation).
Fig. 3 Kinetic of the reaction of various concentrations of histamine (0,
1, 5, 10, 20, 30, 40, 50, 60, 80 and 100 mg mL�1, from bottom to top) at
lexc/em ¼ 485/620 nm measured for 1 h in 5 min increments in the sensing
plate (error bars for n ¼ 3).
Testing of conceivable interferents
The effect of the interference of proteins can be neglected due to
the methanolic extraction. The pretreatment at 60 �C for 30 min
will render them insoluble by aggregation and denaturation.
Further on, they will be removed during the filtration steps.
Finally, Hypan has been found to efficiently shield Py-1 from
proteins (and labeling reactions with their lysine side-chains) in
sensing layers.32,34
In organic solvents like methanol, secondary and tertiary
amines can nucleophilically attack the pyrylium ring of Py-1.19
When present in molar excess, secondary amines react fast by
a ring opening reaction, but do not form a new peak in the
absorbance spectra. The reaction of tertiary amines is by far
slower. Both reactions can be detected by a decrease of absor-
bance of the label (data not shown) but lead to non-fluorescent
products. Py-1 yields fluorescent conjugates with primary amines
only.
Table 2 Figures of merit of selected methods for determination of BAs
MethodLinear range/mg mL�1 LOD/mg mL�1
St
HPLC 0.1–130 0.051 (histamine) 1
CE 0.11–11.1 0.017 (histamine) 4GC-MS 10–100 mg g�1 5 mg g�1 (histamine) 4TLC 1–50 1 (histamine) 1Enzyme sensor array 2–40 2 (histamine) 2
Screen-printed electrodebiosensors with enzymes
0.022–0.178 0.020 (histamine) �
Sensing plate 0.20–60 0.16 (histamine) 19
4496 | Analyst, 2011, 136, 4492–4499
When Py-1 is embedded in the layer of Hypan polymer in the
sensing microplate, the effect of potential interferents is of low
significance. The fluorescence of a sample containing 50 mg
mL�1 of histamine (his) and an interferent was monitored each 5
min for 30 min. The effect of diethylamine (DEA), triethylamine
(TEA), cysteine and ammonia at concentrations of 0.1 and 1 mg
mL�1, respectively, in the presence of his is shown in Fig. 4. In
the presence of low concentrations of interferent, almost no
effect on the luminescence of his is found after the recom-
mended incubation time of 10 min. At longer incubation times,
amplingime Comments Ref.
00 min 70 min for derivatization, 30 min for baselineseparation of BAs
18
5 min 30 min for derivatization, 15 min for analysis 195 min 20 min for derivatization, 25 min for analysis 2050 min 120 min for derivatization, 30 min for analysis 213 min Excluding time required for statistical data
analysis22
5 min Preparation of biosensor requires >3 h 23
2 min for6 samples
96 samples (one sensing plate) require 10 minincubation and 2 min for data readout
—
This journal is ª The Royal Society of Chemistry 2011
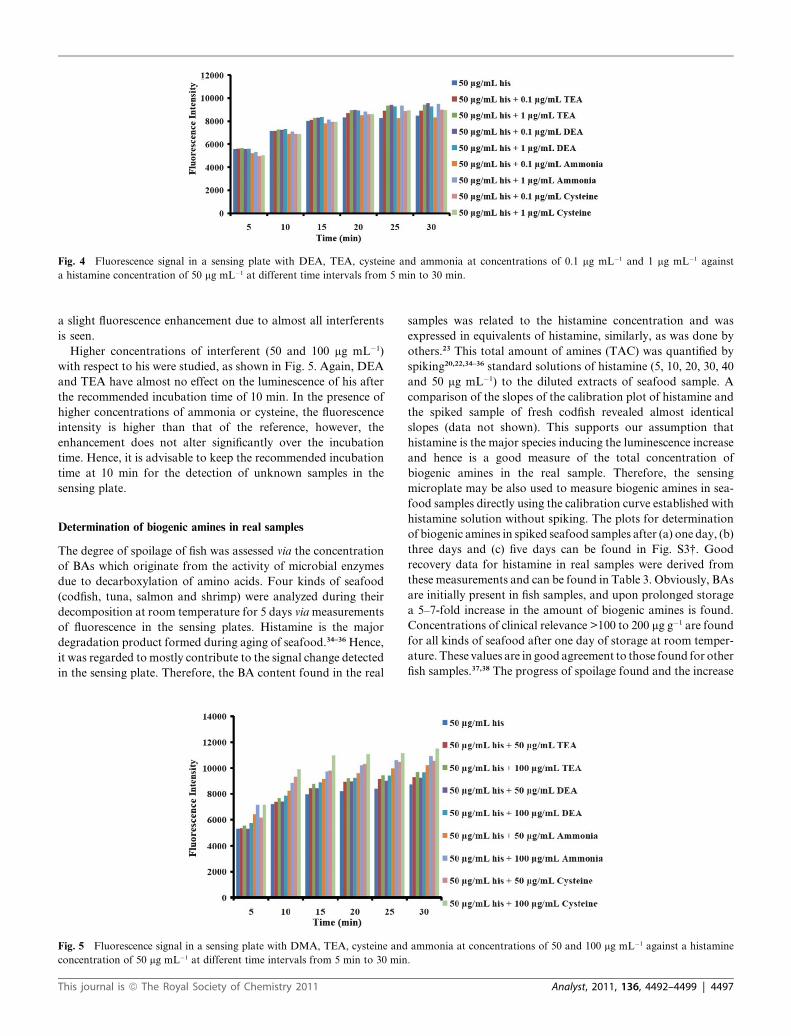
Fig. 4 Fluorescence signal in a sensing plate with DEA, TEA, cysteine and ammonia at concentrations of 0.1 mg mL�1 and 1 mg mL�1 against
a histamine concentration of 50 mg mL�1 at different time intervals from 5 min to 30 min.
a slight fluorescence enhancement due to almost all interferents
is seen.
Higher concentrations of interferent (50 and 100 mg mL�1)
with respect to his were studied, as shown in Fig. 5. Again, DEA
and TEA have almost no effect on the luminescence of his after
the recommended incubation time of 10 min. In the presence of
higher concentrations of ammonia or cysteine, the fluorescence
intensity is higher than that of the reference, however, the
enhancement does not alter significantly over the incubation
time. Hence, it is advisable to keep the recommended incubation
time at 10 min for the detection of unknown samples in the
sensing plate.
Determination of biogenic amines in real samples
The degree of spoilage of fish was assessed via the concentration
of BAs which originate from the activity of microbial enzymes
due to decarboxylation of amino acids. Four kinds of seafood
(codfish, tuna, salmon and shrimp) were analyzed during their
decomposition at room temperature for 5 days viameasurements
of fluorescence in the sensing plates. Histamine is the major
degradation product formed during aging of seafood.34–36 Hence,
it was regarded to mostly contribute to the signal change detected
in the sensing plate. Therefore, the BA content found in the real
Fig. 5 Fluorescence signal in a sensing plate with DMA, TEA, cysteine and
concentration of 50 mg mL�1 at different time intervals from 5 min to 30 min
This journal is ª The Royal Society of Chemistry 2011
samples was related to the histamine concentration and was
expressed in equivalents of histamine, similarly, as was done by
others.23 This total amount of amines (TAC) was quantified by
spiking20,22,34–36 standard solutions of histamine (5, 10, 20, 30, 40
and 50 mg mL�1) to the diluted extracts of seafood sample. A
comparison of the slopes of the calibration plot of histamine and
the spiked sample of fresh codfish revealed almost identical
slopes (data not shown). This supports our assumption that
histamine is the major species inducing the luminescence increase
and hence is a good measure of the total concentration of
biogenic amines in the real sample. Therefore, the sensing
microplate may be also used to measure biogenic amines in sea-
food samples directly using the calibration curve established with
histamine solution without spiking. The plots for determination
of biogenic amines in spiked seafood samples after (a) one day, (b)
three days and (c) five days can be found in Fig. S3†. Good
recovery data for histamine in real samples were derived from
these measurements and can be found in Table 3. Obviously, BAs
are initially present in fish samples, and upon prolonged storage
a 5–7-fold increase in the amount of biogenic amines is found.
Concentrations of clinical relevance >100 to 200 mg g�1 are found
for all kinds of seafood after one day of storage at room temper-
ature. These values are in good agreement to those found for other
fish samples.37,38 The progress of spoilage found and the increase
ammonia at concentrations of 50 and 100 mg mL�1 against a histamine
.
Analyst, 2011, 136, 4492–4499 | 4497
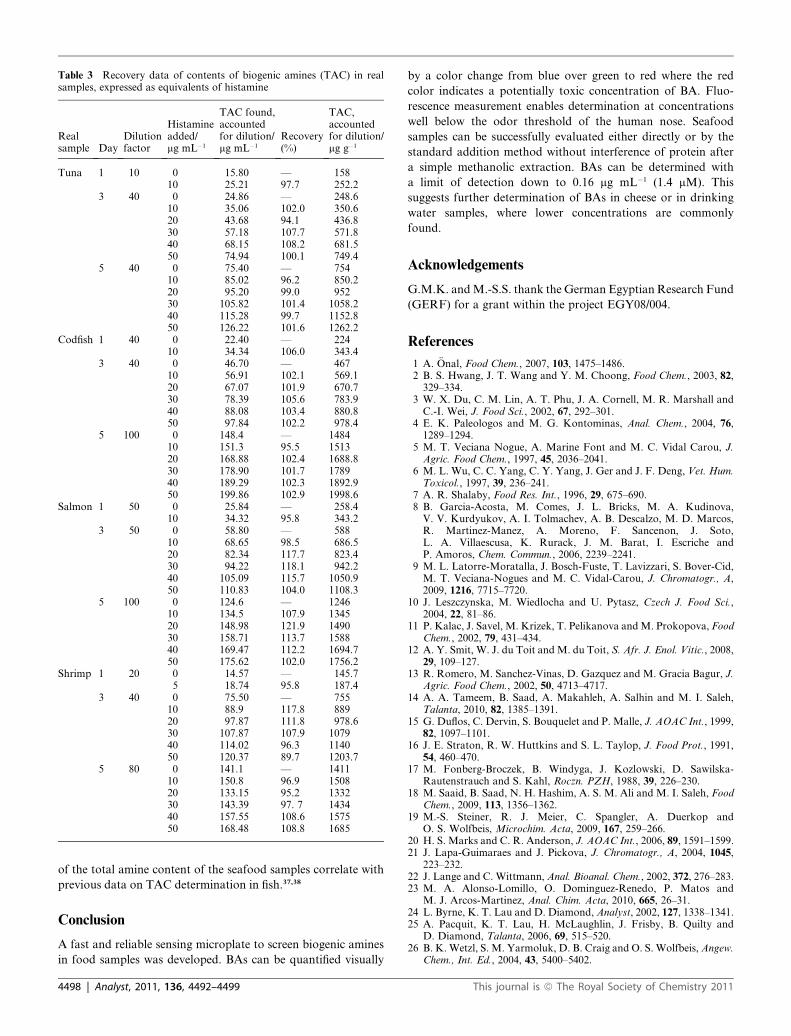
Table 3 Recovery data of contents of biogenic amines (TAC) in realsamples, expressed as equivalents of histamine
Realsample Day
Dilutionfactor
Histamineadded/mg mL�1
TAC found,accountedfor dilution/mg mL�1
Recovery(%)
TAC,accountedfor dilution/mg g�1
Tuna 1 10 0 15.80 — 15810 25.21 97.7 252.2
3 40 0 24.86 — 248.610 35.06 102.0 350.620 43.68 94.1 436.830 57.18 107.7 571.840 68.15 108.2 681.550 74.94 100.1 749.4
5 40 0 75.40 — 75410 85.02 96.2 850.220 95.20 99.0 95230 105.82 101.4 1058.240 115.28 99.7 1152.850 126.22 101.6 1262.2
Codfish 1 40 0 22.40 — 22410 34.34 106.0 343.4
3 40 0 46.70 — 46710 56.91 102.1 569.120 67.07 101.9 670.730 78.39 105.6 783.940 88.08 103.4 880.850 97.84 102.2 978.4
5 100 0 148.4 — 148410 151.3 95.5 151320 168.88 102.4 1688.830 178.90 101.7 178940 189.29 102.3 1892.950 199.86 102.9 1998.6
Salmon 1 50 0 25.84 — 258.410 34.32 95.8 343.2
3 50 0 58.80 — 58810 68.65 98.5 686.520 82.34 117.7 823.430 94.22 118.1 942.240 105.09 115.7 1050.950 110.83 104.0 1108.3
5 100 0 124.6 — 124610 134.5 107.9 134520 148.98 121.9 149030 158.71 113.7 158840 169.47 112.2 1694.750 175.62 102.0 1756.2
Shrimp 1 20 0 14.57 — 145.75 18.74 95.8 187.4
3 40 0 75.50 — 75510 88.9 117.8 88920 97.87 111.8 978.630 107.87 107.9 107940 114.02 96.3 114050 120.37 89.7 1203.7
5 80 0 141.1 — 141110 150.8 96.9 150820 133.15 95.2 133230 143.39 97. 7 143440 157.55 108.6 157550 168.48 108.8 1685
of the total amine content of the seafood samples correlate with
previous data on TAC determination in fish.37,38
Conclusion
A fast and reliable sensing microplate to screen biogenic amines
in food samples was developed. BAs can be quantified visually
4498 | Analyst, 2011, 136, 4492–4499
by a color change from blue over green to red where the red
color indicates a potentially toxic concentration of BA. Fluo-
rescence measurement enables determination at concentrations
well below the odor threshold of the human nose. Seafood
samples can be successfully evaluated either directly or by the
standard addition method without interference of protein after
a simple methanolic extraction. BAs can be determined with
a limit of detection down to 0.16 mg mL�1 (1.4 mM). This
suggests further determination of BAs in cheese or in drinking
water samples, where lower concentrations are commonly
found.
Acknowledgements
G.M.K. andM.-S.S. thank the German Egyptian Research Fund
(GERF) for a grant within the project EGY08/004.
References
1 A. €Onal, Food Chem., 2007, 103, 1475–1486.2 B. S. Hwang, J. T. Wang and Y. M. Choong, Food Chem., 2003, 82,329–334.
3 W. X. Du, C. M. Lin, A. T. Phu, J. A. Cornell, M. R. Marshall andC.-I. Wei, J. Food Sci., 2002, 67, 292–301.
4 E. K. Paleologos and M. G. Kontominas, Anal. Chem., 2004, 76,1289–1294.
5 M. T. Veciana Nogue, A. Marine Font and M. C. Vidal Carou, J.Agric. Food Chem., 1997, 45, 2036–2041.
6 M. L. Wu, C. C. Yang, C. Y. Yang, J. Ger and J. F. Deng, Vet. Hum.Toxicol., 1997, 39, 236–241.
7 A. R. Shalaby, Food Res. Int., 1996, 29, 675–690.8 B. Garcia-Acosta, M. Comes, J. L. Bricks, M. A. Kudinova,V. V. Kurdyukov, A. I. Tolmachev, A. B. Descalzo, M. D. Marcos,R. Martinez-Manez, A. Moreno, F. Sancenon, J. Soto,L. A. Villaescusa, K. Rurack, J. M. Barat, I. Escriche andP. Amoros, Chem. Commun., 2006, 2239–2241.
9 M. L. Latorre-Moratalla, J. Bosch-Fuste, T. Lavizzari, S. Bover-Cid,M. T. Veciana-Nogues and M. C. Vidal-Carou, J. Chromatogr., A,2009, 1216, 7715–7720.
10 J. Leszczynska, M. Wiedlocha and U. Pytasz, Czech J. Food Sci.,2004, 22, 81–86.
11 P. Kalac, J. Savel, M. Krizek, T. Pelikanova andM. Prokopova, FoodChem., 2002, 79, 431–434.
12 A. Y. Smit, W. J. du Toit andM. du Toit, S. Afr. J. Enol. Vitic., 2008,29, 109–127.
13 R. Romero, M. Sanchez-Vinas, D. Gazquez and M. Gracia Bagur, J.Agric. Food Chem., 2002, 50, 4713–4717.
14 A. A. Tameem, B. Saad, A. Makahleh, A. Salhin and M. I. Saleh,Talanta, 2010, 82, 1385–1391.
15 G. Duflos, C. Dervin, S. Bouquelet and P. Malle, J. AOAC Int., 1999,82, 1097–1101.
16 J. E. Straton, R. W. Huttkins and S. L. Taylop, J. Food Prot., 1991,54, 460–470.
17 M. Fonberg-Broczek, B. Windyga, J. Kozlowski, D. Sawilska-Rautenstrauch and S. Kahl, Roczn. PZH, 1988, 39, 226–230.
18 M. Saaid, B. Saad, N. H. Hashim, A. S. M. Ali and M. I. Saleh, FoodChem., 2009, 113, 1356–1362.
19 M.-S. Steiner, R. J. Meier, C. Spangler, A. Duerkop andO. S. Wolfbeis, Microchim. Acta, 2009, 167, 259–266.
20 H. S. Marks and C. R. Anderson, J. AOAC Int., 2006, 89, 1591–1599.21 J. Lapa-Guimaraes and J. Pickova, J. Chromatogr., A, 2004, 1045,
223–232.22 J. Lange and C. Wittmann, Anal. Bioanal. Chem., 2002, 372, 276–283.23 M. A. Alonso-Lomillo, O. Dominguez-Renedo, P. Matos and
M. J. Arcos-Martinez, Anal. Chim. Acta, 2010, 665, 26–31.24 L. Byrne, K. T. Lau and D. Diamond, Analyst, 2002, 127, 1338–1341.25 A. Pacquit, K. T. Lau, H. McLaughlin, J. Frisby, B. Quilty and
D. Diamond, Talanta, 2006, 69, 515–520.26 B. K. Wetzl, S. M. Yarmoluk, D. B. Craig and O. S. Wolfbeis,Angew.
Chem., Int. Ed., 2004, 43, 5400–5402.
This journal is ª The Royal Society of Chemistry 2011
27 D. B. Craig, B. K. Wetzl, A. D€urkop and O. S. Wolfbeis,Electrophoresis, 2005, 26, 2208–2213.
28 R. J. Meier, M.-S. Steiner, A. Duerkop and O. S. Wolfbeis, Anal.Chem., 2008, 80, 6274–6279.
29 C. den Brinker, C. Rayner and M. Kerr, J. AOAC Int., 1990, 73, 876–877.
30 L. S. Moret and S. Conte, J. Chromatogr., A, 1996, 729, 363–369.
31 AOAC, Official Methods of Analysis, AOAC, Washington, 16th edn,1995, (Method 35.1.32).
32 A. V. Stoy, J. Biomater. Appl., 1998, 3, 552–604.
This journal is ª The Royal Society of Chemistry 2011
33 T. L. Nelson, I. Tran, T. G. Ingallinera, M. S. Maynor andJ. J. Lavigne, Analyst, 2007, 132, 1024–1030.
34 M.-S. Steiner, R. J. Meier, A. Duerkop and O. S. Wolfbeis, Anal.Chem., 2010, 82, 8402–8405.
35 M. S. Maynor, T. L. Nelson, C. O’Sullivan and J. J. Lavigne, Org.Lett., 2007, 9, 3217–3220.
36 D.-F. Hwang, S.-H. Chang, C.-Y. Shiau and C.-C. Cheng, J. FoodSci., 1995, 60, 926–928.
37 M. Niculescu, C. Nistor, I. Fr�ebort, P. Pe�c, B. Mattiasson andE. Cs€oregi, Anal. Chem., 2000, 72, 1591–1597.
38 G.C.ChemnitiusandU.Bilitewski,Sens.Actuators,B, 1996,32, 107–113.
Analyst, 2011, 136, 4492–4499 | 4499
Copyright © 2022 FDOKUMEN