Impact of seafood and fruit consumption on bone mineral density
11
Maturitas 56 (2007) 1–11 Impact of seafood and fruit consumption on bone mineral density Pierre A. Zalloua a,b , Yi-Hsiang Hsu a , Henry Terwedow a , Tonghua Zang c , Di Wu c , Genfu Tang c , Zhiping Li c , Xiumei Hong d , Sami T. Azar b , Binyan Wang e , Mary L. Bouxsein f , Joseph Brain g , Steven R. Cummings h , Clifford J. Rosen i , Xiping Xu c,j,∗ a Program for Population Genetics, Harvard School of Public Health, Boston, MA, USA b American University of Beirut, Department of Internal Medicine, Beirut, Lebanon c Anhui Medical University, Institute of Medicine, Anhui, China d Life Science School, University of Science and Technology of China, Anhui, China e Children’s Health Research Center, Children’s Memorial Hospital, Chicago, IL, USA f Beth Israel Deaconess Medical Center, Boston, MA, USA g Department of Environmental Health, Harvard School of Public Health, Boston, MA, USA h San Francisco Coordinating Center, University of California, San Francisco, CA, USA i Maine Center for Osteoporosis Research and Education, St. Joseph Hospital, Bangor, ME, USA j Center for Population Genetics, Division of Epidemiology and Biostatistics, School of Public Health M/C 923,University of Illinois at Chicago, 1603 W Taylor, #978B, Chicago, IL, USA Received 11 May 2005; received in revised form 26 April 2006; accepted 9 May 2006 Abstract Objectives: Over the past decade, dietary choices and nutrition have proven to be major modulators of bone mineral density (BMD) in men and women. We investigated environmental determinants, specifically dietary habits, of BMD by using multiple regression models in a rural Chinese population. Methods: BMDs were measured at the hip and total body in 5848 men and 6207 women, aged 25–64. Dietary and supplemental intakes were assessed by a simple, one-page questionnaire tailored to collect nutritional information from large rural populations. Another questionnaire was used to collect information on the subjects’ age, disease history, smoking, alcohol consumption, physical activity as well as women’s menstrual status and reproductive history. Multiple regression models were used to assess the relationships among dietary variables and BMD, after adjusting for age, BMI (body mass index), weight, occupation, smoking status, and alcohol consumption. Results: Increasing seafood consumption was significantly associated with greater BMD in women (p < 0.001), especially those consuming more than 250 g per week of seafood. One thousand and three hundred and twenty-four men and 1479 women consumed >250 g of fruit per week. Higher fruit intake was found to be significantly associated with higher BMD in both sexes (p <0.05). High vegetable consumption, however, did not positively impact BMD. ∗ Corresponding author. Tel.: +1 312 4133667; fax: +1 312 9960064. E-mail address: [email protected] (X. Xu). 0378-5122/$ – see front matter © 2006 Elsevier Ireland Ltd. All rights reserved. doi:10.1016/j.maturitas.2006.05.001
Transcript of Impact of seafood and fruit consumption on bone mineral density

A
O(rMiAptsRcc(p
0d
Maturitas 56 (2007) 1–11
Impact of seafood and fruit consumption on bone mineral density
Pierre A. Zalloua a,b, Yi-Hsiang Hsu a, Henry Terwedow a, Tonghua Zang c, Di Wu c,Genfu Tang c, Zhiping Li c, Xiumei Hong d, Sami T. Azar b, Binyan Wang e,
Mary L. Bouxsein f, Joseph Brain g, Steven R. Cummings h,Clifford J. Rosen i, Xiping Xu c,j,∗
a Program for Population Genetics, Harvard School of Public Health, Boston, MA, USAb American University of Beirut, Department of Internal Medicine, Beirut, Lebanon
c Anhui Medical University, Institute of Medicine, Anhui, Chinad Life Science School, University of Science and Technology of China, Anhui, China
e Children’s Health Research Center, Children’s Memorial Hospital, Chicago, IL, USAf Beth Israel Deaconess Medical Center, Boston, MA, USA
g Department of Environmental Health, Harvard School of Public Health, Boston, MA, USAh San Francisco Coordinating Center, University of California, San Francisco, CA, USA
i Maine Center for Osteoporosis Research and Education, St. Joseph Hospital, Bangor, ME, USAj Center for Population Genetics, Division of Epidemiology and Biostatistics,
School of Public Health M/C 923,University of Illinois at Chicago, 1603 W Taylor, #978B, Chicago, IL, USA
Received 11 May 2005; received in revised form 26 April 2006; accepted 9 May 2006
bstract
bjectives: Over the past decade, dietary choices and nutrition have proven to be major modulators of bone mineral densityBMD) in men and women. We investigated environmental determinants, specifically dietary habits, of BMD by using multipleegression models in a rural Chinese population.
ethods: BMDs were measured at the hip and total body in 5848 men and 6207 women, aged 25–64. Dietary and supplementalntakes were assessed by a simple, one-page questionnaire tailored to collect nutritional information from large rural populations.nother questionnaire was used to collect information on the subjects’ age, disease history, smoking, alcohol consumption,hysical activity as well as women’s menstrual status and reproductive history. Multiple regression models were used to assesshe relationships among dietary variables and BMD, after adjusting for age, BMI (body mass index), weight, occupation, smokingtatus, and alcohol consumption.esults: Increasing seafood consumption was significantly associated with greater BMD in women (p < 0.001), especially those
onsuming more than 250 g per week of seafood. One thousand and three hundred and twenty-four men and 1479 womenonsumed >250 g of fruit per week. Higher fruit intake was found to be significantly associated with higher BMD in both sexes< 0.05). High vegetable consumption, however, did not positively impact BMD.
∗ Corresponding author. Tel.: +1 312 4133667; fax: +1 312 9960064.E-mail address: [email protected] (X. Xu).
378-5122/$ – see front matter © 2006 Elsevier Ireland Ltd. All rights reserved.oi:10.1016/j.maturitas.2006.05.001

2
CiBp©
K
1
oamrpioipmspdouB
brppicVsap
tbym[m[c
P.A. Zalloua et al. / Maturitas 56 (2007) 1–11
onclusions: This study with its large population size has identified preventive measures, as well as some risk factors, involvedn bone loss and osteoporosis. Our results highlight the importance of several dietary variables as significant determinants of
MD. It also emphasizes the role of dietary intake in general and shows that specific foods, such as fruits and seafood, canositively impact BMD.2006 Elsevier Ireland Ltd. All rights reserved.
od
od
ushossmtataow
ionsabobr
2
2
wr
eywords: BMD; Fruit; Menopause; Nutrition; Osteoporosis; Seafo
. Introduction
Osteoporosis is a major cause of disability through-ut the world. It is estimated that 10 million Americansre currently affected with this disorder and another 18illion have low bone mass, placing them at future
isk [1]. There is now evidence indicating that osteo-orosis has quietly become an epidemic in China withts aging population. According to a recent surveyf 5593 people aged above 40 years in five admin-strative areas in China, it was found that the totalrevalence rate of osteoporosis was 16.1%, 11.5% forales and 19.9% for females [2]. Bone mineral den-
ity (BMD) is an important predictor of fracture. Aatient with BMD that is reduced by ≥2.5 standardeviations below peak bone mass is considered to havesteoporosis [3]. Strong efforts have been recentlyndertaken to understand the factors that influenceMD.
It is well known that genetic factors influence peakone mass, but many environmental factors also play aole in altering genetic effects [4–7]. Proper nutritionlays a role in the prevention and treatment of osteo-orosis. One of the most important nutritional factorsn prevention of osteoporosis is adequate intake of cal-ium and Vitamin D [8]. In addition to calcium anditamin D, inadequate intake of phosphorus, magne-
ium, fluoride, boron, vitamins (K, C, B6), potassium,nd protein has been linked to a predisposition to osteo-orosis [9–11].
Several studies suggest that dietary habits and nutri-ion play a crucial role in modulating BMD. It is plausi-le that prevention of bone loss through diet is possible,et it involves many nutrients and food components likeilk, fruits, vegetables, meat, sea food and shellfish
12–14]. Also of interest, is the effect of nutrients likeinerals, vitamins and macronutrients on bone status
15]. Most studies to date have focused on the effect ofalcium and Vitamin D on bone health [16], neglecting
wooG
ther important nutrients that may be crucial to boneevelopment and maintenance of BMD.
Foods and food components, including dairy prod-cts, fruits and vegetables, dietary fibers, mineral water,oy products, carbonated beverages, caffeine and alco-ol have only recently been investigated [17]. In a studyf 907 elderly men and women from the Framinghamtudy, Tucker et al. [18] demonstrated that both potas-ium and magnesium intake significantly contribute toaintenance of BMD. From their food frequency ques-
ionnaires and content estimates of dietary source, theuthors determined that the major sources of these elec-rolytes were fruits, vegetables and whole grain. Theuthors also report that increased intake (servings/day)f fruits and vegetables, especially in men, is associatedith diminished decline in BMD.Results from many studies evaluating the dietary
mpact on bone health [15,19,20], remain inconclusiver even contradictory. What is clear, however, is thatutrients and food constituents interact to affect bonetatus. This study, with its large population size, aimst identifying some dietary factors that may influenceone loss and osteoporosis. This study also aims at rec-mmending preventive measures that might improveone health in a population where the use of hormoneeplacement therapy is not practiced.
. Material and methods
.1. Subjects
A total of 12,055 individuals (5848 men and 6207omen) were included in this study. Subjects were
ecruited from October 2003 to January 2004. Subjects
ere composed of four major groups; Group I consistedf ≤45-year-old men, Group II consisted of >45-year-ld men, Group III of premenopausal women and,roup IV consisted of postmenopausal women. This
Maturi
sp[cimtmwr
CHCia
2
ALtadashs(b
2
etfswmldw
2
d
imDahsacdow
2
llofwadmdnod1
2
opfasaaTcctW
P.A. Zalloua et al. /
tudy is part of an ongoing community-based osteo-orosis project conducted in Anhui Province, China31]. Men and women aged 25–64 years old, whoome from families with a minimum of three partic-pating siblings were considered eligible for recruit-
ent. Participants with a documented medical condi-ion, i.e. type 1 diabetes, end stage renal disease, cancer,
etabolic bone disease, chronic pathogenic infections,ere excluded from the study. Women who could not
ule out pregnancy were also excluded.This study was approved by the Human Subjects
ommittee (the institutional review board, IRB) of thearvard School of Public Health and by the Ethicsommittee of Anhui Medical University. A written
nformed consent was carefully explained to, read to/bynd signed by each participant.
.2. BMD measurement
Dual-energy X-ray absorptiometry (DXA) (Prodigydvance Bone Densitometer, GE Medical SystemsUNAR) was used to measure the bone mineral con-
ent (g) and the area BMD (g/cm2) through whole bodynd total hip scans. All BMD measurements were con-ucted in a single study center. Daily calibration withphantom was performed. We randomly selected 71
ubjects for re-measurements at whole body and totalip. The maximum interval between the two DXA mea-urements was 30 days. The coefficient of variabilityCV%) of the reproducibility is 1.34 and 2.05 at wholeody and total hip, respectively.
.3. Anthropometry
Each participant underwent a general physicalxamination performed by a trained clinician. Duringhe examination, height, weight, waist and hip circum-erences were measured and recorded. Height was mea-ured to the nearest 0.1 cm on a portable stand meter andeight to the nearest 0.1 kg with the subject standingotionless in the center of the scale. BMI was calcu-
ated as weight/height2 (kg/m2). Waist to hip ratio wasetermined by obtaining tape measurements around theaist and hips.
.4. Nutritional questionnaire
A nutritional questionnaire was used to collectata on each participant’s consumption of local food
itaB
tas 56 (2007) 1–11 3
tems/groups, such as milk, seafood, preserved food,eat (mainly pork), vegetables, fruits, and Vitaminsupplementation. This questionnaire was part of
much larger questionnaire that included personal,ealth, smoking, employment and reproductive historyections. Reported intake frequency of the dietary vari-bles was summed to obtain the total amount in gramsonsumed per week for each individual. Based on aietary information survey conducted prior to the studyn potential subjects the thresholds for nutrient intakeere assigned.
.5. Other covariates
A comprehensive questionnaire was used to col-ect each participant’s demographic, occupational andifestyle information, disease history, consumptionf alcohol and cigarette smoking, physical activity,racture history, and family history of fractures. Foromen, an additional reproductive questionnaire was
dministered to collect data on menstrual and repro-uctive history, including age at menarche, typicalenstrual cycle characteristics, history of menstrual
ysfunctions, age at menopause, number of preg-ancies, breast-feeding, as well as current and pastral contraceptive use. Postmenopausal women wereefined as women without menstruation for at least2 months.
.6. Statistical analysis
Since age, gender and menopause status are threef the most important predictors of bone mass, osteo-orosis and fractures, we reported analyses separatelyor these three variables. The SAS 8.2 software pack-ge (SAS Institute, Cary, NC) was used to perform alltatistical analyses. Analysis of variance test (ANOVA)nd χ2 tests were used to compare the base-line char-cteristics of the subjects among the four study groups.he Tukey test was also used to perform pairwise-omparisons among groups when there was signifi-ance for an ANOVA. χ2 test was used to comparehe dietary intake variables between men and women.
e then further divided subjects into quartiles accord-
ng to their total body BMD. We defined subjects inhe lowest quartile as the extreme low BMD group,nd subjects in the highest quartile as the extreme highMD group. Multivariate logistic regression models
4 Maturi
astlcwfs
3
3p
iw
pdiGckGfs
3
3
TB
V
AAB
B
V
CPAROH
*
tA
sR
l
P.A. Zalloua et al. /
djusted for age, weight, BMI, occupation, smokingtatus, and alcohol consumption were used to assesshe dietary determinants of extreme BMD. A log like-ihood ratio test was used to test the interaction amongovariates. Generalized estimating equation modelsere used to adjust for intraclass-correlation within
amily members. A p-value of less than 0.05 was con-idered significant.
. Results
.1. General characteristics of the study
opulationThere were a total of 2409 men in Group I and 3439n Group II. Four thousand and two hundred and sixteenomen were premenopausal (Group III) and 1991 were
aw1m
able 1MD and baseline characteristics of the study population stratified by gend
ariables Men
Age ≤ 45 (N = 2409) Age > 45 (N
[mean (S.D.)] [mean (S.D.
ge (years) 39.0 (3.77) 52.0 (4.63)ge range (years) 24.4–45.0 45.1–65.0MI (kg/m2)**** 21.60 (2.56)c 21.29 (2.48)
MD (g/cm2)Whole body* 1.14 (0.07)f 1.12 (0.07)Total hip* 0.99 (0.11)f 0.95 (0.12)
ariables Men
Age ≤ 45 (N = 2409) Age >
[number (%)] [num
igarette smokinga,**** 1802 (74.9)e 2821assive smokinga,**** 382 (15.9)c 1099lcohol consumptiona,**** 1029 (42.7)d 1612egular exercisea 21 (0.8) 23ccupation (farmer/worker)**** 2092 (87.0)e 3123eavy physical activityb,* 406 (16.8)d 645
p < 0.05; ***p < 0.001; ****p < 0.0001; compared the difference between Gest was used for categorical variables. Tukey test was used to perform the paNOVA test. χ2 test was used for categorical variables. p < 0.05 for pairwisa Cigarette smoking: current cigarette smoking defined as more than on
pouse or other close family members are current smokers. Alcohol consumpegular exercise: frequency of one or more times per week.b More than 5 h per day carrying (on back or shoulder), riding (bicycle o
ifting or moving a load with more than 20 kg.
tas 56 (2007) 1–11
ostmenopausal (Group IV). The mean age and stan-ard deviation in Group I were 39.0 ± 3.77, 52.0 ± 4.63n Group II, 41.3 ± 5.33 in Group III and 52.4 ± 4.88 inroup IV. The BMI and standard deviation were cal-
ulated for each of the four groups, and the mean ing/m2 was 21.60 ± 2.56 for Group I, 21.29 ± 2.48 forroup II, 22.36 ± 2.80 for Group III and 21.86 ± 2.87
or Group IV. Characteristics of the study sample areummarized in Table 1.
.2. Dietary variables
.2.1. Milk consumptionFive thousand and seven hundred and sixty men
nd 6127 women consumed ≤250 g of milk per weekhereas, 76 men and 62 women had between 250 and500 g of milk per week in their usual diet. Increasedilk consumption did not show a significant effect on
er, age and menopausal status
Women
= 3439) Premenopause(N = 4216)
Postmenopause(N = 1991)
)] [mean (S.D.)] [mean (S.D.)]
41.27 (5.33) 52.44 (4.88)26.0–59.0 37.0–67.0
d 22.36 (2.80)e 21.86 (2.87)c
e 1.10 (0.07)d 1.01 (0.08)c
e 0.96 (0.11)d 0.86 (0.12)c
Women
45 (N = 3439) Premenopause(N = 4216)
Postmenopause(N = 1991)
ber (%)] [number (%)] [number (%)]
(82.2)f 80 (1.9)c 110 (5.5)d
(32.0)d 3170 (75.3)e 1520 (76.6)e
(46.9)d 98 (2.3)c 69 (3.5)c
(1.1) 18 (0.4) 16 (0.8)(91.8)d 3900 (92.8)c 1863 (94.1)c
(18.7)c 838 (19.1)c 382 (19.9)c
roups I–IV. ANOVA test was used for continuous variables, and χ2
irwise-comparison among groups when there were significance fore-comparison if the letters (c,d,e,f) are different between groups.e pack per month. Passive smoking: non-cigarette smokers whosetion: current alcohol consumption of more than one drink per week.
r other man powered vehicle), dragging, hand-pulled cart, raising,
P.A. Zalloua et al. / Maturitas 56 (2007) 1–11 5
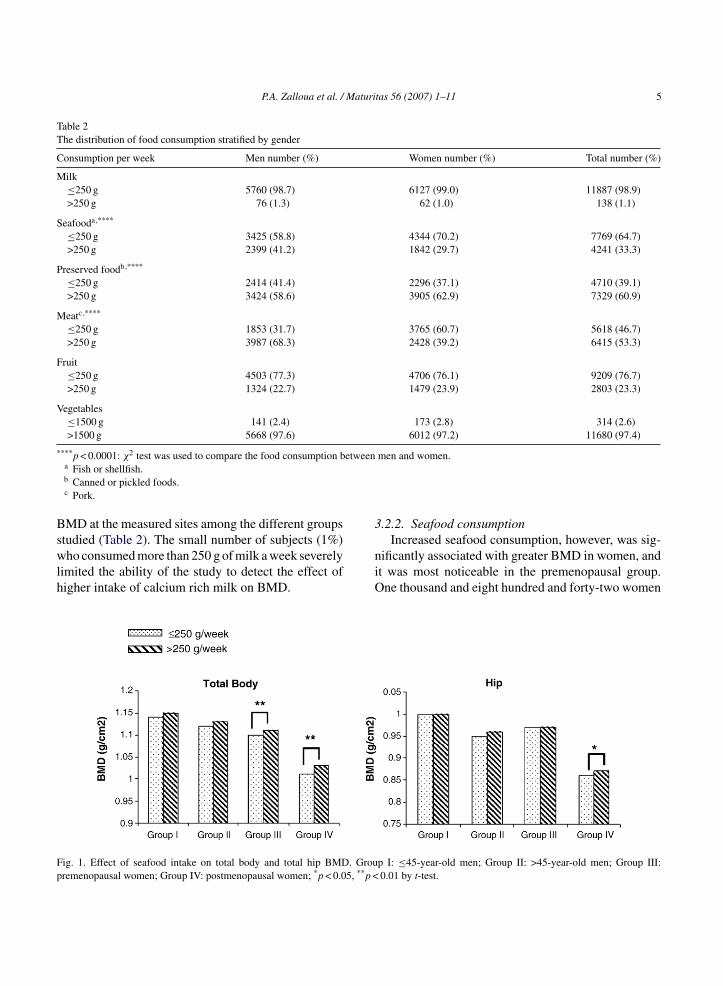
Table 2The distribution of food consumption stratified by gender
Consumption per week Men number (%) Women number (%) Total number (%)
Milk≤250 g 5760 (98.7) 6127 (99.0) 11887 (98.9)>250 g 76 (1.3) 62 (1.0) 138 (1.1)
Seafooda,****
≤250 g 3425 (58.8) 4344 (70.2) 7769 (64.7)>250 g 2399 (41.2) 1842 (29.7) 4241 (33.3)
Preserved foodb,****
≤250 g 2414 (41.4) 2296 (37.1) 4710 (39.1)>250 g 3424 (58.6) 3905 (62.9) 7329 (60.9)
Meatc,****
≤250 g 1853 (31.7) 3765 (60.7) 5618 (46.7)>250 g 3987 (68.3) 2428 (39.2) 6415 (53.3)
Fruit≤250 g 4503 (77.3) 4706 (76.1) 9209 (76.7)>250 g 1324 (22.7) 1479 (23.9) 2803 (23.3)
Vegetables≤1500 g 141 (2.4) 173 (2.8) 314 (2.6)>1500 g 5668 (97.6) 6012 (97.2) 11680 (97.4)
**** 2 etween
Bswlh
3
Fp
p < 0.0001: χ test was used to compare the food consumption ba Fish or shellfish.b Canned or pickled foods.c Pork.
MD at the measured sites among the different groups
tudied (Table 2). The small number of subjects (1%)ho consumed more than 250 g of milk a week severelyimited the ability of the study to detect the effect ofigher intake of calcium rich milk on BMD.
niO
ig. 1. Effect of seafood intake on total body and total hip BMD. Grouremenopausal women; Group IV: postmenopausal women; *p < 0.05, **p <
men and women.
.2.2. Seafood consumption
Increased seafood consumption, however, was sig-ificantly associated with greater BMD in women, andt was most noticeable in the premenopausal group.ne thousand and eight hundred and forty-two women
p I: ≤45-year-old men; Group II: >45-year-old men; Group III:0.01 by t-test.

6 P.A. Zalloua et al. / Maturitas 56 (2007) 1–11
Table 3The distribution and adjusted odds ratios (OR) of seafood and fruit consumption among subjects stratified by bottom (extreme low) and top(extreme high) quartiles of their total body BMD
Variables Seafood Fruit
≤250 g number (%) >250 g number (%) ≤250 g number (%) >250 g number (%)
Group IExtreme high BMD (≥1.191) 325 (54.5) 271 (45.5) 444 (74.6) 151 (25.4)Extreme low BMD (≤1.092) 373 (62.0) 228 (38.0) 462 (76.7) 140 (23.3)Adjusted OR (95% CI)a 1.0 0.83 (0.58–1.38) 1.0 0.89 (0.68–1.16)
Group IIExtreme high BMD (≥1.180) 482 (56.4) 373 (43.6) 634 (74.2) 221 (25.8)Extreme low BMD (≤1.070) 528 (61.7) 328 (38.3) 683 (80.1) 170 (19.9)Adjusted OR (95% CI) 1.0 0.90 (0.66–1.32) 1.0 0.78* (0.57–0.98)
Group IIIExtreme high BMD (≥1.153) 684 (65.6) 359 (34.4) 754 (72.2) 290 (27.8)Extreme low BMD (≤1.059) 773 (74.5) 265 (25.5) 788 (73.8) 280 (26.2)Adjusted OR (95% CI) 1.0 0.66*** (0.53–0.81) 1.0 0.81* (0.67–0.99)
Group IVExtreme high BMD (≥1.074) 329 (66.2) 168 (33.8) 373 (75.2) 123 (24.8)Extreme low BMD (≤0.960) 354 (70.7) 147 (29.3) 421 (83.9) 81 (16.1)Adjusted OR (95% CI) 1.0 0.87 (0.62–1.23) 1.0 0.73* (0.53–0.92)
*p < 0.05; ***p < 0.001.a Adjusted OR is equal to 1 as the reference group. The OR is adjusted for age, weight, BMI, smoking status, alcohol consumption and
occupation.
wdFa
sGwaoyib3pb7spO(
3
swfwUGw
absqjti
ho had more than 250 g per week of seafood in theiriet showed an improvement in their total body BMD.ig. 1 shows the effect of seafood intake on total bodynd hip BMDs.
Further, we determined the odds ratio (OR) foreafood consumption on total body BMD acrossroups I–IV (Table 3). The OR was adjusted for age,eight, BMI, smoking status, alcohol consumption,
nd occupation. BMD was stratified into quartiles, withnly the bottom and top quartiles being used in the anal-sis. For premenopausal women, the number of partic-pants with higher seafood consumption (>250 g) in theottom and the top BMD quartiles was 265 (25.5%) and59 (34.4%), respectively; and the number of partici-ants with lower seafood consumption (≤250 g) in theottom and the top quartiles of the total body BMD was73 (74.5%) and 684 (65.6%), respectively. When the
ubjects with higher seafood consumption were com-ared to those with lower seafood consumption, theR of having the BMD at lowest quartile was 0.66p < 0.001).
0r
o
.2.3. Fruits and vegetable consumptionIn the study groups, 4503 men and 4706 women con-
umed ≤250 g of fruit per week, 1324 men and 1479omen consumed >250 g of fruit per week. Higher
ruit intake was found to be significantly associatedith higher total body BMD in both sexes (Fig. 2).nexpectedly men with lower consumption of fruits inroup I had significantly higher hip BMD than subjectsith higher fruit consumption.As with seafood consumption, we determined the
djusted odds ratio (OR) for fruit consumption on totalody BMD across Groups I–IV (Table 3). BMD wastratified into quartiles, with only the bottom and topuartiles being used in the analysis. When the sub-ects with higher fruit consumption were compared tohose with lower fruit consumption, the ORs of hav-ng the BMD at lowest quartile were 0.78 (p < 0.05),
.81 (p < 0.05), and 0.73 (p < 0.05) for Groups II–IV,espectively.In 5668 men and 6012 women consuming >1500 gf vegetables per week, higher vegetable intake did

P.A. Zalloua et al. / Maturitas 56 (2007) 1–11 7
F : ≤45-yw
nB
3
wtst
3
os
3
stw
3
s
TRq
F
S
G
G
*
ig. 2. Effect of fruit intake on total body and total hip BMD. Group Iomen; Group IV: postmenopausal women; *p < 0.05 by t-test.
ot seem to have a detectable statistical impact onMD.
.2.4. Preserved food consumptionTwo thousand and two hundred and ninety-six
omen and 2414 men had ≤250 g of preserved food inheir weekly diet. It as surprising to see that higher con-umption of the salt rich preserved food did not seemo have any effect on BMD.
.2.5. Meat consumptionIncreased pork intake did not affect BMD in women
r men. Table 2 shows the distribution of food con-umption in both men and women.
ccca
able 4elative odds of being in bottom quartile (extreme low BMD) by low or higuartiles of BMD
ood consumption N % of extreme low BMD
eafood Fruit
roup III (premenopausal)Low Low 1212 53.8Low High 240 48.8High Low 325 40.9High High 297 44.1
roup IV (postmenopausal)Low Low 590 54.1Low High 91 37.4High Low 200 49.5High High 113 41.6
p < 0.05; ***p < 0.001; ****p < 0.0001.a Models adjusted for age, weight, BMI, smoking status, alcohol consump
ear-old men; Group II: >45-year-old men; Group III: premenopausal
.2.6. Vitamin D supplementationWe failed to show association between Vitamin D
upplementation and greater BMD, but this may be dueo the relatively small number (<1%) of participantsho took Vitamin D supplementation.
.3. Multiple variable analysis
We further tested the multiple impact on BMD ofeafood and fruit consumption. There was a signifi-
antly positive correlation between seafood and fruitonsumption between the Groups. The Spearman’sorrelation coefficients between seafood consumptionnd fruit intake for Groups I–IV were 0.2438, 0.2457,h consumption of seafood and fruit in women in the top and bottom
Crude Adjusteda
OR 95% CI OR 95% CI
Referent Referent0.82 0.62–1.08 0.78 0.57–1.070.58**** 0.46–0.76 0.59**** 0.45–0.780.69* 0.53–0.88 0.68*** 0.51–0.91
Referent Referent0.51* 0.32–0.80 0.49* 0.27–0.870.83 0.60–1.15 0.73 0.49–1.110.60* 0.40–0.91 0.88* 0.52–0.98
tion and occupation.

8 Maturi
0jf
apcuBwfbttcihm0Bchpc(
co
4
dacop
tlbsct
ai
tmalrsamow
dwa(dVdatlTtitfiaswto
phcnTciocr6
P.A. Zalloua et al. /
.2916, and 0.3348, respectively (data not shown). Sub-ects with higher seafood consumption consumed moreruit.
Table 4 shows the combinatorial effect of seafoodnd fruit consumption on total body BMD. The multi-le regression models adjusted for age, weight, BMI,igarette smoking, alcohol intake, and occupation weresed. Among women in the top and bottom quartiles ofMD within strata of menopausal status, we assignedomen to four groups based on low or high seafood and
ruit consumption. In Group III, the odds of being in theottom quartile of BMD (extreme low BMD) relativeo subjects with low seafood and low fruit consump-ion was lower in those with high seafood and low fruitonsumption (Odds ratio (OR): 0.59; 95% confidencenterval (CI): 0.45, 0.78; p < 0.0001) and those withigh seafood and high fruit consumption after adjust-ent for important covariates (OR: 0.68; 95% CI: 0.51,
.91; p < 0.001). In Group IV, the odds of extreme lowMD relative to subjects with low seafood and low fruitonsumption was lower in those with low seafood andigh fruit consumption (OR: 0.49; 95% CI: 0.27, 0.87;< 0.05) and those with high seafood and high fruitonsumption after adjustment for important covariatesOR: 0.88; 95% CI: 0.52, 0.98; p < 0.001).
These results support the earlier observation that theonsumption of fruit and seafood has a positive effectn BMD.
. Discussion
Dietary choices and nutrition have proven in the lastecade to be major modulators of BMD in both mennd women [10]. The identification of some dietaryomponents that may directly affect BMD has becomef great importance, especially with an aging worldopulation.
A unique feature to our study is that it evaluateshe effect of different food types on bone status in aarge population sample, thus permitting stratificationy gender and menopausal status. In contrast, othertudies focused on the effect of specific nutrients likealcium, Vitamin D, magnesium, phosphorous, pro-
ein, Vitamin A, Vitamin K and phytoestrogens.It is long established and well understood that milknd milk products are good sources of nutrients neededn growth and maintenance [16]. Dairy products are
osaa
tas 56 (2007) 1–11
he principal source of calcium. However, in our study,ilk intake and Vitamin D supplementation are notsignificant part of the regional diet of the popu-
ation studied as compared to the dairy and proteinich Western-style diet, and thus were not significantlyhown to positively impact BMD. We found that onlyvery small percentage of the study population (1.3%en and 1% women) consumed >250 g milk/week
r had Vitamin D supplements (0.6% men and 0.5%omen) as part of their diet.In the population studied, seafood was a large
ietary component and was significantly associatedith increased BMD in women. These results can be
ttributed to the high content of essential fatty acidEFA) present in fish and other seafood. Recent evi-ence has shown that similar to the lack of calcium anditamin D3, a deficiency in certain fatty acids in theiet may also contribute to bone loss [21–23]. EFAsre believed to enhance Vitamin D effects thus facili-ating calcium absorption from the gut, which in turneads to a reduction of calcium excretion in the urine.his process may result in increased calcium deposi-
ion in bone, enhanced synthesis of bone collagen and,mproved bone health [24]. Coetzer et al. showed thathe relative content of fish oil derived polyunsaturatedatty acids in the intestinal membranes may change flu-dity and increase calcium absorption by enhancing thection of Vitamin D3 [25]. Fernandes et al. found aignificant bone loss reduction in ovariectomized micehen placed on a fish oil (FO) rich diet. No such reduc-
ion was observed when similar mice were fed corn oilr casein rich diets [26].
The detailed mechanisms by which FO exerts itsrotective function are not yet fully understood. It is,owever, well established that FO decreases urinaryalcium loss. It has been hypothesized that FO rich in-3 fatty acids plays an important role is regulating-cell function and the synthesis of pro-inflammatoryytokines. Both of these effects are closely implicatedn osteoclastogenesis, as well as in the pathogenesis ofsteoporosis [26]. Sun et al. showed that dietary FOan prevent bone loss in ovariectomized mice by downegulating pro-inflammatory cytokine (TNF-� and IL-) synthesis. These cytokines increase the production
f prostaglandin E (PGE-2) by increasing the expres-ion of cyclo-oxygenase II (COX-II) in osteoblasticnd stromal cells. Elevated levels of PGE-2, as wells TNF-�, induce the expression of the receptor acti-
Maturi
vlmAbom
oaawdtrEnpit
atIiTcrpaElctsstftpBmsft
cy
mt[abidibp
mwiatfsdlphoitt
hyBetcmo
tbwncbpr
P.A. Zalloua et al. /
ator of NF-kB ligand (RANKL) and in turn stimu-ate the differentiation of osteoclast progenitors into
ature osteoclasts and may result in osteoporosis [27].nother mechanism by which n-3 fatty acid improvesone health is that it enhances the formation of nitricxide (NO), which plays an important role in boneetabolism [27].A deeper understanding of the mechanism of action
f EFA on calcium metabolism may offer novelpproaches to the management of osteoporosis as wells to the ectopic calcification that is often associatedith osteoporosis and seems to be responsible for manyeaths. This current study supports indirectly the pro-ective effects of EFA on bone. However, it also does notule out the positive effect on BMD of factors other thanFA that are present in seafood, like Vitamin D, sele-ium, iron and calcium. Furthermore, EFA is mainlyresent in oily fish and the current study with its lim-ted questionnaire does not differentiate between theypes of fish consumed.
Diets high in fruits and vegetables produce a morelkaline urine by contributing a variety of compoundshat accept hydrogen ions during metabolism [28,29].n our study there are significant associations betweenntake of fruits and BMD in both men and women.hese findings are compatible with several studies thatoncluded that potassium, magnesium, and Vitamin Cich fruits were associated with greater BMD [18]. Therotective effect of fruit intake was significantly notice-ble in the postmenopausal women group in our study.strogen deficiency has been hypothesized to cause
oss of tissue magnesium which in turn disrupts cal-ium metabolism [30]. It is worth noting here that whenaken alone, men ≤45 years (Group I) with lower con-umption of fruits had significantly higher BMD thanubjects with higher fruit consumption. One explana-ion is that the total body fat percentage (total bodyat/body weight) in these men was significantly lowerhan in men with higher fruit intake. The total body fatercentage was negatively associated with total bodyMD in our study population [31]. In addition, theajority (90.22%) of the men in Group I who con-
umed less fruit were in the occupational category ofarmer/worker, which correlated positively with higher
otal body BMD in our study population.Improved calcium balance, increased serum osteo-alcin concentrations, and decreased urinary hydrox-proline excretion have been documented when post-
ppfm
tas 56 (2007) 1–11 9
enopausal women were given potassium bicarbonateo neutralize endogenous acid loads from normal diets32]. Potassium plays a regulating role in calcium bal-nce and through this regulator effect may influenceone resorption. It is important that this potassium ben the form of an organic salt that metabolizes to carbonioxide with regard to neutralizing endogenous acid-ty that is generated from acid producing foods. Thisuffering effect of potassium may play a key role inrotecting the skeleton [13,33].
Magnesium also plays an essential role in calciumetabolism. It was shown that lower bone resorptionas associated with a higher intake of magnesium. It
s now believed that magnesium deficiency may because of osteoporosis. Low magnesium decreases
he activity of a skeletal ATPase that is responsibleor transporting potassium ions into the skeletal inter-titium in exchange for hydrogen ion extrusion. Thisecreased activity could result in pH imbalance, whicheads to enhanced bone resorption. These results sup-ort previous findings of the positive influence of aigh long-term consumption of alkaline-forming foodsn bone health in postmenopausal women. Fruit aremportant sources of potassium and magnesium andhis finding supports their potential role in the preven-ion of osteoporosis.
However, unlike several studies where vegetablesad also a positive effect on BMD [18], our anal-sis failed to document any such positive effect onMD. These results, while initially surprising may bexplained by the fact that unlike fruits, vegetables tendo be consumed cooked in Chinese diets. During theooking process, many nutrients and essential vita-ins that can positively influence BMD may be lost
r greatly reduced.Studying this rural Chinese population allowed for
he very first time the effect of pickled food on BMD toe investigated. Greater consumption of preserved foodas not associated with lower BMD. These results wereot expected since pickled foods are rich in sodiumontent (salt). Studies have shown that calciuria cane induced by salt. As a result of this physiologicalrocess, a diet rich in Na (salt) can be considered as aisk factor for osteoporosis [10,17,34]. Although unex-
ected, these results can be explained by the fact thatickled food do not constitute on their own a majorood source and are always consumed along with otherajor nutrients that may mask their effect on BMD. Our
1 Maturi
rsaa
aataiubpsrreppao
A
olWtBp
R
[
[
[
[
[
[
[
[
[
[
[
[
[
0 P.A. Zalloua et al. /
esults warrant further investigations on the relation-hip between salt intake and bone health that requiren in depth focus on reliable measures of salt intake,nd improved subject characterization.
Because the use of hormone replacement therapy asmanaging regiment for osteoporosis has been associ-ted with several undesirable effects, more studies onhe effects of foods and nutrients on bone metabolismre required. Because dietary habits vary widely, stud-es conducted on specific populations can be veryseful. As an example, studies on dietary effects onone metabolism may be particularly useful for theopulation studied, in the prevention of osteoporo-is and provide the added benefit of decreasing theeliance on drug therapy to prevent osteoporosis. Ouresults emphasize the role of dietary intake in gen-ral and show its impact on BMD in a rural Chineseopulation. This study with its large population sizeroves highly beneficial in identifying measures, suchs fruit and seafood intake, in preventing bone loss andsteoporosis.
cknowledgements
This study is supported by the National Institutesf Health, National Institute of Arthritis and Muscu-oskeletal and Skin Diseases, grant R01 AR 045651.
e are grateful for the assistance and cooperation ofhe faculty and staff of the Anhui Medical Universityiomedical Institute, and we thank all study partici-ants.
eferences
[1] Mitchell BD, Kammerer CM, Schneider JL, Perey R, BauerRL. Genetic and environmental determinants of bone mineraldensity in Mexican Americans: results from the San AntonioFamily Osteoporosis Study. Bone 2003;33:839–46.
[2] Li N, Ou P, Zhu H, Yang D, Zheng P. Prevalence rate of osteo-porosis in the mid-aged and elderly in selected parts of China.Chin Med J (Engl) 2002;115:773–5.
[3] Kanis JA, Melton III LJ, Christiansen C, Johnston CC, Khal-taev N. The diagnosis of osteoporosis. J Bone Miner Res
1994;9:1137–41.[4] Livshits G, Deng HW, Nguyen TV, Yakovenko K, Recker RR,Eisman JA. Genetics of bone mineral density: evidence for amajor pleiotropic effect from an intercontinental study. J BoneMiner Res 2004;19:914–23.
[
tas 56 (2007) 1–11
[5] Eisman JA. Genetics of osteoporosis. Endocr Rev 1999;20:788–804.
[6] Smith DM, Nance WE, Kang KW, Christian JC, Johnston JrCC. Genetic factors in determining bone mass. J Clin Invest1973;52:2800–8.
[7] Prentice A. The relative contribution of diet and genotype tobone development. Proc Nutr Soc 2001;60:45–52.
[8] Matkovic V, Fontana D, Tominac C, Goel P, Chesnut III CH.Factors that influence peak bone mass formation: a study ofcalcium balance and the inheritance of bone mass in adolescentfemales. Am J Clin Nutr 1990;52:878–88.
[9] Tranquilli AL, Lucino E, Garzetti GG, Romanini C. Calcium,phosphorous, and magnesium intakes correlate with bone min-eral content in postmenopausal women. Gynecol Endocrinol1994;8:55–8.
10] Prentice A. Diet, nutrition and the prevention of osteoporosis.Public Health Nutr 2004;7:227–43.
11] Grajeta H. Nutrition in prevention and treatment of osteoporo-sis. Przegl Lek 2003;60:649–53.
12] Kitchin B, Morgan S. Nutritional considerations in osteoporo-sis. Curr Opin Rhuematol 2003;15:476–80.
13] Macdonald HM, New SA, Golden MH, Campbell MK,Reid DM. Nutritional associations with bone loss during themenopausal transition: evidence of a beneficial effect of cal-cium, alcohol, and fruit and vegetable nutrients and of a detri-mental effect of fatty acids. Am J Clin Nutr 2004;79:155–65.
14] Angus RM, Sambrook PN, Pocock NA, Eisman JA. Dietaryintake and bone mineral density. Bone Miner 1988;4:265–77.
15] Masse PG, Dosy J, Tranchant CC, Dallaire R. Dietarymacro- and micronutrient intakes of nonsupplemented pre-and postmenopausal women with a perspective on menopause-associated diseases. J Hum Nutr Diet 2004;17:121–32.
16] Heaney RP. Calcium, dairy products and osteoporosis. J AmColl Nutr 2000;19:83S–99S.
17] Tucker KL. Dietary intake and bone status with aging. CurrPharm Des 2003;9:2687–704.
18] Tucker KL, Hannan MT, Chen H, Cupples LA, Wilson PW, KielDP. Potassium, magnesium, and fruit and vegetable intakes areassociated with greater bone mineral density in elderly men andwomen. Am J Clin Nutr 1999;69:727–36.
19] Bacon L, Stern JS, Keim NL, Van Loan MD. Low bone mass inpostmenopausal chronic dieting obese women. Eur J Clin Nutr2004;58:966–71.
20] Whiting SJ, Vatanparast H, Baxter-Jones A, Faulkner RA, Mir-wald R, Bailey DA. Factors that affect bone mineral accrual inthe adolescent growth spurt. J Nutr 2004;134:696S–700S.
21] Watkins BA, Lippman HE, Le Bouteiller L, Li Y, Seifert MF.Bioactive fatty acids: role in bone biology and bone cell func-tion. Prog Lipid Res 2001;40:125–48.
22] Albertazzi P, Coupland K. Polyunsaturated fatty acids. Is there
a role in postmenopausal osteoporosis prevention? Maturitas2002;42:13–22.23] Terano T. Effect of omega 3 polyunsaturated fatty acid ingestionon bone metabolism and osteoporosis. World Rev Nutr Diet2001;88:141–7.

Maturi
[
[
[
[
[
[
[
[
[
[
P.A. Zalloua et al. /
24] Kruger MC, Horrobin DF. Calcium metabolism, osteoporo-sis and essential fatty acids: a review. Prog Lipid Res1997;36:131–51.
25] Coetzer H, Claassen N, van Papendorp DH, Kruger MC. Cal-cium transport by isolated brush border and basolateral mem-brane vesicles: role of essential fatty acid supplementation.Prostaglandins Leukot Essent Fatty Acids 1994;50:257–66.
26] Fernandes G, Lawrence R, Sun D. Protective role of n-3 lipidsand soy protein in osteoporosis. Prostaglandins Leukot EssentFatty Acids 2003;68:361–72.
27] Sun D, Krishnan A, Zaman K, Lawrence R, Bhattacharya A,Fernandes G. Dietary n-3 fatty acids decrease osteoclastogene-sis and loss of bone mass in ovariectomized mice. J Bone Miner
Res 2003;18:1206–16.28] Wachman A, Bernstein DS. Diet and osteoporosis. Lancet1968;1:958–9.
29] Chan JC. Nutrition and acid–base metabolism. Fed Proc1981;40:2423–8.
[
tas 56 (2007) 1–11 11
30] Seelig MS. Interrelationship of magnesium and estrogen incardiovascular and bone disorders, eclampsia, migraine and pre-menstrual syndrome. J Am Coll Nutr 1993;12:442–58.
31] Hsu YH, Venners SA, Terwedow HA, et al. Relation of bodycomposition, fat mass, and serum lipids to osteoporotic fracturesand bone mineral density in Chinese men and women. Am J ClinNutr 2006;83:146–54.
32] Sebastian A, Harris ST, Ottaway JH, Todd KM, Morris Jr RC.Improved mineral balance and skeletal metabolism in post-menopausal women treated with potassium bicarbonate. N EnglJ Med 1994;330:1776–81.
33] New SA, Bolton-Smith C, Grubb DA, Reid DM. Nutritionalinfluences on bone mineral density: a cross-sectional study
in premenopausal women. Am J Clin Nutr 1997;65:1831–9.34] Teucher B, Fairweather-Tait S. Dietary sodium as a risk fac-tor for osteoporosis: where is the evidence? Proc Nutr Soc2003;62:859–66.