High-resolution numerical modeling of mesoscale island wakes and sensitivity to static topographic...
9
Geosci. Model Dev., 8, 2645–2653, 2015 www.geosci-model-dev.net/8/2645/2015/ doi:10.5194/gmd-8-2645-2015 © Author(s) 2015. CC Attribution 3.0 License. High-resolution numerical modeling of mesoscale island wakes and sensitivity to static topographic relief data C. G. Nunalee 1,a , Á. Horváth 2,b , and S. Basu 1 1 Department of Marine, Earth, and Atmospheric Sciences, North Carolina State University, Raleigh, NC, USA 2 Leibniz Institute for Tropospheric Research, Leipzig, Germany a now at: Resource Modeling Analytics Group, WindLogics Inc., Juno Beach, FL, USA b now at: Remote Sensing Group, STFC Rutherford Appleton Laboratory, Harwell Oxford, UK Correspondence to: C. G. Nunalee ([email protected]) Received: 22 January 2015 – Published in Geosci. Model Dev. Discuss.: 19 March 2015 Revised: 25 June 2015 – Accepted: 18 July 2015 – Published: 26 August 2015 Abstract. Recent decades have witnessed a drastic increase in the fidelity of numerical weather prediction (NWP) mod- eling. Currently, both research-grade and operational NWP models regularly perform simulations with horizontal grid spacings as fine as 1 km. This migration towards higher reso- lution potentially improves NWP model solutions by increas- ing the resolvability of mesoscale processes and reducing de- pendency on empirical physics parameterizations. However, at the same time, the accuracy of high-resolution simula- tions, particularly in the atmospheric boundary layer (ABL), is also sensitive to orographic forcing which can have sig- nificant variability on the same spatial scale as, or smaller than, NWP model grids. Despite this sensitivity, many high- resolution atmospheric simulations do not consider uncer- tainty with respect to selection of static terrain height data set. In this paper, we use the Weather Research and Fore- casting (WRF) model to simulate realistic cases of lower tro- pospheric flow over and downstream of mountainous islands using the default global 30 s United States Geographic Sur- vey terrain height data set (GTOPO30), the Shuttle Radar To- pography Mission (SRTM), and the Global Multi-resolution Terrain Elevation Data set (GMTED2010) terrain height data sets. While the differences between the SRTM-based and GMTED2010-based simulations are extremely small, the GTOPO30-based simulations differ significantly. Our results demonstrate cases where the differences between the source terrain data sets are significant enough to produce entirely different orographic wake mechanics, such as vortex shed- ding vs. no vortex shedding. These results are also compared to MODIS visible satellite imagery and ASCAT near-surface wind retrievals. Collectively, these results highlight the im- portance of utilizing accurate static orographic boundary conditions when running high-resolution mesoscale models. 1 Introduction Massively parallel computing platforms now enable regional-scale numerical weather prediction (NWP) models 1 to be easily integrated with fine-scale grid spacings, down to approximately 1 km horizontally. A valuable benefit of such high-resolution models is their capability to simulate orographically induced flow phenomena. Examples of such phenomena include gap winds (Mass et al., 2014), lee rotors (Ágústsson and Ólafsson, 2014), and wake vortices (Li et al., 2008). The accuracy of model simulations of orographic flows has been verified against a suite of observational data including, but not limited to, ground-based instruments e.g., lidar (Lesouëf et al., 2013), mesonets (Bieringer et al., 2013); satellite-based remote-sensing instruments e.g., synthetic aperture radar (SAR) (Miglietta et al., 2013); and airborne measurement platforms, e.g., aircraft (Gioli et al., 2014), radiosonde (Nunalee and Basu, 2014). Despite the increased resolvability, and overall fidelity, offered by finer-resolution models as it pertains to orographic flows, mesoscale NWP models are still constrained by multiple factors such as necessary physics parameterizations (Doyle et al., 2013; Draxl et al., 2014). The treatment of subgrid-scale (i.e., 1 In the context of this article, NWP models refer to models that may run in forecast or hindcast modes. Published by Copernicus Publications on behalf of the European Geosciences Union.
Transcript of High-resolution numerical modeling of mesoscale island wakes and sensitivity to static topographic...
Geosci. Model Dev., 8, 2645–2653, 2015
www.geosci-model-dev.net/8/2645/2015/
doi:10.5194/gmd-8-2645-2015
© Author(s) 2015. CC Attribution 3.0 License.
High-resolution numerical modeling of mesoscale island wakes and
sensitivity to static topographic relief data
C. G. Nunalee1,a, Á. Horváth2,b, and S. Basu1
1Department of Marine, Earth, and Atmospheric Sciences, North Carolina State University, Raleigh, NC, USA2Leibniz Institute for Tropospheric Research, Leipzig, Germanyanow at: Resource Modeling Analytics Group, WindLogics Inc., Juno Beach, FL, USAbnow at: Remote Sensing Group, STFC Rutherford Appleton Laboratory, Harwell Oxford, UK
Correspondence to: C. G. Nunalee ([email protected])
Received: 22 January 2015 – Published in Geosci. Model Dev. Discuss.: 19 March 2015
Revised: 25 June 2015 – Accepted: 18 July 2015 – Published: 26 August 2015
Abstract. Recent decades have witnessed a drastic increase
in the fidelity of numerical weather prediction (NWP) mod-
eling. Currently, both research-grade and operational NWP
models regularly perform simulations with horizontal grid
spacings as fine as 1 km. This migration towards higher reso-
lution potentially improves NWP model solutions by increas-
ing the resolvability of mesoscale processes and reducing de-
pendency on empirical physics parameterizations. However,
at the same time, the accuracy of high-resolution simula-
tions, particularly in the atmospheric boundary layer (ABL),
is also sensitive to orographic forcing which can have sig-
nificant variability on the same spatial scale as, or smaller
than, NWP model grids. Despite this sensitivity, many high-
resolution atmospheric simulations do not consider uncer-
tainty with respect to selection of static terrain height data
set. In this paper, we use the Weather Research and Fore-
casting (WRF) model to simulate realistic cases of lower tro-
pospheric flow over and downstream of mountainous islands
using the default global 30 s United States Geographic Sur-
vey terrain height data set (GTOPO30), the Shuttle Radar To-
pography Mission (SRTM), and the Global Multi-resolution
Terrain Elevation Data set (GMTED2010) terrain height data
sets. While the differences between the SRTM-based and
GMTED2010-based simulations are extremely small, the
GTOPO30-based simulations differ significantly. Our results
demonstrate cases where the differences between the source
terrain data sets are significant enough to produce entirely
different orographic wake mechanics, such as vortex shed-
ding vs. no vortex shedding. These results are also compared
to MODIS visible satellite imagery and ASCAT near-surface
wind retrievals. Collectively, these results highlight the im-
portance of utilizing accurate static orographic boundary
conditions when running high-resolution mesoscale models.
1 Introduction
Massively parallel computing platforms now enable
regional-scale numerical weather prediction (NWP) models1
to be easily integrated with fine-scale grid spacings, down
to approximately 1 km horizontally. A valuable benefit of
such high-resolution models is their capability to simulate
orographically induced flow phenomena. Examples of such
phenomena include gap winds (Mass et al., 2014), lee rotors
(Ágústsson and Ólafsson, 2014), and wake vortices (Li et al.,
2008). The accuracy of model simulations of orographic
flows has been verified against a suite of observational data
including, but not limited to, ground-based instruments e.g.,
lidar (Lesouëf et al., 2013), mesonets (Bieringer et al., 2013);
satellite-based remote-sensing instruments e.g., synthetic
aperture radar (SAR) (Miglietta et al., 2013); and airborne
measurement platforms, e.g., aircraft (Gioli et al., 2014),
radiosonde (Nunalee and Basu, 2014). Despite the increased
resolvability, and overall fidelity, offered by finer-resolution
models as it pertains to orographic flows, mesoscale NWP
models are still constrained by multiple factors such as
necessary physics parameterizations (Doyle et al., 2013;
Draxl et al., 2014). The treatment of subgrid-scale (i.e.,
1In the context of this article, NWP models refer to models that
may run in forecast or hindcast modes.
Published by Copernicus Publications on behalf of the European Geosciences Union.

2646 C. G. Nunalee et al.: High-resolution numerical modeling of mesoscale island wakes
sub-mesoscale) processes such as turbulence, radiative
transfer, moisture phase change, etc. collectively contributes
to the uncertainty of model solutions (see Coiffier, 2011).
At the same time, it has also been demonstrated that model
uncertainty can be increased through the prescription of
inaccurate, or unrepresentative, time-dependent atmospheric
boundary conditions (Kumar et al., 2011; Pielke, 2013).
In the past decade, advanced data assimilation techniques,
coupled with improved remote-sensing capabilities, have
been shown to reduce simulation uncertainty (Ancell et al.,
2011; Bieringer et al., 2013) and increase forecast skill
(Pu et al., 2013). While great efforts have been expended
to identify sources of NWP error with respect to model
configuration (i.e., physics parameterizations) and dynamic
(meteorological) boundary conditions, often overlooked
is the sensitivity of model solutions to static boundary
conditions, namely topographic relief.
Presently, several global terrain height data sets exist
which can be used by regional-scale NWP models. One of
the most used surface relief data sets, named GTOPO30, was
developed by the United States Geographic Survey and com-
prised through a synthesis of numerous international digi-
tal elevation models. GTOPO30 contains maximum spatial
resolution of 30 arc seconds and is the default data set for
many community models such as the Weather Research and
Forecasting (WRF) model. Aside from GTOPO30 data, other
satellite-derived global terrain height data sets are also avail-
able such as the Shuttle Radar Topography Mission (SRTM)
(Farr et al., 2007), and the Global Multi-resolution Ter-
rain Elevation Data (GMTED2010) (GMTED, 2011). These
data sets offer higher spatial resolutions globally of 3 and
7.5 arc seconds, respectively. The construction of surface
terrain height grids in NWP models from source data sets
(e.g., GTOPO30, SRTM, and GMTED2010) typically in-
volves subgrid scale averaging of the source data, grid-scale
spatial interpolation during data ingestion, and/or prepro-
cessing smoothing effects (e.g., see the WRF model Prepro-
cessing System Documentation; NCAR, 2014). Although
in many circumstances these activities are necessary, they
can effectively result in under-resolved topographic relief.
Under-resolved terrain height implies that the NWP model
generated terrain height does not fully capture the relevant
features of the natural topography described by the source
data (Jiménez and Dudhia, 2012) and can result in terrain
height discrepancies on the order of tens to hundreds of me-
ters (Jiménez and Dudhia, 2013). Such discrepancies have
been shown to result in significant error in simulated low-
level wind fields (Rife and Davis, 2005; Jiménez et al., 2010;
Santos-Alamillos et al., 2013). Aside from under-resolved
terrain height in modeled grids, which is essentially an over-
simplification of the source terrain height data, we show in
this paper that uncertainty in source terrain height data sets
themselves can be significant enough to result in fundamen-
tal differences in simulated orographic flow mechanics. This
finding illustrates that the sensitivity of NWP models can be
more complex than first-order biases recently documented by
Teixeira et al. (2014).
In this paper, we simulate two realistic cases of atmo-
spheric flow past mountainous islands; for each case, we
run WRF model simulations using GTOPO30, SRTM, and
GMTED2010 source terrain height data while keeping all
other model configurations identical. From the results, we
comment on the fundamental differences in simulated atmo-
spheric wake patterns associated with the three terrain height
fields. At the same time we compare the simulated flow fea-
tures to those observed in visible satellite imagery. Our re-
sults demonstrate that selection of terrain height source data
can, in some cases, be critical to successfully capturing the
fundamental mechanics of mesoscale orographic wakes.
2 Case studies and modeling details
Two historical atmospheric events were considered in this pa-
per, both corresponding to cases of flow past mountainous
islands. Since the islands were far from any upstream sur-
face heterogeneity, only the local terrain features associated
with the islands perturbed the local winds and consequent
cloud structures. For these events, the wind wake character-
istics associated with each island were indicated by distinct
cloud structures captured in visible satellite imagery from the
Moderate Resolution Imaging Spectroradiometer (MODIS)
instrument. The modeled wind wake patterns of the events
were compared to one another and the differences were doc-
umented in the context of the inferred wake patterns shown
in satellite imagery.
The first, and primary, case study involved the Spanish
island of Gran Canaria (GC) off the west coast of north-
ern Africa on 30 April 2007. MODIS visible satellite im-
agery from this day (Fig. 1, left panel) revealed a coherent
pattern of dipole vortices (i.e., von Kármán vortices) being
shed downstream of GC. GC has a diameter of approximately
50 km at sea level and has a peak elevation of 1948 m m.s.l.
GC’s SRTM-based topography is shown in Fig. 1 (right
panel) for reference.
The second case study presented here involves flow past
several islands which collectively comprise the Lesser An-
tilles (LA) in the eastern Caribbean. On 1 August 2013,
MODIS visible satellite imagery of the Lesser Antilles re-
gion illustrated distinct wakes behind all of the major is-
lands of the LA (Fig. 2 left panel). Contrary to the GC
case which had a coherent vortex shedding wake regime,
the LA case had weak wind wakes where the rotation be-
hind each island was not strong enough to counter the back-
ground wind flow. Furthermore, the wakes were correlated
with a reduction in cumulus cloudiness and darker sea sur-
face color, a phenomenon investigated by Smith et al. (1997).
The windward islands of the LA are generally lower than GC
but are, nonetheless, predominately mountainous with peak
elevations near 1 km for each island (see Table 1).
Geosci. Model Dev., 8, 2645–2653, 2015 www.geosci-model-dev.net/8/2645/2015/

C. G. Nunalee et al.: High-resolution numerical modeling of mesoscale island wakes 2647
Figure 1. MODIS-TERRA visible satellite imagery of the Canary Islands on 30 April 2007 (left) and SRTM terrain height profile of Gran
Canaria (right).
Figure 2. MODIS-TERRA true color image of the Lesser Antilles at 14:40 UTC on 1 August 2013 (left panel). Note the dark island wakes
embedded in sunglint in the eastern part of the image. Corresponding ASCAT-B 6.25 km resolution near-surface winds at 13:26 UTC (right
panel). For clarity, only every fourth wind vector is plotted.
Table 1. Peak elevations of the major islands in the Lesser Antilles
archipelago.
Symbol Island Peak elevation
A Guadeloupe 1467 m
B Dominica 1447 m
C Martinique 1397 m
D St. Lucia 950 m
E St. Vincent 1234 m
F Grenada 840 m
The corresponding near-surface wind retrievals from the
ASCAT (Advanced Scatterometer) instrument (Vogelzang
et al., 2011) on the MetOp-B (Meteorological Operational)
satellite are shown in Fig. 2 (right panel). The speed of the
predominantly east-southeasterly winds decreased from an
upstream value of 7.5–9.0 to 4.5–7.0 m s−1 in the lee of the
islands. The maximum speed reduction and the width/length
of the wind wake were correlated with island peak elevation.
The slower winds in the wake lead to a smoother sea sur-
face and, thus, increased specular reflection and decreased
diffuse reflection, while the opposite is true for the rougher
sea surface areas experiencing faster winds outside the wake.
www.geosci-model-dev.net/8/2645/2015/ Geosci. Model Dev., 8, 2645–2653, 2015

2648 C. G. Nunalee et al.: High-resolution numerical modeling of mesoscale island wakes
Depending on the sun-satellite geometry, this difference be-
tween the relative strengths of specular vs. diffuse reflection
can result in both dark and bright island wakes. When the is-
land is farther away from the solar specular point, as in the
LA case, the wake is darker than the surrounding rougher
sea surface. Contrarily, when the island is close to the spec-
ular point, as in the GC case, the wake appears brighter than
the surrounding ocean surface.
The numerical simulations performed in this study used
the Weather Research and Forecasting (WRF) model ver-
sion 3.6.1 which was initialized by ERA-Interim reanaly-
sis data (physics configurations are shown in Table 2). The
simulations used a nested four-domain configuration cen-
tered on the islands of interest. Of note, a horizontal grid
spacing of 1 km was chosen in the innermost domain (d04)
while the parent domains (d03–d01) used grid spacings of 3,
9, and 27 km, respectively. Additionally, in d04 the control
simulations used GTOPO30 terrain height while the experi-
mental simulations used terrain height data remapped from
SRTM and GMTED2010 to 30 arcsec (i.e., SRTM30 and
GMTED30, respectively). SRTM30 data were made avail-
able by http://dds.cr.usgs.gov/srtm/version2_1/SRTM30 and
GMTED30 data were downloaded from http://earthexplorer.
usgs.gov. Domains d01, d02, and d03 used 10 min, 2 min,
and 30 s GTOPO terrain height (respectively) with one-way
feedback. All other modeling variables were held constant
between the control simulations and experimental simula-
tions. For each of the three terrain height fields, the de-
fault smoothing and interpolation methods were selected.
That is, one pass of the built-in WRF Preprocessing System
(WPS) smoother–desmoother and four-point averaging inter-
polation, respectively.
3 Gran Canaria case study
In this section, we analyze the atmospheric flow patterns
downstream of GC as simulated by the WRF model with
GTOPO30, SRTM30, and GMTED30 terrain fields. Before
beginning the analysis, we compare the discrepancies be-
tween the three terrain height data fields in the left pan-
els of Fig. 3. Here a southern view of the model terrain
height for GC as generated by GTOPO30, SRTM30, and
GMTED30 is shown. Notice that compared to GTOPO30,
the SRTM30-based and GMTED30-based terrain height pro-
files have not only increased ruggedness but also led to a sig-
nificant increase in peak terrain height of GC island of nearly
1 km. Furthermore, the differences between the SRTM30
and GMTED30 terrain profiles are largely insignificant. Fig-
ure 3 also illustrates the upstream mean potential tempera-
ture cross section in the lower troposphere on 30 April 2007.
Within the potential temperature cross section, a well-mixed
planetary boundary layer (PBL) can be identified by the
nearly constant potential temperature in the lowest 800 m of
the atmosphere. Above this layer, in the free atmosphere,
a thermal capping inversion was present. Most importantly
for the purposes of this paper, the increase in peak eleva-
tion of GC with the SRTM30 and GMTED30 data makes the
modeled GC island penetrate into the stably stratified free
atmosphere.
Given that the original GTOPO30-based elevation of GC
was predominantly within the well-mixed PBL, the simu-
lated flow around it was mostly 3-D. That is, the impinging
air column was able to rise and cross the crest of the island
barrier and then descend on the lee slope without significant
buoyant restriction. This effect produced the unorganized
wake pattern shown in the upper right panel of Fig. 3. Al-
ternatively, with the SRTM30-based and GMTED30-based
elevation, the increased topographic steepness along with the
layer of stable stratification beneath the maximum height of
the island caused much of the flow to split and pass around
the lateral flanks of GC. This flow behavior generated coher-
ent lee vortices (i.e., von Kámán vortices) which were shed
downstream of the island, similar to what was observed in
the MODIS satellite imagery shown in Fig. 1 (left panel).
In addition to invoking differences in the simulated
wake pattern of GC, the GTOPO30-based, SRTM30-based,
and GMTED30-based simulations also exhibited substantial
variability in the wind regime very near to GC itself. In
Fig. 4, an instantaneous streamwise wind speed cross sec-
tion is presented for all three simulations. Of particular note
is the wind speed extrema (greater than 17 ms−1) on the
crest of GC in the GTOPO30-based simulation. This zone
of high wind speed was a result of a Venturi-type effect
caused by compression of the air column as it passed over
the crest of the island. Alternatively, in the SRTM30-based
and GMTED30-based simulations this zone of strong wind
speed was not present due to the lack of significant air col-
umn compression over GC. Instead, the lateral flow around
GC produced a zone of weak wind speed along the island
centerline with respect to the flow direction.
4 Lesser Antilles case study
The second case study presented here deals with boundary
layer flow impinging on the eastern slopes of the Lesser An-
tilles (LA) island archipelago. As can be seen in Fig. 2, the
wake signatures from all of the major islands in this region
persisted for up to approximately 300 km downstream. Con-
trary to the GC case, the wake patterns in the LA case did not
contain strong enough vorticity to counter the ambient wind
speed and therefore coherent wake vortices did not form.
This type of wake pattern has been called a weak wake pat-
tern by Smith et al. (1997), and forms in conditions of slower
wind speed and lower island height in comparison to the vor-
tex shedding patterns in the GC case.
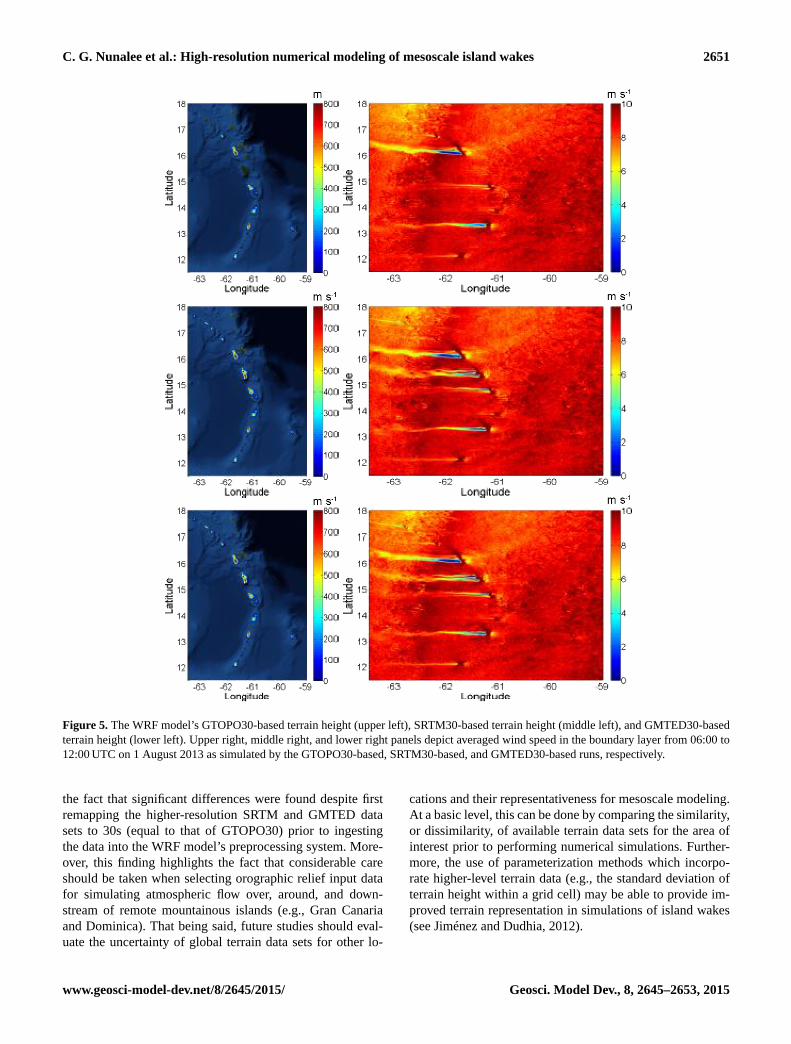
In the left panels of Fig. 5, the regional topographic
relief is shown for the GTOPO30-based simulation vs.
the SRTM30 and GMTED30-based simulations. Of par-
Geosci. Model Dev., 8, 2645–2653, 2015 www.geosci-model-dev.net/8/2645/2015/

C. G. Nunalee et al.: High-resolution numerical modeling of mesoscale island wakes 2649
Figure 3. WRF model terrain height profiles of Gran Canaria as viewed from the south corresponding to GTOPO30 (upper left), SRTM30
(middle left), and GMTED30 (lower left). Background color scheme represents ambient upstream potential temperature profile. Upper right,
middle right, and lower right panels depict instantaneous relative vertical vorticity averaged vertically across the lowest 15 grid levels for the
GTOPO30-based, SRTM30-based, and GMTED30-based simulations, respectively.
Table 2. Model physics configurations.
Parameterization Name Reference
Microphysics WRF single-moment 5-class Hong et al. (2004)
Longwave radiation RRTM longwave Mlawer et al. (1997)
Shortwave radiation Dudhia shortwave radiation Dudhia (1989)
Convection Kain–Fritsch (d01 and d02) Kain (2004)
Land surface Noah Land Surface Model Chen and Dudhia (2001)
Planetary boundary layer Yonsei University Hong et al. (2006)
Surface layer Revised MM5 surface layer Jiménez et al. (2012)
www.geosci-model-dev.net/8/2645/2015/ Geosci. Model Dev., 8, 2645–2653, 2015

2650 C. G. Nunalee et al.: High-resolution numerical modeling of mesoscale island wakes
Figure 4. Instantaneous wind speed cross section for the
GTOPO30-based (top panel), SRTM30-based (middle panel), and
GMTED30-based (bottom panel) simulations at 06:00 UTC on
30 April 2007. Cross sections are oriented in the streamwise axis
with inflow to the left.
ticular note is the fact that the island of Dominica, one
of the more prominent of the islands in the LA in the
SRTM30/GMTED30-based simulations, is represented as
flat (1 m m.s.l.) in the GTOPO30-based model elevation. At
the same time, other neighboring islands (e.g., St. Vincent)
appear relatively similar, despite them being slightly smaller
in size in the GTOPO30-based simulation. Again as in the
GC case, SRTM30 and GMTED30 terrain fields are very
similar.
The differences in the depiction of Dominica’s relief be-
tween the three simulations manifested in substantial dif-
ferences in regards to the simulated 6 h mean surface wind
speeds. The right panels in Fig. 5 show the mean sur-
face wind fields simulated by the three model runs. Most
notably, the weak wind wake associated with Dominica
is nearly non-existent in the GTOPO30-based simulation
while it extends hundreds of kilometers in the SRTM30-
based and GMTED30-based simulations. In addition, the
zone of enhanced wind speed associated with funneling be-
tween Dominica and its northern neighbor of Guadeloupe
is increased in the SRTM30/GMTED30-based simulations.
Lastly, the unique shapes of the individual island wakes
showed signs of variability between the GTOPO30- and
SRTM30/GMTED30-based simulations.
5 Conclusions
In this work, we have simulated two realistic cases of atmo-
spheric flow past mountainous islands using the WRF model.
For each case, we explored the sensitivity of the simulated
wake patterns with respect to three different terrain height
source data sets (i.e., GTOPO30, SRTM, and GMTED2010).
Our results show cases where differences in source terrain
height corresponded to fundamental differences in simulated
wake mechanics. For the GC case, the simulation which used
GTOPO30 terrain height had a peak island elevation nearly
1 km lower than that in the SRTM30-based and GMTED30-
based model terrain. The SRTM30 and GMTED30 terrain,
on the other hand, were very similar. As a consequence, the
GTOPO30-based terrain did not reach the stably stratified
thermal inversion above the planetary boundary layer while
the SRTM30 and GMTED30 terrain extended hundreds of
meters into the free atmosphere. This difference resulted in
substantially less vertical vorticity downstream of GC island,
along with an area of wind speed extrema on the crest of the
island in the GTOPO30-based simulation. In other words, the
SRTM30-based and GMTED30-based simulations produced
more significant lateral flow around the island and down-
stream von Kármán vortices, in agreement with MODIS vis-
ible satellite imagery, while the GTOPO30-based simulation
facilitated anomalous Venturi-type wind effect speed-up on
the crest of the island and incoherent downstream vortices.
For the LA case, the GTOPO30-based model terrain rep-
resented the island of Dominica to be essentially flat and near
sea level (i.e., 1 m m.s.l.) and consequently resulted in no
surface wind wake pattern. At the same time, the SRTM30-
based and GMTED30-based simulations were almost identi-
cal and resulted in a weak wind wake field which extended
hundreds of kilometers downstream of Dominica. The lat-
ter two results were similar to what was observed in visible
satellite imagery and scatterometer surface wind retrievals.
This work explored the value of using representative ter-
rain height source data for high-resolution mesoscale mod-
eling activities. The results presented here indicate that the
differences in simulated flow features associated with dif-
ferent terrain data sets is not a consequence of the terrain
source spatial resolution but instead arise due to fundamental
differences in the data sets. This conclusion is supported by
Geosci. Model Dev., 8, 2645–2653, 2015 www.geosci-model-dev.net/8/2645/2015/
C. G. Nunalee et al.: High-resolution numerical modeling of mesoscale island wakes 2651
Figure 5. The WRF model’s GTOPO30-based terrain height (upper left), SRTM30-based terrain height (middle left), and GMTED30-based
terrain height (lower left). Upper right, middle right, and lower right panels depict averaged wind speed in the boundary layer from 06:00 to
12:00 UTC on 1 August 2013 as simulated by the GTOPO30-based, SRTM30-based, and GMTED30-based runs, respectively.
the fact that significant differences were found despite first
remapping the higher-resolution SRTM and GMTED data
sets to 30s (equal to that of GTOPO30) prior to ingesting
the data into the WRF model’s preprocessing system. More-
over, this finding highlights the fact that considerable care
should be taken when selecting orographic relief input data
for simulating atmospheric flow over, around, and down-
stream of remote mountainous islands (e.g., Gran Canaria
and Dominica). That being said, future studies should eval-
uate the uncertainty of global terrain data sets for other lo-
cations and their representativeness for mesoscale modeling.
At a basic level, this can be done by comparing the similarity,
or dissimilarity, of available terrain data sets for the area of
interest prior to performing numerical simulations. Further-
more, the use of parameterization methods which incorpo-
rate higher-level terrain data (e.g., the standard deviation of
terrain height within a grid cell) may be able to provide im-
proved terrain representation in simulations of island wakes
(see Jiménez and Dudhia, 2012).
www.geosci-model-dev.net/8/2645/2015/ Geosci. Model Dev., 8, 2645–2653, 2015
2652 C. G. Nunalee et al.: High-resolution numerical modeling of mesoscale island wakes
Acknowledgements. The authors acknowledge computational and
financial support received from the Renaissance Computing Insti-
tute in addition to financial support received from the Department
of Defense AFOSR under award number (FA9550-12-1-0449). Any
opinions, findings and conclusions or recommendations expressed
in this material are those of the authors and do not necessarily
reflect the views of the Department of Defense. The authors also
thank Jur Vogelzang and Ad Stoffelen of the Royal Netherlands
Meteorological Institute (KNMI) for providing the experimental
6.25 km ASCAT winds.
Edited by: R. Neale
References
Ágústsson, H. and Ólafsson, H.: Simulations of observed lee waves
and rotor turbulence, Mon. Weather Rev., 142, 832–849, 2014.
Ancell, B. C., Mass, C. F., and Hakim, G. J.: Evaluation of surface
analyses and forecasts with a multiscale ensemble Kalman filter
in regions of complex terrain, Mon. Weather Rev., 139, 2008–
2024, 2011.
Bieringer, P. E., Ray, P. S., and Annunzio, A. J.: The effect of to-
pographic variability on initial condition sensitivity of low-level
wind forecasts. Part II: Experiments using real terrain and obser-
vations, Mon. Weather Rev., 141, 2156–2172, 2013.
Chen, F. and Dudhia, J.: Coupling an advanced land-
surface/hydrology model with the Penn State/NCAR MM5
modeling system, Mon. Weather Rev., 129, 587–604, 2001.
Coiffier, J.: Fundamentals of Numerical Weather Prediction, Cam-
bridge University Press, 2011.
Doyle, J. D., Epifanio, C. C., Persson, A., Reinecke, P. A., and
Zängl, G.: Mesoscale modeling over complex terrain: numerical
and predictability perspectives, in: Mountain Weather Research
and Forecasting, Springer, 531–589, 2013.
Draxl, C., Hahmann, A. N., Peña, A., and Giebel, G.: Evaluating
winds and vertical wind shear from Weather Research and Fore-
casting model forecasts using seven planetary boundary layer
schemes, Wind Energy, 17, 39–55, 2014.
Dudhia, J.: Numerical study of convection observed during the
winter monsoon experiment using a mesoscale two-dimensional
model, J. Atmos. Sci., 46, 3077–3107, 1989.
Farr, T. G., Rosen, P. A., Caro, E., Crippen, R., Duren, R., Hens-
ley, S., Kobrick, M., Paller, M., Rodriguez, E., Roth, L., Seal, D.,
Shaffer, S., Shimada, J., Umland, J., Werner, M., Oskin, M., Bur-
bank, D., and Alsdorf D.: The shuttle radar topography mission,
Rev. Geophys., 45, RG2004, doi:10.1029/2005RG000183, 2007.
Gioli, B., Gualtieri, G., Busillo, C., Calastrini, F., Gozzini, B., and
Miglietta, F.: Aircraft wind measurements to assess a coupled
WRF-CALMET mesoscale system, Meteorol. Appl., 21, 117–
128, 2014.
Global multi-resolution terrain elevation data 2010 (GMTED2010):
available at: http://pubs.er.usgs.gov/publication/ofr20111073
(last access: May 2015), 2011.
Hong, S.-Y., Dudhia, J., and Chen, S.-H.: A revised approach to ice
microphysical processes for the bulk parameterization of clouds
and precipitation, Mon. Weather Rev., 132, 103–120, 2004.
Hong, S.-Y., Noh, Y., and Dudhia, J.: A new vertical diffusion pack-
age with an explicit treatment of entrainment processes, Mon.
Weather Rev., 134, 2318–2341, 2006.
Jiménez, P. A. and Dudhia, J.: Improving the representation of re-
solved and unresolved topographic effects on surface wind in the
WRF model, J. Appl. Meteorol. Clim., 51, 300–316, 2012.
Jiménez, P. A. and Dudhia, J.: On the ability of the WRF model
to reproduce the surface wind direction over complex terrain, J.
Appl. Meteorol. Clim., 52, 1610–1617, 2013.
Jiménez, P. A., González-Rouco, J. F., García-Bustamante, E.,
Navarro, J., Montávez, J. P., de Arellano, J. V.-G., Dudhia, J.,
and Muñoz-Roldan, A.: Surface wind regionalization over com-
plex terrain: evaluation and analysis of a high-resolution WRF
simulation, J. Appl. Meteorol. Clim., 49, 268–287, 2010.
Jiménez, P. A., Dudhia, J., González-Rouco, J. F., Navarro, J., Mon-
távez, J. P., and García-Bustamante, E.: A revised scheme for the
WRF surface layer formulation, Mon. Weather Rev., 140, 898–
918, 2012.
Kain, J.: The Kain–Fritsch convective parameterization: an update,
J. Appl. Meteorol., 43, 170–181, 2004.
Kumar, A., Done, J., Dudhia, J., and Niyogi, D.: Simulations of Cy-
clone Sidr in the Bay of Bengal with a high-resolution model:
sensitivity to large-scale boundary forcing, Meteorol. Atmos.
Phys., 114, 123–137, 2011.
Lesouëf, D., Gheusi, F., Chazette, P., Delmas, R., and Sanak, J.:
Low tropospheric layers over Reunion Island in lidar-derived ob-
servations and a high-resolution model, Bound.-Lay. Meteorol.,
149, 425–453, 2013.
Li, X., Zheng, W., Zou, C., and Pichel, W.: A SAR observation and
numerical study on ocean surface imprints of atmospheric vortex
streets, Sensors, 8, 3321–3334, 2008.
Mass, C. F., Warner, M. D., and Steed, R.: Strong westerly wind
events in the Strait of Juan de Fuca, Weather Forecast., 29, 445–
465, 2014.
Miglietta, M. M., Zecchetto, S., and De Biasio, F.: A comparison of
WRF model simulations with SAR wind data in two case stud-
ies of orographic lee waves over the Eastern Mediterranean Sea,
Atmos. Res., 120, 127–146, 2013.
Mlawer, E., Taubman, S., Brown, P., Iacono, M., and Clough, S.:
Radiative transfer for inhomogeneous atmosphere: RRTM, a val-
idated correlated-k model for the longwave, J. Geophys. Res.,
102, 16663–16682, 1997.
NCAR: User’s Guide for Advanced Research WRF Model-
ing System: CH3, The WRF Preprocessing System, avail-
able at: http://www2.mmm.ucar.edu/wrf/users/docs/user_guide_
V3/users_guide_chap3.htm (last access: 15 April 2014), 2014.
Nunalee, C. G. and Basu, S.: Mesoscale modeling of coastal low-
level jets: implications for offshore wind resource estimation,
Wind Energy, 17, 1199–1216, 2014.
Pielke, R. A.: Mesoscale Meteorological Modeling, Vol. 98, Aca-
demic Press, Waltham, MA, USA Oxford, UK Amsterdam, the
Netherlands, available at: http://books.google.com/books?hl=
en&lr=&id=ExlFulltapcC&oi=fnd&pg=PR1&dq=mesoscale+
meteorological+modeling+pielke (last access: 17 March 2015),
2013.
Pu, Z., Zhang, H., and Anderson, J.: Ensemble Kalman filter assimi-
lation of near-surface observations over complex terrain: compar-
ison with 3DVAR for short-range forecasts, Tellus A, 65, 19620,
doi:10.3402/tellusa.v65i0.19620, 2013.
Geosci. Model Dev., 8, 2645–2653, 2015 www.geosci-model-dev.net/8/2645/2015/

C. G. Nunalee et al.: High-resolution numerical modeling of mesoscale island wakes 2653
Rife, D. L. and Davis, C. A.: Verification of temporal variations in
mesoscale numerical wind forecasts, Mon. Weather Rev., 133,
3368–3381, 2005.
Santos-Alamillos, F., Pozo-Vázquez, D., Ruiz-Arias, J., Lara-
Fanego, V., and Tovar-Pescador, J.: Analysis of WRF model wind
estimate sensitivity to physics parameterization choice and ter-
rain representation in Andalusia (Southern Spain), J. Appl. Me-
teorol. Clim., 52, 1592–1609, 2013.
Smith, R. B., Gleason, A. C., Gluhosky, P. A., and Grubišic, V.: The
wake of St. Vincent, J. Atmos. Sci., 54, 606–623, 1997.
Teixeira, J. C., Carvalho, A. C., Carvalho, M. J., Luna, T.,
and Rocha, A.: Sensitivity of the WRF model to the lower
boundary in an extreme precipitation event – Madeira island
case study, Nat. Hazards Earth Syst. Sci., 14, 2009–2025,
doi:10.5194/nhess-14-2009-2014, 2014.
Vogelzang, J., Stoffelen, A., Verhoef, A., and Figa-Saldaña, J.: On
the quality of high-resolution scatterometer winds, J. Geophys.
Res., 116, C10033, doi:10.1029/2010JC006640, 2011.
www.geosci-model-dev.net/8/2645/2015/ Geosci. Model Dev., 8, 2645–2653, 2015