High Performance Computing - ELIB-DLR
280
P. Bastian • D. Kranzlmüller • H. Brüchle • M. Brehm EDITORS High Performance Computing in Science and Engineering Garching/Munich 2018 Bayerische Akademie der Wissenschaften
-
Upload
khangminh22 -
Category
Documents
-
view
1 -
download
0
Transcript of High Performance Computing - ELIB-DLR

P. Bastian • D. Kranzlmüller • H. Brüchle • M. Brehm EDITORS
High Performance Computing in Science and Engineering Garching/Munich 2018
BayerischeAkademiederWissenschaften

Impressum:
Bayerische Akademie der WissenschaftenAlfons-Goppel-Str. 11, D-80539 Mü[email protected], www.badw.de
Leibniz-Rechenzentrum (LRZ)Boltzmannstraße 1, D-85748 Garching bei Mü[email protected], www.lrz.de
Herausgeber: Peter Bastian, Dieter Kranzlmüller, Helmut Brüchle, Matthias BrehmRedaktion: Helmut BrüchleGestaltung: Tausendblauwerk, Konrad-Adenauer-Straße 22, 85221 Dachau, www.tausendblauwerk.deDruck und Bindung: bonitasprint gmbh, Max-von-Laue-Straße 31, 97080 Würzburg
Das Titelbild zeigt das Gravitationswellensignal, das bei der Verschmelzung zweier Neutronensterne ausgesendet wurde und am 17. August 2017 detektiert wurde.Siehe Seite 18f für weitere Informationen.Bild Vorwort: Andreas Heddergott; Bild Umschlag-Rückseite: Torsten Bloth.
Das Werk einschließlich aller Abbildungen ist urheberrechtlich geschützt. Alle Rechte liegen bei der Bayerischen Akademie der Wissenschaften.
Bezugsadresse:
Leibniz-Rechenzentrum (LRZ)Boltzmannstraße 1, D-85748 Garching bei München
ISBN 978-3-9816675-2-3

P. Bastian • D. Kranzlmüller • H. Brüchle • M. Brehm EDITORS
High Performance Computing in Science and Engineering Garching/Munich 2018
BayerischeAkademiederWissenschaften


Table of contents
Table of contents
Preface
10 SuperMUC:ASuccessStory PeterBastian,DieterKranzlmüller,HelmutBrüchle,MatthiasBrehm
Chapter 01 – Astrophysics
14 Thesonicscalerevealedbytheworld’slargestturbulencesimulation SChristophFederrath16 Theworld’slargestturbulencesimulations ChristophFederrath,RalfS.Klessen18 BinaryNeutronStarMergerSimulations TimDietrich20 TowardsResolvingtheTurbulentCascadeinSelf-Consistent3DCore-CollapseSupernovaSimulations Hans-ThomasJanka22 TheSPHINXSimulationsoftheFirstBillionYearsandReionization JoakimRosdahl24 3DSupernovaSimulationswith3DProgenitorsandMuonPhysics Hans-ThomasJanka26 Preparingfortheimminentdetectionofgravitationalwavesfrombinaryneutronstars LucianoRezzolla28 SILCC-ZOOM:Theformationanddispersalofmolecularclouds StefanieWalch30 TestingNeutrinoTransportTreatmentsin3DSupernovaSimulations Hans-ThomasJanka32 Longtime3DSupernovaSimulationsforEstablishingtheProgenitor-RemnantConnection Hans-ThomasJanka34 LightontheVirgoclusterofgalaxies:ourclosestcluster-neighbor JennyG.Sorce36 Kineticsimulationsofastrophysicalandsolarplasmaturbulence JörgBüchner38 MagneticumPathfinder:Awebinterfacetoaccessthesimulationdatagoesonline KlausDolag40 Wildspace-timeswithNumericalRelativity BerndBrügmann,DavidHilditch42 TheCosmicFactory:Simulatingthedarkuniverseatdifferentscales StefanGottlöber44 FirstLight:FormationoftheFirstGalaxiesatCosmicDawn DanielCeverino46 Simulatingtheformation,evolution,andmergingofmolecularclouds DanielSeifried48 OurCosmicHomeinabox:SLOWdancinggalaxies JennyG.Sorce,KlausDolag
Chapter 02 – Chemistry and Material Sciences
54 Monte-Carloanddensityfunctionalstudiesofspintroniceffectsin(quasi)two-dimensionalsystems JaroslavFabian56 Topology,Entanglement,andcriticalphenomenaincorrelatedquantummatter F.F.Assaad58 High-throughputsearchfortransparentp-typeconductingnon-oxidematerials S.HosseinMirhosseini

Projects on SuperMUC
60 Abinitiomodellingofiridiumdioxidenanoparticlesascatalystsforprotonexchange membranewaterelectrolysiscells JakobTimmermann62 Photocatalyticwatersplittingwithcarbonnitridematerials JohannesEhrmaier64 BinarydopingofHfO2toimprovethepiezoelectricproperties AlfredKersch66 Experimentally-InformedLarge-ScaleAtomisticSimulationsofNanoporousGold ZhuochengXie68 ChemicalFunctionalizationofOxideSurfaces BerndMeyer70 ANeuralNetworkPotentialfortheCu/ZnOsystem JörgBehler73 OntheliquidphasemechanismofmethanoloxidationatAu/TiO2nanocatalysts DominikMarx76 OpticalSimulationofInnovativeThinFilmSolarCells C.Pflaum78 StabilizationofferroelectricpropertiesinHafniawithdoping AlfredKersch80 Firstprinciplesmultiscalekineticmodellingofcatalyticreactions KarstenReuter82 Calculatingfreeenergybarriersinphoto-electrochemistry KarstenReuter84 Effectofelectrolytesolutiononstandardreductionpotentialsofpolyoxometalates A.Kremleva,A.Genest,N.Rösch86 SorptionofU(VI)bycalciumsilicatehydrate(CSH)phases A.Kremleva,S.Krüger,N.Rösch88 Numericalsimulationsoftopologicalandcorrelatedquantummatter FakherF.Assaad,EwelinaHankiewicz,GiorgioSangiovanni
Chapter 03 – Computational Fluid Dynamics and Engineering
92 InvestigationofVehicleWheelsAerodynamicsusingDoE-basedComputationsandExperiments LuMiao94 Three-dimensionalreactingshock-bubbleinteraction FelixDiegelmann96 Numericalinvestigationofturbulentheattransferinahighaspectratiocoolingduct ThomasKaller98 TowardsLarge-EddySimulationofPrimaryAtomizationofLiquidJets MarkusKlein100 Massively-parallelmoleculardynamicssimulationoffluidsatinterfaces MartinThomasHorsch102 Large-scaleOrderinTurbulentConvection JörgSchumacher104 LESofRocketCombustionApplicationsUnderReal-GasConditions MichaelPfitzner106 Dissipationelementanalysisofturbulentnon-premixedflames ChristianHasse108 Superstructuresinturbulentthermalconvection DetlefLohse,RichardStevens110 InvestigationofGreenPropellantsinRocketCombustionChambers OskarJ.Haidn112 Fully-resolved,finite-sizeparticlesinstatisticallystationary,homogeneousturbulence MarkusUhlmann114 FromFullyResolvedtoWall-ModeledTurbulenceSimulations MartinKronbichler116 DirectNumericalSimulationofTurbulentOxy-FuelFlames C.Hasse118 LargeEddySimulationofturbulentflowinteractingwithcomplexstructures MichaelManhart

Table of contents
120 Detailedcoalandflameletmodelingforlargeeddysimulationofpulverizedcoalcombustion AndreasKempf122 SuperstructuresEnhanceHeatTransport OlgaShishkina124 ModulationofTurbulentPropertiesinSprayFlameBurningn-Heptane:DirectNumericalSimulation DominiqueThévenin126 PartitionedMulti-PhysicsonMassivelyParallelSystems Hans-JoachimBungartz,MiriamMehl128 CoupledDirectAeroacousticSimulationsonMassivelyParallelSystems SabineRoller130 FuelFlexibleCombustionSystemswithHighHydrogenContent(HHC)Fuels HeinzPitsch132 CondensationShockPhenomenainCavitatingFlow BerndBudich134 TechnicallyPremixedFlameResponseviaLargeEddySimulation WolfgangPolifke136 AerodynamicInvestigationsofVortexDominatedandMorphingAircraftConfigurationswith ActiveandPassiveFlowControl ChristianBreitsamter138 NumericalSimulationofFlameAccelerationandDeflagrationto-DetonationTransition inLargeConfinedVolumes JosefHasslberger140 ScalableMulti-PhysicswithwaLBerla HaraldKöstler142 CavitationErosioninInjectionSystems TheresaTrummler144 DirectNumericalSimulationofOpen-ChannelFlowatFully-RoughRegime MarkusUhlmann148 Modeldevelopmentforsootingturbulentflamesbymeansoftwocomplementary high-fidelitynumericalsimulations P.Gerlinger150 Heatandgastransferacrosswatersurfaces H.Herlina152 DirectnumericalsimulationofturbulentplaneCouetteflowwithwall-normaltranspirationvelocity MartinOberlack154 Large-eddysimulationoffuelinjectionandturbulentmixingunderhighpressureconditions JanMatheis156 ModelingofMulti-ScaleInterfacialFlows StéphaneZaleski158 EnhancedAerodynamicsofWindTurbines ThorstenLutz160 Görtlervorticesinanimpingingshock-wave/boundary-layerinteraction VitoPasquariello162 DeterminationofCombustionDynamicsandCombustionNoiseinaConfinedTurbulentSwirlCombustor WolfgangPolifke
Chapter 04 – Earth, Climate and Environmental Sciences
166 Extremescalesimulationsofthe2004Sumatra-AndamanearthquakeandtheIndianOceantsunami MichaelBader168 4DCity—Space-timeUrbanInfrastructureMappingbyMulti-sensorFusionandVisualization XiaoxiangZhu171 RetrodictionsofPastMantleFlowUsingGlobalHigh-ResolutionEarthModels Hans-PeterBunge173 Validationofverticallynestedlarge-eddy-simulationinheterogeneousterrain FrederikDeRoo176 Secondarycirculationsatanisolatedsemi-aridforest FrederikDeRoo178 3-Dseismicwavepropagationandearthquakerupture:Newroadsfortheforwardandinverseproblem HeinerIgel

Projects on SuperMUC
181 FromElectronstoPlanets,withEnergyBetween R.E.Cohen183 Globalclimatesimulationsatextremehigh-resolution J.vonHardenberg185 ClimExproject:investigatingclimatevariabilitytostudyextremeeventsinawarmingworld RalfLudwig187 Exascalecomputinginnumericalweatherprediction:massivelyparallelI/Oinatmosphericmodels onconformalmeshes DomHeinzeller189 AtmosphericChemistryandClimate RobertSausen
Chapter 05 – High Energy Physics
194 HighPrecisionHadronPhysicsfromLatticeQCD AndreasSchäfer198 ThehottestnuclearmatterineffectivefieldtheoriesandlatticeQCDsimulations NoraBrambilla200 SimulationofInteractionsforLHCRun-2 GünterDuckeck202 Nucleonobservablesasprobesforphysicsbeyondthestandardmodel K.Jansen204 Precisiondeterminationofthestrongcoupling RainerSommer206 Non-zerodensitysimulationsinfullQCD DénesSexty208 FormfactorsofsemileptonicB-mesondecaysfromLatticeQCD JochenHeitger210 Thestronginteractionsbeyondthestandardmodelofparticlephysics GeorgBergner213 High-loopperturbativecomputationsfromlatticeQCD RainerSommer
Chapter 06 – Life Sciences
218 Revealingthemechanismunderlyingtheactivationoftheinsulinreceptor ÜnalCoskun220 StructureandDynamicsofRespiratoryComplexI VilleR.I.Kaila222 SubstratesofIntramembraneProteases:ILiketoMoveit,Moveit! ChristinaScharnagl224 ConductancemechanismofthemembranechannelGLICuponopeningandclosing HelmutGrubmüller227 ComputationalBiomedicine:PredictiveMechanisticModelsinSupportof DrugDiscoveryandPersonalisedMedicine DieterKranzlmüller229 ConformationaldynamicsinAlzheimerpeptideformationandamyloidaggregation MartinZacharias231 ScalableComputationalMolecularEvolutionSoftware&DataAnalyses AlexandrosStamatakis234 Structureanddynamicsofnascentpeptidesintheribosomeexittunnel HelmutGrubmüller236 ReplicaExchangeMolecularDynamicsSimulationoftheSwitchingProcessinsmallGTPases MartinZacharias238 TheInteractionofAlzheimer’sAmyloid-βPeptideWithNeuronalLipidBilayers BirgitStrodel240 G-ProteinCoupledReceptorsupClose TimothyClark242 EnzymeDesignbyQM/MMMonteCarlo VilleR.I.Kaila

Table of contents
244 Redox-coupledProtonTransferDynamicsinCytochromec Oxidase VilleR.I.Kaila246 HowDoestheHIVVirusHijacktheHumanNuclearPoreComplex? HelmutGrubmüller248 Clusteringofmicro-andnanoscopicdrugdeliveryagentsinhumanbloodflow StephanGekle250 ParallelSimulatedSoluteTemperinginHybridDFT/PMMSimulations GeraldMathias252 FindingNano-forceSensorsinsideSkinusingSupercomputerSimulations FraukeGräter254 TargetingFtsZassemblyforthedevelopmentofnewantibiotics PabloChacon
Chapter 07 – Plasma Physics
258 Pushingtheenvelopeofplasmawakefieldacceleratorswithexoticbeams PatricMuggli260 PSCSimulationSupportforNovelAcceleratorConcepts HartmutRuhl264 SimulationofKineticTurbulenceinSpacePlasmas CedricSchreiner266 SimulationofBrilliantX/Gamma-RayEmissioninStrongLaserFields HartmutRuhl
Appendices
270 SummerofSimulation:EnablinganewgenerationofSuperMUCusers
Project reports from the Summer of Simulation
271 Insightsintotheformulationofamulti-domainantibioticfromMDsimulations GerhardWinter272 ChemicalReactivityofAmorphousOxideSurfaces BerndMeyer273 Computingprecisesolvationfreeenergiesofsmallmolecules IrisAntes
274 TheSuperMUCMulti-PetascaleSystem
278 SuperMUC-NG–NextGenerationSupercomputeratLRZ

10
Projects on SuperMUC
SuperMUC: A Success Story7.6 billion compute hours consumed, 5.6 million jobs pro-cessed, more than 750 research projects carried out, 1,995 researchers as clients: Since 2012, SuperMUC has served science on a large-scale and has enabled break-through scientific research on a world-class level.
In this results book, we would like to present this out-standing research, publishing more than 110 reports on projects carried out in 2016 and 20171. Our “TOP 5” pro-jects in terms of allocated core-hours consumed 17% of the total available core-hours on SuperMUC in this time-frame and merit special mention:1. Astrophysics: Janka et al. performed longtime 3D su-
pernova simulations (page 32)2. Computational Fluid Dynamics and Engineering: Lohse
et al. performed simulations on thermal turbulence at extreme Rayleigh numbers (page 108)
3. High Energy Physics: Jansen et al. studied nucleon ob-servables as probes for physics beyond the standard model (page 202)
4. Earth, Climate and Environmental Sciences: Ludwig et al. research climate change and hydrological extremes (page 185)
5. Astrophysics: Dietrich et al. investigated binary neu-tron star mergers (page 18)
For us at LRZ it is of utmost importance to support our users as best as we can, and to make sure these world-class supercomputing resources are used in the best pos-sible way. To achieve this, we have implemented meas-ures and programs over the last couple of years:
Dedicated application labs within the framework of the successful Partnership Initiative Computational Sciences (piCS) for astrophysics, big data, computational fluid dynamics, earth- and environmental sciences, digital humanities, and life sciences have been established at LRZ. Here, our application experts work closely together with scientists on optimization and scalability of the top applications, including our successful extreme scaling workshop series.
Additionally, twice a year, the Bavarian Competence Network for Technical and Scientific High Performance Computing (KONWIHR) supports short to medium term projects from regional researchers to optimize existing applications to achieve better scalability. Software devel-opers from KONWIHR projects come to LRZ to work direct-ly with application experts to profile the application, iden-tify bottlenecks, and to develop and implement strategies for better scalability. The results of several KONWIHR pro-
jects are included in this book. In the future, users can ex-pect even more support through high level support teams for GCS Large Scale projects and PRACE projects.
To attract new users from the fields of molecular dynam-ics, quantum chemistry, and bioinformatics to success-fully use a Tier-0 system like SuperMUC, LRZ initiated the “Summer of Simulation”. In June 2016, seven PhD students were selected. Each one received a one million core-hour grant to develop a scalable setup for their ap-plication with the help of a tutor from LRZ. In the second stage, the students submitted a follow-up proposal, and six were granted between five and eight million core-hours, each. The “Summer of Simulation” was repeated in 2017, this time with nine projects, that all successful-ly finished the second stage and used on average 8 mio core-hours. More details can be found in the Appendix.
The success story continues: SuperMUC-NG
To fulfill the ever-increasing demand on more and more computing power, on December 14, 2017, LRZ and Intel have signed a contract for a new supercomputer at LRZ. SuperMUC-NG will be the „Next Generation“ of the cur-
[1] For reports on previous projects, please see the previous editions of our results books: https://www.lrz.de/services/compute/supermuc/magazinesbooks/index.html#Books

11
Preface
Figure 1: Prof. Dr. Dieter Kranzlmüller, Chairman of the Board of Directors at LRZ in front of SuperMUC Phase 2.
rently operated SuperMUC, and will provide an impressive computational power of 26.7 PetaFlop/s to a wide-ranging scientific community. SuperMUC-NG will not only signif-icantly improve the compute power, but also enable the handling of tremendous amounts of data („Big Data“) accumulated in today’s experiments and simulations. A further objective of the new system is providing users the flexibility to deploy their own software and visualisation environments for analyzing the data and sharing the re-sults with other researchers worldwide. For better integra-tion with modern concepts of handling and visualization of huge amounts of data, SuperMUC-NG will be linked to separately operated cloud components.
With the next supercomputer SuperMUC-NG, we will meet the ever-growing demands for compute and stor-age resources of our researchers and will provide excel-lent conditions for state-of-the-art scientific research. SuperMUC-NG is currently being installed and will start production in early 2019. It will be equipped with more than 6,400 Lenovo ThinkSystem SD650 DWC compute nodes based on the Intel Xeon Scalable processor. De-tailed descriptions on SuperMUC and SuperMUC-NG can be found in the Appendix.
Getting access to top-tier supercomputing resources
LRZ supplies its high performance computing resources to both national and international research teams. It is a member of the Gauss Centre for Supercomputing (GCS), which combines the three national centres High Perfor-mance Computing Center Stuttgart (HLRS), Jülich Super-computing Centre (JSC), and Leibniz Supercomputing Centre (LRZ) into Germany’s foremost supercomputing institution. GCS is jointly funded by the German Federal Ministry of Education and Research and the correspond-ing ministries of the states of Bavaria, Baden-Wuert-temberg and North Rhine-Westphalia. GCS massively contributes to European large-scale scientific and engi-neering research by its involvement in the Partnership for Advanced Computing in Europe (PRACE).
Twice a year, GCS supports the most demanding projects through its Call for Large Scale Projects. Projects with Eu-ropean partners can submit proposals via PRACE. Several PRACE and GCS Large Scale projects report about their work in this book. Smaller scale proposals for computing time on SuperMUC can be submitted to LRZ throughout the year and the projects can start immediately after they have been reviewed positively.
Acknowledgments
We gratefully acknowledge the continued support of the State of Bavaria, The Bavarian Competence Network for Technical and Scientific High Performance Computing (KONWIHR), the Gauss Centre for Supercomputing (GCS), the German Research Foundation (DFG), the German Federal Ministry of Education and Research (BMBF), the Partnership for Advanced Computing in Europe (PRACE), and many other institutions promoting high perfor-mance computing. We thank the reviewers and the Steering Committees of GCS and SuperMUC for the re-views of the projects, their insights and helpful remarks. Without their efforts it would not have been possible and will not be possible in the future to sustain the high scientific quality we can see in the projects.
We are very thankful to our longtime Chairman of the SuperMUC and GCS Steering Committee, Prof. Dr. Sieg-fried Wagner, who passed away in January, 2018. Profes-sor Wagner was a tireless advocate of high-performance computing and its value to scientific engineering. Prof. Wagner was a strong supporter and driving force behind the foundation of GCS and his role in the steering com-mittees ensured the sustainable success of SuperMUC.
Garching near Munich, June 2018Peter BastianDieter KranzlmüllerHelmut BrüchleMatthias Brehm


Chapter 01 – Astrophysics
Astrophysics

14
Astrophysics
Introduction
Understanding turbulence is critical for a wide range of terrestrial and astrophysical applications. For example, turbulence on earth is responsible for the transport of pollutants in the atmosphere and determines the move-ment of weather patterns. But turbulence plays a central role in astrophysics as well. For instance, the turbulent motions of gas and dust particles in protostellar disks enables the formation of planets. Moreover, virtually all modern theories of star formation rest on the statistics of turbulence (Padoan et al., 2014). The theoretical as-sumptions about turbulence behind star formation the-ories allow the prediction of star formation rates in the Milky Way and in distant galaxies (Salim et al., 2015; Shar-da et al., 2018). Interstellar turbulence shapes the struc-ture of molecular clouds (Klessen & Glover, 2016) and is a key process in the formation of filaments, the building blocks of star-forming clouds.
A key ingredient for all these models is the so-called sonic scale. The sonic scale marks the transition from super-
sonic to subsonic turbulence and produces a break in the turbulence power spectrum from E ∝ k –2 to E ∝ k –5/3, or equivalently in the 2nd-order velocity structure function from SF2 ∝ l 1/2 (in the supersonic regime) to SF2 ∝ l 1/3 (in the subsonic regime). While these structure function slopes of 1/2 and 1/3 for the supersonic and subsonic parts of the spectrum have been measured independently, there is no simulation currently capable of bridging the gap between both regimes. This is because previous sim-ulations did not have enough resolution to separate the injection scale, the sonic scale and the dissipation scale. The aim of this project is to run the first simulation that is sufficiently resolved to measure the exact position of the sonic scale and the transition region from superson-ic to subsonic turbulence. We therefore ran a simulation with the unprecedented resolution of 10,0483 grid cells on SuperMUC, in order to resolve the sonic scale.
Results
In the framework of a GAUSS Large Scale Project, an allo-cation exceeding 40 million core hours has been granted to this project on SuperMUC. The simulation code used for this project is FLASH, a public, modular grid-based hydrodynamical code for the simulation of astrophysical flows (Fryxell et al., 2000). The parallelisation is based en-tirely on MPI. In the framework of the SuperMUC Phase 2 scale-out workshop, the current code version (FLASH4) has been optimised to reduce the memory and MPI com-munication requirements. In particular, non-critical op-erations are now performed in single precision, without causing any significant impact on the accuracy of the re-sults (see Figure 1). In this way, the code runs with a factor of 4.1 less memory and 3.6 times faster than the version used for the previous large-scale project at LRZ (Feder-rath, 2013), and scales remarkably well up to the full ma-chine on SuperMUC Phase 2 (Hammer et al., 2016).
Our current 10,0483 simulation has been completed and data processing is in progress. The simulation was run on 65,536 compute cores, used up the full allocation of 40
The sonic scale revealed by the world’s largest turbulence simulation1
Research Institution1Research School of Astronomy and Astrophysics, Australian National UniversityPrincipal InvestigatorChristoph Federrath1
ResearchersRalf S. Klessen2;3, Luigi Iapichino4
Project Partners2Universität Heidelberg, Zentrum für Astronomie, Institut für Theoretische Astrophysik; 3Universität Heidelberg, Interdisziplinäres Zentrum für Wissenschaftliches Rechnen; 4Leibniz-Rechenzentrum der Bayerischen Akademie der Wissenschaften
SuperMUC Project ID: pr32lo
Figure 1: Comparison of the pure double-precision and pure-single precision schemes with our new hybrid-precision scheme for modelling supersonic and subsonic turbulence. The mass and momentum are well conserved in our hybrid-precision scheme, shown as a straight blue line (identical to the pure double-precision scheme), while significant errors arise in the pure single-precision scheme (shown as the green line).

15
Figure 2: Velocity structure function of the simulation with 10,0483 cells. This reveals the transition from supersonic to subsonic turbulence around the sonic scale (defined as the scale where the Mach number is unity). We find the sonic scale at about 1/100th of the computational box size.
The sonic scale revealed by the world’s largest turbulence simulation
million core hours and produced about 2 PB of output data. Here we present the first results of the simulations, with a focus on identifying the sonic scale.
In order to find the sonic scale we computed the 2nd-or-der velocity structure functions over a period of 5 large-scale turbulent turnover times. Figure 2 shows the time-averaged structure function (with error bars quan-tifying fluctuations in time around the average), where we have plotted the Mach number (defined as √—SF2/cs, where cs is the isothermal sound speed of the gas), as a function of scale l /L (in units of the size of the compu-tational domain, L). We can directly use this plot to iden-tify the position of the sonic scale and transition region around it. We find the sonic scale where the Mach num-ber is unity, which gives a sonic scale of l /L ≈ 0.014. Pow-er-law fits in the subsonic and supersonic regime yield slopes of 0.4 and 0.5, respectively, close to the theoretical expectations (the subsonic slope is slightly steeper than the original Kolmogorov prediction of 1/3, likely because of necessary intermittency corrections; see Schmidt et al., 2008). The transition region around the sonic scale is about a factor of 3 in l.
We can use the measured position and width of the sonic scale from Figure 2 to visualise the density struc-tures associated with the sonic-scale transition. We do
so in Figure 3, which shows the gas density in the en-tire domain (left-hand panel) and the Fourier-filtered density field to highlight the density structures around the sonic scale (scales of about 1/100th of the box size; shown in the right-hand panel). This reveals the posi-tion and morphology of the sonic-scale structures. We find that they are associated with strong shocks, i.e., the transition regions between pre-shock and post-shock gas. The filaments and sheets tracing these structures have enormous density contrasts of 100–1000.
These sonic-scale structures are key ingredients for star formation. We think that they are associated with the formation of interstellar filaments (Federrath, 2016). Dense cores may form at the intersection of such fil-aments, which marks the onset of local gravitational dominance of these cores, such that they can proceed via gravitational collapse to form stars. Hence, the sonic scale is a key ingredient in star-formation theory (Krum-holz & McKee, 2005; Federrath & Klessen, 2012).
The visualisation shown in Figure 3 highlights the enor-mous complexity of the turbulent structures on all spa-tial scales covered in these simulations. For further visual-isations and movies of the simulation, please visit http://www.mso.anu.edu.au/~chfeder/pubs/extreme_scaling/extreme_scaling.html (movies and visualisations for use on the LRZ and GCS webpage).
There are many other fundamental aspects of turbulent flows that can be studies with this large simulation (frac-tal dimension, probability distribution functions of key dynamic variables, etc.). This is work in progress.
References and Links
[1] Federrath, C. 2013, Monthly Notices of the Royal Astronomical Society, 436, 1245
[2] Federrath, C. 2016, Monthly Notices of the Royal Astronomical Society, 457, 375
[3] Federrath, C., & Klessen, R. S. 2012, The Astrophysical Journal, 761, 156
[4] Fryxell, B., Olson, K., Ricker, P., et al. 2000, The Astrophysical Journal Supplement Series, 131, 273
[5] Hammer, N., Jamitzky, F., Satzger, H., et al. 2016, Advances in Parallel Computing, 27, 827
[6] Klessen, R. S., & Glover, S. C. O. 2016, Star Formation in Galaxy Evolu-tion: Connecting Numerical Models to Reality, Saas-Fee Advanced Course, 43, 85
[7] Krumholz, M. R., & McKee, C. F. 2005, The Astrophysical Journal, 630, 250
[8] Padoan, P., Federrath, C., Chabrier, G., et al. 2014, Protostars and Planets VI, 77
[9] Salim, D. M., Federrath, C., & Kewley, L. J. 2015, The Astrophysical Journal Letters, 806, L36
[10] Schmidt, W., Federrath, C., & Klessen, R. 2008, Physical Review Letters, 101, 194505
[11] Sharda, P., Federrath, C., da Cunha, E., Swinbank, A. M., & Dye, S. 2018, Monthly Notices of the Royal Astronomical Society
Gauss Centre for Supercomputing: http://www.gauss-centre.eu/gauss-centre/EN/Projects/Astrophysics/
federrath_astrophysics_weltrekord.html?nn=1345700
Uni Heidelberg: http://www.ita.uni-heidelberg.de/~chfeder/pubs/supersonic/
supersonic.shtml?lang=en
Figure 3: Three-dimensional visualisation of our turbulence simulation. The left-hand panel shows the gas density in the entire domain, while the right-hand panel highlights those structures that are associated with the sonic scale. We see that these sonic-scale structures trace the edges of strong shocks. The density contrasts are up to 1000 across these sonic surfaces.

16
Astrophysics
The world’s largest turbulence simulations1 Research Institution
1 Research School of Astronomy and Astrophysics, Australian National University2 Zentrum für Astronomie der Universität Heidelberg, Institut fü r Theoretische Astrophysik3 Universität Heidelberg, Interdisziplinäres Zentrum fü r Wissenschaftliches RechnenPrincipal InvestigatorChristoph Federrath1, Ralf S. Klessen2, 3
ResearchersLuigi Iapichino4, & Nicolay J. Hammer4
Project Partners4 Leibniz-Rechenzentrum der Bayerischen Akademie der Wissenschaften
SuperMUC Project ID: pr48pi (Gauss Large Scale project)
Introduction
Understanding turbulence is critical for a wide range of terrestrial and astrophysical applications. For example, turbulence on earth is responsible for the transport of pollutants in the atmosphere and determines the movement of weather patterns. But turbulence plays a central role in astrophysics as well. For instance, the tur-bulent motions of gas and dust particles in protostellar disks enables the formation of planets. Moreover, virtual-ly all modern theories of star formation rest on the sta-tistics of turbulence (Padoan et al., 2014). Especially the theoretical assumptions about turbulence behind star formation theories allow the prediction of star forma-tion rates in the Milky Way and in distant galaxies (Fed-errath & Klessen, 2012). Interstellar turbulence shapes the structure of molecular clouds and is a key process in the formation of filaments which are the building blocks of star-forming clouds. The key ingredient for all these models is the so-called sonic scale. The sonic scale marks the transition from supersonic to subsonic turbulence and produces a break in the turbulence power spectrum from E ∝ k –2 to E ∝ k –5/3. While the power-law slopes of -2 and -5/3 for the supersonic and subsonic parts of the
spectrum have been measured independently, there is no simulation currently capable of bridging the gap between both regimes. This is because previous simu-lations did not have enough resolution to separate the injection scale, the sonic scale and the dissipation scale.
The aim of this project is to run the first simulation that is sufficiently resolved to measure the exact position of the sonic scale and the transition region from supersonic to subsonic turbulence. A simulation with the unprece-dented resolution of 100003 grid cells will be needed for resolving the transition scale.
Results
In the framework of a GAUSS Large Scale Project, an al-location exceeding 40 million core-h has been granted to this project on SuperMUC. The application used for this project is FLASH, a public, modular grid-based hy-drodynamical code for the simulation of astrophysical flows (Fryxell et al., 2000). The parallelisation is based entirely on MPI. In the framework of the SuperMUC Phase 2 scale-out, the current code version (FLASH4) has been optimised to reduce the memory and MPI com-munication requirements. In particular, non-critical op-erations are now performed in single precision, without
Figure 1: Weak scaling of the customized version of the FLASH code, used during the SuperMUC scale-out workshop on Phase 2 in 2015. The diamonds indicate the scaling tests of the FLASH code, while ideal scaling is represented by the dashed line.
Figure 2: Power spectrum from highly-compressible, supersonic turbulence simulations (compressive driving), demonstrating a k –2 scaling (Federrath, 2013).
17
The world’s largest turbulence simulations
causing any significant impact on the accuracy of the results. In this way, the code runs with a factor of 4.1 less memory and 3.6 times faster than the version used for the previous large-scale project at LRZ (Federrath, 2013), and scales remarkably well up to the full machine on SuperMUC Phase 2 (see Figure 1).
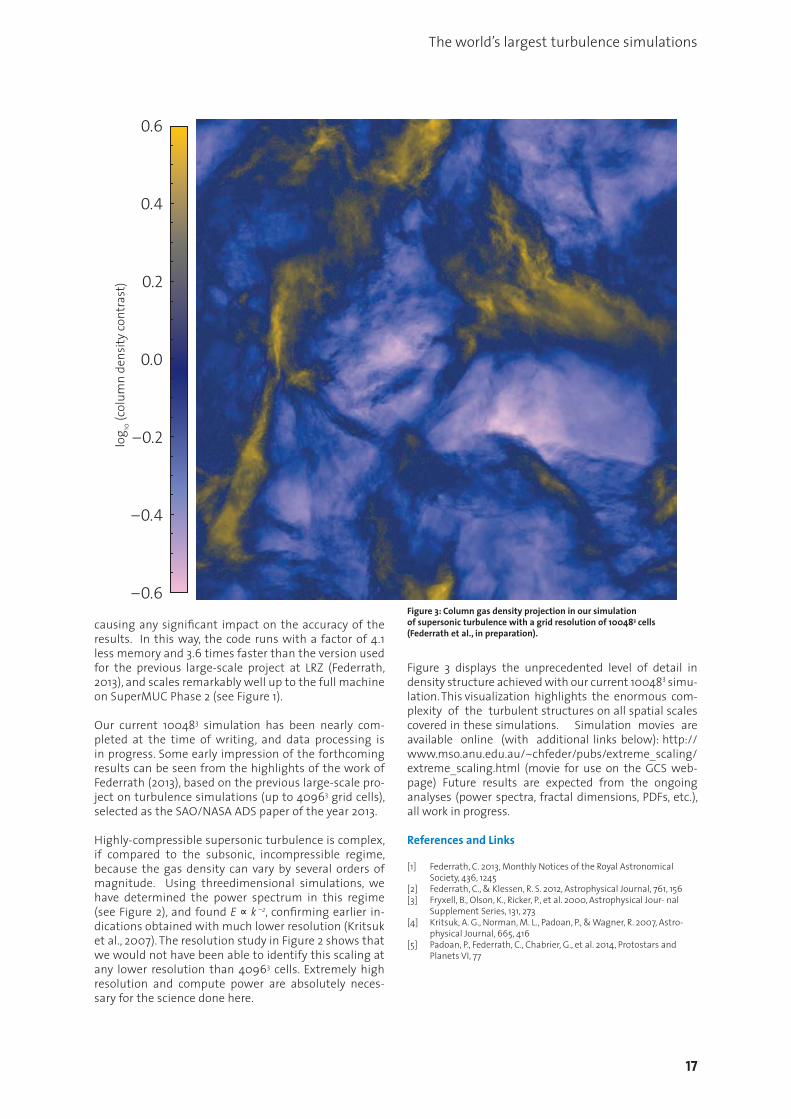
Our current 100483 simulation has been nearly com-pleted at the time of writing, and data processing is in progress. Some early impression of the forthcoming results can be seen from the highlights of the work of Federrath (2013), based on the previous large-scale pro-ject on turbulence simulations (up to 40963 grid cells), selected as the SAO/NASA ADS paper of the year 2013.
Highly-compressible supersonic turbulence is complex, if compared to the subsonic, incompressible regime, because the gas density can vary by several orders of magnitude. Using threedimensional simulations, we have determined the power spectrum in this regime (see Figure 2), and found E ∝ k –2, confirming earlier in-dications obtained with much lower resolution (Kritsuk et al., 2007). The resolution study in Figure 2 shows that we would not have been able to identify this scaling at any lower resolution than 40963 cells. Extremely high resolution and compute power are absolutely neces-sary for the science done here.
Figure 3 displays the unprecedented level of detail in density structure achieved with our current 100483 simu-lation. This visualization highlights the enormous com-plexity of the turbulent structures on all spatial scales covered in these simulations. Simulation movies are available online (with additional links below): http://www.mso.anu.edu.au/~chfeder/pubs/extreme_scaling/extreme_scaling.html (movie for use on the GCS web-page) Future results are expected from the ongoing analyses (power spectra, fractal dimensions, PDFs, etc.), all work in progress.
References and Links
[1] Federrath, C. 2013, Monthly Notices of the Royal Astronomical Society, 436, 1245
[2] Federrath, C., & Klessen, R. S. 2012, Astrophysical Journal, 761, 156[3] Fryxell, B., Olson, K., Ricker, P., et al. 2000, Astrophysical Jour- nal
Supplement Series, 131, 273[4] Kritsuk, A. G., Norman, M. L., Padoan, P., & Wagner, R. 2007, Astro-
physical Journal, 665, 416[5] Padoan, P., Federrath, C., Chabrier, G., et al. 2014, Protostars and
Planets VI, 77
log 10
(col
umn
dens
ity co
ntra
st)
0.6
0.4
0.2
0.0
–0.2
–0.4
–0.6Figure 3: Column gas density projection in our simulation of supersonic turbulence with a grid resolution of 100483 cells (Federrath et al., in preparation).

18
Astrophysics
Introduction
On the 17th of August 2017 the observation of gravitation-al and electromagnetic radiation from a binary neutron star coalescence initiated a new era of multi-messen-ger astronomy [1]. For the first time the coincident de-tections of a short gamma ray bursts, a kilonova, and a gravitational wave signal connected several high-energy astrophysics phenomena with the collision of the most extreme stars in the Universe.
While this achievement is already an important scien-tific breakthrough, one expects multiple observations of merging neutron stars in the next years due to the in-creasing sensitivity of advanced GW detectors.
To interpret the observations, theoretical studies of bi-nary neutron star systems are necessary. Because of the complexity of the non-linear Einstein Equations coupled to the equations of general relativistic hydrodynamics, numerical relativity simulations are required to describe the system in the last stages of the binary coalescence.
Numerical relativity simulations are a multi-scale and mul-ti-physics problem that requires the solution of nonlinear partial differential equations in complex geometries.
Over the last years our group has developed numerical methods and codes to perform such simulations to allow predictions of the gravitational-wave and electromagnet-ic radiation emitted by compact binaries. Aspects we are focusing on are the dynamical interaction between supra-nuclear-density and the production of accurate gravita-tional waveforms for a variety of binary parameters.
Results
Computational SetupDynamical simulations are performed with the BAM code. BAM combines state-of-art methods to deal with black hole spacetimes and shock capturing methods for general relativistic hydrodynamics simulations.The code is based on the method of lines and uses high-order finite difference stencils for the spatial dis-cretization of the geometric variables, while high reso-
lution shock capturing methods are used for the hydro-dynamic variables. The time integration is done with an explicit Runge-Kutta method. The BAM infrastructure also supplies adaptive mesh refinement by a combina-tion of fixed and moving boxes, as well as cubed spheres. The code is written in C and is hybrid OpenMP/MPI parallelized.
It is important to point out that scientific statements can only be made with a bundle of numerical simula-tions and that individual simulations of a single physi-cal setup using one resolution are almost meaningless. Therefore, we are required to simulate physical setups with different resolutions to show consistency, to check convergence, and to give proper error bars for the observ-ables. Additionally, we have to span a reasonable range in the parameter space to study the imprint of the bi-nary parameters, as spin, equation of state, total mass, and mass-ratio. Depending on the resolution and param-eters considered every individual simulation runs on a few hundred to a few thousand processors. Currently, we have consumed ~100 million CPUhs on SuperMUC with-in the project pr48pu. We produced ~200 million files and used a maximum of ~110TB of storage.
Scientific results
With the help of the computational resources granted through the project pr48pu, we have written in the last 2 years 10 peer reviewed articles. Some of the research highlights will be discussed in the following.
Binary Neutron Star Merger Simulations1 Research Institution
Max Planck Institut for Gravitational Physics Potsdam / Dutch National Institut for Subatomic Physics AmsterdamPrincipal InvestigatorTim DietrichResearchersS. Bernuzzi, B. Brügmann, S. V. Chaurasia, R. Dudi, D. Radice, W. Tichy, M. UjevicProject PartnersMax Planck Institute for Gravitational Physics Potsdam, University of Parma, University of Jena, Federal Universi-ty of ABC Sao Paulo, Florida Atlantic University
SuperMUC Project ID: pr48pu (Gauss Large Scale project)
Figure 1: Gravitational wave signal emitted from the coalescence of two neutron stars as detected on the 17th of August 2017, source: http://www.aei.mpg.de/2132431/ gw170817-binary-neutron-star-merger

19
Binary Neutron Star Merger Simulations
Waveform model development: The main target of gravitational wave astronomy is to ex-tract the properties of the observed system like the stars’ masses or spins from the detected signal. For this purpose the signal is cross-correlated with waveform templates. Therefore, a key to the source identification is the availa-bility of state-of-the-art models of the gravitational-wave signal. Recently, we constructed an analytical closed-form gravitational wave model which employs directly high-resolution and error-controlled numerical relativity data [2]. The latter have been combined with analytical ex-pressions based on post-Newtonian theory, describing the early inspiral when the two stars are still far apart, and on waveforms obtained in the so-called effective-one-body approach [3]. This allowed us to build waveform approx-imants that are valid from the low frequencies to the strong-field regime and up to merger. Our work [2] provid-ed for the first time simple, flexible, and accurate models used directly in the data analysis of the first binary neu-tron star event observed by LIGO and Virgo [1].
Binary Neutron Star Parameter Space Coverage: Currently, our collaboration is about to release the first cat-alog of binary neutron star waveforms with a total of 367 simulations. An important aspect of our work is the use of initial data which fulfill the Einstein Constraint Equations and the equations governing the evolution of the matter variables. These consistent initial data allow for highly ac-curate predictions of the binary evolution. Furthermore, with the methods presented in [4] we are able to access large regions of the binary neutron star parameter space.
In particular, we have been the first who performed sim-ulations for spinning neutron stars with a realistic de-scription of the intrinsic rotation of the stars. We have been the first who simulated precessing binary neutron star mergers, i.e., systems in which the orbital plane pre-cesses due to the fact that the spins of the neutron stars are not aligned with the orbital angular momentum. We managed to simulate systems with large mass ratios, in particular mass ratios between 1.5 and 2. Since although the observed neutron star binaries have currently mass ratios below 1.3, one expects that also systems with higher mass ratios exist, consequently, we need to be prepared for upcoming gravitational wave observations in different regions of the parameter space.
Very recently, we started the investigation of highly eccentric binary neutron star systems. These systems which can form in globular clusters allow to constrain the Equation of State of neutron star matter by density oscillations induced into the stars during close encoun-ters in the inspiral.
Outlook
In the future we plan to extend our work on binary neu-tron star systems and focus on the development of a new pseudospectral code, BAMPS. BAMPS includes already routines for general relativistic hydrodynamics within the framework of discontinuous Galerkin methods and will be the next-generation successor to BAM.
References and Links
[1] http://www.aei.mpg.de/2132431/gw170817-binary-neu-tron-star-merger
[2] T. Dietrich, S. Bernuzzi, and W. Tichy, 2017. Closed-form tidal approxi-mants for binary neutron star gravitational waveforms construct-ed from high-resolution numerical relativity simulations. Phys. Rev. D.96, 12, 121501.
[3] S. Bernuzzi, A. Nagar, T. Dietrich, and T. Damour, 2014. Modeling the Dynamics of Tidally Interacting Binary Neutron Stars up to the Merger. Phys.Rev.Lett. 114, (2015) 16, 161103.
[4] T. Dietrich, et al., 2015. Binary Neutron Stars with Generic Spin, Eccentricity, Mass ratio, and Compactness - Quasi-equilibrium Sequences and First Evolutions. Phys. Rev. D.92, 12, 124007
Figure 2: Density evolution during the merger of two neutron stars during the numerical simulation from top to bottom., source: http://www.aei.mpg.de/2132431/gw170817-binary-neutron-star-merger

20
Astrophysics
Supernovae are among the most powerful explosions in the universe, play an important role as sources of neutri-nos and gravitational waves, and act as crucial agents in the cosmic cycle of matter by disseminating the nuclear burning products of massive stars and by contributing new radioactive species assembled during the explosion. While the stellar core collapses either to a neutron star or a black hole, the surrounding material can be expelled in a supernova outburst. The possibility of such mass ejection is determined in a dynamical interplay of ener-gy transfer (“heating”) by neutrinos from the new-born neutron star to the explosion shock, and violent hydro-dynamic instabilities including turbulent flows, which provide decisive support for the onset of the supernova blast.
Detailed 3D simulations are therefore necessary to de-cide whether or not a star explodes. The first full-scale stellar core-collapse simulations in three dimensions, which have become feasible due to supercomputing power provided on SuperMUC by Gauss and PRACE re-sources, indeed lend support to the neutrino-driven
mechanism as the cause of successful supernovae. How-ever, such simulations are extremely CPU-time consum-ing because of the enormous complexity of the neutri-no physics and the grand challenges associated with a wide range of spatial and temporal scales that have to be bridged by the numerical models. Therefore the compu-tational resolution of the existing successful models was still severely limited, and systematic investigations of the numerical convergence of the corresponding results, in particular with respect to the turbulent flows behind the supernova shock, are demanded.
Owing to the computer time granted for Gauss pro-ject pr48ra a resolution study with this goal could be performed for the Prometheus-Vertex supernova code employed by the Garching group. Moreover, the project resources allowed for a test of a newly developed stat-ic mesh refinement (SMR) technique that is supposed to permit better numerical resolution in the turbulent postshock layer of full-scale supernova simulations with-out paying additional costs on the side of the extremely expensive neutrino transport.
Towards Resolving the Turbulent Cascade in Self-
Consistent 3D Core-Collapse Supernova Simulations1
Research InstitutionMax Planck Institute for Astrophysics, Karl-Schwarzschild-Str. 1, GarchingPrincipal InvestigatorHans-Thomas JankaResearchersTobias Melson, Alexander Summa, Andreas MarekProject PartnersMax Planck Computing and Data Facility (MPCDF), Garching.
SuperMUC Project ID: pr48ra (Gauss Large Scale project)
Figure 1: Time evolution of the angle-averaged shock radius for all simulations of the reported resolution study. Models s9.0 and s20 (dotted and dashed lines) are full-scale supernova simulations with sophisticated neutrino trans-port for 9 and 20 solar-mass stars performed with 3.5 degrees and two degrees angular resolution and a newly developed static-mesh-re-finement (SMR) technique, re-spectively. The thin lines represent results for simulations with a sim-plified treatment of neutrino heat-ing and cooling (HTCL) for a setup close to the explosion threshold; the thick lines (shifted by 100 km for better visibility) display results for a case with stronger tendency to explode. The different colors correspond to angular grids with different resolutions as indicated by the model names.

21
Turbulent Cascade in Self-Consistent 3D Core-Collapse Supernova Simulations
Two full-scale supernova simulations including neutrino transport were performed for progenitor stars of 9.0 and 20.0 solar masses, using the SMR mesh with two refine-ment levels (for both angular directions of the employed polar grid) that allowed for an improved resolution of one degree in the neutrino-heating layer and 0.5 degrees in the turbulent postshock region instead of the stand-ard uniform resolution of two degrees. These two runs amounted to roughly 50 million core hours each on the LRZ HPC system SuperMUC. Additional systematic reso-lution variations could be carried out with a simplified description of neutrino heating and cooling. They en-compassed models with uniform cell sizes between four degrees (half the standard resolution) and 0.5 degrees (four times the standard resolution) as well as compara-tive runs with the described SMR grid, requiring another contingent of more than 50 million additional core hours.The results of this study are summarized in Figs.1 and 2. They lead to the following important conclusions on the possibility to reliably capture the impact of turbulent convection on the onset of neutrino-driven explosions in simulations with the Prometheus-Vertex supernova code:1. Calculations with higher angular resolution show
more favorable conditions for explosions (Fig. 1). This backs up previous model runs where successful su-pernovae were obtained with the standard numeri-cal grid.
2. Cases evolving very close to the explosion threshold exhibit a particularly strong resolution sensitivity. In such a situation low resolution can prevent the runa-way expansion of the supernova shock.
3. Models with two degrees resolution show a clearly delayed development of turbulent postshock convec-tion (Fig.2) and are marginally acceptable. Conver-
gence seems to be achieved for an angular resolution around one degree.
4. The newly developed SMR technique can be safely applied for low-mass progenitors that are well be-yond the critical threshold for explosion. However, the SMR grid has a damping effect on the explosion in cases near the borderline and therefore requires further improvements.
The described resolution study performed with a Gauss computer-time grant is an indispensable step to consol-idate the still resolution-limited supernova simulations that are feasible on present-day supercomputers. The in-sights obtained in this project are of pivotal relevance for the strategic planning and optimization of future simu-lations, in particular with the SMR method, of this funda-mentally important problem of stellar, nuclear, neutrino and gravitational astrophysics.
References:
[1] Melson, Tobias, Janka, Hans-Thomas, and Marek, Andreas. Neutrino- driven Supernova of a Low-mass Iron-core Progenitor Boosted by Three-dimensional Turbulent Convection. Astrophysical Journal Letters 801, L24 (2015), arXiv:1501.01961
[2] Melson, Tobias, Janka, Hans-Thomas, Bollig, Robert, Hanke, Florian, Marek, Andreas, and Müller, Bernhard. Neutrino-driven Explosion of a 20 Solar-mass Star in Three Dimensions Enabled by Strange-quark Contributions to Neutrino-Nucleon Scattering. Astrophysical Journal Letters 808, L42 (2015), arXiv:1504.07631
[3] Melson, Tobias. Modeling Neutrino-driven Core-collapse Supernova Explosions in Three Dimensions. PhD Thesis. Technische Universität München (2016)
Figure 2: Vorticity in cross-sectional planes of four 3D simulations with different angular resolutions at 230 milliseconds after core bounce, i.e., after the stellar core has collapsed to a neutron star. The supernova shock can be recognized by the sharp discontinuity at a radius between 100 km and 200 km. It is clearly visible that low angular resolution (upper cases for four degrees, left, and two degrees, right) damps the development of turbulent postshock convection due to numerical viscos-ity, and that the model with static mesh refinement (SMR, bottom right) exhibits close similarity to the case with one degree angular resolution (bottom left).

22
Astrophysics
Introduction
The formation of the first galaxies marked the end of cosmological the dark ages and the beginning of the Ep-och of Reionization (EoR). Radiation from the first stars, hosted by the first galaxies, heated the surrounding in-ter-galactic gas via photo-ionization. As the ionized hy-drogen bubbles grew and percolated, the whole Universe was transformed from a dark, cold, neutral state into a hot ionized one: reionization was completed, about a bil-lion years after the Big Bang. This last major transition of the Universe is at the limit of our observational capabil-ities and is a key science driver of the foremost upcom-ing telescopes, such as the James Webb Space Telescope (JWST) and the Square Kilometre Array (SKA).
Cosmological simulations are great tools to disentan-gle the complex physics leading to reionization, a `loop’ encompassing an enormous range of physical scales: of gravitational collapse of dark matter into haloes, the condensation of gas into galaxies at the centres of those haloes, it’s eventual collapse into stars, which is regulat-ed by stellar radiation and supernova (SN) explosions, the emission of ionizing radiation from those stars, the prop-agation of the radiation to inter-galactic scales, and its interaction with gas along the way.
Simulations have given us a broad understanding of structure formation in the Universe, but yet there re-main many unanswered questions. For example, the timing and duration of reionization is very sensitive to the fraction of ionizing radiation emitted from stars that actually escapes out of galaxies. Therefore, it remains un-clear what kinds of galaxies were the main contributors to reionization. Was it powered by stars in high-mass gal-axies or low-mass galaxies? It is not even clear if reioni-
zation was powered at all by stars or other more exotic sources such as accreting black holes.
Thanks to computational methods developed by the team [1,2], the SPHINX suite of cosmological adaptive mesh refinement simulations [3] allow us for the first time to simultaneously capture the large-scale reioni-zation process and the escape of ionizing radiation from thousands of resolved galaxies. This is done using full radiation-hydrodynamics, that is explicitly modelling the emission and propagation of the radiation and it’s effect on gas. The largest SPHINX volumes are 10 co-mov-ing Mpc in width and obtain a physical resolution of 10 parsec1. Sub-resolution models for the formation of stars and SN explosions provide realistic descriptions of pro-cesses which happen well below our physical resolution. Figure 1 shows the range of scales (from Mpc to tens of pc) and physics (of dark matter, gas, stars, and radiation) represented in our simulation volumes.
Results and Methods
The pilot paper for the project [4] addresses the surpris-ing contribution from binary stars on reionization. Most stars in the Universe are in binary systems, with two stars locked in orbit around each other. If the orbits are close enough, the companion stars can exchange mass and they may even eventually merge into one massive star.
Such physics are far beyond the resolution of cosmologi-cal simulations, including SPHINX. To model the radiation coming from stellar populations, which are the smallest resolved objects in SPHINX, we rely on the results of re-searchers who specialise in the formation and evolution of stellar populations on much smaller scales and pro-
The SPHINX Simulations of the First Billion Years and Reionization1
Research InstitutionCentre de Recherche Astrophysique de LyonPrincipal InvestigatorJoakim RosdahlResearchersHarley Katz, Jérémy Blaizot, Taysun Kimm, Léo Michel-Dansac, Thibault Garel, Martin Haehnelt, Pierre Ocvirk, and Romain TeyssierProject PartnersSub-department of Astrophysics, University of Oxford; Kavli Institute for Cosmology and Institute of Astronomy, Cambridge; Department of Astronomy, Yonsei University, Seoul; Observatoire Astronomique de Strasbourg; Institute for Computational Science, University of Zürich
SuperMUC Project ID: pr53na (PRACE project)
1 A parsec, or pc, is a length unit corresponding to about 3.3 light-years, and a megaparsec, or Mpc, is a million parsecs. Like our Universe, the simu-lation volumes are expanding. A co-moving Mpc, or cMpc, is an expanding length scale which at our time ends at a length of 1 Mpc. The SPHINX simulations end when reionization has finished, when the Universe is only about 1/7th of it’s current size, that is 1 cMpc = 1/7 Mpc.

23
The SPHINX Simulations of the First Billion Years and Reionization
vide us with detailed descriptions of how stellar popula-tion luminosities evolve with age. While classical stellar population models ignore binary stars, newer models which account for them find that they lead to somewhat higher and much more prolonged ionizing luminosities, due to mass transfers between stars.
With the SPHINX simulations, we show that these binary models lead to much earlier and faster reionization than models with single stars only. This is due to a combina-tion of SN explosions and the prolonged luminosity of the stellar populations.
Stellar populations are born out of dense gas, and in the first few million years of their lifetime the radiation emit-ted by its stars is all absorbed by this dense environment: none of the radiation escapes. This surrounding gas is eventually cleared away by SN explosions, which start about 3 million years after the birth of the stellar pop-ulation. However, this coincides with a sudden dimming of the population, because the stars that explode first are also the most massive and luminous ones. Hence the population transitions quickly (over a few million years, which is very quick in astronomy) from high lumi-nosity with zero escape fraction to very low luminosity with nonzero escape fraction. Neither phase contributes much radiation to the inter-galactic Universe.
The introduction of binary stars alters the picture: due to mass transfer between binary companions, massive
luminous stars can exist long after the first few million years and hence the transition to low luminosities is not as steep, meaning a much larger amount of ionizing photons can escape at relatively late times into the large-scale Universe and contribute to reionization.
The resulting large-scale effect on reionization can be seen in Figure 2, which shows the evolution of the vol-ume-weighted ionized hydrogen fraction in the simu-lated SPHINX volumes, compared to data derived from observations of the early Universe (black symbols). The use of stellar population model which accounts for bina-ry stars leads to efficient reionization of the simulated volume, even somewhat ahead of the observational es-timates, while the model with single stars only leads to very inefficient reionization.
On-going Research / Outlook
The simulations presented in the pilot paper are being used to address a number of open questions about the early Universe. These include studies of what mass-range of galaxies, if any, dominates the contribution of radiation to reionization, how reionization suppresses the growth of low-mass galaxies by heating inter-ga-lactic gas and suppressing its collapse into galaxies, and predictions of the observational properties of the earliest galaxies.
References and Links
[1] Rosdahl, J., Blaizot, J., Aubert, D., Stranex, T., & Teyssier, R. 2013, MN-RAS, 436, 2188
[2] Katz, H., Kimm, T., Sijacki, D., & Haehnelt, M. G. 2017, MNRAS, 468, 4831
[3] http://sphinx.univ-lyon1.fr[4] Rosdahl, J., Katz, H., Blaizot, J., et al. 2018, eprint arXiv:1801.07259
Figure 2: Evolution of the volume weighted neutral fraction with redshift (a proxy for the expansion of the Universe: we live at redshift zero and the Universe was reionized around redshift 6). The black symbols show observationally derived constraints of reionization. The red curve shows the SPHINX simulated volume with single stars only assumed for the luminosities of stellar populations, while the blue line is from an identical simulation except that binary stars are accounted for in the stellar luminosities. This leads to a much more efficient reionization of the simulated volume. Accurate modelling of stellar populations is therefore highly relevant for understanding of reionization.
Figure 1: Projections from one of our simulation volumes at redshift 6 (about one billion years after the Big Bang). Circles mark radii of the more massive dark matter halos in the volume. Clockwise from top left, the first three panels show hydrogen gas column densities, NH, first for the full volume, then in the environment around the most massive halo, and finally inside that halo. The four sub-panels in the bottom left corner zoom in on the central galaxy and show, clockwise from top right, the column density of gas, the photoionization rate (Γ; a proxy for the flux of ionizing radiation), the fraction of ionized over total hydrogen (xHII), and distribution of stars (Σ*, in units of solar masses per square parsec). The physical scale is indicated in the lower left corner of each map.

24
Astrophysics
Introduction
During millions of years massive stars evolve through a sequence of nuclear burning stages, building up a degen-erate core of iron that is surrounded by shells of silicon, ox-ygen and neon, carbon, helium and hydrogen as “ashes” of the successive nuclear reactions. Finally, the iron core be-comes gravitationally unstable and collapses to a neutron star or black hole within less than one second. The huge amount of gravitational binding energy released in the collapse can power a supernova (SN) explosion, in which the outer shells of the progenitor star are expelled with velocities up to roughly 10 percent of the speed of light.
The physical cause for the explosion is debated for more than 50 years already. One of the mechanisms invokes energy deposition by neutrinos around the newly formed neutron star. Neutrinos are nearly massless, elementary particles, which are radiated in huge numbers by the ex-tremely hot (up to several 100 billion Kelvin) matter in the neutron star. The neutrinos carry away the binding energy of the compact remnant, which exceeds the ener-gy of a typical SN by more than a factor 100. The absorp-tion of only one percent of the neutrinos in the plasma surrounding the neutron star is therefore sufficient to explain the powerful SN blast.
Only recently modern three-dimensional (3D) neutrino-hy-drodynamical simulations have been able to provide quan-titative confirmation for the viability of this long-standing theoretical scenario of neutrino-driven explosions. The team of the PI participates in a worldwide effort in a lead-ing position, using most advanced numerical tools (the Pro-metheus-Vertex code) and being supported by an Advanced Grant of the European Research Council, entitled “Modeling Stellar Collapse and Explosion: Evolving Progenitor Stars to Supernova Remnants” [1]. Goal of this project is the consist-ent 3D modeling of SN explosions from the final phase of convective shell burning through stellar collapse and ex-plosion towards the early SN remnant evolution. Owing to GAUSS and PRACE computer-time grants also on Super-MUC, the PI’s team has achieved to obtain neutrino-driven SN explosions in some cases [2].
Results and Methods
However, the success was not straightforward. The first generation of 3D models computed by the Garching group did not explode, in contrast to previous axisym-metric (2D) simulations. To obtain SN explosions, the models had to be tweaked by invoking rapid progenitor rotation or a ~15% reduction of the neutral-current neu-trino-nucleon scattering. Both effects had to be assumed larger than is compatible with our present knowledge of neutrino-interaction physics and stellar evolution of SN progenitors.
These results suggest that some important ingredients may still be missing in state-of-the-art 3D simulations. One possibility is a lack of numerical resolution, which is severely constrained by the enormous CPU-time need-ed for the calculation of neutrino transport and interac-tions. Indeed, resolution studies with simplified toy mod-els suggest that a finer spatial grid reduces numerical viscosity and turbulent dissipation and thus can foster explosions (see SuperMUC project pr48ra). Whether this effect is sufficiently strong in full-fledged SN simulations can presently not be answered due to a lack of computa-tional resources. SuperMUC cannot stably provide more than the currently used ~16000 processor cores, which are only sufficient to compute models with two degrees angular resolution, requiring still more than half a year of permanent computing for a single SN run.
3D Supernova Simulations with 3D Progenitors and Muon Physics1
Research InstitutionMax Planck Institute for AstrophysicsPrincipal InvestigatorHans-Thomas JankaResearchersTobias Melson, Robert Bollig, Andreas Marek, Bernhard Müller, Alexander HegerProject PartnersMPCDF (Garching), Monash University (Australia)
SuperMUC Project ID: pr53yi (Gauss Large Scale project)
Figure 1: Radial component of velocity fluctuations (left) and turbulent Mach number (right) for a ~19 solar-mass star at the moment of core bounce. Dashed black and white circles mark the boundaries between the oxygen and silicon layers (outer circle) and between the silicon shell and the iron core, respectively. The turbulent Mach numbers exceed a value of 0.45 in some of the high-velocity patches.

25
3D Supernova Simulations with 3D Progenitors and Muon Physics
Another possible deficiency con-cerns remaining and unavoida-ble simplifications of the neutri-no-transport treatment, because present-day supercomputers are by far not powerful enough to rig-orously solve the time-dependent Boltzmann transport equation in six-dimensional phase (i.e., 3D po-sition and 3D momentum) space for all three flavors of neutrinos and antineutrinos. Therefore the Prometheus-Vertex code of the PI’s team makes use of the so-called “ray-by-ray plus’’ (RbR+) approxi-mation, in which the radiation intensity is assumed to be axially symmetric around the radial direction in every point of the spatial polar coordinate (or axis-free Yin-Yang) grid. Hereby nonradial components of the neutrino fluxes are ignored. Comparing to alternative transport treatments, however, shows very satisfactory reliabili-ty of results based on the RbR+ approximation for the problem considered (see SuperMUC project pr62za).
In project (pr53yi) described here, two other new ingre-dients in SN modeling are investigated in their conse-quences. The first aspect concerns the initial conditions. Traditionally, progenitor models were adopted from 1D calculations of stellar evolution to the onset of core collapse (2D or 3D calculations over millions of years of evolution are not feasible). Since the Prometheus-Ver-tex code maintains sphericity in 3D when starting with spherical initial data, we usually have to introduce ar-tificial (small) seed perturbations to initiate the devel-opment of nonradial hydrodynamical flows (convective overturn, the standing accretion-shock instability, turbu-lence) in regions where these instabilities are expected to grow. However, because of convective burning at the base of the silicon and oxygen shells, natural perturba-tions should exist in the progenitor star at the stage when its core begins to collapse. Within this project we have computed the final episode of oxygen-shell burn-ing of a ~19 solar mass star, going back in time seven minutes before the gravitational instability of the iron core sets in. Huge dipolar flows develop in the oxygen layer at this stage, exhibiting turbulent Mach numbers up to >0.45 (Fig. 1). These large-scale flows have been demonstrated to potentially have severe ramifications for the development of turbulence in the postshock lay-er. Stronger turbulent activity supports the shock revival by neutrino heating and thus can enable neutrino-driven explosions [3].
The second new aspect taken into account in the sim-ulations performed for this project is the inclusion of muons and of the corresponding neutrino interactions in the hot, dense medium of the newly formed neutron star. This physics has been ignored so far in SN modeling because of the long-standing prejudice that muons (be-cause of ~105 MeV rest mass) are not important during the early phase of the proto-neutron star evolution. How-ever, a detailed analysis reveals that significant numbers
of muons can be created by electromagnetic (“thermal”) pair processes and by the conversion of degenerate elec-trons to negative muons through weak interactions. Since the initial muon number in the collapsed stellar core vanishes and because muon antineutrinos escape faster from the dense interior, the neutron star muoniz-es during its cooling evolution. This is in stark contrast to the deleptonization with respect to electron-lepton number, which goes hand in hand with the conversion of the proton-rich pre-collapse state to the final conditions in a neutron-dominated cool neutron star.
2D SN simulations including muons performed by the PI’s team for the first time, have demonstrated that suc-cessful explosions can be obtained in cases where the models fail to explode without muons (Fig. 2 and [4]). This success is facilitated by a muon-induced faster con-traction of the nascent neutron star. The consequence is higher neutrino emission and corresponding enhanced neutrino-energy transfer behind the stalled SN shock.
On-going Research / Outlook
No conclusive results could be obtained yet for our 3D SN simulations with muons and 3D initial conditions. Be-cause 6-species (instead of 3-species) neutrino transport is needed to account for the muon physics self-consist-ently, the computations are considerably more expensive than without muons. Since only 120 million core-hours were granted on SuperMUC instead of the requested 151 million core-hours, the SN runs are still ongoing at the present time. Because an extension proposal for further CPU-resources was rejected, the project has to be termi-nated or postponed indefinitely.
References and Links
[1] mpa.iwww.mpg.de/220337/Modeling-Stellar-Collapse-and-Explosion[2] H.-T. Janka, T. Melson, and A. Summa. 2016. Physics of Core-Collapse
Supernovae in Three Dimensions: A Sneak Preview. Annu Rev Nucl Part S, 66, 1 (2016), 341–375. DOI: https://doi.org/10.1146/annurev-nucl-102115-044747
[3] B. Müller, T. Melson, A. Heger, and H.-T. Janka. 2017. Supernova Simulations From a 3D Progenitor Model - Impact of Perturbations and Evolution of Explosion Properties. Mon Not R Astron Soc, 472, 1 (2017), 491–513. https://doi.org/10.1093/mnras/stx1962
[4] R. Bollig, H.-T. Janka, A. Lohs, G. Martinez-Pinedo, C. J. Horowitz, and T. Melson. 2017. Muon Creation in Supernova Matter Facilitates Neutrino-Driven Explosions. Phys Rev Lett, 119, 4 (2017), id.242702. https://doi.org/10.1103/PhysRevLett.119.242702
Figure 2: Mass-shell plot with entropy (in kB per nucleon) color coded for 2D SN simulations of a 20 solar-mass star. The model on the left does not include muons and does not explode. In contrast, the model on the right includes muons and therefore develops an explosion, visible by the outgoing shock front (see [4]).

26
Astrophysics
Introduction
It has been a great fortune for the underlying project that its main purpose, which was formulated in the prog-nosticated title of the project has been acknowledged. Not even two years after the first detection of a gravita-tional wave (GW) emanated from the inward spiral and merger of pairs of a black holes by LIGO (GW150914), GWs from a binary neutron star merger has been recently dis-covered. In August 2017 GWs and electromagnetic coun-terparts were detected from the merger of binary neu-tron stars by the LIGO/Virgo collaboration and numerous observatories around the world. This long-awaited event (GW170817) marks the beginning of the new field of mul-ti-messenger gravitational wave astronomy. Exploiting the extracted tidal deformations of the two neutron stars from the late inspiral phase of GW170817 it is now possible to severely constrain several global properties of the equation of state (EOS) of dense matter. How-ever, the most interesting part of the high density and temperature regime of the EOS is solely imprinted in the post-merger GW emission from the remnant hypermas-sive/supramassive neutron star (HMNS/SMNS). This re-gime was not observed in GW170817, but will possibly be detected in forthcoming events within the next observ-ing run. Based on a large number of numerical-relativity simulations, the emitted GWs, the interior structure of the generated HMNS/SMNS, the accurate measurement of the amount of ejected material from the merger, the synthetic light curves of the produced kilonova signal,
the distribution of the abundances of heavy-elements and last but not least, the impact of magnetic fields on the long term ejection of mass have been investigated in detail within the underlying project pr62do.
Results and Methods
A multiplicity of quasi-circular and parabolic binary neu-tron star simulations have been performed in pure gen-eral relativistic hydrodynamics. Three finite temperature EOSs, three initial masses and two mass ratios have been explored in the quasi-circular runs, while the different simulations of the parabolic encounters contain two fi-nite temperature EOSs, two mass ratios and six different values of the impact parameter. Based on these simula-tions, the internal and rotational HMNS/SMNS proper-ties, the evolution of the density and temperature pro-files of the remnant HMNS/SMNS and their connection with the emitted GW signal have been analyzed in detail [1,2]. Additionally, the accurate measurement of “dynam-ical ejecta” from the merger of binary neutron stars have been investigated. The merger is an extremely disruptive process, especially if the stars do not have the same mass or do not merge from quasi-circular orbits but through a dynamical capture. Mass can be ejected either very rapidly -- via tidal torques at the time of the dynamically merger or encounter -- or more slowly -- via winds that can be due to a number of different processes, which range from shock-heating to neutrino emission. This gravitationally unbound matter represents the perfect
Preparing for the imminent detection of gravitational waves from binary neutron stars1
Research InstitutionInstitute for Theoretical Physics (ITP), Goethe University FrankfurtPrincipal InvestigatorLuciano RezzollaResearchersLuke Bovard, Federico Guercilena, Matthias Hanauske, Elias Most, Antonios Nathanail, Jens PapenfortProject Partners—
SuperMUC Project ID: pr62do (Gauss Large Scale project)
Figure 1: Heavy-elements abundances (filled circles) versus the mass number A when computed for different EOSs, masses and mass ratios (shown with different lines). The left, middle and right panels refer to the DD2, the LS220, and the SFHO EOS, respectively. The vertical lines mark a few repre-sentative r-process elements: Figure taken from [2].

27
Figure 2: Gravitational wave strain signal of three representative eccentric merger models at an artificial distance of 100 Mpc. In the bottom row the respective spectrograms are shown. The dashed white line is the f-mode frequency of a single star of these models.
Preparing for the imminent detection of gravitational waves from binary neutron stars
site for r-process nucleosynthesis and, if containing suf-ficient mass, can also lead to a bright electromagnetic signal, known as a “kilonova”, as the material decays ra-dioactively. In the follow-up observations of GW170817, a kilonova was observed providing the first definitive and undisputed confirmation of a kilonova and the forma-tion of r-process elements from merging neutron stars. To investigate the r-process formation in merging neu-tron stars, a variety of simulations were performed [2] using numerous EOSs, initial masses, and mass ratios which well sample the parameter space of BNS mergers.
Measuring the ejected material from these simulations we found that the amount of ejected material is on the order of ~10–3 Msolar but sensitively depends on the numer-ical parameters, such as grid resolution, unbound criteri-on, and neutrino treatment. Using a novel tracer method [2], the fluid elements could be followed along fluid lines which allowed for an accurate computation of the results from r-process nucleosynthesis. The result of this nucleo-synthesis is displayed in Fig.1 for all the simulations in [2]. These simulations demonstrate that the r-process nucle-osynthesis from binary mergers is “robust”, in that it is almost entirely independent on the initial masses, mass ratios, or EOS. Additionally, tracer data was also used to compute kilonova light curves. When comparing the pro-duced light curves from the different simulations with those observed, show that our results are significantly dimmer than those observed, which was due lower eject-ed amount of ejected material and a lack of lanthanides. This suggests that the dynamical ejecta is not the major source of ejecta from a merger, but places a secondary role to other forms of secular ejecta, such as from neutrino driven winds or viscous ejecta from a disk.
A further use of the data produced from the simulations of [2], was used to investigate the effects of viscous dissi-pation in the post-merger of BNS mergers [3]. It was found by analyzing the data that the viscous effect of bulk vis-cosity can play an important role in post-merger dynamics which can be measured through the gravitational wave. This implies that the assumption of a perfect fluid inside the HMNS/SMNS needs to be relaxed to allow for viscous effects. The implementation of the relevant viscous contri-butions is presently under construction.
Another more uncommon type of merging BNS systems are highly eccentric mergers. These systems can form in environments of high stellar density as globular clus-ters as opposed to the primordial systems which lead to quasi-circular mergers. We carried out a series of sim-ulations including the same mass ratio and EOSs as in the quasi-circular models described above, as well as dif-ferent orbital configurations to determine the amount and properties of the ejected material. Depending on the EOS and the mass ratio we showed that the outflow can reach almost 10–1 Msolar , which is significantly more than in the quasi-circular models and suggest a clear al-teration of a kilonova signal coming from such mergers. Despite the fact that the thermodynamic properties of the dynamical ejecta differ considerably between the different models, the resulting r-process nucleosynthesis leads to almost the same abundances patterns as the quasi-circular models emphasizing the “robustness” of this process. Additionally, the gravitational wave signals coming from merging eccentric binaries have been ana-lyzed and a selection is depicted in Fig. 2. Depending on the impact parameter the system undergoes multiple close encounters, where in each of these part of the or-bital energy and angular momentum are radiated away in a burst of GWs. Due to the strong tidal effects the stars start to oscillate and radiate GWs with their f-mode fre-quency until they merge eventually. Especially the burst signals could be observed with future GW detectors from which one could deduce the position of the follow-ing kilonova emission.
On-going Research / Outlook
Presently the impact of magnetic fields and neutrinos on the long term ejection of mass and the implementation of phase transitions in the EOSs and their impact on the emitted GWs are under investigation.
References and Links
[1] Phys. Rev. D, 96(4):043004 (2017), “Rotational properties of hyper-massive neutron stars from binary mergers”
[2] Phys. Rev. D, 96(12): 124005 (2017), “On r-process nucleosynthesis from matter ejected in binary neutron star mergers”
[3] Phys. Rev. Lett., 120:041101 (2018), “Viscous dissipation and heat conduction in binary neutron-star mergers”
[4] Comput. Astrophys. Cosmol. 4:3 (2017), “Entropy-limited hydrody-namics: a novel approach to relativistic hydrodynamics”

28
Astrophysics
Introduction
Stars form in molecular clouds (MCs), which are dense (mean number densities ≥100 cm-3) and cold (T ≈ 10 K) objects that form out of the warm and more diffuse in-terstellar medium in a galactic disk. MCs are short-lived, dynamically evolving and very turbulent. They are possi-bly assembled on time scales of a few to a few ten mil-lion years and develop a filamentary substructure. Fur-ther, the filaments fragment to form dense cores, which become self-gravitating and form stars.
When averaged over the whole galactic disk, the star formation efficiency in molecular gas, i.e. the fraction of molecular gas that is converted into stars, is observed to be only of the order of ~1%, which leads to a long de-pletion time scale of molecular gas. This is in apparent disagreement with the rapid evolution of MCs towards star formation. The solution to this dilemma could be the effective dispersal of the parental MCs from within – by feedback from newly born stars. In particular massive stars with a mass larger than ~8 times the mass of the Sun provide highly energetic feedback to the surround-ing medium in the form of ionizing radiation and the associated radiation pressure, stellar winds, and super-novae. The feedback has been proposed to quench star formation inside the MC and to efficiently limit the ac-cretion of fresh gas onto the evolving MC [2].
Overall, the early evolution of an individual MC and its star formation properties are closely connected to the properties of the surrounding interstellar medium (ISM). Hence, MC formation, evolution, star formation and feed-back, should be modeled simultaneously and within the galactic environment. Due to the high physical complex-ity and dynamic range of the involved density and spatial scale, this is a computationally very challenging task.
In the SILCC-ZOOM Gauss project we modeled the for-mation of dense and cold molecular clouds from the multi-phase interstellar medium (ISM) and their subse-quent dispersal by stellar feedback on sub-parsec scales. Therefore, we carried out novel three-dimensional (3D),
adaptive-mesh-refinement (AMR), magneto-hydrody-namical (MHD), galactic zoom-in simulations with the MPI-parallel, finite-volume code FLASH [3].
Results and Methods
The calculations were carried out with our version of FLASH 4.3 [3], which includes a chemical network to treat heating by a background or a direct radiation field, radiative cooling and molecule formation [4 and refer-ences therein; based on e.g. 5], a tree-based method for self-gravity and radiative transfer [6], and sink particles with a star formation sub-grid model which follows the major evolutionary phases of the massive stars [2,7], in particular their wind and radiation output. The initial conditions are themselves based on simulations that were carried out in the SILCC project [1,2,4,7,8] under Gauss Call No. 7, which has been shown to reproduce a realistic multi-phase ISM with reasonable MC properties.
SILCC-ZOOM: The formation and dispersal of molecular clouds1
Research InstitutionI. Physikalisches Institut, Universität zu KölnPrincipal InvestigatorStefanie WalchResearchersDaniel Seifried, Sebastian Haid, Thorsten NaabProject PartnersMax-Planck-Institut für Astrophysik, Garching b. München
SuperMUC Project ID: pr62su (Gauss Large Scale project)
Figure 1: A molecular cloud formed from the multi-phase interstellar medium in a SILCC-ZOOM simulation. The filamentary substructure is a natural consequence of the chaotic assembly of the gas in combination with self-gravity and gas cooling leading to thermal instability. Figure taken from [9].

SILCC-ZOOM: The formation and dispersal of molecular clouds
In different galactic environments simulated in SILCC, we identify the regions where MCs are about to form and zoom in on them using the AMR technique. Thus, we local-ly allow for a high spatial resolution (< 0.1 parsec) within a region with a side length of ~100 parsec. Throughout the zoom-in calculation, we continue to follow the full galactic environment at lower resolution. Therefore the MCs may accrete gas from the surrounding medium and could be heated and stirred by nearby supernova explosions [9, 10]. Typically a zoom-in simulation took 1 million CPU-hours.
The simulations naturally develop the observed internal turbulent and filamentary MC substructure (see [9] and Fig. 1 for an example of a formed MC in one of the zoom-in runs with solar neighborhood properties of the ambient multi-phase ISM). The simulations allow us to determine due to which physical process, e.g. turbulence, gravity, thermal instability, and/or magnetic fields, the filaments are imprinted. For instance, we find obvious striations off the formed filaments in MHD runs, which are in agree-ment with recent observations of the Taurus MC [11] and stem from magneto-sonic waves travelling through the cloud. These features are completely absent in purely hy-drodynamical simulations.
On the resolution scale of ~0.1 parsec, sink particles are introduced. These include a sub-grid star cluster model and track the formation of individual massive stars and their associated feedback. First, by switching on each feed-back process individually and in combination, i.e. ionizing radiation, radiation pressure and stellar wind, we carefully explore their relative impact on the ambient medium. The “impact” is quantified in terms of energy and momentum deposited in the MC [12]. We confirm that radiative feed-back is dominant in the dense and cold ISM (as has been shown in many previous works), but we can clearly show that a warm ambient medium (T > few 1,000 K) is domi-nated by stellar wind feedback because the radiation fails to couple to the gas in this case.
In realistic MCs as modeled in the SILCC-ZOOM simu-lations, massive stars are embedded within cold gas in the young star-forming cloud for the first million years. Thereafter, the stars break out of their birthplaces and start to dissolve the MC. Moreover, some of the massive stars escape as run-away stars. Therefore, in realistic MC environments, the initial phases of star formation are
dominated by radiative feedback [13], while the stellar winds will become influential once they can leak out of the dense parts of the cloud. In Fig. 2 we show one MC at an evolutionary stage, where massive stars have already been formed and disperse the cloud from the inside.
In order to carry out these simulations, we developed a backward radiative transfer scheme (TreeRay), which is an extension to the tree solver for self-gravity and dif-fuse radiation presented in [6]. The novel method has the great advantage that the amount of computational work does not scale with the number of sources as typical for most radiative transfer schemes. It also parallelizes very well. However, we are somewhat limited by the required amount of memory. Therefore, the optimal choice for us was to run each simulation on up to 2,000 cores, and to run several simulations in parallel. In total we used 67 million CPU-hours for the SILCC-ZOOM project. The over-all storage needed to store the time-dependent 3D data was of the order of 100 TB.
On-going Research / Outlook
The simulations we performed are currently world-lead-ing and would have not been possible without the com-putational resources we could use on SuperMUC. Multi-ple research papers are currently in preparation.
We are working on a hybrid parallelization scheme for our simulation code such that the current memory re-quirement can be reduced. We now aim for (1) simulat-ing larger pieces of the galactic disk at high (sub-parsec) resolution and (2) zoom-in even to much smaller scales of a few Astronomical Units within some clouds to fol-low the star formation process, the fragmentation of the gas to individual stars, the formation of protostellar disks from self-consistent initial conditions, and protostellar feedback in the form of self-consistently driven jets and outflows, which all deserve detailed studies.
References and Links
[1] www.astro.uni-koeln.de/silcc[2] Gatto, Walch + SILCC (2017), MNRAS, 466, 1903[3] http://flash.uchicago.edu/site/[4] Walch + SILCC (2015), MNRAS, 454, 238[5] Glover & Mac Low (2011), MNRAS, 412, 337[6] Wünsch, Walch, et al. (2018), MNRAS, 475, 3393[7] Peters + SILCC (2017), MNRAS, 466, 3293[8] Girichidis, Walch + SILCC (2016), MNRAS, 456, 3432[9] Seifried, Walch, et al. (2017), MNRAS, 472, 4797[10] Seifried, Walch, et al. (2018), ApJ, 855, 81[11] Heyer et al. (2016), MNRAS, 461, 3918[12] Haid, Walch, Seifried, et al. (2018a), sub. to MNRAS[13] Haid, Walch, Seifried, et al. (2018b), sub. to MNRAS
Figure 2: Example of a zoom-in cloud with radiative feedback from the formed massive stars shown at 1.5 Myr after the first massive star has been formed. From left to right we plot the surface densities of all gas, molecular and ionized gas as well as the resulting Hα emission. The symbols show sink particles with (star symbols) and without (circles) massive stars. The developed HII regions are highly structured and variable in time. The molec-ular cloud is dispersed by the radiative feedback. Figure taken from [13].

30
Astrophysics
Introduction
Supernova (SN) explosions terminate the lives of stars that possess more than about nine solar masses. They are among the most spectacular phenomena in the uni-verse, can become as bright as a whole galaxy for weeks and thereby release more energy than the sun will radiate during its 13 billion years of life. SNe are the birth sites of neutron stars and black holes. They play an important role in galaxy evolution because the matter expelled in the explosions is enriched with the chemical elements that allowed the earth and the life on it to form.
Only in recent years three-dimensional (3D) simulations of SNe have become feasible, enabled by the growing power of modern supercomputers and the availability of highly parallelized simulation programs. The team of the PI participates in this worldwide effort in a leading posi-tion, supported by an Advanced Grant of the European Research Council, entitled “Modeling Stellar Collapse and Explosion: Evolving Progenitor Stars to Supernova Rem-nants” [1]. Goal of this project is the consistent 3D mod-eling of SN explosions from the final phase of convective shell burning through stellar collapse and explosion to-wards the early SN remnant evolution.
One of the central questions in this context concerns the physical mechanism by which the catastrophic collapse of the stellar core to a compact object (a neutron star or black hole) is reversed to the powerful ejection of most of the star’s material in the SN blast. For more than 50 years it has been hypothesized that neutrinos are the crucial agents that can establish the energy transfer needed to drive this explosion. Less than one percent of all emitted neutrinos are sufficient to do this job, because these el-ementary particles carry away the gigantic gravitational binding energy of the compact remnant, which exceeds the SN energy more than hundredfold.
Results and Methods
Only recently modern 3D neutrino-hydrodynamical sim-ulations, for the first time achieved by the PI and his
team and rendered possible through GAUSS and PRACE computer-time grants also on SuperMUC, have been able to provide quantitative support for this long-standing theoretical scenario [2,3].
SN modeling in 3D including full-fledged neutrino trans-port and a state-of-the-art treatment of the neutrino interactions is extremely CPU-time consuming. A single explosion run requires more than half a year of continu-ous parallel computing on over 16,000 SuperMUC pro-cessors. Nevertheless, approximations in the neutrino transport have to be accepted because present-day su-percomputers are by far not powerful enough to solve the time-dependent Boltzmann transport equation in six-dimensional phase (i.e., 3D position and 3D momen-tum) space for all three flavors of neutrinos and antineu-trinos. Therefore the Prometheus-Vertex code of the PI’s team makes use of the so-called “ray-by-ray plus’’ (RbR+) approximation, in which the radiation intensity is assumed to be axially symmetric around the radial direction in every
Testing Neutrino Transport Treatments in 3D Supernova Simulations1
Research InstitutionMax Planck Institute for AstrophysicsPrincipal InvestigatorHans-Thomas JankaResearchersRobert Glas, Oliver JustProject PartnersAstrophysical Big Bang Laboratory, RIKEN (Japan)
SuperMUC Project ID: pr62za
Figure 1: Average radii of SN shock (Rs), gain layer (Rg), and neutron star (Rns) for 3D SN simulations of an exploding 9 solar-mass star (top) and a nonexploding 20 solar-mass star (bottom). Each of the panels compares four runs for low (L) and high (H) resolution, using the RbR+ transport approximation or the FMD-M1 scheme. Aside from stochastic fluctua-tions due to turbulent flows in the 20 solar-mass model the agreement is very good.

Testing Neutrino Transport Treatments in 3D Supernova Simulations
point of the spatial polar coordinate (or axis-free Yin-Yang) grid. Hereby nonradial components of the neutrino fluxes are ignored, assuming they are of minor importance in cas-es where the collapsing stellar core does not become glob-ally deformed due to, e.g., contrifugal flattening caused by rapid rotation. The RbR+ approximation reduces the com-putational complexity by time integration of 1D transport problems for all angular (latitudinal-azimuthal) directions. For this purpose the Prometheus-Vertex code employs a solver for the neutrino two-moment (i.e., energy and mo-mentum) equations with an accurate variable-Eddington closure deduced from the 1D Boltzmann equation. Thus computing >16,000 1D transport problems (each of them being dependent on radius, neutrino energy, and polar an-gle of neutrino propagation) with little communication fa-cilitates highly efficient parallel implementation.
Of course, this approximation must be tested. To this end the PI’s team developed the ALCAR code, which solves the full multidimensional (FMD) neutrino transport by a two-moment (M1) scheme with an algebraic closure relation [4]. M1 schemes are currently a very popular approximation of neutrino transport, also replacing an unfeasible rigorous integration of the (6+1)-dimensional Boltzmann equation. They are complementary to RbR+, because nonradial flux components are taken into ac-count. Based on time-dependent axisymmetric (2D) sim-ulations with an M1 scheme and on stationary low-res-olution solutions of the Boltzmann equation, RbR+ was criticised in recent literature to lack accuracy and to pro-duce artificial SN explosions in 2D.For this project we performed, for the first time, 3D full-sphere hydrodynamical simulations with the ALCAR code using the M1–FMD and RbR+ approximations for neutrino transport. We considered progenitor stars of 9 and 20 so-
lar-masses, both with low (L) spatial resolution (320, 40, 80 grid cells in radial, lateral, and azimuthal directions) and high (H) resolution (640, 80, 160 cells) and with 15 energy groups for the neutrino transport in all runs. Also a corresponding set of 2D cases was calculated. For saving computer time in these test models, we applied various simplifications of the complex neutrino interaction physics. This allowed us to conduct the project with 30 million core hours, using up to 8000 cores and up to 1.5 TByte of SCRATCH space per single job. In total, 100 TBytes of data were generated.
With the chosen physics setup the 9 solar-mass star ex-plodes whereas the 20 solar-mass progenitor fails to de-velop a SN explosion (Fig 1). Thus we could test the FMD against the RbR+ scheme both for successful and unsuc-cessful SN cases.In 3D, the agreement between FMD and RbR+ results for “L” and “H” cases is extremely satisfactory (see Figs.1–3). This verifies and backs up the published 3D SN results of the Garching group produced with the Prometheus-Ver-tex code using RbR+ neutrino transport.
On-going Research / Outlook
Unfortunately, higher-resolution simulations for testing convergence of the 3D results are currently prohibited by their huge computational demands. ALCAR will be further upgraded by better neutrino interactions, an ax-is-free Yin-Yang grid, and a 3D gravity treatment to inves-tigate globally deformed SNe expected for fast rotation.
References and Links
[1] mpa.iwww.mpg.de/220337/Modeling-Stellar-Collapse-and-Explosion[2] H.-Thomas Janka, Tobias Melson, and Alexander Summa. 2016.
Physics of Core-Collapse Supernovae in Three Dimensions: A Sneak Preview. Annu Rev Nucl Part S, 66, 1 (2016), 341–375. DOI: https://doi.org/10.1146/annurev-nucl-102115-044747
[3] H.-Thomas Janka. 2018. Zündende Neutrinos. Physik Journal, 17, 3 (2018), 47–53. http://www.pro-physik.de/details/physikjournal Article/10870177/Zuendende_Neutrinos.html
[4] Oliver Just, Martin Obergaulinger, H.-Thomas Janka. 2015. A new Multidimensional, Energy-dependent Two-moment Transport Code for Neutrino-hydrodynamics. Mon Not R Astron Soc, 453, 4 (2015) 3386–3413. DOI: https://doi.org/10.1093/mnras/stv1892
Figure 2: Total energy deposition rate by neutrinos in the gain layer (be-tween Rg and Rs; Fig. 1) versus time for the 20 solar-mass “H” simulations (black). While the 2D RbR+ simulation shows the larger fluctuations reported already previously, in particular in a 19-degree polar cone around the artificial symmetry axis (green; upper panels), the 3D RbR+ run does not exhibit any worrisome artifacts and is in excellent agreement with FMD (lower panels).
Figure 3: Color-coded fluctuations of the local neutrino heating and cool-ing rates relative to the angular averages for the “H” runs of the 20 so-lar-mass star with FMD (upper panels) and RbR+ transport (lower panels). The left column contains instantaneous results at 175 ms, the right column averages over 30 ms (see labeling). Again, the agreement in amplitudes and spatial scales between RbR+ and FMD is very assuring, when natural stochastic fluctuations due to turbulent convection are ignored.

32
Astrophysics
Massive stars end their lives in a catastrophic gravitation-al collapse of their central cores, in course of which huge amounts of energy are released that can power gigan-tic explosions known as supernovae. These fascinating events can shine as bright as a whole galaxy for weeks; they give birth to neutron stars or black holes, eject a ma-jor part of the heavy elements created since the Big Bang in stars and during their terminal explosions, and they are important players to determine the dynamical evolution of galaxies and the formation of many generations of stars therein. Understanding the physical processes that drive the supernova outbursts is of crucial importance not only for understanding the properties of these cosmic blasts but also for predicting the neutrino and gravitation-al-wave signals that will be measured in the case of a fu-ture event in our Milky Way Galaxy.
Owing to the growing power of modern massively par-allel supercomputers, considerable progress towards un-ravelling the explosion mechanism could be achieved in recent years. Three-dimensional simulations of stellar core collapse with a detailed description of the crucial neutrino physics lend support to the so-called delayed
neutrino-driven mechanism, in which neutrinos — ra-diated in huge numbers by the extremely hot matter of the collapsed stellar core — heat the plasma surrounding the newly formed neutron star. Because of the enormous complexity of the involved physics and the inaccessibility of the extreme conditions in supernova interiors to labo-ratory experiments, computer simulations are indispen-sable to decipher the processes that initiate and power the explosions. Three-dimensional models are needed be-cause nonradial hydrodynamic mass motions (“instabili-ties”) and turbulent flows support the neutrino heating and impose large-scale asymmetries on the ejecta of the explosion. The necessity of global 3D modeling and the si-multaneous need to resolve turbulent flows on relatively small scales, combined with the excessive computational demands connected to the high dimensionality of a de-tailed description of neutrino transport and interactions, set the requirements for the computing resources. One run of a full-scale supernova model with the standard choice of two degrees resolution in both angular direc-tions of a polar grid requires about 50 million core hours on typically 16,000 cores of SuperMUC, corresponding to roughly 4.5 months of round-the-clock computing.
Longtime 3D Supernova Simulations for
Establishing the Progenitor-Remnant Connection1
Research InstitutionMax Planck Institute for Astrophysics, Karl-Schwarzschild-Str. 1, GarchingPrincipal InvestigatorHans-Thomas JankaResearchersTobias Melson, Alexander Summa, Bernhard Müller, Andreas MarekProject PartnersQueen’s University Belfast and Monash Centre for Astrophysics, Monash UniversityMax Planck Computing and Data Facility (MPCDF), Garching.
SuperMUC Project ID: pr74de (Gauss Large Scale project)
Figure 1: Sequence of volume-rendered snapshots for the time evolution of an exploding 15 solar-mass star with rapid rotation. Colors represent entropy per nucleon. The neutrino-driven explosion is supported by a powerful spiral mode of the standing-accretion-shock in-stability (SASI), which drives shock ex-pansion predominantly perpendicular to the rotation axis. The rotation axis coincides with the z-axis of the tripod in the lower left corner of each panel, and the supernova shock is visible as a bluish, transparent surface enveloping high-entropy bubbles of neutrino heat-ed matter (red-orange-yellow surface). Time (information in the upper left corner of each panel) is measured in milliseconds after the formation of the supernova shock. (© Author and The American Astronomical Society)
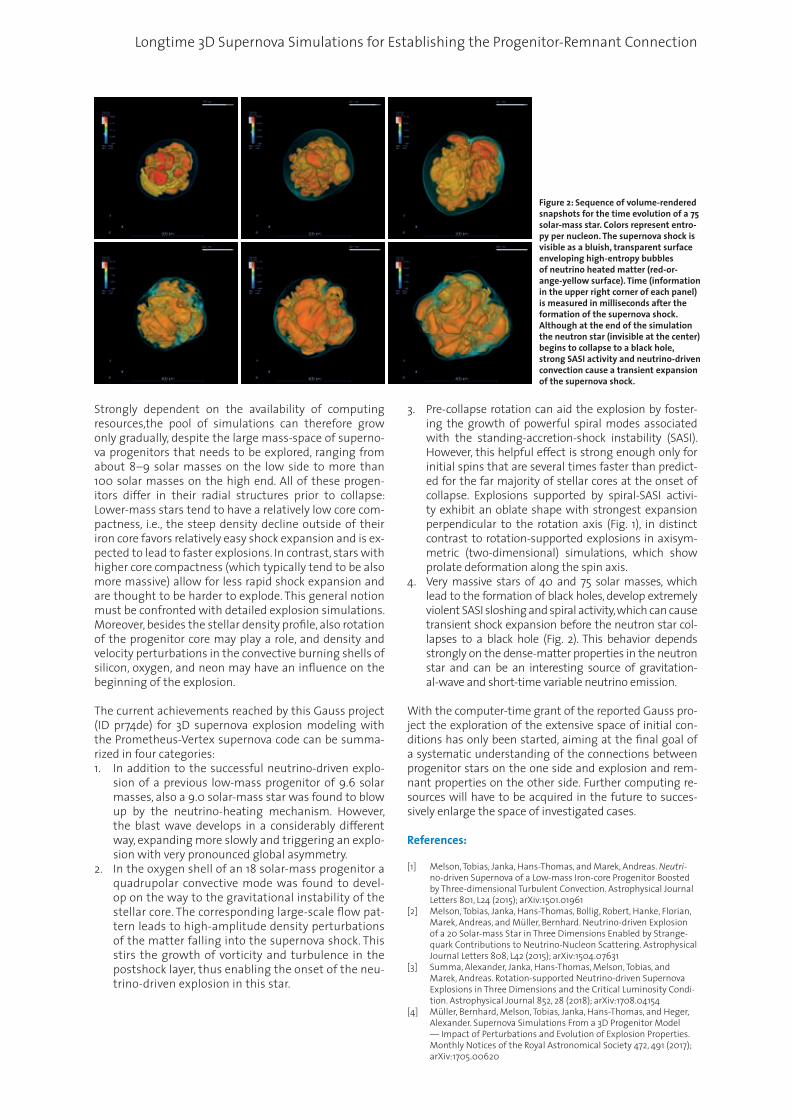
Longtime 3D Supernova Simulations for Establishing the Progenitor-Remnant Connection
Strongly dependent on the availability of computing resources,the pool of simulations can therefore grow only gradually, despite the large mass-space of superno-va progenitors that needs to be explored, ranging from about 8–9 solar masses on the low side to more than 100 solar masses on the high end. All of these progen-itors differ in their radial structures prior to collapse: Lower-mass stars tend to have a relatively low core com-pactness, i.e., the steep density decline outside of their iron core favors relatively easy shock expansion and is ex-pected to lead to faster explosions. In contrast, stars with higher core compactness (which typically tend to be also more massive) allow for less rapid shock expansion and are thought to be harder to explode. This general notion must be confronted with detailed explosion simulations. Moreover, besides the stellar density profile, also rotation of the progenitor core may play a role, and density and velocity perturbations in the convective burning shells of silicon, oxygen, and neon may have an influence on the beginning of the explosion.
The current achievements reached by this Gauss project (ID pr74de) for 3D supernova explosion modeling with the Prometheus-Vertex supernova code can be summa-rized in four categories:1. In addition to the successful neutrino-driven explo-
sion of a previous low-mass progenitor of 9.6 solar masses, also a 9.0 solar-mass star was found to blow up by the neutrino-heating mechanism. However, the blast wave develops in a considerably different way, expanding more slowly and triggering an explo-sion with very pronounced global asymmetry.
2. In the oxygen shell of an 18 solar-mass progenitor a quadrupolar convective mode was found to devel-op on the way to the gravitational instability of the stellar core. The corresponding large-scale flow pat-tern leads to high-amplitude density perturbations of the matter falling into the supernova shock. This stirs the growth of vorticity and turbulence in the postshock layer, thus enabling the onset of the neu-trino-driven explosion in this star.
3. Pre-collapse rotation can aid the explosion by foster-ing the growth of powerful spiral modes associated with the standing-accretion-shock instability (SASI). However, this helpful effect is strong enough only for initial spins that are several times faster than predict-ed for the far majority of stellar cores at the onset of collapse. Explosions supported by spiral-SASI activi-ty exhibit an oblate shape with strongest expansion perpendicular to the rotation axis (Fig. 1), in distinct contrast to rotation-supported explosions in axisym-metric (two-dimensional) simulations, which show prolate deformation along the spin axis.
4. Very massive stars of 40 and 75 solar masses, which lead to the formation of black holes, develop extremely violent SASI sloshing and spiral activity, which can cause transient shock expansion before the neutron star col-lapses to a black hole (Fig. 2). This behavior depends strongly on the dense-matter properties in the neutron star and can be an interesting source of gravitation-al-wave and short-time variable neutrino emission.
With the computer-time grant of the reported Gauss pro-ject the exploration of the extensive space of initial con-ditions has only been started, aiming at the final goal of a systematic understanding of the connections between progenitor stars on the one side and explosion and rem-nant properties on the other side. Further computing re-sources will have to be acquired in the future to succes-sively enlarge the space of investigated cases.
References:
[1] Melson, Tobias, Janka, Hans-Thomas, and Marek, Andreas. Neutri-no-driven Supernova of a Low-mass Iron-core Progenitor Boosted by Three-dimensional Turbulent Convection. Astrophysical Journal Letters 801, L24 (2015); arXiv:1501.01961
[2] Melson, Tobias, Janka, Hans-Thomas, Bollig, Robert, Hanke, Florian, Marek, Andreas, and Müller, Bernhard. Neutrino-driven Explosion of a 20 Solar-mass Star in Three Dimensions Enabled by Strange-quark Contributions to Neutrino-Nucleon Scattering. Astrophysical Journal Letters 808, L42 (2015); arXiv:1504.07631
[3] Summa, Alexander, Janka, Hans-Thomas, Melson, Tobias, and Marek, Andreas. Rotation-supported Neutrino-driven Supernova Explosions in Three Dimensions and the Critical Luminosity Condi-tion. Astrophysical Journal 852, 28 (2018); arXiv:1708.04154
[4] Müller, Bernhard, Melson, Tobias, Janka, Hans-Thomas, and Heger, Alexander. Supernova Simulations From a 3D Progenitor Model — Impact of Perturbations and Evolution of Explosion Properties. Monthly Notices of the Royal Astronomical Society 472, 491 (2017); arXiv:1705.00620
Figure 2: Sequence of volume-rendered snapshots for the time evolution of a 75 solar-mass star. Colors represent entro-py per nucleon. The supernova shock is visible as a bluish, transparent surface enveloping high-entropy bubbles of neutrino heated matter (red-or-ange-yellow surface). Time (information in the upper right corner of each panel) is measured in milliseconds after the formation of the supernova shock. Although at the end of the simulation the neutron star (invisible at the center) begins to collapse to a black hole, strong SASI activity and neutrino-driven convection cause a transient expansion of the supernova shock.

34
Astrophysics
Introduction
Galaxy clusters are formidable reservoir of galaxies (ag-glomerate of stars, planets and dust). As such they are perfect objects of studies to unravel the mysteries of gal-axy formation and evolution in dense environments. At about 50 millions light-years from us, the Virgo cluster, a gathering of more than a thousand galaxies is our clos-est cluster-neighbor. Its proximity with us permits deep observations. However, accessing the past history of the Virgo cluster from nowadays observations is not trivial. At this stage, cosmological numerical simulations of the cluster come in handy. In such simulations, dark matter (nature of most of the matter in the Universe) and bary-ons (visible matter) follow physical laws to reproduce our closest cluster-neighbor and its galaxies in a simulated box across cosmic time.
However there exists a large variety of clusters born in different cosmic environments. Thus reproducing our closest cluster-neighbor within its cosmological environ-ment constitutes a numerical challenge. Efficient simu-lacra of the Virgo cluster can be obtained via simulations that resemble our cosmic neighborhood down to the cluster scale. Virgo-like clusters form then in the proper environment and permit assessing the most probable formation history of the cluster. To model the galaxy population of the cluster high-resolution simulations are required. Such simulations can be performed only on the largest supercomputers.
Results and Methods
Simulations that resemble our local neighborhood need to be performed in large boxes to counteract the peri-odic boundary conditions. Such conditions are essential to fulfill the laws of the conservation of matter. In about 1 billion light-years boxes, reaching a particle mass of 107 times the solar mass is quite challenging especially when including the full hydrodynamical processes fol-lowed by the baryons (gas).
A democratized procedure to achieve such resolution in large boxes when the focus is only one object (here the Virgo cluster) is the zoom-in technique. This technique permits increasing the resolution of the simulation only in the region of interest while keeping the rest of the box at low resolution. Thus without any additional computa-tional effort, the effect of the whole box-environment on the cluster is preserved while the time is mostly used to compute at high resolution the history of the cluster and its constituents: the galaxies.
Still, 10 millions cpu-hours were required to simulate the sole full formation of the cluster from the early Universe until nowadays with full hydrodynamics and with a par-ticle mass of 107 times the solar mass. About 3000 cores were requested. 251 time steps of the simulation were recorded for a total of no less than 21 TB of data. More than 3.6 millions files were produced. All these numbers do not include all the preliminary computing time re-quired to test the code, prepare the initial conditions for the simulation and identify the Virgo cluster simulacrum in the selected simulation. More information are availa-ble at [1].
Preliminary steps include preparing the observation-al data to constrain the initial conditions so that the resulting structures in the box, at the end of the simu-lation run, look like our local environment. These data need indeed to undergo grouping, bias minimization [2] before being inserted into the whole machinery [3] to produce the initial conditions. 200 initial conditions were prepared and run at a low resolution. They allowed us to identify the unique (position, location, mass) Virgo cluster look-alike in each simulation by identification to our local environment. The observer was assumed to be at the center of the boxes and the latter were oriented like our neighborhood. With these 200 simulated Virgo clusters, we conducted a statistical study and found for instance that the Virgo cluster had had most probably a quiet merging history within the last 7 Gigayears and formed along a preferential direction.
Light on the Virgo cluster of galaxies: our closest cluster-neighbor 1
Research InstitutionCentre de Recherche Astrophysique de Lyon & Leibniz-Institut für AstrophysikPrincipal InvestigatorJenny G. SorceResearchersJérémy Blaizot, Yohan Dubois, Stefan GottlöberProject PartnersCRAL Lyon, IAP Paris, AIP Potsdam
SuperMUC Project ID: pr74je

35
From these 200 simulated Virgo clusters, we selected the cluster whose properties make it the average Virgo cluster. The zoom-in technique implemented in the MU-SIC code allowed us to increase the resolution. We ran then the simulation using the RAMSES code with hydro-dynamical implementations detailed in [4]. Here again, preliminary tests with the code were necessary to run it properly on the supercomputer.
After 10 millions cpu-hours, the full history of the for-mation of the Virgo cluster was simulated and recorded. Figure 1 shows this formation. At [1] movies are available. Different time steps were selected to present slices of the distribution of matter in the box, more precisely at the location of the Virgo cluster. The gradient of colors stands for the density gradient. From black to white, the density of particles (matter) increases. From left to right, top to bottom, one can see the formation of the cluster from an homogenized distribution of matter to a huge concentration of matter. Small filaments interconnected by small clumps of matter grow to finally give one ma-jor filament (preferential direction) with one enormous clump of matter (more than 1014 times the solar mass): the Virgo cluster of galaxies.
On-going Research / Outlook
At such a high resolution with hydrodynamical features, the simulations contain simulated galaxies of the Virgo cluster look-alike. Figure 2 shows four of them, viewed face-on, in slices of about 300,000 light-years. The next step is then to extract galaxy properties from the simula-tion like their colors, their metallicity, their star formation,
their mass to make deep comparisons with the observed galaxy population of the Virgo cluster. Galaxy formation models can then be validated or/and calibrated.
The step after this one is to run an even higher resolution simulation (to reach 105 times the solar mass) but with solely dark matter to reduce the computational cost. Such a resolution will allow us to simulate the smallest galaxies, called dwarfs, in and around the Virgo cluster of galaxies. To do so, we will use semi-analytical modeling to populate a posteriori the dark matter simulation with galaxies.
References and Links
[1] http://jennygsorce.appspot.com/lightvirgocluster.html[2] J.G. Sorce, MNRAS 450 (2015), 2644[3] J.G. Sorce, S. Gottlöber, G. Yepes, et al., MNRAS 455 (2016), 2078[4] Y. Dubois, C. Pichon, C. Welker, et al., 444 MNRAS (2014), 1453
Figure 1: Formation of the Virgo cluster of galaxies. From left to right, top to bottom: the dark matter particles gather in the simulated box to form the Virgo cluster. From dark blue to white, the matter density increases. The Virgo cluster is the clump of matter visible nowadays, namely 13.5 Gigayears after the big bang. Each slice is about 30 millions light-years.
Figure 2: Four simulated galaxies of the Virgo cluster viewed face-on. Slices are about 300,000 light-years.
0000005
-60 -40 -20 0 20 40 60C1 (kpc)
-60
-40
-20
0
20
40
60
C2 (k
pc)
0000024
-60 -40 -20 0 20 40 60C1 (kpc)
-60
-40
-20
0
20
40
60
C2 (k
pc)
0000016
-60 -40 -20 0 20 40 60C1 (kpc)
-60
-40
-20
0
20
40
60
C2 (k
pc)
0000027
-60 -40 -20 0 20 40 60C1 (kpc)
-60
-40
-20
0
20
40
60
C2 (k
pc)
Light on the Virgo cluster of galaxies: our closest cluster-neighbor
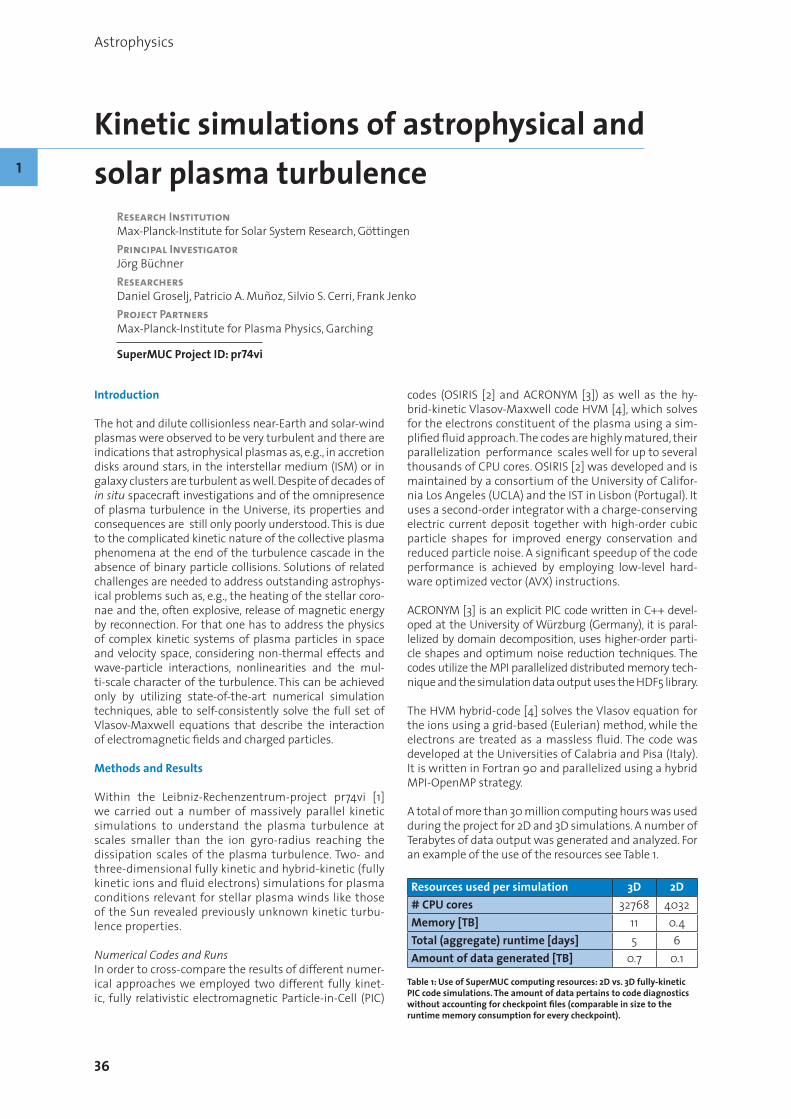
36
Astrophysics
Kinetic simulations of astrophysical and solar plasma turbulence
Research InstitutionMax-Planck-Institute for Solar System Research, GöttingenPrincipal InvestigatorJörg BüchnerResearchersDaniel Groselj, Patricio A. Muñoz, Silvio S. Cerri, Frank JenkoProject PartnersMax-Planck-Institute for Plasma Physics, Garching
SuperMUC Project ID: pr74vi
Introduction
The hot and dilute collisionless near-Earth and solar-wind plasmas were observed to be very turbulent and there are indications that astrophysical plasmas as, e.g., in accretion disks around stars, in the interstellar medium (ISM) or in galaxy clusters are turbulent as well. Despite of decades of in situ spacecraft investigations and of the omnipresence of plasma turbulence in the Universe, its properties and consequences are still only poorly understood. This is due to the complicated kinetic nature of the collective plasma phenomena at the end of the turbulence cascade in the absence of binary particle collisions. Solutions of related challenges are needed to address outstanding astrophys-ical problems such as, e.g., the heating of the stellar coro-nae and the, often explosive, release of magnetic energy by reconnection. For that one has to address the physics of complex kinetic systems of plasma particles in space and velocity space, considering non-thermal effects and wave-particle interactions, nonlinearities and the mul-ti-scale character of the turbulence. This can be achieved only by utilizing state-of-the-art numerical simulation techniques, able to self-consistently solve the full set of Vlasov-Maxwell equations that describe the interaction of electromagnetic fields and charged particles.
Methods and Results
Within the Leibniz-Rechenzentrum-project pr74vi [1] we carried out a number of massively parallel kinetic simulations to understand the plasma turbulence at scales smaller than the ion gyro-radius reaching the dissipation scales of the plasma turbulence. Two- and three-dimensional fully kinetic and hybrid-kinetic (fully kinetic ions and fluid electrons) simulations for plasma conditions relevant for stellar plasma winds like those of the Sun revealed previously unknown kinetic turbu-lence properties.
Numerical Codes and Runs In order to cross-compare the results of different numer-ical approaches we employed two different fully kinet-ic, fully relativistic electromagnetic Particle-in-Cell (PIC)
codes (OSIRIS [2] and ACRONYM [3]) as well as the hy-brid-kinetic Vlasov-Maxwell code HVM [4], which solves for the electrons constituent of the plasma using a sim-plified fluid approach. The codes are highly matured, their parallelization performance scales well for up to several thousands of CPU cores. OSIRIS [2] was developed and is maintained by a consortium of the University of Califor-nia Los Angeles (UCLA) and the IST in Lisbon (Portugal). It uses a second-order integrator with a charge-conserving electric current deposit together with high-order cubic particle shapes for improved energy conservation and reduced particle noise. A significant speedup of the code performance is achieved by employing low-level hard-ware optimized vector (AVX) instructions.
ACRONYM [3] is an explicit PIC code written in C++ devel-oped at the University of Würzburg (Germany), it is paral-lelized by domain decomposition, uses higher-order parti-cle shapes and optimum noise reduction techniques. The codes utilize the MPI parallelized distributed memory tech-nique and the simulation data output uses the HDF5 library.
The HVM hybrid-code [4] solves the Vlasov equation for the ions using a grid-based (Eulerian) method, while the electrons are treated as a massless fluid. The code was developed at the Universities of Calabria and Pisa (Italy). It is written in Fortran 90 and parallelized using a hybrid MPI-OpenMP strategy.
A total of more than 30 million computing hours was used during the project for 2D and 3D simulations. A number of Terabytes of data output was generated and analyzed. For an example of the use of the resources see Table 1.
Resources used per simulation 3D 2D# CPU cores 32768 4032Memory [TB] 11 0.4Total (aggregate) runtime [days] 5 6Amount of data generated [TB] 0.7 0.1
Table 1: Use of SuperMUC computing resources: 2D vs. 3D fully-kinetic PIC code simulations. The amount of data pertains to code diagnostics without accounting for checkpoint files (comparable in size to the runtime memory consumption for every checkpoint).
1

37
Kinetic simulations of astrophysical and solar plasma turbulence
2D TurbulenceWe investigated the 2D properties of the turbulence for plasma parameters typical for the near-Earth free streaming solar wind by comparing fully kinetic, hy-brid-code (reduced-kinetic) with the results obtained be-fore in the framework of a gyrokinetic plasma model [5]. The spectral properties of the solutions obtained from the fully kinetic and gyrokinetic simulations were found to be in good agreement under typical plasma condi-tions. Other than as the consequences of numerous simplifying assumptions of gyrokinetic models, the fully kinetic investigations allowed to identify the dominant type of turbulent fluctuations (see Figure 1). The results of the hybrid code simulations, on the other hand, were lacking of essential consequences of the kinetic electron physics, i.e. Landau damping that made the hybrid spec-tra shallow even on subionic scales so the hybrid simula-tions cannot reproduce the real turbulent spectra such as gyrokinetic and fully kinetic models.
3D TurbulenceOur massively parallel 3D PIC-code simulations of the ki-netic turbulence were among the very first targeting the end of the inertial range of the solar wind turbulence [6]. By considering the spectral properties of the solutions and by calculating the anisotropy of the turbulence rela-tive to the local mean magnetic field, we confirmed the predictions of the leading, so-called kinetic Alfvén wave turbulence model. This was the first study where the predictions of the kinetic Alfvén wave turbulence model were tested using only first-principle-physics assump-tions without additional approximations, yielding results largely consistent with the predictions (cf. Figure 2).
On-going Research / Outlook
The analysis of the data obtained by the simulations continues. Additional aspects under consideration are, e.g. the particle acceleration (see Figure 2.) and the role
of magnetic reconnection in kinetic range plasma tur-bulence. Figure 1 indicates, e.g., possible reconnection sites – current sheets. The self-consistently generated current sheets change the spectral properties of the tur-bulence cascade towards the dissipation range. The pro-ject results inspired us to start a number of challenging new follow-up projects. While we so far focused on the plasma regimes of the free streaming, near-Earth solar wind, kinetic turbulence is expected to operate also in other astrophysical environments which are character-ized by different plasma parameters. It must be better understood how kinetic turbulence works in other re-gimes and how it works over the whole larger range of the turbulent cascade. For this sake larger domain sizes and the use of more realistic ion to electron mass ratios are required. For this, however, the use of the upcoming SuperMUC-NG is mandatory. From the technical point of view, we aim to use the upcoming system for larger simulations in terms of runtime memory consumption and (steady) file system performance when writing large amounts of checkpoint data. The solution of these prob-lems is critical for the further investigation of the kinetic plasma turbulence; larger and more realistic simulations are needed in order to understand both the very end of the turbulence cascade as well as the injection range in different astrophysical plasmas.
References and Links
[1] http://www.mps.mpg.de/5301753/tsssp-hpc-project-lrz-super-muc-2017
[2] OSIRIS: http://epp.tecnico.ulisboa.pt/osiris[3] ACRONYM: http://plasma.nerd2nerd.org/[4] HVM: http://fis.unical.it/hvm[5] D. Groselj et al. 2017. Fully Kinetic versus reduced-kinetic Modeling
of Collisionless Plasma Turbulence. Astrophys. J. 847, 28. DOI: https://doi.org/10.3847/1538-4357/aa894d
[6] D. Groselj et al. 2018. Fully Kinetic Simulation of 3D Kinetic Alfvén Turbulence. Phys. Rev. Lett. 120, 105101. DOI: https://doi.org/10.1103/PhysRevLett.120.105101
Figure 1: 2D PIC-code simulation results: the fully developed turbulence contains sheets of enhanced electric current density.
Figure 2: Electric field strength in the fully developed a 3D kinetic turbulence obtained by PIC-code simulations. The helical curves show a few sample electron trajectories, colored in accordance with by the particle energy.

38
Astrophysics
Introduction
Within modern cosmology, the Big Bang marks the beginning of the universe and the creation of matter, space and time about 13.8 billion years ago. Since then, the visible structures of the cosmos have developed: bil-lions of galaxies which bind gas, dust, stars and planets with gravity and host supermassive black holes in their centres. But how could these visible structures have formed from the universe’s initial conditions?
To answer this question, theoretical astrophysicists carry out large, cosmological simulations. They transform our knowledge about the physical processes which drive the formation of our universe into models and simulate the resulting evolution of our universe across a large range of spacial scales and over billions of years. To be comparable to ongoing and future cosmological surveys, such theoret-ical models have to cover very large volumes, especially to host the rarest, most massive galaxy clusters expected to be the lighthouses of structure formation detectable al-ready at early times (e.g. at high redshifts). While the Uni-verse makes its transition from dark matter dominated to
dark energy dominated (i.e. accelerated expansion), the objects which form within it make their transition from young, dynamically active and star formation driven sys-tems to more relaxed and equilibrated systems observed at late time (e.g. low redshifts). Especially here theoretical models in form of complex, hydrodynamical cosmological simulations are needed to disentangle the internal evolu-tion of clusters of galaxies with respect to the evolution of the cosmological background. Such simulations will be es-sential to interpret the outstanding discoveries expected from upcoming surveys.
To make the outcome of such large cosmological hy-drodynamics simulations available to a broad scien-tific community, LRZ in cooperation with experts from C2PAP (the Excellence Cluster Universe’s datacentre) has now opened access to the Cosmological Web Portal [1], which now has already more than 100 registered users (see figure 1 for a usage statistics). As first step, two of the largest simulation sets form the Magneticum Path-finder Project [2] where made public.
Challenges of the Web Portal
The Web portal is based on a multi-layer structure, see [3,4] for more details. Between those layers, data and processes flow over the web portal with its web inter-face, several databases, the backend within the job con-trol layer, the compute cluster (where the analysis tools are actually executed) and the storage system (where the raw simulation data are stored). The need for a sep-aration between the web interface and the backend arises from both the necessity of users to run person-alized jobs on raw data, managed by a job scheduler of the compute cluster and the protection of the data from unauthorized access. As compute layer, currently the C2PAP compute cluster, operated by the Excellence cluster Origin and Structure of the Universe [5] is used while for the HPC storage we make use of the new Data Science Storage service at LRZ. All other processes are virtualised using the LRZ machines. Almost all parts of the implementation is based on common packages and publicly available libraries, except the core of the back-
Magneticum Pathfinder: A web interface to access the simulation data goes online 1
Research InstitutionUniversitäts-Sternwarte München, Fakultät für Physik der Ludwig-Maximilians-UniversitätPrincipal InvestigatorKlaus DolagResearchersVeronica Biffi, Nicolay J. Hammer, Alexey Krukau, Margarita Petkova, Antonio RagagninProject PartnersC2PAP Universe Cluster, LRZ
SuperMUC Project ID: pr83li (Gauss Large Scale project), pr86re
Figure 1: Overall usage of the cosmological web portal over the last 17 months: Number of post-processing jobs (black), clicks by registered users (blue) and total clicks (red), which include the public browsing feature.

39
end, which is a customized component tailored for the data flows, job requests and specific needs of the used scientific data analysis software. All services are based on standard post-processing tools as used in scientific analysis of such simulations.
The Web Interface
The visual frontend allows to explore the cosmologi-cal structures within the simulation, based on panning through and zooming into high resolution, 256 megapix-el size images which are available for numerous outputs of the different simulations. A special layer-spy option can be used to show a second, smaller, visualization within a lens which can be moved freely over the whole imageand moving the layer spy over the visible objects reveals immediately and intuitively the connection be-tween the different components.
Services currently available
There are several services available in the web interface which are designed to complete the interactive explo-ration of the simulation, to explore and select interest-ing objects and to allow the user to obtain information based on unprocessed simulation data or virtual obser-vations of selected objects.
The Clusterfind service operates on the stored meta data and returns a list of objects matching the given properties. It shows the resulting list of objects in form of a table and additionally allows to produce histograms or scatter plots from any combination of columns within the result table. In addition, the produced table can be exported as CSV-ta-ble and individual objects can be selected by clicking on the table entry or the data points in the plot.
The ClusterInspect service works similar to the ClusterFind, except that, once an object (e.g. galaxy cluster or group) is selected, the generated table displays the properties of all member galaxies of the cluster/group. The interactive plotting tool allows then to visualize any galaxy property from the table in the same way as described above.
The SimCut service allows users to directly obtain the unprocessed simulation data for the selected object. These data are returned in the original simulation out-put format. Therefore, the user may analyse the data in the same way as he would do for his own simulations.
The Smac service allows the user to obtain 2D maps of integrate physical quantities along the line of sight. Cur-rently, the service allows to produce column densities for the gas component or for the entire matter, the mass-weighted temperature bolometric X-ray surface bright-ness and the thermal or kinetic SZ maps. The maps are returned in standard FITS files.
The Phox service allows to perform synthetic X-ray ob-servations of the ICM and AGN component of selected galaxy clusters. Here the user can choose among current and future X-ray instruments to make use of the actu-al specifications of these instruments. An idealized list of Xray photons for the chosen instrument is returned. To produce an even more realistic result, the user can additionally request a detailed instrument simulation based on special software available for the individual Xray satellite missions. All result are provided in form of a so called event file in the FITS format, which is identical (beside some keywords in the headers) to what would be obtained from a real observation.
On-going Research / Outlook
The Magneticum research collaboration will continue to integrate more simulations into the web interface and also works on extending the services towards detailed analysis of individual galaxies.
References and Links
[1] www.c2papcosmosim.srv.lrz.de [2] www.magneticum.org [3] Ragagnin, A., Dolag, K., Biffi, V., Cadolle Bel, M., Hammer, N.J.,
Krukau, A., Petkova, M., Steinborn, D.: “A web portal for hydrody-namical, cosmological simulations”, 2017, A&C, 20, 52
[4] http://inside.hlrs.de/editions/17spring.html#thecosmological- web-portal-has-gone-online-at-lrz
[5] www.universe-cluster.de
Figure 2: In the visual front end (here showing the Magneticum/Box2b/hr simulation at z=0.17) the stellar component is used as the basic, back-ground visualization. The layer-spy option allows to dynamically overlap a movable lens with different other visualisation. All objects chosen in the “Restrict” menu are marked with green circles. The blue circle marks the currently chosen cluster, the pop-up info window shows its basic properties. The overlay “pie chart” in the lower right corner shows exam-ples of different visualizations which can be chosen [1].
Magneticum Pathfinder: A web interface to access the simulation data goes online
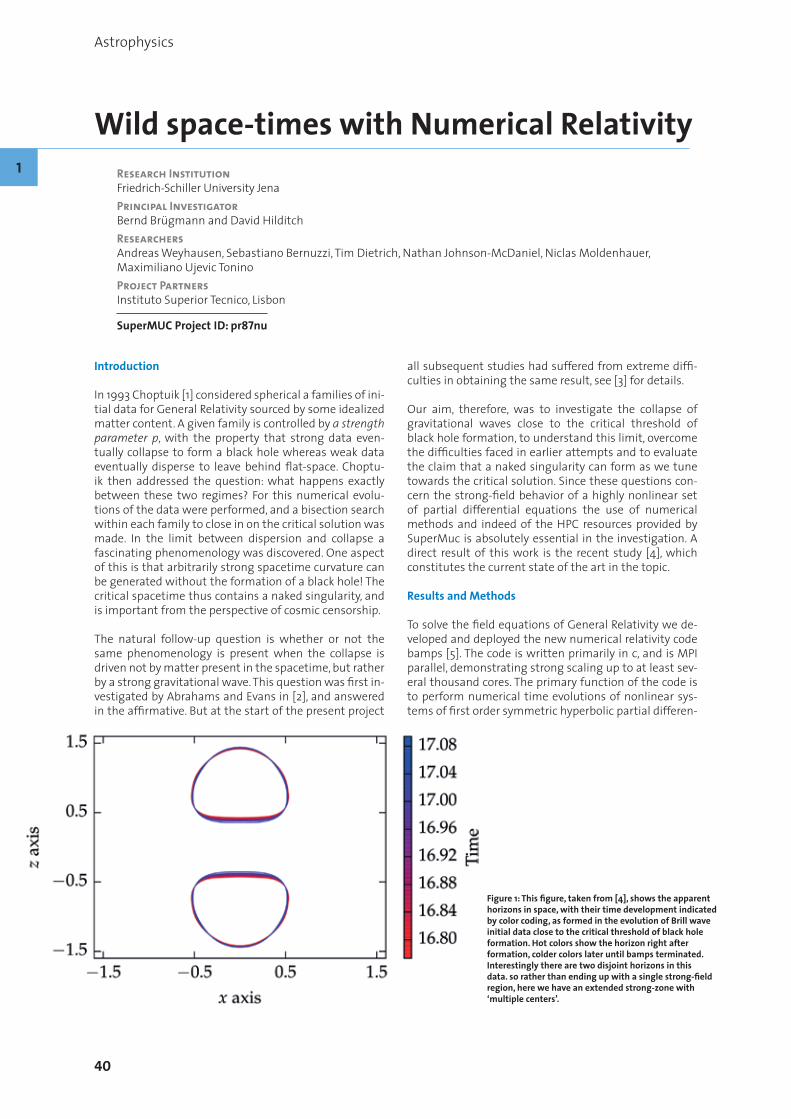
40
Astrophysics
Introduction
In 1993 Choptuik [1] considered spherical a families of ini-tial data for General Relativity sourced by some idealized matter content. A given family is controlled by a strength parameter p, with the property that strong data even-tually collapse to form a black hole whereas weak data eventually disperse to leave behind flat-space. Choptu-ik then addressed the question: what happens exactly between these two regimes? For this numerical evolu-tions of the data were performed, and a bisection search within each family to close in on the critical solution was made. In the limit between dispersion and collapse a fascinating phenomenology was discovered. One aspect of this is that arbitrarily strong spacetime curvature can be generated without the formation of a black hole! The critical spacetime thus contains a naked singularity, and is important from the perspective of cosmic censorship.
The natural follow-up question is whether or not the same phenomenology is present when the collapse is driven not by matter present in the spacetime, but rather by a strong gravitational wave. This question was first in-vestigated by Abrahams and Evans in [2], and answered in the affirmative. But at the start of the present project
all subsequent studies had suffered from extreme diffi-culties in obtaining the same result, see [3] for details.
Our aim, therefore, was to investigate the collapse of gravitational waves close to the critical threshold of black hole formation, to understand this limit, overcome the difficulties faced in earlier attempts and to evaluate the claim that a naked singularity can form as we tune towards the critical solution. Since these questions con-cern the strong-field behavior of a highly nonlinear set of partial differential equations the use of numerical methods and indeed of the HPC resources provided by SuperMuc is absolutely essential in the investigation. A direct result of this work is the recent study [4], which constitutes the current state of the art in the topic.
Results and Methods
To solve the field equations of General Relativity we de-veloped and deployed the new numerical relativity code bamps [5]. The code is written primarily in c, and is MPI parallel, demonstrating strong scaling up to at least sev-eral thousand cores. The primary function of the code is to perform numerical time evolutions of nonlinear sys-tems of first order symmetric hyperbolic partial differen-
Wild space-times with Numerical Relativity1 Research Institution
Friedrich-Schiller University JenaPrincipal InvestigatorBernd Brügmann and David HilditchResearchersAndreas Weyhausen, Sebastiano Bernuzzi, Tim Dietrich, Nathan Johnson-McDaniel, Niclas Moldenhauer, Maximiliano Ujevic ToninoProject PartnersInstituto Superior Tecnico, Lisbon
SuperMUC Project ID: pr87nu
Figure 1: This figure, taken from [4], shows the apparent horizons in space, with their time development indicated by color coding, as formed in the evolution of Brill wave initial data close to the critical threshold of black hole formation. Hot colors show the horizon right after formation, colder colors later until bamps terminated. Interestingly there are two disjoint horizons in this data. so rather than ending up with a single strong-field region, here we have an extended strong-zone with ‘multiple centers’.

41
tial equations. As is common for applications in numeri-cal relativity evolution modules are autogenerated using computer algebra. The code employs a pseudospectral method to approximate spatial derivatives with a stand-ard method of lines time integrator. The domain is de-composed into several patches in which the equations are solved. Data is communicated from neighboring do-mains using a so-called penalty method. This approach requires little data communication, which contributes to the good scaling mentioned above.
In the present application [4] we evolved the Einstein equations written in generalized harmonic form, using constraint preserving, radiation controlling outer bound-ary conditions. We focused on a single axially symmetric Brill wave family of gravitational wave initial data and searched for the critical amplitude at which black holes first form. Close to the critical point the resulting spa-cetimes generate structure on an ever-finer scale, which makes the evolutions computationally very demanding. In total the code development and production runs used around 10 Million core hours, the majority of which were run on SuperMuc. (Our results with the project pr87nu concerning binary neutron star spacetimes, which used around the same amount of resources, have been report-ed elsewhere). Our typical jobs ranged from a few hun-dred to a few thousand cores.
We compared carefully with all published work evolving this family of data, and found good agreement with the results of the new code. We were then able to bound the critical amplitude A* to within a range around 10-6, an improvement on earlier results by several orders of mag-nitude. Interestingly, close to the critical point we find that this data form not one but two black hole horizons, indicating that the data form a binary black hole spa-cetime. This result is shown in Figure 1. In this range we furthermore see evidence for power-law scaling in the curvature, as is expected if critical phenomena are pres-ent in the collapse of gravitational waves. This result is reported and explained in Figure 2.
On-going Research / Outlook
The next task in our research program will be to study other families of initial data, and to try and get closer to the critical point. Ultimately this will allow us to get a better understanding of the most extreme spacetimes one can construct in General Relativity. The main difficul-ties in going closer to the critical point are the formation of coordinate singularities, and the immense cost of the numerical evolutions required. To alleviate the former we have developed a new formalism, which gives great-er freedom in the choice of coordinates in applications. For the latter the combination of improved numerical methods, particularly in the form of adaptive mesh-re-finement, and expanded computational resources will be essential.
References and Links
[1] Phys. Rev. Lett. 70, 9 – 1993[2] Phys. Rev. Lett. 70, 2980 – 1993[3] Phys. Rev. D 88, 103009 – 2013[4] Phys. Rev. D 96, 104051 – 2017[5] Phys. Rev. D 93, 063006 – 2016
Figure 2: This figure, taken also from [4] shows the scaling of the maximum of the curvature against the logarithmic distance of the data to the critical solution. Theoretical models predict that in this limit the data should appear like a straight line plus a periodic wiggle and we interpret the result as evidence towards that claim, although there is certainly much room for future work in this direction.
Wild space-times with Numerical Relativity

42
Astrophysics
Introduction
Todays most favorable cosmological model is a flat Fried-man universe with a cosmological constant (68%), Cold Dark Matter (CDM; 27%) and a small amount of usual baryonic matter (5%). This model provides the frame-work for cosmological structure formation, which can be tested against observations. In the 1970’s the basic idea of structure formation was formulated, namely that structure emerges from primordial density perturba-tions via gravitational instability. The dark matter forms halos, within which the baryons cool, fragment and form stars. To a good approximation this process can be de-scribed within a dark matter only model, i.e. following the clustering of dark matter in numerical experiments. Then, galaxies can be assigned to the dark matter halos in a post-processing process. The resulting galaxy distri-bution can be compared with the observed one.
Recent and upcoming large observational survey pro-jects are mapping huge volumes of the Universe. From the theoretical point of view, one needs to simulate the evolution of these very large volumes for a reliable comparison with observations and in order to study the rarest objects, like the most massive clusters and the largest voids. On the other hand, one wants to keep the highest possible resolution to retain reliable information also on halo substructures as well as on the low mass isolated objects. We are now deep in the era of precision cosmology, where uncertainties in the values of the cos-mological parameters from CMB Planck measurements are very small. Therefore, one needs to take care of using the cosmology in simulations as close as possible to the observed data. Over the last years we run a series of dark matter only simulations in the same Planck cosmology but in very different volumes, so we can study dark mat-ter halo clustering over a huge range of mass scales, from the biggest clusters to the tiny dwarfs.
Simulations
The first simulation performed in this series was the MultiDark simulation with 3840^3 particles in a box of
1000 Mpc/h side length [2]. For our series of simulations we increased rsp. decreased the box-size by a factor of 2.5 Thus in each step between the BigMultiDark (BigMD), the MultiDark (MD), the Small MultiDark (SMD), the Very Small MultiDark (VSMD) and the Extremely Small Multi-Dark simulations (ESMD) the volume decreases by a fac-tor of ~16 and the mass resolution improves by the same factor. On top of this series we were running also the HugeMultiDark (HMD) simulation. Concerning ESMD so far only the simulation at lower resolution has been fin-ished (ESMD_2048).
Simulation box Np mp Nout
HMD 4000 40963 7.9 x10¹⁰ 128BigMD 2500 38403 2.4x10¹⁰ 80MD 1000 38403 8.7x10⁹ 129SMD 400 38403 9.6x10⁷ 117VSMD 160 38403 6.2x10⁶ 150ESMD_2048 64 20483 2.6x10⁶ 70
Table 1: Numerical parameters for the simulations. The columns give the simulation identifier, the size of the simulated box in Mpc/h, the number of particles, the mass per simulation particle mp (in Msun/h) and the total number of simulation outputs stored Nout .
Data products
Due to gravitational instabilities the dark matter parti-cles clump into dark matter halos. At redshift z=0 a sim-ulation as described above contains typically 50 to 100 million halos. The halos and their sub-halos need to be identified in the simulation and their properties must be estimated. Moreover, one wants to know how the halos have been formed and evolved. We have used two com-pletely independent halo finders: A spherical overdensi-ty halo finder and a hierarchical Friends-of-Friends halo finder.
In order to identify spherical halos and their sub-halos as well as their merging history we have used ROCKSTAR (Robust Overdensity Calculation using K-Space Topologi-cally Adaptive Refinement [3]). ROCKSTAR is a massively
The Cosmic Factory: Simulating the dark universe at different scales1
Research InstitutionLeibniz Institute for Astrophysics PotsdamPrincipal InvestigatorStefan GottlöberResearchersGustavo Yepes, Peter Behroozi, Alexander Knebe, Anastasia Galkin, Pratika DayalProject PartnersUAM Madrid, AIP Potsdam, University of Groningen, University of Arizona
SuperMUC Project ID: pr87yi

43
parallel code very well designed to run over large dark matter simulations. It is designed to maximize halo consistency across time-steps. Therefore, it is especially useful for the construction of merger trees of the halo evolution and the generation of semi-analytical galaxy catalogs based on the merger trees.
The great advantage of the Friends-of-Friends (FOF) al-gorithm is its simplicity. The basic idea is to find halos by linking all particle pairs separated by less than a certain linking length that is defined as a fraction of the mean inter-particle separation in the simulation. This method defines a unique catalog of halos for any given linking length. We calculated the FOF halos for all redshifts at four different linking lengths, namely 0.2, 0.1, 0.05, and 0.025 of the mean inter-particle separation. By definition the halos defined at a shorter linking length are sub-ha-los of the parent-halos defined at larger linking lengths. Since the linking length is reduced in each step by a fac-tor of 2 the corresponding sub-halos have typically mean over-densities larger than the parent halos by a factor of about 8.
Galaxies
Galaxies of very different kinds are observed in the uni-verse. From the tiny dwarf galaxies to the most massive elliptical galaxies they cover several orders of magnitude in mass and luminosity. The galaxies differ very much in their baryonic mass content: the gas fraction and the stellar mass fraction. Some of the galaxies form active massive black holes in their centers. During the last dec-ades much progress has been made in understanding the formation and evolution of galaxies by elaborat-ed numerical simulations with ever increasing spatial and mass resolutions. However these hydrodynamical
simulations are extremely time consuming and cannot be performed for very large volumes at very high reso-lution. A possible alternative to study galaxies in large cosmological volumes with the required resolution is the post-processing of dark matter only simulations with semi-analytical galaxy formation models. This has been done so far for the MD simulation (see Table 1) using three different semi-analytic models, namely Galacticus, SAG, and SAGE [4].
Database
The CosmoSim database [1,5] provides data from the cos-mological simulations described above. In the database the Structured Query Language SQL is used to filter the main data products and retrieve exactly those subsets the user is interested in. Since the amount of data which such simulations produce nowadays exceeds the Tera-byte range, the full data set is too large to be provided for each user. Having the data directly available via SQL proved to be a very useful concept. This language allows users – especially those not intimately familiar with the data format of the simulation – a far more direct path from a science question to an executable expression than a standard scripting or programming language would. However, an increasing number of users is also interested in using the simulation data directly or ana-lyzing the full catalogs by themselves. Therefore, the da-tabase allows also to download a few selected simula-tion outputs (1.7 Tb each) as well as the full ROCKSTAR or galaxy catalogs. Besides the data, the database contains a comprehensive documentation as well as a number of images and movies for public outreach. More than 80 papers have been published so far using data provided by the MultiDark database.
On-going Research/Outlook
At present we run the ESMD simulation with 40963 par-ticles. The VSMD simulation is analyzed within an ERC project titled “DELPHI: a framework to study Dark Matter and the emergence of galaxies in the epoch of reioniza-tion” (PI Pratika Dayal).
References and Links
[1] http://www.cosmosim.org [2] Klypin et al., 2016, MNRAS 457, 4340[3] Behroozi P. S., Wechsler R. H., Wu H.-Y., 2013, ApJ 762, 109 Rockstar is
freely available from https://bitbucket.org/gfcstanford/rockstar/overview
[4] Knebe A., et al., 2018, MNRAS 474, 5206 [5] Riebe K., et al., 2013, Astronomische Nachrichten 334, 691
Figure 1: Dark matter density slice through the BigMD simulation (big picture) and the VSMD simulation (smaller inside the big one) at redshift zero.
The Cosmic Factory: Simulating the dark universe at different scales

44
Astrophysics
Introduction
The formation of the first galaxies is one of the key mile-stones in the history of the Universe. When the Universe was only 380 thousand years old, it was mostly neutral and cold. These Dark Ages finished by the formation of the first galaxies. They started to ionize Hydrogen ap-proximately 400 Million years after the Big Bang. The Epoch of Reionization has been a subject of considerable interest in the last decades. However, very little is known about the properties of these first galaxies. The deep-est observations with the Hubble Space Telescope have yielded a handful of tiny and faint objects.
The launch of the James Webb Space Telescope (JWST) in 2020 will completely revolutionize our understanding of Universe Reionization. One of the four main Science Themes for JWST is to unveil the properties of first galax-ies (http://jwst.nasa.gov/firstlight.html). JWST will yield very deep surveys of galaxies at extremely high redsfhits (z>5). This will provide unprecedented details about the first galaxies and it will generate considerable public in-terest. As quoted in the above link, “Webb will be a power-ful time machine with infrared vision that will peer back over 13.5 billion years to see the first stars and galaxies forming out of the darkness of the early universe”.
This is a crucial time for theoretical predictions about the properties of the first galaxies. They are needed for the design of successful observations and to interpret the first results from JWST. Semi-empirical methods and large cosmological simulations have provided predic-tions of the abundances of these galaxies but they lack the details about the distribution of gas, stars, metals and dust within first galaxies. This is a crucial aspect. For example, the distribution of these components affects the overall ability of ionizing photons to scape these gal-axies and ionize the Universe.
There are two main approaches in cosmological simula-tions of galaxy formation. The first approach uses a full cosmological box. These simulations yield a large popu-lation of galaxies but their interiors are poorly resolved.
The second approach uses zoom-in simulations that con-centrate the computational resources on the formation and evolution of a few selected galaxies. However previ-ous sets of zoom-in simulations were small, with only a dozen of independent galaxies.
The FirstLight project [1] have generated a sample of over 1000 zoom-in simulations of the first galaxies. The full exploitation of this dataset will allow us to infer global properties of the galaxy population while resolving the galaxy interiors with parsecs resolution.
Results and Methods
Early results [2] of FirstLight have yielded UV luminosity function (UVLF), galaxy stellar mass function, stellar-mass-halo-mass and other scaling relations at redshift
FirstLight: Formation of the First Galaxies at Cosmic Dawn 1
Research InstitutionZentrum für Astronomie der Universität Heidelberg, Institut für Theoretische AstrophysikPrincipal InvestigatorDaniel CeverinoResearchersRalf S. Klessen, Simon C.O. GloverProject Partners—
SuperMUC Project ID: pr92za
Figure 1: Left: Schematic timeline of the Universe, showing the Epoch of Reionization, the Dark Ages and the formation of the first galaxies (source: STSci). Right: Gas within a galaxy at redshift 5 from the First-Light project. Dense star-forming clouds and bubbles filled with diffuse gas are both resolved as part of the multiphase Interstellar Medium.

45
FirstLight: Formation of the First Galaxies at Cosmic Dawn
z=6-10 in good agreement with existing observations, when available. The simulations predict a flattening of the UVLF at magnitudes fainter than MUV=-14 due to stellar feedback. They also predict a rapid evolution of the faint slope of the UVLF and this implies a large number of galaxies with moderately faint luminosities during the dark ages (z=10). These predictions will be tested by JWST.
Allowed by the large number statistics, we focus on the mean galaxy properties (stellar mass, gas mass, and SFR) over a large range of halo masses [4]. We unveil the physical origin of the star-forming main sequence (SFMS) during the early galaxy assembly. We answer the following questions: which physical processes set the mean and scatter of SFMS?; are they in place at any redshift or are they being built over time?
The simulations of 1000 galaxies are performed using the ART code, which accurately follows the evolution of a gravitating N-body system and the Eulerian gas dy-namics using an Adaptive Mesh Refinement (AMR) ap-proach. ART is a hybrid MPI+OpenMP code that uses do-main decomposition of the whole cosmological volume. Each MPI task makes refinement of the grid around a distinct lagrangian region where a single galaxy forms and evolves. This decomposition minimizes the com-munication between tasks, because they only share the base grid. The parallelization within a node is done us-ing OpenMP. No external libraries are required. The full project uses 1000 MPI tasks, distributed over 1000 nodes (28k cores). It needs approximately 2Gb of memory per core for the most expensive tasks. Therefore, the maxi-mum memory required will be 5Tb. The MPI tasks are approximately distributed in 10 independent runs. Each one uses about 100 Haswell nodes. 20M CPU-hours were consumed. 0.5M files were generated and temporarily stored in PROJECT (15 Tb of storage).
On-going Research / Outlook
Several aspects of the original FirstLight project have not been fully developed and they will be explored in the extension of the project (10M CPU-hours): i) Simu-lations of more massive lower-case Galaxies will help us to understand the formation of the first quasars. ii) New models of stellar feedback will be developed. They will be included in new simulations that will shed light on the role of feedback processes in the regulation of the for-mation of the first galaxies. A selection of one quarter of the original sample of halos will be simulated again with these new models. Then, I will compare the results of this new set with the original dataset. This compari-son will reveal the degree of improvement of these new models. ii) Finally, the analysis of the cosmological boxes with Planck cosmology will be performed and compare with the corresponding WMAP runs. The halo statistics with Planck cosmology show significantly higher halo number densities due to a more massive Universe. This could have important implications for the formation of the first galaxies and reionization.
In the framework of the AstroLab support call 2016, I have established a fruitful collaboration with Dr Luigi Ia-pichino with the main goal of increasing the overall per-formance of the ART code. We are currently focusing on improving the OpenMP parallelization and testing the performance of ART in the new KNL nodes.
References and Links
[1] http://www.ita.uni-heidelberg.de/~ceverino/FirstLight/index.html[2] Ceverino, D., Glover, S. C. O., & Klessen, R. S. 2017, MNRAS, 470, 2791[3] Bouwens R. J., et al., 2015, ApJ, 803, 34[4] Ceverino, D., Klessen, R., & Glover, S. 2018, arXiv:1801.10382[5] Salmon B., et al., 2015, ApJ, 799, 183
Figure 2: UVLF at z=6. The FirstLight tests are consistent with observa-tions [3]. They predict a progressive flattening of the LF at low luminosi-ties (MUV > –14) driven by stellar feedback.
Figure 3: SFR versus stellar mass of a fraction of the FirstLight sample at z=6. Points with errors bars show observational results [5] (Points with error bars).

46
Astrophysics
Introduction
In our research we investigate the formation and evo-lution of molecular clouds by means of high-resolution zoom-in simulations of stratified galactic disks. The sim-ulations are a follow-up of the work performed in the Large-Scale Gauss Project pr45si carried out on the gen-eral purpose supercomputer SuperMuc, where the long-term evolution of different galactic disks was modeled with significantly lower spatial resolution[1,2]. By zoom-ing in with a smart adaptive mesh refinement technique, we center on individual molecular clouds while these are forming and evolving within a realistic environment. We thus can explore the impact of e.g. supernova explo-sions on the clouds. In particular we are interested in the chemical evolution of the clouds as well as the internal dynamics and structure.
Results and Methods
In our work we have so far performed a number of simulations on SUPERMUC. Each of the simulations re-quired a computational time of a about 1 – 2 Mio. CPU-hours with a simultaneous use of up to 1000 CPUs per simulation. A few hundreds of files were produce for each simulation requiring a disk space of about 20 TB in total. The simulations are performed with the hydro-dynamics code FLASH[3] written in Fortran 90. The code solves the 3-dimensional, discretized magnetohydrody-namical equations on a Cartesian grid. Making use of the adaptive-mesh-refinement (AMR) technique, only those regions which are of particular interest for us are resolved with the highest possible spatial resolution whereas other regions of minor interest are resolved more coarsely. This significantly reduces the number of calculations to be performed and hence the computa-tional time required, thus allowing us to perform the simulations over long physical timescales. Furthermore, we use a chemical network designed for astrophysical problems which allows us to model the formation of molecular hydrogen and CO, and non-equilibrium cool-ing and heating effects.
Initial conditionsThe simulations we carry out follow the evolution of the multi-phase ISM in a (500 pc)2 x ± 5 kpc region of a galac-tic disk, with a gas surface density of 10 Msun/pc2. We in-clude an external potential, self-gravity, magnetic fields, heating and radiative cooling, as well as time-dependent chemistry. We explore SN explosions at different rates in located either in high-density regions, in random lo-cations, in a combination of both, or clustered in space and time. We select regions from these runs where we know that molecular clouds are forming and then start to zoom-in [4]. This allow us to follow the evolution of molecular clouds with a significantly higher spatial res-olution of 0.06 pc.
Structure of molecular cloudsWe investigate the formation of a couple of molecular clouds in our simulations. In Fig. 1 we demonstrate the power of the applied zoom-in technique. Even from these simple projection a couple of interesting results emerge. First, the clouds investigated are far off from a spherically symmetric structure but rather show a highly fragmented and filamentary shape. It appears also that the individual clouds show large morphological differ-ences between each other.
The fragmentary and filamentary structure is also re-flected by the so-called fractal dimension of these clouds. The fractal dimension describes how volume-fill-ing a structure is: a homogeneous medium would have a fractal dimension of 3, a sheet-like structure 2, and a thin string-like filament a fractal dimension of 1. By analyzing the individual molecular clouds we find that in general the clouds tend to have a fractal dimension around 2.5, which is in excellent agreement with actually observed molecular clouds.
Chemical compositionIn our study we investigate the resolution required to resolve the formation of molecular species, which has often been neglected in the literature. In general, only for a resolution of 0.24 pc or better the simulations seem to be converged.
Simulating the formation, evolution, and merging of molecular clouds 1
Research Institution1. Physikalisches Institut, Universität zu KölnPrincipal InvestigatorDaniel SeifriedResearchersDaniel Seifried, Stefanie Walch, Philipp Girichidis, Thorsten Naab, Sebastian HaidProject PartnersMPA Garching, AIP Potsdam
SuperMUC Project ID: pr94du

47
Simulating the formation, evolution, and merging of molecular clouds
Reaching such a resolution, is essential to be able to acurrately compare simulation to observations, which is done via creating so-called synthetic observations from the simulated data. Doing so we were able to make pre-diction about the frequently observed line emission of the CO molecule. In addition using the novel dust polar-isation radiative transfer code POLARIS, we were able to produce polarisation maps. These maps help to analyse the magnetic field structure in molecular clouds. Com-paring our simulated maps with actual observations sig-nificantly improves our understanding in how to inter-pret real observations.
Dynamics of molecular cloudsIt is a long-standing debate in which state observed mo-lecular cloud are. Are they gravitationally bound or un-bound, are the collapsing and how strong are the inter-nal turbulent motions. With the present simulations we can investigate these question in detail.
Furthermore, it is a controversly debated question, what drives the strongly supersonic turbulence observed in the clouds. In order to to investigate this in detail, we ex-posed the clouds to supernova going off in their vicinity (Fig. 2). We could show that, despite the enormous ener-gy released during a supernove explosion, it’s impact on the molecular clouds remains rather moderate. Most of the hot gas stemming from the supernova is channelled around the cloud and does not effect its densest parts.
On-going Research / Outlook
For our future research we intend to study the evolution of further molecular clouds. In particular we will focus on the impact of magnetic fields not discussed here so far, as well as the impact of radiation released from starts formed inside the clouds. This will require further large amounts of computing power in the future.
References and Links
See also http://www.astro.uni-koeln.de/silcc
[1] Walch, S., Girichidis, P., Naab, T., et al. 2015, MNRAS, 454, 238[2] Girichidis, P., Walch, S., Naab, T., et al. 2015, MNRAS, 456, 3432[3] Fryxell, B., Olson, K., Ricker, P., et al. 2000, ASTROPHYS. J. SUPPL. S., 131,
273[4] Seifried, D., Walch, S., Girichidis, P., et al. 2017, MNRAS, 472, 4797
Figure 1: Zoom-in from a galactic disk onto a molecular cloud, and finally on the central high-density part of the cloud, demonstrating the power of the applied zoom-in technique [4].
Figure 2: 3D representation of a molecular cloud modelled in the project pr94du. The reddish material represent the dense, filamentary gas, whereas the bluish material presents dilute and hot gas of nearby supernova remnants.

48
Astrophysics
Introduction
Our Cosmic Home, the local volume of the Universe, that is centered on us and extends over 1 billion light-years, is a formidable site for detailed observations. Therefore, cosmological Simulations of the LOcal Web (SLOW) in-cluding galaxies (clumps of dust, stars and planets), rather than any other part of the cosmic web, are per-fect tools to test our formation and evolution theories of galaxies and galaxy clusters down to the details. Indeed, structure formation is studied through the equation of motion of tracer particles in initial conditions. However, a random realization of the cosmological model used as initial conditions does not necessarily reproduce the lo-cal structure making direct comparisons with the local observations extremely challenging.
The ‘SLOW dancing galaxies’ project will follow the evo-lution of dark (nature of most of the matter in the Uni-verse) and baryonic (the directly visible Universe) matter within a simulation volume that stands for our cosmic neighborhood out to a distance of 1 billion light-years. The initial conditions for such simulations are obtained with sophisticated algorithms that take into account the position and motion estimates of thousands of galax-ies within our local volume. These local measurements allow to constrain the initial conditions that, in return, when motions since early times until today are followed according to the gravity laws, lead to the observed lo-cal large scale structure. When in addition, the baryonic matter follows hydrodynamical laws (together with rec-ipes to model the birth of stars), the galaxy population is also simulated. The latter can be directly compared to the observed galaxy population.
Simulations resembling the local large scale structure and resolving its galaxy population need to follow a very large dynamical range (sampled with several tens of bil-lion resolution elements) and therefore can only be per-formed on the largest supercomputers.
Results and Methods
Simulating a 2 billion light-years box representing our Cosmic Home including galaxies down to the mass of our Milky Way (e.g. resolving masses about 1011-1012 times the solar mass with at least several hundreds of particles) con-stitutes a formidable computational challenge. A single, dark matter only simulation reaching such a high resolu-tion in this large volume requires already an amount of 0.5 Million CPUh of computing time and typically runs on 16 thousands computing cores.
Building the necessary initial conditions requires strin-gent preliminary steps. These steps include preparing the observational data (motions of local galaxies) that need to undergo a grouping procedure to erase the non-linear effects and a carefully designed observational bias mini-mization technique [2], before they can be inserted into the whole machinery [3] that produce initial conditions of our local environment. Because of the scarcity of the ob-servational data, a random field has to be superimposed to the data to make a proper realization of the cosmolog-ical model.
Therefore, as a first step within the selection process of the final initial conditions, lower resolution dark matter only simulations are performed using many different random fields. The initial conditions that give the sim-ulated structure that closest resembles that of our very well observed Cosmic Home is then selected. A substan-tial amount of ~250 initial conditions at low resolution (particle mass about 1011 times the solar mass) was built and evolved with dark matter only in this first step. Every simulation was analyzed to determine the cluster mass-es and inferred the agreement with their observed local counterparts. Several animations of such comparisons are available at [1].
The initial conditions of the box that contained the clus-ters that resemble the most to the local observed clusters were then selected. A part of this box is shown on Figure 1. It represents the simulated counterpart (black points are
Our Cosmic Home in a box: SLOW dancing galaxies1
Research InstitutionCentre de Recherche Astrophysique de Lyon, Leibniz-Institut für Astrophysik, Universitäts-Sternwarte München, Ludwig Mazimilian Universität MünchenPrincipal InvestigatorJenny G. Sorce, Klaus DolagResearchersSergey Pilipenko, Stefan GottlöberProject PartnersCRAL Lyon, USM/LMU Munich, RAS Moscow, AIP Potsdam
SuperMUC Project ID: pr74do (Gauss Large Scale project)

49
dark matter particles from the simulation) of the Hercules supercluster that is constituted of several observed Abell clusters (blue names).
From the selected initial conditions, higher resolutions initial conditions were produced using the GINNUN-GAGAP code. The latter allows adding additional cos-mological fluctuations at the smallest scales without changing the large scales. Adding such additional scales permitted looking for the initial conditions that would host galaxies that best reflect the current appearance (e.g. geometry and dynamics) of the well-known local
Group, an assembly of galaxies within tens of million light-years around the Milky Way and its closest neigh-bor, Andromeda (M31). Another 200 simulations were performed to prepare a list of possible realizations with reasonable local Group candidates.
As a last step, the resolution was further increased to roughly 3x10⁸ times the solar mass for the dark matter particles to allow resolving even smaller galaxies within the local Group. Almost 20 of such high-resolution simu-lations where performed to finally select the best match. The distribution of simulated and observed galaxies in
Figure 1: Slice of the simulated box of ~100 million light-years centered on the Hercules supercluster that contains 11 Abell clusters (bound). The black points stand for the dark matter particles. Observed galaxies whose motions are used to constrain the initial conditions are in red. Positions of Abell clusters from the NASA database are in blue.
Our Cosmic Home in a box: SLOW dancing galaxies

50
Astrophysics
Figure 2: Slice of the simulated box of about 10 million light-years showing the Virgo cluster of galaxies, our closest cluster-neighbor and the local Group. The latter contains our galaxy, the Milky Way, and Andromeda (M31). Same color code as Fig. 1 but blue symbols stand for the Virgo cluster and local galaxies
the local Group and the local environment out to the Virgo cluster, our closest cluster-neighbor, is shown in Figure 2 with the same color code as Figure 1.
On-going Research / Outlook
Our next step is to run the selected initial conditions with full hydrodynamical treatment [4,5,6,7] which is important for studying the formation of active ga-lactic nuclei (AGN), galaxies, and galaxy cluster. The
simulation will then contain simulated galaxies of the local volume which reproduce detailed properties of galaxies of different morphologies, their angular mo-mentum properties and the evolution of the stellar mass--angular momentum relation with redshift, the mass-size relations and their evolution, global proper-ties like the fundamental plane or dark matter frac-tions, the baryon conversion efficiency, as well as the dynamical properties of early type galaxies, see [8] and references therein.
1

51
Our Cosmic Home in a box: SLOW dancing galaxies
Subsequently, galaxy properties such as color, metallicity, star-formation rate will be extracted from the simulation to make a deep comparisons with the observed galaxy population of our neighborhood. Galaxy population mod-els can then be validated or/and calibrated.
Our step next to this one will be to run an even higher res-olution simulation (107-108 times the solar mass) but only within a subset of the local volume to reduce the compu-tational costs. Such a resolution will allow us to simulate even smaller galaxies within the inner part of the local volume.
References and Links
[1] wwwmpa.mpa-garching.mpg.de/HydroSims/SLOW_dancing_galaxies/
[2] Sorce 2015, MNRAS 450, 2644[3] Sorce, Gottlöber, Yepes, et al. 2016, MNRAS 455, 2078[4] Dolag, Komatsu, Sunyaev 2016, MNRAS, 463, 1797[5] www.magneticum.org[6] Teklu, Remus, Dolag et al. 2015, ApJ, 812, 29[7] Hirschmann, Dolag et al. 2014, MNRAS, 442, 2304[8] Teklu, Remus, Dolag et al. 2018, ApJL, 854, 28


Chapter 02 – Chemistry and Material Sciences
Chemistry and Material
Sciences

54
Chemistry and Material Sciences
2
Monte-Carlo and density functional studies of spintronic effects in (quasi) two-dimensional systems
Research InstitutionUniversität RegensburgPrincipal InvestigatorJaroslav FabianResearchersTobias Frank, Martin Gmitra, Petra Högl, Denis Kochan, Marcin Kurpas, Kamil TokarProject PartnersRene Derian, Lubos Mitas, Ivan Stich
SuperMUC Project ID: pr48nu
Introduction
Spintronics is the broad field of solid-state physics, which utilizes the charge and spin degree of freedom for real-izing novel technologies for information processing and storage. Spintronics represents our main research inter-est [1]. An important class of materials, which is currently being explored for such applications is based on carbon as carrier material. Therefore, the investigation of organ-ic materials like graphene and other two-dimensional layered materials plays an important role. Besides their potential importance in technologies those materials offer possibilities to study novel phases of matter with unusual topological properties. A main topic here is the realization of topological insulators, a very recent and impacting research field. We also investigate numerically novel two-dimensional semiconductors, such as transi-tion-metal dichalcogenides or phosphorene, which have a great potential for electronic, optical, as well as spin-tronics applications.
Results and Methods
Monte Carlo study of phosphorenePhosphorene is a monolayer of black phosphorus exhib-iting a direct band gap of about 2 eV and large aniso-tropic mobility. Unlike graphene, phosphorene is a semi-conductor, and unlike two-dimensional transition-metal dichalcogenides, which are semiconductors too, phos-phorene is distinctly anisotropic thanks to its puckered atomic structure. The semiconductor property makes phosphorene suitable for electronic and spintronics ap-plications. Experimentally and theoretically no consist-ent values for the optical and fundamental gaps have been obtained in literature so far. In this study we aim to determine the optical gap employing highly-paralleliz-able quantum Monte Carlo methods, which enable us to address correlation effects beyond standard DFT. The focus here is on testing novel ways to treat the many-body physics in two-dimensional materials. Monte Carlo is excellently suited for this task, as it has a better scaling than quantum chemistry methods. Typically, computa-tions can run perfectly parallelized on several thousand
Figure 1: Protected pseudohelical states in proximitized graphene. Tubes with arrows indicate the edge states on a graphene ribbon (indicated by black spheres) which is placed on a substrate generating special alternating spin-dependent magnetic fluxes (red and blue triangles) [6].
processors, exhibiting linear scaling. In this study, which consumed more than 30 million core hours, we try to give a benchmark value for the fundamental gap for oth-er correlated theories such as GW+BSE. Our preliminary result is a gap of 2.4 eV for freestanding phosphorene [2], which predicts a large exciton binding energy of about 0.6 eV.
Spin relaxation in phosphoreneHere we performed DFT calculations of the essential spin-orbit and spin relaxation properties of phosphorene [3]. We found that intrinsic spin-orbit coupling induc-es spin mixing with the probability of the order of 104, exhibiting a large anisotropy, following the anisotropic crystalline structure of phosphorene. For realistic values of the momentum relaxation times, the intrinsic (Elli-ott-Yafet) spin relaxation times were calculated to hun-dreds of picoseconds to nanoseconds. Applying a trans-verse electric field (simulating gating and substrates) generates extrinsic two-fold symmetric spin-orbit fields in phosphorene, which activate the D’yakonov-Perel’ mechanism for spin relaxation. We showed that this extrinsic spin relaxation also has a strong anisotropy and can dominate over the Elliott-Yafet one for strong enough electric fields. Phosphorene on substrates can thus exhibit an interesting interplay of both spin-relax-ation mechanisms, whose individual roles could be deci-phered using our results.

55
Monte-Carlo and density functional studies of spintronic effects in (quasi) two-dimensional systems
Proximity effects in heterostructuresIn this sub-project we have concentrated on DFT sim-ulations of graphene on metal surfaces and on transi-tion-metal dichalcogenides.In case of graphene on metal surfaces, we considered the Cu(111) surface and investi-gated effects of orbital and spin-orbit proximity effects in graphene [4]. The proximity effects are caused mainly by the hybridization of graphene π and copper d orbitals. Our electronic structure calculations agree well with the experimentally observed features.
We carry out a graphene-Cu(111) distance dependent study to obtain proximity orbital and spin-orbit coupling parameters, by fitting the DFT results to a robust low energy model Hamiltonian. We find a strong distance dependence of the Rashba and intrinsic proximity in-duced spin-orbit coupling parameters, which are in the meV and hundreds of μeV range, respectively, for ex-perimentally relevant distances. The Dirac spectrum of graphene also exhibits a proximity orbital gap, of about 20 meV. Furthermore, we find a band inversion with-in the graphene states accompanied by a reordering of spin and pseudospin states, when graphene is pressed towards copper.
Graphene on transition-metal dichalcogenides exhib-it similar features as graphene on Cu(111) [5]. Intrinsic spin-orbit coupling is enhanced by the proximity effect by orders of magnitude. The sublattice resolved intrin-sic spin-orbit coupling effects are of staggered type and can lead to a peculiar band inversion in the low-energy Dirac spectrum of graphene. By extensive tight-bind-ing studies we explore the finite-size behavior of edge states appearing in this system [6]. One important result of this study is the occurrence of edge states which are protected by time-reversal symmetry in trivial insulators, by finite size quantization effects, see Fig. 1. One peculiar
Figure 2: Spin-orbit valve effect in bilayer graphene proximitized by transition metal dichalcogenides. On (upper panel) and off states (lower panel) of the spin transistor are shown. In the on state, the proximity spin-orbit coupling leads to a precession of the injected spins, such that they arrive with parallel configuration at the analyzing contact.
feature of these states appearing at the zigzag edge of a graphene ribbon is the generation of a pure spin current in the ground state. This might be useful for spin current generation in spintronics devices.
For bilayer graphene on transition-metal dichalcogenides we investigated proximity orbital and spin-orbit effects in bilayer graphene on monolayer WSe2 [5]. We found by DFT simulations that built-in electric field induces an orbital band gap of about 12 meV in bilayer graphene. Re-markably, the proximity spin-orbit splitting for holes is 2 orders of magnitude — the spin-orbit splitting of the valence band at K point is about 2 meV — more than for electrons. Effectively, holes experience spin valley locking due to the strong proximity of the lower graphene layer to WSe2. However, applying an external transverse elec-tric field of some 1 V/nm, countering the built-in field of the heterostructure, completely reverses this effect and allows, instead of holes, electrons to be spin valley locked with 2 meV spin-orbit splitting. Such a behavior consti-tutes a highly efficient field-effect spin-orbit valve, mak-ing bilayer graphene on WSe2 a potential platform for a field-effect spin transistor, see Fig. 2.
On-going Research / Outlook
The topic of proximity effects on graphene is a very fruit-ful and technologically promising field. We will study further proximity induced superconductivity, sublattice resolved exchange effects by DFT and tight-binding calculations. The exact determination of van der Waals gaps between layered two-dimensional materials is also an interesting task. We are interested to apply our newly acquired knowledge of ab-initio quantum Monte-Carlo methods to the case of graphene edge magnetism or magnetism induced by atom adsorption.
References and Links
[1] www.physik.uni-regensburg.de/forschung/fabian[2] Tobias Frank, Rene Derian, Kamil Tokar, Lubos Mitas, Jaroslav Fabian,
and Ivan Stich, arXiv:1805.10823[3] Marcin Kurpas, Martin Gmitra, and Jaroslav Fabian, Phys. Rev. B 94,
155423 (2016)[4] Tobias Frank, Martin Gmitra, and Jaroslav Fabian, Phys. Rev. B 93,
155142 (2016)[5] Martin Gmitra, Petra Högl, Denis Kochan, and Jaroslav Fabian, Phys.
Rev. B 93, 155104 (2016)[6] Tobias Frank, Petra Högl, Martin Gmitra, Denis Kochan, and Jaroslav
Fabian, Phys. Rev. Lett. 120, 156402 (2018)[7] Martin Gmitra, and Jaroslav Fabian, Phys. Rev. Lett. 119, 146401
(2017)
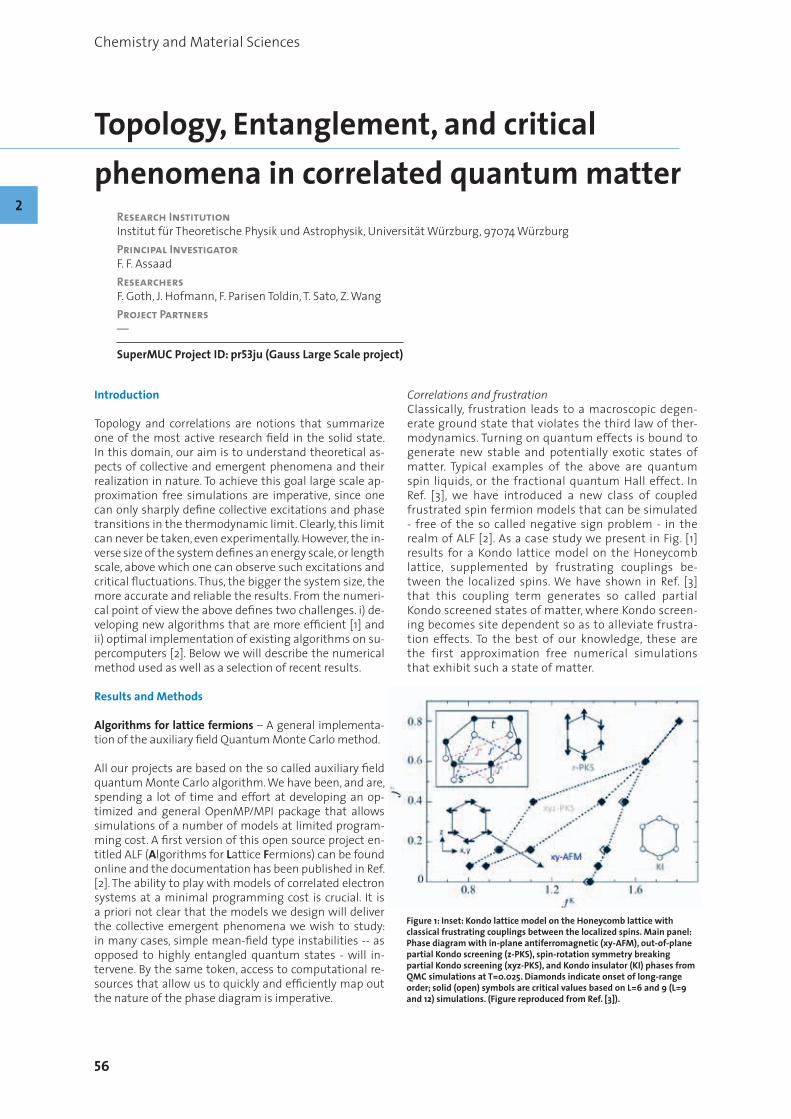
56
Chemistry and Material Sciences
2
Topology, Entanglement, and critical phenomena in correlated quantum matter
Research InstitutionInstitut für Theoretische Physik und Astrophysik, Universität Würzburg, 97074 Würzburg Principal InvestigatorF. F. Assaad ResearchersF. Goth, J. Hofmann, F. Parisen Toldin, T. Sato, Z. Wang Project Partners—
SuperMUC Project ID: pr53ju (Gauss Large Scale project)
Introduction
Topology and correlations are notions that summarize one of the most active research field in the solid state. In this domain, our aim is to understand theoretical as-pects of collective and emergent phenomena and their realization in nature. To achieve this goal large scale ap-proximation free simulations are imperative, since one can only sharply define collective excitations and phase transitions in the thermodynamic limit. Clearly, this limit can never be taken, even experimentally. However, the in-verse size of the system defines an energy scale, or length scale, above which one can observe such excitations and critical fluctuations. Thus, the bigger the system size, the more accurate and reliable the results. From the numeri-cal point of view the above defines two challenges. i) de-veloping new algorithms that are more efficient [1] and ii) optimal implementation of existing algorithms on su-percomputers [2]. Below we will describe the numerical method used as well as a selection of recent results.
Results and Methods
Algorithms for lattice fermions – A general implementa-tion of the auxiliary field Quantum Monte Carlo method.
All our projects are based on the so called auxiliary field quantum Monte Carlo algorithm. We have been, and are, spending a lot of time and effort at developing an op-timized and general OpenMP/MPI package that allows simulations of a number of models at limited program-ming cost. A first version of this open source project en-titled ALF (Algorithms for Lattice Fermions) can be found online and the documentation has been published in Ref. [2]. The ability to play with models of correlated electron systems at a minimal programming cost is crucial. It is a priori not clear that the models we design will deliver the collective emergent phenomena we wish to study: in many cases, simple mean-field type instabilities -- as opposed to highly entangled quantum states - will in-tervene. By the same token, access to computational re-sources that allow us to quickly and efficiently map out the nature of the phase diagram is imperative.
Figure 1: Inset: Kondo lattice model on the Honeycomb lattice with classical frustrating couplings between the localized spins. Main panel: Phase diagram with in-plane antiferromagnetic (xy-AFM), out-of-plane partial Kondo screening (z-PKS), spin-rotation symmetry breaking partial Kondo screening (xyz-PKS), and Kondo insulator (KI) phases from QMC simulations at T=0.025. Diamonds indicate onset of long-range order; solid (open) symbols are critical values based on L=6 and 9 (L=9 and 12) simulations. (Figure reproduced from Ref. [3]).
Correlations and frustrationClassically, frustration leads to a macroscopic degen-erate ground state that violates the third law of ther-modynamics. Turning on quantum effects is bound to generate new stable and potentially exotic states of matter. Typical examples of the above are quantum spin liquids, or the fractional quantum Hall effect. In Ref. [3], we have introduced a new class of coupled frustrated spin fermion models that can be simulated - free of the so called negative sign problem - in the realm of ALF [2]. As a case study we present in Fig. [1] results for a Kondo lattice model on the Honeycomb lattice, supplemented by frustrating couplings be-tween the localized spins. We have shown in Ref. [3] that this coupling term generates so called partial Kondo screened states of matter, where Kondo screen-ing becomes site dependent so as to alleviate frustra-tion effects. To the best of our knowledge, these are the first approximation free numerical simulations that exhibit such a state of matter.

57
Topology, Entanglement, and critical phenomena in correlated quantum matter
Competing orders in Dirac systemsIn Ref. [4] we designed a model that allows for spon-taneous antiferromagnetic (AFM) and Kekulé valence bond solid (KVBS) orders (See. Fig 2). We consider Dirac fermions, as realized by a tight binding model with ma-trix element t on the honeycomb lattice, supplemented by a Hubbard U term. This term triggers an O(3) Gross-Neveu transition between the semi-metal and an AFM. To account for a competing ordered state, we couple our model to an Ising degree of freedom in a transverse field of magnitude h. The coupling between the Ising and fer-mionic degrees of freedom is chosen such that when the Ising field orders it triggers a KVBS.
The main result of the paper, is the observation of a di-rect and continuous transition between the AFM and KVBS with emergent SO(4) symmetry. This transition cannot be understood in the realm of mean-field type Ginzburg-Landau transitions, and belongs to the cat-egory of so called deconfined quantum critical points (DQCP). Here, the emergent SO(4) symmetry allows for a topological ⊖-term at ⊖=π in the low energy effec-tive field theory. As a consequence the domain wall de-fects of the KVBS order harbor spin 1/2 chains. At the critical point these spin 1/2 chains condense and form the AFM order.
On-going Research / Outlook
The above presents a small selection of projects, the re-sults of which define questions and numerical challeng-es. In the future we will continue research along the fol-lowing lines.
Algorithms. The models we have defined are free of the so called negative sign problem such that computation-al effort scales as the system size to the cubed times the inverse temperature. To date our Monte Carlo up-dating schemes are based on local updates that invari-ably lead to long autocorrelation times especially in the vicinity of quantum phase transitions. At present this is
Figure 2: Phase diagram with semimetallic, antiferromagnetic (AFM), and Kekulé-ordered (KVBS) phases from QMC simulations at T=0.05. Circles (diamonds) indicate the onset of long-range Néel (Kekulé) order; open (solid) symbols are critical values based on L=3 and 6 (L=6 and 9) simulations. (Figure reproduced from Ref. [4]).
the major obstacle hindering access to much larger lat-tices. Efforts to develop global updating schemes based on machine learning or on Hybrid Monte Carlo meth-ods are under way [5].
Competing orders in Dirac Fermions. Mutually compat-ible (i.e. anti-commuting) dynamically generated mass terms in Dirac systems are a golden route to study a variety of exotic quantum phase transitions where new elementary particles emerge at the transition. In the aforementioned model, we can check the validity of the low-energy effective field theory by imposing domain walls of the KVBS order and numerically testing if spin-1/2 chains emerge at the domain wall. Furthermore, a unique signature of the new so-called spinon particles, should be visible in the dynamical quantities such as the spin dynamical structure factor. Such quantities are measured in neutron scattering experiments. Finally, dif-ferent mass terms, such as superconductivity and quan-tum spin Hall can be considered. The interest here lies in generating microscopically very different models that should belong to the same universality class.
Correlations and frustrationThe PKS phase presented above, requires better under-standing. In fact, the only way to define precisely Kondo physics, is with the notion of entanglement between the local spin degrees of freedom and the conduction elec-trons. To obtain a better understanding of the phase di-agram presented in Fig. 1 we plan to study the so-called mutual information between the spin and fermion sub-systems. Beyond this specific model, Ref. [3] allows for simulations of a variety of models where the spin system can be driven to an exotic state of matter such as a spin liquid. Here, notions such as Kondo breakdown where spin and electronic systems effectively decouple can be investigated.
To conclude, Quantum Monte Carlo simulations of fermion systems allow to study a variety of emergent quantum phenomena free of approximations. We can generate on the computer new phases of matter as well as new quantum phase transitions, thereby enhancing our understanding of collective quantum phenomena. Since our models are based on the fundamental rules of quantum mechanics, these states of matter should appear in nature.
References and Links
[1] Manuel Weber, Fakher F. Assaad, and Martin Hohenadler, Direct-ed-loop quantum Monte Carlo method for retarded interactions, Phys. Rev. Lett. 119 (2017), 097401.
[2] Martin Bercx, Florian Goth, Johannes S. Hofmann, and Fakher F. As-saad, The ALF (Algorithms for Lattice Fermions) project release 1.0. Documentation for the auxiliary field quantum Monte Carlo code, SciPost Phys. 3 (2017), 013. (http://alf.physik.uni-wuerzburg.de)
[3] Toshihiro Sato, Fakher F. Assaad, and Tarun Grover, Quantum Monte Carlo simulation of frustrated Kondo lattice models, Phys. Rev. Lett. 120 (2018), 107201.
[4] Toshihiro Sato, Martin Hohenadler, and Fakher F. Assaad, Dirac fermions with competing orders: Non- landau transition with emergent symmetry, Phys. Rev. Lett. 119 (2017), 197203.
[5] Stefan Beyl, Florian Goth, and Fakher F. Assaad, Revisiting the hy-brid quantum Monte Carlo method for Hubbard and electron-pho-non models, Phys. Rev. B 97 (2018), 085144.

58
Chemistry and Material Sciences
2
High-throughput search for transparent p-type conducting non-oxide materials
Research InstitutionMax-Planck-Institut für chemische Physik fester Stoffe, DresdenPrincipal InvestigatorS. Hossein MirhosseiniResearchersRamya Kormath Raghupathy and Thomas D. KühneProject Partners—
SuperMUC Project ID: pr53lo (Summer of Simulation project)
Introduction
One of the aims of SpeedCIGS project [1] is to find new materials that can be employed in the future tandem cells [2]. Transparent conducting materials (TCMs) are crucial for the realization of high-performance tandem cells [3]. Potential materials for TCMs should offer two contradictory properties: a wide band gap and a low carrier effective mass. Among various TCMs, oxides have been widely studied owing to their stability, low electron effective mass, and optical transparency. Previ-ous research on transparent conducting oxides (TCOs) has shown their outstanding properties as high-perfor-mance n-type conductors. However, in many optoelec-tronic applications, such as interlayer electrodes in tan-dem cells, high-performance p-type TCMs are required. The performance of p-type TCOs is hindered by the lo-calized p states of oxygen in the valence band, which results in heavy holes [4]. Demands for p-type TCMs and the deficient performance of this class of material have promoted intensive research efforts from academia and industry to rationalize and design potential p-type TCMs.
In this work, we performed high-throughput density functional calculations for halcogenide-based binary semiconductors to identify the most promising p-type transparent conductors. We proposed some novel p-type non-oxide TCMs that have a low hole effective mass, good optical transparency, and hole dopability.
Results and Methods
All density functional calculations were performed us-ing the Vienna Ab initio Simulation Package (VASP) with PAW pseudopotentials and a plane-wave cutoff of 500 eV. The exchange correlation is described with the Perdew-Burke-Ernzerhof (PBE) form of the generalized gradient approximation for structural optimization. All the atoms in the system were allowed to relax until the force on each atom was less than 0.01 eV/Å. Brillouin zone integration was performed on a Monkhorst k-point mesh. Since PBE functional tends to underestimate the
Figure 1: Defect formation energies of MgS (top panel) and MgTe (bot-tom panel) as a function of electron chemical potential (μe). The x axis shows the experimentally measured band gaps of the compounds.
band gaps of semiconductors, we employed the HSE06 screened hybrid functional to calculate the band struc-tures and hole effective masses of selected compounds. We have used about 5m core-hours for our high-through-put calculations for more than 100 compounds. Jobfarm-ing technique was used to put together several jobs such that each job needs a large number of cores (typically 1280 cores per job).

59
High-throughput search for transparent p-type conducting non-oxide materials
Our study focused on material screening and material engineering for optoelectronic applications. Our criteria for material screening were as follows: materials with Eg>1.7 eV (the minimum value needed for Cu(In, Ga)Se2-based tandem cells) and a hole effective mass <1. Among 500 compounds, we found less than 100 that satisfied our screening criteria for Eg. The atomic struc-tures of the selected compounds were optimized and their stability were calculated. The chemical potential diagram corresponding to each compound was also computed. For materials that satisfy our criteria, intrin-sic defects such as vacancies and antisites were con-sidered to determine the p-type dopability. Materials that upheld intrinsic defects were further selected to understand foreign atom chemistry. Extrinsic dopants were substituted to determine their effects on p-type performance. Our material screening strategy led to the identification of eight potential p-type transparent con-ductors (ZnS, ZnSe, ZnTe, MgS, MgTe, GaSe, A2Se3, and BeTe). The compounds and calculated band gaps and hole effective masses are listed in Table 1. The following paragraphs outline the properties of the most promis-ing p-type TCM candidates.
ZnS is a direct band gap semiconductor with a wide band gap of 3.7 eV. Considering the intrinsic defects, ZnS is not a promising p-type conductor. However, the role of extrinsic dopants for ZnS was explored owing to its promising electronic properties. We observed that ex-trinsic dopants such as Na and K for Zn increase the hole concentration. The formation energies for these defects were found to be about 1.0 eV less than those for intrin-sic defects. In agreement with the previous results, we also found that CuZn acts as an acceptor and increases the hole concentration. Doping with the suggested al-kali metals will give rise to better p-type conductivity by preventing the formation of intrinsic antisite defects. In ZnTe, cation vacancies form more easily than anion va-cancies and antisites. Cation vacancies introduce holes into the system and improve conductivity in ZnTe. An-tisites and anion vacancies impact the transport prop-erties of ZnTe. However, the formation energies of these intrinsic defects are too high. Similar to ZnS, ZnTe could also be doped with Na and Cu. The properties of ZnSe fall between ZnS and ZnTe.
Compound EHSE (eV) m*h (me)
ZnS 3.5 0.70
ZnSe 2.6 0.63
ZnTe 2.6 0.40
MgS 5.5 0.96
MgTe 4.2 0.18
GaSe 2.6 0.25
Al2Se3 3.1 0.56
BeTe 2.6 0.35
Table 1: Selected compounds and their calculated band gaps and effective masses.
Mg-based chalcogenides have wide band gaps, which is the primary requirement for optoelectronic applications. Cubic MgS has an indirect band gap of 6.4 eV, whereas hexagonal MgTe has a direct band gap of 4.7 eV. The for-mation of intrinsic defects was less likely in MgS than in MgTe (see Figure 1). Although both materials have small hole densities without doping, Na- or K-doped MgS and MgTe are good candidates for p-type conductors. Adding these alkali metals to these systems led to the formation of NaMg and KMg substitutional acceptor defects.
Al2Se3 has a wide direct band gap (Eg = 3.1 eV). The for-mation of anion vacancies generate transition states at about 0.60 eV above the valence band maximum. An-tisite and cation vacancies have low formation energies compared with anion vacancies. However, the intrinsic defects in Al2Se3 have very high formation energies and consequently their concentrations are low. In contrast to intrinsic defects MgAl substitutional defect has low for-mation energy and is beneficial for p-type conductivity.
BeTe is an indirect band gap semiconductor with a large band gap (Eg = 2.9 eV) and a small hole effective mass of 0.35. Without doping, BeTe is a potential p-type con-ductor because the formation energies for cation vacan-cies are low compared with other intrinsic defects. To enhance the hole conductivity, BeTe can intentionally be doped with Li. LiBe has low formation energies when the Fermi level is at the valence band maximum. LiBe is an acceptor and increases the hole concentration.
GaSe is another chalcogenide that has a low hole effec-tive mass and relatively large band gap (2.1 eV). Anion vacancies and antisites act as donors at small electron chemical potentials and create transition levels in the band gap. Cation vacancies create a transition state in the band gap as well. All interstitial defects have rela-tively high formation energies and consequently low concentrations in GaSe. GaSe could be doped with Zn to enhance the p-type conductivity. ZnGa defects create shallow acceptor levels. It has been shown experimental-ly that Zn enhances the hole conductivity of GaSe, which is also evident from our calculations.
On-going Research / Outlook
High-throughput calculations need large computer re-sources. We have used 5m core-hours of our computing time to preform the calculations which we could not do on our local clusters.
We are going to perform high-throughput calculations for ternary chalcogenides as well as other classes of ma-terials such as halides. For these calculations we are go-ing to apply for computing time on LRZ.
References and Links
[1] http://www.cpfs.mpg.de/kiss[2] http://www.superstrate.net/pv/limit/tandem.html[3] K. Ellmer. 2012. Past Achievements and Future Challenges in the
Development of Optically Transparent Electrodes. NAT PHOTONICS 6 (2012), 809-817.
[4] M. Morales-Masis, S. De Wolf, R. Woods-Robinson, J. W. Ager, and C. Ballif. 2017. Transparent Electrodes for Efficient Opto-electronics.

60
Chemistry and Material Sciences
2
Ab initio modelling of iridium dioxide nanoparticles as catalysts
for proton exchange membrane water electrolysis cellsResearch InstitutionChair of Theoretical Chemistry, Technische Universität MünchenPrincipal InvestigatorJakob TimmermannResearchersDaniel Opalka, Anna AnicProject Partners—
SuperMUC Project ID: pr53qu (Summer of Simulation project)
Introduction
One of the major challenges of this century is the de-carbonization of the energy production using renewa-ble energy sources with flexible conversion and storage of electricity as a key aspect arising from decentralized and fluctuating energy production. Converting sur-plus electricity in high-purity hydrogen, water electrolysis is one of the promising methods since hydrogen is an in-dispensable component of chemical industry and of im-portance as a high-energy fuel.
Characterized by high maximum operating pressure, high maximum achievable current density and negligi-ble overpotential regarding the hydrogen evolution reac-tion the Proton Exchange Membrane (PEM) electrolysis is perfectly fitting plenty of industrial requirements. The main drawback of PEM cells however is the substantial overpotential of the oxygen evolution reaction (OER) re-sulting in significant potential loss at the anode setting high standards for any catalyst.
In the acidic and corrosive operating conditions of PEM cells iridium dioxide (IrO2) is currently the only stable cat-alyst. While sufficiently active the low abundance of irid-ium makes a reduction of the iridium loading inevitable to achieve commercial viability. A common approach to increase the surface area and to hence decrease catalyst loading is the use of nanoparticles.
To enable a stringent optimization of IrO2 catalyst a general understanding of the nanoparticles w.r.t. their
shape, surface structure (facet and termination) as well as overall stability is required. In this project a modelling and simulation protocol has been developed to generate and simulate IrO2 nanoparticles based on the energies of facets-terminations combinations and hence to provide insights regarding stability and surface reconstruction.
Results and Methods:
Nanoparticle — Compare Wulff structure to optimized geometryThe almost infinite number of possible nanoparticle structures seems to prevent a systematic modelling and simulation approach, however in the early 20th century G. Wulff proposed a simple and systematic way to deter-mine an initial nanoparticle shape (Wulff shape)[1]. This might be explained according to Figure 1:
(I) The energies of (001), (111) and (100) surfaces are cal-culated. (II) Planes perpendicular to the respective Mill-er vectors are shifted relative to the surface energies to obtain the ideal Wulff shape. (III) Based on the rutile IrO2 unit cell and according to information about termi-nations the Wulff particle (IIIa) is extracted. The applied final Wulff shape (IIIb) is in this case different to the ideal Wulff shape (II) due to the discretized nature of the bulk crystal.
Prior to this project the surface energies of all low-index Miller facets and terminations necessary to capture any possible Wulff shape of rutile structured IrO2 have been extracted from periodic slab calculations using FHI-aims. Present project is pursuing following approach: • Generating mono-surface Wulff structures of differ-
ent size for (111) and (101) facets-termination combi-nations.
• Performing geometry relaxation calculations for each structure applying CP2K.
• Analysing the relaxed geometries w.r.t. surface re-construction to verify the Wulff approach.
For both facets three different terminations character-ized by an increasing number of oxygen atoms are taken Figure 1: Schematic Wulff construction of iridium dioxide nanoparticles.

61
Ab initio modelling of iridium dioxide nanoparticles
into account: oxygen-deficient (t0), stoichiometric (t1) and oxygen-rich (t2) with the (111) terminations illustrated in Figure 2. Moreover, for the (111) facet a termination with an additional oxygen (t-O) which cannot be extracted di-rectly from the bulk structure but is generated by attach-ing an additional oxygen to the surface iridium of (111)-t2 has been investigated, also illustrated in Figure 2.
The key results regarding the particle reconstruction are summarized in Table 1 and illustrated in Figure 3. The reconstruction of the different nanoparticles can be compared via the minimal root-mean-square deviation (RMSD) of the initial Wulff structure and the relaxed final geometry. The RMSD value is minimized in two steps ap-plying Kabsch [2] and Quaternion [3] algorithm.
RMSD Atoms All atoms Surface Core
(111)-t0301 4.0 5.0
0.7657 3.6 4.8
(111)-t1
201 4.0 5.10.7491 3.1 4.3
973 2.7 4.1
(111)-t2
243 1.3 1.50.5-0.7565 1.1 1.4
1087 1.0 1.2
(111)-t-O263 1.6 2.1
0.5607 1.4 1.81159 1.1 1.5 0.2
(101)-t0
169 7.5 8.2 1.8521 5.1 6.2 0.91173 4.4 5.9 0.7
(101)-t1255 1.5 1.7
0.45693 1.2 1.4
(101)-t2355 1.4 1.7 0.4889 1.2 1.3 0.2
Table 1: Number of atoms and minimal root mean square deviation of initial and relaxed geometries (RMSD) of structures.
To provide a more precise evaluation of the degree of re-construction the procedure is repeated taking only sur-face atoms respective only core atoms into account.
Figure 3 illustrates that the minimal RMSD value though depending on the size of the particle is much more depending on the selected termination. Oxygen rich surfaces (101)-t2, (111)-t2 and (101)-t-O as well as the sto-ichiometric (101)-t1 surface do not undergo profound re-construction compared to the corresponding core atoms while the oxygen-poor surfaces especially (101)-t0 are prone to reconstruction.
In conclusion regarding oxygen saturated respectively oxygen rich particles the Wulff structures of IrO2 nano-particles seem to be suitable approximation while oxy-gen deficient surfaces undergo noticeable reconstruc-tion and a Wulff approach including such surfaces has to be handle with special care.
On-going Research / Outlook
Limitations and next stepsThe very next step is finishing the comparison and per-formance analysis of AIMS and CP2K calculations which has not been addressed in this report as well as the ex-traction of edge and vertex energies from the surface se-quences in relation to the respective surface frame.
Obviously, the geometry relaxation calculations provide much more information than RMSD values. A detailed analysis of the atomic (e.g. pair correlation function) and electronic structure (e.g. projected density of state) again considering surface and core atoms separately is still pending.
Parallel to ongoing analysis of existing data, new simu-lation protocols shall be developed with special focus on the PEM environment i.e. (implicit) water solvation and/or applied potential to determine to what extent these influence the nanoparticle structure.
References and Links
1. Wulff, G.V., Zeitschrift für Krystallographie und Mineralogie. , 1901. 34: p. 449 -530.
2. Kabsch, W., Acta Crystallographica Section A, 1976. 32(5): p. 922-923.3. Walker, M.W., L. Shao, and R.A. Volz,. CVGIP: Image Understanding,
Figure 3: RMSD considering only surface (solid line) or core (dashed line) atoms of all investigated particles. The labels small, medium and big refer to Table 1 (e.g. small particles include all structures with less than 450 atoms).
Figure 2: The four different surfaces related to the (111) facet: oxygen deficient (111)-t0, stoichiometric (111)-t1, oxygen rich (111)-t2 and (111)-t-O with an additional oxygen attached to the surface iridium.

62
Chemistry and Material Sciences
2
Photocatalytic water splitting with carbon nitride materials
Research InstitutionDepartment of Theoretical Chemistry, TU MunichPrincipal InvestigatorJohannes EhrmaierResearchersDaniel OpalkaProject Partners—
SuperMUC Project ID: pr53wo (Summer of Simulation project)
Introduction
Photocatalytic water-splitting, that is, the production of hydrogen and oxygen from water with sunlight, has the potential to provide unlimited, clean and sustainable en-ergy. In 2009, Antonietti and coworkers reported for the first time hydrogen production from water using a car-bon nitride (CN) photocatalyst [1]. Since then, CN materi-als have attracted vast interest in the field. They can split water under irradiation with visible light, consist of earth abundant materials and are photo-stable. In 2015, it was shown that a CN material doped with carbon nano-dots can split water into molecular hydrogen and oxygen in a stoichiometric ratio of 2:1, but the underlying atomistic mechanism is hitherto unknown. Large scale ab initio simulations, including the solvent explicitly, are the only way to gain insight into the photochemical mechanism of water splitting.
Recently, Domcke and Sobolewski suggested a photo-chemical mechanism for solar water splitting in hydro-gen-bonded molecular systems [2-3]. The mechanism is summarized in Fig. 1. Absorption of a photon drives an H-atom transfer from water to the catalyst, producing a hydrogenated catalyst radical and an OH radical. Sub-sequently, the transferred H-atom of the hydrogenated catalyst is either photo-detached and atomic hydrogen is formed, or two hydrogenated chromophore radicals recombine in a dark reaction with the help of a conven-tional catalyst.
Results and Methods
For this project, carbon nitride systems of different size, from single molecules (triazine and heptazine) to peri-odic carbon-nitride sheets, were simulated in water to investigate the H-atom transfer reaction from water
Figure 1: Scheme of photocatalytic water splitting in the heptazine-water complex according to Domcke and Sobolewski [4].
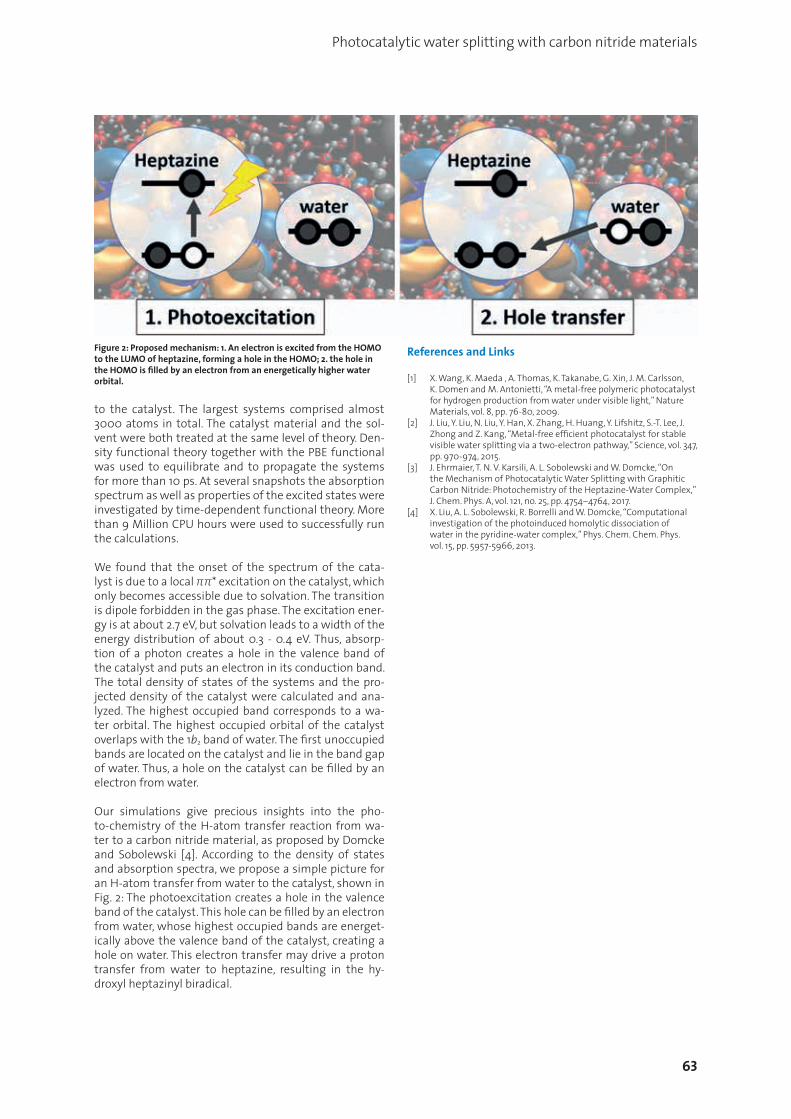
63
Photocatalytic water splitting with carbon nitride materials
to the catalyst. The largest systems comprised almost 3000 atoms in total. The catalyst material and the sol-vent were both treated at the same level of theory. Den-sity functional theory together with the PBE functional was used to equilibrate and to propagate the systems for more than 10 ps. At several snapshots the absorption spectrum as well as properties of the excited states were investigated by time-dependent functional theory. More than 9 Million CPU hours were used to successfully run the calculations.
We found that the onset of the spectrum of the cata-lyst is due to a local ππ* excitation on the catalyst, which only becomes accessible due to solvation. The transition is dipole forbidden in the gas phase. The excitation ener-gy is at about 2.7 eV, but solvation leads to a width of the energy distribution of about 0.3 - 0.4 eV. Thus, absorp-tion of a photon creates a hole in the valence band of the catalyst and puts an electron in its conduction band. The total density of states of the systems and the pro-jected density of the catalyst were calculated and ana-lyzed. The highest occupied band corresponds to a wa-ter orbital. The highest occupied orbital of the catalyst overlaps with the 1b2 band of water. The first unoccupied bands are located on the catalyst and lie in the band gap of water. Thus, a hole on the catalyst can be filled by an electron from water.
Our simulations give precious insights into the pho-to-chemistry of the H-atom transfer reaction from wa-ter to a carbon nitride material, as proposed by Domcke and Sobolewski [4]. According to the density of states and absorption spectra, we propose a simple picture for an H-atom transfer from water to the catalyst, shown in Fig. 2: The photoexcitation creates a hole in the valence band of the catalyst. This hole can be filled by an electron from water, whose highest occupied bands are energet-ically above the valence band of the catalyst, creating a hole on water. This electron transfer may drive a proton transfer from water to heptazine, resulting in the hy-droxyl heptazinyl biradical.
References and Links
[1] X. Wang, K. Maeda , A. Thomas, K. Takanabe, G. Xin, J. M. Carlsson, K. Domen and M. Antonietti, “A metal-free polymeric photocatalyst for hydrogen production from water under visible light,” Nature Materials, vol. 8, pp. 76-80, 2009.
[2] J. Liu, Y. Liu, N. Liu, Y. Han, X. Zhang, H. Huang, Y. Lifshitz, S.-T. Lee, J. Zhong and Z. Kang, “Metal-free efficient photocatalyst for stable visible water splitting via a two-electron pathway,” Science, vol. 347, pp. 970-974, 2015.
[3] J. Ehrmaier, T. N. V. Karsili, A. L. Sobolewski and W. Domcke, “On the Mechanism of Photocatalytic Water Splitting with Graphitic Carbon Nitride: Photochemistry of the Heptazine-Water Complex,” J. Chem. Phys. A, vol. 121, no. 25, pp. 4754–4764, 2017.
[4] X. Liu, A. L. Sobolewski, R. Borrelli and W. Domcke, “Computational investigation of the photoinduced homolytic dissociation of water in the pyridine-water complex,” Phys. Chem. Chem. Phys. vol. 15, pp. 5957-5966, 2013.
Figure 2: Proposed mechanism: 1. An electron is excited from the HOMO to the LUMO of heptazine, forming a hole in the HOMO; 2. the hole in the HOMO is filled by an electron from an energetically higher water orbital.

64
Chemistry and Material Sciences
2
Binary doping of HfO2 to improve the piezoelectric properties
Research InstitutionDepartment of Applied Sciences and Mechatronics, Munich University of Applied SciencesPrincipal InvestigatorAlfred KerschResearchersMax FalkowskiProject Partners—
SuperMUC Project ID: pr53xo (Summer of Simulation project)
Introduction
Recently, ferroelectric characteristics have been found in HfO2 based thin films. The modified HfO2 based thin films yield high potential for various ferroelectric, piezoe-lectric and pyroelectric applications like non-volatile log-ic and memory applications, sensing and energy harvest-ing. The material is lead-free and fully compatible with silicon process technology.
For this oxide exist five important crystal phases: (i) monoclinic, low-temperature bulk crystal phase, (ii) tetragonal, high-temperature crystal phase, (iii) cubic, high-temperature bulk crystal phase, (iv) orthorhombic, high-pressure crystal phase, (v) ferroelectric, thin film crystal phase.
The phase of interest is the ferroelectric crystal phase. Unfortunately, this phase is energetically disadvantaged with respect to the monoclinic phase in bulk oxides under normal conditions. Additional mechanisms are needed for stabilization of other crystal phases as the monoclinic. For instance, depending on doping type and its concentration the ferroelectric, orthorhombic, tetrag-onal and cubic phases can be made favorable over the monoclinic. Furthermore, the phases can be tuned in such a way by doping that for instance, the tetragonal
phase becomes energetically favored over the ferroelec-tric by a small amount. Consequently, a phase transition can be induced by applying an electric field leading to expansion or contraction of the material due to different crystal cell volumes and realize the so-called giant piezo-electric effect.
Results and Methods
Within the frame of this project we have investigated doped HfO2 supercells by density functional theory (DFT). Due to our previous investigation and experimental evi-dence of our collaborators, we have chosen Si and La as doping species for more thorough investigation, espe-cially for their combination in HfO2 [1][2][3][4].
Furthermore, oxygen vacancies as intrinsic defects can also emerge in HfO2. It is expected, that double positive charged oxygen vacancy attracts negative charged La dopant, which is a III-valent atom. Si is a IV-valent atom, same as Hf atom, hence no charge compensation via ox-ygen vacancy is needed.
In summary, three defects are considered: (i) freely dis-tributed substitutional Si and La atoms, (ii) Si and tightly paired La and oxygen vacancy, (iii) Si and tight complex of two La and one oxygen vacancy.
Figure 1: Statistics of performed calculations for three different pairs of crystal defects: SiHf – LaHf, SiHf – (LaHfVO) and SiHf – (LaHfLaHfVO). (a) shows mean values and stand-ard deviations of total energy differences for all four phases with respect to the monoclinic. (b) shows the mean values and standard deviations for the super-cell volumes.

Binary doping of HfO2 to improve the piezoelectric properties
The cubic phase is omitted in this study as it always tran-sitions into the t-phase while geometry relaxation in DFT calculations. Hence, only four crystal phases are consid-ered: monoclinic (m), ferroelectric (f), orthorhombic (o) and tetragonal (t).
As there is a lot of possible arrangements of the described defects in a supercell of a given size, all structural com-binations need to be considered. Under the assumption, that these defect arrangements can be thought as small concentration fluctuations on the small scale and each of these arrangements (fluctuations) are equally possible to occur, only the mean values for the total energy and su-percell volume for each crystal phase are considered.
Figure 1 summarizes statistics of performed calculations for Si and La defects with and without oxygen vacancies in HfO2. In Figure 1(a) the total energy differences are shown. It is convenient to choose a monoclinic structure as the reference energy. The bigger the total energy dif-ference is with respect to the reference, the less favored is the structure. For the investigation of the piezoelectric characteristics, the volumes of the doped supercells are also of importance, which are summarized in Figure 1(b).
Both, doped and pure HfO2 thin films consist of grains with a typical length scale of 10 nm and not of perfect single crystal, as it is simulated in a DFT calculation. It is an experimental evidence, that thin pure HfO2 films are crystallized in the f-phase, although the m-phase has the lowest total energy. In order to stabilize other phas-es as the monoclinic, which in most cases is the lowest total energy phase, additional mechanisms or effects are needed, like interface energy or strain. Therefore, trends should be analyzed in the simulations of this kind.
The f-phase and t-phase are suitable for the field-induced phase transition as final and initial states for a piezoe-lectric application. The piezoelectric coefficient is given by the ratio of induced strain and the applied electric field. For both, the strain and the electric field, a charac-teristic length for the f- and t-phases is needed. It can be approximated as the third root of the supercell volume. In the simplest approximation the needed bias for the in-duction of the phase transition is defined by the energy difference between the t- and the f-phases and remanent polarization of approx. 0.25 C/m2. A short back-of-the-en-velop calculation gives the following approximations for the piezoelectric coefficients: 11.5 pC/N for SiHf – (LaHfVO) doped HfO2 and 3.0 pC/N for SiHf – (LaHfLaHfVO) doped HfO2. SiHf – LaHf doping is not useful for the piezoelectric effect as the t-phase, the initial phase, lies energetically above the f-phase. These considerations are only true, if two other competitive phases, the m- and the o- phases are disad-vantaged due to thin film effects.
The study shows that the binary doping of HfO2 with Si and La accompanied with oxygen vacancies allows the piezoelectric effect in this material. The La concen-tration should be rather low for a high piezoelectric co-efficient, as La strongly promotes the tetragonal phase making the field induced transition into the ferroelectric
phase disadvantaged. The value of the piezoelectric co-efficient is very promissing. For instance, quartz exhibits classical piezoelectric effect with no phase transition in-volved and it has a piezoelectric coefficient of 2.3 pC/N. For zircon dioxide, a very similar material to HfO2, a pie-zoelectric coefficient of 10 pC/N was reported, which is similar to obtained results. Industrially used materials with perovskite crystal structure have the piezoelectric coefficient of the order of several hundred pC/N, e.g. the piezoelectric coefficient of widely spread PZT is 593 pC/N.
For the calculation of the total energies of different structures, a proprietary code FHI-AIMS was used. The conducted scaling study for a typical simulation run has shown that 224 cores on the SuperMUC Phase II system give the best balance between the computational effi-ciency and the execution time of approximately 7 hours.
Several thousands of DFT calculations were performed within this study. In order to manage this amount of work, a lot of automation for the simulations setup, startup and evaluation was performed. An own Python package was developed for these tasks, using pymatgen, ase and further standard Python modules.
Due to the relatively small size of a single job and the big number of the jobs to be run, the job farming technique was used. Instead of running single AIMS simulations, a bash script is started on the allocated nodes, which in turn starts several AIMS calculation from a predefined list simultaneously. This technique allows utilizing a large amount of the computational time in a short period.
On-going Research / Outlook
Apart from the presented study of Si – La doping inter-action in HfO2, in a similar manner the interaction of La – La and Si – Si was investigated. These investigations provide a deeper understanding of Si and La doping for HfO2. There is a publication under preparation, which will include all the results and in depth discussions.
ZrO2 is a material very similar to HfO2. It occurs in the same crystal phases, has similar chemical characteristics, is also lead-free and CMOS compatible. All these facts makes it particularly interesting for applications. ZrO2 has one crucial advantage regarding piezoelectric characteristics compared to HfO2: the energy difference between t- and f-phases is very small, making field-induced transition much easier to occur, and hence increasing the giant pi-ezoelectric coefficient. We are also looking on doping of ZrO2, in order to optimize the piezoelectric properties.
References and Links
[1] C. Richter, T. Schenk, M. H. Park, F. A. Tscharntke, E. D. Grimley, J. M. LeBeau, C. Zhou, C. M. Fancher, J. L. Jones, T. Mikolajick, and U. Schroeder. 2017. Si doped hafnium oxide – A “fragile” ferroelectric system. Adv. Electron. Mater. 3, 1700131. DOI: https://doi.org/10.1002/aelm.201700131.
[2] C. Künneth, R. Materlik, M. Falkowski, and A. Kersch. 2018. Impact of four-va-lent doping on the crystallographic phase formation for ferroelectric HfO2 from first-principles: implication for ferroelectric memory and energy-re-lated applications. ACS Appl. Nano Mater. 1, 1, 254-264. DOI: 10.1021/acs-anm.7b00124
[3] U. Schroeder, C. Richter, M. H. Park, T. Schenk, M. Pesic, M. Hoffmann, F. P. G. Fengler, D. Pohl, B. Rellinghaus, C. Zhou, C.-C. Chung, J. L. Jones, and T. Mikolajick. 2018. Lanthanum doped hafnium oxide: a robust ferroelectric material. Inorg. Chem. 57, 2752-2765. DOI: 10.1021/acs.inorgchem.7b03149
[4] R. Materlik, C. Künneth, M. Falkowski, T. Mikolajick, and A. Kersch. 2018. Al-, Y- and La-doping effects favoring intrinsic and field induced ferroelectrici-ty in HfO2: a first principles study. Accepted. J. Appl. Phys.
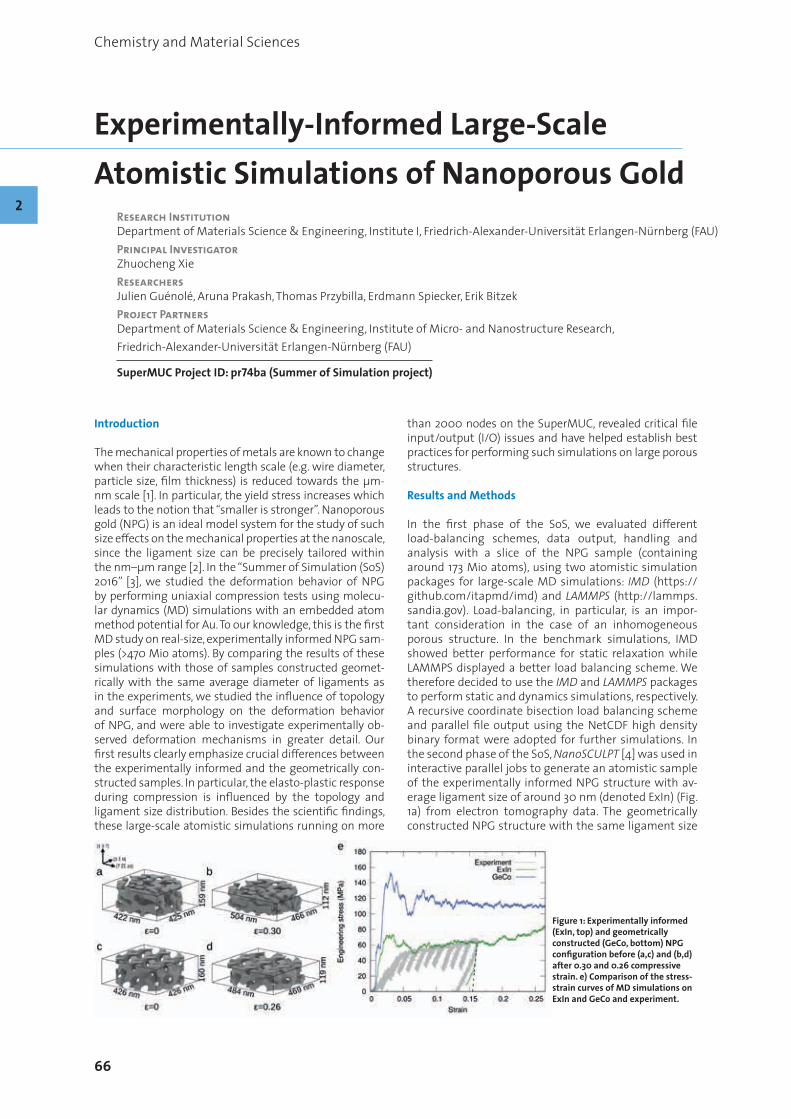
66
Chemistry and Material Sciences
2
Experimentally-Informed Large-Scale Atomistic Simulations of Nanoporous Gold
Research InstitutionDepartment of Materials Science & Engineering, Institute I, Friedrich-Alexander-Universität Erlangen-Nürnberg (FAU)Principal InvestigatorZhuocheng XieResearchersJulien Guénolé, Aruna Prakash, Thomas Przybilla, Erdmann Spiecker, Erik BitzekProject PartnersDepartment of Materials Science & Engineering, Institute of Micro- and Nanostructure Research, Friedrich-Alexander-Universität Erlangen-Nürnberg (FAU)
SuperMUC Project ID: pr74ba (Summer of Simulation project)
Introduction
The mechanical properties of metals are known to change when their characteristic length scale (e.g. wire diameter, particle size, film thickness) is reduced towards the μm-nm scale [1]. In particular, the yield stress increases which leads to the notion that “smaller is stronger”. Nanoporous gold (NPG) is an ideal model system for the study of such size effects on the mechanical properties at the nanoscale, since the ligament size can be precisely tailored within the nm–μm range [2]. In the “Summer of Simulation (SoS) 2016” [3], we studied the deformation behavior of NPG by performing uniaxial compression tests using molecu-lar dynamics (MD) simulations with an embedded atom method potential for Au. To our knowledge, this is the first MD study on real-size, experimentally informed NPG sam-ples (>470 Mio atoms). By comparing the results of these simulations with those of samples constructed geomet-rically with the same average diameter of ligaments as in the experiments, we studied the influence of topology and surface morphology on the deformation behavior of NPG, and were able to investigate experimentally ob-served deformation mechanisms in greater detail. Our first results clearly emphasize crucial differences between the experimentally informed and the geometrically con-structed samples. In particular, the elasto-plastic response during compression is influenced by the topology and ligament size distribution. Besides the scientific findings, these large-scale atomistic simulations running on more
than 2000 nodes on the SuperMUC, revealed critical file input/output (I/O) issues and have helped establish best practices for performing such simulations on large porous structures.
Results and Methods
In the first phase of the SoS, we evaluated different load-balancing schemes, data output, handling and analysis with a slice of the NPG sample (containing around 173 Mio atoms), using two atomistic simulation packages for large-scale MD simulations: IMD (https://github.com/itapmd/imd) and LAMMPS (http://lammps.sandia.gov). Load-balancing, in particular, is an impor-tant consideration in the case of an inhomogeneous porous structure. In the benchmark simulations, IMD showed better performance for static relaxation while LAMMPS displayed a better load balancing scheme. We therefore decided to use the IMD and LAMMPS packages to perform static and dynamics simulations, respectively. A recursive coordinate bisection load balancing scheme and parallel file output using the NetCDF high density binary format were adopted for further simulations. In the second phase of the SoS, NanoSCULPT [4] was used in interactive parallel jobs to generate an atomistic sample of the experimentally informed NPG structure with av-erage ligament size of around 30 nm (denoted ExIn) (Fig. 1a) from electron tomography data. The geometrically constructed NPG structure with the same ligament size
Figure 1: Experimentally informed (ExIn, top) and geometrically constructed (GeCo, bottom) NPG configuration before (a,c) and (b,d) after 0.30 and 0.26 compressive strain. e) Comparison of the stress-strain curves of MD simulations on ExIn and GeCo and experiment.

67
Experimentally-Informed Large-Scale Atomistic Simulations of Nanoporous Gold
and solid fraction (denoted GeCo) (Fig. 1c) was construct-ed using constant-mean-curvature surface analytical formula. The to-scale structures contain roughly 470 Mio atoms. After static relaxation (using the FIRE algorithm) and thermalization (in the NVE and NVT ensembles), the compression tests (in the NVT ensemble) were per-formed on the Thin Nodes of SuperMUC using 512-2048 nodes. During the simulations, on-the-fly structural anal-yses and calculation of auxiliary properties (coordination number, common neighbor analysis, atomic stress ten-sor, etc.) were carried out to expedite subsequent post processing. Further visualization and analyses of the simulation snapshots were performed using the Remote Visualization Nodes of SuperMUC.
Based on the stress-strain curves in Fig. 1e, the compres-sion tests of NPG can be divided into three regimes: a linear elastic regime, followed by a collapse plateau due to plastic yielding and finally a densification regime. This agrees well with typical experimental compression tests of macroscopic metallic foams [2]. The yield strength of the ExIn sample obtained from our simulation is around 73 MPa. The results of the ExIn sample agree well with the in-situ experiment on the specimen from which the simulated structure was obtained. Fig. 2 shows the occurrence of stacking fault tetrahedra (SFTs) in the experiments that are also seen in the MD simulations. Analyzing the simulations allowed to reveal the disloca-tion processes leading to SFTs. The artificial structure on the other hand shows a higher yield strength than the experiment and the ExIn sample, around 153 MPa, and no significant densification is observed at the attained strain. The difference of mechanical behavior between these two samples can be attributed to their different topology (e.g. nodal connectivity) and morphology (e.g. ligament size distribution).
Important technical challenges were encountered while performing the simulations on the large structures with 470 Mio atoms. The initial strategy based on the NetCDF format had to be re-evaluated, since the output of these structures caused LAMMPS to crash. In order to not fur-ther delay the simulations, we used the standard LAMMPS binary output scheme which expectedly shows poorer I/O
performance than NetCDF but still better I/O performance than ASCII. Until now, we have consumed about 94% (9.4 Mio CPUh) of the allocated CPUh. The simulations gener-ated 1500 large snapshots (containing all atomic positions and auxiliary properties) and 7500 small snapshots (con-taining only atoms belonging to crystal defects), with an individual file size of around 75 GB and 2.5 GB, respectively. In total, we have 165 TB of raw data (on SCRATCH) and 35 TB of post-processed data (on WORK).
By comparison to the benchmarks, an increase in com-putation time per step per atom by a factor of two has been observed. Together with the experts of the LRZ, we analyzed the I/O pattern of LAMMPS with a strong scaling test. The first observations indicate that the combination of auxiliary property calculation on such large structures together with file I/O on large numbers of nodes (>512 nodes) are at the root of this drop of performance. The re-quested size of individual I/O operations decreases as the number of MPI processes increases. When this requested size is smaller than the block size of the GPFS filesystem (8 MiB on SCRATCH), which is the case when we output our smallest snapshots, the time for I/O operations increases dramatically. To avoid this issue, we decided to limit the number of nodes used in our simulations (to <512 nodes).
On-going Research / Outlook
In the SoS project, we performed the first ultra-large-scale atomistic simulations using a real-size experimen-tally-informed nanoporous sample. All simulations and on-the-fly analyses have been successfully completed. For the full scientific study of the deformation behavior of NPG, further post-processing and visualization of the raw data is required. For that, we will use multiple serial jobs and the Remote Visualization Nodes. Analysis will in-clude, but is not limited to, dislocation analysis, resolved shear stress calculation, quantitative structural analysis. Additional finite element (FE) simulations are being per-formed in our group to quantify the differences in elastic behavior between continuum scale models, atomistic models and experiments, and to understand local stress states in NPG. The overarching aim of the entire scientific project is the development of physics-based constitutive models for size-dependent mechanical properties of na-nostructures.
Some technical challenges remain to be solved to opti-mize the performance of the simulations, e.g. the opti-mization of I/O performance by aggregation techniques on the data output with NetCDF format. Our experience from this project will provide guidelines for scientists who intend to perform and analyze ultra-large-scale atomistic simulations. To our knowledge, our system is about twice as large as the current largest routine atomistic studies [5].
References and Links
[1] J. Greer, et al. Prog. Mater. Sci. 56 (2011):654-724.[2] C. Volkert, et al. Appl. Phys. Lett. 89 (2006): 061920.[3] www.lrz.de/services/compute/labs/biolab/[4] A. Prakash, et al. MethodsX 3 (2016): 219-230.[5] L. Zepeda-Ruiz, et al. Nature 550 (2017): 492-495.
Figure 2: (a) Bright field transmission electron microscopy (TEM) image of deformed ligaments in NPG. (b) High-resolution TEM image of stack-ing fault tetrahedra (SFTs) (c) Formation of SFTs in MD simulations.
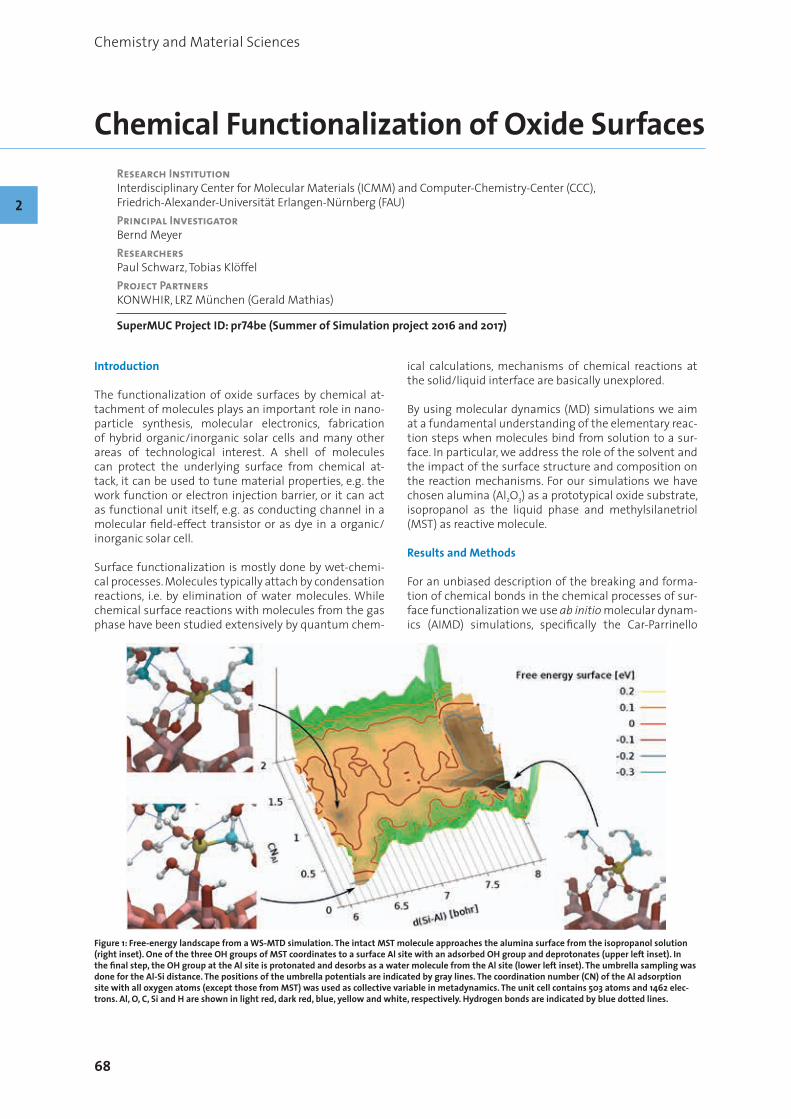
68
Chemistry and Material Sciences
Chemical Functionalization of Oxide SurfacesResearch InstitutionInterdisciplinary Center for Molecular Materials (ICMM) and Computer-Chemistry-Center (CCC), Friedrich-Alexander-Universität Erlangen-Nürnberg (FAU)Principal InvestigatorBernd MeyerResearchersPaul Schwarz, Tobias KlöffelProject PartnersKONWHIR, LRZ München (Gerald Mathias)
SuperMUC Project ID: pr74be (Summer of Simulation project 2016 and 2017)
Introduction
The functionalization of oxide surfaces by chemical at-tachment of molecules plays an important role in nano- particle synthesis, molecular electronics, fabrication of hybrid organic/inorganic solar cells and many other areas of technological interest. A shell of molecules can protect the underlying surface from chemical at-tack, it can be used to tune material properties, e.g. the work function or electron injection barrier, or it can act as functional unit itself, e.g. as conducting channel in a molecular field-effect transistor or as dye in a organic/inorganic solar cell.
Surface functionalization is mostly done by wet-chemi-cal processes. Molecules typically attach by condensation reactions, i.e. by elimination of water molecules. While chemical surface reactions with molecules from the gas phase have been studied extensively by quantum chem-
ical calculations, mechanisms of chemical reactions at the solid/liquid interface are basically unexplored.
By using molecular dynamics (MD) simulations we aim at a fundamental understanding of the elementary reac-tion steps when molecules bind from solution to a sur-face. In particular, we address the role of the solvent and the impact of the surface structure and composition on the reaction mechanisms. For our simulations we have chosen alumina (Al2O3) as a prototypical oxide substrate, isopropanol as the liquid phase and methylsilanetriol (MST) as reactive molecule.
Results and Methods
For an unbiased description of the breaking and forma-tion of chemical bonds in the chemical processes of sur-face functionalization we use ab initio molecular dynam-ics (AIMD) simulations, specifically the Car-Parrinello
Figure 1: Free-energy landscape from a WS-MTD simulation. The intact MST molecule approaches the alumina surface from the isopropanol solution (right inset). One of the three OH groups of MST coordinates to a surface Al site with an adsorbed OH group and deprotonates (upper left inset). In the final step, the OH group at the Al site is protonated and desorbs as a water molecule from the Al site (lower left inset). The umbrella sampling was done for the Al-Si distance. The positions of the umbrella potentials are indicated by gray lines. The coordination number (CN) of the Al adsorption site with all oxygen atoms (except those from MST) was used as collective variable in metadynamics. The unit cell contains 503 atoms and 1462 elec-trons. Al, O, C, Si and H are shown in light red, dark red, blue, yellow and white, respectively. Hydrogen bonds are indicated by blue dotted lines.
2

69
Chemical Functionalization of Oxide Surfaces
molecular dynamics (CPMD) method and code [2]. CPMD is based on density functional theory (DFT) as quan-tum-chemical electronic structure method. To overcome reaction barriers and to be able to observe chemical re-actions (`rare events’) in the limited timeframe of AIMD simulations we apply various accelerated sampling tech-niques, in particular thermodynamic integration, um-brella sampling and metadynamics (MTD), which also provide information on the free energy landscape.
The simulations show that the approach of MST mole-cules from the liquid to the alumina surfaces is an acti-vated process with a small energy barrier. One of the MST OH groups reorients from the liquid towards the surface and coordinates to a surface Al ion. A very characteris-tic transition state structure of a six-membered ring is formed, which consists of the Si atom and one OH of the MST molecule and the surface Al with an adsorbed OH group. The transition structure quickly leads to a spon-taneous condensation reaction in which the OH at the Al site is protonated and desorbs as water molecule into the liquid.
Residual water molecules on the Al2O3 surface increase the energy barrier for surface binding. Also the condensa-tion reaction becomes activated. An example of the overall free energy landscape for this process is shown in Figure 1. Here we have used the recently proposed well-sliced metadynamics (WS-MTD) technique [3], a combination of umbrella sampling and metadynamics, which allows us to study the full process in a single simulation setup.
On the multi-core architecture of SuperMUC with 28 cores per node the MPI-only parallelization of CPMD came to its limits. First, the reduction in bandwidth and increase in overhead of the all-to-all and global summa-tion calls of 28 MPI processes communicating simultane-ously from each node became a severe bottleneck. Sec-ond, for our isopropanol/Al2O3 system scalability already ends at 7 nodes (with 2 ps simulation time per day), since then the fast Fourier grid is fully distributed over the MPI processes (see red dashed line in Figure 2). 50 ps of simu-lation time, which is a typical length of a production run, would therefore take at minimum about a month.
In a KONWHIR project in collaboration with Gerald Mathias from LRZ we optimized the parallelization strat-egies within CPMD. This included the following steps: (i) the existing OpenMP parallelization is extended to all rel-evant code paths, (ii) single node performance is further increased by merging various small DGEMM calls into larger ones which are called less frequently, (iii) the com-munication overhead is reduced by introducing overlap-ping computation and communication and by modifying the all-to-all message passing in such a way that larger fragments of data are communicated less frequently.
The result is shown in Figure 2 (solid red line). We typical-ly use 4 MPI processes per node and 7 OpenMP threads per MPI process. Our example of the isopropanol/Al2O3 in-terface shows very good scaling up to 25 nodes with the new improved CPMD version. On 12 nodes we get more than 10 ps simulation time per day, i.e. a 50 ps production run can be done now within 5 days instead of one month. On the single node level, when staying in the range of 2 to 6 nodes where CPMD shows almost ideal scaling, we achieve more than 60% of the node peak performance.
On-going Research / Outlook
With the improved scalability and single node perfor-mance of CPMD we are now able to address more com-plex chemical processes at oxide surfaces. In a follow-up project we have started to study the catalytic deactivation of chemical warfare agents at ZnO surfaces in aqueous environments [4]. A typical setup is shown in Figure 3. By using 36 SuperMUC nodes we are able to perform 50 ps simulations for this system within 10 days (about 250.000 CPUh, see blue solid line in Figure 2). In the largest simu-lation so far we carried out an umbrella sampling run to calculate the adsorption free energy of sulfur mustard molecules on ZnO. For each umbrella window we used 18 nodes. The 28 umbrella windows were run in parallel to enhance sampling by replica exchange, thus making use of a full SuperMUC island with 512 nodes.
References and Links
[1] https://chemistry.nat.fau.eu/meyer-group[2] http://www.cpmd.org[3] S. Awasthi, V. Kapil, N.N. Nair, J. Comp. Chem. 99, 12562 (2016)[4] G.K. Prasad et al., J. Hazard. Mater. 149, 460 (2007)
Figure 2: Improved performance of CPMD on SuperMUC. The small sys-tem is the isopropanol/Al2O3 simulation from Figure 1, the large system is the water/ZnO interface from Figure 3.
Figure 3: Sulfur mustard molecule at a water/ZnO interface. The unit cell contains 735 atoms and 3332 electrons. Zn, O, C, S, Cl and H are shown in gray, red, black, yellow, green and cyan, respectively.

70
Chemistry and Material Sciences
2
A Neural Network Potential for the Cu/ZnO system
Research InstitutionTheoretical Chemistry, Institute for Physical Chemistry, Georg-August University Göttingen, GermanyPrincipal InvestigatorJörg BehlerResearchersMartín Leandro PaleicoProject Partners—
SuperMUC Project ID: pr74bu (Summer of Simulation project)
Introduction
Many chemicals are produced in large-scale industrial processes using heterogeneous catalysis. An important example is methanol, which is generated by a catalyst composed of copper clusters supported on zinc oxide nanoparticles.
In spite of intensive research and a wealth of exper-imental data, the atomistic structure of the catalyst involving thousands of atoms is still unknown, and the-oretical studies are urgently needed to unravel the de-tailed topology of the catalyst. Unfortunately, computer simulations of realistic structural models of the catalyst are severely hampered by the complexity of the system if conventional quantum chemical methods like densi-ty-functional theory (DFT) are used, while more efficient empirical potentials are not sufficiently reliable. In this project a modern approach to constructing interatomic potentials based on artificial neural networks (NN) will be used [1], which has been developed in our group.
These NN potentials have an accuracy close to first princi-ples calculations, while being many orders of magnitude faster to evaluate, enabling simulations of complex and realistic structural models. Here, a NN potential will be developed and employed to characterize the structural properties of the catalyst in detail by large-scale molec-ular dynamics and Monte Carlo simulations to provide insights into the nature of the active sites.
NNP’s are trained to reproduce first-principle energies with an accuracy in the order of a few meV/atom, but with efficiency comparable to classical force fields. The training requires a dataset of tens of thousands of single point ab-initio calculations. This is a considerable invest-ment of CPU time, but, once properly trained, the NN can be used to simulate systems in a fraction of the time it would take to perform a quantum mechanical calcula-tion, which in some cases is impossible.
The CPU-budget at the Leibniz Rechenzentrum was used to generate this large dataset. The computation-
al power offered by the LRZ allowed us to carry out the calculations in a few weeks, which would otherwise take a significant time when using our local clusters. It also permitted the incorporation of single point cal-culations with hundreds of atoms into the dataset, which ultimately helps build a better NNP. In the end, the calculations performed at the LRZ will lead to a better final NNP, constructed in a drastically shorter time frame.Scientific work accomplished and results obtained
In this section, some of the results obtained with the dataset produced at the LRZ are presented. The NNP generated from the dataset is capable of accurate-ly simulating different systems. The NNP needs to be validated against DFT simulations to prove its accuracy, and for this purpose structural properties like the bulk modulus, energy versus volume curves, and surface en-ergies were calculated and are shown in the following sections. In addition, some initial Monte Carlo simula-tions are presented.
Zinc Oxide Bulk StructuresBeing able to reproduce the energy versus volume curve of a system is an important part of obtaining correct simulations. One of the first validation steps for a new NNP is to match the energy curve obtained from DFT. With this analysis, the equilibrium lattice constants
Figure 1: Energies obtained from DFT and the NNP, for different volumes of the common zinc oxide crystal structures.

71
A Neural Network Potential for the Cu/ZnO system
and stable crystal structures can be found, and derived parameters like the bulk modulus calculated. Figure 1 and table 1 present the results for different zinc oxide bulk crystals. The agreement between DFT and the NNP is seen to be excellent. As expected for zinc oxide, the more stable structures are the hexagonal (wurtzite) and cubic (zincblende) close packed structures (with the former one being the most stable as seen in exper-iments).
The NNP is now capable of performing the same analysis for different copper crystal structures.
Wurtzite zinc oxide NN DFT Experi- mental [2]
First Lattice Constant a (Å) 3.27 3.27 3.25
Second Lattice Constant c/a 1.64 1.64 1.60
Bulk Modulus (GPa) 125 127 143
Cohesive Energy (eV/unit formula) 8.72 8.75 7.52
Table 1: Structural parameters obtained for the wurtzite crystal of zinc oxide, from DFT and NNP.
Copper SurfacesOne important parameter for any surface is its surface energy, or the energy required to generate the surface by cleaving a bulk structure. A plot of slab energy versus number of atoms (fig. 2) yields the surface energy from the intercept of a linear regression. The values obtained for the surface energy are presented in table 2. As expect-ed for copper, the (111) surface is the most stable, with the other surface planes having higher, similar surface ener-gies between them. Once again, the agreement with the ab initio data is good.
The NNP is also able to perform a similar analysis for some of the low index zinc oxide surfaces.
Surface Surface Energy NNP (meV/Å2)
Surface Energy DFT (meV/Å2)
(100) 166.0 166.0
(110) 161.8 164.8
(111) 120.9 121.2
Table 2: Surface energies for fcc copper surfaces, obtained from the NNP and DFT
Grand Canonical Monte Carlo Simulations: Copper Nan-oparticlesGrand Canonical Monte Carlo enables the simulation of condensed phases in equilibrium with a gas reservoir. This can be used to study processes that ocurr in hetero-geneous phases, such as evaporation, condensation, and deposition. The eventual goal is to study the deposition and growth of copper nanoparticles on zinc oxide surfac-es. As an intermediate step, the growth of a copper nan-oparticle in vacuum was studied, as shown in figure 3.
In figure 3, the copper nanoparticle grows as copper at-oms condense into the system from the grand canonical reservoir (a), at some point in the simulation a second in-dependent copper cluster condenses and starts to grow (b-d), and finally both clusters come into contact and merge in a process reminiscent of Ostwald ripening (e-g).
Grand Canonical simulations can also be performed, with the current NNP, of copper adsorption on different copper surfaces.
Realization of the project, Methods, Simulations, and Codes
The program chosen to generate the dataset is the Vien-na Ab-initio Simulation Package (VASP), using DFT with the PBE functional and a plane-wave basis set.
The initial structures for the dataset are generated in a procedural fashion. Starting with a base system (fcc cop-per bulk, slab of hcp zinc oxide exposing a certain surface,
etc), the system size is ex-panded and contracted, the angles of the bounding box changed slightly, and the atoms displaced a random small distance. Supercells are also generated from smaller cells, and atoms are added or vacancies generated. This procedure tries to cover the configuration space in an unbiased way.
Two different neural net-works are trained on this in-itial dataset. Where the con-figuration space has been appropriately sampled, both neural networks will calcu-late the same energy and forces for the system, bar-
Figure 2: Energies obtained from DFT and the NNP, for different numbers of atoms for the low index fcc copper surfaces.

72
Chemistry and Material Sciences
ring small differences. If the internal architecture of the neural networks is different, they will give very different energies for structures and forces for atoms outside of the properly sampled configuration space. This property is used to find new structures that need to be included in the dataset from simulations performed using a NNP to run molecular dynamics (or Monte Carlo) simulations, and identifying problem structures by comparing the re-sults of two neural networks.
The number and types of structures generated are pre-sented in table 3. In total, 80% of the assigned 8 million CPU hours were utilized, or a total of 6.5 million CPU hours. The structures include a variety of chemical environments (clusters, slabs and bulk structures) and compositions (Cu, ZnO, CuZn alloys, ternary CuZnO systems). The structures contain between 50 and 150 atoms, and consume be-tween 20 and 40 minutes of real time utilizing 20 nodes of the thin node islands (16 processors).
Structure NumberCu bulk 4500Cu slabs (fcc) 4500Cu clusters 2000ZnO bulk 6000ZnO slabs (wurtzite) 4000CuZn alloy bulk 4000Cu deposited on ZnO 6000
Total 31000
Table 3: Overview of the structures calculated at the LRZ.
The calculations were performed utilizing a job farm-ing approach. The generation of the dataset requires thousands of independent and short single-point VASP calculations. To make efficient use of the scheduling queues and computational resources, the job farming was implemented as follows: The initial script sent to the LoadLeveler scheduler asks for a certain number of nodes to be allocated. These nodes are then divided using hostlists, and concurrent, parallel jobs (VASP cal-culations) are started. The farming script monitors the progress of the jobs, and starts new jobs once the previ-
ous ones have completed. This load balancing is needed since jobs can have differing running times.
The farming approach allows for a flexible use of re-sources, since the number of concurrent and total jobs can be easily changed. The number of nodes can be al-tered to run more jobs at the same time and thus get through a structure set faster. It is also efficient, because it load balances on its own, which is important when the dataset includes structures that reach convergence at different times. This way no CPU cycles are wasted by jobs that have already finished while others are still running. Given results obtained in scaling tests, 100 jobs per farming script were run, with a target of 12 hours for total run time.
Optionally: On-going Research / Outlook
The computational time provided by the LRZ helped cre-ate the initial dataset for a working neural network po-tential. This potential can then be used to perform initial simulations, and generate new structures to refine the potential further. As shown in the previous sections, the initial potential is already capable of reproducing struc-tural properties as calculated by the reference ab-initio method. Additionally, the potential is able to perform simulations that would be hard to obtain from an ab-initio method. An example of this is the simulation of copper nanoparticles using grand canonical Monte Carlo. Such simulations would be hard to obtain from an ab-initio method due to computational time constraints, since big systems with many atoms or long simulation times are required.
The main obstacles for the project were associated to the handling of thousands of individual simulations and their associated results. An effective job farming ap-proach was implemented through scripting to manage the setup of the required ab-initio calculations. In addi-tion, careful management was implemented of all the obtained output files, in regards to post-processing and storage.
The initial potential is to be refined by adding more calculations involving copper clusters deposited on dif-ferent zinc oxide surfaces, to study the behavior of this system. Afterwards, the study will center on freestanding interacting nanoparticles. In this way we hope to achieve a model for the industrial catalyst, that would not be accessible to traditional ab-initio or classical force field based simulations.
Additional references
[1] Jörg Behler. 2017. First Principles Neural Network Potentials for Reactive Simulations of Large Molecular and Condensed Systems. Angew. Chem. Int. Ed. 56, 42 (Aug. 2017), 12828-12840. DOI: https://doi.org/10.1002/anie.201703114
[2] David R. Lide. 2009. Handbook of Chemistry and Physics (90th. ed.). CRC Press.
Figure 3: Snapshots of the growing copper clusters at different times.
2

73
On the liquid phase mechanism of methanol oxidation at Au/TiO2 nanocatalysts
On the liquid phase mechanism of methanol oxidation at Au/TiO2 nanocatalysts
Research InstitutionLehrstuhl für Theoretische Chemie, Ruhr-Universität BochumPrincipal InvestigatorDominik MarxResearchersDaniel Muñoz-Santiburcio, Niklas SiemerProject Partners—
SuperMUC Project ID: pr74va (Summer of Simulation project)
Introduction
The backbone of industrial chemistry is heterogeneous catalysis. Even small improvements of the used catalyst, often based on mechanistical insights, may enhance the efficiency in terms of energy consumption and/or se-lectivity. Such insights can be provided by the ‘Solvation Science approach’ to theoretical heterogeneous catalysis in the liquid phase, while experiments often lack the re-quired atomistic resolution.
Highly dispersed gold/titania catalysts are widely used for key reactions, notably including the selective oxida-tion of alcohols in the liquid phase. The mechanistic de-tails of this reaction are mostly unknown, while the cor-responding gas-phase process is often investigated. The pivotal role of water in stabilizing charge transfer and its actual chemical role in the reaction mechanism remains poorly known.
Here, we take advantage of enhanced sampling ab ini-tio molecular dynamics (AIMD) [1] simulations using a well-established Au/TiO2 nanocatalyst model [2, 3, 4] (Figure 1) in order to elucidate the mechanistic details of thermally activated liquid-phase methanol oxidation at elevated T and p in accordance with experimental con-ditions.
Results and Methods
We performed large-scale multiple walker ab initio metadynamics simulations with the Au nanoparticle (AuNP) being in contact with the dioxygen and metha-nol reactants in the gas phase as well as in neutral water [5]. In the gas phase, the methanol molecule is adsorbed via weak interactions of its OH group with the O2 (see structure aG in Figure 2). In the course of the reaction, one of the aliphatic hydrogens moves close enough to the AuNP, leading to C-H activation (see bG in Figure 2). The final oxidation of methanol is observed exclusively if the O2 molecule dissociates. The dissociation is caused via charge transfer from the AuNP resulting in a partially positive AuNP and a partially negative O2 species. After
dissociation, the protonic hydroxyl’ H and the hydridic al-iphatic H are respectively transferred to the O2 and the AuNP in a concerted fashion.
In liquid water charged species can be stabilized thanks to its high dielectric constant, which allows a stepwise mechanism for methanol oxidation. The reaction starts with the O2 dissociation due to charge transfer from the AuNP, which carries more charge than in the gas phase due to the charge donated from its solvation shell. After
Figure 1: Close-up of the liquid phase Au/TiO2 nanocatalyst system used to simulate methanol oxidation by dioxygen that is activated at the AuNP/titania perimeter site. The TiO2 slab is shown in dark red (O) and cyan (Ti), the AuNP in gold, the adsorbed O2 in red, the CH3OH in black (C), red (O) and white (H), and the H2O molecules in transparent red (O) and white (H).

74
Chemistry and Material Sciences
the dissociation, one of the nascent O atoms is able to accept the hydroxyl proton, which was observed to be transferred via a Grotthuss-like diffusion process involv-ing a water molecule. The resulting methoxy intermedi-ate is a stable intermediate in water. Once the aliphatic H atom of the methoxy is close enough to the AuNP, it is transferred as a hydride yielding the product formal-dehyde.
In summary, the presence of water crucially changes the mechanism of methanol oxidation at Au/TiO2. Our ‘Sol-vation Science approach’ is able to determine the mech-anistic changes of the reaction due to the presence of water, not only establishing the qualitatively different mechanism when comparing the liquid phase with the gas phase reference, but also rationalizing the changes in terms of the charge transfers occurring between the involved species.
Performance and scaling
The AIMD simulations were carried out using CPMD [6] which is a DFT-based molecular dynamics code. The electronic structure of the nanocatalyst model was de-scribed by a plane wave basis set in combination with ultrasoft pseudopotentials. The ionic and electronic de-grees of freedom of the system are time-propagated with an extended Lagrangian scheme, which is the most computationally demanding part of the calculation.
Such task is efficiently performed using processor groups (Pgr). Within a Pgr the parallelization is realized via MPI and either MPI or OpenMP/Vector for inter-node and intra-node communication, respectively. At this level of
parallelization the allocation of 160 cores allowed for the highest speedup for our Au/TiO2 nanocatalyst model. Herein the 3D-FFT of the electronic wavefunctions is split up most efficiently into one 2D-FFT per processor core. Further levels of parallelization within the CPMD code, e.g. via Kohn-Sham orbitals, resulted in lower speed-up. Thus, production runs were carried out with 2D-FFT par-allelization giving the best use of the granted CPU time and the best time to solution.
On SuperMUC CPMD propagation of a single gas phase Au/TiO2 nanocatalyst model required 28.1 and 19.1 core•min per MD step on Phase 1 thin nodes and on Phase 2 nodes, respectively, fully employing 10 nodes on Phase 1 or 6 nodes on Phase 2. For the liquid phase 62.5 and 47.2 core•min per MD step on Phase 1 and on Phase 2 were required, respectively. There exists another level of parallelization which is the multiple walker extension to the metadynamics method. Each “walker” is a different replica of the system, and the different walkers inter-act in building up the biasing potential with a negligi-ble communication effort. Hence, this algorithm shows a linear scaling with respect to the number of walkers, being possible to use tenths of walkers. On SuperMUC partitions the best performance between queue waiting vs. production was achieved using up to ten walkers, i.e. 1960 cores. On SuperMUC this project has used approx-imately ten million core hours. Besides the bookkeeping of the trajectory data at every MD step, a larger disk I/O demand during such jobs was the writing of complete restart files (each of 1.9 GiB in size) which was done every four hours. The maximum storage needed in the SCRATCH, WORK and PROJECT filesystems was 1 TiB, 3 TiB and 100 GiB, respectively.
Figure 2: Top panels: Schematic reaction mechanisms for the CH3OH oxidation on O2/Au/TiO2 in the gas phase and in water as extracted from the ab initio simulations (the AuNP is depicted in gold; only the reactive water molecules involved in the liquid-phase mechanism are shown). Bottom panel: Real-space snapshots of the aqueous system, from left to right: structures aW, bW, cW and dW.
2

75
On-going Research / Outlook
The simulations with our Au/TiO2 model on Super-MUC Phase 2 are speeded-up by about 40% compared to Phase 1. This allows for larger system sizes and ab initio molecular dynamics simulations with computa-tionally more demanding electronic structure methods. Currently we are using an extended Au/TiO2 model to investigate the origin of the enhanced O2 activation at this catalyst, with which we will be able to quantify such activation enhancement in liquid vs. gas phase in terms of free energy barriers, also comparing different adsorp-tion sites. Such insights will be of great interest for the heterogeneous catalysis field. These simulations require at least twice the computational resources of the pres-ent study. We estimate an increase in computational cost by about 100 times for upcoming projects which would be required and hopefully accessible by “SuperMUC Next Generation”.
References and Links
[1] D. Marx and J. Hutter, “Ab Initio Molecular Dynamics: Basic Theory and Advanced Methods”, Cambridge University Press (2009)
[2] M. Farnesi Camellone, D. Marx. J. Phys. Chem. Lett. 4, 514–518 (2013).[3] M. Farnesi Camellone, P. M. Kowalski, D. Marx. Phys. Rev. B 84,
035413 (2011).[4] M. Farnesi Camellone, D. Marx. J. Phys. Chem. C 118, 20989–21000
(2014).[5] D. Muñoz-Santiburcio, M. Farnesi Camellone, D. Marx. Angew. Chem.
Int. Ed. 57, 3327-3331 (2018).[6] CPMD, http://www.cpmd.org/
http://www.theochem.rub.de/research/marxhttp://www.solvation.de
On the liquid phase mechanism of methanol oxidation at Au/TiO2 nanocatalysts
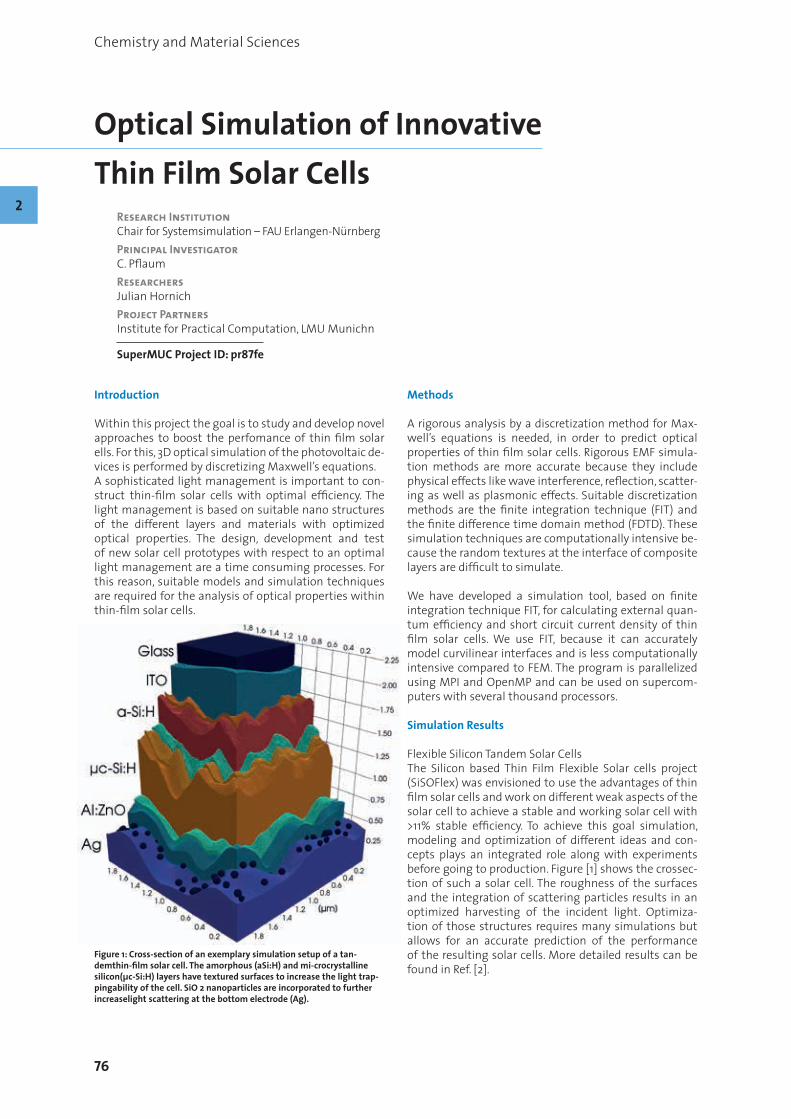
76
Chemistry and Material Sciences
2
Optical Simulation of Innovative Thin Film Solar Cells
Research InstitutionChair for Systemsimulation – FAU Erlangen-NürnbergPrincipal InvestigatorC. PflaumResearchersJulian HornichProject PartnersInstitute for Practical Computation, LMU Munichn
SuperMUC Project ID: pr87fe
Introduction
Within this project the goal is to study and develop novel approaches to boost the perfomance of thin film solar ells. For this, 3D optical simulation of the photovoltaic de-vices is performed by discretizing Maxwell’s equations.A sophisticated light management is important to con-struct thin-film solar cells with optimal efficiency. The light management is based on suitable nano structures of the different layers and materials with optimized optical properties. The design, development and test of new solar cell prototypes with respect to an optimal light management are a time consuming processes. For this reason, suitable models and simulation techniques are required for the analysis of optical properties within thin-film solar cells.
Methods
A rigorous analysis by a discretization method for Max-well’s equations is needed, in order to predict optical properties of thin film solar cells. Rigorous EMF simula-tion methods are more accurate because they include physical effects like wave interference, reflection, scatter-ing as well as plasmonic effects. Suitable discretization methods are the finite integration technique (FIT) and the finite difference time domain method (FDTD). These simulation techniques are computationally intensive be-cause the random textures at the interface of composite layers are difficult to simulate.
We have developed a simulation tool, based on finite integration technique FIT, for calculating external quan-tum efficiency and short circuit current density of thin film solar cells. We use FIT, because it can accurately model curvilinear interfaces and is less computationally intensive compared to FEM. The program is parallelized using MPI and OpenMP and can be used on supercom-puters with several thousand processors.
Simulation Results
Flexible Silicon Tandem Solar CellsThe Silicon based Thin Film Flexible Solar cells project (SiSOFlex) was envisioned to use the advantages of thin film solar cells and work on different weak aspects of the solar cell to achieve a stable and working solar cell with >11% stable efficiency. To achieve this goal simulation, modeling and optimization of different ideas and con-cepts plays an integrated role along with experiments before going to production. Figure [1] shows the crossec-tion of such a solar cell. The roughness of the surfaces and the integration of scattering particles results in an optimized harvesting of the incident light. Optimiza-tion of those structures requires many simulations but allows for an accurate prediction of the performance of the resulting solar cells. More detailed results can be found in Ref. [2].
Figure 1: Cross-section of an exemplary simulation setup of a tan-demthin-film solar cell. The amorphous (aSi:H) and mi-crocrystalline silicon(μc-Si:H) layers have textured surfaces to increase the light trap-pingability of the cell. SiO 2 nanoparticles are incorporated to further increaselight scattering at the bottom electrode (Ag).
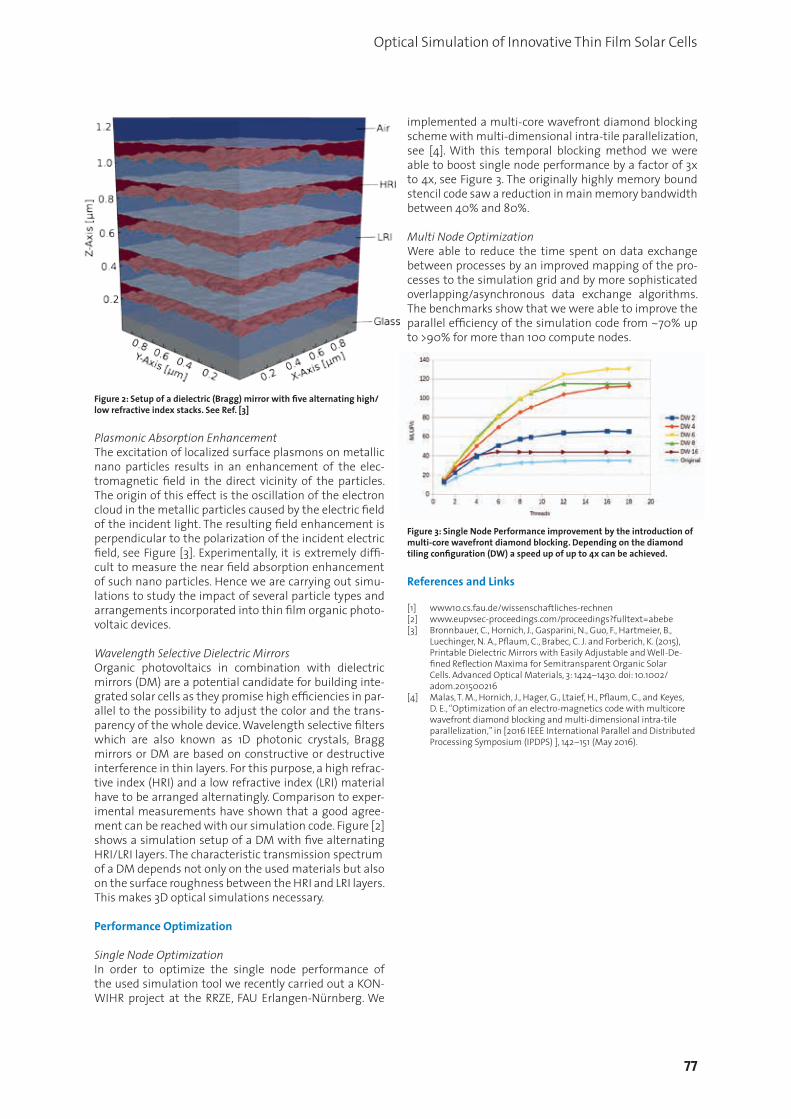
77
Optical Simulation of Innovative Thin Film Solar Cells
Plasmonic Absorption EnhancementThe excitation of localized surface plasmons on metallic nano particles results in an enhancement of the elec-tromagnetic field in the direct vicinity of the particles. The origin of this effect is the oscillation of the electron cloud in the metallic particles caused by the electric field of the incident light. The resulting field enhancement is perpendicular to the polarization of the incident electric field, see Figure [3]. Experimentally, it is extremely diffi-cult to measure the near field absorption enhancement of such nano particles. Hence we are carrying out simu-lations to study the impact of several particle types and arrangements incorporated into thin film organic photo-voltaic devices.
Wavelength Selective Dielectric MirrorsOrganic photovoltaics in combination with dielectric mirrors (DM) are a potential candidate for building inte-grated solar cells as they promise high efficiencies in par-allel to the possibility to adjust the color and the trans-parency of the whole device. Wavelength selective filters which are also known as 1D photonic crystals, Bragg mirrors or DM are based on constructive or destructive interference in thin layers. For this purpose, a high refrac-tive index (HRI) and a low refractive index (LRI) material have to be arranged alternatingly. Comparison to exper-imental measurements have shown that a good agree-ment can be reached with our simulation code. Figure [2] shows a simulation setup of a DM with five alternating HRI/LRI layers. The characteristic transmission spectrumof a DM depends not only on the used materials but also on the surface roughness between the HRI and LRI layers. This makes 3D optical simulations necessary.
Performance Optimization
Single Node OptimizationIn order to optimize the single node performance of the used simulation tool we recently carried out a KON-WIHR project at the RRZE, FAU Erlangen-Nürnberg. We
implemented a multi-core wavefront diamond blocking scheme with multi-dimensional intra-tile parallelization, see [4]. With this temporal blocking method we were able to boost single node performance by a factor of 3x to 4x, see Figure 3. The originally highly memory bound stencil code saw a reduction in main memory bandwidth between 40% and 80%.
Multi Node OptimizationWere able to reduce the time spent on data exchange between processes by an improved mapping of the pro-cesses to the simulation grid and by more sophisticated overlapping/asynchronous data exchange algorithms. The benchmarks show that we were able to improve the parallel efficiency of the simulation code from ~70% up to >90% for more than 100 compute nodes.
References and Links
[1] www10.cs.fau.de/wissenschaftliches-rechnen[2] www.eupvsec-proceedings.com/proceedings?fulltext=abebe[3] Bronnbauer, C., Hornich, J., Gasparini, N., Guo, F., Hartmeier, B.,
Luechinger, N. A., Pflaum, C., Brabec, C. J. and Forberich, K. (2015), Printable Dielectric Mirrors with Easily Adjustable and Well-De-fined Reflection Maxima for Semitransparent Organic Solar Cells. Advanced Optical Materials, 3: 1424–1430. doi: 10.1002/adom.201500216
[4] Malas, T. M., Hornich, J., Hager, G., Ltaief, H., Pflaum, C., and Keyes, D. E., “Optimization of an electro-magnetics code with multicore wavefront diamond blocking and multi-dimensional intra-tile parallelization,” in [2016 IEEE International Parallel and Distributed Processing Symposium (IPDPS) ], 142–151 (May 2016).
Figure 2: Setup of a dielectric (Bragg) mirror with five alternating high/low refractive index stacks. See Ref. [3]
Figure 3: Single Node Performance improvement by the introduction of multi-core wavefront diamond blocking. Depending on the diamond tiling configuration (DW) a speed up of up to 4x can be achieved.

78
Chemistry and Material Sciences
2
Stabilization of ferroelectric properties in Hafnia with doping
Research InstitutionModeling and Simulation Lab, Department of Applied Sciences and Mechatronics, University of Applied Sciences MunichPrincipal InvestigatorAlfred KerschResearchersRobin Materlik, Christopher Künneth, Max FalkowskiProject PartnersNamLab gGmbH Dresden, Electronic Materials Research Lab RWTH Aachen
SuperMUC Project ID: pr89pe
Introduction
Ferroelectricity is a property of a few crystalline insulators with partial ionic bonds. In such a crystal, the positively charged metal ions and negatively charged oxygen ions can be arranged in structures of different symmetry, the possible crystal phases. In a crystal, the symmetry of atom arrangement and symmetry of charge arrangement has to be distinguished. In most cases, the existing crystals, which are the energetically most favorable structures, have a reduced atomic symmetry, but the charge distri-bution is still symmetric. In a ferroelectric crystal, a less symmetric phase with asymmetric charge distribution is energetically most favorable. Figure 1 shows the unit cell of the ferroelectric phase of HfO2 with positively charged hafnium and negatively charged oxygen with an asym-metry in the oxygen subsystem. As a result the crystal has an electric polarization without the application of an external electrical field. The phenomenon is well-known in the perovskite structure of BaTiO3.
Ferroelectrics have a wide range of applications in mod-ern technology, which started with the use of permanent polarization in FeRAM cells for data storage applications. As strong piezoelectrics, they enable electro-mechanical transducers. As strong pyroelectrics, they enable thermo- mechanical transducers, including sensors for heat or motion detection, and generators for electric energy from waste heat.
This project is part of a research collaboration [1] with the goal to investigate Hafnia (HfO2) and Zirconia (ZrO2) ferroelectrics and their possible applications. This re-cently discovered [2], new ferroelectric material class is especially attractive for many applications because of their compatibility to silicon microelectronics, their bio-compatibility and their strong pyroelectric properties. In some applications, it may substitute lead containing compounds.
Both Hafnia and Zirconia show no ferroelectric behavior in nature and only become ferroelectric under certain conditions. The most important factor favouring ferroe-
lectricity is doping on the level of a few percent. One of the aims of this project is to find the most appropriate doping as well as an explanation why specific dopants promote ferroelectric and others do not.
Results and Methods
The crystal structures are simulated atomistically on the level of quantum mechanics with the simulation tools Abinit and FHI-Aims [3]. The electron distribution in the crystal is calculated with density functional theory, then the forces between the atoms are derived and new posi-tion of the atoms closer to the equilibrium are searched, iteratively until a convergence is reached. The results in-clude the position of the atoms, the crystal structure, and the energy of the crystal. Different initial positions lead to different crystallographic phases. The energies are fi-nally compared to find the most stable phase, depending
Figure 1: The ferroelectric Pca21 polar orthorhombic crystal structure of HfO2 competing with monoclinic, orthorhombic, tetragonal and cubic structures. Green: metal ions, Red: oxygen ions, Gold: stable asymmetric positioned oxygen ions responsible for ferroelectricity. Arrow marks the polarization vector Pr.
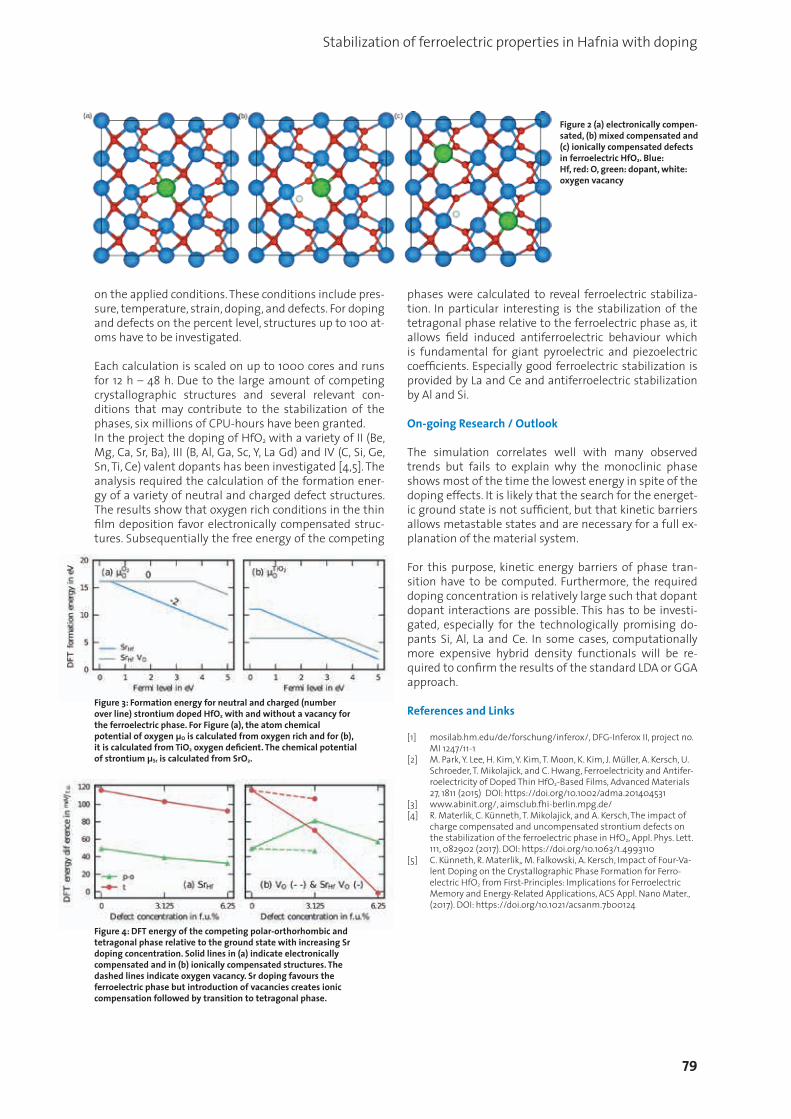
79
Stabilization of ferroelectric properties in Hafnia with doping
on the applied conditions. These conditions include pres-sure, temperature, strain, doping, and defects. For doping and defects on the percent level, structures up to 100 at-oms have to be investigated.
Each calculation is scaled on up to 1000 cores and runs for 12 h – 48 h. Due to the large amount of competing crystallographic structures and several relevant con-ditions that may contribute to the stabilization of the phases, six millions of CPU-hours have been granted.In the project the doping of HfO2 with a variety of II (Be, Mg, Ca, Sr, Ba), III (B, Al, Ga, Sc, Y, La Gd) and IV (C, Si, Ge, Sn, Ti, Ce) valent dopants has been investigated [4,5]. The analysis required the calculation of the formation ener-gy of a variety of neutral and charged defect structures. The results show that oxygen rich conditions in the thin film deposition favor electronically compensated struc-tures. Subsequentially the free energy of the competing
phases were calculated to reveal ferroelectric stabiliza-tion. In particular interesting is the stabilization of the tetragonal phase relative to the ferroelectric phase as, it allows field induced antiferroelectric behaviour which is fundamental for giant pyroelectric and piezoelectric coefficients. Especially good ferroelectric stabilization is provided by La and Ce and antiferroelectric stabilization by Al and Si.
On-going Research / Outlook
The simulation correlates well with many observed trends but fails to explain why the monoclinic phase shows most of the time the lowest energy in spite of the doping effects. It is likely that the search for the energet-ic ground state is not sufficient, but that kinetic barriers allows metastable states and are necessary for a full ex-planation of the material system.
For this purpose, kinetic energy barriers of phase tran-sition have to be computed. Furthermore, the required doping concentration is relatively large such that dopant dopant interactions are possible. This has to be investi-gated, especially for the technologically promising do-pants Si, Al, La and Ce. In some cases, computationally more expensive hybrid density functionals will be re-quired to confirm the results of the standard LDA or GGA approach.
References and Links
[1] mosilab.hm.edu/de/forschung/inferox/, DFG-Inferox II, project no. MI 1247/11-1
[2] M. Park, Y. Lee, H. Kim, Y. Kim, T. Moon, K. Kim, J. Müller, A. Kersch, U. Schroeder, T. Mikolajick, and C. Hwang, Ferroelectricity and Antifer-roelectricity of Doped Thin HfO2-Based Films, Advanced Materials 27, 1811 (2015) DOI: https://doi.org/10.1002/adma.201404531
[3] www.abinit.org/, aimsclub.fhi-berlin.mpg.de/[4] R. Materlik, C. Künneth, T. Mikolajick, and A. Kersch, The impact of
charge compensated and uncompensated strontium defects on the stabilization of the ferroelectric phase in HfO2, Appl. Phys. Lett. 111, 082902 (2017). DOI: https://doi.org/10.1063/1.4993110
[5] C. Künneth, R. Materlik,, M. Falkowski, A. Kersch, Impact of Four-Va-lent Doping on the Crystallographic Phase Formation for Ferro-electric HfO2 from First-Principles: Implications for Ferroelectric Memory and Energy-Related Applications, ACS Appl. Nano Mater., (2017). DOI: https://doi.org/10.1021/acsanm.7b00124
Figure 2 (a) electronically compen-sated, (b) mixed compensated and (c) ionically compensated defects in ferroelectric HfO2. Blue:Hf, red: O, green: dopant, white: oxygen vacancy
Figure 3: Formation energy for neutral and charged (numberover line) strontium doped HfO2 with and without a vacancy forthe ferroelectric phase. For Figure (a), the atom chemicalpotential of oxygen μO is calculated from oxygen rich and for (b),it is calculated from TiO2 oxygen deficient. The chemical potentialof strontium μSr is calculated from SrO2.
Figure 4: DFT energy of the competing polar-orthorhombic andtetragonal phase relative to the ground state with increasing Srdoping concentration. Solid lines in (a) indicate electronicallycompensated and in (b) ionically compensated structures. Thedashed lines indicate oxygen vacancy. Sr doping favours theferroelectric phase but introduction of vacancies creates ioniccompensation followed by transition to tetragonal phase.

80
Chemistry and Material Sciences
2
First principles multiscale kinetic modelling of catalytic reactions
Research InstitutionDepartment Chemie & Catalysis Research CenterPrincipal InvestigatorKarsten ReuterResearchersMie Andersen, Craig PlaisanceProject PartnersLehrstuhl für Theoretische Chemie, TU München
SuperMUC Project ID: pr92me
Introduction
In recent years, the growing demands for alternative power sources and rising concerns about global warm-ing has renewed the interest in developing efficient processes for the synthesis of chemicals and fuels us-ing solid (heterogeneous) catalysts. A mixture of carbon monoxide and hydrogen (also known as syngas) is the starting point for many reactions of technological in-terest. The obtained end products are highly dependent on the solid material that catalyzes the reaction. Often the catalytically active material is present in the form of nanoscopic particles of transition metals (e.g. Co, Ru, Rh, Ni, Cu or alloys) distributed on a porous support mate-rial. In order to tune the activity of the catalyst and the selectivity towards the desired end product (e.g. meth-ane, longer chain hydrocarbons, methanol or ethanol) it is important to gain an atomic-scale understanding of the working catalyst. At the Technical University of Munich (TUM) scientists study catalytic processes at surfaces with a multiscale modelling approach, rang-ing from the microscopic elementary processes taking place at the catalytic surface to the construction of a microkinetic model that takes into account the statis-tical interplay between those processes and allows to predict the macroscopic reaction rate and product se-lectivity. This theoretical modelling relies on an exten-sive database of first principles density functional theo-
ry (DFT) calculations, the construction of which requires the use of high performance computing facilities such as LRZ’s SuperMUC.
Results and Methods
The complexity of catalytic reactions on surfaces calls for efficient means of estimating both thermodynam-ic adsorption energies of the different species involved in the process and kinetic reaction barriers for the con-sidered reaction steps, which are required input for a microkinetic model. For predictive-quality input data DFT is generally the method of choice owing to its fa-vorable ratio between accuracy and computational cost. Still, the large system sizes required for a faithful model of real catalysts, along with the large number of calculations that need to be performed for complex re-actions and the consideration of several (or the screen-ing of many) different catalyst materials, renders this approach very challenging. A commonly used strategy to simplify this challenge is to employ scaling relations, which are linear relations between the adsorption en-ergies of chemically related species. Of particular high computational cost is the calculation of reaction barri-ers (equivalently known as activation energies), which involves identification of the transition state of the re-action step. This is illustrated for the dissociation of a water molecule in Figure 1 (a). In Figure 1 (b) an example
Figure 1: (a) DFT-calculated ener-gies and structures of the initial, transition and final state for the dissociation of a water molecule on a terrace site of a Rh(211) cata-lyst. (b) Scaling relation between the activation energy and the re-action energy of the water dissoci-ation step illustrated for terrace (t) and step (s) sites on the (211) facet of several transition metals. Based on data from Ref. [1].

81
First principles multiscale kinetic modelling of catalytic reactions
of a scaling relation is shown, i.e. the activation energy of the reaction step scales linearly with the reaction en-ergy. The latter quantity involves only thermodynamic adsorption energies, which are computationally much less costly to obtain than kinetic barriers. Scaling rela-tions are therefore useful for predicting kinetic barriers on new materials (e.g. TM alloys) at a much lower com-putational cost than the explicit DFT calculation of all reaction energetics.
The work carried out at TUM addresses several different levels of theory involved in the multiscale modelling of catalytic reactions (c.f. Figure 2). A fundamental and critical choice for the theoretical modeling is the type of active site(s) to focus the investigations on [2]. For many reactions in heterogeneous catalysis this could be a specific site type on a TM nanoparticle such as a surface step or terrace site [1], but it could equivalently be a site at the interface between a TM and an oxide material [3]. Next, the elementary processes that can take place on the active site need to be considered for the particular reaction of interest. As discussed above, the reaction energetics is typically calculated from DFT, while scaling relations can be used to extend the the-oretical predictions to many similar materials such as the TM and their alloys [1]. This is typically the part of the multiscale modelling approach that relies most heavily on supercomputing power.
The DFT-calculated reaction energetics allows to calcu-late rate constants for all elementary processes, which serve as input to a microkinetic model. For the prediction of rough trends and limitations in catalyst activities, the microkinetic model often relies on a mean-field approx-imation (MFA), in which a random spatial distribution of the chemical species on the catalyst surface is assumed. This approach has been used to estimate upper limits to the catalytic performance of bifunctional catalysts [4-5], which are special types of catalysts that rely on the cou-
pling of two different active sites, each catalyzing a par-ticular reaction step. Such insights serve to provide ideas how to design new catalyst materials that go beyond the limitations to the optimal catalyst activity achievable posed by scaling relations.
To go beyond the MFA and explicitly account for spatial correlations in the distribution of the chemical species on the surface, we make use of kinetic Monte Carlo (kMC) simulations. For the specific reaction of carbon monoxide and hydrogen to form methane, explicit as-sessment of the MFA against the more elaborate kMC simulations showed that the MFA can break down for step sites on metal surfaces. This was shown to arise from the fact that these sites bind the chemical spe-cies very strongly and therefore hinder their mixing on the catalyst surface [1]. The work underlines the impor-tance of considering more advanced microkinetic mod-els despite their higher computational cost, also for the screening of new catalyst materials where the MFA has traditionally been applied.
References and Links
[1] M. Andersen, C. Plaisance, and K. Reuter, J. Chem. Phys. 2017, 147, 152705
[2] K. Reuter, C. Plaisance, H. Oberhofer, and M. Andersen, J. Chem. Phys. 2017, 146, 040901
[3] M. Andersen, X. Yu, M. Kick, Y. Wang, C. Wöll, and K. Reuter, J. Phys. Chem. C 2018, 122, 4963
[4] M. Andersen, A.J. Medford, J.K. Nørskov, and K. Reuter, Ang. Chem. Int. Ed. 2016, 55, 5210
[5] M. Andersen, A.J. Medford, J.K. Nørskov, and K. Reuter, ACS Catal. 2017, 7, 3960
Figure 2: Overview of the various lev-els of theory involved in the multiscale modelling of catalytic reactions. The reaction energetics of the elementary processes is typically calculated at one or more active site models using DFT. This serves as input to a microkinetic model, which is typically constructed using either the mean-field approxi-mation or kinetic Monte Carlo simu-lations. From the microkinetic model a number of predictions can be made related to e.g. the dominant reaction pathway as well as to which reaction steps within that pathway that are most important for the observed catalytic activity and product selec-tivity. Finally, the obtained insight can be used to identify descriptors for catalytic performance, which in turn facilitate the search for new and improved catalyst materials through computational catalyst screening.

82
Chemistry and Material Sciences
2
Calculating free energy barriers in photo-electrochemistry
Research InstitutionDepartment Chemie & Catalysis Research CenterPrincipal InvestigatorKarsten ReuterResearchersHarald Oberhofer, Thomas StecherProject PartnersLehrstuhl für Theoretische Chemie, TU München
SuperMUC Project ID: pr92me
Introduction
In recent years theory and specifically computer simula-tions have assumed an ever increasing role in the study of (photo-)electrocatalytic reactions. Thereby, decep-tively simple thermodynamic approaches such as the famed computational hydrogen electrode approach or the identification of scaling relations between certain intermediates allowed first insights into industrially relevant reactions and even a computational “screen-ing” for efficient catalyst materials. In comparing the thermodynamic stabilities of reaction intermediates, thermodynamic approaches straightforwardly show if a reaction can proceed at a given material and driving potential or not. Yet, compared to theoretical approach-es in other fields of chemistry, such as e.g. heterogenous catalysis, the simulation of (photo-)electrocatalytic re-actions still lags behind. Kinetic barriers, the lowering of which is the very definition of a catalyst, are generally disregarded completely.
The reason for this lies in the complexity of the inter-faces, generally water and a catalyst, and the reactions, which are generally comprised of electrochemical and non-electrochemical steps. In our work we present the first fully dynamic calculation of the free energy barrier of the rate limiting first step of water oxidation on TiO2 .
Results and Methods
Computationally, such simulations are extremely de-manding of both the methodologies applied, as well as the available computing hardware. Recent simu-lations showed that the description of the electronic structure and thus reactivity of non-metallic oxide sur-faces in computationally efficient semi-local density functional theory can be highly inaccurate.[1] In terms of the kinetic barrier this can even lead to a complete disappearance of the other minimum due to erroneous delocalisation of the electron-hole driving the reaction. Thus, in order to determine the kinetic barrier of pro-ton abstraction, we have to resort to highly expensive hybrid density functionals[2] or beyond.[3] While these
offer the necessary accuracy they are computationally highly demanding and scale badly with system size. At the same time, in order to accurately model the cata-lyst-solvent interface, a sufficient number of solvent molecules needs to be simulated as well. Even with modern embedding methods,[4] this leads to a very large number of atoms to be simulated on the level of hybrid DFT. Together with the fact that kinetic barriers demand a thorough sampling of phase space in the form of e.g. molecular dynamics, the rate estimations of photo-electrochemical reactions absolutely neces-sitate Tier-0 resources both in terms of memory, and CPU-time.
Utilising a combination of state-of-the-art methods including solid-state embedding,[5] quantum and mo-lecular mechanical dynamics, as well as umbrella sam-pling Gaussian process regression profile reconstruc-tion we determined the free energy profile of the first proton abstraction from a water molecule adsorbed on TiO2 .[2] The resulting profile plotted versus a Mar-
Figure 1: Illustration of the embedded simulation setup. Colored spheres depict the elements Ti (grey), O (red), and H (white) and additional fitted charges designed to reproduce the long-range electrostatic potential (green).
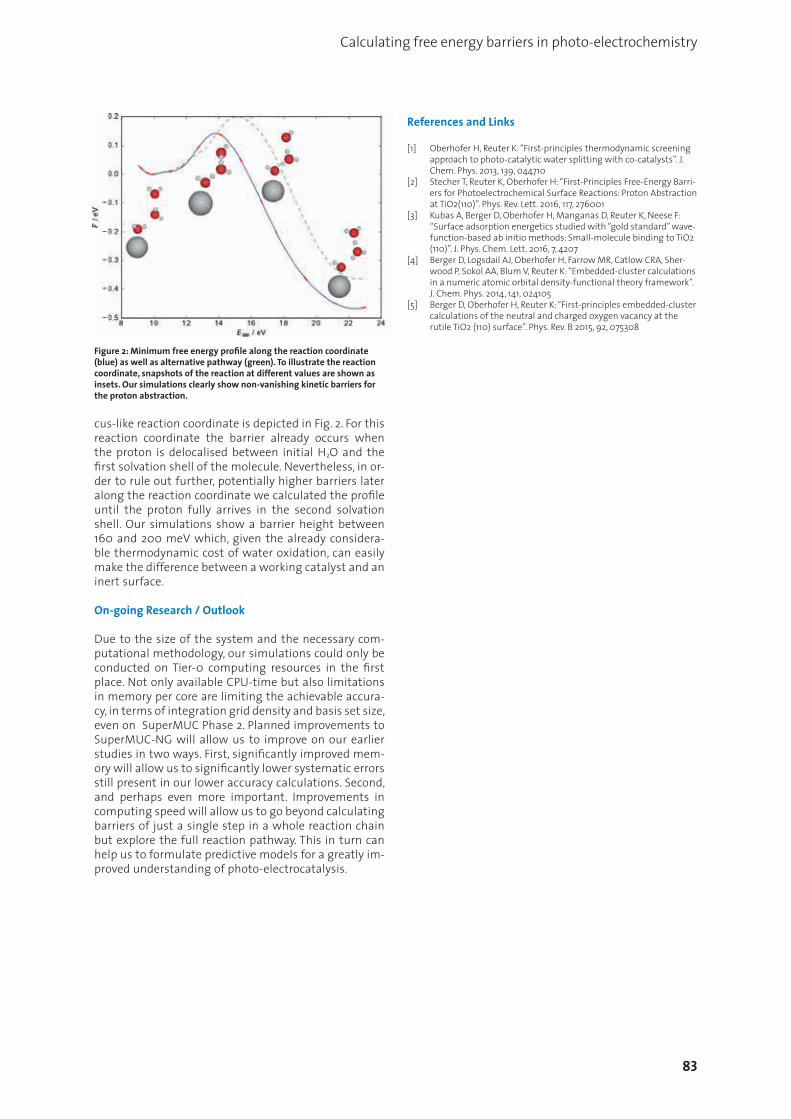
83
Calculating free energy barriers in photo-electrochemistry
cus-like reaction coordinate is depicted in Fig. 2. For this reaction coordinate the barrier already occurs when the proton is delocalised between initial H2O and the first solvation shell of the molecule. Nevertheless, in or-der to rule out further, potentially higher barriers later along the reaction coordinate we calculated the profile until the proton fully arrives in the second solvation shell. Our simulations show a barrier height between 160 and 200 meV which, given the already considera-ble thermodynamic cost of water oxidation, can easily make the difference between a working catalyst and an inert surface.
On-going Research / Outlook
Due to the size of the system and the necessary com-putational methodology, our simulations could only be conducted on Tier-0 computing resources in the first place. Not only available CPU-time but also limitations in memory per core are limiting the achievable accura-cy, in terms of integration grid density and basis set size, even on SuperMUC Phase 2. Planned improvements to SuperMUC-NG will allow us to improve on our earlier studies in two ways. First, significantly improved mem-ory will allow us to significantly lower systematic errors still present in our lower accuracy calculations. Second, and perhaps even more important. Improvements in computing speed will allow us to go beyond calculating barriers of just a single step in a whole reaction chain but explore the full reaction pathway. This in turn can help us to formulate predictive models for a greatly im-proved understanding of photo-electrocatalysis.
References and Links
[1] Oberhofer H, Reuter K: “First-principles thermodynamic screening approach to photo-catalytic water splitting with co-catalysts”. J. Chem. Phys. 2013, 139, 044710
[2] Stecher T, Reuter K, Oberhofer H: “First-Principles Free-Energy Barri-ers for Photoelectrochemical Surface Reactions: Proton Abstraction at TiO2(110)”. Phys. Rev. Lett. 2016, 117, 276001
[3] Kubas A, Berger D, Oberhofer H, Manganas D, Reuter K, Neese F: “Surface adsorption energetics studied with “gold standard” wave-function-based ab initio methods: Small-molecule binding to TiO2 (110)”. J. Phys. Chem. Lett. 2016, 7, 4207
[4] Berger D, Logsdail AJ, Oberhofer H, Farrow MR, Catlow CRA, Sher-wood P, Sokol AA, Blum V, Reuter K: “Embedded-cluster calculations in a numeric atomic orbital density-functional theory framework”. J. Chem. Phys. 2014, 141, 024105
[5] Berger D, Oberhofer H, Reuter K: “First-principles embedded-cluster calculations of the neutral and charged oxygen vacancy at the rutile TiO2 (110) surface”. Phys. Rev. B 2015, 92, 075308
Figure 2: Minimum free energy profile along the reaction coordinate (blue) as well as alternative pathway (green). To illustrate the reaction coordinate, snapshots of the reaction at different values are shown as insets. Our simulations clearly show non-vanishing kinetic barriers for the proton abstraction.

84
Chemistry and Material Sciences
2
Effect of electrolyte solution on standard reduction potentials of polyoxometalates
Research InstitutionFachgebiet Theoretische Chemie, Department Chemie, Technische Universität MünchenPrincipal Investigator—ResearchersA. Kremleva, A. Genest, N. RöschProject PartnersA*STAR Institute of High Performance Computing, Singapore
SuperMUC Project ID: pr94je
Introduction
Polyoxometalates (POMs) are a class of nano-sized (early) transition metal compounds formed by oxyanions, Fig. 1. POMs exist in a variety of shapes, sizes, and composi-tions; they are stable in solution over a wide range of pH values and temperatures and they are able to undergo reversible multi-electron redox processes. POMs can be used in a variety of applications, e.g. chemical synthesis, materials science, electrochemistry, biology, medicine. Recently, the use of POMs has been suggested for large-scale energy storage, in particular in redox flow batter-ies (RFB). A high demand of energy storage technology results from the increasing use of sustainable resources, such as sun, wind, and ocean tides, whose output is not easily adapted to fluctuation in demand.
POMs of special interest are the so-called Keggin ions with structures of the type [XM12O40]n–. Replacing some metal centers M by another transition metal M’ gener-ates Keggin-type POMs where redox potentials due to the two types of metals are separated by up to a few Volts. As an example, we mention a V-exchanged W-based Keggin ion, a system which was shown to yield an aqueous 0.8 V battery that could be cycled 100 times [1]. Although the current densities of this prototype were measured at least one order lower than those of common RFBs, POMs based systems may offer a new approach to RFBs.
Inspired by this new concept, another substituted POM, namely a tri-Mn substituted W-based Keggin ion, [Mn(III)3(OH)3(H2O)3SiW9O34]4–, was recently introduced and examined electrochemically [2]. For this Keggin ion we modeled redox potentials for the redox pairs Mn(IV/III) and Mn(III/II) by means of quantum mechanical elec-tronic structure calculations on the basis of density func-tional theory (DFT). Computational chemistry offers an approach complimentary to experiment for characteriz-ing the (electrochemical) properties of POMs.
Results and Methods
In general, the calculation of standard reduction poten-tials of transition metal centers is still a challenge. There are two main redox reaction mechanisms: proton cou-pled electron transfer (PCET) and cation coupled electron transfer (CCET). Modeling bare POMs without taking into account protons or counterions which neutralize the sys-tem leads to significant uncertainties in the absolute re-duction potentials. Therefore, counterions have to be tak-en into account. Modeling the effect of the surrounding solution (solvation) is another source of uncertainties. A simple way of modeling solvation is to represent the sol-vent environment by a polarizable continuum (PC), e.g. as done in the COSMO model. Yet, this model might not be accurate enough for a reliable representation of the elec-trolyte field [3]. An improved approach is to surround the investigated POM and the neutralizing counterions by ex-plicit water molecules, applying periodic boundary condi-tions. This environment is modeled at the quantum chem-ical level. Such a model system has a very large number of degrees of freedom, making it practically impossible to determine a global energy minimum. Instead, one aims at determining free energies at a chosen temperature. This implies a sampling of the phase space, carried out via mo-lecular dynamics (MD). We combined both solvation treat-ments by taking snapshots from MD simulations and cal-culating reduction potentials for a system where the POM and its counterions, together with just a few explicit water molecules, are embedded in a PC. Our study shows that treating short-range solvation effects in this hierarchical way considerably improves the results. Figure 1: Bare POMs with all Mn centers in oxidation states III (a) and IV (b).
Snapshots of partially solvated Li4[Mn(III)3(H2O)3] (c) and Li4[Mn(IV)3(OH)3] (d). For an explanation of the short-hand notations, see the text.

Effect of electrolyte solution on standard reduction potentials of polyoxometalates
Fig. 1 shows bare POMs (without counterions) with all Mn centers in oxidation state III ([Mn(III)3(H2O)3]4–, Fig. 1a) and in oxidation state IV ([Mn(IV)3(OH)3]4–, Fig. 1b). Exper-iment suggests that Mn(III/II) reduction is of CCET type and Mn(IV/III) reduction exhibits the PCET mechanism. Therefore, the POM with Mn(IV) is deprotonated, com-pared to the POM with Mn(III).
We started by simulating the system [Mn(III)3(H2O)3]4–(Fig. 1a). The POM together with 4 Li+ counterions was sur-rounded by water molecules in a box of 18x18x18 Å3. An ab Initio molecular dynamics (AIMD) simulation of this system with about 500 atoms was carried out using the parallelized plane-wave based Vienna Ab Initio Simulation Package VASP [4]. 448 cores were used to treat a few tens of picoseconds. One picosecond takes about 12 hours of real time at SuperMUC. During the first few picoseconds the energy has to be equilibrated among the various degrees of freedom. Subsequently, the production run is started, producing snapshots for the statistical analysis. Equilibrat-ed systems are assumed to show stable positions of the Li cations around the POM. To study this, the number of Li-O bonds to the POM was analyzed, Fig. 2, calculating the mov-ing average of CN (coordination number of Li-POM bonds). Initially, each Li cation was 4-coordinated to the POM. After ~18 ps, 2 of the 4 Li cations stay 4-coordinated to the POM, the other two ions being only monocoordinated. In total 32 ps of AIMD were carried out, 14 of which were devoted to the production run where 10 snapshots were taken to determine the structure of a model cluster (POM, Li+ coun-terions, and aqua ligands of the first coordination shell of each Li+, Fig. 1c). These snapshots were used for calculating standard reduction potentials by means of DFT with the hybrid exchange-correlation functional B3LYP using the software package TURBOMOLE [5].
We also modeled the POM with all Mn in oxidation state IV. Experiment suggests that oxidation of all Mn(III) centers to Mn(IV) proceeds via the PCET mechanism [2]. We carried out a computational experiment in which we simulated the oxidized system Mn(IV) and reduced the number of Li counterions to one, resulting in the model Li[Mn(IV)3(H2O)3]. This computational experiment showed a deprotonation of the POM and the number of released protons is the same as the number of Mn ions in oxidation state IV. In this way, we were able to confirm the PCET mechanism, suggested experimentally, for the Mn(IV/III) redox reaction.
Therefore, we removed three hydrogens from the equil-ibrated system Li4[Mn(III)3(H2O)3] in order to create Li4[Mn(IV)3(OH)3]. This fully oxidized POM with only Mn(IV) centers was equilibrated and a production run of more than 10 ps was carried out. The corresponding CNs of the Li ions to the POM are shown in Fig. 2 (right panel). Full equi-libration of Li4[Mn(IV)3(OH)3] results in two Li cations with no direct contacts to the POM, a monocoordinated and a bicoordinated Li+. The equilibrated state was reached at ~55 ps overall time, followed by another 15 ps production run. As for the system with Mn(III), during the last 10 ps of production run structure snapshots were taken (Fig. 1d).
UredO Model 1 [3] Model 2 Exp. [2]
Mn(IV/III) 1.63±0.04 0.77±0.03 0.85 (pH 6)Mn(III/II) 1.05±0.07 0.55±0.04 0.65
Table 1: Standard reduction potentials in eV, calculated according to Model 1 and Model 2. For details see text.
Standard redox potentials Ured0 were estimated for two
models: (1) POMs with Li+ counterions four-coordinated on the surface of POMs and solvation modeled implicit-ly (COSMO) [3]; (2) snapshots of POMs with equilibrated positions of Li+ and additional aqua ligands together with implicit solvation (COSMO). The resulting Ured
0 values de-crease considerably due to Li equilibration, from 1.63±0.04 to 0.77±0.03 eV for Mn(IV/III) and from 1.05±0.07 to 0.55±0.04 eV for Mn(III/II), Table 1. The position of the Li+ counterions closer to the POM in Model 1 creates a stronger positive electrostatic field, which makes electron addition (reduction process) easier and consequently Ured
0 higher. In Model 2 the Li+ counterions are further away from the POM and also are partially explicitly solvated, shielding the positive electrostatic field of Li+ counterions. Therefore, the calculated Ured
0 from Model 2 are lower. Note, Ured0
changes from Model 1 to Model 2 differently, depending on the reduction step of Mn: by 0.86 eV for Mn(IV/III) and by only 0.5 eV for Mn(III/II). This can be rationalized by dif-ferent local structures of the near-field electrolyte, Fig. 2.
In summary, with a standard PC solvation treatment, redox potentials are overestimated due to a poor rep-resentation of the electrolyte environment. Explicit (at-omistic) modeling of the aqueous solution yields redox potentials in excellent agreement with experiment be-cause it adequately reflects the effect of solvated coun-terions and the fluctuating aqueous medium. With these investigations we convincingly demonstrated how im-portant it is for a reliable prediction of electrochemical properties of POMs to describe the electrolyte explicit-ly at the atomic level. Such good agreement between measured redox potentials and calculated values is un-precedented for such complex molecular charge carriers.
References and Links
[1] H.D. Pratt III, N.S. Hudak, X. Fang, T.M. Anderson, A polyoxometalate flow battery, J. Power Sources, 236 (2013) 259-264.
[2] J. Friedl, R. Al-Oweini, M. Herpich, B. Keita, U. Kortz, U. Stimming, Electrochemical studies of tri-manganese substituted Keggin polyoxoanions, Electrochim. Acta, 141 (2014) 357-366.
[3] A. Kremleva, P. A. Aparicio, A. Genest, N. Rösch, Quantum chemical modeling of tri-Mn-substituted W-based Keggin polyoxoanions, Electrochim. Acta 231 (2017) 659-669.
[4] www.vasp.at[5] www.turbomole.com
Figure 2: Moving average for CN of each Li cation to O centers of the POM. Shift 0.5 ps, width 1 ps.

86
Chemistry and Material Sciences
2
Sorption of U(VI) by calcium silicate hydrate (CSH) phases
Research InstitutionFachgebiet Theoretische Chemie, Department Chemie, Technische Universität MünchenPrincipal Investigator–ResearchersA. Kremleva, S. Krüger, N. RöschProject Partners–
SuperMUC Project ID: pr94je
Introduction
Sorption of actinides is regarded as a main retardation mechanism against transport of these hazardous ele-ments in the environment. Cementitious materials as commonly used for solidification and as construction material in geological repositories for radioactive waste affect the release of many radionuclides. Calcium silicate hydrates (CSH) are major constituents of cement and its degradation products and have been identified as the main sorbing phase for actinide ions. To gain a mecha-nistic understanding of actinide sorption processes at the atomic scale, which is an important prerequisite for thermodynamic and transport modeling for safety con-siderations, quantum chemical (QC) calculations offer an alternative and direct approach, complementary to the often used spectroscopic methods. We study the sorp-tion of U(VI), which forms the uranyl ion UO2
2+ at com-mon conditions. Still under discussion, the structure of CSH is considered to be nano-crystalline or even gel-like. At least locally CSH phases are assumed to be similar to the mineral tobermorite for calcium-to-silicon (C/S) ratios below 1.5 and similar to jennite for higher C/S ra-tios. Aging cement undergoes decalcification where Ca cations leave the interlayer region, thus leading to lower C/S ratios. We model aged CSH by tobermorite, ideal and defective. Tobermorite consists of layers of calcium oxide, CaO, decorated with chains of silicate units, SiO4. The sil-icate chains show a periodicity of three units. Two SiO4 tetrahedra are paired and directly connected to the CaO layer (“pairing” tetrahedra) and the third one connects
two pairing tetrahedra in bridging fashion (“bridging” tetrahedron, Fig. 1). We chose the variant of tobermorite which shows a layer separation of 14 Å. This is the most hydrated form of tobermorite with the chemical formu-la Ca4+nSi6O14+n(OH)4-2n•7H2O, n = 0–2. It exhibits a varying number of interlayer Ca2+ cations, Fig. 1, which define the C/S ratio. We studied ideal models of tobermorite with C/S ratios of 0.67, 0.83, and 1.0, Fig. 1, as well as defective variants with a low number of missing bridging SiO4 moieties, resulting in slightly enhanced C/S ratios.
Results and Methods
We carried out QC calculations, applying a plane-wave density functional method as implemented in the program VASP [1]. The effect of core electrons was represented by the projector augmented wave (PAW) approach. Tobermorite bulk and surface systems were described by periodic supercell models, comprising 8 formula units (about 450 atoms) or four unit cells of the ideal tobermorite crystal (Fig. 1). A critical aspect in these calculations is the structure of the interlayer due to soft degrees of freedom of water molecules and OH groups. Incorporation of the UO2
2+ ion into the interlay-er region or the removal of a unit of the silica chains may lead to rearrangements of the interlayer water molecules. To avoid biasing structures and energies of sorption complexes due to the initial structure of the interlayer, the relaxation of interlayer water has to be accounted for. In a previous study we have shown that reliable energies of U(VI) adsorption on solvated clay mineral surfaces are achieved by carefully equilibrat-ing the water overlayer [2]. Thus, we applied ab initio molecular dynamics (AIMD) simulations for at least 4 ps with fixed lattice parameters for relaxing and “equil-ibrating” the soft degrees of freedom. This procedure requires ~224 cores on SuperMUC for ~46 hours. Next, the structure of the bulk system was optimized togeth-er with the lattice parameters. Then we cycled 1 ps of AIMD simulations with fixed lattice parameters and full optimization steps until subsequent optimization steps yielded total energies closer than 10 kJ/mol. A vibration-al analysis was carried out for the converged structures.
Figure 1: Schematic representation of tobermorite 14 Å for various C/S ratios. Green: CaO layer and interlayer Ca ions; brown: SiO4 tetrahedra.

Sorption of U(VI) by calcium silicate hydrate (CSH) phases
Ideal tobermorite bulk structures with various C/S ra-tios were modeled in this way. The resulting geometries agree well with experiment and are used as a reference. As a common defect and also to account for the low crystallinity of CSH, we studied structures with missing bridging SiO4 units. The removal of such bridging tetra-hedra is calculated to be endothermic, by 20–40 kJ/mol per unit. Compared to the ideal structure, defective to-bermorite exhibits red-shifted Si-O related vibrational bands. Optimized structures of tobermorite were used to study the sorption of U(VI). To preserve charge neutrality after introducing UO2
2+, we removed either two protons or a Ca2+ ion. For mineral models with the same C/S ra-tio the exchange of Ca2+ by U(VI) is energetically more favorable than the exchange of two protons. Therefore, we compensated the uranyl charge by Ca2+ exchange wherever possible. To find favorable sorption sites for U(VI), we considered places suggested by chemical in-tuition and in the literature. In addition, we carried out an automated search where we scanned the interlayer region for places yielding distances to substrate O, Si, and Ca centers in agreement with the results of X-ray absorp-tion fine structure (EXAFS) data. The latter show typically U-O distances larger than 200 pm, U-Si distances of ~310 pm and ~370 pm, as well as U-Ca distances larger than 380 pm [3]. Water molecules and Ca ions in the interlayer region were not considered in the search rules.
By this elaborate search, we identified six absorption sites for U(VI) (Fig. 2), most of which include U(VI) coordina-tion to the edge of a bridging SiO4 moiety (sites 2–5, Fig. 2) resulting in a short U-Si distance of ~310 pm, as seen in experiment [3]. The bridging site 1 and site 6 at a silica tetrahedron defect exhibit U-Si distances of 340–370 pm, which tend to be somewhat shorter than the longer U-Si distance of 370 pm found in experiment [3]. For C/S = 0.67, site 1 is energetically most favorable. For higher C/S ratios, sites 3 and 4 as well as the defect site 6 are preferred. Thus, U(VI) favors also other places, not only replacing interlayer Ca ions. Comparison of absorption energies of sites shows a tendency to more endothermic values with increasing C/S ratio. Sorbed uranyl ions are mostly four-coordinat-ed in the equatorial plane. With increasing C/S ratio, ab-sorbed uranyl coordinates up to two OH ligands in the first coordination shell (instead of aqua ligands), bridging uranyl ions with interlayer Ca2+ cations. Values of all struc-tural parameters are calculated as measured by EXAFS, but not all of them are simultaneously present in a single absorption complex. Therefore, we conclude that several species contribute to the EXAFS result.
To examine the absorption and absorption (incorporat-ed into the interlayer region) of U(VI) in tobermorite, we studied the ideal and defective (001) surface by means of a slab model comprising a single mineral layer (Fig. 2). For this surface, we modeled C/S ratios varying from 0.67 to 1.2, which are independent from the corresponding bulk values. We probed monodentate and bidentate adsorp-tion of U(VI) on silanol groups. Preliminary results show that bidentate coordination is favored over monodentate coordination. Uranyl adsorbed on the tobermorite (001) surface exhibits OH ligands in the first coordination shell, but these ligands are not necessarily bridging to Ca2+ cat-ions. Structural parameters of the adsorption complexes and uranyl vibrational frequencies (Fig. 3) were found to be similar to the ones calculated for absorbed species. For the uranyl stretching vibrations a weak trend to low-er frequencies was calculated for absorbed compared to adsorbed species, by ~7 cm-1 on average. The same tendency had been deduced from a recent fluorescence spectroscopy experiment [4]. Sorption energies, calculat-ed as exchange of Ca2+ by UO2
2+, are also comparable for ad- and absorbed complexes for substrates of the same C/S ratio. Thus, U(VI) species adsorbed at the (001) sur-face of tobermorite or incorporated in the tobermorite interlayer will not easily be distinguishable by geometric or vibrational parameters. Preliminary energy considera-tions suggest that both sorption mechanisms may occur simultaneously.
On-going Research / Outlook
In this ongoing project which is supported by the Ger-man Federal Ministry for Economic Affairs and Energy (grant No 02E11415E) further sorption complexes will be examined for U(VI) and U(IV), including surface adsorp-tion and incorporation into the CaO layer. These studies aim at the elucidation of the overall uranium sorption mechanism and possible redox reactions.
References and Links
[1] www.vasp.at[2] A. Kremleva, S. Krüger, N. Rösch, Toward a reliable energetics of
adsorption at solvated mineral surfaces: a computational study of uranyl(VI) on 2:1 clay minerals, J. Phys. Chem. C, 120 (2016) 324-335.
[3] M. Harfouche, E. Wieland, R. Dähn, T. Fujita, J. Tits, D. Kunz, M. Tsuka-moto, EXAFS study of U(VI) uptake by CSH, J. Colloid Int. Sci., 303 (2006) 195-204.
[4] J. Tits, C. Walther, T. Stumpf, N. Mace, E. Wieland, A luminescence line-narrowing spectroscopic study of the uranium(VI) interaction with cementitious materials and titanium dioxide, Dalton Trans. 44 (2015) 966-97
Figure 2: Schematic rep-resentation of sorption sites for UO2
2+ (blue dots) in the interlayer region of tobermorite which serves as model of CSH.
Figure 3: Symmetric νsym and antisymmetric νasym stretching frequencies of a uranyl ion sorbed in CSH.

88
Chemistry and Material Sciences
2
Numerical simulations of topological and correlated quantum matter
Research InstitutionInstitut für theoretische Physik und Astrophysik, Universität WürzburgPrincipal InvestigatorFakher F. Assaad, Ewelina Hankiewicz, Giorgio SangiovanniResearchersFlorian Goth, Michael Karolak, Gang Li, Martin Edelmann, Andreas Hausoel, Thomas Lang, Zi Yang Meng, Domenico Di Sante, Yasir Iqbal, Stefan BeylProject Partners–
SuperMUC Project ID: pr94vu
Introduction
To unravel the complexity of the solid state, complemen-tary state-of-the-art numerical approaches are required. In Würzburg, a number of researchers embedded in the SFB 1170 on Topological and Correlated Electronics at Surfaces and Interfaces, are in the unique position of mastering a number of very different and complemen-tary methods which will allow for progress. On one hand one can start with density functional theory in the local density approximation and then add dynamical local in-teractions using the so called dynamical mean-field ap-proximation. This approach has the merit of being mate-rial dependent in the sense that it is possible to include the specific chemical constituents of the material under investigation. Progress in this domain will be described below. Spacial fluctuations alongside temporal ones are crucial to understand a number of materials. In this pro-ject, we will concentrate on magnetic materials in three spatial dimensions, and test the new pseudo-fermion functional renormalization group (PFFRG) method to understand aspects of frustrated magnetism in three spatial dimensions. Here, the approach will be tested against exact QMC simulations. Testing the quality of this tool is important due to its potential application in the domain of Iridates.
Access to the LRZ supercomputing center is imperative to carry out the relevant simulations on a wide range of models and to cover the parameter space. In all cases, access to supercomputers allows to carry out simula-tions on larger and larger system sizes, enabling extrap-olation to the thermodynamic limit which is relevant for the understanding of experiments and collective phenomena.
To carry out the relevant simulations we require in total 34 Mio cpu hours. The details how they will be used will be described in the following sections.
The magnetic fluctuation profiles of 3D frustrated magnets
The search for unconventional phases of matter, such as quantum spin liquids, is one of the fundamental and most debated issues in condensed matter physics. Traditionally, frustrated quantum magnets in 2D are a promising arena to look for such topological phases [1]. However, tremendously exciting developments and dis-coveries of exotic magnetism and spin liquid physics have been made experimentally in 3D frustrated quan-tum magnets. In particular, neutron scattering experi-ments on Hyper-Kagome (Na4Ir3O8), Hyper-Honeycomb (Li2IrO3), and various Pyrochlore and Double- Perovskite systems have revealed a novel magnetic fluctuation profile, which has so far lacked any theoretical under-standing. This is because of a complete absence of any numerical quantum manybody method which can be used for a microscopic investigation of 3D systems, for a system size large enough to make connection with ex-
Figure 1: Representative magnetic fluctuation profile of the spin liquid in the spin-1/2 Cubic lattice Heisenberg model

89
Numerical simulations of topological and correlated quantum matter
perimental data. However, the very recent development and successful application of the pseudo-fermion func-tional renormalization group (PFFRG) method to record large (>4000 sites) 3D systems [2] has shown it to be a promising approach, able to access system sizes which are an order or magnitude larger than those achievable by other methods; this is made possible by a straightfor-ward parallelizability of the RG flow equations. However, its successful application proves to be computationally extremely intensive and requires massive parallelization of the RG flow equations. To exploit this property in all its potential we need access to a large supercomputer like the SuperMUC. Given these resources our future goal is to explain the observed magnetic fluctuation profile of 3D frustrated magnets(see Fig. 1) using spin models of magnetism which are known to accurately capture the physics. To carry out this study we plan to investigate 9 materials/model Hamiltonians, where for each of them we plan to run 200 simulations to study the parameter space. This amounts to a resource usage of around 2.4 Million CPU hours/model. Therefore, these projects need, in total, resources of 21.6 Million Hours.
These efforts are coordinated with the ab-initio DFT cal-culations in the group of Prof. G. Sangiovanni, in order to understand the microscopic origin of the couplings in the materials and to provide estimates of the same, which form the starting point of our FRG calculations. In the unfrustrated regime, we plan to carry out large-scale and systematic quantitative benchmarking of PFFRG with Quantum Monte Carlo calculations coordinated to-gether with the efforts in the group of Prof. F. F. Assaad, and a first such study has already been done [2].
Ab-initio study of iridate heterostructures
Iridium is also the protagonist of another fascinating line of research of the many-body physics of 5dcorrelated electrons. Its spin-orbit interaction competes indeed so strongly with the Coulomb repulsion, that compounds differing only in small structural details can display dramatically different electronic and magnetic proper-ties. This is for instance the case of perovskite-like irid-ium strontium-oxides of the Ruddlesden-Popper series Srn+1IrnO3n+1: While the n=1 (214) compound is a quasi-two dimensional Mott system and the n=2 (327) a narrow-gap antiferromagnetic insulator, the n=∞ (113) is a correlated metal on the verge of a ferromagnetic instability [3].
Nowadays a big effort focuses on controlling and tuning these properties by heterostructuring iridiumoxides and growing them on different substrates. The success or the failure of these attempts is strongly bound to our ability of making reliable theoretical predictions. The physical effects playing a role in this class of materials are many, from strong mass enhancement of electronic quasiparti-cles, to sizeable scattering due to electron-electron inter-action, from magnetic instabilities to spin-orbit-driven physics. For this reason, the theoretical modeling is ex-tremely challenging and it requires large-scale compu-tational resources, like those available at the Leibniz Su-percomputing Centre with the SuperMUC HPC-system.
We are going to set up Density Functional Theory (DFT) calculations of SrIrO3-films on SrTiO3 [4], in close contact with the group of Ralph Claessen at the University of Würzburg, where these heterostructures are currently grown and experimentally investigated. To accomodate the out-of- plane tilting of the oxygen-octahedra and the epitaxially grown films, the unit cells required contain more than 150 atoms. The atomic relaxation in the pres-ence of magnetism and interactions due to the Hubbard interaction with strength U are therefore going to be ex-tremely heavy, considering in particular the fact that the calculations include spin-orbit coupling. Since we need a correct description of the paramagnetic phase above the magnetic ordering temperature, approaches beyond DFT are highly desirable. This poses even more technical challenges. We plan to address them by means of our hy-bridization-expansion continuous time quantum Monte Carlo code for Dynamical Mean Field Theory (DMFT) cal-culations called “w2dynamics” [5]. We highly optimized our code package over the years to treat systems that have a size at the border of feasibility. It is already in-stalled on SUPERMUC and shows high performance and perfect scalability. The DFT calculations will be done with VASP (already installed and optimized on SuperMUC) and, due to their size and the spin-orbit coupling, require of the order of 500 cores. The heterostructures we need to simulate differ for the number of Ir-layers which rang-es from 1 to 6. For each of these cases we will need to ex-plore different magnetic orders, different terminations, oxygen vacancies and clusters thereof. Considering that the largest cases will need several restarts over the 24- hour time, we foresee of the order of 70 simulation for each of the six thicknesses. This means 400 simulations, that for 24 hours on 512 cores correspond to 5 Mio core hours. DFT+DMFT calculations will not be done for each of these structures. Since however they require a para-magnetic DFT run as a starting point, some of the DFT calculations will have to be repeated without magnetic order. For this we estimate a fifth of the previous esti-mate, i.e. 1 Mio core hours. From the current experience with our w2dynamics CTQMC package on SuperMUC, we need 512-core jobs for low-temperature five-orbital CT-HYB with full Coulomb interaction. Good DMFT conver-gence for such big setups requires of the order of two or three restarts over the 24-hour time.
References and Links
[1] Y. Iqbal, W.-J. Hu, R. Thomale, D. Poilblanc, and F. Becca, “Spin liquid nature in the Heisenberg J1 – J2 triangular antiferromagnet,” Phys. Rev. B 93, 144411 (2016)
[2] Y. Iqbal, R. Thomale, F. Parisen Toldin, S. Rachel, J. Reuther, “Func-tional Renormalization Group for threedimensional Quantum Magnetism,” arxiv E-prints, 1604.03438 (2016)
[3] Y. K. Kim, O. Krupin, J. D. Denlinger, A. Bostwick, E. Rotenberg, Q. Zhao, J. F. Mitchell, J. W. Allen, B. J. Kim, “Fermi arcs in a doped pseu-dospin-1/2 Heisenberg antiferromagnet,” Science 345, 187 (2014)
[4] P. Schütz, D. Di Sante, L. Dudy, J. Gabel, M. Stübinger, M. Kamp, Y. Huang, M. Capone, M.-A. Husanu, V. N. Strocov, G. Sangiovanni, M. Sing, and R. Claessen, “Dimensionality-Driven Metal-Insulator Transition in Spin-Orbit-Coupled SrIrO3”, Phys. Rev. Lett. 119, 256404 (2017)
[5] N. Parragh, A. Toschi, K. Held, and G. Sangiovanni, ”Conserved quan-tities of SU(2)-invariant interactions for correlated fermions and the advantages for quantum Monte Carlo simulations,” Phys. Rev. B 86, 155158 (2012)


Chapter 03 – Computational Fluid Dynamics and Engineering
Computational Fluid Dynamics
and Engineering

92
Computational Fluid Dynamics and Engineering
Introduction
With constantly growing fuel prices and toughening of environmental legislation, the vehicle industry is strug-gling to reduce fuel consumption and decrease emission levels for the new and existing vehicles. One of the ways to achieve this goal is to improve aerodynamic perfor-mance by decreasing aerodynamic resistance.
Rotating wheels together with the wheelhouses can pro-duce up to 25% of the total aerodynamic drag. Further-more, there are power losses associated with the resist-ance moments acting on the wheels; originating from the relative movement of the wheels in the air.
The improvement of vehicle aerodynamics requires the tools of aerodynamics development to perform at ev-er-increasing levels of accuracy. Computational Fluid Dynamic (CFD) is very important due to the complexity of problems and accuracy required. Requirements of CFD are high process integration to keep pace with vehicle development cycle and the accuracy of results must be reliable, especially where no experiments are available.
The simulations of full car in a computational domain have been studied with rotating wheels and different pa-rameters. And the forces and moments were calculated. The simulations were carried on on the super computer of Munich (superMUC) in Leibniz Supercomputing Center.
Preliminary Results and Methods
The DrivAer model was selected for the project. The Dri-vAer model is developed at TU München in cooperation with the automotive industry companies BMW and Audi. The experiments reported in this project were executed in the Wind Tunnel A of the Institute of Aerodynamics and Fluid Mechanics at Technical University Munich, a 1:2.5 model wind tunnel with a blockage ratio 8%. The test sec-tion is 4.8m long, the cross section of nozzle exit is 4.32m2. Vortex generators are installed at the nozzle exit to reduce the pressure fluctuations induced by the developing shear layers. The maximum wind speed is 65m/s. Four different
Setup experiments were studied, which would be used to validate the simulation results.
For the numerical investigation, the open source code OpenFOAM was chosen. The customizability of open-source software, along with the absence of licensing restrictions, is increasing its presence in the engineering and research environments [1]; the user has the choice of technology provider. Full transparency of technology permits complete analysis and solves problems, which is very flexible for calculating the ventilation moment of the rotating wheels.
The pressure-velocity coupling in the present work is realized using the SIMPLE algorithm implemented in simpleFoam. For the Reynolds Averaged Navier Stokes Equations (RANS) simulations, the k-ω-SST (Shear-Stress-Transport) model following Menter [2] was chosen. The ω-equations has significant advantages near adverse pressure gradient flows, leading to improved wall shear stress. The SST model combines the k-ω model near the wall and the k-εmodel away from the wall as a unified two-equation turbulence model. It was developed for ex-ternal aerodynamic flow simulation and has shown to be
Investigation of Vehicle Wheels Aerodynamics
using DoE-based Computations and ExperimentsResearch InstitutionInstitute of Aerodynamics and Fluid MechanicsPrincipal InvestigatorLu MiaoResearchersThomas IndingerProject Partners—
SuperMUC Project ID: pr42re
3
Figure 1: Four different Setups in wind tunnel,Meshing and Iso-surface of pressure distribution

93
Investigation of Vehicle Wheels Aerodynamics using DoE-based Computations and Experiments
superior to other two-equation models in view of sepa-ration, lift and drag prediction.
The simulations were conducted at the velocity u = 41.2 m/s with rotating wheels, the turbulent intensity is 0.4% and the turbulent length scale is 1.5mm, which are in line with the inlet conditions during the wind tunnel exper-iment. To prevent backflow into the domain, the velocity boundary condition at the outlet was set to an inletOut-let condition. A no-slip boundary condition was enforced at the walls and a symmetry boundary condition was chosen for the wind tunnel buffer.
First, the results of the body-shell alone without wheels and mirrors were compared to the simulation. It can sig-nificantly reduce the turn-around time for optimizing the numerical schemes and boundary conditions with the ba-sic body, with less and easier cells regardless of the wheels. The model was positioned x=2000 mm downstream of the nozzle exit and the tests were conducted at a Reynolds number of Re=5.2 Mio, which corresponds to a freestream velocity of about 45 m/s. All the tests are conducted under moving ground.Tab.1 shows the comparisons of the drag and lift coefficients with the experiments under the mov-ing ground condition. The simulations were computed in an idealized box. On the whole, good accuracy is obtained for the prediction of drag coefficient over different range of vehicles. The simulation has the best agreement with the experiment for sedan car, the station wagon.
Rear end Experiment CFD
CdFB 0.117 0.118NB 0.129 0.129SW 0.192 0.189
delta–CdFB–NB -0.012 -0.011FB–SW -0.075 -0.071NB–SW -0.063 -0.060
ClFB -0.345 -0.367NB -0.370 -0.398SW -0.494 -0.522
delta–ClFB–NB 0.025 0.031FB–SW 0.149 0.155NB–SW 0.124 0.124
Table 1. comparison of drag and lift coefficients of different vehicle rear end between wind tunnel tests and simulation results, FB(fastback) NB(notchback)SW(station wagon)
The chosen wall function for the viscosity term imposes a continuous vt profile near the wall based on the veloc-ity, as proposed by Launder and Spalding [3]. To solve the transport equations, a basic second-order scheme line-arupwind discretization was implemented for the diver-gence terms. To compute the velocity components from the divergence term the Gauss bounded linearUpwindV scheme has been chosen. The Gauss linear scheme, a basic second-order gradient scheme using the Gauss theorem and face interpolation, was chosen as the base gradient scheme for the simulations. Gauss limited was
chosen as the snGradSchemes based on the mesh infor-mation, normally when orthogonality bigger than 60, and cellimited Gauss linear scheme was used for grad-Schemes, in order to avoid unphysically oscillation.
In this project it addresses the accuracy of different methods to simulate the wheel rotating, like the mul-tiple reference frame (MRF) and two ways using sliding mesh, seen in Fig.2, and also the differences between Reynolds-averaged Navier-Stokes equations (RANS) and Delayed Detached Eddy Simulation (DDES), all compared with particle image velocimetry (PIV) data and drag forces for an isolated rotating wheel. The sliding mesh case wheel on ground gives a similar flow field like the MRF-DDES case. The flow filed around spokes in sliding mesh case is more rotating-symmetry than the MRF case. A full parametric wheel was used, seen in Fig.3. Dif-ferent parameters of the Wheels can be changed for the simulations.
References and Links
[1] OpenFOAM Foundation, “Features of OpenFOAM”, OpenFOAM, URL: http://www.openfoam.org/features
[2] Menter,F.,and Egorov,Z.,2005.”A scale adaptive simulation model using two-equation models”.AIAA(2005-1095).
[3] Launder,B.,and Spalding,D.,1974:”The numerical computation of turbulent flows”.Computer methods in applied mechanics and engineering,3(2),pp.269-289.
Figure 2. AMI of two different methods with sliding mesh In the next step, the full car simulations with DDES and sliding mesh is studied, in order to study the influence of wheel parameters, based on the DoE plan, there are 25 configurations covering 15 parameters of a automo-tive wheel, as seen in Fig.3.
Figure 3. Fully Parametric Wheel based on DoE plan.

94
Computational Fluid Dynamics and Engineering
Introduction
The efficient mixing of fuel and oxidizer is essential in modern combustion engines. Especially in supersonic combustion the rapid mixing of fuel and oxidizer is of crucial importance as the detention time of the fuel-ox-idizer mixture in the combustion chamber is only a few milliseconds [1]. The shock-induced Richtmyer-Meshkov instability (RMI) promotes mixing and thus has the po-tential to increase the burning efficiency of supersonic combustion engines [2]. However, the shock wave, nec-essary to induce RMI, causes a second effect in a reactive
gas mixture. The compression and temperature increase over the shock front can ignite the gas mixture, followed by a subsonic deflagration or a supersonic detonation wave. The reaction wave in turn interacts with the RMI, which affects the flow field evolution und the mixing significantly.
Our LRZ project [3] is used for three-dimensional simu-lations of a reacting shock-bubble interaction (RSBI) to study the interaction between RMI and shock-induced reaction waves. A planar shock wave propagates through a gas bubble filled with a reactive gas mixture. The ba-
Three-dimensional reacting shock-bubble interaction
Research InstitutionInstitute of Aerodynamics and Fluid MechanicsPrincipal InvestigatorFelix DiegelmannResearchersNikolaus A. Adams, Stefan HickelProject PartnersTechnische Universität München
SuperMUC Project ID: pr45wa
3
Figure 1: Ignition and detonation wave propagation in a RSBI with a shock Mach number of Ma = 2.83. For two-dimensional plots: gray color scale shows the xenon mass fraction, red-yellow color scale the temperature with a cutoff at T = 1500 K. Black lines in (a) and (b) depict the initial shock wave, propagating from left to right. For three-dimensional plots: red isosurface depicts the temperature at cutoff level of T = 1500 K, gray isosurface illustrates the bubble shape (YXe = 0.1) [7].

95
Three-dimensional reacting shock-bubble interaction
roclinic vorticity generated at the interface causes the bubble to evolve into a vortex ring. Upon contact, the incident shock wave is partially reflected and partially transmitted. In our setup of a convergent geometry (a heavy gas bubble surrounded by a light ambient gas) the transmitted shock wave propagates at a lower velocity than the incident shock wave. Hence, the transmitted shock wave is deformed such that it is focused at the downstream pole of the bubble. Pressure and temper-ature increase at this shock focusing point, which is be sufficient to ignite the gas mixture.
Our setup contains a gas bubble filled with a stoichio-metric composition of Hydrogen (H2), Oxygen (O2) and Xenon, surrounded by pure Nitrogen. The H2-O2 reaction is highly pressure sensitive. Previous two-dimensional studies have already shown promising results by the var-iation of the initial pressure and the shock Mach number [4,5]. For the three-dimensional study we use a shock Mach number of Ma = 2.83 to trigger detonation. The in-fluence of the reaction wave on the mixing and the spa-tial evolution of the bubble is studied in detail.
Numerical Method
We use the parallelized numerical framework INCA [6] on the SuperMUC to solve the full set of compressible reacting multicomponent Navier-Stokes equations. The 2nd-order accurate Strang time splitting scheme is used to separate the stiff source term, containing the chemical reaction kinetics, from the Navier-Stokes equations, which results in a system of partial differential equations (PDE) and a system of stiff ordinary differential equations (ODE). The time integration for the PDE system is realized by the 3rd-order total variation diminishing Runge-Kutta scheme. The numerical fluxes at the cell faces are reconstructed from cell averages by the adaptive central-upwind 6th-or-der weighted essentially non-oscillatory (WENO-CU6) scheme. The 5th-order backward differentiation formula is applied to solve the stiff source term of the ODE, contain-ing the chemical reaction kinetics. A complex H2-O2 reac-tion mechanism with eight species and 19 intermediate reactions is chosen to provide accurate results.
The simulations are performed at a resolution of 140 points per radius (ppr) in the fine region of the grid, which amounts to a total number of 115 million cells. More than 10.000 cores consumed approximately 5 mil-lion CPUh for a single simulation.
Results and Methods
The ignition spot and the propagation of the reaction wave is shown in Fig. 1. Each set of isosurface and iso-contour plots contains a two-dimensional slice and a three-dimensional rendering of the RSBI. Figure 1 (a) shows the bubble shortly after ignition. The solid line represents the initial shock wave, propagating from left to right. The gas mixture is ignited directly behind the shock wave after a short induction time and propagates as a combustion ring through the bubble gas. At the ear-ly stage of combustion the reaction wave spreads radi-
ally in all spatial directions, see Fig. 1 (b). After approxi-mately 10 μs, the reaction wave has consumed most of the bubble gas and a toruslike region of burned gas is formed, which is outlined in Fig. 1 (c). The last set of iso-surface and isocontour plots in Fig. 1 (d) shows the RSBI at t = 100 μs. The H2-O2 mixture has been burned, shock reflections cause a complex temperature field inside the bubble and the roll-up with the formation of the main vortex ring is initiated. The propagation of the detona-tion wave towards the shock-focusing point and the sub-sequent blow out of bubble gas leads to a characteristic jellyfish-like structure of three-dimensional RSBI.
Additionally we observe that the main vortex ring be-comes unstable at late stages. Figure 2 shows the vortex ring at t = 600 μs, destabilized by azimuthal bending modes. Our observations are in very good agreement with the results of Klein et al. [8]. They also observed that their shocked sphere undergoes an azimuthal bending mode instability, which is analogous to the Widnall in-stability [9]. Furthermore a restriction for the growth of Widnall-type instabilities is observed by Hejazialhosseini et al. [10]. The Atwood numbers has to be larger than 0.2 to induce the azimuthal instability, which is fulfilled in our setup with an Atwood number of A = 0.476. The destabilized vortex ring significantly affects the mixing process at late stages of evolution.
References and Links
[1] Yang, J., Kubota, T., Zukoski, E., Applications of shock -induced mix-ing to supersonic combustion, AIAA J. 31 (1993) 854–862.
[2] Marble, F., Zukoski, E., Jacobs, J., Hendricks, G., Waitz, I., Shock enhance-ment and control of hypersonic mixing and combustion, Proceedings of AIAA 26th Joint Propulsion Conference, Orlando, 1990.
[3] https://www.lrz.de/projekte/hlrb-projects/0000000000F 43587.html
[4] Diegelmann, F., Tritschler, V. K., Hickel, S., Adams, N. A., On the pressure dependence of ignition and mixing in two-dimensional reactive shock-bubble interaction, Combustion and Flame 163 (1) (2016) 414–426.
[5] Diegelmann, F., V. K., Hickel, S., Adams, N. A., Shock Mach number influence on reactionwave types and mixing in reactive shock-bub-ble interaction. Combustion and Flame 174 (2016) 085–099.
[6] http://www.inca-cfd.com; http://www.aer.mw.tum.de[7] Diegelmann, F., Hickel, S., and Adams, N.A,. Three-dimensional reacting
shock-bubble interaction. Combus-tion and Flame, 181 (2017) 300–314.[8] Klein, R., Budil, K.S., Perry, T.S., Bach, D.R., The Interaction of Super-
nova Remnants with Interstellar Clouds: Experiments on the Nova Laser, Astrophys. J. 583 (2003) 245–259.
[9] Widnall, S.E., Bliss, D.B., Tsai, C.-Y., The instability of short waves on a vortex ring, J. Fluid Mech. 66 (1974) 35–47.
[10] Hejazialhosseini, B., Rossinelli, D., Koumoutsakos, P., Vortex dynam-ics in 3D shock-bubble interaction, Phys. Fluids 25 (2013) 110816.
Figure 2: Vortex ring with Widnall-type instability in the long-term evolution.
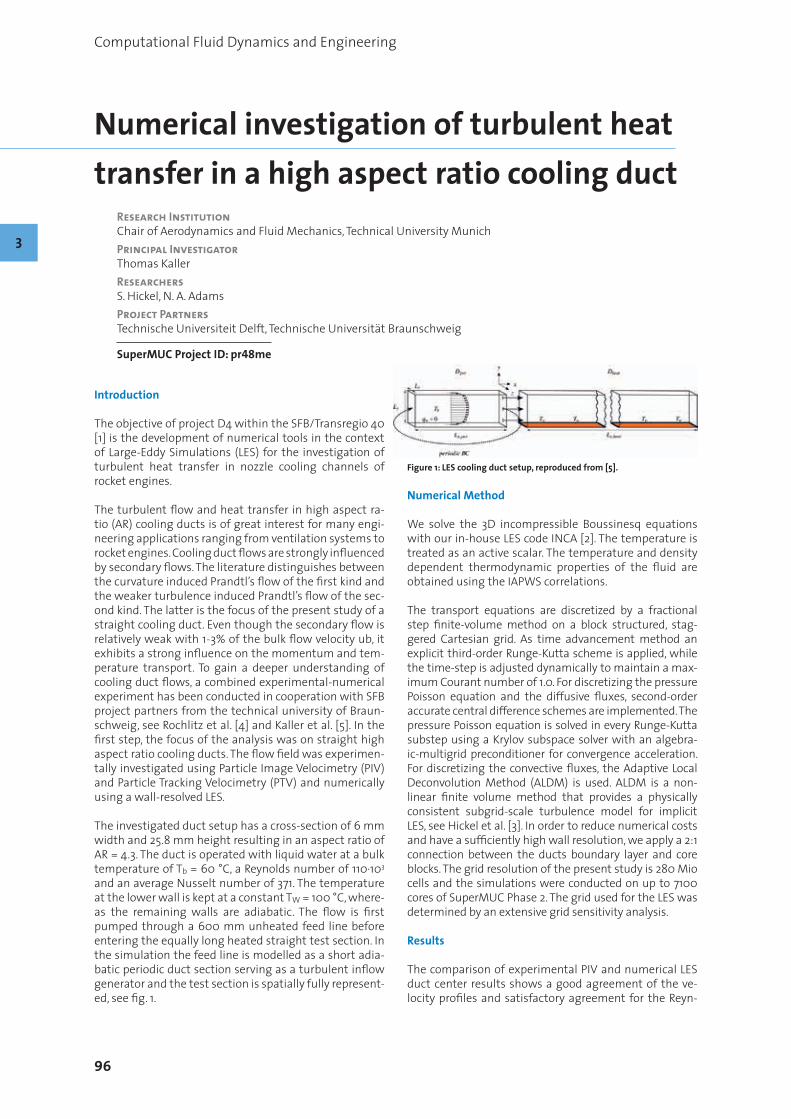
96
Computational Fluid Dynamics and Engineering
Introduction
The objective of project D4 within the SFB/Transregio 40 [1] is the development of numerical tools in the context of Large-Eddy Simulations (LES) for the investigation of turbulent heat transfer in nozzle cooling channels of rocket engines.
The turbulent flow and heat transfer in high aspect ra-tio (AR) cooling ducts is of great interest for many engi-neering applications ranging from ventilation systems to rocket engines. Cooling duct flows are strongly influenced by secondary flows. The literature distinguishes between the curvature induced Prandtl’s flow of the first kind and the weaker turbulence induced Prandtl’s flow of the sec-ond kind. The latter is the focus of the present study of a straight cooling duct. Even though the secondary flow is relatively weak with 1-3% of the bulk flow velocity ub, it exhibits a strong influence on the momentum and tem-perature transport. To gain a deeper understanding of cooling duct flows, a combined experimental-numerical experiment has been conducted in cooperation with SFB project partners from the technical university of Braun-schweig, see Rochlitz et al. [4] and Kaller et al. [5]. In the first step, the focus of the analysis was on straight high aspect ratio cooling ducts. The flow field was experimen-tally investigated using Particle Image Velocimetry (PIV) and Particle Tracking Velocimetry (PTV) and numerically using a wall-resolved LES.
The investigated duct setup has a cross-section of 6 mm width and 25.8 mm height resulting in an aspect ratio of AR = 4.3. The duct is operated with liquid water at a bulk temperature of Tb = 60 °C, a Reynolds number of 110∙103 and an average Nusselt number of 371. The temperature at the lower wall is kept at a constant TW = 100 °C, where-as the remaining walls are adiabatic. The flow is first pumped through a 600 mm unheated feed line before entering the equally long heated straight test section. In the simulation the feed line is modelled as a short adia-batic periodic duct section serving as a turbulent inflow generator and the test section is spatially fully represent-ed, see fig. 1.
Numerical Method
We solve the 3D incompressible Boussinesq equations with our in-house LES code INCA [2]. The temperature is treated as an active scalar. The temperature and density dependent thermodynamic properties of the fluid are obtained using the IAPWS correlations.
The transport equations are discretized by a fractional step finite-volume method on a block structured, stag-gered Cartesian grid. As time advancement method an explicit third-order Runge-Kutta scheme is applied, while the time-step is adjusted dynamically to maintain a max-imum Courant number of 1.0. For discretizing the pressure Poisson equation and the diffusive fluxes, second-order accurate central difference schemes are implemented. The pressure Poisson equation is solved in every Runge-Kutta substep using a Krylov subspace solver with an algebra-ic-multigrid preconditioner for convergence acceleration. For discretizing the convective fluxes, the Adaptive Local Deconvolution Method (ALDM) is used. ALDM is a non-linear finite volume method that provides a physically consistent subgrid-scale turbulence model for implicit LES, see Hickel et al. [3]. In order to reduce numerical costs and have a sufficiently high wall resolution, we apply a 2:1 connection between the ducts boundary layer and core blocks. The grid resolution of the present study is 280 Mio cells and the simulations were conducted on up to 7100 cores of SuperMUC Phase 2. The grid used for the LES was determined by an extensive grid sensitivity analysis.
Results
The comparison of experimental PIV and numerical LES duct center results shows a good agreement of the ve-locity profiles and satisfactory agreement for the Reyn-
Numerical investigation of turbulent heat transfer in a high aspect ratio cooling duct
Research InstitutionChair of Aerodynamics and Fluid Mechanics, Technical University MunichPrincipal InvestigatorThomas KallerResearchersS. Hickel, N. A. AdamsProject PartnersTechnische Universiteit Delft, Technische Universität Braunschweig
SuperMUC Project ID: pr48me
3
Figure 1: LES cooling duct setup, reproduced from [5].
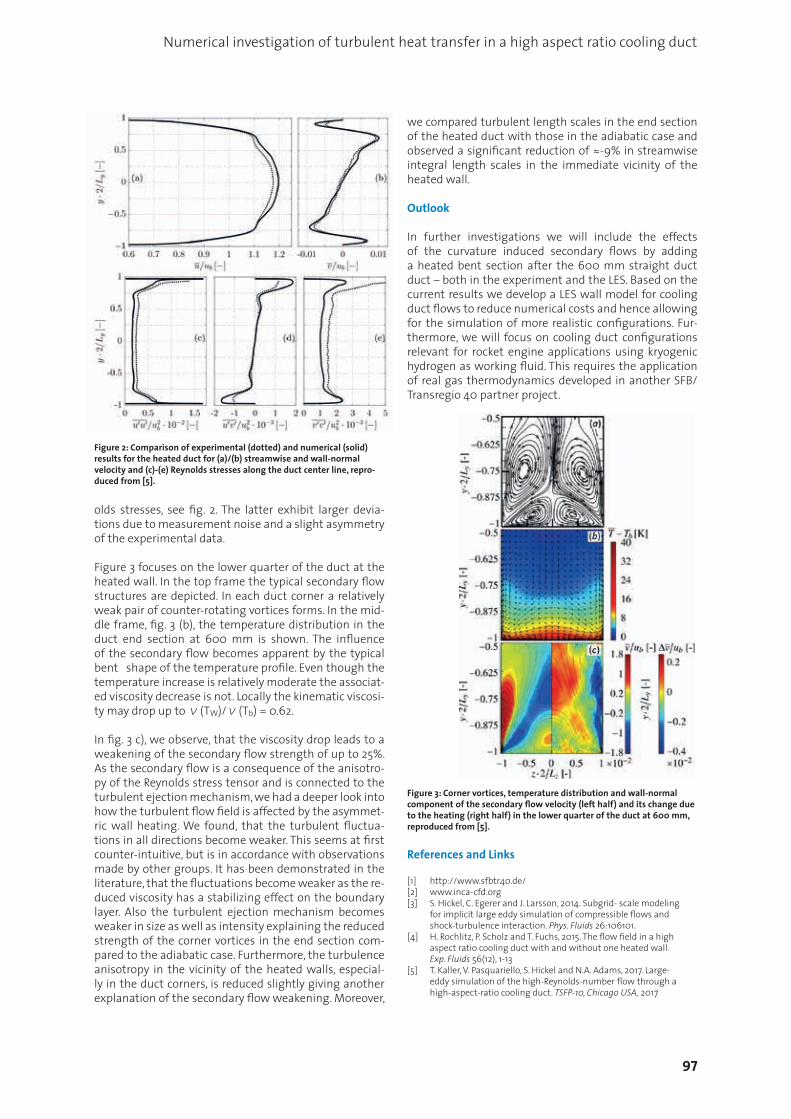
97
Numerical investigation of turbulent heat transfer in a high aspect ratio cooling duct
olds stresses, see fig. 2. The latter exhibit larger devia-tions due to measurement noise and a slight asymmetry of the experimental data.
Figure 3 focuses on the lower quarter of the duct at the heated wall. In the top frame the typical secondary flow structures are depicted. In each duct corner a relatively weak pair of counter-rotating vortices forms. In the mid-dle frame, fig. 3 (b), the temperature distribution in the duct end section at 600 mm is shown. The influence of the secondary flow becomes apparent by the typical bent shape of the temperature profile. Even though the temperature increase is relatively moderate the associat-ed viscosity decrease is not. Locally the kinematic viscosi-ty may drop up to ν(TW)/ν(Tb) = 0.62.
In fig. 3 c), we observe, that the viscosity drop leads to a weakening of the secondary flow strength of up to 25%. As the secondary flow is a consequence of the anisotro-py of the Reynolds stress tensor and is connected to the turbulent ejection mechanism, we had a deeper look into how the turbulent flow field is affected by the asymmet-ric wall heating. We found, that the turbulent fluctua-tions in all directions become weaker. This seems at first counter-intuitive, but is in accordance with observations made by other groups. It has been demonstrated in the literature, that the fluctuations become weaker as the re-duced viscosity has a stabilizing effect on the boundary layer. Also the turbulent ejection mechanism becomes weaker in size as well as intensity explaining the reduced strength of the corner vortices in the end section com-pared to the adiabatic case. Furthermore, the turbulence anisotropy in the vicinity of the heated walls, especial-ly in the duct corners, is reduced slightly giving another explanation of the secondary flow weakening. Moreover,
we compared turbulent length scales in the end section of the heated duct with those in the adiabatic case and observed a significant reduction of ≈-9% in streamwise integral length scales in the immediate vicinity of the heated wall.
Outlook
In further investigations we will include the effects of the curvature induced secondary flows by adding a heated bent section after the 600 mm straight duct duct – both in the experiment and the LES. Based on the current results we develop a LES wall model for cooling duct flows to reduce numerical costs and hence allowing for the simulation of more realistic configurations. Fur-thermore, we will focus on cooling duct configurations relevant for rocket engine applications using kryogenic hydrogen as working fluid. This requires the application of real gas thermodynamics developed in another SFB/Transregio 40 partner project.
References and Links
[1] http://www.sfbtr40.de/[2] www.inca-cfd.org[3] S. Hickel, C. Egerer and J. Larsson, 2014. Subgrid- scale modeling
for implicit large eddy simulation of compressible flows and shock-turbulence interaction. Phys. Fluids 26:106101.
[4] H. Rochlitz, P. Scholz and T. Fuchs, 2015. The flow field in a high aspect ratio cooling duct with and without one heated wall. Exp. Fluids 56(12), 1-13
[5] T. Kaller, V. Pasquariello, S. Hickel and N.A. Adams, 2017. Large- eddy simulation of the high-Reynolds-number flow through a high-aspect-ratio cooling duct. TSFP-10, Chicago USA, 2017
Figure 2: Comparison of experimental (dotted) and numerical (solid) results for the heated duct for (a)/(b) streamwise and wall-normal velocity and (c)-(e) Reynolds stresses along the duct center line, repro-duced from [5].
Figure 3: Corner vortices, temperature distribution and wall-normal component of the secondary flow velocity (left half) and its change due to the heating (right half) in the lower quarter of the duct at 600 mm, reproduced from [5].
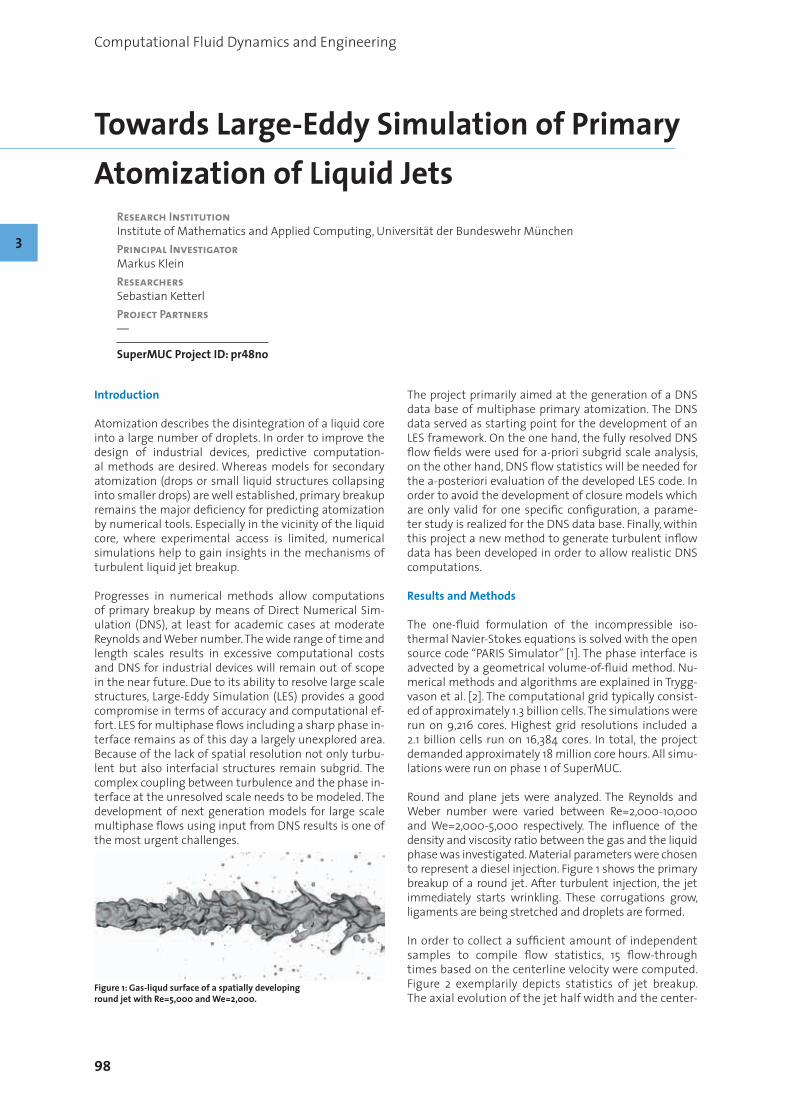
98
Computational Fluid Dynamics and Engineering
Introduction
Atomization describes the disintegration of a liquid core into a large number of droplets. In order to improve the design of industrial devices, predictive computation-al methods are desired. Whereas models for secondary atomization (drops or small liquid structures collapsing into smaller drops) are well established, primary breakup remains the major deficiency for predicting atomization by numerical tools. Especially in the vicinity of the liquid core, where experimental access is limited, numerical simulations help to gain insights in the mechanisms of turbulent liquid jet breakup.
Progresses in numerical methods allow computations of primary breakup by means of Direct Numerical Sim-ulation (DNS), at least for academic cases at moderate Reynolds and Weber number. The wide range of time and length scales results in excessive computational costs and DNS for industrial devices will remain out of scope in the near future. Due to its ability to resolve large scale structures, Large-Eddy Simulation (LES) provides a good compromise in terms of accuracy and computational ef-fort. LES for multiphase flows including a sharp phase in-terface remains as of this day a largely unexplored area. Because of the lack of spatial resolution not only turbu-lent but also interfacial structures remain subgrid. The complex coupling between turbulence and the phase in-terface at the unresolved scale needs to be modeled. The development of next generation models for large scale multiphase flows using input from DNS results is one of the most urgent challenges.
The project primarily aimed at the generation of a DNS data base of multiphase primary atomization. The DNS data served as starting point for the development of an LES framework. On the one hand, the fully resolved DNS flow fields were used for a-priori subgrid scale analysis, on the other hand, DNS flow statistics will be needed for the a-posteriori evaluation of the developed LES code. In order to avoid the development of closure models which are only valid for one specific configuration, a parame-ter study is realized for the DNS data base. Finally, within this project a new method to generate turbulent inflow data has been developed in order to allow realistic DNS computations.
Results and Methods
The one-fluid formulation of the incompressible iso-thermal Navier-Stokes equations is solved with the open source code “PARIS Simulator” [1]. The phase interface is advected by a geometrical volume-of-fluid method. Nu-merical methods and algorithms are explained in Trygg-vason et al. [2]. The computational grid typically consist-ed of approximately 1.3 billion cells. The simulations were run on 9,216 cores. Highest grid resolutions included a 2.1 billion cells run on 16,384 cores. In total, the project demanded approximately 18 million core hours. All simu-lations were run on phase 1 of SuperMUC.
Round and plane jets were analyzed. The Reynolds and Weber number were varied between Re=2,000-10,000 and We=2,000-5,000 respectively. The influence of the density and viscosity ratio between the gas and the liquid phase was investigated. Material parameters were chosen to represent a diesel injection. Figure 1 shows the primary breakup of a round jet. After turbulent injection, the jet immediately starts wrinkling. These corrugations grow, ligaments are being stretched and droplets are formed.
In order to collect a sufficient amount of independent samples to compile flow statistics, 15 flow-through times based on the centerline velocity were computed. Figure 2 exemplarily depicts statistics of jet breakup. The axial evolution of the jet half width and the center-
Towards Large-Eddy Simulation of Primary Atomization of Liquid Jets
Research InstitutionInstitute of Mathematics and Applied Computing, Universität der Bundeswehr MünchenPrincipal InvestigatorMarkus KleinResearchersSebastian KetterlProject Partners—
SuperMUC Project ID: pr48no
3
Figure 1: Gas-liqud surface of a spatially developinground jet with Re=5,000 and We=2,000.
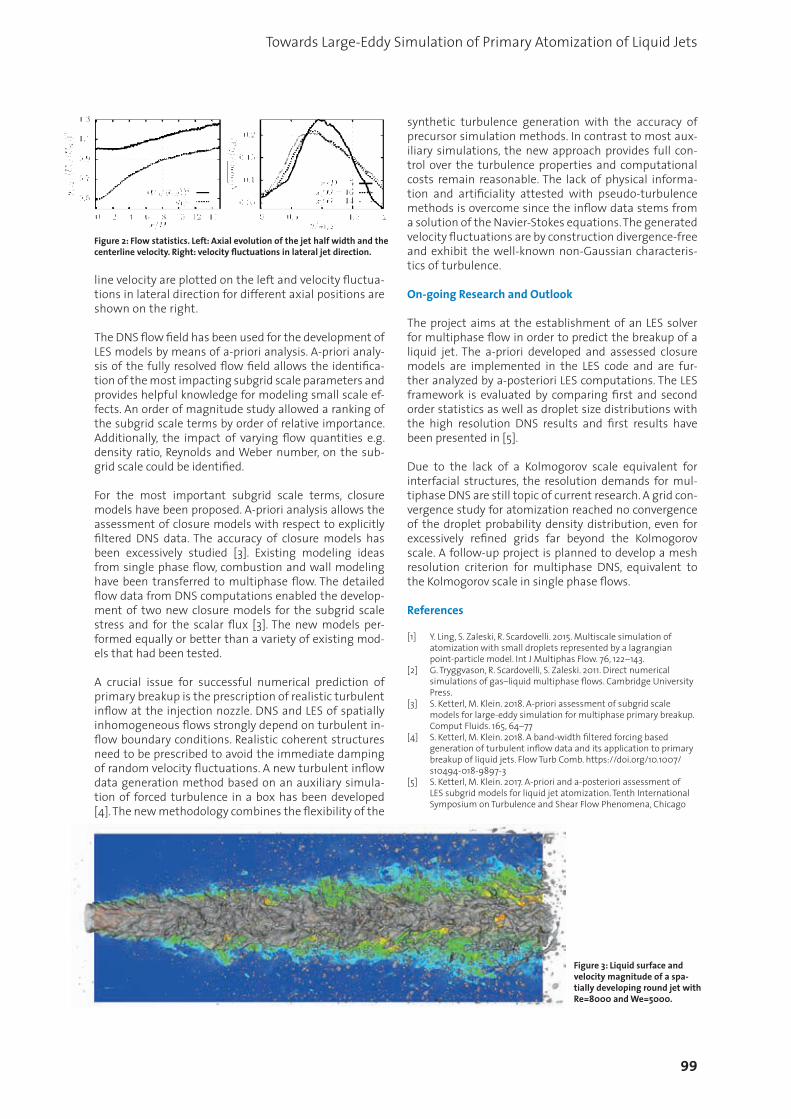
99
Towards Large-Eddy Simulation of Primary Atomization of Liquid Jets
line velocity are plotted on the left and velocity fluctua-tions in lateral direction for different axial positions are shown on the right.
The DNS flow field has been used for the development of LES models by means of a-priori analysis. A-priori analy-sis of the fully resolved flow field allows the identifica-tion of the most impacting subgrid scale parameters and provides helpful knowledge for modeling small scale ef-fects. An order of magnitude study allowed a ranking of the subgrid scale terms by order of relative importance. Additionally, the impact of varying flow quantities e.g. density ratio, Reynolds and Weber number, on the sub-grid scale could be identified.
For the most important subgrid scale terms, closure models have been proposed. A-priori analysis allows the assessment of closure models with respect to explicitly filtered DNS data. The accuracy of closure models has been excessively studied [3]. Existing modeling ideas from single phase flow, combustion and wall modeling have been transferred to multiphase flow. The detailed flow data from DNS computations enabled the develop-ment of two new closure models for the subgrid scale stress and for the scalar flux [3]. The new models per-formed equally or better than a variety of existing mod-els that had been tested.
A crucial issue for successful numerical prediction of primary breakup is the prescription of realistic turbulent inflow at the injection nozzle. DNS and LES of spatially inhomogeneous flows strongly depend on turbulent in-flow boundary conditions. Realistic coherent structures need to be prescribed to avoid the immediate damping of random velocity fluctuations. A new turbulent inflow data generation method based on an auxiliary simula-tion of forced turbulence in a box has been developed [4]. The new methodology combines the flexibility of the
synthetic turbulence generation with the accuracy of precursor simulation methods. In contrast to most aux-iliary simulations, the new approach provides full con-trol over the turbulence properties and computational costs remain reasonable. The lack of physical informa-tion and artificiality attested with pseudo-turbulence methods is overcome since the inflow data stems from a solution of the Navier-Stokes equations. The generated velocity fluctuations are by construction divergence-free and exhibit the well-known non-Gaussian characteris-tics of turbulence.
On-going Research and Outlook
The project aims at the establishment of an LES solver for multiphase flow in order to predict the breakup of a liquid jet. The a-priori developed and assessed closure models are implemented in the LES code and are fur-ther analyzed by a-posteriori LES computations. The LES framework is evaluated by comparing first and second order statistics as well as droplet size distributions with the high resolution DNS results and first results have been presented in [5].
Due to the lack of a Kolmogorov scale equivalent for interfacial structures, the resolution demands for mul-tiphase DNS are still topic of current research. A grid con-vergence study for atomization reached no convergence of the droplet probability density distribution, even for excessively refined grids far beyond the Kolmogorov scale. A follow-up project is planned to develop a mesh resolution criterion for multiphase DNS, equivalent to the Kolmogorov scale in single phase flows.
References
[1] Y. Ling, S. Zaleski, R. Scardovelli. 2015. Multiscale simulation of atomization with small droplets represented by a lagrangian point-particle model. Int J Multiphas Flow. 76, 122–143.
[2] G. Tryggvason, R. Scardovelli, S. Zaleski. 2011. Direct numerical simulations of gas–liquid multiphase flows. Cambridge University Press.
[3] S. Ketterl, M. Klein. 2018. A-priori assessment of subgrid scale models for large-eddy simulation for multiphase primary breakup. Comput Fluids. 165, 64–77
[4] S. Ketterl, M. Klein. 2018. A band-width filtered forcing based generation of turbulent inflow data and its application to primary breakup of liquid jets. Flow Turb Comb. https://doi.org/10.1007/s10494-018-9897-3
[5] S. Ketterl, M. Klein. 2017. A-priori and a-posteriori assessment of LES subgrid models for liquid jet atomization. Tenth International Symposium on Turbulence and Shear Flow Phenomena, Chicago
Figure 3: Liquid surface and velocity magnitude of a spa-tially developing round jet with Re=8000 and We=5000.
Figure 2: Flow statistics. Left: Axial evolution of the jet half width and the centerline velocity. Right: velocity fluctuations in lateral jet direction.
parameters and provides helpful knowledge for modelingsmall scale effects. An order of magnitude study allowed aranking of the subgrid scale terms by order of relativeimportance. Additionally, the impact of varying flowquantities e.g. density ratio, Reynolds and Weber number,on the subgrid scale could be identified. For the most important subgrid scale terms, closuremodels have been proposed. A-priori analysis allows theassessment of closure models with respect to explicitlyfiltered DNS data. The accuracy of closure models hasbeen excessively studied [3]. Existing modeling ideasfrom single phase flow, combustion and wall modelinghave been transferred to multiphase flow. The detailedflow data from DNS computations enabled thedevelopment of two new closure models for the subgridscale stress and for the scalar flux [3]. The new modelsperformed equally or better than a variety of existingmodels that had been tested. A crucial issue for successful numerical prediction ofprimary breakup is the prescription of realistic turbulentinflow at the injection nozzle. DNS and LES of spatiallyinhomogeneous flows strongly depend on turbulent inflowboundary conditions. Realistic coherent structures needto be prescribed to avoid the immediate damping ofrandom velocity fluctuations. A new turbulent inflow datageneration method based on an auxiliary simulation offorced turbulence in a box has been developed [4]. Thenew methodology combines the flexibility of the syntheticturbulence generation with the accuracy of precursorsimulation methods. In contrast to most auxiliarysimulations, the new approach provides full control overthe turbulence properties and computational costs remainreasonable. The lack of physical information and
artificiality attested with pseudo-turbulence methods isovercome since the inflow data stems from a solution ofthe Navier-Stokes equations. The generated velocityfluctuations are by construction divergence-free andexhibit the well-known non-Gaussian characteristics ofturbulence.
On-going Research and Outlook
The project aims at the establishment of an LES solver formultiphase flow in order to predict the breakup of a liquidjet. The a-priori developed and assessed closure modelsare implemented in the LES code and are furtheranalyzed by a-posteriori LES computations. The LESframework is evaluated by comparing first and secondorder statistics as well as droplet size distributions withthe high resolution DNS results and first results havebeen presented in [5]. Due to the lack of a Kolmogorov scale equivalent forinterfacial structures, the resolution demands formultiphase DNS are still topic of current research. A gridconvergence study for atomization reached noconvergence of the droplet probability density distribution,even for excessively refined grid far beyond theKolmogorov scale. A follow-up project is planned todevelop a mesh resolution criterion for multiphase DNS,equivalent to the Kolmogorov scale in single phase flows.
References
[1] Y. Ling, S. Zaleski, R. Scardovelli. 2015. Multiscale simulation of atomization with small droplets represented by a lagrangian point-particle model. Int J Multiphas Flow. 76, 122–143.
[2] G. Tryggvason, R. Scardovelli, S. Zaleski. 2011. Direct numerical simulations of gas–liquid multiphase flows. Cambridge University Press.
[3] S. Ketterl, M. Klein. 2018. A-priori assessment of subgrid scale models for large-eddy simulation for multiphase primary breakup. Comput Fluids. 165, 64–77
[4] S. Ketterl, M. Klein. 2018. A band-width filtered forcing based generation of turbulent inflow data and its application to primary breakup of liquid jets. Flow Turb Comb. https://doi.org/10.1007/s10494-018-9897-3
[5] S. Ketterl, M. Klein. 2017. A-priori and a-posteriori assessment of LES subgrid models for liquid jet atomization. Tenth International Symposium on Turbulence and Shear Flow Phenomena, Chicago
Figure 3: Liquid surface and velocity magnitude of a spatially developing round jet with Re=8000 and We=5000.
Figure 2: Flow statistics. Left: Axial evolution of the jet half width and the centerline velocity. Right: velocity fluctuations in lateral jet direction.

100
Computational Fluid Dynamics and Engineering
Introduction
Molecular modelling and simulation is an established method for describing and predicting thermodynamic properties of fluids. It is well suitable for investigating phenomena on small length and time scales; often, however, scale-bridging series of simulations are need-ed to facilitate a reliable extrapolation from the nano-scale to the respective technically relevant length and time scales. The supercomputing project SPARLAMPE (“Scalable, Performant And Resilient Large-scale Ap-plications of Molecular Process Engineering”) exam-ines interfacial properties of fluids, their contact with solid materials, interfacial fluctuations and finite-size effects, linear transport coefficients in the bulk and at interfaces and surfaces as well as transport processes near and far from equilibrium. These phenomena are investigated by massively-parallel molecular dynamics (MD) simulation, based on quantitatively reliable clas-sical-mechanical force fields. The simulation results are combined to obtain an understanding of the complex processes undergone by cutting liquids during machin-ing, in particular in the region of contact between the tool and the work piece.
With efficiently parallelized MD codes, scale-bridging simulation approaches for systems containing up to a trillion molecules have become feasible in recent years. Here, the program ls1 mardyn is used, i.e., an in-house code which is developed in collaboration with multiple academic partners [1], beside LAMMPS, which is external-ly developed free software.
Results and Methods
Nine publications have so far appeared on the basis of the computational resources allocated by LRZ within the SPARLAMPE supercomputing project. The representative results which are briefly illustrated here concern quanti-tatively accurate modelling of the vapour-liquid surface tension of real fluids [2], cf. Figure 1, wetting of struc-
tured surfaces [3], cf. Figure 2, and molecular simulation of the processes experienced by cutting liquids during nano-machining operations [4], cf. Figure 3.
The present MD simulations were carried out with ls1 mardyn [1-3] as well as LAMMPS [4]; the boundary con-ditions mainly correspond to the canonical ensemble, i.e., to constant N, V, and T. Concerning computational requirements, four major types of simulation runs exist:
(1) Test runs with small systems, or production runs for small single-phase systems; supercomputing resources were not needed for this purpose, except for very few test runs concerning the SuperMUC environment itself. Such simulations are always required to a limited extent.
(2) Scenarios where of the order of 30 to 300 simula-tions need to be carried out with different model pa-
Massively-parallel molecular dynamics simulation of fluids at interfaces
Research InstitutionLaboratory of Engineering Thermodynamics, Technische Universität KaiserslauternPrincipal InvestigatorMartin Thomas HorschResearchersStefan Becker, Debdip Bhandary, Edder García, Hans Hasse, Michaela Heier, Maximilian Kohns, Martin P. Lautenschlaeger, Steffen Seckler, Simon Stephan, Katrin Stöbener, Nikola Tchipev, Jadran Vrabec, Stephan WerthProject PartnersScientific Computing in Computer Science, Technische Universität München; Thermodynamics and Energy Technology, Universität Paderborn
SuperMUC Project ID: pr48te
3
Figure 1: Surface tension over temperature (as dimensionless reduced quantities) for the Mie-6 class of fluid models, which has three parame-ters. By systematic exploration of the parameter space, the behaviour of the whole model class can be captured and correlated [2]. On this basis, molecular models can be adjusted to bulk and interfacial properties of real fluids, e.g., by multicriteria optimization.
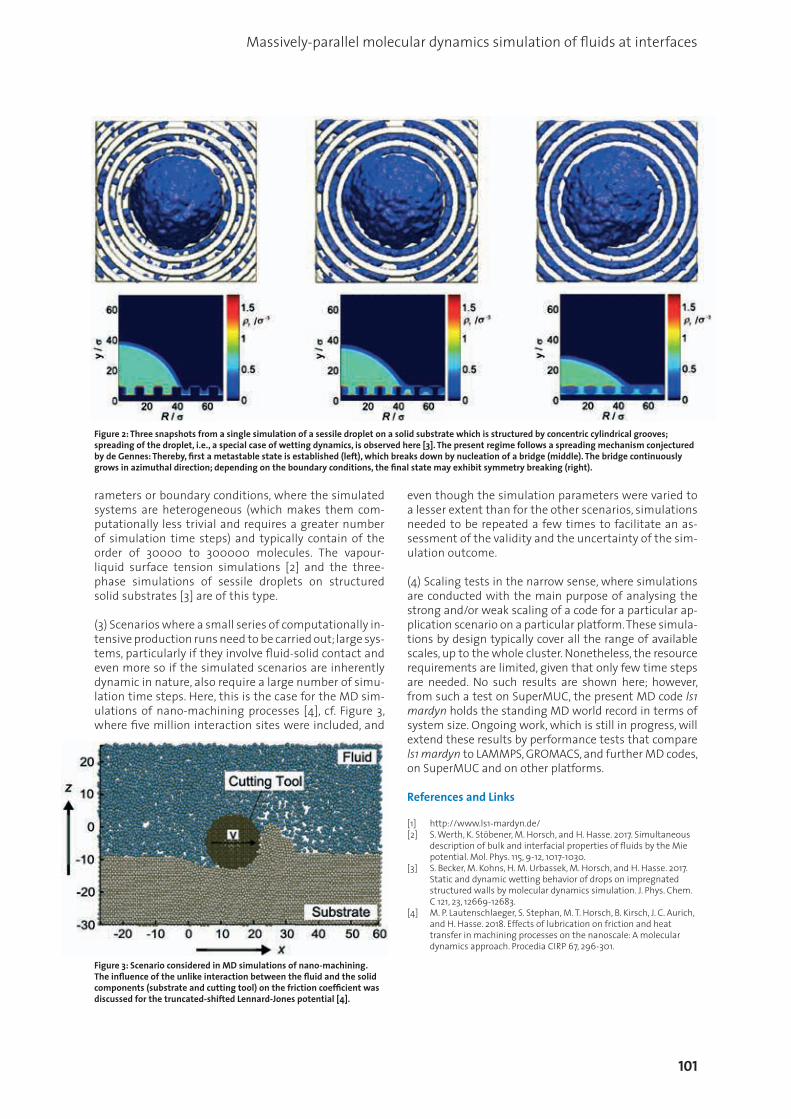
101
Massively-parallel molecular dynamics simulation of fluids at interfaces
rameters or boundary conditions, where the simulated systems are heterogeneous (which makes them com-putationally less trivial and requires a greater number of simulation time steps) and typically contain of the order of 30000 to 300000 molecules. The vapour- liquid surface tension simulations [2] and the three-phase simulations of sessile droplets on structured solid substrates [3] are of this type.
(3) Scenarios where a small series of computationally in-tensive production runs need to be carried out; large sys-tems, particularly if they involve fluid-solid contact and even more so if the simulated scenarios are inherently dynamic in nature, also require a large number of simu-lation time steps. Here, this is the case for the MD sim-ulations of nano-machining processes [4], cf. Figure 3, where five million interaction sites were included, and
even though the simulation parameters were varied to a lesser extent than for the other scenarios, simulations needed to be repeated a few times to facilitate an as-sessment of the validity and the uncertainty of the sim-ulation outcome.
(4) Scaling tests in the narrow sense, where simulations are conducted with the main purpose of analysing the strong and/or weak scaling of a code for a particular ap-plication scenario on a particular platform. These simula-tions by design typically cover all the range of available scales, up to the whole cluster. Nonetheless, the resource requirements are limited, given that only few time steps are needed. No such results are shown here; however, from such a test on SuperMUC, the present MD code ls1 mardyn holds the standing MD world record in terms of system size. Ongoing work, which is still in progress, will extend these results by performance tests that compare ls1 mardyn to LAMMPS, GROMACS, and further MD codes, on SuperMUC and on other platforms.
References and Links
[1] http://www.ls1-mardyn.de/[2] S. Werth, K. Stöbener, M. Horsch, and H. Hasse. 2017. Simultaneous
description of bulk and interfacial properties of fluids by the Mie potential. Mol. Phys. 115, 9-12, 1017-1030.
[3] S. Becker, M. Kohns, H. M. Urbassek, M. Horsch, and H. Hasse. 2017. Static and dynamic wetting behavior of drops on impregnated structured walls by molecular dynamics simulation. J. Phys. Chem. C 121, 23, 12669-12683.
[4] M. P. Lautenschlaeger, S. Stephan, M. T. Horsch, B. Kirsch, J. C. Aurich, and H. Hasse. 2018. Effects of lubrication on friction and heat transfer in machining processes on the nanoscale: A molecular dynamics approach. Procedia CIRP 67, 296-301.
Figure 2: Three snapshots from a single simulation of a sessile droplet on a solid substrate which is structured by concentric cylindrical grooves; spreading of the droplet, i.e., a special case of wetting dynamics, is observed here [3]. The present regime follows a spreading mechanism conjectured by de Gennes: Thereby, first a metastable state is established (left), which breaks down by nucleation of a bridge (middle). The bridge continuously grows in azimuthal direction; depending on the boundary conditions, the final state may exhibit symmetry breaking (right).
Figure 3: Scenario considered in MD simulations of nano-machining. The influence of the unlike interaction between the fluid and the solid components (substrate and cutting tool) on the friction coefficient was discussed for the truncated-shifted Lennard-Jones potential [4].
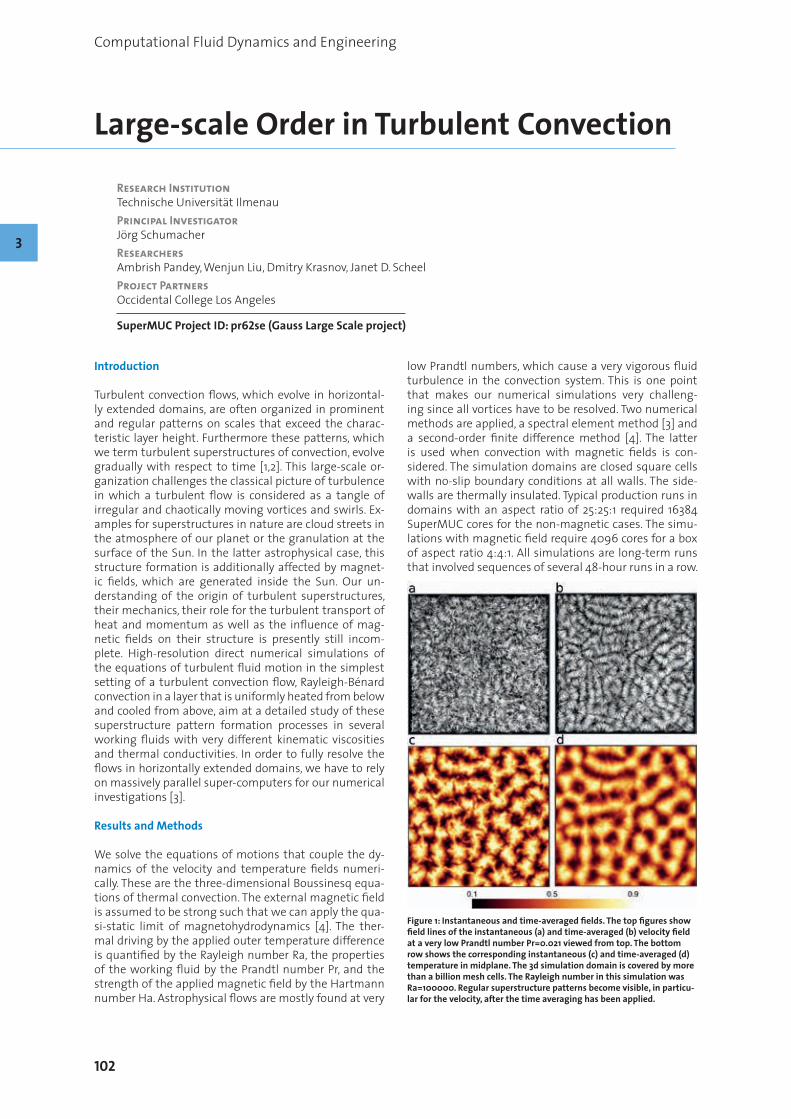
102
Computational Fluid Dynamics and Engineering
Introduction
Turbulent convection flows, which evolve in horizontal-ly extended domains, are often organized in prominent and regular patterns on scales that exceed the charac-teristic layer height. Furthermore these patterns, which we term turbulent superstructures of convection, evolve gradually with respect to time [1,2]. This large-scale or-ganization challenges the classical picture of turbulence in which a turbulent flow is considered as a tangle of irregular and chaotically moving vortices and swirls. Ex-amples for superstructures in nature are cloud streets in the atmosphere of our planet or the granulation at the surface of the Sun. In the latter astrophysical case, this structure formation is additionally affected by magnet-ic fields, which are generated inside the Sun. Our un-derstanding of the origin of turbulent superstructures, their mechanics, their role for the turbulent transport of heat and momentum as well as the influence of mag-netic fields on their structure is presently still incom-plete. High-resolution direct numerical simulations of the equations of turbulent fluid motion in the simplest setting of a turbulent convection flow, Rayleigh-Bénard convection in a layer that is uniformly heated from below and cooled from above, aim at a detailed study of these superstructure pattern formation processes in several working fluids with very different kinematic viscosities and thermal conductivities. In order to fully resolve the flows in horizontally extended domains, we have to rely on massively parallel super-computers for our numerical investigations [3]. Results and Methods
We solve the equations of motions that couple the dy-namics of the velocity and temperature fields numeri-cally. These are the three-dimensional Boussinesq equa-tions of thermal convection. The external magnetic field is assumed to be strong such that we can apply the qua-si-static limit of magnetohydrodynamics [4]. The ther-mal driving by the applied outer temperature difference is quantified by the Rayleigh number Ra, the properties of the working fluid by the Prandtl number Pr, and the strength of the applied magnetic field by the Hartmann number Ha. Astrophysical flows are mostly found at very
low Prandtl numbers, which cause a very vigorous fluid turbulence in the convection system. This is one point that makes our numerical simulations very challeng-ing since all vortices have to be resolved. Two numerical methods are applied, a spectral element method [3] and a second-order finite difference method [4]. The latter is used when convection with magnetic fields is con-sidered. The simulation domains are closed square cells with no-slip boundary conditions at all walls. The side-walls are thermally insulated. Typical production runs in domains with an aspect ratio of 25:25:1 required 16384 SuperMUC cores for the non-magnetic cases. The simu-lations with magnetic field require 4096 cores for a box of aspect ratio 4:4:1. All simulations are long-term runs that involved sequences of several 48-hour runs in a row.
Large-scale Order in Turbulent Convection
Research InstitutionTechnische Universität IlmenauPrincipal InvestigatorJörg SchumacherResearchersAmbrish Pandey, Wenjun Liu, Dmitry Krasnov, Janet D. ScheelProject PartnersOccidental College Los Angeles
SuperMUC Project ID: pr62se (Gauss Large Scale project)
3
Figure 1: Instantaneous and time-averaged fields. The top figures show field lines of the instantaneous (a) and time-averaged (b) velocity field at a very low Prandtl number Pr=0.021 viewed from top. The bottom row shows the corresponding instantaneous (c) and time-averaged (d) temperature in midplane. The 3d simulation domain is covered by more than a billion mesh cells. The Rayleigh number in this simulation was Ra=100000. Regular superstructure patterns become visible, in particu-lar for the velocity, after the time averaging has been applied.
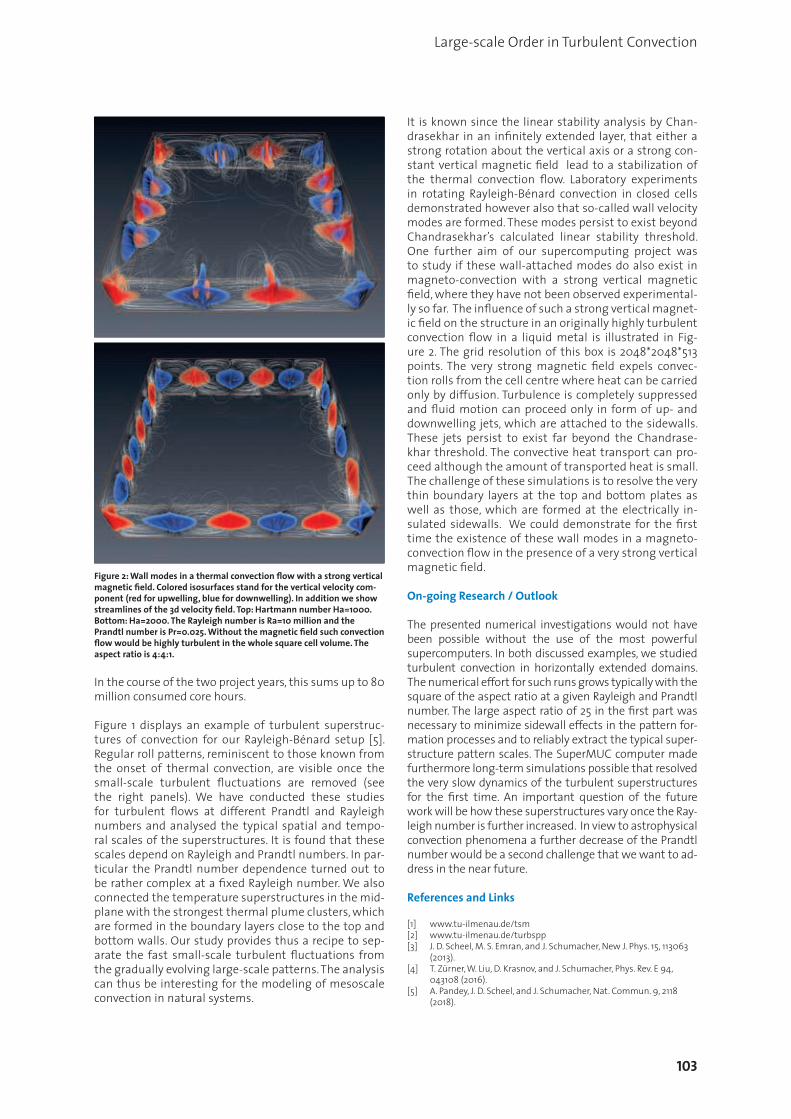
103
Large-scale Order in Turbulent Convection
In the course of the two project years, this sums up to 80 million consumed core hours.
Figure 1 displays an example of turbulent superstruc-tures of convection for our Rayleigh-Bénard setup [5]. Regular roll patterns, reminiscent to those known from the onset of thermal convection, are visible once the small-scale turbulent fluctuations are removed (see the right panels). We have conducted these studies for turbulent flows at different Prandtl and Rayleigh numbers and analysed the typical spatial and tempo-ral scales of the superstructures. It is found that these scales depend on Rayleigh and Prandtl numbers. In par-ticular the Prandtl number dependence turned out to be rather complex at a fixed Rayleigh number. We also connected the temperature superstructures in the mid-plane with the strongest thermal plume clusters, which are formed in the boundary layers close to the top and bottom walls. Our study provides thus a recipe to sep-arate the fast small-scale turbulent fluctuations from the gradually evolving large-scale patterns. The analysis can thus be interesting for the modeling of mesoscale convection in natural systems.
It is known since the linear stability analysis by Chan-drasekhar in an infinitely extended layer, that either a strong rotation about the vertical axis or a strong con-stant vertical magnetic field lead to a stabilization of the thermal convection flow. Laboratory experiments in rotating Rayleigh-Bénard convection in closed cells demonstrated however also that so-called wall velocity modes are formed. These modes persist to exist beyond Chandrasekhar’s calculated linear stability threshold. One further aim of our supercomputing project was to study if these wall-attached modes do also exist in magneto-convection with a strong vertical magnetic field, where they have not been observed experimental-ly so far. The influence of such a strong vertical magnet-ic field on the structure in an originally highly turbulent convection flow in a liquid metal is illustrated in Fig-ure 2. The grid resolution of this box is 2048*2048*513 points. The very strong magnetic field expels convec-tion rolls from the cell centre where heat can be carried only by diffusion. Turbulence is completely suppressed and fluid motion can proceed only in form of up- and downwelling jets, which are attached to the sidewalls. These jets persist to exist far beyond the Chandrase-khar threshold. The convective heat transport can pro-ceed although the amount of transported heat is small. The challenge of these simulations is to resolve the very thin boundary layers at the top and bottom plates as well as those, which are formed at the electrically in-sulated sidewalls. We could demonstrate for the first time the existence of these wall modes in a magneto-convection flow in the presence of a very strong vertical magnetic field.
On-going Research / Outlook
The presented numerical investigations would not have been possible without the use of the most powerful supercomputers. In both discussed examples, we studied turbulent convection in horizontally extended domains. The numerical effort for such runs grows typically with the square of the aspect ratio at a given Rayleigh and Prandtl number. The large aspect ratio of 25 in the first part was necessary to minimize sidewall effects in the pattern for-mation processes and to reliably extract the typical super-structure pattern scales. The SuperMUC computer made furthermore long-term simulations possible that resolved the very slow dynamics of the turbulent superstructures for the first time. An important question of the future work will be how these superstructures vary once the Ray-leigh number is further increased. In view to astrophysical convection phenomena a further decrease of the Prandtl number would be a second challenge that we want to ad-dress in the near future.
References and Links
[1] www.tu-ilmenau.de/tsm[2] www.tu-ilmenau.de/turbspp[3] J. D. Scheel, M. S. Emran, and J. Schumacher, New J. Phys. 15, 113063
(2013). [4] T. Zürner, W. Liu, D. Krasnov, and J. Schumacher, Phys. Rev. E 94,
043108 (2016).[5] A. Pandey, J. D. Scheel, and J. Schumacher, Nat. Commun. 9, 2118
(2018).
Figure 2: Wall modes in a thermal convection flow with a strong vertical magnetic field. Colored isosurfaces stand for the vertical velocity com-ponent (red for upwelling, blue for downwelling). In addition we show streamlines of the 3d velocity field. Top: Hartmann number Ha=1000. Bottom: Ha=2000. The Rayleigh number is Ra=10 million and the Prandtl number is Pr=0.025. Without the magnetic field such convection flow would be highly turbulent in the whole square cell volume. The aspect ratio is 4:4:1.

104
Computational Fluid Dynamics and Engineering
Introduction
Space-transportation and launcher systems enable ac-cess to space and are therefore the gateway to earth and planetary explorations. These systems are powered by chemical propulsion systems as this type of propulsion is an excellent compromise between cost and efficiency. Non-military launcher systems are based on liquid-pro-pellant technologies and have high demands in terms of reliability and environmental compatibility which still require further development. In particular, the extreme thermal and mechanical loads of liquid rocket engines (LREs) call for intensive fundamental research as a basis for radically improved and innovative technical solutions. At the Institute for Thermodynamics at the Bundeswehr University Munich we are investigating the combus-tion chamber of LREs by means of numerics within the framework of the SFB TRR 40 [1]. More precise, we are conducting large-eddy simulations (LESs) to investigate the mixing of the propellants, the subsequent combus-tion and the thermal load acting onto the components of the combustion chamber. Such simulations are chal-lenging as the flow is highly compressible, turbulent and three-dimensional. Furthermore, very steep gradients, e.g. in the density (see Fig. 1), are present having to be properly resolved by the mesh and handled by the solver.
Methods
For the LESs a pressure-based version of the C++ toolbox OpenFOAM [2] is used with in-house modifications con-cerning the thermophysical and combustion modeling. The algorithm solves the conservation equations in a segregated manner based on the Pressure-Implicit with Splitting of Operators approach.
Typically, LREs are operated at supercritical pressure with respect to the pure components value and at least one of the propellants is injected at cryogenic temperatures. Therefore, real-gas effects, i.e. the fluid properties are de-pendent on both pressure and temperature, are a prom-inent feature and the widely used ideal gas assumption is not valid. The real-gas effects are taken into account
by applying a framework based on the cubic equation of state. For the modeling of the combustion process dif-ferent approaches are applied ranging from detailed and expensive ones like transported PDF methods to cheaper and more common approaches like tabulated combus-tion models. In the flamelet concept the turbulent flame is represented of thin, laminar and locally one-dimen-sional flame structures.
The size of our meshes is ranging from one million up to two hundred million cells depending on the domain size and the required spatial resolution. In Fig. 2 an exemplary mesh for the investigation of a single element injector is shown. For our simulations we are typically applying 400
LES of Rocket Combustion Applications Under Real-Gas Conditions
Research InstitutionInstitute for Thermodynamics, Bundeswehr University MunichPrincipal InvestigatorMichael PfitznerResearchersJulian Zips, Hagen Müller, Christoph TraxingerProject PartnersChair of Aerodynamics and Fluid Mechanics, TU Munich
SuperMUC Project ID: pr63ze
3
Figure 1: Snapshot of the density gradient [3].
Figure 2: Typical mesh for single-injector simulations.

LES of Rocket Combustion Applications Under Real-Gas Conditions
to 5.000 CPU-cores resulting in CPU-expenses between 20.000 to 500.000 CPU-hours per simulation. In one year we are using approximately 25 million CPU-hours on SuperMUC to do our most expensive simulations. The typical storage usage is approximately 50 TB.
Results
The final research goal of our project is the simulation of multi-injector combustion chambers at LRE-conditions. To do so, several milestones have been reached during the past years, for which the provided computing power of SuperMUC was a key-factor.
Inert, single-phase injection Strong density stratifications are a main characteristic of the injection process at rocket-relevant conditions. The injected cryogenic fluid undergoes a pseudoboiling pro-cess where it transits from a liquid-like (low temperature, high density) to a gas-like (high temperature, low densi-ty) state. Due to the density stratification, the instability growth is delayed, see Fig. 1, and turbulent kinetic energy is redistributed from the radial to the axial flow direction. In multi-component injection cases, real-gas effects can lead to an endothermic mixing resulting in a sub-cooling of the mixture in the turbulent mixing layer, see Fig. 3.
Combustion The injection of fuel and oxidizer into the combustion chamber of LREs is done through a coaxial injector and therefore non-premixed approaches are used to model the combustion process. Usually, the oxidizer is inject-ed at cryogenic temperatures (liquid-like state) leading to strong real-gas effects. The length and extent of the
liquid-like, stable oxidizer-core is crucial for the flame’s structure, extension and form. Typically, the flames in LREs are thin and robust against stretching. In Fig. 4 the structure of a methane-oxygen flame is shown.
Inert, multi-phase injection In multi-component mixtures the mixture critical pres-sure can by far exceed the value of the pure components forming the mixture. Therefore, phase separation is pos-sible to occur although the individual pure components have been injected in a single-phase state. Recently, our thermodynamic framework was extended in order to consider multi-component phase separation, see [4]. In Fig. 5 the comparison of simulations with experiments for a spray-like jet is shown.
On-going Research / Outlook
Recently, we started with the simulation and investiga-tion of multi-injector combustion chambers, see [5]. In addition, the investigation of phase separation effects will be continued and extended with respect to mode-ling and injection conditions. As these simulations re-quire a lot of computing power, we are planning to use SuperMUC further on. Without the CPU-hours provided by SuperMUC we would not be able to reach our goals successfully.
References and Links
[1] www.sfbtr40.de [2] www.openfoam.org [3] H. Müller, C. A. Niedermeier, J. Matheis, M. Pfitzner, and S. Hickel.
2016. Large-eddy simulation of nitrogen injection at trans-and supercritical conditions. Physics of Fluids 28, 1 (2016), 015102–1–015102–28.
[4] C. Traxinger, M. Banholzer, and M. Pfitzner. 2018. Real-Gas Effects and Phase Separation in Underexpanded Jets at Engine-Relevant Conditions. In 56th AIAA Aerospace Sciences Meeting.
[5] J. Zips, H. Müller, M. Pfitzner, J. Hardi, and M. Oschwald. 2017. Large-eddy simulation of multi-element LOx/H2 combustion at transcritical conditions. In Proceedings of the 2017 EUCASS in Milan.
Figure 3: Snapshot of the temperature field in a multi-component, real-gas coaxial-jet.
Figure 4: Methane-oxygen flame forming downstream of a coaxial-in-jector at rocket-relevant conditions.
Figure 5: Multi-component phase separation during the injection of n-hexane into nitrogen. Upper frame: Experiments conducted by the ITLR (University of Stuttgart); Lower frame: LES result OpenFOAM.
y=D
[-]y=
D [-]
x=D [-]
x=D [-]
0 20 40 60 80
0 20 40 60 80
Experiment
Simulation

106
Computational Fluid Dynamics and Engineering
Introduction
In today’s industrialized world, energy requirements have constantly increased over recent decades, and they will possibly still do so in the foreseeable future. Although the amount of renewable energies will have increased by more than 150% by the year 2050, according to the International Energy Outlook 2017, fossil fuels such as petroleum, coal and natural gas are still market-dom-inating. Therefore, the importance of combustion is ob-vious, and will possibly be unchallenged even after the year 2050. However, the conversion of chemical energy to thermal energy by combusting fossil fuels has adverse effects and novel concepts are required for future com-bustion devices. While admission procedures are often interminable for new devices and are still largely based on laboratory experiments, such developments could be achieved faster and at lower costs if accurate, robust, and truly predictive computational design tools were availa-ble. However, reacting flows are one of the most difficult flow scenarios, since many highly complex physical pro-cesses are involved which have to be coupled nonlinearly to accurately describe the behavior of the overall system. Furthermore, chemical reacting flows are multi-scale problems, meaning that a fully coupled description in-volves various time and length scales, which additionally stresses a numerical treatment.
A promising approach for the modeling of turbulent non-premixed combustion are flamelet models. They are based on the assumption that chemical reactions are fast and occur in thin confined layers around the reac-tion zone. If the characteristic length scale of these layers is smaller than that of the surrounding turbulent eddies, turbulence is unable to penetrate the reaction zone and the flame is assumed to be embedded in a quasi-lam-inar flow field. This view of turbulent flame structures allows the complex chemical structures of the flame to be decoupled from the flow dynamics. This decoupling of scales constitutes an important advantage of flame-let models compared to other combustion models, as it allows for a pre-tabulation of thermo-chemical states based on a small number of independent parameters.
One of these quantities and at the same time a central quantity in the modeling of non-premixed combustion is the mixture fraction which is used to determine the mixed- ness of the initially unmixed fuel and oxidizer streams.
However, depending on the physics, the choice of these parameters is not obvious and different flamelet mod-eling strategies have been proposed in the past, e.g. ac-counting for differential diffusion of the chemical species and curvature effects [1]. Furthermore, the decoupling of scales introduces an additional closure problem for the flamelet equations since effects of the surrounding flow field have to be considered in order to accurately describe the physics.
Parts of this SuperMUC project focused on the analy-sis of dissipation elements, a recent concept of Wang and Peters [2], which might promote novel insights into flamelet-based modeling strategies.
Results and Methods
Within this project all analyses were based on direct nu-merical simulations (DNS) which were conducted with the DNS code DINO [3]. The solver is designed for the simulation of low-Mach number reactive flows, where spatial derivatives in the governing equations are discre-
Dissipation element analysis of turbulent non-premixed flames
Research InstitutionSimulation of reactive Thermo-Fluid Systems, TU DarmstadtPrincipal InvestigatorChristian HasseResearchersFelix Dietzsch, Michael Gauding, Sebastian Popp, Arne ScholtissekProject PartnersISUT, Otto von Guericke University, Magdeburg (Dominique Thévenin)
SuperMUC Project ID: pr74li
3
Figure 1: Strong and weak scaling of the semi-implicit Runge-Kutta solver implemented in DINO [5] for two different cases.
102 103 104 105
100
101
102
Nproc
strong
scaling
[s]
strong
ideal
weak
60
70
80
90
100
110
120
130
140
weak
scaling
[%]

Dissipation element analysis of turbulent non-premixed flames
tized with 6th order finite differences. The temporal inte-gration is done by a 3rd order semi-implicit Runge-Kutta scheme. Based on the distributed memory architecture of SuperMUC parallelization of the solver is achieved by the message passing interface (MPI), where an excellent scalability up to 65536 cores is achieved, see Figure 1.
A working copy of DINO can be obtained on request by contacting the group of Prof. Thévenin at the Otto von Guericke University Magdeburg.
DNS of a non-premixed jet flameThe setup used for the simulation is based on a tempo-rally evolving jet configuration which was originally pro-posed by Hawkes et al. [4]. The simulations were carried out on an isotropic mesh with a grid spacing of 14 μm and required nearly 3 billion grid points. A single run con-sumed 2 MCPUh on 23904 cores and generated roughly 10 TB of raw data. To give an example of the turbulent nature of the jet, figure 2 shows isocontours of the scalar dissipation rate,χ=2DZ ∇Z·∇Z, normalized by,χq, where DZ is the diffusion coefficient of the mixture fractionZ.
Dissipation element analysesBased on the highly resolved DNS the mixture fraction field is decomposed into small subunits called “dissipa-tion elements”.
The essence of the theory of Wang and Peters [4] is to trace gradient trajectories along the ascending and de-scending gradient until a local extremal point is reached. The ensemble of all trajectories that end at the same lo-cal extremal points form a dissipation element, eventually leading to a geometrical decomposition of the mixture fraction field. A schematic of this procedure is shown in figure 3 and a visual representation of two dissipation ele-ments in three dimensional space is given in figure 4.
Based on this geometrical decomposition, a parametri-zation solely based on the endpoints was introduced [5]. Apart from this parametrization, a regime classification based on the stoichiometric mixture fraction is proposed which distinguishes between: (i) a fuel rich regime, (ii) a stoichiometric regime and (iii) a fuel lean regime. This classification in conjunction with the two-point character of dissipation elements allows conclusions to be drawn about the connectivity of different regions of the jet, e.g. the connection between the reaction zone and the turbu-lent core. Based on these regimes, dissipation elements are classified according to the location of their endpoints and various statistics related to the endpoints are computed.
On-going Research / Outlook
The analysis of turbulent reactive flows by means of dis-sipation elements complements the on-the-fly analysis, conducted in an earlier SuperMUC project (pr83xa), by providing a statistical characterization of flamelet-re-lated parameters. This statistical analysis in turn could be used to develop possible closure strategies for the extended flamelet equations [1] by providing further in-sights into the topology of the mixture fraction field.
References
Figure 2: Logarithm of the normalized scalar dissipation rate. The scalar dissipation rate is proportional to the gradient of the mixture fraction
Figure 3: Schematic of the mixture fraction field including two hypo-thetical trajectories (orange) originating from an initial point to their respective minimum and maximum points. The green solid lines corre-spond to dissipation elements, enclosing all trajectories that end at the same minimum and maximum point.
Figure 4: Illustration of two connected dissipation elements. The red plus and the green minus represent local maximum and minimum points, respectively. Reprint from Ref. [3], with permission from Elsevier.
gradient trajectory(flamelet)
S
S
S
S
S
S
MaximumInitial point
MinimumSaddle point
dissipationelement
[1] Arne Scholtissek, Felix Dietzsch, Michael Gauding and Christian Hasse. 2017. Combust. Flame 175, 243-258.
[2] L. Wang and N. Peters. 2006. J. Fluid Mech. 554, 457–475.[3] Abouelmagd Abdelsamie, Gordon Fru, Timo Oster, Felix Dietzsch, Gábor Janiga
and Dominique Thévenin. 2016. Comput. Fluids 131, 123-141.[4] Evatt R. Hawkes, Ramanan Sankaran, James C. Sutherland and Jacqueline H.
Chen. 2007. Proc. Combust. Inst. 31, 1633-1640.[5] Michael Gauding, Felix Dietzsch, Jens Henrik Goebbert, Dominique Thévenin,
Abouelmagd Abdelsamie and Christian Hasse. 2017. Phys. Fluids 29.

108
Computational Fluid Dynamics and Engineering
Introduction
A tremendous variety of physical phenomena involve turbulence, such as bird and airplane flight, propulsion of fish and boats, sailing, and even galaxy formation. Computational fluid dynamics uses numerical methods and algorithms to analyze such turbulent flows. Turbu-lent flow is characterized by chaotic swirling movements that vary widely in size, from sub-millimeters, over the extent of storm clouds, to phenomena on a galactic scale. The interaction of the chaotic movements on dif-ferent scales makes it very challenging to simulate and understand the underlying geometric structures within turbulent flows. At the same time understanding these fundamental patterns is crucial for industry to optimize a wide range of applications.
Turbulent thermal convection is a class of turbulent flows in which temperature differences drive the flow. Prime examples are convection in the atmosphere, the thermo-cline circulation in the oceans, heating and ventilation in buildings, or in industrial processes. The model system for turbulent thermal convection is Rayleigh-Bénard flow in which a layer of fluid is heated from below and cooled from above. The temperature difference between the two plates leads to the formation of a large-scale flow pattern in which hot fluid moves up on one side, while cold fluid moves down on the other side of the cell, see figure 1. The beauty of the Rayleigh-Bénard system is that it is mathe-matically very well defined. This feature allows direct com-parison of simulation results with theory, and one-to-one comparison with state of the art laboratory experiments. As a result, for more than a century, Rayleigh-Bénard con-vection has been the perfect playground to develop novel experimental and simulation techniques in fluid dynam-ics that enable a better understanding of underlying tur-bulent flow structures [2,3].
Results and Methods
According to the classical view on turbulence, strong turbulent fluctuations should ensure that the effect of
the system geometry on the turbulent flow structures is minimal in highly turbulent flows as the entire phase space is explored statistically This view justifies the use of small aspect ratio, i.e. small horizontal length com-pared to its height, domains when studying very tur-bulent flows. This massively reduces the experimental or simulation cost to reach the high Rayleigh number, which indicates the dimensionless temperature differ-ence between the bottom and top plate, regime rele-vant for industrial applications and astrophysical and geophysical phenomena. Therefore, in a quest to study Rayleigh-Bénard convection at ever increasing Rayleigh, most experiments and simulations have focused on small aspect ratio cells in which the horizontal domain size is small compared to its height. This approach has resulted in major developments in our understanding of heat transfer in turbulent flows.
Superstructures in turbulent thermal convection
Research InstitutionMax Planck Institute for Dynamics and Self-Organization, Gottingen, GermanyPrincipal InvestigatorDetlef Lohse, Richard StevensResearchersRichard Stevens, Alexander Blass, Xiaojue Zhu, Roberto Verzicco, Detlef LohseProject PartnersMax Planck Center Twente for Complex Fluid Dynamics and Physics of Fluids Group, University of Twente, The Netherlands
SuperMUC Project ID: pr74sa (Gauss Large Scale project)
3
Figure 1: Three-dimensional visualization of Rayleigh-Bénard convection in a small periodic domain revealing the large-scale flow organization of a region with warm upwelling fluid represented in red and cold down- going fluid in blue.

Superstructures in turbulent thermal convection
However, while heat transfer in industrial applications occurs in confined systems, many natural instances of convection take place in horizontally extended systems. Previous experiments and simulations at relatively low Rayleigh have shown that large scale horizontal flow patterns can emerge. Until now it was unclear what hap-pens at very high Rayleigh when the flow in the bulk of the domain becomes fully turbulent. Motivated by major advances in computational capabilities of supercomput-ers like SuperMUC, we set out to perform unprecedented simulations for very large aspect ratio Rayleigh-Bénard convection at high Rayleigh.
In order to achieve this, we performed large-scale simula-tions of turbulent thermal convection using an in-house developed second order finite difference flow solver. Our code is written in Fortran 90 and large-scale paralleliza-tion is obtained using a two-dimensional domain decom-position, which is implemented using Message Passing Interface (MPI). On SuperMUC we performed simulations on grids with up to 60x109 computational nodes using up to 16 thousand computational cores. A snapshot of the entire flow field requires up to 1.7 terabytes, while the en-tire database we generated is over 1 petabyte. The gener-ated database allows us to perform advanced flow field analysis unlocking detailed flow characteristics. This has, for example, allowed us to analyze the analogies and differences in the energy-containing flow structures found in pressure and thermally driven wall-bounded flows. In order to achieve this, we performed many sim-ulations for which long term averaging was required to obtain the required statistical convergence. As a result, the simulations in this project required over a hundred million computational hours. The developed code has been made available to the fluid dynamics community at www.afid.eu and can also be used to simulate other canonical flow problems such as channel, Taylor Couette, and plane Couette flow [4].
Our simulation campaign [5] reveals that, in contrast to views from classical theories, turbulent thermal super-structures survive in fully turbulent flows, see figure 2. It turns out that these thermal superstructures have a profound influence on the heat transfer. An intriguing, and still unexplained, result is that the heat transfer be-
comes independent of the system size before the flow structures become independent of the system geometry. Explaining this intriguing phenomenon will require fur-ther research. We hope that the discovery of these ther-mal superstructures will allow us to gain better insight into the mechanism that drives large scale flow organi-zation in astrophysical and geophysical systems such as cloud formation in the Earth’s atmosphere.
On-going Research / Outlook
SuperMUC allowed us to perform unprecedented simu-lations of turbulent thermal convection. Computer sim-ulations of such turbulent flows are notoriously compu-tationally demanding due to the large range of length and time scales that needs to be resolved. Therefore, such groundbreaking simulations can only be performed on the largest supercomputers in the world, such as Super-MUC. In addition, our simulations were only made pos-sible due to algorithmic developments aimed at limiting the communication between different computational tasks. This improved the computational efficiency of our code and ensures good parallel efficiency on a large num-ber of processors. Long term storage and data accessibility are assured by using the open source HDF5 data format.
Even with the massive computational and storage facil-ities offered by SuperMUC, it is still impossible to con-sider all physically relevant flow problems. For instance, a question of crucial importance is what happens at even stronger thermal forcing than can be simulated currently. For strong enough thermal forcing, one name-ly expects an ultimate state of thermal convection. It is conjectured that this ultimate regime is triggered when the boundary layers close to the plate become turbulent. Simulating ultimate thermal convection will require im-mense computational resources and will only become possible using a new generation of supercomputers like SuperMUC-NG.
References and Links
[1] Group website: pof.tnw.utwente.nl; Project details:
Figure 2: Snapshots of the temper-ature field in a horizontal domain that is 64 times as long as the do-main height. The columns from left to right show successive zooms of the area indicated in the black box. The lower panels show the flow structure close to the bottom plate where small hot thermal plumes carry away the heat, while the upper panels reveal the large-scale flow patterns formed in the center of the domain.
stilton.tnw.utwente.nl/people/stevensr/research_superstruc.html; Computational code: www.afid.eu;
[2] Ahlers, Grossmann, Lohse, Rev. Mod. Phys. 81, 503 (2009). [3] R.J.A.M. Stevens, R. Verzicco, D. Lohse, J. Fluid Mech. 643, 495-507 (2010).[4] E.P. van der Poel, R. Ostilla-Mónico, J. Donners, R. Verzicco,
Computers & Fluids 116, 10 (2015). [5] R.J.A.M. Stevens, A. Blass, X. Zhu, R. Verzicco, D. Lohse, Physical Review
Fluids 3, 041501(R) (2018).
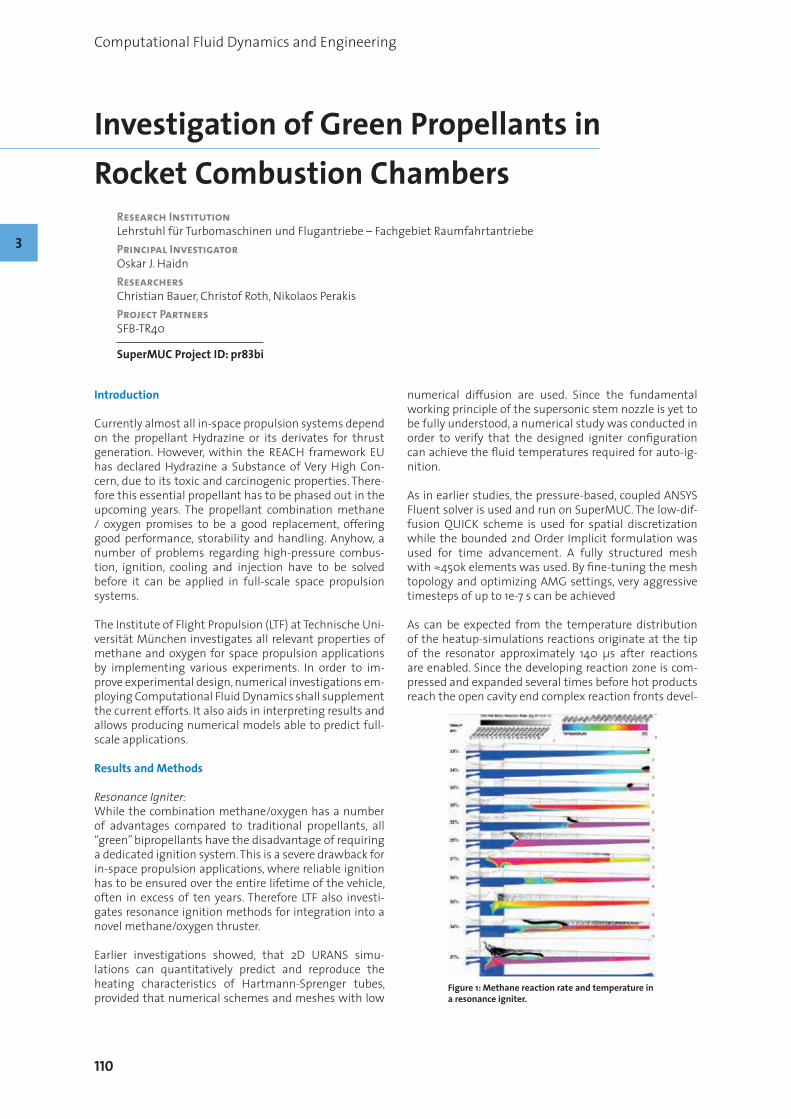
110
Computational Fluid Dynamics and Engineering
Introduction
Currently almost all in-space propulsion systems depend on the propellant Hydrazine or its derivates for thrust generation. However, within the REACH framework EU has declared Hydrazine a Substance of Very High Con-cern, due to its toxic and carcinogenic properties. There-fore this essential propellant has to be phased out in the upcoming years. The propellant combination methane / oxygen promises to be a good replacement, offering good performance, storability and handling. Anyhow, a number of problems regarding high-pressure combus-tion, ignition, cooling and injection have to be solved before it can be applied in full-scale space propulsion systems.
The Institute of Flight Propulsion (LTF) at Technische Uni-versität München investigates all relevant properties of methane and oxygen for space propulsion applications by implementing various experiments. In order to im-prove experimental design, numerical investigations em-ploying Computational Fluid Dynamics shall supplement the current efforts. It also aids in interpreting results and allows producing numerical models able to predict full-scale applications.
Results and Methods
Resonance Igniter:While the combination methane/oxygen has a number of advantages compared to traditional propellants, all “green” bipropellants have the disadvantage of requiring a dedicated ignition system. This is a severe drawback for in-space propulsion applications, where reliable ignition has to be ensured over the entire lifetime of the vehicle, often in excess of ten years. Therefore LTF also investi-gates resonance ignition methods for integration into a novel methane/oxygen thruster.
Earlier investigations showed, that 2D URANS simu-lations can quantitatively predict and reproduce the heating characteristics of Hartmann-Sprenger tubes, provided that numerical schemes and meshes with low
numerical diffusion are used. Since the fundamental working principle of the supersonic stem nozzle is yet to be fully understood, a numerical study was conducted in order to verify that the designed igniter configuration can achieve the fluid temperatures required for auto-ig-nition.
As in earlier studies, the pressure-based, coupled ANSYS Fluent solver is used and run on SuperMUC. The low-dif-fusion QUICK scheme is used for spatial discretization while the bounded 2nd Order Implicit formulation was used for time advancement. A fully structured mesh with ≈450k elements was used. By fine-tuning the mesh topology and optimizing AMG settings, very aggressive timesteps of up to 1e-7 s can be achieved
As can be expected from the temperature distribution of the heatup-simulations reactions originate at the tip of the resonator approximately 140 μs after reactions are enabled. Since the developing reaction zone is com-pressed and expanded several times before hot products reach the open cavity end complex reaction fronts devel-
Investigation of Green Propellants in Rocket Combustion Chambers
Research InstitutionLehrstuhl für Turbomaschinen und Flugantriebe – Fachgebiet RaumfahrtantriebePrincipal InvestigatorOskar J. HaidnResearchersChristian Bauer, Christof Roth, Nikolaos PerakisProject PartnersSFB-TR40
SuperMUC Project ID: pr83bi
3
Figure 1: Methane reaction rate and temperature in a resonance igniter.

111
Investigation of Green Propellants in Rocket Combustion Chambers
op. More in-depth analysis is required for quantitatively validating the simulation, but the obtained results sug-gest that the novel igniter design is suitable for igniting methane/oxygen mixtures at the specified conditions.
Rocket Combustor InvestigationsA main focus of the research has been the investigation of the methane rocket combustor test case 1 of the Trans-regio SFB-TR40 [2]. The research aims to improve the nu-merical prediction of rocket performance parameters as well as the prediction of the heat transfer through the combustor wall. In order to get reliable predictions from simulations, the physical processes, such as fluid flow and combustion, must be modeled accurately and the simulation model must be validated.
Investigations of the aspects of turbulence and chem-istry modeling have been conducted for the test case configuration [4]. In a combined effort including other research groups a comparison of different overall models with experimental data has been made. The results show clear differences in the prediction of the different tools and with the test data as shown in Figure 2.
The research on the modeling of the combustion pro-cesses in the high pressure combustor is on-going.
Currently research is conducted on tabulated chemistry models. These models allow the thermochemistry cal-culations to be done in a preprocessing step. They are therefore in general less computational expensive and combustion is simplified to a mixing problem. Standard models implemented in commercial solvers are often not sufficient for the complex physics in a rocket combustor and must be extended. An interface has been developed to read user defined tables into the commercial solver ANSYS Fluent and was tested on the SuperMUC. Chem-istry Table generation strategies are currently still under development and the validity of the physical assumption going into the chemistry models must still be tested.
A special focus is on the recombination processes in the thermal boundary layer due to the enthalpy defect near the cooled combustor walls. Investigations are made into different propellant combination as comparison. For hy-drogen, where in the past the assumption of chemical
equilibrium has provided good results, the assumption is tested and the influence of reaction kinetics is investi-gated. A comparison with methane as fuel is conducted to see if the assumption holds true or must be dropped due to the larger chemical time scale.
The tabulated chemistry model has been also applied to a multi-element chamber operated with gaseous methane and oxygen within the framework of the 2017 Transregio summer program. The chamber with 7 coaxial injector elements is illustrated in Figure 3. The configura-tion used for the simulated experiment consists of four water cooled chamber segments and a nozzle segment. Using a calorimetric method, the average heat flux in each of the segments can be calculated in the experi-ment. For the purposes of the Summer Program, a test case at 20 bar and O/F of 2.6 was chosen. The results of the tabulated chemistry approach showed a very good agreement with the experimental measurements of heat flux and pressure.
On-going Research / Outlook
The use of the HPC resources provided by SuperMUC al-lowed for the investigation of the considered configura-tions using a multitude of simulations to conduct paramet-ric studies, helping to determine the main processes driving the design parameters looked for from the simulation. It also allowed for the simulation of more complex combus-tor configurations which aim to be scalable to flight hard-ware and therefore are a good basis for tool validation.
Within this project the feasibility of resonance ignition methods for gaseous oxygen and methane at ambient temperatures could be demonstrated. However, in actual applications both methane and oxygen are stored at cry-ogenic conditions around 100 K. How the implemented igniters behave under these more challenging operating conditions has yet to be evaluated. Additionally, the in-teraction between igniter and rocket combustion cham-ber still has to be investigated. Since a delayed or failed ignition can easily destroy a rocket engine and lead to a complete loss of the mission, the transient engine start-up is of particular interest. In future projects it is there-fore planned to conduct coupled simulations of both combustion chamber and igniter, in order to evaluate the effect of these interactions.
References and Links
Figure 2: Predicted temperature fields in the test case combustor.
Figure 3: Temperature field in the thrust chamber.
[1] http://www.sfbtr40.de/index.php?id=home[2] O. Haidn, O. Knab, M. Celano, C. Kirchberger und S. G., „Transregio SFB-
TR40 - Test Case 1, Tech. Rep. 6,“ TUM, Lehrstuhl für Flugantriebe, 2015.[3] A. Chemnitz et al. „Numerical Investigation of Flow and Combustion in
a Single-Element GCH4/GOX Rocket Combustor: Aspects of Turbulence Modeling,“ in 52nd AIAA/SAE/ASEE Joint Propulsion Conference, 2016.

112
Computational Fluid Dynamics and Engineering
Introduction
Turbulent flow seeded with solid particles is encoun-tered in a number of natural and man-made systems, as diverse as the earth’s atmosphere, rivers, the human respiratory tract, chemical engineering devices, etc. From a technological point of view it is often important to be able to understand and describe the dynamics of such particulate flow systems with sufficient accuracy and at reasonable cost. However, some physical effects occurring when the fluid and the solid phase inter-act strongly have so far obstinately resisted analytical and experimental approaches. Three such phenomena bearing fundamental open questions shall be named in the following: (i) the spatial distribution of the dis-persed phase (i.e. the tendency of particles to accumu-late under some circumstances); (ii) the enhancement or attenuation of the turbulent fluid flow when adding even small amounts of particles; (iii) the modification of the particle settling velocity when sedimentation takes place in a turbulent background flow. All of these effects have far-reaching consequences in various prac-tical applications, e.g. in cloud physics, where the colli-sion rate of rain drops is strongly and non-trivially af-fected by turbulence.
The current project is an extension of a previous large-scale Gauss project in which we performed high fideli-ty simulations of particles in homogeneous isotropic turbulence. Those simulations provided unprecedented results on particle-turbulence interactions and it was
then necessary to open our study to a new set of param-eters to extract as much informations as possible from the generated data [3,4]. Here we test the influence of particle time scale as well as the intensity of turbulence relative to settling of the particles. This allows us to get more insight into interaction mechanisms involved and brings us a step closer to more general and practically relevant configurations.
Results and Methods
The current project has two parts. First, we are consider-ing the interaction between heavy particles and forced homogeneous-isotropic turbulence in the absence of gravity. Here we have considered three new cases D5-R6, D11-R6, and D11-R12 (cf. table 1). These cases are iden-tical to former cases D5 and D11 of reference [4], except that the particle-to-fluid density ratio was increased by a factor of 4 and 8 (in the latter case). In the second part of the project, we are continuing the simulation of set-tling particles with background turbulence for longer times, in order to reach a proper statistically stationary case and in order to sample a sufficiently long time in-terval. Two cases have been considered with different relative turbulence intensity (measuring 0.2 and 0.3 in cases R120-G178 and R140-G180, respectively, cf. Table 1), in order to gauge its effect upon the disruption (or not) of columnar particle clusters. Moreover, case R120-G178 starts with a clustered initial condition (taken from [2]), while R140-G180 has initially randomly distributed particles.
Fully-resolved, finite-size particles in statistically stationary, homogeneous turbulence
Research InstitutionInstitute for Hydromechanics (IfH), Karlsruhe Institute of TechnolgyPrincipal InvestigatorMarkus UhlmannResearchersAgathe ChouippeProject Partners—
SuperMUC Project ID: pr83la (Gauss Large Scale project)
3
Case Grid # particles Re Ga D/η D/Δx nprocD5-R6 20483 20026 120 0 5.5 16 4096D11-R6 20483 2504 140 0 11 32 4096D11-R12 20483 2504 140 0 11 32 4096R120-G178 20482x4096 11867 95 178 7 24 8192R140-G180 20482x4096 11868 140 180 9 24 8192
Table 1: Parameters of the simulations. “Re” refers to the Taylor micro-scale Reynolds number in the absence of particles, “Ga” is the Galileo number, “D/η” is the ratio between the particle diameter and the Kolmogorov scale, “D/Δx” is the number of grid points per particle diameter, and “nproc” is the number of processor cores used for the respective simulation.
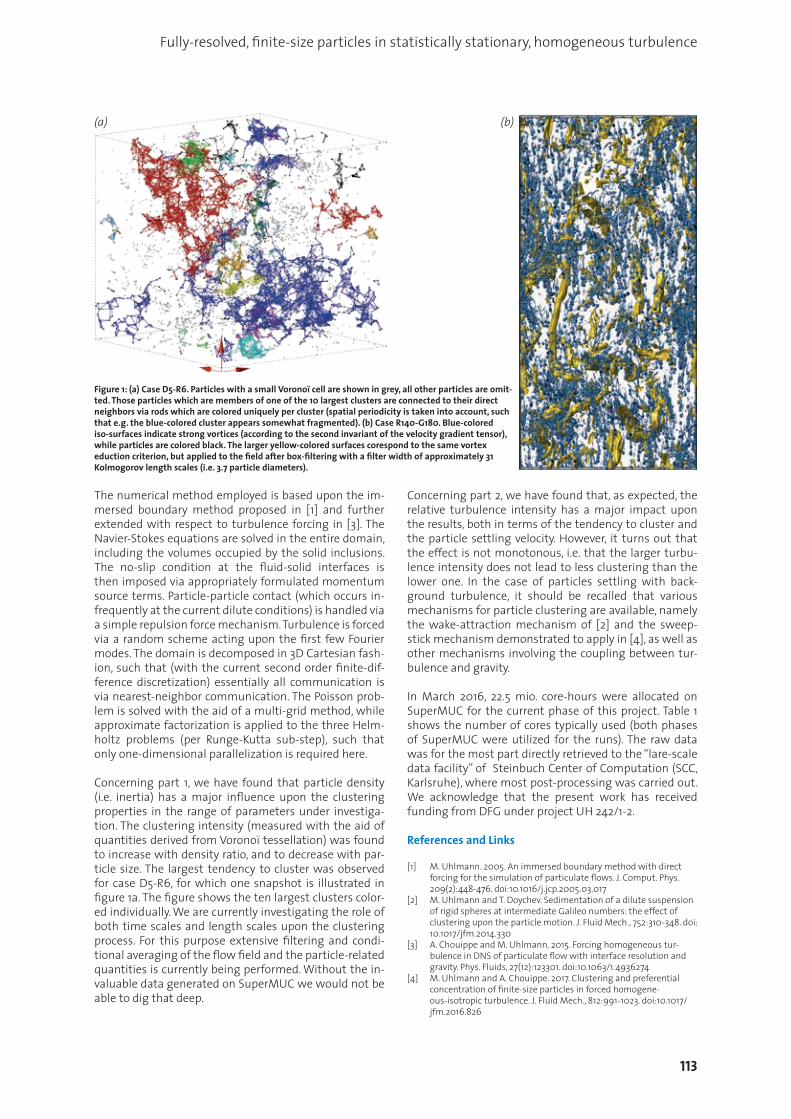
113
Fully-resolved, finite-size particles in statistically stationary, homogeneous turbulence
The numerical method employed is based upon the im-mersed boundary method proposed in [1] and further extended with respect to turbulence forcing in [3]. The Navier-Stokes equations are solved in the entire domain, including the volumes occupied by the solid inclusions. The no-slip condition at the fluid-solid interfaces is then imposed via appropriately formulated momentum source terms. Particle-particle contact (which occurs in-frequently at the current dilute conditions) is handled via a simple repulsion force mechanism. Turbulence is forced via a random scheme acting upon the first few Fourier modes. The domain is decomposed in 3D Cartesian fash-ion, such that (with the current second order finite-dif-ference discretization) essentially all communication is via nearest-neighbor communication. The Poisson prob-lem is solved with the aid of a multi-grid method, while approximate factorization is applied to the three Helm-holtz problems (per Runge-Kutta sub-step), such that only one-dimensional parallelization is required here. Concerning part 1, we have found that particle density (i.e. inertia) has a major influence upon the clustering properties in the range of parameters under investiga-tion. The clustering intensity (measured with the aid of quantities derived from Voronoï tessellation) was found to increase with density ratio, and to decrease with par-ticle size. The largest tendency to cluster was observed for case D5-R6, for which one snapshot is illustrated in figure 1a. The figure shows the ten largest clusters color-ed individually. We are currently investigating the role of both time scales and length scales upon the clustering process. For this purpose extensive filtering and condi-tional averaging of the flow field and the particle-related quantities is currently being performed. Without the in-valuable data generated on SuperMUC we would not be able to dig that deep.
Concerning part 2, we have found that, as expected, the relative turbulence intensity has a major impact upon the results, both in terms of the tendency to cluster and the particle settling velocity. However, it turns out that the effect is not monotonous, i.e. that the larger turbu-lence intensity does not lead to less clustering than the lower one. In the case of particles settling with back-ground turbulence, it should be recalled that various mechanisms for particle clustering are available, namely the wake-attraction mechanism of [2] and the sweep-stick mechanism demonstrated to apply in [4], as well as other mechanisms involving the coupling between tur-bulence and gravity.
In March 2016, 22.5 mio. core-hours were allocated on SuperMUC for the current phase of this project. Table 1 shows the number of cores typically used (both phases of SuperMUC were utilized for the runs). The raw data was for the most part directly retrieved to the “lare-scale data facility” of Steinbuch Center of Computation (SCC, Karlsruhe), where most post-processing was carried out. We acknowledge that the present work has received funding from DFG under project UH 242/1-2.
References and Links
[1] M. Uhlmann. 2005. An immersed boundary method with direct forcing for the simulation of particulate flows. J. Comput. Phys. 209(2):448-476. doi:10.1016/j.jcp.2005.03.017
[2] M. Uhlmann and T. Doychev. Sedimentation of a dilute suspension of rigid spheres at intermediate Galileo numbers: the effect of clustering upon the particle motion. J. Fluid Mech., 752:310-348. doi: 10.1017/jfm.2014.330
[3] A. Chouippe and M. Uhlmann. 2015. Forcing homogeneous tur-bulence in DNS of particulate flow with interface resolution and gravity. Phys. Fluids, 27(12):123301. doi:10.1063/1.4936274
[4] M. Uhlmann and A. Chouippe. 2017. Clustering and preferential concentration of finite-size particles in forced homogene-ous-isotropic turbulence. J. Fluid Mech., 812:991-1023. doi:10.1017/jfm.2016.826
Figure 1: (a) Case D5-R6. Particles with a small Voronoï cell are shown in grey, all other particles are omit-ted. Those particles which are members of one of the 10 largest clusters are connected to their direct neighbors via rods which are colored uniquely per cluster (spatial periodicity is taken into account, such that e.g. the blue-colored cluster appears somewhat fragmented). (b) Case R140-G180. Blue-colored iso-surfaces indicate strong vortices (according to the second invariant of the velocity gradient tensor), while particles are colored black. The larger yellow-colored surfaces corespond to the same vortex eduction criterion, but applied to the field after box-filtering with a filter width of approximately 31 Kolmogorov length scales (i.e. 3.7 particle diameters).
(a) (b)

114
Computational Fluid Dynamics and Engineering
Introduction
Incompressible flows in the turbulent regime are of fundamental significance for engineering and bio-medical applications. In comparison to the classical Reynolds-averaged Navier-Stokes approach, where all turbulent motions are modeled, the explicit resolution of vortical structures enables much higher levels of ac-curacy. Eddy-resolving simulation approaches demand for extremely high spatial and temporal resolution. Therefore, efficient numerical methods and models en-abling short simulation times while retaining the high fidelity of fully resolved simulation methodologies are essential.
The aim of our project is threefold:• Develop highly efficient numerical methods for ex-
treme-scale simulations• Apply the resulting algorithms and computer soft-
ware to compute benchmark flows, providing highly accurate reference results
• Devise and analyze numerical models which drasti-cally reduce the required resolution in industrial ap-plications
At the Institute for Computational Mechanics at TUM [1], these developments are performed within a spectral in-compressible discontinuous Galerkin solver INDEXA (IN-compressible Discontinuous Galerkin towards the EXA scale) [2].
Results and Methods
We give a short overview of the most important algo-rithmic characteristics of INDEXA and present recent computations of direct numerical simulation (DNS) and wall-modeled large-eddy simulation using these algo-rithms.
Fast Matrix-Free ImplementationsOur numerical models use high-order discontinuous Galerkin methods for spatial discretization and split-ting methods for time integration [2]. In this scheme,
a time step propagates the nonlinear convective term explicitly first. The intermediate velocity is made di-vergence-free by solving a pressure Poisson equation. The viscous term is advanced in the last stage by a Helmholtz equation. Linear systems are solved with state-of-the-art iterative schemes based on multigrid techniques, ensuring linear complexity and thus op-timality also with hundreds of millions or billions of unknowns. For the solvers, matrix-vector products are evaluated in a matrix-free way based on sum factori-zation. The kernels are relatively heavy on arithmetics with 1.5 to 6 floating point operations per byte loaded from main memory. To reach optimal performance, the worker kernels are vectorized with AVX [3], using 4-wide double precision registers for the outer iterations and 8-way single-precision registers whenever their higher throughput can be leveraged for intermediate results within the solvers. The implementations have been tuned to minimize the time to solution both on the node level and on a large scale with MPI.
Direct Numerical SimulationThe periodic hill flow is a popular fluid dynamics test case due to its simplicity regarding boundary conditions and complexity with respect to simulation and modeling. The flow is visualized in Figure 1. At the lower wall, the flow separates behind the hill crest and includes flow phe-nomena such as a shear layer and a recirculation bubble. These strong nonequilibrium boundary layer conditions make the flow particularly interesting as a benchmark for wall modeling including hybrid RANS/LES.
In the study [4], we performed the first DNS of the Reyn-olds number ReH = 10,595 based on the hill height H. The mesh consisted of 128 x 64 x 64 cells each with high-or-der polynomial approximations of 6th degree (scheme is of 7th order of accuracy) with a mild grid stretching towards the walls, giving a discretization of 896 x 448 x 448 nodes and 719 million degrees of freedom. The curved boundary at the lower wall is represented using the high-order polynomial ansatz of the elements. A detailed h/p convergence study has been performed to support the quality of the DNS.
From Fully Resolved to Wall-Modeled Turbulence Simulations
Research InstitutionInstitute for Computational Mechanics, Technical University of MunichPrincipal InvestigatorMartin KronbichlerResearchersBenjamin Krank, Niklas Fehn, Wolfgang A. WallProject Partners—
SuperMUC Project ID: pr83te
3

115
From Fully Resolved to Wall-Modeled Turbulence Simulations
The DNS was carried out on the Phase 1 of SuperMUC. In order to determine a suitable parallel setup, Figure 2 shows strong scaling experiments of the DNS as well as a coarser DNS at the lower Reynolds number of ReH=5,600 on up to 65,536 CPU cores. Representing a good compro-mise between simulation time and resource efficiency, the final production run at ReH = 10,595 was performed on 8,192 cores, resulting in a simulation time of approx-imately six weeks and corresponding to approximately 8 million core hours. The simulation results have been made available to the scientific community on the public repository mediaTUM.
Wall-Modeled Large-Eddy SimulationIn underresolved simulations, the present scheme pro-vides sufficient numerical dissipation for stable simula-tions. This characteristic may be used for implicit large-ed-dy simulation (ILES), i.e., a supplementary subgrid closure is not necessary. Despite the drastic reduction in compu-tational requirements in comparison to DNS, the presence
of solid walls limits the application of ILES to the low and medium Reynolds number regime. At high Reynolds numbers, the small size
of the energy-carrying near-wall turbulent eddies poses excessive
grid resolution requirements, which will not be available for several dec-
ades.
The computational resources on Su-perMUC have enabled essential con-
tributions to wall modeling via function enrichment [5]. The basic idea is that addition-
al shape functions are used in a thin layer at the wall, which are constructed using a wall function. The method then automatically employs these shape functions if the standard polynomial part is not sufficient to resolve the turbulent boundary layer. The wall model has been test-ed extensively using the periodic hill flow example and results of much higher quality in comparison to standard equilibrium wall models have been obtained.
On-going Research / Outlook
In ongoing research, our group is investigating further ex-tensions to the incompressible flow solver and the wall modeling. On the one hand, the formulation from [2,5] is new and must be verified on additional problem settings before it can be employed in industrial applications. This includes a thorough verification of the scheme for implicit large eddy simulation. On the other hand, the solver com-ponents are subject to further improvement. For Super-MUC-NG, we work on reducing the memory transfer of our kernels, which we anticipate to be the most pressing aspect. Besides merging memory-heavy vector operations with the more arithmetically intensive matrix-free operator evaluation, the MPI-only implementation will be replaced by an efficient hybrid parallelization. OpenMP within the nodes can be up to 30% faster than the current pure-MPI setup because it avoids the explicit memory traffic of the MPI point-to-point communication routines. These optimi-zations, together with the increased performance of Super-MUC-NG, would enable a DNS of the next higher Reynolds number of the periodic hill flow, ReH=19,000, which would provide another big step forward for research on schemes for turbulence and our wall modeling in particular.
References and Links
[1] www.lnm.mw.tum.de[2] B. Krank, N. Fehn, W.A. Wall, M. Kronbichler. 2017. A high-order
semi-explicit discontinuous Galerkin solver for 3D incompressible flow with application to DNS and LES of turbulent channel flow. Journal of Computational Physics 348, pp. 634-659.
[3] M. Kronbichler, K. Kormann, I. Pasichnyk, M. Allalen. 2017. Fast matrix-free discontinuous Galerkin kernels on modern computer architectures. ISC High Performance 2017, LNCS 10266, pp. 237-255.
[4] B. Krank, M. Kronbichler, W.A. Wall. 2018. Direct numerical simu-lation of flow over periodic hills up to ReH=10,595. Submitted to Flow, Turbulence and Combustion.
[5] B. Krank, M. Kronbichler, W.A. Wall. 2018. A multiscale approach to hybrid RANS/LES wall modeling within a high-order discontinuous Galerkin scheme using function enrichment. Submitted to Inter-national Journal for Numerical Methods in Fluids.
Figure 1: Visualization of the flow over periodic hills at ReH=10,595 via the Q-criterion, colored by velocity magnitude, taken from [4].
Figure 2: Strong scaling of the DNS setup on SuperMUC, Phase 1, taken from [4]

116
Computational Fluid Dynamics and Engineering
Introduction
The increasing demand for power and environmental concerns motivates research activities in the field of alternative fuels. One example of these alternative fu-els is synthesis gas (CO/H2 mixtures), which can e.g. be generated by partial oxidation/gasification of hydrocar-bons such as biomass to obtain a hydrogen and carbon monoxide rich mixture. This mixture can be used for en-ergetic and non-energetic applications. For example it can be used during the production process of methanol / fuel synthesis or it can be used directly as fuel in a gas turbine. Oxygen-enriched mixtures or even pure O2 as oxidizer are employed in partial oxidation for syngas pro-duction.
During past decades computational fluid dynamics (CFD) have led to fundamental insights in the field of re-
active flow systems which would not have been possible by experiments only. For example, the measurement of spatially (3D) and temporally resolved species concentra-tions in turbulent flames is almost impossible. On the other hand, combustion mostly occurs on the smallest scales where chemistry interacts with the smallest ed-dies, making numerical modeling a difficult task.
The rapid advancement of supercomputing capabili-ties helped to establish a powerful and promising tool in combustion science, which is able to overcome these difficulties. In the so-called direct numerical simulation (DNS) approach, the governing equations describing flu-id motion, species and energy transport are solved with-out any modeling assumptions. Even if currently limited to simple geometries, spatially and temporally resolved datasets encourage the use of DNS for model develop-ment and validation.
Direct Numerical Simulation of Turbulent Oxy-Fuel Flames
Research InstitutionNumerical Thermo-Fluid Dynamics, TU Bergakademie FreibergPrincipal InvestigatorC. Hasse ResearchersFelix Dietzsch, Michael Gauding, Sebastian Popp, Arne Scholtissek, Dominique ThéveninProject PartnersISUT, Otto von Guericke University, Magdeburg
SuperMUC Project ID: pr83xa
3
Figure 1: Visualization of the direct numerical simulation performed on SuperMUC. The illustration shows a volume rendering of the temperature field. The reac-tion zone is highlighted by the green iso-surface.

117
Direct Numerical Simulation of Turbulent Oxy-Fuel Flames
The simulation performed in the course of this LRZ pro-ject investigated a temporally evolving non-premixed syngas jet flame, which was run on 8192 cores and com-prised nearly one billion grid points. The obtained results serve as a database for the validation of a recently pub-lished set of enhanced model equations for non-pre-mixed combustion. The scientific question was how the curvature of the underlying fields affects molecular transport processes within the reaction zone. For refer-ence, a snapshot of the simulation is shown in figure 1. The reaction zone is highlighted by the green iso-surface.
For the analysis it was necessary to extract several dif-ferent flame structures, see figure 2, and to track their evolution while the simulation was running.
With this, so called in-situ tracking, we were able to show for the first time that the extended set of model equa-tions is actually applicable under turbulent conditions and that curvature-induced transport has an important contribution to combustion dynamics.1
These findings are illustrated in figure 3. The plot shows the temporal evolution of temperature (at the point of stoichiometric mixture) of one flame structure. During early times of the flame structure significant deviations between the extended formulation and the classical formulation exist. These differences become negligible as soon as the underlying field flattens. Further details about the results can be found in ref. [1].
These results in combination with the extended set of equations will be important for future modeling strategies when it comes to Large Eddy Simulations (LES). In contrast to DNS, LES resolves only large flow scales and requires a proper closure of the governing equations. However, with LES more realistic flow scenarios are feasible.
References
[1] Scholtissek A, Dietzsch F, Gauding M, Hasse C. In-situ tracking of mixture fraction gradient trajectories and unsteady flamelet analysis in turbulent non-premixed combustion. Combustion and Flame. (In Press)
Figure 2: Cutout from the upper half of the jet flame. The grey iso-surface marks the reaction zone which is thrilled by quasi one-di-mensional flame structures.
Figure 3: Comparison of temperature evolution between DNS, the classical model and the extended set of equations accounting for curvature induced transport. The temperature was extracted at the point of stoichiometric mixture and is shown for one flame structure tracked over time. As a reference the orange line marks the temperature at which a flame structure extinguishes.

118
Computational Fluid Dynamics and Engineering
Introduction
Turbulent flows are of intrinsic complexity due to the non-linear character of the governing equations. In a tur-bulent flow regime, flow structures with a continuous spectrum of scales are interacting. With increasing Reyn-olds number, the range of the involved scales increases. Thus, typical technical or geophysical flows at large Reyn-olds numbers can only be predicted by the use of models reducing the number of degrees of freedom. Computer simulations have emerged as a powerful tool to improve the understanding of such flows.
The example investigated in this project is the devel-opment of scour holes around bridge piers standing in mobile river beds. In this project, we intend to particu-larly understand the scaling of the flow with Reynolds number and the change in the flow structure within a developing scour hole. To this end, we investigate the flow around a circular cylinder mounted on a flat plate and of a cylinder standing in a scour hole. The enhanced level of wall shear stress in the local flow field around the cylinder is considered to be the main reason for the developing scour hole.
The main goals of the project are: (i) to gain deeper un-derstanding of the flow and its dynamics, and how these dynamics change with increasing Reynolds number and scour depth; and (ii) to perform simulations of such flows which can be used as reference for model development.
This project has been funded as a combined numerical/experimental study by the DFG (MA 2062/11). Parallel to the simulations performed at LRZ, experiments have been performed at the Hydromechanics Laboratory at TUM for validation and to obtain complementary data to the numerical simulations.
Computational aspects
For the Large-Eddy Simulations within this project, the flow solver MGLET is employed. It uses a Finite Volume method to solve the incompressible Navier-Stokes equa-
tions on Cartesian grids with a staggered arrangement of the variables. A local grid refinement is implemented by adding refined grids in a hierarchical, overlapping way. An explicit third-order low-storage Runge-Kutta time step is used for time integration.
Curved surfaces are represented by an Immersed Bound-ary Method. MGLET is parallelized by a domain decompo-sition method using Message Passing Interface (MPI). Re-cently, the code has been optimized for massively-parallel computing architectures, such as SuperMUC, within two successive KONWIHR projects with their outcomes being published in [1,6]. These projects were intensively support-ed by experts from the CFDLab organized by the LRZ.
The first optimization addressed the communication infrastructure of the multi-block grids. Initially, the wall-time needed for updating variables stored in a cell was approximately 5 micro seconds when the number of MPI processes was around 2000. After the optimization, we are able to use efficiently four islands of the SuperMUC Phase 1 (~33000 cores) with a cell-update time of approxi-mately 2 micro seconds. In Figure 1, an example result for a weak scaling test is plotted. The figure demonstrates that MGLET is well scalable now for large numbers of cores and problem sizes. It has to be noted that even multi-block configurations run efficiently now on many cores. The sec-ond optimization project aimed to implement a parallel I/O strategy into MGLET, as the performance of the orig-inal serial I/O implementation became a progressively
Large Eddy Simulation of turbulent flow interacting with complex structures
Research InstitutionFachgebiet Hydromechanik, Technische Universität MünchenPrincipal InvestigatorMichael Manhart ResearchersWolfgang Schanderl, Yoshiyuki Sakai, Hakon StrandenesProject PartnersDFG, KONWIHR
SuperMUC Project ID: pr84gi (KONWIHR Project)
3
Figure 1: Improvement of parallel weak scaling performance expressed as time per cell-update as function of number of MPI processes. The problem size was set at 512X103 cells per MPI process. The tested archi-tecture is SuperMUC Phase 1 (Intel Sandy Bridge).

119
Large Eddy Simulation of turbulent flow interacting with complex structures
predominant bottleneck while the problem size which MGLET can handle grew drastically. We decided to resort to the parallel HDF5 I/O library to realize this task. The performance of the original serial I/O was bounded at approximately 200 MB/sec. In contrast, the new parallel I/O implementation was confirmed to perform up to 5 GB/sec. with ~33000 MPI processes.
Results and Methods
So far, we have performed Large-Eddy Simulations for the case of a cylinder on a flat plate at three Reynolds numbers (Re=20000, 39000 and 78000) [2,3,4,5] and for a cylinder placed in a scour hole for the smallest Reyn-olds number (Re=20000). The sub-grid scale stresses are parametrized by the Wall-Adapting Local Eddy-Viscos-ity model (WALE). A free surface channel flow at a low Froude number is approximated by a free-slip condition at the upper wall. A fully turbulent open-channel flow is set as inflow condition. It is generated by a so-called precursor simulation which is run in parallel to the main flow simulation, see Figure 2.
The region of interest around the cylinder/plate junction is resolved by zonally embedded grids which give a total refinement factor of eight with respect to the global grid [2,4]. For each Reynolds number, the grid was adapted ac-cording to the expected inertial stresses of the fluid. The finest configuration (Re=78000), using in total a number of 1.6 billion grid cells, was run on 2048 cores with about 12 seconds per time step (SuperMUC Phase 2) before the optimization. As expected, this was about a factor of 2-3 slower than a configuration with a single block grid due to the complex communication patterns that arose from the zonally embedded grids.
The simulations for the cylinder on a flat plate have been carefully evaluated and analyzed, and several aspects have been and will be published, see [2,3,4,5].
The main results are summarized in the following. The approaching boundary-layer-type flow leads to a down-flow in front of the cylinder. This down-flow forms a vor-tex when reaching the bottom plate, see Figure 3. Due to the main flow, this vortex wraps around the cylinder and forms the so-called horseshoe vortex system.
The horseshoe upstream of the cylinder can be visu-alized by the second invariant of the velocity gradient tensor (Q-criterion). Figure 4 clearly illustrates the com-plex interaction of structures on a continuous spectrum of scales. One can identify structures having the size of the diameter of the cylinder (horseshoe vortex, von Kar-man-vortex) as well as structures having the length scale of the grid resolution.
A detailed comparison of measured and simulated re-sults reveal a satisfying accordance for the horseshoe vortex topology, the positions of critical points, the wall shear stress and the turbulence structure [2]. We have demonstrated that conventional wall models based on the law of the wall will fail in large regions in front of the cylinder as Reynolds stresses play a minor role in the momentum balance near the wall [3].
We found that the horseshoe vortex system is only weakly changing with Reynolds number when scaled by the out-er flow variables, the inflow velocity and the cylinder di-ameter. However, the maximum wall shear stress in front of the cylinder normalized by outer variables, the friction coefficient, scales with the inverse of the square root of the Reynolds number. This is a viscous scaling. We explain this scaling by the observation that Reynolds stresses play a minor role in the region, in which the wall shear stress is large. A publication on this effect in in preparation.
References
Figure 2: Side view of the setup. The grid around the cylinder is refined with three locally embedded grids [2,4].
Figure 3: Time-averaged streamlines in the symmetry plane in front of the cylinder. Plotted is data at Re=78000.
Figure 4: The Q-criterion visualizes coherent structures around the cylin-der in a cylinder-plate junction flow (top view, Re=78000).
[1] Y. Sakai, S. Mendez, M. Allalen, M. Manhart. Performance evaluation of a Parallel HDF5 Implementation to Improve the Scalability of the CFD Software Package MGLET. InSiDE - Innovatives Supercomputing in Deutschland (2), 2017, 82 – 85.
[2] W. Schanderl, U. Jenssen, C. Strobl and M. Manhart. The structure and budget of turbulent kinetic energy in front of a wall-mounted cylinder, J. Fluid Mech. 827:285-321, 2017.
[3] W. Schanderl, U. Jenssen, M. Manhart. Near-wall stress balance in front of a wall-mounted cylinder. Flow, Turbulence and Combustion. 99:665-684, 2017.
[4] W. Schanderl and M. Manhart. Reliability of wall shear stress estimations of the flow around a wall-mounted cylinder. Computers and Fluids, 128:16-29, 2016.
[5] W. Schanderl and M. Manhart. Dissipation of turbulent kinetic energy in a cylinder wall junction flow, submitted to Flow, Turbulence and Combustion.
[6] H. Strandenes, M. Manhart, M. Allalen, I. Pasichnyk, W. Schanderl. Improving scalability for the CFD software package MGLET. InSiDE – Innovatives Supercomputing in Deutschland (2), 2016, 48 – 50.

120
Computational Fluid Dynamics and Engineering
Introduction
Pulverized coal combustion (PCC) still plays a major role for the word energy supply. However, future coal power plants need to be more efficient and produce less pollut-ants to mitigate global warming.
Computational fluid dynamics in general, and large eddy simulation (LES) in particular, have become important tools for studying combustion systems. However, signifi-cant research effort is still needed for numerical simula-tions of practical systems to become predictive. The aim of the project is improve some of the models used in the LES of PCC to move towards more reliable predictions and to elucidate the complex nature of turbulent pulver-ized coal flames.
Results and Methods
Our in-house code PsiPhi has been used for all simulations in this project. The code solves the governing implicitly filtered Navier-Stokes equations in the low-Mach limit using the finite volume method. Continuity is enforced by a pressure-correction scheme and projection method us-ing a Gauß-Seidel solver with successive over-relaxation. The code is discretized in time by an explicit third-order Runge-Kutta procedure and in space by second-order cen-tral or total variation diminishing schemes.
Coal particles are described using a Lagrangian parcel strategy. The Lagrangian phase is fully coupled to the Eu-lerian phase employing tri-linear interpolation schemes. A discrete ordinates method is used to treat thermal ra-diation.
The code is written in Fortran90 and parallelized us-ing non-blocking MPI and domain decomposition. For this project, the code has been compiled with the Intel compiler, and Intel as well as IBM versions of MPI have been used. The code has been optimized through several projects with our collaborators on SuperMUC, JUQUEEN and HazelHen, and has been demonstrated to scale up to 128,000 cores.
This project used 30M cpu-h in total. A typical large run used 16,384 cores and generated 6 TB of data for restart-ing and post-processing purposes.
The first study aimed at the investigation of different de-volatilization models [1]. To do this in a meaningful way, a compact test case featuring a simple coal jet flame ex-periment from the Central Research Institute of Electric Power Industry (CRIEPI) in Japan has been selected and simulated using devolatilization models of different level of complexity. Among these models, the detailed Chemi-cal Percolation for Devolatilization (CPD) model has been used, for the first time directly plugged into the LES of PCC. This allows for a much improved description of the behavior of individual coal particles. In the future, this will become particularly relevant for the accurate predic-tions of pollutant formation in subsequent studies.
The second study aimed at the incorporation of the flamelet model for a detailed of the description of the gas phase into a simulation of a realistic test case, the semi-industrial scale furnace of the International Flame Research Foundation (IFRF) [2,3]. Different sub-grid mod-els have been tested, and a large scale simulation with 1.7 billion cells and 40 million Lagrangian particles has been performed. The main goal of these studies was to show whether a flamelet based on gas flames works well in such large scale simulations of PCC and to val-idate the model in a realistic environment. These goals were achieved such that the flamelet model can now be extended and/or used in future simulations of full scale boilers. Additional to the validation of the method, pro-cesses such as particle heating, devolatilization and char combustion in a turbulent environment could be inves-tigated in detail. Additionally, the simulations revealed further possible improvements of the approach such as proper treatment of recirculating flue gases or better de-scription of the combustion by a more detailed descrip-tion of the volatile gas released during devolatilization.
In the third study different models for devolatilization and char combustion were tested in an LES of pulverized coal and biomass combustion, co-fired in a large-scale
Detailed coal and flamelet modeling for large eddy simulation of pulverized coal combustion
Research InstitutionUniversity of Duisburg-Essen, Instituto Superior Técnico (University of Lisbon)Principal InvestigatorAndreas KempfResearchersMiriam Rabacal, Martin RiethProject PartnersTUB Freiberg (Germany), University of Stuttgart (Germany), University of Sheffield (UK)
SuperMUC Project ID: pr84mu (Gauss Large Scale project), pr92ni
3

Detailed coal and flamelet modeling for large eddy simulation of pulverized coal combustion
laboratory furnace from Brigham Young University [4]. The LES results show that the devolatilization model has a strong impact on the flame structure, while the char conversion mode modeling had a marginal effect. The predictions provide a better understanding of the flame structure and the differences between the devolatiliza-tion and combustion of coal and biomass particles in a realistic turbulent environment.
On-going Research / Outlook
Detailed LES at such scale are only possible on large HPC systems such as SuperMUC. Machines such as the upcoming “SuperMUC Next Generation” will enable to simulate PCC systems at even larger scale with unprece-
dented level of detail, allowing to better understand the complex interplay between turbulence, particle dynam-ics and chemical reactions. In addition, future projects will focus on more detailed and improved flamelet mod-els for a detailed description of the gas phase.
References and Links
Figure 1: Temperature contours [Kelvin] in the x-y-plane through the quarl center for approximately two thirds of the computational domain in axial (x) direction (top), in a y-z plane at x=1.6 m (bottom left) and a y-z plane at x=3.2 m (bottom right) [3].
[1] M. Rieth, A.G. Clements, M. Rabacal, F. Proch, O.T. Stein, A.M. Kempf. 2016. Flamelet LES modeling of coal combustion with detailed devolatilization by directly coupled CPD. Proc. Combus. Inst., 36 (2), 2181-2189.
[2] M. Rieth, F. Proch, M. Rabacal, B. Franchetti, F. Cavallo Marincola, A.M. Kempf. 2016. Flamelet LES of a semi-industrial scale furnace. Combust. Flame, 173, 39-56.
[3] M. Rieth, F. Proch, A.G. Clements, M. Rabacal, A.M. Kempf. 2016. Highly resolved flamelet LES of a semi-industrial scale furnace. Proc. Combus. Inst., 36 (3), 3371-3379.
[4] M. Rabaçal, M Costa, M. Vascellari, C. Hasse, M. Rieth, and AM Kempf. Large Eddy Simulation of Co-Firing Biomass and Coal in a Large-Scale Furnace. Submitted to Combustion Theory and Modeling.

122
Computational Fluid Dynamics and Engineering
Introduction
Being one of the three ways to transport heat, thermal convection is ubiquitous in nature and technical applica-tions. It is studied in atmospheric physics, astro- and geo-physics. Besides that, thermal convection is also studied in engineering, as it is very important for technical applica-tions as well, e.g. in cooling processes. The utilized cooling fluids range from water (cooling CPUs) to liquid metals, which are used for cooling nuclear power plants. Thereby, it becomes necessary to understand and predict convec-tive heat transport in fluids with different properties.
Rayleigh-Bénard convection (RBC), where a fluid is con-fined between a hot bottom plate and a cold top plate, is one of the main model systems to investigate the phys-ics of turbulent thermal convection. In our project we fo-cus on the investigation of the interaction between the shear and buoyancy force. Especially we want to know, how these forces can enhance the mean heat transport across a cylindrical domain (represented by the dimen-
sionless Nusselt number Nu) and which kind of super-structures emerge inside the flow, and how they contrib-ute to the global heat transport [1].
How does our model system work? We consider convection in fluids, which density de-creases with increasing temperature. Thus, here buoy-ancy drives convection. The strength of the driving is determined by the Rayleigh number Ra, which is pro-portional to the temperature difference between the plates. Additionally, shear is induced in our system by inclining the cylindrical cell with respect to gravity. This splits the buoyancy force into two components and the additional component is directed parallel to the hot/cold plates, creating a shear flow along the hot and cold thermal boundary layers.
Previous studies for cylinders of the diameter-to-height aspect ratio one (Γ=1) evince a complex behavior of the heat transport for various fluids [2]. In our current stud-ies, we include an additional aspect, which is geometri-cal confinement of the convection cell. The aspect ratio is reduced to Γ=1/5 (i.e., the height H of the cylinder equals five times the diameter D), and our setup becomes a slender cylinder [3].
Recent experiments conducted for a slender cylinder of even stronger confinement (H = 20D) showed that the heat transport in such configurations can significantly increase (~10x) compared to that in RBC [4]. These exper-iments used liquid sodium as a working fluid, which has a very small Prandtl number Pr, i.e. the ratio of the viscos-ity to the thermal diffusivity is very small.
The main goal of our study is to provide insight into the flow fields in this kind of convective setup, because it is very difficult to do this experimentally. Furthermore, we want to analyze the heat transport scaling relations with Rayleigh number and Prandtl number.
Results and Methods
Our model system is described by the momentum (in-compressible Navier-Stokes) and energy equations. The Boussinesq approximation is used, which means that
Superstructures Enhance Heat Transport
Research InstitutionMax Planck Institute for Dynamics and Self-OrganizationPrincipal InvestigatorOlga ShishkinaResearchersLukas ZwirnerProject Partners—
SuperMUC Project ID: pr84pu, pr92jo
3
Figure 1: Instantaneous snapshots of the temperature isosurfaces for the aspect ratio Γ= 1 and Γ= 1/5, for different inclination angles of the convection cell, Ra=109, Pr=1.

123
Superstructures Enhance Heat Transport
the change of the temperature affects only the buoyan-cy term, all other fluid properties are independent of the temperature. These equations are solved by the Goldfish code, which implements a highly advanced high-order fi-nite-volume method. We perform direct numerical simu-lations (DNS), which do not need any closure models and our results are free from additional assumptions. We use cylindrical coordinates and non-equidistant, staggered meshes, to adapt the geometry of the cylinder. In Table 1 we list typical numbers about the mesh, CPU-time and memory requirements. The mesh is denser in proximity to the boundaries of the cylinder, in order to properly resolve the boundary layers (BLs). The necessary resolu-tion of the mesh is determined by the smallest turbulent scale. For small Prandtl numbers, this is the Kolmogorov scale. The boundary conditions for the velocity are no-slip at all walls and for the temperature adiabatic side walls are used and the temperatures at the cold top and hot bottom plates are kept constant.
A non-dimensional form of the equations has four input parameters: the Rayleigh number (strength of the ther-mal driving), the Prandtl number (fluid property), the di-ameter-to-height aspect ratio and the inclination angle of the cell.
The inclination angle is varied from 0, which corresponds to Rayleigh-Bénard convection (RBC), to π/2, which is so-called vertical convection (VC). Currently the Rayleigh number reaches up to 109 for Prandtl numbers 1 and 0.1.
In this report we focus on one of our most interesting findings for Ra=109, Pr=1 These results illustrate how geometrical confinement and inclination of the cylin-der can alter the flow structure in such a way, that the mean heat transport significantly increases. In RBC, that
means without inclination, the heat transport is simi-lar for both aspect ratios (less than 2% difference). Fig. 1 shows that in the Γ=1 case there is a large-scale circu-lation (LSC) but in the slender cylinder there is not. Thus, the LSC does not play an important roll on the global heat flux in RBC. The similarity between the flows can be seen in Fig 2. It shows that the sheet-like thermal plumes have similar dimensions in the case without inclination for both aspect ratios. Nevertheless, other results show that in the inclined slender cylinder, the LSC is always present, its direction is fixed by the splitting of the buoy-ancy force and its strength plays an important role in the heat transport.
D / H mesh (zφr) CPUh cores size of single snapshot
1 770 x 512 x 384 ~60k 128 4.9 GB1 / 5 512 x 256 x 65 ~30k 64 286.5 MB
Table 1: Information about a typical mesh size, cpu-hours (collecting statistics) and number of MPI cores. Note that 11 inclination angles are simulated for each particular combination of the Rayleigh number and Prandtl number, which results in about 1 million core hours for each combination.
When the inclination angle reaches π/4, the mean heat transport is optimal (maximal) for both aspect ratios. However, in the slender cylinder the heat transport in-creases by about 40%, while in the Γ=1 cylinder the in-crease amounts only 6% compared to the no inclination case. This significant difference is observed also in Figs. 1 and 2. The sheet-like thermal plumes do not change much in the aspect ratio one case. Inside the slender cyl-inder, however, we do not observe any sheet-like plumes. Instead there is one large zone of an impinging cold plume and one large zone of a rising hot plume.
Our simulations show also for other Rayleigh numbers and Prandtl numbers, that this kind of appearance of the thermal BLs seems to be favorable for the heat transport enhancement in the system. Apparently the interaction of the LSC and the BLs is stronger in the sense that a more rapid LSC squeezes the thermal BL together, thus, enhancing the heat transport.
On-going Research / Outlook
Going to lower Prandtl numbers requires especially fine meshes to resolve the relevant turbulent scales and, therefore, these simulations consume much more cpu-hours. In our future work we plan to directly compare the results of our simulations with measurements from our collaborators. This will help us to gain more detailed in-sight into the heat and momentum transport in turbu-lent thermal convection of liquid metals. The simulations in the desired parameter range are already started.
References and Links
[1] www.lfpn.ds.mpg.de/shishkina/projects/shear_and_buoyancy.html[2] Shishkina, O., Horn, S. 2016. J. Fluid Mech. 790, R3[3] Zwirner, L., Shishkina, O., under revision[4] Vasilev, A. Yu., et al. 2015. Technical Physics 60, 1063–7842
Figure 2: Slices of instantaneous flow fields near the heated plate for the aspect ratio Γ= 1/5 (left column) and Γ= 1 (right column) in RBC (top row) and inclination of π/4 (bottom row). The temperature is indi-cated by color (color scale as in Fig. 1) and the black streamlinesrepresent the velocity field, Ra=109, Pr=1.

124
Computational Fluid Dynamics and Engineering
Introduction
The current report shows the status of our HLRB project pr84qo, which is running on SuperMUC since November 2014. The aim of this project is to investigate turbulent spray flames, quantifying possible modifications of the turbulent properties. Ignition is analyzed using direct numerical simulation in different configurations: (1) ho-mogenous isotropic turbulence, (2) temporally-evolving jet (TEJ), and (3) spatially-evolving jet (SEJ). The droplets of liquid n-heptane, being smaller than the grid resolu-tion and Kolmogorov length scale, are modeled as point droplets, while the Navier-Stokes equations are solved in the low-Mach number regime. Detailed models are employed to describe chemical reactions and molecular transport in the gas phase. In the current DNS, the con-tinuous (gas) phase is simulated in a standard manner (Eulerian frame) whereas the discontinuous (droplet) phase is tracked in a Lagrangian frame. Two-way cou-pling interaction between both phases is quantified via the exchange of mass, momentum and energy. The im-pact of different parameters is investigated, in particu-lar: initial temperatures, initial pressure, equivalence ra-tio/droplet mass fraction, droplet size, turbulence level (with a Taylor Reynolds number up to 150) and mean shear effect.
Algorithms and Numerical Methods
The current project relies on an in-house DNS code. DINO (DIrect Numerical, high-Order Simulation and On-the-fly Analysis of Reacting flows and Sprays) is a new Fortran-2003 code, which has been developed in our group since the beginning of 2013 [1-3]. DINO is a three-dimensional low Mach number DNS solver code with a 6th order finite-difference spatial discretization for reacting and multi-phase turbulent flows. The code is parallelized in two dimensions using the 2DECOMP&FFT library that acts on top of standard MPI and FFTW. The Poisson equation for pressure is solved by means of FFT, both for periodic and non-periodic boundary conditions (in the latter case with pre- and post-processing steps). A
3rd order semi-implicit Runge-Kutta scheme is used for time integration. By default, the chemical source terms are computed using the Cantera-1.8 library. The transport properties are computed either with the Cantera library or with the EGlib-3.4 library. The discontinuous phase in multi-phase flow simulations (droplets/spray) is tracked by using either a classical Lagrangian point force ap-proach (for non-resolved particles) or with the Immersed Boundary Method (IBM) technique for fully resolved droplets (an approach that is not discussed further here). The initial turbulent field is generated by inverse Fourier transform with analytical energy spectrum (Passot-Pou-quet or Von Karman-Pao). Input/output operations rely on MPI-I/O routines provided by the 2DECOMP&FFT li-brary. These files are used for restarting the simulations while using parallel HDF5 saving for storing data used for postprocessing. The code is already under GIT version control, which helps all users to quickly and safely carry out changes or updates, if needed. As build environment DINO uses cmake and it can be compiled with both GNU and Intel Fortran compilers. Required resources, until the end of 2017, for this project are summarized in Table 1.
Total CPU-h Overall storage
Typical #cores
#generated files
28 Mio 40 TB 4096 6000
Table 1: summary of required resources (over 3 years).
Scientific Results
As mentioned in the previous section we are investigat-ing the burning of n-heptane liquid droplets in three dif-ferent configurations: Homogeneous isotropic turbulent flow (HIT), temporally-evolving turbulent jet flow (TEJ), and spatially-evolving jet flows (SEJ). The corresponding results of cases with HIT had been presented during the Combustion Symposium [4]. It had been found that the cases with HIT configuration deliver good scientific re-sults, however, spray in HIT is over simplified configuration and can’t give complete view about the shear effect since
Modulation of Turbulent Properties in Spray Flame Burning n-Heptane: Direct Numerical Simulation
Research InstitutionLaboratory of Fluid Dynamics and Technical Flows (LSS/ISUT), University of Magdeburg “Otto-von-Guericke”, Universitätsplatz 2, Magdeburg D-39106, GermanyPrincipal InvestigatorDominique ThéveninResearchersAbouelmagd Abdelsamie, Cheng Chi, and Timo OsterProject Partners—
SuperMUC Project ID: pr84qo (Gauss Large Scale project)
3
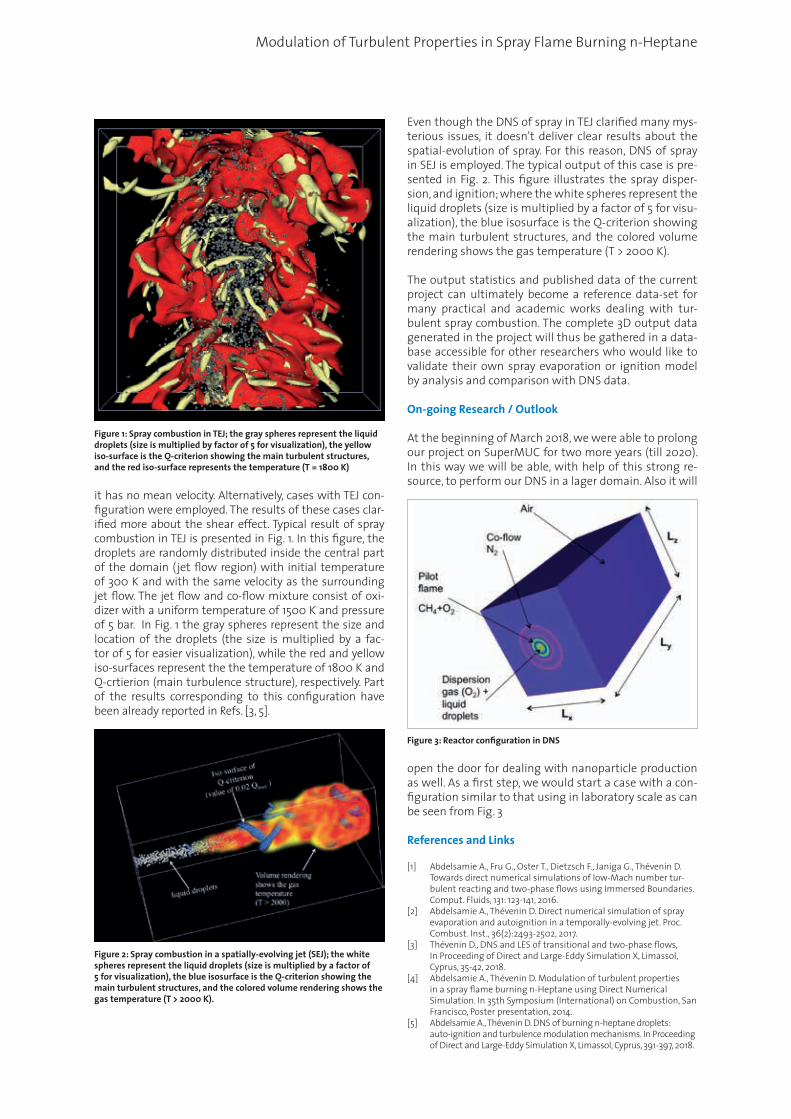
Modulation of Turbulent Properties in Spray Flame Burning n-Heptane
it has no mean velocity. Alternatively, cases with TEJ con-figuration were employed. The results of these cases clar-ified more about the shear effect. Typical result of spray combustion in TEJ is presented in Fig. 1. In this figure, the droplets are randomly distributed inside the central part of the domain (jet flow region) with initial temperature of 300 K and with the same velocity as the surrounding jet flow. The jet flow and co-flow mixture consist of oxi-dizer with a uniform temperature of 1500 K and pressure of 5 bar. In Fig. 1 the gray spheres represent the size and location of the droplets (the size is multiplied by a fac-tor of 5 for easier visualization), while the red and yellow iso-surfaces represent the the temperature of 1800 K and Q-crtierion (main turbulence structure), respectively. Part of the results corresponding to this configuration have been already reported in Refs. [3, 5].
Even though the DNS of spray in TEJ clarified many mys-terious issues, it doesn’t deliver clear results about the spatial-evolution of spray. For this reason, DNS of spray in SEJ is employed. The typical output of this case is pre-sented in Fig. 2. This figure illustrates the spray disper-sion, and ignition; where the white spheres represent the liquid droplets (size is multiplied by a factor of 5 for visu-alization), the blue isosurface is the Q-criterion showing the main turbulent structures, and the colored volume rendering shows the gas temperature (T > 2000 K).
The output statistics and published data of the current project can ultimately become a reference data-set for many practical and academic works dealing with tur-bulent spray combustion. The complete 3D output data generated in the project will thus be gathered in a data-base accessible for other researchers who would like to validate their own spray evaporation or ignition model by analysis and comparison with DNS data.
On-going Research / Outlook
At the beginning of March 2018, we were able to prolong our project on SuperMUC for two more years (till 2020). In this way we will be able, with help of this strong re-source, to perform our DNS in a lager domain. Also it will
open the door for dealing with nanoparticle production as well. As a first step, we would start a case with a con-figuration similar to that using in laboratory scale as can be seen from Fig. 3
References and Links
[1] Abdelsamie A., Fru G., Oster T., Dietzsch F., Janiga G., Thévenin D. Towards direct numerical simulations of low-Mach number tur-bulent reacting and two-phase flows using Immersed Boundaries. Comput. Fluids, 131: 123-141, 2016.
[2] Abdelsamie A., Thévenin D. Direct numerical simulation of spray evaporation and autoignition in a temporally-evolving jet. Proc. Combust. Inst., 36(2):2493-2502, 2017.
[3] Thévenin D., DNS and LES of transitional and two-phase flows, In Proceeding of Direct and Large-Eddy Simulation X, Limassol, Cyprus, 35-42, 2018.
[4] Abdelsamie A., Thévenin D. Modulation of turbulent properties in a spray flame burning n-Heptane using Direct Numerical Simulation. In 35th Symposium (International) on Combustion, San Francisco, Poster presentation, 2014.
[5] Abdelsamie A., Thévenin D. DNS of burning n-heptane droplets: auto-ignition and turbulence modulation mechanisms. In Proceeding of Direct and Large-Eddy Simulation X, Limassol, Cyprus, 391-397, 2018.
Figure 1: Spray combustion in TEJ; the gray spheres represent the liquid droplets (size is multiplied by factor of 5 for visualization), the yellow iso-surface is the Q-criterion showing the main turbulent structures, and the red iso-surface represents the temperature (T = 1800 K)
Figure 2: Spray combustion in a spatially-evolving jet (SEJ); the white spheres represent the liquid droplets (size is multiplied by a factor of 5 for visualization), the blue isosurface is the Q-criterion showing the main turbulent structures, and the colored volume rendering shows the gas temperature (T > 2000 K).
Figure 3: Reactor configuration in DNS

126
Computational Fluid Dynamics and Engineering
Introduction
The forthcoming exa-scale era promises enormous amounts of computational power. If we can translate the increasing computational power into covering more relevant physical effects in multi-physics simulations, we can aim for the most challenging applications, such as climate simulations or simulations of the human body. To this end, however, we have to reconcile scalability and flexibility of coupling approaches, as classical approach-es typically suffer from the one or the other.
The open-source coupling library preCICE [1] allows for the flexible coupling of existing single-physics legacy codes at runtime. Since preCICE treats theses codes as black-boxes, only minimal alterations to the codes are necessary to prepare them for coupling. To couple codes, the library offers methods for equation coupling, means for communication between separated executables, and methods for data mapping between non-matching cou-pling meshes. The SuperMUC project ported preCICE to a fully parallel layout without lowering the existing flex-ibility, compare Figure 1. The coupling of highly scalable single-physics solvers is possible without degenerating their scalability.
The SuperMUC project closely follows the ExaFSA pro-ject [2], part of SPPEXA – the German priority program for exa-scale computing, where we exemplarily focus on fluid-structure-acoustic interaction as a challenging multiphysics application.
Results and Methods
In the following, we briefly summarize the methods of the three feature groups of preCICE and their paralleliza-tion. For more details, we refer the reader to [3].
Equation Coupling To re-establish a strong coupling between various codes in each timestep, preCICE offers fixed-point acceleration techniques. Simple underrelaxation schemes are sup-ported as well as sophisticated quasi-Newton methods. For the latter group, we support Anderson acceleration and a generalized Broyden method. The parallelization of both methods relies on a parallel tall-and-skinny QR-de-composition, which can be efficiently updated with Giv-en’s rotations. In particular, we worked on block-Jacobi quasi-Newton coupling schemes, which allow for a si-multaneous execution of various codes [4].
Communication The parallel M:N communication of preCICE builds up on several 1:N kernel communications, which avoids dead-locks at initialization in an elegant way as one side of the communication only needs to establish one 1:N commu-nication per rank. preCICE offers two variants for the ker-nel communication: MPI and TCP/IP. Thus, we can either rely on efficient MPI implementations or avoid any MPI dependence for binary distributed single-physics codes. Both kernel implementations use asynchronous com-munication to further avoid deadlocks during the data communication.
Data Mapping To map data between non-matching coupling meshes, preCICE offers projection-based interpolation as well as radial-basis function (RBF) mapping. The latter only op-
Partitioned Multi-Physics on Massively Parallel Systems
Research InstitutionTechnical University of Munich, University of StuttgartPrincipal InvestigatorHans-Joachim Bungartz, Miriam MehlResearchersFlorian Lindner, Klaudius Scheufele, Benjamin UekermannProject PartnersDavid Blom et al. (TU Delft), Juan-Carlos Cajas et al. (Barcelona Supercomputing Center),Verena Krupp et al. (University of Siegen)
SuperMUC Project ID: pr84va
3
Figure 1: New parallel concept of the coupling library preCICE. Two parallel solvers A and B are coupled. Equation coupling, communication, and data mapping are performed on the solver ranks on distributed data.

127
Partitioned Multi-Physics on Massively Parallel Systems
erates on point clouds, which makes it perfectly suited for black-box coupling. While the parallelization of pro-jection-based mapping is rather trivial, the parallization of the RBF mapping is more involved. We rely on the PET-Sc library [5] to solve the RBF system in every coupling iteration.
With the newly-developed parallelization concepts, singlephysics codes can now be coupled without inter-fering with their scalability. Figure 2 shows an example for a fluid-fluid coupling, where all coupling operations are negligible compared to the solvers’ costs. The exam-ple uses an explicit coupling with matching interface meshes. However, also for sophisticated fluid-struc-ture couplings with RBF mappings and quasi-Newton schemes, the coupling costs in our experiments were al-ways significantly less than the solvers’ costs.
Applications
Enriching the existing flexibility of preCICE by a profound parallelization concept allows us to study several exem-plary applications. Figure 3 shows three-field flow cou-pling for a subsonic jet. Figure 4 shows a fluid-structure interaction for an aortic blood flow. Figure 5 shows a first fluid-structure-acoustic application.
On-going Research / Outlook
The ExaFSA project is currently at the beginning of its second phase, including further parallelization challeng-es for preCICE, for which we also want to apply for a fol-lowup SuperMUC project. The gather-scatter initializa-
tion will be replaced by an hierarchical concept making multiple re-initializations possible. Thus, changing cou-pling interfaces can be treated efficiently as necessary for fully Eulerian fluid solvers with moving boundaries, for solvers with dynamic adaptivity, and for an overall inter-solver load balancing. Furthermore, algorithmic changes should eliminate interface operations with quadratic complexity for the generalized Broyden meth-od and the RBF mapping. Finally, also technical problem concerning the construction of the MPI inter-solver com-munication, which we faced during this project, will be a focus of our research.
References and Links
[1] www.precice.org [2] ipvs.informatik.uni-stuttgart.de/SGS/EXAFSA [3] H.J. Bungartz, F. Lindner, M. Mehl, K. Scheufele, A. Shukaev,, B.
Uekermann. Partitioned Fluid-Structure- Acoustics Interaction on Distributed Data – Coupling via preCICE. In H.J. Bungartz, P. Neumann, E.W. Nagel (eds.) Software for Exa-scale Computing – SPPEXA 2013-2015. Springer, Berlin Heidelberg (2016)
[4] M. Mehl, B. Uekermann, H. Bijl, D. Blom, B. Gatzhammer, and A. van Zuijlen. Parallel coupling numerics for partitioned fluid-structure interaction simulations. Comp. Math. Appl., 4 (2016), 869–891.
[5] www.mcs.anl.gov/petsc/
Figure 2: Strong scaling of the work per timestep for a density pulse traveling through an artificial coupling interface in an Euler domain. The time spent for the coupling does not influence the overall scalability.
Figure 4: Fluid-structure interaction of an aortic blood flow. Two snapshots during one cycle show velocity vectors besides the struc-tural deformation. The fluid and the structure solver from the finite element Alya System are used, coupled with preCICE.
Figure 5: Prototype for a first fluid-structure-acoustic interaction: a bending tower in cross flow. Pressure values at a cut through the 3D domain are depicted. At the fluid-acoustic interface, there is still a vis-ible jump due to incorrect boundary conditions in span-wise direction. For the fluid and the structure domain, we use the finite volume solver OpenFOAM, while the acoustic domain uses the discontinuities Galerkin solver Ateles.
Figure 3: Three field flow coupling with the discontinuities Galerkin solver Ateles, coupled with preCICE. Pressure values of a subsonic jet are shown at various time instances. The leftmost snapshot also depicts the subdomains.

128
Computational Fluid Dynamics and Engineering
Introduction
The ExaFSA project [1] aims for the integrated simulation of acoustic wave propagation and generation in flows around obstacles. The ambition in this project is the in-clusion of the interaction of the structural movement with fluid motion, as well as the simulation of the gener-ated sound waves from this configuration. A basic sketch of the overall problem is shown in Figure 1.
The inclusion of the various physics and different scales involved in this overall problem has become possible by large computing facilities like the SuperMUC. Within this research, the present compute time project is concerned with computations and investigations for the coupling between the fluid domain and the acoustic wave propa-gation across larger distances. These two parts build an essential pair in the complete setup, as they are expected consume the largest part of the total compute time. The fluid domain due to its need for high resolution and the nonlinearity of the problem and the acoustic propaga-
tion due to the large domain that needs to be covered for the wave propagation.
The structural part imposes further restrictions on the fluid domain, especially with respect to the time resolu-tion. Thus, even though the fluid-structure interaction increases the computational costs drastically, those ad-ditional computations are still found mostly in the fluid part. Therefore, this first compute time project for this research concentrates on the fluid motion and acoustic wave propagation.
Results and Methods
The fluid and acoustic domain require the resolution of dif-ferent scales. While we are dealing with high energies and small length scales in the fluid domain, we are facing large length scales and low energy fluctuations in the acoustic waves. A monolithic solution with the same resolution pre-scribed by the maximal requirements in either domain is not feasible from the computational point of view. Instead the two domains need to be separated to allow for a proper discretization with respect to each involved regime.
To enable a direct aeroacoustic simulation with the two-way interaction between fluid and acoustic domain, the ExaFSA project uses a coupled approach, where the do-mains are spatially separated, and each part can be com-puted with different methods and discretization.
Coupled Direct Aeroacoustic Simulations on Massively Parallel Systems
Research InstitutionSimulation Techniques and Scientific Computing, University of SiegenPrincipal InvestigatorSabine RollerResearchersVerena Krupp, Harald KlimachProject PartnersBenjamin Uekerman, Scientific Computing in Computer Science, TU München
SuperMUC Project ID: pr84xu
3
Figure 1: Schematic sketch of the Fluid-Structure-Acoustics problem setup.
Figure 2: Iso-surfaces of vorticity magnitude colored by Mach number and acoustic pressure on a slice around the core of the free-stream jet. Multi-level mesh with 139,424 elements, O(16), yielding more than 2.85billion degrees of freedoms. The simulation was run on 2048 nodes, i.e. 32,768 cores, of Super-MUC [5].

129
Coupled Direct Aeroacoustic Simulations on Massively Parallel Systems
Figure 2 illustrates the generation of sound by a fluid in motion with a jet from a nozzle. The noise generat-ing fluid motion usually can be found in a comparable small area around the structure in the ExaFSA setting. Thus, a spatial separation can be naturally found for these scenarios. In Figure 2 the jet with turbulent fluid motion can be clearly separated from the area, where pressure waves are transported. The idea in the cou-pled simulation is now to gradually simplify the equa-tions to solve as soon as possible. Starting with the full compressible Navier-Stokes equations, including friction the first simplification that can be done is to neglect the viscous terms when there are no shear flows expected anymore. This results in the nonlinear inviscous Euler equations. Finally, when the variation in the state gets sufficiently small, the nonlinearities can be neglected and only the linearized Euler equa-tions need to be solved.
For the surface coupling between the individual domains we use the general library preCICE [2]. This tool allows the coupling of various solvers via a generic interface de-scription. This will allow us to combine dedicated solvers for each physical domain. For the current investigation we first utilize the same solver for both, the fluid and the acoustic domain, albeit with different discretizations. Our solver Ateles [3] is a Discontinuous-Galerkin solver with a modal basis. This is especially well suited for linear problems like the acoustic wave propagation. A high spa-tial scheme order can be utilized with this scheme, which reduces the required memory to represent the solution accurately.
Nonlinear equations, however, drastically increase the computational effort in this scheme for high orders. Nevertheless, we employ this solver for this project also for the fluid domain, though with a low spatial scheme order. We plan, to replace the solver in the fluid domain.
During this project we computed several jet configura-tions and improved the scalability of the approach. The communication algorithm in preCICE was changed and some load-balancing was introduced to account for in-creased computational efforts for the interpolation in the high-order scheme.
A large part of the project was concerned with the gen-eration of a reference solution with a large fluid domain without coupling. We then investigated the feasibility and accuracy of the coupled simulation. These showed good agreement with the produced reference and after the mentioned improvements also a good runtime. We use more than 20 million core-h on the various investiga-tions, with around a third of it spent on the production of the reference for comparison.
In most runs we used 16,384 cores per simulation as this proofed to be the most feasible queueing option. The re-sulting data is stored in one file per point in time and domain. Typically, 100 points in time were used for each simulation resulting in around 200 files, where each con-tains the complete solution in space and is also suitable
to restart the simulation. Tracking specific probes in the domain with a higher time resolution produces some other, smaller files. But these are only few and small. In the fluid domain the solution requires around 10 GB of disk-space for a mesh with around 30 million elements. In the acoustic domain with a high scheme order, less de-grees of freedom are required and the solution data fits into files of less than half that size. In total a simulation, therefore, produced roughly 1.5 TB of data. In the course of the project we utilized more than 10 TB of disk-space for the various investigations.
On-going Research / Outlook
The just finalized phase 1 of the ExaFSA project focused on setting up the framework and gaining experience with the general quality of the coupling algorithms, es-pecially on the data mapping between the processes. Future work focuses on the simulation of real world flu-id-structure-acoustic interaction to bring new insights into such applications and realize computational op-timization of e.g. the sound design of aircraft or wind turbines.
We can now build on the foundation and improvements that we were able to build during the compute time pro-ject. The detailed simulation of the problem including also the fluid-structure interaction further increases the computational costs the follow-up work on these large scale investigations have already started in a new com-pute time project.
References and Links
[1] http://ipvs.informatik.uni-stuttgart.de/SGS/EXAFSA/[2] H.-J. Bungartz, F. Lindner, B. Gatzhammer, M. Mehl, K. Scheufele,
A. Shukaev and B. Uekermann. preCICE — A Fully Parallel Library for Multi-Physics Surface Coupling. In Computers and Fluids. Elsevier, 2015.
[3] Jens Zudrop. 2015. Efficient Numerical Methods for Fluid- and Electro-dynamics on Massively Parallel Systems, Ph.D. Dissertation, RWTH Aachen, Germany
Figure 3: Snapshot of a coupled simulation of a subsonic jet, coupling interfaces are marked by black lines. Innermost: Navier-Stokes; middle: inviscid flow surrounding: linearized Euler. Left: flow phenomena. Right: acoustic wave propagation.

130
Computational Fluid Dynamics and Engineering
Introduction
The recent increase of renewable energy resources re-quires the development of advanced energy storage techniques in order to balance the increasingly tempo-rally fluctuating energy production. According to the vi-sion ‘Energiekonzept 2050’ of the German government [2], energy storage may be realized by transforming ex-cessive electric energy into chemical energy, e.g. by the electrolysis of water that splits water into molecular hydrogen and oxygen. The generated hydrogen can be stored and if needed, the energy can be regained by an electrification of hydrogen via combustion in stationary gas turbines. Within the vision ‘Energiekonzept 2050’, hydrogen is of particular interest as it represents a car-bon-free energy carrier.
One way to integrate the generated hydrogen into the existing energy infrastructure is to enrich convention-al fuels such as natural gas by hydrogen. Such fuels are termed High Hydrogen Content (HHC) fuels. However, HHC fuels show an entirely different combustion be-havior as they are prone to thermodiffusive combustion instabilities [3]. This results from the high diffusivity of hydrogen or, respectively, its low Lewis number. These instabilities are yet not sufficiently understood, but sig-nificantly affect the overall combustion process as they can lead to an acceleration of the flame due to flame wrinkling and strong variations of the heat release. Thus, before HHC combustion becomes applicable in actual combustion engines a deeper understanding of its com-bustion behavior is required.
Nowadays the development process of new combustion devices is strongly supported by computational fluid dynamics in order to cut the high cost associated with experimental tests. This again requires accurate and reli-able models for high-fidelity simulations. Recently, com-bustion processes in gas turbines have been analyzed by Large Eddy Simulation (LES) [4], which resolve the larg-est turbulent scales but require modeling of the small-est scales in a turbulent flow. Typically, LES represent a satisfactory trade-off between computational cost and
resolving a turbulent flow with a reasonable degree of accuracy. However, model development for LES requires the knowledge of the interaction of the unresolved tur-bulent scales and combustion. These details can only be obtained from Direct Numerical Simulations (DNS) where all turbulent scales are resolved. In contrast to LES, DNS of realistic combustion engines are yet not feasible due to their significant computational cost, but provide unique data sets for LES model development and vali-dation due to their enormous richness of details. Since current LES modeling approaches developed for hydro-carbon fuels cannot describe the complex phenomena occurring for thermodiffusive unstable flames, entirely new LES models need to be developed for HHC fuels. This model development process starts with the generation of a DNS data sets of thermodiffusive unstable flames.
Results and Methods
Numerical FrameworkThe governing equations of the DNS are given by the reacting Navier-Stokes equations in the low-Mach lim-it. For the computation, an in-house code called CIAO is employed. The code is a high-order, semi-implicit fi-nite difference code that uses Crank-Nicolson time ad-
Fuel Flexible Combustion Systems with High Hydrogen Content (HHC) Fuels
Research InstitutionInstitute for Combustion Technology, RWTH Aachen University, Germany Principal InvestigatorHeinz PitschResearchersLukas BergerProject Partners—
SuperMUC Project ID: pr84yo
3
Figure 1: Simulation setup for the 2D DNS of a lean, premixed H2-flame.
Outflow
Inflow
periodic periodic
unburnt
burnt

131
Fuel Flexible Combustion Systems with High Hydrogen Content (HHC) Fuels
vancement and an iterative predictor corrector scheme. Spatial and temporal staggering is used to increase the accuracy of stencils. The Poisson equation for the pres-sure is solved by the multi-grid HYPRE solver. Momen-tum equations are spatially discretized with a second order scheme. Species and temperature equations are discretized with a third order WENO scheme. The tem-perature and species equations are advanced by utilizing an operator splitting according to Strang. The chemistry operator uses a time-implicit backward difference meth-od, as implemented in the stiff ODE solver CVODE. For further details about the applied numerical algorithms and code verification, the reader is referred to Ref. [5]. The code uses the message passing interface (MPI) standard.
DNS of a Thermodiffusively Unstable H2-FlameFig. 1 shows the simulation setup of a 2D large-scale DNS flame that burns towards the inlet. The simulation domain is periodic in crosswise direction and the planar flame is initially perturbed in order to trigger thermodif-fusive instabilities. The inlet velocity is chosen such that the flame is stabilized sufficiently long within the simu-lation domain. Fig. 2 shows a 2D large-scale simulation of a lean, premixed H2-flame at Tu=298K, p=0.5 bar and ϕ=0.4. After an initial phase, the flame quickly forms typical patterns that are characteristic of thermodiffusive instabilities. During the simulation, cusps of different siz-es are formed along the flame front and hence, increase the overall flame surface leading to an acceleration of the flame. Two distinct sizes of such cusps are visible. First, a characteristic smallest length scale can be identified that repeats itself multiple times along the flame front and
second, two large-scale structures are seen at, e.g., 90 ms, 229 ms, and 269 ms, which will be referred to as flame fin-gers. The smallest cell sizes can be attributed to the most unstable wave length of the dispersion relation, which de-scribes the linear phase of such instabilities. However, Fig. 2 clearly shows that a strong non-linear interaction also exists, which yields the formation of flame fingers. These structures periodically arise from the flame front and quickly propagate towards the unburnt. However, during their propagation, the flame fingers show a tilting be-havior (see e.g. t = 269 ms) such that they are reabsorbed by the flame. Thus, a periodic formation and collapse of flame fingers is observed. Understanding and predicting the size of these fingers is a critical component of an LES model as the flame acceleration strongly depends on the increase of the flame surface area. The overall acceleration of the flame front can be studied by means of the flame’s consumption speed. For this case, it is found that the con-sumption speed is about 2.5 times larger than the lami-nar burning velocity, which underlines the importance of incorporating the effects of thermodiffusive instabilities into current LES models.
References and Links
[1] https://www.lrz.de/projekte/hlrb projects/0000000000F437D7.html[2] Energiekonzept für eine umweltschonende, zuverläs-sige und
bezahlbare Energieversorgung. Website, 2017. Available at https://www.bundesregierung.de/ContentArchiv/DE/Archiv17/_Anlagen/ 2012/02/energiekonzept-final.pdf?_blob=publicationFile&v=5
[3] P. Clavin, Prog. Energy Combust. Sci., Vol. 11 pp.1-59, 1985[4] M. Mueller, H. Pitsch, Phys Fluids 25 (110812), 2013[5] O. Desjardins, G. Blanquart, G. Balarac, H. Pitsch, J. Comput. Phys.,
227:7125-7159, 2008
t = 1ms t = 68ms t = 90ms t = 120ms
t = 229ms t = 269ms t = 417ms t = 147ms
Figure 2: Temporal evolu-tion of a 2D lean premixed hydrogen-air flame affected by thermodiffu-sive instabilities. Operating conditions are Tu = 298K, p = 0.5 bar and ϕ= 0.4.

132
Computational Fluid Dynamics and Engineering
Introduction
Cavitation denotes the local evaporation of a liquid me-dium caused by a decrease in static pressure below the vapor pressure, at almost constant temperature. Hydrau-lic cavitation bases on Bernoulli’s principle: an accelera-tion of the liquid leads to a reduction in static pressure. Hence, given a large acceleration, the static pressure can fall below the local vapor pressure. Many engineer-ing devices operating with liquid media, such as pumps, impellers, turbines, or ship propellers are subjected to hydraulic cavitation. Furthermore, it can also occur in hy-draulic ducting, e.g. at discharge valves, throttles, venturi or orifices. The generated vapor pockets, also called cavi-ties or voids, are typically transported with the main flow. When reaching again into areas of increased pressure, a sudden implosion or collapse-like re-condensation of the vapor occurs.
These collapses may induce intense pressure levels, which can exceed orders of several hundreds of MPa. On the oth-er hand, characteristic length- and time-scales of the last stages of collapse events are nanometers and a few na-noseconds, respectively. This induces shock waves, which subsequently propagate through the liquid medium.
Cavitation is, in most cases, associated with a range of adverse effects. The aforementioned cavity collapse events generate far-field noise. Furthermore, collapse-as-sociated pressure peaks are high enough to cause sur-face fatigue, or even material erosion. When exposed to cavitation over a sustained time, this may eventually lead to the failure of affected components. Cavitation may also excite vibrations, potentially leading to resonances of the structure. Finally, cavitation causes a degradation of the performance of the device, e.g., a reduction of static head for pumps, or of the deliverable thrust for a ship propeller.
The speed of sound in a two-phase flow can be orders of magnitudes lower than in either the pure liquid or pure vapor. Hence, even though cavitation occurs in a seem-ingly incompressible liquid flow, Mach-numbers Ma >> 1
can be reached, and the flow becomes locally super-son-ic. In addition to the aforementioned shock waves asso-ciated with cavity collapse events, this enables the occur-rence of further compressible phenomena.
An important compressible mechanism is the so-called condensation shock, which denotes a shock wave propa-gating within the two-phase flow, associated with con-densation of the vapor across the front. Condensation shocks represent a major driving mechanism for the unsteady nature of cavitating flow: global system dyna- mics, such as shedding frequencies of attached sheet cavities, can significantly be altered by their occurrence. As such, structural vibrations or resonances can be ex-cited. Moreover, by affecting global cavity unsteadiness, flow aggressiveness and, hence, erosivity, as well as noise can largely be influenced by condensation shocks as well.
Despite their relevance for understanding the physics of and implications associated with cavitating flow, con-densation shocks only recently gained attention in the literature, primarily by experimental investigations.
The goal of this project hence is to study this phenome-non by means of numerical simulation. Computational Fluid Dynamics (CFD) is advantageous in this regard, as it enables the analysis of flow structures and dynamics at both a temporal and spatial accuracy which is not achievable by experimental studies. As demonstrated, the formation and propagation of shock wave systems is crucial for understanding cavitation and its impact. However, the separation of length- and time-scales be-tween wave dynamics associated with cavity collapse events on one hand, and the convective flow in conjunc-tion with, e.g., condensation shocks on the other, typical-ly span several orders of magnitudes. In order to spatially resolve the finest structures, grids with tens to hundreds of millions of control volumes are necessary. Simultane-ously, with time-steps on the order of nanoseconds, cov-ering convective time intervals requires tens of millions of iterations. This leads to a substantial numerical effort, requiring massively-parallel, high-performance comput-ing resources.
Condensation Shock Phenomena in Cavitating Flow
Research InstitutionChair of Aerodynamics and Fluid MechanicsPrincipal InvestigatorBernd BudichResearchersBernd Budich, Steffen J. Schmidt, Nikolaus A. AdamsProject PartnersU.S. Office of Naval Research
SuperMUC Project ID: pr85ki
3

Condensation Shock Phenomena in Cavitating Flow
Numerical Method
In order to capture collapse-induced pressure peaks and associated shock wave dynamics, the numerical ap-proach developed at the TUM Institute of Aerodynamics and Fluid Mechanics [1], takes into account the two-phase compressibility of the water-vapor-mixture. The density-based, 3D finite volume method is based on a homogeneous mixture model [2]. Spatial reconstruction utilizes a 2nd-order TVD scheme on body-fitted, struc-tured grids. An explicit, 4- stage Runge-Kutta method is used for integration in time. In this study, we focus on inertia-dominated physics and thus neglect viscosity. Furthermore, the flow is assumed barotropic and the ef-fects of gas content are neglected. The described numer-ical method is implemented in the flow solver CATUM. It is entirely written in Fortran, and parallelized using Massage Passing Interface (MPI) directives for massive-ly-parallel computations on Intel x86 architectures. Stat-ic domain decomposition and load-balancing is achieved using the METIS partitioning algorithms [3].
Results
In order to study condensation shock phenomena, the canonical configuration of a partial cavity, developing at the sharp apex of a prismatic test body and under-going subsequent sheet-to-cloud transition, is studied. The numerical set-up reproduces the experiments of Ganesh [4] as close as possible. The results of this study are documented in a recent publication of the authors [5], and major findings are summarized in the following. The predictions are in close agreement with the exper-iments: typical coherent flow structures found in the experiments are well reproduced by the simulations, as depicted in Figure 1, comparing a top-view on the partial cavity from the experiments with the simulation results.
As indicated, the simulations equally predict an attached sheet cavitation, detached cavity clouds, cavitating horse-shoe vortices, “streamers”, cavitating side-wall vor-tices, cavitating vortices stretching around a detached
cloud, as well as crescent-shaped regions. The simula-tions show a highly three-dimensional flow field, char-acterized by a high level of vorticity. It is predominantly generated by the corrugated condensation shock front traveling upstream through the attached partial cavi-ty. The front is subjected to Rayleigh-Taylor instabilities, while the post-shock fluid undergoes Kelvin-Helmholtz instabilities.
A closer comparison between numerical prediction and experiment is given in Figure 2, juxtaposing the evolution of the vapor volume fraction during the collapse phase of the sheet cavity. The global structure of the flow, as well as the level of the vapor volume fraction are both well-re-produced. Moreover, it is found that velocities of cavity growth and collapse, as well as the resulting shedding Strouhal-number, which characterizes the frequency of the periodic shedding, are in close agreement.
It is found that global flow unsteadiness of this con-figuration is entirely dominated by the occurrence of the condensation shock phenomenon. Moreover, it is demonstrated that it satisfies locally Rankine-Hugoniot jump relations. Estimations of the shock propagation Mach number show that the flow is super-sonic. Our results indicate that, in addition to classically observed re-entrant jets, condensation shocks feed an intrinsic in-stability mechanism of partial cavitation.
HPC resources were a prerequisite for the presented study. Utilizing up to 1024 cores in parallel, the investiga-tions required a total of approximately 10∙106 CPU-hours on SuperMUC phase 2.
References and Links
Figure 2: Comparison of instantaneous void fraction between exper-iment (left) and simulation (right) during the collapse phase of the partial cavity, with an indication of the location of the condensation shock front. Reprinted with permission from [5], copyright Cambridge University Press.
Figure 1: Illustration of a typical shedding cycle in top-view, comparing experiments (left) and simulations (right). The numerical results show vapor structures by means of the iso-surface of 10% vapor volume frac-tion (grey) and vortical structures with the iso-surface of λ2-criterion, λ2 = –2·106 s –2, colored by the axial vorticity. The white boxes indicate coherent flow structures. Reprinted with permission from [5], copyright Cambridge University Press.
[1] http://www.aer.mw.tum.de/abteilungen/gasdynamik[2] Schmidt, S.J. (2015) “A low Mach number consistent compressible approach for
simulation of cavitating flows”. PhD thesis, Technische Universität München, Germany.
[3] http://glaros.dtc.umn.edu/gkhome/views/metis[4] Ganesh, H., Mäkiharju, S.A. & Ceccio, S.L. (2016) “Bubbly shock propagation as a
mechanism for sheet-to-cloud transition of partial cavities”, J. Fluid Mech. 802, 37-78.
[5] Budich, B., Schmidt, S.J. & Adams, N.A. (2018) “Numerical simulation and analy-sis of condensation shocks in cavitating flow“, J. Fluid Mech. 838, 759-813.

134
Computational Fluid Dynamics and Engineering
tic waves, is obtained from the numerical simulation by employing system identification (SI) [2] and connected to the acoustic network model to predict the combustion instability.
The CFD-SI approach to compute flame transfer func-tions are computationally demanding and therefore per-formed in SuperMUC. This method was proven to be effi-cient and accurate for perfectly premixed flames, where the fuel and oxidizer are mixed homogenously. However, in industrial application the perfect mixing is difficult to achieve, and the flame is often subject to mixture inho-mogeneities. Lean premixed flames are highly sensitive to the mixture inhomogeneities, i.e. strong unsteady heat release rate oscillations might occur.
The focus of this project is to identify the flame transfer function in the presence of mixture inhomogeneities. For this purpose, an experimental test rig is devised at TU Berlin and corresponding numerical computations are carried out at TU München in the framework of a FVV project (Vorhaben Nr. 1170, Vorhersage von Flam-mentransferfunktionen). The setup is illustrated in Fig. 1, where the red color indicates the heat release in the combustion chamber and the grayscale color indicates
Technically Premixed Flame Response via Large Eddy Simulation
Research InstitutionProfessur Für ThermofluiddynamikPrincipal InvestigatorWolfgang PolifkeResearchersAlp AlbayrakProject PartnersSiemens, Alstom and Rolls Royce
SuperMUC Project ID: pr86fa
3
Figure 1: A snapshot of the burners numerical domain. Red color is of the heat release rate and the grayscale equivalence ratio.
Introduction
Power plants that employ gas turbines are major source of energy production and will also play a significant role in the future renewable energy era by providing a reli-able back-up source. Over the last decade, stricter regu-lations are imposed on gas turbines for hazardous gas emissions such as NOx. A common approach to reduce emissions is to burn leaner mixtures in combustion ap-plications. However, lean burned flames are susceptible against combustion instabilities. The underling mecha-nism of these instabilities is: acoustic waves perturb the heat release rate of the flame. The unsteady heat release is a volume source and thus generates acoustic waves, which are reflected from combustor boundaries. The re-flected acoustic waves again perturb the flame such that a feedback loop is formed. If this aspect is not respected in the design stage, perturbations might grow and cause fatigue or even damage the burner.
Combustion instability is a multiscale phenomenon. The state of art modeling approach relies on network modeling to account for large-scale acoustics in the complete combustor. However, the interaction between the unsteady heat release rate with acoustic waves re-quires high fidelity computational fluid dynamic (CFD) approach such as large eddy simulation, where small-scale turbulent combustion interaction is resolved. The flame transfer function, i.e. the flame response to acous-

135
Technically Premixed Flame Response via Large Eddy Simulation
the equivalence ratio in the mixing duct. The darker colors indicate higher concentration of the fuel and it is evident that the flame is subject to strong mixing inho-mogeneities.
Results and Methods
The Navier-Stokes equations with low Mach number combustion assumption are employed in the object-ori-ented C++ Software package OpenFOAM [3]. An implicit finite volume scheme with well-known PISO algorithms is used. The solver is derived from the standard solver re-actingFOAM. The sub-grid scale turbulence is modeled with WALE model in the large eddy simulation frame-work. Global 2-step chemistry is used to model Meth-ane-Air combustion. The time averaged heat release rate from the simulation is compared against CO* images
from the experimental measurement. A good agreement is achieved in terms of the correct flame anchoring posi-tion, flame length and flame angle.
The thickened flame model (TFM) is employed to mod-el the sub-grid scale turbulent chemistry interaction. This model was already validated for perfectly premixed flames. However, preliminary tests showed poor agree-ment in the technically premixed setup. This is illustrated in Fig. 3, where the Bode plots are shown for flame trans-fer functions from experiments (circles) and CFD-SI results with the standard thickened flame model (red line). The Bode plot shows the gain (top plot) and phase (bottom plot) as a function of the frequency in Hertz. The mis-match is observed in gain especially at around 125 Hz and the trend is off for the phase at around low frequencies.
We identified that the discrepancy is caused by the thick-ened flame model, which is valid solely for perfectly pre-mixed flames. In the framework of this project, the local thickened flame model (LTFM) is devised, which extends the capabilities of the thickened flame model to account for the local mixture inhomogeneities. Very good agree-ment against the experiments is achieved as shown in Fig. 3 with the blue line.
To perform the CFD-SI approach, the flow velocity at the inlet of the domain is perturbed with a broadband signal around 0.25s. The corresponding time series of the heat release rate oscillations is used to calculate the flame transfer function. This simulation is realized in 650000 CPU hours by employing 1120 processors. We also ob-served a speed up around %40 in SuperMUC phase 2 compared to SuperMUC phase 1.
On-going Research / Outlook
The results shown in Fig. 3 relies on Single-Input-Sin-gle-Output (SISO) identification, where the velocity is the input and the heat release is the output. Another possibility is to employ Multiple-Input-Single-Output (MISO) system approach, where two input channels are selected as velocity and equivalence ratio. Employing un-correlated broadband signals in a single simulation will yield the identification of the flame transfer function caused by both velocity and equivalence ratio fluctua-tions. The latter will reveal the underlying physics of the flame response with the mixture inhomogeneities and it is planned to derive corresponding low order models.
In future, it is planned that this tuned CFD framework will be further developed. The characteristic based state-space boundary conditions (CBSBC) will be implemented, which enables to couple any acoustic network model with the CFD framework. By doing so, self-sustained non-linear combustion instabilities will be efficiently simulated.
References and Links
[1] http://www.tfd.mw.tum.de/index.php?id=99[2] W. Polifke, Black-box system identification for reduced order model
construction, Annals of Nuclear Energy, vol. 67C, pp. 109–128, May 2014.[3] www.openfoam.org
Figure 2 Flame Transfer Function of a technically premixed flame from experiments (circles), standard thickened flame model (TFM) and extended local thickened flame model (LTFM).
Figure 3: Left: The time averaged heat release rate from CFD. Right: Time averaged CO* image from experimental measurement.
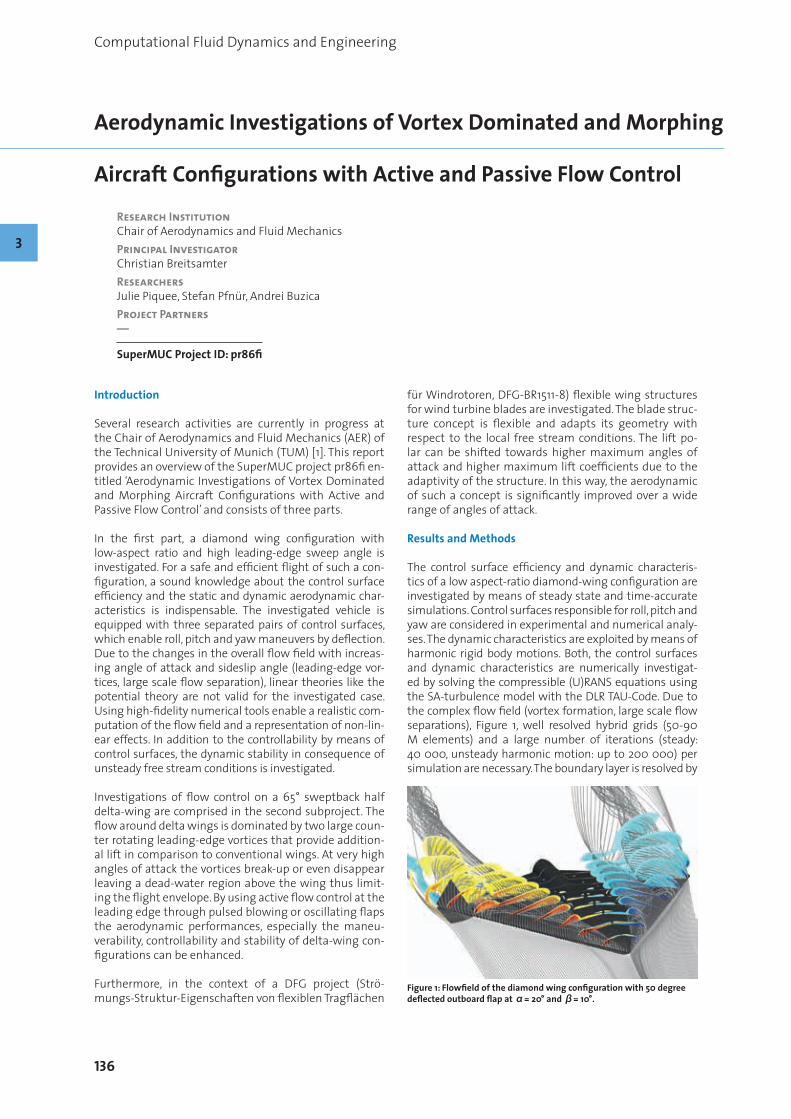
136
Computational Fluid Dynamics and Engineering
für Windrotoren, DFG-BR1511-8) flexible wing structures for wind turbine blades are investigated. The blade struc-ture concept is flexible and adapts its geometry with respect to the local free stream conditions. The lift po-lar can be shifted towards higher maximum angles of attack and higher maximum lift coefficients due to the adaptivity of the structure. In this way, the aerodynamic of such a concept is significantly improved over a wide range of angles of attack.
Results and Methods
The control surface efficiency and dynamic characteris-tics of a low aspect-ratio diamond-wing configuration are investigated by means of steady state and time-accurate simulations. Control surfaces responsible for roll, pitch and yaw are considered in experimental and numerical analy-ses. The dynamic characteristics are exploited by means of harmonic rigid body motions. Both, the control surfaces and dynamic characteristics are numerically investigat-ed by solving the compressible (U)RANS equations using the SA-turbulence model with the DLR TAU-Code. Due to the complex flow field (vortex formation, large scale flow separations), Figure 1, well resolved hybrid grids (50-90 M elements) and a large number of iterations (steady: 40 000, unsteady harmonic motion: up to 200 000) per simulation are necessary. The boundary layer is resolved by
Aerodynamic Investigations of Vortex Dominated and Morphing
Aircraft Configurations with Active and Passive Flow Control
Research InstitutionChair of Aerodynamics and Fluid MechanicsPrincipal InvestigatorChristian BreitsamterResearchersJulie Piquee, Stefan Pfnür, Andrei BuzicaProject Partners—
SuperMUC Project ID: pr86fi
3
Figure 1: Flowfield of the diamond wing configuration with 50 degree deflected outboard flap at α= 20° and β= 10°.
Introduction
Several research activities are currently in progress at the Chair of Aerodynamics and Fluid Mechanics (AER) of the Technical University of Munich (TUM) [1]. This report provides an overview of the SuperMUC project pr86fi en-titled ‘Aerodynamic Investigations of Vortex Dominated and Morphing Aircraft Configurations with Active and Passive Flow Control’ and consists of three parts.
In the first part, a diamond wing configuration with low-aspect ratio and high leading-edge sweep angle is investigated. For a safe and efficient flight of such a con-figuration, a sound knowledge about the control surface efficiency and the static and dynamic aerodynamic char-acteristics is indispensable. The investigated vehicle is equipped with three separated pairs of control surfaces, which enable roll, pitch and yaw maneuvers by deflection. Due to the changes in the overall flow field with increas-ing angle of attack and sideslip angle (leading-edge vor-tices, large scale flow separation), linear theories like the potential theory are not valid for the investigated case. Using high-fidelity numerical tools enable a realistic com-putation of the flow field and a representation of non-lin-ear effects. In addition to the controllability by means of control surfaces, the dynamic stability in consequence of unsteady free stream conditions is investigated.
Investigations of flow control on a 65° sweptback half delta-wing are comprised in the second subproject. The flow around delta wings is dominated by two large coun-ter rotating leading-edge vortices that provide addition-al lift in comparison to conventional wings. At very high angles of attack the vortices break-up or even disappear leaving a dead-water region above the wing thus limit-ing the flight envelope. By using active flow control at the leading edge through pulsed blowing or oscillating flaps the aerodynamic performances, especially the maneu-verability, controllability and stability of delta-wing con-figurations can be enhanced.
Furthermore, in the context of a DFG project (Strö-mungs-Struktur-Eigenschaften von flexiblen Tragflächen
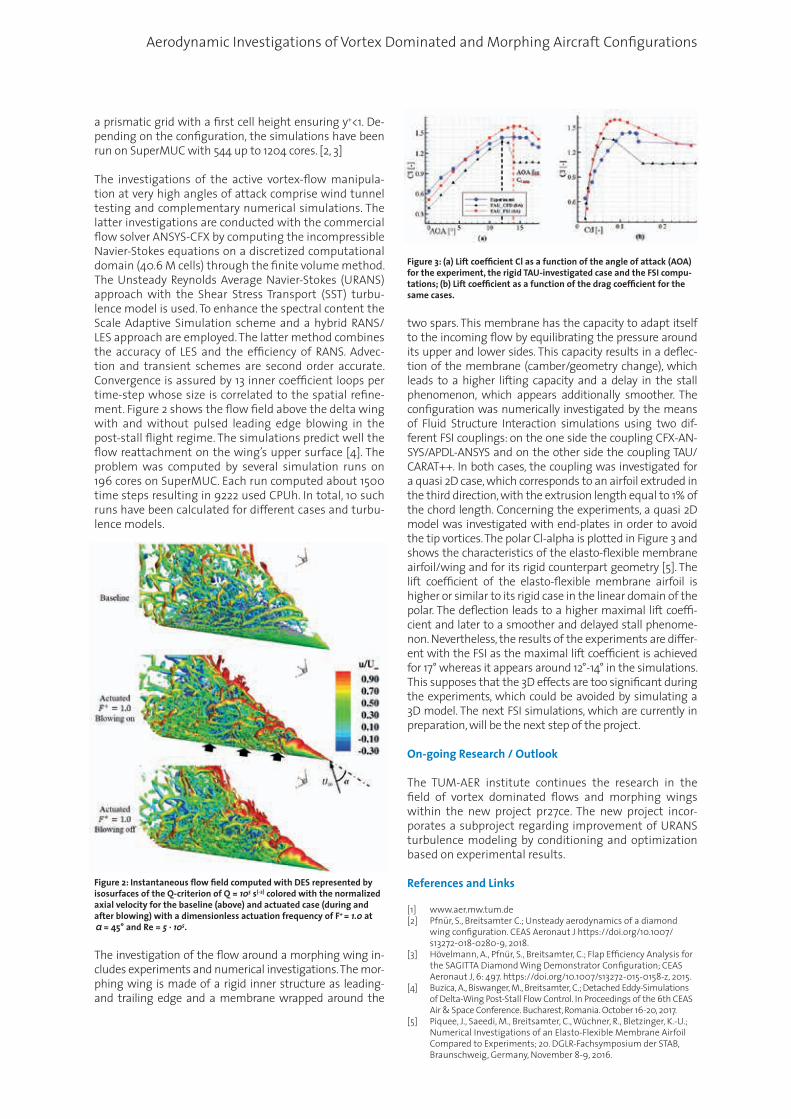
Aerodynamic Investigations of Vortex Dominated and Morphing Aircraft Configurations
a prismatic grid with a first cell height ensuring y+<1. De-pending on the configuration, the simulations have been run on SuperMUC with 544 up to 1204 cores. [2, 3]
The investigations of the active vortex-flow manipula-tion at very high angles of attack comprise wind tunnel testing and complementary numerical simulations. The latter investigations are conducted with the commercial flow solver ANSYS-CFX by computing the incompressible Navier-Stokes equations on a discretized computational domain (40.6 M cells) through the finite volume method. The Unsteady Reynolds Average Navier-Stokes (URANS) approach with the Shear Stress Transport (SST) turbu-lence model is used. To enhance the spectral content the Scale Adaptive Simulation scheme and a hybrid RANS/LES approach are employed. The latter method combines the accuracy of LES and the efficiency of RANS. Advec-tion and transient schemes are second order accurate. Convergence is assured by 13 inner coefficient loops per time-step whose size is correlated to the spatial refine-ment. Figure 2 shows the flow field above the delta wing with and without pulsed leading edge blowing in the post-stall flight regime. The simulations predict well the flow reattachment on the wing’s upper surface [4]. The problem was computed by several simulation runs on 196 cores on SuperMUC. Each run computed about 1500 time steps resulting in 9222 used CPUh. In total, 10 such runs have been calculated for different cases and turbu-lence models.
The investigation of the flow around a morphing wing in-cludes experiments and numerical investigations. The mor-phing wing is made of a rigid inner structure as leading- and trailing edge and a membrane wrapped around the
two spars. This membrane has the capacity to adapt itself to the incoming flow by equilibrating the pressure around its upper and lower sides. This capacity results in a deflec-tion of the membrane (camber/geometry change), which leads to a higher lifting capacity and a delay in the stall phenomenon, which appears additionally smoother. The configuration was numerically investigated by the means of Fluid Structure Interaction simulations using two dif-ferent FSI couplings: on the one side the coupling CFX-AN-SYS/APDL-ANSYS and on the other side the coupling TAU/CARAT++. In both cases, the coupling was investigated for a quasi 2D case, which corresponds to an airfoil extruded in the third direction, with the extrusion length equal to 1% of the chord length. Concerning the experiments, a quasi 2D model was investigated with end-plates in order to avoid the tip vortices. The polar Cl-alpha is plotted in Figure 3 and shows the characteristics of the elasto-flexible membrane airfoil/wing and for its rigid counterpart geometry [5]. The lift coefficient of the elasto-flexible membrane airfoil is higher or similar to its rigid case in the linear domain of the polar. The deflection leads to a higher maximal lift coeffi-cient and later to a smoother and delayed stall phenome-non. Nevertheless, the results of the experiments are differ-ent with the FSI as the maximal lift coefficient is achieved for 17° whereas it appears around 12°-14° in the simulations. This supposes that the 3D effects are too significant during the experiments, which could be avoided by simulating a 3D model. The next FSI simulations, which are currently in preparation, will be the next step of the project.
On-going Research / Outlook
The TUM-AER institute continues the research in the field of vortex dominated flows and morphing wings within the new project pr27ce. The new project incor-porates a subproject regarding improvement of URANS turbulence modeling by conditioning and optimization based on experimental results.
References and Links
[1] www.aer.mw.tum.de[2] Pfnür, S., Breitsamter C.; Unsteady aerodynamics of a diamond
wing configuration. CEAS Aeronaut J https://doi.org/10.1007/s13272-018-0280-9, 2018.
[3] Hövelmann, A., Pfnür, S., Breitsamter, C.; Flap Efficiency Analysis for the SAGITTA Diamond Wing Demonstrator Configuration; CEAS Aeronaut J, 6: 497. https://doi.org/10.1007/s13272-015-0158-z, 2015.
[4] Buzica, A., Biswanger, M., Breitsamter, C.; Detached Eddy-Simulations of Delta-Wing Post-Stall Flow Control. In Proceedings of the 6th CEAS Air & Space Conference. Bucharest, Romania. October 16-20, 2017.
[5] Piquee, J., Saeedi, M., Breitsamter, C., Wüchner, R., Bletzinger, K.-U.; Numerical Investigations of an Elasto-Flexible Membrane Airfoil Compared to Experiments; 20. DGLR-Fachsymposium der STAB, Braunschweig, Germany, November 8-9, 2016.
Figure 2: Instantaneous flow field computed with DES represented by isosurfaces of the Q-criterion of Q = 105 s(-2) colored with the normalized axial velocity for the baseline (above) and actuated case (during and after blowing) with a dimensionless actuation frequency of F+ = 1.0 at α= 45° and Re = 5 ∙ 105.
Figure 3: (a) Lift coefficient Cl as a function of the angle of attack (AOA) for the experiment, the rigid TAU-investigated case and the FSI compu-tations; (b) Lift coefficient as a function of the drag coefficient for the same cases.

138
Computational Fluid Dynamics and Engineering
phenomena behind flame acceleration and DDT in ob-structed channels, even on necessarily under-resolved meshes. The quality of DDT predictions itself depends on the underlying mechanism. In contrast to successful simulations of DDT by shock focusing, prediction of DDT in the vicinity of the turbulent flame brush is less reli-able. The code accurately reproduces key safety charac-teristics such as the detonation propagation velocity and associated pressure loads.
Following the motivation of this work, the developed solver was finally applied to a full-scale Konvoi-type light water reactor, i.e. a standardized German pressurized wa-ter reactor design. Hypothetical DDT scenarios in glob-ally lean hydrogen-air mixtures demonstrate a highly three-dimensional behavior of flame propagation in the containment. As expected, a strong sensitivity of the ex-plosion process on mixture composition was observed.
A spherical shape of the containment is characteristic of the Konvoi design. It contains the entire four-loop reactor coolant system which is under operating pressure. The steel-made spherical structure is self-supported and pro-vides a barrier against the release of radioactive substanc-es to the environment. Its diameter is 56 m and its wall thickness is typically 38 mm. The containment is designed to withstand a static pressure of 6.3 bar. The surrounding reactor building is built of reinforced concrete to shield
Numerical Simulation of Flame Acceleration and Deflagration-
to-Detonation Transition in Large Confined Volumes Research InstitutionLehrstuhl für Thermodynamik, Technische Universität MünchenPrincipal InvestigatorJosef HaßlbergerResearchersJosef HaßlbergerProject PartnersGemeinnützige Gesellschaft für Anlagen- und Reaktorsicherheit mbH
SuperMUC Project ID: pr86ka
3
Figure 1: Sectional view of the Konvoi-type pressurized water reactor model.
Introduction
In the framework of a research project funded by the German Federal Ministry of Economic Affairs and Ener-gy (BMWi), a CFD combustion solver has been extended for the purpose of nuclear safety analysis. The method-ology aims at the prediction of industry-scale hydrogen explosions like in the Fukushima-Daiichi core meltdown accident, with a particular focus on the hazardous Def-lagration-to-Detonation Transition (DDT) phenomenon. Independent of the specific nuclear safety motivation of this work, the methodology can equally be applied to other potentially hazardous situations involving acciden-tal release of hydrogen in air, e.g. in chemical and process industry.
Results and Methods
Contrary to the state-of-the-art in large-scale explosion modeling, the entire combustion process was computed within a single solver framework. The usage of empirical combustion regime transition criteria was deliberately avoided. The multi-physics multi-scale problem poses several challenges which were met by special numeri-cal techniques. As a key element, the developed hybrid flame-tracking shock-capturing scheme reduces grid de-pendency by treating the flame as a reactive discontinui-ty which is propagated by a geometrical Volume-of-Fluid method. At the same time, gas-dynamic discontinuities, especially shocks, are calculated by an approximate Riemann solver. Adaptive mesh refinement was addi-tionally implemented to reduce overall computational cost. The spatial resolution is locally adapted according to the highly unsteady evolution of explosions.
For the validation of the numerical model, the largest ever conducted indoor DDT experiments in the RUT fa-cility (Kurchatov Institute, Moscow region) were chosen because of their industry-scale geometrical dimensions. Investigated DDT mixtures are close to the safety-rele-vant lower detonation limit which was measured at 12.5% of hydrogen in air. As the simulations showed, the methodology is generally able to capture the essential

139
Numerical Simulation of Flame Acceleration and Deflagration-to-Detonation Transition
the reactor against external events. Here, the primary question to answer is whether the integrity of the steel liner containment is jeopardized by explosions of certain severeness. The domain of interest is thus limited to the inside of the containment. Reactor building rooms outside of the containment are not taken into account.
The corresponding three-dimensional model in Fig. 1, pro-vided by Germany’s nuclear safety agency GRS gGmbH, includes typical plant components (reactor pressure vessel, steam generators, pressurizer, polar crane etc.) as well as internal concrete structures (steam generator towers, reactor cavity, spent fuel pool, sump etc.). Small-scale installations like pipes in the low-level rooms have to be neglected given a reasonable mesh density. It re-mains an open question to what extent the combustion process is influenced by such simplifications. Doors and burst disks, mounted at the top of the steam generator towers, are assumed open. They either failed prior to ig-nition or they are destroyed by precursor pressure waves. In any case, these components do not hinder explosive flame propagation decisively.
For one of the investigated cases, Fig. 2 gives an impres-sion of the complexity of the explosion process in a nu-clear reactor. It underscores the point of doing extensive CFD simulations for this kind of analysis. At two points in time, the wall pressure and the semi-transparent flame contour are visualized for one half of the reactor. The snapshot at 450 ms after ignition (left picture) is before DDT, and 500 ms (right picture) is after DDT. With the onset of detonation comes a strong rise in wall pressure load. A detonation wave and reflected pressure waves are propagating in the upper part of the containment.
On-going Research / Outlook
Using the SuperMUC high performance cluster, a step towards deterministic DDT simulations on full reactor scale has been made. A total of 6 mio. CPU hours was granted for this purpose and the simulations were usu-ally executed on 1024 or 2048 cores. Several publications resulted from the project, see references list below for example.
In a follow-up project, the capabilities of the Open-FOAM-based solver are currently being enhanced (with respect to nuclear safety analysis): extending the hydro-gen-air mixture by inert steam and flammable carbon monoxide, including the effect of unresolvable small ob-stacles via the distributed porosity concept and improv-ing the sub-grid modeling of intrinsic flame instabilities.
References
To find out more about the project, interested readers may consult these papers:
[1] J. Hasslberger, L.R. Boeck, and T. Sattelmayer. Numerical simulation of deflagration-to-detonation transition in large confined volumes. Journal of Loss Prevention in the Process Industries, 36:371-379, 2015. doi: 10.1016/j.jlp.2014.11.018
[2] J. Hasslberger, P. Katzy, L.R. Boeck, and T. Sattelmayer. CFD simula- tion of deflagration-to-detonation transition in a full-scale Konvoi-type pressurized water reactor. Nuclear Engineering and Radiation Science, 3(4):041014, 2017. doi: 10.1115/1.4037094
Figure 2: Wall pressure including semi-transparent flame contour before DDT (left picture) and after DDT (right picture); Rainbow color scale representing the range from 2.5 to 30 bar.

140
Computational Fluid Dynamics and Engineering
vices consisting of fully resolved rigid bodies of arbitrary shape in 3D. An effortless exchange of the constituents of the considered micro devices, adapting the surround-ing channel geometry according to the specific needs, or regarding regimes beyond low Reynolds numbers are only some of the potential benefits associated with the use of this coupled software framework.
(2) Another project implemented within waLBerla is the simulation of electron beam melting, an additive man-ufacturing method. Electron beam melting is used to produce successive layers of a part in a powder bed and offers the ability to produce components closest to their final dimensions with good surface finish. Currently, this process is faster than any other technique of comparable quality. However, the parts are not produced at sufficient rate to make them economically viable for any but very high value applications. One key output of the project is the knowledge surrounding the use of the high powder electron beam gun, including the process control, and a modelled and validated understanding of beam-pow-der bed interaction. The outcome of the simulations are compared with real experimental data and therefore the model parameters are adjusted in such a way that the resulting numerical melt pool sizes correspond to the ex-perimental ones.
Scalable Multi-Physics with waLBerla
Research InstitutionLehrstuhl Informatik 10 (Systemsimulation), Universität Erlangen-Nürnberg (Germany)Principal InvestigatorHarald KöstlerResearchersU. Rüde, D. Bartuschat, R. Ammer, K. Pickl Project Partners: M. Markl, C. Körner, A.-S. SmithProject Partners—
SuperMUC Project ID: pr86ma
3
Introduction
Applications in the field of computational fluid dynam-ics (CFD) often demand high resolutions and thus com-putational resources, in particular regarding memory and arithmetic operations. The waLBerla framework is designed for massively parallel simulations of different applications from CFD. waLBerla is a lattice Boltzmann based numerical fluid flow software framework for the simulation of numerous physical applications, e.g., blood flow in the human heart or moving obstacles represent-ing cells or bacteria in a fluid. The framework is devel-oped carefully for outstanding single-core performance as well as excellent scalability. Especially on the large scales, this approach enables to utilize the scarce and ex-pensive computing resources most efficiently and allows for domain sizes otherwise not achievable on current su-percomputers.
(1) One project using waLBerla investigates collective swarming behavior of numerous self-propelled micro-organisms at low Reynolds numbers (Stokes flow), e.g., a swarm of Escherichia coli (E. coli) bacteria. In this pro-ject, waLBerla is consistently coupled with the resear-achers’s rigid body simulation tool pe (physics engine). This allows the scientists to simulate self-propelled de-
Figure 1: Exemplary setup of a small swarm consisting of 384 swimmers on 3 processes. The visualized planes represent process boundaries in swimming direction. The surrounding simulation domain is set periodic in all directions. The largest simulated setup of exact copies of such grids of 2x8x8 swimmers per process consisted of 16,777,216 swimmers. Copyright: Universität Erlan-gen-Nürnberg, Lehrstuhl Informa-tik 10 (Systemsimulation)

141
Scalable Multi-Physics with waLBerla
(3) A third project is motivated by the increasing impor-tance of lab-on-a-chip (LoC) systems. The great inter-est in LoC systems is attributable to the fact that they can be used as portable biological analysis devices for point-of-care diagnostics. Electro-osmosis and electro-phoresis are the mechanisms of choice for microfluidic manipulation and actuation in LoC devices. At the small scales of LoC systems, measurements of the flow are very difficult. Thus, simulations are required for the de-sign and optimization of those systems. In order to cap-ture the multiple physical effects accurately at small scale a very fine discretization and small time steps are necessary, resulting in the need for a large amount of computational resources. In the scope of this project, the separation of charged macromolecules in electro-lyte solutions inside channels of dimensions relevant for LoC is simulated.
References:
[1] Ammer, R., Markl, M., Ljungblad, U., Körner, C., & Rüde, U. (2014). Simulating fast electron beam melting with a parallel thermal free surface lattice Boltzmann method. Computers & Mathematics with Applications, 67(2), 318-330. doi:10.1016/j.camwa.2013.10.001
[2] Bartuschat, D., & Rüde, U. (2015). Parallel Multiphysics Simulations of Charged Particles in Microfluidic Flows. Journal of Computation-al Science, 8(0), 1-19. doi:10.1016/j.jocs.2015.02.006
[3] Godenschwager, C., Schornbaum, F., Bauer, M., Köstler, H., & Rüde, U. (2013). A Framework for Hybrid Parallel Flow Simulations with a Trillion Cells in Complex Geometries. Proceedings of the Interna-tional Conference on High Performance Computing, Networking, Storage and Analysis (pp. 35:1-35:12). Denver, Colorado: ACM. doi:10.1145/2503210.2503273
[4] Pickl, K., Hofmann, M., Preclik, T., Köstler, H., Smith, A.-S., & Rüde, U. (2014). Parallel Simulations of Self-propelled Microorganisms. In M. Bader, A. Bode, H.-J. Bungartz, M. Gerndt, G. R. Joubert, & F. Peters, Parallel Computing: Accelerating Computational Science and Engi-neering (CSE) (pp. 395-404). München: IOS Press. doi:10.3233/978-1-61499-381-0-395
Figure 3: Bisecting micro-channel: separation of oppositely charged particles with a radius of 60μm in fluid flow.
Figure 2: Powder bed partially melt-ed with a moving electron beam. The liquid melting pool with its free surface is positioned on top of the melted ring, while the rest of the ring has solidified already. Arbitrary items can be manufactured by repeating the powder application and melting process. Copyright: Universität Erlangen-Nürnberg, Lehrstuhl Informatik 10 (System-simulation)

142
Computational Fluid Dynamics and Engineering
LES approach based on the Adaptive Local Deconvolu-tion (ALDM) method [2]. To consider two-phase effects, we apply the homogenous-mixture cavitation model. The actual vapor-liquid interface of cavitation structures is not reconstructed in this barotropic model. Surface tension thus is neglected. Recently, we have extended the single-fluid two-phase model by a component of non-condensable gas. Complex (moving) bodies are con-sidered by a conservative cut-cell method [3].
Results
Interaction of turbulence and cavitationWe have performed wall-resolved LES of the flow through a generic throttle to validate our model in the context of turbulent, cavitating nozzle flows [4]. At pressure difference 300 to 115 bar, we observe periodic formation of vapor in the detached shear layer at the throttle inlet (left column of Fig. 1). When the pressure difference is increased (300 to 55 bar, right column of Fig. 1), a stable vapor sheet develops at the throttle inlet. In the throttle center, cavitation in large, stable vortices is observed.
We find that while turbulence and vortex dynamics play a dominant role at low pressure differences, the forma-tion of a stable sheet cavity and cavitating vortices sup-press turbulence at high pressure differences.
Break-up of cavitating liquid jetsRecently, we have studied the break-up of cavitating liq-uid jets in a free gas phase [5]. The setup resembles a ge-neric, scaled-up automotive fuel injector and consists of a cavitating water jet emanating from a rectangular nozzle
Cavitation Erosion in Injection Systems
Research InstitutionInstitute of Aerodynamics and Fluid Mechanics, Prof. N. A. Adams, TUMPrincipal InvestigatorTheresa TrummlerResearchersFelix Örley, Christian Egerer, Steffen SchmidtProject Partners—
SuperMUC Project ID: pr86ta
3
Figure 1: Instantaneous turbulence (top) and cavitation structures (bot-tom) in a generic throttle valve. Pressure difference 300 to 115 bar (left) and 300 to 55 bar (right).
Introduction
Developments in direct Diesel injection systems in-crease rail pressures to more than 2500 bar. This trend aims at enhancing jet break-up and mixing to improve combustion and reduce emissions. Higher flow acceler-ation, however, implies thermo-hydrodynamic effects, such as cavitation, which occur when the liquid evapo-rates locally. The collapse of such vapor structures causes strong shock waves. When bubbles collapse near a solid wall, high-velocity liquid jets directed towards material surfaces are created. Imposed structure loads can lead to material erosion, which may be so strong that the per-formance degrades severely or devices may fail. On the other hand, these loads are used to clean nozzle holes and throttles from surface deposits, and can promote jet break-up. Furthermore, two-phase flows can be used to maintain choked nozzle conditions and a constant mass flow rate.
Understanding the flow phenomena inside an injection system is necessary to quantify the effects of turbulence and cavitation, and their influence on jet and spray charac-teristics. Small dimensions, high operating pressures and short timescales make the instrumentation of fuel noz-zles with experimental equipment challenging. Compu-tational Fluid Dynamics (CFD) can provide time-resolved information on flow structures in arbitrary small geome-tries. Numerical simulations thus have become an impor-tant tool in the design process of injection systems.
The present research project focuses on the prediction of cavitation erosion in fuel injection systems using a CFD approach. This includes wave dynamics, interaction of cavitation and turbulence as well as flow transients due to moving geometries. In our project, we use Large Eddy-simulation (LES) to understand the flow dynamics. Our simulations run on SuperMUC in the massively par-allelized numerical framework INCA [1].
Numerical Method
With LES, the smallest turbulent flow scales are not resolved on the computational grid. Effects of these scales thus must be modelled. We employ an implicit

143
Cavitation Erosion in Injection Systems
injected into air. We investigated several operating condi-tions that lead to different cavitation characteristics.
In a supercavitating state, see right column of Fig. 2, we observe a stronger break-up of the liquid jet than in case of developing cavitation, see left column of Fig. 2.
From an analysis of the transient data we have identified three main mechanisms that lead to distortions of the jet surface and, ultimately, to a widening and break-up of the jet. First, turbulent fluctuations, which are induced by col-lapse events in the proximity of the exit plane of the noz-zle, add to the momentum in wall-normal direction. Sec-ond, low pressure vapor regions near the nozzle exit and the gas filled plenum form a pressure gradient, which en-ables entrainment of gas from the outlet region into the nozzle. When the gas is being ejected again, the water is accelerated towards the side walls and creates large scale bulges of liquid. Third, collapse events of cavitation struc-tures inside the jet near the liquid-gas interface induce high velocity liquid jets directed towards the interface.
9-hole Diesel injector with moving needleTo study our models in realistic environments, we in-vestigate the turbulent multiphase flow inside a 9-hole common rail Diesel injector during a full injection cycle of ISO 4113 Diesel fuel at a pressure of 1500 bar into air. Our simulation includes a prescribed needle movement. The nozzle holes have a mean diameter of 150μm.
The analysis of the turbulent flow field reveals that the opening and closing phase are dominated by small-scale turbulence, while in the main injection phase large vorti-
cal structures are formed in the volume upstream of the needle seat, and reach into the nozzle holes, see Fig. 3. In each hole, several of these structures are present at the same time. During and after the closing phase, cavitation structures are detected in the nozzle holes and in the sac hole region, see Fig. 4, and cause violent collapse events. Subsequently, the collapse of the sac hole cavity and rebound effects cause a large number of strong events near the lowest point of the sac hole. These events dur-ing this phase thus are considered to be most likely to cause surface erosion inside the device during operation.
On-going Research and Outlook
Our studies helped us to better understand the dynamics of cavitating, turbulent fluid flows in injection systems. High-performance computing is a necessary tool to ad-dress the requirements that the investigations of tur-bulent, cavitating flows impose on spatial and temporal resolution. Due to the high speed of sound, the time step size usually is on the order of less than a nano-second, while near-wall turbulence requires a high grid resolution and thus causes a large number of cells. Our simulations usually run on up to 5600 cores to compute physical time scales on the order of micro-seconds. Current research topics include the development of improved gas models with degassing and solution of gas in liquid, the analysis of fluid structure interaction in the context of cavitation, the modeling of quantitative erosion prediction in cavitat-ing flow environments, and acceleration methods for CFD codes for the simulation of cavitating flows.
References and Links
[1] http://www.inca-cfd.com http://www.aer.mw.tum.de[2] Hickel, S., Egerer, C. P., & Larsson, J. (2014). Subgrid-scale modeling
for implicit large eddy simulation of compressible flows and shock-turbulence interaction. Physics of Fluids, 26(10), 106101. doi:10.1063/1.4898641
[3] Örley, F., Pasquariello, V., Hickel, S., & Adams, N. A. (2015). Cut-ele-ment based immersed boundary method for moving geometries in compressible liquid flows with cavitation. Journal of Computa-tional Physics, 283(C),1–22. doi:10.1016/j.jcp.2014.11.028
[4] Egerer, C. P., Hickel, S., Schmidt, S. J., Adams, N. A., 2013. Large-eddy simulation of turbulent cavitating flow in a micro channel. Physics of Fluids, 26(8), 085102. doi:10.1063/1.4891325.2
[5] Örley, F., Trummler, T., Hickel, S., Mihatsch, M. S., Schmidt, S. J., Adams, N. A., (2015). Large-eddy simulation of cavitating nozzle flow and primary jet break-up. Physics of Fluids, 27(8), 086101. doi:10.1063/1.4928701
Figure 2: Cavitation structures (blue) and jet surface (grey) for develop-ing cavitation (left) and supercavitation (right): perspective view (top) and top view (bottom).
Figure 3: Coherent vortical structures during the main injection phase colored by velocity in the half-domain.
Figure 4: Cavitation structures inside the nozzle holes and sac hole shortly after full closing of the injector needle.

144
Computational Fluid Dynamics and Engineering
The relevance of the arrangement of the roughness ele-ments for the problem of estimating the flow resistance clearly appeared from the simulations and previous ex-perimental findings. Schlichting (1936) was the first who systematically investigated the effects on open-channel flow of combining different (regular, homogeneous) ar-rangements of spheres mounted on a smooth wall and varying their size and their relative distance. Schlicht-ing (1936) understood the limit of parametrising the roughness with a single parameter (e.g. the roughness Reynolds number) and introduced the “roughness densi-ty”, namely the number of roughness elements per unit area. In fact, Nikuradse (1933) carried out several series of experiments on artificially roughened pipe character-ised by constant roughness density. Indeed, a great and unjustified effort is required to reduce the effect of any generic roughness to the Nikuradse standard (the so called “equivalent sand roughness”). Beyond the practi-cal application of these concepts for engineering purpos-es, which are required for simplicity and generality, our interest is to understand the effect of the arrangement of roughness elements on the turbulence structure. In particular, at constant roughness density, can the only arrangement affect the flow resistance?
In order to contribute to this knowledge, another sim-ulation was carried out which was characterised by the same flow rate (bulk Reynolds number approximately equal to Reb=7000) and relative roughness (equal to 0.18) as the previous one, but with the spheres arranged randomly on the wall. Thus, the effect of the arrange-ment was isolated. The two simulations with square and random arrangement of roughness elements are here-after referred to as S and R. Before computing run R, the spheres were preliminarily released from their positions, “shaken” and re-crystallized, thereby the bed displaying a “random” pattern. Since the spheres were close, they tended to pack in patches with a hexagonal arrange-ment and orientation of the hexagons that changed “randomly” patch by patch. The number of roughness el-ements (1024), the relative roughness as well as the size of the domain were preserved from the run S. Actually,
Direct Numerical Simulation of Open-Channel Flow at Fully-Rough Regime
Research InstitutionInstitute for Hydromechanics (IfH), Karlsruhe Institute of TechnolgyPrincipal InvestigatorMarkus UhlmannResearchersMarco MazzuoliProject Partners—
SuperMUC Project ID: pr87yo
3
Introduction
Fluvial streams are determined by the balance between gravitational forces and bed resistances. The former are proportional to the bed slope while the latter are char-acterised by the geometrical features of the bottom. If the flow is steady and the bed is fixed, the flow rate is a function only of the flow depth (rating curves). None-theless, estimating the rating curves is challenging, in particular if the ratio of the bed roughness size to the flow depth, namely the relative roughness, is large, because the entire flow structure is affected by the shape, the size and the arrangement of the roughness elements (e.g. the grain and spatial distributions of a gravel-bed creek). Also obtaining accurate information of the open-channel flow in the vicinity of the bottom is not easy, even in the laboratory, while the support pro-vided by direct numerical simulation (DNS) is typically limited to cases where the flow rate is not relevant for practical applications. In the context of the present pro-ject, however, the open-channel flow was investigated by DNS for values of the bulk Reynolds which fall in the range of the fully-rough regime, revealing the structure of turbulence close to and through the bed roughness. In a first simulation Mazzuoli & Uhlmann (2017) con-sidered spherical roughness elements arranged in a square closely-packed pattern in order to compare with the previous investigations of Chan-Braun et al. (2011, 2013) in the transitionally-rough regime. Some of these results were also presented by Mazzuoli & Uhlmann (2016).
In a recent experiment, Amir et al. (2014) investigated the open-channel flow at the fully-rough regime and for large values of the relative roughness (ranging between 0.2 and 0.4) and measured the velocity field and the hy-drodynamic (pressure) forces acting on spheres placed in honeycomb arrangement on a plane wall. Mazzuoli & Uhlmann (2017) compared with the experiment of Amir et al. (2014) which were carried out for similar Reynolds numbers. Some detail of the comparison is described in the following section.

145
Direct Numerical Simulation of Open-Channel Flow at Fully-Rough Regime
such bed geometry, although it preserves a certain regu-larity, is more representative of the natural configuration of a river bed than the square one. Some of the results obtained from the latter simulation are outlined in the following.
runs (Lx, Ly, Lz) (Nx, Ny, Nz) D+ Reτ Reb
S (12, 1, 3)H (6912, 576, 1728) 120 550 7000R (12, 1, 3)H (6912, 576, 1728) 140 650 7000
Table 1: Grid size and parameters of present simulations.
Methods and Results
The Navier-Stokes and continuity equations were ap-proximated by a second-order finite-difference scheme and solved numerically with a fractional-step method. The velocity was forced to vanish at the surface of the roughness elements by means of the direct-forcing im-mersed-boundary method proposed by Uhlmann (2005). A uniform and equispaced computational grid was used with grid-spacing of about one wall unit. Table 1 shows the details of the domain size in the streamwise (x), wall-normal (y) and spanwise (z) directions, where H de-notes the open-channel height and N the number of grid points in each direction.
The results obtained from the simulation S were com-pared to those obtained by Chan-Braun et al. (2011) in the transitionally-rough regime. Mazzuoli & Uhlmann (2017) describe the flow structure in the region about the crest of the spheres which is no longer characterised by the presence of a buffer layer between the flow through the interstices of the roughness and the logarithmic region extending above the spheres. It was showed that in the fully-rough regime most of velocity fluctuations below the crest of the spheres was not turbulent, but was asso-ciated with the stationary vortex structures developing through the roughness. Both in the transitionally and ful-ly-rough regimes secondary flows stem from the interac-tion of the primary flow with the spheres, which consist in spanwise oriented recirculating cells. In the latter case, the roughness elements penetrate deeper towards the core flow, causing different effects: the secondary flow to develop significantly closer to the bottom; the vortices about the spheres to stretch in the streamwise direction; the average lift force acting on the roughness elements to increase with respect to the transitionally-rough case along with the intensity of both drag and lift fluctua-tions.
Finally, Chan-Braun et al. (2011) noted that, in the transi-tionally-rough regime, the statistics of the fluctuations of hydrodynamic forces acting on the spheres could be put in an analogy with those measured over a smooth wall. Such analogy fails in the fully-rough regime.
It is found that the only change of the arrangement of the roughness elements substantially affects the flow resistance and, consequently, mean and turbulent quan-tities. In particular, the Chézy coefficient (which is a “con-
ductance” defined as the ratio between the bulk velocity and the friction velocity) is found to be about the 15% smaller than in run S. Figure 1a shows that the veloci-ty profile sufficiently far form the sphere crests (in the logarithmic region) is shifted with respect to the case in absence of the roughness by an amount, ΔU+ (called roughness function) that is significantly larger in run R than in run S. A value of ΔU+ similar to that obtained for the run R was measured by Amir et al. (2014) in an open-channel with relative roughness equal to 0.2 and spherical roughness elements in closely-packed hex-agonal arrangement, but for values of Reb and of the roughness Reynolds number, D+, much larger than in run R. Indeed, it is confirmed what Mazzuoli & Uhlmann (2017) supposed, that the flow resistance in a random
Figure 1: (a) Velocity profiles. (b) Roughness function plotted vs the equivalent sand roughness (grey markers indicate previous experimen-tal results – see Figure 3 of Chan-Braun et al. (2011) for a reference). (c) Secondary flow developing in the plane orthogonal to the primary flow for the case of run R.

146
Computational Fluid Dynamics and Engineering
arrangement of roughness elements is larger than in a regular arrangements, even if the “roughness density” is unchanged. Comparing the value of ΔU+ obtained for run R with previous experimental and numerical results plotted as a function of the equivalent sand roughness (cf. Figure 1b), it is found that run R is placed well in the region of the fully rough regime (which is approximate-ly limited by ΔU+>50). Far from the bottom, the spatial scales of turbulent structures are controlled by the spatial distribution of the flow-blockage produced by the spheres. In fact, the number of spheres that can be counted along a streamwise line is not independent of the spanwise coordinate. This non-homogeneity reflects, for instance, on the generation of secondary flows of size comparable with the open-channel height (as shown in Figure 1c) and, contextually, on the spacing of low- and high-speed streaks (cf. Figure 2b). Indeed, large coherent
structures (with size of order H) are observed in both the simulations, but a regular pattern of low- and high-ve-locity regions like that induced in run S by the square ar-rangement of the spheres (Figure 2a) can not be detect-ed in the case of run R. Also the intensity of the streaks is larger in the run R, causing stronger secondary flows.
It is worthwhile to stress that, at the scale of the com-putational domain, the roughness density is identical for the two runs and slight differences arise only local-ly (i.e. at the scale of a few times the roughness size) or along a line. Hence, the remarkably different turbulence structure and hydrodynamic forces are only related to the arrangement of the roughness elements. Indeed, it is well documented for gravel beds, the drag acting on the stones is somewhat affected by the presence of oth-er stones, typically of different size, aligned upstream.
Figure 2: Low- and high-speed streaks identified by isocontours of the streamwise component of velocity fluctuations at u’+=±2.2 for the run S (a) and run R (b).
Figure 3: (a) Sketch of the calculation of the hiding effect produced by red spheres on the grey one. Top views (b) and (c) show the spheres coloured by the complement of local blockage and dimensionless drag fluctuations.
3

147
Direct Numerical Simulation of Open-Channel Flow at Fully-Rough Regime
Sometimes it is referred to as “hiding effect” because stones, shielded by other stones, experience a weakened drag force and are possibly not set into motion (Garcìa & Parker, 1991).
Presently, a remarkable correlation is found between the drag force fluctuations acting on individual roughness elements and the relative position of upstream neigh-bouring spheres (local blockage). The complement to 1 of the blockage (also referred to as conductance) for each sphere (e.g. the grey sphere in Figure 3a) is calculated as the ratio between the complement to the projection area of upstream neighbouring spheres (the red area in Figure 3a) to the full area of the rectangle Ω. In Figure 3a the red spheres are those that “hide” the grey one.
The spheres in Figure 3b marked with warmer colours correspond to those for which the conductance is large, i.e. the spheres most exposed to the flow. It can be appre-ciated from Figure 3c that these spheres also experience strong drag fluctuations.
About 24M CPU hours were allocated on SuperMUC for the project. Run S and run R were computed over 6561 cores of SuperMUC Phase 1 (411 nodes) and Phase 2 (235 nodes). Each time step was computed in ~24 s, even though the best performance (15 s) was observed on Phase 2 by using 6561 cores over 411 nodes. The post-pro-cessing was performed on SuperMUC with Octave using simple MPI-like-parallel scripts while graphical objects were created on the facilities of the Steinbuch Center of Computation (SCC, Karlsruhe).
On-going Research
In the next future, a systematic series of simulations, even in the transitionally rough regime, should be per-formed to understand the effect of the arrangement of the roughness elements on the flow structure for in-stance by using different patterns and inter-distances between the spheres.
We acknowledge that the present work was funded by the DFG project UH 242/4-2.
References and Links
[1] Marco Mazzuoli, Markus Uhlmann. 2017. Direct numerical simu-lation of open-channel flow over a fully-rough wall at moderate relative submergence. J FLUID MECH 824 (Jul 2017) 722-765. DOI:https://doi.org/10.1017/jfm.2017.371
[2] Clemens Chan-Braun, Manuel García-Villalba, and Markus Uhl-mann. 2011. Force and torque acting on particles in a transitionally rough open-channel flow. J FLUID MECH 684 (Oct 2011) 441-474. DOI: http://dx.doi.org/10.1017/jfm.2011.311
[3] Clemens Chan-Braun, Manuel García-Villalba, and Markus Uhl-mann. 2013. Spatial and temporal scales of force and torque acting on wall-mounted spherical particles in open channel flow. Physics of Fluids 25, 7 (Jul 2013). DOI: https://doi.org/10.1063/1.4813806
[4] Mazzuoli, M., Uhlmann M. 2016. Direct Numerical Simulation of Open-Channel Flow at Fully-Rough Regime, High Performance Computing in Science and Engineering, Garching/Munich pp.164-165, ISBN: 978-3-9816675-1-6
[5] Mohammad Amir, Vladimir I. Nikora, and Mark T. Stewart.. 2014. Pressure forces on sediment particles in turbulent open-channel flow: a laboratory study, J FLUID MECH 757, (Oct 2014), 458-497. DOI: http://dx.doi.org/10.1017/jfm.2014.498
[6] Schlichting, Hermann. 1936. Experimentelle untersuchungen zum rauhigkeitsproblem. Ingenieur-Archiv 7, 1 (Feb 1936).
[7] Nikuradse, Johann. 1933. Strömungsgestze in rauhen Rohren. Forschungsheft, Verein Deutscher Ingenieure 361.
[8] Markus Uhlmann. 2005. An immersed boundary method with direct forcing for the simulation of particulate flows. J COMPUT PHYS 209, 2 (Nov 2005) 448-476. doi:10.1016/j.jcp.2005.03.017
[9] Garcìa, Marcelo and Parker, Gary. 1991. Entrainment of bed sediment into suspension, Journal of Hydraulic Engineering 117, 4 (Apr 1991) 414-435.
DOI: https://doi.org/10.1061/(ASCE)0733-9429(1991)117:4(414)

148
Computational Fluid Dynamics and Engineering
case the governing equations contain unclosed corre-lations which require modelling. Especially challenging in this context are the highly nonlinear, unclosed terms which originate from filtering the chemical source term (turbulence-chemistry-interaction). Due to the high computational cost, it is at present not possible to use highly elaborate modelling approaches for each of the cited problems at the same time (turbulence, and tur-bulence-chemistry-interaction). Thus, two modelling ap-proaches are followed in this project, where a simple ap-proach is deliberately chosen for one of the fields in order to develop elaborate models at realistic simulation times.
The first approach uses computationally efficient RANS turbulence modelling in combination with a Transported Probability Density Function (TPDF) method [1], to describe turbulence-chemistry-interaction. A great advantage of TPDF is that the chemical source term appears in closed form. In the second approach the focus is on a detailed and time-resolved description of large turbulent structures by LES. An efficient model is used for sub-grid scale turbu-lence chemistry interaction, namely a Finite-Rate-Chem-istry (FRC) model with an Assumed Probability Density Function (APDF) closure [2].
Model development for sooting turbulent flames by means of
two complementary high-fidelity numerical simulationsResearch InstitutionGerman Aerospace Center (DLR), Institute of Combustion TechnologyPrincipal InvestigatorP. GerlingerResearchersM. Grader, C. Eberle, A. FiolitakisProject Partners—
SuperMUC Project ID: pr87zi
3
Figure 1: Phenomenology of soot formation based on [5].
Introduction
Combustion is one of the oldest heat and power gener-ation technologies and continues to play an important role in covering the energy demand of the world. The intense use of combustion, however, has led to several environmental problems. One of them is the emission of soot. Soot and soot precursors are suspected to be carcinogenic. Furthermore, soot particle emissions from aircraft engines influence the formation of cirrus clouds at high altitudes and have thus an impact on the climate. From a technical point of view, soot indicates incomplete and hence less efficient combustion. By its high radiative emissivity, soot contributes to locally elevated heat loads on combustion chamber walls. Therefore, continuous ef-forts are made to improve combustion systems and to reduce their soot emissions.
Due to the increasing availability of computational re-sources, CFD (Computational Fluid Dynamics) has be-come an important tool in the design process of com-bustion systems. CFD provides detailed, time- resolved information about the three dimensional, reactive flow field and thereby complements experimental investi-gations which are in many cases limited to exhaust gas analysis, since optical access to the flame is not realiz-able. Soot predictions in technical combustion are par-ticularly challenging. Firstly, the chemical and physical processes of soot evolution are highly complex and in-volve countless of intermediate steps. Also some aspects of soot evolution are not yet fully understood and are a topic of ongoing research. Secondly, technical combus-tion occurs predominantly in turbulent flows, which are characterized by a highly unsteady, fluctuating velocity distribution.
The direct numerical simulation of such flows is com-putationally very expensive and therefore limited to a small range of problems. It is therefore common practice to derive transport equations for statistical quantities (termed “Reynolds Averaged Navier Stokes”, RANS) or to remove the smallest turbulent scales by spatial filter-ing operations (“Large Eddy Simulation”, LES). In either

Model development for sooting turbulent flames
Gas-phase-chemistry is modeled in both approaches by a detailed reaction mechanism, which describes the for-mation of small aromatics. Polycyclic aromatic hydrocar-bons (PAHs) and soot are treated by sectional approach-es, where the particle size distribution is discretized by sections with averaged chemical and physical properties. Commonly accepted PAH and soot surface chemistries are considered as summarized in Fig. 1 (for model details refer to [3]).
By developing LES and TPDF methods separately, this work represents a first step towards an improved LES/Filtered-Density-Function model for the simulation of soot formation in the future. To this end a turbulent, lifted ethylene-air flame is simulated, where compre-hensive experimental data [4] are available for mod-el validation. Due to the large number of unknowns, which are introduced by chemistry, and the extreme numerical stiffness of the problem, these simulations are computationally very expensive. Therefore high per-formance computers such as the petascale System Su-perMUC at LRZ are required.
Results and Methods
The simulations in this project have been performed by means of the in-house code THETA (Turbulent Heat Re-lease Extension of the Tau Code). THETA is a finite volume method based solver, optimized for low Mach number combustion simulation on unstructured grids. It features efficient, matrix-free linear solvers and uses domain de-composition for parallelization. State of the art turbulence models and special numerical strategies for the solution of a stiff system of coupled differential equations, com-mon to finite-rate chemistry, are implemented. To solve the transport equation of the joint thermochemical PDF for the TPDF model, a Monte-Carlo method is available. Stochastic particles are simulated, whose evolution mimic
the behavior of the PDF of the thermochemical sys-tem. The Monte-Carlo solv-er features a hybrid MPI/OpenMP parallelization paradigm and is coupled to the finite volume solver THETA.
To reduce computational costs in the TPDF/RANS simulation, the rotation-al symmetry of the flame is exploited and only a 5 degree segment is consid-ered. This segment is dis-cretized with 175,312 cells. In each cell a total of 64 stochastic particles is used in order to provide samples for PDF representation.
The grid for the APDF/LES consists of 17 million hexa-
hedral cells on which all 81 transport equations for species masses, momentum and enthalpy are solved. Statistical averaging was done for 0.1s so far and is still ongoing.
According to the phenomenology of soot formation as shown in Fig. 1, soot formation in the APDF/LES is illus-trated in Fig. 2 for the real flame.
By means of temperature contour the lifted-off flame structure is given. The remaining iso-surfaces indicate the path from fuel to soot. As fuel (blue iso-surface at the bottom) reaches the combustion zone, PAHs (green iso-surface) are formed and transform into soot (black iso-surface) further downstream. A comparison of the small structures in the fuel jet and the large structures observed further downstream shows a large disparity of turbulent time and length scales which results from the interaction of the high-velocity fuel jet with the slow co-flowing air. This is particularly challenging for time re-solved simulations, since small time steps are required for reasons of accuracy and numerical stability and on the other hand long data acquisition times are needed to obtain converged statistics. This can be seen in Fig. 3 where a preliminary result of the mean soot volume frac-tion (<fv>) on the centerline of the combustor is given. The APDF/LES result shows uncomplete statistical con-vergence in the upper part of the flame. Therefore, fur-ther statistical averaging is necessary which is ongoing. The convergence of the TPDF/RANS is not yet sufficient to compare it to experimental data. Considering the complexity of the flame, the result is in excellent agree-ment with the measurements.
On-going research / Outlook
In this project soot-formation in a turbulent, lifted, sooting ethylene-air jet-flame is modelled successfully using TPDF/RANS and APDF/LES methods in conjunc-tion with finite-rate chemistry and a sectional soot model. Both simulations are still running to obtain con-verged statistical quantities and preliminary results are promising. The comparison of both methods will help to work towards a filtered density function approach (LES/TPDF) for soot prediction.
References and Links
[1] A. Fiolitakis, P. Ess, P. Gerlinger, M. Aigner. Combustion and Flame (2014) 161:2107-2119
[2] P. Gerlinger. Combustion Science and Technology (2003) 175:841-872 [3] C. Eberle, P. Gerlinger, M. Aigner. Combustion and Flame (2017)
179:63-73 [4] M. Köhler, K.P. Geigle, T. Blacha, P. Gerlinger, W. Meier. Combustion and
Flame (2012) 159:2620-2635[5] H. Bockhorn: Soot Formation in Combustion: Mechanisms and
Models. Springer Series in Chemical Physics, Volume 59, 1994
Figure 3: Axial profiles of computed and measured [5] soot volume fractions.
Figure 2: Instantaneous APDF/LES results.

150
Computational Fluid Dynamics and Engineering
cosity of water and D is the molecular diffusion coeffi-cient of the gas in water). It was shown that cold sinking plumes transport high gas-saturated fluid deep into the bulk. Due to the relatively small sizes (5 x 5 x 5 cm3 and 10 x 10 x 10 cm3) of the computational domain, the sink-ing plumes were found to reach the bottom of the do-main before they naturally lost their buoyancy. Hence, those previous investigations focused on the develop-ment of the Rayleigh instability and the early stages of transition (including the formation of convection cells).
In the present project we aim to understand the physics of gas transfer in deep calm water bodies, such as found in lakes. For that purpose, the size of the computational domain has to be sufficiently large to allow all cool water plumes to sink downwards until they naturally lose their buoyancy. Therefore, a relatively large computational domain (cf. Table 1) combined with a linear temperature gradient imposed at the bottom (cf. Fig. 1) was chosen to achieve this goal.
Domain size (cm3) βΔT Ra Pr, Sc
30 x 30 x 30 0.00057202 5.3 x 10⁵ 7, 16
Table 1: Overview of simulation. Ra, Pr, Sc are the Rayleigh, Prandtl and Schmidt numbers, respectively. β is the thermal expansion coefficient of water at 293.15K so that here ΔT corresponds to about 3K.
The initial conditions for the velocity and gas concentra-tion fields were set to zero. The normalized temperature field was initially set to T=1, except at the surface, where a fixed temperature of T=0 was prescribed for all times. Near the bottom a temperature gradient (stratification) was imposed, see Fig. 1. Consequently, a thin thermal boundary layer of cool water is formed adjacent to the interface. To trigger the Rayleigh instability, small ran-dom disturbances were added to the temperature field at t=9.6s, causing the formation of thin sinking plumes of cool water (Fig. 1). Simultaneously, portions of warm-er water move upwards forming convection cells near the surface (Fig. 2).
For free-slip boundary conditions at the surface, our pre-vious simulations confirmed the scaling of the transfer velocity KL with Sc–1/2 over a broad range of Schmidt
Heat and gas transfer across water surfaces
Research InstitutionInstitute for Hydromechanics, Karlsruhe Institute of TechnologyPrincipal InvestigatorH. HerlinaResearchersH. Herlina, J. G. Wissink, M. UhlmannProject PartnersMAE Department, Brunel University London
SuperMUC Project ID: pr92da
3
Introduction
The present project is motivated by the problem of at-mospheric gas transfer across the water surface driven by buoyant - convective instability. The physical mecha-nisms that govern the process are not well understood, despite their significant contribution to the global heat budget and environmentally important gas cycles. An important example of such a process is the oxygen ab-sorption across the air-water interface into lakes or reser-voirs promoted by surface cooling. Note that gases, such as oxygen and carbon dioxide have low-diffusivity in wa-ter. The most challenging aspect of obtaining accurate data associated with such low-diffusivity (high Schmidt number) mass transfer processes lies in resolving the very thin boundary layer at the water side and the steep concentration gradients occurring in the bulk. In this pro-ject, direct numerical simulations are performed using a specifically designed code capable of resolving those de-tails on a computationally feasible mesh size.
Results and Methods
In our previous simulations of buoyant-convectively driven mass transfer due to surface cooling [1], the in-terfacial mass transfer was accurately resolved up to a realistic Schmidt number of Sc=500, which is typical for oxygen in water, (Sc=ν/ D, where ν is the kinematic vis-
Figure 1: Vertical cross-section of the temperature field after 72.25 time-units of simulation.

151
Heat and gas transfer across water surfaces
numbers (Sc=2–500). The same scaling law was found to apply in the present simulation at all instances for the two computed scalar fields (i.e. the temperature field T and the gas concentration field c for Sc=16, cf. table 1).
Method
The present DNS computations were performed using a specifically-designed numerical scheme that is capa-ble of resolving details of the interfacial low-diffusivity scalar transport process, which is marked by the occur-rences of steep concentration gradients. In this code we employ a fifth-order accurate WENO scheme [2] for scalar convection. The scheme is able to capture the steep gradients in the scalar distribution accurately (as illustrated in Fig. 3), without any spurious oscillations that are typically found when using spectral methods on relatively coarse meshes (Gibbs phenomenon). The WENO-scheme (for scalar convection), combined with a fourth-order central method for scalar diffusion, was implemented on a staggered and stretched mesh (fur-ther details see [3]). The solver has been parallelized by dividing the computational domain into a number of blocks of equal size by using a standard decomposition. Because of the application of the WENO scheme and other higher-order methods a three point overlap be-tween blocks is used.
Computing resources used Up to now, we have used 28 Mio CPUh for the calculation of the present simulation, as shown in Table 2. The num-ber of cores employed was 32,000.
Grid points Cores Time steps CPUh used2400 x
2400 x 1520 40 x 40 x 20 750,000 28Mio
Table 2: Overview of computing resources.
On-going Research / Outlook
The present simulation was our largest simulation of buoyant-convectively mass transfer so far. In the past, for such buoyant-convectively driven gas transfer simula-tions, the maximum number of cores we used was 16,384. During the test account period of the current project, it turned out that it was necessary to perform modifica-tions to the code so that it could handle the 32,000 cores employed. One of the issues was related to the writing of results which needed to be done using MPI routines. Also, some of the algorithms needed to be adapted in or-der for the code to become more economic with memory. To get the large simulation running correctly, we had to use several trial runs. Another problem we encountered was that at times our simulation did not start correctly as it did not get all the cores correctly assigned and be-cause of the large amount of cores required the running of the simulation at times suffered from problems with the operating system of SuperMUC.
As mentioned above, the aim of the present study is to investigate the air-water gas transfer process driven by surface cooling in deep sheltered lakes and other water bodies exposed to low wind speeds. To achieve this it is necessary to run the simulation for a long time, at least until the cool sinking plumes naturally lose their buoyan-cy in the lower bulk. So far the simulation has completed 750,000 time-steps. However, as indicated in Fig. 1b, the thermal plumes did not sink deep enough to lose their buoyancy. Based on the current state of the simulation, we estimate that another 900,000 time-steps would be needed to achieve a steady isothermal.
References and Links
[1] Wissink, J.G. and Herlina, H. 2016. J. Fluid Mech. 787, 508-540.[2] Liu X., Osher S., Chan T. 1994. J. Comput. Phys. 115, 200–212.[3] Kubrak B., Herlina H., Greve F., Wissink J.G. 2013. J. Comput. Phys. 240,
158-173.
Figure 2: Temperature field adjacent to the surface at t=72.75 time-units. The temperature distribution (normalized so that T=0 and T=1 are the coldest temperature at the surface and the initial warmest temperature in the bulk, respectively) shows the typical pattern of convection cells.
Fig. 3: Heat transfer at the air-water interface driven by surface cooling. Visualized are cold sinking plumes identified using the isosurface of the normalized temperature (T) = 0.5, colored by their distance from the bottom of the computational domain, which spans from z=0 (bottom) to z=30 cm(top). Only a small part (7.5 x 7.5 cm2) of the total 30 x 30 cm2 horizontal area is shown.

152
Computational Fluid Dynamics and Engineering
Moreover, we have seen that the large and wide rolls present in Couette flows are not destroyed by transpi-ration flows, which was largely unexpected. A clear indi-cation of the structures at relatively large transpiration numbers may be taken from figure 1.
In addition, we have found new and unexpected struc-tures in a region very close to the wall which were wider
and shorter than expected. Their appearance is best ob-served in a spectral representation resembles a butterfly wing shape, as shown in figure 2.
These structures are of importance to understand the dynamics of transpiration flow and the momentum ex-change between velocities.
All raw data sets are stored at SuperMUC’s tape system and we are presently finalizing all the postprocessing routines. The use of fat nodes is necessary due to the rel-ative big size of the data.
Canonical Couette flow without wall transpiration.
In order to better appraise our results and the key dif-ferences and similarities to the canonical Couette flow, we have run a very large simulation of the latter. This simulation was run in 4096 processors of SuperMUC at a Reynolds friction number of Reτ=2000 in a large com-
Direct numerical simulation of turbulent plane
Couette flow with wall-normal transpiration velocityResearch InstitutionTU-DarmstadtPrincipal InvestigatorMartin OberlackResearchersSergio Hoyas, Universitat Politècnica de València; Stefanie Kraheberger, TU-DarmstadtProject Partners—
SuperMUC Project ID: pr92la
3
Case Reτ ReV0 Uw/V0 Uw/U0C00 V0
+ Nx Ny Nz TUb/Lx Tuτ/hC00 1000 0 ∞ 1 0 6144 383 4608 9.0 20.5C02 1000 32 1243 1.382 0.032 3072 383 2304 18.7 32.2C05 1000 50 685 1.907 0.051 3072 383 2304 22 60.1C10 1000 60 492 2.741 0.063 3072 383 2304 22 97.5C20 1000 75 395 4.402 0.071 3072 383 2304 24.7 194A12 250 19 400 2.673 0.070 768 251 576 60.6 281A15 500 37.5 400 3.342 0.070 1536 251 1152 25.4 151A20 500 42 323 3.60 0.085 1536 251 1152 52.3 344
Table 1: Parameters of the simulations. The largest mesh has roughly 10e9 points.
Turbulent Couette flows with wall transpiration
The main objective of the project was a detailed DNS study of a turbulent Couette flow with transpiration which has never been studied in laboratory experiments. The present study is the first simulation describing this kind of flows in detail. The number of simulations ran are summarized in the following table.
The first objective of this subproject was completely achieved, as this set of simulations has given us a per-fect benchmark to test our turbulence theory about the breaking and creation of symmetries in turbulence, and the generation of new scaling laws.
Figure 1: Coherent structures obtained from the ensemble average of the C20 case. The shape of the figures is defined by iso-contours of velocity. The colors indicate fast flow regions (red) and slow ones (blue)

153
Direct numerical simulation of turbulent plane Couette flow with wall-normal transpiration velocity
putational box. One of the main results is that the well-known rolls present in Couette Flows still persist and seem to grow in length with increasing Reynolds num-ber. This is somewhat surprising as in theory the high-er the Reynolds number, the more chaotic the behavior becomes. We have also found a slightly lower value for the Karman constant than the one obtained in Poiseuille flows. Presently, we are testing the symmetry based tur-bulence theory against this flow and we will publish our results shortly.
Realization of the project
It is worth mentioning that the project has been running without any problem. The code was further accelerated and optimized during the 2016’s SuperMUC extreme scaling workshop. Quite surprisingly, our routine for all-to-all communications worked better than ALLTOALL MPI routines.
Due to the further optimization of the code and the time granted to us during the participation in this workshop, we still have time left that we are using for a challeng-ing computation: turbulent Poiseuille flow at the highest Reynolds possible for DNS which is roughly Reτ=10e4. The simulation is running at 2048 cores of SuperMUC second phase nodes. Our estimations indicate that we are going to need a total of 3.5M CPU-H.
We would like to stress the importance of this simula-tion, as it would be a reference for the next years being
the first one to reach this high Reynolds number. It makes our simulation comparable to the largest flows charac-terized in experiments, with the main advantage that we have access to every detail of the flow, which is needed to compare to the symmetry based turbulence theory.
References and Links
[1] DNS of a turbulent Couette flow at constant wall transpiration up to Reτ =1000, J. Fluid Mech. (2018), vol. 835, pp. 421443.
[2] Couette flows up to Reτ =2000. J. Fluid Mech., in preparation[3] On the persistence of large-scale turbulent structures in turbulent
Couette flow with wall-transpiration, 70th Annual Meeting of the APS Division of Fluid Dynamics
[4] DNS of a turbulent Couette flow at constant wall transpiration up to Reτ =1000., Tenth International Symposium on Turbulence and Shear Flow Phenomena 2017
[5] DNS of a turbulent Couette flow at constant wall transpiration up to Reτ =1000, iTi Conference on Turbulence VII, Bertinoro, Italy, September 7-9, 2016
[6] Turbulent plane Couette flow with wall-transpiration. European Turbulence Conference 15 (ETC 15)
[7] Plane turbulent Couette flow: DNS, large scale structures and symmetry induced scaling laws. Ninth International Symposium on Turbulence and Shear Flow Phenomena (TSFP-9)
Direct numerical simulation of turbulent plane
Couette flow with wall-normal transpiration velocity
Figure 3: Footprints of the structures in the x-z and y-z planes
Figure 4: Indicator function, for three canonical Couette Flows: blue and red profiles are for a Reynolds number of Reτ=1000 in different boxes and the green one is at a Reynolds of Reτ=2000.
Figure 2: Distribution of the butterfly spectrum with respect to the wall distance. The spectrum is in particular apparent near the turning point of the velocity profile (here the maximum of the velocity derivative).
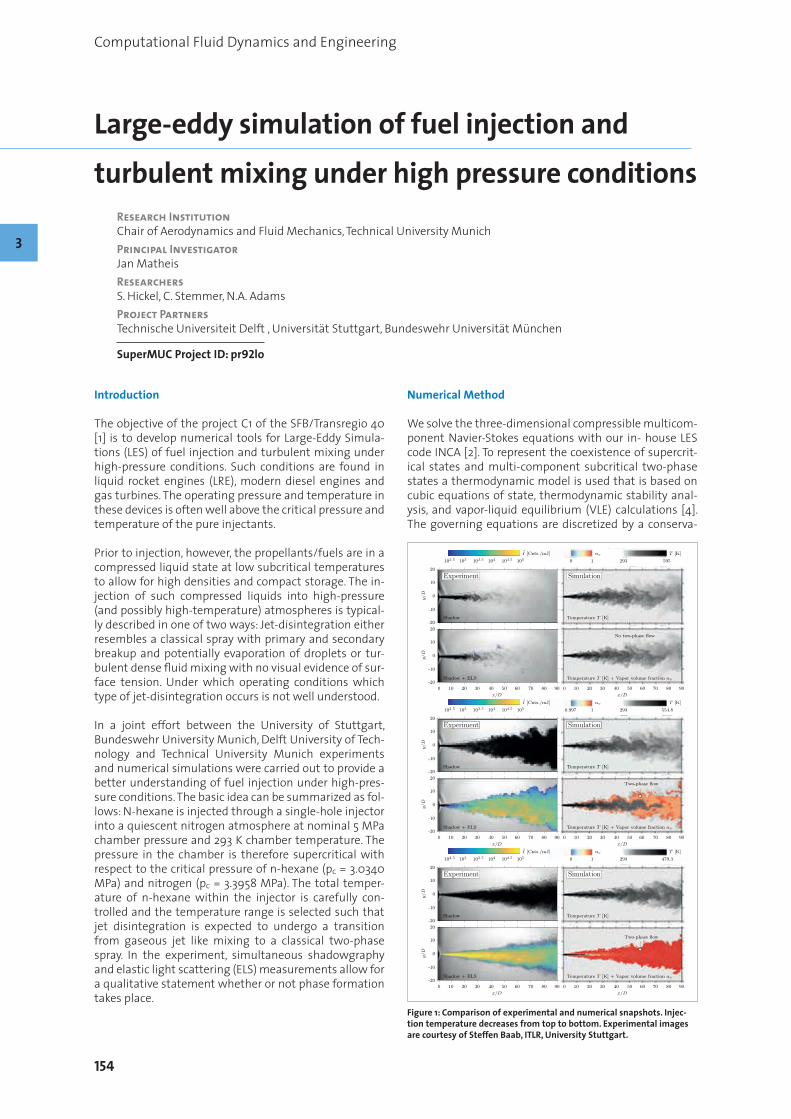
154
Computational Fluid Dynamics and Engineering
Numerical Method
We solve the three-dimensional compressible multicom-ponent Navier-Stokes equations with our in- house LES code INCA [2]. To represent the coexistence of supercrit-ical states and multi-component subcritical two-phase states a thermodynamic model is used that is based on cubic equations of state, thermodynamic stability anal-ysis, and vapor-liquid equilibrium (VLE) calculations [4]. The governing equations are discretized by a conserva-
Large-eddy simulation of fuel injection and turbulent mixing under high pressure conditions
Research InstitutionChair of Aerodynamics and Fluid Mechanics, Technical University MunichPrincipal InvestigatorJan MatheisResearchersS. Hickel, C. Stemmer, N.A. AdamsProject PartnersTechnische Universiteit Delft , Universität Stuttgart, Bundeswehr Universität München
SuperMUC Project ID: pr92lo
3
Introduction
The objective of the project C1 of the SFB/Transregio 40 [1] is to develop numerical tools for Large-Eddy Simula-tions (LES) of fuel injection and turbulent mixing under high-pressure conditions. Such conditions are found in liquid rocket engines (LRE), modern diesel engines and gas turbines. The operating pressure and temperature in these devices is often well above the critical pressure and temperature of the pure injectants.
Prior to injection, however, the propellants/fuels are in a compressed liquid state at low subcritical temperatures to allow for high densities and compact storage. The in-jection of such compressed liquids into high-pressure (and possibly high-temperature) atmospheres is typical-ly described in one of two ways: Jet-disintegration either resembles a classical spray with primary and secondary breakup and potentially evaporation of droplets or tur-bulent dense fluid mixing with no visual evidence of sur-face tension. Under which operating conditions which type of jet-disintegration occurs is not well understood.
In a joint effort between the University of Stuttgart, Bundeswehr University Munich, Delft University of Tech-nology and Technical University Munich experiments and numerical simulations were carried out to provide a better understanding of fuel injection under high-pres-sure conditions. The basic idea can be summarized as fol-lows: N-hexane is injected through a single-hole injector into a quiescent nitrogen atmosphere at nominal 5 MPa chamber pressure and 293 K chamber temperature. The pressure in the chamber is therefore supercritical with respect to the critical pressure of n-hexane (pc = 3.0340 MPa) and nitrogen (pc = 3.3958 MPa). The total temper-ature of n-hexane within the injector is carefully con-trolled and the temperature range is selected such that jet disintegration is expected to undergo a transition from gaseous jet like mixing to a classical two-phase spray. In the experiment, simultaneous shadowgraphy and elastic light scattering (ELS) measurements allow for a qualitative statement whether or not phase formation takes place.
Figure 1: Comparison of experimental and numerical snapshots. Injec-tion temperature decreases from top to bottom. Experimental images are courtesy of Steffen Baab, ITLR, University Stuttgart.
Shadow + ELS
102.5 103
Temperature T [K] + Vapor volume fraction αv
Temperature T [K]
0
-10
-20
Simulation
I [Cnts./mJ]
103.5 104 104.5 105
Experiment
Shadow
αv
0 1 595293
T [K]
10
20
y/D
0
-10
-20
10
20
y/D
0 10 20 30 40 50 60 70 80 90
x/D
0 10 20 30 40 50 60 70 80 90
x/D
No two-phase flow
Shadow + ELS
102.5 103
Temperature T [K] + Vapor volume fraction αv
Temperature T [K]
0
-10
-20
Simulation
I [Cnts./mJ]
103.5 104 104.5 105
Experiment
Shadow
αv
0.997 1 554.8293
T [K]
10
20
y/D
0
-10
-20
10
20
y/D
0 10 20 30 40 50 60 70 80 90
x/D
0 10 20 30 40 50 60 70 80 90
x/D
Two-phase flow
Shadow + ELS
102.5 103
Temperature T [K] + Vapor volume fraction αv
Temperature T [K]
0
-10
-20
Simulation
I [Cnts./mJ]
103.5 104 104.5 105
Experiment
Shadow
αv
0 1 479.3293
T [K]
10
20
y/D
0
-10
-20
10
20
y/D
0 10 20 30 40 50 60 70 80 90
x/D
0 10 20 30 40 50 60 70 80 90
x/D
Two-phase flow

155
Large-eddy simulation of fuel injection and turbulent mixing under high pressure conditions
tive finite-volume scheme on a Cartesian grid. We use a second-order upwind biased numerical flux function for the advective transport of mass and internal energy.
Effects of unresolved subgrid scales (SGS) are modelled by the adaptive local deconvolution method (ALDM) of Hickel et al. [3]. The viscous flux is discretised using a 2nd order cen-tral difference scheme, and the 3rd order explicit Runge-Kut-ta scheme is used for time integration. We use an adaptive Cartesian blocking strategy with a static local refinement and a varying grid resolution along the spray break-up tra-jectory to keep computational costs tractable. In this and closely related projects, see, e.g., Matheis et al. [4], grid res-olutions of up to 120 Mio cells were used. The simulations were run on up to 4000 cores of SuperMUC Phase 2.
Results
A comparison between single-shot measurements (left) and numerical snapshots (right) is shown in Figure 1. Each top frame shows the experimental shadowgram together with the temperature field in the LES. Each bottom frame depicts the scaled ELS signal superimposed on the shad-owgram together with the vapor volume fraction field su-perimposed on the temperature field. The n-hexane injec-tion temperature is decreasing from top to bottom. Note that the prescribed inflow temperature in the LES - which has a first-order effect on the type of jet disintegration - is calculated on basis of an isentropic nozzle flow. Further-
more, the total temperature in the injector element is measured with an uncertainty of +/-2 K. Therefore, focus is put on a qualitative comparison between experiment and simulation. Consider Figure 1 (left column): For case T600 only minor ELS intensities are measured, which in-dicates that no stable phase formation took place. This conclusion can be drawn based on the very high sensi-tivity of the scattered light towards the thermodynamic state, i.e., single- or two-phase flow. With decreasing in-flow temperature the ELS signal intensity increases in the outer shear layer of the jet. For the case T560 we observe the highest ELS intensity several inflow-diameters down-stream of injection and in the outer shear layer (meaning not on the jet centerline). For case T480 (bottom frame) the ELS characteristics change. The highest intensity is found very close to the injector exit and closer to the jet centerline. In the LES we observe a very similar pattern. While no two-phase flow is detected for case T600, we get a ‘vapor-volume-fraction signal’ for case T560 in the outer periphery of the jet. With decreasing inflow temperature, the spatial extent of two-phase flow increases and the ax-ial position where the outer shear layer of two-phase flow merges on the jet centerline moves upstream. The picture changes for the cases T480. The vapor volume fraction is in the range 0 - 1 and the whole jet is in a two-phase state. For x/D < 20, a liquid-like core surrounded by two-phase flow can be identified. From a qualitative perspective, ex-perimental observations can be explained in a consistent manner with the help of the LES. Figure 2 shows a com-parison between averaged experimental and numerical data. In the experiment, the average was calculated on basis of 10-15 single-shots. In the LES, statistical proper-ties have been obtained by averaging in time for about 2.5~ms. Similar as for the instantaneous data, we observe -- from a qualitative perspective -- a very good agreement between measured ELS pattern and regions of two-phase flow in the LES. Further results and details can be found in Traxinger et al. [5]
Outlook
There are a number of aspects that require further in-vestigation: for example, in a dilute flow regime, i.e., very small liquid volume fraction, particle-particle interactions are rare, the continuum assumption, which goes hand in hand with the pure Eulerian framework – as done in this work - is invalid. Here, we plan to couple our LES solver with a Lagrangian spray solver. Furthermore, it is of great practical interest to consider chemical reactions in these simulations. Further experiments and numerical simula-tions are planned in the course of the SFB/Transregio 40.
References and Links
[1] http://www.sfbtr40.de/[2] www.inca-cfd.org[3] S. Hickel, C. Egerer and J. Larsson, 2014. Subgrid- scale modeling
for implicit large eddy simulation of compressible flows and shock-turbulence interaction. Phys. Fluids 26:106101.
[4] J. Matheis and S. Hickel, 2017. Multi-component vapor-liquid equilibrium model for LES of high-pressure fuel injection and application to ECN Spray A. Int. J. of Multiphas. Flow.
[5] C. Traxinger, H. Müller, M. Pfitzner, S. Baab, G. Lamanna, B. Weigand, J. Matheis, C. Stemmer, N. A. Adams, and S. Hickel, 2017. “Experimen-tal and numerical investigation of phase separation due to mul-ti-component mixing at high-pressure conditions. ILASS - Europe 2017.
Large-eddy simulation of fuel injection and turbulent mixing under high pressure conditions
Figure 2: Comparison of averaged experimental and numerical data. Injection temperature decreases from top to bottom. Experimental images are courtesy of Steffen Baab, ITLR, University Stuttgart.
Shadow + ELS
102.5 103
Temperature T [K] + Normalized liq. mole fraction
Temperature T [K]
0
-10
-20
Simulation
I [Cnts./mJ]
103.5 104 104.5 105
Experiment
Shadow
10
20
y/D
0
-10
-20
10
20
y/D
0 10 20 30 40 50 60 70 80 90
x/D
0 10 20 30 40 50 60 70 80 90
x/D
Norm. liq.T [K]
0 1595293
100 110 120
fraction [-]
Shadow + ELS
102.5 103
Temperature T [K] + Normalized liq. mole fraction
Temperature T [K]
0
-10
-20
Simulation
I [Cnts./mJ]
103.5 104 104.5 105
Experiment
Shadow
10
20
y/D
0
-10
-20
10
20
y/D
0 10 20 30 40 50 60 70 80 90
x/D
0 10 20 30 40 50 60 70 80 90
x/D
Norm. liq.T [K]
0 1554.8293
100 110 120
fraction [-]
Shadow + ELS
102.5 103
Temperature T [K] + Normalized liq. mole fraction
Temperature T [K]
0
-10
-20
Simulation
I [Cnts./mJ]
103.5 104 104.5 105
Experiment
Shadow
10
20
y/D
0
-10
-20
10
20
y/D
0 10 20 30 40 50 60 70 80 90
x/D
0 10 20 30 40 50 60 70 80 90
x/D
Norm. liq.T [K]
0 1479.3293
100 110 120
fraction [-]

156
Computational Fluid Dynamics and Engineering
tions were then continued until Ug t / H = 400. The com-putational time required for these four simulations are shown in Table 2.
There are two purposes for this set of simulations: 1) to prove the convergence of simulations at least for large-scale physical quantities such as droplet size distribu-tion; 2) to explore in detail the underlying drop formation mechanisms.
An overview of the atomizing jet is shown in Fig. 1. As can be seen, the multiphase flow arising from atomization is complex and chaotic, involving a wide range of length scales. Different mesh levels and numerical methods were considered to investigate their effects on the spray formation. The computational resource allocated by PRACE in 2015 were mainly for the M2 and M3 simula-tions. The most important result for which computing power was needed most is the convergence study of the distri-bution of drop sizes (Fig. 2). It can be seen that a conver-gence starts between M1 and M2 in the size range of dp beyond 2.5<dp> (about 50 μm). We are awaiting for the simulation results of M3 to confirm this convergence. The converged distribution results are then compared to various predictions and models (e.g., log-normal and Gamma distributions).
Atomization process plays an im-portant role in a broad range of industrial and environmental ap-plications. In particular, the charac-teristics of the sprays produced by
Modeling of Multi-Scale Interfacial FlowsResearch InstitutionInstitut Jean Le Rond d’Alembert, Université Pierre et Marie Curie (Paris VI), Paris, FrancePrincipal InvestigatorStéphane ZaleskiResearchersDaniel Fuster, Yue Ling, Stéphane Popinet, Leon Malan, Rajarshi Roy, Tomas Arrufat, Ruben Scardovelli, Gretar TryggvasonProject PartnersUniversità di Bologna, Bologna, Italy; University of Notre Dame, Notre Dame, United States
SuperMUC Project ID: pr94be (PRACE project)
3
Grid Δx (μm) H/Δx Number of
Cells
Number of Time
Steps
Total CPU Time
M0 25 32 8.4 Million 4.9 ∙ 104 2.5 ∙ 103M1 12.5 64 67 Million 1.0 ∙ 105 4.3 ∙ 104M2 6.25 128 537 Million 2.2 ∙ 105 5.0 ∙ 105M3 3.125 256 4 Billion 5.0 ∙ 105 10.0 ∙ 106
Table 2. Hierarchy of grids used and the CPU time required for the corresponding simulation.
With the computational resources awarded by PRACE we have investigated the problem of atomization through direct numerical simulation. We have developed a nov-el multi-scale simulation approach, which combines the interface tracking scheme, i.e., Volume-of-Fluid method, and the Lagrangian point-particle model [3]We then implemented the numerical methods and mod-els in the multiphase flow solver, ParisSimulator, and conducted simulation of atomization in two-phase mix-ing layers in order to understand the droplet formation mechanisms. A brief summary of the main findings from the simulations are given in this report; while extended discussions can be found in [2].In this work, we simulate a model of the quasi-planar atomization experiment of Matas et al. 2011 (Phys. Flu-ids, 23:094112, 2011). In a large, three- dimensional box of dimension Lx ∙ Ly ∙ Lz, we inject gas and liquid streams through the boundary x = 0, which are separated by a solid plate with dimensions lx ∙ e ∙ Lz. The thickness of the liquid and gas streams is H and H – e, respectively. In order to minimize the effects of the finite size of the domain, the dimensions of the box are large in the x and y dimensions (Lx = 16H, and Ly = 8H). Special care was taken to specify the exit conditions: to minimize the re-circulating flow and avoid excessive reinjection of coher-ent structures near the inlet. The gas and the liquid are injected with velocities Ug, and Ul. The thickness of the boundary layers on the liquid and gas sides of the sep-arator plate were taken to be identical, and are denoted by δ. The values of the corresponding dimensionless pa-rameters are shown in Table 1, using standard notations.
We solve the Navier-Stokes equations for incompress-ible flow with sharp interfaces and constant surface tension. The fields were discretized using a fixed regu-lar cubic grid. The simulations were performed on three grids called M0, M1, M2, M3, so that Mn has H/Δx = 32 ∙2n points in the liquid layer. An approximate steady state was reached at about Ug t / H = 200 and the simula-
M r m Reg, δ Weg, δ Reg, H
ρgUg 2/ ρlUl
2 ρl / ρg μl / μg ρgUgδ / μg ρgUg2δ / σ ρgUgH / μg
20 20 20 1000 10 8000
Table 1. Dimensionless parameters of the simulation.

157
Modeling of Multi-Scale Interfacial Flows
atomizers in fuel injection systems (such as the droplet size distribution) have a significant impact on the com-bustion efficiency and pollutant emission. Since the liq-uid masses of scale of the injection nozzle (centimeters) break into droplets as small as sub-microns, a wide range of length scales and complex topological changes are involved in the flow field. Accurate simulations are thus challenging and extremely costly and massively parallel computing systems are required. As a full space-time data of the flow field can be obtained, numerical simu-lation offers flow details that are often difficult to meas-ure in experiments, which are in turn vital to improve our understanding of the underlying physics in droplet formation and the interaction between the interface and turbulence. Furthermore, mining the huge simulation database with advanced statistical learning techniques such as neural networks opens a novel way to develop reduced order models which will be useful in practical industrial applications.
On-going Research / Outlook
With the allocation of computational resource through PRACE, we were able to perform very large scale simu-lations and significantly advanced the investigation of atomization. (to our knowledge, the M3 simulation list-ed above is the largest simulation up to today.) For the purpose of validation, we will continue to perform sim-ulations with physical parameters that are consistent with experiments. Furthermore, we are interested in de-veloping reduced order models by mining the huge data we obtained through advanced statistical learning tech-niques. In order to obtain the data we need for model development, we need to perform more fully verified and validated simulations like the M3 simulation.
References and Links
[1] S. Vincent, L. Osmar, J.-L. Estivalezes, S. Zaleski, F. Auguste, W. Anisze-wski, Y. Ling, T. Ménard, A. Pedrono, J. Magnaudet, J.-P. Caltagirone, A. Berlemont 2014: A phase inversion benchmark for multiscale multiphase flows, in preparation.
[2] Y. Ling, D. Fuster, S. Zaleski and G. Tryggvason, Direct numerical simulations of spray formation in a gas-liquid mixing layer obtain a high-fidelity numerical closeup of the detailed mechanisms of spray formation, Phys Rev Fluids, 2017 vol. 2 (1) p. 014005.
[3] Y. Ling, S. Zaleski, and R. Scardovelli, “Multi-scale simulation of at-omization with small drops represented by Lagrangian point-par-ticle model,” International Journal of Multiphase Flow 76, 122-143, November 2015; doi:10.1016/j.ijmultiphaseflow.2015.07.002; Area: Mechanics-Science.
Modeling of Multi-Scale Interfacial Flows
Figure 1: The atomizing jet.
Figure 2: Droplet size distribution obtained by different meshes.

158
Computational Fluid Dynamics and Engineering
Cases 10L 10M 10HTI [%] 4 7.3 12.5CP 0.411 0.431 0.457CT 0.614 0.627 0.643
Table 1: Effective TI at the turbine, averaged power and thrust coefficient.
Turbine loads and fluctuations are increasing with the ro-tor diameter. Trailing edge flaps [2] at the outer rotor blade part (see Figure 2) are a modern aerodynamic concept for load and fatigue control, since flaps allow modifying the airfoil lift at given angle of attack. The result of the research was that the flap needs to be centered at 80-85% on the blade radius with an extension of 10-15% along chord in order to avoid separation, depending on the turbine.
Within the national Assist research project, CFD analy-sis of the flow around a wind turbine nacelle have been performed in order to improve the understanding of the complex flow physics and to derive means to reduce the flow separation in this area and in this way to increase the turbine’s efficiency. Simulations have been com-pared to an isolated rotor simulation, see Figure 3.
In the connection area between the blade and nacelle, the interference of the two boundary layers create a
Enhanced Aerodynamics of Wind Turbines
Research InstitutionInstitute of Aerodynamics and Gas Dynamics, University of StuttgartPrincipal InvestigatorThorsten LutzResearchersPascal Weihing, Eva Jost, Levin Klein, Giorgia GumaProject Partners—
SuperMUC Project ID: pr94va
3
Introduction
Within the present project, the aerodynamic behavior of modern wind turbines has been investigated by the use of CFD. Three main sub-topics have been studied:• The effect of inflow turbulence on the
transient turbine loads.• The possibility to control the rotor loads by
applying trailing edge flaps to the outer part of the rotor blade.
• The analysis of the flow around the turbine nacelle.
Additionally, investigations have been conducted on the impact of complex terrain, aero-elastic rotor blade defor-mation and complex inflow conditions.
Results and Methods
All the simulations have been performed with the fi-nite-volume CFD code FLOWer, developed by the German Aerospace Center (DLR) within the MEGAFLOW project. It solves the Navier Stokes equations in an integral form using different turbulence RANS and hybrid RANS/LES models.
The simulations requiring the highest resources were the ones regarding inflow turbulence, where 236,000 CPU hours and 1968 CPUs have been used for each case (6 cases in total). The used space in the $HOME is around 50%, while in the $WORK is around 56% of the availa-ble budget. The used code is not producing an exceeding amount of files that is why, up to now, no problem was faced in the file storage.
The influence of inflow turbulence (see Figure 1) has been studied within the European project AVATAR [1], using the reference rotor of the project with radius R=102.88 m and simulating three different levels of turbulence in-tensities (TI) at the turbine location, see table 1. As can be seen, the inflow turbulence has an impact on the mean power and thrust showing a continuous increase with increasing TI.
Figure 1: Interaction of the rotor with a high level of atmospheric turbulence.

Figure 3: Vortex around the rotor. Isolated rotor (top), rotor with nacelle (down)
159
Enhanced Aerodynamics of Wind Turbines
thicker one that cannot compensate the adverse pres-sure gradient of the blade and separation occurs. To avoid this, the corner of the nacelle has been rounded in order to increase the radius where the boundary layer is thicker. As can be seen in Figure 4, the separation is in this way eliminated resulting in a slight increase of axial and driving forces.
On-going Research / Outlook
The project has been prolongated in order to study the following topics:• aero-elastic effects on wind turbines in
complex terrain.• vibration and acoustic analysis by onshore
wind turbines.
Within the project WINSENT (WINd Science and ENgi-neering in complex Terrain) [3] new numerical models will be developed in order to take into account turbulent inflow conditions, complex terrain [4] and aeroelasticity. Complex terrain is a terrain whose topology and rough-ness is influencing the atmospheric boundary layer (ABL), see Figure 5. Results will be compared within different in-stitutions involved in the project and with field results from the two research wind turbines that are going to be erected in Stöttener Berg, in South Germany. Fluid Structure Interaction (FSI) CFD-CSD coupled simulations [5] will be run in cooperation with TU Munich using both beam and shell elements to model the turbine structure properties.
Within the national project TremAc, emission and im-mission of vibrations and low frequency noise from wind turbines are simulated. There can be different causes for noise, like non-uniform inflow conditions, atmospheric turbulence, flow separation, tower impact, rotor tilt and especially aero-elasticity. In particular for this last point, the coupling between the CFD flow solver FLOWer and the MBS solver SIMPACK has been extended.
Simulations including turbulent inflow conditions, aero- eleasticity and/or complex terrain are really expensive because they require fine meshes, small timesteps and high order numerical schemes. Most of the simulations have been run on SuperMUC phase 2 and with the up-coming machine SuperMUC-NG it is hoped to increase the simulation velocity, saving in this way also compu-tational time.
References and Links
[1] http://www.eera-avatar.eu/[2] E. Jost, T.Lutz and E. Krämer. 2016. A parametric CFD Study of
Morphin Trailing Edge Flaps on a 10 MW OFFshore Wind Turbine. Energy Procedia, vol. 94, pp. 53-60
[3] http://www.windfors.de/english/test-site.html[4] T. Lutz, C. Schulz, P. Letzgus and A. Rettenmaier. 2017. Impact of
Complex Orography on Wake Develpment: Simulation Results for the Planned WindForS Test Site. Wake Conference, 2017.
[5] M. Sayed, T. Lutz, E. Krämer, S. Shayegan, A. Ghantasala, R. Wüchner and K.-U Bletzinger. 2016. High fidelity CFD-CSD aeroelastic analysis of slender bladed horizontal-axis wind turbine. Torque conference (2016), J. Phys.: Conf Ser. 753 042009
Figure 5: Velocity distribution in complex terrain
Figure 2: Harmonic flap oscillation (6p) – Vortices in blade wake
Figure 4: Surface streamlines of the flow around the baseline nacelle (left) and an optimized nacelle (right)

160
Computational Fluid Dynamics and Engineering
Results
Wall-resolved LES and the high Reynolds number for this SWBLI study require the use of a large amount of com-putational cells. We performed a sensitivity study with up to 720 mio. cells and obtained grid-converged re-sults with 360 mio. cells. Exploiting the very good scal-ing properties of our flow solver INCA, we run the sim-ulations on 13860 cores on SuperMUC (Phase 1 & Phase 2). SWBLI inherently cover a broad range of time scales, requiring long integration times for statistically reliable data at low-frequencies. The high grid resolution near the wall (cell size on the order of micro-meters) and the high-speed flow result in a physical time-step size on the order of nano-seconds, thus requiring millions of time-steps. The SWBLI presented in the following ran for 6 mio. iterations and consumed a total number of ap-proximately 15 mio. core-hours, indicating the necessity of high-performance computing (HPC) in the context of SWBLI at high Reynolds numbers. A detailed analysis can be found in [4].
Görtler vortices in an impinging shock-wave/ boundary-layer interaction
Research InstitutionInstitute of Aerodynamics and Fluid Mechanics, Prof. N. A. Adams, TUMPrincipal InvestigatorVito PasquarielloResearchersVito Pasquariello, Stefan Hickel, Nikolaus A. AdamsProject PartnersGerman Aerospace Center, Institute of Aerodynamics and Flow Technology, Cologne
SuperMUC Project ID: pr94we
3
Introduction
In the context of launch vehicles, shock-wave/bounda-ry-layer interactions (SWBLI) are common flow features that may generate high-magnitude transient side loads. During the start-up of liquid propellant fueled rocket engines, the rocket nozzle operates in an overexpanded condition, which consequently leads to unsteady inter-nal flow separation. The interaction can critically affect the rocket nozzle performance in case of shock-induced boundary-layer separation and it is a main source of max-imum mean and fluctuating pressure loads that the un-derlying structure is exposed to. These high-magnitude transient loads can be severe enough to fail interfacing components as well as the complete nozzle in the rocket engine. High-fidelity numerical tools are necessary for a correct prediction of the complex flow physics, especially when addressing unsteady features of the interaction.Numerical Method
The governing equations are the compressible Navi-er-Stokes equations, which are solved with our in-house Finite Volume large-eddy simulation (LES) code INCA [1]. Within the LES framework, the smallest turbulent flow scales are not resolved on the computational grid, but must be modeled. The Adaptive Local Deconvolu-tion Method [2] is used which implicitly provides sub-grid-scale effects. INCA operates on Cartesian grids, al-lowing for an efficient blocking-strategy and thus high parallel performance.
Figure 1: Schematic of the experimental setup. The insert shows the LES domain with a numerical Schlieren image. Image taken from [4].
Figure 2: Visualization of Görtler-like vortices near flow reattachment at two times. Isosurfaces of reversed flow (blue) and of positive/negative streamwise vorticity (white/black) are shown. Image taken from [4].

161
Görtler vortices in an impinging shock-wave/boundary-layer interaction
The topology studied in this work is an oblique shock-wave impinging on a flat plate turbulent boundary-layer (TBL), see Fig. 1. Experiments for this case were conducted at the German Aerospace Center [3]. The adverse pres-sure gradient imposed by the incident shock is strong enough to cause boundary-layer separation and a sepa-ration shock originating well ahead of the inviscid
impingement point. Although the interaction is nom-inally 2D, Fig. 2 gives evidence of 3D flow structures emerging in the reattachment region. Isosurfaces of positive and negative streamwise vorticity indicate the existence of two pairs of counter-rotating streamwise vortices. These so-called Görtler-like vortices emerge due to a centrifugal instability on concave surfaces and can often be found in compression-corner studies. We found that these vortices oscillate in spanwise direction at low frequencies, while directly influencing the instantaneous shape of the separated flow.
We performed a detailed modal analysis by means of Dynamic Mode Decomposition (DMD) for studying un-steady effects of the SWBLI. For this analysis we saved a total number of 7000 three-dimensional snapshots with approximately 100 TB storage. The analysis has been ap-plied to both spanwise-averaged as well as wall-plane snapshots, see Fig. 3 and Fig. 4. Two types of dynamical-ly important modes have beend found: low-frequency modes (Fig. 3 top) show high activity around the shock system, the separated shear layer and the separation bubble, indicating a breathing motion of the recirculat-ing flow together with a forward/backward motion of the shock system as a whole. At medium frequencies (Fig. 3 bottom, Fig. 4 bottom) shear-layer vortices are convect-ed downstream while inducing eddy Mach waves in the supersonic part of the flow. The low-frequency skin-fric-tion mode (Fig. 4 top) clearly shows streamwise streaks in the reattachment region, which we have identified as footprints of Görtler-like vortices. These vortices are
coupled to the separation bubble dynamics and cause a large-scale flapping of the reattachment line superim-posed on a breathing motion of the recirculating flow.
Outlook
We performed unprecedented LES for the interaction of a TBL with a strong impinging shock wave at consider-ably high Reynolds number. Our analyses provide new insights into low-frequency mechanisms related to Gör-tler-like vortices for strong interactions. For the first time a clear coupling between unsteady Görtler-like vortices and separation bubble dynamics could be found for im-pinging SWBLI, a phenomenon so far only discussed in the context of compression-corner studies. While the ex-act cause of low-frequencies still remains an open ques-tion, unsteady Görtler-like vortices might act as a source for continuous (coherent) forcing of the intrinsic separa-tion-shock-system dynamics.
References and Links
[1] http://www.aer.mw.tum.de http://www.sfbtr40.de http://inca-cfd.org
[2] Hickel, S., Egerer, C.P., & Larsson, J. (2014). Subgrid scale mod-eling for implicit large eddy simulation of compressible flows and shock-turbulence interaction. Physics of Fluids, doi:10.1063/1.4898641
[3] Daub, D., Willems, S., & Gülhan, A. (2015). Experimental results on unsteady shock-wave/boundary-layer interaction induced by an impinging shock. CEAS Space Journal, doi: 10.1007/s12567-015-0102-4
[4] Pasquariello, V., Hickel, S. & Adams, N. A. (2017). Unsteady effects of strong shock-wave/boundary-layer interaction at high Reynolds number. Journal of Fluid Mechanics, doi: 10.1017/jfm.2017.308
Görtler vortices in an impinging shock-wave/ boundary-layer interaction
Figure 3: Real and imaginary part of DMD modes with contours of modal pressure fluctuations at (a) low and (b) medium frequency. Image partially reproduced from [4].
Figure 4: Real and imaginary part of DMD modes with contours of modal skin-friction fluctuations at (a) low and (b) medium frequency. Image partially reproduced from [4].

162
Computational Fluid Dynamics and Engineering
tion zone having a maximum edge length of 0.6 mm. A Lax-Wendroff scheme is used being of second-order ac-curacy in time and space. Sub-grid stresses are modeled by the wall adapting linear eddy (WALE) model, whereas flame-turbulence interaction is taken into account via the dynamically thickened flame model. A reduced 2-step chemistry model is used to describe the premixed methane/air flame. The compressible LES resolves all physical mechanism needed to describe the combustion noise generation and the combustor dynamics, see Fig. 1.
A prerequisite for an accurate reproduction of the exper-imental values is a matching mean reaction zone shape between LES and experiment, see Fig. 2.
Determination of Combustion Dynamics and Combustion
Noise in a Confined Turbulent Swirl CombustorResearch InstitutionProfessur für ThermofluiddynamikPrincipal InvestigatorWolfgang PolifkeResearchersMalte MerkProject PartnersLaboratoire EM2C, CNRS CentraleSupélec, Université Paris Saclay
SuperMUC Project ID: pr94yu
3
Introduction
Combustion noise is an undesirable but unavoidable by-product of every turbulent combustion device. In various industrial applications such as stationary gas turbines or aeronautical engines high levels of combustion noise are reached. For aeronautical engines combustion noise even may constitute the most significant contribution to the overall sound emission from a plane at approach and cutback conditions. Besides of being harmful to those ex-posed to noise emissions, high levels of combustion noise may lead to severe structural damages of the engine or may even trigger thermoacoustic instabilities. In case of a thermoacoustic instability the heat released by the turbu-lent flame oscillates in phase with the pressure amplitude of an acoustic eigenmode of the surrounding cavity. As a consequence, a self-sustained oscillation results, which may reach harmful pressure amplitudes within the com-bustion chamber of the engine. This scenario has to be avoided at any cost. Consequently, combustion noise and combustor dynamics are ongoing research topics.
In the current project the combustion dynamics as well as the generation of combustion noise is investigated within a confined combustion system. Therefore, an experimen-tal test-rig of an application-relevant confined turbulent swirl combustor has been designed and commissioned at the Laboratoire EM2C, CNRS CentraleSupélec, Université Paris Saclay. The objective is then to reproduce experimen-tal measurements of combustion noise and combustion dynamics by means of a compressible Large- Eddy Simula-tion (LES) of reactive flow. Through a successful compari-son between LES results and experimental measurements a deeper understanding of the involved physical mecha-nisms shall be obtained.
Results and Methods
The Fortran based explicit LES code AVBP, developed by CERFACS, Toulouse [2], is used to solve the fully com-pressible Navier-Stokes equations on an unstructured grid, which consists of approximately 20 million tetra-hedral cells. The smallest cells are located in the reac-
Figure 1: Snapshot of the compressible LES computation for the confined swirl combustor. The turbulent structures (green iso-surfaces) that are generated across the radial swirler impinge on the flame front (orange iso-surface) and cause thereby turbulent combustion noise.
Figure 2: Comparison between measured and computed mean reaction zone shape. Left: time averaged heat release rate computed via LES. Right: time averaged OH* chemiluminescence measured in experiment. Reproduced from [3].

Determination of Combustion Dynamics and Combustion Noise in a Confined Turbulent Swirl Combustor
Note that the OH* chemiluminescence is a good exper-imental indicator for the heat release rate of premixed flames. Even though the flame angle differs slightly, the flame length is well captured by the compressible LES. The LES has been averaged over 120 ms. As the acoustic CFL number has to be below unity, the time step size of the explicit LES solver is of order 1e-07 s for the given op-erating conditions of the combustor. The computation of 120 ms physical time needs about 24 hours on 700 cores, resulting in 16800 core hours in total.
In a next step the phase averaged mean reaction zone shape is compared for a configuration that undergoes a thermoacoustic instability, see Fig 3.
The flame movement per phase angle increment is accu-rately recovered by the LES, which strongly suggest that the combustor dynamics are correctly described by the LES. With an instability frequency of 185 Hz, a physical time length of only 110 ms is needed to compute 20 os-cillation cycles. However, as the complete 3D field has to be stored 6 times per oscillation cycle, the according LES run generates 700 Gb of data.
Finally, the measured sound pressure spectra are com-puted via LES. For confined configurations the acoustic impedances up- and downstream have a crucial impact on the resulting sound pressure spectrum. However, the complete geometry of the experimental testrig cannot be resolved within the LES domain due to the enormous computational costs. To circumvent this issue, the LES is coupled up- and downstream to characteristic based state-space boundary conditions [4], see Fig. 4.
These allow to model the effect of arbitrary acoustic im-pedances up- and downstream of the LES domain without resolving these parts explicitly within the LES domain. Thus, various plenum and exhaust geometries can be realized without the need of re-meshing. A simple reformulation of the acoustic boundary model is enough to take eventual changes into account. Figure 5 depicts the resulting sound pressure spectra for two different working conditions.
Excellent agreement between LES and measured data is observable. This allows now an LES based optimization of the operating conditions / combustor geometry in or-der to avoid thermoacoustic instabilities or to reduce the maximal reached sound pressure level.
For statistically well converged spectra, a minimal time series length of 350 ms is necessary yielding a computa-tional cost of approximately 50000 core hours per com-putation.
On-going Research / Outlook
After successfully validating the compressible LES in terms of flame dynamics and combustion noise gen-eration, the next step in the current project will be to impose an acoustic broadband excitation signal to the compressible LES flow. By recording the resulting acous-tic velocity fluctuations at a given reference position and the according heat release rate fluctuations, low-order models for the flame dynamics and the combustion noise source can be derived. Therefore, the LES broad-band data is post-processed via advanced system iden-tification techniques [5]. The obtained low-order models can, in turn, be used to predict the thermoacoustic sta-bility and the sound pressure level within the confined combustor at reduced computational costs. However, for an accurate identification of the respective low-or-der models a time series data length of about 350 ms is needed. As the optimal characteristics of the broadband excitation signal are still unknown and their definition is part of the research project, a large set of computations will be necessary, which require the further use of Super-MUC resources.
References and Links
[1] www.tfd.mw.tum.de [2] www.cerfacs.fr/avbp7x [3] M. Merk, R. Gaudron, M. Gatti, C. Mirat, T. Schuller, and W. Polifke.
Measurement and Simulation of Combustion Noise and Dynamics of a Confined Swirl Flame. AIAA J, 2018
[4] S. Jaensch, C. Sovardi, and W. Polifke. On the Robust, Flexible and Consistent Implementation of Time Domain Impedance Boundary Conditions for Compressible Flow Simulations. J. Comput. Phys., 2016
[5] M. Merk, S. Jaensch, C. Silva, and W. Polifke. Simultaneous Identifi-cation of Transfer Functions and Combustion Noise of a Turbulent Flame. J. Sound. Vib., 2018
Determination of Combustion Dynamics and Combustion
Noise in a Confined Turbulent Swirl Combustor
Figure 3: Phase averaged snapshots of the turbulent swirl flame undergoing a thermoacoustic oscillation cycle. Left: phase averaged (20 cycles) heat release rate isosurfaces from LES. Right: phase averaged (100 cycles) OH* chemiluminescence snapshots from experiment. Reproduced from [3].
Figure 4: Schematic of coupling between compressible LES and characteristic based state-space boundary conditions. The acoustic waves leaving the LES domain serve as input for the acoustic boundary models. The outputs of the respective boundary state-space models are fed back into the LES.
Figure 5: Measured (blue) and computed (red / green) sound pressure spectrum within the confined combustor geometry. Left: stable working conditions. Right: unstable working condition. Reproduced from [3].
ExhaustPlenum LES domain
ExhaustPlenum LES domain
0 500 1,000 1,500 2,00050
100
150
Frequency [Hz]
SP
L[d
B]
0 500 1,000 1,500 2,00050
100
150
Frequency [Hz]
SP
L[d
B]


Chapter 04 – Earth, Climate and Environmental Sciences
Earth, Climate and
Environmental Sciences

166
Earth, Climate and Environmental Sciences
Introduction
The main goal of our research project ASCETE (Advanced simulation of coupled earthquake-tsunami events) is to establish a work-flow that couples several state-of-the-art geoscientific simulation softwares for more accu-rate simulation of earthquake-tsunami events. The spa-tio-temporal sea-floor displacement of an earthquake rupture simulation conducted by the software package SeisSol [1] is constrained by initial conditions from a ge-omechanical model and serves as input into a tsunami software. The full workflow shall enable us to better understand under which conditions subduction zone earthquakes lead to devastating tsunamis.
A particular devastating tsunami was caused by the 2004 Sumatra-Andaman earthquake. This event was ex-treme in size, length, and damage caused: A fault system with an extension of about 1500km ruptured for more than 8 minutes, leading to an Mw 9.1–9.3 earthquake that caused a tsunami reaching up to 30m height.
During last year’s project period we were able to run the first full 3D dynamic rupture simulation of the Sumatra-Andaman earthquake. Such dynamic rupture simulations combine non-linear frictional failure on a prescribed fault surface coupled to subsequent seismic wave propagation. The output of the simulations is ana-lysed in terms of fault mechanical properties such as slip rate and total slip on the fault. Additionally the result-ant sea-floor displacement is evaluated against recorded GPS signals.
From a computational point of view this scenario is particularly challenging. Due to the intersection of the fault surface with the topography as well as with the subsurface structure, many small discretisation elements are generated during meshing. These small elements require small time steps in order to fulfil stability conditions. The discretised numerical models of this scenario, with sufficient fault and topography resolution, include 100 million to 220 million elements
where the smallest elements force execution of about 3 million time steps (or worse). While our software pack-age SeisSol has been able to handle comparably large element counts since 2014, the number of time steps here is about 14 times higher than our largest simula-tion to that date. Only with recent software improve-ments, such as local time-stepping support for dynamic rupture and asynchronous I/O, the full 3D simulation of this scenario became feasible. This is a vital prerequisite for the project ASCETE.
Extreme scale simulations of the 2004 Sumatra-
Andaman earthquake and the Indian Ocean tsunamiResearch InstitutionTechnical University of Munich and LMU MunichPrincipal InvestigatorMichael BaderResearchersAlice-Agnes Gabriel, Elizabeth Madden, Sebastian Rettenberger, Thomas Ulrich, Leonhard Rannabauer, Carsten Uphoff, Stephanie WollherrProject Partners—
SuperMUC Project ID: pr45fi
Figure 1: Performance on SuperMUC Phase 2, obtained during a strong scaling analysis. BL is the baseline version from 2015 and SC is our optimised version. GTS and LTS denote global and local time-stepping, respectively.
Figure 2: Snapshot of emitted seismic waves in the model volume and slip rates on the fault [2].
4
150200250300350400450500550
128 256 512 1024 2048 3072Number of nodes
GFL
OPS
per
nod
e
BL GTS BL LTS SC GTS SC LTS
150200250300350400450500550
128 256 512 1024 2048 3072Number of nodes
GFL
OPS
per
nod
e
BL GTS BL LTS SC GTS SC LTS

Extreme scale simulations of the 2004 Sumatra-Andaman earthquake
Results and Methods
SeisSol uses an explicit time-stepping scheme. As it is common for explicit solvers, the maximum time-step of a discretisation element depends on its insphere radius. In order to save computation time one may use static adaptivity, that is, insphere radii may vary drastically over the discretisation domain. More severely, one may obtain very small insphere radii due to deformed tetrahedral elements, which may be generated by the mesh gener-ator due to intersections of the fault with topography, material layers, or due to fault branches. For example, in the preprocessing stage of the Sumatra-Andaman earth-quake we obtained insphere radii as low as 0.06m where a spatial resolution of about 400m was desired. Even our final production model had a low minimum insphere ra-dius of only 9.95m.
A possible solution for this issue is local time-stepping (LTS). Here, every element may have its own time-step, such that the bulk of tetrahedral elements has a reason-ably sized time-step. In the last year, we extended our LTS scheme to support dynamic rupture simulations and we heavily optimised our dynamic rupture kernel, using code generation for small matrix-matrix multiplications. These optimisations are described in detail in our publi-cation [2], which won the Best Paper Award at the Super-computing 2017 conference.
During the extreme scaling period at LRZ in March 2017, we investigated the scalability of the Sumatra-Andaman earthquake scenario on the whole SuperMUC Phase 2 machine, with about 111 billion degrees of freedom. In to-tal we used up to 3072 nodes, that is, 86016 cores. The re-sults of our strong-scaling analysis are shown in Figure 1. On SuperMUC Phase 2, we achieve a parallel efficiency of 82% for global time-stepping and a parallel efficiency of 63% for local time-stepping.
The full simulation of the 2004 Sumatra-Andaman earth-quake required 13.9h at 0.94 PFLOPS sustained perfor-mance using all 3072 nodes available at SuperMUC Phase 2. With the simulation we generated 15.8TB of output data for visualisation, post-processing, and checkpointing. Due to the overlapping of I/O and computation, the I/O time contributes to less than 1% of the total runtime.
In total, we managed to reduce a predicted run-time of 7 days and 19 hours to a real run-time, including output, of 13.9 hours in our largest scenario.
Figure 2 shows part of the fault and its intersection with the surface (black lines) including the splay faults. Slip rate on the fault is indicated by orange colours which represents the differential velocity of both sides (move-ment) of the fault. Dark colours indicate strong slip along the subduction zone. The blue-red colours in a cutout of the simulation volume indicate seismic waves generated due to slip on the fault.
On-going Research
With the pipeline ready to simulate coupled events, the main focus for the remainder of the ASCETE project is on the impact of various initial conditions, e.g. rough faults and stress parameterisation, in combination with ad-vanced rheological models, i.e. viscoplastic or viscoelastic rheologies, on tsunami generation.
In a first study we compared the difference between a purely elastic model and a viscoplastic model, that is, a model with inelastic deformation. The distribution of sea-floor uplift obtained by both models is quite differ-ent, especially the maximum uplift is 3.2m higher in the viscoplastic model. In subsequent tsunami simulations, using the initial data generated by SeisSol, we observe a higher water height in the leading wave of the tsunami, due to the difference in sea-floor uplift. About 2 hours af-ter nucleation of the Sumatra-Andaman earthquake the satellite Jason-1 passed the Indian Ocean tsunami, which allows a comparison of synthetic data to measured data along Jason’s path. In Figure 3 a comparison of our tsu-nami simulation to the data of Jason-1 is shown. The vis-coplastic model shows an excellent match of the lead-ing wave’s water height (first peak) with data. Figure 4 shows a snapshot of the water height 113 minutes after nucleation of the Sumatra-Andaman earthquake.
References and Links
Figure 3: By coincidence the satellite Jason-1 passed the Indian Ocean after about 2 hours after the Sumatra-Andaman earthquake. Here we compare simulated water height with the satellite’s data [3]. The initial conditions for the tsunami simulations are generated by SeisSol.
Figure 4: Simulated water height in the In-dian Ocean 113 minutes after nucleation of the Sumatra-Andaman earthquake. The initial conditions are derived from a viscoplastic earthquake simulation.
110 min 111 min 112 min 113 min 114 min 115 min 116 min 117 min 118 min 119 min 120 min2:51:01 2:52:01 2:53:13 2:54:00 2:55:00 2:56:01 2:57:01 2:58:01 2:59:01 3:00:00 3:01:00
Sim.J−1
−0.6−0.4−0.2
0.00.20.40.60.8
−12.9° −9.9° −6.4° −4.1° −1.2° 1.8° 4.7° 7.7° 10.6° 13.5° 16.4°Latitude
Wat
er h
eigh
t [m
]
Jason−1 Elastic Viscoplastic
[1] SeisSol. www.seissol.org. [2] Carsten Uphoff, Sebastian Rettenberger, Michael Bader, Elizabeth H. Madden,
Thomas Ulrich, Stephanie Wollherr, and Alice-Agnes Gabriel. Extreme scale multi-physics simulations of the tsunamigenic 2004 Sumatra megathrust earthquake. In Proceedings of SC17. ACM, 2017.
[3] Sea surface height anomalies derived from the Jason-1 data record. ftp://podaac-ftp.jpl.nasa.gov/ allData/jason1/L2/j1_ssha/c109/.

168
Earth, Climate and Environmental Sciences
Abstract
Static 3-D city models are well established for many ap-plications such as architecture, urban planning, naviga-tion, tourism, and disaster management. However, they do not represent the dynamic behavior of the buildings and other infrastructure (e.g. dams, bridges, railway lines). Such temporal change, i.e. 4-D, information is de-manded in various aspect of urban administration, espe-cially for the long-term monitoring of building deforma-tion. Very high resolution spaceborne Synthetic Aperture Radar (SAR) Earth observation satellites, like the German TerraSAR-X and TanDEM-X provide for the first time the possibility to derive both shape and deformation param-eters of urban infrastructure on a continuous basis.
This project aims at generating 4-D city models and their user specific visualizations to reveal not only the 3-D shape of urban infrastructures but also their deforma-tion patterns and motion. The research envisioned in this project will lead to a new kind of city models for moni-toring and visualization of the dynamics of urban infra-structure in a very high level of detail. The deformation of different parts of individual buildings will be accessible for different users (geologists, civil engineers, decision makers, etc.) to support city monitoring and manage-ment, as well as risk assessment.
With the support of Gauss Centre for Supercomputing (GCS), the project has successfully delivered the world’s first city-scale 4-D model derived from spaceborne SAR sensor. In addition, in total eleven million CPU-hours have been dedicated to the generation of 4-D city mod-els of various cities in the duration of the project, in-cluding Las Vegas, Berlin, Shanghai, Beijing, Washington D.C., and Paris.
Motivation
More than half of the world’s population lives in urban areas. For instance, in China there were 83 cities with a population over 1.5 million in 2005 [1]. While this urbani-
zation is expected to increase continuously, with around 135 cities having more than 1.5 million inhabitants in 2025 and around 1 billion people living in China’s cities in 2030 [1], the monitoring of the structural healthiness of urban infrastructure gets increasingly urgent. There are several potential threats which may lead to structur-al degradation and damage of infrastructure, e.g. erro-neous construction, bad building quality, subsidence or uplift due to groundwater levelvariation underground construction activities, or natural disasters. For example, Figure 1 shows a collapsed building in Shanghai due to unstable geological condition and poor reconstruction. Such event can be prevented if a continuous monitoring of the local ground deformation was conducted.
Methodology and Challenge
The most competent method for assessing long-term millimeter-level deformation over large urban areas is the so called differential SAR tomography (D-TomoSAR). D-TomoSAR is able to reconstruct dense 3-D point cloud as well as the deformation parameters of the moni-tored area. One can imagine D-TomoSAR as dense GPS measurements covering each temporally coherent pixel (usually more than 50% of all pixels) on the acquired SAR image.
4D City — Space-time Urban Infrastructure Mapping by Multi-sensor Fusion and Visualization
Research InstitutionSignal Processing in Earth Observation, Technical University of Munich & Remote Sensing Technology Institute, German Aerospace CenterPrincipal InvestigatorXiaoxiang ZhuResearchersYilei Shi, Claas Grohnfeldt, Yuanyuan WangProject Partners—
SuperMUC Project ID: pr45ne
Figure 1: Collapsed apartment building due to unstable geological condi-tion of the ground, and poor construction. Photo from Flickr, CC-BY-ND.
4

169
4D City — Space-time Urban Infrastructure Mapping by Multi-sensor Fusion and Visualization
However, for retrieving high precision 3-D position and the deformation parameters, D-TomoSAR needs to solve an inversion problem with a typical dimension of 100 x 1,000,000 (the forward model matrix) for the data typ-ically used. Such inversion problem is repeated for each pixel in the SAR image that has a typical size of 6,000 x 10,000. Thus, D-TomoSAR processing on a city scale is computationally expensive.
Another method employed in this project to improve the resolution of the SAR images is the so called non-local (NL) means filtering. NL means filtering searches sim-ilar patches in the SAR image in order to significantly reduced the measurements noise while preserving the spatial resolution. As the similar patches have to be searched within the entire image space, it is extremely computationally expensive. Moreover, the computation-al complexity increases quadratically with the dimension of the image.
The abovementioned methods are not feasible for large area processing without high performance computa-tional (HPC) support.
Results
With the support of Leibniz Supercomputing Centre (LRZ) of GCS, the research team so far is the only team in the world that is able to produce the 3-D reconstruction and deformation in city-scale using D-TomoSAR. This project consumed so far in total 11 million core-hours. For each processing job, a stack of tens to hundreds of images was uploaded and processed. Over 500 cores were usu-ally requested for each job. As the computation is also memory intensive, most of the jobs were processed on the fat-island in LRZ. So far, the following datasets have been processed:
Dataset # of images Image size resolution
Las Vegas 180 11,000 x 6,000 0.6 x 1.1m2
Berlin 550 11,000 x 6,000 0.6 x 1.1m2
Shanghai 29 25,000 x 55,000 1.2 x 3.3m2
Beijing 60 25,000 x 55,000 1.2 x 3.3m2
Washington 24 6,000 x 15,000 0.6 x 0.25m2
Paris 41 6,000 x 15,000 0.6 x 0.25m2
Table 1: Processed datasets and size
Some representative results are shown in the following content.
Las VegasThe following upper subfigure is one of the input TerraS-AR-X images of Las Vegas. By applying the D-TomoSAR al-gorithm on tens of such images, a 3-D point cloud was re-constructed (lower subfigure). This point cloud contains around 10 million points. Most importantly, each point contains not only the 3-D position, but also its deforma-tion information with an accuracy of better than millim-eter per year (so-called 4-D).
Figure 3 shows an example of the precise deformation discovered in Las Vegas. Since July 2009, the Las Vegas Convention Center has been undergoing a pronounced subsidence. The color of the figure shows the estimated linear deformation velocity in mm/year.
Figure 2: Upper: TerraSAR-X high resolution spotlight image of Las Vegas, and lower: 3D point cloud of Las Vegas reconstructed using our algorithm. Color represents the height [2], [3].
Figure 3: Deformation estimates of an area around the Las Vegas Con-vention Center: linear deformation velocity (unit: mm/y)[4].

170
Earth, Climate and Environmental Sciences
4
BerlinBy fusing two point clouds reconstructed using SAR im-ages acquired from different viewing angles, one can obtain a complete coverage over an entire city. Figure 4 is the example of Berlin. As always, each point is associat-ed with its movement information. The combined point cloud shown in Figure 4 contains about 40 million points. The number of points exceeds 100 million, if the recon-structed point cloud from all 550 images are combined.
NL Means FilterFigure 5 is a comparison of the standard 12m TanDEM-X 3-D digital elevation model (DEM) and the resolution-en-hanced DEM by NL means filtering [7]. The NL means fil-tered DEM revealed much more detailed structure buried in the noise [8]-[11].
Conclusion and Outlook
With the HPC support of GSC, this project delivered the world’s first 4-D city model derived from spaceborne SAR data. Such 4-D model is essential in continuously monitoring of urban areas. As the data volume of earth observation mission exponentially increases, e.g. the Copernicus programme, HPC will surely be an essential edge in the future research. Such edge also supported us of winning an ambitious European Research Council starting grant project So2Sat: Big Data for 4-D Global
Mapping – 1016 Bytes from Social Media to EO Satellites (http://www.sipeo.bgu.tum.de/projects/so2sat), whose aim is to provide global 4-D urban models.
References
[1] J. Woetzel et al., “Preparing for China’s Urban Billion,” McKinsey Global Institute, 2009.
[2] X. Zhu, Very High Resolution Tomographic SAR Inversion for Urban Infrastructure Monitoring: A Sparse and Nonlinear Tour, vol. 666. Deutsche Geodätische Kommission, 2011.
[3] X. Zhu, Y. Wang, S. Gernhardt, and R. Bamler, “Tomo-GENESIS: DLR’s Tomographic SAR Processing System,” in Urban Remote Sensing Event (JURSE), 2013 Joint, 2013, pp. 159–162.
[4] X. X. Zhu and R. Bamler, “Let’s Do the Time Warp: Multicomponent Nonlinear Motion Estimation in Differential SAR Tomography,” IEEE Geosci. Remote Sens. Lett., vol. 8, no. 4, pp. 735–739, 2011.
[5] Y. Wang, X. Zhu, and R. Bamler, “An Efficient Tomographic Inversion Approach for Urban Mapping Using Meter Resolution SAR Image Stacks,” IEEE Geosci. Remote Sens. Lett., vol. 11, no. 7, pp. 1250–1254, 2014.
[6] Y. Wang and X. Zhu, “Automatic Feature-based Geometric Fusion of Multi-view TomoSAR Point Clouds in Urban Area,” IEEE J. Sel. Top. Appl. Earth Obs. Remote Sens., vol. 8, no. 3, pp. 953–965, 2015.
[7] X. X. Zhu, R. Bamler, M. Lachaise, F. Adam, Y. Shi, and M. Eineder, “Improving TanDEM-X DEMs by Non-local InSAR Filtering,” in EU-SAR 2014; 10th European Conference on Synthetic Aperture Radar; Proceedings of, 2014, pp. 1–4.
[8] Y. Shi, X. Zhu, W. Yin, R. Bamler, A fast and accurate basis pursuit denoising algorithm with application to super-resolving tomo-graphic SAR, IEEE Transactions on Geoscience and Remote Sensing, in press, 2018.
[9] S. Montazeri, X. Zhu, M. Eineder, R. Bamler, 3-D Deformation Mon-itoring of Urban Infrastructure by Tomographic SAR Using Mul-ti-Track TerraSAR-X Data Stacks. IEEE Transactions on Geoscience and Remote Sensing 54(12), 6868-6878, 2016.
[10] X. Zhu, S. Montazeri, C. Gisinger, R. Hanssen, R. Bamler, Geodetic SAR Tomography. IEEE Transactions on Geoscience and Remote Sensing 54(1), 18-35, 2016
[11] N. Ge, F. Rodriguez Gonzalez, Y. Wang, and X. X. Zhu, “Spaceborne Staring Spotlight SAR Tomography - A First Demonstration with TerraSAR-X,” IEEE J. Sel. Top. Appl. EARTH Obs. REMOTE Sens., 2018.
Figure 4: Fusion of two reconstructed 3D point clouds. The combined point cloud contains over 40 million points [5], [6].
Figure 5: Jülich city area: Optical image ©Google (left), the standard 12m TanDEM-X DEM (middle) and improved nonlocal TanDEM-X DEM with 6m resolution (right) [7].

171
Retrodictions of Past Mantle Flow Using Global High-Resolution Earth Models
Introduction
Earth’s mantle, although solid on short time scales, can flow like a very viscous fluid over the course of geologic eras. Heat coming from the underlying core and inter-nal heat production due to radioactive decay are large enough to set the mantle in vigorous convection. Mantle convection drives the motion of tectonic plates and dic-tates the long-term evolution of the Earth: it controls the distribution of continents and oceans and their topographic elevation; it determines the formation of mountain ranges, shallow seas and land bridges between continents; and it is the cause of Earth’s seis-micity and volcanic ac-tivity. As such, it has a broad impact on
many aspects of the Earth system, ranging from its oce-anic and atmospheric circulation to its climate, from its hydrosphere to the erosion and deposition of sediments, from the location and abundance of natural resources to the evolution of life. As such, mantle convection is one of the main research areas at the Geophysics section of the Ludwig-Maximilians-Universität München [1].
Retrodictions of Past Mantle Flow Using Global High-Resolution Earth Models
Research InstitutionGeophyics Section, Department of Earth and Environmental Sciences, Ludwig-Maximilians-Universität MünchenPrincipal InvestigatorHans-Peter BungeResearchersLorenzo Colli, Siavash Ghelichkhan and Bernhard SchuberthProject Partners—
SuperMUC Project ID: pr48ca
Figure 1: First mantle flow retrodictions for geodynamically plausible, compressible, high resolution Earth models with ~670 million finite elements, going back in time to the mid-Paleogene [3]. The visualization shows the time evolution of one of the four retrodiction models (top: temperature variations, middle: asthenospheric flow velocity, and bottom: the induced surface topography). The retrodictions produce a spatially and temporally highly variable asthenosphere flow with faster than plate velocities, and a history of dynamic topography characterized by local doming events, in agreement with considerations on plate driving forces, and regional scale uplifts reported in the geologic literature.

172
Earth, Climate and Environmental Sciences
4
Results and Methods
In an earlier study, we showed that, although mantle convection at earth-like vigor is a chaotic process, one can constrain its flow history back in time for periods comparable to a mantle overturn, i.e. ≈100 million years, if knowledge of the surface velocity field and estimates on the present-day heterogeneity state are available [2]. Such “retrodictions”, which involve the solution of a ge-odynamic inverse problem through the adjoint method, are a promising tool to improve our understanding of deep Earth processes, and to link uncertain geodynamic modeling parameters to geologic observables. We have now performed the first mantle flow retrodictions for geodynamically plausible, compressible, high resolution Earth models with ≈670 million finite elements, going back in time to the Mid Paleogene [3].
The geodynamic inverse problem aims at finding the (unknown) state of the mantle some time in the past that naturally evolves into its (known) present-day state. The adjoint method minimizes the difference between the observed present-day mantle structure and the prediction of a geodynamic model by refining the initial condition in the past through an iterative method. Each iteration requires the solution forward in time of the equations that govern mantle convection, which are based on first-principle conservation laws of physics, and the solution backward in time of a set of adjoint equations, which are derived from the forward equations.
One of the appealing aspects of the adjoint method is the similarity of the forward and adjoint equations. They can thus be solved by the same numerical code with only slight modifications. For this project we used the parallel finite element code TERRA, modified to solve the forward and adjoint equations for compressible Earth models [4]. In order to simulate mantle convection at earth-like vigor, a sufficiently high resolution is needed. This is obtained by dividing the volume of the mantle into ≈670 million finite elements, for a maximum grid spacing of ≈11 km at Earth’s surface. An adjoint iteration for this model over 40 Ma requires between 75 and 150 thousand CPU-hours, equivalent to 36 to 72 hours of computation using 2048 CPUs. The initial condition is optimally recovered after 5 to 10 iterations, leading to a total of about a million CPU-hours per retrodiction. We have chosen to retrodict past mantle flow for four sce-narios, combining two different estimates for the pres-ent-day state of the Earth’s mantle with two different viscosity profiles for the geodynamic model. Retrodic-tions of mantle evolution for these four scenarios were performed for the last 40 Ma of geologic history (i.e., back to the mid-Paleogene). We then investigated the related implications in terms of dynamic topography [3] and changes in the the shape of the Earth’s gravitation-al potential field induced by mantle circulation [5]. We found that the retrodicted history of mantle convection and dynamic topography in our simulations is sensitive to the assumptions about the present-day mantle state and its viscosity, suggesting that mantle flow retrodic-
tions obtained from adjoint modeling can provide pow-erful constraints on the assumptions of structural and rheologic parameters of Earth models. In particular, this can be achieved by comparing their predicted dynamic topography evolution to constraints gleaned from the geologic record.
Furthermore, we assessed the signal retrievability of the modeled geoid rates by current and future satellite gravity missions using closed-loop numerical simula-tions, with different satellite gravity retrieval mission as-sumptions [5]. Temporal gravity signals induced by deep Earth’s processes are commonly thought to lie below the observational threshold of satellite gravity missions, as one assumes them to be small in amplitude and restrict-ed to the longest spatial and temporal scales. However, the fast rates of surface uplift and subsidence in the retrodiction models of the mantle, and the geologic ob-servations of epeirogenic movements provide evidence for the contrary. The modeled deep Earth signal, on the order of 5 μm/year at spatial scales of 1000 km, is on the edge of detectability by current gravimetry satellite missions, but coming into the range of detectability in future temporal gravity field solutions, suggesting the use of satellite gravity data to validate geodynamic Earth models. Importantly, the application of forward modeled dynamic mantle signals, which can be linked to geologic observables and are thus independently testable, seems to be essential for improved de-aliasing and signal sepa-ration in future gravity missions.
On-going Research / Outlook
After these first successful retrodictions, we now plan to use this powerful methodology to systematically investi-gate the parameter space of mantle convection – in par-ticular, various pressure and temperature-dependent vis-cosities – by checking the predicted changes in surface dynamic topography against the geologic record. In addi-tion, a variety of seismic tomographic models, mineralo-gies and chemical compositions exist that we can use in different combinations as proxy for the present-day ther-modynamic state of the mantle, for which many tens of simulations need to be run in the next years.
References and Links
[1] www.geophysik.uni-muenchen.de[2] L. Colli, H.-P. Bunge, and B. S. A. Schuberth. 2015. On retrodic-
tions of global mantle flow with assimilated surface velocities. Geophysical Research Letters 42, 8341–8348. DOI: https://doi.org/10.1002/2015gl066001
[3] L. Colli, S. Ghelichkhan, H.-P. Bunge and J. Oeser. 2017. Retrodictions of Mid Paleogene mantle flow and dynamic topography in the Atlantic region from compressible high resolution adjoint mantle convection models: Sensitivity to deep mantle viscosity and tomo-graphic input model. Gondwana Research 53, 252–272. DOI: https://doi.org/10.1016/j.gr.2017.04.027
[4] S. Ghelichkhan and H.-P. Bunge. 2016. The compressible adjoint equations in geodynamics: derivation and numerical assessment. Int J Geomath 7, 1–30. DOI: https://doi.org/10.1007/s13137-016-0080-5
[5] S. Ghelichkhan, M. Murböck, L. Colli, R. Pail and H.-P. Bunge. 2017. On the observability of epeirogenic movement in current and future gravity missions. Gondwana Research 53, 273–284. DOI: https://doi.org/10.1016/j.gr.2017.04.016

173
Validation of vertically nested large-eddy-simulation in heterogeneous terrain
Introduction
Human life is directly affected by the chemical compo-sition and physical properties of the air near the Earth’s surface, e.g. due to air pollution or heat waves. Due to the Earth’s rotation and the diurnal cycle this air forms the atmospheric boundary layer (ABL) at the bottom of the troposphere, through which all exchange of energy and matter between the surface and the atmosphere takes place. The properties of the ABL strongly depend on the underlying surface and can change from day to day. A thorough understanding of the processes that govern the behavior of the ABL can therefore improve the qual-ity of life [1].
The flow in the ABL is turbulent, and localized or low fre-quency measurements cannot yield a complete picture. A convenient computational technique to study the tur-bulence in the ABL, is large-eddy simulation (LES). LES resolves the turbulence above a grid-dependent cutoff scale, below which the turbulence becomes more gener-ic and can be (statistically) predicted by simpler models. In this way, the computational resources needed are sup-pressed, while we obtain a correct understanding of the turbulence above the cutoff scale.
However, for studies that rely on details in the surface layer (the lowest 10% of the ABL) an accurate description would require a high grid resolution with large costs. As a solution we have implemented an LES-within-LES nesting scheme, where the surface layer is resolved at a higher spatial resolution than the rest of the ABL. In this project, we verified our nesting scheme [2] and validated it by means of a case study for the LITFASS-2003 exper-iment, focusing on heterogeneous terrain. Previous LES has been performed for this site by Maronga and Raasch [3] but at lower vertical resolution (without nesting: with 10 m vertical grid size and 20 m horizontal grid size) and with different research focus. With nesting we achieve a resolution of 1 m vertical grid size and 2 m horizontal grid size in this study.
Validation of vertically nested large-eddy- simulation in heterogeneous terrain
Research InstitutionKarlsruhe Institute of Technology – Campus AlpinPrincipal InvestigatorFrederik De RooResearchersSadiq HuqProject Partners—
SuperMUC Project ID: pr48la
Fig. 1: Overview of the nesting algorithm

174
Earth, Climate and Environmental Sciences
4
Methods and verification
We use the LES model PALM [4] from the Leibniz Univer-sity Hannover, which is available under the GPL-3 license. The time-stepping is done with a third order Runge-Kutta scheme, the advection scheme for the ensemble runs with Wicker-Skamarock, for the Rayleigh-Bénard convection with Piacsek-Williams. The pressure solver uses fast Fou-rier transform (FFTW). PALM has implicit filtering of the subgrid-scales, for which it employs 1.5-order turbulence closure with a prognostic equation for the turbulent kinet-ic energy. At the lowest grid cell Monin-Obukhov similarity theory is applied. Our lateral boundary conditions are peri-odic and the surface fluxes are driven by the diurnal cycle. The domain of PALM is decomposed into vertical columns, which communicate by MPI calls. The nested grid and the parent grid are assigned different MPI communicators, which interact with each other through the global commu-nicator for the anterpolation (feedback) of the parent grid and the boundary conditions of the nested grid.
We tested the scalability of the nested code with a con-stant number of grid points per core and a constant ratio between the number of cores for the parent and nest-ed grid. For comparison with the non-nested version of PALM, standalone runs with the same load and same number of cores as the nested grid were evaluated.
We also investigated pure Rayleigh-Bénard convection to verify our implementation of the nesting. This type of free convection produces convection cells spanning the entire vertical extent of the domain, which allows us to verify that the two grids interact correctly.
O E R P#grid points (G) 6.0 1.1 11 8.6# runs 100 8 1 1# CPU 1638 2592 6048 4096Core-hours 0.3 3.5 2.7 1.5
Table 1: Overview of our simulations. O: optimization of the nesting, E: LITFASS ensemble runs with nesting, R: LITFASS reference run, P: prelimi-nary simulation with non-cyclic boundary conditions
Simulation Results
After optimization and verification of the nesting, we fo-cus on simulations for the LITFASS experiments. We run ensemble simulations to separate the effects induced by the heterogeneous land surface (Fig. 4) from random turbulence. We focus on the energy balance closure ratio (EBR) which expresses the closure of the surface energy budget, shown in Fig. 5. The net incoming energy is com-pared to the turbulent fluxes of latent and sensible heat and the ground heat flux. In real-world experiments, EBR is obtained by eddy-covariance measurements (EC). As in most EC measurements, many locations show under-clo-sure (EBR <1). However, near borders of different surface types, strong local over-closure (EBR>1) can be found as well, highlighting the importance of edge effects in near-surface turbulence.
Fig. 2: Scaling of the nested PALM
Fig. 3: Rayleigh-Bénard convection in the parent grid (a) and the nested grid (b)

175
Local Supercluster Simulations
On-going Research / Outlook
We encountered problems with the NetCDF library in combination with the fpe0 compiler flag, this issue oc-curs only on Intel compiler version 15 or higher. While the principal developers of PALM have shown that the stan-dalone code scales up to 40,000 cores, our experience from SuperMUC shows that on more than two islands the data IO causes a severe bottle-neck.
Figure 4: Map of the surface types for the modeled LITFASS area Figure 5: Surface energy balance ratio for LITFASS
References and Links
[1] https://www.imk-ifu.kit.edu/table.php[2] S Huq, F De Roo, S Raasch and M Mauder 2016, 21st Symposium on
Boundary Layers and Turbulence, Leeds, GB, June 9-13, 2014[3] Maronga, B. and S. Raasch 2013. Boundary-Layer Meteorol. 148, 309-
331 doi:10.1007/s10546-012-9748-z[4] https://palm.muk.uni-hannover.de/trac
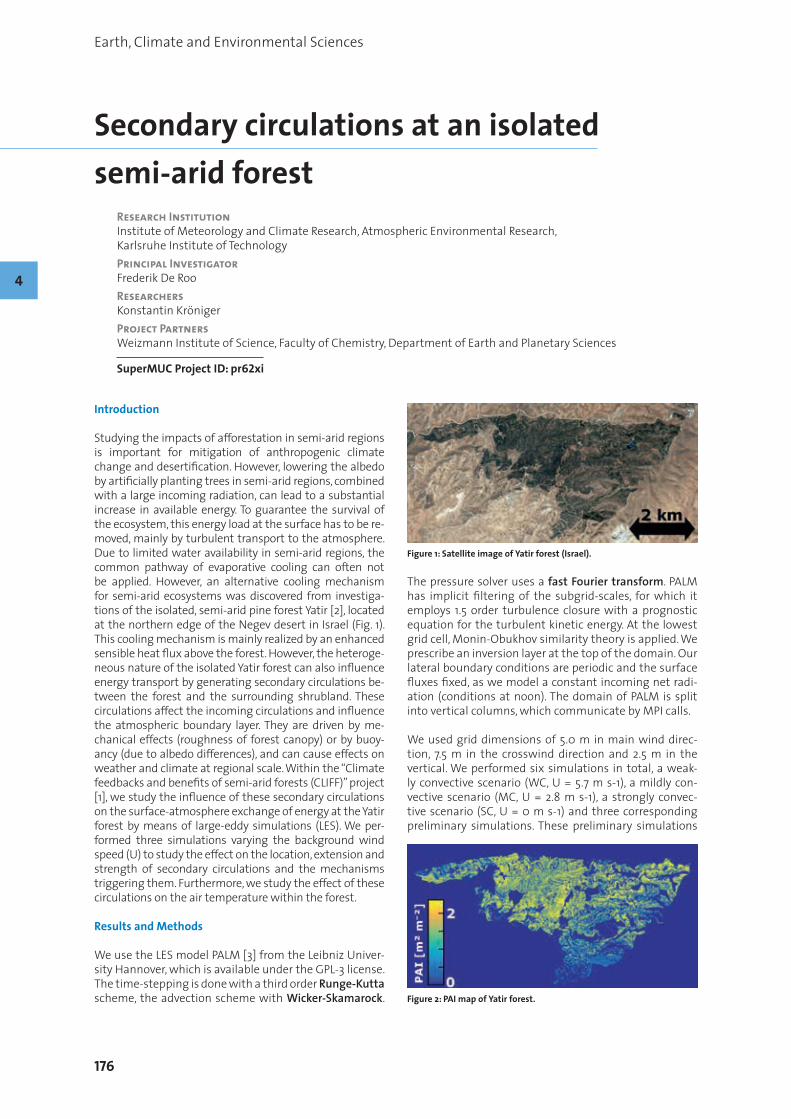
176
Earth, Climate and Environmental Sciences
Introduction
Studying the impacts of afforestation in semi-arid regions is important for mitigation of anthropogenic climate change and desertification. However, lowering the albedo by artificially planting trees in semi-arid regions, combined with a large incoming radiation, can lead to a substantial increase in available energy. To guarantee the survival of the ecosystem, this energy load at the surface has to be re-moved, mainly by turbulent transport to the atmosphere. Due to limited water availability in semi-arid regions, the common pathway of evaporative cooling can often not be applied. However, an alternative cooling mechanism for semi-arid ecosystems was discovered from investiga-tions of the isolated, semi-arid pine forest Yatir [2], located at the northern edge of the Negev desert in Israel (Fig. 1). This cooling mechanism is mainly realized by an enhanced sensible heat flux above the forest. However, the heteroge-neous nature of the isolated Yatir forest can also influence energy transport by generating secondary circulations be-tween the forest and the surrounding shrubland. These circulations affect the incoming circulations and influence the atmospheric boundary layer. They are driven by me-chanical effects (roughness of forest canopy) or by buoy-ancy (due to albedo differences), and can cause effects on weather and climate at regional scale. Within the “Climate feedbacks and benefits of semi-arid forests (CLIFF)” project [1], we study the influence of these secondary circulations on the surface-atmosphere exchange of energy at the Yatir forest by means of large-eddy simulations (LES). We per-formed three simulations varying the background wind speed (U) to study the effect on the location, extension and strength of secondary circulations and the mechanisms triggering them. Furthermore, we study the effect of these circulations on the air temperature within the forest.
Results and Methods
We use the LES model PALM [3] from the Leibniz Univer-sity Hannover, which is available under the GPL-3 license. The time-stepping is done with a third order Runge-Kutta scheme, the advection scheme with Wicker-Skamarock.
The pressure solver uses a fast Fourier transform. PALM has implicit filtering of the subgrid-scales, for which it employs 1.5 order turbulence closure with a prognostic equation for the turbulent kinetic energy. At the lowest grid cell, Monin-Obukhov similarity theory is applied. We prescribe an inversion layer at the top of the domain. Our lateral boundary conditions are periodic and the surface fluxes fixed, as we model a constant incoming net radi-ation (conditions at noon). The domain of PALM is split into vertical columns, which communicate by MPI calls.
We used grid dimensions of 5.0 m in main wind direc-tion, 7.5 m in the crosswind direction and 2.5 m in the vertical. We performed six simulations in total, a weak-ly convective scenario (WC, U = 5.7 m s-1), a mildly con-vective scenario (MC, U = 2.8 m s-1), a strongly convec-tive scenario (SC, U = 0 m s-1) and three corresponding preliminary simulations. These preliminary simulations
Secondary circulations at an isolated semi-arid forest
Research InstitutionInstitute of Meteorology and Climate Research, Atmospheric Environmental Research, Karlsruhe Institute of TechnologyPrincipal InvestigatorFrederik De RooResearchersKonstantin KrönigerProject PartnersWeizmann Institute of Science, Faculty of Chemistry, Department of Earth and Planetary Sciences
SuperMUC Project ID: pr62xi
Figure 1: Satellite image of Yatir forest (Israel).
Figure 2: PAI map of Yatir forest.
4
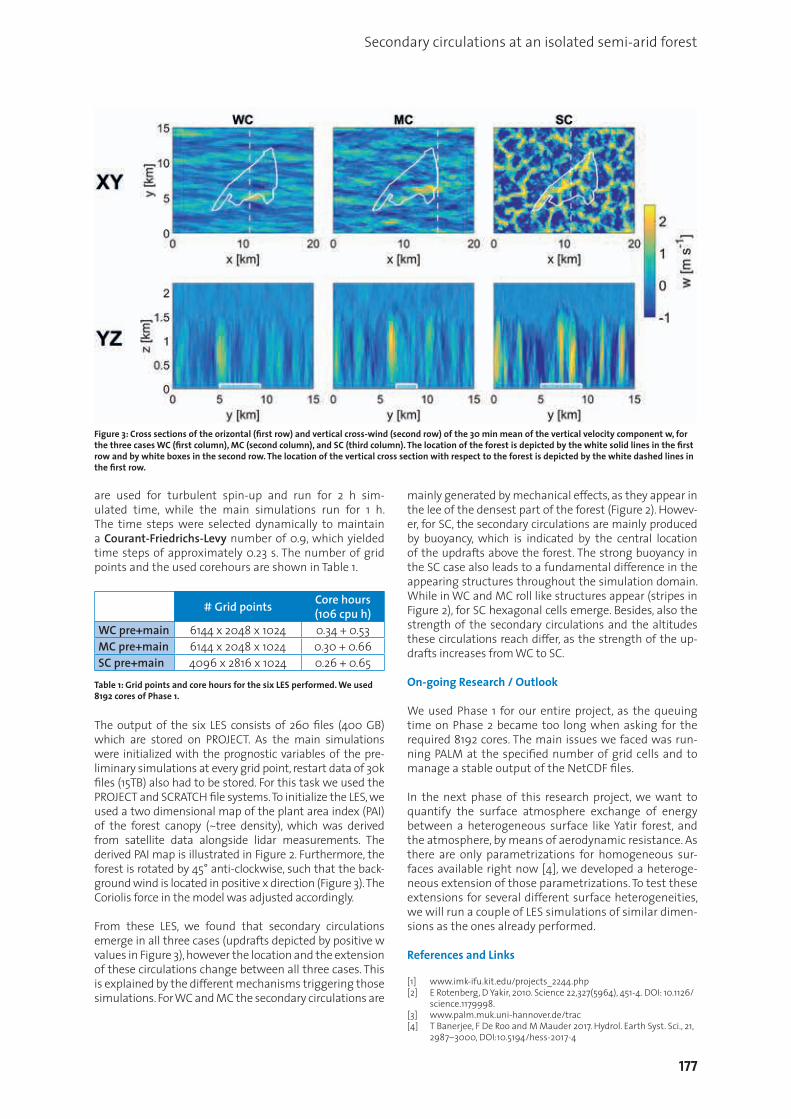
177
Secondary circulations at an isolated semi-arid forest
are used for turbulent spin-up and run for 2 h sim-ulated time, while the main simulations run for 1 h. The time steps were selected dynamically to maintain a Courant-Friedrichs-Levy number of 0.9, which yielded time steps of approximately 0.23 s. The number of grid points and the used corehours are shown in Table 1.
# Grid points Core hours (106 cpu h)
WC pre+main 6144 x 2048 x 1024 0.34 + 0.53MC pre+main 6144 x 2048 x 1024 0.30 + 0.66SC pre+main 4096 x 2816 x 1024 0.26 + 0.65
Table 1: Grid points and core hours for the six LES performed. We used 8192 cores of Phase 1.
The output of the six LES consists of 260 files (400 GB) which are stored on PROJECT. As the main simulations were initialized with the prognostic variables of the pre-liminary simulations at every grid point, restart data of 30k files (15TB) also had to be stored. For this task we used the PROJECT and SCRATCH file systems. To initialize the LES, we used a two dimensional map of the plant area index (PAI) of the forest canopy (~tree density), which was derived from satellite data alongside lidar measurements. The derived PAI map is illustrated in Figure 2. Furthermore, the forest is rotated by 45° anti-clockwise, such that the back-ground wind is located in positive x direction (Figure 3). The Coriolis force in the model was adjusted accordingly.
From these LES, we found that secondary circulations emerge in all three cases (updrafts depicted by positive w values in Figure 3), however the location and the extension of these circulations change between all three cases. This is explained by the different mechanisms triggering those simulations. For WC and MC the secondary circulations are
mainly generated by mechanical effects, as they appear in the lee of the densest part of the forest (Figure 2). Howev-er, for SC, the secondary circulations are mainly produced by buoyancy, which is indicated by the central location of the updrafts above the forest. The strong buoyancy in the SC case also leads to a fundamental difference in the appearing structures throughout the simulation domain. While in WC and MC roll like structures appear (stripes in Figure 2), for SC hexagonal cells emerge. Besides, also the strength of the secondary circulations and the altitudes these circulations reach differ, as the strength of the up-drafts increases from WC to SC.
On-going Research / Outlook
We used Phase 1 for our entire project, as the queuing time on Phase 2 became too long when asking for the required 8192 cores. The main issues we faced was run-ning PALM at the specified number of grid cells and to manage a stable output of the NetCDF files.
In the next phase of this research project, we want to quantify the surface atmosphere exchange of energy between a heterogeneous surface like Yatir forest, and the atmosphere, by means of aerodynamic resistance. As there are only parametrizations for homogeneous sur-faces available right now [4], we developed a heteroge-neous extension of those parametrizations. To test these extensions for several different surface heterogeneities, we will run a couple of LES simulations of similar dimen-sions as the ones already performed.
References and Links
[1] www.imk-ifu.kit.edu/projects_2244.php [2] E Rotenberg, D Yakir, 2010. Science 22,327(5964), 451-4. DOI: 10.1126/
science.1179998.[3] www.palm.muk.uni-hannover.de/trac[4] T Banerjee, F De Roo and M Mauder 2017. Hydrol. Earth Syst. Sci., 21,
2987–3000, DOI:10.5194/hess-2017-4
Figure 3: Cross sections of the orizontal (first row) and vertical cross-wind (second row) of the 30 min mean of the vertical velocity component w, for the three cases WC (first column), MC (second column), and SC (third column). The location of the forest is depicted by the white solid lines in the first row and by white boxes in the second row. The location of the vertical cross section with respect to the forest is depicted by the white dashed lines in the first row.

178
Earth, Climate and Environmental Sciences
Introduction
The Computational Seismology group of LMU Munich uses SuperMUC HPC infrastructure in a variety of inter-national research projects covering 3D forward and in-verse problems in computational wave propagation and earthquake rupture across spatial and temporal scales. A high number of small¬ to mid-scale runs as well as certain large¬-scale simulations were performed. State¬-of-¬the-¬art modeling software based on high¬-order accurate SEM and ADER-¬DG methods was used to gain insight into earthquake physics and observational seis-mology. For example, the discontinuous Galerkin (DG) solver SeisSol today can be considered the most accurate and efficient solver for dynamic rupture problems (SC17 Best Paper Award). We explored new roads implement-ing new SEM solvers (e.g., Salvus, axisem3D, WaveQLab3D, ExaHyPE) on SuperMUC. Furthermore, new numerical methods for computational seismology were developed (SpecTet) and optimized for high¬-performance comput-ing. The project merges a variety of methods and topics, of which we highlight selected results and impacts in the following.
The forward problem: Earthquake rupture physicsAlice-Agnes Gabriel, Elizabeth Madden, Thomas Ulrich, Stephanie Wollherr
Studying past earthquakes using numerical modeling allows us to advance our ability to quantify earthquake hazard and to understand fundamental aspects of earth-quake physics. Using SeisSol, a software package solving the coupled dynamic rupture and wave propagation problem with high order accuracy in space and time, we studied several past earthquakes. Dynamic rupture sce-narios of the 1992 Mw 7.3 Landers (Wollherr and Gabriel, 2018), the 2004 Mw 9.3 Sumatra-Andaman (Upoff et al., 2017), and the 2016 Mw 7.8 Kaiko-ura (Ulrich et al., 2018, Fig. 1) earthquakes, enabled us to reproduce key charac-
teristics of such events and offer comprehensive, physi-cally self-consistent earthquake source descriptions. We studied specific aspects of the earthquake rupture and of the wave-propagation affecting earthquake hazard. For instance, we investigated the influence of off-fault plastic yielding on the rupture transfer between sever-al segments (using the Landers model), the effect of a shallow sedimentary basin on the ground-motions (2015 Mw 7.8 Gorkha earthquake, Rijal, 2018) and the physical conditions allowing rupture cascades on complex fault systems (Kaiko-ura earthquake, Ulrich et al., 2018).
Rijal, A. (2018), Modern numerical methods for the analysis of topography and basin structure effects on ground motion: 2015 Nepal Earthquake, Master Thesis, Ludwig-Maximilians-Universi-tät München, Department of Earth and Environmental Sciences, Geophysics.
Ulrich, T., Gabriel, A.-A., Ampuero, J.P., Xu, W. (2018), Dynamic viability of the 2016 Mw 7.8 Kaiko-ura earthquake cascade on weak crustal faults (under revision at Nature Communications).
Uphoff, C., Rettenberger, S., Bader, M., Madden, E. H., Ulrich, T.,
3-D seismic wave propagation and earthquake rupture:
New roads for the forward and inverse problemResearch InstitutionDepartment für Geo- und Umweltwissenschaften, LMU MunichPrincipal InvestigatorHeiner IgelResearchersMichael Dumbser, Kenneth C. Duru, Alice-Agnes Gabriel, Celine Hadziioannou, Kasra Hosseini, Lion Krischer, Elizabeth Madden, Anne Obermann, Simon Stähler, Thomas Ulrich, Stephanie Wollherr, Djamel ZianeProject PartnersStanford University, CA, USA; Department of Earth Sciences/Swiss Seismological Service, ETH Zurich, Switzerland; University of Hamburg; Department of Civil, Environmental and Mechanical Engineering, University of Trento, Italy; University of Oxford, UK; King Abdullah University of Science and Technology, Saudi Arabia; Chair of Scientific Computing, Technical University Munich
SuperMUC Project ID: pr63qo (KONWIHR Project)
Figure 1: Dynamic rupture multi-physics scenario of the 2016 Mw 7.8 Kaik0-ura earthquake. Snapshot of the wavefield (absolute particle velocity in m/s) across the fault network and of the fault slip rate after 44 seconds simulation time.
4

179
3-D seismic wave propagation and earthquake rupture
Wollherr, S., and Gabriel, A.-A. (2017). Extreme scale multi-physics simulations of the tsunamigenic 2004 Sumatra megathrust earth-quake. In Proceedings of the International Conference for High Performance Computing, Networking, Storage and Analysis, SC’17, 21, 1-16.
Wollherr, S., Gabriel, A.-A. and Uphoff C. (2018), Off-fault plasticity in three-dimensional dynamic rupture simulations using a modal Discontinuous Galerkin method on unstructured meshes: Imple-mentation, verification, and application (submitted to Geophysical Journal International).
The inverse problem: Seismic Full Waveform InversionLion Krischer, Christian Boehm, Andreas Fichtner
Understanding the subsurface structure of our planet is one of geophysics’ paramount goals. Seismic waves excited for example by earthquakes travel through the planet and its internal structure leaves an imprint on them. Seismologists developed numerous techniques over the last 40 years to invert recorded waveforms for Earth structure. During the last decade computers and algorithms became powerful enough to perform these inversions using physically accurate numerical wavefield simulations, a technique known as full waveform inver-sion (FWI). We applied FWI to a domain stretching from the Western border of the United States across the North Atlantic well into Europe and inverted radially anisotrop-ic structure with waveform periods from 30-120 seconds. Key improvements of this work compared to previous studies are the advances in data processing, non-linear optimisation techniques, and the full automization of the workflow yielding a highly detailed model.
Krischer, L., Fichtner, A., Boehm, C., Igel, H. (2018) Automated Large- Scale Seismic Waveform Inversion for North America and the North Atlantic. (Geophysical Journal International, doi:10.1029/2017JB015289,)
Broadband inversion for seismic sources and structureSimon Staehler, Kasra Hosseini
Seismic tomography is a powerful geophysical imaging method that has been yielding increasingly detailed structural information about the earth’s deep interior. It is similar to the non-invasive imaging methods used for medical diagnostics (e.g., X-ray tomography) except that
the sources are earthquakes, and the receivers are a glob-al network of seismometers. The method uses seismic waves, generated by tens to thousands of moderate to large earthquakes, to sample and estimate the 3-D spa-tial variations in seismic velocity of the crust and mantle. Although these 3-D images of seismic velocity anomalies are not of primary interest per se, they correlate with den-sity, temperature, and compositional anomalies which are the drivers of heat and material flows in the interior. The field of seismic tomography is undergoing a rapid shift towards waveform-based methods that explicitly account for scattered wave energy. Our work addresses the problem of the whole-mantle geometry as sampled by body waves, which has three key characteristics: (1) A very large dataset of ~3500 earthquake sources recorded by global broadband stations. (2) High-frequency body wave measurements which are computationally very ex-pensive to model but yield maximum image resolution. In this case, full-3D simulations become prohibitively ex-pensive, but the problem can be reasonably approved as the first order derivation from a spherically symmetric earth. (3) An inversion framework with adaptive parame-terization to accurately map the information of our data set onto velocity variations in Earth’s mantle. SuperMUC has been extensively used for simulating high-frequency synthetic seismograms and to generate new global seis-mic tomography models of the mantle (Fig. 3).
The inverse problem: Understanding and enabling imaging with diffuse wave-fieldsAnne Obermann, Céline Hadziioannou
Recent findings of observational seismology indicate a high, spatially variable, sensitivity of the local seismic velocity in the later, scattered part of the seismic signal (seismic coda) to deformation and/or stress and pressure changes. In recent years, the work in this field has led to unprecedented precision in continuous monitoring of the seismic velocity (e.g. forecasting the location of vol-canic eruption, assessing reservoir dynamics, evolution of stress and damage state after large earthquakes). Al-though the separation of the effects of the various forc-ing and precise 3D spatial imaging of the changes still need to be improved. The later is the main methodolog-
Figure 2: Vertical slice of the final model after 20 L-BFGS iterations. It shows the isotropic shear wave speed at a depth of 150 km.
Figure 3: Depth profiles at 200 km (left) and 1200 km (right) depths.Colors indicate the compressional velocity perturbations with respect to IASP91 background model. [Hosseini et al., in preparation]

180
Earth, Climate and Environmental Sciences
ical challenge that we targeted with extensive 3D wave-field simulations in complex, heterogeneous media (Fig. 3). Our results allowed us to understand the partitioning of surface- and body-waves in the coda (Obermann et al. 2016). Using this partitioning, we developed 3D sensitiv-ity kernels that we use successfully to image complex structures (e.g. cracks, voids, pressure changes) at depth (Obermann et al. 2018).
Obermann, A., Planès, T., Hadziioannou, C., Campillo, M. (2016) Lapse-time dependent coda wave depth sensitivity to local velocity perturbations in 3-D heterogeneous elastic media, Geophysical Journal International, 207, 59-66, doi: 10.1093/gji/ggw264
Obermann, A., Planès, T., Larose, E., Campillo, M. (2018) 4-D imaging of subsurface changes with coda waves: numerical studies of sensitivity kernels and applications to the Mw 7.9, 2008 Wenchuan earthquake, to be submitted to PAGEOPH
New numerical methods for 3D wave propagation: SpecTetDave A. May, Alice-Agnes Gabriel, Ashim Rijal
In the absence of recorded earthquake data, numerical methods can be used to understand the ground mo-tions. However, simulation of seismic wave propagation is numerically challenging in the mountainous regions because of the strong variation in topography and shallow basins. The SpecTet package, both allowing un-structured tetrahedral meshing and high-order accura-cy based on the Spectral Element Method, allows high flexibility in mesh generation crucial for discretizing sedimentary basin edges and complex topography. The incorporation of surface topography and basin edge structures into numerical simulation helps us to esti-mate realistic ground motions. The largest aftershock (Mw 7.3) of the 2015 Gorkha earthquake, which occured in the mountainous terrain and close to the Kathman-du valley - a basin, was simulated to understand the effects of topography and basin structure on ground motion.
A comparison between SpecTet and ADER-DG based package SeisSol was carried out (Rijal, 2018) using a Layer Over Halfspace (LOH.1) benchmark test. A robust comparison of both packages on the same unstruc-tured tetrahedral meshes, reveals that SpecTet provides
4
approximately a factor of 1.2 lower resolution. The high-ly optimized SeisSol package is computationally less demanding by a factor of 20 compared to the current state of the SpecTet package.
Rijal, A. (2018), Modern numerical methods for the analysis of topography and basin structure effects on ground motion: 2015 Nepal Earthquake, Master Thesis, Ludwig-Maximilians-Universi-tät München, Department of Earth and Environmental Sciences, Geophysics.
Figure 4: Seismic wave-field simulation in a complex, heterogeneous structure (A). The resultant synthetic seismograms show long-lasting multiply-scattered coda waves (B).
Figure 4: Simulation of the largest aftershock (Mw 7.3) of the 2015 Gorkha Earthquake, Nepal using the SpecTet package. Snapshot of the absolute particle velocity wave-field at time t=34s is shown with trapped waves inside the Kathmandu basin (inset figure).

181
From Electrons to Planets, with Energy Between
Introduction
Fluids are important in Earth’s interior, where they trans-port materials, lead to melting, and govern much of the behavior of the Earth ranging from earthquakes to volcanism and plate tectonics, yet fluid properties are extremely difficult to measure at high pressures. In the Earth, carbonated aqueous fluids separate from rocks in the slabs that are subducted into Earth’s transition zone and rise, reacting with mantle rocks, changing their chemistry and mechanical properties, generating earth-quakes, and leading to melting that causes volcanoes and large-scale motion in the Earth. Studying the chem-istry of these fluids is made difficult by the fact that they react with whatever you encapsulate them in, such as a diamond anvil cell or metallic reaction vessels, and they do not diffract X-rays like crystals, so are difficult to obtain even basic quantities such as density. In giant planets like Jupiter, with enormous pressure and temper-atures, this is even more of an issue, where we have very little experimental information. We are using first-prin-
ciples methods to simulate such fluids, starting with electrons and nuclei, using highly accurate quantum me-chanical methods to simulate fluids in the pressures and temperatures that range from Earth’s surface to its core, and to the center of Jupiter and beyond. The same meth-ods can be used across all fields of materials, and we are also studying technological materials, particularly active materials that can be used to produce or harness ener-gy, such as ferroelectrics. This is an European Research Council Advanced Grant project called Theory of Mantle, Core, and Technological Materials (ToMCaT).
Results and Methods
C-H-O fluidsWe performed first-principles molecular dynamics (FPMD) and obtained the equation of state as a function of pressure, temperature and composition. Unexpect-edly, we find spontaneous molecular reactions, and we have identified from the computed vibrational spectra and analyzing atomic distances and animation frames.
The equation of state and phase diagram of fluids at giant planet core conditionsWe have performed FPMD on iron fluids, Fe-H fluids, and
From Electrons to Planets, with Energy Between
Research InstitutionDepartment of Earth and Environmental Sciences, Ludwig Maximilians Universität MünchenPrincipal InvestigatorR. E. CohenResearchersAlexandra Seclaman, Honghui Wu, Junqing Xu, Bogdan Yavorksyy, Haiwu ZhangProject Partners—
SuperMUC Project ID: pr92ma
Figure 1: (1) We find spontaneous formation of molecules such as for-mate under transition zone conditions. (2) Snapshot of the simulation box showing water and CO2 molecules. (3) Hydrogen-Oxygen corre-sponding to the middle of the Earth’s upper mantle at two tempera-tures. 4) Self diffusion profile of H2O molecules in pure water spanning a pressure range covering Earth’s crust through the Upper Lower Mantle (dotted line).
Figure 2. Speciation changes in pure water and a CO2 –poor mixture. As the pressure increases H2O molecules are dissociated more at lower pressures in the mixture. In a water-rich mixture and at 20 GPa, CO2 is no longer the stable molecular specie of C.

182
Earth, Climate and Environmental Sciences
4
pure iron metal (Fig. 3). These results are now being used to model Jupiter and other giant planets.
Iron at Earth core conditionsWe have computed the thermal conductivity of pure solid iron throughout Earth’s conditions using Density Func-tional Theory (DFT) and Dynamical Mean Field Theory (DMFT). Our predicted thermal conductivity at Core-Mantle boundary conditions (T≈4000 K and P≈136 GPa) is about 93 W/m/K, 30% lower than previous theoretical results, [1] which neglected the contribution due to electron-electron scattering. Considering that melting and the existence of light elements at Earth’s core will further decrease thermal conductivity, the heat conduction down the core adiabat will be about 9-12 TW. Comparing this with the estimated total heat from the core, 8-16 TW, suggests that the geody-namo might be sustained mainly by thermal convection.
Tuning electrocaloricsThe electrocaloric effect is the change in temperature with applied electric field in pyroelectrics, or the change in electric field with temperature. It can be used for solid
state refrigeration or energy scavenging, and will play an important role in our energy future. However, how to op-timize it is not well known. We have performed extensive molecular dynamics simulations using the shell model fit to first-principles calculations for PMN-PT [3] and Ba-TiO3 [4] as functions of temperature, composition, and applied electric field, magnitude and direction.
Ferroelectric perovskite oxides possess a large electro-ca-loric (EC) effect, but usually at high temperatures near the ferroelectric/ paraelectric phase transition temper-ature, which limits their potential application as next generation solid-state cooling devices. In PMN-PT (Pb-Mg1/3Nb2/3O3-PbTiO3). We find that the maximum EC strength of PMN-PT occurs within the morphotropic phase boundary (MPB) region at 300 K (Fig. 5). The large adiabatic temperature change is caused by easy rotation of polarization within the MPB region.
On-going Research / Outlook
First-principles molecular dynamics for fluids is enormously computationally intensive. The computations have taken over 60 million CPU hours, and there is more to do. The problem is that to get chemical accuracy for fluid properties and constitution requires on the order of 10 picoseconds of simulation time for each volume, composition, and temper-ature point, which is 20,000 self-consistent calculations for systems of 108-192 atoms for Fe-H and H2O-CO2, respective-ly. On the superMUC we can run efficiently on hundreds of processors, even a whole island, to make this work possible. We are now working on getting our final well-converged results, which we can then apply to planetary interiors. The work on transport properties is also moving from perfect crystals to complex fluids such as Earth’s outer core, Jupiter, and exoplanets.
References and Links
[1] http://www.tomcat.mineralogie.geowissenschaften.uni-muenchen.de/
[2] M. Pozzo et al., Nature 485, 355 (2012).[3] H. H. Wu and R. E. Cohen, Phys. Rev. B 054116 (2017).[4] H. H. Wu and R. E. Cohen, J. Phys. Condens. Matter. 29, 485704 (2017).
Figure 3: Density versus pressure for 3 compositions in the Fe-H liquid sys-tem. Different types of symbols mark different temperatures, while colors mark compositions. Earth’s inner core density is shown for reference. The existence of a Jovian core is still a debated subject.
Figure 5. Adiabatic temperature change in PMN0.4PT0.6 in applied elec-tric field. This electrocaloric effect can be used for solid state refrigeration and energy scav-enging from excess heat.
Figure 4. Computed thermal conductivity for iron at 100-140 GPa, for comparison with experiments.

183
Global climate simulations at extreme high-resolution
Introduction
Climate prediction is currently one of the most compu-tationally challenging problems in science and yet also one of the most urgent problems for the future of soci-ety. It is well known that a typical climate model (with a resolution of ~120-km in the atmosphere and ~100-km in the ocean) is unable to represent many important climate features, such as the Euro-Atlantic variability. Recent studies have been shown that climate models at much higher resolutions (up to ~16km) simulate these patterns more realistically. Whilst few would doubt the desirability of being able to integrate climate models at such a high resolution, there are numerous other areas of climate model development which compete for the given computing resources: for example, the need to in-corporate additional Earth System complexity. Instead of explicitly resolving small scale processes by increas-ing the resolution of climate models, a computationally cheaper alternative is to use stochastic parameterization schemes. The main motivation for including stochastic approaches in climate models is related to the observed upscale propagation of errors, whereby errors at very small scales (only resolved in high horizontal resolution models) can grow and ultimately contaminate the accu-racy of larger scales in a finite time.
The Climate SPHINX (Stochastic Physics HIgh resolutioN eXperiments) [1] project has proceeded along these lines, investigating the sensitivity of climate simulations to both model horizontal resolution and stochastic parameteriza-tions and exploring extremely high resolutions. The exper-iments included both historical and future scenarios in
order to unveil whether resolution or stochastic schemes impacts the way model represent climate change.
Results and Methods
In Climate SPHINX, the EC-Earth Earth System Model has been used to explore the impact of stochastic phys-ics in a large ensemble of 30-year climate integrations at five different atmospheric horizontal resolutions. The project included more than 120 simulations in both a historical scenario (1979–2008) and a climate change projection (2039–2068), together with coupled tran-sient runs (1850–2100). 20 ensemble members were run at T159 (~125 km), 20 at T255 (~80 km), 12 at T511 (~40 km), 6 at T799 (~25 km) and 2 at T1279 (~16 km) for both present-day and climate change projection. For each res-olution, half of the ensemble members included a pa-rameterization of subgrid unresolved scales, using two stochastic physics schemes (namely the SPPT and SKEB schemes).
A total of 20.4 million core hours have been used on Su-perMUC over a single year, through a grant made avail-able by PRACE (the Partnership for Advanced Comput-ing in Europe). Close to 1.5PB of raw output data have been produced. The four T1279 simulations alone sum up to about 5.5 million core hours and about 200TB of raw data output. Summing together the restarts files and the output of all experiments the total amount of space occupied at the peak of the project (February 2016)
Truncation T159 T255 T511 T799 T1279# Cores 224 588 840 1120 1540Walltime 52’ 1h12’ 6h10’ 14h 30hMembers 20 20 12 6 2Output /year 26GB 64GB 249GB 0.6TB 1.6TB
Table 1: Resolution-dependent technical details for EC-Earth in the Climate SPHINX experiments. Wall time has been measured on the Supermuc-II Haswell platform for one year of model time, and it is evaluated for deterministic simulations; the wall time for stochastic simulations is about 5% higher.
Global climate simulations at extreme high-resolution
Research InstitutionIstituto di Scienze dell’Atmosfera e del Clima (CNR-ISAC)Principal InvestigatorJ. von HardenbergResearchersP. Davini, S. Corti, T. Palmer, H. Christensen, A. Weisheimer, A. Subramanian, S. Juricke, P. A. G. Watson Project PartnersOxford University
SuperMUC Project ID: pr94bi (PRACE project)
Figure 1: Orography resolution over Europe at the lowest resolution (T159, about 125km) and at the highest one (T1279, about 16km).

184
Earth, Climate and Environmental Sciences
4
reached about 1 PB. In order to reduce the size of the output and to increase the data accessibility to a larg-er audience, automatic post-processing routines have been implemented, in order to archive in real-time only the necessary outputs for successive scientific analysis. About 140TB of post-processed outputs are freely acces-sible to the climate community since March 2016, made available through an EUDAT pilot project (DATA SPHINX) at CINECA, Italy [1]. The raw project output data are avail-able through a data-only archive at LRZ.
Analysis so far of the large amount of data produced by the project have allowed significant scientific results, and have involved the different research groups. To this day, three top peer-reviewed publications have been produced [2,3,4] and other two are currently under review. Thanks to the free accessibility of the SPHINX data, several external groups (e.g. University of Reading, University of Newcas-tle, etc.) have downloaded the dataset in order to investi-gate different aspects of present and future climate.
Main scientific results showed that both resolution and stochastic perturbations lead to improvement on the representation of the climate variability rather than of the mean climate. However – not surprisingly – different phenomena show different sensitivities.
For instance, tropical rainfall variability and the inten-sity and frequency of tropical cyclones seem to benefit both from increased horizontal resolution and from sto-chastic parameterization, whereas improvements in the Madden–Julian Oscillation occur only when stochastic perturbations are added.
In general – in the tropics – applying stochastic schemes at low resolution leads to interesting improvements; this is also observed in coupled simulations when look-ing at the impact of stochastic perturbations on the El Niño Southern Oscillation. On the other hand, increasing resolution beyond T511 does not seem to further improve the tropical variability (with the possible exception of the intensity of tropical cyclones).
Conversely, in the mid-latitudes, analyzing atmospheric blocking frequencies, no statistical difference was found between stochastic and deterministic runs. Here reso-lution plays a key role, especially over the Euro-Atlantic sector – where the T799 resolution (~25 km) reduces it to negligible values.
To summarize, the best improvements are observed up-grading from T255 to T511, whereas minor improvements are observed using higher resolutions. However, while this resolution increase reduces the bias for most of the phe-nomena considered, stochastic schemes seem ineffective for some aspects (e.g. atmospheric blocking) but effec-tive as much as resolution – and even more – for others (e.g. tropical precipitation variability). However, we must remark that these results can be associated with the ab-sence of specific tuning for both deterministic higher-res-olution and stochastic configurations, which can affect the mean climate and consequently partially deteriorate climate variability. Indeed, such tuning does not involve only the surface and top-of-the-atmosphere radiative fluxes but also some of the physical parameterizations of the climate model. Some schemes, e.g. deep and shal-low convection parameterizations, may be satisfactory at coarse resolutions but may perform poorly at finer ones.
On-going Research / Outlook
The SuperMUC Phase II platform based on Haswell pro-cessors granted a reduction of about 5% of the total core hours used, without affecting the wall time. About 75% of the simulations have been run using the Haswell nodes.
Climate SPHINX explored only the impact of the SPPT and SKEB atmospheric stochastic schemes, together with changes in resolution of the atmospheric model, mainly in atmosphere-only simulations. Given the en-couraging results, particularly regarding the benefits in increasing resolution and in the use of stochastic physics, we plan to explore further these issues in two directions. First it will be useful to explore the impact of stochastic schemes also in high-resolution coupled simulations, in which both the atmospheric and the oceanic resolution are increased. Second, we will explore the use of stochas-tic schemes to represent uncertainty also in other com-ponents of the Earth System. In particular it will be use-ful to test two new schemes which are currently being developed at the University of Oxford for representing uncertainties in oceanic and land-surface processes.
References and Links
[1] http://www.to.isac.cnr.it/sphinx/[2] P. Davini, J. von Hardenberg, S. Corti, H. M. Christensen, S. Juricke, A.
Subramanian, P. A. G. Watson, A. Weisheimer, and T. N. Palmer. 2017. Geosci. Model Dev., 10(3), 1383–1402. https://doi.org/10.5194/gmd-10-1383-2017
[3] P. A. G. Watson, J. Berner, S. Corti, P. Davini, J. von Hardenberg, C. Sanchez, A. Weisheimer, and T. N. Palmer. 2017. J. Geophys. Res. Atmos., 122 (11), 5738-5762. https://doi.org/10.1002/2016JD026386
[4] P. Davini, S. Corti, F. D’Andrea, G. Rivière, G., J. von Hardenberg. 2017. J. Adv. Model. Earth Syst. 9 (7), 2615–2634. https://doi.org/10.1002/2017MS001082
Figure 2: Atmospheric blocking bias for the present-day climate SPHINX simulations. The model bias is reduced considerably with increasing resolution (see the blue section over central Europe disappearing at T799).

185
ClimEx project: investigating climate variability to study extreme events in a warming world
Introduction
The ClimEx project [1] is the result of more than a decade of collaboration between Bavaria and Québec. It main-ly focuses on hydrological extremes and their links with natural climate variability and anthropogenic climate change. In order to better understand how climate var-iability and meteorological extremes translate into local flooding events, a complex modelling chain has been designed to connect global climate conditions with local hydrological impacts. The ClimEx project aims to gener-ate 50 realizations of this hydro-climatic chain, driven by greenhouse gas and aerosol emissions from both natural and anthropogenic sources, resulting in 50 equiprobable climate realizations from 1950 to 2100 over Europe and northeastern North America.
Experimental set-up
The ClimEx modelling framework involves three model-ling steps in order to connect global climate conditions with local hydrological characteristics. The first step (de-scribed in [2]) was performed by the Canadian Centre for Climate Modelling and Analysis of Environment and Climate Change Canada (ECCC), who has made available 50 climate realizations covering the entire Earth’s surface from 1950 to 2100 using the CanESM2 Global Climate Model (GCM). These simulations use the observed green-house gases and aerosol emissions from 1950 to 2005, while following the representative concentration path-way RCP8.5 thereafter up to 2100. The 50 realizations only differ by slight random perturbations in the initial conditions of the model. Given the non-linear nature of the climate system, this procedure allows for estimating internal variability in climate models, and thus permits to generate an appreciable amount of extreme events,
which are normally rare by definition. Because of their high complexity, global climate models are computation-ally expensive to run for such a long time period and a large ensemble size, a coarse-grid spatial resolution was used, with 310 km between grid points. This dataset was made available to the ClimEx project, which used it as an input to a downscaling chain toward much finer spa-tial scales that are more appropriate for addressing local climate-change impacts.
Unlike GCMs, Regional Climate Models (RCMs) allow to concentrate computational resources over a limited area of the globe, thus reaching much higher spatial resolutions. As the second modelling step of ClimEx, the Canadian Regional Climate Model version 5 (CRCM5; de-veloped by Université du Québec à Montréal (UQAM) in collaboration with ECCC [3]) was used to dynamical-ly downscale the 50 realizations from CanESM2 onto a high-resolution grid with 12-km grid point distance. This step was performed separately over both the Europe and northeastern North America domains. This was the first computational step performed in the scope of ClimEx, which was conducted during years 2016 and 2017 on the SuperMUC supercomputer at the Leibniz Supercom-puting Centre (LRZ), requiring a total of 88 million core-hours of resources.
As the third -ongoing- modelling layer, hydrological models will use the high-resolution meteorological variables from the CRCM5 and run simulations over 98 hydrological basins in Bavaria with resolutions of 500m and 3 hours. ClimEx embodies a novel global calibration strategy for the hydrological model WaSiM [4], using the Dynamically Dimensioned Search in conjunction with Seasonal Annealing [5]. Results of this computationally demanding calibration procedure, performed in large
ClimEx project: investigating climate variability to study extreme events in a warming world
Research InstitutionLudwig-Maximilians-Universitaet Muenchen (LMU)Principal InvestigatorRalf Ludwig1
ResearchersMartin Leduc2, Anne Frigon2, Marco Braun2, Francois Brissette3, Jean-Luc Martel3, Simon Ricard4, Richard Turcotte4, Franz-Josef Schmid1, Fabian v. Trentini1, Florian Willkofer1, Raul Wood1, Alain Mailhot5, Gilbert Brietzke6, Dieter Kranzlmüller6, Jens Weismüller6 Project Partners1Department of Geography, Ludwig-Maximilians-Universitaet Muenchen, Germany 2Consortium Ouranos, Montreal (PQ), Canada 3École de Technologie Supérieure (ETS), Montreal (PQ), Canada 4Centre d’Expertise hydrique du Québec (CEHQ), Québec (PQ), Canada 5Institut National de recherche scientifique – Eau Terre Environment (INRS-ETE), Québec 6Leibniz Rechenzentrum (LRZ), Munich, Germany
SuperMUC Project ID: pr94lu (Gauss Large Scale project)

186
Earth, Climate and Environmental Sciences
4
parts on LRZ’s CoolMUC-2, are assessed through a variety of objective functions. Upon sufficient multi-criteria val-idation, the models will be used to determine processes and patterns that trigger regional scale extreme events under changing climate conditions. Findings from this valuation will be employed to develop a new flood risk assessment and management tool, introducing the con-cept of “virtual perfect prediction”.
Results
While the computations in the hydrological domain are still in progress, first analyses of the climate model en-semble reveal strong future climate changes, e.g. increas-es in extreme precipitation, winter precipitation and summer drought over the European domain. Further, the variability in winter temperature shows a clear negative and summer precipitation a clear positive trend.
On-going Research / Outlook
ClimEx depends on the new capacities emerging from HPC for large scale hydro-climatic impact studies. Access to SuperMUC (CLIMATE) and CoolMUC-2 (HYDRO) enables
us to apply novel process and pattern analysis, previously unthinkable in this research domain. Consequently, the single model large scale ensemble is unprecedented to this point. We currently run an attribution study to bet-ter determine and distinguish the dynamics of extreme events under the assumption of no anthropogenic radia-tive forcing. The potential of Super-MUC-NG will be very interesting to advance research towards very high resolu-tion, convection permitting climate modeling.
References and Links
[1] http://www.climex-project.org[2] Fyfe, J. C. et al., 2017: Large near-term projected snowpack loss over
the western United States. Nature Communications, 8, 14996, doi:10.1038/ncomms14996.
[3] Separovic, L., et al., 2013: Present climate and climate change over North America as simulated by the fifth-generation Canadian Re-gional Climate Model. Clim Dyn, 41, 3167–3201, doi:10.1007/s00382-013-1737-5.
[4] Schulla, J., 2017: Model Description WaSiM. Technical Report. pp. 347.[5] Lespinas, F. et al., 2017: Performance of the dynamically dimen-
sioned search algorithm: influence of parameter initialization strategy when calibrating a physically based model. Hyd Res, 49/1, doi:10.2166/nh.2017.139
[6] Leduc et al., 2018. ClimEx project: a 50-member ensemble of climate change projections at 12-km resolution over Europe and northeastern North America with the Canadian Regional Climate Model (CRCM5). Submitted to Journal of Applied Meteorology and Climatology.
Figure 1: (a) to (c) The CRCM5 50-member ensemble mean climate-change signal for precipitation during June over the European domain computed for the 2020-2039, 2040-2059 and 2080-2099 periods relative to 2000-2019. (d) to (f) Same as (a) to (c) but using the first five members of the ensem-ble. Hatching indicates regions where the signal is not statistically significant at the 99\% confidence level (Student’s t-test with unequal variances). Figure adapted from [6].

187
Exascale computing in numerical weather prediction
Introduction
The weather- and climate-modelling community is cur-rently seeing a shift in paradigm from limited area mod-els towards novel approaches involving global, complex and irregular meshes. A promising and prominent exam-ple therefore is the Model for Prediction Across Scales, MPAS [1,2]. MPAS is a novel set of Earth system simula-tion components and consists of an atmospheric core, an ocean core, a land-ice core and a sea-ice core. Its distinct features are the use of unstructured Voronoi meshes and C-grid discretization to address shortcomings of global models on regular grids and of limited area models nest-ed in a forcing data set, with respect to parallel scalabil-ity, numerical accuracy and physical consistency [3].
The unstructured Voronoi meshes allow the generation of variable-resolution meshes with smooth transitions be-tween areas of different refinement for greater numerical accuracy and smaller flow distortions than in traditional nesting approaches. At the same time, the computational costs are significantly lower when using a high resolution for the area of interest and a lower resolution elsewhere than for a global mesh at very high resolution.
Nonetheless, with exascale computing projected for the end of this decade and the fact that energy requirements and physical limitations will imply the use of accelera-tors and the scaling out to orders of magnitudes larger numbers of cores then today, it is paramount to prepare modern codes like MPAS for this future. To identify po-tential problems and optimize complex codes such as at-mospheric models for future applications, it is necessary to conduct experiments at extreme scale on the largest computational systems available today. The current “re-cord” for atmospheric models is held by Miyamoto et al. (2013) [4], who employed the Japanese NICAM model at a horizontal resolution of 870m on RIKEN’s K-Computer. In a series of extreme-scaling workshops at LRZ and at Re-search Center Jülich (FZJ), we pushed the limit of running the atmospheric component of MPAS, MPAS-A, down to
a horizontal resolution of 2km globally [5]. A key com-ponent for this success was the implementation of an alternative I/O layer designed for massively parallel ap-plications. Much of the development work in this respect was conducted as part of our project pr94mi at LRZ.
Results and Methods
The Model for Prediction Across Scales has traditionally employed the Parallel I/O Library, PIO, developed at NCAR (https://github.com/NCAR/ParallelIO) to perform parallel I/O operations using all or a subset of MPI tasks in netCDF. While netCDF has a number of convenient features such as platform-independence and tools to read and visualize data, the performance for parallel read and write opera-tions with large numbers of MPI tasks is usually well below the theoretical limits of modern parallel file systems. Ex-treme scaling applications employing thousands of nodes on modern supercomputers spend a large amount of their time waiting for the I/O operations to complete, which slows down the model run (i.e., the time to solution) and wastes significant resources and energy. To address this problem, we implemented an alternative I/O layer based on the SIONlib library developed at FZJ for massively par-allel I/O operations (http://www.fz-juelich.de/ias/jsc/EN/Expertise/Support/Software/SIONlib/_node.html). SIONlib provides convenient C and Fortran APIs to read and write task-local data in single or multiple files in a binary format.
Our implementation of SIONlib in parallel to the existing PIO layer is designed to mimic the handling of netCDF data while retaining the superior performance of SIONlib read and write operations. This approach allows using SIONlib and PIO for different output streams in the same model run. For instance, users can choose SIONlib for large, inter-nal data sets such as restart files, and netCDF for smaller, diagnostic output files. SIONlib can also be used for inter-mediate data such as initial conditions (see below).
For SIONlib data, each MPI task participates in the I/O and reads (writes) its task-local data from (to) the file system.
Exascale computing in numerical weather prediction: massively
parallel I/O in atmospheric models on conformal meshesResearch InstitutionUniversity of Colorado Boulder, Cooperative Institute for Research in Environmental Sciences, NOAA/OAR/ESRL/Global Systems Division, Boulder, CO, USA (previously: Karlsruhe Institute of Technology, Institute of Meteorology and Climate Research, Garmisch-P., Germany) Principal InvestigatorDom HeinzellerResearchersMichael G. Duda, Harald KunstmannProject PartnersNational Center for Atmospheric Research, Mesoscale & Microscale Meteorology Laboratory; Karlsruhe Institute of Technology, Institute of Meteorology and Climate Research
SuperMUC Project ID: pr94mi (KONWIHR Project)

Earth, Climate and Environmental Sciences
4
To avoid locking issues, the block size in SIONlib is set to a multiple of the file system block size. Writing netCDF files consists of two steps: a data definition phase, and a data write phase. In the former, variables and their attributes and dimensions are defined. After calling an “end define” function, data can be written to disk in the second phase. Our SIONlib implementation follows a similar approach: in the data definition phase, variable metadata is encod-ed in a buffer that gets flushed to disk at the end of the definition phase. Similarly, for reading SIONlib data, the metadata block must be read before any variable data.
A limitation of our SIONlib implementation is that the same number of tasks and the same parallelization (hori-zontal domain decomposition in the case of unstructured Voronoi meshes in MPAS) must be used for writing and reading data. Conversely, with PIO, it is possible to use dif-ferent numbers of MPI tasks as the data are re-arranged during writing and reading (this flexibility offered by PIO is one of the reasons for its inferior I/O performance).
Being restricted to the same number of MPI tasks may be a limitation when experimenting with the model setup, but has little implications in real applications, where a fixed setup is used in operational real-time forecasting or long-term climate simulations. It also opens up possibili-ties to further improve the parallel performance of MPAS, in particular with respect to the model initialization (set-up). In this so-called bootstrapping phase, MPI tasks de-termine their neighbors on the Voronoi mesh and set up the “halo” communication. With netCDF, a mesh decom-position file (produced by the graph partitioning software METIS, http://glaros.dtc.umn.edu/gkhome/metis/metis/overview) is read and halo exchange properties are cal-culated during the model initialization. With SIONlib, it is possible to encode this information in the task-local data when creating initial conditions or restart files. As such, most of the bootstrapping process can be skipped when initializing the model with a SIONlib file. Additionally, we implemented a small feature that speeds up the model initialization even when bootstrapping from netCDF files. Specifically, the METIS graph partition file is converted into a small SIONlib file, which is read by all tasks at mod-el startup instead of the METIS output being read by one task and scattered using MPI.
The improvements made to the latest MPAS release v5.2 have noticeable effect on the performance, in particular at extreme scale. Table 1 shows the differences in runtime for a 1-hour integration on a regular 2-km mesh with 147 mil-lion horizontal grid columns on 2048 nodes with 16 MPI tasks each. The size of the initial conditions read at mod-el startup is 4TB. During the 1-hour integration, approxi-
mately 9TB of data are written to disk. The timing is split into fixed costs that occur only once at model startup and into costs that scale with the length of the integration. The timings in Table 1 are obtained from single model runs and are subject to a certain variability. This can be seen from the timing results for the dynamical solver, which should be identical across the three runs as the changes to the I/O layer do not impact this part of the code.
The above results were obtained with an MPI-only version of the code. To improve the parallel performance of the time integration in MPAS, we implemented and optimized a hybrid parallelization making use of OpenMP inside the dynamical solver. With target platforms such as the In-tel many-core chips in mind, for which large number of threads can be beneficial, we implemented the threading inside the dynamical solver as follows: at the beginning of the time-integration loop, threads are created and kept alive until the end of the loop. In between, OpenMP master/single constructs are used when necessary. This approach avoids the frequent creation and destruction of threads, as it is often the case when OpenMP parallel-do constructs are used around individual threaded loops. Table 2 shows that making use of hyperthreading on the LRZ SuperMUC nodes by using two OpenMP threads per MPI tasks leads to a speed up of approximately 15% for the solver.
Timing [s] SIONlib, MPI SIONlib, hybridTime integration 2045 1734 Solver 1941 1626 File write 101 108
Table 2. Timing results for the setup described in Table 1 for a MPI-only version of the code (2048 nodes, 16 MPI tasks per node) and a hybrid version of the code (using hyperthreading on the SuperMUC phase 1 thin nodes).
On-going Research / Outlook
The improvements to the MPAS code made as part of this project allow us to take on the next obvious challenge and push the horizontal resolution down to 1km globally. Quadrupling the number of horizontal grid columns cre-ates challenges not only in terms of the size of the data on disk, but also in terms of the memory required. For a model run invoking state-of-the art physics at this resolution and in double precision, we estimate a minimum of 400TB us-able memory. Since neither of the two SuperMUC phases provides that much memory and since FZJ JUQUEEN will be retired in May 2018, we resorted to the third system within the GCS, HLRS Hazel Hen, for this experiment.
References and Links
Timing [s] pnetCDF pnetCDF* SIONlibInitialize 1176 888 131 Bootstrapping 480 194 65 File read 684 694 52Time integration 2675 2772 2045 Solver 1902 1967 1941 File write 773 805 101
Table 1. Timing results for a 1-hour model run (see text). The input file containing the initial conditions is in pnetCDF CDF-5 large file format (col-umns pnetCDF), the graph decomposition in ASCII (METIS output) or in SIONlib format (column pnetCDF*). For the rightmost column, (“SIONlib”), the initial conditions are in SIONlib format and no graph decomposition is needed.
[1] https://mpas-dev.github.io [2] Skamarock, W.C., Klemp, J.B., Duda, M.G., Fowler, L., Park, S.-H., Ringler, T.D.: A
Multi-scale Nonhydrostatic Atmospheric Model Using Centroidal Voronoi Tesselations and C-Grid Staggering. MWR, 240, 3090-3105, 2012, doi:10.1175/MWR-D-11-00215.1
[3] Heinzeller, D., Duda, M.G., Kunstmann, H.: Towards convection-resolving, global atmospheric simulations with the Model for Prediction Across Scales (MPAS) v3.1: an extreme scaling experiment. Geosci. Model Dev., 9, 77-110, 2016, doi:10.5194/gmd-9-77-2016
[4] Miyamoto, Y., Kajikawa, Y., Yoshida, R., Yamaura, T., Yashiro, H., Tomita, H.: Deep moist atmospheric convection in a subkilometer global simulation, Geophys. Res. Lett., 40, 4922-4926, 2013
[5] Heinzeller D., Duda M.G.: Preparing for exascale: A global 2 km atmospheric scaling experiment with the Model for Prediction Across Scales (MPAS), in: Technical Report JUQUEEN Extreme Scaling Workshop 2017 (Eds. D. Brömmel, W. Frings, B.J.N. Wylie), held January 23-25 2017 in Jülich, Germany, http://hdl.handle.net/2128/13977

189
Atmospheric Chemistry and Climate
Introduction
The objective of this project is to improve our under-standing of the Earth’s atmospheric composition and climate by means of numerical modelling. The Earth system is driven by several dynamical, chemical and physical processes, which determine its composition and evolution and affect the global climate. The numer-ical representation of such processes is a difficult task. It requires considerable computational resources, in order to realistically simulate the different components of the system and their interactions. Substantial storage capa-bilities are also essential to store and analyze the tera-byte-sized output produced by these experiments. In ad-dition to scientific interest, the growing societal concern for topics like the global climate change, the south-hem-ispheric ozone hole and the deterioration of air quality in metropolitan areas is further motivating the need for a deep understanding of these processes.
The focus of this project is twofold: (1) We aim at a better representation of the Earth atmosphere in a numerical model. (2) We apply such a model to quantify the impacts of human activities on the atmospheric composition and climate. We use a highly flexible numerical system, the ECHAM/MESSy Atmospheric Chemistry (EMAC) model [1], which allows using the same code for tackling dif-ferent scientific problems. The model can be easily con- figured to set the horizontal and vertical resolutions, the level of interaction between dynamics, chemistry, physics and radiation, the complexity of the chemical reactions, as well as the parameters that describe the physical pro-cesses within the system. The use and application of the same code also facilitates code development and docu-mentation as well as synergies among the users.
Results and Methods
The results summarized in this section refer to the year 2017. The values for the consumed resources (CPU-time and storage) are updated to 13 November 2017. Slightly higher values are to be expected for the end of 2017 due to still ongoing experiments.
Age of air and water vapour budget in the stratosphereTwo hind-cast simulations in free-running mode with the global chemistry-climate model EMAC over the pe-riod 1950-2013 were started to test our recently imple-mented diabatic vertical velocity scheme within the La-grangian tracer transport scheme ATTILA (Atmospheric Tracer Transport in a Lagrangian model, [2]) against the standard kinematic vertical velocity scheme of EMAC. The diabatic vertical velocity is more appropriate to rep-resent the mass transport in the stratosphere than the kinematic velocity [3]. The simulations are still ongoing, but first results could already be analysed. We focused on the age-of-air calculated from the sulfur hexafluo-ride (SF6) age-of-air tracer, a linear increasing SF6-tracer emitted at the surface that provides information on the zonal mean transport characteristics within the atmos-phere. The simulation with the new diabatic vertical ve-locity provides more realistic results as it is characterized by an older stratospheric air than the one with the kine-matic vertical velocity (Figure 1). The final results will be available once the simulations are complete. The delay was due to the problems with the SCRATCH disk during summer and the limited free storage space on WORK for our project during 2017.
Total CPU time: 753 kCPU-h.Number of CPUs per job: 112Overall storage in WORK: 88 TBOverall storage in SCRATCH: 20 TB
Contributions of road traffic to tropospheric ozone on re-gional and global scaleWe applied the MECO(n) model system [4] to investigate the contribution of the road traffic emissions to the at-mospheric composition in Europe. MECO(n) allows an online nesting of the regional model COSMO into the global model EMAC. In the applied configuration EMAC was used together with two COSMO refinements at 0.44° (Europe) and 0.1° (Germany) resolution. To assess the influence of the annual variability on the contribu-tion of road traffic emissions on tropospheric ozone, we extended the simulations performed in 2016 within the framework of a PhD project [5]. We performed two
Atmospheric Chemistry and ClimateResearch InstitutionDLR – Institut für Physik der Atmosphäre, Oberpfaffenhofen, GermanyPrincipal InvestigatorRobert SausenResearchersS. Brinkop, B. Brötz, D. S. Cai, S. Dietmüller, R. Eichinger*, V. Eyring, F. Frank, C. Frömming, H. Garny*, K.-D. Gottschaldt, P. Graf, V. Grewe, J. Hendricks, P. Jöckel, J. C. Kaiser, B. Kern, S. Matthes, M. Mertens, A. Pfeiffer, M. Ponater, V. Rieger, and M. RighiProject Partners* Also at Ludwig-Maximilians-Universität München, Meteorologisches Institut München, Germany
SuperMUC Project ID: pr94ri

Earth, Climate and Environmental Sciences
190
4
experiments for the 2008-2010 period, using two differ-ent anthropogenic emission scenarios. The results show a 10-15% contribution of the road traffic emissions to ozone concentration in Europe and a contribution of up to 60% to NOy (all reactive nitrogen compounds). See [6] for more details.
The analysis of the purely dynamical simulations per-formed last year indicated room for improvements of the MECO(n) model system. Therefore we performed an additional purely dynamical simulation covering a peri-od of 20 years, with different settings for the nudging of meteorological variables in EMAC. The results show a clear improvement of the model biases compared to observational data. This is an important step forward in the MECO(n) performance, which will be useful in future studies.
Despite the successful outcome of these studies, several technical problems occurring at SuperMUC in 2017 led us to consume more computational resources as original-ly planned. Due to the issue with the SCRATCH disk over the summer, a large amount of output has been lost and the corresponding experiments had to be repeated: LRZ kindly provided us with 1000 extra CPU-h to compensate for this loss. Other issues with the model performance arose during the year due to the Intel MPI environment. Switching to another environment (e.g., IBM) in the course of this study was unfortunately not possible, since the adopted model setup requires bitwise reproducibility of the output in order to deliver reliable results, meaning that exactly the same executable needs to be used for all model experiments in this study. Another limitation was due to the large storage required on WORK for analyz-ing the output. Despite the considerable efforts by LRZ to provide us with a significantly large quota on WORK (200 TB), this was still a limiting factor especially when several simulations were performed and stored simultaneously by several users within our project.
Total CPU time: 1836 kCPU-h.Number of CPUs per job: 616 (refinement for Europe and Germany) and 280 (refinement for Europe).Overall storage in $WORK: 73 TB.Overall storage in SCRATCH: 20 TB.
Impacts of the transport sectors emissions on atmospheric aerosol and climateA recently-developed model configuration, accounting for aerosol-cloud interactions at all stratiform cloud lev-els (low, mid-level and high clouds), has been applied to improve our quantifications of the impact of traffic on aerosol and climate. The new configuration includes an advanced version of the aerosol submodel (MADE3, [7]), coupled with a recent two-moment cloud microphys-ical scheme [8] providing a detailed representation of liquid, mixed-phase and ice clouds. Two sets of 10 ex-periments over a 15-year period have been conducted to quantify the effect of land transport, shipping and avi-ation emissions on climate and to isolate their impact on ice clouds. Each set of experiments considers differ-ent assumptions on new particle formation in the trop-
osphere, which are thought to have a significant impact on the aerosol-cloud interaction processes. First results show that the new quantification of the traffic impacts on climate are a few factors higher than in the previous model version, mostly due to a different (and improved) representation of the background concentrations. The simulation output is currently being analysed, also with the help of advanced statistical methods, to disentangle the role of ice clouds in the climate impacts of the trans-port sectors.
Furthermore, in the context of the DLR Project VEU2 [9], two simulations with different vertical resolutions and including wind-driven mineral dust emissions, have been performed. Emission inventories for anthropogen-ic sources developed within the project have been used as an input to the model. The output will be delivered to the project project partners (HZG and KIT) to be used as boundary conditions for regional model experiments based on CMAQ and COSMO-ART, aiming at characteriz-ing the impacts of traffic on air quality at regional scales.
Total CPU time: 836 kCPUhNumber of CPUs per job: 224Overall storage in WORK: 21 TB
Figure 1. Age-of-air simulated with the EMAC/ATTILA model with diabatic vertical velocity in the time period 1960-1979 for the Lagrangian parcels (top panel) and the age of air difference between the EMAC/ATTILA simulation over the same time period: diabatic-velocity (diab) and kine-matic-velocity (kin, bottom panel). Units in both panels are years.

191
Atmospheric Chemistry and Climate
Overall storage in SCRATCH: 3 TB.On-going Research / Outlook
In the project time frame 2016-2017, we almost fully consumed the total granted CPU time (11069 kCPU-h). Of this budget, 3425 CPU-h (31%) was consumed in 2017 (until 13 November). The remaining budget of 605 CPU-h (5%) will be likely consumed by the end of 2017, as some of the experiments discussed above are still ongoing.Within the pr94ri project, several other activities and studies were originally planned, focusing on variation of atmospheric methane, calculation of climate cost func-tion of air traffic, efficacy of transport-related radiative forcing, modelling support of aircraft measurements, and systematic model evaluation. The development of the model code and configurations for such studies is still ongoing and is currently being tested.
In addition to these model-specific issues, several oth-er technical issues prevented us to perform all planned studies. These issues can be summarized as follows:• The unreliability of the SCRATCH disk over the summer
led to some data loss and to delays in the execution of several experiments;
• The regular compiler updates on SuperMUC with sub-sequent removal of the previous versions made it in some cases impossible to use the same executable for different experiments. Nevertheless binary-identical reproducibility of the output is an absolutely essential requirement for our studies, since most of them deal with the effects of small perturbations on the climate system;
• The huge output produced by our experiments (and by climate models in general) often exceeded the availa-ble quota on WORK. We greatly appreciate the effort by LRZ to provide us with a quota which is far larger as the one granted to most of the other projects, still we have to recognize that this represents a limiting factor for our studies.
On a last note, we would like to acknowledge the use of the meet.lrz.de videoconference system, which we suc-cessfully and profitably used for many meetings in the course of the project.
References and Links
[1] www.messy-interface.org[2] Reithmeier, C., Sausen, R., and Grewe, V., Investigating lower
stratospheric model transport: Lagrangian calculations of mean age and age spectra in the GCM ECHAM4, Clim. Dyn. 30, 225-239, doi:10.1007/s00382-007-0294-1, 2008.
[3] Eluszkiewicz, J., Hemler, R. S., Mahlman, J. D., Bruhwiler, L., and Takacs, L. L., Sensitivity of Age-of-Air Calculations to the Choice of Advection Scheme, J. Atmos. Sci., 57, 3185-3201, doi:10.1175/1520-0469(2000)057<3185:SOAOAC>2.0.CO;2.
[4] Mertens, M., Kerkweg, A., Jöckel, P., Tost, H., and Hofmann, C., The 1-way on-line coupled model system MECO(n) – Part 4: Chemical evaluation (based on MESSy v2.52), Geosci. Model Dev. 9, 3545-3567, doi:10.5194/gmd-9-3545-2016, 2016.
[5] Mertens, M. B., Contribution of road traffic emissions to tropo-spheric ozone in Europe and Germany, PhD thesis, Ludwig- Maximilians-Universität München, http://nbn-resolving.de/urn:nbn:de:bvb:19-207288, 2017.
[6] Mertens, M., Grewe, V., Rieger, V. S., and Jöckel, P., Revisiting the contribution of land transport and shipping emissions to tropospheric ozone, Atmos. Chem. Phys., 18, 5567-5588, https://doi.org/10.5194/acp-18-5567-2018, 2018.
[7] Kaiser, J. C., Including Coarse Mode Aerosol Microphysics in a Climate Model: Model Deveopment and First Application. DLR-Forschungsbericht. DLR-FB-2016-1. http://elib.dlr.de/103328/1/fb_2016-01.pdf, 2016.
[8] Kuebbeler, M., Lohmann, U., Hendricks, J., and Kärcher, B., Dust ice nuclei effects on cirrus clouds, Atmos. Chem. Phys., 14, 3027-3046, doi:10.5194/acp-14-3027-2014, 2014.
[9] Vekehrsentwicklung und Umwelt, http://www.dlr.de/VEU/de/desktopdefault.aspx/tabid-9680/


Chapter 05 – High Energy Physics
High Energy Physics
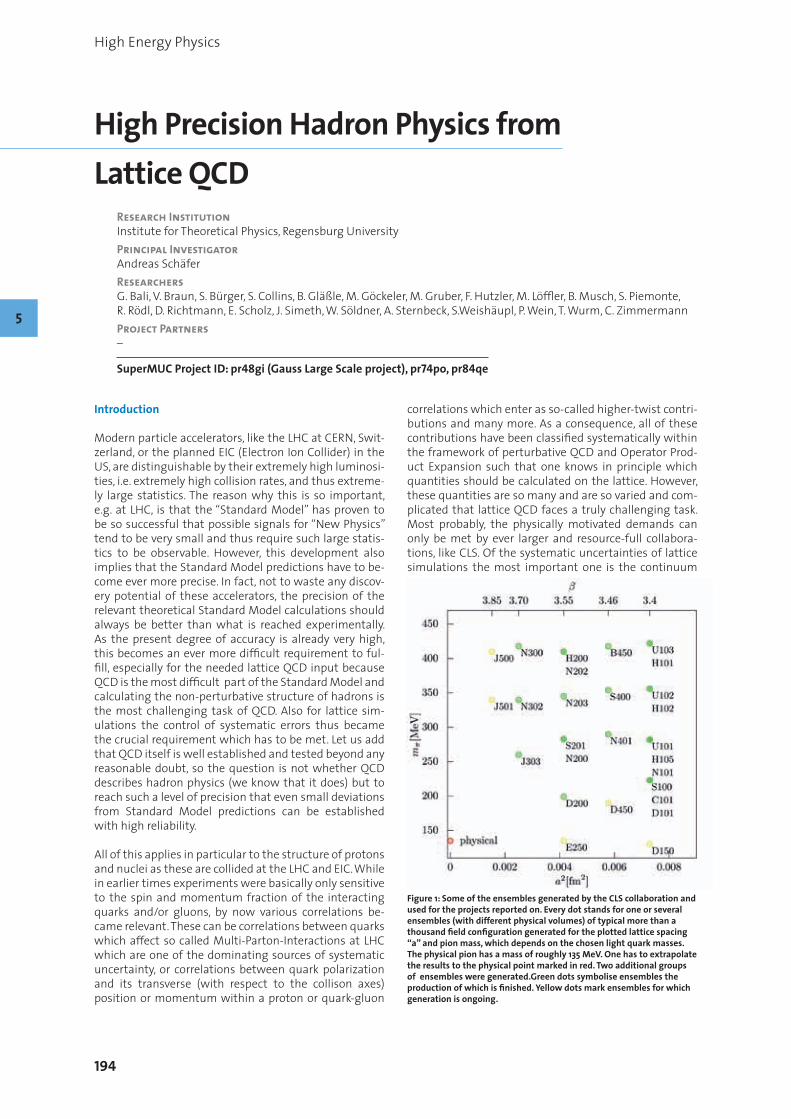
194
High Energy Physics
High Precision Hadron Physics from Lattice QCD
Research InstitutionInstitute for Theoretical Physics, Regensburg UniversityPrincipal InvestigatorAndreas SchäferResearchersG. Bali, V. Braun, S. Bürger, S. Collins, B. Gläßle, M. Göckeler, M. Gruber, F. Hutzler, M. Löffler, B. Musch, S. Piemonte, R. Rödl, D. Richtmann, E. Scholz, J. Simeth, W. Söldner, A. Sternbeck, S.Weishäupl, P. Wein, T. Wurm, C. ZimmermannProject Partners–
SuperMUC Project ID: pr48gi (Gauss Large Scale project), pr74po, pr84qe
Introduction
Modern particle accelerators, like the LHC at CERN, Swit-zerland, or the planned EIC (Electron Ion Collider) in the US, are distinguishable by their extremely high luminosi-ties, i.e. extremely high collision rates, and thus extreme-ly large statistics. The reason why this is so important, e.g. at LHC, is that the “Standard Model” has proven to be so successful that possible signals for “New Physics” tend to be very small and thus require such large statis-tics to be observable. However, this development also implies that the Standard Model predictions have to be-come ever more precise. In fact, not to waste any discov-ery potential of these accelerators, the precision of the relevant theoretical Standard Model calculations should always be better than what is reached experimentally. As the present degree of accuracy is already very high, this becomes an ever more difficult requirement to ful-fill, especially for the needed lattice QCD input because QCD is the most difficult part of the Standard Model and calculating the non-perturbative structure of hadrons is the most challenging task of QCD. Also for lattice sim-ulations the control of systematic errors thus became the crucial requirement which has to be met. Let us add that QCD itself is well established and tested beyond any reasonable doubt, so the question is not whether QCD describes hadron physics (we know that it does) but to reach such a level of precision that even small deviations from Standard Model predictions can be established with high reliability.
All of this applies in particular to the structure of protons and nuclei as these are collided at the LHC and EIC. While in earlier times experiments were basically only sensitive to the spin and momentum fraction of the interacting quarks and/or gluons, by now various correlations be-came relevant. These can be correlations between quarks which affect so called Multi-Parton-Interactions at LHC which are one of the dominating sources of systematic uncertainty, or correlations between quark polarization and its transverse (with respect to the collison axes) position or momentum within a proton or quark-gluon
5
correlations which enter as so-called higher-twist contri-butions and many more. As a consequence, all of these contributions have been classified systematically within the framework of perturbative QCD and Operator Prod-uct Expansion such that one knows in principle which quantities should be calculated on the lattice. However, these quantities are so many and are so varied and com-plicated that lattice QCD faces a truly challenging task. Most probably, the physically motivated demands can only be met by ever larger and resource-full collabora-tions, like CLS. Of the systematic uncertainties of lattice simulations the most important one is the continuum
Figure 1: Some of the ensembles generated by the CLS collaboration and used for the projects reported on. Every dot stands for one or several ensembles (with different physical volumes) of typical more than a thousand field configuration generated for the plotted lattice spacing “a” and pion mass, which depends on the chosen light quark masses. The physical pion has a mass of roughly 135 MeV. One has to extrapolate the results to the physical point marked in red. Two additional groups of ensembles were generated.Green dots symbolise ensembles the production of which is finished. Yellow dots mark ensembles for which generation is ongoing.
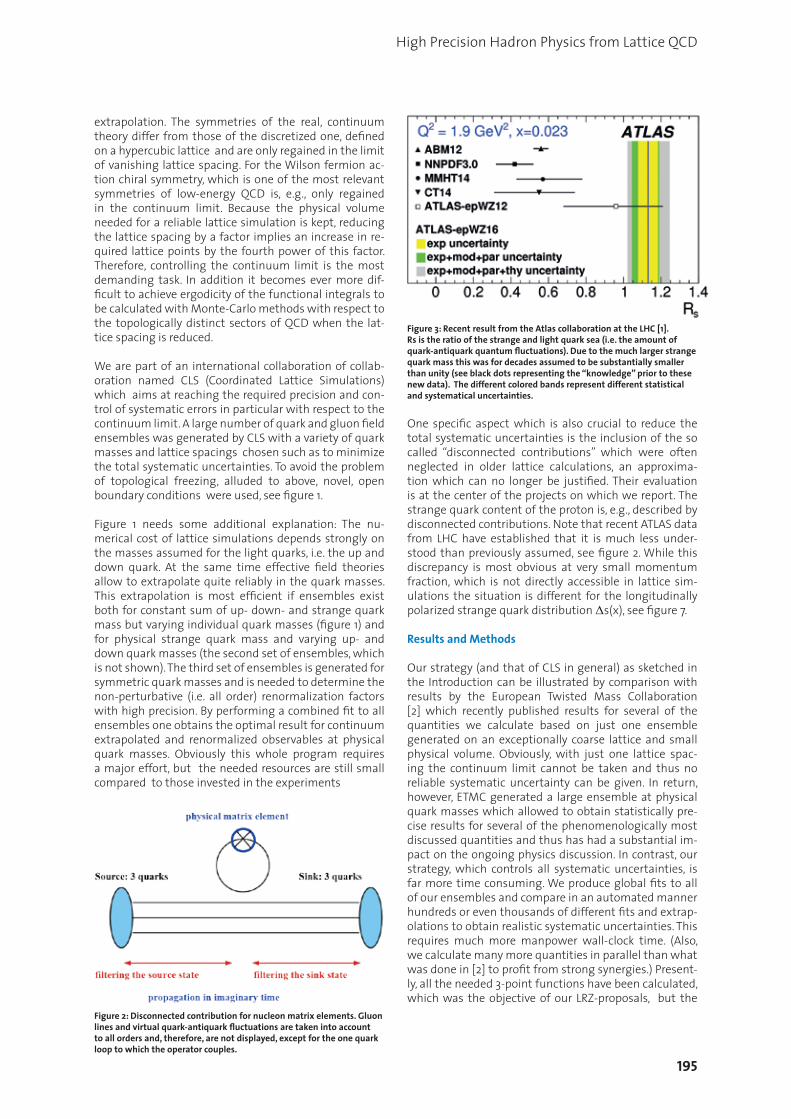
195
High Precision Hadron Physics from Lattice QCD
extrapolation. The symmetries of the real, continuum theory differ from those of the discretized one, defined on a hypercubic lattice and are only regained in the limit of vanishing lattice spacing. For the Wilson fermion ac-tion chiral symmetry, which is one of the most relevant symmetries of low-energy QCD is, e.g., only regained in the continuum limit. Because the physical volume needed for a reliable lattice simulation is kept, reducing the lattice spacing by a factor implies an increase in re-quired lattice points by the fourth power of this factor. Therefore, controlling the continuum limit is the most demanding task. In addition it becomes ever more dif-ficult to achieve ergodicity of the functional integrals to be calculated with Monte-Carlo methods with respect to the topologically distinct sectors of QCD when the lat-tice spacing is reduced.
We are part of an international collaboration of collab-oration named CLS (Coordinated Lattice Simulations) which aims at reaching the required precision and con-trol of systematic errors in particular with respect to the continuum limit. A large number of quark and gluon field ensembles was generated by CLS with a variety of quark masses and lattice spacings chosen such as to minimize the total systematic uncertainties. To avoid the problem of topological freezing, alluded to above, novel, open boundary conditions were used, see figure 1.
Figure 1 needs some additional explanation: The nu-merical cost of lattice simulations depends strongly on the masses assumed for the light quarks, i.e. the up and down quark. At the same time effective field theories allow to extrapolate quite reliably in the quark masses. This extrapolation is most efficient if ensembles exist both for constant sum of up- down- and strange quark mass but varying individual quark masses (figure 1) and for physical strange quark mass and varying up- and down quark masses (the second set of ensembles, which is not shown). The third set of ensembles is generated for symmetric quark masses and is needed to determine the non-perturbative (i.e. all order) renormalization factors with high precision. By performing a combined fit to all ensembles one obtains the optimal result for continuum extrapolated and renormalized observables at physical quark masses. Obviously this whole program requires a major effort, but the needed resources are still small compared to those invested in the experiments
Figure 2: Disconnected contribution for nucleon matrix elements. Gluon lines and virtual quark-antiquark fluctuations are taken into account to all orders and, therefore, are not displayed, except for the one quark loop to which the operator couples.
One specific aspect which is also crucial to reduce the total systematic uncertainties is the inclusion of the so called “disconnected contributions” which were often neglected in older lattice calculations, an approxima-tion which can no longer be justified. Their evaluation is at the center of the projects on which we report. The strange quark content of the proton is, e.g., described by disconnected contributions. Note that recent ATLAS data from LHC have established that it is much less under-stood than previously assumed, see figure 2. While this discrepancy is most obvious at very small momentum fraction, which is not directly accessible in lattice sim-ulations the situation is different for the longitudinally polarized strange quark distribution Δs(x), see figure 7.
Results and Methods
Our strategy (and that of CLS in general) as sketched in the Introduction can be illustrated by comparison with results by the European Twisted Mass Collaboration [2] which recently published results for several of the quantities we calculate based on just one ensemble generated on an exceptionally coarse lattice and small physical volume. Obviously, with just one lattice spac-ing the continuum limit cannot be taken and thus no reliable systematic uncertainty can be given. In return, however, ETMC generated a large ensemble at physical quark masses which allowed to obtain statistically pre-cise results for several of the phenomenologically most discussed quantities and thus has had a substantial im-pact on the ongoing physics discussion. In contrast, our strategy, which controls all systematic uncertainties, is far more time consuming. We produce global fits to all of our ensembles and compare in an automated manner hundreds or even thousands of different fits and extrap-olations to obtain realistic systematic uncertainties. This requires much more manpower wall-clock time. (Also, we calculate many more quantities in parallel than what was done in [2] to profit from strong synergies.) Present-ly, all the needed 3-point functions have been calculated, which was the objective of our LRZ-proposals, but the
Figure 3: Recent result from the Atlas collaboration at the LHC [1]. Rs is the ratio of the strange and light quark sea (i.e. the amount of quark-antiquark quantum fluctuations). Due to the much larger strange quark mass this was for decades assumed to be substantially smaller than unity (see black dots representing the “knowledge” prior to these new data). The different colored bands represent different statistical and systematical uncertainties.
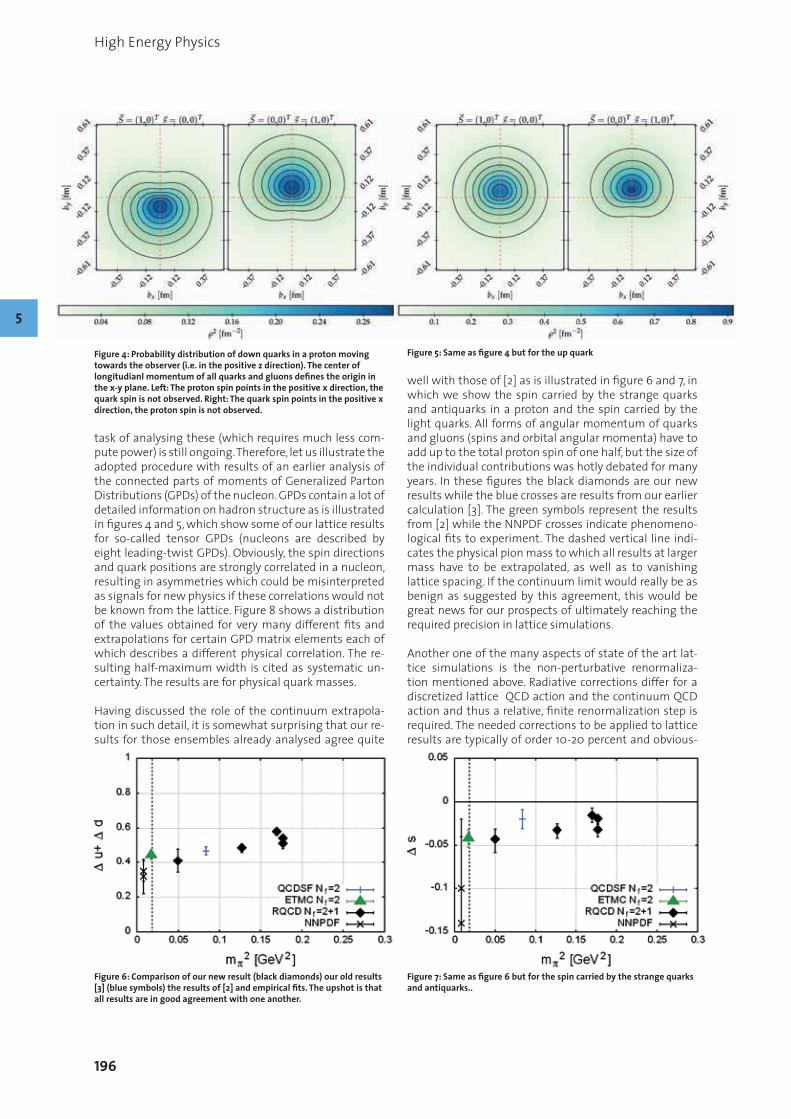
196
High Energy Physics
task of analysing these (which requires much less com-pute power) is still ongoing. Therefore, let us illustrate the adopted procedure with results of an earlier analysis of the connected parts of moments of Generalized Parton Distributions (GPDs) of the nucleon. GPDs contain a lot of detailed information on hadron structure as is illustrated in figures 4 and 5, which show some of our lattice results for so-called tensor GPDs (nucleons are described by eight leading-twist GPDs). Obviously, the spin directions and quark positions are strongly correlated in a nucleon, resulting in asymmetries which could be misinterpreted as signals for new physics if these correlations would not be known from the lattice. Figure 8 shows a distribution of the values obtained for very many different fits and extrapolations for certain GPD matrix elements each of which describes a different physical correlation. The re-sulting half-maximum width is cited as systematic un-certainty. The results are for physical quark masses.
Having discussed the role of the continuum extrapola-tion in such detail, it is somewhat surprising that our re-sults for those ensembles already analysed agree quite
well with those of [2] as is illustrated in figure 6 and 7, in which we show the spin carried by the strange quarks and antiquarks in a proton and the spin carried by the light quarks. All forms of angular momentum of quarks and gluons (spins and orbital angular momenta) have to add up to the total proton spin of one half, but the size of the individual contributions was hotly debated for many years. In these figures the black diamonds are our new results while the blue crosses are results from our earlier calculation [3]. The green symbols represent the results from [2] while the NNPDF crosses indicate phenomeno-logical fits to experiment. The dashed vertical line indi-cates the physical pion mass to which all results at larger mass have to be extrapolated, as well as to vanishing lattice spacing. If the continuum limit would really be as benign as suggested by this agreement, this would be great news for our prospects of ultimately reaching the required precision in lattice simulations.
Another one of the many aspects of state of the art lat-tice simulations is the non-perturbative renormaliza-tion mentioned above. Radiative corrections differ for a discretized lattice QCD action and the continuum QCD action and thus a relative, finite renormalization step is required. The needed corrections to be applied to lattice results are typically of order 10-20 percent and obvious-
Figure 4: Probability distribution of down quarks in a proton moving towards the observer (i.e. in the positive z direction). The center of longitudianl momentum of all quarks and gluons defines the origin in the x-y plane. Left: The proton spin points in the positive x direction, the quark spin is not observed. Right: The quark spin points in the positive x direction, the proton spin is not observed.
Figure 5: Same as figure 4 but for the up quark
Figure 6: Comparison of our new result (black diamonds) our old results [3] (blue symbols) the results of [2] and empirical fits. The upshot is that all results are in good agreement with one another.
Figure 7: Same as figure 6 but for the spin carried by the strange quarks and antiquarks..
5

197
High Precision Hadron Physics from Lattice QCD
ly have to be known rather precisely to reach an over all percent precision. This is possible using sophisticated numerical procedures but requires substantial computer time. We have simulated a substantial number of addi-tional ensembles and have carefully optimized our al-gorithmic procedures to determine the renormalization factors with high precision.
Codes used
In line with our remarks about the synergies and large scale collaborations required to meet the demands of present day particle physics, we use open source code going under the name of CHROMA [4]. We also will make the CLS configurations public available on the ILDG (Inter-national Lattice Data Grid). For the first bunch of ensem-bles this will happen as soon as some technical problem at the ILDG host site is resolved. To overcome the prob-lem of topological freezing we developed tools to sim-ulate with open temporal boundary conditions instead of periodic or antiperiodic ones. Their advantage is that topological charge can enter or leave the lattice volume and their disadvantage that the lattice volume close to the edges cannot be used due to artifacts, resulting in a loss of up to 30 percent of the useable volume. For these simulations the open source software package openQCD (http://luscher.web.cern.ch/luscher/openQCD/index.html) was developed. The main numerical task in lattice simu-lations is the inversion of the Clover-Wilson Dirac ope- rator, which is a very large sparse matrix on the lattice. The numerical inversion cost grows drastically when the light quark masses are reduced to their physical values. Therefore, various state-of-the-art techniques have to be used, e.g., domain decomposition and deflation. The latter uses the property of local coherence of the lowest eigenmodes to effectively remove them from the opera-tor which results in a greatly improved condition number and a cheaper inversion, for the generation of the gauge ensembles within the CLS effort.
Figure 8: Histograms of thousands of fits for several GPD matrix elements at physical quark mass (connected contributions only). In each case fitting ranges and functions as well as extrapolation formulas were modified in many ways within sensible bounds.
There are many other features that make this software very efficient, including twisted-mass Hasenbusch fre-quency splitting that allows for a nested hierarchical integration of the molecular dynamics at different time scales, decoupling the quickly changing but cheaper forc-es of the action from the more expensive low frequency part of the fermion determinant.
Within the interdisciplinary SFB/TRR-55 “Hadron physics from lattice QCD” we closely collaborate with collegues in Applied Mathematics at Wuppertal University who are experts in the required taks. This resulted in much superior matrix inversion algorithms, like an adaptive, aggregation based multigrid solver which we have not only extensively used but also made publically available within CHROMA.
Not surprisingly, by substantially increasing the perfor-mance of our codes we ran into the Big Data problem of handling the very large ensembles generated by CLS as well as the very many correlators we analyse.
This requires us to use libraries that support parallel IO. The Hierarchical Data Format (HDF5) is by now our standard format and greatly simplies the management of big amounts of data. Using Data-Grid technology established by the experimental groups at the LHC we are also able to move such large files in short times. (In fact, by making available the technology and know-how computer centers contribute signicantly to the success of large-scale efforts like the CLS one.)
References and Links
[1] M. Aaboud et al. [ATLAS Collaboration], Eur. Phys. J. C 77 (2017) 367; arXiv:1612.03016
[2] C.Alexandrou et al. Phys. Rev. Lett. 119 (2017) 142002; arX-iv:1706.02973.
[3] G.S.Bali et al. Phys.Rev.Lett. 108 (2012) 222001; arXiv:1112.3354.[4] R.G.Edwards et al. [SciDAC, LHPC and UKQCD Collaborations], Nucl.
Phys. Proc. Suppl. 140 (2005) 832; hep-lat/0409003.

198
High Energy Physics
The hottest nuclear matter in effective field theories and lattice QCD simulations
Research InstitutionTechnische Universität München (TUM), Physik Department T30fPrincipal InvestigatorNora BrambillaResearchersA. S. Kronfeld, A. Vairo, J. H. Weber; A. Bazavov, P. PetreczkyProject PartnersBrookhaven National Lab., Fermi National Accelerator Lab., Michigan State Uni.
SuperMUC Project ID: pr48le, pr83pu (C2PAP)
IntroductionThe TUMQCD collaboration [1] studies nuclear mat-ter through a combination of effective field theory ap-proaches and lattice gauge theory simulations. By di-rectly interfacing both methods we have gained new insights into the properties of hot nuclear matter in the quark-gluon-plasma phase. Our focus in the recent year has been on the Equation-of-State of hot nuclear matter [2] and on the properties of heavy quark-antiquark sys-tems immersed in hot nuclear matter [3].
Nuclear matter has a hadronic phase at low tempera-tures and low densities with well-known key properties such as confinement of quarks. It also has plasmalike phase at temperatures above a pseudo-critical tempera-ture, whose properties are quite different and much less established. In particular, the low-lying hadrons, which are the most relevant degrees of freedom in the hadronic phase, do not exist any more in this quark-gluon plasma. Instead, the constituents of the hadrons – quarks and gluons – are deconfined and directly make up an almost perfect liquid.
Results and Methods
The method of the TUMQCD collaboration is to com-bine the two complementary approaches to improve their predictive power. On the one hand, effective field theory approaches permit analytical and systematic calculations, but require the realization of an assumed hierarchy between different relevant physical scales. On the other hand, lattice gauge theory allows for numerical simulations in an imaginary-time formalism and solves the path integral numerically through a Markov process. However, many dynamical processes require real-time methods, and thus, cannot be studied directly with an imaginary-time formalism.
We may establish the ranges of applicability for the ef-fective field theories, the actual realization of the scale hierarchies and the underlying assumptions by compar-ing results obtained with the former approach to results obtained with the latter approach. Within these applica-
5
bility ranges we may then use the effective field theory approach to make predictions that cannot be obtained directly from lattice gauge theory simulations.
For our simulations we have used the publicly availa-ble code of the MILC collaboration [4], which is a hybrid MPI-OpenMP code written in C and in steady develop-ment since the 80s. We have implemented 2+1 flavors of sea quarks using the highly improved staggered quark (HISQ) action [5] with the strange quark mass at its physical value and the light sea quark mass at either 5% or 20% or the strange quark mass. The most compu-tationally intensive part of the code is the Rational Hy-brid Monte Carlo (RHMC) algorithm, which realizes the Markov process. In the RHMC, the degrees of freedom are coupled to a heatbath and evolved along molecular dynamics trajectories followed by a Metropolis-type ac-cept/reject step.
We have used SuperMUC for generating lattices for 2+1 flavor QCD at finite temperature with the RHMC algo-rithm using usually 2048 cores distributed over four par-allel production runs. We have used 8 million core hours for generating 22 new ensembles with lattice extents of 483 x 12 or 643 x 16. In our simulations we could generate unprecedentedly fine lattices with a realistic sea quark content and lattice spacings smaller than 0.01 fm, which have been instrumental in determining the continuum limit of our results at high temperatures. In total these ensembles account for 26 TB of binary files. These files have to be kept on disk (WORK) until evaluations of cor-relators are completed and are later archived on tape.
Our study of the 2+1 flavor QCD Equation of State [2] per-mitted us to considerably reduce the numerical errors of previous studies with the HISQ action. We could verify that results from direct lattice calculations coincide with hadron resonance gas model calculations for tempera-tures up to 94% of the pseudo-critical temperature. We developed a new, systematic approach to correct for the discretization errors of the QCD pressure and could ob-tain well-controlled continuum results for temperatures five times higher than previous studies.

199
The hottest nuclear matter in effective field theories and lattice QCD simulations
These high temperature lattice results now permit a meaningful comparison with various weak-coupling approaches to thermal QCD, as the latter have only mild truncation errors at such high temperatures. The lattice results lie between the results from dimensionally re-duced effective field theory (Electrostatic QCD) at order g6 and 3-loop Hard-Thermal-Loop QCD, but are compati-ble with the latter within the associated truncation error, see Figure 1.
On-going Research
We have published our study of “Color screening in 2+1 flavor QCD” [3] on the arXiv and will submit it to Physical Review D in the next month. In this paper we address the question at which distances and to which extent a heavy quark-antiquark pair is sensitive to the effects of the surrounding thermal QCD medium or is predominantly still a vacuum-like system. For this project we have computed spatial heavy-quark corre-lation functions at finite temperature in the project pr83pu using the lattices generated on SuperMUC in the project pr48le. We obtain the continuum limit for values of the temperature up to fourteen times high-er than the pseudo-critical temperature and conduct a detailed comparison with various effective field the-ory approaches. We verify the realization of the scale hierarchies in certain regimes determined by the tem-perature and the distance between the quark and the antiquark. These results suggest that these effective field theories provide suitable descriptions of the heavy quark interactions for temperatures above two times the pseudo-critical temperature.
We also work on further projects involving the same lattices and correlation functions. These projects in-volve novel and more precise determinations of the strong coupling constant αs and of the static energy at zero and finite temperature using various approaches refined by or invented in our collaboration. The knowl-edge of the applicability ranges of the effective field theories is indispensable for these projects. Most of our ensembles are reused by us and also by our collabora-
Figure 1: 2+1 flavor QCD pressure from HISQ simulations and two different weak-coupling approaches.
tors using different HPC systems, e.g. at Jefferson Lab. in the US. Lastly, we are extending our work to simulations with 2+1+1 flavors of quarks, for which we will require an extension of our SuperMUC project pr48le.
We have started to target the overhaul of main aspects of our code (transition from AOS to SOA) in order to pro-duce efficient code for Intel MIC infrastructures.
References and Links
[1] TUMQCD collaboration: http://einrichtungen.ph.tum.de/T30f/tumqcd/index.html.
[2] A. Bazavov, P. Petreczky and J. H. Weber, Phys. Rev. D 97, no. 1, 014510 (2018).
[3]. [3]. A. Bazavov, N. Brambilla, P. Petreczky, A. Vairo, J. H. Weber [TUM-QCD Collaboration], Preprint TUM-EFT 81/16, arXiv:1804.10600 [hep-lat], submitted to Phys. Rev. D.
[4] MILC code: http://www.physics.utah.edu/~detar/milc/[5] E. Follana et al. [HPQCD and UKQCD Collaborations], Phys. Rev. D 75,
054502 (2007).
T [MeV]
p/pideal
3-loop, HTL
O(g6) EQCD
0.3
0.4
0.5
0.6
0.7
0.8
0.9
1
400 600 800 1000 1200 1400 1600 1800 2000

200
High Energy Physics
Simulation of Interactions for LHC Run-2Research InstitutionLMU Munich, Physics FacultyPrincipal InvestigatorGünter DuckeckResearchersRodney Walker, ATLAS CollaborationProject PartnersMPP Munich
SuperMUC Project ID: pr58be
Introduction
Our project (ATLMUC) runs simulations of high ener-gy proton-proton collisions in the large hadron collider (LHC) at CERN combined with a simulation of the ATLAS detector response on SuperMUC. Since 2015 LHC is run-ning in its 2nd phase (LHC Run-2) at a centre-of-mass en-ergy of 13 TeV. From 2015 to 2017 LHC was operating very stable and with good efficiency close to or even beyond the original design intensity. In sum, the recorded data volume for Run-2 exceeds the Run-1 (2010-2012) volume already by more than a factor 3.
The ATLAS experiment [1] is one of two multi-purpose ex-periments at the LHC designed to record large numbers of these proton-proton collision events. Figure 1 shows an example event from the recent data taking. The AT-LAS collaboration has already published more than 700 journal articles including the celebrated discovery of the Higgs boson. In searches for new phenomena, as well as for precise measurements, simulations of proton-proton collisions, based on theoretical predictions, combined with a detailed simulation of the detector response are indispensable.
5
These simulations are computationally expensive, e.g. the complete simulation of a complex collision event takes up to 1000 seconds on a single CPU core. The ATLAS ex-periment records about 10 billion collision events per year and the detailed analysis of this data requires at least the same amount of simulated events for the standard pro-cesses in order to perform the baseline optimizations and background corrections. Detailed searches for contribu-tions from ‘New Physics’ processes – the main purpose of the LHC program – require additional samples of sim-ulated events for these processes, typically for multiple settings of parameters specific for these models. These measurements provide stringent constraints on theoreti-cal models beyond the Standard Model of particle physics. One recent example of an exclusion plot for particles pre-dicted in Super-Symmetric Models is shown in Figure 2 [5].
In many cases the scientific output of the ATLAS collabo-ration is not limited by the capacity to process and reduce the data but by the capacity to produce all necessary sim-ulations. Therefore using CPU resources at HPC systems such as SuperMUC/LRZ is a crucial extension of the world-wide LHC computing grid resources which primarily focus on data storage and reconstruction of LHC events.
Figure 1: Example of a proton-proton collision event in ATLAS LHC Run-2. This event was collected in July 2016 and is characterized by two particu-lar high energetic lepton pairs. It is a candidate in searches for exotic particle production or decays.

201
Simulation of Interactions for LHC Run-2
Results and Methods
SuperMUC was integrated into the ATLAS production sys-tem to run a cpu-intensive part of the Monte Carlo simu-lation of LHC events in the ATLAS detector. The integration required a gateway service to receive job requests, stage-in input data, submit into the batch system, and stage-out the output data. Due to the large number of jobs submit-ted automatized submission procedures are required. The gateway is provided by an ARC CE [2] running on a remote node with key-based ssh access to the SuperMUC login nodes. Submission into the batch system and subsequent monitoring proceeds using commands run via ssh. The GPFS files systems are fuse-mounted (sshfs) and there-fore available for stage-in/-out of data. Several technical problems were identified and solved in doing this. The re-mote ARC CE via ssh is remarkably stable. Submission is strictly controlled via X509 certificate. The workloads are a well-defined subset of ATLAS central production work-flows, namely detector simulation based on Geant4 [3]. Geant4 is a toolkit for simulation of the passage of par-ticles through matter. It is cpu-limited and dominated by integer arithmetic operations. Although the passage of particles through matter is serial by nature, ATLAS devel-oped a means to usefully use multiple cpu cores. After an initialization step, the process forks to N sub-processes us-ing copy-on-write shared memory. Each process then pro-cesses a stream of independent events, before merging at the end. This enables the efficient use of a whole node and thereby fulfills the basic SuperMUC requirement.
The workloads are deliberately defined to be short (<4hrs) in order to maximize backfill potential. The pro-ject was accepted on the basis of backfill with pre-empt-able jobs. If a job is killed by pre-emption, then the events already produced are merged and stored by the ARC CE, thus only the events in-flight are lost. No memory dump of the processes is performed, on restart the simulation just continues with the next event. This pre-emptable workload is now used exclusively.
This opportunistic use works well and is an important contribution to ATLAS simulation. The initial CPU alloca-tion has been extended several times. At the beginning, one problem encountered was the poor GPFS client per-formance on phase-1 compute nodes. It leads to a halv-ing of the cpu efficiency, due to delays in file access. A partial solution was found by using Parrot-cvmfs [4] for the software access. The cvmfs part caches file metadata and leads to reduced GPFS lookup.
We eagerly look forward to the availability of Singularity containers, promised for the next generation, as this sim-plifies the software access and solves other OS related difficulties.
GPFS scratch space is used for caching input files. We can turnover the cache to remain inside some limit, but cur-rently rely on the system cleanup. The work GPFS is used to store the software, in a format required by the cvmfs client, and also for work directories of active jobs. The 11 TB quota is adequate for the foreseeable needs.
Figure 2: Example of ATLAS results on searches for super-symmetric particles predicted in extensions of the Standard Model theory. The plot shows 95% confidence level exclusion limits for the production of gluinos and charginos[5].
On-going Research / Outlook
The LHC Run-2 is planned to continue until end of 2018 and should increase the data volume by about a factor 5 compared to Run-1. A corresponding increase of the sim-ulated data volume is required in order to analyze and in-terpret the recorded data. This will allow us to determine with much better precision the properties of the Higgs Boson and either find new particles as predicted by ‘New Physics’ theories or further increase the constraints on these models. Using SuperMUC to simulate events will be a crucial component to reach these goals.
Active development of the simulation software is on-going in order to make the workflow more flexible and better parallelizable for smaller work-units. In 2019 and 2020 no LHC collisions are planned, instead several im-portant upgrades both to the LHC accelerator and the ATLAS detector are scheduled. In that period a continuing demand for event simulation is expected, both to provide sufficient samples for ongoing Run-2 analyses and new simulation samples, adapted for the detector upgrades in Run-3, which is planned to start in 2021. We would very much appreciate if “SuperMUC Next Generation” would continue to contribute to this effort.
References and Links
[1] The ATLAS experiment, http://atlas.ch/[2] Advanced Resource Connector middleware for lightweight
computational Grids, M.Ellert et al., Future Generation Computer Systems 23 (2007) 219-240./document
[3] Geant4, Nuclear Instruments and Methods in Physics Research A 506 (2003) 250-303.
[4] The Evolution of Global Scale Filesystems for Scientific Software Distribution, J. Blomer etal, Computing in Science & Engineering, 17(6) 61-71.
[4] http://cernvm.cern.ch/portal/filesystem/hpc[5] ATLAS Collaboration, Phys.Rev. D96 (2017) no.11, 112010, arXiv:
1708.08232 .

202
High Energy Physics
Nucleon observables as probes for physics beyond the standard model
Research InstitutionNIC, DESY, Zeuthen, GermanyPrincipal InvestigatorK. JansenResearchersC. Alexandrou, S. Bacchio, M. Constantinou, J. Finkenrath, K. Hadjiyiannakou, G. Koutsou, A. Scapellato, C. Kallidonis, B. Kostrzewa, M. Petschlies, C. Urbach, K. Ottnad, F. Steffens, A. VaqueroProject PartnersDepartment of Physics, University of Cyprus, Nicosia, Cyprus; Physics Department, Temple University, Philadelphia PA, USA; Computation-based Science and Technology Research Center, The Cyprus Institute, Nicosia, Cyprus; Department of Physics and Astronomy, Stony Brook University, New York, USA; Helmholtz-Institut für Strahlen- und Kernphysik (Theorie) and Bethe Center for Theoretical Physics, Universität Bonn, Bonn, Germany; Helmholtz-Institut Mainz, Johannes Gutenberg-Universitt, Mainz, Germany; Department of Physics and Astronomy, University of Utah, Salt Lake City, UT, USA
SuperMUC Project ID: pr74yo (Gauss Large Scale project)
Introduction
Lattice Quantum Chromodynamics (QCD) is a non-pertur-bative approach for solving QCD, our theory of the strong interaction between quarks and gluons, that starts direct-ly from the QCD Lagrangian. It consists of discretizing the theory on a 4-dimensional Euclidean lattice. Due to most substantial advances of the employed algorithms and the advent of powerful supercomputers such as SuperMuc, lattice QCD simulations are now possible directly at phys-ical values of the quark masses. This is a very significant step forward, since it avoids an extrapolation to the physi-cal masses and thus eliminates a rather uncontrolled sys-tematic uncertainty. In this way, lattice QCD has developed into a true ab initio method for providing insights into the inner most structure of matter. In this project, we have focused to improve our unerstanding of hadron structure and computed observables that can probe new physics beyond the standard model (BSM).
We use a particular quark discretization, twisted mass fermions, which provides a very fast convergence to the continuum limit. Our European Twisted Mass Collab-oration (ETMC), in which this project is embedded, has already simulated ensembles of gauge configurations at the physical up and down quark masses and is now calculating gauge ensembles which include for the first time Nf=2+1+1 flavours of quarks comprising the physical light, strange and charm quark masses [1]. These calcu-lations became possible by developing new algorithmic techniques within our team and which led to large im-provements, see ref. [2].
Nucleon spinAs a first very important result we have obtained the complete decomposition of the nucleon spin into the contributions from its partons.
5
1/2 ΔΣ L Ju 0.415(13) -0.107(40) 0.308(40)d -0.193(9) 0.247(40) 0.054(38)s -0.021(5) 0.067(21) 0.046(21)g - - 0.133(18)
tot. 0.201(18) 0.207(78) 0.541(79)
Table 1: Numerical values of the nucleon spin decomposition, given in the MS-scheme at 2 GeV.
This includes the quark intrinsic spin, the quark orbital an-gular momentum, and the gluon contribution. This is the first such study in lattice QCD using quarks with masses tuned to their physical values. We used Ji’s spin sum:
IntroductionLattice Quantum Chromodynamics (QCD) isa non-perturbative approach for solving QCD,our theory of the strong interaction betweenquarks and gluons, that starts directly from theQCD Lagrangian. It consists of discretizingthe theory on a 4-dimensional Euclidean lat-tice. Due to most substantial advances of theemployed algorithms and the advent of power-ful supercomputers such as SuperMuc, latticeQCD simulations are now possible directly atphysical values of the quark masses. This is avery significant step forward, since it avoids anextrapolation to the physical masses and thuseliminates a rather uncontrolled systematic un-certainty. In this way, lattice QCD has devel-oped into a true ab initio method for providinginsights into the inner most structure of mat-ter. In this project, we have focused to improveour unerstanding of hadron structure and com-puted observables that can probe new physicsbeyond the standard model (BSM).We use a particular quark discretization, twistedmass fermions, which provides a very fast con-vergence to the continuum limit. Our Euro-pean Twisted Mass Collaboration (ETMC), inwhich this project is embedded, has alreadysimulated ensembles of gauge configurationsat the physical up and down quark masses andis now calculating gauge ensembles which in-clude for the first time Nf=2+1+1 flavours ofquarks comprising the physical light, strangeand charm quark masses [1]. These calcula-tions became possible by developing new algo-rithmic techniques within our team and whichled to large improvements, see ref. [2].
Nucleon spin. As a first very important re-sult we have obtained the complete decompo-sition of the nucleon spin into the contributions
12∆Σ L J
u 0.415(13) -0.107(40) 0.308(40)d -0.193(9) 0.247(40) 0.054(38)s -0.021(5) 0.067(21) 0.046(21)g - - 0.133(18)
tot. 0.201(18) 0.207(78) 0.541(79)
Table 1: Numerical values of the nucleon spindecomposition, given in the MS-scheme at 2GeV.
from its partons. This includes the quark in-trinsic spin, the quark orbital angular momen-tum, and the gluon contribution. This is thefirst such study in lattice QCD using quarkswith masses tuned to their physical values.We used Ji’s spin sum:
1
2=
∑q
(1
2∆Σq + Lq) + JG, (1)
where ∆Σq is the intrinsic spin contributionof a quark of flavor q, Lq its angular momen-tum contribution and JG the total contributionfrom gluons. ∆Σq = gqA is the axial charge,while the total spin Jq is obtained from the ma-trix element of a suitable first derivative oper-ator, which also yields the momentum fraction〈x〉q. With all components available to us atthe physical point, including the gluon contri-bution, we found that indeed they add up to1/2 as expected. In Fig. , we show the indi-vidual contributions that make up the spin ofthe nucleon and give in table 1 their individualvalues.
Direct evaluation of Parton Distribution Func-tions (PDF). Another important and most re-markable result has been a direct lattice cal-culation of parton distribution functions. Us-ing the pioneering method suggested by Ji in
2
(1)
where ΔΣ q is the intrinsic spin contribution of a quark of flavor q, Lq its angular momentum contribution and JG the total contribution from gluons. ΔΣ q = g q
A is the axial charge, while the total spin Jq is obtained from the ma-trix element of a suitable first derivative operator, which also yields the momentum fraction ⟨x⟩q. With all com-ponents available to us at the physical point, including the gluon contribution, we found that indeed they add up to 1/2 as expected. In Fig. , we show the individual con-tributions that make up the spin of the nucleon and give in table 1 their individual values.
Direct evaluation of Parton Distribution Functions (PDF)Another important and most remarkable result has been a direct lattice calculation of parton distribution functions. Using the pioneering method suggested by Ji in Figure 1.

203
Nucleon observables as probes for physics beyond the standard model
Ref. [3] we have computed nucleon parton distribu-tion functions (PDFs) on two physical point ensembles, namely an Nf = 2 ensemble with size 483 ∙ 96 and lattice spacing a = 0:093 fm and an Nf = 2+1+1 ensemble with size 643 ∙ 128 and lattice spacing a = 0:082 fm. Results are depicted in Fig. 2, where we show the dependence on the quark momentum fraction x of the renormalized un-polarized and helicity distributions. This is the first time that by using physical values of the quark masses an agreement with phenomenological extractions of par-ton distribution functions could be demonstrated. This clearly constitutes a major step forward in understand-ing the structure of hadronic matter.
References
[1] Jacob Finkenrath, Constantia Alexandrou, Simone Bacchio, Pana-giotis Charalambous, Petros Dimopoulos, Roberto Frezzotti, Karl Jansen, Bartosz Kostrzewa, Giancarlo Rossi, and Carsten Urbach, Simulation of an ensemble of Nf = 2 + 1 + 1 twisted mass cloverim-proved fermions at physical quark masses, in: 35th International Symposium on Lattice Field Theory (Lattice 2017) Granada, Spain, une 18-24, 2017, 2017.
[2] Simone Bacchio, Constantia Alexandrou, and Jacob Finkerath, Multigrid accelerated simulations for Twisted Mass fermions, in: 35th International Symposium on Lattice Field Theory (Lattice 2017) Granada, Spain, June 18-24, 2017, 2017.
[3] Xiangdong Ji, Parton Physics on a Euclidean Lattice, Phys. Rev. Lett., 110, 262002, 2013.
[4] J. F. Owens, A. Accardi, and W. Melnitchouk, Global parton distribu-tions with nuclear and finite-Q2 corrections, Phys. Rev., D87, no. 9, 094012, 2013.
[5] Daniel de Florian, Rodolfo Sassot, Marco Stratmann, and Werner Vogelsang, Extraction of Spin-Dependent Parton Densities and Their Uncertainties, Phys. Rev., D80, 034030, 2009.
Figure 1: Nucleon spin decomposition. All quantities are given in the MS-scheme at 2 GeV. The striped segments show valence quark contri-butions (connected) and the solid segments the sea quark and gluon contributions (disconnected).
Figure 2: Renormalized distributions computed from the Nf=2 ensemble. Top: unpolarized PDF, down: helicity PDF. CJ12mid [4], and DDSV08 [5] are phenomenological distributions extracted from analysis of deep inelastic scattering data.
-1 -0.5 0 0.5 1x
-2
-1
0
1
2
3
4
5
6u! dp = 6:=L
p = 8:=Lp = 10:=LCJ12mid
-1 -0.5 0 0.5 1x
-1
0
1
2
3
4"u!"dp = 6:=L
p = 8:=Lp = 10:=LDSSV08

204
High Energy Physics
Precision determination of the strong couplingResearch InstitutionNeumann Institute for Computing, DESYPrincipal InvestigatorRainer SommerResearchersALPHA Collaboration: Mattia Bruno, Mattia Dalla Brida, Patrick Fritzsch, Tomasz Korzec, Alberto Ramos, Stefan Schaefer, Hubert Simma, Stefan SintProject PartnersHumboldt Universität zu Berlin, Universität Wuppertal, Trinity College Dublin, CERN, University Milan Bicocca, Brookhaven National Lab
SuperMUC Project ID: pr84mi (Gauss Large Scale project)
Introduction
Decades of research have lead to the Standard Model of particle physics. It is a theory which describes the struc-ture of matter at length scales below the diameters of nuclei to an astonishing level of precision. Equivalently it successfully predicts particle decays and scattering cross sections of high-energy processes up to the ener-gies reached at the Large Hadron Collider (LHC) at CERN in Geneva. Indeed, we also believe that physics at larg-er length scales, i.e., nuclear and atomic physics, would emerge from the fundamental equations of the Stand-ard Model, if we were able to solve them directly.
A very attractive feature of the Standard Model is that it has very few free parameters. These are – as far as we presently know – fundamental parameters of Nature. Their precise determination is thus an important part of particle physics and physics in general. It is also essen-tial in order to put the Standard Model to tests of ever increasing precision. Such tests are especially motivated by observations that go beyond the physics described by the Standard Model, such as the existence of dark mat-ter or the degree of asymmetry between matter and an-ti-mattter in the universe. Thus, despite its tremendous success, the Standard Model must be incomplete! In the quest for a more complete theory, precision tests of the Standard Model complement direct searches for dark matter candidates and other effects of “new” physics at the LHC and other experiments.
Both the determination of the fundamental parameters and the precision tests of the theory require precision experiments on the one hand and a precise solution of the theory (as a function of the fundamental constants) on the other hand. For many processes, the theory can be accurately solved as a series expansion in the couplings of the theory. An exception are processes that are domi-nated or affected by the ”strong” interactions part of the theory. This part is called Quantum Chromo Dynamics (QCD). Its most important feature is that it describes the structure of the smallest nucleus, the proton, in terms of constituents called quarks. These are bound inside the proton by the strong force, which is mediated by the ex-
5
change of quanta called gluons. The analogous phenom-enon on the atomic level is the binding of the electrons by the exchange of photons with the nucleus. However, while the Coulomb force between electron and nucleus falls off rapidly with the distance (and is relatively weak altogether, characterized by a small fine structure con-stant α=1/137), the force between quarks remains strong at arbitrarily large distances and leads to the phenome-non of confinement: quarks are always bound. They do not exist as true particles by themselves. But how do we know that confinement is indeed a property of the theo-ry? It is only due to its “simulations” on a space-time grid on super-computers such as SuperMUC and JUQUEEN. We put “simulations’’ in quotation marks, since these are not simulations of how particles move in space-time, but rather represent stochastic solutions of Feynman’s path integral, which provides the quantization of the funda-mental fields, the quarks and the gluons. The stochastic solution of the path integral is possible, independently of any series (i.e., perturbative) expansions. It thus provides non-perturbative predictions of the theory. The stochas-tic evaluation of the path integral on a grid is called a lattice QCD simulation.
Despite the strong interactions of the theory, one may de-fine αs, the analogue of the fine structure constant in QCD. This is the coupling of the theory, and a perturbative treat-ment means the series expansion in this coupling. A sim-ple, physically appealing definition of the coupling is the force between static (infinitely heavy) quarks multiplied by the square of the distance. The aforementioned proper-ty of confinement means that at distances around a pro-ton radius this coupling is much larger than one; hence, a series expansion makes no sense. However, at smaller distances also the QCD force becomes Coulomb-like, and the distance-dependent (“running’’) coupling, αs, becomes weaker and weaker. Perturbation theory then predicts that αs vanishes at small distances, r, as -1/log(rΛ). The constant Λ characterizes the coupling uniquely and thus corresponds to the fundamental intrinsic energy scale of the theory. Once it is known, perturbative predictions, valid at short distances or, equivalently, high energies become parameter-free. This is important for tests of QCD at high energies, e.g., at the LHC.

205
Precision determination of the strong coupling
Results and Methods
A precision determination of the Λ-parameter is a chal-lenge. A physical observable has to be evaluated which simultaneously has three properties: 1) it is a short dis-tance quantity; 2) it can be obtained with high precision and 3) its perturbative expansion is known to reasonably high order. Lattice QCD, once its free parameters are de-termined from low-energy experimental data, can pro-vide such observables, but in addition to the above, care has to be taken that 4) lattice spacings are small com-pared to the physical short distance involved. Our collab-oration has developed a systematic strategy to cope with all challenges, in particular with 4). After applications to simplified theories, we have by now obtained a very precise result in the three-flavor theory with u, d, and s quarks. It can be connected perturbatively to the physical five-flavor number [3]. We thereby determine Λ in a con-trolled fashion, from experimental input at the lowest energy: masses and decay constants of Pion and Kaon.
Our strategy (Figure 1) to connect large distances L=1/μ (μ: energy) and small distances involves couplings defined deliberately in a finite small volume, where very small grid spacings can be simulated. Two couplings with comple-mentary properties at larger and smaller distances are employed. Their μ-dependence, and the connection be-tween them, are both computed non-perturbatively by simulations of lattice QCD and extrapolations to vanish-ing grid spacing a. The two couplings are denoted ”Gradi-ent flow’” and ”Schrödinger Functional” in Figure 1. In the weak coupling region, the non-perturbative results are compared to the perturbative expression in terms of Λ, and that fundamental parameter is determined. Here the precision of perturbation theory is at the % level, because a coupling of αs=0.1 is reached and the unknown pertur-bative corrections are proportional to its square.
In our SuperMUC project, we deal with the connection of the coupling to the low-energy, non-perturbative scales of the theory. This is numerically most challenging, because
Figure 1: The energy dependence of two finite volume couplings, ”Gradient flow” and ”Schrödinger Functional”, as obtained in our finite volume simulations. By perturbative conversion at high μ (small α), we also determine the coupling in the so-called MS scheme.
Figure 2: Continuum extrapolation of μref*/ μhad for two different choices of g
2GF (μhad ). For details, see [3].
now physically large volumes have to be simulated and different grid spacings need to be considered in order to take a continuum limit by extrapolation. Also this part is split in two individual steps, which can both be carried out separately and again with the most suitable resolutions. In the previous report we mentioned the determination of an intermediate reference scale, μref*, in units of the ex- perimentally accessible decay constants of Pion and Kaon. By our computations, this scale is now related to the low-est scales, μhad, reached by the Gradient flow running cou-pling in the second step. It thus consists in the determi-nation of μref*/ μhad. With very fine lattice spacings a, the continuum limit extrapolation of that ratio could again be carried out with confidence, see Figure 2.
Result / Conclusions
The last step, Figure 2, has been combined with the previ-ous results to obtain [3]
α MS (mZ) = 0.1185(8)
which compares very well, but is more precise than the Particle Data Group (PDG) world average of phenome-nological determinations of the strong coupling at the Z-boson mass from scattering experiments,
α MS (mZ) = 0.1175(17)
This agreement provides a very good test of the correct-ness of QCD as the theory of the strong interactions. Here it is of particular importance that our result is based entirely on experimental results for hadrons, i.e., QCD properties governed by confinement. In contrast, the PDG world average uses scattering data at relative-ly large energy, selected such that confinement can be hoped to lead only to small corrections to the pertur-bative expressions. Both analyses lead to the same cou-pling. Of course, the higher precision in our determina-tion is particularly valuable for future predictions of QCD effects at particle physics colliders.
References and Links
[1] M. Dalla Brida, Phys. Rev. Lett. 117 (2015) 182001[2] M. Bruno et al, J. High E. Phys., 1502 (2015) 043[3] M. Bruno et al, Phys. Rev. Lett. 119 (2017) 102001
2.2
2.25
2.3
2.35
2.4
2.45
2.5
2.55
0 0.02 0.04 0.06 0.08 0.1 0.12 0.14
g2GF(µhad,1) = 11.31
g2GF(µhad,2) = 10.20
µ� ref/µhad
(aµ�ref)
2
Set ASet B

206
High Energy Physics
Non-zero density simulations in full QCDResearch InstitutionBergische Universität WuppertalPrincipal InvestigatorDénes SextyResearchersZ. Fodor, S.D. Katz, Cs. TörökProject Partners—
SuperMUC Project ID: pr84to (Gauss Large Scale project)
Introduction
The simulation of nuclear matter at nonzero baryon den-sity presents a notoriously hard problem in lattice QCD. The usual simulation strategies depend on the exploration of the configuration space by interpreting the weight of each configuration in an average as a probability, which is however not valid here as the weight is non positive. This is called the ‘sign problem’ of nonzero density QCD. In this project the researchers compare two different simulation strategies which evade the sign problem with very differ-ent methods.
The different phases of water (liquid water, vapour and ice) are well known to everybody, and almost everyone knows even the temperature at which the water chang-es its phase i.e. it gets frozen or boils to vapour. Systemat-ic studies yield the phase diagram of the water as a func-tion of the temperature and the pressure, well known to both experimental and theoretical physics.
The behavior of quarks and gluons, which make up the nuclei of atoms is governed by the theory called Quan-tum Chromo Dynamics (QCD). This theory describes how quarks build up protons, neutrons and other particles at low temperatures with the help of an attractive force mediated by gluons, and the quark-gluon plasma at high
5
temperatures. One of the current outstanding problems of theoretical physics is to produce a phase diagram for QCD as a function of the temperature and the baryonic density. Currently very little is known about the phase diagram of QCD, but effective models give some guide-lines as illustrated above. The simulation of nuclear mat-ter and quark gluon plasma at small baryon densities is a well established part of theoretical physics since dec-ades. There are very sophisticated algorithms based on the so called ‘importance sampling’ which uses the fact that the system can be described with an ensemble of configurations which describe an instance of gluon and quark fields. Each configuration has a weight which is interpreted as a probability depending on the tempera-ture, quark masses and so on. This probabilistic descrip-tion however breaks down as soon as there is a nonzero baryonic density in the system, because the weight of each configuration can now become negative. This is the infamous ‘sign problem’, a long standing challenge in the field of lattice QCD as well as other fields such as condensed matter physics, non-equilibrium physics, etc.
In this project the researchers test two methods designed to evade the sign problem. The first is called ‘reweighting’ as it changes the weights of the configurations such that they are positive again, and in turn mimics the nonzero baryon density by changing the physical quantities to be measured in an appropriate fashion. This allows to
Figure 1: The phase diagram of water (left) as a function of the temperature and pressure, and one of the proposed phase diagrams of Nuclear matter (right), as a function of baryon density and temperature.

207
Non-zero density simulations in full QCD
explore into the region of non zero densities, however the method becomes unreliable if we go too far from the original zero density phase, moreover its cost increases very rapidly as the system size is increased.
The second method is based on the so called Langevin equation which describes a random walk in configu-ration space, and can be used as a simulation method also at zero densities. This method however does not require the interpretation of weights as probabilities, and therefore is generalizable to non-positive weights as well. This generalization is based on the structure of the complex numbers, hence it has the name ‘Com-plex Langevin equation (CLE)’ . It was invented more than 30 years ago [1], however its status was unclear as sometimes this method gives unreliable results. In recent years however important results have clarified what conditions must be satisfied and what technical improvements are needed to make the method and its results trustworthy [2].
The researchers have determined that there is a good agreement between reweighting and Complex Langevin results where both are applicable[3]. Their range of appli-cability is however quite different. Reweighting performs well at small baryon densities while Complex Langevin works at small lattice spacings (which means high tem-peratures in practice). Their reliabilities can be assessed independently of the other method. See for illustration the figures below where the ‘Polyakov loop’ (a quantity connected to the energy of free quark) is plotted as a function of the chemical potential and the ‘beta’ param-eter controlling the lattice spacing. These findings led to further studies which are carried out to simulate the physics at high temperature and to determine whether the Complex Langevin method can be extended to lower temperatures.
Figure 2: Comparison of the simulation strategies CLE and reweighting.
References
[1] G. Parisi, Phys. Lett. 131B (1983) 393; J. R. Klauder, Acta Phys. Austria-ca Suppl. 25 (1983) 251.
[2] D.Sexty PoS LATTICE2014 (2014) 016; G. Aarts, E. Seiler, D. Sexty, I.-O. Stamatescu JHEP 1705 (2017) 044
[3] Z.Fodor, S.D. Katz, D. Sexty, Cs. Török Phys.Rev. D92 (2015) no.9, 094516

208
High Energy Physics
Form factors of semileptonic B-meson decays from Lattice QCD
Research InstitutionWestfälische Wilhelms-Universität MünsterPrincipal InvestigatorJochen HeitgerResearchersDebasish Banerjee, Michele Della Morte, Piotr Korcyl, Mateusz Koren, Hubert Simma, Rainer Sommer, Christian WittemeierProject PartnersJohn von Neumann Institute for Computing, DESY, University of Southern Denmark, Jagiellonian University
SuperMUC Project ID: pr85ju
Introduction
The Standard Model (SM) of elementary particle physics is impressively successful in describing a wide class of phenomena originating from electromagnetic, weak and strong interactions, over a wide range of energy scales. While the SM is holding up superbly against extensive experimental scrutinies, it is also well believed to be an effective theory, only valid up to some energy cut-off. For instance, it neither contains a dark matter candidate, nor does it explain the observed baryon asymmetry of the universe. While direct search of new particles is the main approach to establish New Physics at the LHC, CERN, it is also possible that first signals may emerge from indirect searches by looking for deviations from the SM theoret-ical predictions in precise (low-energy) measurements. Here, the quark flavour physics sector plays a key rôle: E.g., flavour-changing neutral current processes are high-ly suppressed in the SM and hence very sensitive to New Physics. Nevertheless, some of them are sufficiently large to be studied in dedicated experiments.
Flavour transitions in the SM are parameterized by the Cabibbo-Kobayashi-Maskawa (CKM) matrix that encodes the strengths of flavour-changing weak decays involv-ing quarks. While these are weak interaction processes, the relevant physical states, as an effect of confinement, are low-energy bound states of quarks, the hadrons. Their transitions actually govern the decay rates and are mediated by the theory of strong interaction, Quantum Chromodynamics (QCD). As the traditional perturbative approach, however, is accurate at weak couplings only, but inadequate in the strongly coupled, low-energy regime of hadrons and their matrix elements, QCD computations have to be performed non-perturbatively in this regime.
Lattice QCD is the natural, genuinely non-perturbative ab-initio method that allows such computations, with-out relying on any model-dependent assumptions, and where systematic errors can be fully controlled. It starts from a discretization of space and time and puts the fundamental (quark and gluon) field variables on the
5
sites and links of a lattice, resulting in a finite (but still very large: ~O(108)) number of degrees of freedom. The definition of physical observables rests on the Euclide-an version of Feynman’s path integral representation of the partition function of QCD and expectation values derived from it. In practice, calculations are realized as “computer experiments”: Stochastic evaluation of the expectation values by Monte Carlo simulations, employ-ing “importance sampling” methods to numerically esti-mate the multidimensional integrals involved. Although since recent years realistic lattice QCD simulations with dynamical light sea quarks of masses close to nature, in large volumes at fine lattice spacings, are customary, they remain very challenging. Therefore, extensive large-scale numerical simulations on super-computers such as SuperMUC represent valuable inputs to achieve a preci-sion for many physical quantities that can compete with the one reached in experiments.
Very promising processes among the indirect New Phys-ics searches, where one expects beyond SM effects to be quite large, are semileptonic weak decays of mesons con-taining a b-quark. The SM prediction for the decay rate requires the non-perturbative computation of a hadron-ic matrix element and is proportional to one entry of the CKM-matrix. With this project we aim at a lattice QCD computation of the hadronic matrix element relevant for the semileptonic (exclusive) process Bs → K ℓ ν. Combining it with the experimental decay rate enables to determine the CKM matrix element |Vub|. Tensions with estimates from B → τ ν, B → π ℓ ν and inclusive decays would then hint at New Physics. Similar anomalies are observed in ratios of semileptonic B-meson decays with different fi-nal-state leptons, which may indicate a SM-breakdown by virtue of lepton-universality violation.
Still, the presence of the b-quark represents an additional difficulty, because its mass is very large. Thus, the b-quark cannot be simulated as a relativistic particle with today’s computing power and is treated employing an effective theory. Our collaboration uses the Heavy Quark Effective Theory (HQET), where the heaviest degrees of freedom
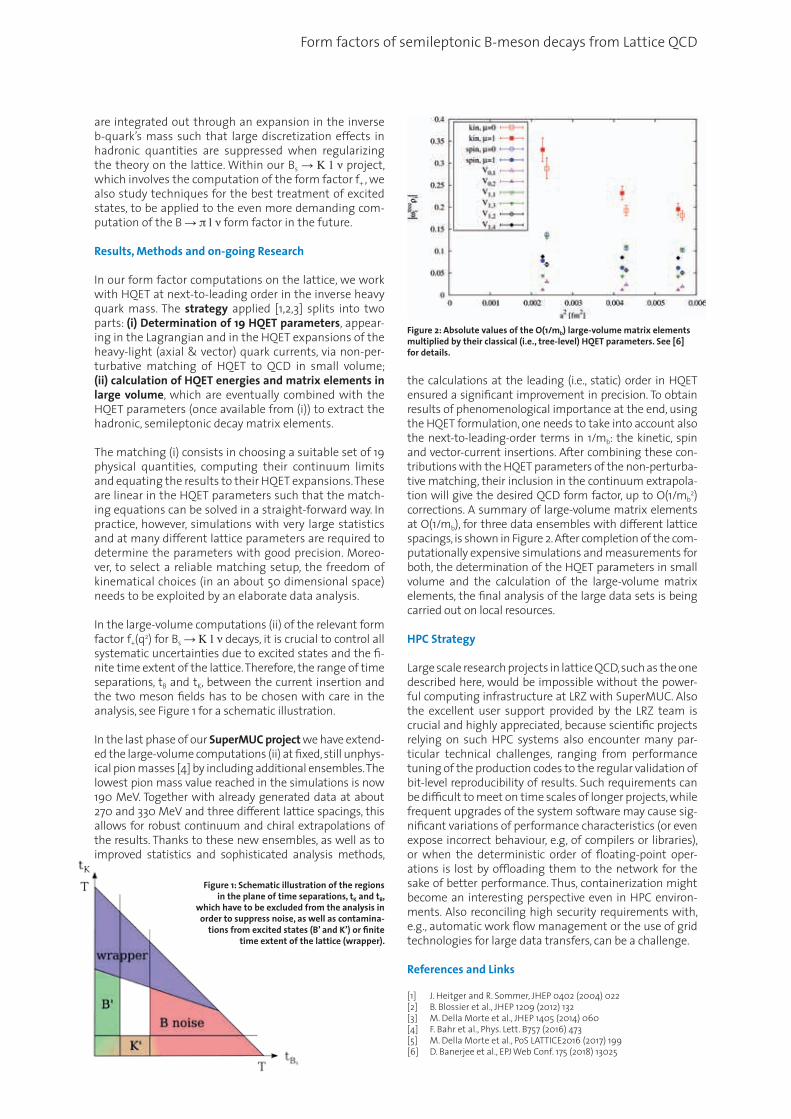
Form factors of semileptonic B-meson decays from Lattice QCD
are integrated out through an expansion in the inverse b-quark’s mass such that large discretization effects in hadronic quantities are suppressed when regularizing the theory on the lattice. Within our Bs → K ℓ ν project, which involves the computation of the form factor f+ , we also study techniques for the best treatment of excited states, to be applied to the even more demanding com-putation of the B → π ℓ ν form factor in the future.
Results, Methods and on-going Research
In our form factor computations on the lattice, we work with HQET at next-to-leading order in the inverse heavy quark mass. The strategy applied [1,2,3] splits into two parts: (i) Determination of 19 HQET parameters, appear-ing in the Lagrangian and in the HQET expansions of the heavy-light (axial & vector) quark currents, via non-per-turbative matching of HQET to QCD in small volume; (ii) calculation of HQET energies and matrix elements in large volume, which are eventually combined with the HQET parameters (once available from (i)) to extract the hadronic, semileptonic decay matrix elements.
The matching (i) consists in choosing a suitable set of 19 physical quantities, computing their continuum limits and equating the results to their HQET expansions. These are linear in the HQET parameters such that the match-ing equations can be solved in a straight-forward way. In practice, however, simulations with very large statistics and at many different lattice parameters are required to determine the parameters with good precision. Moreo-ver, to select a reliable matching setup, the freedom of kinematical choices (in an about 50 dimensional space) needs to be exploited by an elaborate data analysis.
In the large-volume computations (ii) of the relevant form factor f+(q2) for Bs → K ℓ ν decays, it is crucial to control all systematic uncertainties due to excited states and the fi-nite time extent of the lattice. Therefore, the range of time separations, tB and tK, between the current insertion and the two meson fields has to be chosen with care in the analysis, see Figure 1 for a schematic illustration.
In the last phase of our SuperMUC project we have extend-ed the large-volume computations (ii) at fixed, still unphys-ical pion masses [4] by including additional ensembles. The lowest pion mass value reached in the simulations is now 190 MeV. Together with already generated data at about 270 and 330 MeV and three different lattice spacings, this allows for robust continuum and chiral extrapolations of the results. Thanks to these new ensembles, as well as to improved statistics and sophisticated analysis methods,
Figure 2: Absolute values of the O(1/mb) large-volume matrix elements multiplied by their classical (i.e., tree-level) HQET parameters. See [6] for details.
the calculations at the leading (i.e., static) order in HQET ensured a significant improvement in precision. To obtain results of phenomenological importance at the end, using the HQET formulation, one needs to take into account also the next-to-leading-order terms in 1/mb: the kinetic, spin and vector-current insertions. After combining these con-tributions with the HQET parameters of the non-perturba-tive matching, their inclusion in the continuum extrapola-tion will give the desired QCD form factor, up to O(1/mb
2) corrections. A summary of large-volume matrix elements at O(1/mb), for three data ensembles with different lattice spacings, is shown in Figure 2. After completion of the com-putationally expensive simulations and measurements for both, the determination of the HQET parameters in small volume and the calculation of the large-volume matrix elements, the final analysis of the large data sets is being carried out on local resources.
HPC Strategy
Large scale research projects in lattice QCD, such as the one described here, would be impossible without the power-ful computing infrastructure at LRZ with SuperMUC. Also the excellent user support provided by the LRZ team is crucial and highly appreciated, because scientific projects relying on such HPC systems also encounter many par-ticular technical challenges, ranging from performance tuning of the production codes to the regular validation of bit-level reproducibility of results. Such requirements can be difficult to meet on time scales of longer projects, while frequent upgrades of the system software may cause sig-nificant variations of performance characteristics (or even expose incorrect behaviour, e.g, of compilers or libraries), or when the deterministic order of floating-point oper-ations is lost by offloading them to the network for the sake of better performance. Thus, containerization might become an interesting perspective even in HPC environ-ments. Also reconciling high security requirements with, e.g., automatic work flow management or the use of grid technologies for large data transfers, can be a challenge.
References and Links
[1] J. Heitger and R. Sommer, JHEP 0402 (2004) 022[2] B. Blossier et al., JHEP 1209 (2012) 132[3] M. Della Morte et al., JHEP 1405 (2014) 060[4] F. Bahr et al., Phys. Lett. B757 (2016) 473[5] M. Della Morte et al., PoS LATTICE2016 (2017) 199[6] D. Banerjee et al., EPJ Web Conf. 175 (2018) 13025
Figure 1: Schematic illustration of the regions in the plane of time separations, tK and tB,
which have to be excluded from the analysis in order to suppress noise, as well as contamina-
tions from excited states (B’ and K’) or finite time extent of the lattice (wrapper).
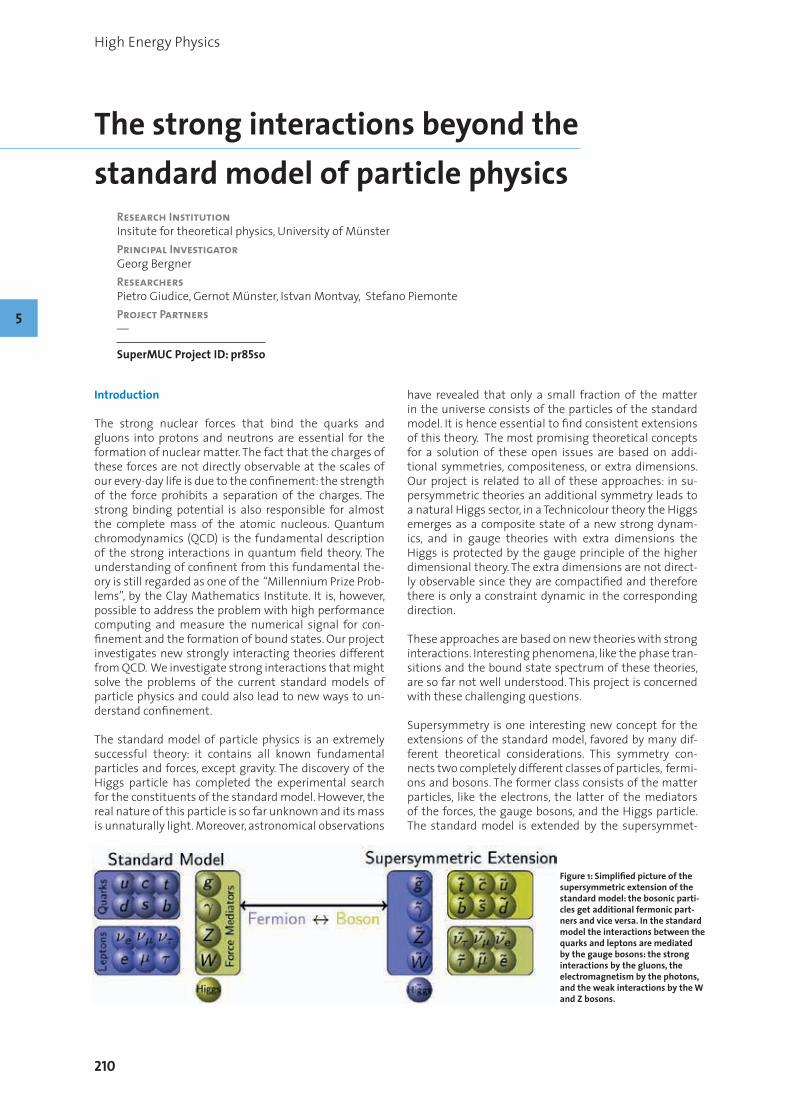
210
High Energy Physics
The strong interactions beyond the standard model of particle physics
Research InstitutionInsitute for theoretical physics, University of MünsterPrincipal InvestigatorGeorg BergnerResearchersPietro Giudice, Gernot Münster, Istvan Montvay, Stefano PiemonteProject Partners—
SuperMUC Project ID: pr85so
Introduction
The strong nuclear forces that bind the quarks and gluons into protons and neutrons are essential for the formation of nuclear matter. The fact that the charges of these forces are not directly observable at the scales of our every-day life is due to the confinement: the strength of the force prohibits a separation of the charges. The strong binding potential is also responsible for almost the complete mass of the atomic nucleous. Quantum chromodynamics (QCD) is the fundamental description of the strong interactions in quantum field theory. The understanding of confinent from this fundamental the-ory is still regarded as one of the “Millennium Prize Prob-lems”, by the Clay Mathematics Institute. It is, however, possible to address the problem with high performance computing and measure the numerical signal for con-finement and the formation of bound states. Our project investigates new strongly interacting theories different from QCD. We investigate strong interactions that might solve the problems of the current standard models of particle physics and could also lead to new ways to un-derstand confinement.
The standard model of particle physics is an extremely successful theory: it contains all known fundamental particles and forces, except gravity. The discovery of the Higgs particle has completed the experimental search for the constituents of the standard model. However, the real nature of this particle is so far unknown and its mass is unnaturally light. Moreover, astronomical observations
5
have revealed that only a small fraction of the matter in the universe consists of the particles of the standard model. It is hence essential to find consistent extensions of this theory. The most promising theoretical concepts for a solution of these open issues are based on addi-tional symmetries, compositeness, or extra dimensions. Our project is related to all of these approaches: in su-persymmetric theories an additional symmetry leads to a natural Higgs sector, in a Technicolour theory the Higgs emerges as a composite state of a new strong dynam-ics, and in gauge theories with extra dimensions the Higgs is protected by the gauge principle of the higher dimensional theory. The extra dimensions are not direct-ly observable since they are compactified and therefore there is only a constraint dynamic in the corresponding direction.
These approaches are based on new theories with strong interactions. Interesting phenomena, like the phase tran-sitions and the bound state spectrum of these theories, are so far not well understood. This project is concerned with these challenging questions.
Supersymmetry is one interesting new concept for the extensions of the standard model, favored by many dif-ferent theoretical considerations. This symmetry con-nects two completely different classes of particles, fermi-ons and bosons. The former class consists of the matter particles, like the electrons, the latter of the mediators of the forces, the gauge bosons, and the Higgs particle. The standard model is extended by the supersymmet-
Figure 1: Simplified picture of the supersymmetric extension of the standard model: the bosonic parti-cles get additional fermonic part-ners and vice versa. In the standard model the interactions between the quarks and leptons are mediated by the gauge bosons: the strong interactions by the gluons, the electromagnetism by the photons, and the weak interactions by the W and Z bosons.

211
The strong interactions beyond the standard model of particle physics
ric partner particles as shown in Figure 1. The extended theory includes a supersymmetric version of the strong interactions of the standard model. The supersymmetric gluodynamics describes the interactions of gluons and their superpartners the gluinos.
Results and Methods
Numerical lattice simulationsDespite the interesting attempts for an analytical un-derstanding of strongly interacting theories, numeri-cal simulations on a discretised space-time, the lattice, are still the only method for an investigation from first principles. Efficient algorithms have been recently devel-oped for the simulations of QCD leading to a remarka-ble agreement between numerical data and experiment. These methods are applied in the investigations of the new strongly interacting theories beyond the standard model of particle physics in our project. In this way two interesting aspects of the theories can be investigated: the bound states and the phase transitions. Large scale computing facilities are essential to perform lattice sim-ulations of QCD. In addition, the considerations of new theories requires a careful tuning of the parameters and advanced methods are needed for the measurements of the relevant observables. We have developed the tools and algorithms for a simulation of these theories, in par-ticular a new program package for the numerical simu-lations.
The particle spectrumAt low energies, the observable particles are bound states of the fundamental gluons and fermionic particles. In su-persymmetric theories these should form multiplets of fermions and bosons with the same mass. We were able to show, for the first time, the expected degeneracy of the non-perturbative particle spectrum in SU(2) super-symmetric Yang-Mills theory [1]. In our newest investiga-tions we have considered also the gauge group SU(3), the same gauge group as in QCD [2].
The phase transitionsAt low temperatures strongly interacting theories are confined, but at high temperatures they behave like a free gas of gluons and fermions, see Figure 2. The decon-finement transition separates these two phases. In ad-dition, the fermions condense at low temperatures. The analysis of these transitions is important to understand
the phenomenological implications of the extensions of the standard model. We have done intense numerical investigations to measure the transition temperatures.
At finite temperature the different nature of fermions and bosons becomes apparent: they obey different sta-tistics and supersymmetry gets broken. In quantum field theory, non-zero temperature is resembled by a compac-tified dimension with different boundary conditions for fermions and bosons. If the same boundary conditions are applied for fermions and bosons, their contributions cancel in the massless limit and the deconfinement tran-sition disappears, as shown in Figure 3. This effect allows a detailed control on the confinement mechanism in this theory and it is, furthermore, an interesting check for the consistency with supersymmetry. We were able to verify if for the first time this effect by numerical simulations [2-4]. It opens the way for new analytic approaches to understand the confinement mechanism [5]. The nu-merical signal for the transition comes form the Polyakov loop, the order parameter of the deconfinement transi-tion. It develops a non-zero expectation value after the
Figure 2: Illustration of the confinement transition in strongly interact-ing theories. The bound states at small temperatures are dissolved into a free gas of fundamental particles at high temperatures.
Figure 3: Theoretical predictions of the different phases in supersym-metric Yang-Mills theory at finite temperature T and at finite compacti-fication radius R. The numerical confirmation of this effect can be found in [3,4].
T
TSYMc
TYMc
m → 0m → ∞
confined
deconfined
m → 0m → ∞
1/R
confined
deconfined

212
High Energy Physics
transition. Figure 4 shows the remarkable difference of the signal for the two different transitions.
Another interesting application of the compactified gauge theories is the Hosotani mechanism. In this mech-anism the Higgs field comes from a compactified higher dimensional gauge dynamics. The compactified theories that we are investigating in our project correspond to the four dimensional counterpart of this mechanism.
On-going Research / Outlook
We have finished the basic determination of the phase transitions and the bound state spectrum supersymmet-ric Yang-Mills theory and related gauge theories. This is just the first investigation of the new physics beyond the standard model of particle physics and we hope to proceed with our studies towards more involved Tech-nicolour candidates, supersymmetric QCD, and extend-ed supersymmetry. A more detailed matching between analytical calculation and the numerical simulations of the compactified supersymmetric Yang-Mills theory is currently under investigation.
References and Links
[1] G. Bergner, P. Giudice, I. Montvay, G. Münster, S. Piemonte, JHEP 1603 (2016) 080.
[2] S. Ali, G. Bergner, H. Gerber, P. Giudice, G. Münster, I. Montvay, S. Piemonte, P. Scior, JHEP 1803 (2018) 113.
[3] G. Bergner, P. Giudice, G. Münster, S. Piemonte, PoS LATTICE 2015 (2016) 239.
[4] G. Bergner, S. Piemonte, JHEP 1412 (2014) 133.[5] G. Bergner, P. Giudice, G. Münster, S. Piemonte, D. Sandbrink, JHEP
1411 (2014) 049.[6] E. Poppitz, T. Schäfer, M. Ünsal, JHEP 1210 (2012) 115.
Figure 4: The order parameter of the deconfinement transition for periodic and antiperiodic fermion boundary conditions. The largest к corresponds to the lowest fermion mass.
5

213
High-loop perturbative computations from lattice QCD
High-loop perturbative computations from lattice QCD
Research InstitutionDESY-ZeuthenPrincipal InvestigatorRainer SommerResearchersMattia Dalla Brida, Martin LüscherProject PartnersUniversita’ di Milano-Bicocca, CERN
SuperMUC Project ID: pr92ci
Introduction
Particle physics is entering a new precision era, with many different experiments eagerly seeking for hints of physics beyond the Standard Model (SM). This incredible experimental effort must necessarily be paired up with an equally remarkable advance in the corresponding the-oretical predictions.
In this context, a precise determination of the funda-mental parameters of QCD as well as the renormaliza-tion of hadronic matrix elements of composite operators, are relevant problems in the phenomenology of the SM.Notably, these require a non-perturbative solution, which is elegantly provided by lattice field theory meth-ods, where QCD is discretized on a space-time lattice and solved by means of numerical simulations.
The strategy relies on the definition of convenient fi-nite-volume renormalization schemes. These schemes are devised in terms of observables defined in a finite (Euclidean) space-time volume, and the renormalization scale is set by the finite extent of the little universe. This allows a step-scaling procedure to be applied, and the change in renormalization scale is determined by per-forming numerical simulations with different volumes. In this way, one is able to determine the scale evolution of these schemes from the low-energy sector of QCD up to high-energy, employing only modest lattice sizes: both statistical and systematic uncertainties can thus be kept under control at all stages of the computation. Once the high-energy regime is reached, perturbation theory (PTh) is used to match the finite-volume schemes to more standard schemes commonly used in phenomenology, such as the MS schemes (see [4] for an introduction).
For the aforementioned strategy to be successful care has to be taken in choosing the finite-volume schemes. Judicious considerations about several technical points led to definitions based on the Schrödinger functional (SF) of QCD. In addition, a new powerful tool has proven to be particularly compelling for these studies, namely the Yang-Mills gradient flow (GF). The GF defines a whole
new class of observables with simple renormalization properties, which can be computed very precisely in lat-tice QCD simulations (cf. ref. [4]).
The calculation of these observables in PTh is however technically challenging. For instance, prior to this project, only lowest-order results were available in finite volume with SF boundary conditions, which did not allow the matching to other schemes to be determined.
Numerical stochastic perturbation theory (NSPT) is a powerful technique that may be applied in this con-text. The aim of this project was to further develop this method and to demonstrate its usefulness by accurately computing some relevant gradient-flow observables to high-loop order.
Methods and Results
MethodsNSPT is an algorithm that solves the lattice theory nu-merically to a given order in the coupling. It is particu-larly suitable for high-order computations, and it allows in principle to circumvent the main difficulties of the standard methods based on Feynman diagrams.
In its original form it consists in solving through Mon-te-Carlo (MC) methods (a discrete version of) the equa-tions of stochastic perturbation theory, as derived from the Langevin equation. In addition, NSPT can be easily implemented for SF schemes and it provides a natural framework for the perturbative computation of GF ob-servables (see [2] for an introduction).
On the other hand, the standard NSPT algorithms suf-fer from several limitations. First of all, these algorithms are not exact: a sequence of simulations with finer and finer discretization of the relevant equations have to be performed in order to extrapolate away the systemat-ic errors in the results. Secondly, similarly to the more standard MC simulations of lattice QCD, the computa-tional effort required for a given (statistical) precision significantly increases towards the continuum limit due

214
High Energy Physics
5
to the rapid increase of autocorrelations in the generat-ed field configurations. As a result, careful and relatively expensive studies have to be conducted in order to relia-bly reach the necessary level of precision for the quanti-ties of interest.
These limitations can substantially be ameliorated by formulating NSPT in terms of other stochastic equations than Langevin, as in particular the stochastic molecular dynamics (SMD) equations. This step allows one indeed to exploit the most recent algorithmic advances in lat-tice QCD in the context of NSPT.
ResultsWe have successfully implemented NSPT based on the SMD equations for the case of the SU(3) Yang-Mills theo-ry, and showed through a highly non-trivial computation that accurate determinations of the perturbation expan-sion of various quantities of interest are technically fea-sible at least up to two-loop order. Specifically, we consid-ered the computation of the two-loop matching between the GF coupling and the MS coupling. The GF coupling is a perfect example of an observable which perturbation expansion is difficult to obtain (cf. Figure 1), while at the same time this should be known precisely in order to be useful for non-perturbative investigations. The results of our calculation, together with the details of both the the-oretical and numerical framework, have been published in [2], and have been also presented at the 34th International Symposium on Lattice Field Theory [3].
The programs used for this project have been specifically written by us, based on the openQCD package developed
at CERN (see [1]). The programs parallelize in 0,1,2,3 or 4 dimensions, depending on what is specified at compila-tion time. They are highly optimized for machines with current Intel or AMD processors, but run correctly on any system that complies with the ISO C89 and the MPI 1.2 standards. The machine-specific optimizations include inline AVX assembly code for multiplications of 3x3 com-plex matrices, which is the by far most frequent elemen-tary operation in these programs. All programs are part of a publicly available package [1].
As in more conventional, non-perturbative, lattice QCD simulations, the results from NSPT are obtained for a finite lattice resolution L/a, where L4 is the space-time volume of the lattice, and a is the lattice spacing. Several lattice resolutions are required to reliably extrapolate the results to the desired continuum limit, a/L → 0. Figure 2, displays the results of the simulations for different lat-tice sizes, and their continuum extrapolation.
On SuperMUC we performed the most expensive simu-lations needed for this project, and hence, the most im-portant ones for obtaining precise results. Specifically, we simulated the largest lattice volumes: 324 and 404 (cf. Figure 2). The former was parallelized using a 4x4x4x4 process grid of 256 cores of SuperMUC Phase 1 Thin Nodes. For the largest lattice, instead, we considered a 4x4x10x10 process grid of 1600 cores. Given the chosen process grids, we could employ all 16 cores of the nodes, thus exploiting efficiently the allocated resources. The programs were compiled using the IBM-MPI implemen-tation, which gave the best performances among the op-tions offered on SuperMUC.
Figure 1: Some of the complicated Feynman diagrams contributing to the GF coupling at two-loops. The curly lines represent valence (blue) and sea (black) gluons, the dashed lines represent ghosts, and the dots are different interaction vertices.

215
High-loop perturbative computations from lattice QCD
On-going Research / Outlook
The project has demonstrated that NSPT is a very pow-erful tool for computing the perturbation expansion of complicated observables to high-loop order, with competitive precision. This project hence firmly sets the theoretical and programming ground for future computations using these methods. The versatility of the methods is such that many renormalization problems in lattice QCD will profit from these devel-opments.
We are currently applying the results obtained for the PTh matching between the GF and MS coupling to a precise non-perturbative determination of the running coupling in the SU(3) Yang-Mills theory. Apart from the theoretical interest of this determination, these results will give us important information on the high-energy behavior of GF couplings. This information is extremely valuable for future high-precision determinations of the QCD coupling along the lines of [4].
References and Links
[1] http://luscher.web.cern.ch/luscher/NSPT/[2] Dalla Brida, Lüscher, Eur.Phys.J. C77 (2017) no.5, 308[3] Dalla Brida, Lüscher, PoS LATTICE2016 (2016) 332[4] Bruno et. al. Phys.Rev.Lett. 119 (2017) no.10, 102001
Figure 2: Continuum limit extrapolations for the one- and two-loop coefficients (upper and lower panel, respectively) of the matching between the GF and MS coupling.


217
Chapter 06 – Life Sciences
Life Sciences

218
Life Sciences
Revealing the mechanism underlying the activation of the insulin receptor
Research Institution1Paul Langerhans Institute of the Helmholtz Zentrum München at the University Hospital and Faculty of Medicine Carl Gustav Carus of TU Dresden; 2German Center for Diabetes Research (DZD)Principal InvestigatorÜnal Coskun1,2
ResearchersIlpo Vattulainen3,4,5; Chetan Poojari3; Theresia Gutmann1,2; Sami Rissanen4; Michal Grzybek1,2; Tomasz Róg3,4
Project Partners3Department of Physics, University of Helsinki; 4Laboratory of Physics, Tampere University of Technology; 5MEMPHYS – Center for Biomembrane Physics
SuperMUC Project ID: pr48ci (Gauss Large Scale project)
Introduction
Diabetes reaches epidemic proportions with a major and growing economic impact on the society. An effective treatment requires atomic-level understanding of how insulin acts on cells.
Cells require insulin to efficiently take up sugar from the blood. Therefore, insulin binds outside the cell to the ec-todomain of its receptor, the so-called insulin receptor (IR), localized in the cell membrane (Fig. 1). Insulin binding induces a structural change in its receptor that is trans-lated across the membrane to the intracellular domains, which then phosphorylate each other and thus initiate signaling cascades. Until very recently, the extent and na-ture of this conformational change was highly debated leading to mutually exclusive models describing recep-tor activation. Owing to its size, localization in the mem-brane, and complex binding characteristics, the insulin receptor is notoriously difficult to study by experimental means. In spite of recent break-throughs showing vari-ous structures of IR [1-4], high-resolution data describing how the transition to the activated state evolves in time are still missing. Molecular dynamics (MD) simulations enable us to study the process of insulin binding to its receptor and the resulting structural changes at atomic scale, thus providing new dynamic perspectives into the receptor’s activation mechanism.
Results and Methods
We applied MD simulations to study structural transi-tions in the insulin receptor ectodomain (IR-ECD) – ini-tially based on crystallographic data that were available at that time (protein database structure entry (PDB) ID: 4ZXB) [2]. The simulated IR ectodomain system consist-ed of about 1 million atoms in a simulation box of 22.4 x 22.4 x 19.9 nm. As interatomic potential functions, we used the allatom OPLS-AA (Optimized Potentials for Liq-uid Simulations) force field for proteins and TIP3P (Trans-ferable Intermolecular Potential with 3 Points) for water.
To rule out force field-dependent effects, we confirmed our observations in tests applying also AMBER (Assisted Model Building with Energy Refinement), an alternative force field, which yielded similar results. Simulations were carried out using the GROMACS simulation pack-age with a time step of 2 fs. For each run, 1,344 cores were used with a performance of about 85 ns/day. The size of the input file used in our simulations was 49 MB. Each simulation run produced 8 files. Except for the trajectory file, the sizes of the files were < 500 MB each. In total about 23 million core hours were used together with 5 TB of storage space reserved for the project.
The IR ectodomain system was successfully modelled and equilibrated in its inactive state (Fig. 2) and thus proved applicable for further studies that include in-sulin. Insulin exhibits complex binding characteristics featuring multivalent binding to the receptor. The hor-mone as well as each IR monomer contains two distinct binding surfaces. Insulin is envisioned to bind its recep-tor at one site first and then – with its second binding site – to bind additionally to the second binding site in the opposing receptor monomer thus establishing a cross-link. The precise mechanism of insulin binding, i.e., where and how it engages its receptor first, the process
6
Figure 1: Two insulin receptors embedded in a membrane. Each receptor consists of two entities (two monomers forming a dimer). Insulin binds outside the cell to the receptor’s ectodomain which leads to a structural change that is propagated across the membrane (green) to the intracel-lular modules that activate each other. © 2018 Chetan Poojari.

219
Revealing the mechanism underlying the activation of the insulin receptor
of cross-linking the receptor halves, and the dynamics of the structural transition have remained elusive to date.
Insulin was docked to the receptor ectodomain in its in-active state based on previous crystallographic data (PDB ID: 4XZB and 4OGA) [2]. It should be emphasized that the insulin/IR-ECD complex simulated here represents presumably only the initial state occurring during the activation process. This complex was found to maintain stable interactions throughout the simulation periods without insulin dissociating from the binding site. Nev-ertheless, we observed only minimal changes within the structure of the IR-ECD.
Conflicting models describing the mechanism under-lying IR activation have been proposed. Very recently, we successfully reconstituted full-length insulin recep-tors in lipid nanodiscs, i.e., small artificial membrane patches, and directly visualized the conformational change in the receptor by single-particle electron microscopy (EM) [1, 3]. This insulin-induced structural change is complex and requires domain rearrange-ments as illustrated in Fig. 3. The insulin-bound IR-ECD conformation obtained further support by cryo-elec-tron microscopy [4]. These recent structures enabled us to update our systems accordingly, but – due to the large extent of structural rearrangements in the receptor – call for longer simulation runs in order to reveal the complete transition.
Ongoing Research / Outlook
Combining electron microscopy data [3,4] with our simu-lation efforts will provide further insights into this acti-vation mechanism. Currently, we are able to model insu-lin-free and insulin-bound IR-ECD complexes, equilibrate their structures, and consider the dynamics of those complexes in the given states, but further simulation studies are required to understand the complete transi-tion into the activated state leading to downstream sig-naling (Fig. 3).
Simulating systems of large size remains a challenging task and was possible here only because of the signifi- cant resources granted by SuperMUC. Before running the production runs, the scaling of the simulation mod-els was carried out on both Phase 1 and Phase 2 clus-ters. The scaling performance improved with Phase 2, thus speeding up the calculations. In production runs, the dynamics of the receptor appeared to be too slow to monitor large structural changes. Thus, simulations at longer time scales (> 20 microseconds) are required to observe the enormous – yet slow – changes reported in experimental studies [3, 4]. The new SuperMUC-NG facility together with its superior architecture over the Phase 2 cluster would aid in performing multiple simu-lations of full-length IR models to characterize the full activation process, and in particular to conduct these simulations in parallel with a single job script without compromising the computing performance. Simula-tions at extended time scales to simulate the activation process are ongoing. Deciphering the complete process
of activation – resolved in space and time – remains of eminent importance to understand insulin action and to develop targeted strategies for treating pathologies such as diabetes.
References and Links
[1] https://tu-dresden.de/med/mf/plid/forschung/Coskun[2] T. I. Croll et al. (2016). Structure 24, 469-476,
doi:10.1016/j.str.2015.12.014.[3] T. Gutmann et al. (2018). J Cell Biol 217, 1643-1649,
doi:10.1083/jcb.201711047.[4] G. Scapin et al. (2018). Nature 556, 122-125,
doi:10.1038/nature26153.
Figure 2: The solvated and ionized insulin receptor ectodomain with one monomer colored in red and the second monomer colored in silver. Na+ and Cl– ions are displayed as orange and yellow spheres, respec- tively. © 2018 Chetan Poojari.
Figure 3: The mechanism underlying insulin receptor activation. 2D class averages of full-length IR embedded in a nanodisc obtained by electron microscopy (top) and corresponding cartoon presentation (bottom) [3].

220
Life Sciences
Structure and Dynamics of Respiratory Complex I
Research InstitutionTechnical University of MunichPrincipal InvestigatorVille R. I. KailaResearchersAndrea Di Luca, Shreyas Supekar, Ana P. Gamiz-Hernandez Project Partners—
SuperMUC Project ID: pr48de
Introduction
Conversion of foodstuff into energy is essential for all liv-ing systems. In eukaryotes, this process takes place in the mitochondria by enzymes of the respiratory chain. Figure 1 shows the largest of those enzymes, complex I or NADH:ubiquinone oxidoreductase, which initiates the cell respiration process in many aerobic organisms. The energy conversion by these respiratory enzymes is achieved by pumping protons across a biological mem-brane. This creates a potential difference across the mem-brane, similar as in a battery, that is used in subsequent
steps to create new molecules that thermodynamically drive other biological processes. Since energy is required to move protons across the membrane, the enzymes of the respiratory chain use a series of exergonic chemical reactions and couple them to the proton translocation.
Complex I employs the energy from the electron transfer (eT) process from NADH to the quinone (Q) to pump four protons (H+) across the membrane. Membrane-embed-ded subunits are responsible for the proton translocation (pT) process, but the mechanism is far from being under-stood. Elucidation of this mechanism is, however, funda-
Figure 1: Crystal structure of respiratory complex I (PDB ID: 4HEA). The hydrophilic and membrane domains are responsible for the electron transfer and proton transfer reactions, respectively. Quinone reduction (modeled in the crystal structure) triggers the proton pump up to ca. 200 Å away from the Q-binding site. Inset: Computationally predicted quinone binding mode near the terminal iron-sulfur cluster N2.
6

221
Structure and Dynamics of Respiratory Complex I
mental for understanding the molecular principles that nature uses to convert energy. Moreover, understanding the function of complex I has also important biomedi-cal implications, as many mutations in this enzyme are linked to human mitochondrial disorders. This research project focused on how the movement of electrons from NADH to the Q site leads to formation of quinol (QH2), and how this chemical process triggers proton pumping across the membrane (see Fig. 1).
Results and Methods
With our simulations performed at the HPC Supermuc, we elucidated several unclear mechanistic aspects of complex I that are essential for understanding key steps involved in activation of the pumping machinery.
Complex I uses quinone (Q) as a substrate, which reacts to quinol (QH2) in a long, ca. 30-40 Å, protein cavity. We identified that the Q molecule can bind in both stacked and hydrogen-bonded binding modes with nearby resi-dues, which in turn modulate the electron transfer rate (2). We also observed that the first electron transfer step is not coupled to proton transfer, whereas the second electron transfer steps leads to transfer of two protons from nearby residues (Fig. 2).
By modeling the Q molecule in the protein cavity, we found possible molecular reasons why complex I has a preference for long-tailed quinone substrates. These sim-ulations also highlighted important structural regions, which are essential for protein function (3). To this end, our simulations showed that complex I is likely to employ a series of charged amino acids to transmit the “signal” up to 200 Å from the Q reaction site to achieve proton pumping. We observed putative pathways necessary to transfer protons across the membrane, and showed that these form at symmetry-related positions in the mem-brane domain of complex I (4).
The simulations also allowed us to compare the bacterial and complex mammalian enzyme motions, and connect them to recently resolved cryo-EM structures. Interest-ingly, the simulations showed that the motions in the
two enzyme “versions” are similar, but not identical, and that the mammalian enzyme is likely to dynamically sample the so-called active and deactive forms of com-plex I. These findings more generally show how low-fre-quency motions in enzymes might be linked to the en-zyme functions (5).
To elucidate the proton pumping mechanism, we em-ployed long time-scale classical molecular dynamic sim-ulations. The microsecond-timescale simulations were necessary to observe channel opening. The systems, com-prising ~1 million atoms, were simulated with NAMD2, a highly parallelized code scaling up to 512 nodes (8192 pro-cessors). The entire project used 32 million CPU-hours. A total of ~10 TB of data was generated and stored in the project directories, and was then used for analysis.
On-going Research / Outlook
The HPC offered by Supermuc played a crucial role in the realization of this challenging, but highly success-ful project. The Supermuc offered unique resources that enabled our large-scale simulations that provid-ed an essential step to derive the mechanistic models. The current data produced with Supermuc was key for our publications (2-5) and gave us new data used for the continuation of our research. Currently we have started a new Supermuc project with exciting follow-ups from the current project.
References and Links
1. http://villekaila.wordpress.com/.2. Gamiz-Hernandez AP, Jussupow A, Johansson MP, Kaila VRI (2017)
Terminal Electron–Proton Transfer Dynamics in the Quinone Re-duction of Respiratory Complex I. J Am Chem Soc 139:16282-16286.
3. Fedor JG, Jones AJY, Di Luca A, Kaila VRI, Hirst J (2017) Correlating kinetic and structural data on ubiquinone binding and reduction by respiratory complex I. Proc Natl Acad Sci 114:12737-12742.
4. Di Luca A, Gamiz-Hernandez AP, Kaila VRI (2017) Symmetry-related Proton Transfer Pathways in Respiratory Complex I. Proc Natl Acad Sci 114:E6314-E6321.
5. Di Luca A, Kaila VRI (2018) Global collective motions in the mam-malian and bacterial respiratory complex I. Biochim Biophys Acta - Bioenergetics 1859:326-332.
Figure 3: Antiporter-like subunits symmetry is reflected in the proton pathway formation across the membrane. Here the two symmetry-re-lated channels are shown in orange and green (4).
Figure 2: Process of quinone reduction. Once semiquinone (SQ) is formed, the second electron moves from the iron-sulfur cluster, N2, and couples with proton transfer from nearby residues leading to formation of QH–/ QH2.

222
Life Sciences
Substrates of Intramembrane Proteases: I Like to Move it, Move it!
Research InstitutionPhysics of Synthetic Biological Systems (TUM) and Chemistry of Biopolymers (WZW TUM)Principal InvestigatorChristina ScharnaglResearchersAlexander Götz, Simon MenigProject Partners—
SuperMUC Project ID: pr48ko (Gauss Large Scale project), pr92so
Introduction
Intramembrane proteases control the activity of mem-brane proteins and occur in all organisms. A prime ex-ample is γ-secretase (GSEC), cleaving the amyloid pre-cursor protein (APP), whose misprocessing is related to onset and progression of Alzheimer’s disease (AD). Since a protease’s biological function depends on its substrate spectrum, it is essential to study the repertoire of natu-ral substrates as well as determinants and mechanisms of substrate recognition and cleavage. This is the aim of a collaborative research project [1] (FOR2290, DFG For-schergruppe ”Understanding intramembrane proteoly-sis”, Figure 1). Conformational flexibility of substrate and enzyme plays here an essential role for recognition, com-plex formation and subsequent relaxation steps leading to cleavage and product release [1,2].
Results and Methods
To uncover functional dynamics of substrates, we employ multi-scale molecular dynamic (MD) approaches that span a range of time and spatial scales. Simulations at at-omistic (AT) resolution (CHARMM36 force field, mackerell.umaryland.edu) are used to analyze key aspects of struc-
ture and conformational dynamics (pr48ko) in the micro-second range. Coarse-grained (CG) models (MARTINI force field, cgmartini.nl) provide the long simulation times and large number of replicas required for a reliable prediction of substrate-enzyme contacts (pr92so). The applied sim-ulation codes, NAMD2.12 (ks.uiuc.edu) and GROMACS5.1 (gromacs.org), are known to be highly scalable on the Su-perMUC. Our in silico modeling approach closely connects with the in vitro investigations in order to interpret and guide the experiments, and to validate the simulations.
GSEC cleaves an array of over 90 diverse membrane pro-teins without showing preferences for specific sequence motifs. As cleavage occurs in the helical transmembrane domain (TMD) of the substrates, the relevance of structur-al and dynamical features of the substrate’s TMD itself for processing seems obvious. We used AT MD simulations to investigate, whether TMDs of substrates join a common intrinsic conformational dynamics differing from the dy-namics of non-substrates and disease mutants. Simula-tions of 2 μs length have been performed for TMD model peptides (i) in a bilayer of POPC lipids (~42000 atoms), and (ii) in the low-dielectric 2,2,2-trifluoroethanol containing 20 vol-% water (~28000 atoms) mimicking the interior of the enzyme. Using the Sandy-Bridge architecture and 528 cores, we obtained 75 ns/day and 90 ns/day, respectively. The comparison with the results from enhanced sampling (78 runs, aggregate time 15.6 μs) for four TMDs revealed reproducibility of the results from the 2 μs simulations. To our knowledge, the data collected for 50 TMDs builds the largest database of atomistic MD simulations in the mi-crosecond range. For a subset of model peptides, CG sim-ulations were necessary to determine the impact of the crowed membrane environment used for the solid state NMR experiments (100 peptides, 3000 lipids, 35 water molecules per lipid, 150 μs simulation time, 10 μs/day us-ing Intel-MPI with 700 cores on the Sandy-Bridge nodes). In total, the built-up of the database consumed 45 million core-hours and occupies ~50 TB of disk space.
The challenge was to identify features which provide both, characterization and discrimination of conforma-tional dynamics with high significance. To meet this
6
Figure 1: Defining repertoire and molecular architecture of substrates of intramembrane proteases ([1]). The insert shows an overlay of 150 MD structures of the membrane-spanning domain of APP .
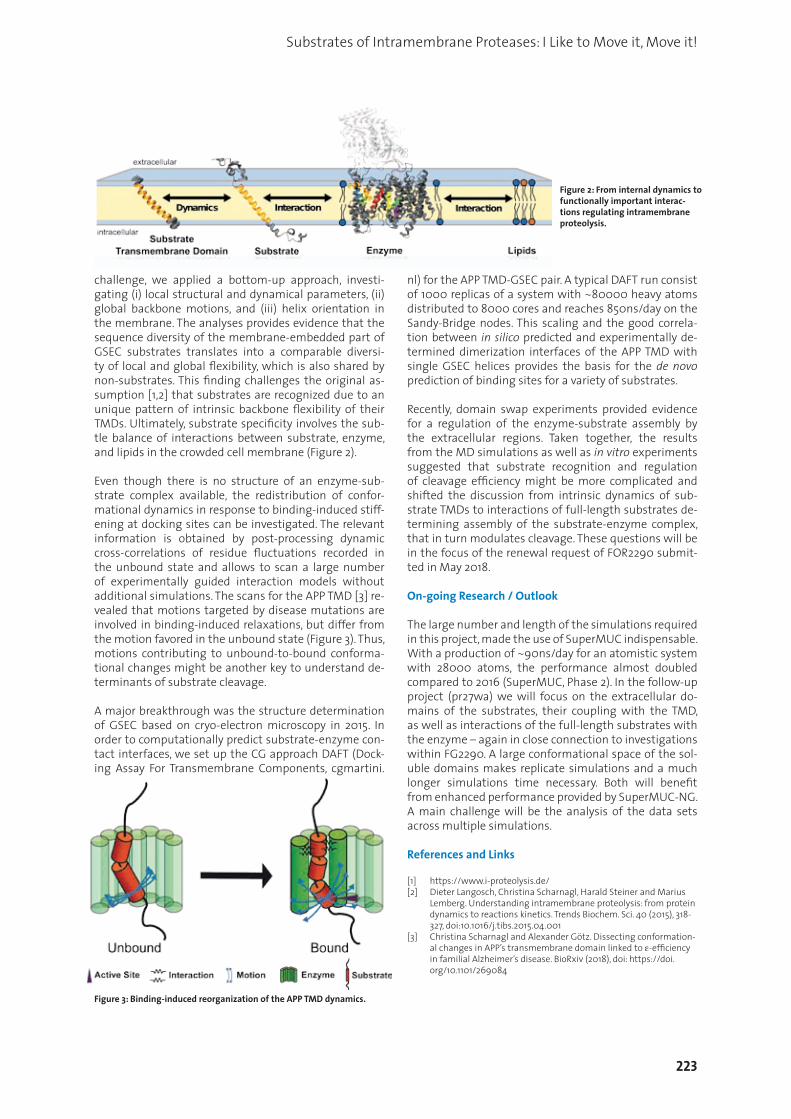
223
Substrates of Intramembrane Proteases: I Like to Move it, Move it!
challenge, we applied a bottom-up approach, investi-gating (i) local structural and dynamical parameters, (ii) global backbone motions, and (iii) helix orientation in the membrane. The analyses provides evidence that the sequence diversity of the membrane-embedded part of GSEC substrates translates into a comparable diversi-ty of local and global flexibility, which is also shared by non-substrates. This finding challenges the original as-sumption [1,2] that substrates are recognized due to an unique pattern of intrinsic backbone flexibility of their TMDs. Ultimately, substrate specificity involves the sub-tle balance of interactions between substrate, enzyme, and lipids in the crowded cell membrane (Figure 2).
Even though there is no structure of an enzyme-sub-strate complex available, the redistribution of confor-mational dynamics in response to binding-induced stiff-ening at docking sites can be investigated. The relevant information is obtained by post-processing dynamic cross-correlations of residue fluctuations recorded in the unbound state and allows to scan a large number of experimentally guided interaction models without additional simulations. The scans for the APP TMD [3] re-vealed that motions targeted by disease mutations are involved in binding-induced relaxations, but differ from the motion favored in the unbound state (Figure 3). Thus, motions contributing to unbound-to-bound conforma-tional changes might be another key to understand de-terminants of substrate cleavage.
A major breakthrough was the structure determination of GSEC based on cryo-electron microscopy in 2015. In order to computationally predict substrate-enzyme con-tact interfaces, we set up the CG approach DAFT (Dock-ing Assay For Transmembrane Components, cgmartini.
nl) for the APP TMD-GSEC pair. A typical DAFT run consist of 1000 replicas of a system with ~80000 heavy atoms distributed to 8000 cores and reaches 850ns/day on the Sandy-Bridge nodes. This scaling and the good correla-tion between in silico predicted and experimentally de-termined dimerization interfaces of the APP TMD with single GSEC helices provides the basis for the de novo prediction of binding sites for a variety of substrates.
Recently, domain swap experiments provided evidence for a regulation of the enzyme-substrate assembly by the extracellular regions. Taken together, the results from the MD simulations as well as in vitro experiments suggested that substrate recognition and regulation of cleavage efficiency might be more complicated and shifted the discussion from intrinsic dynamics of sub-strate TMDs to interactions of full-length substrates de-termining assembly of the substrate-enzyme complex, that in turn modulates cleavage. These questions will be in the focus of the renewal request of FOR2290 submit-ted in May 2018.
On-going Research / Outlook
The large number and length of the simulations required in this project, made the use of SuperMUC indispensable. With a production of ~90ns/day for an atomistic system with 28000 atoms, the performance almost doubled compared to 2016 (SuperMUC, Phase 2). In the follow-up project (pr27wa) we will focus on the extracellular do-mains of the substrates, their coupling with the TMD, as well as interactions of the full-length substrates with the enzyme – again in close connection to investigations within FG2290. A large conformational space of the sol-uble domains makes replicate simulations and a much longer simulations time necessary. Both will benefit from enhanced performance provided by SuperMUC-NG. A main challenge will be the analysis of the data sets across multiple simulations.
References and Links
[1] https://www.i-proteolysis.de/[2] Dieter Langosch, Christina Scharnagl, Harald Steiner and Marius
Lemberg. Understanding intramembrane proteolysis: from protein dynamics to reactions kinetics. Trends Biochem. Sci. 40 (2015), 318-327, doi:10.1016/j.tibs.2015.04.001
[3] Christina Scharnagl and Alexander Götz. Dissecting conformation-al changes in APP’s transmembrane domain linked to ε-efficiency in familial Alzheimer’s disease. BioRxiv (2018), doi: https://doi.org/10.1101/269084
Figure 2: From internal dynamics to functionally important interac-tions regulating intramembrane proteolysis.
Figure 3: Binding-induced reorganization of the APP TMD dynamics.

224
Life Sciences
Conductance mechanism of the membrane channel GLIC upon opening and closing
Research InstitutionMax Planck Institute for Biophysical Chemistry, Göttingen (Germany)Principal InvestigatorHelmut GrubmüllerResearchersCarsten Kutzner, R. Thomas Ullmann, Helmut GrubmüllerProject Partners—
SuperMUC Project ID: pr48pa (Gauss Large Scale project)
Introduction
All living organisms are made of cells. Cells separate their interior from the exterior environment by the cell wall, the so-called plasma membrane. Embedded in this membrane are (among many other functional proteins) various channel proteins that control what goes in and out of the cell. A channel protein acts as gate and gate-keeper rolled into one: Depending on its type it will only let specific molecules pass when it is open. The so-called aquaporins for example let only water molecules pass; another important type of channels control the influx and efflux of ions and are therefore called ion chan-nels. These are fundamental to all living beings as they maintain vital electrochemical gradients across the cell membrane and enable electrical signaling across cells. Key characteristics of ion channel function that can be measured experimentally are ion permeation rates and selectivities, i.e. preferences for types of ions.
A particular group of ion channels with very interesting properties are the pentameric ligand-gated ion chan-nels (pLGICs). They play a key role for fast synaptic signal transduction in brain and muscle and are, as the name suggests, composed of five similar (or identical) subunits. As illustrated in Fig. 1 (left), they consist of a large extracel-lular domain (ECD) and a somewhat smaller transmem-brane domain (TMD), which includes the channel’s pore. While pLGICs remain closed in their resting state, they can be activated by binding of small molecules (ligands) to the ECD. An intriguing property of pLGICs is that ligand bind-ing at the exterior side leads to structural rearrangements that propagate through the channel to the remote TMD, where they trigger pore opening (Fig. 1). This strong cou-pling between ligand binding and pore opening seems to be the universal gating mechanism in all pLGICs.
In this project, the scientists want to shed light on this intricate gating mechanism by characterizing and ex-
6
Figure 1: Sketch of the proton (H+) activated gating mechanism of a pentameric ligand-gated ion chan-nel. Left: Lowering of the extracellu-lar pH leads to a protonation of the ECD. This in turn triggers a cascade of structural rearrangements that ultimately induce opening (right) of the membrane-embedded pore (yellow).
pore closed pore open
top view
side view
TMD
H+
membrane
H+
ECDstructural
rearrange-ments
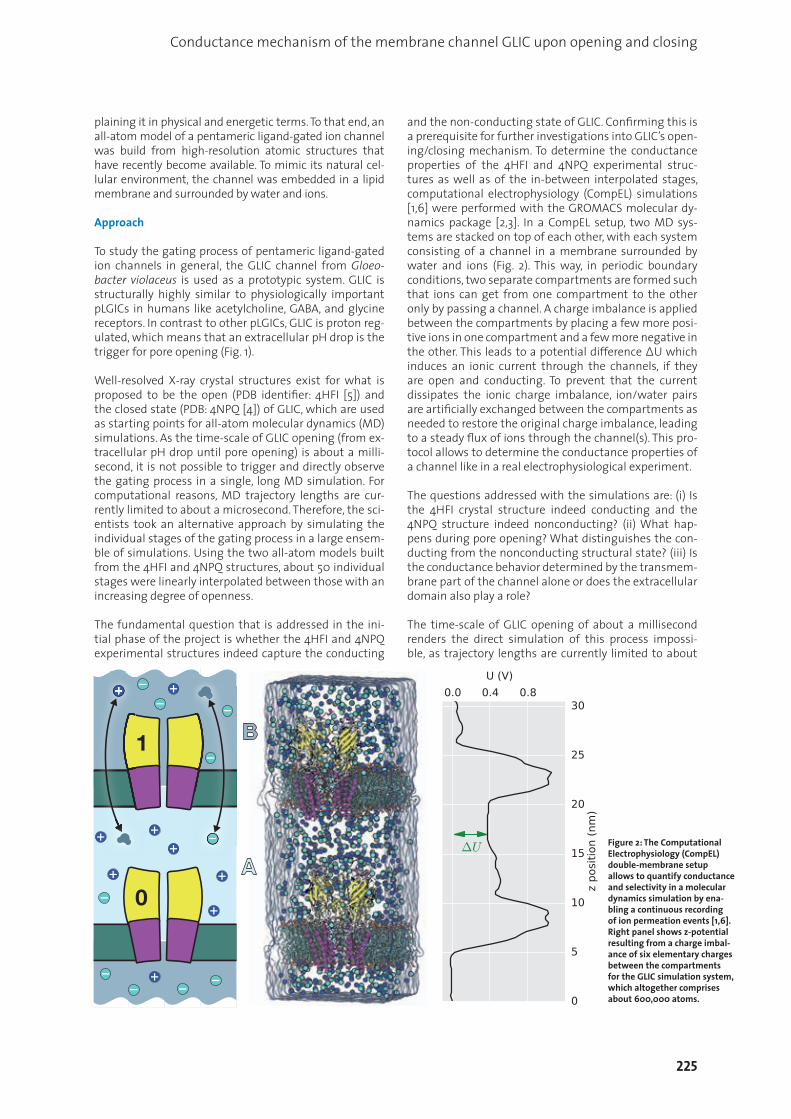
225
Conductance mechanism of the membrane channel GLIC upon opening and closing
plaining it in physical and energetic terms. To that end, an all-atom model of a pentameric ligand-gated ion channel was build from high-resolution atomic structures that have recently become available. To mimic its natural cel-lular environment, the channel was embedded in a lipid membrane and surrounded by water and ions.
Approach
To study the gating process of pentameric ligand-gated ion channels in general, the GLIC channel from Gloeo-bacter violaceus is used as a prototypic system. GLIC is structurally highly similar to physiologically important pLGICs in humans like acetylcholine, GABA, and glycine receptors. In contrast to other pLGICs, GLIC is proton reg-ulated, which means that an extracellular pH drop is the trigger for pore opening (Fig. 1).
Well-resolved X-ray crystal structures exist for what is proposed to be the open (PDB identifier: 4HFI [5]) and the closed state (PDB: 4NPQ [4]) of GLIC, which are used as starting points for all-atom molecular dynamics (MD) simulations. As the time-scale of GLIC opening (from ex-tracellular pH drop until pore opening) is about a milli-second, it is not possible to trigger and directly observe the gating process in a single, long MD simulation. For computational reasons, MD trajectory lengths are cur-rently limited to about a microsecond. Therefore, the sci-entists took an alternative approach by simulating the individual stages of the gating process in a large ensem-ble of simulations. Using the two all-atom models built from the 4HFI and 4NPQ structures, about 50 individual stages were linearly interpolated between those with an increasing degree of openness.
The fundamental question that is addressed in the ini-tial phase of the project is whether the 4HFI and 4NPQ experimental structures indeed capture the conducting
and the non-conducting state of GLIC. Confirming this is a prerequisite for further investigations into GLIC’s open-ing/closing mechanism. To determine the conductance properties of the 4HFI and 4NPQ experimental struc-tures as well as of the in-between interpolated stages, computational electrophysiology (CompEL) simulations [1,6] were performed with the GROMACS molecular dy-namics package [2,3]. In a CompEL setup, two MD sys-tems are stacked on top of each other, with each system consisting of a channel in a membrane surrounded by water and ions (Fig. 2). This way, in periodic boundary conditions, two separate compartments are formed such that ions can get from one compartment to the other only by passing a channel. A charge imbalance is applied between the compartments by placing a few more posi-tive ions in one compartment and a few more negative in the other. This leads to a potential difference ΔU which induces an ionic current through the channels, if they are open and conducting. To prevent that the current dissipates the ionic charge imbalance, ion/water pairs are artificially exchanged between the compartments as needed to restore the original charge imbalance, leading to a steady flux of ions through the channel(s). This pro-tocol allows to determine the conductance properties of a channel like in a real electrophysiological experiment.
The questions addressed with the simulations are: (i) Is the 4HFI crystal structure indeed conducting and the 4NPQ structure indeed nonconducting? (ii) What hap-pens during pore opening? What distinguishes the con-ducting from the nonconducting structural state? (iii) Is the conductance behavior determined by the transmem-brane part of the channel alone or does the extracellular domain also play a role?
The time-scale of GLIC opening of about a millisecond renders the direct simulation of this process impossi-ble, as trajectory lengths are currently limited to about
Figure 2: The Computational Electrophysiology (CompEL) double-membrane setup allows to quantify conductance and selectivity in a molecular dynamics simulation by ena-bling a continuous recording of ion permeation events [1,6]. Right panel shows z-potential resulting from a charge imbal-ance of six elementary charges between the compartments for the GLIC simulation system, which altogether comprises about 600,000 atoms.
B
A
1
0

226
Life Sciences
6
a microsecond due to computational reasons. This to-gether with the fact that the pLGICs are rather large pro-teins (the complete simulation system comprises about 600,000 particles) makes this project extraordinarily challenging and only feasible on HPC resources like Su-perMUC.
Work Completed:
To address the above questions, the scientists have de-termined the ionic conductivity of the GLIC channel for 50 stages along the opening coordinate in CompEL set-ups. MD simulations were carried out both for the whole channel as well as just for the transmembrane part, to study the effect of the extracellular domain.
The simulations clearly established that the 4NPQ struc-ture is nonconducting and that the 4HFI structure is conducting sodium ions (top panel of Fig. 3). The 4HFI conductivity calculated from the simulations lies in the low pS range and is thus compatible with experimental results (yellow region in Fig. 3).
Moving from left to right in Fig. 3 is equivalent to moving through the stages the channels visits in its opening mo-tion. During the transition from closed to open, conduc-tivity sets in at the same time as the pore fills with water (see left scale of Fig. 3). The more water is in the pore, the higher the conductivity gets.
The scientists could also determine that the transmem-brane part of the GLIC channel alone (without the large extracellular domain attached) shows a similar conduct-ance behavior, however the conductivities are generally smaller and set in later in the opening process (bottom panel of Fig. 3). This indicates that the extracellular part also modifies the conductance behavior of the pore.
Although the simulations themselves are now success-fully completed, the scientists are still a long way from concluding their research. The data generated by the sim-ulations still needs to be thoroughly evaluated and inter-preted. It forms the basis for further research into the mo-lecular mechanism and the gating behavior of GLIC and pentameric ligand-gated ion channels in general.
References:
[1] Kutzner, C.; Köpfer, D.; Machtens, J. P.; de Groot, B. L.; Song, C.; Zacha-riae, U.: Insights into the function of ion channels by computation-al electrophysiology simulations. Biochimica et Biophysica Acta – Biomembranes 1858 (7, B), pp. 1741 – 1752 (2016)
[2] Páll, S.; Abraham, M. J.; Kutzner, C.; Hess, B.; Lindahl, E.: Tackling exascale software challenges in molecular dynamics simulations with GROMACS. In: Solving Software Challenges for Exascale: Inter-national Conference on Exascale Applications and Software, EASC 2014, Stockholm, Sweden, April 2-3, 2014, Revised Selected Papers, pp. 3 – 27 (Eds. Markidis, S.; Laure, E.). Springer, Cham (2015)
[3] Kutzner, C.; Apostolov, R.; Hess, B.; Grubmüller, H.: Scaling of the GROMACS 4.6 molecular dynamics code on SuperMUC. In: Parallel Computing: Accelerating Computational Science and Engineering (CSE), pp. 722 – 730 (Eds. Bader, M.; Bode, A.; Bungartz, H. J.). IOS Press, Amsterdam (2014)
[4] Sauguet, L.; Shahsavar, A.; Poitevin, F.; Huon, C.; Menny, A.; Nemecz, A. Haouz, A.; Changeux, J.-P.; Corringer, P.-J.; Delarue, M.: Crystal structures of a pentameric ligand-gated ion channel provide a mechanism for activation. PNAS 111, 966-971 (2014)
[5] Sauguet, L.; Poitevin, F.; Murail, S.; van Renterghem, C.; Moraga-Cid, G.; Malherbe, L.; Thompson, A. W.; Koehl, P.; Corringer, P.-J.; Baaden, M.; Delarue, M.: Structural basis for ion permeation mechanism in pentameric ligand-gated ion channels. EMBO J. 32, 728-741 (2013)
[6] Kutzner, C.; Grubmüller, H.; de Groot, B. L.; Zachariae, U.: Computa-tional Electrophysiology: The molecular dynamics of ion channel Permeation and selectivity in atomistic detail. Biophys. J. 101 (4), pp. 809 – 817 (2011)
Figure 3: Pore hydration is a prerequisite for GLIC conductance. Both GLIC models are non-conducting at the closed position 4NPQ. When approaching the open position 4HFI, first the pore becomes hydrated (blue, left scale), then ion conduction sets in (black, right scale).
Right scale: Conductance determined from the ion permeation events in the simulations. Experimental values for the GLIC single-channel conductance are 6–10 pS (yellow horizontal bar).
Left scale: Number of water molecules in the upper part of the pore (yellow region in Fig. 1).
227
Predictive Mechanistic Models in Support of Drug Discovery and Personalised Medicine
Computational Biomedicine: Predictive Mechanistic Models
in Support of Drug Discovery and Personalised MedicineResearch InstitutionLudwig Maximillian University, Munich (LMU)Principal InvestigatorDieter KranzlmüllerResearchersPeter Coveney, Shunzhou Wan, David Wright, Agastya Bhati, Fouad HusseiniProject PartnersUCL, London; LRZ, Munich
SuperMUC Project ID: pr53zu
Introduction
Our current project [1] aims to develop high fidelity, compu-tationally based, predictive mechanistic models of biome- dical systems which can be applied in support of drug dis-covery and personalised medicine utilizing today’s top-level computational infrastructure. In the project, we investigate the robust application of free energy approaches in these two areas within a computing infrastructure of the highest performance. Therefore, this project will not only advance the particular fields in focus, but will lead to improved and novel insights for the operation of HPC machines at unprece- dented levels, thereby serving as a lighthouse model for other domains. The theme of the project is gaining insight into the binding properties of proteins which represent key classes of drug target in important disease cases.
Over the past few years, we have uncovered and developed two new ways of calculating the free energy of binding of ligands to proteins. One is ESMACS (enhanced sampling of molecular dynamics with assumption of continuum solvent) [2]; the other is TIES (thermodynamic integration with en-hanced sampling) [3]. We also investigate new approaches to enhance sampling and for more precise free energy esti-mations in an extension of the BAC workflow environment; the approaches include the most popular Hamiltonian- replica exchange (H-REMD) and its variants – replica ex-change with solute tempering (REST2) and free energy per-turbation with REST2 (FEP/REST2).
All of the above approaches we are using are ensemble based, which emphasise the theoretical necessity of invoking ensemble methods [4], which address a fundamental prin-ciple in using microscopic modelling methods to compute thermodynamic quantities: statistical mechanics mandates the calculation of the latter from ensemble averages of the former. They make use of ensemble averaging and recognise the Gaussian random process nature of MD trajectories.
For successful uptake in drug design and discovery, reliable predictions of binding affinities need to be made on time scales which influence experimental programmes. For ap-plications in personalized medicine, the selection of suitable drugs needs to be made within a few hours to influence cli-
nical decision making. Therefore, speed is of the essence if we wish to use free energy based calculation methods in these areas. To perform modelling and calculation with optimal efficiency, we have developed the Binding Affinity Calculator (BAC) [5], a highly automated molecular simulation based free energy calculation workflow tool. BAC has considerable potential for uptake in the pharmaceutical industry for drug design and discovery, and in the more forward-looking field of personalized medicine for drug selection in a clinical con-text. We also developed a High Throughput Binding Affinity Calculator (HTBAC), which builds upon the RADICAL Cyber-tools, as the framework solution to support the coordination of the required scale of computations, thereby allowing us to employ thousands of cores at a time. With the automation workflow and the availability of high performance comput-ers like SuperMUC, we have applied ESMACS and TIES ap-proaches to over 20 different sets of compounds and protein targets, of which many have been performed within this pro-ject thanks to the substantial allocation of cycles awarded; these are listed in the following Results and Methods section.
Results and Methods
The underlying computational method is based on classical molecular dynamics (MD). We have found that an ensem-ble consisting of ca 25 replicas for ESMACS study [2], and an ensemble of a minimum of 5 replicas for TIES study [3] are required per free energy calculation in order to guarantee reproducibility of predictions. On multicore machines such as SuperMUC, this plays into our hands because, in the time it takes to perform one such calculation, all of the members of an ensemble can be computed. The method is therefore fast, with free energies being determined within around 12 hours. Considerable automation is necessary to perform these calculations, which consist of a large number of steps, including model building, production MD and data analytics performed on the resulting trajectory files, all on SuperMUC. Its execution is much faster and more error-proof when per-formed in an automated fashion which we have implement-ed by a judicious combination of BAC [5] and RADICAL-Cyber-tools, the HTBAC.
We have made very important progress in our research this year. We have been able to produce rapid, reliable, accurate

228
Life Sciences
and precise predictions of binding free energies using both ESMACS and TIES. We are able to quantify the uncertainties in the predicted free energies with our ensemble-based ap-proaches. Studies of some of the molecular systems have been completed and results published [6], others are either at the post-processing stage or at earlier stages where more simulations and calculations are required. Our predictions from ensemble simulations, some of them performed blind-ly, are in good agreement with experimental findings. Our findings have demonstrated that this approach is able to de-liver an accurate ranking of ligand binding affinities quickly and reproducibly.
With the resource allocation in the current project, we have an extensive investigation of uncertainty quantification from alchemical free energy approaches [6], in which a few protein systems have been studied, including thrombin, bromodomain-containing protein 4 (BRD4), and fibroblast growth factor receptor 1 (FGFR1). The proteins belong to dif-ferent classes, complexed with a set of diverse ligands; the molecular systems are chosen in the study to exhibit the wide applicability of the methods we are using, and the es-sential of uncertainty quantification in the calculations. In the study, we have applied different schemes to study the ef-fects of conformational samplings and the use of free energy estimator on the accuracy and precision of the final results. Our study shows that the results from ensemble approaches are accurate and precise for a range of ligand-protein com-plexes and the schemes have a built-in mechanism to con-trol errors [6].
We have been performing ensemble simulations for a more complicated molecular system, G-protein coupled receptors (GPCRs) complexed with a series of ligands and embedded in a solvent and lipid environment. Our preliminary results are very encouraging: we have successfully computed the binding free energies using TIES and ESMACS. The results show that TIES is a powerful method capable of accurately transform-ing neutral ligands and is possible to employ for other GPCR systems or complex systems. The binding free energies from ESMACS shows that ligands can be investigated from two angles, ligand class and selectivity; both of which give a story regarding conformational dynamics.
We also investigate the potential profile along the binding path of ligand into the binding site of GPCR using a meta-dynamics approach. The metadynamics samples large scale conformational changes and calculates the free-energy sur-faces along a given reaction coordinate, the binding path here. We are comparing the difference of two members of GPCR family, which bind with a same ligand with different kinetic and thermodynamic properties. Drug selectivity for different protein targets will be studied here using both the metadynamics and the free energy calculations.
We are also applying TIES to another case where protein mu-tations are introduced. Such a study is directly related to per-sonal medicine where drugs are selected for a given patient based on their genetic profile. This is because mutations usu-ally affect drug efficacy as they change the binding affinity of drugs with their target protein, or change the activation of the target protein, or both. Our binding affinity calculator is capable to predict the changes of binding affinities upon
mutations. We have extended our TIES approach, named as TIES-PM (protein mutation). The combination of ensemble- based TIES-PM with REST2 is able to sample relatively large comformational changes which cannot be sampled using normal TIES within a reasonable time scale.
On SuperMUC, we have been using NAMD and AmberTools packages for ensemble simulations of biological systems of interest. A typical calculation requires ca 9,800 cores using ESMACS and ca 12,740 cores using TIES. We can fill up a sin-gle phase of the machine (i.e. using ca 160,000 cores) and compute ca 16 binding affinities using ESMACS; or ca 12 rel-ative free energies using TIES, within the space of 12 hours in each case; and double this turn around if we also make use of both phases of SuperMUC, as we did two years ago on SuperMUC with a Giant Workflow. So far more than 20 mil-lion CPU hours have been consumed in this project.
On-going Research / Outlook
There are some on-going studies currently using the alloca-tions from this project, including the simulations of GPCRs and the TIES-PM simulations listed in the above section. There are some other activities at different completion stag-es; except the GPCR systems, we are mainly focusing an- other distinct target class: immunological complexes; These includes peptide-major histocompatibility complex (pMHC) and T-cell receptor-pMHC (TCR-pMHC) studies. The compu-tational objective is to quantitatively predict the binding affinities and residence times of peptides to MHC, pMHCs to TCR, together with the residence time of peptide in MHC.We have performed some of the (TCR-)pMHC systems. The immunology complexes are more complicit than the small molecule-protein systems we have studied, as they involve protein-protein interactions and large scale conformation changes. All these will require longer simulation time and more number of replicas for accurate and precise binding free energy estimations.
We have just got a large dataset of ligand-protein systems from Janssen Research and Development, Belgium, a part-ner in the CompBioMed. Extensive simulations of ESMACS studies will be performed for the entire dataset, and some selected ligands for TIES simulations where applicable. This study will be directly related to a drug development area where binding affinities can be made in blind and insights can be provided on how to optimise a ligand, a key process in the hit to lead and lead optimization steps of drug discovery.
We plan to use the remaining allocation of CPU time in the following year to complete all of the remaining studies and the new planned study on Janssen dataset as listed above. Workflows including but not limited to ensemble simulations will be required for all of these calculations. The ensemble- based calculations make optimal use of SuperMUC Next Generation (SuperMUC-NG).
References and Links
[1] http://ccs.chem.ucl.ac.uk/supermuc[2] S. Wan, B. Knapp, D. Wright, C. Deane, P. V. Coveney, J. Chem. Theory Comput., 11 (7),
3346-3356 (2015)[3] A. Bhati, S. Wan, D. Wright, P. V. Coveney, J. Chem. Theory Comput., 13 (1), 210–222 (2017)[4] P. V. Coveney and S. Wan, Phys. Chem. Chem. Phys., 2016, 18, 30236-30240,[5] S. Sadiq, D. Wright, S. Watson, S. Zasada, I. Stoica, P. Coveney. 2008. J. Chem. Inf. Model.
48, 1909-19.[6] A. Bhati, S. Wan, Y. Hu, B. Sherborne, P. V. Coveney, “Uncertainty Quantification in
Alchemical Free Energy Methods”, Journal of Chemical Theory and Computation, In Press (2018), DOI: 10.1021/acs.jctc.7b01143
6

229
Conformational dynamics in Alzheimer peptide formation and amyloid aggregation
Conformational dynamics in Alzheimer peptide formation and amyloid aggregation
Research InstitutionLehrstuhl für Molekulardynamik, Physik-Department T38, TU MünchenPrincipal InvestigatorMartin ZachariasResearchersChristina Frost, Manuel Hitzenberger, Jonathan Coles, Danial Pourjafar Dehkordi, Julian Hartmann, Florian Kandzia, Korbinian Liebl, Asman Nayis, Maria Reif, Till Siebenmorgen, Paul WestphälingerProject PartnersAliaksei Krukau, Gerald Matthias, Leibniz-Rechenzentrum, München
SuperMUC Project ID: pr48po
Introduction
Self-assembly of peptides into ordered amyloid fibrils is associated with several neurodegenerative diseases in-cluding Alzheimer’s disease. The key component of the pathological aggregates in case of Alzheimer’s disease is the so-called Aβ peptide resulting from the cleavage of the amyloid precursor protein by the intra-membrane γ-secretase enzyme. The primary function of the enzyme is the proteolytic degradation of membrane proteins. Re-cently, the structure of γ-secretase has been determined [1] which gives important insights into the complex structural arrangement of several subunits forming the active enzyme. The enzyme active site is localized in the membrane spanning presenilin subunit. The enzyme un-dergoes important conformational changes during the proteolytic reaction cycle. A full understanding of the enzyme function and the design of inhibitors for inter-fering with Aβ peptide generation and amyloid forma-tion requires also an understanding of the enzyme con-formational flexibility. To elucidate the local and global dynamics of the large γ-secretase complex we have em-ployed extensive molecular dynamics (MD) simulations of γ-secretase using the SuperMUC parallel computer resources. In a parallel study we have also used exten-sive MD-simulations combined with advanced sampling techniques to study the amyloid propagation and nu-cleation processes at atomic detail. The results of the studies give important insights into the mechanism of amyloid peptide production and the process of peptide aggregation to form pathological amyloids.
Results and Methods
Dynamics of γ-secretase in a phospholipid membraneThe simulations on γ-secretase have been performed on the entire enzyme complex embedded in a phospholip-id membrane and including explicitly the surrounding aqueous solvent (Figure 1). The use of SuperMUC resourc-es allowed us to run simulations for several micro-sec-onds starting from different start structures and simu-lation conditions. It was possible to identify long-lived
phospholipid binding sites that give hints on putative exo- binding sites for amyloid precursor proteins. The distribution of water molecules found during simula-tions indicates that the active site and a possible sub-strate binding channel are accessible for the aqueous solvent. This finding has important consequences for inhibitor design and for understanding how substrate peptides and proteins access the enzyme active site. The most dominant global motions extracted from the sim-
Figure 1: (A) Simulation system of γ-secretase (cartoon representation) embedded in a phospholipid bilayer (grey and red sticks). The subdo-mains nicrastin, PEN, Aph-1 and the enzymatically active presenilin are shown in green, pink, yellow and blue, respectively. (B-D) Large-scale mobility illustrated as the three energically most favorable global collective motions (indicated as arrows).
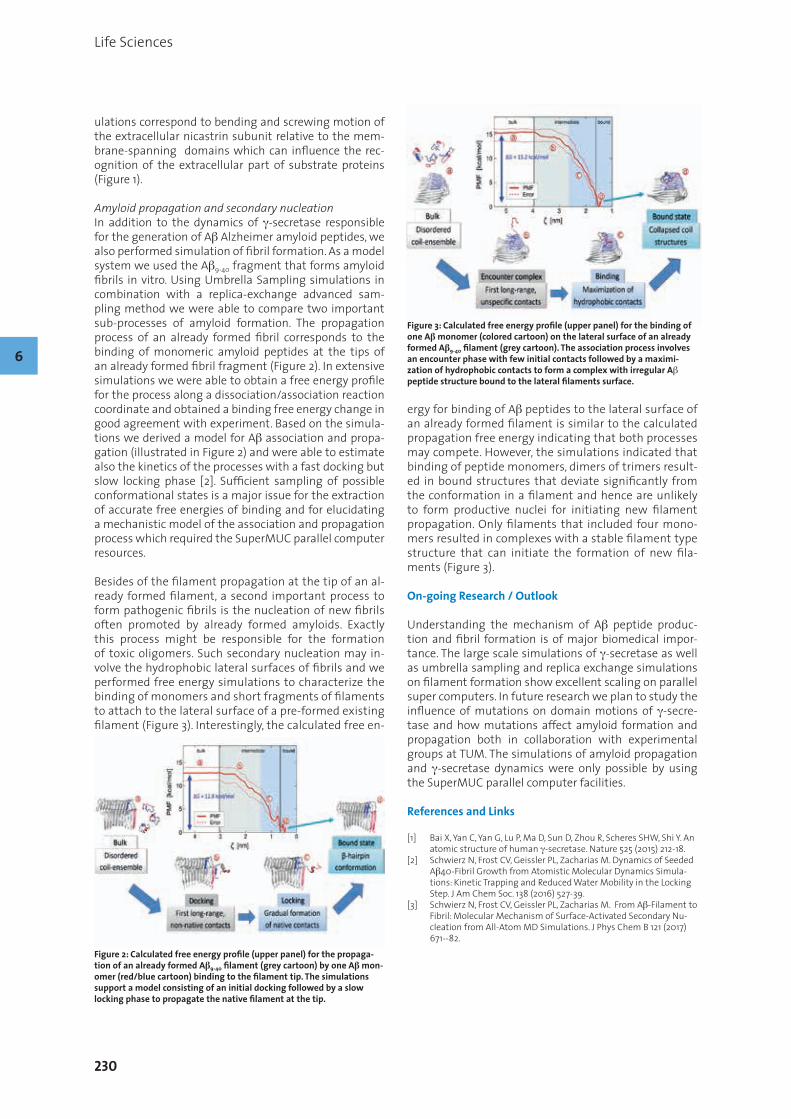
230
Life Sciences
ulations correspond to bending and screwing motion of the extracellular nicastrin subunit relative to the mem-brane-spanning domains which can influence the rec-ognition of the extracellular part of substrate proteins (Figure 1).
Amyloid propagation and secondary nucleationIn addition to the dynamics of γ-secretase responsible for the generation of Aβ Alzheimer amyloid peptides, we also performed simulation of fibril formation. As a model system we used the Aβ9-40 fragment that forms amyloid fibrils in vitro. Using Umbrella Sampling simulations in combination with a replica-exchange advanced sam-pling method we were able to compare two important sub-processes of amyloid formation. The propagation process of an already formed fibril corresponds to the binding of monomeric amyloid peptides at the tips of an already formed fibril fragment (Figure 2). In extensive simulations we were able to obtain a free energy profile for the process along a dissociation/association reaction coordinate and obtained a binding free energy change in good agreement with experiment. Based on the simula-tions we derived a model for Aβ association and propa-gation (illustrated in Figure 2) and were able to estimate also the kinetics of the processes with a fast docking but slow locking phase [2]. Sufficient sampling of possible conformational states is a major issue for the extraction of accurate free energies of binding and for elucidating a mechanistic model of the association and propagation process which required the SuperMUC parallel computer resources. Besides of the filament propagation at the tip of an al-ready formed filament, a second important process to form pathogenic fibrils is the nucleation of new fibrils often promoted by already formed amyloids. Exactly this process might be responsible for the formation of toxic oligomers. Such secondary nucleation may in-volve the hydrophobic lateral surfaces of fibrils and we performed free energy simulations to characterize the binding of monomers and short fragments of filaments to attach to the lateral surface of a pre-formed existing filament (Figure 3). Interestingly, the calculated free en-
ergy for binding of Aβ peptides to the lateral surface of an already formed filament is similar to the calculated propagation free energy indicating that both processes may compete. However, the simulations indicated that binding of peptide monomers, dimers of trimers result-ed in bound structures that deviate significantly from the conformation in a filament and hence are unlikely to form productive nuclei for initiating new filament propagation. Only filaments that included four mono-mers resulted in complexes with a stable filament type structure that can initiate the formation of new fila-ments (Figure 3).
On-going Research / Outlook
Understanding the mechanism of Aβ peptide produc-tion and fibril formation is of major biomedical impor-tance. The large scale simulations of γ-secretase as well as umbrella sampling and replica exchange simulations on filament formation show excellent scaling on parallel super computers. In future research we plan to study the influence of mutations on domain motions of γ-secre-tase and how mutations affect amyloid formation and propagation both in collaboration with experimental groups at TUM. The simulations of amyloid propagation and γ-secretase dynamics were only possible by using the SuperMUC parallel computer facilities.
References and Links
[1] Bai X, Yan C, Yan G, Lu P, Ma D, Sun D, Zhou R, Scheres SHW, Shi Y. An atomic structure of human γ-secretase. Nature 525 (2015) 212-18.
[2] Schwierz N, Frost CV, Geissler PL, Zacharias M. Dynamics of Seeded Aβ40-Fibril Growth from Atomistic Molecular Dynamics Simula-tions: Kinetic Trapping and Reduced Water Mobility in the Locking Step. J Am Chem Soc. 138 (2016) 527-39.
[3] Schwierz N, Frost CV, Geissler PL, Zacharias M. From Aβ-Filament to Fibril: Molecular Mechanism of Surface-Activated Secondary Nu-cleation from All-Atom MD Simulations. J Phys Chem B 121 (2017) 671--82.
6
Figure 2: Calculated free energy profile (upper panel) for the propaga-tion of an already formed Aβ9-40 filament (grey cartoon) by one Aβ mon-omer (red/blue cartoon) binding to the filament tip. The simulations support a model consisting of an initial docking followed by a slow locking phase to propagate the native filament at the tip.
Figure 3: Calculated free energy profile (upper panel) for the binding of one Aβ monomer (colored cartoon) on the lateral surface of an already formed Aβ9-40 filament (grey cartoon). The association process involves an encounter phase with few initial contacts followed by a maximi-zation of hydrophobic contacts to form a complex with irregular Aβ peptide structure bound to the lateral filaments surface.

231
Scalable Computational Molecular Evolution Software & Data Analyses
Scalable Computational Molecular Evolution Software & Data Analyses
Research InstitutionHeidelberg Institute for Theoretical StudiesPrincipal InvestigatorAlexandros StamatakisResearchersAlexey Kozlov, Pierre BarberaProject Partners1KITE initiative
SuperMUC Project ID: pr58te (Gauss Large Scale project)
Introduction
The field of phylogenetic tree reconstruction strives to infer the evolutionary relationships among a set of or-ganisms (species, frequently also denoted as taxa) based on molecular sequence data. Recent advancements in sequencing technology, in particular the emergence of so-called next generation sequencers, have generated an avalanche of sequence data, that now makes it possi-ble to use whole transcriptomes and even genomes of a large number of species for tree reconstruction.
Likelihood-based approaches (Maximum Likelihood and Bayesian Inference) represent an accurate and widely used, but at the same time also highly compute-inten-sive approach for reconstructing phylogenetic trees. In 2017 and 2018 we were able to substantially improve the scalability and efficiency of two Maximum Likelihood based tools for tree reconstruction and phylogeny-aware identification of anonymous molecular sequence data on SuperMUC.
In addition, we analyzed several empirical large-scale da-tasets in collaboration with biologists.
Scalable Software
A key focus of our lab is on developing methods in con-junction with large-scale empirical data analyses. In 2017 there has been substantial progress in developing and releasing novel, scalable open-source codes for phyloge-netic inference. Our new tools rely on an open-source library for efficient phylogenetic likelihood calculations that is available as open source code under AGPLv3 (https://github.com/xflouris/libpll-2).
RAxML-NG: In 2017, we released the complete re-design of our flagship tool for phylogenetic inference RAxML (over 20,000 citations on the four main papers, Google Scholar, accessed March 2018) as open source code un-der AGPLv3 (available at https://github.com/amkozlov/raxml-ng). RAML-NG has substantially superior sequen-tial as well as parallel performance compared to RAxML and also compared to our previous dedicated tool for su-percomputers (ExaML, see below). RAxML-NG integrates all optimizations from RAxML as well as ExaML and scales from the laptop to the supercomputer. In addition, we have designed a highly efficient hybrid parallelization that achieves spectacular super-linear speedups (up to 140%) due to increased cache efficiency. In Figure 1 we show a parallel efficiency comparison between RAxML-NG and ExaML on two large-scale DNA and amino acid datasets. Note that, that phylogenetic likelihood calcula-tions are predominantly memory bandwidth bound.
EPA-NG: In 2017, we also released the complete re-design of our Evolutionary Placement Algorithm (EPA) as open-source code under AGPLv3 (available at https://github.com/Pbdas/epa-ng).
The EPA places anonymous sequences as obtained from metagenetics studies onto a given reference phyloge-ny using the Maximum Likelihood criterion. As a data analysis of protists living in neotropical forest soils revealed (mentioned in our previous report, published in Nature Ecology & Evolution in early 2017; also see, e.g., press coverage https://insidehpc.com/2017/03/
Figure 1. Super-linear speedups of the hybrid MPI-PThreads version of RAxML-NG versus ExaML on large scale DNA (left) and amino acid datasets (right).

232
Life Sciences
supermuc-helps-discover-new-species-critical-rain-forest-ecosystems/) our previous implementation had reached its performance limits as the number of mo-lecular sequences produced by such studies steadily increases. The new version is between 3.5 to 370 times faster than our previous implementation (depending on heuristic parameter settings) and also 30 times fast-er than a competing tool for the same purpose called pplacer. In addition, we have also designed a novel parallel version of the tool that exhibits good parallel strong scaling efficiency (see Figure 2).
While the papers describing RAxML-NG and EPA-NG have not been submitted yet, we believe that both are likely to become high impact papers.
Except for the tools presented here, we have also devel-oped and released a new tool for phylogenetic model testing and continued work on improving load balance of phylogenetic likelihood calculations via appropriate data distribution algorithms [5].
6
Figure 2. Phylogenetic tree of the Hymenoptera.

233
Scalable Computational Molecular Evolution Software & Data Analyses
Figure 3. Strong parallel scaling efficiency of EPA-NG for placing 10 million, 100 million, and 1 billion molecular sequences into a phylogenetic reference tree on up to 2048 cores.
Scalable Data Analyses
In 2016 and 2017, we still used our previous dedicated su-percompuer codes – ExaML and ExaBayes – to conduct several large-scale phylogenomic analyses in the context of the ongoing 1KITE project (www.1kite.org).
In particular, our work shed new light on the evolutionary history of a large group of insects that includes wasps, bees, ants, and sawflies (order Hymenoptera). This group exhibits several interesting evolutionary transitions, for instance, from plant-feeding to predation and parasitism (and back to pollen-collecting in bees), or from solitary to eusocial lifestyle.
We inferred a phylogeny of 173 Hymenoptera species us-ing 3,256 protein-coding genes (>1,500,000 alignment columns). For thoroughly analyzing this large dataset, we used ~650,000 CPU-hours in total, while each individu-al run typically used 640 (ExaML) up to 1792 (ExaBayes) cores. Notably, we performed one of the largest Bayesian phylogenetic analysis to date and set new standards for what is feasible with current software and hardware in this area. The resulting phylogenetic tree is depicted in Figure 3.
Our study resolved the phylogenetic origins of bees and stinging wasps, and, in general, provided the basis for classification and comparative analysis of the Hymenop-tera. Our findings were published in Current Biology [2].
Two smaller studies that focused on vespid wasps [3] and chalcid wasps [4] have been published in Molecu-lar Phylogeny and Evolution. Among other findings, they confirmed that several important traits such as eusoci-ality or the ability to jump have evolved multiple times independently in different wasp lineages.
Finally, we executed analogous phylogenomic analysis for three further insect subgroups: Syrphoidea (hover-files), Apoidea (wasps and bees) and Paraneoptera (lice and thrips). The corresponding papers have either been accepted (Syrphoidea in Systematic Entomology) or are under review.
On-going Research / Outlook
With our novel efficient parallel software now in place (RAxML-NG and EPA-NG), we are ready to conduct fur-ther challenging large-scale phylogenetic analyses on SuperMUC and SuperMUC-NG. The key goal for 2018 is to analyze the final and extremely large insect dataset in the framework of the 1KITE project. This dataset contains roughly 1000 genes from about 1300 species. This data-set is particularly challenging as it contains, both, a large number of genes and a huge number of taxa. Note that, previous analyses of insect datasets on SuperMUC only contained between 100 – 200 species.
Another key challenge is to further optimize the I/O ef-ficiency of EPA-NG as it constantly reads molecular se-quence data from file and also generates large result files (current measured I/O throughput is 5Gbit/s).
References and Links
[1] lab web-site: www.exelixis-lab.org[2] R. S. Peters, L. Krogmann, C. Mayer, A. Donath, S. Gunkel, K. Meuse-
mann, A. Kozlov, L. Podsiadlowski, M. Petersen, R. Lanfear, P. A. Diez, J. Heraty, K. M. Kjer, S. Klopfstein, R. Meier, C. Polidori, T. Schmitt, S. Liu, X. Zhou, T. Wappler, J. Rust, B. Misof, O. Niehuis. “Evolutionary History of the Hymenoptera”. Current Biology 27(7): 1013-1018, 2017.
[3] S. Bank, M. Sann, C. Mayer, K. Meusemann, A. Donath, L. Podsi-adlowski, A. Kozlov, M. Petersen, L. Krogmann, R. Meier, P. Rosa, T. Schmitt, M. Wurdack, S. Liu, X. Zhou, B. Misof, R. S. Peters, O. Niehuis. “Transcriptome and target DNA enrichment sequence data provide new insights into the phylogeny of vespid wasps (Hymenoptera: Aculeata: Vespidae)”. Molecular Phylogenetics and Evolution 116: 213-226, 2017.
[4] R. S. Peters, O. Niehuis, S. Gunkel, M. Bläser, C. Mayer, L. Podsiad-lowski, A. Kozlov, A. Donath, S. van Noort, S. Liu, X. Zhou, B. Misof, J. Heraty, L. Krogmann. “Transcriptome sequence-based phylogeny of chalcidoid wasps (Hymenoptera: Chalcidoidea) reveals a history of rapid radiations, convergence, and evolutionary success”. Molecular Phylogenetics and Evolution, 120: 286-296, 2018.
[5] B. Morel, T. Flouri, A. Stamatakis. “A novel heuristic for data dis-tribution in massively parallel phylogenetic inference using site repeats”. IEEE HPCC17, 2017.
128 512 204825616 10240
0.2
0.4
0.6
0.8
1
Parallel Efficiency
10M100M1B
Number of cores
default

234
Life Sciences
Structure and dynamics of nascent peptides in the ribosome exit tunnel
Research InstitutionMax Planck Institute for Biophysical Chemistry, GöttingenPrincipal InvestigatorHelmut GrubmüllerResearchersMichal H. Kolár, Lars. V. Bock, Andrea C. VaianaProject PartnersDept. Phys. Biochemistry, MPI BPC, Göttingen; Gene Center, LMU, Munich
SuperMUC Project ID: pr62de (Gauss Large Scale project)
Introduction
The ribosome is a stochastic nanomachine responsible for protein synthesis in all cells (Fig 1). It is a large biomo-lecular complex of several ribonucleic acid (RNA) strands, and of a few dozen proteins. Ribosomes translate the ge-netic information from the messenger RNA (mRNA) into a sequence of amino acids. The process of translation is regulated by several factors and involves a cyclic binding of transfer RNAs (tRNAs) into three specific sites (labeled A, P and E). Ribosomes are highly conserved across all do-mains of life. Any malfunction of the biomachine notably affects the cellular life cycle. Apart from their fascinat-ing nature and function, ribosomes represent one of the most important targets for antibiotic binding [1].
At the turn of the millennium, the atom-resolved struc-ture of a prokaryotic ribosome was determined. Since then, a great quantity of structural information has been obtained from several species including Escherichia coli, Bacillus thermophilus, yeast and humans. Ribosomes read mRNA at a decoding site on their small subunit (30S). The peptidyl transferase center (PTC), where the peptide bonds are formed, is located deep within the ri-bosome in its large (50S) subunit and is formed by RNA only. The newly synthesized peptide, also called the nas-cent chain (NC), exits the ribosome through a tunnel spanning the 50S subunit (Fig. 1). The tunnel is about 10 nm long. Already the first structural studies suggested that the exit tunnel may facilitate secondary structure formation of the NC. It was suggested that the NC may fold or pre-fold within the exit tunnel. Only in recent years, has evidence for this co-translational protein fold-ing emerged [2]. Despite this progress, many questions remain unanswered.
The exit tunnel is mostly formed by ribosomal RNA, which carries a highly negatively charged backbone. In contrast, the RNA nucleobases are rather hydrophobic. Two pro-teins contribute to the tunnel wall in its innermost part, namely proteins L4 and L22. These form a constriction within the tunnel and have been suggested to play some regulatory role. Some peptide sequences cause ribosome stalling; these stalled peptides can be released under certain conditions. Stalling is also of key importance for the action of many antibiotics. It means that the tunnel is a functional part of the ribosome. Moreover, the tunnel is filled with water and ions. The interaction between the NC and the complex, heterogeneous environment of the interior of the tunnel are not currently understood.
In the project we used an all-atom molecular dynamics (MD) simulations to study NC-ribosome complexes. We have developed a simulation protocol to study NC elon-gations. One by one, amino acids were added to the NC and its passage through the tunnel was investigated. Apart from several model peptide sequences, we have studied a NC called VemP, which was recently shown to regulate ribosome function.
6
Figure 1: Anatomy of the bacterial ribosome (PDB: 5afi)

Structure and dynamics of nascent peptides in the ribosome exit tunnel
VemP is a short peptide found in marine bacteria. Its structure has recently been resolved by a cryo-electron microscopy at atomic resolution. In the ribosome tunnel, VemP may adopt an extremely compact conformation of two α-helices joined by an S-shape loop. By means of all-atom MD simulations we have studied the dynamics and mechanical properties of VemP.
Our simulations pose several challenges which can be tackled only by high-performance supercomputer fa-cilities. To address biologically relevant questions about ribosome structure and dynamics, the simulations need to have high spatial resolution and the simulation time needs to be sufficiently long [3]. Hence, our typical simu-lations contain more than 2 million particles whose time evolution is studied on multi-microsecond time scales.
Results and Methods
Model PeptidesWe studied three model peptide sequences: poly-pheny-lalanine (poly-Phe), poly-alanine (poly-Ala), and poly-gly-cine (poly-Gly), which we have built on-the-fly using the MD-based simulation protocol and various simulation setups. Motivated by experiments performed by our in-house collaborators (Marina Rodnina group), some of the peptides were labeled by a fluorescent dye BOF. We ob-served slow relaxation of the poly-Phe, so only a chain of 6 amino acids was technically possible to accommodate into the tunnel during the simulations. Poly-Gly and po-ly-Ala simulations relaxed faster than poly-Phe possibly due to their smaller side chains. We were able to build from scratch a NC containing 16 amino acids. The push-ing force, generated during the first steps of the amino acid addition in the simulations, dissipated quickly and did not propagate to distances beyond a few amino ac-ids. As a consequence, the NC formed a compact fold already before the constriction site (Fig. 2). Overall, our simulations suggest that the pushing force, exerted to the C-terminus of the NC, cannot be solely responsible for the peptide passage through the tunnel.
VemPWe used MD simulations to study VemP dynamics. The initial atomic structure was kindly provided by the group of Roland Beckmann (LMU Munich). All of the VemP com-ponents were stable at the simulations time scales (up to microseconds). The outer helix showed higher flexibility than the inner helix (Fig. 3). In experiments, VemP reacts
to external mechanical forces. Hence we have carried out a series of non-equilibrium simulations to study me-chanical properties of the VemP. We applied a force onto the VemP N-terminus directing towards the tunnel exit. We tested several parameters that define the unfolding rate. Our simulations suggested that the unfolding trig-gered by the external mechanical force on the N-termi-nus occurs in a stepwise manner. VemP, as a mechanical string, is loaded until intermolecular contacts are broken suddenly, which causes unfolding of a VemP part (Fig. 3).
MethodsAll of the simulations were performed in GROMACS 5 package [4], which is available as a standard SuperMUC module. The code uses a mixed MPI/OpenMP paralleliza-tion and with our simulation boxes scales well up to sev-eral thousands of CPU cores. We typically used between 1792 and 7168 CPU cores. The simulations ran in chains using a checkpoint file based functionality of GROMACS. The simulations produced a large amount of data (tens of TB) which are still being analyzed.
On-going Research / Outlook
We have studied several NCs in the ribosome exit tun-nel. Many aspects of the peptide elongation remain to be addressed. In order to avoid formation of a compact NC fold, we will combine two approaches that were used in the current Project, namely the pushing force generat-ed by addition of an extra amino acid to the C-terminus with the pulling force applied to the N-terminus of the NC. Regarding the VemP peptide, we plan to study its me-chanical properties in more detail. Molecular details of the unfolding will likely emerge from the analyses of the now-available trajectories.
References and Links
[1] Jacob Poehlsgaard and Stephen Douthwaite. 2005. The bacterial ribosome as a target for antibiotics. Nature Reviews Microbiology, 3 (Nov 2005), 870-881.
[2] Boyd Hardesty, Tamara Tsalkova and Gisela Kramer. 1999. Co-trans-lational folding. Curr. Opin. Struct. Biol., 9 (Feb 1999), 111-114.
[3] Lars V. Bock, Michal H. Kolár, and Helmut Grubmüller. 2018. Molecu-lar simulations of the ribosome and associated translation factors. Curr. Opin. Struct. Biol., 49 (April 2018), 27-35.
[4] Mark J. Abraham, Teemu Murtola, Roland Schultz, Szilard Pall, Jere-my C. Smith, Berk Hess and Erik Lindahl. 2015. GROMACS: High per-formance molecular simulations through multi-level parallelism from laptops to supercomputers. Software X. 1 (Sep. 2015), 19-25.
Figure 2: The compact structure of the BOF-labeled poly-alanine (yel-low) in the ribosome tunnel (white surface). The P-site tRNA is in red.
Figure 3: Left: Superimposition of 60 VemP conformations from the last 200 ns of the ribosome-VemP complex simulation. The PTC is represent-ed by the yellow sphere Right: Root-mean-square deviation (RMSD) of VemP parts calculated as a function of simulation time with respect to the initial (i.e. experimental) VemP conformation. Four curves of the same color stand for four independent non-equilibrium simulations.

236
Life Sciences
Replica Exchange Molecular Dynamics Simulation of the Switching Process in small GTPases
Research InstitutionInstitute of Theoretical Molecular-dynamics (T38)Principal InvestigatorMartin ZachariasResearchersDanial Pourjafar-DehkordiProject Partners—
SuperMUC Project ID: pr74bi (Summer of Simulation project)
Introduction
Small GTPases are a class of protein-based switches that play a significant role in many intracellular signalling events by switching between active and inactive states [1]. Depending on the switch state, its two important regula-tory regions, namely switch I and II, adopt different confor-mations. While in the active state both regions are highly conserved and ordered, upon inactivation they become disordered [2]. The conformation and flexibility of switch regions are crucial for recognising the physiological bind-ing partners. It has been revealed that post-translational modifications (PTMs) - such as phosphorylation , phospho-cholination or adenylylation - of specific amino acid resi-dues modulate their activity [3]. Rab, Rho/Cdc42 and Ras GTPase subfamilies are among the most frequently tar-geted ones. Phosphorylations by protein kinases inside or outside the switch regions also manipulates the activity of G-proteins, as observed in Rab8a where Ser111, not inside the switch regions, is phosphorylated. The conformational consequences of such modifications help us understand their biological impact. The aim of this work, which is part of a project in collaboration with experimental groups within the framework of SFB1035 “Control of protein func-tion by conformational switching”, is to understand how the switching mechanism is modulated through specific modifications by means of molecular dynamics (MD) and advanced sampling simulation techniques. Combination of MD and biased potential replica-exchange (BPRE) help us obtain an insight, in atomic details, on how PMTs inter-fere with GTPases switching mechanism.
Results and Methods
Our method relies on introducing a biased potential that promotes conformations with unfavourable backbone and side-chain dihedrals. The starting setup was com-posed of eight parallel MD simulations (also referred to as “replicas”) of the solvated protein-ligand complex. Along the replicas, the potential was increased to penal-ise low energy angles, namely the ones associated with α-helices and β-sheets. Based on a Metropolis criterion, every 1000 steps an exchange attempt between the
neighbouring replicas was allowed or rejected. The idea is that if we have enough exchange attempts, at the point of convergence there will be an unbiased representation of the conformational space. For simulating each com-plex, that is composed of 22480 atoms, including water molecules, 448 cores were deployed. Overall, 7 million of the granted 8 million CPU-hours was used. The biasing potential were targeted on switch I (residues 30-42) and switch II (residues 64-80) of both ligand-bound complex-es. The simulations were performed at 315K at which the behaviour of the two complexes became clearly distin-guishable in the switch regions. RMSD values of switch I indicated a higher occurrence of larger deviations i.e. frequent exchange to the higher replicas, in Rab8a:GDP compared to Rab8a:GTP (Fig.1). Switch II illustrated clear-ly higher flexibility in Rab8a:GDP complex, with peak RMSD values at 2 and 3.8Å, whereas in GTP-bound Rab the deviations were limited to 2Å.
The outcome clusters of both complexes varied merely in the switch regions. In the GTP-bound Rab, the character-istic interactions between T40 and the γ phosphate and the Mg2+ ion remained intact, whereas in Rab8a:GDP, the absence of this interaction facilitates switch II unfolding. Analysis of the switch II region revealed that although the helix was separated from the ligand binding pocket, it restrained the α-helical conformation.
In the next step, we used our BPRE model to investigate the effects of T72 and S111 phosphorylation on Rab8a structure. Comparing the RMSD of the switch regions
6
Figure 1: Root mean square deviation of switch I and switch II with respect to the active Rab GTPase structure.

237
Replica Exchange Molecular Dynamics Simulation of the Switching Process in small GTPases
showed that the phosphorylated Rabs, although bound to GDP, were stabilised in a conformation close to that of Rab8a:GTP complex (Fig.2). This shift was more profound in switch II, where one of the phosphorylated residues is directly located (T72) and the other one is in remote in-teraction with (S111). Investigating the clusters obtained from the BPRE simulations showed that indeed there are new non-native polar contacts formed between the add-ed phosphate groups and their neighbouring amino acid residues that stabilised the switch II region in its active conformation (Fig.3).
Comparing the binding free energies (Tab.1) indicated that the complex of Rabin8 and GDP-bound Rab8a is
favoured to all other ensembles. The energy of Rabin8 binding to the wild-type Rab8a:GDP was favoured over pS111- Rab8a:GDP and pT72-Rab8a:GDP by about -5.71 and -49.16 kCal/mol, respectively. The drastic reduction in the latter case may be due to the position of T72 that is directly at the interface of Rab8a:Rabin8.
Overall, using the BPRE model we were able to address two important implications of PTMs on Rab8a. First, the switch regions are stabilised in a closed form that is similar to the active GTP bound conformation, which obstructs switch domains opening necessary for the li-gand exchange. Second, the interactions between the target residues and the interacting partner (Rabin8) are disturbed due to new hydrogen bonding competition. These two factors effectively impair Rab8a-Rabin8 inter-actions which results in a drastically reduced nucleotide exchange rate for phosphorylated Rab, which is in agree-ment with the experimental results[4].
On going research
There are several other members of the Ras superfam-ily that are prone to modifications which will be inves-tigated. Modifications that are of various types have to be examined by our method. Moreover, it has to be in-vestigated wether in the presence of the binding partner, the above discussed conformational changes still take place. Following these objectives will help us to gain a clear understanding of the implications of an advanced sampling method in predicting the consequences of a chemical modification on Ras protein family.
Reference
[1] Schwartz, Samantha L., et al. “Rab GTPases at a glance.” Journal of cell science 120.22 (2007): 3905-3910.
[2] Prakash, Priyanka, and Alemayehu A. Gorfe. “Lessons from com-puter simulations of Ras proteins in solution and in membrane.” Biochimica et Biophysica Acta (BBA)-General Subjects 1830.11 (2013): 5211-5218.
[3] Lai, Yu-Chiang, et al. “Phosphoproteomic screening identifies Rab GTPases as novel downstream targets of PINK1.” The EMBO journal 34.22 (2015): 2840-2861.
[4] Lai, Yu-Chiang, et al. “Phosphoproteomic screening identifies Rab GTPases as novel downstream targets of PINK1.” The EMBO journal 34.22 (2015): 2840-2861.
Figure 2: Distribution of the switch I (up) and II (down) domains RMSD of the heavy atoms, with respect to the initial position.
Figure 3: Most populated clusters obtained from BPRE simulation of T72 phosphorylated Rab8a:GDP (orange) overlaid on wild-type Rab8a:GDP:Rabin8 crystalline structure. New hydrogen bonds are formed between phosphorylated T72 and the neighbouring residues.
Rabin8 in complex with ΔG [kCal/mol] ± SEM ΔΔGRab:GDP 13.45 ± 0.48 —Rab:GDP 14.79 ± 0.48 1.34Rab-pT72:GDP 62.61 ± 0.71 49.16Rab-pS111:GDP 19.16 ± 0.48 5.71Rab-pT72pS111:GDP 68.48 ± 0.70 55.03
Table 1: Absolute (ΔG) and relative (ΔΔG) free energy differences of Rab:Rabin binding with respect to GDP bound complex in kcal/mol. The free energies were calculated using MM-PBSA package of Amber soft-ware from a 5ns production run.

238
Life Sciences
The Interaction of Alzheimer’s Amyloid-β Peptide With Neuronal Lipid Bilayers
Research InstitutionForschungszentrum Jülich, GermanyPrincipal InvestigatorBirgit StrodelResearchersMichael C. Owen, Waldemar Kulig, Ilpo VattulainenProject PartnersUniversity of Helsinki, Helsinki Finland
SuperMUC Project ID: pr74da (Gauss Large Scale project)
Introduction
Alzheimer’s disease (AD) is a neurodegenerative disorder that primarily affects the elderly and is having a great-er impact on societies across the globe as the overall life expectancy of humans continues to increase. The exact cause of the neuronal death in AD has yet to be established, though it is widely accepted that the major contributing cause of neuronal death associated with Alzheimer’s disease are toxic amyloid-β (Aβ) peptides. Monomeric Aβ (Figure 1) can aggregate into insoluble, relatively inert, rigid structures called fibrils, but also much more toxic, soluble structures of intermediate size, and varying shapes, which are called oligomers. Aβ42 oligomers have been shown to be the most toxic form of the Aβ peptide, though it is still unknown how they originate.
It is becoming increasingly evident that the plasma membrane of neurons plays a role in modulating Aβ aggregation. The aggregation of Aβ was shown to pref-erentially occur in rigid liquid-ordered phases of lipid membranes that are comprised of sphingomyelin (SM) as well as cholesterol (CHOL). The monosialotetrahexo-sylganglioside (GM1) has also been found to be involved in Aβ aggregation, however it has been shown both to accelerate aggregation as well as inhibit it. To under-stand how membrane lipids affect the oligomerization of Aβ, we have comprised a system that includes six Aβ peptides and a bilayer membrane comprised of 1058 li-pids (Table 1) and study the aggregation of Aβ42 using molecular dynamics (MD) simulations. The lipids are distributed symmetrically between the two leaflets of the membrane and provide a good account of the lipids present in neuronal membranes, as they include cho-
lesterol, sphingomyelin and GM1 in physiologically rel-evant quantities. Moreover, the bilayer is large enough (165 Å x 165 Å surface area) and contains the lipids in sufficient numbers to enable their interactions with Aβ42 to be studied with statistical significance. Our system contains an experimentally relevant peptide concentration of 2.1 mM in explicit water and a physio-logically relevant NaCl concentration of 150 mM. There-fore, the components of the system under investigation present ideal, physiological conditions.
Membrane Composition Quantity (mol%)
Abbr. Full Name Number of Lipids
POPC 1-palmitoyl-2-oleoyl- phosphatidylcholine 212 (20)
CHOL Cholesterol 212 (20)
POPE 1-palmitoyl-2-oleoyl- phosphatidylethanolamine 190 (18)
POPS 1-palmitoyl-2-oleoyl- phosphatidylserine 190 (18)
SM Sphingomyelin 190 (18)
GM1 Monosialotetrahexosyl- ganglioside 64 (6)
Total Number of Lipids 1,058 (100)
Peptide and Solvent Composition Quantity
Aβ42 peptides 6
Explicit water molecules 167,345
Total ions (Na+ + Cl–) 1,294
Total Number of Atoms 639,505
Table 1. The lipid, peptide, solvent and ion composition of the Aβ-bilayer system under study.
6
Figure 1. The primary structure of Aβ42, showing the acidic residues in red, basic residues in blue, hydrophobic residues in black, and polar residues in green.
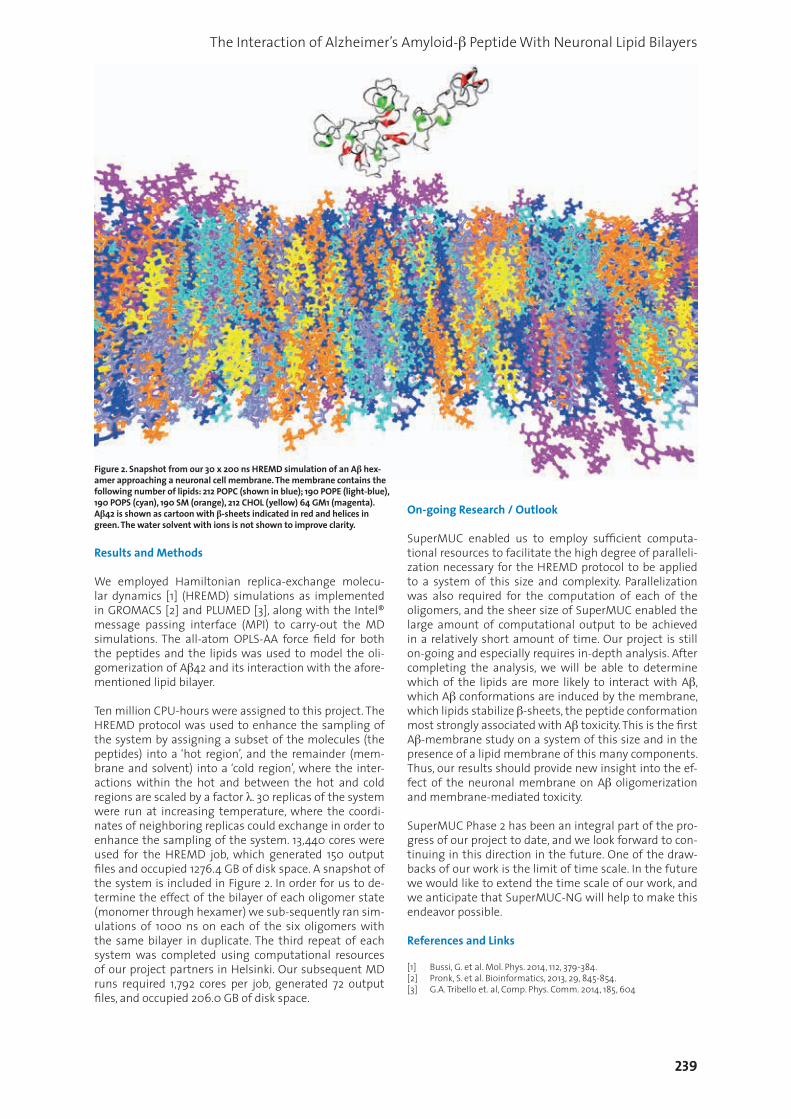
239
The Interaction of Alzheimer’s Amyloid-β Peptide With Neuronal Lipid Bilayers
Results and Methods
We employed Hamiltonian replica-exchange molecu-lar dynamics [1] (HREMD) simulations as implemented in GROMACS [2] and PLUMED [3], along with the Intel® message passing interface (MPI) to carry-out the MD simulations. The all-atom OPLS-AA force field for both the peptides and the lipids was used to model the oli-gomerization of Aβ42 and its interaction with the afore-mentioned lipid bilayer.
Ten million CPU-hours were assigned to this project. The HREMD protocol was used to enhance the sampling of the system by assigning a subset of the molecules (the peptides) into a ‘hot region’, and the remainder (mem-brane and solvent) into a ‘cold region’, where the inter-actions within the hot and between the hot and cold regions are scaled by a factor λ. 30 replicas of the system were run at increasing temperature, where the coordi-nates of neighboring replicas could exchange in order to enhance the sampling of the system. 13,440 cores were used for the HREMD job, which generated 150 output files and occupied 1276.4 GB of disk space. A snapshot of the system is included in Figure 2. In order for us to de-termine the effect of the bilayer of each oligomer state (monomer through hexamer) we sub-sequently ran sim-ulations of 1000 ns on each of the six oligomers with the same bilayer in duplicate. The third repeat of each system was completed using computational resources of our project partners in Helsinki. Our subsequent MD runs required 1,792 cores per job, generated 72 output files, and occupied 206.0 GB of disk space.
On-going Research / Outlook
SuperMUC enabled us to employ sufficient computa-tional resources to facilitate the high degree of paralleli-zation necessary for the HREMD protocol to be applied to a system of this size and complexity. Parallelization was also required for the computation of each of the oligomers, and the sheer size of SuperMUC enabled the large amount of computational output to be achieved in a relatively short amount of time. Our project is still on-going and especially requires in-depth analysis. After completing the analysis, we will be able to determine which of the lipids are more likely to interact with Aβ, which Aβ conformations are induced by the membrane, which lipids stabilize β-sheets, the peptide conformation most strongly associated with Aβ toxicity. This is the first Aβ-membrane study on a system of this size and in the presence of a lipid membrane of this many components. Thus, our results should provide new insight into the ef-fect of the neuronal membrane on Aβ oligomerization and membrane-mediated toxicity.
SuperMUC Phase 2 has been an integral part of the pro-gress of our project to date, and we look forward to con-tinuing in this direction in the future. One of the draw-backs of our work is the limit of time scale. In the future we would like to extend the time scale of our work, and we anticipate that SuperMUC-NG will help to make this endeavor possible.
References and Links
[1] Bussi, G. et al. Mol. Phys. 2014, 112, 379-384.[2] Pronk, S. et al. Bioinformatics, 2013, 29, 845-854.[3] G.A. Tribello et. al, Comp. Phys. Comm. 2014, 185, 604
Figure 2. Snapshot from our 30 x 200 ns HREMD simulation of an Aβ hex-amer approaching a neuronal cell membrane. The membrane contains the following number of lipids: 212 POPC (shown in blue); 190 POPE (light-blue), 190 POPS (cyan), 190 SM (orange), 212 CHOL (yellow) 64 GM1 (magenta). Aβ42 is shown as cartoon with β-sheets indicated in red and helices in green. The water solvent with ions is not shown to improve clarity.

240
Life Sciences
G-Protein Coupled Receptors up CloseResearch InstitutionComputer-Chemistry Center, Friedrich-Alexander-University Erlangen-NuernbergPrincipal InvestigatorTimothy ClarkResearchersPassainte Ibrahim, Jonas Kaindl, Noureldin Saleh, Ralf C. Kling, Lampros MilanosProject PartnersInstitute of Structural and Molecular Biology, University College London (Prof. Gervasio)
SuperMUC Project ID: pr74su (Gauss Large Scale project), pr94to
Introduction
G-protein coupled receptors (GPCRs) represent nature’s most prevalent means of communication across cell walls. There are approximately 800 GPCRs in the human genome and GPCRs are targeted by approximately 40% of all marketed drugs. They share a common architecture in which seven transmembrane helices, TM1-TM7, span the membrane. The helices are linked by three extracel-lular loops (ECL1-ECL3) and three intracellular ones (ICL1-ICL3). This general architecture is shown in Fig. 1.
Because GPCRs are membrane proteins, they are inher-ently difficult to crystallize, so that X-ray crystal struc-tures are still few and far between (currently, approx-imately 45 structures are available). Additionally, the measures often necessary to induce the receptors to crystallize lead to constructs that are far removed from the biological situation, so that the relevance of the crys-tal structures is uncertain. Because of this difficult exper-imental situation and because protein force fields (me-chanical models of proteins used for simulations) have become very reliable, simulations now play a major role in GPCR research. [1]
GPCRs regulate (turn on and off) functions within the cell based on signals from outside. In most cases, the signal is a small molecule, often a peptide-hormone in natural
cases, but also small molecules such as adrenaline, do-pamine or synthetic drugs. The mechanism of action of GPCRs is complex. The small molecule signal (the ligand) cannot switch the receptor alone. It requires that a part-ner protein be on the intracellular side of the receptor. This protein (intracellular binding partner, IBP) may be one of three types of G-protein, which then effects the signaling, or an arrestin, which causes the receptor to be internalized (essentially scrapped). Thus, partners bound on the two sides of the receptor are necessary for signaling.
The ligands themselves may also exert different func-tions: The classical agonists activate the receptor, where-as antagonists prevent it from being activated. Most re-ceptors exhibit varying degrees of activation even in the absence of agonists (constitutional or basal activity) and this activity can also be modified by inverse agonists. Par-tial agonists cannot activate the receptor fully. Recently, it has also become clear that biased ligands (agonists or antagonists) can preferentially activate either a G-pro-tein signaling path or one mediated by arrestin without activating the other. These biased agonists represent very promising therapeutic agents.
This complexity makes both biophysical studies of the structures and mechanisms of action of GPCRs and ration-al drug design of GPCR ligands a challenging task that of-ten requires detailed information that is simply not avail-able from experiments. Simulations can therefore make unusually important contributions to GPCR research.
Results and Methods
Classical molecular-dynamics (MD) simulations are the workhorse of biophysical simulations. In such simula-tions, the protein is represented by a simple mechanical model (balls and springs) that is computationally very ef-ficient and has been refined over the past three decades to give excellent results. This force-field model is used to calculate the energy and the forces acting on the atoms in every step of the simulation. The problem is that we must be able to represent even the fastest movements of the protein adequately. In this case, vibrations of CH-, NH- and OH-bonds require that the time-step in the simulations not be larger than approximately 1 fs (10-15 seconds). This can be extended to 2 fs by standard tech-
6
Figure 1: Schematic diagram of the general architecture of type A GPCRs. The cylinders represent α-helices.

G-Protein Coupled Receptors up Close
niques but means that at least 500 million time steps are necessary for one microsecond simulation. One mi-crosecond is not very long for a biological system, which sometimes take hours to react to a stimulus. It is there-fore necessary to use so-called enhanced-sampling tech-niques in order to simulate slow and rare events.
The challenge is to construct such an enhanced-sam-pling technique that investigates slow events within an accessible length of simulation. One of the most suc-cessful techniques in this respect is known as metady-namics. [2] In metadynamics simulations, one or more re-action coordinates (collective variables, CVs) are defined. During the simulation, small destabilizing Gaussian functions are added to the potential-energy hypersur-face at positions (defined by the CVs) that the simulation has already visited. In this way, minima in the potential energy are filled and the simulation spontaneously vis-its regions of higher energy. The important advantage of metadynamics is that the negative of the sum of the added Gaussian gives the free-energy profiles for the process investigated.
The challenge in the project was to establish a metady-namics protocol that allows us both to take advantage of SuperMUC and to optimize the performance of the simulations for GPCR investigations. This was achieved by defining a general CV that is suitable for most class A GPCRs, applying a funnel-like constraint to stop the sim-ulation sampling the entire extracellular medium and using a multi-walker technique to make the simulation massively parallel. The results have been published as a computational protocol, [3] which is shown in Fig. 2. This protocol makes it possible to determine free energies of binding as accurately as experiment and to determine the effect of the ligand (agonist, antagonist etc.). [4]
Typical metadynamics simulation using the single CV use 32 replicas on 64 nodes. This ensures convergence of a full free-energy profile within 500ns-2μs of collective simulation time (approximately 20-50ns per replica de-pending on the size of each system) in a single run on either SuperMUC Thin nodes or Haswell nodes.
The protocol proved to be highly efficient for both terna-ry and binary protein complexes as it gives good parallel performance parallelization up to 14,000 cores.
One job usually generates a minimum of 240 files. Along with unbiased MD simulations the overall storage need-ed can exceed 9 TB per project.
The first important result was obtained using two CVs before the protocol described above had been developed fully. The simulations revealed that the vasopressin re-ceptor has no less than three different binding sites, as shown in Fig. 3. The deepest of these three, the ortho-steric site, is that responsible for activation, and there-fore agonist binding. However, agonists can also bind to the other two sites to block access to the orthosteric one. This is found to be the case for specific agonists for the V1bR and V2R receptor subtypes, which bind to the in-termediate and vestibule sites, respectively. [4] We have since found that multiple binding sites are a character-istic of GPCRs, an important discovery for rational drug design of GPCR antagonists.
On-going Research / Outlook
The research described would not have been possible without SuperMUC. The simulations give unprecedent-ed detail and accuracy on a par with experiment. It is planned not only to continue but also to expand the project to include further partners from the FAU and the universities of Leipzig and Regensburg.
References and Links
[1] T. Clark. 2017. G-Protein coupled receptors: answers from simula-tions, Beilstein J Org Chem https://www.beilstein-journals.org/bjoc/content/pdf/1860-5397-13-106.pdf.
[2] https://www.sciencedirect.com/topics/medicine-and-dentistry/metadynamics.
[3] N. Saleh, P. Ibrahim, G. Saladino, F. L. Gervasio and T. Clark. 2017. An efficient Metadynamics-based Protocol to Model the Binding Af-finity and the Transition State Ensemble of GPCR-Ligands, J Chem Inf Model https://doi.org/10.1021/acs.jcim.6b00772.
[4] N, Saleh, G. Saladino, F. L. Gervasio and T. Clark. 2017. Investigating allosteric effects on the functional dynamics of β2-adrenergic ternary complexes with enhanced-sampling simulations, Chem. Sci. https://doi.org/10.1039/C6SC04647A.
[5] N. Saleh, E. Haensele, L. Banting, J. Sopkova-de Oliveira Santos, D. C. Whitley, G. Saldino, F. L. Gervasio, R. Bureau and T. Clark. 2016. A Three-Site Mechanism for Agonist/Antagonist Action on the Vasopressin Receptors, Angew Chem https://doi.org/10.1002/anie.201602729.
Figure 2: Schematic view of the metadynamics simulation protocol. A universal CV is defined (yellow arrow),a funnel-like constraint is used to prevent the ligand wandering in the solvent (gray) and multiple walkers (red/black) are used to improve sampling and parallel performance. [3]
Figure 3: the three binding sites found for the vasopressin receptor.

242
Life Sciences
Enzyme Design by QM/MM Monte CarloResearch InstitutionGroup for Computational Biocatalysis, Department of Chemistry, TUMPrincipal InvestigatorVille R. I. KailaResearchersSophie L. MaderProject Partners—
SuperMUC Project ID: pr74ve (Summer of Simulation project)
Introduction
We have developed a new method for computational protein design where we randomly mutate amino acids of enzymes using a Metropolis Monte Carlo (MC) proce-dure. The aim of the method is to identify substitutions that increase the catalytic activity, i.e., lower the reaction barrier for catalysis. We probe the catalytic activity by quantum mechanics/classical mechanics (QM/MM) cal-culations, which are important for accurately modeling chemical reactions [1].
Results and Methods
The QM/MM Monte Carlo (QM/MM MC) method has been tested using a computationally designed enzyme for a catalytic reaction step, here called Enzyme A. We wanted to predict mutations that would increase the efficiency of this enzyme. A related enzyme referred to as Enzyme B served as a reference to the predicted mu-tations. Enzyme B was obtained experimentally perform-ing mutations on Enzyme A in order to improve its cata-lytic efficiency.
The QM/MM MC method follows a mutation-equili-bration-evaluation scheme. In the first step, the initial structure of the enzyme undergoes a random mutation
move. The mutations are performed using the molecular modeling software Visual Molecular Dynamics (VMD) [2]. The mutated protein structure is equilibrated by classi-cal molecular dynamics (MD) simulations employing the software NAMD [3]. After the MD relaxation step, the reaction barrier is probed at quantum chemical level employing the program TURBOMOLE [4], by performing QM calculations on pre-optimized reactant and tran-sition state (TS) structures of the substrates within the mutated and relaxed enzyme structure. Based on the calculated reaction barrier, the mutation move is either accepted or rejected by applying the Metropolis Monte Carlo algorithm, following the next mutation cycle. The method has been implemented using the programming language Python.
During the beginning of the Summer of Simulation 2016, the QM/MM MC method was implemented on the Su-perMUC supercomputer. Using the parallelization frame-work Redisexec, N independent protein replicas, generat-ed from the same starting structure, were simulated in parallel on the SuperMUC thin nodes, with each replica occupying one node. In these simulations, the QM calcu-lations were performed in a sequential way.
Scaling tests were performed for the QM/MM MC meth-od within the parallelization framework Redisexec on the SuperMUC thin nodes with 16 CPUs each, subjecting each replica to five mutation moves, using one node per replica (Figure 1). Concluding from the scaling tests, 100 nodes were used within the parallelization framework Redisexec for the upcoming QM/MM MC calculations.
In order to reduce the time required for one mutation step, the implementation was modified to allow every replica to be calculated using two nodes instead of one. This way, the time needed for the MD relaxation step was reduced and both of the QM calculations were per-formed in parallel at the same time. All in all, the average time needed to perform one mutation step decreased from ca. 2 minutes to ca. 1.3 minutes.
Analysis of the mutations performed during multiple mutation trajectories shows that residues close to the active site are mutated most frequently (Figure 2). The computationally sampled mutations were found to re-
6
Figure 1: Scaling tests with five single mutations performed per node.

243
Enzyme Design by QM/MM Monte Carlo
duce the approximated barrier from ca. 10 kcal mol-1 to ca. 1 kcal mol-1.
We also computed free energy profiles for the reactions catalyzed by Enzyme A and Enzyme B, respectively, by employing the QM/MM umbrella sampling technique. To this end, 23 independent QM/MM MD simulations were performed for each of the enzymes, by subsequent-ly restraining the conformations along the reaction co-ordinate, going from the reactant state to the product conformation. The 46 conformations were sampled for 1 picosecond each, employing the CHARMM/TURBOMOLE interface [5]. These calculations were performed using the Redisexec framework as well, using one node per conformation.
The resulting free energy profiles are qualitatively in agreement with the experimental findings as the cal-culated reaction barrier for Enzyme A is higher than for Enzyme B (Figure 3).
The project consumed in total 6 million CPU hours. For every replica, ca. 2000 files were generated. Overall, ca. 1.5 TB of storage were needed, distributed over SCRATCH and PROJECT.
On-going Research / Outlook
SuperMUC provided us with the computing time we needed to test and apply our method. SuperMUC Phase 2 turned out to be most suitable for certain TURBOMOLE calculations.
During the scaling tests for the QM/MM MC method on 1024 nodes, the quota in PROJECT was filled up with so-called “in-doubt blocks”, possibly produced by the TUR-BOMOLE calculations. In order to avoid incidents like this for the upcoming scaling tests and production runs, the temporary files produced by TURBOMOLE were removed after each mutation cycle, and the production runs were performed on the SCRATCH file system.
Running more than 100 replicas in parallel, the increased number of I/O operations seemed to slow down the overall performance of the framework.
The catalytic activity of the mutated structures will be investigated further by both computational and experi-mental means. The umbrella sampling technique will be applied to the most promising mutated structures ob-tained from our QM/MM MC method, in order to verify that the reaction barrier of Enzyme A has been lowered.
References and Links
[1] https://www.compbio.ch.tum.de[2] William Humphrey, Andrew Dalke, and Klaus Schulten. 1996. VMD:
Visual Molecular Dynamics. J. Mol. Graphics 14, 1 (Feb. 1996), 33–38. DOI: https://doi.org/10.1016/0263-7855(96)00018-5
[3] James C. Phillips, Rosemary Braun, Wei Wang, James Gumbart, Emad Tajkhorshid, Elizabeth Villa, Christophe Chipot, Robert D. Skeel, Laxmikant Kalé, and Klaus Schulten. 2005. Scalable Molec-ular Dynamics with NAMD. J. Comput. Chem. 26, 16 (Dec. 2005), 1781–1802. DOI: https://doi.org/10.1002/jcc.20289
[4] Reinhart Ahlrichs, Michael Bär, Marco Häser, Hans Horn, and Christoph Kölmel. 1989. Electronic Structure Calculations on Workstation Computers: The Program System Turbomole. Chem. Phys. Lett. 162, 3 (Oct. 1989), 165–169. DOI: https://doi.org/10.1016/0009-2614(89)85118-8
[5] Saleh Riahi and Christopher N. Rowley. 2014. The CHARMM- TURBOMOLE Interface for Efficient and Accurate QM/MM Molecular Dynamics, Free Energies, and Excited State Properties. J. Comput. Chem. 35, 28 (Oct. 2014), 2076-2086. DOI: https://doi.org/10.1002/jcc.23716
Figure 2: Frequently mutated residues of Enzyme A with their most fre-quent mutation type shown using the following color code: blue: posi-tively charged, red: negatively charged, yellow: polar, green: non-polar.
Figure 3: Free energy profiles for the reaction steps catalyzed by Enzyme A and Enzyme B.

244
Life Sciences
Redox-coupled Proton Transfer Dynamics in Cytochrome c Oxidase
Research InstitutionTechnical University of MunichPrincipal InvestigatorVille R. I. KailaResearchersShreyas Supekar, Ana P. Gamiz-HernandezProject Partners—
SuperMUC Project ID: pr84gu
Introduction
Biological systems have evolved to effectively capture, store, and transform energy from one form to another. In mitochondria, which function as power plants of the eukaryotic cell, this process is catalyzed by enzymes of the respiratory chain that convert the energy from food-stuff into an electrical gradient stored across a biolog-ical membrane. Cytochrome c oxidase (CcO) functions as a terminal electron acceptor in all aerobic respiratory chains. It catalyzes the reduction of oxygen from the air into water by using electrons that the enzyme receives from foodstuff. CcO employs the free energy released from this process to pump protons across a membrane, establishing an electrochemical proton gradient across the membrane, which the cell further employs to drive energy-requiring processes. Nevertheless, despite decades of research, it still remains unclear how CcO pump protons across the membrane and what prevents the protons from leaking backwards in the pumping process.
Experiments show that when electrons travel through metal centers in CcO, two types of protons are trans-
ferred: the chemical protons are transferred to the ac-tive center to complete the oxygen reduction process, whereas the pumped protons are transferred across the membrane. CcO employs two channels for the uptake of these protons. All pumped protons are taken up from the so-called D-channel, whereas chemical protons originate from both the D- and K-channels, for reasons that remain unknown. Experiments also suggest that the pumped protons are transiently stored at a “proton-loading site” (PLS) before they are ejected across the membrane. The PLS is thus likely to function as an important coupling element in the pumping process. The aim of this study was to 1) identify the exact location of the PLS, 2) to probe how the electron transfer reactions through the metal centers modulate the proton transfer reaction barriers, and 3) to elucidate a molecular mechanism for the chan-nel switching process (Figure 1).
Results and Methods
In order to study the energetics and dynamics of CcO during its catalytic cycle, we performed large-scale at-omistic molecular dynamics (MD) simulations on micro-second timescales. To mimic the steps of the catalytic
6
Figure 1: The structure and function of cytochrome c oxidase (CcO). Reduction of oxygen to water drives electron transfer (blue arrows) via protein-bound metal centers (CuA, heme a) to the active site (heme a3/CuB). The electron transfer leads to uptake of protons (red arrows) from the negatively charged (N) side of the membrane using the D and K-chan-nels. A glutamic acid residue (Glu-242), at the end of the D-channel, transfers protons both to the active center and to transient proton loading site above the active center, from which the protons are released to the positively (P)-side of the membrane. Inset: The active site, and the hydrophobic cavity above Glu-242. The location of the putative proton loading site (PLS) is indicated with a dotted circle.
Redox-coupled Proton Transfer Dynamics in Cytochrome c Oxidase Technical University of Munich Ville R. I. Kaila Shreyas Supekar, Ana P. Gamiz-Hernandez pr84gu Introduction Biological systems have evolved to effectively capture, store, and transform energy from one form to another. In mitochondria, which function as power plants of the eukaryotic cell, this process is catalyzed by enzymes of the cell respiratory chain that convert the energy from foodstuff into an electrical gradient stored across a biological membrane. Cytochrome c oxidase (CcO) functions as a terminal electron acceptor in all aerobic respiratory chains. It catalyzes the reduction of oxygen from the air into water by using electrons that the enzyme receives from foodstuff. CcO further employs the free energy released from this process to pump protons across a membrane, establishing an electrochemical proton gradient across the membrane, which the cell further employs to drive energy-requiring processes. Nevertheless, despite decades of research, it still remains unclear how CcO pump protons across the membrane and furthermore, what prevents the protons from leaking backwards in the pumping process. The Cco reaction can be given as:
O2 + 4H+ + 4e- → 2H2O .
Experiments show that when electrons travel through metal centers in CcO, two types of protons are transferred: the chemical protons are translocated to the active center to complete the oxygen reduction process, whereas the pumped protons are transferred across the membrane. CcO employs two channels for the uptake of these protons. All pumped protons are taken up from the so-called D-channel, whereas chemical protons originate from both the D- and K-channels, for reasons that remain unknown. Experiments also suggest that the pumped protons are transiently stored at a "proton-loading site" (PLS) before they are ejected across the membrane. The PLS is thus likely to function as an important coupling element in the pumping process. The aim of this study was to 1) identify the exact location of the PLS, 2) to elucidate how the electron transfer reactions through the metal centers modulate the proton transfer reaction barriers, and 3) to elucidate a molecular mechanism for the channel switching process (Figure 1).
Figure 1. The structure and function of cytochrome c oxidase (CcO). Reduction of oxygen to water drives electron transfer (blue arrows) via protein-bound metal centers (CuA, heme a) to the active site (heme a3/CuB). The electron transfer leads to uptake of protons (red arrows) from the negatively charged (N) side of the membrane using the D- and K-channels. A glutamic acid residue (Glu-242), at the end of the D-channel, transfers protons both to the active center and to transient proton loading site above the active center, from which the protons are released to the positively (P)-side of the membrane. Inset: The active site, and the hydrophobic cavity above Glu-242. The location of the putative proton loading site (PLS) is indicated with a dotted circle.
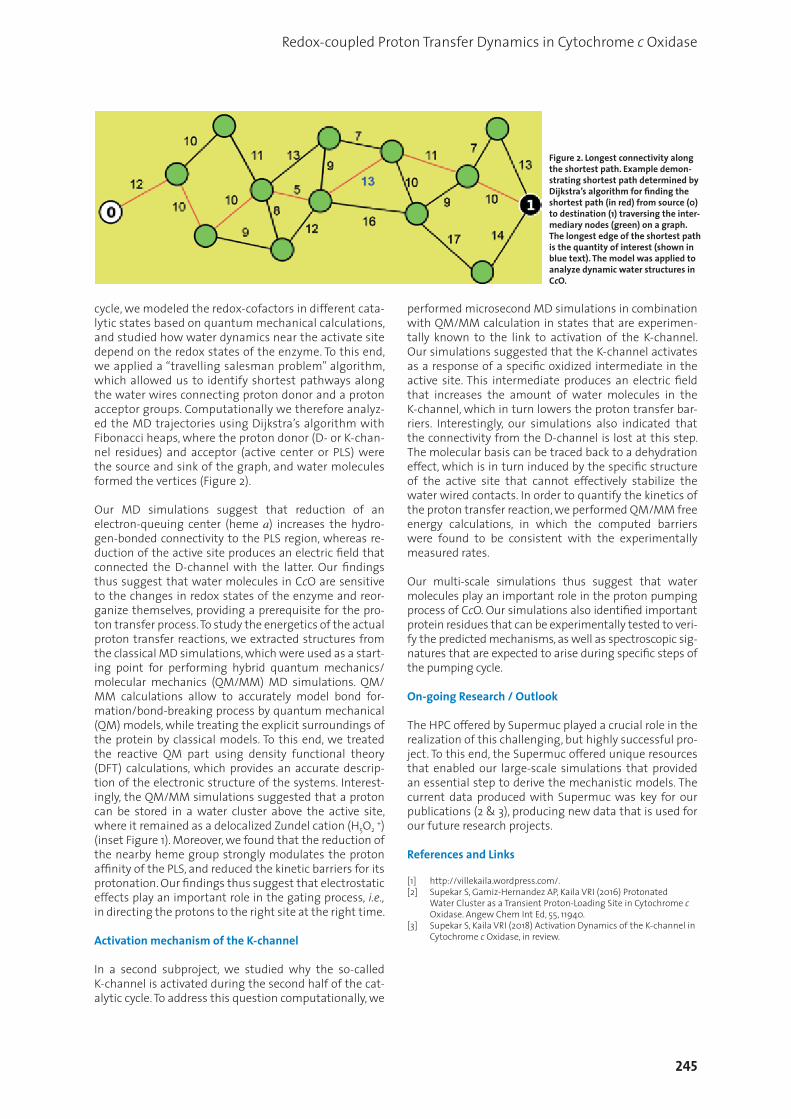
245
Redox-coupled Proton Transfer Dynamics in Cytochrome c Oxidase
cycle, we modeled the redox-cofactors in different cata-lytic states based on quantum mechanical calculations, and studied how water dynamics near the activate site depend on the redox states of the enzyme. To this end, we applied a “travelling salesman problem” algorithm, which allowed us to identify shortest pathways along the water wires connecting proton donor and a proton acceptor groups. Computationally we therefore analyz-ed the MD trajectories using Dijkstra’s algorithm with Fibonacci heaps, where the proton donor (D- or K-chan-nel residues) and acceptor (active center or PLS) were the source and sink of the graph, and water molecules formed the vertices (Figure 2).
Our MD simulations suggest that reduction of an electron-queuing center (heme a) increases the hydro-gen-bonded connectivity to the PLS region, whereas re-duction of the active site produces an electric field that connected the D-channel with the latter. Our findings thus suggest that water molecules in CcO are sensitive to the changes in redox states of the enzyme and reor-ganize themselves, providing a prerequisite for the pro-ton transfer process. To study the energetics of the actual proton transfer reactions, we extracted structures from the classical MD simulations, which were used as a start-ing point for performing hybrid quantum mechanics/molecular mechanics (QM/MM) MD simulations. QM/MM calculations allow to accurately model bond for-mation/bond-breaking process by quantum mechanical (QM) models, while treating the explicit surroundings of the protein by classical models. To this end, we treated the reactive QM part using density functional theory (DFT) calculations, which provides an accurate descrip-tion of the electronic structure of the systems. Interest-ingly, the QM/MM simulations suggested that a proton can be stored in a water cluster above the active site, where it remained as a delocalized Zundel cation (H5O2 +) (inset Figure 1). Moreover, we found that the reduction of the nearby heme group strongly modulates the proton affinity of the PLS, and reduced the kinetic barriers for its protonation. Our findings thus suggest that electrostatic effects play an important role in the gating process, i.e., in directing the protons to the right site at the right time.
Activation mechanism of the K-channel
In a second subproject, we studied why the so-called K-channel is activated during the second half of the cat-alytic cycle. To address this question computationally, we
performed microsecond MD simulations in combination with QM/MM calculation in states that are experimen-tally known to the link to activation of the K-channel. Our simulations suggested that the K-channel activates as a response of a specific oxidized intermediate in the active site. This intermediate produces an electric field that increases the amount of water molecules in the K-channel, which in turn lowers the proton transfer bar-riers. Interestingly, our simulations also indicated that the connectivity from the D-channel is lost at this step. The molecular basis can be traced back to a dehydration effect, which is in turn induced by the specific structure of the active site that cannot effectively stabilize the water wired contacts. In order to quantify the kinetics of the proton transfer reaction, we performed QM/MM free energy calculations, in which the computed barriers were found to be consistent with the experimentally measured rates.
Our multi-scale simulations thus suggest that water molecules play an important role in the proton pumping process of CcO. Our simulations also identified important protein residues that can be experimentally tested to veri-fy the predicted mechanisms, as well as spectroscopic sig-natures that are expected to arise during specific steps of the pumping cycle.
On-going Research / Outlook
The HPC offered by Supermuc played a crucial role in the realization of this challenging, but highly successful pro-ject. To this end, the Supermuc offered unique resources that enabled our large-scale simulations that provided an essential step to derive the mechanistic models. The current data produced with Supermuc was key for our publications (2 & 3), producing new data that is used for our future research projects.
References and Links
[1] http://villekaila.wordpress.com/.[2] Supekar S, Gamiz-Hernandez AP, Kaila VRI (2016) Protonated
Water Cluster as a Transient Proton-Loading Site in Cytochrome c Oxidase. Angew Chem Int Ed, 55, 11940.
[3] Supekar S, Kaila VRI (2018) Activation Dynamics of the K-channel in Cytochrome c Oxidase, in review.
Figure 2. Longest connectivity along the shortest path. Example demon-strating shortest path determined by Dijkstra’s algorithm for finding the shortest path (in red) from source (0) to destination (1) traversing the inter- mediary nodes (green) on a graph. The longest edge of the shortest path is the quantity of interest (shown in blue text). The model was applied to analyze dynamic water structures in CcO.
Results and Methods In order to study the energetics and dynamics of CcO during its catalytic cycle, we performed large-scale atomistic molecular dynamics (MD) simulations on microsecond timescales. To mimic the steps of the catalytic cycle, we modeled the redox-cofactors in different catalytic states based on quantum mechanical calculations, and studied how water dynamics near the activate site depend on the redox states of the enzyme. To this end, we applied a "travelers’ problem" algorithm, which allowed us to identify shortest pathways along the water wires connecting proton donor and a proton acceptor groups. Computationally we therefore analyzed the MD trajectories using Dijkstra’s algorithm with Fibonacci heaps, where the proton donor (D- or K-channel residues) and acceptor (active center or PLS) were the source and sink of the graph, and water molecules formed the vertices (Figure 2).
Figure 2. Longest connectivity along the shortest path. Example demonstrating shortest path determined by Dijkstra's algorithm for finding the shortest path (in red) from source (0) to destination (1) traversing the intermediary nodes (green) on a graph. The longest edge of the shortest path is the quantity of interest (shown in blue text). Our MD simulations suggest that reduction of an electron-queuing center (heme a) increases the hydrogen-bonded connectivity to the PLS region, whereas reduction of the active site produces an electric field that connected the D-channel with the latter. Our findings thus suggest that water molecules in CcO are sensitive to the changes in redox states of the enzyme and reorganize themselves, providing a prerequisite for the proton transfer process. To study the energetics of the actual proton transfer reactions, we extracted structures from the classical MD simulations, which were used as a starting point for performing hybrid quantum mechanics/molecular mechanics (QM/MM) MD simulations. QM/MM calculations allow to accurately model bond-formation/bon-breaking process by quantum mechanical (QM) models, while treating the explicit surroundings of the protein by classical models. To this end, we treated the reactive QM part using density functional theory (DFT) calculations, which provides an accurate description of the electronic structure of the systems. Interestingly, the QM/MM simulations suggested that a proton can be stored in water cluster above the active site, where it remained as a delocalized Zundel cation (H5O2
+) (inset Figure 1). Moreover, we found that the reduction of the nearby heme group strongly modulates the proton affinity of the PLS, and reduced the kinetic barriers for its
protonation. Our findings thus suggest that that electrostatic effects play an important role in the gating process, i.e., in directing the protons to the right site at the right time. Activation mechanism of the K-channel
In a second subproject, we studied why the so-called K-channel is activated during the second half of the catalytic cycle. To address this question computationally, we performed microsecond MD simulations in combination with QM/MM calculation in state that are experimentally known to link to activation of the K-channel. Our simulations suggested that the K-channel activates as a response of a specific oxidized intermediate in the active site. This intermediate produces an electric field that increases the amount of water molecules in the K-channel, which in turn lowers the proton transfer barriers. Interestingly, our simulations also indicated that the connectivity from the D-channel is lost at this step. The molecular basis can be traced back to a dehydration effect, which is in turn induced by the specific structure of the active site that cannot stabilize the water wired-contacts. In order to quantify the kinetics of the proton transfer reaction, we performed QM/MM free energy calculations, in which the computed barriers were found to be close to the experimentally measured rates.
Our multi-scale computational studied performed here thus suggest that water molecules play an important role in the proton pumping process of CcO. Our simulations also identified important protein residues that can be experimentally tested to verify the predicted mechanisms, as well as spectroscopic signatures that are expected to arise during specific steps of the pumping cycle.
On-going Research / Outlook The HPC offered by Supermuc played a crucial role in the realization of this challenging, but highly successful project. To this end, the Supermuc offered unique resources that enabled our large-scale simulations that provided an essential step to derive the mechanistic models. The current data produced with Supermuc was key for our publications (2 & 3), producing new data that is used for our future research projects.
References and Links 1. http://villekaila.wordpress.com/. 2. Supekar S, Gamiz-Hernandez AP, Kaila VRI (2016)
Protonated Water Cluster as a Transient Proton-Loading Site in Cytochrome c Oxidase. Angew Chem Int Ed, 55, 11940.
3. Supekar S, Kaila VRI (2018) Activation Dynamics of the K-channel in Cytochrome c Oxidase, in review

246
Life Sciences
How Does the HIV Virus Hijack the Human Nuclear Pore Complex?
Research InstitutionTheoretical and Computational Biophysics Dept., Max-Planck-Institute for Biophysical ChemistryPrincipal InvestigatorHelmut Grubmüller ResearchersSarah RauscherProject Partners—
SuperMUC Project ID: pr84ma (Gauss Large Scale project)
Introduction
How does HIV (human immunodeficiency virus) pass its genetic material into and out of the cell nucleus without being detected by the human host cell? Two HIV proteins (Rev and capsid/CA) are responsible, but the molecular mechanisms they use to disguise the ribonucleic acid of HIV and proteins from the human nuclear pore complex are not understood. A study, conducted by scientists of the Max Planck Institute for Biophysical Chemistry in Göttingen, aims to provide structural information on the relevant protein-protein interactions, which is a nec-essary step in the rational design of drugs targeting Rev and CA.
HIV evolves rapidly, and multi-drug resistant strains have already emerged. However, only 31 drugs have been ap-proved, which target only four HIV proteins. Two novel drug targets were the focus of this research: Rev and the capsid (CA) protein. Rev is essential to replication of the virus, while the HIV core particle is enclosed by many copies of CA. Drugs targeting Rev and CA have been identified, but so far none have reached clinical trials.
The Göttingen based scientists leveraged the computing power of HPC system SuperMUC to simulate detailed and accurate models of the protein-protein interactions involved with the aim to facilitate the design of more ef-fective drugs.
Work Completed
The scientists carried out a rigorous evaluation of the accuracy of de novo intrinsically disordered protein (IDP) ensembles. IDPs fulfil many essential biological roles from cell signalling to maintaining the selective barrier of the nuclear pore complex. Their disordered nature has been shown in many cases to be crucial to their function.
While molecular simulations are increasingly being used to obtain conformational ensembles of IDPs, there is cur-rently no consensus on the accuracy of these ensembles, or the suitability of modern empirical force fields for this purpose. In their study, the scientists assessed the accu-racy of IDP ensembles obtained using state-of-the-art force fields (Rauscher 2015). Carrying out such a compar-ative study presented a huge computational challenge, which was only possible with the large compute time allocation on HPC system SuperMUC.
The conducted comparison of force fields led to several unexpected results. First, the extent of the difference between ensembles is unexpectedly large, spanning the complete range from globule-like to highly expand-ed. The key finding of the researchers’ joint experimen-tal-computational study is that one single force field, CHARMM 22*, stands out in that it is consistent with small angle x-ray scattering and NMR data within ex-perimental error. Thus, having obtained an accurate IDP ensemble, the potential long-term impact of this work extends far beyond an assessment of force field accuracy.
Following up on this work, in a joint study together with the groups of Alex MacKerell (Univ. of Maryland) and Mi-chael Feig (Michigan State), the researchers developed and carried out tests of a new version of the CHARMM protein force field (CHARMM 36m) (Huang 2017). Exten-
6
Figure 1: An interaction partner of the HIV Rev protein, Importin-β. a, Crystal structure of the importin-β binding domain of importin-α (red) with importin-β (green) from PDB ID 1QGK. b, The same crystal structure as shown in a with a top view looking into the center of the importin-β superhelical structure.

247
How Does the HIV Virus Hijack the Human Nuclear Pore Complex?
sive tests of the new force field for both folded and dis-ordered proteins were carried out on SUPERMUC. In all test cases, CHARMM 36m outperformed its predecessor, CHARMM 36. The potential impact of this work is signif-icant because we now have a force field suitable for sim-ulations of both folded and disordered proteins, which forms the basis for the study of the HIV proteins.
References
[1] Huang, J., Rauscher, S., Nawrocki, G., Ran,T., Feig, M., de Groot, B. L., Grubmüller, H., and MacKerell Jr., A. D. (2017) CHARMM36m: An Im-proved Force Field for Folded and Intrinsically Disordered Proteins. Nature Methods 14, 71-73
[2] Kutzner, C., Apostolov, R., Hess, B., Grubmüller, H. Scaling of the GROMACS 4.6 molecular dynamics code on SuperMUC. Parallel Computing: Accelerating Computational Science and Engineering (CSE) 722-730, IOS Press, NL (2014).
[3] Rauscher, S., Gapsys, V., Gajda, M. J., Zweckstetter, M., de Groot, B. L., and Grubmüller, H. (2015) Structural Ensembles of Intrinsically Disordered Proteins Depend Strongly on Force Field: A Comparison to Experiment. Journal of Chemical Theory and Computation 11, 5513−5524.
Figure 2: Conformational ensembles of an IDP in eight different molec-ular mechanics force fields. The ensemble obtained with CHARMM 22* (yellow) is consistent with experimental data from both small angle x-ray scattering and NMR measurements.
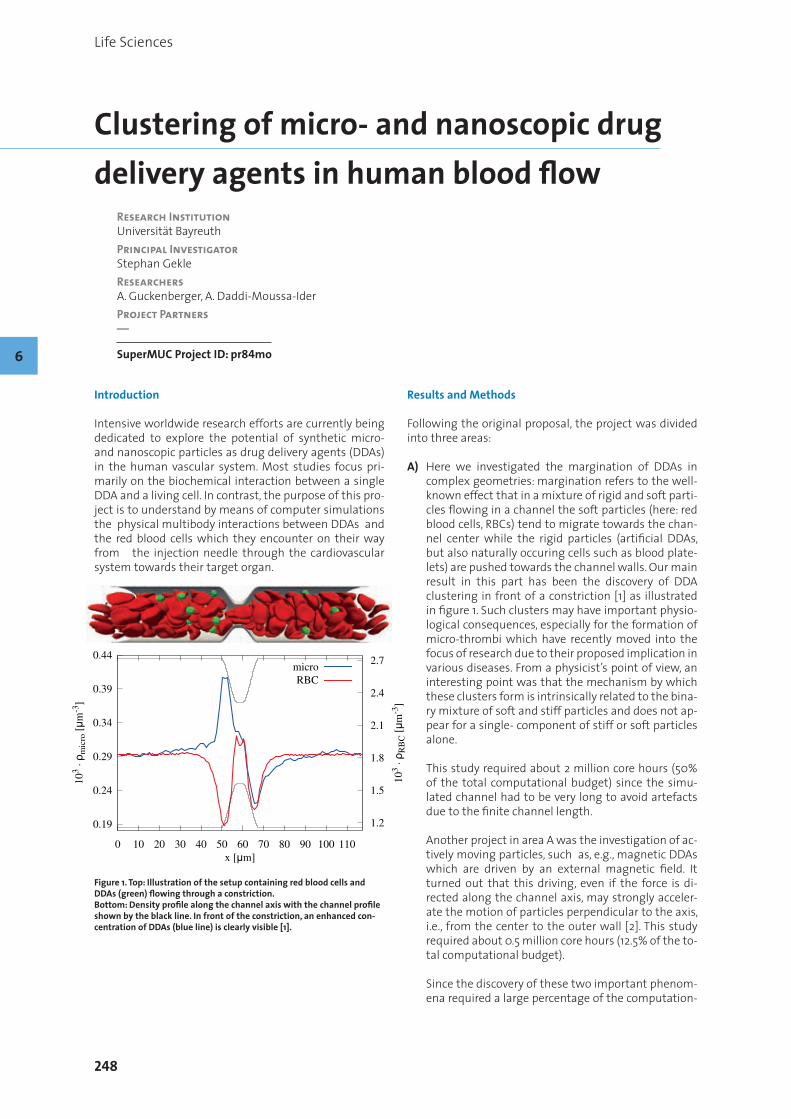
248
Life Sciences
Clustering of micro- and nanoscopic drug delivery agents in human blood flow
Research InstitutionUniversität Bayreuth Principal InvestigatorStephan Gekle ResearchersA. Guckenberger, A. Daddi-Moussa-Ider Project Partners—
SuperMUC Project ID: pr84mo
Introduction
Intensive worldwide research efforts are currently being dedicated to explore the potential of synthetic micro- and nanoscopic particles as drug delivery agents (DDAs) in the human vascular system. Most studies focus pri-marily on the biochemical interaction between a single DDA and a living cell. In contrast, the purpose of this pro-ject is to understand by means of computer simulations the physical multibody interactions between DDAs and the red blood cells which they encounter on their way from the injection needle through the cardiovascular system towards their target organ.
Results and Methods
Following the original proposal, the project was divided into three areas:
A) Here we investigated the margination of DDAs in complex geometries: margination refers to the well-known effect that in a mixture of rigid and soft parti-cles flowing in a channel the soft particles (here: red blood cells, RBCs) tend to migrate towards the chan-nel center while the rigid particles (artificial DDAs, but also naturally occuring cells such as blood plate-lets) are pushed towards the channel walls. Our main result in this part has been the discovery of DDA clustering in front of a constriction [1] as illustrated in figure 1. Such clusters may have important physio-logical consequences, especially for the formation of micro-thrombi which have recently moved into the focus of research due to their proposed implication in various diseases. From a physicist’s point of view, an interesting point was that the mechanism by which these clusters form is intrinsically related to the bina-ry mixture of soft and stiff particles and does not ap-pear for a single- component of stiff or soft particles alone.
This study required about 2 million core hours (50% of the total computational budget) since the simu-lated channel had to be very long to avoid artefacts due to the finite channel length.
Another project in area A was the investigation of ac-tively moving particles, such as, e.g., magnetic DDAs which are driven by an external magnetic field. It turned out that this driving, even if the force is di-rected along the channel axis, may strongly acceler-ate the motion of particles perpendicular to the axis, i.e., from the center to the outer wall [2]. This study required about 0.5 million core hours (12.5% of the to-tal computational budget).
Since the discovery of these two important phenom-ena required a large percentage of the computation-
6
Figure 1. Top: Illustration of the setup containing red blood cells and DDAs (green) flowing through a constriction. Bottom: Density profile along the channel axis with the channel profile shown by the black line. In front of the constriction, an enhanced con-centration of DDAs (blue line) is clearly visible [1].
0.19
0.24
0.29
0.34
0.39
0.44
0 10 20 30 40 50 60 70 80 90 100 110
1.2
1.5
1.8
2.1
2.4
2.7
103 · ρ m
icro
[µm
-3]
103 · ρ R
BC
[µm
-3]
x [µm]
microRBC

249
Clustering of micro- and nanoscopic drug delivery agents in human blood flow
al budget research on margination near bifurcations has been postponed to the next project period.
B) Here we focused on smaller systems with one or two red blood cells flowing behind each other in a small channel. Recent experiments in the group of C. Wag-ner in Saarbrücken found that such a setup can lead to hydrodynamic clusters, i.e., that two cells sponta-neously attain a position in which they flow behind each other with a stable and well defined distance [3]. Our simulations were able to reproduce this ef-fect. In the course of these investigations, however, we discovered an unexpectedly rich behavior of even a single red blood cell. More precisely, it turned out that the motion is very often bistable, i.e., that two different dynamic modes are attained depending solely on the initial radial position of the RBC. This bistability has been overlooked in recent numerical works [4], but does seem to appear in the experi-ments. We are currently preparing these results for publication together with our partners in Saarbrück-en. This project used about 1 million core hours (25% of the computational budget).
C) In this project we investigated the diffusion (Brown-ian motion) of nanoparticles in close vicinity to a cell membrane. The diffusional approach between na-noparticle and cell represents the crucial first step before endocytosis, i.e., uptake of the nanoparticle by the cell. We have investigated various aspects of this phenomenon starting with a single particle near a planar cell membrane [5] and between two mem-branes [6]. We found that due to the elasticity of the membrane the system acquired a memory leading to pronounced subdiffusive behavior of the particle even in a simple Newtonian carrier fluid like water. Such subdiffusive behavior has thus far been almost only observed in complex non-Newtonian fluids. We then extended our studies to the hydrodynamic in-teraction between two particles where we found that the presence of the membrane induces attrac-tive interactions (while a rigid wall always leads to repulsive interaction) which may cause the forma-tion of medically relevant particle clusters [7]. Most recently, we also studied the influence of the particle shape [8].
In this area C we derived analytical theories for the various particle mobilities/diffusivities. As an essen-tial validation, these theories were then verified by numerical simulations run on SuperMUC. This area used about 0.25 million core hours (6.25% of the com-putational budget).
D) As a final area, which was not foreseen in the original proposal, we investigated in detail the benefits and drawbacks of various algorithms to compute bend-ing forces in elastic cell membranes [9, 10]. This is a numerically very challenging task since it involves the numerical computation of the fourth spatial deri-vate over a discretized membrane surface (see fig-ure 2). This project used about 0.25 million core hours (6.25% of the budget).
On-going Research / Outlook
Due to the success and the scientific insights gained by the usage of SuperMUC we plan to continue the project.
References and Links
Publications resulting from this SuperMUC project are italic.
[1] Bächer, C., Schrack, L. & Gekle, S. Clustering of microscopic particles in constricted blood flow. arXiv:1608.06123 (2016).
[2] Gekle, S. Strongly Accelerated Margination of Active Particles in Blood Flow. Biophys J 110, 514–520 (2016).
[3] Clavería, V. et al. Clusters of red blood cells in microcapillary flow: hydrodynamic versus macromolecule induced interaction. Soft Matter 12, 8235–8245 (2016).
[4] Fedosov, D. A., Peltomäki, M. & Gompper, G. Deformation and dynamics of red blood cells in flow through cylindrical microchan-nels. Soft Matter 10, 4258 (2014).
[5] Daddi-Moussa-Ider, A., Guckenberger, A. & Gekle, S. Long-lived anomalous thermal diffusion induced by elastic cell membranes on nearby particles. Phys. Rev. E 93, 012612 (2016).
[6] Daddi-Moussa-Ider, A., Guckenberger, A. & Gekle, S. Particle mobil-ity between two planar elastic membranes: Brownian motion and membrane deformation. Phys. Fluids 28, 071903–20 (2016).
[7] Daddi-Moussa-Ider, A. & Gekle, S. Hydrodynamic interaction between particles near elastic interfaces. J. Chem. Phys. 145, 014905–14 (2016).
[8] Daddi-Moussa-Ider, A., Lisicki M. & Gekle, S. Mobility of an axisym-metric particle near an elastic interface. J. Fluid Mech. (accepted)
[9] Guckenberger, A., Schraml, M. P., Chen, P. G., Leonetti, M. & Gekle, S. On the bending algorithms for soft objects in flows. Comput. Phys. Commun. 207, 1–23 (2016).
[10] Guckenberger, A. & Gekle S. How to bend a cell membrane in silico. J. Phys. Cond. Mat. (invited topical review, in preparation).
Figure 2: The error in the bending forces computed over a red blood cell membrane for one of the six algorithms investigated in [9].

250
Life Sciences
Parallel Simulated Solute Tempering in Hybrid DFT/PMM Simulations
Research InstitutionLudwig-Maximilians-Universität MünchenPrincipal InvestigatorGerald MathiasResearchersMagnus Schwörer Project Partners—
SuperMUC Project ID: pr89xe (KONWIHR Project)
Introduction
The sampling of the conformational space of molecules by plain molecular dynamics (MD) simulations is com-putationnally inefficient. If one aims at an unbiased structural ensemble or has no prior knowledge of the free energy landscape, temperature replica-exchange methods (TREM) can alleviate the sampling problem. They are used in many biomolecular MD applications, although the large number of degrees of freedom leads to small temperature gaps between temperature rungs and, correspondingly, a large number of replicas is need-ed to span a reasonable temperature range. For hybrid simulations, where solute molecules are treated with high-level density functional theory (DFT), whereas the surrounding is described on a (polarizable) force-field level (see Figure 1), the large number of replicas makes TREM prohibitively expensive.
Here, we have combined the DFT/PMM hybrid approach with the simulated solute tempering (SST) generalized ensemble method [1] sketched in Fig. 2. Because SST ef-fectively heats up only the solute it requires only a few rungs on the SST temperature ladder and yields a par-ticularly efficient sampling needed for the costly DFT/
PMM method. The necessary SST parameters, so-called weights, can be obtained from inexpensive preparatory PMM simulations.
Computational approach
As a first application, we computed the free energy land-scape and the vibrational spectra of the alanine dipep-tide molecule (DFT), which was solvated in PMM water (Fig.1) [4].
For the pSST setup we ran 32 replicas occupying the rungs of a Tk∈{300 K, 406 K, 550 K} ladder. Only three rungs suffice for this temperature range to yield an ef-ficient exchange probability of around 30 %. All replicas were propagated for 0.5 ns of trajectory. 33 % of the time, they occupied rung T0=300 K to yield a total of 6 ns tra-jectory data at this reference temperature. From this data, we computed the free energy landscape of the mol-ecule and drew 400 initial conditions for a subsequent computation of vibrational spectra by a time-correlation framework. Here, we computed 50 ps of NVT0 trajectory for each initial condition and performed a conformation-ally resolved generalized normal coordinate analysis [5] to yield the vibrational spectra.
6
Figure 1: A alanine dipeptide (Ac-Ala-NHMe) treated by DFT immersed in PMM water. The electron density (shaded area) is colored according to the electrostatic potential generated by the solvent. In our approach we combine the grid-based DFT code CPMD with the PMM-MD code IPHIGENIE [2,3].
Figure 2: In SST simulations, the system replicas frequently change the simulation temperature. At high temperatures, enthalpic barriers can be crossed and newly visited molecular conformations can contribute to the ensemble of interest at low temperature after the replica has travelled through temperature space. In SST, only the solute changes its effective temperature, whereas the solvent remains at the reference temperature T0. Multiple replicas can be simulated independently in parallel but contribute to a common weight statistics (pSST [1]).

251
Parallel Simulated Solute Tempering in Hybrid DFT/PMM Simulations
Results
Figure 3 shows the free energy landscape resulting from our pSST ensemble. The minima ppII, α, α L , and α D are well resolved. The C5 minimum is a shallow basin. The global minimum is the α configuration but ppII lies en-ergetically only slightly above. To probe the convergence of the pSST simulation, we have computed a one dimen-sional cut through the free-energy landscape by umbrel-la sampling (US), which is shown in Figure 4. The relative depth of the minima labeled A and B as well as the sepa-rating barriers are nearly identical in both methods. Only the shape of the plateau region near Ψ =-120° is not fully converged in pSST.
Finally, we show the vibrational spectra for the two dominant conformations ppII and α in Figure 5. In the
characteristic region between 1450 cm-1 and 1650 cm-1 the band pattern of the two conformations strongly dif-fer due to the different spectral positions and intensities of the aminde I and II modes localized on the left and right part of the molecule.
Summary
We have shown that the pSST method efficiently sam-ples the configuration space of solutes in DFT/(P)MM simulations in an unbiased manner. The method is high-ly parallel and scales excellently because the replicas are only weakly coupled by the common weight update scheme.
Acknowledgements
Generous allocation of CPU time during the friendly user phase of SuperMUC Phase II by the LRZ is gratefully ac-knowledged. This project was financially supported by the KONWHIR-III software initiative and by the DFG (SFB 749-C4).
References and Links
[1] M. Schwörer et al., J. Chem. Theory Comput. 12, 992 (2016)[2] https://sourceforge.net/projects/iphigenie/
http://www.cpmd.org[3] M. Schwörer et al., J. Chem. Phys. 142, 104108 (2015)[4] M. Schwörer et al.,, in preparation[5] G. Mathias et al., J. Chem. Theory Comput. 8, 224–234 (2012)
Figure 3: Free energy landscape spanned by the Φ-Ψ dihedral angles of alanine dipeptide obtained from DFT/PMM pSST simulations.
Figure 4: Cut through the free energy landscape at Φ = -120° obtained from the pSST data and umbrella-sampling simulations.
Figure 5: IR intensity of the vibrational spectra if the pII (upper) and α (lower) conformations, whose structure is shown in the insets. The bold orange lines mark the overall IR absorbance; the thin colored lines show contributions of individual vibrational modes.

252
Life Sciences
Finding Nano-force Sensors inside Skin using Supercomputer Simulations
Research InstitutionHeidelberg Institute for Theoretical StudiesPrincipal InvestigatorFrauke GräterResearchersCsaba DadayProject PartnersInstitute for Scientific Computing (IWR), Heidelberg University
SuperMUC Project ID: pr92ne
Introduction
Resarch done in the Molecular Biomechanics group at Heidelberg Institute for Theoretical Studies[1] identified a good candidate for a molecular force sensor inside skin.Using several million computer hours at SuperMUC, we simulated how a particular component of skin could be responsible for force sensing inside tissues. This area of inquiry has so far been unexplored, particularly since ex-periments with these molecules have proven very diffi-cult to accomplish.
Results and Methods
Our project involved the simulation of the force response of two critical proteins at cell-cell junctions, especially in skin: desmoplakin and plectin. Through the careful and systematic study of these proteins, we proposed a new activation mechanism that could explain force sensing inside tissues, which is a relatively poorly understood bi-ological process.
A large part of these two proteins is made of so-called spectrin repeats (SRs), which are rigit units of three hel-ices each. This makes them ideal for transmitting force, but also their modular nature makes them capable of adapting their length to external perturbations through the breakage of some SRs. However, strikingly, an SH3 domain naturally appears in many of these proteins, interacting with two spectrin repeats. This repeat, fun-damentally different to SRs, is known to be a signalling molecule, but it is interacting with the protein itself un-der normal circumstances.
Our project simulated how the direct proximity of this SH3 domain interacts with external force. In all of our simulations, we found that the SH3 domain is fully intact when under force, and the protein is activated, possibly starting a signalling cascade involved in force sensing (see Figure 1).[2] Through exhaustive sampling, we also identified the most important residues that are responsible for this activation mechanism (Figure 2). Furthermore, we identified at least two distinct ac-
tivation pathways for plectin, which also required less external force to open up.
To understand these processes, we conducted large-scale molecular dynamics simulations (MD) on SuperMUC. All-atom MD has been the method of choice for under-standing how biological systems evolve in time, but also has answered questions in topics like fluid dynamics or material science.
MD essentially involves the integration of Newton’s equations of motion, where short-range chemical inter-actions are included as “bonded terms”, scaling as O(N) (N being the number of atoms in our system), while elec-trostatic and van der Waals interactions are included as “non-bonded terms”, which scale in principle as O(N2), but can be reduced to O(NlogN) through judicious ap-proximations including summing in Fourier space (called particle mesh Ewald) or multipole expansions.
Our work used the widely known open-source software package called GROMACS[3], already installed on site at LRZ. This package has been optimized for supercom-puters down to about a thousand atoms per core. Given that our system sizes ranged from 500k-1.6M atoms, we could efficiently use about 300-600 cores per simula-tion. However, given that the behaviour of our systems is stochastic, we needed to simulate our system starting from several different initial conditions, sometimes yield-ing drastically different results.
A key aspect of our project was reducing the external force applied on our systems. This meant that our simu-lations ran longer than typical MD simulations done on similarly large systems. Our simulation time amassed a total of 100 μs, which translates to about 7 million core-hours on LRZ, generating almost 1 TB of data. Our longest simulations lasted about 3 months each, not including queuing.
6

253
Finding Nano-force Sensors inside Skin using Supercomputer Simulations
On-going Research / Outlook
Our project was successful in identifying an intriguing new possibility in the field of mechanosensing, but there are still other intriguing directions to explore.
One main difference between simulations and physio-logical conditions and experiments is the relatively fast pulling we need to perform in order to make simulation times manageably short. In practice, the time scales we can reach using MD are on the order of μs, which is still probably at least 3 orders of magnitude shorter than physiological time scales, and correspondingly the pro-teins are subjected to unreasonably large forces. Another important direction to explore would be simulating sev-eral proteins relevant to this process, i.e., including po-tential binding partners. This would increase our system size significantly.
Larger computers and/or more computer time could en-able us reaching these time- and length scales. In par-ticular, better inter-node communication could help the scaling go to higher nodes and therefore reduce the total wall-clock time.
References and Links
Example:[1] www.h-its.org/en/research/mbm/[2] C Daday, K Kolsek, and F. Gräter, Sci Rep-UK 7 (2017), 11669[3] MJ Abraham, T Murtola, R Schulz, S Páll, JC Smith, B Hess, E Lindahl,
SoftwareX 1 (2015) 19-25 GROMACS: High performance molecular simulations through multi-level parallelism from laptops to supercomputers SoftwareX 1 (2015) pp. 19-25
Figure 2: The most important residues that participate in the activation process of desmoplakin. Green letters and balls-and-sticks representation show residues inside the helices of the spectrin repeats, while purple letters and licorice representation show residues inside the barrel of the SH3 domain.
Figure 1: The activation mechanism of desmoplakin under force. The SH3 domain (gray), chemically unavailable under normal circumstances, is “torn off” due to external forces, and is capable of launching a signalling cascade. The binding pocket of the SH3 domain is coloured orange.

254
Life Sciences
Targeting FtsZ assembly for the development of new antibiotics
Research InstitutionRocasolano Physical Chemistry Institute (IQFR-CSIC). Biological Physical Chemistry DepartmentPrincipal InvestigatorPablo ChaconResearchersErney Rámirez-Aportela, José Manuel AndreuProject PartnersCentro de Investigaciones Biológicas (CIB-CSIC)
SuperMUC Project ID: pr94ze (PRACE project)
Introduction
Cell division protein FtsZ is the organizer of the bacterial cytokinetic ring. FtsZ is a filament-forming GTPase that is thought to generate constriction force by a combina-tion of filament bending, condensation and recycling. FtsZ and its eukaryote relative, tubulin, have molecular switches in their assembly-disassembly cycle, triggered by the presence or absence of the nucleotide gamma phosphate, which permit polymer regulation. Given its key role in division of the majority of bacteria, FtsZ has emerged as target for seeking new antibiotics to fight the widespread emergence of pathogens resistant to current antibiotics.
Only very recently, the assembled sates of a straight FtsZ have been solved at atomic detail. Using this novel infor-mation, our goal is to perform all-atom simulations of long filaments bound to several biologically character-ized modulators to better understand their inhibition mechanisms. In particular, we are interested in the rela-tionship between the assembly molecular mechanism and the binding of modulators to help the rational de-sign of new antibiotics.
We recently report a state of the art study of the FtsZ filament dynamics interpreted in the context of the as-sembly cycle of this essential cell division protein [1]. In contrast with all previous studies based on the inactive (not functional) closed-cleft FtsZ conformation studies, our large scale simulations studies disclose different fil-ament curvatures supported by nucleotide-regulated in-terfacial dynamics. Moreover, we have monitored, for the first time, the relaxation from the active polymer confor-mation to the inactive closed-cleft conformation of FtsZ monomers. In agreement with experimental data, these groundbreaking results unravel the natural mechanism of the FtsZ assembly switch. Integrating this assembly switch and the nucleotide-dependent interfacial fila-ment stability, our work offers a detailed molecular in-terpretation of the assembly-disassembly FtsZ cycle and its inhibition (see Figure 1). Based on these results, we strongly think that the structure-based drug discovery
efforts on this system can be only tackled by targeting the dynamics of the functional filament structure using atomistic simulations.
Results and Methods
Here we performed a molecular dynamics simulation study of FtsZ filament structures bound to several bio-logically characterized modulators to better understand their inhibition mechanisms. MD simulations were per-formed on FtsZ heptamers (~500,000 atoms, including water molecules). generated by crystallographic symme-try operations from the X-ray crystal structures of SaFtsZ bound to GDP (PDB ID 3V08) and to complex PC190723 (PDB ID 3V0B). The GDP and PC190723 crystallograph-ic coordinates were replaced by optimized poses of the tested compounds in the corresponding binding site. For each filament-compound system, we carry out at least five MD simulations of 300-500 ns in length. Note that these FtsZ filaments are quite flexible and require long simulation times to achieve convergence. We typically employ 1024 cores to produce the long scale simulations that imply around 0.65 ns per CPU hours. Therefore the production time of one simulation system roughly takes several days to complete. The amount of sampling re-quired to carry out all the simulations planned would not be possible without the level of performance and scalability offered by SuperMUC.
There are a growing number of substances, some of them the product of large screens, reported to have some effect on FtsZ polymerization, FtsZ GTPases or bacterial cytokinesis [2]. There are two main binding sites 1) the nucleotide binding site located at the interface between dimers 2) interdomain cleft between C-terminal and the N-terminal domains. Therefore depending on the bind-ing site we performed to type of studies:
1) Targeting the polymerization interface between FtsZ monomers including the GTP binding site. This includes two optimized analogs of the polyhydroxy aromatic compounds described in [2], a Chrysophaentins fragment reported to be active [3], and two unpublished
6

255
Targeting FtsZ assembly for the development of new antibiotics
compounds obtained from an in house virtual screening study. All these compounds that cover representative different scaffolds are GTP-replacing FtsZ inhibitors with antibacterial activity.
2) Targeting the FtsZ activation switch. First we revisited the filament stabilization mechanism of the effective antibacterial compound PC190723[7], which binds at a cleft between both FtsZ domains. Then we study also study a several fluorescent derivatives amenable for binding assays. Finally, we performed sim-ulation on three novel compounds with antibacterial activities that we have identified from virtual screening.
On-going Research / Outlook
Our results indicate the in the case of nucleotide site all compounds tested have a clear destabilization effect. By the contrary, in the case of PC190723 derivatives, the binding into the cleft between domains blocks the pro-tein in the open filament-forming conformation. Con-forming our previous simulations and in agreement with biochemical and structural studies, the maintenance of the cleft open avoids disassembly. In this context, we also explore some of the resistance mutations to these com-pounds (see Figure 1). We are currently analyzing the data in order to exploit these results for the structure-based drug discovery and design. Molecular dynamics simula-tion was also used to test the stability of binding of three virtual screening compounds. Unfortunately, we encoun-ter stabilization and convergence issues with such com-pounds depending that we are still trying to overcome. However, we have no problems to simulate the fluores-cent derivatives. In fact, thanks to the simulations per-formed on superMUC, we gathered enough information to guide the design of such compounds. Based on this information, and in collaboration with experimentalists, we have designed and synthesized several fluorescent probes to be used in ligand-binding assays and reported in [4]. We also study PRC1 (protein regulator of cytokine-sis 1), which binds the FtsZ Eukaryote homolog tubulin. PRC1 cross-links antiparallel microtubules and is essen-tial for the completion of mitosis and cytokinesis [5].
We are currently analyzing the effect of all these mod-ulator compounds on the FtsZ assembly mechanism based on the simulations run on SuperMUC. In collabora-tion with experimentalist we are now confronting these results with experimental evidences. We hope that struc-tural keys observed in the dynamics of the filaments will be very valuable to optimize and design new antibiotic compounds targeting Ftsz dynamics.
References and Links
[1] Ramirez-Aportela, E., Lopez-Blanco, J.R., Andreu, J.M., and Chacon, P., 2014. Understanding nucleotide-regulated FtsZ filament dynamics and the monomer assembly switch with large-scale atomistic simulations. Biophys J 107, 9 (Nov 4), 2164-2176. DOI= http://dx.doi.org/10.1016/j.bpj.2014.09.033.
[2] Artola, M., Ruiz-Avila, L.B., Vergonos, A., Huecas, S., Araujo-Bazan, L., Martin-Fontecha, M., Vazquez-Villa, H., Turrado, C., Ramirez-Aportela, E., Hoegl, A., Nodwell, M., Barasoain, I., Chacon, P., Sieber, S.A., Andreu, J.M., and Lopez-Rodriguez, M.L., 2015. Effective GTP-replacing FtsZ inhibitors and antibacterial mechanism of action. ACS Chem Biol 10, 3 (Mar 20), 834-843. DOI= http://dx.doi.org/10.1021/cb500974d.
[3] Ruiz-Avila, L.B., Huecas, S., Artola, M., Vergonos, A., Ramirez-Aportela, E., Cercenado, E., Barasoain, I., Vazquez-Villa, H., Martin-Fontecha, M., Chacon, P., Lopez-Rodriguez, M.L., and Andreu, J.M., 2013. Syn-thetic inhibitors of bacterial cell division targeting the GTP-binding site of FtsZ. ACS Chem Biol 8, 9 (Sep 20), 2072-2083. DOI= http://dx.doi.org/10.1021/cb400208z.
[4] Artola, M., Ruiz-Avila, L.B., Ramirez-Aportela, E., Martinez, R.F., Araujo-Bazan, L., Vazquez-Villa, H., Martin-Fontecha, M., Oliva, M.A., Martin-Galiano, A.J., Chacon, P., Lopez-Rodriguez, M.L., Andreu, J.M., and Huecas, S., 2017. The structural assembly switch of cell division protein FtsZ probed with fluorescent allosteric inhibitors. Chem Sci 8, 2 (Feb 1), 1525-1534. DOI= http://dx.doi.org/10.1039/c6sc03792e.
[5] Kellogg, E.H., Howes, S., Ti, S.C., Ramirez-Aportela, E., Kapoor, T.M., Chacon, P., and Nogales, E., 2016. Near-atomic cryo-EM structure of PRC1 bound to the microtubule. Proc Natl Acad Sci U S A 113, 34, 9430-9439 DOI= http://dx.doi.org/10.1073/pnas.1609903113.
Figure 1: Destabilizing effect observed in one of the mutants tested. The filament structure (violet ribbons) exhibited a dynamic and heteroge-neous curvature indicating instability. The initial conformation is shown in gray.


Chapter 07 – Plasma Physics
Plasma Physics

258
Plasma Physics
Pushing the envelope of plasma wakefield accelerators with exotic beams
Research InstitutionMax Planck Institute for Physics, Munich, GermanyPrincipal InvestigatorPatric MuggliResearchersMariana Moreira, Thales Silva, Joana Martins, Jorge VieiraProject PartnersGoLP/Instituto de Plasmas e Fusão Nuclear, Instituto Superior Técnico, Universidade de Lisboa, Lisbon, Portugal
SuperMUC Project ID: pr74ha
Introduction
Particle accelerators and radiation sources play a key role in science, industry and society. Material break down is one of the major limits for the maximum achievable accelera-tion gradients. When the accelerating fields are too large, the walls of the accelerator “break”, forming plasma, thus disrupting the acceleration or light emission processes. A new concept, using plasma-based accelerators, where the acceleration takes place in a pre-ionized medium, a plas-ma, can be revolutionary because the plasma can support extremely high electric and magnetic fields. The recent progresses have been tremendous and plasma-based ac-celerators and light sources may become a future genera-tion of more compact accelerators.
Plasma accelerators are driven by intense laser or particle beams that excite relativistic plasma waves. These waves can accelerate electrons and positrons to high energies. Despite the tremendous progresses there are several challenges that need to be addressed, and new features that remain unexplored. In this report, we will discuss our work towards solving some of the present challeng-es and towards exploring new features.
Plasma accelerators can be driven by long proton bunch-es, such as those from the LHC, at CERN. The advantage of using a proton beam as drivers, as opposed to electron or laser beams, is that currently available proton bunches can carry much more energy than any other driver ever produced. Thus, proton bunch drivers and plasmas have the potential to accelerate electrons and positrons be-yond the energy frontier, in a single stage [1]. The AWAKE experiment is currently exploring this possibility [2]. Un-derstanding the proton bunch dynamics in the plasma is critical to support current experiments and is the first major goal of our work.
Identifying the maximum repetition rate for these de-vices is another key fundamental question. The plasma stores energy from the driver. Exploring how this ener-gy flows into the background plasma ions, how the ions move, and how the plasma relaxes back to an undis-
turbed condition is the second major question we are addressing using SuperMUC computing resources.
Plasma waves, which are the accelerating units of plasma accelerators and light sources, are extremely malleable. In certain circumstances this property can be disadvanta-geous. For instance, it can lead to the onset of the beam-break up instability. However, it also points towards a re-markable feature: the possibility to control the topology of plasma accelerating structures. Investigating the flexibility on the plasma topology is the third goal of our work. Below, we describe our progresses related to these questions.
Results and Methods
Our main computational tool is the particle-in-cell (PIC) code Osiris [3]. In PIC codes, electrically charged particles interact through the electric and magnetic fields that are deposited in a grid. In Osiris, a relativistic particle pusher advances simulation particles according to the relativ-istic Lorentz force equation. A field solver advances the electric and magnetic fields according to a discretized version of the full set of Maxwell equations. Thus, in gen-eral terms, the standard PIC algorithm makes no physical approximations, to the extent where gravitational and quantum effects can be neglected.
Laser or particle beam drivers can excite plasma waves more effectively when their length is shorter than the plasma wavelength. The proton bunches of the AWAKE experiment are much longer than the plasma wave-length. Thus, in their initial configuration, these bunches cannot excite large amplitude plasma waves. As a result, the AWAKE experiment relies on a beam-plasma insta-bility to shape the initial proton bunch driver. Long pro-ton bunches are subject to the self-modulation instabil-
Figure 1: Self-modulated wakefield accelerator. Plasma (blue) and self-modulated bunch (red) densities.
7

Pushing the envelope of plasma wakefield accelerators with exotic beams
ity, where the driver becomes fully self-modulated at the plasma wavelength during propagation (see Fig. 1).
Because the AWAKE experiment relies on growth of the initial fields to generate large amplitude plasma waves, it is very important to determine whether when the instability is seeded, small initial perturbations will be exponentially amplified during propagation. This would have a deleterious influence on the overall stability and reproducibility of the accelerator. Using Osiris simula-tions in cylindrical geometry, our work on SuperMUC was decisive to show that perturbations to the initial condi-tions have little influence on the growth of the seeded self-modulation process and thus, on the acceleration. Our simulation results are also consistent with current experimental results.
As the proton bunch propagates in the plasma, it deposits its energy into plasma background electrons. This energy then flows into background ions. Understanding the over-all ion dynamics in the wake of electron plasma waves is thus critical to determine the fundamental limits for the repetition rates of plasma accelerators. Our SuperMUC al-location was critical to explore this physics in connection with recent experiments performed at SLAC FACET, where a much shorter electron beam driver was used instead of protons. We have performed multi-dimensional Osiris simulations to investigate the ion dynamics in plasma wakefield acceleration experiments. Figure 2 shows typ-ical simulation results that evidence the motion of the background plasma ions in this context.
The ability to shape the topology of plasma waves is a remarkable feature, which remains largely unexplored, and that may have deep ramifications into basic plasma physics and relativistic nonlinear optics. This feature is particularly interesting in the context of particle acceler-ation as it allows shaping the structure of the plasma in unique and novel ways, which are currently inaccessible to more conventional approaches.
Controlling the topology requires structured light, lasers with sophisticated internal degrees of freedom, such as orbital angular momentum, in which the phase front of the laser is twisted. Although challenging, there are no doubts that ultra-intense structured laser pulses will be produced thanks to the recent advances in ul-tra-fast spatio-temporal beam shaping. Plasma waves with orbital angular momentum lead to intriguing and
Figure 4: Sample of trajectories in a rotat-ing-wakefield driven by lasers with orbital angular momentum.
surprising features that are intrinsically connected to its phase properties. They will open pathways to produce new types of particle beams that could be already use-ful to the multiple communities that probe matter using structured particle beams. Using three-dimensional sim-ulations on SuperMUC our work shows that these plas-ma waves can produce classical electron vortex bunches, that are relativistic, and that have intriguing properties. Each simulation takes a few tens of thousands of sim-ulation hours (typical run: 25000 core-h). Although of a purely classical nature, they reproduce the orbital angu-lar momentum quantization features of twisted photon beams and twisted structured quantum wave-packets (see Fig. 3) [4].
Vortex laser beams composed of two or more pulses with orbital angular momentum (OAM) are ideal to take full ad-vantage of the topological freedom of plasmas and plasma waves. In the plasma, these laser pulses can exhibit intrigu-ing features, such as a rotation of their intensity profile. These novel features are interesting to potentially tailor the trajectories of relativistic electron bunches and thus en-hance radiation generation. We have performed three-di-mensional Osiris simulations to explore the ensuing phys-ics. Each typical run needs on average 60000 core-hours. Figure 4 shows an example where the relativistic electrons describe helical trajectories in the plasma waves [5].
On-going Research / Outlook
We will expand our studies in several directions. In the context of AWAKE, we will explore the effects of plasma density variations for longer propagations, and look for potential experimental signatures from ion motion to explore the repetition rate limits of plasma accelerators. We will also investigate radiation generation by exot-ic relativistic particle bunches produced in topological plasma waves.
Figure 2: Comparison of the background plasma ion dynamics in several initial plasma conditions in the plasma wakefield accelerator.
Figure 3: Laser driver with orbital angular momentum (light blue-green) excites a plasma wakefield (red-blue) that accelerates a vortex electron bunch (green-red spheres)
References and Links
[1] A. Caldwell et al, Nat. Phys. 5, 363–367 (2009).[2] P. Muggli et al., Plasma Physics and Controlled Fusion, 60(1) 014046 (2017)[3] R. A. Fonseca et al, Plasma Phys. Controlled Fusion 55, 124011 (2013).[4] J. Vieira et al, All optical control of plasma based accelerators (submitted, 2018).[5] J. L. Martins et al, in preparation (2018).

260
Plasma Physics
PSC Simulation Support for Novel Accelerator Concepts
Research InstitutionLudwig-Maximilians-Universität München, Faculty of Physics, Chair for Computational and Plasma PhysicsPrincipal InvestigatorHartmut RuhlResearchersBin Liu, Karl-Ulrich Bamberg, Nils Moschüring, Viktoria PauwProject PartnersAWAKE Collaboration (CERN), Max Planck Institute of Quantum Optics (MPQ)
SuperMUC Project ID: pr74si (Gauss Large Scale project)
Introduction
Since the moment ultra-short high-power lasers became available, their potential use for accelerators is of great interest as the charge separation in plasmas can induce enormous electromagnetic field strengths on a sub-mi-crometer scale. Accurate modeling of the plasma dynam-ics is essential for the understanding of how the desired acceleration properties can be produced. Considerable research efforts, both on a theoretical and experimental level, are still needed to achieve ambitious goals, such as medical applications for accelerated protons via laser interaction with mass-limited targets (MLT). These MLTs, such as micro-foils, nano-clusters, needles and wires are potential sources of fast particles and high-energy photons used for purposes such as imaging or treat-ment planning. The high-energy photons generated in non-linear laser interaction are also of interest in the context of ultra-short attosecond X-ray pulses (AXP) that are required for the imaging of biological processes like protein folding or the behavior of Rhodopsin in the hu-man retina.
Inspired by the results of larger full kinetic PSC simu-lations, we also have found a new ion acceleration re-gime, called Ion Wave Breaking Acceleration (IWBA) [2], where collimated and mono-energetic 200-400 MeV ion beams could be produced with available experimental parameters.
While these approaches use lasers to move electrons to accelerate protons/ions, the AWAKE project in contrast uses highly energetic protons for a new linear lepton ac-celerator concept for multi GeV electrons on some tens of meters instead of kilometers with the help of wake fields.
In previous projects, the technology necessary to run 10m box size simulations with micrometer resolution was established, such as enhanced memory manage-ment, better parallelism and increasing the I/O speed of checkpoints to an average of 105 GB/s to be able to run the simulation for full four weeks of pure wall-clock time on 32.768 cores. In the course of this project, the basic baseline case of AWAKE was simulated, producing do-zens of TB with each output step. However, it turned out that instead of simulations with increased density, the experimentalists required several observables/output quantities with much higher temporal resolution. As a consequence, the major effort of the new project was put into increasing global communication efficiency to enable heavy “on-the-fly” data processing and analysis on the scale of tens of thousands of cores. This was a ma-jor challenge, but solving some serious issues dramati-cally increased the performance, so a lot of core hours could be invested in some new complex simulations involving quantum electrodynamical (QED) effects that were originally planned for a later project. However, this is still work in progress as the project is still running at the time of this report.
7
Figure 1: The purple line represents the time for a certain MPI-reduce (sum) routine used by an important inline analysis. The same analysis was done between the timespan 6 to 8 and 10 to 12. The green line corresponds to the total wall-clock time necessary for a time-step. There is a strong correlation show-ing that most of the time is spent in this reduce operation, blocking the simulation.

261
PSC Simulation Support for Novel Accelerator Concepts
Results and Methods
The Plasma Simulation Code (PSC) [1] is a general-pur-pose framework to solve the extended Maxwell-Vlasov- Boltzmann system of equations via the PIC approach. The original FORTRAN version evolved to a modern modu- larized C simulation framework supporting bindings to FORTRAN as well as C/CUDA and features selectable field and particle pushers. The PIC approach is well-known for its good scaling capability via configuration space paral-lelization. A Hilbert-Peano space-filling curve is used for efficient, dynamic and adaptive load and memory ba- lancing allowing for complex and dynamic geometries.
AWAKEThe AWAKE project studies the interaction of a 450 GeV proton beam of the SPS pre-accelerator at CERN with a 10 m long plasma. Moving window technology allows for reducing the active memory footprint and the costs by a factor of 30 to about 3% of a full simulation. Neverthe-less, every single output dump still takes 3 TB and check-points may take even up to 12 TB. For collaboration with experimentalists, these data were still not sufficient, as time-averaged observables requiring information from every single time steps were also demanded. Therefore, development and use of heavy inline data processing and analysis were necessary. This led to a significantly increased amount of collective communication. This re-vealed an MPI issue most likely related to the IBM-MPI behavior on SuperMUC Phase 1 (Fig. 1).
Exhaustive investigations carried out together with ex-perts from the LRZ-Astrolab and engineers from IBM tracked the issue down and found that it was related to the interaction of the collective and point-to-point com-munication patterns in the PSC with intra-node RDMA transfers which delayed the project.
Another big challenge consisted in the fact that in the available IBM implementation, “pami_tune” provided only one algorithm for “MPI-GatherV”, which appar-ently used only “MPI-Root” as receiver. As INTEL did not
scale to so many SuperMUC-islands (at that time), a custom-tuned tree-like algorithm was written for PSC decreasing the wall-clock time from several hundred seconds (on 4-8 islands) to 40 ms., which is a speed-up factor of usually more than 2000.
We are currently summarizing the challenges inherent in the execution of such an extreme scale simulation pre-sented to us in a paper entitled “Enabling the First Fully Kinetic 3D Simulation of the AWAKE Baseline Scenario”, K. Bamberg, N. Moschüring, P. Böhl, K. Lotov, H. Ruhl (2018).
After having resolved these issues, we were able to pro-vide the experimentalists with all the information they needed (Fig. 2) to reach the initial goal of confirming that the reduced codes (fluid-based and 2D cylindrically sym-metric) can accurately represent the relevant physics as well as fully kinetic 3D simulations.
The Head of Simulation Efforts of AWAKE confirmed that the respective results showed high concordance, and by now also coincide with initial experimental results. This represents an unprecedented benchmark at this extreme scale for Particle-in-Cell codes. This work is currently in the process of publication as “First Fully Kinetic 3D Simulation of the AWAKE Baseline Scenario” by N. Moschüring, K. Lo-tov, K. Bamberg, F. Deutschmann, H. Ruhl (2018).
Ultra-thin foilsWhile AWAKE uses 450 GeV protons to accelerate leptons, the other subprojects use much more commonly available lasers to accelerate electrons. For instance, a short circu-larly polarized laser pulse can “press” a major fraction of the electrons out of a 10 nm thick carbon-like foil. The generated electric field strongly accelerates the electrons, attracting them back to the ions, and relativistic effects create an even shorter AXP useful to “film” protein folding which happens on the time scale of 10e-18 seconds.
Together with AWAKE, the nano-foil project is one of our biggest simulations requiring half a trillion grid cells. And likewise, also only few output steps are possible. Fig. 3
Figure 2: The maximum accelera-tion field of three runs, differently resolved, demonstrating clearly the need for high resolutions. The red curve corresponding to the required resolution for the AWAKE baseline case could only be obtained after resolving the mentioned MPI issues. The blue and green lines correspond to reference results, obtained by using reduced models ( Φ as the derivative of the potential denotes sort of an averaged Ez ). They show very good agreement [6].
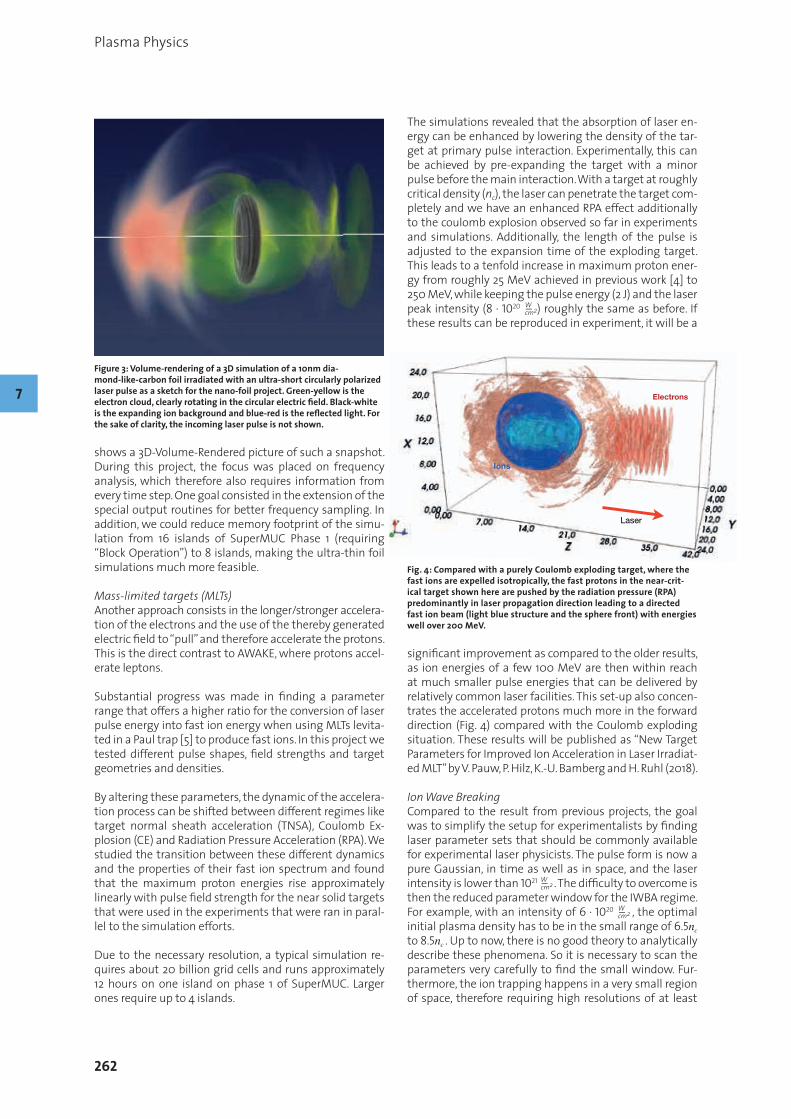
262
Plasma Physics
shows a 3D-Volume-Rendered picture of such a snapshot. During this project, the focus was placed on frequency analysis, which therefore also requires information from every time step. One goal consisted in the extension of the special output routines for better frequency sampling. In addition, we could reduce memory footprint of the simu-lation from 16 islands of SuperMUC Phase 1 (requiring “Block Operation”) to 8 islands, making the ultra-thin foil simulations much more feasible. Mass-limited targets (MLTs)Another approach consists in the longer/stronger accelera- tion of the electrons and the use of the thereby generated electric field to “pull” and therefore accelerate the protons. This is the direct contrast to AWAKE, where protons accel-erate leptons.
Substantial progress was made in finding a parameter range that offers a higher ratio for the conversion of laser pulse energy into fast ion energy when using MLTs levita- ted in a Paul trap [5] to produce fast ions. In this project we tested different pulse shapes, field strengths and target geometries and densities.
By altering these parameters, the dynamic of the accelera-tion process can be shifted between different regimes like target normal sheath acceleration (TNSA), Coulomb Ex-plosion (CE) and Radiation Pressure Acceleration (RPA). We studied the transition between these different dynamics and the properties of their fast ion spectrum and found that the maximum proton energies rise approximately linearly with pulse field strength for the near solid targets that were used in the experiments that were ran in paral-lel to the simulation efforts.
Due to the necessary resolution, a typical simulation re-quires about 20 billion grid cells and runs approximately 12 hours on one island on phase 1 of SuperMUC. Larger ones require up to 4 islands.
The simulations revealed that the absorption of laser en-ergy can be enhanced by lowering the density of the tar-get at primary pulse interaction. Experimentally, this can be achieved by pre-expanding the target with a minor pulse before the main interaction. With a target at roughly critical density (nc), the laser can penetrate the target com-pletely and we have an enhanced RPA effect additionally to the coulomb explosion observed so far in experiments and simulations. Additionally, the length of the pulse is adjusted to the expansion time of the exploding target. This leads to a tenfold increase in maximum proton ener-gy from roughly 25 MeV achieved in previous work [4] to 250 MeV, while keeping the pulse energy (2 J) and the laser peak intensity (8 ∙ 1020 W–cm2) roughly the same as before. If these results can be reproduced in experiment, it will be a
significant improvement as compared to the older results, as ion energies of a few 100 MeV are then within reach at much smaller pulse energies that can be delivered by relatively common laser facilities. This set-up also concen-trates the accelerated protons much more in the forward direction (Fig. 4) compared with the Coulomb exploding situation. These results will be published as “New Target Parameters for Improved Ion Acceleration in Laser Irradiat-ed MLT” by V. Pauw, P. Hilz, K.-U. Bamberg and H. Ruhl (2018).
Ion Wave BreakingCompared to the result from previous projects, the goal was to simplify the setup for experimentalists by finding laser parameter sets that should be commonly available for experimental laser physicists. The pulse form is now a pure Gaussian, in time as well as in space, and the laser intensity is lower than 1021 W–cm2 . The difficulty to overcome is then the reduced parameter window for the IWBA regime. For example, with an intensity of 6 ∙ 1020 W–cm2 , the optimal initial plasma density has to be in the small range of 6.5nc to 8.5nc . Up to now, there is no good theory to analytically describe these phenomena. So it is necessary to scan the parameters very carefully to find the small window. Fur-thermore, the ion trapping happens in a very small region of space, therefore requiring high resolutions of at least
Laser
Electrons
Ions
Figure 3: Volume-rendering of a 3D simulation of a 10nm dia-mond-like-carbon foil irradiated with an ultra-short circularly polarized laser pulse as a sketch for the nano-foil project. Green-yellow is the electron cloud, clearly rotating in the circular electric field. Black-white is the expanding ion background and blue-red is the reflected light. For the sake of clarity, the incoming laser pulse is not shown.
Fig. 4: Compared with a purely Coulomb exploding target, where the fast ions are expelled isotropically, the fast protons in the near-crit-ical target shown here are pushed by the radiation pressure (RPA) predominantly in laser propagation direction leading to a directed fast ion beam (light blue structure and the sphere front) with energies well over 200 MeV.
7

263
PSC Simulation Support for Novel Accelerator Concepts 10845
50 cells per micron [2, 3]. Larger runs (Fig. 5) usually require 2000-2560 cores taking 24-48 hours resulting in about 100 kilo-core-hours per run. The parameter scan consisted of several hundred runs (also smaller ones) on SuperMUC and also on its “little sister” Hydra (for “throughput”). The typical output is about two Terabyte per run, being reduced to some Gigabytes during post-processing.
On-going Research / Outlook
The promising simulation results for nano targets shall be supported with experimental data in 2018. If the results hold up, further investigation into optimization of the ex-perimental set-up and the parameters of pulse and target is of interest.
Given the success of the AWAKE simulations, the small discrepancy between PSC, L-Code and experiments might originate from minimally deviating initial conditions which might be researched by many shorter runs scan-ning different initial parameters. But the results suggest that for most of the realistic scenarios it is fortunately un-necessary to rely on full kinetic simulations.
The challenge of the IWBA project is that in order to ex-plore more details near the wave-breaking point as de-scribed in [2], much higher resolution is required.
Figure 5: 3D-iso-surface plot for a 3D simulation with a 4 Joule circularly polarized laser pulse with a peak intensity about 6·1020 W–cm2 . The pure Gaussian profile is common for experimental setups. The marked ions are accelerated to energies in the range of 60-80MeV.
References and Links
[1] www.plasma-simulation-code.net[2] Liu, B., J. Meyer-ter-Vehn, and H. Ruhl. “Scaling of ion trapping in
laser-driven relativistically transparent plasma.” arXiv preprint arXiv:1803.06358 (2018).
[3] Liu, B., Meyer-ter-Vehn, J., Ruhl, H. and Bamberg, K.-U. “Laser Acceler-ation of Electrons, Protons and Ions”, SPIE conference proceedings (2017) Volume 10240, IV.
[4] Ostermayr, T. M., et al. “Proton acceleration by irradiation of iso-lated spheres with an intense laser pulse.” Physical Review E 94.3 (2016): 033208.
[5] Ostermayr, T. M., et al. “A transportable Paul-trap for levitation and accurate positioning of micron-scale particles in vacuum for laser-plasma experiments.” Review of Scientific Instruments 89.1 (2018): 013302.
[6] Caldwell, A., et al. “Path to AWAKE: Evolution of the concept.” Nuclear Instruments and Methods in Physics Research Section A: Accelerators, Spectrometers, Detectors and Associated Equipment 829 (2016): 3-16.

264
Plasma Physics
Simulation of Kinetic Turbulence in Space Plasmas
Research InstitutionJulius-Maximilians-Universität WürzburgPrincipal InvestigatorCedric SchreinerResearchersPatrick Kilian, Felix Spanier, Karl MannheimProject PartnersMax Planck Institute for Solar System Research, North-West University Potchefstroom
SuperMUC Project ID: pr84ti (Gauss Large Scale project)
Introduction
The study of turbulence has been a major research ques-tion for several decades by now and even though turbu-lence is ubiquitous there is no single theory of it. The pi-oneering works of Kolmogorov used the merger of eddies to explain the energy cascade in hydrodynamic fluids. Gol-dreich and Sridhar [1] showed that in magnetized plasmas three- and four-wave-interaction lead to a cascade with a preferred direction.
The Goldreich and Sridhar theories can explain some of the general features of turbulence (spectrum and anisot-ropy) but are limited to incompressible MHD plasmas. Ap-plication in space plasmas however require the inclusion of dispersive waves, especially Whistler waves.
This SuperMUC project is trying to address one specific part of plasma turbulence research: How is energy cascad-ed in the so-called kinetic plasma regime, i.e., those length scales, where particle collisions can be neglected, and par-ticles no longer act as a fluid.
Several complementary theories exist for this scenario, and detailed numerical models are used to test them. At larger spatial scales the relatively well-understood inertial range exists, where the energy spectrum follows a power law distribution E α k –3/2 in wave number space. It is gener-ally assumed that the cascade continues to follow a pow-er law in the kinetic regime as well, but the spectral index is different, leading to a steeper spectral slope. Thus, at the transition from the inertial to the kinetic range a break in the spectrum is assumed.
Method
The ACRONYM code [2] is a fully relativistic, parallelized, explicit Particle-in-Cell (PiC) code, which has been used and developed by our group for several years. The main application of the code is the simulation of solar wind plasma and the interaction of plasma waves and particles.The PiC method is based on the representation of the plasma as a set of (numerical super-) particles and a
discretized grid which hosts the electromagnetic fields and currents. Particles do not interact directly with each other, but only with the grid. In each simulated time step, the update of the electromagnetic fields can then be computed on the grid only. Afterwards, the fields are interpolated to the positions of the particles, which are then pushed according to the Lorentz force. A schemat-ic representation of the update cycle is presented in Fig. 1. Due to this procedure the computational effort scales only linearly with the number of particles in the simu-lation (instead of quadratic, if particles interact directly with each other), but particle-particle collisions cannot occur. Therefore, the PiC method can only be applied to dilute plasmas, such as the solar wind, where collisions can be neglected.
For our studies we focus on specific waves, mainly the so-called Whistler waves, and thus try to excite mainly plas-ma waves of this kind. We therefore initialize sinusoidal perturbations in the electromagnetic fields, which model the plasma wave or a superposition of several waves [3].
7
Figure 1: Update cycle for a typical explicit Particle-in-Cell code. Moving particles create a current, which is interpolated to discrete grid positions. The update for the electromagnetic fields is computed on the grid and the fields are interpolated back to the positions of the particles. The particles are pushed via the Lorentz force and the next time step begins.

265
Simulation of Kinetic Turbulence in Space Plasmas
Results
It is currently investigated whether the spectral index in the kinetic regime is universal (as is the case in the inertial range), or if it depends on the plasma parameters. Further-more, there is some observational and numerical indica-tion of a second break and steepening of the energy spec-trum at even smaller scales (higher wave numbers), which might be caused by the onset of damping. With our simu-lations we have investigated the properties of the energy spectrum in the kinetic regime and the dissipation range.
Simulations in 2D and 3D have been carried out. The 2D simulations were as big as 20482 cells, while the 3D sim-ulations reached 5123 cells. A grand total of 7 million CPU-hours has been used in this project.
We have found a relatively flat and universal spectral slope at larger spatial scales (small wave numbers). To-wards larger wave numbers we find a break, which coin-cides with the expected onset of damping. The spectrum steepens after the break and the spectral index seems to depend on the properties of the plasma, such as the plasma temperature. Example spectra from a 3D simula-tion are shown in Fig. 2. This simulation has a size of 5123 cells with 128 particles per cell. The total runtime for this simulation alone required 200,000 CPU-hours.
It is interesting to see in Fig. 3 how the energy is distrib-uted in parallel and perpendicular direction: Energy is not distributed isotopically, but energy cascades faster in per-pendicular direction. This behavior is predicted by Goldre-ich and Sridhar for Alfvén waves, but seemingly Whistler waves behave similarly.
The simulations are severely limited by two factors: The physical effect of cyclotron damping [3] makes a large part of the parameter space inaccessible. Even for the chosen parameter set a large fraction of wave number space is affected by damping. The other limiting factor is the large proton-to-electron mass ratio leading to a large spread between cyclotron frequencies.
Conclusion and Outlook
HPC simulations provide a unique window to address one of the most fundamental questions of plasma turbulence: How is energy transported across scales? Employing the particle-in-cell method, we have found spectral slopes and breaks in our spectra that are around the expected values and in line with Gary et al. [4]. It should be noted that the slope depends on the dimensionality of the simulation.
2D cuts of the magnetic energy show a preferred perpen-dicular energy cascade, which shows similarities with the Goldreich-Sridhar theory even though the theoretical der-ivation is different.
Future simulations must connect the kinetic regime with the MHD regime. This can be achieved in two ways: Either much larger simulations covering also very large wave numbers (this can easily increase the simulation size by 2-3 orders of magnitude) or by hybrid simulations con-necting PiC with MHD.
References and Links
[1] P. Goldreich, S. Sridhar, Astrophysical Journal 438 (2) (1995), p. 763[2] P. Kilian, T. Burkart, F. Spanier, in: W. E. Nagel, D. B. Kröner, M. M. Resch
(Eds.), High Performance Computing in Science and Engineering ’11, Springer, 2012, p. 5
[3] C. Schreiner, P. Kilian, F. Spanier, Communications in Computational Physics 21 (4) (2017), p. 947
[4] S. P. Gary, Philosophical Transactions of the Royal Society A 373 (2015), 20140149
Figure 2: One-dimensional magnetic energy spectra obtained from a 3D simulation. The magnetic energy EB is shown as a function of the abso-lute of the wave vector k=|k
→| in panel a). The different lines represent
spectra obtained at different points in time during the simulation. In panel b) the magnetic energy is shown as function of both kII and k⊥ for two points in time: t|Ωe|=0.0 (purple lines) and t|Ωe|=223.8 (blue lines). Power law fits are applied to these spectra (black lines) to obtain the spectral indicated by three numbers in the plot. The vertical black line close to kc/ωp≈0.7 marks the minimum parallel wave number at which cyclotron damping is expected. The energies in both panels are normal-ized to EB, the energy of the background magnetic field.
Figure 3 Distribution of the magnetic energy EB in wave number space at two points in time. The energy is normalized to the energy EB0 of the background magnetic field. Panel a) shows the energy distribution at the beginning of the simulation, where only a few initial waves are excited at small wave numbers. Panel b) depicts the fully developed spectrum after half of the simulation. An anisotropic cascade is developed, which preferentially transports energy to higher perpendicular wave numbers.
EB (E
B0)
k (ωp / c)
t |Ωe| = 0.0 t |Ωe| = 111.9t |Ωe| = 223.8t |Ωe| = 335.7t |Ωe| = 447.6
10-8
10-7
10-6
10-5
10-4
10-3
10-2
10-1
100
10-1 100 101
a)
k (ωp / c)
EB (k||) EB (k⊥)EB (k||) EB (k⊥)
10-1 100 101
b)
-3.5
-4.5
-5.2
k ⊥ (ω
p / c
)
k|| (ωp / c)
0
1
2
3
4
5
0 1 2 3 4 5
a) t |Ωe| = 0.0
k|| (ωp / c)
0 1 2 3 4 5
10-10
10-8
10-6
10-4
10-2
EB (E
B0)
b) t |Ωe| = 223.8

266
Plasma Physics
00.5
11.5
22.5
3
keV10 keV
100keVMeV
10MeV100MeV
0
2
4
6x 10⁷
θ (rad)Photon energy
Rad
iatio
n en
ergy
dis
tribu
tion
Simulation of Brilliant X/Gamma-Ray Emission in Strong Laser Fields
Research InstitutionUniversity of Munich, faculty of physics, chair for computational and plasma physicsPrincipal InvestigatorHartmut RuhlResearchersFabian Deutschmann, Nils Moschüring, Constantin Klier, Karl-Ulrich Bamberg, Bin LiuProject Partners—
SuperMUC Project ID: pr92na (Gauss Large Scale project)
Introduction
With the development of material science, well-defined near-critical density plasma (NCDP) targets can be pre-pared in experiments. The NCDP attracts much attention due to the nonlinear particle dynamics and the strong coup-ling between the laser pulse and the plasma. X/gamma- ray emission from NCDP driven by ultra-intense laser pulses has been observed in Particle-in-Cell (PIC) simu-lations and attracted the interest of experimentalists. A group lead by Jörg Schreiber at Ludwig-Maximilians- Universität, Munich, has done a preliminary experiment, and another group lead by Manuel Hegelich at Texas University in Austin is interested in carrying out an ex-periment. PIC simulations adjusting the results to the experimental parameters have to be run. Ion acceleration enhancement with NCDP has been observed experimen-tally by a team of researchers lead by Jörg Schreiber. PIC
simulations have to be run in order to scan experimental parameters and compare with the experimental results. By analysing the simulation results of the laser interact-ing with NCDP, we were surprised to find that there ex-ists a new ion acceleration regime never described before. We call it ion wave breaking acceleration (IWBA). Wave breaking is one of the most interesting phenomena in plasma physics. Electron self-injected acceleration via wave breaking has lead many applications. Ions are tradi-tionally treated as particles. We found that, when apply-ing a fast rising laser-driven pulse, the background ions move collectively as a cold wave. When the ion wave is too strong, the wave breaks, then a small fraction of ions can be self-injected into a laser driven wake and accelerated efficiently. The final ion beam is collimated and mono- energetic. Such a beam has potential important applica-tions, such as tumour treatment, material detection, and basic physics. Since the ion wave breaking dynamics is too complex to be solved analytically, PIC simulations are needed for understanding the physics.
Results and Methods
Simulation methodThe Plasma-Simulation-Code (PSC) is a general purpose framework to solve the extended Maxwell-Vlasov-Boltz-mann system of equations via the PIC approach [1]. Re-cent extensions comprise the self-field effects of radi-ation and electron-positron pair production in strong fields. The original FORTRAN version evolved to a mod-ern modularized C simulation framework supporting bindings to FORTRAN as well as C/CUDA and features selectable field and particle pushers. The PIC approach is well-known for its good scaling capability via configu-ration space parallelization. A Hilbert-Peano space-filling curve is used for efficient, dynamic and adaptive load and memory balancing allowing for complex and dynamic geometries.
Result: X/gamma-ray emission from NCDPIn this sub-project, we investigated the X/gamma-ray emission when propagating an ultraintense laser pulse in a NCDP via 3D PIC simulations. Collimated radiation with
7
Figure 1: Angular-spectral distribution of radiation energy from a full 3D PIC simulation. The high energy collimated gamma-ray radiation is marked by a black arrow.

267
Simulation of Brilliant X/Gamma-Ray Emission in Strong Laser Fields
peaked photon energy up to MeV is observed, as marked by a black arrow in Fig. 1. In order to resolve detailed electron dynamics, very high resolution is needed. For a full 3D simu-lation we used 7 109 simulation cells and 35 macro-parti-cles per cell, this requires total memory of up to 20Tb.
Result: Ion acceleration enhancement with NCDPIn this sub-project we investigated ion acceleration when irradiating an ultra-intense laser pulse on a combined tar-get, which is formed by a uniformed NCDP layer and an ultra-thin solid foil. A high-density collimated ion layer is observed in a high-resolution 2D simulation, as shown in Fig. 2. In order to resolve the ultra-thin solid foil, very high resolution is needed in simulations. Furthermore, in order to include the laser self-shaping effect in NCDP, a very large simulation box is needed. Therefore even for a full 2D simulation, total memory of up to 15Tb is required.
Result: IWBAIn this sub-project we investigated self-injected ion acceleration when propagating an ultraintense laser pulse in a relativistic self-transparent NCDP with full 3D PIC simulations. The ion wave growing and breaking are observed clearly in simulations, as shown in Fig. 3. The ion wave breaking process is extremely nonlinear and the background ions show complex kinetic behav-iour. In order to resolve the details, large scale and high resolution are required in the simulations. About 0.1 million core-hours are needed for a full 3D simulation. Since this IWBA regime is barely discussed in literature, we have to establish the model from scratch. We have run thousands of 1D/2D simulations and dozens of full 3D simulations for different laser plasma parameters to understand the physics of IWBA. Some of the results have been published [2].
On-going Research / Outlook
We found occasionally that much better quality radia-tion can be emitted with a fast rising laser pulse. More detailed investigation about the X/gamma-ray emission is needed. On the other hand, it is still not very clear how IWBA with practical experimental parameters can be re-alized. More simulations are required. The new ion wave model may help us to improve the understanding of la-ser propagating in plasma even in QED regime. Since we have spent a lot of time and resources on IWBA, we have postponed our research project about the QED cascad-ing effect.
References
[1] www.plasma-simulation-code.net[2] B. Liu, J. Meyer-ter-Vehn, K.-U. Bamberg, W. J. Ma, J. Liu, X. T. He, X. Q.
Yan, and H. Ruhl, Phys. Rev. Accel. Beams 19, 073401 (2016).
Figure 2: Carbon ion density distribution from a high resolution 2D PIC simulation.
Figure 3: Proton density isosurface plot in 3D space at (a) an early time when the ion layer is just formed and (b) a later time after the ion layer broke and an ion beam is accelerated (marked by a black arrow), respectively. The laser pulse (not shown) propagates along z direction.
y (µ
m)
z (µm)
C ion density distribution
40 45 50 55 60 65 70
−6
−4
−2
0
2
4
6


269
Appendices
Appendices

270
Appendices
8
Summer of Simulation: Enabling a new generation of SuperMUC usersIn May 2016, the BioLab of the LRZ application support group initiated the “Summer of Simulation” to foster young scientists to tackle their problems on current supercomputers. Master students and PhD students employing molecular dynamics or quantum chemical simulations were invited to submit a one-page proposal describing their project with the objective to port their applications on SuperMUC, find an optimally scaling set-up, and finally perform first production runs during the summer break.
Current multi and many core architectures pose a chal-lenge to simulation codes with respect to scalability and efficiency. Particularly life and material-science simu-lations often cannot just increase their system sizes, because underlying algorithms scale unfavorably, and insights from larger systems are limited. Still, computa-tional demands are high, due to the required abundant sampling of phase space, or molecular structures, and highly accurate physical descriptions.
The “Summer of Simulation” 2016 started with a kickoff meeting in July, where the eight participants from the Ruhr-University Bochum, the University of Bonn, the Frie-drich-Alexander University Erlangen-Nuremberg, and the Technical University Munich, respectively, presented their projects, and were assigned to a tutor from the LRZ BioLab.
In the following five weeks, the students worked to get their codes and simulations running on SuperMUC and optimize the setup. Each project started with a budget of one million core-hours for preparatory simulations, and to demonstrate the scalability of their application. With the guidance of their tutors, the students prepared follow-up proposals to apply for up to nine million addi-tional core hours. After an accelerated review process, a total of 50 M core-hours were granted and this budget was available to the projects until October. At the end of October, each student presented their results.
All projects were carried out by curious, industrious, and eager students, and it was a great pleasure for the tu-tors to work with them. Moreover, the close contact with the different projects and their new applications showed hurdles and pitfalls, whose fixing improved the usabili-ty of SuperMUC in general. Almost all groups continued working on follow up projects. The “Summer of Simula-tion” was repeated in 2017 and currently, the BioLab is se-lecting the projects for the “Summer of Simulation” 2018.Ten projects from the “Summer of Simulation” 2016 and 2017 consumed more than 6 M core-hours, respectively, and submitted regular reports for chapters 2 and 6 of this book. The reports are marked as “Summer of Simu-lation Project” in the header section. Three additional re-ports are presented on the following pages.
Kind support by the SuperMUC steering committee, in particular Prof. Wellein, is gratefully acknowledged.
V2C cave presentation, participants of the Summer of Simulation pro-gramme 2017 (picture: LRZ).

271
Figure 3: Protein color goes from red to white to blue with increasing step number. Left: without arginine. Right: with arginine
Figure 2: RMSD values for domains 1 and 2 at temperatures ranging from 270 to 398 K. A and B correspond to the formulation with Arginine, C and D correspond to the formulation without arginine.
Summer of Simulation
Insights into the formulation of a multi-domain antibiotic from MD simulations
Research InstitutionLehrstuhl für Pharmazeutische Technologie und Biopharmazie – LMU MünchenPrincipal InvestigatorGerhard WinterResearchersSimon Eisele, Andreas TosstorffProject PartnersDZIF
SuperMUC Project ID: pr53wa
Introduction
Staphylococcus aureus is a commensal gram-positive bacterium that plays a very important role as a patho-gen for humans, causing a variety of infections. [1][2] HY-133 is an effective antibiotic protein targeting S. aureus. However, it tends to deactivate by aggregation (Figure 1).
Results and Methods
Two systems, corresponding to a formulation with and without arginine were setup with packmol and tleap. HEPES and arginine were parametrized with parmchk2 and point charges were calculated using Gaussian16
with HF/G-6-31* theory level/basis set. A RESP fit was performed with antechamber. The Amber ff14SB force-field was used for the protein parametes.
Replica Exchange simulations were run with the MPI ver-sion of pmemd as implemented in Amber16. 64 replicas at temperatures from 270 to 398 K were simulated in parallel.
The trajectories were processed and analyzed with cpptraj to sort the trajectories by temperature and cal-culate RMSD values. RMSD values were calculated for residues 3 to 169 (domain 1) and 175 to 283 (domain 2)
respectively in order to rule out changes in RMSD due to the position of one domain relative to the other. VMD was used for visual analysis.
The dynamics of the protein change when arginine is added to the formulation. By adding arginine to the for-mulation, inter-dominial contacts are reduced and one can even observe a highly extended conformation.
References and Links
[1] http://www.dzif.de/ueber_uns/menschen_im_dzif/ansicht/detail/artikel/projekt_am_start_neuer_wirkstoff_gegen_gefuerchtete_krankenhauskeime/
[2] Tong, et al., Clin. Microbiol. Rev. 28, 603–661 (2015).
Figure 1: Particle count of two formulations differing in arginine content after storage at elevated temperature of 40°C for 14 weeks.
A
C
B
D

272
Appendices
8
Figure 1: Representative structure of an amorphous OH-terminated ZnO slab created by melt-quench CPMD simulations. Zn, O and H are shown in gray, red and white, respectively.
Chemical Reactivity of Amorphous Oxide Surfaces
Research InstitutionInterdisciplinary Center for Molecular Materials (ICMM) and Computer-Chemistry-Center (CCC), Friedrich-Alexander-Universität Erlangen-Nürnberg (FAU)Principal InvestigatorBernd MeyerResearchersHannah SchlottProject Partners—
SuperMUC Project ID: pr74be (Summer of Simulation 2016)
Introduction
Theoretical studies on chemical properties of oxide sur-faces have been done almost exclusively for surface ter-minations of crystalline solids. Oxides, however, are often amorphous and their surfaces are covered by residuals from the environment, in particular OH groups from contact with water or protective ligand shells in the case of nanoparticles. The goal of this project was to create realistic amorphous surface structures which allow a systematic comparison of their chemical reactivity with their crystalline counterparts. We will address the ques-tion whether the atomic disorder and the appearance of new types of surface defects make amorphous surfaces more reactive or if the opposite effect prevails, namely that the higher structural flexibility leads to a better passivation of the unsaturated surface atoms and thus reduces the reactivity of amorphous terminations.
Results and Methods
Amorphous surface structures of ZnO (a technological-ly important transparent conducting oxide) and TiO2 (a photo-active semiconductor) were generated by the melt-quench technique. Atoms are placed at random positions within a unit cell. The volume of the unit cell is chosen in such a way that the experimentally observed density is re-produced. Then, the systems are equilibrated for up to 40 ps at a temperature well above the melting point. From each equilibration run three snapshots are taken and quenched to room temperature for another 40 ps using a linear tem-perature ramp, giving three independent amorphous con-figurations for comparison and some limited statistical averaging. The surfaces were introduced during the melt-quench process without the need to cleave amorphous bulk configurations. Hydroxylated surface structures and surfaces covered by acetate (a typical ligand in wet-chem-ical particle synthesis) were created by including water and acetic acid molecules in the melt-quench procedure.
All simulations were done with the Car-Parrinello CPMD code [2], a first-principles molecular dynamics technique based on density functional theory for the description of
the interatomic interactions. The unit cells contained 256 and 192 atoms in the case of adsobate-free ZnO and TiO2 surfaces, respectively. Single simulations were run most efficiently on 13 SuperMUC nodes (364 cores) using a mixed MPI/OpenMP parallelization (4 MPI processes per node, 7 OpenMP threads per MPI process), up to which CPMD shows almost linear scaling. As a second layer of parallelization the three quench simulations could be combined in a single run. Creation of a set of three amor-phous slabs required about 300.000 CPUh.
A typical result of the melt-quench simulations is shown in Figure 1. All created amorphous surfaces have been thoroughly characterized by analyzing radial distribution functions and average coordination numbers. Compari-son with experimental data shows that realistic amor-phous structures were obtained.
On-going Research / Outlook
The chemical reactivity of the amorphous surface struc-tures is currently investigated by exposing them to a variety of small organic molecules with different reac-tive units (alcohols, acids, aldehydes, ketones, amides, etc.). This is done by performing CPMD simulations for layers of adsorbed molecules at slightly elevated tem-peratures. This allows us to identify spontaneous disso-ciation events and preferred locations of molecules on the surfaces. In a second stage the specific adsorption properties of the molecules at special surface sites will be investigated.
References and Links
[1] https://chemistry.nat.fau.eu/meyer-group[2] http://www.cpmd.org

Summer of Simulation
Computing precise solvation free energies of small molecules
Research InstitutionTechnische Universität MünchenPrincipal InvestigatorIris AntesResearchersMartin ZachmannProject PartnersGerald Mathias, Leibniz-Rechenzentrum
SuperMUC Project ID: pr92go
Introduction
Molecular dynamics (MD) simulations of biomolecules such as proteins have become a feasible task. Yet the amount of computational resources for large systems is still sizeable. The proper treatment of sufficient sur-rounding solvent (usually water) is crucial, and thus con-siderable time is spend on the calculation of water-water interactions. A promising way to reduce this effort is to replace the explicit water molecules by a dielectric con-tinuum. The Hamiltonian Dielectric Solvent (HADES) [1] provides an energy conserving method to compute the resulting dielectric forces, and is efficiently implemented in the IPHIGENIE [2] MD program.
The quality of the HADES description relies on a set of pa-rameters [3]. The overall strength of salt-bridges as well as the absolute solvation free energies play a key role in the dynamics of large proteins. We are using these crite-rions to improve the HADES parametrization. Although suitable quantities can be accessed experimentally, especially molecules with a net-charge can be studied with less uncertainty through explicit solvent MD sim-ulations. We have used SuperMUC to perform several Thermodynamic Integration (TI) and Umbrella Sampling (US) simulations with IPHIGENIE. Statistical sampling for both techniques is enhanced by using a Hamilton Rep-lica Exchange framework. This requires several (10-60) copies (replicas) of each system to be simulated in paral-lel, thus rapidly increasing the computational workload.
We obtained very precise solvation free energies of a set of small molecules representing side-chains of several common amino acids. Additionally, Potential of Mean Force (PMF) profiles were generated, giving an insight into the water-mediated average interaction between two different molecules.
Results and Methods
Solvation free energies were computed for 14 different systems: 6 small molecules representing charged side-chains; zwitterionic Alanine, as well as a single Chlo-rine ion, and 6 small molecules representing uncharged
side-chains for assessment. All simulations employed the CHARMM forcefield. A summary is given in Table 1. Experimental values are listed for comparison for those molecules, where reliable data is available.
Molecule Sim. Exp. Molecule Sim.LYSO -3.37 -4.38 ASP– -87.05METO 0.65 -1.48 LYS+ -64.46TRPO -5.34 -5.88 HIS+ -54.06HISO -10.15 -10.27 ARG+ -58.44SERO -4.87 -5.06 GLU– -87.00ILEO 2.25 2.15 PRO+ -54.59Cl– -81.53 -81.26 ALA+ – -60.96
Table 1: Solvation free energies in kcal/mol. +,-,0 indicate the net-charge of the system. Exp. values from: R. Wolfenden et al., Biochemistry 20(4), 1981, 849. Y. Marcus, J. Chem. Soc. Faraday T. 87(18), 1991, 2995.
In order to obtain highly accurate free energies, we need to simulate around 50 replicas per system. Using one Su-perMUC Phase 2 Haswell node per replica, a typical TI-job requires 1400 CPU-cores.
Resources for the US-jobs are similar, but we only need about 10 replicas per system. A resulting PMF-profile for two oppositely charged molecules can be seen in Figure 1.
On-going Research / Outlook
The data generated on SuperMUC allows us to fully par-ametrize the HADES model. A necessary preparation step for each of our simulations was the fine-tuning of the replica-distribution via several short MDs. This is cum-bersome, and could be automatized in the future.
References and Links
[1] S. Bauer et al., J. Chem. Phys. 140(10), 2014, 104102/104103.[2] https://sourceforge.net/projects/iphigenie/[3] M. Zachmann et al., ChemPhysChem. 16(8), 2015, 1739.
Figure 1: PMF-profile of GLU– and LYS+ as a function of the distance between charge-centers of the molecules.

Appendices
The SuperMUC Multi-Petascale System
SuperMUC is the high-end supercomputer at the Leib-niz-Rechenzentrum (Leibniz Supercomputing Centre, LRZ) in Garching near Munich (the MUC suffix is bor-rowed from the Munich airport code). With more than 241,000 cores and a combined peak performance of the two installation phases of more than 6.8 Petaflop/s (= 6.8 x 10¹⁵ Floating Point Operations per second), it is one of the fastest supercomputers in the world. SuperMUC strengthens the position of Germany’s Gauss Centre for Supercomputing [1] in Europe by integrating it into the European high performance computing ecosystem. With the start of operation of SuperMUC, LRZ became a Eu-ropean Centre for Supercomputing and a Tier-0 Centre for the Partnership for Advanced Computing in Europe (PRACE). SuperMUC is available to all German and Euro-pean researchers to expand the frontiers of science and engineering.
LRZ’s design goal for the architecture was a combination of a large number of thin and medium sized compute nodes with a main memory of 32 GByte (Phase 1) and 64 GByte (Phase 2), respectively, and a smaller number of fat compute nodes with a main memory of 256 GByte. The network interconnect between the nodes allows ex-cellent scaling of parallel applications up to the level of more than 100,000 tasks. SuperMUC consists of 18 Thin Node Islands based on Intel Sandy Bridge-EP processor technology, 6 Medium Node Islands based on Intel Has-well-EP processor technology and one Fat Node Island based on Intel Westmere-EX processor technology. All compute nodes within an individual Island are connect-ed via a fully non-blocking Infiniband network, FDR10 for
the Thin nodes of Phase 1, FDR14 for the Haswell nodes of Phase 2 and QDR for the Fat Nodes of Phase 1. Above the Island level, the pruned interconnect enables a bi-di-rectional bi-section bandwidth ratio of 4:1 (intra-Island / inter-Island). An additional system segment is called Su-perMIC. It is a cluster of 32 Intel Ivy Bridge-EP nodes each having two Intel Xeon Phi accelerator cards installed (Knights Corner). See Table 1 for more details.
SuperMUC Phase 1 and Phase 2 are loosely coupled through the General Parallel File System (GPFS) and Network Attached Storage (NAS) File systems, used by both Phase 1 and Phase 2. Both phases are operated in-dependently, but offer an identical programming envi-ronment.
SuperMUC uses a new, revolutionary form of warm wa-ter cooling developed by IBM. Active components like processors and memory are directly cooled with water that can have an inlet temperature of up to 40 degrees Celsius. This High Temperature Liquid Cooling together with very innovative system software cuts the energy consumption of the system up to 40%. In addition, LRZ buildings are heated re-using this energy.
Permanent storage for data and programs is provided by a 16-node NAS cluster from NetApp. This primary cluster has a capacity of 3.5 Petabytes and has demonstrated an aggregated throughput of more than 12 GB/s using NFSv3. Netapp’s Ontap 8 Cluster-Mode provides a single namespace for several hundred project volumes on the system. Users can access multiple snapshots of data in
Figure 1: SuperMUC Phase 1 on the left and SuperMUC Phase 2 on the right, in the server room.
8
274

Figure 2: Schematic view of SuperMUC Phase 1 and Phase 2.
Figure 3: One blade of SuperMUC Phase 2 consists of two dual-socket compute nodes. The copper tubes distribute the warm cooling water to CPUs, memory modules and peripheral modules.
Figure 4: Rear of racks with warm water cooling.
The SuperMUC Multi-Petascale System
their home directories. For additional redundancy, data is regularly replicated to a separate 4-node Netapp cluster with another 3.5 PB of storage for recovery purposes. Rep-lication uses Snapmirror-technology and runs with up to 2 GB/s in this setup.
For high-performance I/O, IBM’s GPFS with 12 PB of ca-pacity and an aggregated throughput of 250 GB/s is available. Disk storage subsystems were built by DDN. The storage hardware consists of more than 3,400 SA-TA-Disks with 2 TB each, protected by double-parity RAID and integrated checksums.
LRZ’s tape backup and archive systems are based on Ti-voli Storage Manager (TSM) from IBM, providing more than 30 Petabytes of capacity to the users of SuperMUC. Digital long-term archives help to preserve simulation results. User archives are also transferred to a remote disaster recovery site.
Collaborations of European scientists can submit pro-posals to PRACE. Twice per year, the Gauss Centre for Supercomputing has a dedicated call for large scale projects that request more than 35 million core-hours. Smaller proposals by German scientists can be submit-ted throughout the year directly to LRZ.
References
[1] The Gauss Centre for Supercomputing (GCS) is the alliance of the three national German computing centres: Jülich Supercomput-ing Centre (JSC), High Performance Computing Centre Stuttgart (HLRS), and Leibniz Supercomputing Centre (LRZ).
6 Haswell islands(>14,336 Cores per Island)
LRZ infrastructure(NAS, Archive, Visualization)
Internet / Grid Services
Mellanox FDR14Island switch
Medium Islands: 28 cores/node2.3 GB/core
non blocking
Infinibandspine switches
I/Oservers
GPFS for $WORK
10+5 PB
200+100 GB/s
I/O Servers (weak coupling of Phase 1 and Phase 2
via common GPFS file system)
Mellanox FDR10 Island switch
pruned tree
Thin Islands: 16 cores/node1.4 GB/core
Fat Islands: 40 cores/node6.4 GB/core
18 Thin Node islands1 Fat Node Island(>8,126 Cores per Island)
SuperMUC Phase 1SuperMUC Phase 2
non blocking
$SCRATCH
pruned tree
Infinibandspine switches
Storage, etc.Infinibandswitches
275

Appendices
Technical data
Installation Phase Phase 1 Phase 2Installation Date 2011 2012 2013 2015Island Type Fat Nodes Thin Nodes Many Cores Nodes Haswell NodesSystem BladeCenter HX5 IBM System x iDataPlex
dx360M4IBM System x iDataPlex
dx360M4Lenovo NeXtScale nx360M5
WCTProcessor Type Westmere EX Xeon E7-4870 Sandy Bridge EP Xeon E5-2680 Ivy Bridge EP and Xeon Phi 5110P Haswell EP Xeon E5-2697 v3Nominal Frequency [GHz] 2.4 2.7 1.05 2.6Performance per core 4 DP Flops/cycle = 9.6 DP Flop/s
2-wide SSE2 add + 2-wide SSE2 mult
8 DP Flops/cycle =21.6 DP Flops/s 4-wide AVX add + 4-wide AVX
mult
16 DP Flops/cycle =16.64 DP Flops/s 8-wide fused multi-
ply-adds every cycle using 4 threads
16 DP Flops/cycle = 41.6 DP Flops/s two 4-wide fused
multiply-adds
Total Number of nodes 205 9,216 32 3,072Total Number of cores 8,200 147,456 3,840 (Phi) 86,016Total Peak Performance [PFlop/s] 0.078 3.2 0.064 (Phi) 3.58
Total Linpack Performance [PFlop/s] 0.065 2.897 n.a. 2.814Total size of memory [TByte] 52 288 2.56 194Total Number of Islands 1 18 1 6Typical Power Consumption [MW] < 2.3 ~1.1ComponentsNodes per Island 205 512 32 512Processors per Node 4 2 2 Ivy Bridge EP + 2 Phi 5110P 2Cores per Processor 10 8 8 (Ivy Bridge EP) + 60 (Phi) 14
Cores per Node 40 16 16 (host) + 120 (Phi) 28Logical CPUs per Node (Hyperthreading) 80 32 32 (host) + 480 (Phi) 56Memory and CachesMemory per Core [GByte] (typically available for applications) 6.4 (~6.0) 2 (~1.5) 4 (host) + 2 x 0.13 (Phi) 2.3 (2.1)Size of shared Memory per node [GByte] 256 32 64 (host) + 2 x 8 (Phi) 64 (8 nodes in job class big: 256)Bandwidth to Memory per node [Gbyte/s] 136.4 102.4 Phi: 384 137InterconnectTechnology Infiniband QDR Infiniband FDR10 Infiniband FDR10 Infiniband FDR14Intra-Island Topology non-blocking Tree non-blocking TreeInter-Island Topology Pruned Tree 4:1 n.a. Pruned Tree 4:1Bisection bandwidth of Interconnect [TByte/s] 12.5 5.1ServersLogin Servers for users 2 7 1 5StorageSize of parallel storage (SCRATCH/WORK) [Pbyte] 15Size of NAS storage (HOME) [PByte] 3.5 (+ 3.5 for replication)Aggregated bandwidth to/from parallel storage [GByte/s] 250Aggregated bandwidth to/from NAS storage [GByte/s] 12Capacity of Archive and Backup Storage [PByte] > 30System SoftwareOperating System Suse Linux Enterprise Server (SLES)Batchsystem IBM LoadlevelerParallel Filesystem for SCRATCH and WORK IBM GPFSFile System for HOME NetApp NASArchive and Backup Software IBM TSMSystem Management xCat from IBMMonitoring Icinga, Splunk
Figure 5: Several racks of SuperMUC Phase 2.
Figure 6: One of the Infiniband switches.
8
276

Technical data
Installation Phase Phase 1 Phase 2Installation Date 2011 2012 2013 2015Island Type Fat Nodes Thin Nodes Many Cores Nodes Haswell NodesSystem BladeCenter HX5 IBM System x iDataPlex
dx360M4IBM System x iDataPlex
dx360M4Lenovo NeXtScale nx360M5
WCTProcessor Type Westmere EX Xeon E7-4870 Sandy Bridge EP Xeon E5-2680 Ivy Bridge EP and Xeon Phi 5110P Haswell EP Xeon E5-2697 v3Nominal Frequency [GHz] 2.4 2.7 1.05 2.6Performance per core 4 DP Flops/cycle = 9.6 DP Flop/s
2-wide SSE2 add + 2-wide SSE2 mult
8 DP Flops/cycle =21.6 DP Flops/s 4-wide AVX add + 4-wide AVX
mult
16 DP Flops/cycle =16.64 DP Flops/s 8-wide fused multi-
ply-adds every cycle using 4 threads
16 DP Flops/cycle = 41.6 DP Flops/s two 4-wide fused
multiply-adds
Total Number of nodes 205 9,216 32 3,072Total Number of cores 8,200 147,456 3,840 (Phi) 86,016Total Peak Performance [PFlop/s] 0.078 3.2 0.064 (Phi) 3.58
Total Linpack Performance [PFlop/s] 0.065 2.897 n.a. 2.814Total size of memory [TByte] 52 288 2.56 194Total Number of Islands 1 18 1 6Typical Power Consumption [MW] < 2.3 ~1.1ComponentsNodes per Island 205 512 32 512Processors per Node 4 2 2 Ivy Bridge EP + 2 Phi 5110P 2Cores per Processor 10 8 8 (Ivy Bridge EP) + 60 (Phi) 14
Cores per Node 40 16 16 (host) + 120 (Phi) 28Logical CPUs per Node (Hyperthreading) 80 32 32 (host) + 480 (Phi) 56Memory and CachesMemory per Core [GByte] (typically available for applications) 6.4 (~6.0) 2 (~1.5) 4 (host) + 2 x 0.13 (Phi) 2.3 (2.1)Size of shared Memory per node [GByte] 256 32 64 (host) + 2 x 8 (Phi) 64 (8 nodes in job class big: 256)Bandwidth to Memory per node [Gbyte/s] 136.4 102.4 Phi: 384 137InterconnectTechnology Infiniband QDR Infiniband FDR10 Infiniband FDR10 Infiniband FDR14Intra-Island Topology non-blocking Tree non-blocking TreeInter-Island Topology Pruned Tree 4:1 n.a. Pruned Tree 4:1Bisection bandwidth of Interconnect [TByte/s] 12.5 5.1ServersLogin Servers for users 2 7 1 5StorageSize of parallel storage (SCRATCH/WORK) [Pbyte] 15Size of NAS storage (HOME) [PByte] 3.5 (+ 3.5 for replication)Aggregated bandwidth to/from parallel storage [GByte/s] 250Aggregated bandwidth to/from NAS storage [GByte/s] 12Capacity of Archive and Backup Storage [PByte] > 30System SoftwareOperating System Suse Linux Enterprise Server (SLES)Batchsystem IBM LoadlevelerParallel Filesystem for SCRATCH and WORK IBM GPFSFile System for HOME NetApp NASArchive and Backup Software IBM TSMSystem Management xCat from IBMMonitoring Icinga, Splunk
The SuperMUC Multi-Petascale System

SuperMUC-NG – Next Generation Supercomputer at LRZ
SuperMUC-NG – Next Generation Supercomputer at LRZOn December 14, 2017, LRZ and Intel signed a contract for the delivery of the new supercomputer at LRZ. Super-MUC-NG will be the „Next Generation“to the currently operated SuperMUC, and will provide an impressive computational power of 26.9 PFlop/s to a wide-ranging scientific community.
SuperMUC-NG is currently being installed and will start production in early 2019. It will be equipped with more than 6,400 Lenovo ThinkSystem SD650 DWC compute nodes based on the Intel Xeon Scalable processor. Tech-nical details can be found in the table.
Just like SuperMUC, SuperMUC-NG will be cooled using warm water. Lenovo, the system integrator, has devel-oped a cooling concept that will further reduce power consumption and will reuse the waste heat of the su-percomputer to generate cold water. Hereby advanced adsorption cooling technology will be used. The fund-
ing of SuperMUC-NG is shared to equal parts by the federal government of Germany and by the Free State of Bavaria through a strategic plan of the Gauss Cen-tre for Supercomputing (GCS). The total cost of Phase 1 of the project sums up to 96 Million Euro for 6 years including electricity, maintenance and personnel. Ba-varia’s Minister of Science Dr. Ludwig Spaenle stated during the contract signing ceremony that excellent research and development need excellent working con-ditions. With its next supercomputer, SuperMUC-NG, LRZ will meet these demands and establish the prereq-uisites for continuation of state-of-the-art scientific re-search in Bavaria.
Professor Dieter Kranzlmüller, Chairman of the Board of LRZ, sees LRZ well-positioned for the future: “With the new supercomputer, LRZ is well prepared to support scientists in achieving the next level of supercomputing. As part of the project, the user support team will be extended.”
Figure 1: Contract signing for SuperMUC-NG. From left to right: Prof. Dr. Dieter Kranzlmüller, Chairman of the Board of Directors at LRZ, Prof. Dr. Thomas O. Höllmann, President of the Bavarian Academy of Sciences and Humanities, Charles Wuischpard, Vice President, Data Center Group General Manager, Scalable Data Center Solutions Group, Intel Corporation, Dr. Ludwig Spaenle, Bavaria’s Minister of Science, Dr. Herbert Huber, Head of the High Performance Computing Department at LRZ, Scott Tease, Executive Director, HPC and AI, Lenovo Data Center Group.
8
278

Figure 2: One blade of SuperMUC-NG (Lenovo SD650 DWC) contains two compute nodes and the warm water cooling coils (Picture: Lenovo).
The SuperMUC Multi-Petascale System
SuperMUC-NG, Hardware overview
Peak performance 26.9 PFlop/s
Main memory 718 TByte
High performance parallel file system 50 PByte
Data science storage 20 PByte
Cooling Direct warm water cooling
Re-use of excess heat Adsorption chiller
Thin Nodes Fat Nodes
Processor type Intel Skylake Intel Skylake
Total number of nodes of this type 6,336 144
Number of cores per node 48 48
Total CPU Cores 304,128 6,912
Number of islands with this node type 8 1
Memory pernNode 96 GByte 768 GByte
Interconnect Intel Omni-Path 100G Intel Omni-Path 100G
Topology Pruned Fat Tree Pruned Fat tree
Software
Operating system / batch queueing system Suse Linux SLES / SLURM
Parallel filesystem IBM GPFS
Cloud Components
Nodes with Nvidia V100 GPUs 32
Nodes without GPUs 32
279

ISBN 978-3-9816675-2-3www.lrz.de
In this book, the Leibniz Supercomputing Centre (LRZ), a member of the Gauss Centre for Supercomputing (GCS), reports on the results of numerical simulations, performed in 2016 and 2017 on the SuperMUC petascale system. More than 110 project reports give an impressive overview of the utilization of SuperMUC, the Tier-0 system of the Bavarian Academy of Sciences and Humanities.
SuperMUC Phase 1 began user operation in July, 2012, and SuperMUC Phase 2 (picture above) became operational in May 2015. Each system segment has a peak performance of more than 3 PFLOP/s. Both phases are based on Intel x86 architecture and are coupled via a common parallel file system (GPFS). They are independently operated, but offer an identical programming environment. A detailed system description can be found in the appendix.
The articles provide an overview of the broad range of applications that use high performance computing to solve the most challenging scientific problems. For each project, the scientific background is described, along with the results achieved and the methodology used. References for further reading are included with each report.