
Using Diatonic Tendencies As A Harmonic Technique - Digital ...

Hierarchical Tendencies of Capital MarketsAmong International Financial Centers
JESSIE P.H. POON
ABSTRACT The dramatic evolution of global finance in the last three decades has seen inten-
sified competition among the world’s major cities to become prominent control centers of global
financial flows. This paper examines the spatial organization and evolution of capital markets in
forty-three world cities from 1980 to 1998. It finds evidence of the strengthening of hierarchical
tendencies among world financial and capital cities as they search for ways to differentiate between
themselves through financial concentration and productivity. The results also indicate a trend
towards the dominance of London and New York in this financial hierarchy, and that top tier cities
tend to be characterized by significantly lower levels of market and share concentrations, share
trading value, and risks. Finally, important differences in ownership patterns between the capital
markets are detected for the top cities of the hierarchy.
Introduction
S ince Friedmann’s (1986) seminal work, proselytization of “world cities” as the majorheuristic device for thinking about the global economic system has captured the inter-
est of many scholars. The world and global city literature advance the notion that as eco-nomic production intensifies worldwide, only a few cities are able to coordinate and controlcomplex, particularly producer-oriented functions, such as financial functions, that supportthe expansion and construction of the world economy (King 1989; Clark 1996; Knox 1995;Sassen 2001). Alongside the world city hypothesis, a second strand of literature has devel-oped which views world cities as epicenters of global financial transactions (Reed 1981;Goldberg et al. 1988; McGahey et al. 1990). Both literatures are not mutually exclusive.A central theme surrounding the two literatures has been the primary dominance ofLondon, New York, and Tokyo (henceforth “Big-3”) in the global city system, which BenEdwards in The Economist (1998) has called “capitals of capital.” However, though thethree cities are alleged to be unrivaled in their positions as value-creating centers in thedesign and delivery of financial services, their preeminence also thrives on a network offinancial centers that supports the broadening and deepening of the international capital
Growth and ChangeVol. 34 No. 2 (Spring 2003), pp. 135-156
Submitted May 2002; revised Nov. 2002, Jan. 2003.© 2003 Gatton College of Business and Economics, University of Kentucky.Published by Blackwell Publishing, 350 Main Street, Malden MA 02148 US and 9600 Garsington Road, Oxford OX4 2DQ, UK.
Jessie Poon is an associate professor of Geography, at the State University of New York-Buffalo.
Her email address is [email protected]. The invaluable comments of three reviewers are grate-
fully acknowledged.
market. Indeed competition between world financial centers has intensified in the last twodecades as many policy-makers search for ways to upgrade their own national centers vizthe global hierarchy [see Latter (2001) on Hong Kong, Clementi (2001) on London, andLee (2001) on Singapore].
The emergence of world cities as centers of capital has been largely encouraged by atrend of devolution in global finance and supported by technological and electronic expe-diency. In the five years between 1992 and 1997 alone, net issues of international debtsecurities quadrupled from $149.9 billion to $595.9 billion (Bank for International Set-tlements 1998). Internationalization has been most dramatic in international bonds, whichaccount for over 90 percent of the global securities market. Increase in financial activitiesis explained by the rapid expansion of transnational corporate (TNC) activities, the indus-trial development of emerging economies as well as financial deregulation and the relax-ation of capital controls among countries. According to Sassen (2001), world, particularlyglobal, cities are primary agents in the production of financial services. These servicesprovide TNCs with the necessary capabilities to conduct their global operations. In viewingworld cities as central production sites of complex financial activities, supply-drivenfactors underscoring the construction of the global urban system have emerged as popularexplanations in the formation of international financial centers.
This paper has two objectives: first, it examines the spatial organization and evolutionof capital markets in world cities from 1980 to 1998. Second, it investigates the nature ofcapital markets in these cities. The world cities literature1 has focused much more onadvanced producer services such as legal and accounting than on financial services(Beaverstock 1996; Beaverstock et al. 1999; Taylor and Walker 2001), Sassen’s (2001)book being the exception, although Sassen is much more interested in the “practice” ofglobal control through financial activities. Further, Budd (1995) has argued that it is lessproblematic to configure the global urban system in terms of international financial trans-actions than advanced producer services, the latter of which is more difficult to define.But the literature on international financial centers tends to emphasize largely bankingactivities. Yet competition between world cities is predicted to be most intense in capitaland securities markets (“Rise and Fall” The Economist 32:3 1992). Internationalizationof equity markets has been encouraged by a disintermediation of money and finance (Thriftand Leyshon 1998), and the introduction of mass information by the financial industry(Leyshon 2000). This paper will focus on the spatial distribution and structure of capitalmarkets viz stock markets in forty-three cities, the majority of which have been identifiedby the literature to be world cities. In the next section, the formation of international andworld financial centers will be discussed. This is followed by an analysis of the spatialdistribution of the financial centers. Finally, a summary of the findings and potential short-comings of the paper are provided in the conclusion.
World Cities and International Financial CentersAccording to the world cities literature, the global urban landscape is dominated by a
small number of cities that are distinguished by their higher order functions of control and
136 GROWTH AND CHANGE, SPRING 2003

coordination of global economic flows. These cities are pivotally arranged in a hierarchi-cal network of trade, investment, financial, and even government transactions, and areresponsible for creating value up and down the global economic chain (Friedmann 1986;Smith and Timberlake 1995; Clark 1996; Taylor 1997). Proponents of world cities broadlyagree that the existence of a sophisticated financial complex is a prerequisite for the for-mation of a world city. Furthermore, within the world city hierarchy, a separate globalleague, comprising New York, London, and Tokyo, may be distinguished. Global, asopposed to world, cities have been extensively investigated by Sassen (1999; 2001). TheBig-3 are accorded “global” as opposed to “world” status because they are said to becentral sites in the making of the global financial market. Clearly, Sassen is more inter-ested in formation of global cities from the supply dimension, emphasizing the produc-tion-oriented base of finance rather than the more conventional description of cities as sitesof consumption where financial services are seen to be secondary outputs from staplesectors such as manufacturing. In particular, Sassen argues that the internationalization ofthe global marketplace in recent decades is largely associated with the emergence of amarket for equities. Unlike international portfolio investment in the past, securitizationof financial markets today is driven by institutional investors and the increased cross-borderactivities of transnational corporations. Function, not population size, and finance (andadvanced producer services) rather than manufacturing, favor the formation of world cities(Simon 1995; Clark 1996).
In a separate but related line of inquiry, a number of researchers have been interestedin the nature of international financial centers, for example, Reed (1981), Kindleberger(1974), Goldberg et al. (1988), McGahey et al. (1990), Yoon (1989), Choi et al. (1986),Abraham et al. 1994, and O’hUallachain (1994). Like the world cities literature, thesestudies largely attribute the economics of financial concentration to scale economies. Thetask of financial and capital centers is to mediate between surpluses and deficits of finan-cial savings that are best matched in a central place. Geographical centrality of financialactivities is even more important in interregional or international exchanges because ofthe advantages of scale economies. The economic underpinnings of economies of scalesuggest that concentration of a number of financial institutions and capital in one city facilitates transactions between buyers and sellers, namely borrowers and investors.Increasing returns are derived from financial firms’ abilities to share costs among numer-ous customers and differentiated markets. Clustering develops so that firms and agents inthe capital market can reduce high transaction costs (e.g., high risk of investment) throughcontinuous exchange of information (Kindleberger 1974; Gehrig 1998). Scale economiesin international financial centers are largely associated with improvements in informationflows, which in turn bring about the competitive pricing of financial instruments and serv-ices. Sunk costs for financial institutions also tend to be relatively high (e.g., start-up costs,training of labor) as are embedded relationships between securities issuers and clients,which render investment and securities firms relatively spatially immobile. Hence onlywhen there is significant deterioration in the environment will firms be motivated to relo-cate in the financial center. Groups of markets also tend to be closely interrelated thereby
HIERARCHICAL TENDENCIES OF CAPITAL MARKETS 137
favoring a process of co-location (Davis 1990). All this creates a virtuous circle of finan-cial knowledge as enhanced flows of information increase potential accessibility to largepools of capital, which in turn attract TNCs and their headquarters.
Besides scale economies, conditions that favor the formation of a financial and capitalcenter relate to stable financial and currency systems: broad and deep markets such as longand short-term markets, options, commodities and futures markets; an efficient infra-structure that allows efficacious clearing options and monetary transactions; and skilledhuman capital (consultants, lawyers, accountants, etc.).
International financial centers typically originate as national centers that subsequentlyassume regional status from a rise in demand to service international capital transactionsarising from increased international trade. Such growth requires that national centersexpand their financial market activities to include their regional neighbors (Reed 1981).Many international financial centers, therefore, attain their international stature by oper-ating at two levels of regionalism—sub and supra-national. In addition, super financialcenters like London, New York, and Tokyo are distinctive because of the size of their finan-cial markets as well as their abilities to amass a complex informational base that allowsthem to exploit the asymmetry of information globally. When the U.S. imposed the inter-est equalization tax in 1963 to address its balance of payments problems, London promptlycaptured the Eurobond market from New York as transaction costs increased in the latter,arising from information asymmetry between the two cities as a result of the tax policy.A relatively liberal regulatory environment coupled with high levels of transparency andliquidity in London and New York as opposed to other international financial centersfurther help create an information base that is readily communicated to investors.
History also explains the formation of international financial centers. London’s globalstature may be traced to its colonial history with its agglomeration of European merchantsand financial emigrés. The city became an unchallenged center for foreign bonds as thepound sterling dominated international transactions in the eighteenth century. Similarly,while money-market trading in the U.S. currently favors New York, this was not always soobvious. Rather, the country’s banking activities were centered in Philadelphia around1780, and the latter was poised to become the U.S.’s first money market. However, withthe opening of the Erie Canal in 1825, domestic and foreign trade began to expand rapidlyin New York City. At the same time, the state of New York began floating Erie Canal bondswhich attracted much European capital, while institutional infrastructure surroundingbanking regulation thickened (Meyer 1991). All these precipitated a shift of financial activ-ities from Philadelphia to the City of New York. Despite the apparent divergence in lit-erature between that of world cities and international financial centers, there are importantpoints of convergence. First, both literatures agree generally that world financial centersand cities are important constituents of the global economy because they act as controland management centers of financial and other economic flows. Second, both literaturesfavor the use of functions to study the spatial arrangement of cities, and both concludethat cities are arranged hierarchically on the global urban landscape reflecting differentialsurpluses at various levels of accumulation, and thereby the strength of command of func-
138 GROWTH AND CHANGE, SPRING 2003

tions. Third, cities that have been identified by the two literatures as world cities or inter-national financial centers overlap a great deal. Both literatures point to the Big-3 as top-tier cities in global economic exchanges, supported by smaller world cities like Paris,Frankfurt, Singapore, Hong Kong, and others. Fourth, the international financial center lit-erature is heavily focused on one function, that is, banking activities, and may be treatedas a subset rather than a separate literature from the world cities literature. The worldcities literature favors a broader study of other advanced producer functions such as legaland accounting services (Beaverstock 1996; Taylor and Walker 2001); labor markets(Sassen 2001), corporate headquarters and telecommunications (Short et al. 1996); andpolitical, educational, and cultural functions (Markusen and Gwiasda 1994) in addition tofinance.
This paper collapses the two literatures and treats international financial centers as asubset of the world cities literature. The term “international” is replaced with “world” inorder to capture the complex nature of international financial centers better than is cur-rently suggested by the literature. At the same time, “capital” is also added to the descrip-tion in order to broaden the financial focus of the study away from traditional bankingactivities to securities activities. Securities activities are undertaken not merely by com-mercial banks, but also by a wide range of actors such as investment banks, institutionalinvestors, and governments. Hence, cities that dominate the international urban hierarchywill be termed “world financial and capital centers” (WFCCs).
Spatial Distribution and OrganizationIn this section, the spatial structure and distribution of WFCCs is analyzed. Given the
discussion in the previous section, it is expected that WFCCs will likely be arranged in ahierarchical fashion on the basis that global financial integration is facilitated by a networkof cities that serve as different command points in the production of financial services.
Studies on world and financial cities are generally hampered by the lack of data thatallow for sensible international comparisons (Short et al. 1996; Taylor 1999). Short andhis colleagues have observed that most financial data are collected at a national rather thanan international level, and when they are international, they are rarely at the city level.Data on the character of exchange markets is collated from two sources, namely, publica-tions by the Bank for International Settlements (BIS) in Basel, Switzerland, and MeridianSecurities’s World Stock Exchange Fact Book 2000. BIS tends to publish country-leveldata, leaving World Stock Exchange Fact Book 2000 as the primary source of historicalurban data on securities for the analysis below. The earliest year for which reasonable dataexists for all forty-three cities is 1980, and the most recent, 1998. Even then, completedata is available for only a few dimensions or indicators. This is not surprising given thatfinancial integration only intensified in the last ten to fifteen years with the emergence ofseveral markets in developing countries. In most cases, the major stock exchange is locatedin the country’s national or capital city. Only in three instances were competing citiesfound nationally, namely, Canada (Toronto/Montreal),2 Spain (Barcelona/Madrid), andBrazil (Rio de Janeiro/Sao Paulo). In each of the cases, the city with the larger stock
HIERARCHICAL TENDENCIES OF CAPITAL MARKETS 139

exchange (indicated by market capitalization) was selected as the WFCC for that country.This is reasonable considering that differences in market capitalization between compet-ing cities are rather large. For example, while Montreal has been historically more impor-tant than Toronto in Canada’s capital market, since the 1970s, Toronto’s position as thenational host of Canada’s major stock exchange has surpassed that of Montreal. This maybe seen readily in the fact that in 1998, Toronto’s market capitalization was 1.5 times largerthan that of Montreal. The final list of forty-three cities compares favorably with thosefound in Reed (1981) and Friedmann (1986) (see Appendix 1).
Methodology. Cluster analysis was used to examine the spatial organization ofWFCCs. Cluster analysis has become a popular taxonomic tool for classifying cities (e.g.,Reed 1981; Hill et al. 1998; Stimson et al. 2001). There are no dependent or independ-ent variables in cluster analysis. It is a procedure that allows distinct groups within a pop-ulation to be identified, in this case, the forty-three cities (Everitt 1993). More specifically,the agglomerative hierarchical cluster analysis was used to analyze the underlying struc-ture of WFCCs. Based on the literature discussed earlier, there is reason to expect thatthe global equity market is likely to be disproportionately concentrated in the Big-3 andsupported by a number of smaller regional capital centers, hence justifying the use of hier-archical techniques. The agglomerative hierarchical method consists of a series of fusionsof individual cities into “clusters” based on some distance measure. In this case, the dis-tance measure is based on the centroid method. While Ward’s hierarchical method hasbeen popularly applied elsewhere in studies on cities, it was found that the centroid methodwas more satisfactory because of significant outliers and differences in cluster size in thisdata (Everitt 1993).
Relatively good data may be found for five descriptors of the stock markets for 1980,1990, and 1998: market capitalization, value of shares traded, number of shares traded,number of companies (foreign and domestic) listed, and dividend yield (Table 1). Otherdescriptors such as market and share concentrations do not exist for many cities in 1980and 1990. Furthermore, the number of world cities that host stock exchanges is not verylarge. Unless sample size is relatively large relative to the number of variables, interpre-
140 GROWTH AND CHANGE, SPRING 2003
TABLE 1. LIST OF VARIABLES.
Variables Units
Market capitalization (average annual, domestic, and Constant 1999 US$ foreign) millions
Number of listed companies (domestic and foreign) —Number of shares traded (domestic and foreign) Annual figuresValue of shares traded (annual, domestic, and foreign) Constant 1999 US$
millionsDividend yield %

tation of statistics generated from the cluster analysis will be unstable. A ratio of 20 isgenerally recommended for a tractable set of interpretations which in this case works outto roughly two variables, namely, market capitalization and value of shares traded. Bothvariables are important indicators of the size of the securities market in WFCCs. Size isimportant because it determines the productivity of financial markets (Budd 1995). Thepotential inclusion of the remaining three variables was also explored; however, the eigen-values revealed that market capitalization and value of shares traded accounted for over95 percent of the total variance.3
Results of Cluster Analysis. To identify clusters of cities, changes in the agglomer-ation coefficient (Everitt 1993) were searched for, and the cubic clustering criterion (CCC)(Sarle 1983) was examined. Marked increases in the agglomeration coefficient typicallyindicate the delineation of clusters, which in turn indicates a large increase in total vari-ance. Similarly, local peaks under CCC suggest cluster formation. The results were furthercorroborated against tree diagrams or dendrograms that are typically generated from pro-grams (e.g., SAS) on hierarchical cluster analysis.
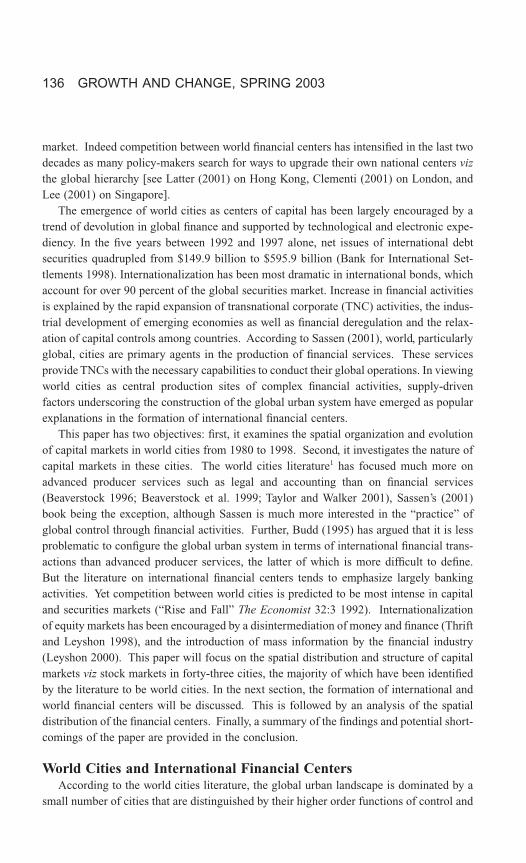
Figure 1 shows that three clusters of WFCCs may be found in 1980. New York andTokyo appear to dominate the international capital market forming a distinct cluster oftheir own (see also Short et al. 1996). The U.S.’s money market is the largest in the worldwhile the U.S. dollar is the most preferred currency for international transactions. NewYork’s dominance may also be explained by the size of its domestic market and the city’s
HIERARCHICAL TENDENCIES OF CAPITAL MARKETS 141
Tier 2 LondonZurich
Frankfurt Toronto
Tier 3 Amsterdam LuxembourgViennaBangkokSingapore
AthensMadridTel-AvivJakartaTaipei
BrusselsMilanBuenos-AiresHong KongSydney
CopenhagenOlsoMexico CityKuala Lumpur
HelsinkiParisRio de JaneiroManila
LisbonStockholmJohannesburgSeoul
Tier 1 New YorkTokyo
FIGURE 1. WORLD FINANCIAL AND CAPITAL CENTERS 1980.Source: World Stock Exchange Fact Book 2000.
location as the preferred base for multinational corporate activities in the country, the latterof which have in turn attracted a large number of investment banks that perform the under-writing of securities in the primary market, or act as brokers for customers in the sec-ondary market. In Tokyo’s case, the city may be one of eight markets that exist in Japan.However, Tokyo’s securities exchange also handles over 80 percent of Japan’s tradingvolume. Unlike its U.S. counterpart, Tokyo’s emergence is fairly recent, occurring onlyafter 1970 when it began to issue yen-denominated bonds. Tokyo’s rise may be explainedby a steady liberalization process of its domestic financial markets beginning in 1974.Until then, no Japanese security firm could purchase foreign securities. Likewise, noforeign firm could purchase a Japanese financial asset. To manage a rising yen, Japaneseinstitutions were permitted to purchase foreign securities in 1978. This, and the relaxationof the Foreign Exchange and Foreign Trade control, resulted in a marked rise in short termcapital movements. At the same time, the yen became increasingly internationalized whilecontrols on foreigners’ portfolio investments in Japan were largely abolished (Gultekin et al. 1989; Lincoln 1998).
Below New York and Tokyo lies a second cluster consisting of the cities of London,Frankfurt, Toronto, and Zurich. All other WFCCs form the third and final cluster. Figure1 reveals a relatively shallow international capital market system in the sense that a largenumber of smaller WFCCs, from Amsterdam and Paris in Europe to Singapore and HongKong in Asia, appear to be relatively indistinguishable, creating a broad-based hierarchyfor 1980. While London’s historical stature as an international financial center is well-documented, it failed to make it to the tier 1 cluster comprising New York and Tokyo. Partof the explanation lies in the existence of capital controls in the period before 1980 inBritain. These controls were only abandoned in 1979 with the abolition of exchange con-trols, followed by the “Big Bang” in 1986. Hence before 1979, investors in Britain wererestricted to the investment dollar market for their foreign investment activities. With therelaxation of exchange controls, investors now have unrestricted access to the foreignexchange market in London for their outward portfolio investment (Eng et al. 1995). Sim-ilarly, the Big Bang created London’s International Stock Exchange while ending fixedcommissions and the monopoly of stock transactions by brokers and jobbers. London’sBig Bang was followed by a series of liberalizations including the repeal of several EUtax initiatives. These liberalizations, as will be seen below, had a certain degree of successin restoring and reinstating London’s historical stature as a global capital center in subse-quent years.
Alongside London, the three cities of Toronto, Frankfurt, and Zurich are also impor-tant WFCCs. Frankfurt’s position, not unlike Tokyo’s, has been aided by the increasingdominance of Germany in world trade and investment, while in Zurich, traditionally animportant financial and banking center, leading Swiss banks hold and manage large blocksof shares listed on the city’s stock exchange (Rybczynski 1994). Toronto’s importance, onthe other hand, is derived from its hinterland’s vast natural resources and minerals as well as large blocks of shares (particularly in oil, mining, and agriculture) that are held byAmerican firms.
142 GROWTH AND CHANGE, SPRING 2003
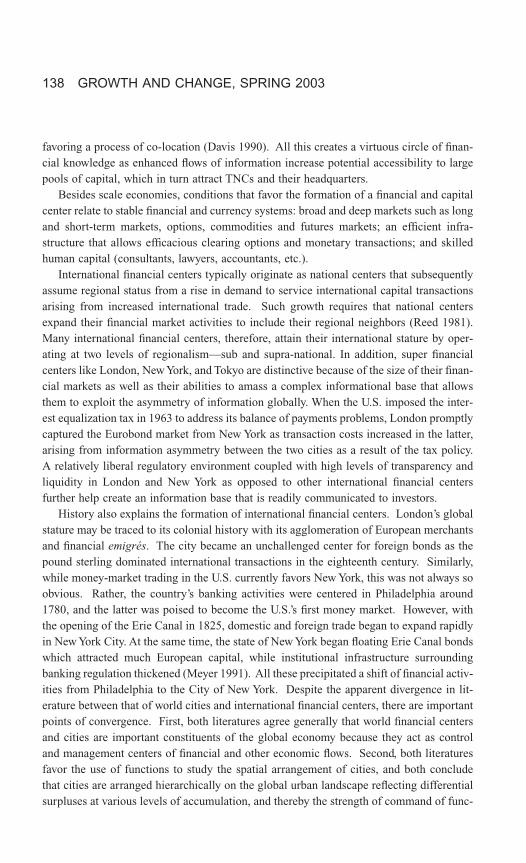
Turning to 1990, a rather different picture emerges altogether (Figure 2). London isnow assigned alongside New York and Tokyo to tier 1, while second tier Frankfurt andToronto are joined by Paris and Taipei, with Zurich being assigned to a lower tier. Indeedthe WFCC hierarchy appears to have deepened as tier 3 cities in 1980 split into two sep-arate groups in 1990. It would seem that by this stage, capital markets in WFCCs suchas Singapore, Hong Kong, Amsterdam, Sydney, and Brussels, have grown rapidly, placingthem ahead of their counterparts like Athens, Helsinki, Buenos Aires, and others. Mean-while, Taipei has become a major second tier capital center—a result of Taiwan’s role asa new net supplier of funds—while over 90 percent of all trading in listed securities inFrance is now conducted out of Paris (Lloyd 1991). 1990 thus saw the emergence of theBig-3 in the global system of WFCCs, supported by three lower tiers of cities.
The emergence of the Big-3 suggests that as the capital market expands globally, it ischaracterized by a simultaneous process of centrifugalization and spatial differentiation,which in turn promotes a deepening of the WFCC hierarchy. This is further seen in 1998.
HIERARCHICAL TENDENCIES OF CAPITAL MARKETS 143
Tier 2 Frankfurt Paris Toronto Taipei
Tier 3 Amsterdam Brussels Copenhagen Luxembourg MadridMilan Oslo Stockholm Vienna ZurichMexico City Rio de Janeiro Johannesburg Bangkok Hong KongKuala Lumpur Mumbai Seoul Singapore Sydney
Tier 1 New YorkTokyoLondon
Tier 4 Athens Helsinki Lisbon Buenos-Aires Bogota CaracasSantiago Bangkok Istanbul Jakarta Manila Wellington
FIGURE 2. WORLD FINANCIAL AND CAPITAL CENTERS 1990.
Centralization through hierarchical tendencies among the cities, for instance, increasedmarkedly by 1998 in the top tiers (Figure 3), with the cluster analysis identifying someseven groups of cities for the year. Increased hierarchical tendencies were also paralleledby fragmentation and differentiation among top tier clusters, with New York and Londonbreaking away from Tokyo. Tokyo is now in a separate cluster with Frankfurt, indicating
144 GROWTH AND CHANGE, SPRING 2003
Tier 2 Frankfurt Tokyo
Tier 5 Brussels Madrid Stockholm Kuala Lumpur Mexico City Rio de Janeiro Johannesburg
Tier 1 New York London
Tier 7 Athens Lisbon Vienna Prague Buenos-Aires Bogota Caracas Santiago Bangkok Jakarta Manila Wellington
Tier 3 Amsterdam Luxembourg Milan Paris Zurich Toronto Sydney Taipei
Tier 4 Hong Kong Singapore Seoul
Tier 6 Copenhagen Helsinki Oslo Budapest Warsaw Tel-Aviv Mumbai Istanbul
FIGURE 3. WORLD FINANCIAL AND CAPITAL CENTERS 1998.

that Frankfurt has consolidated its position among cities in continental Europe, whileTokyo’s previous dominance over London in 1980 appears to be evaporating.
London’s reinstatement as a first tier city largely parallels its consolidation of regionaldominance in Europe in the 1990s as a center of international bonds and foreign exchange.Regional access to the city from Europe is much less, requiring between one to two hoursby air, compared to Tokyo where travel can take up to six hours between the city and otherregional capitals. The city of London also benefits from a spatial concentration of finan-cially related firms and activities. For example, an abundant supply of requisite profes-sional services like legal and accounting services and other interrelated activities (e.g.,mortgage-based securities) has provided important support to the financial industry(Beaverstock 1996; Beaverstock et al. 1999), creating what Pryke and Lee (1995) havecalled “thick market externalities.”
Fragmentation, too, is found among middle tier cities. Hong Kong, Singapore, andSeoul are increasingly distinguished from cities like Brussels, Madrid, Stockholm, KualaLumpur, Mexico City, Rio de Janeiro, and Johannesburg. However, they still trail majorWFCCs like Amsterdam, Zurich, Toronto, Taipei, Sydney, and Paris. Such a trend pointsto the consolidation and strengthening of regional positions among some non Big-3WFCCs, indicating that the spatial division of labor has also intensified. While a morerefined division of labor may have resulted from increased global financial integration andpotential convergence among WFCCs, the analysis also indicates that the success of theupper tier cities depends on the peripheralization of the bottom tier cities. In comparingFigures 1, 2, and 3, for example, WFCCs like Athens, Caracas, Santiago, Bangkok,Jakarta, Manila, Bogota, Buenos Aires, and Lisbon have not been able to strengthen their position from 1980, compared to the cities of Hong Kong, Singapore, and Seoul. Thesuccess of the latter reflects their recent accumulation of industrial and economic wealth,although cities in the former group also constitute recent emerging markets with muchshorter histories of financial liberalization. Nevertheless, Figure 3 shows that some citieshave been more successful in repositioning themselves more favorably than others in theglobal equity markets.
Figures 1 to 3 point to a trend of greater concentration of capital among a few megaworld cities, namely the Big-3 and increasingly, Frankfurt as well. In Frankfurt’s case,Germany’s financial markets were highly regulated up to the 1980s. A series of financialliberalizations have since taken place, beginning with the abolition of taxation on exchangeturnovers in 1991. The introduction of the electronic trading system, XETRA, and theGerman new market index (NEMAX), the latter of which is traded exclusively in Frank-furt rather than exchanges in other German cities, all contributed to a marked increase inmarket capitalization and turnover in the 1990s (Bordlein 2002).
At the same time, increased concentration at the top of the global urban system has also seen the diffusion of capital down the hierarchy thereby creating an important groupof world regional centers in middle tiers. New York is the only city that consistently pre-sides over the hierarchy. Warf (2000) notes that New York’s preeminent position in globalfinance is sustained by its ability to move large amounts of money and information rapidly
HIERARCHICAL TENDENCIES OF CAPITAL MARKETS 145

through innovative use of a sophisticated international telecommunications network.Further, the New York stock exchange (NYSE) relies on considerable spatial stability in thecity’s financial district, at least in the period examined, as this encourages integrationbetween information technology and financial transactions (Longcore and Rees 1996).Domestically, unlike Frankfurt where federalist politics have resulted in greater regionalcompetition among Germany’s financial centers (Bordlein 2002), NYSE has remainedlargely the U.S.’s exchange monopoly, driven in part by the presence of a number of insti-tutional investors, a concentration of firms that are engaged in the production of investmentstrategies, innovations in equity products, and the development of new derivative assets. Amore liquid and computerized exchange in the form of NASDAQ has not diminishedNYSE’s size either even though trading volume in NASDAQ has exceeded that of NYSE’sin some years during the 1990s. However, NASDAQ also remains the preferred market forsmaller, often technology-oriented firms compared to NYSE (Corwin and Harris 2001).
Tokyo appears to be losing some ground to London, the latter of which now has thelargest foreign exchange (forex) market in the world and the oldest and most sophisticatedmoney market. Indeed, since the deregulation that took place in the 1980s, London’s forexvolume has grown to nearly twice that of New York’s and three times that of Tokyo’s. The Japanese financial system is also configured rather differently from that of the U.S.Historically, a sizeable proportion of capital was tied to land and real estate transactionsup to 1997 when the country and the rest of Asia experienced a crisis in the financial sectorthat spread to other sectors as well. Corporations also depend much more on banks astheir primary source of capital. The weaknesses of these two factors became apparentduring the 1997 Asian financial crisis. As the yen rose in the 1990s, this did not result inprice inflation. Instead, Japan experienced asset inflation. This in turn created consider-able speculation on the stock market. When the financial crisis hit the Asian region,Japan’s financial markets suffered important losses arising from decreased asset valueamong many firms whose loans also quickly became non-performing. This, and the markedfall in real estate prices, had a significant adverse effect on the country’s capital markets(Lincoln 1998). Its fourth largest securities house, Yamaichi Securities, for instance, wentinto liquidation in 1997. Meanwhile, deregulation in other Asian WFCCs like Hong Kongand Singapore has seen greater competition among the WFCCs in the Asia Pacific, arisingfrom the relocation of many securities firms to these cities.
Functional classification of clusters according to size thus indicates a deepening of theWFCC hierarchy. However, while the analysis has shed light on the changing spatialorganization of WFCCs, capital markets among the cities are not necessarily constitutedin a uniform manner (Markusen and Gwiasda 1994; Budd 1995; Hill and Kim 2000).Rather, the integration of global finance through a hierarchical network of WFCCs hasbeen facilitated by a deepening in the spatial division of labor in the financial sector. Hencestriking features of WFCCs are their systematic differences rather than similarities incapital markets, and the increased ability among a few cities to reposition themselvesfavorably in the global financial network by exploiting and constructing comparativeadvantages on the global marketplace.
146 GROWTH AND CHANGE, SPRING 2003

To understand some of these differences, we turn to analysis of variance (anova) (Table2). The number of clusters was compressed from seven to five in order to satisfy tests ofhomogeneity and to remedy small cell problems. Hence New York, London, Tokyo, and Frankfurt were grouped into the same cluster (tier 1). Similarly, tier 4 cities (Hong Kong,Singapore, and Seoul) were collapsed with those in tier 5 (Brussels, Madrid, Stockholm,Kuala Lumpur, Mexico City, Rio de Janeiro, and Johannesburg) to form tier 3. Thisimplies that cities in tiers 6 and 7 in Figure 3 have now been regrouped as tiers 4 and 5respectively. Analysis of variance on the five groups of cities was performed for the following variables: market concentration, trading value concentration, company size, dividend yield, and risk rating.
Market and trading value concentrations are important because they provide an indi-cation of the number of companies and stocks that dominate the capital market in ques-tion. In Amsterdam for example, much of the trading in shares covers just one companyand stock: namely, the Royal Dutch Petroleum, suggesting that despite its WFCC status,the city’s capital market is relatively underdeveloped. In contrast, market and trading valueconcentrations in London and New York show a broader and more democratic spreadamong several companies and stocks, indicating the greater depth of capital markets in thetwo cities. These distinctions are important as they shed light on why top tier cities maybe in a class of their own. Risk rating has also been included because it provides an impor-tant indication of the investment climate in the cities in terms of entry and exit restrictionsas well as levels of transparency, all of which facilitate or inhibit transactions in the capitalmarkets. The closer the rating is to 100, the lower the risks associated with portfolioinvestment in the country. Risk rating here is provided by the World Bank which basedthe index on twenty-two components of risks.
The anova results in Table 2 reveal a striking pattern: tier 1 cities, comprising NewYork, London, Tokyo, and Frankfurt, are consistently distinguished from the lower fourtiers in terms of (1) lower market concentration, (2) larger average company size, (3) lowertrading value concentration, and (4) lower risk rating. Lower risks are also associated withsecond tier cities where the average mean of 82 is not that different from the rating of 90among the first tier cities. Other than this, the means are generally markedly different formany variables describing tier 1 cities, and confirmed by the Duncan test. No significantdifferences, on the other hand, may be found for dividend yield. It would seem from Table2 that capital markets of mega-WFCCs are much less concentrated among a few compa-nies and stocks. While lower tier cities like Hong Kong are widely regarded as important financial cities, Hong Kong’s capital market is also overwhelmingly dominated by ten companies (68 percent) suggesting a much shallower capital market.
Other differences among WFCCs are also presented in Tables 3 and 4. In Table 3, thedistribution of debt issuance is shown for 1998 and 1999. Developed countries are respon-sible for nearly 85 percent of total net issues, most of which are in the form of bonds andnotes. Financial institutions are the major actors although the share of corporate issuersincreased by some 8 percent, from 21 to 29 percent, from 1998 to 1999. New York’s preeminence is derived from the U.S.’s dominance in international debt securities, both
HIERARCHICAL TENDENCIES OF CAPITAL MARKETS 147

148G
RO
WT
H A
ND
CH
AN
GE
,S
PR
ING
2003
TABLE 2. ANALYSIS OF VARIANCE RESULTS FOR CITY CLUSTERS AND TIERS, 1998.
Descriptors of stock market City clusters/tiers Difference in means1 F statistic2
Tier 1 Tier 2 Tier 3 Tier 4 Tier 5(mean) (mean) (mean) (mean) (mean)
Market concentration 21.2 42.4 47.6 57.5 59.9 Tier 1 > tiers 2 to 5 3.03**(% share of top ten companies)
Company size ($1999) 1902.2 804.9 689.9 348.6 195.8 Tier 1 > tiers 2 to 5 5.97***Dividend yield (%) 1.63 2.19 3.2 2.0 2.5 No difference 0.96Trading value concentration (% 22.0 51.7 57.2 63.8 65.0 Tiers 2 to 5 > tier 1 4.06***
share of top ten stocks)Risk rating (100 = no risk) 89.9 81.8 63.9 63.7 55.2 Tiers 1 and 2 > 4.55***
tiers 3 to 5
1 Based on the Duncan test.2 F statistics are based on type III sums of squares.Sources: World Stock Exchange Fact Book, 2000; World Development Indicators 2000.

in terms of its financial and corporate institutions as well as its government and state agencies. Beyond the U.S., the picture is a little more complex. Corporate issuers are important for the United Kingdom (U.K.) as well as France and Germany, but not for Japan. Rather, the major issuers in Japan are its financial institutions. Indeed Tokyo’sdistinct political economy has led some scholars to argue that the city does not fit the world or global city hypothesis. Unlike London or New York, the city is much more producer- than service-oriented, and its international stature is derived more from Japanese corporations’ ability to generate sales from abroad than the city’s ability to attract global investment (Hill and Kim 2000). Its capital markets are characterized bysubstantial cross-ownership between keiretsu-like companies where a network of rela-tionships between lenders and borrowers is held together by a “main bank.” Further, shareownership is dominated by financial rather than corporate institutions. This last point will be further elaborated below.
Financial institutions also play an important role in the issues of debt securities inGermany and France. Like Japan, businesses are traditionally financed by bank credits.There is no distinction between commercial and investment banks in Germany forexample, nor are American-styled public stock brokerages found. Furthermore, there are
HIERARCHICAL TENDENCIES OF CAPITAL MARKETS 149
TABLE 3. MAIN FEATURES OF NET ISSUANCE IN INTERNATIONAL DEBT SECURITIES
MARKETS.
1998 1999Billions $ Share Billions $ Share
Total net issues 681.5 1225.2Money market 9.8 1.5 68.6 5.6Bonds and notes 671.1 98.5 1156.5 94.4
Geographical distributionDeveloped countries 575.3 84.4 1149.3 93.8Offshore centers 10.0 1.5 15.7 1.3Other countries 40.2 5.9 35.5 2.9International institutions 56.0 8.2 24.7 2.0
IssuersFinancial institutions 370.0 59.2 658.9 54.9Corporate issuers 133.2 21.3 352.7 29.4Central government 35.6 5.7 37.6 3.1State agencies and others 86.7 13.8 151.2 12.6
Source: Bank for International Settlements Quarterly Review: InternationalBanking and Financial Market Developments, June 2000, Bank for InternationalSettlements.

150G
RO
WT
H A
ND
CH
AN
GE
,S
PR
ING
2003
TABLE 4. OWNERSHIP OF INVESTORS, 1996.
Ownership New York London Tokyo Frankfurt1 Taipei Sydney Milan1
Industrial/commercial companies— 1.4 27.2 42.4 18.4 11.3 12.9
Banks 2.3 0.5 41.1 9.7 4.5 3.2Mutual funds/investment trusts/other
funds 14.8 10.1 2.2 4.2 1.7 — 12.9Pension/insurance 28.6 48.1 — 4.8 — 24.9 —Individuals/households/
non-profit organization 47.7 20.7 19.2 16.8 56.5 23.0 15.5Foreign 6.1 15.9 10.2 16.6 8.7 31.7 14.4Government/public sector — 0.1 0.3 5.5 6.0 0.1 40.7
All figures are based on distribution of domestic market value except for Milan and Hong Kong which are based on totaltrading value.1 Figures are for 1992.Source: World Stock Exchange Fact Book, 2000; World Development Indicators 2000.
HIERARCHICAL TENDENCIES OF CAPITAL MARKETS 151
no restrictions on bank activities in securities trading unlike the U.S. The dominance offinancial institutions as issuers of securities (“universal banks”) may be explained by thefact that German investors and corporations tend to favor low risk assets like bank bondsor fixed interest bank loans (Bordlein 2002). In the case of state and government issuers,U.S. tops the list of countries because of its highly valued treasury bonds. In contrast,state and government agencies are unimportant issuers for the U.K., Hong Kong, and Australia.
Finally, investor ownership patterns of seven cities are further described in Table 4. Nocomparable data may be found for other major WFCCs such as Hong Kong, Paris, or Amsterdam. Table 4 again shows striking differences in the nature of capital marketsamong the cities. Equity investment in New York is predominantly in the hands of indi-viduals and households. This is also true for Taipei. In contrast, pension funds and insur-ance companies are major investors in London’s market. Table 4 also confirms theimportance of banks as major holders of shares in Tokyo, and industries in the case ofFrankfurt. In Milan, concentration of trading is among a few firms while government-owned companies hold vast amounts of securities, hence the high level of share owner-ship among government agencies. In contrast, Sydney’s market is characterized bysignificant foreign ownership. That the cities’ ownership patterns are so strikingly differ-ent reflects national political economies such as the influence of the state in Italy and Japan,the importance of universal banks in Germany and Switzerland, and the role of stock bro-kerages in the U.S.
ConclusionMany commentators agree that national cities that are also internationally or globally
oriented have a substantial financial sector in their urban economies. Competition betweenworld cities has intensified as financial capital emerges as a key component in the globaleconomy, and as cities jostle for a prominent place in the world’s matrix of economicexchanges and flows.
On the global arena, Tokyo, London, and New York are battling to be the premier centerof global finance. In Europe, deregulation has quickened, with several cities attempting toemulate London’s 1986 Big Bang. Frankfurt, for example, has undertaken significantreforms in a bid to out-compete Paris in continental Europe (Fischer 1997). Innovationsand derivative markets are becoming less and less the monopoly of London, while thedeutschmark is now a key European currency. Meanwhile, Vienna is aiming to be thefinancial center for Central and Eastern European companies (Haddock 1999).
Similarly in Asia, governments have initiated regulatory changes that favor more effi-cient capital markets. Japan’s Big Bang in 1998 proposes to remove limitations on entryinto the securities and banking business, and to liberalize fees and commissions that arecollected by brokers. The government has also revised its foreign exchange law to allowfreer trading of foreign currencies. Meanwhile, Singapore is building a critical mass ofskilled financial workers by wooing investment bankers and fund managers to the city. In

all of the cases, the major objective is to try and stem the flow of activities migrating toother world financial centers (Walter 1998).
This paper has examined the spatial evolution of world cities as centers of capital from1980 to 1998. The analysis indicates that over the period examined, WFCCs are inter-connected via a system of vertical relationships that deepened significantly over time. In1980, only three vertical layers or tiers of cities may be identified. This increased to sevenby 1998. Two major trends describe the increased hierarchical tendencies and differenti-ation among the cities. First, London emerged over Tokyo during this period to share thepremier position with New York. While Tokyo remains a top-league capital center, impactsof the 1998 reforms are yet to be seen. Second, intensified competition and industrialdevelopment among middle to lower tier cities have resulted in greater spatial differenti-ation, with some cities becoming more peripheralized than others.
Capital markets in top tier cities like London, Tokyo, Frankfurt, and New York are alsoless concentrated among a few companies, and trading of stocks is spread over a largernumber of corporations and companies. Tokyo and Frankfurt’s markets tend to be drivenby coalitions in the form of banking and industrial groups, while New York’s market ispredominantly in the hands of individuals and households. A significant proportion ofSydney’s market is foreign-owned, while government and state agencies dominate in the case of Milan. London’s market, on the other hand, reflects the influence of institu-tional investors. The analysis would seem to indicate that cities are exploiting compara-tive advantages that support the trend of increased spatial hierarchical tendencies anddifferentiation.
Two issues, however, remain. First, the financial upheavals of the late 1990s havebrought into question whether the liberal market model of financial activities is tenable inthe long run. Clark (1997) contends that such a model focuses overwhelmingly on increas-ing financial transactions at the expense of governance of financial agents, including thatof trading standards. Cities that recognize and respond to systematic weaknesses underly-ing poor financial practices and governance among financial institutions will likely chal-lenge present patterns of the global hierarchy. Beaverstock and his colleagues (2000)further suggest that as cities develop denser networks of financial relations between them,this requires a de-centered as opposed to a hierarchical conceptualization of financial cities. Second, the paper has focused on the size of capital markets in tracing the spatial evolution of WFCCs. Using this function to define WFCCs, notable cities like Sin-gapore and Hong Kong do not compare favorably with many European cities because oftheir small national economies. Yet the two cities are major and important financial entre-pots in Asia, and host more Multinational Corporations (MNCs) than some higher tierEuropean cities. But as Knox (1995) has pointed out, understanding of the spatial struc-ture of world cities depends on the function used, and according to Sassen (2001), pro-duction of financial services is a central function in these cities. In broadening the scopeof global finance to the exchange markets, this paper has sought to address Reed’s (1981)complaint some twenty years ago that bank activities provide only a partial understandingof how centers of finance and capital operate.
152 GROWTH AND CHANGE, SPRING 2003

NOTES1. Despite widespread use of “world city” to describe a global system of cities, the concept is by no
means unambiguous nor uncontested (Knox 1995; Markusen 1999; Hill and Kim 2000; Yeoh
1999). In this paper, the notion of world cities is useful to the extent that it helps identify the pop-
ulation of world and capital centers. This follows from Sassen’s (2001) argument that no city can
achieve international or global status unless it has a significant financial sector in its regional or
metropolitan economy.
2. In most parts of the world, usually one city dominates in finance and the national capital market.
This is true even for the U.S. where New York presides over more specialized cities like Chicago.
But in rare instances like Canada, both Montreal and Toronto tend to share important primary func-
tions partly because of the development of distinct regional hinterlands. Competition, too, exists
between Sydney and Melbourne. However, Sydney also has a much stronger producer service
sector while the metropolitan economy of Melbourne is relatively oriented to industrial produc-
tion.
3. A common procedure for verifying the appropriateness of variables used here is the discriminant
analysis (see Reed 1981; Hill et al. 1998). Given the relatively small number of observations rel-
ative to the number of variables (five), interpretation of the discriminant function-variable corre-
lations as well as standardized coefficients is unstable and should therefore be done cautiously.
Nevertheless, the results do point to the importance of market capitalization and value of shares
traded as a distinct discrimnant function viz the other three variables.
HIERARCHICAL TENDENCIES OF CAPITAL MARKETS 153
APPENDIX 1. LIST OF CITIES.
AmsterdamAthensBangkokBarcelonaBogotaBrusselsBudapestBuenos AiresCaracasCopenhagenFrankfurtHelsinkiHong KongIstanbulJakarta
JohannesburgKuala LumpurLisbonLondonLuxembourgMadridManilaMexico CityMilanMontrealMumbaiNew YorkOsloParisPrague
Sao PaoloSantiagoSingaporeStockholmSydneyTaipeiTel-AvivTokyoTorontoViennaWarsawWellingtonZurich

REFERENCESAbraham, J.P., N. Bervaes, and A. Guinotte. 1994. The competitiveness of European financial centers.
In The Changing face of European banks and securities markets, edited by J. Revell, 229-76. New
York: St Martin’s Press.
Bank for International Settlements. 1998. 68th Annual Report, Basle Switzerland
(http://www.bis.org/publ/ar98f02.pdf, accessed November 2001).
Beaverstock, J.V. 1996. Subcontracting the account! Professional labor markets, migration and orga-
nizational networks in the global accountancy industry. Environment and Planning A 28: 303-327.
Beaverstock, J.V., R.G. Smith, and P.J. Taylor. 1999. The long arm of the law: London’s law firms
in a globalising world-economy. Environment and Planning A: 1857-1876.
———. 2000. World-city network: A new metageography. Annals of the Association of American
Geographers 90: 123-134.
Bordlein, R., and. M.A. Doel. 2002. Stock exchanges and regional competitiveness: The case of
small German exchanges. Paper Presented at the European Regional Science Conference, Dort-
mund, Germany, 27th-31st August.
Budd, L. 1995. Globalization, territory and strategic alliances in different financial centers. Urban
Studies 32: 345-351.
Choi, S.R., A.E. Tschoegl, and C.M. Yu. 1986. Banks and the world’s major financial centers, 1970-
1980. Weltwirtschaftliches Archiv 122: 48-63.
Clark, D. 1996. Urban world/global city. New York: Routledge.
Clark, G. 1997. Rogues and regulation in global finance: Maxwell, Leeson and the city of London.
Regional Studies 31: 221-236.
Clementi, D. 2001. The city and the Euro: Innovation and excellence. Speech by Mr. David Clementi,
Deputy Governor of the Bank of England at the City Seminar on “London into the 21st Century,”
Tokyo, 13 February.
Corwin, S.A., and J.H. Harris. 2001. The initial listing decisions of firms that go public. Financial
Management 30: 35-55.
Davis, E.P. 1990. International financial centers: An industrial analysis. Bank of England Discus-
sion Paper No. 51, 1-23 September. England.
Eng. M.V., F.A. Lees, and L.J. Mauer. 1995. Global Finance. New York: Harper Collins College.
Everitt, B.S. 1993. Cluster analysis. London: Edward Arnold.
Fisher, A. 1997. Sights are set on overtaking Paris (German capital markets after European mone-
tary union). The Financial Times, 9th June.
Friedmann, J. 1986. The world city hypothesis. Development and Change 17: 69-83.
Gehrig, T. 1998. Cities and the geography of financial centers. Center for Economic Policy Research,
Discussion Paper No. 1894. Washington, DC.
Goldberg, M.A., R. Helsley, and M. Levi. 1988. The prerequisites for an international financial center.
In International banking and financial centers, edited by Y.S. Park and M. Essayyad. Boston:
Kluwer.
Gultekin, M.N., N.B. Gultekin, and A. Penati. 1989. Capital controls and international capital market
segmentation: Evidence from the Japanese and American stock markets. Journal of Finance XLIV:
849-869.
Haddock, F. 1999. Vienna jostles to join the big boys. Global Finance 13: 54-55.
154 GROWTH AND CHANGE, SPRING 2003

Hill, E.W., J.R. Brennan, and H.L. Wolman. 1998. What is a central city in the United States? Apply-
ing a statistical technique for developing taxonomies. Urban Studies 35: 1935-1970.
Hill, R.C., and J.W. Kim. 2000. Global cities and developmental states: New York, Tokyo and Seoul.
Urban Studies 37: 2167-2195.
Kindleberger, C.P. 1974. The formation of financial centers: A study in comparative economic history.
Princeton studies in international finance no. 36, Princeton: International Finance Section.
King, A.D. 1989. Global cities: Post-imperialism and the internationalization of London. London:
Routledge.
Knox, P. 1995. World cities in a world-system. In World cities in a world system, edited by P. Knox
and P.J. Taylor, 3-20. Cambridge: Cambridge University Press.
Latter, T. 2001. Just another financial center—or is Hong Kong special? Address by Mr. Tony Latter,
Deputy Chief Executive of the Hong Kong Monetary Authority, at the Foreign Correspondents
Club, Hong Kong, 25th April 2001.
Lee, H.L. 2001. Financial centers today and tomorrow: A Singapore perspective. Address by Mr.
Lee Hsien Loong, Deputy Prime Minister of Singapore and Chairman of the Monetary Authority
of Singapore, International Monetary Conference, Singapore, 4th June 2001.
Lincoln, E.J. 1998. Japan’s financial problems. Brookings Papers on Economic Activity 1998: 347-
375.
Lloyd, T. 1991. Two tilt at London’s crown: Frankfurt and Paris are challenging London’s position
as the European capital of capital. International Management 46: 46-49.
Longcore, T.R., and P.W. Rees. 1996. Information technology and downtown restructuring: The case
of New York City’s financial district. Urban Geography 17: 354-372.
Markusen, A., and V. Gwiada. 1994. Multipolarity and the layering of functions in world cities: New
York City’s struggle to stay on top. International Journal of Urban and Regional Research 18:
167-190.
Markusen, A. 1999. Fuzzy concepts, scanty evidence. Policy distance: The case for rigor and policy
relevance in critical regional studies. Regional Studies 33: 869-884.
McGahey, R., M. Malloy, K. Kazanas, and M.P. Jacobs. 1990. Financial services, financial centers:
Public policy and the competition for markets, firms and jobs. Boulder CO: Westview Press.
Meyer, R. 1991. The formation of a global financial center: London and its intermediaries. Cities
in the world system, edited by R. Kasaba, 97-106. Westport, CT: Greenwood Press.
O’hUallachain, B. 1994. Foreign banking in the American urban system of financial organization.
Economic Geography 70: 206-228.
Pryke, M., and R. Lee. 1995. Place your bets: Towards an understanding of globalization, socio-
financial engineering and competition within a financial center. Urban Studies 32: 329-344.
Reed, H.C. 1981. The preeminence of international financial centers. London: Praeger.
Rybczynski, T. 1994. The development of European capital markets: The main trends and their
implications. In The changing face of European banks and securities market, edited by J. Revell.
New York: St. Martin’s Press.
Sarle, W.S. 1983. SAS Technical Report A-108, Cubic Clustering Criterion. Cary NC: SAS Insti-
tute Inc.
Sassen, S. 2001. The global city. Princeton: Princeton University Press (second edition).
———. 1999. Global financial centers. Foreign Affairs 78: 75-86.
HIERARCHICAL TENDENCIES OF CAPITAL MARKETS 155

Short, J.R. Y. Kim, M. Kuus, and H. Wells. 1996. The dirty little secret of world cities research: Data
problems in comparative analysis. International Journal of Urban and Regional Research 20:
697-717.
Simon, D. 1995. The world city hypothesis: Reflections from the periphery. World cities in a world
system, edited by P. Knox and P.J. Taylor, pp. 132-155. Cambridge: Cambridge University Press.
Smith, D.A., and M. Timberlake. 1995. Cities in global matrices: Towards mapping the world-
system’s city system. World cities in a world system, edited by P. Knox and P.J. Taylor, pp. 79-
97. Cambridge: Cambridge University Press.
Stimson, R., S. Baum, P. Mullins, and K. O’Connor. 2001. A typology of community opportunity
and vulnerability in metropolitan Australia. Papers in Regional Science 80: 45-66.
Taylor, P.J. 1997. Hierarchical tendencies amongst world cities: A global research proposal. Cities
4: 323-332.
———. 1999. So-called “world-cities”: The evidential structure within a literature. Environment
and Planning A 30: 1901-1904.
Taylor, P.J., and D.R.F. Walker. 2001. World cities: A first multivariate analysis of their service com-
plexes. Urban Studies 38: 23-47.
The Economist. 1992. Rise and fall: Survey of financial centers. 323: S3-S6.
Walter, I. 1998. Globalization of markets and financial center competition. New York University
Salomon Center Working Paper No. S-98-2., Stern School of Business, New York University.
Warf, B. 2000. New York: The Big Apple in the 1990s. Geoforum 31: 487-499.
World Stock Exchange fact book. 2000. Meridian Securities, Round Rock, TX.
World development indicators. 2001. Washington, DC: World Bank.
Yeoh, B. 1999. Global/globalizing cities. Progress in Human Geography 23: 607-616.
156 GROWTH AND CHANGE, SPRING 2003
Copyright © 2022 FDOKUMEN