HFT and risk management final version R Fernandez FEBELFIN march2013
65
1 Rue d'Arlon 80 / Aarlenstraat 80 B 1040 Brussels Professional Certificate in Risk Management “High Frequency Trading and the risk monitoring of automated trading.” Robert Fernandez Ferrandiz Prudential Supervision Analyst (NBB) & Assistant (Solvay) [email protected] [email protected] Brussels, March 2013 Agenda Executive Summary.................................................................................................... p2 Introduction.....................................................................................................................p4 Chapter I The key challenges to monitor risk in automated trading............................p5 Chapter II Case study of NYSE Euronext HFT & Chicago Stock Exchange patent....p18 Conclusion ....................................................................................................................p35 Bibliography..................................................................................................................p36 Appendix..................................................................................................................p37-65. o Appendix I Algorithm trading and HFT definition o Appendix II Patent research in USPTO o Appendix III Chicago Board Options Exchange patent to define how organize the IT architecture of the risk monitoring of automated trading. o Appendix IV Research questions on HFT and Algorithm trading. o Appendix V Lessons learned from the Flash Crash o Appendix VI CFTC Audit Trail o Appendix VII CFTC Electronic trading analysis o Appendix VIII The Global Financial Network o Appendix IX NYSE Technologies - Market Access Gateway Inventory (January 2013) Key words : Financial innovation, Systemic risk, IT monitoring, High Frequency Trading, Financial stability.
-
Upload
solvaybrussels -
Category
Documents
-
view
3 -
download
0
Transcript of HFT and risk management final version R Fernandez FEBELFIN march2013

1
Rue d'Arlon 80 / Aarlenstraat 80
B 1040 Brussels
Professional Certificate in Risk Management
“High Frequency Trading and the
risk monitoring of automated trading.”
Robert Fernandez Ferrandiz Prudential Supervision Analyst (NBB) & Assistant (Solvay)
[email protected] [email protected]
Brussels, March 2013
Agenda
Executive Summary.................................................................................................... p2
Introduction.....................................................................................................................p4
Chapter I The key challenges to monitor risk in automated trading............................p5
Chapter II Case study of NYSE Euronext HFT & Chicago Stock Exchange patent....p18
Conclusion ....................................................................................................................p35
Bibliography..................................................................................................................p36
Appendix..................................................................................................................p37-65. o Appendix I Algorithm trading and HFT definition o Appendix II Patent research in USPTO o Appendix III Chicago Board Options Exchange patent to define how organize the IT
architecture of the risk monitoring of automated trading. o Appendix IV Research questions on HFT and Algorithm trading. o Appendix V Lessons learned from the Flash Crash o Appendix VI CFTC Audit Trail o Appendix VII CFTC Electronic trading analysis o Appendix VIII The Global Financial Network o Appendix IX NYSE Technologies - Market Access Gateway Inventory (January 2013)
Key words: Financial innovation, Systemic risk, IT monitoring, High Frequency Trading, Financial stability.

2
Executive Summary Automated and algorithm trading are nowadays important drivers in financial markets. High Frequency trading (as a subdivision of automated trading) is also an important driver in US and EU automated trading platforms. This new paradigm involves important questions on risks, monitoring and regulation. The High Frequency Trading evolution underlines three keys questions:
How High Frequency traders could improve risk management tools to manage operational risks (algorithm issues) and market risks (price manipulation, liquidity and volatility)?
How stocks markets (and brokers-dealers) could improve and contribute to prevent individual failure but also systemic risks (including interdependencies and correlations from HFT algorithms)?
How supervisory authorities could / should regulate high frequency technology in financial markets in a risk monitoring perspective?
Based on case study and regulatory guidelines, this paper analyses key specifications on the automated trading risk monitoring tools. In an automated trading environment, a certain amount of control is lost when a market-maker has issued quotes in a large number of option series. The quotes are typically recorded in the automated and computer-based trading system, and matched up automatically with orders that enter the system electronically. IOSCO has clearly identified the risk of "black box" regarding the evolution of automated trading and ultra-speed trading. Regulators (as ESMA and CFTC) call for monitoring tools implemented not only by High Frequency Traders but also by stock exchanges and all professional traders. ESMA asks that trading platforms should monitor in real time their electronic trading systems (a real time audit trail). Additionally, ESMA asks that investment firms should prior to deploying an electronic trading system (or a trading algorithm) and prior to deploying updates, make use of clearly delineated development and testing methodologies. For algorithms, these might include performance simulations/back testing or off line testing within a trading platform testing environment (where market operators make testing available). CFTC encourages development of more industry-wide testing procedures (to test algorithms in “real life” conditions), including scenario and stress testing. Based on the NYSE Technologies platform case study, we can observe that audit trail from NYSE automated platforms is limited to the timeframe of hundredth of a second (1/100sec). In the same time, NYSE platforms provide total end-to-end latency (including inter-process and inter-server communications) of approximately 70 microseconds (1/1000.000 sec). This case study illustrates the current gap existing between the capacity of trading and the real capacity of monitoring HFT. This gap is creating a "shadow trading" where supervisors would not have the possibility to analyze what is really happening. Volume is also increasing with HFT. In Europe, before MiFID went live back in 2007, It was observed rates of 5,000 to 10,000 messages per second. Nowadays, the automated trading platform Chi-X alone can peak at over 80,000 messages per second. In the US the rates have already exploded, with total equity, options and futures markets topping 4 million messages per second. Additionally to the end-to-end latency issue, HFT increases the volume "message queue" creating a new challenge in the implementation of automated risk trading monitoring. The case study of the Chicago Board Options Exchange patent provides some useful ideas. This patent is dedicated to an automated risk monitoring IT architecture (including automated revision or cancellation of quotes based on risk thresholds).
Additionally to individual risk (For example, the crash of Knight Capital Group in August 2011), Algorithm trading (with direct access to the market and with a high frequency trading

3
timeframe) could also involve systemic risk due to correlation between algorithms. CFTC underlines the importance of testing. For CFTC, It is possible that code rollouts related to small changes in market structure (e.g. new order types) involve important risks due to the fact that many market participants affected simultaneously the condition of the market and that these new trading algorithms were potentially never employed before.
The conclusion of this paper is to support the idea that the new worldwide trading architecture should be articulated around Stock exchanges as regulated Hub. There are worldwide around 50 major stock exchanges. Stock exchange could be responsible to organize "Quality Acceptance" test environment to challenge algorithms in an individual perspective but also in a systemic approach (linked to potential correlation of algorithms).

4
Introduction: The declining costs of technology have led to its widespread adoption throughout financial industries. The resulting technological change has revolutionized financial markets and the way financial assets are traded. Many institutions now trade via algorithms and High Frequency Trading (more than 70% of Equity volume US markets, around 30/40% for European markets). Automated and algorithm trading are nowadays important drivers in financial markets. High Frequency trading (as a subdivision of automated trading) is also nowadays a driver in US and EU automated trading platforms. Based on lessons learned from the Flash Crash of May 2010 and the state of art on algorithmic trading and High Frequency Trading (see appendix), this paper provides an analysis to understand how to improve risk monitoring of automated trading. HFT is subject of many interrogations on net social benefice in the point of view of market efficiency (liquidity, volatility & pricing) but also potential risks for regulators (manipulation & systemic risk) but also for traders. The rise of HFT is a result of two important changes that have increased the ability and desirability of trading fast and frequently. First, the decimalization of quotes, the change from having bid and offer prices being quoted in eighths to having them quoted in pennies, has allowed for more minutes price variation. The smaller price increments makes trading during short horizons less risky as a tick in the wrong direction now can cause a penny per-stock loss whereas previously it would cost an eight of a dollar. Second, there have been technological advances in the ability to quickly analyze information and to rapidly transport data between locations. This evolution has involved the migration from floor-based to electronic (point-and-click) to high speed trading (or high frequency trading). This change also has involved the possibility to have direct access to the markets for a growing number of operators in a multitude of decentralized automatic trading platforms. In the present paper, we will run through key specifications from scholar to supervisory bodies regarding algorithm and High Frequency Trading and the creation of a “shadow trading” area. This paper is articulates on supervisory guidelines and case studies. Firstly, I examine the keys specifications from ESMA and CFTC. Secondly, as hub in the financial market, I challenge stock market regarding this issue. I examine the NYSE Euronext as case study and I present the Chicago Stock Exchange Board patent as illustration of IT architecture on risk monitoring of automated trading. The purpose of this paper is not to provide, as the majority of scholar paper, an exhaustive summary of the current debate on algorithm and HFT trading. The added value of this analysis is to present key ideas on the monitoring of automated trading. The main limit of this paper is due to the absence of possibility to challenge the analyzed specifications with experts from Stock market, dealing room and brokers. The second important limit of this research is the absence of additional analysis regarding the challenge to register and to audit algorithms used in HFT. The main innovative part of this study, regarding previous paper on the topic of HFT, comes from the presentation of a patent specification. This patent, from the Chicago Stock Exchange, deals with technical specifications of risk monitoring implemented in automated trading platforms. I hope that the singularity of this approach will provide a personal added-value on HFT risk management debate.
US stock exchange automated trading timeline
1980s – First electronic trading systems appeared.
1992 – The Chicago Mercantile Exchange (CME) launched
its first electronic platform, Globex.
1993 – Systematic/electronic trading was enabled for CME
equity futures.
2000 – New York-based International Securities Exchange
(ISE), the first fully electronic U.S. options exchange, was
launched.
2003 – NYSE introduced automated quote dissemination.
2010 – All seven U.S. exchanges offered either fully
electronic or a hybrid mix of floor and electronic trading in
options.
5
Submultiples on 1 Second
Value Symbol Name
10−1
s ds decisecond
10−2
s cs centisecond
10−3
s ms millisecond
10−6
s µs microsecond
10−9
s ns nanosecond
10−12
s ps picosecond
10−15
s fs femtosecond
10−18
s as attosecond
10−21
s zs zeptosecond
10−24
s ys yoctosecond
HFT
timeframe
Monitoring
and supervisory
timeframe
Chapter I : Guidelines to monitor automated trading. Introduction - High Frequency Trading Definitions and functionalities The first question that we need to go through is about the definition of High Frequency trading. High-frequency trading (HFT) describes the execution of electronic trading strategies involving extremely rapid capital turnover. Brogaard & co (2010) defines HFT as a type of investment strategy whereby stocks are rapidly bought and sold by a computer algorithm and held for a very short period, usually seconds or milliseconds. For Menkveld (2011), HFT can be characterized as a modern market maker with a latency (inter-message time) upper bound of 1.67 millisecond and engaged in proprietary trading starting and ending most trading days with a zero net position. Peter Gomber (2011) provides a study on HFT and algorithm trading definition (academic and regulatory point of view) and functional analysis. He presents algorithmic trading as the use of computer algorithms to execute human generated, pre-designated trading decisions and designed specifically to minimize price impact. So in algorithmic trading (AT), computers directly interface with trading platforms, placing orders without immediate human intervention. The computers observe market data and possibly other information, and, based on a built-in algorithm, send back trading instructions (Chaboud A., 2009). These trading instructions are often based on parameters like price, volume, instrument, news and timing. In the same way, European Commission (MiFId) defines algorithm trading as the use of computer programs to enter trading orders where the computer algorithm decides on aspects of execution of the order such as the timing, quantity and price of the order. High Frequency Trading is defined, by Jovanovic Boyan and Menkveld Albert (2010), as electronic limit order markets enable agents to automate trading decisions. Computer algorithms are used to either minimize transaction cost when trading into position (working an order through time and across markets or to simply profit from buying and selling securities as a middleman). HFT typically refers to trading activity that employs extremely fast automated programs for generating, routing, canceling, and executing orders in electronic markets. HF traders submit and cancel a massive number of orders and execute a large number of trades, trade in and out of positions very quickly, and finish each trading day without a significant open position. High Frequency trading appears as a sub category of algorithm trading based on the new paradigm provided by ultra-high execution speed. In October 2012, The Financial Times has published a paper on HFT with an explicit title: "Faster than a nanosecond" (FT, 3th Oct. 2012 - http://video.ft.com/v/1861499789001/Faster-than-a-nanosecond). For the European commission, HFT definition is similar to “automated trading” as trading in financial instruments at speeds where the physical latency of the mechanism for transmitting, cancelling or modifying orders becomes the determining factor in the time taken to communicate the instruction to a trading venue or to execute a transaction.

6
Gomber (2011) classifies the functionalities of algorithmic trading and High Frequency Trading as follow: According Gomber (P. Gomber, 2011), the key related concepts to HFT are the Market making characteristic, the Quantitative Portfolio Management (QPM) tools, and the Smart Order Routing (SOR) technology. Peter Gomber (2011) provides the following picture who summarizes also the specifications between Algorithm trading and HFT.
Common for HFT and AT
1) Pre-designed trading decisions 2) Used by professional traders
3) Observing market data in real-time 4) Automated order submission
5) Automated order management 6) Without human intervention 7) Use of direct market access
Specific for AT excl. HFT 1) Agent trading 2) Minimize market impact (for large orders) 3) Goal is to achieve a particular benchmark 4) Holding periods possibly days/weeks/months 5) Working an order through time and across markets
Specific for HFT 1) Very high number of orders 2) Rapid order cancellation 3) Proprietary trading 4) Profit from buying and selling (as middleman) 5) No significant position at end of day (flat position) 6) Very short holding periods 7) Extracting very low margins per trade 8) Low latency requirement 9) Use of co-location/proximity services and individual data feeds 10) Focus on high liquid instruments

7
The US Commodity Futures Trading Commission provides also an useful definition (October 2012). According this definition, High frequency trading is a form of automated trading that employs:
o algorithms for decision making, order initiation, generation, routing, or execution, for each individual transaction without human direction;
o low-latency technology that is designed to minimize response times, including proximity and co-location services;
o high speed connections to markets for order entry; and
o recurring high message rates (orders, quotes or cancellations) determined using one or
more objective forms of measurement, including:
cancel-to-fill ratios; participant-to-market message ratios; or participant-to-market trade volume ratios.
(source: http://www.cftc.gov/ucm/groups/public/@newsroom/documents/file/tac103012_wg1.pdf)
The ESMA 2012 Guidelines for automated trading platforms. In May 2012, the European Security and Markets Authority (ESMA) has published his “Guidelines - Systems and controls in an automated trading environment for trading platforms, investment firms and competent authorities”. For ESMA guidelines, trading platforms should, within their overall governance and decision-making framework, develop, procure (including outsourcing) and monitor their electronic trading systems through a clear and formalized governance process. On regulated markets and multilateral trading facilities, electronic trading systems should also for the ESMA have sufficient capacity to accommodate reasonably foreseeable volumes of messaging. They must be able to increase capacity in order to respond to rising message flow and emergency conditions that might threaten their proper operations. Regarding risks issues involved by the development of HFT, ESMA asks that trading platforms should monitor in real time their electronic trading systems. They should deal adequately with problems identified as soon as reasonably possible in order of priority and be able when necessary to adjust, wind down, or shut down the electronic trading system. Regarding their testing obligations, investment firms should prior to deploying an electronic trading system or a trading algorithm (and prior to deploying updates), make use of clearly delineated development and testing methodologies. For algorithms, these might include performance simulations/back testing or off line testing within a trading platform testing environment (where market operators make testing available). To ensure that there is orderly trading on the platform, trading platforms should have minimum requirements for members’/participants’ and users’ pre- and post-trade controls on their trading activities (including controls to ensure that there is no unauthorized access to trading systems). In particular, trading automated platforms should implement controls on filtering order price and quantity (this requirement is without prejudice to the responsibility of members/participants or users to implement their own pre and post-trade controls). ESMA guidelines also impose that trading platforms should have arrangements to prevent the excessive flooding of the order book at any one moment in time, notably through limits per participant on order entry capacity.
8
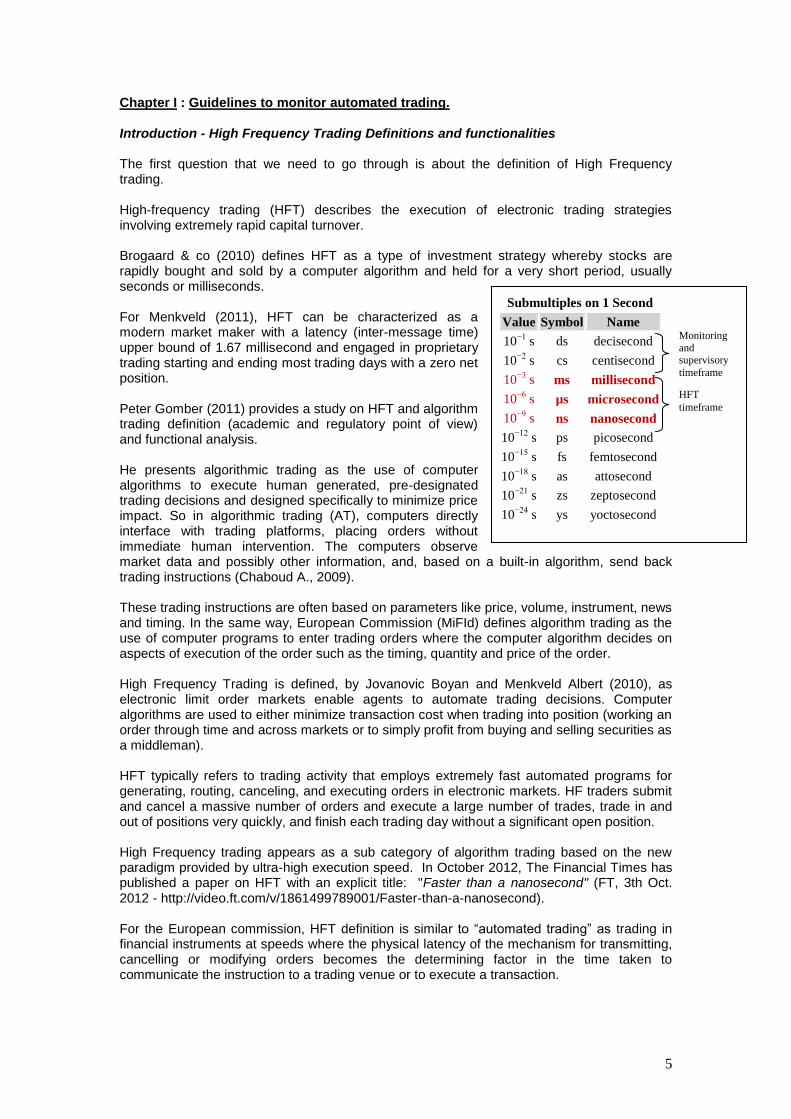
Trading platforms should also have arrangements (for example, volatility interruptions or automatic rejection of orders which are outside of certain set volume and price thresholds) to constrain trading or to halt trading in individual or multiple financial instruments when necessary, to maintain an orderly market. Moreover, investment firms should, during the hours they are sending orders to trading platforms, monitor their orders in as close to real time as possible, including from a cross-market perspective, for potential signs of disorderly trading. Regarding MiFID and MAD implementing Directive 2004/72/EC for regulated markets and for multilateral trading facilities, ESMA guidelines includes that trading platforms should have effective arrangements and procedures which enable them to identify market abuse (in particular market manipulation) in an automated trading environment. Potential cases of market manipulation that could be of particular concern in an automated trading environment include:
Potential cases of market manipulation Details
Ping orders Entering small orders in order to ascertain the level of hidden orders and particularly used to assess what is resting on a dark platform.
Quote stuffing Entering large numbers of orders and/or cancellations/updates to orders so as to create uncertainty for other participants, slowing down their process and to camouflage their own strategy.
Momentum ignition Entry of orders or a series of orders intended to start or exacerbate a trend, and to encourage other participants to accelerate or extend the trend in order to create an opportunity to unwind/open a position at a favorable price.
Layering and Spoofing Submitting multiple orders often away from the touch on one side of the order book with the intention of executing a trade on the other side of the order book. Once that trade has taken place, the manipulative orders will be removed.

9
New European legislative initiative: MiFID II proposal Under the new MiFID II proposal, European regulators are focusing greater scrutiny on high-speed trading. MiFID already covered Multilateral Trading Facilities and regulated markets, but the revision will now bring a new type of trading venue into its regulatory framework: the Organized Trading Facility (OTF). These are organized platforms which are currently not regulated but are playing an increasingly important role. MiFID will introduce new safeguards for algorithmic and high frequency trading activities which have drastically increased the speed of trading and pose possible systemic risks. These safeguards include the requirement for all algorithmic traders to become properly regulated, provide appropriate liquidity and rules to prevent them from adding to volatility by moving in and out of markets. Finally, the proposals will improve conditions for competition in essential post-trade services such as clearing, which may otherwise frustrate competition between trading venues. The proposals will reinforce the role and powers of regulators. In coordination with the European Securities and Markets Authority (ESMA) and under defined circumstances, supervisors will be able to ban specific products, services or practices in case of threats to investor protection, financial stability or the orderly functioning of markets.
Unsatisfied with delays to MiFID II, a draft legislation in Germany is set to curb high-frequency trading (HFT), bringing it under the control of Germany’s Federal Financial Supervisory Authority (BaFin) probably by the end of 2013. Under a new law known as the “Act for the prevention of risks and the abuse of high-frequency trading”, the definition of proprietary trading would be widened to include HFT firms, forcing them to be licensed, and compelling trading venues to enforce minimum tick sizes and order-to-trade ratios.
The draft of MiFID II contained a provision requiring all those operating automated trading strategies to be continuous market-makers whatever the market conditions. This proposed requirement will only apply (if adopted) to those operating a "high frequency strategy" and which has at least one of the four of the following characteristics:
it uses co-location facilities; it relates to a daily portfolio turnover of at least 50%; the ratio of orders to trades exceeds 4:1; the proportion of orders cancelled exceeds 20%; the majority of positions taken are unwound within the same day; over 50% of the orders are made on trading venues offering discounts or
rebates to orders which provide liquidity.
In this new European regulation, it is proposed that ESMA shall be tasked with developing regulatory technical standards for general position limits. It is also proposed that a minimum resting period for all orders is imposed at 500 milliseconds. European Parliament’s financial committee decided in September 2012 to rein in the velocity of high-frequency trading (a half-second speed limit on those using computers to execute lightning-fast stock deals).
An important remark is to understand that not only speed but also volume traded is growing very fast. Hirander Misra, co-founder and chief executive of Algorithm Technologies, notes that, collectively across all the major equity exchanges in Europe, It was observed rates of 5,000 to 10,000 messages per second before MiFID went live back in 2007. Nowadays, the automated trading platform Chi-X alone can peak at over 80,000 messages per second and it's anounced total market peaks approaching 150,000. In the US the rates have, of course, already exploded, with total equity, options and futures markets topping 4 million messages per second according to marketdatapeaks.com. (Source: http://www.automatedtrader.net/online-exclusive/80415/market-data-maelstrom).

10
US Commodity Futures Trading Commission (CFTC)
In October 2012, the US Commodity Futures Trading Commission (CFTC) has adopted the following HFT Draft Definition: => High frequency trading is a form of automated trading that employs:
algorithms for decision making, order initiation, generation, routing, or execution, for each individual transaction without human direction;
low-latency technology that is designed to minimize response times, including proximity and co-location services;
high speed connections to markets for order entry; and
recurring high message rates (orders, quotes or cancellations) determined using one or more objective forms of measurement, including:
o cancel-to-fill ratios; o participant-to-market message ratios; or o participant-to-market trade volume ratios.
=> High frequency trading is a mechanism utilized by a variety of trading strategies [including - but not limited to - liquidity provision and statistical arbitrage]. For CFTC, the objective forms of measurement are determined by a regulator for specific financial instruments or classes of instruments and provide a benchmark for comparing activity that is higher than normal. Such benchmarks should be published on a periodic basis and applied for a specified time period following publication. These measurements should be applied to the participant responsible for the recurring high message rates. The forms of measurement chosen are intended to allow a regulator to measure activity without direct access to the trading algorithms employed to generate the high message rates. CFTC October 2012 definition of HFT can be illustrated by the following flow Chart and Automated Trading process:

11
(CFTC source)
CFTC also has defined the key specifications of an audit trail regarding automated trading (see appendix). Pre-trade risk controls are now required in US equity markets. Equity markets require (limited) risk checks for all participants. Brokers are allowed to self-check. For CFTC, Exchange should expand the pre-trade risk checks available on their systems. CFTC also estimated that Exchange based risk checks should be applied equally to all participants including ensuring that they are applied with equal latency for all participants. Additionally, CFTC underlines the fact that all participants need risk controls, and not just firms specializing in automated trading. Substantial trading errors generated in electronic systems can happen in trading systems used by brokers and end investors. Coding, data, and procedural errors may be more dependent on the trading technology than on the purpose of the trading strategy. Also CFTC underlines the key role used by post-trade risk controls. Post-trade risk controls in the form of drop copies of orders to third parties or brokers can enable useful near real-time risk calculations that cannot be done with ultra-low latency pre-trade risk controls. Post-trade risk controls must:
Provide an alternative pathway for trade positioning;
Enable further data gathering for post-event analysis. CFTC also underlines the importance of testing. For CFTC, It is possible that code rollouts related to small changes in market structure (e.g. new order types) are particularly risky:
Many market participants could affected simultaneously market parameters;
New trading mechanics are potentially never employed before.
On testing topic, CFTC encourages development of more industry-wide testing procedures (to test algorithms in “real life” conditions), including scenario and stress testing. But in the same time, CFTC says to be not optimistic that regulatory certification of algorithms or testing methods can be practical or effective.
In the field of HFT registration, CFTC suggests to make the following distinctions:
Distinctions in degree of automation, latency, messaging and volume;
Distinctions across products, contract months, and range of strategies;

12
Distinctions in time horizon over which messaging/volume is measured.
In this approach, HFT participants can be identified and differentiated as desired to serve surveillance objectives using current data:
Distinguish ATS (Automated Trading System) from non-ATS activity;
Distinguish users’ type of connectivity;
Identify high messaging/volume participants at many levels (e.g. firm, account,…) for any instrument over any time period.
To the question to know if each algorithm should be registered, CFTC underlines the following limits:
Algorithms, inputs and parameters change frequently;
Difficult to consistently define what constitutes a unique algorithm;
No empirical basis to support need for strategy registration.
To the question to know if algorithms should be audited, CFTC underlines the following limits:
Enormous numbers of algorithms deployed;
Inefficient use of limited regulatory resources even assuming expertise were available in regulatory bodies to assess each algorithm;
Foresight economic impact study estimated cost of $1.3 billion/year in US if full descriptions of algorithmic trading strategies were collected and analyzed by regulators;
Entity employing the algorithm should be responsible for appropriate evaluation and testing.
The position of CFTC is to support robust and effective controls and supervision; established at all levels of the infrastructure (to mitigate any single point of failure) and not limited to post-deployment operation. CFTC considers that this controls and supervision should also be considered during every deployment phases. In this approach, it is important to conduct appropriate testing (internal & external conformance) in the following dimensions:
Administrative (user, product and market setup);
Quantitative (back testing algorithm changes against historic trade data);
Technical (connection logic, disconnect/reconnect management);
Functional (order entry, trade & market data processing, market support);
Error (trade bust/adjust management);
Alerting (exchange message & internal alerting notification and display);
Regulatory (clearing and regulatory tag validation);
Stress (load, capacity, performance under unusual market conditions);
Pre-trade risk management (order validation, position management,..). As other IT development, supervision need to implement a clear control framework on:
acceptance, installation and deployment/validation of ATS and HFT; and
Maintenance and monitoring (including an Audit trail tool for Supervision purpose).

13
CFTC Control Recommendation Summary
The audit trail data should be collected, for CFTC, in a way that enables meaningful aggregation, reconstruction, and analysis. The audit trail is also a critical tool to enhancing regulators’ ability to reconstruct and properly sequence activities include:
uniform market participant identifiers,
consistent approaches to the type of data to be collected,
and the use of accurate time-stamp mechanisms. CFTC Audit Trail Data Model (Oct.2012)

14
Examples of derived data (CFTC)
The CFTC Rule 536.B. fixes the “Recordkeeping Requirements" for US Stock exchanges as Chicago Mercantile Exchange Inc. (“CME”), The Board of Trade of the City of Chicago, Inc. (“CBOT”), The New York Mercantile Exchange, Inc. (“NYMEX”) and Commodity Exchange, Inc. (“COMEX”). To illustrate key specification, we have analyzed a regulation certification regarding Chicago Mercantile Exchange (CME Globex). (source:http://www.cftc.gov/stellent/groups/public/@rulesandproducts/documents/ifdocs/rul091912cmecbotnymexandcomex1.pdf) The regulatory requirement asks that orders entered into CME Globex must contain an accurate identification of whether the order is entered via automated or manual means (since June 2011). Inaccurate submission of this regulatory requirement may result in disciplinary action. Core principles of this regulatory requirement are also identified as follows:
An accurate audit trail must be able to identify trading activity that may be disruptive;
Clearing member firms will be required to maintain the front-end audit trail which will include trade information;
The Exchanges (as CME Globex) are formally adopting this regulatory requirements in order to ensure that each Exchange has accurate information concerning whether orders entered are done by automated or manual means.
So entering orders (into CME Globex) shall input for each order:
the user ID assigned him by the Exchange;
a clearing member or other authorized entity;
the price, quantity, product, expiration month, CTI code (Customer Type Indicator);
automated or manual indicator;
and account number;
and, for options, put or call and strike price. The order must be entered (into CME Globex) when it becomes executable. The electronic audit trail must be maintained for a minimum of 5 years and clearing members must have the ability to produce this data in a standard format.

15
For executed orders, the audit trail must record the execution time of the trade along with all fill information. So a record of all fields relating to order entry must be produced (including transaction date, product, Exchange code, expiration month, quantity, order type, order qualifier, price, buy/sell indicator, stop/trigger price, order number, unique transaction number, account number, session ID, automated or manual indicator, host order number, trader order number, clearing member, type of action, action status code, customer type indicator, origin, and timestamps). This electronic audit trail must contain all order receipt, order entry, order modification, and response receipt times to the highest level of precision achievable by the operating system, but at least to the hundredth of a second (1/100sec). The times captured must not be able to be modified by the person entering the order. According CFTC publications (see appendix), the HFT timeline is around 3.6 milliseconds in 2012 on average.
High Frequency Traders website (http://highfrequencytraders.com/news/2309/traders-look-wireless-lowest-latency) estimates that latency, due to wireless technology, could reach 13.3 milliseconds between the markets of Chicago and New York. Hibernia Atlantic (www.hiberniaatlantic.com/gfn.html - see appendix) provides the following worldwide vision of low latency:
24,000 Kilometers of Fiber Optic Cable
Access to over 120 key financial cities around the globe
Connection between London and New York City, with <60 ms latency, the fastest in transatlantic cable history
These examples underline the key challenge to monitor risk management in the high speed automated trading. Audit trail is expected to record and track orders in a timeline of 1/100 sec when transatlantique latency (London/NY) is less of 60/1000sec and with a HFT technology running to the nanosecond according the Financial Times. In this context, the question for regulators is to define how it would be possible to implement an audit trail monitoring HFT and covering the “shadow automated trading" due to ultra-fast trading (from the millisecond to the nanosecond). In October 2011, IOSCO issued its report on "Regulatory Issues Raised by the Impact of Technological Changes on Market Integrity and Efficiency". This report explicitly addresses the need for regulators to continuously evaluate the regulatory challenges related to new and evolving trading strategies. In this report, IOSCO issued the following recommendations:

16
Recommendation 4: “Regulators should continue to assess the impact on market integrity and efficiency of technological developments and market structure changes, including algorithmic and high frequency trading. Based on this, regulators should seek to ensure that suitable measures are taken to mitigate any related risks to market integrity and efficiency, including any risks to price formation or to the resiliency and stability of markets, to which such developments give rise” (source: http://www.iosco.org/library/pubdocs/pdf/IOSCOPD407.pdf) In his report "Regulatory Issues Raised by the Impact of Technological Changes on Market Integrity and Efficiency", IOSCO underlines also that HFT and algorithmic trading have arguably played a significant role in the developments of the new trading environment. IOSCO supports also the need for changes to the way competent authorities monitor trading. (source: http://www.iosco.org/library/pubdocs/pdf/IOSCOPD354.pdf) Regarding market access for automated trading, IOSCO has clearly identified the risk of "black box" due to algorithm and HFT trading: "Facilitating algorithmic trading through automated systems, which raises issues of capacity and the potential need for rationing bandwidth. Indeed, some “black box” trading systems are capable of transmitting several thousand order messages to a market in less than a second". (source: http://www.iosco.org/library/pubdocs/pdf/IOSCOPD284.pdf)

17
Few Comments... Many trading systems utilize what is known as an open outcry method of trading. In the open outcry system, market-makers are required to make a two-sided market by providing a bid and offer quote in all option series. The market-makers typically communicate verbally or visually with contra traders indicating their willingness to buy and sell various quantities of securities. Because the market-makers have personal control over the types and number of contracts traded, they can adjust their trading strategies as their positions change. In this way, the market-makers can manage their exposure, or risk, associated with their holdings by adjusting their quotes to favor trades that would tend to hedge away unwanted exposure. In an automated trading environment, a certain amount of control is lost when a market-maker has issued quotes in a large number of option series. The quotes are typically recorded in the automated and computer-based trading system, and matched up automatically with orders that enter the system electronically. With the proliferation of computer trading systems and increased communication speeds, the rate at which trades may be executed by an automated system far surpass the rate of trades that occur in an open outcry system. The speeds are such that the rapidity of trades may exceed the market-maker's ability to adapt his or her position. Specifically, one disadvantage of automated trading systems is that a number of automatic trades may occur within a very short time that result in an unacceptable risk being assumed by a market-maker. That is, the trades may occur so rapidly that the market-maker is unable to withdraw or modify his quotes in a timely manner (e.g. Knigh Capital crash in August 2012). There exist software tools that can analyze stock and option portfolios in close to real time. Market data is provided to the software analysis tools and used to evaluate the risk associated with stock and option portfolios. In addition, the tools may provide recommendations for trades and quotes and automated submission of those trades and quotes. However, even if a market-maker utilizes such a computer-implemented automated position analysis tool to revise or cancel quotes, the software tools may be unable to act in time given the speed at which an automated trading exchange system is capable of executing incoming orders. In particular, one aspect of existing exchange systems is that transactions are received and processed in the order received. Thus, even if a market-maker responds immediately using an automated software tool, the exchange may have a message queue containing additional orders that will be processed before the exchange system receives and processes the market-maker's quote cancellation request. The result is that a market-maker who is willing to take on a predetermined level of risk must limit the number of quotes or the depth (quantity) of each quote to ensure that rapid trades do not result in an unacceptable aggregate risk, rather than issuing quotes having greater depth and breadth (where the filling of a single quote might reach the market-maker's risk limit). Thus, a market-maker's limited control over risk management may have the undesirable effect of hindering the liquidity of the market. It would therefore be desirable to have a trading exchange system and method for automatically canceling, regenerating, or modifying quotes under certain trading conditions. The Chicago Board Options Exchange patent on risk monitoring of automated trading provides few ideas on the IT architecture needed to avoid "message queue" in automated revision or cancellation of quotes.

18
Chapter II: Case study of NYSE Euronext HFT & Chicago Stock Exchange patent In this section, we propose to analyze information from stock market regarding the implementation of automated trading and High Frequency technology. Acting as node in the financial network, stock markets are key actors in the risk management specifications. Also, stock market must incorporate very fast processing to stay competitive in a very fragmented and changing environment. This paper will focus on two case studies. One will analyze the specifications from the implementation of High speed trading technology in HFT NYSE Euronext. The other one will analyze the patent from Chicago Stock Exchange on the risk monitoring of automated trading. The case study of the NYSE Euronext HFT services NYSE Euronext (NYX) is a leading global operator of financial markets and a provider of innovative trading technologies. With exchanges in the US and Europe, NYSE Euronext equities marketplaces represent one-third of equities trading worldwide. NYSE Euronext is also one of the world’s leading futures and options trading venues, with four markets based in the US and Europe offering derivatives on commodities, FX, equities, bonds, interest rates, indices and swaps. Its commercial technology division, NYSE Technologies, provides transaction, data, and infrastructure management services and solutions. From a single global business, NYSE Technologies delivers best of breed products using world-class technology connected to all the world major markets. NYSE Technologies is one of the world's leading providers of end-to-end electronic trading solutions. Through leading edge software, combined with high performance connectivity, NYSE Technologies engages the global trading community with innovative tools, access to liquidity and worldwide markets.. NYSE Technologies provides High Frequency Trading services, also through Market Access Gateway (MAG) and Risk Management Gateway (RMG). For an investment firm to enter the arena of algorithmic trading, it must have reliable systems capable of moving tremendous volume in microseconds. NYSE Technologies combines these elements into a single normalized messaging interface. Market Access Gateway (MAG) is an extremely low-latency order routing platform, that offers high-frequency traders, institutional investors and broker-dealers a scalable connection to global execution venues. MAG provides high speed messaging on commodity hardware, with deployment specific fine-tuning to maximize performance and throughput. Regarding Risk management tools, MAG provides optional pre-trade risk checks to allow to mitigate operational risk (fat finger checks) and keeps orders compliance in real-time. MAG technology easily integrates with other NYSE Technologies products to provide complete trading solutions. The diagram below shows typical integration examples, providing low latency Direct Market Access (DMA) in both broker-managed and hosted/co-located environments.

19
NYSE Technologies Market Data Platform feed handlers normalize the incoming market data with very low latency and pass the updates to SuperBook and to OneTick. SuperBook builds a consolidated view of all open orders for stocks while. OneTick captures the updates and stores them for historical processing. The OneTick (as Complex Event
DMA = Direct Market Access providing low latency
MAMA or open MAMA = Open Middleware Agnostic
Messaging APITM
LDMA = physical box as the trading engine providing
sub- microsecond transport latency, at throughputs
approaching millions of messages per second.
MAG = Market Access Gateway
RMG = Risk Management Gateway
FH = Feed Handlers
SFTI= Secure Financial Transaction Infrastructure

20
Processing Engine) calculates a range of mathematical analytics, which are delivered to the Client’s algorithmic engine. Finally, when the algorithm decides it’s time to trade, it issues the order to the NYSE Technologies (Market Access Gateway); which converts the trade to the format required by the corresponding Trading Venue. All this communication is handled at sub-microsecond latency via NYSE Technologies LDMA (Local Direct Memory Access = messaging platform). NYSE Technologies has published his Market Access Gateway Inventory for January 10, 2013 (see appendix). The total end-to-end latency introduced by the NYSE Technologies platform, including inter-process and inter-server communications, was approximately 70 microseconds
(1/1000.000 sec). The NYSE Technologies tests were designed to measure key factors of relevance to algorithmic traders:
the latency and throughput characteristics of the market data and market access infrastructure;
platform performance under varying market data update rates; and platform performance while varying the rate that orders are sent to market.
A logical view of the components in the test environment and the measurement points is shown in the following figure.
In a supervisory point of view, it’s
fundamental to assess the impact of
exchange simulator testing on
latency.

21
LATENCY MEASUREMENT – CLASSIC MISTAKES 1. Measuring the parts, not the whole. Measuring the
performance of components in isolation does not provide a true picture of how they will perform in combination. 2. Not using representative test data. Testing with
artificial data, or data from a different market, can produce results that do not accurately characterize real world performance. 3. Measuring only what can easily be captured.
Often, the metrics reported are those that are easy to measure, rather than those that are critical to trading system performance. 4. Not measuring what is important to business. If the
trading strategy is sensitive to latency outliers, there is little benefit in measuring averages. Similarly, capturing network round-trip times or single-component delays may not be particularly relevant in a business context.
The performance of the components shown in grey with dashed outlines was not measured in the tests. Latency was measured across three different segments of the platform:
the inbound components, the trading application, and the outbound components.
Inbound latency measures the time between a market data update being sent by the exchange simulator and the corresponding update being received by the algo engine code. This measures the end-to-end latency of the market data platform from the point of view of an algorithmic trader in the most stringent way: this is the total interval between a packet of market data entering the trader’s network from the exchange, and the time that the algorithm code can act upon it. Application latency measures the internal latency of the algorithm engine, defined as the time between it receiving a market data update and it being about to send an order message to the MAG. It was measured in order to be able to exclude the effect of the test code from the results and, therefore, is not included in the reported figures from NYSE Technologies. Outbound latency measures the time between the algorithm engine sending an order to the MAG and the network packet containing the order being sent to the exchange simulator. This measures the end-to-end latency of the market access platform from the point of view of an algorithmic trader. The first test (the market data test) was designed to determine the maximum rate at which the market data infrastructure could perform without introducing excessive latency. The algorithm engine was configured to send an order message to the MAG in response to every thousand price updates it received, and the multicast publisher was configured to send data at between 5,000 and 80,000 packets per second. This corresponds to approximately 2,300 to 37,000 market data updates per second. The second test (the Market Access test) was designed to determine the maximum order volume that the market access infrastructure could support. The algorithm engine was configured to send an order message to the MAG for every single market data update it received, and the multicast publisher was configured to send data at rates between 1,000 and 15,000 packets per second. These results correspond to market data update rates, and hence also order rates, between 450 and 7,000 per second. The test was run for ten minutes (five million packets for the market data test or half a million packets for the market access test). The entire day’s capture file contained 19.8 million packets, so the higher-rate market data tests correspond to consuming a quarter of a day’s data in just over a minute. The market data test showed consistent average inbound latency of between 46.7 and 50.1 microseconds for all data rates up to the maximum rate of 36,925 packets per second (and never exceeded 290.1 microseconds). The market access test showed very consistent average outbound latency of between 19.8 and 21.5 microseconds. The results of these tests are useful to understand the total end-to-end performance that can be achieved with a set of trading platform components that have been designed to work together.

22
NYSE Technologies - Test and results specifications.
As we can observe in this case study, testing on latency doesn’t cover the fundamental part of Stock exchange simulation. NYSE Technologies has created the industry standard for one of the highest-performance, lowest-latency global networks. It gives a single point of connection to a wide array of markets, through infrastructure reliable enough to power every NYSE Euronext market around the world. With over 1,600 potential counterparties and a wealth of third-party markets, It is one of the largest networks in the world. NYSE Technologies deploy Access Centers in London, Paris, Amsterdam, Brussels, Lisbon and Frankfurt. The Access Centers are housed in telco-neutral, third party data centers and are located a minimum distance apart. The speed of the cross connect is dependent on the bandwidth of the connection the costumer has ordered (this could be 10Mb, 100Mb, 1Gb). NYSE Euronext provides the equipment to be hosted. Most Tier 1 carriers have a presence within these facilities. To conclude this NYSE case study presentation, we would like focus on the "NYSE TECHNOLOGIES TERMS AND CONDITIONS". These Terms and conditions are useful to understand how a stock exchange defines responsibilities with his customers:
The Supplier may at any time, for any reason (except where prohibited by applicable law), deny the Client’s request for the Service or limit the available facilities of the Service as determined in the Supplier’s sole discretion.
The Client is responsible for making separate arrangements for use of any services (other than the Service) provided by the Supplier and its Affiliates (including

23
trading platform and market data services) and nothing in this Agreement entitles the Client or any other party to use or receive such services.
Only the Client (and not any third party) may use and access the Service, and the Client may not resell the Service (in whole or in part) or permit any third party to use or access the Service without the prior written consent of the Supplier.
Prior to allowing any of its Affiliates to use and access the Service, Client shall submit to the Supplier, for the Supplier’s approval, notice of such use and access and the identity of the Affiliates of the Client that would use and access the Service. The Supplier shall promptly notify the Client of its approval or disapproval of such use and access by such Affiliates of the Client.
A “Client User” means any third party, other than an Affiliate of the Client, who the Client permits to use and access the Service in accordance with this Agreement.
The Supplier reserves the right to make Policies governing the use of the Service (the “Policies”) and specifications concerning connection of systems to the Service (the “Specifications”) and to amend the Policies and the Specifications from time to time.
The Client agrees to comply with the Policies and Specifications and the rules and regulations of the Supplier as are notified by the Supplier to the Client from time to time.
The Supplier exercises no control over, and accepts no responsibility for, the content of any information transmitted using the Service. Use of such information is at the Client’s own risk. The Client is solely responsible for maintaining the accuracy and integrity of its own data.

24
Chicago Board Options Exchange as case study - A patent to define how organize the IT architecture of the risk monitoring of automated trading. In the fields of Patents, US market gives the originality to allow corporate to patent business model or organization. This section will analyze the Chicago Board Options Exchange patent as case study on what kind of IT architecture could be implemented in a risk management perspective for automated trading. This patent also provides IT architecture specification to help in managing "message queue" for High Frequency quotes revision or cancellation regarding Risk thresholds. To select the Chicago Board Options Exchange patent, we conduct a research in the US Patent & Trademark Office data base. This research has used key "words" to filter patents with the target to find patents related to risk monitoring of automated trading:
On the filter “Title&Abstract&Document” for the key words “automated trading”, we have found 92 patents;
If we include an additional filter on the key words “Risk management”, we have 15 patents;
If we include an additional filter on keys words “monitoring” or “risk monitoring”, we have 4 patents.
On these 4 patents, one patent comes from the Chicago Board Options on Exchange and his content covers the purpose of this paper. (see appendix)
This patent was approved in 2012 with the ID number 20020082967. It was submitted by Chicago Board Options Exchange (CBOE) and coverts the following organization topic: “Automated trading exchange system having integrated quote risk monitoring and integrated quote modification services”. CBOE sum up his patent as follow: “An automated trading exchange having integrated quote risk monitoring and quote modification services. An apparatus is implemented using at least one computer, having memory, and a processor. The computer is configured to receive orders and quotes, wherein specified ones of the quotes are contained in a quote group, and have associated trading parameters such as a risk threshold. Not all received quotes are required to have trading parameters as described herein. Preferably, the quote group contains all the quotes, or a subset of quotes, belonging to an individual market-maker for a given class of options contracts, or possibly the quotes of two or more market-makers that have identified themselves as belonging to a group for the purposes of risk monitoring and quote modification. The computer typically generates a trade by matching the received orders and quotes to previously received orders and quotes, and otherwise stores each of the received orders and quotes if a trade is not generated. The computer then determines whether a quote within the quote group has been filled as a result of the generated trade, and if so, determines a risk level and an aggregate risk level associated with said trade. The computer then compares the aggregate risk level with the market-maker's risk threshold, and if the threshold is exceeded, automatically modifies at least one of the remaining quotes in the quote group. The computer may also automatically regenerate quotes that have been filled”. CBOE has structured his patent on fhe following 30 claims: 1. A system for processing trades of securitized instruments based on security orders and quotes received from client computers, comprising:
at least one server computer comprising a memory, and a processor, said server computer configured to perform the steps of:

25
o receiving orders and quotes, wherein specified ones of said quotes belong to a quote group, and wherein said specified ones of said quotes have associated trading parameters comprising a risk threshold;
o generating a trade by matching said received orders and quotes to previously received orders and quotes;
o storing each of said orders and quotes when a trade is not generated; o determining whether a quote having associated trading parameters has been
filled as a result of the generated trade, and if so, determining a risk level and an aggregate risk level associated with said trade;
o comparing said aggregate risk level with said risk threshold; o and, automatically modifying at least one of the remaining said specified ones
of said quotes in the quote group if said threshold is exceeded.
2. The apparatus of claim 1 further comprising a quote data structure stored in said first memory, said data structure containing a plurality of quotes fields and at least one risk threshold field. 3. The apparatus of claim 2, wherein said plurality of quote fields comprises a bid quote field and an offer quote field. 4. The apparatus of claim 2, wherein said data structure further comprises a group indicator field. 5. The apparatus of claim 2, wherein said data structure further comprises a quote modification increment field. 6. The apparatus of claim 2, wherein said data structure further comprises a quote regeneration increment field. 7. The apparatus of claim 2, wherein said data structure further comprises an owner field. 8. A method of :
modifying quotes in an automated exchange trading system that receives orders and quotes from remote computers, matches the orders and quotes to generate trades, and stores orders and quotes that are unmatched, comprising the steps of:
receiving trading parameters comprising a risk threshold;
associating said trading parameters with specified ones of received quotes;
determining whether a quote having associated trading parameters has been filled as a result of a generated trade, and if so,
determining a risk level and an aggregate risk level associated with said trade;
comparing said aggregate risk level with said risk threshold;
and, automatically modifying at least one of the specified ones of received quotes if said threshold is exceeded.
9. The method of claim 8 wherein the step of determining a risk level comprises calculating a delta value for the generated trade. 10. The method of claim 8 wherein the step of determining a risk level comprises calculating a trading volume for the generated trade. 11. The method of claim 8 wherein the step of determining an aggregate risk level comprises determining a net delta. 12. The method of claim 8 wherein the trading parameters further comprise a time duration, and wherein the step of determining an aggregate risk level comprises summing the deltas from trades involving at least a subset of quotes contained in said quote group that were executed within the time duration. 13. The method of claim 8 wherein the trading parameters further comprise an integer N, and

26
wherein the step of determining an aggregate risk level comprises summing the deltas from the most recent N trades involving at least a subset of quotes contained in said quote group. 14. The method of claim 8 wherein the step of determining an aggregate risk level comprises determining a net contract volume. 15. The method of claim 8 wherein the step of determining an aggregate risk level comprises determining a weighted sum of contract volumes. 16. The method of claim 8 wherein the step of determining an aggregate risk level comprises determining an aggregate volume quantity. 17. The method of claim 8 wherein the step of automatically modifying at least one of the specified ones of said received quotes comprises canceling all said specified ones of said received quotes. 18. The method of claim 8 wherein the step of automatically modifying at least one of the specified ones of said received quotes comprises reducing the quantity associated with the specified ones of received quotes. 19. The method of claim 8 wherein the step of automatically modifying at least one of the specified ones of said quotes comprises revising at least one of the bid and offer values of each of the specified ones of received quotes. 20. The method of claim 8 wherein the trading parameters comprise a positive risk threshold and a negative risk threshold. 21. The method of claim 20 wherein the step of comparing the aggregate risk level with the risk threshold comprises comparing the aggregate risk level to the positive risk threshold if the aggregate risk level is positive, and comparing the aggregate risk level to the negative risk threshold if the aggregate risk level is negative. 22. The method of claim 8 wherein the step of comparing the aggregate risk level with the risk threshold comprises comparing the absolute value of the aggregate risk level to the risk threshold. 23. The method of claim 8 wherein each of the specified ones of received quotes are associated with one of a first subgroup and second subgroup, and wherein the step of automatically modifying at least one of the specified ones of received quotes in the quote group comprises reducing the offer values of the quotes in the first subgroup and raising the bid values of the quotes in the second subgroup. 24. The method of claim 23 wherein the first subgroup comprises quotes on call series options and the second subgroup comprises quotes on put series options, and wherein the aggregate risk is positive. 25. The method of claim 23 wherein the first subgroup comprises quotes on put series options and the second subgroup comprises quotes on call series options, and wherein the aggregate risk is negative. 26. The method of claim 23 where the amount of said reducing and raising is determined in response to a modification increment parameter. 27. The method of claim 8 further comprising the step of automatically modifying a quote comprises regenerating a quote having associated trading parameters that has been filled as a result of the generated trade. 28. The method of claim 27 wherein the step of regenerating a quote is performed utilizing a regeneration increment.

27
29. In a system, for processing trades of a security, that includes a computer that receives orders and quotes, executes a trade by matching the received orders and quotes, and stores received orders and quotes for which a trade is not executed, a computer-based risk monitoring apparatus, comprising:
a quote service module that associates market-maker trading parameters comprising a risk threshold with at least one received quote; and
a broker service module that communicates with the quote service module, wherein the broker service module automatically executes trades and provides corresponding fill reports to said quote service module, and wherein the quote service module modifies received quotes in accordance with the trading parameters and the fill reports.
30. In a system for processing trades of securitized instruments, the system including:
a computer having a memory and a processor, said computer being configured to perform the steps of receiving orders and quotes, generating a trade by matching said received orders and quotes to previously received orders and quotes, and storing each of said orders and quotes if a trade is not generated,
a method for managing risk comprising the steps of: o identifying specified ones of said quotes as belonging to a quote group; o associating trading parameters comprising a risk threshold with specified
ones of said quotes; o determining whether a quote having associated trading parameters has
been filled as a result of the generated trade, and if so, determining an aggregate risk level associated with said trade;
o comparing said aggregate risk level with said risk threshold; and o automatically modifying at least one of the remaining said specified ones of
said quotes in the quote group if said threshold is exceeded. So the CBOE's invention is based on a method and apparatus for an automated trading exchange having integrated quote risk monitoring and quote modification services. The computer is configured to receive orders and quotes, wherein specified ones of the quotes are contained in a quote group, and have associated trading parameters such as a risk threshold. All received quotes are required to have trading parameters as described herein. Preferably, the quote group contains all the quotes belonging to an individual market-maker for a given class of options contracts, or possibly the quotes of two or more market-makers that have identified themselves as belonging to a group for the purposes of risk monitoring and quote modification. The computer typically generates a trade by matching the received orders and quotes to previously received orders and quotes, and otherwise stores each of the received orders and quotes if a trade is not generated. The computer then determines whether a quote within the quote group has been filled as a result of the generated trade, and if so, determines a risk level and an aggregate risk level associated with said trade. The computer then compares the aggregate risk level with the market-maker's risk threshold, and if the threshold is exceeded, automatically modifies at least one of the remaining quotes in the quote group. The computer may also automatically regenerate quotes, that is, automatically issue new quotes when trades have occurred against previous quotes.

28
CBOE provides the following illustration of his architecture:
In this CBOE's figure, a preferred embodiment of the system 100 utilized for trading and quote modification is described. The system 100 (also referred to herein as a screen-based trading system, or SBT system) includes a plurality of computers, which may be one or more workstations, servers, mainframes, or other computer hardware platforms that provide sufficient resources to meet the desired trading volume and desired transaction-processing rate. The system includes a number of computer clusters such as cluster 102 (although only one is depicted in the figure), where each cluster 102 handles trading for a number of securities, such as one or more classes of options. In the preferred embodiment, each cluster 102 is made up of two servers (104 & 106). The servers 104 and 106 in cluster 102 communicate with a plurality of client servers (110 & 112) that are typically located at remote locations, such as at a brokerage house, but may also be located in the same facility as the clusters 102. Network 108 facilitates communication between the clusters 102 and the client servers (Two clients are showed in CBOE figure: 110 & 112). For CBOE, the network 108 is preferably a private LAN/WAN configuration, but a public network may be utilized, if it provided sufficient redundancies and message security. Each client server (110 & 112) may be provided with a predetermined message throughput rate into network (108), where the throughput rate may be a maximum rate determined by various parameters, including the volume of orders sent by the client server (110 & 112), the volume of quotes sent by the client server (110 & 112), the number of option series for which quotes are provided, communication/connection fees paid by the brokerage house or other entity utilizing the client server (110 & 112), the overall capacity of the trading system 100, etc.

29
The client servers (110 & 112) preferably communicate with other elements of the automated exchange system using a client application server module (210), as further described below, running on client servers (110 & 112). Each client server (110 & 112) is capable of serving a number of clients (shown in the figure as terminals 114, 116, 118, 120, 122, and 124). The client terminals may be "dumb" terminals, stand alone computing devices (PCs or workstations), or even portable wireless terminals. The client servers (110 & 112) may communicate with the client terminals (114-124) using a proprietary protocol or one of many standard public domain protocols. The automated exchange system 100 is comprised of the following five logical software modules:
Presentation Services Graphical User Interface (130- GUI);
Application Services (210 - Client Application Server, Gateway);
Business Services (132) - see appendix;
External Integration Services (133) - see appendix;
and, Infrastructure Services (134) - see appendix.

30
The Presentation Services (GUI module 130) is constituted by applications that interact with the exchange system (100) via the Member Interface (API 135). There are two types of client applications, those that provide a GUI to allow user interaction with the system directly and applications that automate trading functions. An SBT-GUI module (131) (screen-based trading - Graphical User Interface) is responsible for displaying the contents of a particular model to the screen and updating the display if the model's contents change. This module 131 contains several GUI applications, one for each of the major classes of human actors that use the system 100: traders, market-makers, clearing firm brokers, and system operators. The Application Services module 210 contains subordinate modules that forward requests initiated by human or automated actors, to be executed by the appropriate Business Services module(s) 132 (see appendix). These applications submit requests to Business Services components 132, notify clients of business events, and maintain user-specific views of information in the Business Services 132. This module also encompasses a Member Interface (MI) API 135 that provides a single entry point to the system exposing the applications in the Application Services Module 210 (i.e., Trader, Market-Maker). In addition, the Application Services Module 210 maintains instantaneously updated views that reflect the prevailing state of each actor's information in the Business Services module 132. The Trader Application module 136 has the following specific responsibilities:
submit, cancel, update, and cancel/replace orders;
submit requests for quotes;
present the current status of the trader's orders;
present fill and cancel reports;
present Market Best Bids and Offers for selected products;
set the trader's defaults and preferences;
present Book Depths for selected products;
and, present underlying quotes/last sales and news alerts. The Market-Maker module 137 inherits the Trader App module's 136 responsibilities and adds the following:
submit and modify market-maker quotes;
present requests for quotes;
set the market-maker's defaults and parameters;
set autoquote parameters; submit autoquotes. The Clearing Firm Broker module 138 inherits the Trader App module's 136 responsibilities and adds the following: assume control of a trader's privileges. A Clearing Firm Broker can:
force the logout of a market-maker;
set a maximum order quantity for quotes and orders of the clearing firm's market-makers.
The BackOffice application 139 is responsible for reporting order status information. This can include fill reports, cancel reports and new order notifications. The Operations application 140 has the following responsibilities:
start and shutdown the SBT system;
start and stop trading of a product;
change the status of a product's market (pre-open, open, close, halt, etc.);
present logged system events;
maintain SBT-specific trader information;
maintain SBT-specific product information;
maintain trading parameters (minimum market-maker order default size, required percent of responses to a request for quote (RFQ), maximum response time to an RFQ, etc).
The functionality of the Trader 136, Market-Maker 137, Clearing Firm Broker 138, and Back Office 139 modules is exposed by the Member Interface (MI) Application Programming

31
Interface (API) 135. The Member Interface 135 exposes different subsets of functionality depending on the user that logged on to the system. The intention behind sharing a common API among the different trader classes is to allow workstations to service all of them. Separate API's may alternatively be used for the different user classes. The Business Services module 132 (see appendix) contains the core functionality of the automated exchange system 100. It includes components that correspond to the key business object model entities of the automated trading system such as members, orders, books, products, quotes, et cetera. In addition, it includes components to administer and operate the system 100. CBOE's Risk Measurements and Risk Thresholds... In a preferred embodiment of the automated trading system 100 having integrated order modification and quote risk monitoring, the aggregate risk of a market-maker's recent trades is calculated after each trade. The measurement preferably includes either:
calculating an equivalent stock position, i.e., a net delta (by, for example, summing delta values for all contracts traded by the market-maker associated with the option series in the class),
or calculating a net gamma, theta, or vega. In particular, the aggregate risk measurement is preferably the net delta of all the trades for a specific market-maker or a designated group of market-makers in a given class in a given period of time. The quotes in a given class submitted by a market-maker (or a group of market-makers) are referred to herein as a quote group. The aggregate risk measurement is preferably based on the net delta for the entire class of options, which is the sum of all the deltas for a given market-maker's trades in all series of a class. The delta contribution for each trade is calculated every time a trade occurs for any series in the class. The aggregate risk is then calculated by summing delta contributions from only the most recent trades. Autoquote systems provide pricing information, and specifically theoretical delta values, using algorithms that utilize standard parameters. Most of the parameters associated with calculating an individual series delta value are objective data, such as the date, strike price, the price of the underlying security, etc. Other autoquote parameters have acceptable default values that may be used, such as using the broker loan rate for the interest rate, etc. One parameter that may be more subjective among individual market-makers is the volatility parameter. Thus, the system 100 may be designed such that each quote submitted by a market-maker includes a volatility field to be used by the system in determining the individual theoretical delta value. The theoretical delta value may then be calculated either:
as part of the threshold test,
or may be periodically updated at a rate sufficient to provide a fairly accurate delta value .
In this way, the system 100 provides the market-maker with further control over the quote risk monitoring system. Because the exchange quote modification service is intended to address increased risks associated with a rapid sequence of trades, older trades need not be included because the market-maker has had an opportunity to manually intervene and modify his quotes. Thus, the aggregate risk measurement may be based on the last N trades, where N is a trading parameter specified by the market-maker, or may be based on trades occurring within a specific time frame. The duration of the time frame may be specified by the market-maker by providing a time window.

32
Alternatively, the risk threshold and risk measurement may include an aggregate gamma measurement. Gamma is known to be the rate of change of the delta parameter with respect to the rate of change of the underlying security, such as the stock. An aggregate gamma measurement provides an indication of the rate at which an aggregate delta measurement will change. Net gamma values are negative when a market-maker is a net seller of contracts, and positive when a market-maker is a net buyer of contracts. As a further alternative, either theta, which is the rate at which option prices change over time, or vega, which is the change in an option contract that results from a change in its volatility, may be included. The market-maker may provide a single threshold such that if the absolute value of the aggregate risk exceeds the threshold, then the quotes are modified according to the rules set forth below. The market-maker may also provide positive and negative thresholds. In an alternative preferred embodiment, the market-maker's risk is determined by calculating the net contract volume traded within a specified time. The result is that the volume of each trade is treated as a positive or negative value, depending upon the nature of the trade selling calls and buying puts have negative contributions, and buying calls and selling puts have positive contributions. The sum of the trades is then calculated to provide a net difference between the number of short calls plus long puts and long calls plus short puts. Thus, the market-makers may specify a threshold in terms of a maximum net contract volume offset.
The system allows be configured to also allow the market-makers to specify a time window parameter that specifies which trades should be included in the risk calculation. In still further embodiments, the aggregate risk measurement may be simplified by calculating the total number of put or call contracts (or deltas) that have been sold or bought within a given time frame or within that last N trades. Thus, if any of the four aggregate volume quantities (buying calls, selling calls, buying puts, selling puts) exceeds a threshold (within a certain time period, or certain number of trades), the quote modification module 340 modifies the quotes appropriately.
Alternatively, the quote service module 240 (Market-Maker Quote Service module - see appendix) may calculate the total calls bought plus puts sold, and the total calls sold plus puts bought, and notify the quote modification module 340 (see below) if either of these aggregate values exceeds the threshold. As a further alternative, the quote service module may use a weighting scheme to calculate aggregate values described above. Specifically, in-the-money options (options with intrinsic value) may be weighted more heavily than at-the-money or out-of-the-money options. In one preferred method, the in-the-money options are weighted with a factor of two, at-the-money options are weighted with a factor of one, and out-of-the-money options are weighted by a factor of one half. These simplified risk measurement and threshold tests perform adequately due to the nature of trading activities that typically result in large risk exposure. It should also be noted that the market-makers may be grouped together for purposes of risk exposure analysis. That is, the total risk may be calculated based on the trades of one or more market-makers. The market-makers provide a group identification parameter(s) indicating which other market-makers' trades should be included in the risk calculation. In this manner, market-makers acting in concert on behalf of a single organization may coordinate their quote modification. Automatic Quote Modification... The quote service module 240 of the exchange system 100 includes a quote modification service module 340. The quote modification service module 340 may be implemented as part of the quote service module 240, or may be a separate service module. It may also take the form of a separate quote factory module for generating new quotes.

33
The quote modification service module 340 performs quote modification by preferably automatically revising, canceling, or regenerating quotes. The quotes are modified by the exchange system in an automatic manner that does not require further input from the market-maker in the form of quote cancellation requests and submission of new quotes by the market-maker or his computer. The exchange system performs quote modification immediately and without the transmission delays inherent in communication systems and without delays associated with processing queued cancellation requests received from a remote location. If the quote service module 240 determines that the threshold(s) have been exceeded, the quote service module 240 determines revised quotes. The revised quotes can take numerous forms.
In a first embodiment, the quote service module 240 revises quotes by canceling all outstanding quotes in the class, thereby preventing any further trades from executing and giving the market-maker time to provide revised quotes. In this embodiment, the quote service module 240 sends quote update messages in the form of cancellation messages to the broker service module 230 (see appendix). The broker service 230 then removes those quotes from the electronic book. Because the threshold test is performed by the exchange system 100 after each trade, the cancellation messages are therefore preferably processed before any further trades can be executed. This is possible because the cancellation requests are not sent from a remote node on a wide area network, such as a market-maker's computing platform, but are generated by the exchange system 100. This provides the advantage of eliminating a cancellation message queue, as would be used when sending cancellation requests from a remote node, thereby improving quote update times and providing risk management.
In a second embodiment, the quote service module 240 revises quotes by reducing the quantity associated with the existing quotes in the class thereby reducing the amounts of potential further trades and reducing the market-maker's exposure to more risk. The market-maker may specify the amount of the volume decrease by way of an increment value. In this embodiment, the quote service module 240 sends quote updates by first sending quote cancellation messages to the broker service module 230, and after acknowledgment, sending the revised quotes to the broker service module 230 for execution or booking. Again, because the threshold test is performed by the exchange system 100 after each trade, the cancellation messages are therefore preferably processed before any further trades can be executed. As above, this is possible because the cancellation requests are not sent from a remote node on a wide area network, such as a market-maker's computing platform, but are generated by the exchange system 100.

34
In a third embodiment, the quote service module 240 revises quotes by decreasing the bid and offer values of some quotes and increasing others in an attempt to cancel some of the risk already assumed by the market-maker. The quote service 240 does this by automatically adjusting quotes to favor trades that will tend to provide offsetting risk. Specifically, if the threshold has been exceeded by a high positive-valued net delta (or K), then the net delta (or K) may be offset by trades having a negative delta (or K). As set forth above, those trades would include selling calls and buying puts. Similarly, if the threshold has been exceeded by a high negative-valued net delta (or K), then the aggregate risk may be offset by trades having a positive delta (or K), or by selling puts and buying calls. Of course, to produce the desired trades, the lowering of offer values of quotes will tend to result in more selling activity by the market-maker, and the raising of bid values will result in more buying activity by the market-maker. In this embodiment, the modification increment is specified by an increment value. Again the automated risk monitoring system and quote modification service of system 100 provides advantages in that the market-maker need not cancel previous quotes and submit new quotes while still being exposed to the possibility of further trades being executed.
The quote service 240 may also modify quotes by regenerating the just-filled quote. This may be performed even if the market-maker's risk threshold has not been exceeded. The market-maker is able to specify quote regeneration parameters via client application server 210 that are stored in the user service module 260 (see appendix). The parameters specify which products are enabled for quote regeneration, and the extent to which the quotes are to be regenerated. The market-maker may therefore specify, on a product-by-product basis, how many times the quotes are to be regenerated after each quote has been filled. This is referred to herein as the regeneration number parameter. The market-maker may also specify whether the regenerated quotes are to have the same bid and offer values, or are to be backed-off from the previous trade. This parameter is referred to herein as the regeneration increment. That is, for a two-sided quote, if the market-maker has just sold a quantity of contracts at his offer price, the regenerated quote may have a higher offer value. Preferably the bid value is also raised accordingly to maintain a desired or required spread in bid and offer quotes. If, on the other hand, the market-maker has just bought a quantity of contracts at his bid price, the regenerated quote may have a lower bid value. The market-maker also has the option of specifying on a per-class basis the values of the regeneration number parameter and the regeneration increment parameter. The quote regeneration is preferably not performed if the market-maker risk threshold has been exceeded, unless the market-maker has specifically selected quote revision in the event the risk threshold has been exceeded.
Upon execution of a trade at step 310, the quote service module 240 at step 320 checks to see whether the individual market-maker's risk threshold has been exceeded. The risk measurement and threshold test may be performed using a variety of methods, and certain market-makers' trading activities may be combined for the purposes of risk exposure. If the threshold has not been exceeded, then at step 330 the quote service module 240 preferably checks to see whether the market-maker whose quote has been executed has indicated the desire to have his quotes regenerated. If not, then the process has completed. In the event that the result of either inquiry 320, 330 is affirmative, then the quote service 240 modifies the quotes with the quote modification module 340 as described above. Quote modification module 340 includes quote regeneration module 350 and cancel or revise quote module 360. In conclusion, the Chicago Board Options Exchange patent provides a useful case study on IT architecture to manage orders modification or cancellation. It provides useful specifications also regarding the "message queue" issue in a High Frequency Trading environment regarding the necessity to react in real-time.
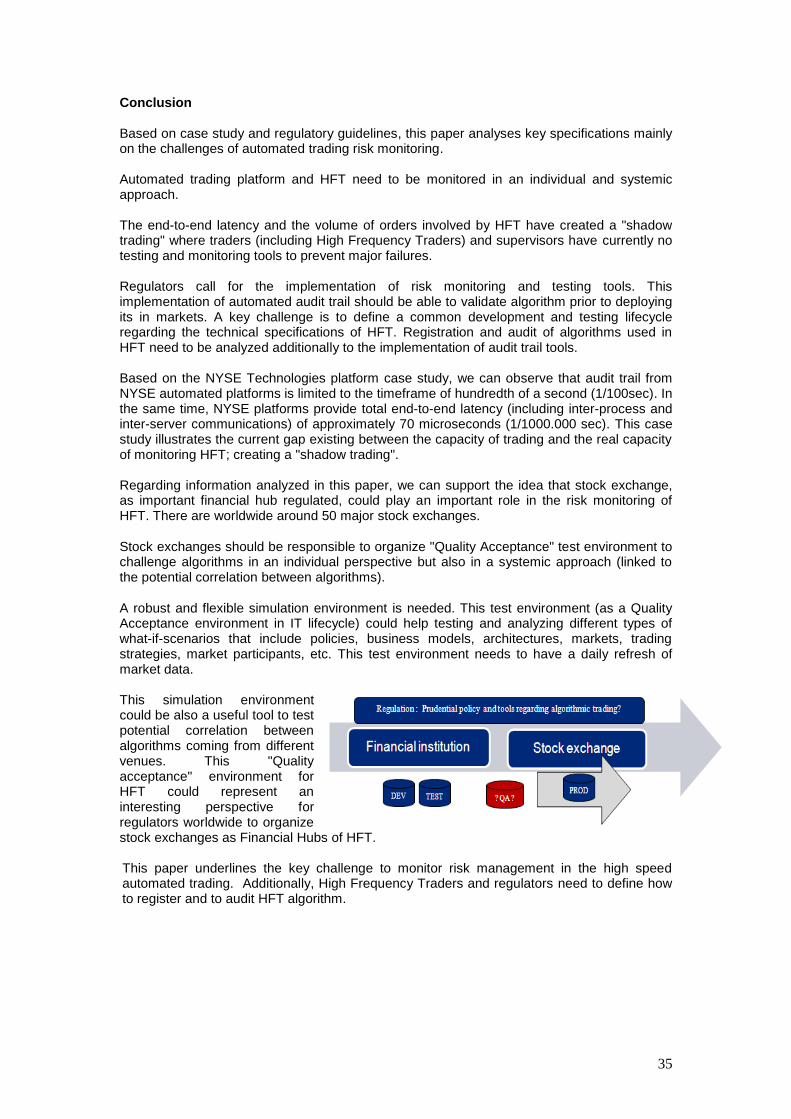
35
Conclusion Based on case study and regulatory guidelines, this paper analyses key specifications mainly on the challenges of automated trading risk monitoring. Automated trading platform and HFT need to be monitored in an individual and systemic approach. The end-to-end latency and the volume of orders involved by HFT have created a "shadow trading" where traders (including High Frequency Traders) and supervisors have currently no testing and monitoring tools to prevent major failures. Regulators call for the implementation of risk monitoring and testing tools. This implementation of automated audit trail should be able to validate algorithm prior to deploying its in markets. A key challenge is to define a common development and testing lifecycle regarding the technical specifications of HFT. Registration and audit of algorithms used in HFT need to be analyzed additionally to the implementation of audit trail tools. Based on the NYSE Technologies platform case study, we can observe that audit trail from NYSE automated platforms is limited to the timeframe of hundredth of a second (1/100sec). In the same time, NYSE platforms provide total end-to-end latency (including inter-process and inter-server communications) of approximately 70 microseconds (1/1000.000 sec). This case study illustrates the current gap existing between the capacity of trading and the real capacity of monitoring HFT; creating a "shadow trading". Regarding information analyzed in this paper, we can support the idea that stock exchange, as important financial hub regulated, could play an important role in the risk monitoring of HFT. There are worldwide around 50 major stock exchanges. Stock exchanges should be responsible to organize "Quality Acceptance" test environment to challenge algorithms in an individual perspective but also in a systemic approach (linked to the potential correlation between algorithms). A robust and flexible simulation environment is needed. This test environment (as a Quality Acceptance environment in IT lifecycle) could help testing and analyzing different types of what-if-scenarios that include policies, business models, architectures, markets, trading strategies, market participants, etc. This test environment needs to have a daily refresh of market data. This simulation environment could be also a useful tool to test potential correlation between algorithms coming from different venues. This "Quality acceptance" environment for HFT could represent an interesting perspective for regulators worldwide to organize stock exchanges as Financial Hubs of HFT. This paper underlines the key challenge to monitor risk management in the high speed automated trading. Additionally, High Frequency Traders and regulators need to define how to register and to audit HFT algorithm.

36
Bibliography (key lectures used for the preparation of this paper)
X. Frank Zhang, “The Effect of High-Frequency Trading on Stock Volatility and Price Discovery”, Yale University, Nov. 2010.
“FINDINGS REGARDING THE MARKET EVENTS OF MAY 6, 2010”, REPORT OF THE STAFFS OF THE CFTC AND SEC TO THE JOINT ADVISORY COMMITTEE ON EMERGING REGULATORY ISSUES, SEPTEMBER 30, 2010 (www.cftc.gov,
www.sec.gov).
D. Easley, M.M. Lopez de Prado, M.O’Hara, “THE VOLUME CLOCK: INSIGHTS INTO THE HIGH FREQUENCY PARADIGM”, March 2012.
Albert J. Menkveld, "High Frequency Trading and the New-Market Makers", August 15, 2011, Duisenberg school of finance (TI 11-076/2/DSF 21)
P. Gomber, B. Arndt, M. Lutat, T. Uhle, “High Frequency Trading”, Goethe Universitat - Frankfurt, 2011.
Mark D. Flood, Allan I. Mendelowitz, William Nichols, "Monitoring Financial Stability in a Complex World", March 14, 2012.
Matt Prewitt, "HIGH-FREQUENCY TRADING: SHOULD REGULATORS DO MORE?", 12/12/2012.
Albert J. Menkveld, "High Frequency Trading and the New-Market Makers", 06/02/2012.
David M. Serritella, 'HIGH SPEED TRADING BEGETS HIGH SPEED REGULATION: SEC RESPONSE TO FLASH CRASH", University of Illinois College of Law, 2011.
AFM, "High frequency trading: The application of advanced trading technology in the European marketplace", Amsterdam, November 2010.
Michal J. McGowan, "The rise of computerized high frequency trading: used and controversy", Duke University School of Law, 2011.
Babis Theodoulidis, David Diaz, "Financial Markets and High Frequency Trading: An Information Management Perspective" (http://ssrn.com/abstract=2178944).
Diego Leis, "High Frequency Trading : Market Manipulation and Systemic Risks From an EU Perspective", 29/02/2012 (http://ssrn.com/abstract=2108344)
J Brogaard, "High frequency trading and its impact on market quality", University Kellogg School of Management, 2010.
Alain Chaboud, "Rise of the Machines: Algorithmic Trading in the Foreign Exchange Market", February 2013, SSNR (http://papers.ssrn.com/sol3/papers.cfm?abstract_id=1501135)
Robert Litzenberger, Jeff Castura, Richard Gorelick, " The Impacts of Automation and High Frequency Trading on market quality", Annueal Review of Financial Economics, October 2012 (http://www.annualreviews.org/doi/abs/10.1146/annurev-financial-110311-101744?journalCode=financial)
"The Future of Computer Trading in Financial MarketsAn International Perspective", Foresight: The Future of Computer Trading in Financial Markets, The Government Office for Science, London, 2012.
Corporate & Institutions informations from: - ESMA - UPSTO (http://www.uspto.gov) - (http://appft1.uspto.gov/netacgi/nph-Parser?Sect1=PTO1&Sect2=HITOFF&d=PG01&p=1&u=%2Fnetahtml%2FPTO%2Fsrchnum.html&r=1&f=G&l=50&s1=%2220020082967%22.PGNR.&OS=DN/20020082967&RS=DN/20020082967) - CFTC - NYSE Euronex - Hibernia Atlantic (www.hiberniaatlantic.com - High Frequency Traders (http://highfrequencytraders.com) - High Frequendy Trading Review (http://www.hftreview.com)

37
Appendix I : Algorithm trading and HFT definition (source: P. Gomber, B. Arndt, M. Lutat, T. Uhle, “High Frequency Trading”, Goethe Universitat - Frankfurt, 2011).

38

39
High Frequency literature Review:
HFTLiteratureReviewNov2012.pdf

40
Appendix II - Patent research in USPTO
1 20120203685 System and Method for Dynamically Changing an Electronic Trade Order Quantity
2 20120095898 AUTOMATED TRADING EXCHANGE SYSTEM HAVING INTEGRATED QUOTE RISK MONITORING AND INTEGRATED QUOTE MODIFICATION SERVICES
3 20120030087 Automated Trading System In An Electronic Trading Exchange
4 20120030086 Automated Trading System In An Electronic Trading Exchange
5 20120022993 Automated Trading System In An Electronic Trading Exchange
6 20110313910 System and Method for Dynamically Changing an Electronic Trade Order Quantity
7 20110119176 Electronic Block Trading System and Method of Operation
8 20100198747 System and Method for Dynamically Changing an Electronic Trade Order Quantity
9 20090006266 ELECTRONIC BLOCK TRADING SYSTEM AND METHOD OF OPERATION
10 20080243709 System and Method for Dynamically Changing an Electronic Trade Order Quantity
11 20080208734 Automated Trading Exchange System Having Integrated Quote Risk Monitoring And Integrated Quote Modification Services
12 20070156574 Automated trading system in an electronic trading exchange
13 20060259417 Automated trading system in an electronic trading exchange
14 20040148242 Method and system for intelligent automated security trading via the Internet
15 20020082967 Automated Trading Exchange System Having Integrated Quote Risk Monitoring and Integrated Quote Modification Services
With the additional key word « monitoring » : 4 patents
1 20120095898 AUTOMATED TRADING EXCHANGE SYSTEM HAVING INTEGRATED QUOTE RISK MONITORING AND INTEGRATED QUOTE MODIFICATION SERVICES
2 20080208734 Automated Trading Exchange System Having Integrated Quote Risk Monitoring And Integrated Quote Modification Services
3 20040148242 Method and system for intelligent automated security trading via the Internet
4 20020082967 Automated Trading Exchange System Having Integrated Quote Risk Monitoring and Integrated Quote Modification Services
Due to the limited scope of this paper, It will be not possible to analyze and present the patent on " A method for automatically executing risk controlled trading spreads". For information, this patent is provided in the following document.
patent on method for automaticcally executing risk controlled trading spreads.docx

41
Appendix III - Chicago Board Options Exchange patent to define how organize the IT architecture of the risk monitoring of automated trading. This appendix provides additional information on technical specifications provided by the Chicago Board Options Exchange patent and not presented in the core of this paper.
******** The Broker Service module 230 is responsible for executing the following types of orders: limit, market, all or none, fill or kill, immediate or cancel, stop, stop limit, and spread. Upon trade execution, the Broker Service 230 is responsible for notifying the Trade Service module 143 of all the orders matched (all parties to the trade) in the trade. It is also responsible for notifying the Order Handling Service (i.e. Orders) 220 and Market-Maker Quote Service (i.e. Quotes) 240 of the fills. The responsibilities of the Order Book Service module 142 are:
cooperate with the Broker Service 230 in calculating the opening price during a product's pre-opening period;
acknowledge that an order was accepted by publishing an event consumed by the Trader application 136 which originated the order;
cancel and cancel/replace resting orders; upon changes to the top of the book, publish the new Book Best Bid Offer (BBBO) and last sale.
The responsibilities of the Trade Service module 143 are:
receive trade notifications from the Broker Service 230;
format trade reports;
store trade reports;
and forward trade reports to trade match (via TPF 156). The Market-Maker (MM) Quote Service module 240 is responsible for:
receiving requests for quotes (RFQs) from traders;
submitting RFQs to market-makers assigned to the product for which the quote was requested (by publishing in the RFQ event channel);
receiving and logging market-maker responses to RFQs (market-maker quotes);
upon receiving a market-maker quote, saving it persistently and submitting them to the Broker Service module 230 for execution;
sending fill reports to originating market-makers upon receiving fill notifications from the Broker and Order Book modules;
canceling or updating a Market-Maker quote upon receiving a request from the originating market-maker by submitting the request to the Broker/Order Book;
canceling or updating or regenerating Market-Maker quotes upon receiving a fill report;
upon inquiry, providing the history of the quotes submitted by a market-maker.
The Product Service module 144 maintains all product-related information. In order to perform its responsibilities, the Product Service module 144 downloads, and preferably caches, product information from TPF 156 and TIPS 157. The User Service module 260 maintains all user-related information, both specific to SBT and contained in the Membership System. It provides a unified interface to SBT components accessing user information, hiding the actual location of the maintained data, thus simplifying client logic.
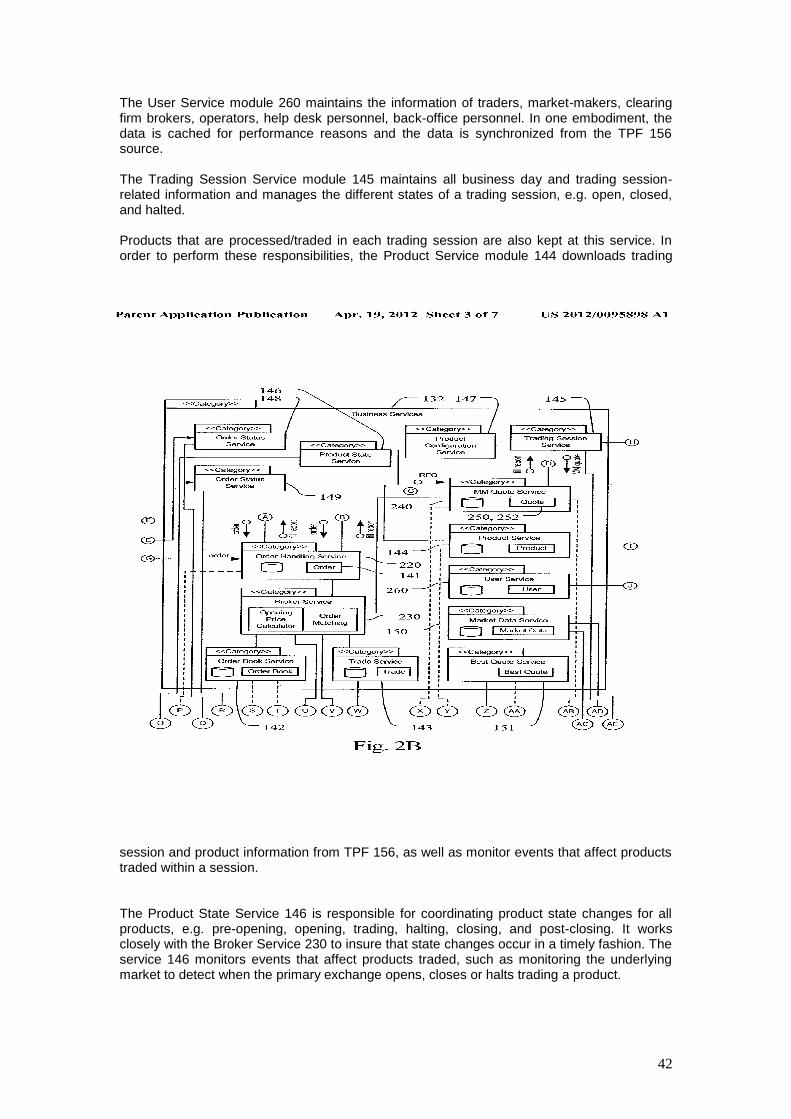
42
The User Service module 260 maintains the information of traders, market-makers, clearing firm brokers, operators, help desk personnel, back-office personnel. In one embodiment, the data is cached for performance reasons and the data is synchronized from the TPF 156 source. The Trading Session Service module 145 maintains all business day and trading session-related information and manages the different states of a trading session, e.g. open, closed, and halted. Products that are processed/traded in each trading session are also kept at this service. In order to perform these responsibilities, the Product Service module 144 downloads trading
session and product information from TPF 156, as well as monitor events that affect products traded within a session.
The Product State Service 146 is responsible for coordinating product state changes for all products, e.g. pre-opening, opening, trading, halting, closing, and post-closing. It works closely with the Broker Service 230 to insure that state changes occur in a timely fashion. The service 146 monitors events that affect products traded, such as monitoring the underlying market to detect when the primary exchange opens, closes or halts trading a product.

43
The Product Configuration Service 147 is responsible for providing the location of where a product is processed/traded. This information is primarily used to route product-specific requests (e.g. orders) for processing. The Order Status Service 148 provides subscription and notification services related to orders (i.e., fill reports, cancel reports, order accepted by book, etc.). The Quote Status Service module 149 provides subscription and notification services related to quotes (i.e. fill reports, deletion reports, etc.) The service 149 preferably replaces the use of event channels for quote status reporting, providing a more secure mechanism for status delivery. The Market Data Service 150 maintains a current snapshot of market data, in addition to publishing market summary data. The module also provides an interface to clients to query historical market data. The Best Quote module 151 is responsible for calculating the market best (aggregate quantities of buy and sell orders at the best price) for each product and sending them to TPF 156 (which in turn forwards them to the Options Price Reporting Authority) for public dissemination. In addition, it is responsible for calculating and disseminating the National Best Bid Offer (NBBO). In order to provide this information, the Best Quote module 151 subscribes to the event channel referred to herein as the Best of the Rest channel to obtain the current best quote from competing exchanges. The Best Quote module 151 then determines the source of the NBBO, whether it is from the present exchange or a competitor, and publishes the results to the Best Quote event channel, of which the TPF Adapter 152 is a subscriber. The External Integration Services module 133 includes adapters (152, 153, 154, and 155), that map the interaction paradigms of external systems to the ones in the system 100 architecture. The adapter modules "adapt" (or "wrap") the native legacy interfaces to interfaces appropriate in the SBT environment. The TPF (Transaction Processing Facility) module 152 contains the adapter to allow SBT and TPF 156 to interact. TPF data is received, remoduled, and broadcast/delivered to the appropriate components within SBT. Conversely, SBT data is received, either through direct invocation or event consumption, remoduled, and sent to TPF 156 using its native interface.
The Membership Adapter 154 translates requests for member information received from SBT components into requests to the Membership System 159 and returns the results after re-formatting.

44
The TIPS Adapter 155 subscribes to TIPS 157 to receive the external market data needed in the SBT environment, including underlying market data and the Best of the Rest of options listed in SBT. The Events Service notifies the TIPS Adapter 155 of consumer subscriptions so that it can propagate these subscriptions back to TIPS 157. Once subscribed, the TIPS Adapter 155 reformats the market data received from TIPS 157 and publishes it for consumption by SBT components. Another responsibility of this adapter 155 is to publish underlying product state events when external markets change their states, for instance when they open, halt, close, etc. The Trade Match Adapter 153 receives SBT data and forwards it to TM 158. The TM Adapter 153 handles the following data flows: Trade Report (SBT to TM) SBT reports all the parties to a trade to TM 158.
Thee Infrastructure Services module 134 contains commercial "off-the-shelf" software and extended infrastructure services that provide enterprise-wide support to various other external systems. One mechanism by which the SBT system components interact with each other is by supplying and consuming events, implemented as a publish/subscribe pattern. The following list provides a brief description of the event flows/notification services (messaging services). In accordance with a preferred embodiment, there are four major tiers of the application software:
The business services 132 handle all the SBT order matching, execution and reporting functionality. It provides the repository for all SBT information data.
The application services 210 handle the application presentation and act as the application front end to the business services. Different views of the business services 132 and collaboration of business objects are grouped together and are presented to the user based on logon authentication and authorization level. The two tiers communicate to each other by two supported tiers: the infrastructure services 134 and external integration services 133.
The infrastructure services 134 provide a seamless integration between the application services 210 and business services 132.
The external integration services 133 provide the access to the external system. CBOE's figure shows a sequence diagram 200 for a preferred embodiment of the automated exchange system 100. The system 100 includes a client application server 210, an order handling service module 220, a broker service module 230, a quote service module 240, a user service module 260, and quote objects 250 and 252. The service modules 220, 230, 240, 260 and objects 250, 252 are preferably software modules running on clusters 102, or on one or more interconnected computers. The software modules are preferably written in an

45
object-oriented programming language and are compiled to run on the clustered computers 102. Preferably, the software utilizes the C++ language, the Java programming language, or other object-oriented language. Alternatively, any suitable software language may be used to implement the system, as will be understood by one of ordinary skill in the art. The modules also interact with a database program used for storing data and other system and user information. In the preferred embodiment an Oracle database system is used. The client application server 210, as discussed above, runs on client servers 110, 112, and provides an interface to one or more clients. The client server 110, 112 may include one or more application modules, depending upon the intended users of the servers 110, 112. For example, the client servers 110, 112 preferably include at least one of a market-maker application, a trader application, a back-office application, or a member interface. The client servers 110, 112 also preferably utilize a user authentication and role-based security model to control access to the various application modules. The client server 110, 112 may also include modules such as a help desk application, an operations application, and a Clearing Firm Broker (CFB) module. The CFB module may be configured to allow a Clearing Firm to set maximum volume limits on a per-class basis. The Help Desk module is preferably enabled for use on client servers that provide connectivity to exchange management personnel. The Help Desk provides a utility to force a user to logout of the system. The order handling service 220 forwards orders to the appropriate broker service module 230 that handles the class of options to which the individual orders relate. If the broker service module 230 cannot execute the order immediately, it routes it to the order book service module, which maintains the current state of all pending orders and quotes. The order handling service module 220 receives order information from various sources, including brokers, traders, market-makers, etc. The orders may enter the system from a client application server 210 or through an alternative interface such as TFP adapter 152, which is a connection that allows a pre-existing automated order handling system such as TPF system 156, to access the present system. The broker service module 230 is responsible for executing various types of orders, including limit, market, all or none, fill or kill, immediate or cancel, stop, stop limit, and spread orders. Preferably, there are numerous broker service modules 230 running on the exchange server 104, or on the interconnected computers in the cluster 102, where each broker service module 230 handles trades for a subset of products offered by the exchange. For example, there is preferably a broker service module 230 for each class of option contracts. The broker service module 230 thus matches incoming orders to other orders or to quotes supplied by market-makers to complete a trade. The broker service module 230 also receives quotes from the quote service 240, discussed below. The broker service module 230 attempts to execute a trade 282 by matching incoming quotes to orders or to other quotes stored by the order book service module 142 in the order book. Note that for purposes of trade execution 282, quotes are treated by the exchange system 100 as if they were orders. Thus, when the broker service module 230 receives a quote that it cannot match to an existing order or quote, it sends the quote to the order book for storage with other unfilled quotes and orders. Preferably, quotes differ from regular orders in that a quote may be two sided, having a bid and an offer price, and that each market-maker may only have one quote per product in the system. To facilitate the order matching process of trade execution 282, the broker service module 230 has direct access to orders stored in the order book by the order book service module 142. Preferably, when the incoming order is matched to an existing quote supplied by the quote service module 240, the broker service module 230 provides the quote service module 240 with details of the trade. The quote service module 240 manages the quotes supplied by market-makers via client application service module 210. The quote service module 240 submits the quotes to the broker service module 230 for execution. The quote service module 240 ensures that each individual market-maker has only one quote per product in the system at any given time.

46
When a market-maker enters a new quote on a product for which he already has an outstanding quote, the quote service module preferably determines whether there is already an existing quote in the system for that market-maker and, if so, informs the broker service module 230 that the pre-existing quote is to be cancelled. The quote service module 240 submits the new quote to the broker service module 230 only after it has received acknowledgement from the broker service module 230 that the pre-existing quote has been cancelled. The broker service module 230 issues fill reports to notify various other modules, and ultimately the trading entities, that the trade was executed. Upon notification of a fill 284 from the broker service module 230 (or the order book module), the quote service module 240 informs the quote object 250. In turn, the market-maker is notified of the fill via the exchange's reporting system. The quote service module 240 also cancels or updates a market-maker quote upon receiving a request from the originating market-maker by submitting the request to the broker service 230. The quote service module performs this by first informing broker service module 230 that the pre-existing quote has been cancelled. The broker service module 230 then removes the quote from the order book and confirms to the quote service 240 that the quote has been cancelled. The quote service 240 then submits the new quote (if one exists) to the broker service module 230. CBOE's figure also shows a preferred sequence of events and messages. Market-Makers log into a client application server module 210 and access the user service module 260. The market-maker communicates with the user service module 260 through a terminal, such as a workstation or wireless handheld unit. As shown by line 270, trading parameters, or quote parameters, are sent to the user service module 260. Upon initialization of the quote service, or upon login of a new market-maker, various trading parameters are provided to the quote service module 240 as shown by line 271. The trading parameters may include a risk threshold, a quote regeneration indicator, a quote regeneration increment, a quote modification indicator, and a quote modification increment. The parameters may include numerous sets of thresholds, indicators, and increments, preferably one such set for each class for which the market-maker is providing quotes. The quote service module 240 receives quotes from market-makers as shown by line 272, and provides these quotes to the quote objects 250, 252, as shown by update lines 273, 274, and to the broker service module 230 as shown by line 276. As mentioned above, the quote service module 240 will not forward updated quotes (as opposed to new quotes) to the broker service module 230 before first canceling old quotes. Orders received by the client application server 210 are routed to the order handling service 220 as shown by line 278. The order is then forwarded to the appropriate broker service 230 as shown by line 280. The broker service module 230 attempts to execute every order or quote received with the best order (or quote) in the book as shown by line 282. When a trade is executed, a fill report is issued to the quote service module 240 as shown by line 284. The quote service module 240 then analyzes the trade and determines whether the market-maker's risk threshold has been exceeded, as shown by line 286. The threshold test will be described in further detail below. A fill report is sent to the quote object 250 as shown by line 288. The quote object 250 then informs market-maker of the fill through the use of a trade report service module. In addition, at steps 286 and 287, the quote service module may modify quotes in response to the trade in accordance with the market-maker's trading parameters, as discussed below. The quote service module then reports the new quotes to the broker service module 230 as shown by line 290. The broker service 230 acknowledges the quote updates as shown by line 292. If the broker service 230 has already processed additional trades against the original quote, then the broker service module 230 would respond with a "too late to cancel" message. Once the update acknowledge has been received, the quote service module 240 updates the quote objects 250, 252, as shown by lines 294, 296. The quote objects then inform the market-maker that its quotes have been updated.
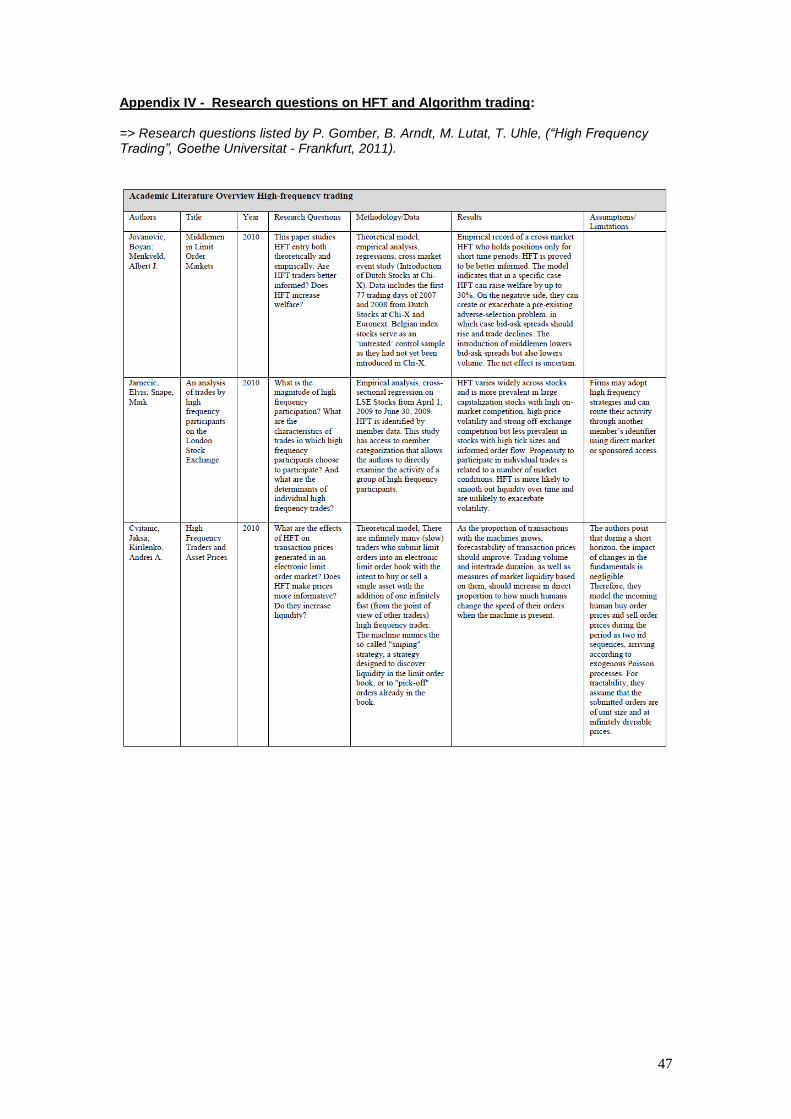
47
Appendix IV - Research questions on HFT and Algorithm trading: => Research questions listed by P. Gomber, B. Arndt, M. Lutat, T. Uhle, (“High Frequency Trading”, Goethe Universitat - Frankfurt, 2011).

48

49

50
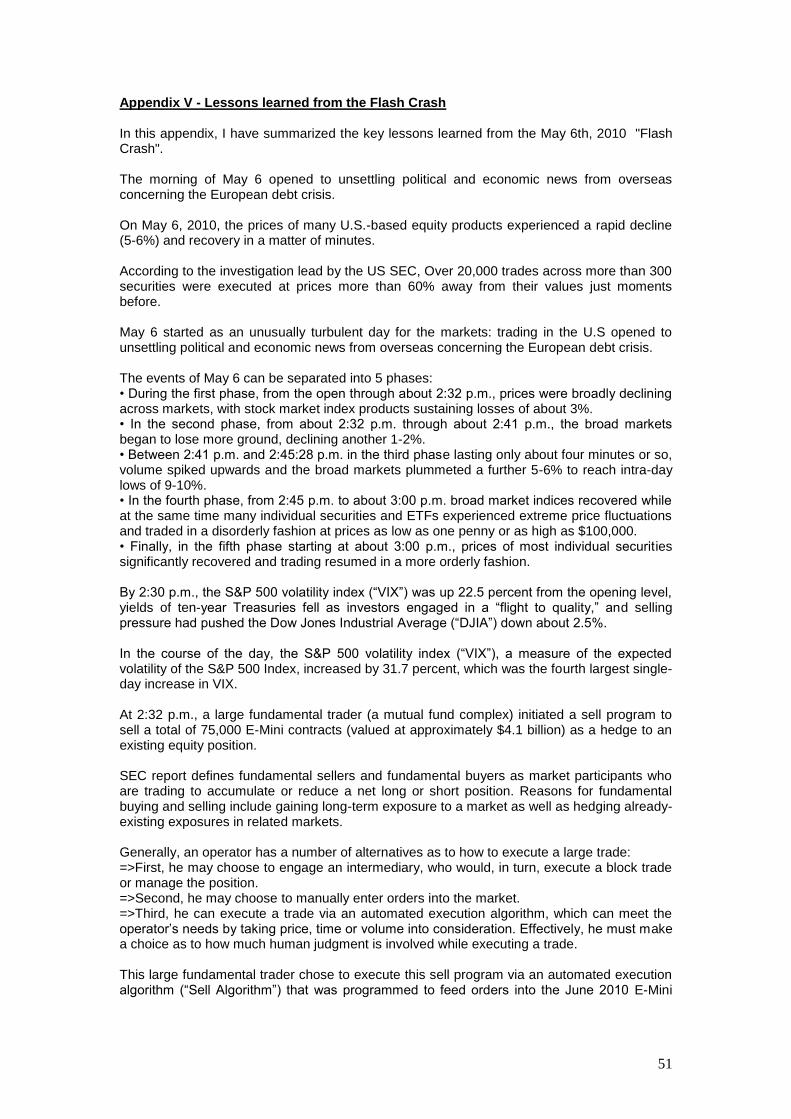
51
Appendix V - Lessons learned from the Flash Crash In this appendix, I have summarized the key lessons learned from the May 6th, 2010 "Flash Crash". The morning of May 6 opened to unsettling political and economic news from overseas concerning the European debt crisis. On May 6, 2010, the prices of many U.S.-based equity products experienced a rapid decline (5-6%) and recovery in a matter of minutes. According to the investigation lead by the US SEC, Over 20,000 trades across more than 300 securities were executed at prices more than 60% away from their values just moments before. May 6 started as an unusually turbulent day for the markets: trading in the U.S opened to unsettling political and economic news from overseas concerning the European debt crisis. The events of May 6 can be separated into 5 phases: • During the first phase, from the open through about 2:32 p.m., prices were broadly declining across markets, with stock market index products sustaining losses of about 3%. • In the second phase, from about 2:32 p.m. through about 2:41 p.m., the broad markets began to lose more ground, declining another 1-2%. • Between 2:41 p.m. and 2:45:28 p.m. in the third phase lasting only about four minutes or so, volume spiked upwards and the broad markets plummeted a further 5-6% to reach intra-day lows of 9-10%. • In the fourth phase, from 2:45 p.m. to about 3:00 p.m. broad market indices recovered while at the same time many individual securities and ETFs experienced extreme price fluctuations and traded in a disorderly fashion at prices as low as one penny or as high as $100,000. • Finally, in the fifth phase starting at about 3:00 p.m., prices of most individual securities significantly recovered and trading resumed in a more orderly fashion. By 2:30 p.m., the S&P 500 volatility index (“VIX”) was up 22.5 percent from the opening level, yields of ten-year Treasuries fell as investors engaged in a “flight to quality,” and selling pressure had pushed the Dow Jones Industrial Average (“DJIA”) down about 2.5%. In the course of the day, the S&P 500 volatility index (“VIX”), a measure of the expected volatility of the S&P 500 Index, increased by 31.7 percent, which was the fourth largest single-day increase in VIX. At 2:32 p.m., a large fundamental trader (a mutual fund complex) initiated a sell program to sell a total of 75,000 E-Mini contracts (valued at approximately $4.1 billion) as a hedge to an existing equity position. SEC report defines fundamental sellers and fundamental buyers as market participants who are trading to accumulate or reduce a net long or short position. Reasons for fundamental buying and selling include gaining long-term exposure to a market as well as hedging already-existing exposures in related markets. Generally, an operator has a number of alternatives as to how to execute a large trade: =>First, he may choose to engage an intermediary, who would, in turn, execute a block trade or manage the position. =>Second, he may choose to manually enter orders into the market. =>Third, he can execute a trade via an automated execution algorithm, which can meet the operator’s needs by taking price, time or volume into consideration. Effectively, he must make a choice as to how much human judgment is involved while executing a trade. This large fundamental trader chose to execute this sell program via an automated execution algorithm (“Sell Algorithm”) that was programmed to feed orders into the June 2010 E-Mini

52
market to target an execution rate set to 9% of the trading volume calculated over the previous minute, but without regard to price or time. 0n May 6, when markets were already under stress, the Sell Algorithm chosen by the large trader to only target trading volume, and neither price nor time, executed the sell program extremely rapidly in just 20 minutes. This sell pressure was initially absorbed by: • High frequency traders (“HFTs”) and other intermediaries8 in the futures market; • Fundamental buyers in the futures market; and • Cross-market arbitrageurs who transferred this sell pressure to the equities markets by opportunistically buying E-Mini contracts and simultaneously selling products like SPY, or selling individual equities in the S&P 500 Index. The combined selling pressure from the Sell Algorithm, HFTs and other traders drove the price of the E-Mini down approximately 3% in just four minutes from the beginning of 2:41 p.m. through the end of 2:44 p.m. Lacking sufficient demand from fundamental buyers or cross-market arbitrageurs, HFTs began to quickly buy and then resell contracts to each other – generating a “hot-potato” volume effect as the same positions were rapidly passed back and forth. Between 2:45:13 and 2:45:27, HFTs traded over 27,000 contracts, which accounted for about 49 percent of the total trading volume, while buying only about 200 additional contracts net. Buy-side market depth in the E-Mini fell to about $58 million, less than 1% of its depth from that morning’s level. As liquidity vanished, the price of the E-Mini dropped by an additional 1.7% in just these 15 seconds. This sudden decline in both price and liquidity may be symptomatic of the notion that prices were moving so fast, fundamental buyers and cross-market arbitrageurs were either unable or unwilling to supply enough buy-side liquidity. According to the SEC investigation, between 2:32 p.m. and 2:45 p.m., as prices of the E-Mini rapidly declined, the Sell Algorithm sold about 35,000 E-Mini contracts (valued at approximately $1.9 billion) of the 75,000 intended. During the same time, all fundamental sellers combined sold more than 80,000 contracts net, while all fundamental buyers bought only about 50,000 contracts net, for a net fundamental imbalance of 30,000 contracts. This level of net selling by fundamental sellers is about 15 times larger compared to the same 13-minute interval during the previous three days, while this level of net buying by the fundamental buyers is about 10 times larger compared to the same time period during the previous three days. Automated trading systems used by many liquidity providers temporarily paused in reaction to the sudden price declines observed during the first liquidity crisis. These built-in pauses are designed to prevent automated systems from trading when prices move beyond pre-defined thresholds in order to allow traders and risk managers to fully assess market conditions before trading is resumed. As in many markets, after their trading systems were automatically paused, individual market participants had to assess the risks associated with continuing their trading: =>whether observed severe price moves could be an artifact of erroneous data; =>the impact of such moves on risk and position limits; =>impacts on intraday profit and loss (“P&L”); =>the potential for trades to be broken, leaving their firms inadvertently long or short on one side of the market; =>the ability of their systems to handle the very high volume of trades and orders they were processing that day. =>because prices simultaneously fell across many types of securities, the potential of occurrence of a cataclysmic event of which they were not yet aware, and that their strategies were not designed to handle. A second liquidity crisis occurred in the equities markets at about 2:45 p.m.

53
Even though after 2:45 p.m. prices in the E-Mini and SPY were recovering from their severe declines, sell orders placed for some individual securities and ETFs found reduced buying interest, which led to further price declines in those securities. Over 98% of all shares were executed at prices within 10% of their 2:40 p.m. value. By approximately 3:00 p.m., most securities had reverted back to trading at prices reflecting true consensus values. Nevertheless, during the 20 minute period between 2:40 p.m. and 3:00 p.m., over 20,000 trades (many based on retail-customer orders) across more than 300 separate securities, including many ETFs, were executed at prices 60% or more away from their 2:40 p.m. prices. SEC investigation underlines that HFTs in the equity markets, who normally both provide and take liquidity as part of their strategies, traded proportionally more as volume increased, and overall were net sellers in the rapidly declining broad market along with most other participants. Result is that One that under stressed market conditions, the automated execution of a large sell order can trigger extreme price movements, especially if the automated execution algorithm does not take prices into account. Moreover, the interaction between automated execution programs and algorithmic trading strategies can quickly erode liquidity and result in disorderly markets. As the events of May 6 demonstrate, especially in times of significant volatility, high trading volume is not necessarily a reliable indicator of market liquidity. May 6 was also an important reminder of the inter-connectedness of derivatives and securities markets, particularly with respect to index products. Another key lesson from May 6 concerns the way of implement “trading pause” in extreme events. While the withdrawal of a single participant may not significantly impact the entire market, a liquidity crisis can develop if many market participants withdraw at the same time. SEC investigations also underlined that market participants’ uncertainty about when trades will be broken can affect their trading strategies and willingness to provide liquidity. SEC investigations also underlined that E-Mini market and SPY present an inter-connection and differences in their patterns attributed to the domination of HFT in the E-Mini market. According to SEC report, a closer examination of the E-Mini order book offers additional evidence that in the very short term liquidity dynamics in the E-Mini differed somewhat from that in SPY. Between 9:30 a.m. to 10:00 a.m., the average for the E-Mini is approximately 100,000 contracts (about $5.5 billion), and the average for SPY is approximately 2.5 million shares (about $275 million). By 2:40 p.m., buy-side resting orders in the E-Mini had already declined to less than 20% of their morning average. By way of comparison, at 2:40 p.m. buy-side resting orders in the SPY were about 75% of the morning average. Then, over the next few minutes buy-side resting orders in the E-Mini were rapidly depleted whereas resting orders in SPY remained at between 20% and 40% of its morning average until 2:50 p.m., when they fell to about 9%. In conclusion, SEC found that Buy-side liquidity in the E-Mini declined significantly faster than in SPY. However, buy-side liquidity in the E-Mini order book was quickly refilled during the 5-second pause and aggressive buy-side orders began to lift prices as soon as the trading resumed. In comparison, it was sell-side depth in SPY that nearly vanished at 2:46 p.m. while the buy-side depth remained steady. In summary, since the E-Mini and SPY both track the same set of S&P 500 stocks, cross-market arbitrage between these two products kept their prices closely aligned during their rapid declines. However, in the moments before prices of the E-Mini and SPY both hit their intra-day lows, the E-Mini suffered a significant loss of liquidity during which buy-side market depth was not able to keep pace with sell-side pressure. Four minutes later, when prices in the E-Mini and SPY were recovering, buy-side market depth for SPY reached its daily low.

54
In order to assess how the liquidity shock may have propagated across securities and markets on May 6, SEC staff spoke with 15 cross-market trading firms that collectively represented net buying of more than 100,000 June 2010 E-Mini contracts (approximately $5.6 billion in notional value) between 2:00 p.m. and 3:00 p.m. on May 6. Cross-market strategies primarily focus on the contemporaneous trading of securities-related products in the futures and securities markets. The objective of these strategies is to capture temporary price differences between any two related products, but with limited or no exposure to subsequent price moves in those products. The specific nature of cross-market trading strategies varies widely. Some firms focus on “one-way” strategies by acting as a liquidity provider (i.e., trading passively by submitting non-marketable resting orders) primarily in one product, and then hedging by trading another product (often by submitting marketable limit or market orders to trade aggressively in the hedging product). Other firms run “two-way” strategies that provide liquidity in multiple products and then hedge as necessary in another product. Firms interviewed reported that the products they most consistently used for cross-market trading strategies on May 6 and other trading days were the E-Mini, SPY, and the basket of underlying stocks in the S&P 500 Index. Consistent with the E-Mini’s very high trading volume, most of the interviewed cross-market trading firms reported that they viewed the E-Mini as the primary price discovery product for the S&P 500 Index. While some firms noted that SPY has increased in importance in recent years as its trading volume has expanded, the firms agreed that price changes in the E-Mini generally lead price changes in SPY and in the basket of underlying stocks. Nearly all of the interviewed large net buyers in the E-Mini market, which were engaged in cross-market arbitrage strategies, reported that during the decline in prices of the E-Mini and SPY, the E-Mini was relatively cheaper than either SPY or baskets of individual securities. These same firms reported that they therefore purchased the E-Mini and contemporaneously sold SPY, baskets of individual securities, or other equity index products. To better understand this reduction in liquidity and how it affected market participants, SEC conducted a series of extensive interviews across a wide range of firms that typically provide market liquidity, beyond those involved in cross-market arbitrage, including: • traditional equity market makers; • high-frequency traders; • internalizers; and • options market makers. SEC defines characteristics often attributed to proprietary firms engaged in high frequency trading as: (1) The use of high-speed and sophisticated computer programs for generating, routing, and executing orders; (2) The use of co-location services and individual data feeds offered by exchanges and others to minimize network and other types of latencies; (3) The very short time-frames for establishing and liquidating positions; (4) The submission of numerous orders that are cancelled shortly after submission; (5) The ending the trading day in as close to a flat position as possible (that is, not carrying significant, unhedged positions overnight). Through May 10th, SEC investigation underlines that 17 HFT firms averaged 43.8% of total dollar volume on the public quoting markets. Their trading was divided between 51.5% liquidity-taking buys and sells (aggressive trading – generally taking bids and lifting offers) and 48.5% liquidity-providing buys and sells (passive trading – generally posting bids and offers). As a percentage of total market dollar volume, the activity for these 17 HFT firms increased in the period from 2:00 p.m. through 2:45 p.m. to a high of 50.3%, before sharply falling to 36.6% in the period from 2:46 through 3:00 p.m. Notably, the 17 HFT firms escalated their aggressive selling more significantly (reaching a total of $9.3 billion) than any other category of trading during the rapid price decline in the period ending 2:45 p.m. A portion of
55
this aggressive selling could be attributable to cross-market strategies in which the firms were contemporaneously buying futures products. NYSE utilizes a hybrid floor/electronic trading model, unlike most other markets today which are fully electronic. SEC has also analyzed the impact of the LRP’s tools on the May 10th events. The liquidity replenishment points (LRPs) are intended to act as a “speed bump” and to dampen volatility in a given stock by temporarily converting from an automated market to a manual auction market when a price movement of sufficient size is reached. Trading on NYSE in that stock will “go slow” and automatic executions will cease for a time period ranging from a fraction of a second to a minute or two to allow the Designated Market Maker (“DMM”) to solicit and/or contribute additional liquidity before returning to an automated market. LRP limits vary according to each security’s share price and average daily volume within specified ranges, generally falling between 1% and 5% of share price. Most LRPs either resolve themselves within a second, when additional buy or sell interest brings prices back within the LRP limits, or are resolved just as quickly by a DMM’s algorithm that automatically sets a new resumption price according to buy and sell interest. Once the LRP is resolved the quotes are no longer labeled as “slow” and automated executions resume. In some cases a DMM’s algorithm will be used to determine the resumption price at which automated quoting and executions can continue. In other cases, when additional liquidity is needed beyond what the DMM’s algorithm is programmed to supply, the resumption price is determined manually by the DMM in a process that can take from a few seconds to a minute or more. Many securities triggered LRPs multiple times on the afternoon of May 6, and though 75% of all events were resolved in less than 1 second. Between 2:30 p.m. and 3:00 p.m., more than 1000 securities triggered LRP events lasting more than 1 second, compared to a “normal” day average of only 20-30 such events. According to the market participants interviewed by SEC, their systems are programmed to automatically adjust for slow quotes on NYSE and will route orders to other exchanges as needed. Market participants also confirmed that the fact so many LRPs were being triggered further underscored the severity of market conditions as they were unfolding, and that this additional “evidence” played into their decisions to reduce liquidity, pause trading, or withdraw from the markets. Regarding this information, SEC addressed two questions: => First, is there evidence that a substantial percentage of trades executed elsewhere might have been otherwise executed against liquidity that appeared on NYSE during the LRP? => Second, during the LRP and when other exchanges were permitted to route around the NYSE, is there evidence of liquidity flowing into NYSE. That is, does NYSE appear to be drawing away and “trapping” additional liquidity from other exchanges during the LRP? To investigate on a failure in liquidity, SEC obtained NYSE OpenBook Ultra and NYSE ArcaBook data, Nasdaq ModelView and similar data. These sources provided minute-by-minute “snapshots” of the order book, for all listed securities. These exchanges, combined, reflect approximately 90% of the executions on exchanges on May 6. These data allowed SEC to calculate the number of shares represented by buy and sell limit orders on these exchanges at a wide range of price points. SEC also measured the price points in terms of the relative distance from the midpoint of the National Best Bid and Offer (NBBO). These data provide a detailed picture of the available liquidity for each security, throughout the day. NBBO is a term used in United States Securities and Exchange Commission regulations. Brokers are required to execute customer trades at the best available ask price when buying securities, and the best available bid price when selling securities. Order book and order audit trail data were used by SEC to look for a general relationship between price-changes and liquidity-changes for approximately 5,000 non-ETF securities.

56
To look at liquidity changes, SEC sorted each of the securities into quintiles based on the extent to which the buy-side order book for that security contracted on May 6. As a measure of the extent of the contraction, SEC used the minimum buy-side depth observed in any minute on that day, divided by its median depth on that day. In addition, because of possible systematic differences between securities with typically different sized order books they sorted these securities into quintiles based on the respective median of their buy-side depths within 500 basis points (“bp”) of the mid-quote, as measured in one minute increments on May 6. Crossing the quintiles based on the typical depth of the order book with quintiles based on the contraction of the order book creates 25 categories spanning 4,920 non-ETF securities. For the securities in each of these categories, SEC analysis presents the average and the median intraday stock price drop, measured as the open to low, and the number of securities in the category. The results show that, except for securities in the lowest 20% of typical buy-side depth, drops in price become increasingly more severe with ever-larger drops in liquidity. The most severe average price drop of 39.8% occurred in the 22 securities that had both the greatest intraday average of buy-side depth and the worst decline in that depth. As SEC regarding Flash trading events of May 6, Zhang (2010) addresses two questions: (1) Does HFT decrease or increase stock price volatility? (2) Does HFT aid or hinder the market’s incorporation of news about firm fundamentals into stock prices? He find that high-frequency trading is positively correlated with stock price volatility after controlling for firm fundamental volatility and other exogenous determinants of volatility. The positive correlation is stronger among the top 3,000 stocks in market capitalization and among stocks with high institutional holdings. The positive correlation is also stronger during periods of high market uncertainty. Zhang also supports the conclusion that HFT hinders the market’s ability to incorporate information about firm fundamentals into asset prices, as high-frequency trading causes stock prices to overreact to fundamental news. In conclusion, we can underline SEC and scholar researches regarding the assumption that HFT seems to interfere in market’s liquidity and volatility. Moreover, HFT seems also represent a financial innovation by his impact in the time paradigm of the financial world (with probable influence on the other economics markets).

57
Appendix VI - CFTC Audit Trail CFTC also has defined the key specification of an audit trail regarding automated trading:

58
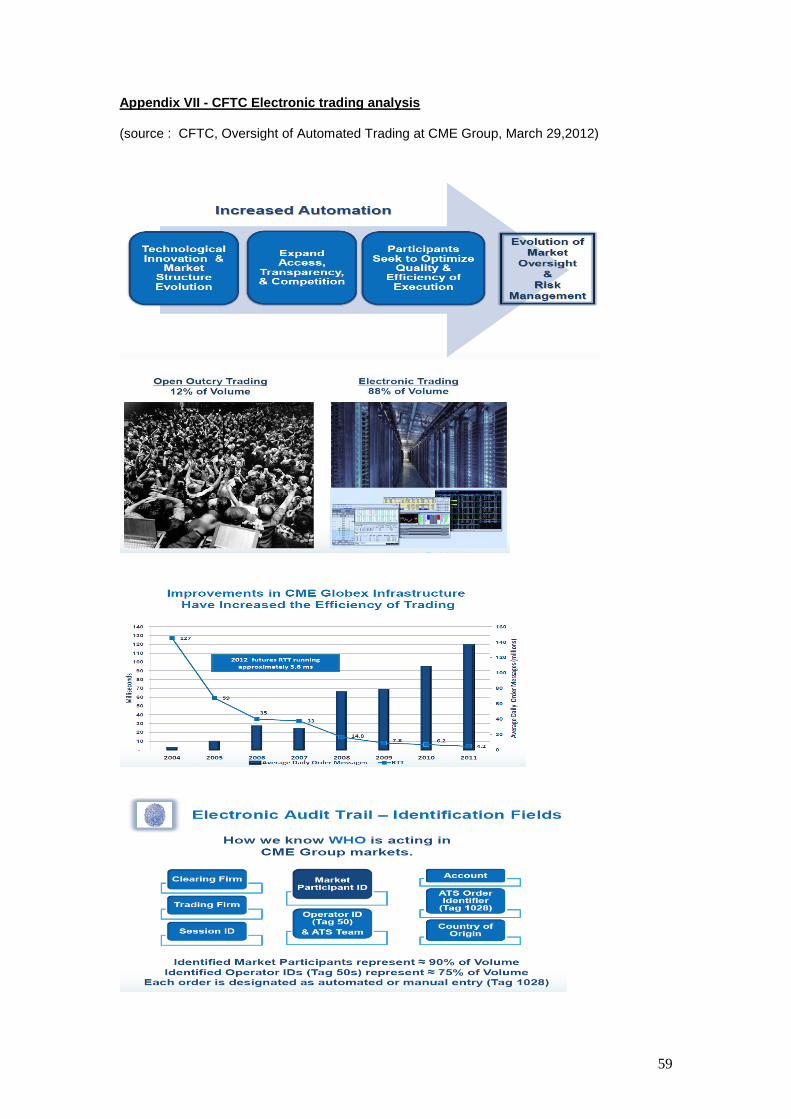
59
Appendix VII - CFTC Electronic trading analysis (source : CFTC, Oversight of Automated Trading at CME Group, March 29,2012)

60

61
(source : Oversight of Automated Trading Systems, ICE, March 29, 2012 - http://www.cftc.gov/ucm/groups/public/@aboutcftc/documents/file/tacpresentation032912_ice.pdf)
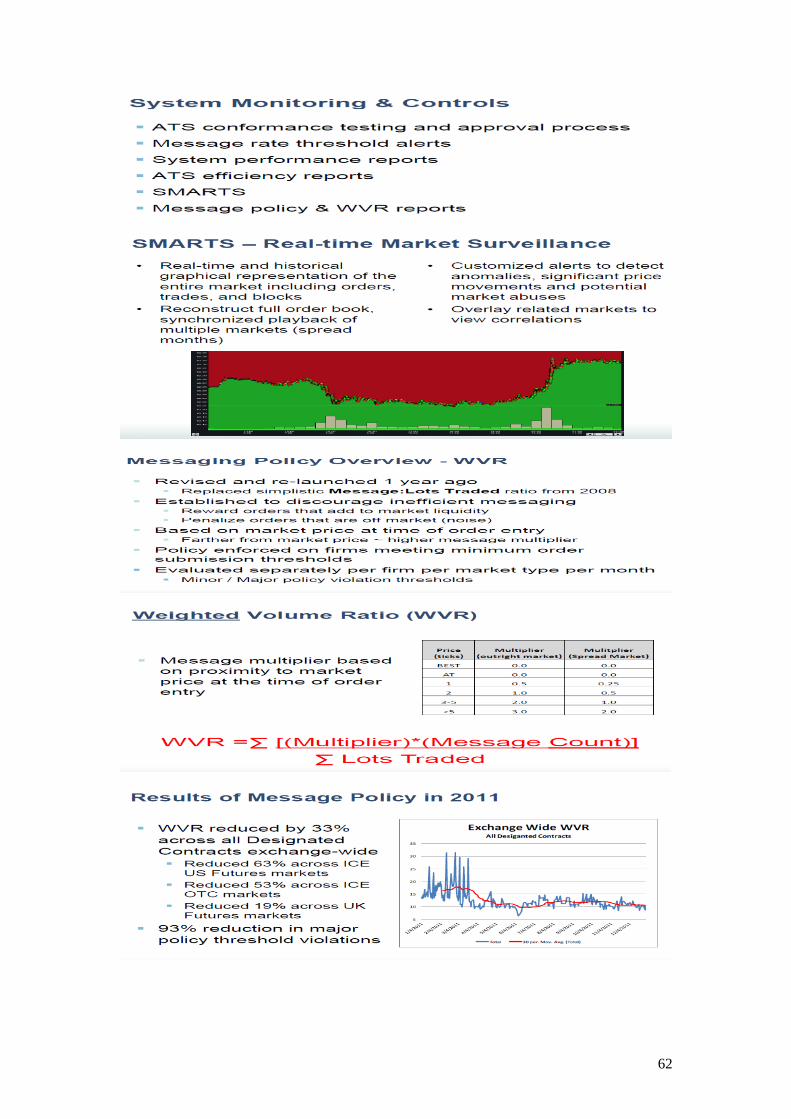
62

63
Appendix VIII - HFT global network and market data source: http://www.hiberniaatlantic.com/gfn.html
24,000 Kilometers of Fiber Optic Cable.
Access to over 120 key financial cities around the globe.
Connection between London and New York City, with <60 ms latency, the fastest in transatlantic cable history.
High Frequency Trading Locations (http://www.motherjones.com/kevin-drum/2011/04/map-day-high-frequency-trading-locations) A. D. Wissner-Gross and C. E. Freer investigate where you should open a high-frequency trading facility given that light-speed propagation delays are a key factor in arbitraging trades between two exchanges. After much fiddling with partial differential equations, they come up with this map, which shows "Optimal intermediate trading node locations (small circles) for all pairs of 52 major securities exchanges (large circles)....from 2008 data reported by the World Federation of Exchanges.

64
http://www.marketdatapeaks.com/about
his site is designed to provide unique market data peak information to IT professionals. The message data rates presented on this site are processed and updated through a single Exegy Ticker Plant appliance residing in a colocation facility. The rates shown are updated every minute and show the actual one-second peak within that minute.
The data rates are aggregated from the following feeds: Feed Exchange / Source
BATS BYX BATS Global Markets BATS BZX BATS Global Markets CME Fix/Fast Chicago Mercantile Exchange (CME) Direct Edge A Direct Edge Direct Edge X Direct Edge NASDAQ BBDS NASDAQ FINRA NASDAQ TDDS NASDAQ FINRA TotalView-ITCH 4.1 NASDAQ NASDAQ GIDS NASDAQ OMX UQDF NASDAQ UTP UTDF NASDAQ UTP NASDAQ OMDF NASDAQ UTP NYSE ArcaBook for Equities NYSE Euronext NYSE ARCA Options 3.0 NYSE Euronext NYSE ARCA Trades NYSE Euronext NYSE Ultrabook NYSE Euronext NYSE GIF NYSE Euronext NYSE Liffe US NYSE Euronext CQS Security Industry Automation Corp (SIAC) CTS Security Industry Automation Corp (SIAC) OPRA Security Industry Automation Corp (SIAC)
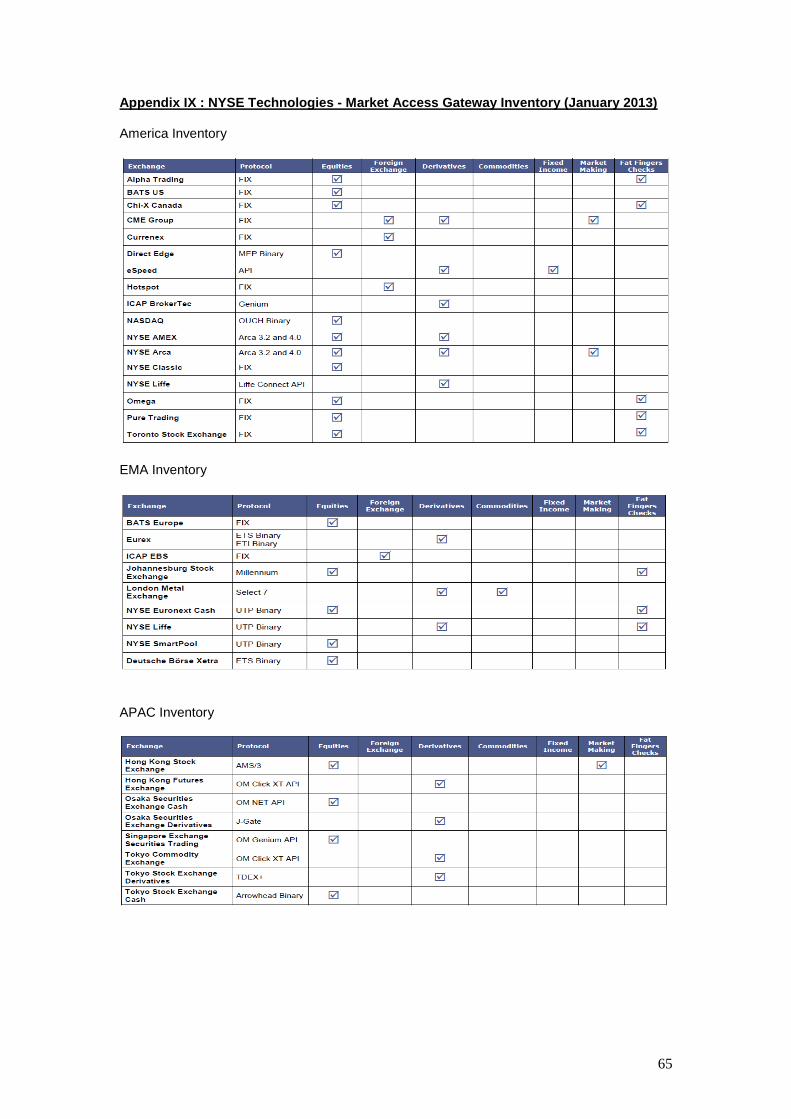
65
Appendix IX : NYSE Technologies - Market Access Gateway Inventory (January 2013) America Inventory
EMA Inventory
APAC Inventory