Heterogeneous features and model selection for event-based media classification
8
Heterogeneous Features and Model Selection for Event-Based Media Classification Xueliang Liu EURECOM Sophia-Antipolis, France [email protected] Benoit Huet EURECOM Sophia-Antipolis, France [email protected] ABSTRACT With the rapid development of social media sites, a lot of user generated content is being shared in the Web, leading to new challenges for traditional media retrieval techniques. An event describes the happening at a specific time and place in real-world, and it is one of the most important cues for people to recall past memories. The reminder value of an event makes it extremely helpful in organizing human life. Thus, organizing media by events has recently drawn much attention within the multimedia research community. In this paper, we focus on two fundamental problems related to event based social media analysis: the study of feature im- portance for modeling the relation between events and me- dia, and how to deal with missing and erroneous metadata often present in social media data. These issues are studied within an event-based media classification framework. Dif- ferent learning approaches are employed to train the event models on different features. We find, through experiments on a large set of events, that the best discriminant features are tags, spatial and temporal feature. We address the miss- ing value problem by extending the feature with an extra attribute to indicate if the values are missing. Promising results are achieved demonstrating the effectiveness of the proposed method. Categories and Subject Descriptors H.3.3 [Information Storage and Retrieval]: Informa- tion Search and Retrieval; H.3.1 [Content Analysis and Indexing]: miscellaneous General Terms Algorithms,Design,Performance, Experimentation, Measure- ment,Reliability Keywords Events, social media, classification, missing value, feature importance 1. INTRODUCTION Recent years have witnessed the rapid development of electronic capturing devices and social media web services, which has made it easy for people to capture and share media data online. Nowadays, there is exponential growth of social Copyright is held by the author/owner(s). ICMR’13, April 16–20, 2013, Dallas, Texas, USA. ACM 978-1-4503-2033-7/13/04. media available online in the form of images and videos. The Web 2.0 provides users facilities to share and access data, while its advent demands effective data management and indexing technologies. How to search for media efficiently and effectively, how to leverage big data to solve the large scale problems in industry and research communities, are still open challenges. An event describes a real world happening and is defined according to Who?, What?, When? and Where?. Recently, organizing media data by events has drawn much attention in the multimedia research community. Events can serve as powerful instruments to organize media, thanks to their in- trinsically multi-faceted nature. Furthermore, it is the most natural way for human beings to store and recall their mem- ories. Associating media to events and modeling events is an area that has started to receive considerable attention. For example, in [24], the authors proposed a method to retrieve media from the same events on given event record samples, and they formulate the similarity of events and media data with visual and time features. [10] and [22] studied how to categorize media data by event. In [10], a naive Bayes classifier is built for each event using text and temporal fea- tures, to categorize social media data by events. The au- thors of [22] focused on how to assign media data to events. They modeled the similarity of events and media data by multimodal features. From this fruitful research, it can be concluded that events are an effective way to organize the content and could help facilitate the search and retrieval of social media data. However, there are still some fundamental questions which are not addressed by previous work. While work to model the similarity of social media on the basis of text/time, or the similarity between events and social media with respect to time, location or text features have been conducted, the importance and effectiveness of those features has not been studied in details until now. Since event and social media data is very sparse, weak representative features may de- grade the performance of a proposed system. In addition, missing attributes are unavoidable in user generated data. As an example, location is very effective to measure the sim- ilarity of events and media data, but in Flickr, only about 20% of uploaded media is labeled with a geo tag. Due to lim- ited availability, location information is often not taken into consideration [24] and in other works, the data with missing values is simply discarded from further analysis [10]. In this paper, we report the study of both the feature selection and missing value handling in the scope of event based media categorization. In details, we address the prob-
Transcript of Heterogeneous features and model selection for event-based media classification

Heterogeneous Features and Model Selection forEvent-Based Media Classification
Xueliang LiuEURECOM
Sophia-Antipolis, [email protected]
Benoit HuetEURECOM
Sophia-Antipolis, [email protected]
ABSTRACTWith the rapid development of social media sites, a lot ofuser generated content is being shared in the Web, leadingto new challenges for traditional media retrieval techniques.An event describes the happening at a specific time andplace in real-world, and it is one of the most important cuesfor people to recall past memories. The reminder value ofan event makes it extremely helpful in organizing humanlife. Thus, organizing media by events has recently drawnmuch attention within the multimedia research community.In this paper, we focus on two fundamental problems relatedto event based social media analysis: the study of feature im-portance for modeling the relation between events and me-dia, and how to deal with missing and erroneous metadataoften present in social media data. These issues are studiedwithin an event-based media classification framework. Dif-ferent learning approaches are employed to train the eventmodels on different features. We find, through experimentson a large set of events, that the best discriminant featuresare tags, spatial and temporal feature. We address the miss-ing value problem by extending the feature with an extraattribute to indicate if the values are missing. Promisingresults are achieved demonstrating the effectiveness of theproposed method.
Categories and Subject DescriptorsH.3.3 [Information Storage and Retrieval]: Informa-tion Search and Retrieval; H.3.1 [Content Analysis andIndexing]: miscellaneous
General TermsAlgorithms,Design,Performance, Experimentation, Measure-ment,Reliability
KeywordsEvents, social media, classification, missing value, featureimportance
1. INTRODUCTIONRecent years have witnessed the rapid development of
electronic capturing devices and social media web services,which has made it easy for people to capture and share mediadata online. Nowadays, there is exponential growth of social
Copyright is held by the author/owner(s).ICMR’13, April 16–20, 2013, Dallas, Texas, USA.ACM 978-1-4503-2033-7/13/04.
media available online in the form of images and videos. TheWeb 2.0 provides users facilities to share and access data,while its advent demands effective data management andindexing technologies. How to search for media efficientlyand effectively, how to leverage big data to solve the largescale problems in industry and research communities, arestill open challenges.
An event describes a real world happening and is definedaccording to Who?, What?, When? and Where?. Recently,organizing media data by events has drawn much attentionin the multimedia research community. Events can serve aspowerful instruments to organize media, thanks to their in-trinsically multi-faceted nature. Furthermore, it is the mostnatural way for human beings to store and recall their mem-ories. Associating media to events and modeling events is anarea that has started to receive considerable attention. Forexample, in [24], the authors proposed a method to retrievemedia from the same events on given event record samples,and they formulate the similarity of events and media datawith visual and time features. [10] and [22] studied howto categorize media data by event. In [10], a naive Bayesclassifier is built for each event using text and temporal fea-tures, to categorize social media data by events. The au-thors of [22] focused on how to assign media data to events.They modeled the similarity of events and media data bymultimodal features. From this fruitful research, it can beconcluded that events are an effective way to organize thecontent and could help facilitate the search and retrieval ofsocial media data.
However, there are still some fundamental questions whichare not addressed by previous work. While work to modelthe similarity of social media on the basis of text/time, orthe similarity between events and social media with respectto time, location or text features have been conducted, theimportance and effectiveness of those features has not beenstudied in details until now. Since event and social mediadata is very sparse, weak representative features may de-grade the performance of a proposed system. In addition,missing attributes are unavoidable in user generated data.As an example, location is very effective to measure the sim-ilarity of events and media data, but in Flickr, only about20% of uploaded media is labeled with a geo tag. Due to lim-ited availability, location information is often not taken intoconsideration [24] and in other works, the data with missingvalues is simply discarded from further analysis [10].
In this paper, we report the study of both the featureselection and missing value handling in the scope of eventbased media categorization. In details, we address the prob-

lem of categorizing media data by events, while investigatinghow to select the representative features and to incorporatethe missing attributes in the system. The contributions ofthis paper are three-folds:
• To identify the most representative features; We studythe feature selection problems in event based mediaanalysis. We learn the event model using multimodalfeatures and find out that the most representative fea-tures are tags, location and time.
• To model the event accurately; We employ and com-pare different learning approaches to model the events.Our results highlight the effectiveness of the decisiontree based approach on heterogeneous data.
• To deal with missing attributes for some samples; Weuse a method inspired from the one presented in [15]to represent the feature with missing value, that is toadd an extended attribute to indicate if the value ismissing or not. Our result shows the benefits of thismissing attribute handling approach.
The rest of this paper is organized as follows; We reviewthe related work in Section 2. The approaches and featuresused to model events are described in Section 3. Experimen-tal results are presented in Section 4. Finally, the contribu-tions and future work are summarized in Section 5.
2. RELATED WORKIn the work presented here, we define an event as a pub-
lic happening taking place at a given location and timeinvolving several people. Last.FM and eventful are eventrepositories designed to help users sharing their experiencesand interests on the Web. These sites also host substantialamounts of user-contributed materials (e.g. photographs,videos, and textual content) for a wide variety of real-worldevents of different type and scale. How to mine the relationbetween events and social media data has gathered recentattention.
Events are important parts in our lives and as such manyof the documents uploaded to social media sites are capturedduring events. Classifying social media documents with re-spect to the events they originate from is thus a promisingapproach to better manage and organize the huge amount ofsocial media data. The problem of media categorization byevent was studied by [10, 22]. In [10], the authors studiedhow to exploit the social textual information produced byusers for classifying pictures into different event categories.They employed a naive Bayes classifier to model an event bytext and time features. In [22] the authors focused on howto assign media data to events, they modeled the similarityof events and media data by multimodal features, and useda rule-based approach to detect new events. Other thanmining the media metadata, visual content analysis is alsoinvolved to model events. In [24], a method was proposed toretrieve media from the same events on record samples. Theauthors formulate the similarity of events and media datawith visual and time features, and the problem was solvedusing the Local Sensitive Hashing approach under the map-reduce framework. In [17], a demonstration was proposedto categorize photos by events/sub-events based on visualcontent analysis.
Since many media are captured during events, the prob-lem of associating media data to its originating events is
also addressed by the research community. In [1], the au-thors proposed approaches to exploit the rich “context” as-sociated with social media content and applied clustering al-gorithms to identify events. [8] analyzed Twitter messagescorresponding to large scale media events to improve eventreasoning, visualization, and analytic. In [14], the authorsproposed a system to present the media content from livemusic events, assuming a serial of concerts by the same artistsuch as a world tour. By synchronizing the music clips withaudio fingerprint and other metadata, the system gives anovel interface to organize user-contributed content.
Other related research works focus on mining the eventspatterns from social media data. The Social Event Detec-tion Task in the MediaEval workshop focuses on discoveringevents and detecting media items that are related to eithera specific social event or an event-class of interest [18]. Asolution to this problems is proposed in [26] which studieshow to exploit the social interaction and other similaritybetween media data to detect events. [21] presented meth-ods to mine events and object from community photo col-lections using clustering approaches. In their system, thephotos are grouped according to several modalities (visualand textual features) and the clusters are classified as ob-jects or events according to their duration and users, basedon fact that events are usually characterized by a short du-ration. A very similar framework is proposed to classify theevents and landmarks in [19]. Furthermore, event based re-search also studies the problem of discovering events directlyfrom Twitter post [27, 23]. In [27], the authors studied howto employ a wavelet-based techniques to detect events fromTwitter stream. A similar method can be found in [6] todetect events from Flickr time series data. In [23], the au-thors investigate how to filter the tweets to detect seismicactivity as it happens. They considered each Twitter user asa sensor and applied Kalman filtering and particle filteringtechniques to estimating the centers of earthquakes and thetrajectories of typhoons.
It can be seen that previous event based social media anal-ysis studied the problem in two aspects: associating mediawith events and discovering events from social media stream.In theses works, many multimodal features, such as tag,time, location and visual features are exploited, and as aresult encouraging performance is achieved. The role eventscan play in organizing and managing media data is verified.However, there are still some fundamental questions whichare not addressed by these works. For examples, the impor-tance and effectiveness of individual multimodal features isnot studied. In addition, missing attributes are unavoidablein user generated data. Modeling data with missing valueis a common problem in data mining [11]. It is also a long-standing but not so well studied problem in the multimediacommunity. In [24, 10], the attributes with missing valuesare discarded since too hard to be modeled in the proposedapproach. In [15], an additional indicator is concatenatedto the feature vector to highlight missing data. As far as weknow, no prior work addresses this issue in event based socialmedia analysis. In this paper, we focus on feature selectionand deal with missing values, by extending the frameworkof event based social media categorization, proposed by [10].
3. OUR PROPOSALOur study is set within an event based social media clas-
sification framework. For each event in the dataset, we train

an event model using the photos originating from that event.To evaluate the effectiveness of different learning approachesand features for modeling events. We use KNN, SVM, De-cision Tree and Random Forest to learn the models basedon temporal (date and time), location (geo-coordinates), tag(annotations) and visual features for each event. Buildingmodels on an event basis allows adding new events withoutaffecting previously learned models and reduces the impactof the increase of events in the dataset. The positive ex-amples of an event are represented by the pictures originat-ing from the event, while the negative ones are randomlyselected from the pictures corresponding to the remainingevents in the dataset. Now, we shall briefly review the clas-sification algorithms under comparison, and then, detail thefeatures to be evaluated.
3.1 Classification algorithmTo evaluate the performance of different learning approaches
for modeling the events, we implement four approaches thatare popularly employed in social media analysis, listed be-low, to train the event models.
• K-Nearest Neighbor The K-Nearest Neighbor algo-rithm (KNN) is among the simplest of all classificationalgorithms: KNN is a type of instance-based learning;it classifies objects based on the k closest training ex-amples in the feature space. An object is classified bya majority vote over its neighbor’s classes, with the ob-ject being assigned to the class most common amongstits k nearest neighbors. Despite its simplicity, KNNhas been successful in a large number of classificationand regression problems. It is often successful in classi-fication situations where the decision boundary is veryirregular.
• Support Vector Machine Support Vector Machine(SVM) [5] is one of the most effective supervised clas-sification methods. Given a set of training examples,each marked as belonging to one of two categories, theSVM training algorithm builds a model that assignsnew examples into one category or the other, based onthe “margin maximization” strategy. An SVM modelis a representation of the examples as points in space,mapped so that the examples of the separate categoriesare divided by a clear gap that is as wide as possible.Support Vector Machines are very effective in high di-mensional spaces, and popularly used in practice dueto its better performance compared with some otherclassifiers [4].
• Decision Tree Decision tree (DT) [3] uses tree struc-ture to make a decision. A decision tree can be con-structed top-down using the information gain, whichmeasures each attribute’s discrimination power. It be-gins at the root node with some ancestor nodes deter-mined by the attribute with the highest informationgain, then attaches all examples where the attributevalues of the examples are identical to each node. Allsub-trees are built using recursion. Decision trees arecommonly used in operations research, specifically indecision analysis, to help identify a strategy most likelyto reach a goal.
• Random Forest Random forest [2] is an ensembleclassifier that consists of many decision trees and out-puts the class that is the mode of the classes output by
individual trees. Although it suffers from over-fittingwith noisy dataset, it is one of the most accurate learn-ing algorithms available which runs efficiently on largedatabases with thousands of input variables withoutvariable deletion.
3.2 Feature with missing valueAs an event is defined as “something happening at a given
place and time” in this paper, several features can easily bemapped to metadata or content available in photos. Thetime can be represented by the photos taken time, whilethe place is represented by the GPS metadata. The topicof events can be mined from the content of media, in theform of visual or textual features. Here are the four featuresinvestigated in our experiments:
• Temporal feature Time is one of the most key com-ponents of an event. The temporal feature used in thispaper is the photo taken time, which is represented asthe number of past seconds from Unix epoch. Thetaken time is compulsory in photo metadata.
• Location feature Nowadays, geographical metadatais a common component in social media data [12]. Weextract the GPS metadata, that is the latitude andlongitude coordinates, as the location feature. GPSinformation is not required in photos metadata. Tocope missing value, the method proposed in [15] is em-ployed: the feature vector is filled with zero if the valueis missing while we add binary flag to indicate avail-ability or not. The binary flag indicates whether thefeature value is missing or present. Experiments onKDD 2009 data show that this strategy improves thetest performances considerably [15].
• Tag Feature In Web 2.0 web services, tags are man-ually labeled by Internet users and have become aneffective way to organize, index and search media con-tent. Since tags appear distinctly in the metadata, weemploy the Boolean weighting schemes to measure theterm’s frequency of tags [16]. In detail, for each eventwe create a word vocabulary with the 200 most fre-quent tags and the tags in a photo are projected onthe vocabulary, creating a vector. Each dimension inthe vector corresponds to a separate term. If a termoccurs in the document, its value in the vector is 1,or 0 otherwise. Tag metadata is also not compulsoryand the same strategy as on location feature is used tohandle missing values for the tag feature. Hence, thetag feature is a 201-D vector.
• Visual Feature Visual features are also representa-tive for the photo content. In our work, we obtainmultiple types of low level visual the features thathas been popularly used in visual content analysis [7]such as: 64-D color histogram, 73-D edge histogramand 64 Gabor features. The three visual features areconcatenated into 201-D and normalized during pre-processing. Visual features are dense and without miss-ing values.
The various feature vectors representing each photo caneither be used separately or concatenated together in orderto learn the event model.
4. EXPERIMENTS
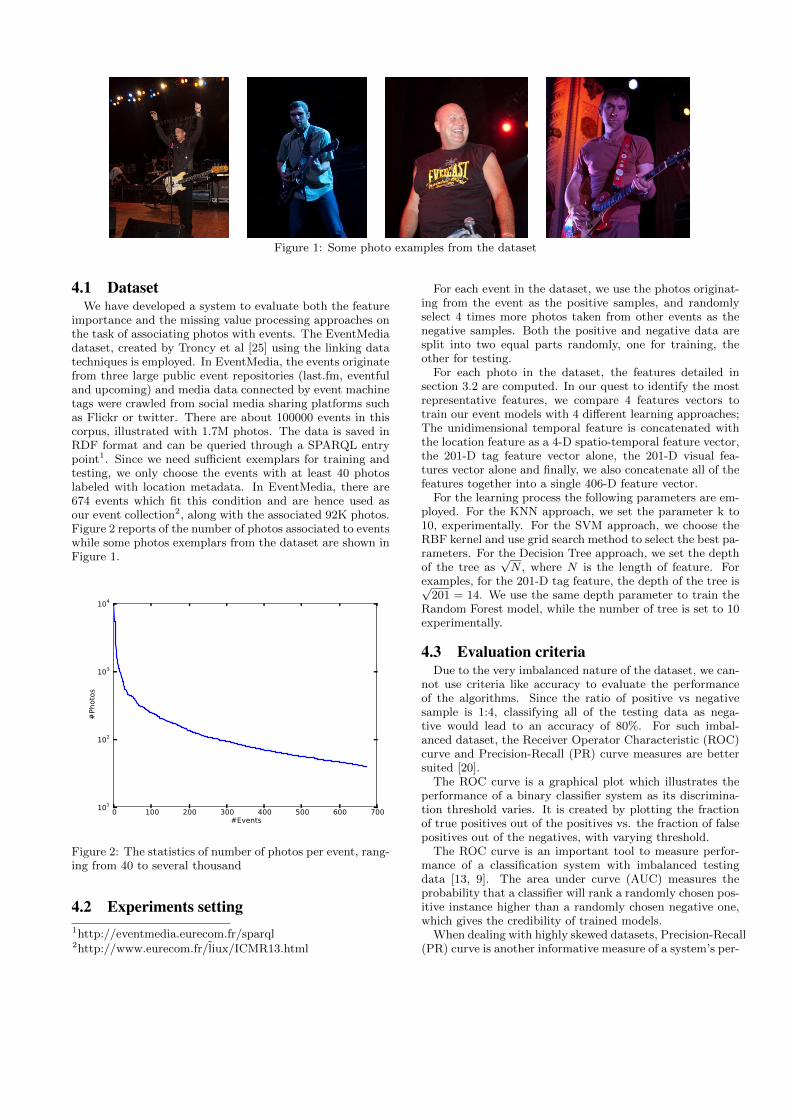
Figure 1: Some photo examples from the dataset
4.1 DatasetWe have developed a system to evaluate both the feature
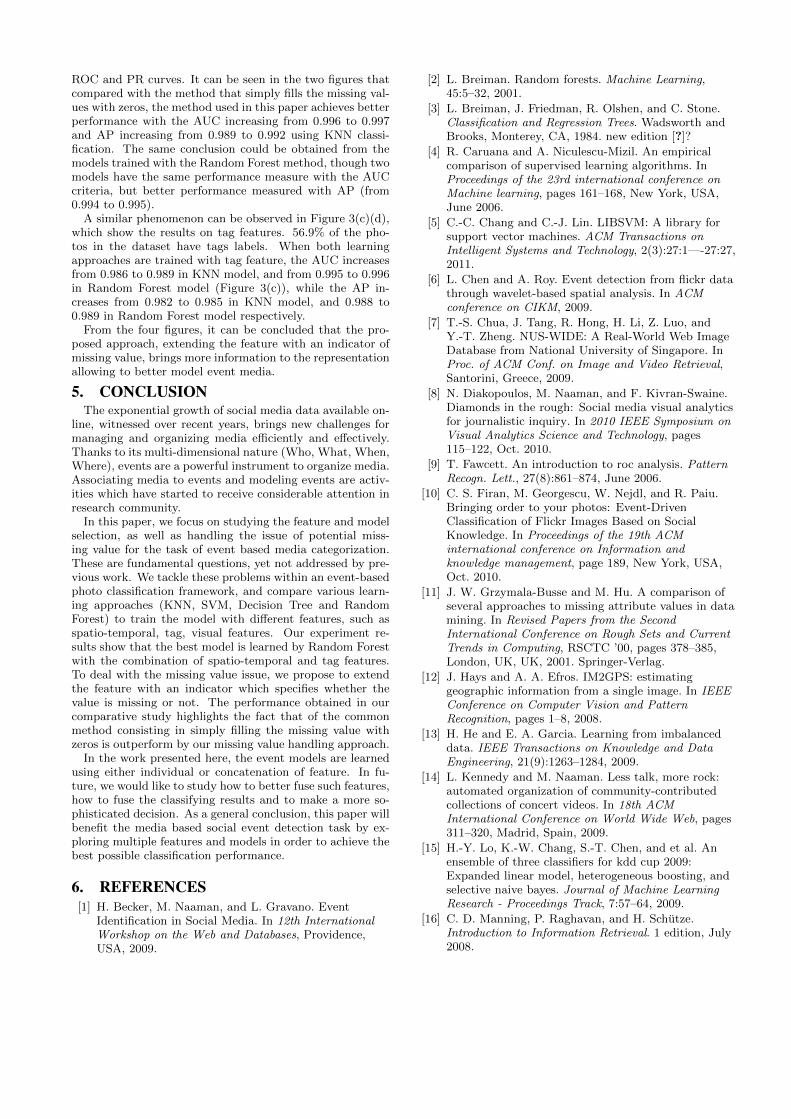
importance and the missing value processing approaches onthe task of associating photos with events. The EventMediadataset, created by Troncy et al [25] using the linking datatechniques is employed. In EventMedia, the events originatefrom three large public event repositories (last.fm, eventfuland upcoming) and media data connected by event machinetags were crawled from social media sharing platforms suchas Flickr or twitter. There are about 100000 events in thiscorpus, illustrated with 1.7M photos. The data is saved inRDF format and can be queried through a SPARQL entrypoint1. Since we need sufficient exemplars for training andtesting, we only choose the events with at least 40 photoslabeled with location metadata. In EventMedia, there are674 events which fit this condition and are hence used asour event collection2, along with the associated 92K photos.Figure 2 reports of the number of photos associated to eventswhile some photos exemplars from the dataset are shown inFigure 1.
0 100 200 300 400 500 600 700#Events
101
102
103
104
#Photos
Figure 2: The statistics of number of photos per event, rang-ing from 40 to several thousand
4.2 Experiments setting1http://eventmedia.eurecom.fr/sparql2http://www.eurecom.fr/liux/ICMR13.html
For each event in the dataset, we use the photos originat-ing from the event as the positive samples, and randomlyselect 4 times more photos taken from other events as thenegative samples. Both the positive and negative data aresplit into two equal parts randomly, one for training, theother for testing.
For each photo in the dataset, the features detailed insection 3.2 are computed. In our quest to identify the mostrepresentative features, we compare 4 features vectors totrain our event models with 4 different learning approaches;The unidimensional temporal feature is concatenated withthe location feature as a 4-D spatio-temporal feature vector,the 201-D tag feature vector alone, the 201-D visual fea-tures vector alone and finally, we also concatenate all of thefeatures together into a single 406-D feature vector.
For the learning process the following parameters are em-ployed. For the KNN approach, we set the parameter k to10, experimentally. For the SVM approach, we choose theRBF kernel and use grid search method to select the best pa-rameters. For the Decision Tree approach, we set the depthof the tree as
√N , where N is the length of feature. For
examples, for the 201-D tag feature, the depth of the tree is√201 = 14. We use the same depth parameter to train the
Random Forest model, while the number of tree is set to 10experimentally.
4.3 Evaluation criteriaDue to the very imbalanced nature of the dataset, we can-
not use criteria like accuracy to evaluate the performanceof the algorithms. Since the ratio of positive vs negativesample is 1:4, classifying all of the testing data as nega-tive would lead to an accuracy of 80%. For such imbal-anced dataset, the Receiver Operator Characteristic (ROC)curve and Precision-Recall (PR) curve measures are bettersuited [20].
The ROC curve is a graphical plot which illustrates theperformance of a binary classifier system as its discrimina-tion threshold varies. It is created by plotting the fractionof true positives out of the positives vs. the fraction of falsepositives out of the negatives, with varying threshold.
The ROC curve is an important tool to measure perfor-mance of a classification system with imbalanced testingdata [13, 9]. The area under curve (AUC) measures theprobability that a classifier will rank a randomly chosen pos-itive instance higher than a randomly chosen negative one,which gives the credibility of trained models.
When dealing with highly skewed datasets, Precision-Recall(PR) curve is another informative measure of a system’s per-

0.0 0.2 0.4 0.6 0.8 1.0False Positive Rate
0.0
0.2
0.4
0.6
0.8
1.0
Tru
e P
osi
tive R
ate
Receiver operating characteristic
Decision Tree (auc = 0.994)K-NN (auc = 0.997)Random Forest (auc = 0.999)SVM (auc = 0.546)
(a) ROC curve with spatial temporal feature
0.0 0.2 0.4 0.6 0.8 1.0Recall
0.0
0.2
0.4
0.6
0.8
1.0
Pre
cisi
on
Precision-Recall Curve
Decision Tree (AP = 0.989)K-NN (AP = 0.991)Random Forest (AP = 0.995)SVM (AP = 0.217)
(b) PR curve with spatial temporal feature
0.0 0.2 0.4 0.6 0.8 1.0False Positive Rate
0.0
0.2
0.4
0.6
0.8
1.0
Tru
e P
osi
tive R
ate
Receiver operating characteristic
Decision Tree (auc = 0.995)K-NN (auc = 0.989)Random Forest (auc = 0.996)SVM (auc = 0.994)
(c) ROC curve with tag feature
0.0 0.2 0.4 0.6 0.8 1.0Recall
0.0
0.2
0.4
0.6
0.8
1.0
Pre
cisi
on
Precision-Recall Curve
Decision Tree (AP = 0.989)K-NN (AP = 0.983)Random Forest (AP = 0.990)SVM (AP = 0.983)
(d) PR curve with tag feature
0.0 0.2 0.4 0.6 0.8 1.0False Positive Rate
0.0
0.2
0.4
0.6
0.8
1.0
Tru
e P
osi
tive R
ate
Receiver operating characteristic
Decision Tree (auc = 0.702)K-NN (auc = 0.854)Random Forest (auc = 0.871)SVM (auc = 0.825)
(e) ROC curve with visual feature
0.0 0.2 0.4 0.6 0.8 1.0Recall
0.0
0.2
0.4
0.6
0.8
1.0
Pre
cisi
on
Precision-Recall Curve
Decision Tree (AP = 0.507)K-NN (AP = 0.626)Random Forest (AP = 0.675)SVM (AP = 0.549)
(f) PR curve with visual feature
0.0 0.2 0.4 0.6 0.8 1.0False Positive Rate
0.0
0.2
0.4
0.6
0.8
1.0
Tru
e P
osi
tive R
ate
Receiver operating characteristic
Decision Tree (auc = 0.992)K-NN (auc = 0.989)Random Forest (auc = 0.999)SVM (auc = 0.995)
(g) ROC curve with all concatenated features
0.0 0.2 0.4 0.6 0.8 1.0Recall
0.0
0.2
0.4
0.6
0.8
1.0
Pre
cisi
on
Precision-Recall Curve
Decision Tree (AP = 0.987)K-NN (AP = 0.977)Random Forest (AP = 0.996)SVM (AP = 0.984)
(h) PRC curve with all concatenated features

0.0 0.2 0.4 0.6 0.8 1.0False Positive Rate
0.0
0.2
0.4
0.6
0.8
1.0
Tru
e P
osi
tive R
ate
Receiver operating characteristic
Decision Tree (auc = 0.997)K-NN (auc = 0.998)Random Forest (auc = 0.999)SVM (auc = 0.993)
(i) ROC curve with ST+ tag feature
0.0 0.2 0.4 0.6 0.8 1.0Recall
0.0
0.2
0.4
0.6
0.8
1.0
Pre
cisi
on
Precision-Recall Curve
Decision Tree (AP = 0.996)K-NN (AP = 0.996)Random Forest (AP = 0.998)SVM (AP = 0.980)
(j) PR curve with ST+ tag feature
Figure 1: ROC and PR curves with different features
formance. In pattern recognition, PR curve measures therelation between fraction of retrieved instances that are rel-evant (Precision), and the fraction of relevant instances thatare retrieved (Recall). The PR curve only takes the posi-tive samples into account and it is always used for scoringhighly imbalanced systems. The area under curve is calledas Average Precision (AP), which is one of the most popu-lar criteria used for evaluating classification and informationretrieval tasks.
4.4 ResultsFrom the whole dataset, we randomly select 100 events
to train the 1-vs-all classifiers with different learning ap-proaches and features. The results are reported in Figure 1.Comparing the four classification approaches KNN, SVM,DT and RF, the Random Forest method offers the best per-formance regardless of the features employed for training.For examples, even with the 4D spatial and temporal fea-ture, the AUC under ROC curve and average precision are0.999 and 0.995 respectively, as shown in Figure 1(a) (b).Decision Tree and KNN models also offer competitive per-formance for modeling the data. Compared with DecisionTree, the KNN algorithm has better performance on spatio-temporal feature and visual feature, but fails to model thetag and concatenated features very well. SVM provides,as expected, good performance with the higher dimensionaldata, such as the tag, visual and the concatenated features.However, it is not well suited to model low dimensional datasuch as the 4-D spatio-temporal feature (AUC and AP valueare 0.546 and 0.217, see the curve in Figure1(a) (b).
We also study the impacts of different features in model-ing the events. We found that the most effective feature isthe tag (Figure 1(c)(d)), which is also the most reliable fea-ture independently of the learning approach employed. Thespatio-temporal feature has a good performance with KNN,Decision Tree and Random Forest (see Figure 1(a)(b)). It isalso the feature with the lowest dimension hence the modelsare learned effectively. Figure 1 also shows that the visualfeature is not very robust compared with the other two fea-tures, and the average AUC and AP values under the fourmethods is 0.813 and 0.589 respectively. The reason is thatmost of the events in EventMedia are concerts and therefore,the photos originating from any events share a similar visual
atmosphere. As part of our extensive set of experiments, wealso study the fusion of different features, which is to con-catenate all of the features together to train the model. Theresult are reported in Figure 1(e)(f). The performance ofthose models trained on the concatenated feature does notimprove when compared with the tag feature, due to the rel-atively low discriminative power of the visual feature withinthis class of event (live events/concerts). The best perfor-mance overall is actually achieved when model is trainedwith both the spatio-temporal feature and tag feature con-catenated, as shown in Figure 1(i)(j).
From these figures, we can conclude that:
1. Tag is the most representative feature when modelingevent, followed closely by the spatio-temporal feature.In addition, the combination of spatio-temporal andtag feature obtains the best performance overall.
2. On modeling the photos features which are very parseand with missing value, the Decision Tree and KNNmethods obtain a better performance compared withSVM, while the previous approaches are designed todeal with problems with irregular decision boundary.
4.5 Evaluation of the impact of Missing ValueIn the dataset, the location feature and tag feature are not
necessarily available, which results in many missing valuesin the feature vectors. To handle the missing values, wepropose to extend the features with an indicator to showif the feature values is missing or not. In the experiments,we evaluate and compare our approach with the commonstrategy for handling missing values: replacing the missingdata by zero vectors.
We train the models using KNN, the approach which offersthe best efficiency with the least computational burden, andRandom Forest, which offers the best effectiveness overallon our dataset. The results of modeling events with bothKNN and RF for the two feature types subject to missingvalues are reported in Figure 3.
In the dataset, only 39.7% of the photos have geo-locationmetadata available. Figure 3(a)(b) shows the performanceof KNN and RF model trained using the location feature un-der the different missing values processing techniques. Theevaluation criteria are the same as in the previous section:
ROC and PR curves. It can be seen in the two figures thatcompared with the method that simply fills the missing val-ues with zeros, the method used in this paper achieves betterperformance with the AUC increasing from 0.996 to 0.997and AP increasing from 0.989 to 0.992 using KNN classi-fication. The same conclusion could be obtained from themodels trained with the Random Forest method, though twomodels have the same performance measure with the AUCcriteria, but better performance measured with AP (from0.994 to 0.995).
A similar phenomenon can be observed in Figure 3(c)(d),which show the results on tag features. 56.9% of the pho-tos in the dataset have tags labels. When both learningapproaches are trained with tag feature, the AUC increasesfrom 0.986 to 0.989 in KNN model, and from 0.995 to 0.996in Random Forest model (Figure 3(c)), while the AP in-creases from 0.982 to 0.985 in KNN model, and 0.988 to0.989 in Random Forest model respectively.
From the four figures, it can be concluded that the pro-posed approach, extending the feature with an indicator ofmissing value, brings more information to the representationallowing to better model event media.
5. CONCLUSIONThe exponential growth of social media data available on-
line, witnessed over recent years, brings new challenges formanaging and organizing media efficiently and effectively.Thanks to its multi-dimensional nature (Who, What, When,Where), events are a powerful instrument to organize media.Associating media to events and modeling events are activ-ities which have started to receive considerable attention inresearch community.
In this paper, we focus on studying the feature and modelselection, as well as handling the issue of potential miss-ing value for the task of event based media categorization.These are fundamental questions, yet not addressed by pre-vious work. We tackle these problems within an event-basedphoto classification framework, and compare various learn-ing approaches (KNN, SVM, Decision Tree and RandomForest) to train the model with different features, such asspatio-temporal, tag, visual features. Our experiment re-sults show that the best model is learned by Random Forestwith the combination of spatio-temporal and tag features.To deal with the missing value issue, we propose to extendthe feature with an indicator which specifies whether thevalue is missing or not. The performance obtained in ourcomparative study highlights the fact that of the commonmethod consisting in simply filling the missing value withzeros is outperform by our missing value handling approach.
In the work presented here, the event models are learnedusing either individual or concatenation of feature. In fu-ture, we would like to study how to better fuse such features,how to fuse the classifying results and to make a more so-phisticated decision. As a general conclusion, this paper willbenefit the media based social event detection task by ex-ploring multiple features and models in order to achieve thebest possible classification performance.
6. REFERENCES[1] H. Becker, M. Naaman, and L. Gravano. Event
Identification in Social Media. In 12th InternationalWorkshop on the Web and Databases, Providence,USA, 2009.
[2] L. Breiman. Random forests. Machine Learning,45:5–32, 2001.
[3] L. Breiman, J. Friedman, R. Olshen, and C. Stone.Classification and Regression Trees. Wadsworth andBrooks, Monterey, CA, 1984. new edition [?]?
[4] R. Caruana and A. Niculescu-Mizil. An empiricalcomparison of supervised learning algorithms. InProceedings of the 23rd international conference onMachine learning, pages 161–168, New York, USA,June 2006.
[5] C.-C. Chang and C.-J. Lin. LIBSVM: A library forsupport vector machines. ACM Transactions onIntelligent Systems and Technology, 2(3):27:1—-27:27,2011.
[6] L. Chen and A. Roy. Event detection from flickr datathrough wavelet-based spatial analysis. In ACMconference on CIKM, 2009.
[7] T.-S. Chua, J. Tang, R. Hong, H. Li, Z. Luo, andY.-T. Zheng. NUS-WIDE: A Real-World Web ImageDatabase from National University of Singapore. InProc. of ACM Conf. on Image and Video Retrieval,Santorini, Greece, 2009.
[8] N. Diakopoulos, M. Naaman, and F. Kivran-Swaine.Diamonds in the rough: Social media visual analyticsfor journalistic inquiry. In 2010 IEEE Symposium onVisual Analytics Science and Technology, pages115–122, Oct. 2010.
[9] T. Fawcett. An introduction to roc analysis. PatternRecogn. Lett., 27(8):861–874, June 2006.
[10] C. S. Firan, M. Georgescu, W. Nejdl, and R. Paiu.Bringing order to your photos: Event-DrivenClassification of Flickr Images Based on SocialKnowledge. In Proceedings of the 19th ACMinternational conference on Information andknowledge management, page 189, New York, USA,Oct. 2010.
[11] J. W. Grzymala-Busse and M. Hu. A comparison ofseveral approaches to missing attribute values in datamining. In Revised Papers from the SecondInternational Conference on Rough Sets and CurrentTrends in Computing, RSCTC ’00, pages 378–385,London, UK, UK, 2001. Springer-Verlag.
[12] J. Hays and A. A. Efros. IM2GPS: estimatinggeographic information from a single image. In IEEEConference on Computer Vision and PatternRecognition, pages 1–8, 2008.
[13] H. He and E. A. Garcia. Learning from imbalanceddata. IEEE Transactions on Knowledge and DataEngineering, 21(9):1263–1284, 2009.
[14] L. Kennedy and M. Naaman. Less talk, more rock:automated organization of community-contributedcollections of concert videos. In 18th ACMInternational Conference on World Wide Web, pages311–320, Madrid, Spain, 2009.
[15] H.-Y. Lo, K.-W. Chang, S.-T. Chen, and et al. Anensemble of three classifiers for kdd cup 2009:Expanded linear model, heterogeneous boosting, andselective naive bayes. Journal of Machine LearningResearch - Proceedings Track, 7:57–64, 2009.
[16] C. D. Manning, P. Raghavan, and H. Schutze.Introduction to Information Retrieval. 1 edition, July2008.

0.0 0.2 0.4 0.6 0.8 1.0False Positive Rate
0.0
0.2
0.4
0.6
0.8
1.0
Tru
e P
osi
tive R
ate
Receiver operating characteristic
KNN: Missing filled by Zero (auc = 0.996)KNN: Our Approach (auc = 0.997)Random Forest: Missing filled by Zero (auc = 0.999)Random Forest: Our Approach (auc = 0.999)
(a) ROC curve with spatial temporal feature
0.0 0.2 0.4 0.6 0.8 1.0Recall
0.0
0.2
0.4
0.6
0.8
1.0
Pre
cisi
on
Precision-Recall Curve
KNN: Missing filled by Zero (AP = 0.989)KNN: Our Approach (AP = 0.992)Random Forest: Missing filled by Zero (AP = 0.994)Random Forest: Our Approach (AP = 0.995)
(b) PR curve with spatial temporal feature
0.0 0.2 0.4 0.6 0.8 1.0False Positive Rate
0.0
0.2
0.4
0.6
0.8
1.0
Tru
e P
osi
tive R
ate
Receiver operating characteristic
KNN: Missing filled by Zero (auc = 0.986)KNN: Our Approach (auc = 0.989)Random Forest: Missing filled by Zero (auc = 0.995)Random Forest: Our Approach (auc = 0.996)
(c) ROC curve with tag feature
0.0 0.2 0.4 0.6 0.8 1.0Recall
0.0
0.2
0.4
0.6
0.8
1.0
Pre
cisi
on
Precision-Recall Curve
KNN: Missing filled by Zero (AP = 0.982)KNN: Our Approach (AP = 0.985)Random Forest: Missing filled by Zero (AP = 0.988)Random Forest: Our Approach (AP = 0.989)
(d) PR curve with tag feature
Figure 3: Performance of KNN and Random Forest methods with missing value features
[17] R. Mattivi, J. Uijlings, F. De Natale, and N. Sebe.Categorization of a collection of pictures intostructured events. In Proceedings of the 2nd ACMInternational Conference on Multimedia Retrieval,page 1, New York, USA, June 2012.
[18] S. Papadopoulos, E. Schinas, V. Mezaris, R. Troncy,and I. Kompatsiaris. Social event detection atmediaeval 2012: Challenges, dataset and evaluation.In MediaEval’12, pages –1–1, 2012.
[19] S. Papadopoulos, C. Zigkolis, Y. Kompatsiaris, andA. Vakali. Cluster-Based Landmark and EventDetection for Tagged Photo Collections. IEEEMultimedia, 18(1):52–63, 2011.
[20] D. M. W. Powers. Evaluation: From Precision, Recalland F-Factor to ROC, Informedness, MarkednessCorrelation. Technical Report SIE-07-001, School ofInformatics and Engineering, Flinders University,Adelaide, Australia, 2007.
[21] T. Quack, B. Leibe, and L. Van Gool. World-scalemining of objects and events from community photocollections. In Proceedings of the 2008 internationalconference on Content-based image and video retrieval,page 47, New York, USA, July 2008.
[22] T. Reuter and P. Cimiano. Event-based classification
of social media streams. In International conference onMultimedia Retrieval, pages 22–22, 2012.
[23] T. Sakaki, M. Okazaki, and Y. Matsuo. Earthquakeshakes Twitter users: real-time event detection bysocial sensors. In International conference on WWW,pages 851–860, Apr. 2010.
[24] M. R. Trad, A. Joly, and N. Boujemaa. Large scalevisual-based event matching. In Proceedings of the 1stACM International Conference on MultimediaRetrieval, pages 1–7, New York, USA, Apr. 2011.
[25] R. Troncy, B. Malocha, and A. Fialho. Linking Eventswith Media. In 6th International Conference onSemantic Systems, Graz, Austria, 2010.
[26] Y. Wang, H. Sundaram, and L. Xie. Social eventdetection with interaction graph modeling. In ACMconference on Multimedia, 2012.
[27] J. Weng and B.-s. Lee. Event Detection in Twitter. InFifth International AAAI Conference on Weblogs andSocial Media, pages 401–408. HP Laboratories, 2011.