HERBALIFE LTD. - AnnualReports.com
112
UNITED STATES SECURITIES AND EXCHANGE COMMISSION Washington, D.C. 20549 Form 10-K FOR ANNUAL AND TRANSITION REPORTS PURSUANT TO SECTIONS 13 OR 15(d) OF THE SECURITIES EXCHANGE ACT OF 1934 (Mark One) ¥ ANNUAL REPORT UNDER SECTION 13 OR 15(d) OF THE SECURITIES EXCHANGE ACT OF 1934 For the fiscal year ended December 31, 2005 n TRANSITION REPORT PURSUANT TO SECTION 13 OR 15(d) OF THE SECURITIES EXCHANGE ACT OF 1934 For the transition period from to . Commission file number: 1-32381 HERBALIFE LTD. (Exact Name of Registrant as Specified in Its Charter) Cayman Islands 98-0377871 (State or Other Jurisdiction of Incorporation or Organization) (I.R.S. Employer Identification No.) P.O. Box 309GT Ugland House, South Church Street Grand Cayman, Cayman Islands (Address of Principal Executive Offices) (Zip Code) (310) 410-9600* (Registrant’s telephone number, including area code) Securities registered pursuant to Section 12(b) of the Act: Title of Each Class Name of Each Exchange on Which Registered Common Shares, par value $0.002 per share New York Stock Exchange Securities registered pursuant to Section 12(g) of the Act: None Indicate by check mark if the registrant is a well-known seasoned issuer, as defined in Rule 405 of the Securities Act. Yes ¥ No n Indicate by check mark if the registrant is not required to file reports pursuant to Section 13 or Section 15(d) of the Act. Yes n No ¥ Indicate by check mark whether the registrant: (1) has filed all reports required to be filed by Section 13 or 15(d) of the Securities Exchange Act of 1934 during the preceding 12 months (or for such shorter period that the Registrant was required to file such reports), and (2) has been subject to such filing requirements for the past 90 days. Yes ¥ No n Indicate by check mark if disclosure of delinquent filers pursuant to Item 405 of Regulation S-K (§229,405 of this chapter) is not contained herein, and will not be contained, to the best of registrant’s knowledge, in definitive proxy or information statements incorporated by reference in Part III of this Form 10-K or any amendment to this Form 10-K. n Indicate by check mark whether the registrant is a large accelerated filer, an accelerated filer, or a non-accelerated filer. See definition of “accelerated filer and large accelerated filer” in Rule 12b-2 of the Exchange Act. (Check one): Large accelerated filer ¥ Accelerated filer n Non-accelerated filer n Indicate by check mark whether registrant is a shell company (as defined in Rule 12b-2 of the Exchange Act). Yes n No ¥ There were 69,949,152 common shares outstanding as of February 22, 2006. The aggregate market value of the Registrant’s common shares held by non-affiliates was approximately $571 million as of June 30, 2005, based upon the last reported sales price on the New York Stock Exchange on that date of $21.61. DOCUMENTS INCORPORATED BY REFERENCE Portions of the registrant’s Definitive Proxy Statement to be filed with the Securities and Exchange Commission no later than 120 days after the end of the Registrant’s fiscal year ended December 31, 2005, are incorporated by reference in Part III of this Form. * C/O Principal Financial and Accounting Officer of Herbalife International, Inc.
-
Upload
khangminh22 -
Category
Documents
-
view
2 -
download
0
Transcript of HERBALIFE LTD. - AnnualReports.com

UNITED STATESSECURITIES AND EXCHANGE COMMISSION
Washington, D.C. 20549
Form 10-KFOR ANNUAL AND TRANSITION REPORTS
PURSUANT TO SECTIONS 13 OR 15(d) OF THESECURITIES EXCHANGE ACT OF 1934
(Mark One)¥ ANNUAL REPORT UNDER SECTION 13 OR 15(d) OF THE SECURITIES
EXCHANGE ACT OF 1934For the fiscal year ended December 31, 2005
n TRANSITION REPORT PURSUANT TO SECTION 13 OR 15(d) OF THESECURITIES EXCHANGE ACT OF 1934
For the transition period from to .Commission file number: 1-32381
HERBALIFE LTD.(Exact Name of Registrant as Specified in Its Charter)
Cayman Islands 98-0377871(State or Other Jurisdiction ofIncorporation or Organization)
(I.R.S. EmployerIdentification No.)
P.O. Box 309GTUgland House, South Church Street
Grand Cayman, Cayman Islands(Address of Principal Executive Offices) (Zip Code)
(310) 410-9600*(Registrant’s telephone number, including area code)
Securities registered pursuant to Section 12(b) of the Act:Title of Each Class Name of Each Exchange on Which Registered
Common Shares, par value $0.002 per share New York Stock Exchange
Securities registered pursuant to Section 12(g) of the Act:None
Indicate by check mark if the registrant is a well-known seasoned issuer, as defined in Rule 405 of the SecuritiesAct. Yes ¥ No n
Indicate by check mark if the registrant is not required to file reports pursuant to Section 13 or Section 15(d) of theAct. Yes n No ¥
Indicate by check mark whether the registrant: (1) has filed all reports required to be filed by Section 13 or 15(d) of the SecuritiesExchange Act of 1934 during the preceding 12 months (or for such shorter period that the Registrant was required to file such reports),and (2) has been subject to such filing requirements for the past 90 days. Yes ¥ No n
Indicate by check mark if disclosure of delinquent filers pursuant to Item 405 of Regulation S-K (§229,405 of this chapter) is notcontained herein, and will not be contained, to the best of registrant’s knowledge, in definitive proxy or information statementsincorporated by reference in Part III of this Form 10-K or any amendment to this Form 10-K. n
Indicate by check mark whether the registrant is a large accelerated filer, an accelerated filer, or a non-accelerated filer. Seedefinition of “accelerated filer and large accelerated filer” in Rule 12b-2 of the Exchange Act. (Check one):
Large accelerated filer ¥ Accelerated filer n Non-accelerated filer n
Indicate by check mark whether registrant is a shell company (as defined in Rule 12b-2 of the Exchange Act). Yes n No ¥
There were 69,949,152 common shares outstanding as of February 22, 2006. The aggregate market value of the Registrant’scommon shares held by non-affiliates was approximately $571 million as of June 30, 2005, based upon the last reported sales price on theNew York Stock Exchange on that date of $21.61.
DOCUMENTS INCORPORATED BY REFERENCEPortions of the registrant’s Definitive Proxy Statement to be filed with the Securities and Exchange Commission no later than
120 days after the end of the Registrant’s fiscal year ended December 31, 2005, are incorporated by reference in Part III of this Form.
* C/O Principal Financial and Accounting Officer of Herbalife International, Inc.
%%TRANSMSG*** Transmitting Job: V16934 PCN: 001000000 ***%%PCMSG| |00017|Yes|No|03/16/2006 21:00|0|0|Page is valid, no graphics -- Color: D|


TABLE OF CONTENTS
Page
PART IITEM 1. BUSINESS . . . . . . . . . . . . . . . . . . . . . . . . . . . . . . . . . . . . . . . . . . . . . . . . . . . . . . . . . . . . 3
ITEM 1A. RISK FACTORS . . . . . . . . . . . . . . . . . . . . . . . . . . . . . . . . . . . . . . . . . . . . . . . . . . . . . . . . 25
ITEM 1B. UNRESOLVED STAFF COMMENTS . . . . . . . . . . . . . . . . . . . . . . . . . . . . . . . . . . . . . . . . 38
ITEM 2. PROPERTIES . . . . . . . . . . . . . . . . . . . . . . . . . . . . . . . . . . . . . . . . . . . . . . . . . . . . . . . . . . 38
ITEM 3. LEGAL PROCEEDINGS. . . . . . . . . . . . . . . . . . . . . . . . . . . . . . . . . . . . . . . . . . . . . . . . . . 38
ITEM 4. SUBMISSION OF MATTERS TO A VOTE OF SECURITY HOLDERS. . . . . . . . . . . . . . . 39
PART IIITEM 5. MARKET FOR REGISTRANT’S COMMON EQUITY, RELATED STOCKHOLDER
MATTERS AND ISSUER PURCHASES OF EQUITY SECURITIES . . . . . . . . . . . . . . . . . 40
ITEM 6. SELECTED FINANCIAL DATA . . . . . . . . . . . . . . . . . . . . . . . . . . . . . . . . . . . . . . . . . . . . 42
ITEM 7. MANAGEMENT’S DISCUSSION AND ANALYSIS OF FINANCIAL CONDITION ANDRESULTS OF OPERATIONS . . . . . . . . . . . . . . . . . . . . . . . . . . . . . . . . . . . . . . . . . . . . . . 44
ITEM 7A. QUANTITATIVE AND QUALITATIVE DISCLOSURES ABOUT MARKET RISK . . . . . . 66ITEM 8. FINANCIAL STATEMENTS AND SUPPLEMENTARY DATA . . . . . . . . . . . . . . . . . . . . . 69
ITEM 9. CHANGES IN AND DISAGREEMENTS WITH ACCOUNTANTS ON ACCOUNTINGAND FINANCIAL DISCLOSURE. . . . . . . . . . . . . . . . . . . . . . . . . . . . . . . . . . . . . . . . . . . 69
ITEM 9A. CONTROLS AND PROCEDURES . . . . . . . . . . . . . . . . . . . . . . . . . . . . . . . . . . . . . . . . . . 69
ITEM 9B. OTHER INFORMATION . . . . . . . . . . . . . . . . . . . . . . . . . . . . . . . . . . . . . . . . . . . . . . . . . 72
PART IIIITEM 10. DIRECTORS AND EXECUTIVE OFFICERS OF THE REGISTRANT . . . . . . . . . . . . . . . 73
ITEM 11. EXECUTIVE COMPENSATION . . . . . . . . . . . . . . . . . . . . . . . . . . . . . . . . . . . . . . . . . . . . 73
ITEM 12. SECURITY OWNERSHIP OF CERTAIN BENEFICIAL OWNERS AND MANAGEMENTAND RELATED STOCKHOLDER MATTERS . . . . . . . . . . . . . . . . . . . . . . . . . . . . . . . . . 73
ITEM 13. CERTAIN RELATIONSHIPS AND RELATED TRANSACTIONS . . . . . . . . . . . . . . . . . . . 73
ITEM 14. PRINCIPAL ACCOUNTANT FEES AND SERVICES . . . . . . . . . . . . . . . . . . . . . . . . . . . . 73
PART IVITEM 15. EXHIBITS AND FINANCIAL STATEMENT SCHEDULES . . . . . . . . . . . . . . . . . . . . . . . 73
NOTES TO CONSOLIDATED FINANCIAL STATEMENTS. . . . . . . . . . . . . . . . . . . . . . . . . . . . . . . . . 83
SIGNATURES . . . . . . . . . . . . . . . . . . . . . . . . . . . . . . . . . . . . . . . . . . . . . . . . . . . . . . . . . . . . . . . . . . . 108
1
%%TRANSMSG*** Transmitting Job: V16934 PCN: 002000000 ***%%PCMSG|1 |00019|Yes|No|03/16/2006 21:13|0|0|Page is valid, no graphics -- Color: D|

FORWARD LOOKING STATEMENTS
This document contains “forward-looking statements” within the meaning of Section 27A of the Securities Actof 1933, as amended and Section 21E of the Securities Exchange Act of 1934, as amended. All statements other thanstatements of historical fact are “forward-looking statements” for purposes of federal and state securities laws,including any projections of earnings, revenue or other financial items; any statements of the plans, strategies andobjectives of management for future operations; any statements concerning proposed new services or develop-ments; any statements regarding future economic conditions or performance; any statements of belief; and anystatements of assumptions underlying any of the foregoing. Forward-looking statements may include the words“may,” “will,” “estimate,” “intend,” “continue,” “believe,” “expect” or “anticipate” and other similar words.
Although we believe that the expectations reflected in any of our forward-looking statements are reasonable,actual results could differ materially from those projected or assumed in any of our forward-looking statements. Ourfuture financial condition and results of operations, as well as any forward-looking statements, are subject to changeand to inherent risks and uncertainties, such as those disclosed in this document. Important factors that could causeour actual results, performance and achievements, or industry results to differ materially from estimates orprojections contained in our forward-looking statements include, among others, the following:
• our relationship with, and our ability to influence the actions of, our distributors;• adverse publicity associated with our products or network marketing organization;• uncertainties relating to interpretation and enforcement of recently enacted legislation in China governing
direct selling;• adverse changes in the Chinese economy, Chinese legal system or Chinese governmental policies;• risk of improper action by Chinese employees or international distributors in violation of Chinese law;• changing consumer preferences and demands;• the competitive nature of our business;• regulatory matters governing our products, including potential governmental or regulatory actions
concerning the safety or efficacy of our products, and network marketing program;• risks associated with operating internationally, including foreign exchange risks;• our dependence on increased penetration of existing markets;• contractual limitations on our ability to expand our business;• our reliance on our information technology infrastructure and outside manufacturers;• the sufficiency of trademarks and other intellectual property rights;• product concentration;• our reliance on our management team;• uncertainties relating to the application of transfer pricing and similar tax regulations;• taxation relating to our distributors; and• product liability claims.
Additional factors that could cause actual results to differ materially from our forward-looking statements areset forth in this Annual Report on Form 10-K, including under the heading “Risk Factors,” “Management’sDiscussion and Analysis of Financial Condition and Results of Operations” and in our Financial Statements and therelated notes.
Forward-looking statements in this Annual Report on Form 10-K speak only as of the date hereof, and forwardlooking statements in documents attached are incorporated by reference speak only as of the date of thosedocuments. The Company does not undertake any obligation to update or release any revisions to any forward-looking statement or to report any events or circumstances after the date hereof or to reflect the occurrence ofunanticipated events, except as required by law.
The Company
Unless otherwise noted, the terms “we,” “our,” “us,” “Company,” “Herbalife” and “Successor” refer toHerbalife Ltd. and its subsidiaries, including WH Capital Corporation (“WH Capital Corp.”) and HerbalifeInternational, Inc. (“Herbalife International”) and its subsidiaries for periods subsequent to Herbalife Internatio-nal’s acquisition on July 31, 2002 by an investment group led by Whitney & Co., LLC and Golden Gate PrivateEquity, Inc. (the “Acquisition”), and the terms “we,” “our,” “us,” “Company” and “Predecessor‘ refer to HerbalifeInternational before the Acquisition for periods through July 31, 2002. Herbalife is a holding company, withsubstantially all of its assets consisting of the capital stock of its indirect, wholly-owned subsidiary, HerbalifeInternational.
2
%%TRANSMSG*** Transmitting Job: V16934 PCN: 003000000 ***%%PCMSG|2 |00013|Yes|No|03/16/2006 21:00|0|0|Page is valid, no graphics -- Color: D|

PART I
Item 1. BUSINESS
GENERAL
We are a global network marketing company that sells weight management, nutritional supplement andpersonal care products. We pursue our mission of “changing people’s lives” by providing a financially rewardingbusiness opportunity to distributors and quality products to distributors and customers who seek a healthy lifestyle.We are one of the largest network marketing companies in the world with net sales of approximately $1.6 billion forthe fiscal year ended December 31, 2005. We sell our products in 60 countries through a network of over one millionindependent distributors. In China, in order to comply with recently enacted legislation, we sell our productsthrough retail stores and an employed sales force. We believe the quality of our products and the effectiveness of ourdistribution network, coupled with geographic expansion, have been the primary reasons for our success throughoutour 26-year company history.
We offer products in three primary categories: weight management, inner nutrition and Outer Nutrition». Ourweight management product portfolio includes meal replacements, weight-loss accelerators, appetite suppressionproducts and a variety of healthy snacks. In 2003, we introduced NiteworksTM, which supports energy and vascularand circulatory health. In March 2004, we launched the ShapeWorksTM weight management program, an enhance-ment to our best-selling Formula 1 weight management product, which personalizes protein intake and includes acustomized meal plan. Our collection of inner nutrition products consists of dietary and nutritional supplements,each containing quality herbs, vitamins, minerals and natural ingredients in support of total well-being and long-term good health. In 2005, we entered into the high growth energy drink category in the U.S. and Canada with theintroduction of Liftoff TM — an innovative, effervescent energy product. Our Outer Nutrition» products include skincleansers, moisturizers, lotions, shampoos and conditioners, each based on botanical formulas to revitalize, sootheand smooth body, skin and hair. In 2005, we upgraded and expanded our personal care line with the introduction ofNouriFusionTM. This product line utilizes vitamin A, C and E to provide benefits to the skin. Weight management,inner nutrition and outer nutrition accounted for 43.4%, 41.4% and 10.4% of our net sales in fiscal year 2005,respectively.
We have significantly increased our emphasis on scientific research in the fields of weight management andnutrition over the past three years. We believe that our focus on nutrition science will continue to result inmeaningful product enhancements that differentiate our products in the marketplace. Our research and developmentorganization combines the experience of product development scientists within our Company with an external teamincluding world-renowned scientists. Additionally, we contributed to the establishment of the Mark HughesCellular and Molecular Nutrition Lab at UCLA (the “UCLA Lab”), which is an independent lab devoted to theadvancement of nutrition science. We introduced NiteworksTM, a cardiovascular product developed in conjunctionwith Louis Ignarro, Ph.D., a Nobel Laureate in Medicine in 2003 and, in March 2004, we introduced ShapeWorksTM,a comprehensive weight management program based on the clinical experience and the 15 years of mealreplacement research of David Heber, M.D., Ph.D., Professor of Medicine and Public Health at the UCLA Schoolof Medicine, Director of the UCLA Center for Human Nutrition and Director of the UCLA Center for DietarySupplement Research in Botanicals.
We have a 17-member Scientific Advisory Board, comprised of world-renowned scientists, and a MedicalAdvisory Board consisting of leading scientists and medical doctors. We consult with these professionals on theadvancements in the field of nutrition science. Additionally, our Medical Advisory Board provides training onproduct usage and gives health-news updates through Herbalife literature, the internet and live training eventsaround the world. The boards, both chaired by Dr. David Heber, support our internal product development team byproviding expertise on obesity and human nutrition, conducting product research and advising on product concepts.
We believe that the direct-selling channel is ideally suited to marketing our products, because sales of weightmanagement, nutrition and personal care products are strengthened by ongoing personal contact between retailconsumers and distributors. This personal contact may enhance consumers’ nutritional and health education andmotivate consumers to begin and maintain wellness and weight management programs. In addition, by using our
3
%%TRANSMSG*** Transmitting Job: V16934 PCN: 004000000 ***%%PCMSG|3 |00008|Yes|No|03/16/2006 21:00|0|0|Page is valid, no graphics -- Color: D|

products themselves, distributors can provide first-hand testimonials of product effectiveness, which often serve asa powerful sales tool.
We are focused on building and maintaining our distributor network by offering financially rewarding andflexible career opportunities through sales of quality, innovative products to health conscious consumers. Webelieve the income opportunity provided by our network marketing program appeals to a broad cross-section ofpeople throughout the world, particularly those seeking to supplement family income, start a home business orpursue entrepreneurial, full and part-time, employment opportunities. Our distributors, who are all independentcontractors, can profit from selling our products and can also earn royalties and bonuses on sales made by thedistributors whom they recruit to join their sales organizations.
We enable distributors to maximize their potential by providing a broad array of motivational, educational andsupport services. We motivate our distributors through our performance-based compensation plan, individualrecognition, reward programs and promotions, and participation in local, national and international Company-sponsored sales events and Extravaganzas. We are committed to providing professionally designed educationaltraining materials that our distributors can use to enhance recruitment and maximize their sales. We and ourdistributor leadership conduct thousands of training sessions annually throughout the world to educate and motivateour distributors. These training events teach our distributors not only how to develop invaluable business-buildingand leadership skills, but also how to differentiate our products with their consumers. Our corporate-sponsoredtraining events provide a forum for distributors, who otherwise operate independently, to share ideas with us andeach other. In addition, our internet-based Herbalife Broadcasting Network delivers worldwide, educational,motivational and inspirational content, including addresses from our CEO. Our efficient and effective distribution,logistics and customer care support system assists our distributors by providing same day, or next-day salescapabilities and support services. We further aid our distributors by generating additional demand for our productsthrough traditional marketing and public relations methods, such as through television ads, sporting eventsponsorships and endorsements.
We were founded in 1980 by Mark Hughes. In 2002, we were acquired by an investment group led byWhitney & Co. LLC (“Whitney”) and Golden Gate Private Equity, Inc. (“Golden Gate Capital”) (together, the“Equity Sponsors”). To consummate this acquisition, Whitney and Golden Gate Capital and their affiliates formed anew holding company called WH Holdings (Cayman Islands) Ltd., a Cayman Islands exempted limited liabilitycompany (which has since been renamed Herbalife Ltd.), and several new direct and indirect wholly ownedsubsidiaries of that holding company, including an acquisition vehicle called WH Acquisition Corp., a Nevadacorporation, in order to acquire us. On July 31, 2002, WH Acquisition Corp. acquired us pursuant to an Agreementand Plan of Merger we entered into on April 10, 2002. As a result of the acquisition, we became a privately heldcompany and were delisted from the NASDAQ National Market at that time.
In December 2004, we and certain shareholders sold a total of 16.7 million of our common shares in our initialpublic offering, and our common shares have since been listed on the New York Stock Exchange (the “NYSE”)under the symbol “HLF.”
In December 2005, Herbalife completed a secondary public offering of 13 million common shares held bycertain existing shareholders. The selling shareholders received all net proceeds from the sale of common sharessold in this offering. Accordingly, Herbalife did not receive any proceeds from the sale of such common shares.
Our Competitive Strengths
We believe that our success stems from our ability to motivate our distributor network with a range of quality,innovative and efficacious products that appeal to consumer preferences for healthy living. We have been able toachieve sustained and profitable growth by capitalizing on the following competitive strengths:
Distributor Base. We have over one million distributors, including over 334,000 supervisors as ofDecember 2005. Our compensation system encourages distributors to remain active in the business and tobuild down-line sales organizations of their own, which can serve to increase their income and increase ourproduct sales. Supervisors contribute significantly to our sales and some key supervisors who have attained thehighest levels within our distributor network, specifically our President’s Team and Chairman’s Club, are
4
%%TRANSMSG*** Transmitting Job: V16934 PCN: 005000000 ***%%PCMSG|4 |00011|Yes|No|03/16/2006 21:00|0|0|Page is valid, no graphics -- Color: D|

responsible for their organization’s generation of a substantial portion of our sales and for recruiting asubstantial number of our distributors.
Product Portfolio. We are committed to building distributor, customer and brand loyalty by providing adiverse portfolio of health-oriented and wellness products. As of December 31, 2005, we had 146 productsencompassing over 3,000 SKUs across our three primary product categories. The breadth of our productofferings enables our distributors to sell a comprehensive package of products designed to simplify weightmanagement and nutrition. We continually review and if necessary improve upon our product formulations,many of which have been in existence for years, based upon developments in nutrition science. We believe thatthe longevity and variety in our product portfolio significantly enhances our distributors’ abilities to build theirbusinesses.
Nutrition Science-Based Product Development. We have significantly increased our emphasis andinvestment in science-based product development in the fields of weight management, nutrition, and personalcare during the past three years. We have an internal team of scientists dedicated to continually evaluatingopportunities to enhance our existing products and to develop new science-based products. These new productdevelopment efforts are reviewed by prominent doctors and scientists who constitute our Scientific AdvisoryBoard and Medical Advisory Board. In addition, in the past three years we provided donations to assist in theestablishment of the UCLA Lab. We believe that the UCLA Lab provides opportunities for Herbalife to accesscutting-edge science in herbal research and nutrition.
Scalable Business Model. Our business model enables us to grow our business with moderate invest-ment in our infrastructure and other fixed costs. With the exception of our China business, we require nocompany-employed sales force to market and sell our products, we incur no direct incremental cost to add anew distributor in our existing markets, and our distributor compensation varies directly with sales. In addition,our distributors bear the majority of our consumer marketing expenses, and supervisors sponsor and coordinatea large share of distributor recruiting and training initiatives. Furthermore, we can readily increase productionand distribution of our products as a result of our multiple third party manufacturing relationships and ourglobal footprint of in-house distribution centers.
Geographic Diversification. We have a proven ability to establish our network marketing organizationin new markets. Since our founding 26 years ago, we have expanded into 60 countries, including 18 countriesin the last seven years. While sales within our local markets may fluctuate due to economic, market andregulatory conditions, competitive pressures, political or social instability or for company specific reasons, webelieve that our geographic diversity mitigates our financial exposure to any particular market.
Experienced Management Team. The management team is led by Michael O. Johnson who became ourChief Executive Officer after spending 17 years with The Walt Disney Company, where he most recentlyserved as President of Walt Disney International. Since joining our Company, Mr. Johnson has assembled ateam of experienced executives, including Gregory Probert, President and Chief Operating Officer andformerly Chief Executive Officer of DMX Music and Chief Operating Officer of The Walt Disney Company’sBuena Vista Home Entertainment division; Richard Goudis, Chief Financial Officer and formerly ChiefOperating Officer of Rexall Sundown; and Brett R. Chapman, General Counsel and formerly Senior VicePresident and Deputy General Counsel of The Walt Disney Company. In addition, Steve Henig, Ph.D.,formerly Senior Vice President of Ocean Spray Cranberries, Inc., joined the Company in 2005 as ChiefScientific Officer with responsibility for our product research and development.
Our Business Strategy
We believe that our network marketing model is the most effective way to sell our products. Our objective is toincrease the recruitment, retention, retailing and productivity of our distributor base by pursuing the followingstrategic initiatives:
Distributor Strategy. We continue to increase our investment in events and promotions as a catalyst tohelp our distributors improve the effectiveness and productivity of their businesses. We will attempt toglobalize best-practice business methods, such as Nutrition Clubs and the Total Plan, to enable our distributors
5
%%TRANSMSG*** Transmitting Job: V16934 PCN: 006000000 ***%%PCMSG|5 |00012|Yes|No|03/16/2006 21:00|0|0|Page is valid, no graphics -- Color: D|

to improve their penetration in existing markets. We have also created marketing programs, such as GenerationH for our under 30 year old distributors, to help us better target important subsegments of the distributor andconsumer population. Additionally, in 2005 we introduced BizWorks, our Company’s new business systemwhich will assist our distributors in building their businesses more efficiently while better servicing theirexisting customers. And finally, to increase brand awareness among potential customers and distributors, wehave entered into marketing alliances, created “Team Herbalife” and began allowing our distributors to utilizethe Herbalife brand logo in their marketing efforts.
Direct-to-Consumer Strategy. We believe this strategy complements our distributors’ existing businessopportunities and it should build a longer-term, more sustainable customer base. We believe that providingdirect sales of our science-based products to end customers via the Internet, while maintaining the financialand business relationship between the customer and distributor, should allow distributors to increase retailing,improve recruiting and retain customers while leveraging our order taking, distribution, shipping, andcollections resources. In consultation with distributor leadership, we introduced Liftoff.com in December2005, to allow for a direct sale to end consumers via the internet of LiftoffTM, our effervescent energy product.We plan to further expand the e-commerce direct-to-consumer platform in 2006.
Product Strategy. We are committed to providing our distributors with unique, innovative products tohelp them increase sales and recruit new distributors. On an ongoing basis we will augment our productportfolio with additional science-based products and, as appropriate, will bundle products addressing similarhealth concerns into packages and programs. We are establishing a core set of products that will be available inall markets around the world. We are also empowering regional and country managers to develop uniqueproducts that are specific to their markets which should ensure that local consumer needs can be met.Additionally, each year we plan to have “mega launches” of products and/or programs which should generatecontinual excitement among our distributors, and which could add to the core set of products. These “megalaunches” will generally target specific market segments deemed strategic to us, such as a children’s line totarget stay-at-home moms and a sports and fitness line to target consumers who have active lifestyles.
China Strategy. While we plan to expand into new markets each year, expanding in China represents asignificant growth opportunity for us. In August 2005, China published direct sales and anti-pyramidingregulations that became effective in December 2005. We believe that China could become one of the largestdirect-selling markets in the world over the next several years. To address this opportunity, we have assembleda management team with direct selling experience, secured a headquarters location in Shanghai, expanded ourmanufacturing capacity in our Suzhou China factory, and we are in the process of opening retail locations andregistering additional products. In 2005, we opened 14 retail stores in 7 key provinces.
Infrastructure Strategy. In 2003, we embarked upon a strategic initiative to significantly upgrade ourtechnology infrastructure globally. We are implementing an Oracle enterprise-wide technology solution, witha scalable and stable open architecture platform, to enhance our efficiency and productivity as well as that ofour distributors. In addition, we are upgrading our internet-based marketing and distributor services platformwith tools such as BizWorks and MyHerbalife.com and we have invested in business intelligence tools toenable better analysis of our business. We expect these initiatives to be substantially complete by 2008.Additionally, we are investing in our employees through a comprehensive and global organizational devel-opment program which was initiated in 2005.
Product Overview
For 26 years, our products have been designed to help distributors and customers from around the world loseweight, improve their health, and experience life-changing results. We have built our heritage on developingformulas that blend the best of nature with innovative techniques from nutrition science, appealing to the growingbase of consumers seeking differentiated products and who desire a healthier lifestyle.
As of December 31, 2005, we marketed and sold 146 products encompassing over 3,000 SKUs through ourdistributors and had approximately 1,750 trademarks globally. We group our products into three categories: weightmanagement, inner nutrition, and Outer Nutrition». Our products are often sold in programs, which are comprisedof a series of related products designed to simplify weight management and nutrition for our consumers and
6
%%TRANSMSG*** Transmitting Job: V16934 PCN: 007000000 ***%%PCMSG|6 |00009|Yes|No|03/16/2006 21:00|0|0|Page is valid, no graphics -- Color: D|

maximize our distributors’ cross-selling opportunities. These programs target specific consumer market segments,such as women, men, mature adults, sports enthusiasts, as well as weight-loss and weight-management customersand individuals looking to enhance their overall well-being.
The following table summarizes our products by product category. The net sales figures are for the year endedDecember 31, 2005.
Product Category Description Representative Products
Weight Management(43.4% of 2005 net sales)
Meal replacements, weight-lossaccelerators and a variety ofhealthy snacks
Formula 1Personalized Protein PowderTotal Control»High Protein Bars and Snacks
Inner Nutrition(41.4% of 2005 net sales)
Dietary and nutritionalsupplements containing qualityherbs, vitamins, minerals andother natural ingredients
NiteworksTM
Garden 7 TM
Aloe ConcentrateLiftoff TM
Outer Nutrition»
(10.4% of 2005 net sales)Skin cleansers, moisturizers,lotions, shampoos and conditioners
Skin Activator» CreamRadiant C TM Body LotionHerbal Aloe Everyday ShampooNouriFusionTM
Weight management
Our weight-management products include the following:
• Formula 1 Protein Drink Mix, a meal-replacement protein powder available in multiple flavors;
• Formula 2 Multivitamin-Mineral & Herbal Tablets, which provide essential vitamins and nutrients and arepart of our weight-management programs;
• Personalized Protein Powder, a soy and whey protein source developed to be added to our meal replacementsto boost protein intake and decrease hunger;
• weight-loss accelerators, including Total Control», which address specific challenges associated withdieting, such as lack of energy, hunger and food craving, fluid retention, decreased metabolism anddigestive challenges, by building energy, boosting metabolism, curbing appetite and helping to promoteweight loss; and
• healthy snacks, formulated to provide between-meal nutrition and satisfaction.
Our best-selling Formula 1 meal replacement product has been part of our basic weight management programfor 26 years and generated approximately 27.4% of our retail sales in 2005. In March 2004, we introducedShapeWorksTM, a personalized protein-based meal replacement program based on the clinical experience and15 years of meal replacement research of Dr. David Heber, Director of the UCLA Center for Human Nutrition. TheShapeWorksTM program incorporates several of our leading weight management products. Our distributors helpidentify body type, analyze lean body mass, and customize a ShapeWorksTM program that can help increasemetabolism and control hunger.
Inner nutrition
We market numerous dietary and nutritional supplements designed to meet our customers’ specific nutritionalneeds. Each of these supplements contains quality herbs, vitamins, minerals and other natural ingredients andfocuses on specific lifestages and lifestyles of our customers, including women, men, children, mature adults, andathletes. For example, in 2003, we introduced NiteworksTM, a product developed in conjunction with Nobel Laureatein Medicine, Dr. Louis Ignarro. NiteworksTM supports energy, circulatory and vascular health and enhances bloodflow to the heart, brain and other vital organs. Another product, Garden 7 TM, is designed to provide thephytonutrient benefits of seven servings of fruits and vegetables, has anti-oxidant and health-boosting properties,and comes in convenient daily packs which can make nutrition simple. In 2005, we entered into the high growth
7
%%TRANSMSG*** Transmitting Job: V16934 PCN: 008000000 ***%%PCMSG|7 |00010|Yes|No|03/16/2006 21:00|0|0|Page is valid, no graphics -- Color: D|

energy drink category in the U.S. and Canada with the introduction of Liftoff TM — an innovative, effervescentenergy product.
Outer Nutrition»
Our Outer Nutrition» products complement our weight-management and inner nutrition products and aim toimprove the appearance of the body, skin and hair. These products include skin cleansers, toners, moisturizers andfacial masks, shampoos and conditioners, body-wash items and a selection of fragrances for men and women underthe brand names Radiant C TM and Skin Activator», among others. For example, our Radiant C TM Daily Skin Boosteris designed to harness the antioxidant power of vitamin C in a light gel-cream to help seal in moisture and minimizethe appearance of fine lines and wrinkles. In addition, we offer Skin Activator», an advanced cream based onglucosamine, almond oil, green tea and sugar that is also designed to reduce the appearance of fine lines andwrinkles, help skin regain a smoother, firmer appearance, and protect from dryness. In 2005 we upgraded andexpanded our personal care line with the introduction of NouriFusionTM. This product line utilizes vitamin A, C, andE to provide benefits to the skin.
Literature, promotional and other products
We also sell literature and promotional materials, including sales aids, informational audiotapes, videotapes,CDs and DVDs designed to support our distributors’ marketing efforts, as well as start-up kits called “InternationalBusiness Packs” for new distributors. For the year ended December 31, 2005, $75.9 million or 4.8% of our net saleswere derived from literature and promotional materials. In 2005 we introduced BizWorks, an internet basedsubscription toolset for distributors that enhances the on-line experience and improves their productivity.
Product Development
We are committed to providing our distributors with unique, innovative science-based products to help themincrease retail sales, and recruit and retain additional distributors. We believe this is accomplished by introducingnew products and by upgrading, reformulating and repackaging existing product lines. Our internal team ofscientists collaborate with the Company’s Scientific Advisory Board and Medical Advisory Board to formulate,review and evaluate new product ideas. Once a particular market opportunity has been identified, our scientistsalong with our marketing and sales teams work closely with distributors to effect a successful development andlaunch of the product.
We are focused on improving and enhancing our products through our product development efforts. Withregard to the weight management and inner nutrition categories, new product development involves all of ourproduct strategies groups including the product marketing, licensing, manufacturing, medical affairs, scientificaffairs, technical services and quality control groups. Product development generally begins with a review ofproduct or ingredient ideas by our scientific affairs group overseeing product design and feasibility research, and thetechnical services group overseeing scientific substantiation (evaluation of safety and efficacy), expert reviews andrelated product research. Product designs are transferred to technical services for development at the pre-prototypephase, but technically complex products are often taken to prototype phase by scientific affairs before transfer. Thetechnical services group then develops the manufacturing specifications/technology transfer package, which oftenrequires development of a prototype, and tests product stability. Prototypes are developed using contract facilities,with oversight by either scientific affairs or technical services, as appropriate. The quality control group, withsupport from the technical services group, is responsible for analytical methods development for ingredient labelclaims and manufacturing product release. Manufacturing is generally out-sourced to qualified vendors, althoughsome products are manufactured at our China manufacturing facility. Product quality assurance is the responsibilityof our quality control group. Concurrent with the technical evaluation and development of our products, ourmarketing teams work with our distributors strategy and planning teams to develop sales materials, training andeducation programs, and product testimonials to support new product launches.
With regard to the Outer Nutrition» category, new product development involves undertaking market trend andcompetitor assessment. We then undertake ideation, which involves creating ideas that fill our needs or our gaps butthat conform with our overall business strategy. We test final ideas with our distributors via global quantitative
8
%%TRANSMSG*** Transmitting Job: V16934 PCN: 009000000 ***%%PCMSG|8 |00012|Yes|No|03/16/2006 21:00|0|0|Page is valid, no graphics -- Color: D|

testing. Those ideas that have high retail potential and high personal use potential are considered for development.We then initiate development and undertake sensory tests and home use tests to determine if we need to make anyaesthetic improvements. Next, we test products in clinical trials or with expert panels for efficacy, safety and claimsubstantiation. Finally, we scale up for launch, complete stability and launch.
During the past three years, we have significantly increased our emphasis on the science of weight man-agement and nutrition. This is illustrated by our assembly of a dedicated internal product development teamcomposed of leading scientists as well as our recent establishment of a Scientific Advisory Board and MedicalAdvisory Board. Our Scientific Advisory Board is comprised of 17 renowned international scientists who areexperts in the fields of obesity and human nutrition, and who conduct product research and advise on productconcepts. Members of this board include David Heber, M.D., Ph.D., Professor of Medicine and Public Health at theUCLA School of Medicine, Director of the UCLA Center for Human Nutrition and Director of the UCLA Center forDietary Supplement Research in Botanicals, and Louis Ignarro, Ph.D., Distinguished Professor of Pharmacology atthe UCLA School of Medicine and Nobel Laureate in Medicine. In addition, our Medical Advisory Board iscomprised of three leading scientists and medical doctors, who provide training on product usage and give health-news updates through Herbalife literature, the internet, and live training events around the world.
We believe that it is important to maintain our relationships with the members of our Scientific Advisory Boardand Medical Advisory Board and to recognize the time and effort that they expend on our behalf. As a result, wehave agreed to compensate the members of these advisory boards as follows. A consulting firm with whichDr. Ignarro is affiliated is entitled to receive a royalty on sales of (a) NiteworksTM, (b) certain “healthy heart”products, and (c) other products that we may mutually designate in the future that are, in each case, sold with the aidof Dr. Ignarro’s consulting, promotional or endorsement services. We paid to the consulting firm, approximately$0.2 million, $0.9 million and $1.4 million in 2003, 2004 and 2005, respectively. In addition, we have madedonations from time to time to UCLA to fund research and educational programs. We contributed $50,000 in 2003,$100,000 in 2004 and $100,000 in 2005 as part of this arrangement. Dr. Heber receives no direct compensation fromus although we do reimburse him for travel expenses and we do pay to a consulting firm, with which Dr. Heber isaffiliated, a quarterly consulting fee of $75,000. Members of our Scientific Advisory Board are compensated fortheir time and efforts in the following manner: (a) one member is a consultant to us whose compensation for serviceon the board is reflected in his consulting fees, and (b) ten members are paid an annual retainer of $5,000 plus travelexpenses. In addition, each member of our Medical Advisory Board other than Dr. Heber (whose compensation isdescribed above) receives a monthly retainer of $5,000, plus $3,000 for every day that they appear at a non-southernCalifornia distributor event and $2,000 for every day that they need to travel to such events.
Since 2002, we have contributed to the establishment of the UCLA Lab through a grant aggregating $500,000.Additionally, in 2004 we donated lab equipment and software to the UCLA Lab. UCLA agreed that the donationswould be used to further research and education in the fields of weight management and botanical dietarysupplements. While our direct relationship with UCLA is currently limited to conducting two ongoing clinicalstudies, we intend to take full advantage of the expertise at UCLA by committing to support research that willfurther our understanding of the benefits of phytochemicals.
In August 2005, we appointed Steve Henig, Ph.D. to the newly created post of Chief Scientific Officer, withresponsibility for our product research and development function. Mr. Henig’s specific responsibilities includesetting Herbalife’s R&D direction; product innovation and development; scientific and medical affairs; productsafety and efficacy; and leadership of Herbalife’s Scientific Advisory Board, which is chaired by DavidHeber, M.D., Ph.D. Mr. Henig is a product innovator who brings more than two decades of experience in thedevelopment and marketing of nutrition products to Herbalife. He most recently served as Senior Vice President atOcean Spray Cranberries, Inc. where he revitalized that company’s new products program and medical researchprogram for Ocean Spray. He has also consulted with a number of leading companies, including POM Wonderful.
We believe our focus on nutrition science and our efforts at combining our internal research and developmentefforts with the scientific expertise of our Scientific Advisory Board, the educational skills of the Medical AdvisoryBoard, and the resources of the UCLA Lab should result in meaningful product introductions and give ourdistributors and consumers increased confidence in our products.
9
%%TRANSMSG*** Transmitting Job: V16934 PCN: 010000000 ***%%PCMSG|9 |00011|Yes|No|03/16/2006 21:00|0|0|Page is valid, no graphics -- Color: D|

Network Marketing Program
General
Our products are distributed through a global network marketing organization comprised of over one millionindependent distributors in 60 countries, except in China where, due to regulations, our sales are conducted throughcompany operated retail stores, preferred customers, and employed sales management personnel. In addition tohelping them achieve physical health and wellness through use of our products, we offer our distributors, who areindependent contractors, attractive income opportunities. Distributors may earn income on their own sales and canalso earn royalties and bonuses on sales made by the distributors in their sales organizations. We believe that ourproducts are particularly well-suited to the network marketing distribution channel because sales of weightmanagement and health and wellness products are strengthened by ongoing personal contact between retailconsumers and distributors. We believe our continued commitment to developing innovative, science-basedproducts will enhance our ability to attract new distributors as well as increase the productivity and retentionof existing distributors. Furthermore, our international sponsorship program, which permits distributors to sponsordistributors in other countries where we are licensed to do business and where we have obtained required productapprovals, provides a significant advantage to our distributors as compared with distributors in some other networkmarketing organizations.
In connection with the Acquisition, we entered into an agreement with our distributors on July 18, 2002 that nomaterial changes adverse to the distributors will be made to the existing marketing plan and that we will continue todistribute Herbalife products exclusively through our independent distributors. We believe that this agreement hasstrengthened our relationship with our existing distributors, improved our ability to recruit new distributors andgenerally increased the long-term stability of our business.
Structure of the network marketing program
To become a distributor, a person must be sponsored by an existing distributor, except in China where nosponsorship is allowed, and must purchase an International Business Pack from us, except in South Korea, wherethere is no charge for a distributor kit. The International Business Pack is a distributor kit available in locallanguages. The kit comes in two sizes. The larger kit costs the local currency equivalent of about $75 and includes acan of ShapeWorksTM/Formula 1, several bottles of different nutritional supplements, booklets describing us, ourcompensation plan and rules of conduct, various training and promotional materials, distributor applications and aproduct catalog. The smaller version costs the local currency equivalent of about $50 and includes sample productsand essentially the same print and promotional materials as included in the larger kit version. To become asupervisor or qualify for a higher level, distributors must achieve specified volumes of product purchases or earncertain amounts of royalty overrides during specified time periods and must re-qualify for the levels once each year.To attain supervisor status, a distributor generally must purchase products representing at least 4,000 volume pointsin one month or 2,500 volume points in two consecutive months. China has its own unique qualifying program.Volume points are point values assigned to each of our products that are equal in all countries and are based on thesuggested retail price of U.S. products (one volume point equates to one U.S. dollar). Supervisors may then attainhigher levels, (consisting of the World Team, the Global Expansion Team, the Millionaire Team, the President’sTeam, the Chairman’s Club and the Founders Circle) and earn increasing amounts of royalty overrides based onpurchases by distributors within their organizations and, for members of our Global Expansion Team and above,earn production bonuses on sales in their downline sales organizations. Supervisors contribute significantly to oursales and some key supervisors who have attained the highest levels within our distributor network are responsiblefor their organization’s generation of a substantial portion of our sales and for recruiting a substantial number of ourdistributors.
10
%%TRANSMSG*** Transmitting Job: V16934 PCN: 011000000 ***%%PCMSG|10 |00009|Yes|No|03/16/2006 21:00|0|0|Page is valid, no graphics -- Color: D|

The following table sets forth the number of our supervisors at the dates indicated:
2001 2002 2003 2004** 2005February*
The Americas . . . . . . . . . . . . . . . . . . . . . . . 55,465 62,737 67,921 75,359 87,925
Europe . . . . . . . . . . . . . . . . . . . . . . . . . . . . 42,419 47,230 51,290 70,239 65,104
Asia/Pacific Rim . . . . . . . . . . . . . . . . . . . . . 43,230 40,423 35,637 31,790 38,524
Japan . . . . . . . . . . . . . . . . . . . . . . . . . . . . . 23,589 22,013 18,287 13,946 9,547
Worldwide . . . . . . . . . . . . . . . . . . . . . . . . . 164,703 172,403 173,135 191,334 201,100
* In February of each year, we delete from the rank of supervisor those supervisors who did not satisfy thesupervisor qualification requirements during the preceding twelve months. Distributors who meet the super-visor requirements at any time during the year are promoted to supervisor status at that time, including anysupervisors who were deleted, but who subsequently requalified. For the latest twelve month re-qualificationperiod ending January 2005, approximately 60 percent of our supervisors did not re-qualify and more than 90%of our distributors that are not supervisors turned over. Distributors who purchase our product for personalconsumption or for short term weight loss or income goals may stay with us for several months to one year.Supervisors who have committed time and effort to build a sales organization generally stay for longer periods.We rely on certifications from the selling distributors as to the amount and source of product sales to otherdistributors which are not directly verifiable by us. In order to increase retailing of our products, we havemodified our requalification criteria to provide that any distributor that earns at least 4,000 volume points in any12-month period can requalify as a supervisor and retain a discount of 50% from suggested retail prices, but willforfeit their distributor organization and associated earnings. For a supervisor to requalify and retain theirdistributor organization and associated earnings, they need to earn 4,000 volume points in one month or2,500 volume points in two consecutive months.
** In 2004, certain modifications were made to the re-qualification criteria resulting in approximately19,000 additional supervisors, including approximately 9,000 related to a change in the business model inRussia.
Distributor earnings
Distributor earnings are derived from several sources. First, distributors may earn profits by purchasing ourproducts at wholesale prices, which are discounted 25% to 50% from suggested retail prices, depending on thedistributors’ level within our distributor network, and selling our products to retail customers or to other distributors.Second, distributors who sponsor other distributors and establish their own sales organizations may earn (a) royaltyoverrides, 15% of product retail sales in the aggregate, (b) production bonuses, 7% of product retail sales in theaggregate and (c) the Mark Hughes bonus, up to 1% of product retail sales in the aggregate. Royalty overridestogether with the distributor allowances represent the potential earnings to distributors of up to approximately 73%of retail sales.
Under the regulations recently published by the Government of China, direct selling companies will be limitedto the payment of gross compensation to direct sellers of 30% of the revenue they generate through their own salesof products to consumers. The Company will incur substantial ongoing additional costs relating to the inclusion inthe China business model of company operated retail stores, employed sales management personnel and companyprovided training and certification procedures for sales personnel, features not common elsewhere in our businessmodel.
Distributors earn the right to receive royalty overrides upon attaining the level of supervisor and above, andproduction bonuses upon attaining the level of Global Expansion Team and above. Once a distributor becomes asupervisor, he or she has an incentive to qualify, by earning specified amounts of royalty overrides, as a member ofthe Global Expansion Team, the Millionaire Team or the President’s Team, and thereby receive production bonusesof up to 7%. We believe that the right of distributors to earn royalty overrides and production bonuses contributessignificantly to our ability to retain our most productive distributors.
11
%%TRANSMSG*** Transmitting Job: V16934 PCN: 012000000 ***%%PCMSG|11 |00008|Yes|No|03/16/2006 21:00|0|0|Page is valid, no graphics -- Color: D|

As noted above, our compensation plan offers distributors opportunities to achieve higher levels of potentialearnings up to ultimately 73% of retail sales, through a combination of royalty overrides and distributor allowances.Each distributor’s success is dependent on two primary factors: the time, effort and commitment a distributor putsinto his or her Herbalife business and the product sales made by a distributor and his or her sales organization.
Many of our non-supervisor distributors join Herbalife to obtain a 25% discount on our products and become adiscount consumer or merely have a part-time income goal in mind. Consequently, non-supervisor earnings tend tobe relatively low and are not tracked by the Company.
Distributor motivation and training
We believe that motivation and training are key elements in distributor success and that we and our distributorsupervisors have established a consistent schedule of events to support these needs. We and our distributorleadership conduct thousands of training sessions annually on local, regional and global levels to educate andmotivate our distributors. Every month, there are hundreds of one-day Success Training Seminars held throughoutthe world. Annually, in each major territory or region, there is a three-day World Team School typically attended by2,000 to 10,000 distributors that focuses on product and business development. Additionally, once a year in eachregion, we host an Extravaganza at which our distributors from around the world can come to learn about newproducts, expand their skills and celebrate their success. In 2005, we conducted a worldwide extravaganza incelebration of the Company’s 25th anniversary, in Atlanta where more than 34,000 distributors attended. Additionalregional events were held in 2005 in Mexico City, Sao Paulo and Japan.
In addition to these training sessions, we have our own “Herbalife Broadcast Network” that we use to providedistributors continual training and the most current product and marketing information. The Herbalife BroadcastNetwork can be seen on the internet.
Distributor reward and recognition is a significant factor in motivating our distributors. Each year, we investover $40 million in regional and worldwide promotions to motivate our distributors to achieve and exceed both salesand recruiting goals. Examples of our worldwide promotions are our 25th Anniversary Cruise that took place inApril 2005, under which distributors qualified to receive a cruise vacation, and our Atlanta Challenge, under whichdistributors earned rewards for exceeding their prior year base-line performance. In Atlanta, the Companyintroduced a Worldwide Cup Promotion that was the primary promotion for 2005.
12
%%TRANSMSG*** Transmitting Job: V16934 PCN: 013000000 ***%%PCMSG|12 |00009|Yes|No|03/16/2006 21:00|0|0|Page is valid, no graphics -- Color: D|

Geographic Presence
As of December 31, 2005, we conducted business in 60 countries located in the Americas, Europe, Asia/Pacific Rim (excluding Japan) and Japan. The following charts sets forth the countries we have opened andcurrently operate in as of December 31, 2005, the year in which we commenced operations in those countries andnet sales information by region for the past three fiscal years.
CountryYear
Entered
Europe*United Kingdom . . . . . . . . . . . . . . . . . . . . . . . . . . . . . . . . . . . . . . . . . . . . . . . . . . . . . . . . 1984
Spain . . . . . . . . . . . . . . . . . . . . . . . . . . . . . . . . . . . . . . . . . . . . . . . . . . . . . . . . . . . . . . . . . 1989
Israel . . . . . . . . . . . . . . . . . . . . . . . . . . . . . . . . . . . . . . . . . . . . . . . . . . . . . . . . . . . . . . . . . 1989
France . . . . . . . . . . . . . . . . . . . . . . . . . . . . . . . . . . . . . . . . . . . . . . . . . . . . . . . . . . . . . . . . 1990
Germany . . . . . . . . . . . . . . . . . . . . . . . . . . . . . . . . . . . . . . . . . . . . . . . . . . . . . . . . . . . . . . 1990
Portugal . . . . . . . . . . . . . . . . . . . . . . . . . . . . . . . . . . . . . . . . . . . . . . . . . . . . . . . . . . . . . . . 1992
Czech Republic . . . . . . . . . . . . . . . . . . . . . . . . . . . . . . . . . . . . . . . . . . . . . . . . . . . . . . . . . 1992
Italy. . . . . . . . . . . . . . . . . . . . . . . . . . . . . . . . . . . . . . . . . . . . . . . . . . . . . . . . . . . . . . . . . . 1992
Netherlands . . . . . . . . . . . . . . . . . . . . . . . . . . . . . . . . . . . . . . . . . . . . . . . . . . . . . . . . . . . . 1993Belgium . . . . . . . . . . . . . . . . . . . . . . . . . . . . . . . . . . . . . . . . . . . . . . . . . . . . . . . . . . . . . . 1994
Poland . . . . . . . . . . . . . . . . . . . . . . . . . . . . . . . . . . . . . . . . . . . . . . . . . . . . . . . . . . . . . . . . 1994
Denmark . . . . . . . . . . . . . . . . . . . . . . . . . . . . . . . . . . . . . . . . . . . . . . . . . . . . . . . . . . . . . . 1994
Sweden . . . . . . . . . . . . . . . . . . . . . . . . . . . . . . . . . . . . . . . . . . . . . . . . . . . . . . . . . . . . . . . 1994
Russia . . . . . . . . . . . . . . . . . . . . . . . . . . . . . . . . . . . . . . . . . . . . . . . . . . . . . . . . . . . . . . . . 1995
Austria . . . . . . . . . . . . . . . . . . . . . . . . . . . . . . . . . . . . . . . . . . . . . . . . . . . . . . . . . . . . . . . 1995
Switzerland . . . . . . . . . . . . . . . . . . . . . . . . . . . . . . . . . . . . . . . . . . . . . . . . . . . . . . . . . . . . 1995
South Africa . . . . . . . . . . . . . . . . . . . . . . . . . . . . . . . . . . . . . . . . . . . . . . . . . . . . . . . . . . . 1995
Norway . . . . . . . . . . . . . . . . . . . . . . . . . . . . . . . . . . . . . . . . . . . . . . . . . . . . . . . . . . . . . . . 1995
Finland . . . . . . . . . . . . . . . . . . . . . . . . . . . . . . . . . . . . . . . . . . . . . . . . . . . . . . . . . . . . . . . 1995
Greece . . . . . . . . . . . . . . . . . . . . . . . . . . . . . . . . . . . . . . . . . . . . . . . . . . . . . . . . . . . . . . . . 1996
Turkey . . . . . . . . . . . . . . . . . . . . . . . . . . . . . . . . . . . . . . . . . . . . . . . . . . . . . . . . . . . . . . . . 1998
Botswana. . . . . . . . . . . . . . . . . . . . . . . . . . . . . . . . . . . . . . . . . . . . . . . . . . . . . . . . . . . . . . 1998
Lesotho . . . . . . . . . . . . . . . . . . . . . . . . . . . . . . . . . . . . . . . . . . . . . . . . . . . . . . . . . . . . . . . 1998
Namibia . . . . . . . . . . . . . . . . . . . . . . . . . . . . . . . . . . . . . . . . . . . . . . . . . . . . . . . . . . . . . . 1998
Swaziland . . . . . . . . . . . . . . . . . . . . . . . . . . . . . . . . . . . . . . . . . . . . . . . . . . . . . . . . . . . . . 1998
Iceland . . . . . . . . . . . . . . . . . . . . . . . . . . . . . . . . . . . . . . . . . . . . . . . . . . . . . . . . . . . . . . . 1999
Slovak Republic . . . . . . . . . . . . . . . . . . . . . . . . . . . . . . . . . . . . . . . . . . . . . . . . . . . . . . . . . 1999
Cyprus. . . . . . . . . . . . . . . . . . . . . . . . . . . . . . . . . . . . . . . . . . . . . . . . . . . . . . . . . . . . . . . . 2000
Ireland . . . . . . . . . . . . . . . . . . . . . . . . . . . . . . . . . . . . . . . . . . . . . . . . . . . . . . . . . . . . . . . . 2000
Croatia . . . . . . . . . . . . . . . . . . . . . . . . . . . . . . . . . . . . . . . . . . . . . . . . . . . . . . . . . . . . . . . 2001
Latvia . . . . . . . . . . . . . . . . . . . . . . . . . . . . . . . . . . . . . . . . . . . . . . . . . . . . . . . . . . . . . . . . 2002
Ukraine . . . . . . . . . . . . . . . . . . . . . . . . . . . . . . . . . . . . . . . . . . . . . . . . . . . . . . . . . . . . . . . 2002
Estonia . . . . . . . . . . . . . . . . . . . . . . . . . . . . . . . . . . . . . . . . . . . . . . . . . . . . . . . . . . . . . . . 2003
Lithuania . . . . . . . . . . . . . . . . . . . . . . . . . . . . . . . . . . . . . . . . . . . . . . . . . . . . . . . . . . . . . . 2003Hungary. . . . . . . . . . . . . . . . . . . . . . . . . . . . . . . . . . . . . . . . . . . . . . . . . . . . . . . . . . . . . . . 2005
13
%%TRANSMSG*** Transmitting Job: V16934 PCN: 014000000 ***%%PCMSG|13 |00007|Yes|No|03/16/2006 21:00|0|0|Page is valid, no graphics -- Color: D|

CountryYear
Entered
The AmericasUSA . . . . . . . . . . . . . . . . . . . . . . . . . . . . . . . . . . . . . . . . . . . . . . . . . . . . . . . . . . . . . . . . . 1980
Canada . . . . . . . . . . . . . . . . . . . . . . . . . . . . . . . . . . . . . . . . . . . . . . . . . . . . . . . . . . . . . . . 1982
Mexico . . . . . . . . . . . . . . . . . . . . . . . . . . . . . . . . . . . . . . . . . . . . . . . . . . . . . . . . . . . . . . . 1989
Venezuela . . . . . . . . . . . . . . . . . . . . . . . . . . . . . . . . . . . . . . . . . . . . . . . . . . . . . . . . . . . . . 1994
Dominican Republic . . . . . . . . . . . . . . . . . . . . . . . . . . . . . . . . . . . . . . . . . . . . . . . . . . . . . 1994
Argentina . . . . . . . . . . . . . . . . . . . . . . . . . . . . . . . . . . . . . . . . . . . . . . . . . . . . . . . . . . . . . 1994
Brazil . . . . . . . . . . . . . . . . . . . . . . . . . . . . . . . . . . . . . . . . . . . . . . . . . . . . . . . . . . . . . . . . 1995
Chile . . . . . . . . . . . . . . . . . . . . . . . . . . . . . . . . . . . . . . . . . . . . . . . . . . . . . . . . . . . . . . . . . 1997
Jamaica . . . . . . . . . . . . . . . . . . . . . . . . . . . . . . . . . . . . . . . . . . . . . . . . . . . . . . . . . . . . . . . 1999
Panama . . . . . . . . . . . . . . . . . . . . . . . . . . . . . . . . . . . . . . . . . . . . . . . . . . . . . . . . . . . . . . . 2000
Colombia . . . . . . . . . . . . . . . . . . . . . . . . . . . . . . . . . . . . . . . . . . . . . . . . . . . . . . . . . . . . . . 2001
Bolivia . . . . . . . . . . . . . . . . . . . . . . . . . . . . . . . . . . . . . . . . . . . . . . . . . . . . . . . . . . . . . . . 2004
Asia/Pacific Rim and JapanAustralia . . . . . . . . . . . . . . . . . . . . . . . . . . . . . . . . . . . . . . . . . . . . . . . . . . . . . . . . . . . . . . 1983
New Zealand . . . . . . . . . . . . . . . . . . . . . . . . . . . . . . . . . . . . . . . . . . . . . . . . . . . . . . . . . . . 1988
Japan . . . . . . . . . . . . . . . . . . . . . . . . . . . . . . . . . . . . . . . . . . . . . . . . . . . . . . . . . . . . . . . . . 1989
Hong Kong . . . . . . . . . . . . . . . . . . . . . . . . . . . . . . . . . . . . . . . . . . . . . . . . . . . . . . . . . . . . 1992
Philippines. . . . . . . . . . . . . . . . . . . . . . . . . . . . . . . . . . . . . . . . . . . . . . . . . . . . . . . . . . . . . 1994
Taiwan . . . . . . . . . . . . . . . . . . . . . . . . . . . . . . . . . . . . . . . . . . . . . . . . . . . . . . . . . . . . . . . 1995
Korea (South) . . . . . . . . . . . . . . . . . . . . . . . . . . . . . . . . . . . . . . . . . . . . . . . . . . . . . . . . . . 1996
Thailand . . . . . . . . . . . . . . . . . . . . . . . . . . . . . . . . . . . . . . . . . . . . . . . . . . . . . . . . . . . . . . 1997
Indonesia . . . . . . . . . . . . . . . . . . . . . . . . . . . . . . . . . . . . . . . . . . . . . . . . . . . . . . . . . . . . . . 1998
India . . . . . . . . . . . . . . . . . . . . . . . . . . . . . . . . . . . . . . . . . . . . . . . . . . . . . . . . . . . . . . . . . 1999
China . . . . . . . . . . . . . . . . . . . . . . . . . . . . . . . . . . . . . . . . . . . . . . . . . . . . . . . . . . . . . . . . 2001
Macau . . . . . . . . . . . . . . . . . . . . . . . . . . . . . . . . . . . . . . . . . . . . . . . . . . . . . . . . . . . . . . . . 2002
Singapore . . . . . . . . . . . . . . . . . . . . . . . . . . . . . . . . . . . . . . . . . . . . . . . . . . . . . . . . . . . . . 2003
* Europe includes Africa and Middle Eastern countries.
Geographic Region 2003 2004 2005 2005
Number ofCountries
December 31,2005
Year Ended December 31,Percent of
Total Net Sales
The Americas. . . . . . . . . . . . . . . . . . . . . . . $ 424.4 $ 468.2 $ 681.7 43.5% 12
Europe . . . . . . . . . . . . . . . . . . . . . . . . . . . . 448.2 536.2 545.3 34.8% 35
Asia/Pacific Rim (excluding Japan) . . . . . . . 167.5 206.5 245.1 15.6% 12
Japan . . . . . . . . . . . . . . . . . . . . . . . . . . . . . 119.3 98.8 94.7 6.1% 1
Total . . . . . . . . . . . . . . . . . . . . . . . . . . . . . $1,159.4 $1,309.7 $1,566.8 100.0% 60
Over the most recent five years, the top six countries of each year have gone from representing approximately69% of net sales in 2001 to 56% of net sales in 2005 reflecting our broad geographical diversification.
After entering a new country, we in many instances experience an initial period of rapid growth in sales as newdistributors are recruited, followed by a decline in sales. We believe that a significant factor affecting these marketsis the opening of other new markets within the same geographic region or with the same or similar language orcultural bases. Some distributors then tend to focus their attention on the business opportunities provided by thesenewer markets instead of developing their established sales organizations in existing markets. Additionally, in some
14
%%TRANSMSG*** Transmitting Job: V16934 PCN: 015000000 ***%%PCMSG|14 |00008|Yes|No|03/16/2006 21:00|0|0|Page is valid, no graphics -- Color: D|

instances, we have become aware that certain sales in certain existing markets were attributable to purchasers whodistributed our products in countries that had not yet been opened. When these countries were opened, the sales inexisting markets shifted to the newly opened markets, resulting in a decline in sales in the existing markets. To theextent we decide to open new markets in the future, we will continue to seek to minimize the impact on distributorfocus in existing markets and to ensure that adequate distributor support services and other Herbalife systems are inplace to support growth.
Manufacturing and Distribution
All of our weight management, nutritional and personal care products are manufactured for us by third partymanufacturing companies, with the exception of products distributed in and sourced from China, where we have ourown manufacturing facility. We source our products from multiple manufacturers, with our top three suppliersaccounting for approximately 40% of our product purchases in 2005. In addition, each of our products can be madeavailable from a secondary vendor if necessary. We work closely with our vendors in an effort to achieve the highestquality standards and product availability. We also have our own quality control lab in which we routinely testproducts received from vendors. We have established excellent relationships with our manufacturers and haveobtained improvements in supply services, product quality and product delivery. Historically, we have not beensubject to material price increases by our suppliers, and we believe that in the event of price increases, we have theability to respond to a portion of the price increases by raising the prices of our products. We own the proprietaryformulations for substantially all of our weight management products and dietary and nutritional supplements.
In order to coordinate and manage the manufacturing of our products, we utilize a significant demand planningand forecasting process that is directly tied to our production planning and purchasing systems. Using thissophisticated planning software and process allows us to balance our inventory levels to provide exceptional serviceto distributors while minimizing working capital and inventory obsolescence.
Our global distribution system features centralized distribution and telephone ordering systems coupled withstorefront distributor service centers. Our major distribution warehouses have been automated with “pick-to-light”picking systems which consistently deliver over 99.5% order accuracy and handling systems that provide forinspection of every shipment before it is sent to delivery. Shipping and processing standards for orders placed areeither the same day or the following business day. We have central sales ordering facilities for answering andprocessing telephone orders. Operators at such centers are capable of conversing in multiple languages.
Our products are distributed to foreign markets either from the facilities of our manufacturers or from ourLos Angeles and Venray, Netherlands distribution centers. Products are distributed in the United States market fromour Los Angeles distribution center, our Memphis distribution center or from our Dallas sales center. Nutritionproducts manufactured in countries globally are generally transported by truck, cargo ship or plane to ourinternational markets and are warehoused in either one of our foreign distribution centers or a contracted thirdparty warehouse and distribution center. After arrival of the products in a foreign market, distributors purchase theproducts from the local distribution center or the associated sales center. Our Outer Nutrition» products arepredominantly manufactured in Europe and the United States. The products manufactured in Europe are shipped toa centralized warehouse facility, from which delivery by truck, ship or plane to other international markets occurs.
Product Return and Buy-Back Policies
In most markets, our products include a customer satisfaction guarantee. Under this guarantee, within 30 daysof purchase, any customer who is not satisfied with an Herbalife product for any reason may return it or any unusedportion of it to the distributor from whom it was purchased for a full refund from the distributor or credit toward thepurchase of another Herbalife product. If they return the products to us on a timely basis, distributors may obtainreplacements from us for such returned products. In addition, in most jurisdictions, we maintain a buy-backprogram pursuant to which we will repurchase products sold to a distributor provided that the distributor resigns asan Herbalife distributor, returns the product in marketable condition generally within twelve months of originalpurchase and meets certain documentation and other requirements. We believe this buy-back policy addresses anumber of the regulatory compliance issues pertaining to network marketing, in that it offers monetary protection todistributors who want to exit the business.
15
%%TRANSMSG*** Transmitting Job: V16934 PCN: 016000000 ***%%PCMSG|15 |00011|Yes|No|03/16/2006 21:00|0|0|Page is valid, no graphics -- Color: D|

Historically, product returns and buy-backs have not been significant and have been steadily declining overthese reporting periods. Product returns, refunds and buy-back expenses approximated 1.9%, 1.1%, and 1.0% ofretail sales in 2003, 2004 and 2005, respectively.
Management Information, Internet and Telecommunication Systems
In order to facilitate our continued growth and support distributor activities, we continually upgrade ourmanagement information, internet and telecommunication systems. These systems include: (1) a centralized hostcomputer managed by Hewlett Packard in Colorado, which is linked to our international markets through adedicated wide area network that provides on-line, real-time computer connectivity and access and hosts our legacyoperating systems and our new Oracle platform; (2) local area networks of personal computers within our markets,serving our regional administrative staffs; (3) an international e-mail system through which our employeescommunicate; (4) a standardized Northern Telecom Meridian telecommunication system in most of our markets;(5) a fully integrated Oracle supply chain management system that has been installed in our distribution centers; and(6) internet websites to provide a variety of online services for distributors (status of qualifications, meetingannouncements, product information, application forms, educational materials and, in the United States, salesordering capabilities). These systems are designed to provide financial and operating data for management, timelyand accurate product ordering, royalty override payment processing, inventory management and detailed distributorrecords. We intend to continue to invest in our systems in order to strengthen our operating platform.
Regulation
General. In both our United States and foreign markets, we are affected by extensive laws, governmentalregulations, administrative determinations, court decisions and similar constraints. Such laws, regulations and otherconstraints exist at the federal, state or local levels in the United States and at all levels of government in foreignjurisdictions, including regulations pertaining to: (1) the formulation, manufacturing, packaging, labeling, distri-bution, importation, sale and storage of our products; (2) product claims and advertising, including direct claims andadvertising by us, as well as claims and advertising by distributors, for which we may be held responsible; (3) ournetwork marketing program; (4) transfer pricing and similar regulations that affect the level of U.S. and foreigntaxable income and customs duties; and (5) taxation of distributors (which in some instances may impose anobligation on us to collect the taxes and maintain appropriate records).
Products. In the United States, the formulation, manufacturing, packaging, storing, labeling, promotion,advertising, distribution and sale of our products are subject to regulation by various governmental agencies,including (1) the FDA, (2) the Federal Trade Commission (“FTC”), (3) the Consumer Product Safety Commission(“CPSC”), (4) the United States Department of Agriculture (“USDA”), (5) the Environmental Protection Agency(“EPA”), (6) the United States Postal Service, (7) United States Customs and Border Protection, and (8) the DrugEnforcement Administration. Our activities also are regulated by various agencies of the states, localities andforeign countries in which our products are manufactured, distributed and sold. The FDA, in particular, regulates theformulation, manufacture and labeling of conventional foods, dietary supplements, cosmetics and over-the-counter(“OTC”) drugs, such as those distributed by us. FDA regulations require us and our suppliers to meet relevantcurrent good manufacturing practice (“cGMP”) regulations for the preparation, packing and storage of foods andOTC drugs. On March 7, 2003, the FDA released for comment its proposed cGMP’s for dietary supplements. If theFDA issues the final cGMPs for dietary supplements in 2006, as the FDA now expects, we will have up to one yearto ensure compliance. We expect to see an increase in certain manufacturing costs as a result of the necessaryincrease in testing of raw ingredients and finished products and compliance with higher quality standards.
Most OTC drugs are subject to FDA Monographs that establish labeling and composition for these products.Our products must comply with these Monographs, and our manufacturers must list all products with the FDA andfollow cGMP. Our cosmetic products are regulated for safety by the FDA, which requires that ingredients meetindustry standards for non-allergenicity and non-toxicity. Performance claims for cosmetics may not be“therapeutic.”
The U.S. 1994 Dietary Supplement Health and Education Act (“DSHEA”) revised the provisions of theFederal Food, Drug and Cosmetic Act (“FFDCA”) concerning the composition and labeling of dietary supplements
16
%%TRANSMSG*** Transmitting Job: V16934 PCN: 017000000 ***%%PCMSG|16 |00009|Yes|No|03/16/2006 21:00|0|0|Page is valid, no graphics -- Color: D|

and, we believe, is generally favorable to the dietary supplement industry. The legislation created a new statutoryclass of dietary supplements. This new class includes vitamins, minerals, herbs, amino acids and other dietarysubstances for human use to supplement the diet, and the legislation grandfathers, with some limitations, dietaryingredients that were on the market before October 15, 1994. A dietary supplement that contains a dietary ingredientthat was not on the market before October 15, 1994 will require evidence of a history of use or other evidence ofsafety establishing that it is reasonably expected to be safe. Manufacturers or marketers of dietary supplements inthe United States and certain other jurisdictions that make product performance claims, including structure orfunction claims, must have substantiation in their possession that the statements are truthful and not misleading. Themajority of the products marketed by us in the United States are classified as conventional foods or dietarysupplements under the FFDCA. Internationally, the majority of products marketed by us are classified as foods orfood supplements.
In January 2000, the FDA issued a regulation that defines the types of statements that can be made concerningthe effect of a dietary supplement on the structure or function of the body pursuant to DSHEA. Under DSHEA,dietary supplement labeling may bear structure or function claims, which are claims that the products affect thestructure or function of the body, without prior FDA approval, but with notification to the FDA. They may not bear aclaim that they can prevent, treat, cure, mitigate or diagnose disease (a disease claim). The regulation describes howthe FDA distinguishes disease claims from structure or function claims. During 2004, the FDA issued a guidance,paralleling an earlier guidance from the FTC, defining a manufacturers obligations to substantiate structure/function claims. The FDA also issued a Structure/Function Claims Small Entity Compliance Guide. In addition, theagency permits companies to use FDA-approved full and qualified health claims for products containing specificingredients that meet stated requirements.
As a marketer of dietary and nutritional supplements and other products that are ingested by consumers, we aresubject to the risk that one or more of the ingredients in our products may become the subject of regulatory action. Anumber of states restricted the sale of dietary supplements containing botanical sources of ephedrine alkaloids. As aresult of these state regulations, we stopped sales of its dietary supplements containing botanical sources ofephedrine alkaloids due to a shift in consumer preference for “ephedra free products” and a significant increase inproducts liability insurance premiums for products containing botanical sources of ephedrine group alkaloids. OnDecember 31, 2002, we ceased sales of Thermojetics» original green herbal tablets containing ephedrine alkaloidsderived from Chinese Ma huang, as well as Thermojetics» green herbal tablets and Thermojetics» gold herbaltablets (the latter two containing the herb Sida cordifolia which is another botanical source of ephedrine alkaloids).On February 6, 2004, the FDA published a rule finding that dietary supplements containing ephedrine alkaloidspresent an unreasonable risk of illness or injury under conditions of use recommended or suggested in the labelingof the product, or, if no conditions of use are suggested in the labeling, under ordinary conditions of use, and aretherefore adulterated.
The FDA has on record a small number of reports of adverse reactions allegedly resulting from the ingestion ofour Thermojetics» original green tablet. These reports are among thousands of reports of adverse reactions to theseproducts sold by other companies.
As a further outgrowth of the FDA ephedra safety review, the FDA, in January 2004, announced that it wouldundertake a review of the safety of the herb Citrus aurantium. We had previously used Citrus aurantium in theShapeWorksTM total control and Thermojetics» green ephedra-free dietary supplements sold in the United States andin a number of international markets. Unconfirmed reports of serious adverse events, reportedly associated withCitrus aurantium, were disclosed by the FDA to the New York Times during April 2004. Under the Freedom ofInformation Act, we obtained a copy of those anecdotal serious adverse event reports. No Herbalife dietarysupplement containing Citrus aurantium was cited by the FDA. Indeed, many cited products from other companiesdid not even contain Citrus aurantium. Nonetheless, we decided to reformulate our products and within theUnited States no longer market dietary supplements containing Citrus aurantium. Internationally, due to longerproduct registration lead times, we are in the process of reformulating our foreign products containing Citrusaurantium and expect to complete such reformulation by the end of 2006.
The FDA’s decision to ban ephedra triggered a significant reaction by the national media, some of whom arecalling for the repeal or amendment of DSHEA. These media view supposed “weaknesses” within DSHEA as the
17
%%TRANSMSG*** Transmitting Job: V16934 PCN: 018000000 ***%%PCMSG|17 |00006|Yes|No|03/16/2006 21:00|0|0|Page is valid, no graphics -- Color: D|

underlying reason why ephedra was allowed to remain on the market. We have been advised that DSHEA opponentsin Congress may use this anti-DSHEA momentum to advance existing or new legislation during the 109th Congressto amend or repeal DSHEA. We currently expect to see the following: (1) calls for mandatory reporting of seriousadverse event reports for supplements; (2) premarket approval for safety and effectiveness of dietary ingredients;(3) specific premarket review of dietary ingredient stimulants that are and will be used to replace ephedra;(4) reversal of the burden of proof standard which now rests on the FDA; and (5) a redefining of “dietary ingredient”to remove either botanicals or selected classes of ingredients now treated as dietary ingredients.
On September 16, 2002, the FDA changed its policies for notifying companies of anecdotal adverse eventreports for dietary supplements. Since then, to date we have received nine anecdotal special nutritional adverseevents reports from the FDA. These anecdotal special nutritional adverse event reports describe a variety of reportedcomplaints. While anecdotal redacted adverse event report documents do not always indicate which product(s) theconsumer reportedly ingested, several adverse event reports, suggest the consumer ingested varying, sometimesunspecified, Herbalife products, including two products no longer sold by Herbalife, Thermojetics Original Greenand Thermojetics Gold dietary supplements. The incidents occurred within varying intervals of time following thereported use of Herbalife products. As a result of our receipt of adverse event reports we may from time to time elector be required to remove a product from a market, either permanently or temporarily. We are in the process ofrefining our processes for gathering and reporting “serious” dietary supplement adverse event reports in thosemarkets where such reporting is required. Currently, this process is managed by our Scientific Affairs department incollaboration with our Medical Affairs department and our Distributor Relations Call Centers.
On March 7, 2003, the FDA proposed a new regulation to require current good manufacturing practicesaffecting the manufacture, packing, and holding of dietary supplements. The proposed regulation would establishstandards to ensure that dietary supplements and dietary ingredients are not adulterated with contaminants orimpurities, and are labeled to accurately reflect the active ingredients and other ingredients in the products. It alsoincludes proposed requirements for designing and constructing physical plants, establishing quality controlprocedures, and testing manufactured dietary ingredients and dietary supplements, as well as proposed require-ments for maintaining records and for handling consumer complaints related to cGMPs. We evaluated this proposalwith respect to its potential impact upon the various contract manufacturers that we use to manufacture ourproducts, some of whom might not meet the new standards. It is important to note that the proposed final rule, in aneffort to limit disruption, includes a three-year phase-in for small businesses of any final regulation that is issued.This will mean that some of our contract manufacturers will not be fully impacted by the proposed regulation untilat least 2009. However, the proposed final rule can be expected to result in additional costs and possibly the need toseek alternate suppliers.
Some of the products marketed by us are considered conventional foods and are currently labeled as such.Within the United States, this category of products is subject to the Nutrition, Labeling and Education Act(“NLEA”), and regulations promulgated under the NLEA. The NLEA regulates health claims, ingredient labelingand nutrient content claims characterizing the level of a nutrient in the product. The ingredients added toconventional foods must either be generally recognized as safe by experts (“GRAS”) or be approved as foodadditives under FDA regulations.
In foreign markets, prior to commencing operations and prior to making or permitting sales of our products inthe market, we may be required to obtain an approval, license or certification from the relevant country’s ministry ofhealth or comparable agency. Where a formal approval, license or certification is not required, we nonetheless seeka favorable opinion of counsel regarding our compliance with applicable laws. Prior to entering a new market inwhich a formal approval, license or certificate is required, we work extensively with local authorities in order toobtain the requisite approvals. The approval process generally requires us to present each product and productingredient to appropriate regulators and, in some instances, arrange for testing of products by local technicians foringredient analysis. The approvals may be conditioned on reformulation of our products, or may be unavailable withrespect to some products or some ingredients. Product reformulation or the inability to introduce some products oringredients into a particular market may have an adverse effect on sales. We must also comply with product labelingand packaging regulations that vary from country to country. Our failure to comply with these regulations can resultin a product being removed from sale in a particular market, either temporarily or permanently.
18
%%TRANSMSG*** Transmitting Job: V16934 PCN: 019000000 ***%%PCMSG|18 |00009|Yes|No|03/16/2006 21:00|0|0|Page is valid, no graphics -- Color: D|

In 2005, Herbalife voluntarily elected to temporarily withdraw its Sesame & Herb tablet product from theIsraeli market. This product, which has been on the market since 1989, was sold only in Israel. Herbalife’s voluntarydecision to temporarily withdraw this product accompanied the initiation of a review by the Israeli Ministry ofHealth of anecdotal case reports of individuals having varying liver conditions when it was reported that a smallnumber of these individuals had consumed Herbalife products. Herbalife scientists and medical doctors are closelycooperating with the Ministry of Health to facilitate this review. This review is ongoing and there can be noassurances as to the outcome.
The FTC, which exercises jurisdiction over the advertising of all of our products, has in the past several yearsinstituted enforcement actions against several dietary supplement companies and against manufacturers of weightloss products generally for false and misleading advertising of some of their products. These enforcement actionshave often resulted in consent decrees and monetary payments by the companies involved. In addition, the FTC hasincreased its scrutiny of the use of testimonials, which we also utilize, as well as the role of expert endorsers andproduct clinical studies. Although we have not been the target of FTC enforcement action for the advertising of ourproducts, we cannot be sure that the FTC, or comparable foreign agencies, will not question our advertising or otheroperations in the future. It is unclear whether the FTC will subject our advertisements to increased surveillance toensure compliance with the principles set forth in the guide.
In Europe, a pending EU Health Claim regulation, now being discussed within the European Parliament,could, depending on amendments, have an adverse effect on existing product “wellness,” “well-being” and “goodfor you” claims presently made on existing product labeling, literature and advertising. We and our industry alliesare vigorously working to address this pending debate in ongoing discussion with Parliamentarians and theEuropean Commission.
In some countries, regulations applicable to the activities of our distributors also may affect our businessbecause in some countries we are, or regulators may assert that we are, responsible for our distributors’ conduct. Inthese countries, regulators may request or require that we take steps to ensure that our distributors comply with localregulations. The types of regulated conduct include: (1) representations concerning our products; (2) incomerepresentations made by us and/or distributors; (3) public media advertisements, which in foreign markets mayrequire prior approval by regulators; and (4) sales of products in markets in which the products have not beenapproved, licensed or certified for sale.
In some markets, it is possible that improper product claims by distributors could result in our products beingreviewed by regulatory authorities and, as a result, being classified or placed into another category as to whichstricter regulations are applicable. In addition, we might be required to make labeling changes.
We are unable to predict the nature of any future laws, regulations, interpretations or applications, nor can wepredict what effect additional governmental regulations or administrative orders, when and if promulgated, wouldhave on our business in the future. They could, however, require: (1) the reformulation of some products not capableof being reformulated; (2) imposition of additional record keeping requirements; (3) expanded documentation ofthe properties of some products; (4) expanded or different labeling; (5) additional scientific substantiation regardingproduct ingredients, safety or usefulness; and/or (6) additional distributor compliance surveillance and enforcementaction by us.
Any or all of these requirements could have a material adverse effect on our results of operations and financialcondition. All of our officers and directors are subject to a permanent injunction issued in October 1986 pursuant tothe settlement of an action instituted by the California Attorney General, the State Health Director and theSanta Cruz County District Attorney. We consented to the entry of this injunction without in any way admitting theallegations of the complaint. The injunction prevents us and our officers and directors from making specified claimsin future advertising of our products and required us to implement some documentation systems with respect topayments to our distributors. At the same time, the injunction does not prevent us from continuing to make specifiedclaims concerning our products that have been made and are being made, provided that we have a reasonable basisfor making the claims.
We are aware that, in some of our international markets, there has been recent adverse publicity concerningproducts that contain ingredients that have been genetically modified (“GM”). In some markets, the possibility of
19
%%TRANSMSG*** Transmitting Job: V16934 PCN: 020000000 ***%%PCMSG|19 |00013|Yes|No|03/16/2006 21:00|0|0|Page is valid, no graphics -- Color: D|

health risks or perceived consumer preference thought to be associated with GM ingredients has prompted proposedor actual governmental regulation. For example, the European Union has adopted a EC Regulation 1829/2003affecting the labeling of products containing ingredients that have been genetically modified, and the documentsmanufacturers and marketers will need to possess to ensure “traceability’’ at all steps in the chain of production anddistribution. This new regulation, which took effect in 2004, has been implemented by us and our contractmanufacturers, resulting in modifications to our labeling, and in some instances, to some of our foods and foodsupplements sold in Europe. Differing GM regulations affecting us also have been adopted in Brazil, Japan, Korea,Taiwan and Thailand. We cannot anticipate the extent to which future regulations in our markets will restrict the useof GM ingredients in our products or the impact of any regulations on our business in those markets. In response toany applicable regulations, we would, where practicable, attempt to reformulate our products to satisfy theregulations. We believe, based upon currently available information, that compliance with regulatory requirementsin this area should not have a material adverse effect on us or our business. However, because publicity andgovernmental scrutiny of GM ingredients is a relatively new and evolving area, there can be no assurance in thisregard. If a significant number of our products were found to be genetically modified and regulations in our marketssignificantly restricted the use of GM ingredients in our products, our business could be materially adverselyaffected.
In addition, in certain of our markets, there has been recent adverse regulatory and press attention toingredients that may cause what is commonly referred to as mad cow disease (“BSE”). Certain of our productscontain ingredients derived from bovine sources. We are not aware of any infection or contamination of any of ourproducts by BSE. Should any such infection or contamination be detected, it could have a material adverse effect onour business. Additionally, if governments preclude importation of products from the U.S. containing bovine-derived ingredients, it could adversely impact product availability and/or future price. Further, even if no suchinfection or contamination is detected, adverse publicity concerning the BSE risk, or governmental or regulatorydevelopments aimed at combating the risk of BSE contamination by regulating bovine products and/or by-products,could have a material adverse effect on our business.
We are also in the process of complying with recent regulations within the European Union, Australia, Brazil,Canada, China, Hong Kong, Japan, Taiwan, and Thailand affecting the use and/or labeling of irradiated rawingredients. To date, we have dealt with irradiation compliance questions involving three products sold in theNetherlands and one product sold in Switzerland.
Compliance with GM, BSE and irradiation regulations can be expected to increase the cost of manufacturingcertain of our products.
Network marketing program. Our network marketing program is subject to a number of federal and stateregulations administered by the FTC and various state agencies as well as regulations in foreign marketsadministered by foreign agencies. Regulations applicable to network marketing organizations generally aredirected at ensuring that product sales ultimately are made to consumers and that advancement within ourorganization is based on sales of the organization’s products rather than investments in the organization or othernon-retail sales related criteria. For instance, in some markets, there are limits on the extent to which distributorsmay earn royalty overrides on sales generated by distributors that were not directly sponsored by the distributor.When required by law, we obtain regulatory approval of our network marketing program or, when this approval isnot required, the favorable opinion of local counsel as to regulatory compliance. Nevertheless, we remain subject tothe risk that, in one or more markets, our marketing system could be found not to be in compliance with applicableregulations. Failure by us to comply with these regulations could have a material adverse effect on our business in aparticular market or in general.
We also are subject to the risk of private party challenges to the legality of our network marketing program. Forexample, in Webster v. Omnitrition International, Inc., 79 F.3d 776 (9th Cir. 1996), the multi-level marketingprogram of Omnitrition International, Inc. (“Omnitrition”) was successfully challenged in a class action byOmnitrition distributors who alleged that Omnitrition was operating an illegal “pyramid scheme” in violation offederal and state laws. We believe that our network marketing program satisfies the standards set forth in theOmnitrition case and other applicable statutes and case law defining a legal marketing system, in part based uponsignificant differences between our marketing system and that described in the Omnitrition case.
20
%%TRANSMSG*** Transmitting Job: V16934 PCN: 021000000 ***%%PCMSG|20 |00010|Yes|No|03/16/2006 21:00|0|0|Page is valid, no graphics -- Color: D|

Herbalife International and certain of its independent distributors have been named as defendants in apurported class action lawsuit filed February 17, 2005, in the Superior Court of California, County of San Francisco,and served on Herbalife International on March 14, 2005 (Minton v. Herbalife International, et al). The case hasbeen transferred to the Los Angeles County Superior Court. The plaintiff is challenging the marketing practices ofcertain Herbalife International independent distributors and Herbalife International under various state lawsprohibiting “endless chain schemes,” insufficient disclosure in assisted marketing plans, unfair and deceptivebusiness practices, and fraud and deceit. The plaintiff alleges that the Freedom Group system operated by certainindependent distributors of Herbalife International products places too much emphasis on recruiting and encour-ages excessively large purchases of product and promotional materials by distributors. The plaintiff also alleges thatFreedom Group pressured distributors to disseminate misleading promotional materials. The plaintiff seeks to holdHerbalife International vicariously liable for the actions of its independent distributors and is seeking damages andinjunctive relief. The Company believes that we have meritorious defenses to the suit.
Herbalife International and certain of its distributors have been named as defendants in a purported class actionlawsuit filed July 16, 2003, in the Circuit Court of Ohio County in the State of West Virginia (Mey v. HerbalifeInternational, Inc., et al). Herbalife International had removed the lawsuit to federal court and the court remandedthe lawsuit to state court. The complaint alleges that certain telemarketing practices of certain Herbalife Inter-national distributors violate the Telephone Consumer Protection Act (the “TCPA”) and seeks to hold HerbalifeInternational vicariously liable for the practices of its distributors. More specifically, the plaintiffs’ complaintalleges that several of Herbalife’s distributors used pre-recorded telephone messages and autodialers to contactprospective customers in violation of the TCPA’s prohibition of such practices. Herbalife’s distributors areindependent contractors and if any such distributors in fact violated the TCPA, they also violated Herbalife’spolicies which require its distributors to comply with all applicable federal, state and local laws. The Companybelieves that we have meritorious defenses to the suit.
We are also subject to the risk of private party challenges to the legality of our network marketing programoutside of the United States. Non-U.S. multi-level marketing programs of other companies have been successfullychallenged in the past, and in a current lawsuit, allegations have been made challenging the legality of our networkmarketing program in Belgium. Test Ankoop-Test Achat, a Belgian consumer protection organization, suedHerbalife International Belgium, S.V. (“HIB”) on August 26, 2004, alleging that HIB violated Article 84 of theBelgian Fair Trade Practices Act by engaging in pyramid selling, i.e., establishing a network of professional or non-professional sales people who hope to make a profit more through the expansion of that network rather than throughthe sale of products to end-consumers. Currently, the lawsuit is in the pleading stage, and the plaintiffs filed theirinitial brief on September 27, 2005. An adverse judicial determination with respect to our network marketingprogram, or in proceedings not involving us directly but which challenge the legality of multi-level marketingsystems, in Belgium or in any other market in which we operate, could negatively impact our business. TheCompany believes that we have meritorious defenses to the suit.
It is an ongoing part of our business to monitor and respond to regulatory and legal developments, includingthose that may affect our network marketing program. However, the regulatory requirements concerning networkmarketing programs do not include bright line rules and are inherently fact-based. An adverse judicial determi-nation with respect to our network marketing program could have a material adverse effect on our business. Anadverse determination could: (1) require us to make modifications to our network marketing program, (2) result innegative publicity or (3) have a negative impact on distributor morale. In addition, adverse rulings by courts in anyproceedings challenging the legality of multi-level marketing systems, even in those not involving us directly, couldhave a material adverse effect on our operations.
Transfer pricing and similar regulations. In many countries, including the United States, we are subject totransfer pricing and other tax regulations designed to ensure that appropriate levels of income are reported as earnedby our U.S. or local entities and are taxed accordingly. In addition, our operations are subject to regulations designedto ensure that appropriate levels of customs duties are assessed on the importation of our products.
Although we believe that we are in substantial compliance with all applicable regulations and restrictions, weare subject to the risk that governmental authorities could audit our transfer pricing and related practices and assertthat additional taxes are owed. For example, we are currently subject to pending or proposed audits that are at
21
%%TRANSMSG*** Transmitting Job: V16934 PCN: 022000000 ***%%PCMSG|21 |00012|Yes|No|03/16/2006 21:00|0|0|Page is valid, no graphics -- Color: D|

various levels of review, assessment or appeal in a number of jurisdictions involving transfer pricing issues, incometaxes, duties, value added taxes, withholding taxes and related interest and penalties in material amounts. In somecircumstances, additional taxes, interest and penalties have been assessed, and we will be required to appeal orlitigate to reverse the assessments. We have taken advice from our tax advisors, and the Company believes that thereare substantial defenses to the allegations that additional taxes are owing, and we are vigorously defending againstthe imposition of additional proposed taxes. The ultimate resolution of these matters may take several years, and theoutcome is uncertain.
In the event that the audits or assessments are concluded adversely to us, we may or may not be able to offset ormitigate the consolidated effect of foreign income tax assessments through the use of U.S. foreign tax credits.Currently, we anticipate utilizing the majority of our foreign tax credits in the year in which they arise with theunused amount carried forward. Because the laws and regulations governing U.S. foreign tax credits are complexand subject to periodic legislative amendment, we cannot be sure that we would in fact be able to take advantage ofany foreign tax credits in the future. As a result, adverse outcomes in these matters could have a material impact onour financial condition and operating results.
Other regulations. We also are subject to a variety of other regulations in various foreign markets, includingregulations pertaining to social security assessments, employment and severance pay requirements, import/exportregulations and antitrust issues. As an example, in many markets, we are substantially restricted in the amount andtypes of rules and termination criteria that we can impose on distributors without having to pay social securityassessments on behalf of the distributors and without incurring severance obligations to terminated distributors. Insome countries, we may be subject to these obligations in any event.
Our failure to comply with these regulations could have a material adverse effect on our business in a particularmarket or in general. Assertions that we failed to comply with regulations or the effect of adverse regulations in onemarket could adversely affect us in other markets as well by causing increased regulatory scrutiny in those othermarkets or as a result of the negative publicity generated in those other markets.
Compliance procedures. As indicated above, Herbalife, our products and our network marketing programare subject, both directly and indirectly through distributors’ conduct, to numerous federal, state and localregulations, both in the United States and foreign markets. Beginning in 1985, we began to institute formalregulatory compliance measures by developing a system to identify specific complaints against distributors and toremedy any violations by distributors through appropriate sanctions, including warnings, suspensions and, whennecessary, terminations. In our manuals, seminars and other training programs and materials, we emphasize thatdistributors are prohibited from making therapeutic claims for our products.
Our general policy regarding acceptance of distributor applications from individuals who do not reside in oneof our markets is to refuse to accept the individual’s distributor application. From time to time, exceptions to thepolicy are made on a country-by-country basis.
In order to comply with regulations that apply to both us and our distributors, we conduct considerable researchinto the applicable regulatory framework prior to entering any new market to identify all necessary licenses andapprovals and applicable limitations on our operations in that market. Typically, we conduct this research with theassistance of local legal counsel and other representatives. We devote substantial resources to obtaining thenecessary licenses and approvals and bringing our operations into compliance with the applicable limitations. Wealso research laws applicable to distributor operations and revise or alter our distributor manuals and other trainingmaterials and programs to provide distributors with guidelines for operating a business, marketing and distributingour products and similar matters, as required by applicable regulations in each market. We, however, are unable tomonitor our supervisors and distributors effectively to ensure that they refrain from distributing our products incountries where we have not commenced operations, and we do not devote significant resources to this type ofmonitoring.
In addition, regulations in existing and new markets often are ambiguous and subject to considerableinterpretive and enforcement discretion by the responsible regulators. Moreover, even when we believe that weand our distributors are initially in compliance with all applicable regulations, new regulations regularly are beingadded and the interpretation of existing regulations is subject to change. Further, the content and impact of
22
%%TRANSMSG*** Transmitting Job: V16934 PCN: 023000000 ***%%PCMSG|22 |00014|Yes|No|03/16/2006 21:00|0|0|Page is valid, no graphics -- Color: D|

regulations to which we are subject may be influenced by public attention directed at us, our products or ournetwork marketing program, so that extensive adverse publicity about us, our products or our network marketingprogram may result in increased regulatory scrutiny.
It is an ongoing part of our business to anticipate and respond to new and changing regulations and to makecorresponding changes in our operations to the extent practicable. Although we devote considerable resources tomaintaining our compliance with regulatory constraints in each of our markets, we cannot be sure that (1) we wouldbe found to be in full compliance with applicable regulations in all of our markets at any given time or (2) theregulatory authorities in one or more markets will not assert, either retroactively or prospectively or both, that ouroperations are not in full compliance. These assertions or the effect of adverse regulations in one market couldnegatively affect us in other markets as well by causing increased regulatory scrutiny in those other markets or as aresult of the negative publicity generated in those other markets. These assertions could have a material adverseeffect on us in a particular market or in general. Furthermore, depending upon the severity of regulatory changes in aparticular market and the changes in our operations that would be necessitated to maintain compliance, thesechanges could result in our experiencing a material reduction in sales in the market or determining to exit the marketaltogether. In this event, we would attempt to devote the resources previously devoted to the market, to a new marketor markets or other existing markets. However, we cannot be sure that this transition would not have an adverseeffect on our business and results of operations either in the short or long-term.
Trademarks and Proprietary Formulas
We use the umbrella trademarks Herbalife, Thermojetics, Dermajetics, and protect several other trademarksand trade names in connection with our products and operations, for example, Shapeworks. Our trademarkregistrations are issued through the United States Patent and Trademark Office and in comparable agencies in theforeign countries. We consider our trademarks and trade names to be an important factor in our business. We alsotake care in protecting the intellectual property rights of our proprietary formulas by restricting access to ourformulas within the Company to those persons or departments that require access to them to perform their functions,and by requiring our finished goods-suppliers and consultants to execute supply and non-disclosure agreements thatseek to contractually protect our intellectual property rights. For example, we have recently developed a newproduct in the energy supplement category for which we have sought (through our employees who invented thisproduct) one or more patents for the formulation as a whole. We strive to protect all new product developments asthe confidential trade secrets of the Company and its inventor employees. However, despite our efforts, we may beunable to prevent third parties from infringing upon or misappropriating our proprietary rights.
Competition
The business of marketing weight management and nutrition products is highly competitive. This marketsegment includes numerous manufacturers, distributors, marketers, retailers and physicians that actively competefor the business of consumers both in the United States and abroad. The market is highly sensitive to theintroduction of new products or weight management plans, including various prescription drugs that may rapidlycapture a significant share of the market. As a result, our ability to remain competitive depends in part upon thesuccessful introduction of new products. In addition, we anticipate that we will be subject to increasing competitionin the future from sellers that utilize electronic commerce. We cannot be sure of the impact of electronic commerceor that it will not adversely affect our business.
We are subject to significant competition for the recruitment of distributors from other network marketingorganizations, including those that market weight management products, nutritional supplements, and personal careproducts, as well as other types of products. Some of our competitors are substantially larger than we are, and haveconsiderably greater financial resources than we have. Our ability to remain competitive depends, in significantpart, on our success in recruiting and retaining distributors through an attractive compensation plan and otherincentives. We believe that our production bonus program, international sponsorship program and other compen-sation and incentive programs provide our distributors with significant earning potential. However, we cannot besure that our programs for recruitment and retention of distributors will be successful.
23
%%TRANSMSG*** Transmitting Job: V16934 PCN: 024000000 ***%%PCMSG|23 |00007|Yes|No|03/16/2006 21:00|0|0|Page is valid, no graphics -- Color: D|

Executive Officers of the Registrant
Biographical information follows for each person who serves as an executive officer of the Company. The tablesets forth certain information regarding these individuals. The information below is as of December 31, 2005.
Name Age Position with the CompanyOfficerSince
Michael O. Johnson . . . . . . . . . . . . . . . . 51 Chief Executive Officer, Director 2003
Gregory Probert. . . . . . . . . . . . . . . . . . . 49 President, Chief Operating Officer 2003
Richard Goudis . . . . . . . . . . . . . . . . . . . 44 Chief Financial Officer 2004
Brett R. Chapman . . . . . . . . . . . . . . . . . 50 General Counsel 2003
Paul Noack . . . . . . . . . . . . . . . . . . . . . . 44 Chief Strategic Officer 2004
Steve Henig Ph.D. . . . . . . . . . . . . . . . . 63 Chief Scientific Officer 2005
Michael O. Johnson is Chief Executive Officer of the Company. Mr. Johnson joined the Company in April2003 after 17 years with The Walt Disney Company, where he most recently served as President of Walt DisneyInternational, and also served as President of Asia Pacific for The Walt Disney Company and President of BuenaVista Home Entertainment. Mr. Johnson has also previously served as a publisher of Audio Times magazine, and hasdirected the regional sales efforts of Warner Amex Satellite Entertainment Company for three of its televisionchannels, including MTV, Nickelodeon and The Movie Channel. Mr. Johnson is currently a director of UnivisionCommunications, Inc., a television company serving Spanish-speaking Americans. Mr. Johnson received hisBachelor of Arts in Political Science from Western State College.
Gregory Probert is President and Chief Operating Officer of the Company. Mr. Probert joined the Company inAugust 2003, after serving as President and CEO of DMX MUSIC for over 2 years. Mr. Probert joined DMXMUSIC after serving as Chief Operating Officer of planet Lingo from January 2000 to November 2000, where heled the team that designed and built the company’s first product, an online conversational system for the $20 billionESL market in Japan. Immediately prior to planet Lingo, Mr. Probert spent 12 years with The Walt DisneyCompany, where he most recently served as Executive Vice President and Chief Operating Officer for the$3.5 billion Buena Vista Home Entertainment worldwide business. Mr. Probert’s positions with The Walt DisneyCompany also included service as Executive Vice President and Managing Director of the International HomeVideo Division, Senior Vice President and Managing Director of Buena Vista Home Entertainment, Asia PacificRegion, based in Hong Kong, and Chief Financial Officer of Buena Vista International, Disney’s theatricaldistribution arm, among others. Mr. Probert received his Bachelor of Science from the University of SouthernCalifornia and his MBA from California State University, Los Angeles.
Richard Goudis joined the Company in June 2004, as Chief Financial Officer. From 1998 to 2001, Mr. Goudiswas the Chief Operating Officer of Rexall Sundown, a Nasdaq 100 company that was sold to Royal Numico in 2000.After the sale to Royal Numico, Mr. Goudis had operations responsibility for all of Royal Numico’s U.S. invest-ments, including General Nutrition Centers, or GNC, Unicity International and Rexall Sundown. From 2002 to May2004, Mr. Goudis was a partner at Flamingo Capital Partners, a firm he founded with several retired executives fromRexall Sundown. Prior to working at Rexall Sundown, Mr. Goudis worked at Sunbeam Corporation and Pratt &Whitney.
Brett R. Chapman joined the Company in October 2003, as General Counsel and Secretary. Prior to joining theCompany, Mr. Chapman spent thirteen years at The Walt Disney Company, most recently as Senior Vice Presidentand Deputy General Counsel, with responsibility for all legal matters relating to Disney’s Media Networks Group,including the ABC Television Network, the company’s cable properties including The Disney Channel and ESPN,and Disney’s radio and internet businesses. Prior to working at The Walt Disney Company, Mr. Chapman was anassociate at the law firm of Skadden, Arps, Slate, Meagher & Flom LLP. Mr. Chapman received his Bachelor ofScience and Master of Science in Business Administration from California State University, Northridge and hisJuris Doctorate from Southwestern University School of Law.
Paul Noack joined the Company in January 2004, as Senior Vice President, Corporate Planning and Strategyand was most recently promoted to Chief Strategic Officer. Prior to joining the Company, Mr. Noack spent 3 years atDMX MUSIC as Senior Vice President and Chief Strategic Officer with responsibility for the company’s strategic
24
%%TRANSMSG*** Transmitting Job: V16934 PCN: 025000000 ***%%PCMSG|24 |00011|Yes|No|03/16/2006 21:00|0|0|Page is valid, no graphics -- Color: D|

alliances and international operations in Asia, Japan, Latin America and Canada. Prior to working at DMX MUSIC,Mr. Noack served as Senior Managing Director of Knightsbridge Holdings, a San Francisco based merchantbanking company and spent 11 years at The Walt Disney Company. Mr. Noack holds a B.A. from St. JohnsUniversity.
Steve Henig, Ph.D. joined the Company in July 2005, as Chief Scientific Officer. Prior to joining theCompany, Mr. Henig spent 6 years at Ocean Spray Cranberries, Inc., as Senior Vice President, technology andinnovation with responsibility for the company’s new products program and medical research program. Prior toworking at Ocean Spray Cranberries, Inc. Mr. Henig served as Senior Vice President, technology and marketingservices at Con Agra’s Grocery products. Mr. Henig holds a Ph.D. in food science from Rutgers University, a M.S.in food and biotechnology and a B.S. in chemical engineering from Technion-Israel Institute of technology.
Employees
As of December 31, 2005, we had 2,946 full-time employees. In China, as of December 31, 2005, we also hadlabor contracts with approximately 842 sales representatives. These numbers do not include our distributors, whoare independent contractors rather than our employees. Except for some employees in Mexico and in certainEuropean countries, none of our employees are members of any labor union, and we have never experienced anybusiness interruption as a result of any labor disputes.
Available Information
Our internet website address is www.Herbalife.com. We make available free of charge on our website ourAnnual Reports on Form 10-K, Quarterly Reports on Form 10-Q, Current Reports on Form 8-K and amendments tothose reports filed or furnished pursuant to Section 13(a) or 15(d) of the Securities Exchange Act of 1934, asamended (the “Exchange Act”) as soon as reasonably practical after we file such material with, or furnish it to, theSecurities and Exchange Commission (the “SEC”). This information is also available in print to any shareholderswho request it, with any such requests addressed to Investor Relations, 1800 Century Park East, Los Angeles, CA90067. Certain of these documents may also be obtained by calling the Securities and Exchange Commissionat 1-800-SEC-0330. The Securities and Exchange Commission also maintains an internet website that containsreports, and other information regarding issuers that file electronically with the Securities and Exchange Com-mission at www.sec.gov. We also make available free of charge on our website our Corporate GovernanceGuidelines, our Code of Business Conduct and Ethics, and the Charters of our Audit Committee, CorporateGovernance and Nominating Committee, and Compensation Committee.
ITEM 1A. RISK FACTORS
Our failure to establish and maintain distributor relationships for any reason could negatively impactsales of our products and harm our financial condition and operating results.
We distribute our products exclusively through over one million independent distributors, and we depend uponthem directly for substantially all of our sales. To increase our revenue, we must increase the number of, or theproductivity of, our distributors. Accordingly, our success depends in significant part upon our ability to recruit,retain and motivate a large base of distributors. There is a high rate of turnover among our distributors, acharacteristic of the network marketing business. The loss of a significant number of distributors for any reasoncould negatively impact sales of our products and could impair our ability to attract new distributors. In our effortsto attract and retain distributors, we compete with other network marketing organizations, including those in theweight management product, dietary and nutritional supplement and personal care and cosmetic product industries.Our operating results could be harmed if our existing and new business opportunities and products do not generatesufficient interest to retain existing distributors and attract new distributors.
In light of the high year-over-year rate of turnover in our distributor base, we have our supervisors and non-supervisor distributors requalify annually in order to help us maintain a more accurate count of their numbers. Forthe latest twelve month re-qualification period ending January 2005, 60% of our supervisors did not re-qualify andmore than 90% of our distributors that are not supervisors turned over. Distributors who purchase our product forpersonal consumption or for short-term income goals may stay with us for several months to one year. Supervisorswho have committed time and effort to build a sales organization will generally stay for longer periods. Distributors
25
%%TRANSMSG*** Transmitting Job: V16934 PCN: 026000000 ***%%PCMSG|25 |00021|Yes|No|03/16/2006 21:00|0|0|Page is valid, no graphics -- Color: D|

have highly variable levels of training, skills and capabilities. The turnover rate of our distributors, and ouroperating results, can be adversely impacted if we and our senior distributor leadership do not provide the necessarymentoring, training and business support tools for new distributors to become successful sales people in a shortperiod of time.
We estimate that, of our over one million independent distributors, we had approximately 201,000 supervisorsafter requalifications in February 2005. These supervisors, together with their downline sales organizations,account for substantially all of our revenues. Our distributors, including our supervisors, may voluntarily terminatetheir distributor agreements with us at any time. The loss of a group of leading supervisors, together with theirdownline sales organizations, or the loss of a significant number of distributors for any reason, could negativelyimpact sales of our products, impair our ability to attract new distributors and harm our financial condition andoperating results.
Since we cannot exert the same level of influence or control over our independent distributors as wecould were they our own employees, our distributors could fail to comply with our distributor policies andprocedures, which could result in claims against us that could harm our financial condition andoperating results.
Our distributors are independent contractors and, accordingly, we are not in a position to directly provide thesame direction, motivation and oversight as we would if distributors were our own employees. As a result, there canbe no assurance that our distributors will participate in our marketing strategies or plans, accept our introduction ofnew products, or comply with our distributor policies and procedures.
Extensive federal, state and local laws regulate our business, our products and our network marketing program.Because we have expanded into foreign countries, our policies and procedures for our independent distributorsdiffer due to the different legal requirements of each country in which we do business. While we have implementeddistributor policies and procedures designed to govern distributor conduct and to protect the goodwill associatedwith Herbalife trademarks and tradenames, it can be difficult to enforce these policies and procedures because of thelarge number of distributors and their independent status. Violations by our distributors of applicable law or of ourpolicies and procedures in dealing with customers could reflect negatively on our products and operations, and harmour business reputation. In addition, it is possible that a court could hold us civilly or criminally accountable basedon vicarious liability because of the actions of our independent distributors. If any of these events occur, the value ofan investment in our common shares could be impaired.
Adverse publicity associated with our products, ingredients or network marketing program, or those ofsimilar companies, could harm our financial condition and operating results.
The size of our distribution force and the results of our operations may be significantly affected by the public’sperception of our Company and similar companies. This perception is dependent upon opinions concerning:
• the safety and quality of our products and ingredients;
• the safety and quality of similar products and ingredients distributed by other companies;
• our distributors;
• our network marketing program; and
• the direct selling business generally.
Adverse publicity concerning any actual or purported failure of our Company or our distributors to complywith applicable laws and regulations regarding product claims and advertising, good manufacturing practices, theregulation of our network marketing program, the licensing of our products for sale in our target markets or otheraspects of our business, whether or not resulting in enforcement actions or the imposition of penalties, could have anadverse effect on the goodwill of our Company and could negatively affect our ability to attract, motivate and retaindistributors, which would negatively impact our ability to generate revenue. We cannot ensure that all distributorswill comply with applicable legal requirements relating to the advertising, labeling, licensing or distribution of ourproducts.
26
%%TRANSMSG*** Transmitting Job: V16934 PCN: 027000000 ***%%PCMSG|26 |00017|Yes|No|03/16/2006 21:00|0|0|Page is valid, no graphics -- Color: D|

In addition, our distributors’ and consumers’ perception of the safety and quality of our products andingredients as well as similar products and ingredients distributed by other companies can be significantlyinfluenced by national media attention, publicized scientific research or findings, widespread product liabilityclaims and other publicity concerning our products or ingredients or similar products and ingredients distributed byother companies. Adverse publicity, whether or not accurate or resulting from consumers’ use or misuse of ourproducts, that associates consumption of our products or ingredients or any similar products or ingredients withillness or other adverse effects, questions the benefits of our or similar products or claims that any such products areineffective, inappropriately labeled or have inaccurate instructions as to their use, could negatively impact ourreputation or the market demand for our products.
Adverse publicity relating to us, our products or our operations, including our network marketing program orthe attractiveness or viability of the financial opportunities provided thereby, has had, and could again have, anegative effect on our ability to attract, motivate and retain distributors. In the mid-1980’s, our products andmarketing program became the subject of regulatory scrutiny in the United States, resulting in large part fromclaims and representations made about our products by our distributors, including impermissible therapeuticclaims. The resulting adverse publicity caused a rapid, substantial loss of distributors in the United States and acorresponding reduction in sales beginning in 1985. We expect that negative publicity will, from time to time,continue to negatively impact our business in particular markets.
Our failure to appropriately respond to changing consumer preferences and demand for new products orproduct enhancements could significantly harm our distributor and customer relationships and productsales and harm our financial condition and operating results and cause the loss or reduction in the valueof your investment in our common shares.
Our business is subject to changing consumer trends and preferences, especially with respect to weightmanagement products. Our continued success depends in part on our ability to anticipate and respond to thesechanges, and we may not respond in a timely or commercially appropriate manner to such changes. Furthermore,the nutritional supplement industry is characterized by rapid and frequent changes in demand for products and newproduct introductions and enhancements. Our failure to accurately predict these trends could negatively impactconsumer opinion of our products, which in turn could harm our customer and distributor relationships and causethe loss of sales. The success of our new product offerings and enhancements depends upon a number of factors,including our ability to:
• accurately anticipate customer needs;
• innovate and develop new products or product enhancements that meet these needs;
• successfully commercialize new products or product enhancements in a timely manner;
• price our products competitively;
• manufacture and deliver our products in sufficient volumes and in a timely manner; and
• differentiate our product offerings from those of our competitors.
If we do not introduce new products or make enhancements to meet the changing needs of our customers in atimely manner, some of our products could be rendered obsolete, which could negatively impact our revenues,financial condition and operating results.
Due to the high level of competition in our industry, we might fail to retain our customers and distribu-tors, which would harm our financial condition and operating results.
The business of marketing weight management and nutrition products is highly competitive and sensitive tothe introduction of new products or weight management plans, including various prescription drugs, which mayrapidly capture a significant share of the market. These market segments include numerous manufacturers,distributors, marketers, retailers and physicians that actively compete for the business of consumers both in theUnited States and abroad. In addition, we anticipate that we will be subject to increasing competition in the futurefrom sellers that utilize electronic commerce. Some of these competitors have longer operating histories,
27
%%TRANSMSG*** Transmitting Job: V16934 PCN: 028000000 ***%%PCMSG|27 |00010|Yes|No|03/16/2006 21:00|0|0|Page is valid, no graphics -- Color: D|

significantly greater financial, technical, product development, marketing and sales resources, greater namerecognition, larger established customer bases and better-developed distribution channels than we do. Our presentor future competitors may be able to develop products that are comparable or superior to those we offer, adapt morequickly than we do to new technologies, evolving industry trends and standards or customer requirements, or devotegreater resources to the development, promotion and sale of their products than we do. For example, if ourcompetitors develop other diet or weight loss treatments that prove to be more effective than our products, demandfor our products could be reduced. Accordingly, we may not be able to compete effectively in our markets andcompetition may intensify.
We are also subject to significant competition for the recruitment of distributors from other network marketingorganizations, including those that market weight management products, dietary and nutritional supplements andpersonal care products as well as other types of products. We compete for global customers and distributors withregard to weight management, nutritional supplement and personal care products. Our competitors include bothdirect selling companies such as NuSkin Enterprises, Nature’s Sunshine, Alticor/Amway, Melaleuca, AvonProducts, Oriflame, and Mary Kay, as well as retail establishments such as Weight Watchers, Jenny Craig, GeneralNutrition Centers, Wal-Mart and retail pharmacies. In addition, because the industry in which we operate is notparticularly capital intensive or otherwise subject to high barriers to entry, it is relatively easy for new competitors toemerge who will compete with us for our distributors and customers. In addition, the fact that our distributors mayeasily enter and exit our network marketing program contributes to the level of competition that we face. Forexample, a distributor can enter or exit our network marketing system with relative ease at any time without facing asignificant investment or loss of capital because (1) we have a low upfront financial cost (generally $50 to $75) tobecome a Herbalife distributor, (2) we do not require any specific amount of time to work as a distributor, (3) we donot insist on any special training to be a distributor and (4) we do not prohibit a new distributor from working withanother company. Our ability to remain competitive therefore depends, in significant part, on our success inrecruiting and retaining distributors through an attractive compensation plan, the maintenance of an attractiveproduct portfolio and other incentives. We cannot ensure that our programs for recruitment and retention ofdistributors will be successful, and if they are not, our financial condition and operating results would be harmed.
We are affected by extensive laws, governmental regulations, administrative determinations, courtdecisions and similar constraints both domestically and abroad and our failure or our distributors’ failureto comply with these restraints could lead to the imposition of significant penalties or claims, which couldharm our financial condition and operating results.
In both domestic and foreign markets, the formulation, manufacturing, packaging, labeling, distribution,importation, exportation, licensing, sale and storage of our products are affected by extensive laws, governmentalregulations, administrative determinations, court decisions and similar constraints. Such laws, regulations and otherconstraints may exist at the federal, state or local levels in the United States and at all levels of government inforeign jurisdictions. There can be no assurance that we or our distributors are in compliance with all of theseregulations. Our failure or our distributors’ failure to comply with these regulations or new regulations could lead tothe imposition of significant penalties or claims and could negatively impact our business. In addition, the adoptionof new regulations or changes in the interpretations of existing regulations may result in significant compliancecosts or discontinuation of product sales and may negatively impact the marketing of our products, resulting insignificant loss of sales revenues. For example, the Food and Drug Administration, or the FDA, has announced plansto issue new guidance or regulations relating to low carbohydrate claims for foods, which could negatively impactour sales of such products.
Governmental regulations in countries where we plan to commence or expand operations may prevent or delayentry into those markets. In addition, our ability to sustain satisfactory levels of sales in our markets is dependent insignificant part on our ability to introduce additional products into such markets. However, governmentalregulations in our markets, both domestic and international, can delay or prevent the introduction, or requirethe reformulation or withdrawal, of certain of our products. For example, during the third quarter of 1995, wereceived inquiries from certain governmental agencies within Germany and Portugal regarding our product,Thermojetics» Instant Herbal Beverage, relating to the caffeine content of the product and the status of the productas an “instant tea,” which was disfavored by regulators, versus a “beverage.” Although we initially suspended the
28
%%TRANSMSG*** Transmitting Job: V16934 PCN: 029000000 ***%%PCMSG|28 |00011|Yes|No|03/16/2006 21:00|0|0|Page is valid, no graphics -- Color: D|

product sale in Germany and Portugal at the request of the regulators, we successfully reintroduced it onceregulatory issues were satisfactorily resolved. Any such regulatory action, whether or not it results in a finaldetermination adverse to us, could create negative publicity, with detrimental effects on the motivation andrecruitment of distributors and, consequently, on sales.
On March 7, 2003, the FDA proposed a new regulation to require current good manufacturing practicesaffecting the manufacture, packing, and holding of dietary supplements. The proposed regulation would establishstandards to ensure that dietary supplements and dietary ingredients are not adulterated with contaminants orimpurities, and are labeled to accurately reflect the active ingredients and other ingredients in the products. It alsoincludes proposed requirements for designing and constructing physical plants, establishing quality controlprocedures, and testing manufactured dietary ingredients and dietary supplements, as well as proposed require-ments for maintaining records and for handling consumer complaints related to cGMPs. We are evaluating thisproposal with respect to its potential impact upon the various contract manufacturers that we use to manufacturerour products, some of whom might not meet the new standards. It is important to note that the proposed regulation,in an effort to limit disruption, includes a three-year phase-in for small businesses of any final regulation that isissued. This will mean that some of our contract manufacturers will not be fully impacted by the proposedregulation until at least 2008. However, the proposed regulation can be expected to result in additional costs andpossibly the need to seek alternate suppliers.
Our network marketing program could be found to be not in compliance with current or newly adoptedlaws or regulations in one or more markets, which could prevent us from conducting our business inthese markets and harm our financial condition and operating results.
Our network marketing program is subject to a number of federal and state regulations administered by theFederal Trade Commission and various state agencies in the United States as well as regulations on direct selling inforeign markets administered by foreign agencies. We are subject to the risk that, in one or more markets, ournetwork marketing program could be found not to be in compliance with applicable law or regulations. Regulationsapplicable to network marketing organizations generally are directed at preventing fraudulent or deceptiveschemes, often referred to as “pyramid” or “chain sales” schemes, by ensuring that product sales ultimatelyare made to consumers and that advancement within an organization is based on sales of the organization’s productsrather than investments in the organization or other non-retail sales-related criteria. The regulatory requirementsconcerning network marketing programs do not include “bright line” rules and are inherently fact-based, and thus,even in jurisdictions where we believe that our network marketing program is in full compliance with applicablelaws or regulations governing network marketing systems, we are subject to the risk that these laws or regulations orthe enforcement or interpretation of these laws and regulations by governmental agencies or courts can change. Thefailure of our network marketing program to comply with current or newly adopted regulations could negativelyimpact our business in a particular market or in general.
We are also subject to the risk of private party challenges to the legality of our network marketing program. Themulti-level marketing programs of other companies have been successfully challenged in the past, and in a currentlawsuit, allegations have been made challenging the legality of our network marketing program in Belgium. TestAnkoop-Test Achat, a Belgian consumer protection organization, sued Herbalife International Belgium, S.V., orHIB, on August 26, 2004, alleging that HIB violated Article 84 of the Belgian Fair Trade Practices Act by engagingin pyramid selling, i.e., establishing a network of professional or non-professional sales people who hope to make aprofit more through the expansion of that network rather than through the sale of products to end-consumers. Theplaintiff is seeking a payment of A25,000 (equal to approximately $30,000 as of December 31, 2005) per purportedviolation as well as costs of the trial. For the year ended December 31, 2005, our net sales in Belgium wereapproximately $15.9 million. Currently, the lawsuit is in the pleading stage. The plaintiffs filed their initial brief onSeptember 27, 2005. An adverse judicial determination with respect to our network marketing program, or inproceedings not involving us directly but which challenge the legality of multi-level marketing systems, in Belgiumor in any other market in which we operate, could negatively impact our business.
29
%%TRANSMSG*** Transmitting Job: V16934 PCN: 030000000 ***%%PCMSG|29 |00012|Yes|No|03/16/2006 21:00|0|0|Page is valid, no graphics -- Color: D|

A substantial portion of our business is conducted in foreign markets, exposing us to the risks of trade orforeign exchange restrictions, increased tariffs, foreign currency fluctuations and similar risks associatedwith foreign operations.
Approximately 82% of our net sales for the year ended December 31, 2005, were generated outside theUnited States, exposing our business to risks associated with foreign operations. For example, a foreign governmentmay impose trade or foreign exchange restrictions or increased tariffs, which could negatively impact ouroperations. We are also exposed to risks associated with foreign currency fluctuations. For instance, purchasesfrom suppliers are generally made in U.S. dollars while sales to distributors are generally made in local currencies.Accordingly, strengthening of the U.S. dollar versus a foreign currency could have a negative impact on us.Although we engage in transactions to protect against risks associated with foreign currency fluctuations, we cannotbe certain any hedging activity will effectively reduce our exchange rate exposure. Our operations in some marketsalso may be adversely affected by political, economic and social instability in foreign countries. As we continue tofocus on expanding our existing international operations, these and other risks associated with internationaloperations may increase, which could harm our financial condition and operating results.
Our expansion in China is subject to general, as well as industry-specific, economic, political and legaldevelopments in China, and requires that we utilize a different business model from that we use elsewherein the world.
Our expansion of operations into China is subject to risks and uncertainties related to general economic,political and legal developments in China, among other things. The Chinese government exercises significantcontrol over the Chinese economy, including but not limited to controlling capital investments, allocating resources,setting monetary policy, controlling foreign exchange and monitoring foreign exchange rates, implementing andoverseeing tax regulations and providing preferential treatment to certain industry segments or companies.Accordingly, any adverse change in the Chinese economy, the Chinese legal system or Chinese governmental,economic or other policies could have a material adverse effect on our business in China.
In August 2005, China published regulations governing direct selling (effective December 1, 2005) andprohibiting pyramid promotional schemes (effective November 1, 2005) and a number of administrative methodsand proclamations were issued in proposal form in September 2005. When final, effective and applicable to us,these regulations will require us to use a business model different from that which we offer in other markets. Toallow us to operate in advance of the effectiveness of these new regulations, as well as to operate once thoseregulations are implemented, we have created and introduced a model specifically for China. In China, we haveCompany-operated retail stores that sell through employed sales management personnel to customers and preferredcustomers. We provide training and certification procedures for sales personnel in China. Once the regulations areeffective, we also expect to sell through independent direct sellers. These features are not common to the businessmodel we employ elsewhere in the world. The direct selling regulations require us to apply for approval to conduct adirect selling enterprise in China. There can be no assurance that we will be able to obtain that license. Additionally,although certain regulations have been published, others are pending, and there is uncertainty regarding theinterpretation and enforcement of such regulations. The regulatory environment in China is evolving, and officialsin the Chinese government often exercise discretion in deciding how to interpret and apply regulations. As such, wehave worked closely with governmental agencies and advisors in interpreting both the existing regulations and thenew regulations. However, we cannot be certain that our business model will be deemed by national or local Chineseregulatory authorities to be compliant with these or other more general regulations. In the past, the Chinesegovernment has rigorously monitored the direct selling market in China, and has taken serious action againstcompanies that the government believed were engaging in activities they regarded to be in violation of applicablelaw, including shutting down their businesses and imposing substantial fines. As a result, there can be no guaranteethat the Chinese government’s interpretation and application of the existing and new regulations will not negativelyimpact our business in China, result in regulatory investigations or lead to fines or penalties.
Chinese regulations prevent persons who are not Chinese nationals from engaging in direct selling in China.We cannot guarantee that any of our distributors living outside of China or any of our independent salesrepresentatives or employed sales management personnel in China will not engage in activities that violate ourpolicies in this market and therefore result in regulatory action and adverse publicity.
30
%%TRANSMSG*** Transmitting Job: V16934 PCN: 031000000 ***%%PCMSG|30 |00013|Yes|No|03/16/2006 21:00|0|0|Page is valid, no graphics -- Color: D|

As we expand operations in China, we anticipate that certain distributors will switch their focus from theirhome markets to that of China. As a result, we may see reduced distributor focus in Hong Kong, Taiwan andpossibly other of our markets as Chinese nationals that are distributors shift their attention to China, and a resultantreduction in distributor growth, leadership and revenue in these other countries.
If our operations in China are successful, we may experience rapid growth in China, and there can be noassurances that we will be able to successfully manage rapid expansion of manufacturing operations and a rapidlygrowing and dynamic sales force. There also can be no assurances that we will not experience difficulties in dealingwith or taking employment related actions (such as hiring, terminations and salary administration, including socialbenefit payments) with respect to our employed sales representatives, particularly given the highly regulated natureof the employment relationship in China. If we are unable to effectively manage such growth and expansion of ourretail stores, manufacturing operations or our employees, our government relations may be compromised and ouroperations in China may be harmed.
Our China business model, particularly with regard to sales management responsibilities and remuneration,differs from our traditional business model. There is a risk that such changes and transitions may not be understoodby our distributors or employees, may be viewed negatively by our distributors or employees, or may not becorrectly utilized by our distributors or employees. If that is the case, our business could be negatively impacted.
If we fail to further penetrate existing markets or successfully expand our business into new markets,then the growth in sales of our products, along with our operating results, could be negatively impactedand investors could lose all or part of their investment in our common shares.
The success of our business is to a large extent contingent on our ability to continue to grow by entering newmarkets and further penetrating existing markets. Our ability to further penetrate existing markets in which wecompete or to successfully expand our business into additional countries in Eastern Europe, Southeast Asia,South America or elsewhere, to the extent we believe that we have identified attractive geographic expansionopportunities in the future, is subject to numerous factors, many of which are out of our control.
In addition, government regulations in both our domestic and international markets can delay or prevent theintroduction, or require the reformulation or withdrawal, of some of our products, which could negatively impactour business, financial condition and results of operations. Also, our ability to increase market penetration in certaincountries may be limited by the finite number of persons in a given country inclined to pursue a direct sellingbusiness opportunity. Moreover, our growth will depend upon improved training and other activities that enhancedistributor retention in our markets. We cannot assure you that our efforts to increase our market penetration anddistributor retention in existing markets will be successful. Thus, if we are unable to continue to expand into newmarkets or further penetrate existing markets, our operating results would suffer and the market value of ourcommon shares could decline.
Our contractual obligation to sell our products only through our Herbalife distributor network and torefrain from changing certain aspects of our marketing plan may limit our growth.
In connection with the Acquisition, we entered into an agreement with our distributors that providedassurances that the change in ownership of our Company would not negatively affect certain aspects of theirbusiness. Through this agreement, we have committed to our distributors that we will not sell Herbalife productsthrough any distribution channel other than our network of independent Herbalife distributors. Thus, we arecontractually prohibited from expanding our business by selling Herbalife products through other distributionchannels that may be available to our competitors, such as over the internet, through wholesale sales, by establishingretail stores or through mail order systems. Since this is an ongoing or open-ended commitment, there can be noassurance that we will be able to take advantage of innovative new distribution channels that are developed in thefuture.
In addition, our agreement with our distributors provides that we will not change certain aspects of ourmarketing plan without the consent of a specified percentage of our distributors. For example, our agreement withour distributors provides that we may increase, but not decrease, the discount percentages available to ourdistributors for the purchase of products or the applicable royalty override percentages, including roll-ups, and
31
%%TRANSMSG*** Transmitting Job: V16934 PCN: 032000000 ***%%PCMSG|31 |00013|Yes|No|03/16/2006 21:00|0|0|Page is valid, no graphics -- Color: D|

production and other bonus percentages available to our distributors at various qualification levels within ourdistributor hierarchy. We may not modify the eligibility or qualification criteria for these discounts, royaltyoverrides and production and other bonuses unless we do so in a manner to make eligibility and/or qualificationeasier than under the applicable criteria in effect as of the date of the agreement. Our agreement with our distributorsfurther provides that we may not vary the criteria for qualification for each distributor tier within our distributorhierarchy, unless we do so in such a way so as to make qualification easier.
Although we reserved the right to make these changes to our marketing plan without the consent of ourdistributors in the event that changes are required by applicable law or are necessary in our reasonable businessjudgment to account for specific local market or currency conditions to achieve a reasonable profit on operations,there can be no assurance that our agreement with our distributors will not restrict our ability to adapt our marketingplan to the evolving requirements of the markets in which we operate. As a result, our growth, and the potential ofgrowth in the value of your investment in our common shares, may be limited.
We depend on the integrity and reliability of our information technology infrastructure, and any relatedinadequacies may result in substantial interruptions to our business.
Our ability to timely provide products to our distributors and their customers, and services to our distributors,depends on the integrity of our information technology system, which we are in the process of upgrading, includingthe reliability of software and services supplied by our vendors. As part of this upgrade, we have investedapproximately $42.3 million as of December 31, 2005. We intend to invest an additional $22.2 million throughDecember 31, 2006. We are implementing an Oracle enterprise-wide technology solution, a scalable and stableopen architecture platform, to enhance our and our distributors’ efficiency and productivity. In addition, we areupgrading our internet-based marketing and distributor services platform, MyHerbalife.com. We expect theseinitiatives to be substantially complete by 2008.
The most important aspect of our information technology infrastructure is the system through which we recordand track distributor sales, volume points, royalty overrides, bonuses and other incentives. We have encountered,and may encounter in the future, errors in our software or our enterprise network, or inadequacies in the softwareand services supplied by our vendors, although to date none of these errors or inadequacies has had a meaningfulnegative impact on our business. Any such errors or inadequacies that we may encounter in the future may result insubstantial interruptions to our services and may damage our relationships with, or cause us to lose, our distributorsif the errors or inadequacies impair our ability to track sales and pay royalty overrides, bonuses and other incentives,which would harm our financial condition and operating results. Such errors may be expensive or difficult to correctin a timely manner, and we may have little or no control over whether any inadequacies in software or servicessupplied to us by third parties are corrected, if at all.
Since we rely on independent third parties for the manufacture and supply of our products, if these thirdparties fail to reliably supply products to us at required levels of quality, then our financial condition andoperating results would be harmed.
All of our products are manufactured by outside companies, except for a small amount of productsmanufactured in our own manufacturing facility in China. We cannot assure you that our outside manufacturerswill continue to reliably supply products to us at the levels of quality, or the quantities, we require, especially afterthe FDA imposes cGMPs regulations.
Our supply contracts generally have a two-year term. Except for force majeure events, such as natural disastersand other acts of God, and non-performance by Herbalife, our manufacturers generally cannot unilaterallyterminate these contracts. These contracts can generally be extended by us at the end of the relevant time periodand we have exercised this right in the past. Globally we have over 40 suppliers of our products. For our majorproducts, we have both primary and secondary suppliers. Our major suppliers include Nature’s Bounty for proteinpowders, Fine Foods (Italy) for protein powders and nutritional supplements, PharmaChem Labs for teas andNiteworksTM and JB Labs for fiber. In the event any of our third-party manufacturers were to become unable orunwilling to continue to provide us with products in required volumes and at suitable quality levels, we would berequired to identify and obtain acceptable replacement manufacturing sources. There is no assurance that we would
32
%%TRANSMSG*** Transmitting Job: V16934 PCN: 033000000 ***%%PCMSG|32 |00014|Yes|No|03/16/2006 21:00|0|0|Page is valid, no graphics -- Color: D|

be able to obtain alternative manufacturing sources on a timely basis. An extended interruption in the supply ofproducts would result in the loss of sales. In addition, any actual or perceived degradation of product quality as aresult of reliance on third party manufacturers may have an adverse effect on sales or result in increased productreturns and buybacks.
If we fail to protect our trademarks and tradenames, then our ability to compete could be negativelyaffected, which would harm our financial condition and operating results.
The market for our products depends to a significant extent upon the goodwill associated with our trademarkand tradenames. We own, or have licenses to use, the material trademark and tradename rights used in connectionwith the packaging, marketing and distribution of our products in the markets where those products are sold.Therefore, trademark and tradename protection is important to our business. Although most of our trademarks areregistered in the United States and in certain foreign countries in which we operate, we may not be successful inasserting trademark or tradename protection. In addition, the laws of certain foreign countries may not protect ourintellectual property rights to the same extent as the laws of the United States. The loss or infringement of ourtrademarks or tradenames could impair the goodwill associated with our brands and harm our reputation, whichwould harm our financial condition and operating results.
Unlike in most of the other markets in which we operate, limited protection of intellectual property is availableunder Chinese law. Accordingly, we face an increased risk in China that unauthorized parties may attempt to copy orotherwise obtain or use our trademarks, copyrights, product formulations or other intellectual property. Further,since Chinese commercial law is relatively undeveloped, we may have limited legal recourse in the event weencounter significant difficulties with intellectual property theft or infringement. As a result, we cannot assure youthat we will be able to adequately protect our product formulations or other intellectual property.
If our distributors fail to comply with labeling laws, then our financial condition and operating resultswould be harmed.
Although the physical labeling of our products is not within the control of our independent distributors, ourdistributors must nevertheless advertise our products in compliance with the extensive regulations that exist incertain jurisdictions, such as the United States, which considers product advertising to be labeling for regulatorypurposes.
Our products are sold principally as foods, dietary supplements and cosmetics and are subject to rigorous FDAand related legal regimens limiting the types of therapeutic claims that can be made for our products. The treatmentor cure of disease, for example, is not a permitted claim for these products. While we train and attempt to monitorour distributors’ marketing materials, we cannot ensure that all such materials comply with bans on therapeuticclaims. If our distributors fail to comply with these restrictions, then we and our distributors could be subjected toclaims, financial penalties, mandatory product recalls or relabeling requirements, which could harm our financialcondition and operating results. Although we expect that our responsibility for the actions of our independentdistributors in such an instance would be dependent on a determination that we either controlled or condoned a non-compliant advertising practice, there can be no assurance that we could not be held responsible for the actions of ourindependent distributors.
If our intellectual property is not adequate to provide us with a competitive advantage or to prevent com-petitors from replicating our products, or if we infringe the intellectual property rights of others, then ourfinancial condition and operating results would be harmed.
Our future success and ability to compete depend upon our ability to timely produce innovative products andproduct enhancements that motivate our distributors and customers, which we attempt to protect under acombination of copyright, trademark and trade secret laws, confidentiality procedures and contractual provisions.However, our products are generally not patented domestically or abroad, and the legal protections afforded by ourcommon law and contractual proprietary rights in our products provide only limited protection and may be time-consuming and expensive to enforce and/or maintain. Further, despite our efforts, we may be unable to prevent third
33
%%TRANSMSG*** Transmitting Job: V16934 PCN: 034000000 ***%%PCMSG|33 |00010|Yes|No|03/16/2006 21:00|0|0|Page is valid, no graphics -- Color: D|

parties from infringing upon or misappropriating our proprietary rights or from independently developing non-infringing products that are competitive with, equivalent to and/or superior to our products.
Additionally, third parties may claim that products we have independently developed infringe upon theirintellectual property rights. For example, in two related lawsuits that are currently pending in California, UnitherPharma, Inc. and others are alleging that sales by Herbalife International of (1) its NiteworksTM and Prelox Blueproducts and (2) its former products Woman’s Advantage with DHEA and Optimum Performance infringe onpatents that are licensed to or owned by those parties, and are seeking unspecified damages, attorneys’ fees andinjunctive relief from the Company. Although we believe that we have meritorious defenses to, and are vigorouslydefending against, these allegations, there can be no assurance that one or more of our products will not be found toinfringe upon the intellectual property rights of these parties or others.
Monitoring infringement and/or misappropriation of intellectual property can be difficult and expensive, andwe may not be able to detect any infringement or misappropriation of our proprietary rights. Even if we do detectinfringement or misappropriation of our proprietary rights, litigation to enforce these rights could cause us to divertfinancial and other resources away from our business operations. Further, the laws of some foreign countries do notprotect our proprietary rights to the same extent as do the laws of the United States.
Since one of our products constitutes a significant portion of our retail sales, significant decreases inconsumer demand for this product or our failure to produce a suitable replacement should we ceaseoffering it would harm our financial condition and operating results.
Our Formula 1 meal replacement product constitutes a significant portion of our sales, accounting forapproximately 27%, 22%, and 23% of retail sales for the fiscal years ended December 31, 2005, 2004 and 2003,respectively. If consumer demand for this product decreases significantly or we cease offering this product without asuitable replacement, then our financial condition and operating results would be harmed.
If we lose the services of members of our senior management team, then our financial condition andoperating results would be harmed.
We depend on the continued services of our Chief Executive Officer, Michael O. Johnson, and our currentsenior management team and the relationships that they have developed with our senior distributor leadership,especially in light of the high level of turnover in our former senior management team, and the resulting need to re-establish good working relationships with our senior distributor leadership, after the death of our founder in May of2000. Although we have entered into employment agreements with many members of our senior management team,and do not believe that any of them are planning to leave or retire in the near term, we cannot assure you that oursenior managers will remain with us. The loss or departure of any member of our senior management team couldnegatively impact our distributor relations and operating results. If any of these executives do not remain with us,our business could suffer. The loss of such key personnel could negatively impact our ability to implement ourbusiness strategy, and our continued success will also be dependent upon our ability to retain existing, and attractadditional, qualified personnel to meet our needs. We currently do not maintain “key person” life insurance withrespect to our senior management team.
The covenants in our existing indebtedness limit our discretion with respect to certain business matters,which could limit our ability to pursue certain strategic objectives and in turn harm our financial condi-tion and operating results.
Our 91⁄2% Notes and senior credit facility contain numerous financial and operating covenants that restrict ourand our subsidiaries’ ability to, among other things:
• pay dividends, redeem share capital or capital stock and make other restricted payments and investments;
• incur additional debt or issue preferred shares;
• allow the imposition of dividend or other distribution restrictions on our subsidiaries;
• create liens on our and our subsidiaries’ assets;
34
%%TRANSMSG*** Transmitting Job: V16934 PCN: 035000000 ***%%PCMSG|34 |00010|Yes|No|03/16/2006 21:00|0|0|Page is valid, no graphics -- Color: D|

• engage in transactions with affiliates;
• guarantee other indebtedness; and
• merge, consolidate or sell all or substantially all of our assets and the assets of our subsidiaries.
In addition, our senior credit facility requires us to meet certain financial ratios and financial conditions. Ourability to comply with these covenants may be affected by events beyond our control, including prevailingeconomic, financial and industry conditions. Failure to comply with these covenants could result in a defaultcausing all amounts to become due and payable under our outstanding notes and/or the senior credit facility, whichis secured by substantially all of our assets, which the lenders thereunder could proceed to foreclose against.
If we do not comply with transfer pricing and similar tax regulations, then we may be subjected toadditional taxes, interest and penalties in material amounts, which could harm our financial conditionand operating results.
As a multinational corporation, in many countries including the United States, we are subject to transferpricing and other tax regulations designed to ensure that our intercompany transactions are consummated at pricesthat have not been manipulated to produce a desired tax result, that appropriate levels of income are reported asearned by our United States or local entities, and that we are taxed appropriately on such transactions. In addition,our operations are subject to regulations designed to ensure that appropriate levels of customs duties are assessed onthe importation of our products. We are currently subject to pending or proposed audits that are at various levels ofreview, assessment or appeal in a number of jurisdictions involving transfer pricing issues, income taxes, customsduties, value added taxes, withholding taxes, sales and use and other taxes and related interest and penalties inmaterial amounts. In some circumstances, additional taxes, interest and penalties have been assessed and we will berequired to pay the assessments or litigate to reverse the assessments. We have reserved in the consolidated financialstatements an amount that we believe represents the most likely outcome of the resolution of these disputes, but ifwe are incorrect in our assessment we may have to pay the full amount asserted. Ultimate resolution of these mattersmay take several years, and the outcome is uncertain. If the United States Internal Revenue Service or the taxingauthorities of any other jurisdiction were to successfully challenge our transfer pricing practices, we could becomesubject to higher taxes and our earnings would be adversely affected.
We may be held responsible for certain taxes or assessments relating to the activities of our distributors,which could harm our financial condition and operating results.
Our distributors are subject to taxation, and in some instances, legislation or governmental agencies impose anobligation on us to collect taxes, such as value added taxes, and to maintain appropriate records. In addition, we aresubject to the risk in some jurisdictions of being responsible for social security and similar taxes with respect to ourdistributors. In the event that local laws and regulations or the interpretation of local laws and regulations change torequire us to treat our independent distributors as employees, or that our distributors are deemed by local regulatoryauthorities in one or more of the jurisdictions in which we operate to be our employees rather than independentcontractors under existing laws and interpretations, we may be held responsible for social security and related taxesin those jurisdictions, plus any related assessments and penalties, which could harm our financial condition andoperating results.
We may incur material product liability claims, which could increase our costs and harm our financialcondition and operating results.
Our products consist of herbs, vitamins and minerals and other ingredients that are classified as foods ordietary supplements and are not subject to pre-market regulatory approval in the United States. Our products couldcontain contaminated substances, and some of our products contain innovative ingredients that do not have longhistories of human consumption. We generally do not conduct or sponsor clinical studies for our products andpreviously unknown adverse reactions resulting from human consumption of these ingredients could occur. As amarketer of dietary and nutritional supplements and other products that are ingested by consumers or applied totheir bodies, we have been, and may again be, subjected to various product liability claims, including that theproducts contain contaminants, the products include inadequate instructions as to their uses, or the products include
35
%%TRANSMSG*** Transmitting Job: V16934 PCN: 036000000 ***%%PCMSG|35 |00012|Yes|No|03/16/2006 21:00|0|0|Page is valid, no graphics -- Color: D|

inadequate warnings concerning side effects and interactions with other substances. It is possible that widespreadproduct liability claims could increase our costs, and adversely affect our revenues and operating income.Moreover, liability claims arising from a serious adverse event may increase our costs through higher insurancepremiums and deductibles, and may make it more difficult to secure adequate insurance coverage in the future. Inaddition, our product liability insurance may fail to cover future product liability claims, thereby requiring us to paysubstantial monetary damages and adversely affecting our business. Finally, given the higher level of self-insuredretentions that we have accepted under our current product liability insurance policies, which are as high asapproximately $10 million, in certain cases we may be subject to the full amount of liability associated with anyinjuries, which could be substantial.
Several years ago, a number of states restricted the sale of dietary supplements containing botanical sources ofephedrine alkaloids and on February 6, 2004, the FDA banned the use of such ephedrine alkaloids. Until late 2002,we had sold Thermojetics» original green herbal tablets, Thermojetics» green herbal tablets and Thermojetics»gold herbal tablets, all of which contained ephedrine alkaloids. Accordingly, we run the risk of product liabilityclaims related to the ingestion of ephedrine alkaloids contained in those products. Currently, we have been named asa defendant in product liability lawsuits seeking to link the ingestion of certain of the aforementioned products tosubsequent alleged medical problems suffered by plaintiffs. Although we believe that we have meritorious defensesto the allegations contained in these lawsuits, and are vigorously defending these claims, there can be no assurancethat we will prevail in our defense of any or all of these matters.
A few of our shareholders will collectively exert significant influence over us and have the power to causethe approval or rejection of all shareholder actions and may take actions that conflict with your interests.
As of February 1, 2006, affiliates of Whitney and Golden Gate Capital own approximately 41.5% of the votingpower of our share capital. Accordingly, the Equity Sponsors collectively will have the power to exert significantinfluence over us and the approval or rejection of any matter on which the shareholders may vote, including theelection of directors, amendment of our memorandum and articles of association and approval of significantcorporate transactions and they will have significant control over our management and policies. This influence overcorporate actions may also delay, deter or prevent transactions that would result in a change of control. Moreover,the Equity Sponsors may have interests that conflict with yours.
We are subject to, among other things, the attestation requirements regarding the effectiveness of internalcontrol over financial reporting. These requirements have increased our compliance costs, and failure tocomply in a timely manner could adversely affect the value of our securities.
We are required to comply with various corporate governance and financial reporting requirements under theSarbanes-Oxley Act of 2002, as well as new rules and regulations adopted by the Commission, the Public CompanyAccounting Oversight Board and the NYSE. In particular, we are required to include management and auditorreports on the effectiveness of internal control over financial reporting as part of our annual report on Form 10-K forthe year ended December 31, 2005, pursuant to Section 404 of the Sarbanes-Oxley Act. We expect to continue tospend significant amounts of time and money on compliance with these rules. Our failure to correct any notedweaknesses in internal controls over financial reporting could result in the disclosure of material weaknesses whichcould have a material adverse effect upon the market value of our stock.
Holders of our common shares may face difficulties in protecting their interests because we are incorpo-rated under Cayman Islands law.
Our corporate affairs are governed by our amended and restated memorandum and articles of association, bythe Companies Law (2004 Revision) and the common law of the Cayman Islands. The rights of our shareholders andthe fiduciary responsibilities of our directors under Cayman Islands law are not as clearly established as understatutes or judicial precedent in existence in jurisdictions in the United States. Therefore, shareholders may havemore difficulty in protecting their interests in the face of actions by our management, directors or controllingshareholders than would shareholders of a corporation incorporated in a jurisdiction in the United States, due to thecomparatively less developed nature of Cayman Islands law in this area.
36
%%TRANSMSG*** Transmitting Job: V16934 PCN: 037000000 ***%%PCMSG|36 |00015|Yes|No|03/16/2006 21:00|0|0|Page is valid, no graphics -- Color: D|

Unlike many jurisdictions in the United States, Cayman Islands law does not specifically provide forshareholder appraisal rights on a merger or consolidation of a company. This may make it more difficult forshareholders to assess the value of any consideration they may receive in a merger or consolidation or to require thatthe offer give shareholders additional consideration if they believe the consideration offered is insufficient.
Shareholders of Cayman Islands exempted companies such as ourselves have no general rights under CaymanIslands law to inspect corporate records and accounts or to obtain copies of lists of our shareholders. Our directorshave discretion under our articles of association to determine whether or not, and under what conditions, ourcorporate records may be inspected by our shareholders, but are not obliged to make them available to ourshareholders. This may make it more difficult for you to obtain the information needed to establish any factsnecessary for a shareholder motion or to solicit proxies from other shareholders in connection with a proxy contest.
Subject to limited exceptions, under Cayman Islands law, a minority shareholder may not bring a derivativeaction against the board of directors. Maples and Calder, our Cayman Islands counsel, has informed us that they arenot aware of any reported class action or derivative action having been brought in a Cayman Islands court.
Provisions of our articles of association and Cayman Islands corporate law may impede a takeover ormake it more difficult for shareholders to change the direction or management of the Company, whichcould adversely affect the value of our common shares and provide shareholders with less input into themanagement of the Company than they might otherwise have.
Our articles of association permit our board of directors to issue preference shares from time to time, with suchrights and preferences as they consider appropriate. Our board of directors could authorize the issuance ofpreference shares with terms and conditions and under circumstances that could have an effect of discouraging atakeover or other transaction.
In addition, our articles of association contain certain other provisions which could have an effect ofdiscouraging a takeover or other transaction or preventing or making it more difficult for shareholders to changethe direction or management of our Company, including a classified board, the inability of shareholders to act bywritten consent, a limitation on the ability of shareholders to call special meetings of shareholders and advancenotice provisions. As a result, our shareholders may have less input into the management of our Company than theymight otherwise have if these provisions were not included in our articles of association.
Unlike many jurisdictions in the United States, Cayman Islands law does not provide for mergers as thatexpression is understood under corporate law in the United States. However, Cayman Islands law does havestatutory provisions that provide for the reconstruction and amalgamation of companies, which are commonlyreferred to in the Cayman Islands as “schemes of arrangement.” The procedural and legal requirements necessary toconsummate these transactions are more rigorous and take longer to complete than the procedures typicallyrequired to consummate a merger in the United States. Under Cayman Islands law and practice, a scheme ofarrangement in relation to a solvent Cayman Islands company must be approved at a shareholders’ meeting by eachclass of shareholders, in each case, by a majority of the number of holders of each class of a company’s shares thatare present and voting (either in person or by proxy) at such a meeting, which holders must also represent 75% invalue of such class issued that are present and voting (either in person or by proxy) at such meeting (excluding theshares owned by the parties to the scheme of arrangement).
The convening of these meetings and the terms of the amalgamation must also be sanctioned by the GrandCourt of the Cayman Islands. Although there is no requirement to seek the consent of the creditors of the partiesinvolved in the scheme of arrangement, the Grand Court typically seeks to ensure that the creditors have consentedto the transfer of their liabilities to the surviving entity or that the scheme of arrangement does not otherwise have amaterial adverse effect on the creditors’ interests. Furthermore, the Grand Court will only approve a scheme ofarrangement if it is satisfied that:
• the statutory provisions as to majority vote have been complied with;
• the shareholders have been fairly represented at the meeting in question;
• the scheme of arrangement is such as a businessman would reasonably approve; and
37
%%TRANSMSG*** Transmitting Job: V16934 PCN: 038000000 ***%%PCMSG|37 |00012|Yes|No|03/16/2006 21:00|0|0|Page is valid, no graphics -- Color: D|

• the scheme of arrangement is not one that would more properly be sanctioned under some other provision ofthe Companies Law.
There is uncertainty as to shareholders’ ability to enforce certain foreign civil liabilities in the CaymanIslands.
We are incorporated as an exempted company with limited liability under the laws of the Cayman Islands. Amaterial portion of our assets are located outside of the United States. As a result, it may be difficult for ourshareholders to enforce judgments against us or judgments obtained in U.S. courts predicated upon the civil liabilityprovisions of the federal securities laws of the United States or any state of the United States.
We have been advised by our Cayman Islands counsel, Maples and Calder, that although there is no statutoryenforcement in the Cayman Islands of judgments obtained in the United States, the courts of the Cayman Islandswill — based on the principle that a judgment by a competent foreign court imposes upon the judgment debtor anobligation to pay the sum for which judgment has been given — recognize and enforce a foreign judgment of acourt of competent jurisdiction if such judgment is final, for a liquidated sum, not in respect of taxes or a fine orpenalty, is not inconsistent with a Cayman Islands judgment in respect of the same matters, and was not obtained ina manner, and is not of a kind, the enforcement of which is contrary to the public policy of the Cayman Islands.There is doubt, however, as to whether the Grand Court of the Cayman Islands will (a) recognize or enforcejudgments of U.S. courts predicated upon the civil liability provisions of the federal securities laws of theUnited States or any state of the United States, or (b) in original actions brought in the Cayman Islands, imposeliabilities predicated upon the civil liability provisions of the federal securities laws of the United States or any stateof the United States, on the grounds that such provisions are penal in nature.
The Grand Court of the Cayman Islands may stay proceedings if concurrent proceedings are being broughtelsewhere.
Item 1B. UNRESOLVED STAFF COMMENTS
None.
Item 2. PROPERTIES
We lease all of our physical properties located in the United States. Our executive offices, located in CenturyCity, California, include approximately 121,000 square feet of general office space leased under arrangementsexpiring in August 2007. We lease an aggregate of approximately 144,000 square feet of office space, computerfacilities and conference rooms in Inglewood, California, leased under an arrangement expiring in October 2006. InDecember 2005, we signed an agreement to lease 186,000 square feet of office space in Torrance, California. Thislease agreement has terms through January 2016 and will replace our Inglewood facility. Additionally, we leasefacilities located in Los Angeles and Memphis. The Los Angeles and Memphis lease agreements have termsthrough June 2006 and August 2006, respectively. In Venray, Netherlands, we lease our European centralizedwarehouse of approximately 150,000 square feet under an arrangement expiring in June 2007. We also leasewarehouse, manufacturing plant and office space in a majority of our other geographic areas of operation. Webelieve that our existing facilities are adequate to meet our current requirements and that comparable space isreadily available at each of these locations.
Item 3. LEGAL PROCEEDINGS
We are from time to time engaged in routine litigation. We regularly review all pending litigation matters inwhich we are involved and establish reserves deemed appropriate by management for these litigation matters whena probable loss estimate can be made.
Herbalife International and certain of its independent distributors have been named as defendants in apurported class action lawsuit filed February 17, 2005, in the Superior Court of California, County of San Francisco,and served on Herbalife International on March 14, 2005 (Minton v. Herbalife International, et al). The case hasbeen transferred to the Los Angeles County Superior Court. The plaintiff is challenging the marketing practices of
38
%%TRANSMSG*** Transmitting Job: V16934 PCN: 039000000 ***%%PCMSG|38 |00013|Yes|No|03/16/2006 21:00|0|0|Page is valid, no graphics -- Color: D|

certain Herbalife International independent distributors and Herbalife International under various state lawsprohibiting “endless chain schemes,” insufficient disclosure in assisted marketing plans, unfair and deceptivebusiness practices, and fraud and deceit. The plaintiff alleges that the Freedom Group system operated by certainindependent distributors of Herbalife International products places too much emphasis on recruiting and encour-ages excessively large purchases of product and promotional materials by distributors. The plaintiff also alleges thatFreedom Group pressured distributors to disseminate misleading promotional materials. The plaintiff seeks to holdHerbalife International vicariously liable for the actions of its independent distributors and is seeking damages andinjunctive relief. The Company believes that we have meritorious defenses to the suit.
Herbalife International and certain of its distributors have been named as defendants in a purported class actionlawsuit filed July 16, 2003, in the Circuit Court of Ohio County in the State of West Virginia (Mey v. HerbalifeInternational, Inc., et al). The complaint alleges that certain telemarketing practices of certain Herbalife Inter-national distributors violate the Telephone Consumer Protection Act, or TCPA, and seeks to hold HerbalifeInternational vicariously liable for the practices of its distributors. More specifically, the plaintiffs’ complaintalleges that several of Herbalife International’s distributors used pre-recorded telephone messages and autodialersto contact prospective customers in violation of the TCPA’s prohibition of such practices. Herbalife International’sdistributors are independent contractors and if any such distributors in fact violated the TCPA they also violatedHerbalife’s policies which require its distributors to comply with all applicable federal, state and local laws. TheCompany believes that we have meritorious defenses to the suit.
As a marketer of dietary and nutritional supplements and other products that are ingested by consumers orapplied to their bodies, we have been and are currently subjected to various product liability claims. The effects ofthese claims to date have not been material to us, and the reasonably possible range of exposure on currentlyexisting claims is not material to us. We believe that we have meritorious defenses to the allegations contained in thelawsuits. We currently maintain product liability insurance with an annual deductible of $10 million.
Certain of our subsidiaries have been subject to tax audits by governmental authorities in their respectivecountries. In certain of these tax audits, governmental authorities are proposing that significant amounts ofadditional taxes and related interest and penalties are due. We and our tax advisors believe that there are substantialdefenses to their allegations that additional taxes are owing, and we are vigorously contesting the additionalproposed taxes and related charges.
Item 4. SUBMISSION OF MATTERS TO A VOTE OF SECURITY HOLDERS
At the Annual General Meeting of Shareholders, the Company’s 2005 annual meeting, held on November 2,2005, 62,303,630 shares were present either in person or by proxy.
At this meeting, the shareholders voted as set forth below on the following matters:
Proposition For Against Abstain WithheldBroker
Non-Votes
1. To elect three directors, each for a term ofthree years.
Peter M. Castleman . . . . . . . . . . . . . . . . . . . 55,801,634 N/A N/A 6,501,996 —
Michael O. Johnson . . . . . . . . . . . . . . . . . . . 55,825,590 N/A N/A 6,478,040 —
John Tartol . . . . . . . . . . . . . . . . . . . . . . . . . 55,806,464 N/A N/A 6,497,136 30
2. To approve the Company’s 2005 StockIncentive Plan . . . . . . . . . . . . . . . . . . . . . . 48,675,410 8,472,678 4,506 N/A 5,151,036
3. To approve the Company’s ExecutiveIncentive Plan . . . . . . . . . . . . . . . . . . . . . . 55,863,838 1,282,278 6,480 N/A 5,151,034
4. To ratify the appointment of the Company’sindependent registered public accountantsfor fiscal year 2005 . . . . . . . . . . . . . . . . . . 61,863,460 432,172 7,998 N/A —
39
%%TRANSMSG*** Transmitting Job: V16934 PCN: 040000000 ***%%PCMSG|39 |00018|Yes|No|03/16/2006 21:00|0|0|Page is valid, no graphics -- Color: D|

PART II
Item 5. MARKET FOR REGISTRANT’S COMMON EQUITY, RELATED STOCKHOLDER MATTERSAND ISSUER PURCHASES OF EQUITY SECURITIES
Information with Respect to our Common Shares
Our common shares have been listed on the New York Stock Exchange (“NYSE”) since December 16, 2004,and trade under the symbol “HLF.” The following table sets forth the range of the high and low sales prices for ourcommon shares in each of the relevant fiscal quarters presented, based upon quotations on the NYSE consolidatedtransaction reporting system.
Quarter Ended High Low
March 31, 2004 . . . . . . . . . . . . . . . . . . . . . . . . . . . . . . . . . . . . . . . . . . . . . . . . . n/a n/a
June 30, 2004 . . . . . . . . . . . . . . . . . . . . . . . . . . . . . . . . . . . . . . . . . . . . . . . . . . . n/a n/a
September 30, 2004 . . . . . . . . . . . . . . . . . . . . . . . . . . . . . . . . . . . . . . . . . . . . . . n/a n/a
December 31, 2004 . . . . . . . . . . . . . . . . . . . . . . . . . . . . . . . . . . . . . . . . . . . . . . $16.85 $14.00
Quarter Ended High Low
March 31, 2005 . . . . . . . . . . . . . . . . . . . . . . . . . . . . . . . . . . . . . . . . . . . . . . . . . $16.70 $15.10
June 30, 2005 . . . . . . . . . . . . . . . . . . . . . . . . . . . . . . . . . . . . . . . . . . . . . . . . . . . $21.86 $14.52
September 30, 2005 . . . . . . . . . . . . . . . . . . . . . . . . . . . . . . . . . . . . . . . . . . . . . . $30.50 $21.00
December 31, 2005 . . . . . . . . . . . . . . . . . . . . . . . . . . . . . . . . . . . . . . . . . . . . . . $33.75 $25.25
The market price of our common shares is subject to fluctuations in response to variations in our quarterlyoperating results, general trends in the market for our products and product candidates, economic and currencyexchange issues in the foreign markets in which we operate and other factors, many of which are not within ourcontrol. In addition, broad market fluctuations, as well as general economic, business and political conditions mayadversely affect the market for our common shares, regardless of our actual or projected performance.
The closing price of our common shares on February 22, 2006, was $30.45. The approximate number ofholders of record of our common shares as of February 22, 2006 was 1,249. This number of holders of record doesnot represent the actual number of beneficial owners of our common shares because shares are frequently held in“street name” by securities dealers and others for the benefit of individual owners who have the right to vote theirshares.
Information with Respect to Dividends
In December 2004, we used a portion of the net proceeds from the initial public offering of our common sharesto pay a special dividend of $2.64 per common share, or $139.7 million, to our shareholders of record onDecember 14, 2004. In addition, we paid a cash dividend of $0.12 per common share; or $6.3 million, toshareholders on record as of December 13, 2004.
The declaration of future dividends is subject to the discretion of our board of directors and will depend uponvarious factors, including our net earnings, financial condition, restrictions imposed by our credit agreement, cashrequirements, future prospects and other factors deemed relevant by our board of directors. Our credit agreementpermits payments of dividends as long as no default exist and the amount does not exceed $20.0 million per fiscalyear, provided that the amount of dividends may be increased by 25% of the consolidated net income for the priorfiscal year, if the Leverage Ratio as defined in the credit agreement for the four fiscal quarters of such fiscal year isless than or equal to 2.00:1.00.
Information with Respect to Securities Authorized for Issuance Under Equity Compensation Plans
The following table sets forth as of December 31, 2005, the information with respect to (a) number of securitiesto be issued upon exercise of outstanding options, warrants and rights, (b) weighted average exercise price of
40
%%TRANSMSG*** Transmitting Job: V16934 PCN: 041000000 ***%%PCMSG|40 |00016|Yes|No|03/16/2006 21:00|0|0|Page is valid, no graphics -- Color: D|

outstanding options, warrants and rights and (c) number of securities remaining available for future issuance underequity compensation plans.
Number of securitiesto be issued
upon exercise ofoutstanding options,warrants and rights
Weighted averageexercise price of
outstanding options,warrants and rights
Number of securitiesremaining available forFuture issuance under
equity compensation plans(excluding securities
in column (a)(a) (b) (c)
Equity compensation plans approved bysecurity holders. . . . . . . . . . . . . . . . . . . . 10,197,233 $12.30 6,010,274
Equity compensation plans not approved bysecurity holders. . . . . . . . . . . . . . . . . . . . — — —
Total . . . . . . . . . . . . . . . . . . . . . . . . . . . . . 10,197,233 $12.30 6,010,274
41
%%TRANSMSG*** Transmitting Job: V16934 PCN: 042000000 ***%%PCMSG|41 |00017|Yes|No|03/16/2006 21:00|0|0|Page is valid, no graphics -- Color: D|

Item 6. SELECTED FINANCIAL DATA
The following table sets forth certain of our historical financial data. We have derived the selected historicalconsolidated financial data as of December 31, 2001, the seven month period ended July 31, 2002, the five monthperiod ended December 31, 2002 and the years ended December 31, 2003, 2004 and 2005, from our auditedfinancial statements and the related notes. Not all periods shown below are include in this Annual Report onForm 10-K. The selected consolidated historical financial data set forth below are not necessarily indicative of theresults of future operations and should be read in conjunction with the discussion under the heading “Management’sDiscussion and Analysis of Financial Condition and Results of Operations,” and the historical consolidatedfinancial statements and accompanying notes included elsewhere in this document. All common share and earningsper share data for the Company gives effect to a 1:2 reverse stock split, which took effect December 1, 2004.
Year EndedDecember 31,
2001
January 1 toJuly 31,
2002
August 1 toDecember 31,
2002 2003 2004 2005Year Ended December 31,
Predecessor Successor
(In thousands except per share data)
Income Statement Data:Net sales . . . . . . . . . . . . . . . . . . $1,020,130 $ 644,188 $ 449,524 $1,159,433 $1,309,663 $1,566,750Cost of sales . . . . . . . . . . . . . . . 241,522 140,553 95,001 235,785 269,913 315,746
Gross profit . . . . . . . . . . . . . . . . 778,608 503,635 354,523 923,648 1,039,750 1,251,004Royalty overrides . . . . . . . . . . . . 355,225 227,233 159,915 415,351 464,892 555,665Selling, General and
Administrative Expenses(1) . . 354,608 207,390 135,536 401,261 436,139 476,268Acquisition transaction
expenses(2) . . . . . . . . . . . . . . — 54,708 6,183 — — —
Operating income(1) . . . . . . . . . 68,775 14,304 52,889 107,036 138,719 219,071Interest income (expense), net . . 3,413 1,364 (23,898) (41,468) (123,305) (43,924)
Income before income taxes andminority interest . . . . . . . . . . . 72,188 15,668 28,991 65,568 15,414 175,147
Income taxes . . . . . . . . . . . . . . . 28,875 6,267 14,986 28,721 29,725 82,007
Income (loss) before minorityinterest . . . . . . . . . . . . . . . . . . 43,313 9,401 14,005 36,847 (14,311) 93,140
Minority interest . . . . . . . . . . . . 725 189 — — — —
Net income (loss). . . . . . . . . . . . $ 42,588 $ 9,212 $ 14,005 $ 36,847 $ (14,311) $ 93,140
Earnings (loss) per shareBasic . . . . . . . . . . . . . . . . . . . $ 1.40 $ 0.28 $ — $ — $ (0.27) $ 1.35Diluted . . . . . . . . . . . . . . . . . $ 1.36 $ 0.27 $ 0.27 $ 0.69 $ (0.27) $ 1.28
Weighted average sharesoutstandingBasic . . . . . . . . . . . . . . . . . . . 30,422 32,387 — — 52,911 68,972Diluted . . . . . . . . . . . . . . . . . 31,250 33,800 51,021 53,446 52,911 72,728
Other Financial Data:Retail sales(3) . . . . . . . . . . . . . . $1,656,168 $1,047,690 $ 731,505 $1,894,384 $2,146,241 $2,575,716Net cash provided by (used in):
Operating activities . . . . . . . . 95,465 37,901 28,039 94,350 80,110 143,352Investing activities . . . . . . . . . (16,366) 18,995 (456,046) 3,152 (8,086) (32,526)Financing activities . . . . . . . . (3,456) (35,292) 491,519 (18,831) (23,160) (225,890)Depreciation and
amortization . . . . . . . . . . . . 18,056 11,722 11,424 55,605 43,896 35,436Capital expenditures(4) . . . . . . . 14,751 6,799 3,599 20,435 30,279 32,604
42
%%TRANSMSG*** Transmitting Job: V16934 PCN: 043000000 ***%%PCMSG|42 |00014|Yes|No|03/16/2006 21:00|0|0|Page is valid, no graphics -- Color: D|

As ofDecember 31,
2001 2002 2003 2004 2005
Predecessor
As of December 31,Company
(In thousands except per share data)
Balance Sheet Data:Cash and cash equivalents(5) . . . . . . . . . . . . . $201,181 $ 76,024 $156,380 $201,577 $ 88,248
Receivables, net . . . . . . . . . . . . . . . . . . . . . . 27,609 29,026 31,977 29,546 37,266
Inventories . . . . . . . . . . . . . . . . . . . . . . . . . . 72,208 56,868 59,397 71,092 109,785
Total working capital . . . . . . . . . . . . . . . . . . 177,813 7,186 1,521 (1,556) 14,094
Total assets . . . . . . . . . . . . . . . . . . . . . . . . . . 470,335 855,705 903,964 948,701 837,801
Total debt . . . . . . . . . . . . . . . . . . . . . . . . . . . 10,612 340,759 325,294 486,217 263,092
Shareholders’ equity(6) . . . . . . . . . . . . . . . . . 260,916 191,274 237,788 64,342 168,888
Cash Dividends per common share . . . . . . . . 0.60 0.30 — 2.76 —
(1) The year ended December 31, 2003 includes $5.1 million in legal and related costs associated with litigationresulting from the Acquisition.
(2) The seven months ended July 31, 2002 and the five months ended December 31, 2002, include fees andexpenses related to the Acquisition.
(3) In previous years, we reported retail sales on the face of our income statement in addition to the requireddisclosure of net sales. Retail sales represent the gross sales amount reflected on our invoices to our distributors.We do not receive the retail sales amount. “Product sales” represent the actual product purchase price paid to usby our distributors, after giving effect to distributor discounts referred to as “distributor allowances,” whichtotal approximately 50% of suggested retail sales prices. Distributor allowances as a percentage of sales mayvary by country depending upon regulatory restrictions that limit or otherwise restrict distributor allowances.“Net sales” represents product sales and handling and freight income.
Retail sales data is referred to in “Management’s Discussion and Analysis of Financial Condition and Resultsof Operations.” Our use of retail sales reflect the fundamental role of “retail sales” in our accounting systems,internal controls and operations, including the basis upon which the distributors are being paid. In addition,information in daily and monthly reports reviewed by our management relies on retail sales data.
The following represents the reconciliation of retail sales to net sales for each of the periods set forth above:
Year EndedDecember 31,
2001
January 1 toJuly 31,
2002
August 1 toDecember 31,
2002 2003 2004 2005
Predecessor
Year Ended December 31,Company
(Dollars in thousands)
Retail sales . . . . . . . $1,656,168 $1,047,690 $ 731,505 $1,894,384 $ 2,146,241 $ 2,575,716Distributor
allowance . . . . . . . (774,513) (492,997) (345,145) (899,264) (1,021,196) (1,225,441)
Product sales . . . . . . 881,655 554,693 386,360 995,120 1,125,045 1,350,275Handling and freight
income . . . . . . . . . 138,475 89,495 63,164 164,313 184,618 216,475
Net sales . . . . . . . . . $1,020,130 $ 644,188 $ 449,524 $1,159,433 $ 1,309,663 $ 1,566,750
(4) Includes acquisition of property from capitalized leases of $3.8 million, $2.1 million, $1.4 million, $6.8 million,$7.2 million and $1.1 million for 2001, the seven months ended July 31, 2002, the five months endedDecember 31, 2002, the years ended December 31, 2003, 2004, and 2005, respectively.
(5) Includes restricted cash of $10.6 million and $5.7 million as of December 31, 2002 and December 31, 2003,respectively, and $1.3 million of marketable securities at December 31, 2002.
(6) In December 2004 we used a portion of the net proceeds from the initial public offering of our common sharesto pay a $2.64 dollar amount per common share or $139.7 million special cash dividend to our shareholders of
43
%%TRANSMSG*** Transmitting Job: V16934 PCN: 044000000 ***%%PCMSG|43 |00012|Yes|No|03/16/2006 21:00|0|0|Page is valid, no graphics -- Color: D|

record on December 14, 2004. In addition, we paid a $0.12 per common share or $6.3 million cash dividend toshareholders on record on December 13, 2004. In March 2004 in conjunction with the conversion of our 12%preferred shares into common shares we paid a total of $221.6 million to the preferred shareholders including,$38.5 million, representing accrued and unpaid dividends.
Item 7. MANAGEMENT’S DISCUSSION AND ANALYSIS OF FINANCIAL CONDITION ANDRESULTS OF OPERATIONS
You should read the following discussion and analysis in conjunction with “Selected Financial Data” and ourconsolidated financial statements and related notes, each included elsewhere in this Annual Report on Form 10-K.
Overview
We are a global network marketing company that sells weight management, nutritional supplement andpersonal care products. We pursue our mission of “changing people’s lives” by providing a financially rewardingbusiness opportunity to distributors and quality products to distributors and customers who seek a healthy lifestyle.We are one of the largest network marketing companies in the world with net sales of approximately $1.6 billion forthe year ended December 31, 2005. We sell our products in 60 countries through a network of over one millionindependent distributors. We believe the quality of our products and the effectiveness of our distribution network,coupled with geographic expansion, have been the primary reasons for our success throughout our 26-yearoperating history.
We offer products in three principal categories: weight management products, nutritional supplements whichwe refer to as “inner nutrition” and personal care products which we refer to as “Outer Nutrition»”. Our products areoften sold in programs, which are comprised of a series of related products designed to simplify weight managementand nutrition for our consumers and maximize our distributors’ cross-selling opportunities.
Industry-wide factors that affect us and our competitors include the increasing prevalence of obesity and theaging of the worldwide population, which are driving demand for nutrition and wellness-related products and therecruitment and retention of distributors.
The opportunities and challenges upon which we are most focused are driving retailing of our product,recruitment and retention of distributors and improving distributor productivity, entering new markets, includingChina, further penetrating existing markets, pursuing local distributor initiatives, introducing new products,developing niche market segments and further investing in our infrastructure.
A key non-financial measure we focus on is Volume Points on a Royalty Basis (hereafter, “Volume Points”),which is essentially our weighted unit measure of product sales volume. It is a useful measure for us, as it excludesthe impact of foreign currency fluctuations and ignores the differences generated by varying retail pricing acrossgeographic markets. In general, an increase in Volume Points in a particular region or country directionallyindicates an increase in local currency net sales.
Volume Points by Geographic Region
2003 % Change 2004 % Change 2005 % ChangeFor the Year Ended December 31,
(Volume points in millions)
The Americas . . . . . . . . . . . . . 688.1 1.3% 761.7 10.7% 1,071.2 40.6%
Europe . . . . . . . . . . . . . . . . . . 525.0 11.2 574.5 9.4 572.9 (0.3)
Asia/Pacific Rim . . . . . . . . . . . 229.4 (15.7) 269.2 17.3 305.3 13.4
Japan. . . . . . . . . . . . . . . . . . . . 102.5 (17.8) 72.8 (29.0) 70.6 (3.0)
Worldwide . . . . . . . . . . . . . . . . 1,545.0 (0.2)% 1,678.2 8.6% 2,020.0 20.4%
Another key non-financial measure on which we focus is the number of distributors qualified as supervisorsunder our compensation system. Distributors qualify for supervisor status based on their Volume Points.
44
%%TRANSMSG*** Transmitting Job: V16934 PCN: 045000000 ***%%PCMSG|44 |00012|Yes|No|03/16/2006 21:00|0|0|Page is valid, no graphics -- Color: D|

The growth in the number of supervisors is a general indicator of the level of distributor recruitment, whichgenerally drives net sales in a particular country or region. Our compensation system requires each supervisor to re-qualify for such status each year, prior to February. There is significant variation in the number of supervisors fromthe fourth quarter to the first quarter of any given year due to the timing of the re-qualification process. Thisfluctuation is normal and consistent, does not reflect a dramatic underlying change in the business in comparingthese two sequential quarters, and will become more meaningful period to period throughout the year.
The following tables show trends in the number of supervisors over the reporting period by region, andfluctuations within each notable country are discussed in the appropriate net sales section below where pertinent. InFebruary of each year, we delete from the rank of supervisor those supervisors who did not satisfy the supervisorqualification requirements during the preceding twelve months. Distributors who meet the supervisor requirementsat any time during the year are promoted to supervisor status at that time, including any supervisors who weredeleted, but who subsequently requalified.
Number of Supervisors by Geographic Region as of Reporting Period
2003 % Change 2004 % Change 2005 % ChangeAs of December 31,
The Americas . . . . . . . . . . . . 110,165 4.4% 124,605 13.1% 160,878 29.1%
Europe . . . . . . . . . . . . . . . . . 84,665 10.5 102,203 20.7 95,628 (6.4)
Asia/Pacific Rim . . . . . . . . . . 55,564 (14.7) 55,460 (0.2) 64,286 15.9
Japan . . . . . . . . . . . . . . . . . . 24,485 (23.3) 16,860 (31.1) 13,566 (19.5)
Worldwide . . . . . . . . . . . . . . 274,879 (1.5)% 299,128 8.8% 334,358 11.8%
Number of Supervisors by Geographic Region as of Requalification Period
2003 2004* 2005As of February,
The Americas . . . . . . . . . . . . . . . . . . . . . . . . . . . . . . . . . . . . . . . . 67,921 75,359 87,925
Europe . . . . . . . . . . . . . . . . . . . . . . . . . . . . . . . . . . . . . . . . . . . . . 51,290 70,239 65,104
Asia/Pacific Rim . . . . . . . . . . . . . . . . . . . . . . . . . . . . . . . . . . . . . . 35,637 31,790 38,524
Japan . . . . . . . . . . . . . . . . . . . . . . . . . . . . . . . . . . . . . . . . . . . . . . 18,287 13,946 9,547
Worldwide. . . . . . . . . . . . . . . . . . . . . . . . . . . . . . . . . . . . . . . . . . . 173,135 191,334 201,100
* In 2004 certain modifications were made to the requalification criteria resulting in approximately 19,000additional supervisors, including approximately 9,000 relating to a change in the business model in Russia.
Supervisors must requalify annually. The requalification period covers the twelve months starting in Februaryand ending the following January. The number of supervisors by geographic region as of the reporting dates willnormally be higher than the number of supervisors by geographic region as of the requalification period becausesupervisors who do not requalify during the relevant twelve-month period will be dropped from the rank ofsupervisor in February. Since supervisors purchase most of our products for resale to other distributors andconsumers, comparisons of supervisor totals on a year-to-year, same period basis are good indicators of ourrecruitment and retention efforts in different geographic regions.
The value of the average monthly purchase of Herbalife products by our supervisors has remained relativelyconstant over time. Consequently, increases in our sales are driven primarily by our retention of supervisors and byour recruitment and retention of distributors, rather than through increases in the productivity of our overallsupervisor base.
In 2004, we made a modification to the supervisor requalification criteria as a limited test. This modificationallowed distributors who otherwise would have failed to requalify as supervisors to continue to purchase productsfrom the Company and to receive the benefit of product discounts, while forfeiting their down-line royalties. We
45
%%TRANSMSG*** Transmitting Job: V16934 PCN: 046000000 ***%%PCMSG|45 |00011|Yes|No|03/16/2006 21:00|0|0|Page is valid, no graphics -- Color: D|

believe this test was successful because we retained approximately 10,000 distributors, and generated approxi-mately 12 million additional Volume Points on an annualized basis, which would represent approximately$9.4 million in net sales, $5.2 million in operating margin and an immaterial impact to Selling, General &Administrative Expenses. As a result of the test, the Company modified the supervisor requalification criteria for alldistributors in 2005.
We provide distributors with products, support material, training, special events and a competitive compen-sation program. If a distributor wants to pursue the Herbalife business opportunity, the distributor is responsible forgrowing his or her business and personally pays for the sales activities related to attracting new customers andrecruiting distributors by hosting events such as Herbalife Opportunity Meetings or Success Training Seminars; byadvertising Herbalife’s products; by purchasing and using promotional materials such as t-shirts, buttons and caps;by utilizing and paying for direct mail and print material such as brochures, flyers, catalogs, business cards, postersand banners and telephone book listings; by purchasing inventory for sale or use as samples; and by training,mentoring and following up (in person or via the phone or internet) with customers and recruits on how to useHerbalife products and/or pursue the Herbalife business opportunity.
Presentation
“Retail Sales” represent the gross sales amounts on our invoices to distributors before distributor allowances(as defined below), and “net sales”, which reflects distribution allowances and handling and freight income, is whatthe Company collects and recognizes as net sales in its financial statements. We discuss Retail Sales because of itsfundamental role in our compensation systems, internal controls and operations, including its role as the basis uponwhich distributor discounts, royalties and bonuses are awarded. In addition, information in daily and monthlyreports reviewed by our management relies on Retail Sales data. However, such a measure is not in accordance withGenerally Accepted Accounting Principles in the U.S. (“GAAP”). You should not consider Retail Sales in isolationfrom, nor as a substitute for, net sales and other consolidated income or cash flow statement data prepared inaccordance with GAAP, or as a measure of profitability or liquidity. A reconciliation of net sales to Retail Sales ispresented below under “Results of Operations.” “Product sales” represent the actual product purchase price paid tous by our distributors, after giving effect to distributor discounts referred to as “distributor allowances,” whichapproximate 50% of retail sales prices. Distributor allowances as a percentage of sales may vary by countrydepending upon regulatory restrictions that limit or otherwise restrict distributor allowances.
Our “gross profit” consists of net sales less “cost of sales,” which represents the prices we pay to our rawmaterial suppliers and manufacturers of our products as well as costs related to product shipments, duties and tariffs,freight expenses relating to shipment of products to distributors and importers and similar expenses.
“Royalty Overrides” are our most significant expense and consist of:
• royalty overrides, or commissions, and bonuses, which total approximately 15% and 7%, respectively, of theRetail Sales of weight management, inner nutrition, Outer Nutrition» and promotional products;
• the Mark Hughes Bonus payable to some of our most senior distributors in the aggregate amount of up to 1%of Retail Sales of weight management, inner nutrition, Outer Nutrition» and promotional products; and
• other discretionary incentive cash bonuses to qualifying distributors.
Royalty Overrides are generally earned based on Retail Sales, and approximate in the aggregate about 22% ofRetail Sales or approximately 35% of our net sales. Royalty Overrides together with distributor allowancesrepresent the potential earnings to distributors of up to approximately 73% of Retail Sales. The compensation todistributors is generally for the development, retention and improved productivity of their distributor salesorganizations and is paid to several levels of distributors on each sale. Because of local country regulatoryconstraints, we may be required to modify our typical distributor incentive plans as described above. Consequently,the total distributor discount percentage may vary over time. We also offer reduced distributor allowances and payreduced royalty overrides with respect to certain products worldwide. Non-U.S. royalty checks that have aged, for avariety of reasons, beyond a certainty of being paid, are taken back into income. Management has calculated thisperiod of certainty to be three years worldwide, whereas previously this period varied by country, ranging from12 months to 30 years. In order to achieve consistency among all countries, the Company adjusted the period over
46
%%TRANSMSG*** Transmitting Job: V16934 PCN: 047000000 ***%%PCMSG|46 |00011|Yes|No|03/16/2006 21:00|0|0|Page is valid, no graphics -- Color: D|

which such amounts would be taken into income to three years on a Company-wide basis, beginning with the thirdquarter of 2004.
Our “operating margins” consist of net sales less cost of sales and royalty overrides.
“Selling, General and Administrative Expenses” represent our operating expenses, components of whichinclude labor and benefits, sales events, professional fees, travel and entertainment, distributor marketing,occupancy costs, communication costs, bank fees, depreciation and amortization, foreign exchange gains andlosses and other miscellaneous operating expenses.
“113⁄4% Notes” refers to Herbalife International’s 113⁄4% senior subordinated notes due 2010. “91⁄2% Notes”refers to our 91⁄2% notes due 2011.
Most of our sales to distributors outside the United States are made in the respective local currencies. Inpreparing our financial statements, we translate revenues into U.S. dollars using average exchange rates. Addi-tionally, the majority of our purchases from our suppliers generally are made in U.S. dollars. Consequently, astrengthening of the U.S. dollar versus a foreign currency can have a negative impact on our reported sales andoperating margins and can generate transaction losses on intercompany transactions. Throughout the last five years,foreign currency exchange rates have fluctuated significantly. From time to time, we enter into foreign exchangeforward contracts and option contracts to mitigate our foreign currency exchange risk.
Summary Financial Results
For the year ended December 31, 2005, net sales increased by 19.6% as compared to 2004, driven by increasesin all regions except for a decrease in Japan. The combination of continued strong recruitment and retention ofdistributors and retailing of our products in our key markets, various promotions leading up to the 25th AnniversaryExtravaganza in Atlanta in April 2005 and the Worldwide Cup promotions during 2005, generally favorable foreigncurrency exchange rates, the launch of new products such as Liftoff TM and NourifusionTM coupled with the ongoingroll out of ShapeWorksTM and NiteWorksTM to more countries along with the globalization of distributor bestpractices such as Nutrition Clubs and the Total Plan contributed to the sales increase. The sales growth in the U.S.and South Korea was an encouraging result of our effort and commitment to turn around these countries, through theestablishment of new country management, re-invigoration of our product portfolio, and re-engagement of thedistributor leadership in these regions. Continued strong sales growth in Mexico was primarily attributable to thegrowth in Nutrition Clubs, a party planning concept.
For the year ended December 31, 2005, net income was $93.1 million, or $1.28 per diluted share, compared tothe prior-year net loss of $14.3 million or loss of $0.27 per diluted share. Net income as reported includes the effectof recapitalization transaction expenses of $14.2 million and $71.5 million (approximately $60.5 million net of tax)in 2005 and 2004, respectively, a non-cash tax charge of $5.5 million associated with moving our China subsidiarywithin the global corporate structure in the second quarter of 2005, and the favorable after-tax impact of $2.5 millionrelating to a change in the allowance for uncollectible royalty overrides receivables from distributors in the thirdquarter of 2005, partially offset by the $1.5 million favorable after-tax impact of aged royalties in the third quarter of2004. The improvement in net income was a result of a 19.6% increase in net sales, the continued favorable impactfrom appreciation of foreign currencies, lower interest and income tax expense, partially offset by expenditures weare undertaking in business initiatives resulting in higher operating expenses primarily from increased labor,benefits, incentive compensation and event and promotion expenses. Overall, the appreciation of foreign currencieshad a $10.8 million favorable impact on net income for the year ended December 31, 2005.
47
%%TRANSMSG*** Transmitting Job: V16934 PCN: 048000000 ***%%PCMSG|47 |00012|Yes|No|03/16/2006 21:00|0|0|Page is valid, no graphics -- Color: D|

Results of Operations
Our results of operations for the periods described below are not necessarily indicative of results of operationsfor future periods, which depend upon numerous factors, including our ability to recruit new distributors and retainexisting distributors, open new markets and further penetrate existing markets, and introduce new products andprograms that will help our distributors increase their retail efforts, and develop niche market segments.
The following table sets forth selected results of our operations expressed as a percentage of net sales for theperiods indicated.
Year EndedDecember 31,
2003
Year EndedDecember 31,
2004
Year EndedDecember 31,
2005
Company
Operations:Net sales . . . . . . . . . . . . . . . . . . . . . . . . . . . . . . . . . . . . 100.0% 100.0% 100.0%
Cost of sales . . . . . . . . . . . . . . . . . . . . . . . . . . . . . . . . . 20.3 20.6 20.1
Gross profit . . . . . . . . . . . . . . . . . . . . . . . . . . . . . . . . . . 79.7 79.4 79.9
Royalty overrides . . . . . . . . . . . . . . . . . . . . . . . . . . . . . 35.8 35.5 35.5
Selling, General & Administrative expenses . . . . . . . . . . 34.7 33.3 30.4
Operating income . . . . . . . . . . . . . . . . . . . . . . . . . . . . . 9.2 10.6 14.0
Interest income (expense), net . . . . . . . . . . . . . . . . . . . . (3.5) (9.4) (2.8)
Income before income taxes. . . . . . . . . . . . . . . . . . . . . . 5.7 1.2 11.2
Income taxes . . . . . . . . . . . . . . . . . . . . . . . . . . . . . . . . . 2.5 2.3 5.3
Net income (loss) . . . . . . . . . . . . . . . . . . . . . . . . . . . . . 3.2 (1.1) 5.9
Year ended December 31, 2005 compared to year ended December 31, 2004
Net Sales
The following chart reconciles Retail Sales to net sales:
Sales by Geographic Region
RetailSales
DistributorAllowance
ProductSales
Handling &FreightIncome
NetSales
RetailSales
DistributorAllowance
ProductSales
Handling &FreightIncome
NetSales
Change inNet Sales
2004 2005
Year Ended December 31,
(Dollars in millions)
The Americas . . . . . $ 762.6 $ (364.4) $ 398.2 $ 70.0 $ 468.2 $1,123.2 $ (539.6) $ 583.6 $ 98.1 $ 681.7 45.6%
Europe . . . . . . . . . 875.5 (418.0) 457.5 78.7 536.2 890.4 (424.1) 466.3 79.0 545.3 1.7%
Asia/Pacific Rim . . . 338.7 (156.3) 182.4 24.1 206.5 399.7 (182.7) 217.0 28.1 245.1 18.7%
Japan . . . . . . . . . . 169.4 (82.5) 86.9 11.9 98.8 162.4 (79.0) 83.4 11.3 94.7 (4.1)%
Total . . . . . . . . . . $2,146.2 $(1,021.2) $1,125.0 $184.7 $1,309.7 $2,575.7 $(1,225.4) $1,350.3 $216.5 $1,566.8 19.6%
Changes in net sales are directly associated with the recruiting and retention of our distributor force, retailingof our products, the quality and completeness of the product offerings that the distributor force has to sell and thenumber of countries in which we operate. Management’s role, both in-country and at the corporate level is toprovide distributors with a competitive and broad product line, encourage strong teamwork and leadership amongthe Chairman’s Club and President’s Team distributors and offer leading edge business tools to make doing businesswith Herbalife simple. Management uses the distributor marketing program coupled with educational andmotivational tools to incent distributors to drive recruiting, retention and retailing, which in turn affect net sales.Such tools include corporate sales events — Extravaganzas and World Team Schools — where large groups ofdistributors gather, thus allowing them to network with other distributors, learn recruiting, retention and retailing
48
%%TRANSMSG*** Transmitting Job: V16934 PCN: 049000000 ***%%PCMSG|48 |00012|Yes|No|03/16/2006 21:00|0|0|Page is valid, no graphics -- Color: D|

techniques from our leading distributors, and become more familiar with how to market and sell our products andbusiness opportunities. Accordingly, management believes that these development and motivation programs canincrease the productivity of the supervisor network. The expenses for such programs are included in SellingGeneral & Administrative Expenses. Sales are driven by several factors, including the number and productivity ofdistributors and supervisors who continually build, educate and motivate their respective distribution and salesorganizations. We also use event and non-event product promotions to motivate distributors to increase recruiting,retention and retailing activities. These promotions have prizes ranging from qualifying for events to vacations. Thecosts of these promotions are included in Selling, General & Administrative Expenses.
The factors described above have driven growth in our business. The following net sales by geographic regiondiscussion further details some of the above factors and describes unique growth factors specific to certain majorcountries. The Company believes that the correct business foundation, coupled with ongoing training andpromotional initiatives is required to increase recruiting and retention of distributors and retailing of the Company’sproducts. The correct business foundation includes strong country management that works closely with thedistributor leadership, unified distributor leadership, a broad product line that appeals to local consumer needs, afavorable regulatory environment, a scalable and stable technology platform and an attractive distributor marketingplan. Initiatives such as Success Training Seminars, World Team Schools, Promotional Events and regionalExtravaganzas are integral components of developing a highly motivated and educated distributor sales organi-zation that will work toward increasing the recruitment and retention of distributors.
The Company’s strategy will continue to include creating and maintaining growth within existing markets. Weexpect to increase our spending in Selling, General & Administrative Expenses to maintain or stimulate salesgrowth, while making strategic investments in new initiatives. In addition, new ideas are being generated in ourregional markets, either by distributors, country management or corporate management. Examples are the NutritionClubs in Mexico, the Total Plan in Brazil and GenerationH (“GenH”) in the U.S., as described in the net salesdiscussion below. Management’s strategy is to review the applicability of expanding successful country initiativesthroughout a region and/or globally and where appropriate, and financially support the globalization of theseinitiatives.
The Americas
Net sales in The Americas increased $213.5 million, or 45.6%, for the year ended December 31, 2005, ascompared to 2004. In local currency, net sales increased by 39.2% for the year ended December 31, 2005, ascompared to 2004. The fluctuation of foreign currency rates had a positive impact of $30.0 million on net sales forthe year ended December 31, 2005. The overall increase was a result of net sales growth in Mexico, Brazil andU.S. of $116.5 million, $43.2 million and $31.8 million, or 113.8%, 63.1%, and 12.6%, respectively, for the yearended December 31, 2005. These countries continue to benefit from strong country and distributor leadership thatfocuses on recruiting and retention of the distributor force that retails our product, and a product line and businessopportunity that is attractive to the demographics in those countries.
The continued net sales growth in Mexico is evidenced by the increased number of supervisors, up 77.3% atDecember 31, 2005 compared to December 31, 2004, which reflects the renewed emphasis on distributor andcustomer retention programs such as the Nutrition Clubs, which are new and innovative means by which distributorsare retailing our products to new customers, some of whom may eventually become distributors of our products.The costs to set up a Nutrition Club are generally nominal, and are borne solely by the distributor. Our distributorsare operating over 27,000 Nutrition Clubs world-wide, approximately 25,000 are open in Mexico.
The continued net sales growth in Brazil is evidenced by the increased number of supervisors, up 33.3% atDecember 31, 2005 compared to December 31, 2004, and is a result of the expansion of the Total Plan, strongdistributor leadership, a highly effective country management team and a good product portfolio. The Total Plan is alow cost lead generating method where distributors use our personal care line of products and offer consultations toobtain referrals. This concept specifically supports our retailing and recruiting initiatives and has been a catalyst forgrowth in Brazil. In December 2005, Brazil held its 10th Anniversary Event, with over 10,000 distributors inattendance. At this event, new products (Firm Cell, Radiant C Scrub, Cleanser and Body Lotion) were launched thatfurther support the Total Plan, reinforcing our objective to increase the recruitment, retailing and retention by
49
%%TRANSMSG*** Transmitting Job: V16934 PCN: 050000000 ***%%PCMSG|49 |00018|Yes|No|03/16/2006 21:00|0|0|Page is valid, no graphics -- Color: D|

distributors, and a demonstration of our online distributor tool, BizWorks, was provided to highlight the benefits ofreal time organizational volume reports as a means to improve efficiency for distributors. The positive momentumfrom the event should help continue the sales growth trend into 2006.
Net sales growth in the U.S. is evidenced by the increased number of supervisors, up 4.7% at December 31,2005 compared to December 31, 2004, with a volume point increase of 14.5% compared to prior year. As a result ofthe numerous steps taken in 2004 and 2005 to improve the business in the U.S., including the establishment of adedicated U.S. country management team; branding efforts such as sponsorship of the JP Morgan Chase tennistournament, the AVP Volleyball Tour and the Nautica Malibu Triathlon; and various promotions such as the 2005President’s Team Challenge, the World Team Bonus, the Atlanta Challenge in connection with the 25th AnniversaryExtravaganza and the Worldwide Cup promotion, net sales have exceeded the annual results for 2004. At the25th Anniversary Extravaganza two new products were introduced, LiftoffTM and NouriFusionTM. LiftoffTM representsthe Company’s entry into the energy drink market and is intended to support our GenH program to attract a youngerdemographic segment into the distributor organization. NouriFusionTM supports the Total Plan method of operationand was a strategic launch to improve diversity in the product portfolio, since skin care (Outer Nutrition) is thecategory least developed as of 2005. In October of 2005 we introduced a comprehensive Heart Health line whichincorporates NiteworksTM, CoreComplexTM, TriShieldTM, MegaGarlicTM and HerbalifelineTM, and is endorsed byDr. Louis Ignarro. At our World Team School/Leadership Development Weekend held in October 2005, welaunched our 2006 worldwide promotion, Active World Team, which we believe will, when coupled with ourproduct launches and branding initiatives have a positive impact on sales growth in 2006.
We believe that 2006 sales in the Americas region should continue its positive year over year growth primarilyas a result of the expected continuation of the strong momentum in Mexico, Brazil, and the U.S.
Europe
Net sales in Europe increased $9.1 million, or 1.7%, for the year ended December 31, 2005, as compared to2004. In local currency, net sales increased 1.0% for the year ended December 31, 2005, as compared to 2004. Thefluctuation of foreign currency rates had a positive impact on net sales of $3.5 million for the year endedDecember 31, 2005. Throughout 2004, Europe experienced sales growth when compared to 2003, partly due to theBillion Dollar Challenge promotion in the first and second quarters of 2004. Such sales growth was not expected tobe sustainable in 2005. While some markets did sustain growth such as Spain, France and South Africa, two keymarkets, Germany and the Netherlands, experienced sales declines of 20.8% and 16.2%, respectively, for the yearended December 31, 2005.
We have recently appointed a new country manager in Germany and the new management team is developing aturnaround plan for 2006 to re-engage the local distributor leadership and to rebuild confidence among distributorsto improve recruiting and retention. The German leadership has begun to work together to improve our brand image,to implement the GenH initiative, and have formed an executive committee to focus on other initiatives. In theNetherlands we have taken steps to re-engage the local distributor leadership and promote the GenH initiativewithin the country.
Net sales in Spain were up $7.6 million, or 23.1%, for the year ended December 31, 2005, as compared to 2004.The increase in net sales is primarily due to unified distributor leadership, an increasing emphasis locally on healthand nutrition and the continuing positive impact of certain promotions in 2005. In France, one of our largestEuropean markets, net sales were up $6.6 million, or 25.8%, for the year ended December 31, 2005, as compared to2004, partly due to adoption of a new nutritional distributor training program and a special vacation promotion. Netsales in South Africa were up $7.1 million or 51.7%, as compared to 2004, primarily due to a unified distributorleadership and successful promotional activity. Additionally, in South Africa, we celebrated our 10th anniversary ofdoing business in the country with a major sales event during the third quarter.
We concluded the year with a World Team School in Budapest, Hungary, where over 8,000 Europeandistributors attended product, leadership, and business opportunity training sessions. During the event there wasspecific training on Nutrition Clubs, and the 2006 Active World Team promotion was introduced.
50
%%TRANSMSG*** Transmitting Job: V16934 PCN: 051000000 ***%%PCMSG|50 |00017|Yes|No|03/16/2006 21:00|0|0|Page is valid, no graphics -- Color: D|

We believe that 2006 net sales in Europe should continue the positive year over year volume growth partly dueto our global and local branding initiatives, such as sponsoring the London Triathlon, which are intended tocontinually improve our corporate and brand reputation in the market and our introduction of new products into theregion, such as LiftoffTM. In addition, with the recent changes to our management teams, both regionally and locally,we expect to formulate and implement a successful strategy to turn around several declining markets in Europe andcontinue positive growth trends in others.
Asia/Pacific Rim
Net sales in Asia/Pacific Rim increased $38.6 million, or 18.7%, for the year ended December 31, 2005, ascompared to 2004. In local currency, net sales increased 14.2% for the year ended December 31, 2005, as comparedto 2004. The fluctuation of foreign currency rates had a $9.3 million positive impact on net sales for the year endedDecember 31, 2005. The overall increase was attributable mainly to increases in Taiwan and South Korea.
Net sales in Taiwan increased $18.4 million, or 25.6%, for the year ended December 31, 2005, over 2004, dueprimarily to an increase in the number of supervisors by 24.7% at December 31, 2005, as compared to the same timelast year, highly engaged distributor leadership, increased local distributor trainings and initiatives to promoteindividual recognition of well performing distributors, new product launches, positive momentum from the WorldTeam School held in Singapore in October 2005, the 25th Anniversary Atlanta Extravaganza, and the WorldwideCup Promotion. The Singapore World Team School was attended by approximately 5,000 distributors who receivedproduct, leadership, and business opportunity training. Net sales in South Korea increased $12.2 million, or 34.0%,for the year ended December 31, 2005, as compared to 2004. This improvement in 2005 was a result of positivemomentum from the sales events and promotions discussed above and unified focus by Korea’s country anddistributor leadership. Also, in late 2004 we introduced ShapeWorksTM in South Korea, which had a positive impacton recruiting and retailing initiatives in 2005.
Overall, we believe that continued local distributor training, positive momentum from the Singapore WorldTeam School, the launch of new products (NourifusionTM was launched in South Korea and Taiwan in late 2005), theopening of Malaysia in February 2006 and introduction of new business tools, should contribute to ongoing salesincreases and support the continued globalization of Nutrition Clubs and the Total Plan in the Asia/Pacific Rimregion in 2006.
Japan
Net sales in Japan decreased $4.1 million, or 4.1%, for the year ended December 31, 2005, as compared to2004. In local currency, net sales in Japan decreased 2.3% for the year ended December 31, 2005, as compared to2004. The fluctuation of foreign currency rates had a negative $1.8 million impact on net sales for the year endedDecember 31, 2005. The net sales decline in 2005, which is a continuation of a six-year downward trend in Japan,albeit at a slower rate for this reporting period, had been driven primarily by ineffective prior country management,which had not properly motivated distributor leadership, and the lack of new product introductions. In the thirdquarter of 2004, we appointed a new country manager who has focused on uniting and motivating distributorleadership to improve recruiting and retention of distributors, and we are in the process of expanding our productline to address local country demographic needs. In the second quarter of 2005, we launched NourifusionTM andsupported this launch with a formal Total Plan training for our distributors. NourifusionTM International BusinessPack’s were also created to synchronize the method of operation with the introduction kit. During 2005, we openeda new sales office in a central upscale location in Tokyo, a significant improvement over the existing location thatwe believe should give us greater visibility in a key population center. The first floor of the sales office has anutrition center where distributors can bring their customers or potential distributors to sample our products,conduct meetings, and hold trainings. In December 2005, we held the Japan Spectacular in Kobe, Japan, making itthe biggest event in Japan in 5 years, with approximately 6,000 distributors attending. Positive momentum was alsogenerated from the Worldwide Cup Promotion in 2005. In the third quarter of 2005, NiteworksTM was introduced inJapan, and a special vacation promotion was launched. We believe the above initiatives in combination with theimplementation of new brand and volume incentive promotional programs, should continue to improve sales trendsin 2006.
51
%%TRANSMSG*** Transmitting Job: V16934 PCN: 052000000 ***%%PCMSG|51 |00017|Yes|No|03/16/2006 21:00|0|0|Page is valid, no graphics -- Color: D|

Sales by Product Category
RetailSales
DistributorAllowance
ProductSales
Handling &FreightIncome
NetSales
RetailSales
DistributorAllowance
ProductSales
Handling &FreightIncome
NetSales
% Change inNet Sales
2004 2005
Year Ended December 31,
(Dollars in millions)
Weight Management . . . $ 945.1 $ (465.3) $ 479.8 $ 81.3 $ 561.1 $1,149.4 $ (565.3) $ 584.1 $ 96.6 $ 680.7 21.3%
Inner Nutrition . . . . . . 946.5 (466.0) 480.5 81.5 562.0 1,092.1 (537.1) 555.0 91.8 646.8 15.1%
Outer Nutrition» . . . . . 207.3 (102.1) 105.2 17.9 123.1 275.9 (135.7) 140.2 23.2 163.4 32.7%
Literature, Promotionaland Other . . . . . . . . 47.3 12.2 59.5 4.0 63.5 58.3 12.7 71.0 4.9 75.9 19.5%
Total . . . . . . . . . . . . $2,146.2 $(1,021.2) $1,125.0 $184.7 $1,309.7 $2,575.7 $(1,225.4) $1,350.3 $216.5 $1,566.8 19.6%
Our increased emphasis on the science of weight management and nutrition during the past two years hasresulted in product introductions such as NiteworksTM and Garden 7 TM and the introduction of ShapeWorksTM, apersonalized meal replacement program. Due to the launch of ShapeWorksTM in March 2004 in the United States andthe on-going roll-out to other countries, the introduction of new Outer Nutrition» products like NouriFusionTM, andthe increased use of the Total Plan by distributors in Brazil and worldwide, which uses Outer Nutrition products asits foundation, net sales of weight management products and Outer Nutrition» products increased at a higher ratethan net sales of inner nutrition products. Sales of Outer Nutrition products increased 32.7% for the year endedDecember 31, 2005, which is a greater rate of growth than that for any other category. Literature, Promotional andOther, which is net of product buy-backs and returns in all product categories, increased, due primarily to anincrease in literature sales from selling starter kits to new distributors and from a decrease in returns and refunds. Weexpect growth rates within these categories will vary from time to time as we launch new products.
Gross Profit
Gross profit was $1,251.0 million for the year ended December 31, 2005, as compared to $1,039.8 million in2004. As a percentage of net sales, gross profit for the year ended December 31, 2005 increased from 79.4% to79.8%, as compared to 2004. Generally, gross profit percentages do not vary significantly as a percentage of salesother than due to product or country mix, ongoing cost reduction initiatives and provisions for slow moving andobsolete inventory. Additionally, we believe that we have the ability to mitigate ingredient and manufacturing costincreases from our suppliers by raising the prices of our products or shifting product sourcing to alternativemanufacturers.
Royalty Overrides
Royalty Overrides as a percentage of net sales was 35.5% for the years ended December 31, 2004 and 2005The favorable pre-tax impact of $4.0 million relating to a change in the allowance for uncollectible royalty overridesreceivables from distributors in the third quarter of 2005 was partially offset by a favorable pre-tax impact of$2.4 million of aged royalty checks in the third quarter of 2004. Generally, royalty overrides as a percentage of netsales varies slightly from period to period due to changes in the mix of products and countries because varyingRoyalty Overrides are paid on certain products and in certain countries. Due to the structure of our globalcompensation plan coupled with the current country mix of our business, we do not expect to see significantfluctuations in Royalty Overrides as a percent of net sales.
Selling, General, & Administrative Expenses
Selling, General, and Administrative Expenses as a percentage of net sales improved to 30.4% for the yearended December 31, 2005, as compared to 33.3% in 2004. The unfavorable impact of foreign currency fluctuationswas $8.2 million for the year ended December 31, 2005.
For the year ended December 31, 2005, Selling, General & Administrative Expenses increased $40.2 million to$476.3 million from $436.1 million in 2004. The increase included $23.1 million in higher salaries and benefits, dueprimarily to normal merit increases, increased staffing, and higher incentive compensation; $5.7 million relating to
52
%%TRANSMSG*** Transmitting Job: V16934 PCN: 053000000 ***%%PCMSG|52 |00015|Yes|No|03/16/2006 21:00|0|0|Page is valid, no graphics -- Color: D|

legal and litigation expenses and additional professional fees primarily associated with strengthening our tech-nology infrastructure; $16.0, million in additional advertising and promotion expenses related primarily related toour 2005 Worldwide Cup promotion which have helped drive worldwide sales growth; $5.4 million in higher traveland entertainment expenses and $5.6 million in higher occupancy cost to support the growth of our business. Theincreases were partially offset by $9.2 million lower monitoring fees and other expenses due to the termination ofthe related agreements with Whitney and Golden Gate; $9.8 million lower amortization expenses; and a $0.7 millionforeign exchange gain in 2005 versus a $1.9 million loss in 2004.
We expect 2006 Selling, General & Administrative Expenses to increase in absolute dollars over 2005 levelsreflecting general salary merit increases; further investments in China; and various sales growth initiativesincluding sales events, globalization of best practices such as Nutrition Clubs and Total Plan, and the developmentof the direct-to-consumer initiative. As a percentage of net sales, these expenses should remain consistent with 2005levels.
Net Interest Expense
Net interest expense was $43.9 million for the year ended December 31, 2005, as compared to $123.3 millionin 2004. The higher interest expense in 2004 was primarily due to the two recapitalizations in 2004, as noted in thetable below, and $8.2 million additional interest expense associated with the $275.0 million principal amount of our9 1⁄2% Notes issued in March 2004:
Interest ExpenseYear Ended
December 31, 2005Year Ended
December 31, 2004(Dollars in millions)
113⁄4% Notes-Redemption Premium and write-off of deferredfinancing fees . . . . . . . . . . . . . . . . . . . . . . . . . . . . . . . . . . . $ — $ 49.9
151⁄2% Senior Notes-Redemption Premium and write-off ofdeferred financing fees . . . . . . . . . . . . . . . . . . . . . . . . . . . . — 15.4
91⁄2% Senior Notes Clawback Premium and Write-off ofdeferred financing fees . . . . . . . . . . . . . . . . . . . . . . . . . . . . 14.2 —
Term Loan-Write-off of deferred financing fees . . . . . . . . . . . . 2.2 4.5
Revolver-Write-off of deferred finance fees . . . . . . . . . . . . . . . — 1.7
Recapitalization expenses included in Interest Expense . . . . . . 16.4 $ 71.5
Interest Expense . . . . . . . . . . . . . . . . . . . . . . . . . . . . . . . . . . . 27.5 51.8
Total Interest Expense. . . . . . . . . . . . . . . . . . . . . . . . . . . . . . . $43.9 $123.3
As part of the continuation of the fourth quarter 2004 recapitalization, we exercised a contract provision toredeem 40%, or $110 million, of the 91⁄2% Notes. After the required notice period, this redemption was completedon February 4, 2005. The premium and the write-off of deferred financing fees of $14.2 million associated with thisredemption was included in interest expense in the first quarter of 2005.
Income Taxes
Income taxes were $82.0 million for the year ended December 31, 2005, as compared to $29.7 million in 2004.As a percentage of pre-tax income, the estimated effective income tax rate was 46.8% for the year endedDecember 31, 2005, as compared to 192.8% in 2004. The decrease in the effective tax rate for the year endedDecember 31, 2005 as compared to 2004 was caused primarily by the impact of less non-deductible interestincluding the aforementioned non-deductible recapitalization charges in each period. Offsetting these benefits was$5.5 million non-cash tax charge associated with moving our China subsidiary within our global corporate structurein the second quarter of 2005. Additionally, the stronger than expected revenue growth during the past severalquarters and management’s outlook that a mid-teens revenue growth rate will continue throughout 2006 caused adecrease in the valuation allowances required against certain deferred tax assets and an increase in current taxes incertain areas as our worldwide transfer pricing and overall tax structures were impacted.
53
%%TRANSMSG*** Transmitting Job: V16934 PCN: 054000000 ***%%PCMSG|53 |00017|Yes|No|03/16/2006 21:00|0|0|Page is valid, no graphics -- Color: D|

Foreign Currency Fluctuations
Currency fluctuations had a favorable impact of $10.8 million on net results for the year ended December 31,2005, when compared to what current year net results would have been using last year’s foreign exchange rates. Forthe year ended December 31, 2005, the regional effects were a favorable $0.7 million in Europe, a favorable$2.4 million in Asia/Pacific Rim, a favorable $7.0 million in The Americas, and a favorable $0.7 million in Japan.
Net Results
For the year ended December 31, 2005, net income was $93.1 million, or $1.28 per diluted share, compared tothe prior-year net loss of $14.3 million or loss of $0.27 per diluted share. Net income as reported includes the effectof recapitalization transaction expenses of $14.2 million and $71.5 million (approximately $60.5 million net of tax)in 2005 and 2004, respectively, a non-cash tax charge of $5.5 million associated with moving our China subsidiarywithin the global corporate structure in the second quarter of 2005, and the favorable after-tax impact of $2.5 millionrelating to a change in the allowance for uncollectible royalty overrides receivables from distributors in the thirdquarter of 2005, partially offset by the $1.5 million favorable after-tax impact of aged royalties in the third quarter of2004. The improvement in net income was a result of a 19.6% increase in net sales, the continued favorable impactfrom appreciation of foreign currencies, lower interest and income tax expense partially offset by expenditures weare undertaking in business initiatives resulting in higher operating expenses primarily from increased labor,benefits, incentive compensation and promotion expense. Overall, the appreciation of foreign currencies had a$10.8 million favorable impact on net income for the year ended December 31, 2005.
Year ended December 31, 2004 compared to year ended December 31, 2003
Net Sales
The following chart reconciles Retail Sales to net sales:
Sales by Geographic Regions
RetailSales
DistributorAllowance
ProductSales
Handling &FreightIncome
NetSales
RetailSales
DistributorAllowance
ProductSales
Handling &FreightIncome
NetSales
Changein NetSales
2003 2004
Year Ended December 31,
(Dollars in millions)
The Americas . . . . . . $ 687.9 $(328.9) $359.0 $ 65.4 $ 424.4 $ 762.6 $ (364.4) $ 398.2 $ 70.0 $ 468.2 10.3%
Europe . . . . . . . . . . 733.4 (349.4) 384.0 64.2 448.2 875.5 (418.0) 457.5 78.7 536.2 19.6%
Asia/Pacific Rim. . . . . 271.6 (123.6) 148.0 19.5 167.5 338.7 (156.3) 182.4 24.1 206.5 23.3%
Japan . . . . . . . . . . . 201.5 (97.4) 104.1 15.2 119.3 169.4 (82.5) 86.9 11.9 98.8 (17.2)%
Total . . . . . . . . . . . . $1,894.4 $(899.3) $995.1 $164.3 $1,159.4 $2,146.2 $(1,021.2) $1,125.0 $184.7 $1,309.7 13.0%
Changes in net sales are directly associated with the recruiting, retention and retailing of our distributor force,the quality and completeness of the product offerings that the distributor force has to sell and the number ofcountries in which we operate. Management’s role, both in-country and at the corporate level is to providedistributors with a competitive and broad product line, ensure strong teamwork and leadership among theChairman’s Club and President’s Team distributors and offer leading edge business tools to make doing businesswith Herbalife simple. Management uses the marketing program coupled with educational and motivational tools toincent distributors to drive recruiting, retention and retailing which in turn affect net sales. Such tools includecorporate sales events — Extravaganzas and World Team Schools — where large groups of distributors gather, thusallowing them to network with other distributors, learn recruiting, retention and retailing techniques from ourleading distributors, and become more familiar with how to market and sell our products and business opportunities.Accordingly, management believes that these development and motivation programs can increase the productivityof the supervisor network. The expenses for such programs are included in selling, general & administrativeexpenses. An example is the Barcelona Extravaganza held in August of 2004 and mentioned below. Sales are drivenby several factors including the number and productivity of distributor leaders who continually build, educate andmotivate their respective distribution and sales organizations. We also use product event and non-event promotions
54
%%TRANSMSG*** Transmitting Job: V16934 PCN: 055000000 ***%%PCMSG|54 |00015|Yes|No|03/16/2006 21:00|0|0|Page is valid, no graphics -- Color: D|

to motivate distributors to increase recruiting, retention and retailing activities. These promotions have ranged fromour 2003 laptop computer promotion to vacations or other qualifying events for distributors that meet certain sellingand recruiting goals. The costs of these promotions are included in selling, general & administration expenses. Acurrent example is the “Atlanta Challenge” discussed below. Similar to sales events, it is not possible for us to draw aprecise quantitative correlation between a successful promotion and a resultant long-term effect on net sales.
The factors described above have driven growth in our business. The following net sales by geographic regiondiscussion further details some of the above factors and describes unique growth factors specific to certain majorcountries. The Company believes that the correct foundation, coupled with ongoing training and promotionalinitiatives is required to increase recruiting and retention of distributors and retailing of the product. The correctfoundation includes strong country management that works closely with the distributor leadership, a broad productline that appeals to local consumer needs, a favorable regulatory environment, a scalable and stable technologyplatform and an attractive marketing plan. Initiatives such as Success Training Seminars, World Team Schools,Promotional Events and regional Extravaganzas are integral components of developing a highly motivated andeducated distributor sales organization that will work toward increasing the recruitment and retention ofdistributors.
The Company’s strategy has included and will continue to include generating and maintaining growth withinexisting markets. We generally expect to continue to spend the current level of selling, general & administrativeexpenses (as a percent of net sales) to maintain or stimulate sales growth, while making strategic investments in newinitiatives as discussed in the business strategy section. In addition, new ideas are being generated in our regionalmarkets, either by distributors, country management or corporate management. Examples are the Nutrition Clubs inMexico and the Total Plan in Brazil, as described in the net sales discussion below. Management’s strategy is toreview the applicability of expanding successful country initiatives throughout a region and/or globally whereappropriate.
The Americas
Net sales in The Americas increased $43.8 million, or 10.3%, for the year ended December 31, 2004, ascompared to 2003. In local currency, net sales increased by 10.7% for the year ended December 31, 2004, ascompared to 2003. The fluctuation of foreign currency rates had a negative impact of $1.6 million on net sales forthe year ended December 31, 2004. The overall increase was a result of net sales growth in Brazil and Mexico of$29.2 million and $28.8 million, or 74.4% and 39.1%, respectively, for the year ended December 31, 2004. Thesecountries continue to benefit from strong country and distributor leadership that focuses on recruiting and retentionof the distributor force that retails our product, and a product line and business opportunity that is attractive to thedemographics in those countries. The net sales growth in Brazil and Mexico was partially offset by a net salesdecrease in the U.S. of $22.0 million, or 8.0%.
The continued net sales growth in Brazil is evidenced by the increased number of supervisors, up 54.6% atDecember 31, 2004 compared to 2003, the expansion of the Total Plan, strong distributor leadership, a highlyeffective country management team and a good product portfolio. The Total Plan is a low cost lead generatingmethod where distributors use our personal care line of products and offer consultations to obtain referrals. Thisconcept specifically supports our retailing and recruiting initiatives and has been a catalyst for growth in Brazil.
The continued net sales growth in Mexico is evidenced by the increased number of supervisors, up 33.0% atDecember 31, 2004 compared to December 31, 2003, which reflects the renewed emphasis on distributor andcustomer retention programs such as the Nutrition Clubs, which are new and innovative means by which distributorsare retailing our products to new customers, some of whom may eventually become distributors of our products.The costs to set up a Nutrition Club are generally nominal, and are borne solely by the distributor. Our distributorshave opened over 2000 Nutrition Clubs to date.
Growth in Brazil and Mexico was partly offset by a decline in net sales in the U.S., of $22.0 million, or 8.0%,for the year ended December 31, 2004, as compared to December 31, 2003. This was evidenced by a 6.1% decreasein the number of supervisors at December 31, 2004 as compared to 2003, with a similar volume point decrease whencompared to the prior year. This is a continuation of a downward trend in the U.S., although the decrease in 2004 islower than the decrease experienced in 2003. Contributing factors to this continued decline include distraction
55
%%TRANSMSG*** Transmitting Job: V16934 PCN: 056000000 ***%%PCMSG|55 |00014|Yes|No|03/16/2006 21:00|0|0|Page is valid, no graphics -- Color: D|

among senior distributor leadership related to the transition of our new senior management team, strong com-petition from other direct selling companies and marketing difficulties experienced during the transition to the newShapeWorksTM product line launched in March 2004. The transition to the new ShapeWorksTM product line in theU.S. cost approximately $4.2 million, which was primarily recorded in selling, general & administrative expenses.Of this, approximately $0.6 million was related to several previous versions of the package design, labels andrelated promotional materials, a cost that is not expected to be incurred in future transitions of this product in otherregions. We believe the U.S. continues to be a viable market and therefore we have taken numerous steps to turn thebusiness around. For example, we have organized regional “mini-extravaganza” sales events, the opening of aregional sales center in Dallas, created a U.S. country management team, where previously the U.S. was managedfrom The Americas Region, and introduced retailing and recruiting programs used successfully in Brazil andMexico such as the Total Plan and Nutrition Clubs. The multiple regional mini-extravaganzas cost approximately$1.9 million in 2004, which was recorded in selling, general & administrative expenses. We expect a similar level ofspending in 2005 to help stimulate growth in the U.S. market. Regional sales centers are small, walk up distributioncenters that we are opening in key areas of the U.S. where we feel we are underdeveloped. The walk up centers allowdistributors to interact with us on a more personal basis and we believe they will assist distributors with theirrecruiting and retention efforts. To set up the regional sales center in Dallas, we incurred $0.4 million in capitalexpenditures and we will spend approximately $0.6 million in annual operating expenses. To the extent thatmanagement chooses to continue to expand this model throughout the U.S. based upon a thorough financial review,we would expect a similar level of expenditure for each regional sales center that the Company may potentiallyopen. Management’s evaluation in this area has not yet been completed. Management and senior distributorleadership will continue to target promotions, events and products to specific key U.S. metro areas. We believe thisshould increase the efficiency of our spending, while increasing market penetration.
Europe
Net sales in Europe increased $87.9 million, or 19.6%, for the year ended December 31, 2004, as compared to2003. In local currency net sales increased 8.6% for the year ended December 31, 2004, as compared to 2003. Thefluctuation of foreign currency rates had a positive impact on net sales of $49.4 million for the year endedDecember 31, 2004. Most European markets recorded net sales growth partly as a result of an eight-monthpromotion ending in June 2004 that helped our distributors increase recruiting and retention and was furthersupported by the motivation and training at the Barcelona Extravaganza in July 2004. We spent $3.9 million,recorded in Selling, General & Administrative Expenses, on this eight month incremental sales promotion, calledthe “Billion Dollar Challenge.” The Barcelona Extravaganza had a net cost of $1.8 million and was recorded in theselling, general & administrative expenses. The November 2004 launch of ShapeWorksTM in Europe at the BolognaWorld Team School has been well received by distributors, reflecting a smoother launch than in the U.S. earlier thisyear.
Net sales in Spain were up $13.8 million, or 72.5%, for the year ended December 31, 2004, as compared to2003, due to a cohesive, renewed focus by distributor leadership, an increasing emphasis locally on health andnutrition and the success of the Billion Dollar Challenge and the Barcelona Extravaganza. Net sales in Turkey wereup $11.4 million, or 85.7%, for the year ended December 31, 2004, as compared to 2003, due to increasingacceptance of the direct selling concept in Turkey as well as an energetic distributor leadership group. In Italy, oneof our largest European markets, net sales were up $7.1 million, or 11.2%, for the year ended December 31, 2004, ascompared to 2003, driven by strong country management and distributor leadership collaboration on recruiting andretention programs. In the Netherlands, another of our larger European markets, net sales were up $8.3 million, or17.8%, for the year ended December 31, 2004, as compared to 2003, partly due to the Corporate/Distributorco-sponsored TV program, “Fitness Challenge,” which increased the visibility of the Herbalife name. TheCompany’s cost related to the Fitness Challenge was less than $0.1 million, and was recorded in Selling, General &Administrative Expenses. We are currently reviewing whether to repeat this sponsorship in 2005. In addition, weinitiated a new worldwide promotion, The Atlanta Challenge, at the Barcelona Extravaganza in July, as a means toincent distributors to qualify for our 25th Anniversary Extravaganza in April 2005 in Atlanta. The 25th AnniversaryCruise is a special worldwide vacation promotion, separate from, but occurring in connection with the 25th
Anniversary Extravaganza in Atlanta, and is expected to cost approximately $6.0 million. This is an event thatdistributors qualified for during 2004. Accordingly, we have accrued the expense in selling, general &
56
%%TRANSMSG*** Transmitting Job: V16934 PCN: 057000000 ***%%PCMSG|56 |00014|Yes|No|03/16/2006 21:00|0|0|Page is valid, no graphics -- Color: D|

administrative expenses. We do not expect a similar promotion in 2005. The 25th Anniversary Extravaganza willreplace the major regional extravaganzas in 2005, although we may still hold smaller regional events to carry theexcitement and momentum of this event. We expect the net cost of the 25th Anniversary Extravaganza in Atlanta tobe approximately $6.4 million.
In the first quarter of 2004, we took over the management of product distribution in Russia and Greece. Prior tothis, we used a third-party importer to manage and distribute our product to distributors in these countries. We havenow opened an administrative office and a company-operated distribution center in these countries to more closelyalign with our business model in most other countries around the world. This will allow more direct interaction withour distributors, which we feel will improve communication and ultimately enhance recruiting and retention ofdistributors in those countries. The cost of the change in business model in these countries was $1.0 million incapital expenditures, $4.4 million in transition costs that we do not expect to incur in the future and $5.9 million innet additional annual operating expenses. The transition costs and operating expenses were recorded in selling,general & administrative expenses.
Asia/Pacific Rim
Net sales in Asia/Pacific Rim increased $39.0 million, or 23.3%, for the year ended December 31, 2004, ascompared to 2003. In local currency, net sales increased 19.2% for the year ended December 31, 2004, as comparedto 2003. The fluctuation of foreign currency rates had a $6.8 million positive impact on net sales for the year endedDecember 31, 2004. The overall increase was attributable mainly to an increase in Taiwan, partly offset by adecrease in South Korea.
Net sales in Taiwan increased $23.8 million, or 49.6%, for the year ended December 31, 2004, over 2003, dueprimarily to an increase in the number of supervisors by 34.0% at December 31, 2004, as compared to the same timelast year, highly engaged distributor leadership, strong country management, increased local distributor trainingsand initiatives to promote individual recognition of well performing distributors, new product launches, positivemomentum from the Bangkok Extravaganza held in September and various other regional promotions. TheBangkok Extravaganza had a net cost of $1.7 million and was recorded in selling, general & administrativeexpenses. In 2005 this and other regional extravaganzas will be replaced by the 25th Anniversary AtlantaExtravaganza. Management will evaluate the need for smaller regional events to carry the excitement andmomentum of the 25th Anniversary Atlanta Extravaganza to those around the world who are unable to attend.Net sales in South Korea decreased $8.0 million, or 18.3%, for the year ended December 31, 2004, as compared to2003. It appears that numerous initiatives begun in the fourth quarter of 2003, are making an impact. To illustratethis improvement, while volume was flat (an improvement over prior year’s trend), net sales increased 11.0% in thefourth quarter as compared to the same period last year. We expect South Korea will report positive year over yearsales growth in 2005. In late 2004 we introduced ShapeWorksTM in South Korea, at a cost of less than $0.1 million,which was recorded in selling, general & administrative expenses, and which we believe should help with recruitingand retailing initiatives.
Japan
Net sales in Japan decreased $20.5 million, or 17.2%, for the year ended December 31, 2004, as compared to2003. In local currency, net sales in Japan decreased 22.9% for the year ended December 31, 2004, as compared to2003. The fluctuation of foreign currency rates had a $6.8 million favorable impact on net sales for the year endedDecember 31, 2004. The net sales decline in 2004, which is a continuation of a five-year downward trend in Japan,albeit at a slower rate for this reporting period, had been driven primarily by ineffective prior country management,which had not properly motivated distributor leadership or introduced new products in a timely manner to meetdistributor expectations. This weakness has been exacerbated by strong competition from other direct sellingcompanies and a general deterioration of the Japanese economy. In the third quarter of 2004, we appointed a newcountry manager who is currently focusing on uniting and motivating distributor leadership to improve recruitingand retention of distributors, and we are in the process of expanding our product line to address local countrydemographic needs. For example in late 2004 we introduced a green tea flavored Formula 1 and we createdindividual serving “packets” for our Formula 1 product. In 2005 we will be opening a new sales office in a centrallocation of Tokyo, a significant improvement over the existing location that we believe should give us greater
57
%%TRANSMSG*** Transmitting Job: V16934 PCN: 058000000 ***%%PCMSG|57 |00010|Yes|No|03/16/2006 21:00|0|0|Page is valid, no graphics -- Color: D|

visibility in a key population center. In combination with implementing new brand and volume incentivepromotional programs, we believe the above initiatives should help improve financial performance in 2005.
Sales by Product Category
RetailSales
DistributorAllowance
ProductSales
Handling &FreightIncome
NetSales
RetailSales
DistributorAllowance
ProductSales
Handling &FreightIncome
NetSales
Changein NetSales
2003 2004
Year Ended December 31,
(Dollars in millions)
Weight Management . . $ 840.4 $(413.2) $427.2 $ 72.9 $ 500.1 $ 945.1 $ (465.3) $ 479.8 $ 81.3 $ 561.1 12.2%
Inner Nutrition» . . . . . 849.0 (417.5) 431.5 73.6 505.1 946.5 (466.0) 480.5 81.5 562.0 11.3%
Outer Nutrition» . . . . . 177.6 (87.3) 90.3 15.4 105.7 207.3 (102.1) 105.2 17.9 123.1 16.5%
Literature, Promotionaland Other . . . . . . . 27.4 18.7 46.1 2.4 48.5 47.3 12.2 59.5 4.0 63.5 30.9%
Total . . . . . . . . . . . . $1,894.4 $(899.3) $995.1 $164.3 $1,159.4 $2,146.2 $(1,021.2) $1,125.0 $184.7 $1,309.7 13.0%
Our increased emphasis on the science of weight management and nutrition during the past two years,illustrated by our assembly of the Scientific Advisory Board and the Medical Advisory Board, has resulted innumerous product introductions like NiteworksTM and Garden 7TM and the introduction of ShapeWorksTM , apersonalized meal replacement program. Due to the launch of our ShapeWorksTM product line in March 2004 and theintroduction of new personal care products, net sales of weight management products and Outer Nutrition» productsincreased at a higher rate than net sales of inner nutrition products. The rationalization of our Outer Nutrition»
product line in 2002 resulted in an initial decrease in sales, but since then the line has represented approximately 9%of our net sales. The product line today is designed to complement the weight management and inner nutritionproduct lines with products for improving the appearance of the body, skin and hair. Literature, Promotional andOther, which includes product buy-backs and returns in all product categories, increased due to a decrease in returnsand refunds. We expect shifts within these categories from time to time as we launch new products.
Gross Profit
Gross profit was $1,039.8 million for the year ended December 31, 2004, as compared to $923.6 million in2003. As a percentage of net sales, gross profit for the year ended December 31, 2004 decreased from 79.7% to79.4%, as compared to 2003. The decrease in gross profit as a percentage of net sales for the year endedDecember 31, 2004 was attributable mainly to an increase in provisions made for slow moving and obsoleteinventory of $4.8 million as well as a small sales mix variance, which was partially offset by lower raw material andvendor costs. Generally, gross profit percentages do not vary significantly as a percentage of sales other than due toongoing cost reduction initiatives and provisions for slow moving and obsolete inventory. Additionally, we believethat we have the ability to mitigate price increases by raising the prices of our products or shifting product sourcingto alternative manufacturers.
Royalty Overrides
Royalty Overrides as a percentage of net sales were 35.5% for the year ended December 31, 2004, as comparedto 35.8% in 2003. As a percentage of net sales, Royalty Overrides decreased by 0.3% for the year endedDecember 31, 2004, as compared to 2003, due primarily to the $2.4 million favorable impact of aged royalties.Generally, this ratio varies slightly from period to period due to changes in the mix of products and countriesbecause full Royalty Overrides are not paid on certain products or in certain countries. Due to the structure of ourglobal compensation plan, we do not expect to see significant fluctuations in Royalty Overrides as a percent of netsales.
Selling, General & Administrative Expenses
Selling, general, and administrative expenses as a percentage of net sales were 33.3% for the year endedDecember 31, 2004, as compared to 34.6% in 2003.
58
%%TRANSMSG*** Transmitting Job: V16934 PCN: 059000000 ***%%PCMSG|58 |00010|Yes|No|03/16/2006 21:00|0|0|Page is valid, no graphics -- Color: D|

For the year ended December 31, 2004, selling, general & administrative expenses increased $34.8 million to$436.1 million from $401.3 million in 2003. The increase included $15.4 million in higher salaries and benefits, dueprimarily to normal merit increases, the impact of foreign currency fluctuations, a lower bonus expense in 2003based on not fully achieving targets that year and increases related to the strengthening of the management teamregionally and in the U.S.; $13.8 million in additional professional fees associated with higher legal and accountingexpenses, including Sarbanes-Oxley compliance, technology expenses, and higher manufacturing consultingexpenses related to the start-up of our facility in China; $4.5 million in additional promotional expenses relatedprimarily to the ShapeWorksTM launch, the eight-month European promotion program noted above which ended inJune 2004 and expenses related to our 25 th Anniversary promotions, all of which were detailed in the discussion ofnet sales by region; $12.2 million in higher non-income taxes due primarily to higher sales in certain jurisdictions;$2.6 million relating to the recapitalization in March, which we do not expect to recur in 2005; and $3.0 million inhigher provisions made for doubtful accounts. The changes discussed above include the unfavorable impact offoreign currency fluctuations on operating expenses of $9.3 million The increases were partially offset by$8.7 million lower litigation expenses, $4.6 million lower foreign exchange transaction losses and $11.7 millionlower amortization expense of intangibles for the year ended December 31, 2004, as compared to 2003, due to thefinal allocation in the third quarter of 2003 of the purchase price in connection with the Acquisition.
In December 2004, we reached an agreement with the Equity Sponsors to terminate a monitoring feeagreement in exchange for the issuance of 700,000 warrants. Using the Black-Scholes model we have calculated thefair value of this consideration to be approximately $2.9 million, which is included in 2004 expenses.
We target a product gross profit of approximately 80% of net sales, which allows us to economically remitroyalties to our distributor organization, pay our vendors for product and cover operating costs associated withproduct development and licensing, warehousing, distribution and transportation. We generally do not targetpromotions or advertising at any particular product or brand. Our significant promotions are generally aimed atgenerating increased levels of recruiting and retention of distributors. An example is the European Billion DollarChallenge in the first half of 2004. Under this promotion, distributors qualified for various levels of award, based onthe incremental sales volume they achieved. Generally, when a major new product is launched, there will beexpenditures related to the roll-out and promotion of such products. Based on the breadth and manner of a productlaunch, these costs could be material or immaterial. For example, as detailed previously in the net sales discussion,we introduced ShapeWorksTM in the United States in 2004 at an extravaganza, at a cost of approximately$3.7 million, net of costs of labeling and packaging revisions prior to introduction. The same product waslaunched in Europe at the Bologna event (a “mini-extravaganza”) at a cost of $0.5 million, and in South Korea, nottied to any major event, at a cost of less than $0.1 million. Product or brand advertising is generally handled by ourdistributors, although in 2005, we anticipate participating in sponsoring certain sporting events that will raiseawareness and recognition of the Herbalife brand. We have not finalized these plans, but we expect that spending onsuch events would not be material in 2005.
59
%%TRANSMSG*** Transmitting Job: V16934 PCN: 060000000 ***%%PCMSG|59 |00012|Yes|No|03/16/2006 21:00|0|0|Page is valid, no graphics -- Color: D|

Net Interest Expense
Net interest expense was $123.3 million for the year ended December 31, 2004, as compared to $41.5 millionin 2003. The higher interest expense in 2004 was primarily due to the two recapitalizations in 2004 as noted in thetable below and $8.2 million additional interest expense associated with the $275.0 million principal amount of our91⁄2% Notes issued in March 2004:
Interest Expense
Year EndedDecember 31,
2004
Year EndedDecember 31,
2003(Dollars in millions)
113⁄4% Notes-Redemption Premium and write-off of deferred financing fees . . $ 49.9 $ 1.4121⁄2% Senior Notes-Redemption Premium and write-off of deferred
financing fees . . . . . . . . . . . . . . . . . . . . . . . . . . . . . . . . . . . . . . . . . . . . . 15.4 —Term Loan-Write-off of deferred financing fees . . . . . . . . . . . . . . . . . . . . . . 4.5 —Revolver-Write-off of deferred finance fees . . . . . . . . . . . . . . . . . . . . . . . . . 1.7 —
Recapitalization expenses included in Interest Expense . . . . . . . . . . . . . . . . . $ 71.5 $ 1.4Interest Expense . . . . . . . . . . . . . . . . . . . . . . . . . . . . . . . . . . . . . . . . . . . . . 51.8 40.1
Total Interest Expense . . . . . . . . . . . . . . . . . . . . . . . . . . . . . . . . . . . . . . . . . $123.3 $41.5
As part of the continuation of the fourth quarter 2004 recapitalization, we exercised a contract provision toredeem 40%, or $110 million, of the 91⁄2% Notes. After the required notice period, this redemption was completedon February 4, 2005. The premium and the write-off of deferred financing fees of $14.2 million associated with thisredemption will be included in interest expense in the first quarter of 2005.
Income Taxes
Income taxes were $29.7 million for the year ended December 31, 2004, as compared to $28.7 million in 2003.As a percentage of pre-tax income, the estimated effective income tax rate was 192.8% for the year endedDecember 31, 2004, as compared to 43.8% in 2003. The increase in the effective tax rate for the year endedDecember 31, 2004 as compared to 2003 was caused primarily by the expenses related to the recapitalizations, asignificant portion of which are non-deductible, and the non-deductible interest expense associated with the 91⁄2%Notes. Excluding the impact of the recapitalization expenses of $71.5 million, the 2004 effective tax rate wouldhave been approximately 47%. In 2005, we believe the effective tax rate should decrease to 43%, reflecting thelower level of non deductible interest, and before the impact of the $14.2 million of premium and write-off ofdeferred financing fees noted in interest expense above. We estimate the unfavorable impact to the effective tax rateof including these expenses could be as high as 4%.
Foreign Currency Fluctuations
Currency fluctuations had a favorable impact of $12.9 million on net results for the year ended December 31,2004, when compared to what current year net results would have been using last year’s foreign exchange rates. Forthe year ended December 31, 2004, the regional effects were a favorable $7.5 million in Europe, a favorable$2.7 million in Asia/Pacific Rim, a favorable $0.2 million in The Americas, and a favorable $2.5 million in Japan.
Net Results
Net results for the year ended December 31, 2004 including $71.5 million of pre-tax recapitalization expenses(approximately $60.5 million net of tax), was a loss of $14.3 million, or a loss of $0.27 per diluted share, which was$51.2 million lower than the prior-year net income of $36.8 million or earnings of $0.69 per diluted share. Therecapitalization expenses in the first and fourth quarters of 2004 of $71.5 million pre-tax resulted from therepurchase our 151⁄2% senior notes, and the 113⁄4 Notes, and the refinancing of Herbalife International’s term loan.Net results were also impacted by the interest expense associated with the 91⁄2% Notes, higher promotional expensesand labor costs, partially offset by the 13.0% increase in net sales, the favorable impact of aged royalties and thefavorable impact of the appreciation of foreign currencies. Overall, the appreciation of foreign currencies had a$12.9 million favorable impact on net results for 2004.
60
%%TRANSMSG*** Transmitting Job: V16934 PCN: 061000000 ***%%PCMSG|60 |00014|Yes|No|03/16/2006 21:00|0|0|Page is valid, no graphics -- Color: D|

Liquidity and Capital Resources
We have historically met our working capital and capital expenditure requirements, including funding forexpansion of operations, through net cash flows provided by operating activities. Our principal source of liquidity isour operating cash flows. Variations in sales of our products would directly affect the availability of funds. There areno material restrictions on the ability to transfer and remit funds among our international affiliated companies.
For the year ended December 31, 2005, we generated $143.4 million from operating cash flows, as comparedto $80.1 million in 2004. The increase in cash generated from operations reflected an increase in operating incomeof $80.4 million, which was primarily driven by a 19.6% growth in net sales and a decrease in interest paid in 2005of $49.9 million, partially offset by an increase in income taxes paid of $44.9 million and an increase in inventory.
Capital expenditures, including capital leases, for the year ended December 31, 2005 were $32.6 million, ascompared to $30.3 million in 2004. The majority of these expenditures represented investments in managementinformation systems, internet tools for distributors, the relocation of our facility in Japan, and the expansion of ourfacilities in China. We expect to incur capital expenditures of up to $45 million in 2006.
2005 and 2006 are investment years for us in China as we expand our business there. The operating loss for2005 was $2.2 million and we currently anticipate to fund an operating loss of approximately $10.0 million in 2006,in addition to total capital expenditures and working capital of up to $15.0 million for the planned build-out of retailstores, our offices and the expansion of the capabilities of our manufacturing facility. In 2005 we investedapproximately $4.5 million in capital expenditures in China.
In December 2004, Herbalife completed an initial public offering in connection with which several recap-italization transactions were completed, including the tender for all of the outstanding 113⁄4% Notes, of which 99.9%accepted the tender offer, and a replacement of the existing term loan and revolving credit facility with a new$225.0 million senior credit facility. In addition, we redeemed $110 million principal amount excluding discountsor 40% of our outstanding 91⁄2% Notes in February of 2005 for the cash amount of $124.1 million, including apremium of $10.5 million and accrued interest of $3.6 million. Interest expense in 2005 includes the redemptionamount of $14.2 million which represents $10.5 million of premium and $3.7 million of write off of deferredfinancing cost and discount.
The $225.0 million senior credit facility consists of a senior secured revolving credit facility with totalavailability of up to $25.0 million and a senior secured term loan facility in an aggregate principal amount of$200.0 million. The revolver is available until December 21, 2009. The revolver bears interest at LIBOR plus 2%. InApril 2005 the senior credit facility was amended whereby the interest rate was reduced from LIBOR plus 21⁄4% toLIBOR plus 13⁄4%. In addition, the amount payable in connection with a partial or full refinancing of the loan withinthe first year of the amendment shall equal 101% of the principal amount. In August 2005, the senior credit facilitywas amended to permit the purchase, repurchase or redemption of up to $50.0 million aggregate principal amount ofthe 91⁄2% Notes due 2011. There were no repurchases of the 91⁄2% Notes in 2005. With regard to the term loan we areobligated to pay $0.2 million every quarter until September 30, 2010 and the remaining principal amount onDecember 21, 2010. During 2005 we prepaid approximately $109.0 million of our senior credit facility resulting inapproximately $2.2 million additional interest expense from write-off of deferred financing fees. As of Decem-ber 31, 2005, the outstanding balance of the term loan was $89.8 million and no amounts had been borrowed underthe revolving credit facility.
The senior credit facility and the 91⁄2% Notes include customary covenants that restrict, among other things, theability to incur additional debt, pay dividends or make certain other restricted payments, incur liens, merge or sell allor substantially all of our assets, or enter into various transactions with affiliates. Additionally, the senior creditfacility includes covenants relating to the maintenance of certain leverage, fixed charge coverage, and interestcoverage ratios, and requirements to make early payments to the extent of excess cash flow, as defined therein.
61
%%TRANSMSG*** Transmitting Job: V16934 PCN: 062000000 ***%%PCMSG|61 |00016|Yes|No|03/16/2006 21:00|0|0|Page is valid, no graphics -- Color: D|

The following summarizes our contractual obligations including interest at December 31, 2005 and the effectsuch obligations are expected to have on our liquidity and cash flows in future periods:
Total 2006 2007 2008 2009 20102011 &
Thereafter
Payments Due by Period
(Dollars in millions)
Term Debt . . . . . . . . . . . . . . . . $118.2 $ 6.8 $ 6.7 $ 6.6 $ 6.5 $ 91.6 $ —
113⁄4% Notes . . . . . . . . . . . . . . . $ 0.2 $ — $ — $ — $ — $ 0.2 $ —
91⁄2% Notes . . . . . . . . . . . . . . . . $251.2 $15.7 $15.7 $15.7 $15.7 $ 15.7 $172.7
Capital Lease . . . . . . . . . . . . . . $ 5.5 $ 3.4 $ 1.9 $ 0.2 $ — $ — $ —
Other debt . . . . . . . . . . . . . . . . $ 6.6 $ 5.7 $ 0.9 $ — $ — $ — $ —
Operating leases . . . . . . . . . . . . $ 77.9 $16.2 $10.5 $ 7.8 $ 7.0 $ 6.7 $ 29.7
Total . . . . . . . . . . . . . . . . . . . . . $459.6 $47.8 $35.7 $30.3 $29.2 $114.2 $202.4
Whitney and Golden Gate (and/or their affiliates) were parties to a Share Purchase Agreement (the “SharePurchase Agreement”) pursuant to which they originally purchased our Preferred Shares. Under the terms of theShare Purchase Agreement, Whitney and Golden Gate could, subject to approval by our board of directors and 75%of our shareholders, require us to pay a dividend to all of our shareholders related to certain income that may betaxable to them resulting from their ownership of our shares. We made dividend payments of $6.3 million to ourshareholders in the fourth quarter of 2004, related to certain income that may be taxable to them for the years endedDecember 31, 2003 and December 31, 2004.
In December 2004, we entered into a termination agreement with the parties to the Share Purchase Agreement.Pursuant to the termination agreement, the Share Purchase Agreement and all obligations and liabilities of theparties under the Share Purchase Agreement were terminated. As consideration for the termination of the SharePurchase Agreement, we have entered into a Tax Indemnification Agreement with Whitney and Golden Gate (and/or their affiliates) pursuant to which we have agreed to indemnify each of those parties for the Federal income taxliability and any related losses they incur in respect of income of Herbalife that is (or would be) includible in thegross income of that party for any taxable period under Section 951(a) of the Internal Revenue Code of 1986, asamended (the “Code”). Under the terms of the Tax Indemnification Agreement, we assume, for this purpose, thateach indemnified party is a “United States shareholder” as defined in Section 951(b) of the Code. We do not,however, have any obligation to provide an indemnity with respect to any taxes or related losses incurred that havebeen reimbursed under the Share Purchase Agreement. Our senior credit facility permits us to pay these taxindemnity payments, but restricts the aggregate amount that we can pay in any given year to no more than$15 million. We currently anticipate that no amounts will be required to be paid under this agreement for 2005. As aresult of the secondary offering in December 2005 in which Whitney and Golden Gate sold approximately12.6 million shares, we are no longer a controlled foreign corporation. Consequently, for 2006 and thereafter, nopayments under this agreement will be required.
In connection with the initial public offering we paid a special cash dividend to stockholders of record prior tothe offering in the amount of $139.7 million.
The declaration of future dividends is subject to the discretion of our board of directors and will depend uponvarious factors, including our earnings, financial condition, restrictions imposed by our credit agreement, cashrequirements, future prospects and other factors deemed relevant by our board of directors. Our credit agreementpermits payments of dividends as long as no default exists and the amount does not exceed $20.0 million per fiscalyear provided that the amount of dividends may be increased by 25% of the consolidated net income for the priorfiscal year if the Leverage Ratio (as defined in our credit agreement) for the four fiscal quarters of such fiscal year isless than or equal to 2.00:1.00.
As of December 31, 2005, we had positive working capital of $14.1 million. Cash and cash equivalents were$88.2 million at December 31, 2005, compared to $201.6 million at December 31, 2004.
62
%%TRANSMSG*** Transmitting Job: V16934 PCN: 063000000 ***%%PCMSG|62 |00020|Yes|No|03/16/2006 21:00|0|0|Page is valid, no graphics -- Color: D|

We expect that cash and funds provided from operations and available borrowings under our new revolvingcredit facility will provide sufficient working capital to operate our business, to make expected capital expendituresand to meet foreseeable liquidity requirements, including debt service on the 91/2% Notes and the new senior creditfacility. There can be no assurance, however, that our business will service our debt, including our outstandingnotes, or fund our other liquidity needs.
The majority of our purchases from suppliers are generally made in U.S. dollars, while sales to Herbalifedistributors generally are made in local currencies. Consequently, strengthening of the U.S. dollar versus a foreigncurrency can have a negative impact on operating margins and can generate transaction losses on intercompanytransactions. For discussion of our foreign exchange contracts and other hedging arrangements, see the quantitativeand qualitative disclosures about market risks described below.
Quarterly Results of Operations
All common shares and earnings per share data for the Company gives effect to a 1:2 reverse stock split, whichtook effect December 1, 2004.
March 31,2004
June 30,2004
September 30,2004
December 31,2004
March 31,2005
June 30,2005
September 30,2005
December 31,2005
Quarter Ended
(In thousands except per share data)
Operations:
Net sales . . . . . . . . . . . . . . $324,052 $324,160 $319,809 $341,641 $372,060 $384,667 $400,997 $409,026
Cost of sales . . . . . . . . . . . . 63,618 66,245 68,961 71,089 75,737 77,373 79,482 83,155
Gross profit . . . . . . . . . . . . . 260,434 257,915 250,848 270,552 296,323 307,294 321,515 325,871
Royalty Overrides . . . . . . . . . 115,856 114,532 111,978 122,526 135,168 137,089 138,618 144,790
Selling, general &administrative expenses . . . . 107,840 105,199 102,772 120,329 110,029 117,817 121,584 126,837
Operating income . . . . . . . . . 36,738 38,184 36,098 27,697 51,126 52,388 61,313 54,244
Interest income (expense),net . . . . . . . . . . . . . . . . . (27,373) (14,256) (13,604) (68,071) (22,202) (7,446) (7,950) (6,326)
Income (loss) before incometaxes . . . . . . . . . . . . . . . 9,365 23,928 22,494 (40,374) 28,924 44,942 53,363 47,918
Income taxes . . . . . . . . . . . . 9,849 11,840 11,004 (2,968) 15,648 22,168 26,226 17,964
Net: income (loss) . . . . . . . . $ (484) $ 12,088 $ 11,490 $ (37,406) $ 13,276 $ 22,774 $ 27,137 $ 29,954
Earnings (loss) per share
Basic . . . . . . . . . . . . . . . $ (0.01) $ 0.23 $ 0.22 $ (0.68) $ 0.19 $ 0.33 $ 0.39 $ 0.43
Diluted . . . . . . . . . . . . . . $ (0.01) $ 0.22 $ 0.21 $ (0.68) $ 0.19 $ 0.32 $ 0.37 $ 0.41
Weighted average sharesoutstanding
Basic . . . . . . . . . . . . . . . 52,035 52,063 52,265 55,256 68,643 68,678 69,077 69,487
Diluted . . . . . . . . . . . . . . 52,035 55,066 55,660 55,256 71,714 71,860 73,455 73,444
Contingencies
We are from time to time engaged in routine litigation. We regularly review all pending litigation matters inwhich we are involved and establish reserves deemed appropriate by management for these litigation matters whena probable loss estimate can be made.
Herbalife International and certain of its independent distributors have been named as defendants in apurported class action lawsuit filed February 17, 2005, in the Superior Court of California, County of San Francisco,and served on Herbalife International on March 14, 2005 (Minton v. Herbalife International, et al). The case hasbeen transferred to the Los Angeles County Superior Court. The plaintiff is challenging the marketing practices ofcertain Herbalife International independent distributors and Herbalife International under various state lawsprohibiting “endless chain schemes,” insufficient disclosure in assisted marketing plans, unfair and deceptivebusiness practices, and fraud and deceit. The plaintiff alleges that the Freedom Group system operated by certainindependent distributors of Herbalife International products places too much emphasis on recruiting and encour-ages excessively large purchases of product and promotional materials by distributors. The plaintiff also alleges that
63
%%TRANSMSG*** Transmitting Job: V16934 PCN: 064000000 ***%%PCMSG|63 |00015|Yes|No|03/16/2006 21:00|0|0|Page is valid, no graphics -- Color: D|

Freedom Group pressured distributors to disseminate misleading promotional materials. The plaintiff seeks to holdHerbalife International vicariously liable for the actions of its independent distributors and is seeking damages andinjunctive relief. The Company believes that we have meritorious defenses to the suit.
Herbalife International and certain of its distributors have been named as defendants in a purported class actionlawsuit filed July 16, 2003, in the Circuit Court of Ohio County in the State of West Virginia (Mey v. HerbalifeInternational, Inc., et al). The complaint alleges that certain telemarketing practices of certain Herbalife Inter-national distributors violate the Telephone Consumer Protection Act, or TCPA, and seeks to hold HerbalifeInternational vicariously liable for the practices of its distributors. More specifically, the plaintiffs’ complaintalleges that several of Herbalife International’s distributors used pre-recorded telephone messages and autodialersto contact prospective customers in violation of the TCPA’s prohibition of such practices. Herbalife International’sdistributors are independent contractors and if any such distributors in fact violated the TCPA they also violatedHerbalife’s policies which require its distributors to comply with all applicable federal, state and local laws. TheCompany believes that we have meritorious defenses to the suit.
As a marketer of dietary and nutritional supplements and other products that are ingested by consumers orapplied to their bodies, we have been and are currently subjected to various product liability claims. The effects ofthese claims to date have not been material to us, and the reasonably possible range of exposure on currentlyexisting claims is not material to us. We believe that we have meritorious defenses to the allegations contained in thelawsuits. We currently maintain product liability insurance with an annual deductible of $10 million.
Certain of our subsidiaries have been subject to tax audits by governmental authorities in their respectivecountries. In certain of these tax audits, governmental authorities are proposing that significant amounts ofadditional taxes and related interest and penalties are due. We and our tax advisors believe that there are substantialdefenses to their allegations that additional taxes are owed, and we are vigorously contesting the additionalproposed taxes and related charges.
These matters may take several years to resolve, and we cannot be sure of their ultimate resolution. However, itis the opinion of management that adverse outcomes, if any, will not likely result in a material effect on our financialcondition and operating results. This opinion is based on our belief that any losses we suffer would not be materialand that we have meritorious defenses. Although we have reserved an amount that we believe represents the likelyoutcome of the resolution of these disputes, if we are incorrect in our assessment we may have to record additionalexpenses.
Critical Accounting Policies
Our Consolidated Financial Statements are prepared in conformity with accounting principles generallyaccepted in the United States, which require us to make estimates and assumptions that affect the reported amountsof assets and liabilities and disclosures of contingent assets and liabilities at the date of the financial statements andthe reported amounts of revenue and expenses during the year. Actual results could differ from those estimates. Weconsider the following policies to be most critical in understanding the judgments that are involved in preparing thefinancial statements and the uncertainties that could impact our results of operations, financial condition and cashflows.
We are a network marketing company that sells a wide range of weight management products, nutritionalsupplements and personal care products within one industry segment as defined under SFAS No. 131, “Disclosuresabout Segments of an Enterprise and Related Information.” Our products are manufactured by third party providersand then sold to independent distributors who sell Herbalife products to retail consumers or other distributors.
We sell products in 60 countries throughout the world and we are organized and managed by geographicregion. In the first quarter of 2003, we elected to aggregate our operating segments into one reporting segment, asmanagement believes that our operating segments have similar operating characteristics and similar long termoperating performance. In making this determination, management believes that the operating segments are similarin the nature of the products sold, the product acquisition process, the types of customers products are sold to, themethods used to distribute the products, and the nature of the regulatory environment.
64
%%TRANSMSG*** Transmitting Job: V16934 PCN: 065000000 ***%%PCMSG|64 |00015|Yes|No|03/16/2006 21:00|0|0|Page is valid, no graphics -- Color: D|

Revenue is recognized when products are shipped and title passes to the independent distributor or importer.Amounts billed for freight and handling costs are included in net sales. We generally receive the net sales price incash or through credit card payments at the point of sale. Related royalty overrides and allowances for productreturns are recorded when the merchandise is shipped.
Allowances for product returns, primarily in connection with our buyback program, are provided at the timethe product is shipped. This accrual is based upon historic return rates for each country, which vary from zero toapproximately 5.0% of retail sales, and the relevant return pattern, which reflects anticipated returns to be receivedover a period of up to 12 months following the original sale. Historically, product returns and buybacks have notbeen significant. Product returns and buybacks were approximately 1.9%, 1.1% and 1.0% of retail sales for theyears ended December 31, 2003, 2004 and 2005 respectively. No material changes in estimates have beenrecognized for the year ended December 31, 2005 or for the years ended December 31, 2004 and 2003.
We record reserves against our inventory to provide for estimated obsolete or unsalable inventory based onassumptions about future demand for our products and market conditions. If future demand and market conditionsare less favorable than management’s assumptions, additional reserves could be required. Likewise, favorablefuture demand and market conditions could positively impact future operating results if previously reserved forinventory is sold. We reserved for obsolete and slow moving inventory totaling $4.2 million, $6.2 million and$8.0 million as of December 31, 2003, 2004 and 2005, respectively.
In accordance with SFAS No. 144, long-lived assets, such as property, plant, and equipment, and purchasedintangibles subject to amortization, are reviewed for impairment whenever events or changes in circumstancesindicate that the carrying amount of an asset may not be recoverable. Recoverability of assets to be held and used ismeasured by a comparison of the carrying amount of an asset to estimated undiscounted future cash flows expectedto be generated by the asset. If the carrying amount of an asset exceeds its estimated future cash flows, animpairment charge is recognized by the amount by which the carrying amount of the asset exceeds the fair value ofthe asset. Assets to be disposed of would be separately presented in the balance sheet and reported at the lower of thecarrying amount or fair value less costs to sell, and are no longer depreciated. The assets and liabilities of a disposedgroup classified as held for sale would be presented separately in the appropriate asset and liability sections of thebalance sheet.
Goodwill and other intangibles not subject to amortization are tested annually for impairment, and are testedfor impairment more frequently if events and circumstances indicate that the asset might be impaired. Animpairment loss is recognized to the extent that the carrying amount exceeds the asset’s fair value. Thisdetermination is made at the reporting unit level and consists of two steps. First, the Company determines thefair value of a reporting unit and compares it to its carrying amount. Second, if the carrying amount of a reportingunit exceeds its fair value, an impairment loss is recognized for any excess of the carrying amount of the reportingunit’s goodwill and other intangibles over the implied fair value. The implied fair value is determined by allocatingthe fair value of the reporting unit in a manner similar to a purchase price allocation, in accordance withSFAS No. 141, Business Combinations. The residual fair value after this allocation is the implied fair value of thereporting unit goodwill and other intangibles. As of December 31, 2005, we had goodwill of approximately$134.2 million, and marketing franchise of $310.0 million. No write-downs were recognized for the year endedDecember 31, 2004. Goodwill was reduced in 2005 by approximately $33.3 million due primarily to a reduction inthe valuation allowance established at the time of the Acquisition against pre-Acquisition tax benefits.
Contingencies are accounted for in accordance with SFAS No. 5, “Accounting for Contingencies.” SFAS No. 5requires that we record an estimated loss from a loss contingency when information available prior to issuance ofour financial statements indicates that it is probable that an asset has been impaired or a liability has been incurred atthe date of the financial statements and the amount of the loss can be reasonably estimated. Accounting forcontingencies such as legal and income tax matters requires us to use judgment. Many of these legal and taxcontingencies can take years to be resolved. Generally, as the time period increases over which the uncertainties areresolved, the likelihood of changes to the estimate of the ultimate outcome increases.
Deferred income tax assets have been established for net operating loss carryforwards of certain foreignsubsidiaries and have been reduced by a valuation allowance to reflect them at amounts estimated to be ultimatelyrecognized. The net operating loss carryforwards expire in varying amounts over a future period of time.
65
%%TRANSMSG*** Transmitting Job: V16934 PCN: 066000000 ***%%PCMSG|65 |00016|Yes|No|03/16/2006 21:00|0|0|Page is valid, no graphics -- Color: D|

Realization of the income tax carryforwards is dependent on generating sufficient taxable income prior to expirationof the carryforwards. Although realization is not assured, we believe it is more likely than not that the net carryingvalue of the income tax carryforwards will be realized. The amount of the income tax carryforwards that isconsidered realizable, however, could change if estimates of future taxable income during the carryforward periodare adjusted.
New Accounting Pronouncements
In December 2004, the Financial Accounting Standards Board (“FASB”) enacted Statement of FinancialAccounting Standards 123 — revised 2004 (“SFAS 123R”), “Share-Based Payment” which replaces Statement ofFinancial Accounting Standards No. 123 (“SFAS 123”), Accounting for Stock-Based Compensation” and super-sedes Accounting Principle Board (“APB”) Opinion No. 25, “Accounting for Stock Issued to Employees.”SFAS No. 123R requires the measurement of all employee share-based payments to employees, including grantsof employee stock options, using a fair-value-based method and the recording of such expense in our consolidatedstatements of operations.
We are required to adopt SFAS No. 123R in the first quarter of fiscal year 2006. The pro forma disclosurespreviously permitted under SFAS No. 123 no longer will be an alternative to financial statement recognition. SeeNote 2 in our Notes to Consolidated Financial Statements for the pro forma net income and net income per shareamounts, for fiscal 2002 through fiscal 2004, as if we had used a fair-value-based method similar to the methodsrequired under SFAS No. 123R to measure compensation expense for employee stock incentive awards. Althoughwe have not yet determined whether the adoption of SFAS No. 123R will result in amounts that are similar to thecurrent pro forma disclosures under SFAS No. 123, we are evaluating the requirements under SFAS No. 123R. On apreliminary basis we expect the adoption will have a cumulative pre-tax impact of less than $15 million for theperiod from 2006 to 2010, related to share based awards issued prior to the year end of 2005, on our consolidatedstatements of operations. The full impact of adopting SFAS No. 123R cannot be accurately estimated at this time, asit will depend on the market value and the amount of share based awards granted in the future periods.
In December 2004, the FASB issued FASB Staff Position No. FAS 109-2 “Accounting and DisclosureGuidance for the Foreign Earnings Repatriation Provision within the American Jobs Creations Act of2004” (“AJCA”). The AJCA introduces a limited time 85% dividends received deduction on the repatriation ofcertain foreign earnings to a U.S. taxpayer (repatriation provision), provided certain criteria are met. SFAS No. 109-2provides accounting and disclosure guidance for the repatriation provision. The provision will not provide amaterial benefit to the Company.
In December 2004, the FASB issued SFAS No. 151, “Inventory Costs, an amendment of ARB No. 43,Chapter 4,” which requires that abnormal amounts of idle facility expense, freight, handling costs and wastedmaterial (spoilage) be recognized as current-period charges. In addition, the statement requires that allocation offixed production overheads to the costs of conversion be based on the normal capacity of the production facilities.SFAS No. 151 is effective for fiscal years beginning after June 15, 2005. The Company will adopt this statement asrequired, and management does not believe the adoption will have a material effect on the Company’s results ofoperations, financial condition or liquidity.
In May 2005, the FASB issued SFAS No. 154, “Accounting Changes and Error Corrections.” SFAS No. 154requires restatement of prior periods’ financial statements for changes in accounting principle, unless it isimpracticable to determine either the period-specific effects or the cumulative effect of the change. Also,SFAS No. 154 requires that retrospective application of a change in accounting principle be limited to the directeffects of the change. SFAS No. 154 is effective for accounting changes and corrections of errors made in fiscalyears beginning after December 15, 2005. Management does not believe that the adoption of SFAS No. 154 willhave a material impact on the Company’s consolidated financial statements.
Item 7A. QUANTITATIVE AND QUALITATIVE DISCLOSURES ABOUT MARKET RISK
We are exposed to market risks, which arise during the normal course of business from changes in interest ratesand foreign currency exchange rates. On a selected basis, we use derivative financial instruments to manage or hedgethese risks. All hedging transactions are authorized and executed pursuant to written guidelines and procedures.
66
%%TRANSMSG*** Transmitting Job: V16934 PCN: 067000000 ***%%PCMSG|66 |00016|Yes|No|03/16/2006 21:00|0|0|Page is valid, no graphics -- Color: D|

We have adopted SFAS No. 133, “Accounting for Derivative Instruments and Hedging Activities” (“SFASNo. 133”). SFAS No. 133, as amended and interpreted, established accounting and reporting standards forderivative instruments, including certain derivative instruments embedded in other contracts, and for hedgingactivities. All derivatives, whether designated in hedging relationships or not, are required to be recorded on thebalance sheet at fair value. If the derivative is designated as a fair-value hedge, the changes in the fair value of thederivative and the underlying hedged item are recognized concurrently in earnings. If the derivative is designated asa cash-flow hedge, changes in the fair value of the derivative are recorded in other comprehensive income (“OCI”)and are recognized in the statement of operations when the hedged item affects earnings. SFAS No. 133 definedrequirements for designation and documentation of hedging relationships as well as ongoing effectivenessassessments in order to use hedge accounting. For a derivative that does not qualify as a hedge, changes in fairvalue are recognized concurrently in earnings.
A discussion of our primary market risk exposures and derivatives is presented below.
Foreign Exchange Risk
We enter into foreign exchange derivatives in the ordinary course of business primarily to reduce exposure tocurrency fluctuations attributable to intercompany transactions and translation of local currency revenue. Most ofthese foreign exchange contracts would qualify as cash flow hedges for forecasted transactions.
We purchase average rate put options, which give us the right, but not the obligation, to sell foreign currency ata specified exchange rate (“strike rate”). The objective of these options is to provide protection in the event that theforeign currency weakens beyond the option strike rate. The fair value of the option contracts is based on third-partybank quotes.
The following table provides information about the details of our option contracts:
Foreign Currency CoverageAverage
Strike PriceFair
ValueMaturity
Date(In millions) (In millions)
At December 31, 2005Purchase Puts (Company may sell MXP/buy USD)Mexican Peso . . . . . . . . . . . . . . . . . . . . . . . . . . . . $ 6.0 10.53-10.79 $0.1 Jan-Mar 2006Mexican Peso. . . . . . . . . . . . . . . . . . . . . . . . . . . . $ 5.5 10.64-10.82 $0.1 Apr-Jun 2006Mexican Peso . . . . . . . . . . . . . . . . . . . . . . . . . . . . $ 4.5 10.74-10.86 $0.1 Jul-Sep 2006Mexican Peso . . . . . . . . . . . . . . . . . . . . . . . . . . . . $ 4.0 10.78-10.90 $0.1 Oct-Dec 2006
$20.0 $0.4
Foreign Currency CoverageAverage
Strike PriceFair
ValueMaturity
Date(In millions) (In millions)
At December 31, 2004Purchase Puts (Company may sell yen/buy
USD)Japanese yen . . . . . . . . . . . . . . . . . . . . . . . . . . . $ 4.5 102.06-103.43 $0.1 Jan-Mar 2005Japanese yen . . . . . . . . . . . . . . . . . . . . . . . . . . . 4.5 101.31-102.63 0.1 Apr-Jun 2005Japanese yen . . . . . . . . . . . . . . . . . . . . . . . . . . . 4.5 100.52-101.79 0.1 Jul-Sep 2005Japanese yen . . . . . . . . . . . . . . . . . . . . . . . . . . . 4.5 99.70-100.90 0.1 Oct-Dec 2005
$18.0 $0.4
Purchase Puts (Company may sell euro/buyUSD)
Euro . . . . . . . . . . . . . . . . . . . . . . . . . . . . . . . . . $10.2 1.31-1.35 $ — Jan-Mar 2005Euro . . . . . . . . . . . . . . . . . . . . . . . . . . . . . . . . . 10.2 1.32-1.35 0.1 Apr-Jun 2005Euro . . . . . . . . . . . . . . . . . . . . . . . . . . . . . . . . . 10.2 1.31-1.36 0.2 Jul-Sep 2005Euro . . . . . . . . . . . . . . . . . . . . . . . . . . . . . . . . . 10.2 1.32-1.36 0.3 Oct-Dec 2005
$40.8 $0.6
67
%%TRANSMSG*** Transmitting Job: V16934 PCN: 068000000 ***%%PCMSG|67 |00019|Yes|No|03/16/2006 21:00|0|0|Page is valid, no graphics -- Color: D|

Foreign exchange forward contracts are used to hedge advances between subsidiaries. The objective of thesecontracts is to neutralize the impact of foreign currency movements on the subsidiary’s operating results. The fairvalue of forward contracts is based on third-party bank quotes.
The following table provides information about the details of our forward contracts:
Foreign CurrencyContract
DateForwardPosition
MaturityDate
ContractRate
FairValue
(In millions) (In millions)
At December 31, 2005Buy SEK sell USD . . . . . . . . . . . . . . . . . . . . . . 12/28/05 $ 2.3 1/31/06 7.93 $ 2.3
Buy EUR sell USD. . . . . . . . . . . . . . . . . . . . . . 12/28/05 $ 0.9 1/31/06 1.19 $ 0.9
Buy GBP sell USD . . . . . . . . . . . . . . . . . . . . . . 12/28/05 $ 3.1 1/31/06 1.72 $ 3.1
Buy KRW sell USD . . . . . . . . . . . . . . . . . . . . . 12/28/05 $ 6.0 1/31/06 1,012.05 $ 6.0
Buy JPY sell USD . . . . . . . . . . . . . . . . . . . . . . 12/28/05 $ 4.1 1/31/06 117.39 $ 4.1
Buy CNY sell USD . . . . . . . . . . . . . . . . . . . . . 12/28/05 $15.0 1/31/06 8.03 $15.0
Buy INR sell USD . . . . . . . . . . . . . . . . . . . . . . 12/28/05 $ 5.3 1/31/06 45.34 $ 5.3
Buy CAD sell Euro . . . . . . . . . . . . . . . . . . . . . 12/30/05 $ 1.5 1/31/06 1.38 $ 1.5Buy NZD sell Euro. . . . . . . . . . . . . . . . . . . . . . 12/30/05 $ 0.7 1/31/06 1.75 $ 0.7
Buy AUD sell Euro . . . . . . . . . . . . . . . . . . . . . 12/30/05 $ 0.7 1/31/06 1.63 $ 0.7
Buy TWD sell Euro . . . . . . . . . . . . . . . . . . . . . 12/30/05 $ 3.3 1/31/06 39.15 $ 3.4
Buy USD sell Euro . . . . . . . . . . . . . . . . . . . . . . 12/30/05 $ 0.7 1/31/06 1.19 $ 0.7
Buy NOK sell Euro . . . . . . . . . . . . . . . . . . . . . 12/30/05 $ 1.5 1/31/06 8.05 $ 1.5
Buy DKK sell Euro . . . . . . . . . . . . . . . . . . . . . 12/30/05 $ 1.3 1/31/06 7.46 $ 1.3
Buy PLN sell Euro . . . . . . . . . . . . . . . . . . . . . . 12/30/05 $ 0.8 1/31/06 3.84 $ 0.8
Buy Euro sell USD . . . . . . . . . . . . . . . . . . . . . . 12/30/05 $13.4 1/31/06 1.19 $13.7
Buy HUF sell Euro . . . . . . . . . . . . . . . . . . . . . . 12/30/05 $ 0.8 1/31/06 252.83 $ 0.8
Buy EUR sell USD. . . . . . . . . . . . . . . . . . . . . . 12/28/05 $ 9.5 1/31/06 1.19 $ 9.5
Buy Euro sell SEK . . . . . . . . . . . . . . . . . . . . . . 12/28/05 $ 0.6 1/31/06 9.42 $ 0.6
Buy YEN sell CHF . . . . . . . . . . . . . . . . . . . . . . 12/28/05 $22.6 1/31/06 89.40 $22.5
Buy Euro sell GBP . . . . . . . . . . . . . . . . . . . . . . 12/28/05 0.8 1/31/06 0.69 $ 0.8
At December 31, 2004Buy EUR sell USD. . . . . . . . . . . . . . . . . . . . . . 12/22/04 $ 3.4 1/24/05 1.34 $ 3.5
Buy GBP sell USD . . . . . . . . . . . . . . . . . . . . . . 12/22/04 $ 3.4 1/24/05 1.91 $ 3.5
Buy JPY sell USD . . . . . . . . . . . . . . . . . . . . . . 12/22/04 $24.1 1/24/05 104.00 $24.5
Buy SEK sell USD . . . . . . . . . . . . . . . . . . . . . . 12/22/04 $ 3.0 1/24/05 6.74 $ 3.0
Buy Euro sell Rouble . . . . . . . . . . . . . . . . . . . . 12/23/04 $ 1.3 1/24/05 37.74 $ 1.3
Buy MXP sell Euro . . . . . . . . . . . . . . . . . . . . . 12/6/04 $10.2 1/5/05 15.02 $10.1
Buy DKK sell Euro . . . . . . . . . . . . . . . . . . . . . 12/6/04 $ 0.4 1/5/05 7.43 $ 0.4
Buy AUD sell Euro . . . . . . . . . . . . . . . . . . . . . 12/6/04 $ 2.7 1/5/05 1.74 $ 2.7
Buy NOK sell Euro . . . . . . . . . . . . . . . . . . . . . 12/6/04 $ 1.8 1/5/05 8.15 $ 1.8
Buy TWD sell Euro . . . . . . . . . . . . . . . . . . . . . 12/6/04 $ 1.1 1/5/05 42.94 $ 1.1
Buy CAD sell Euro . . . . . . . . . . . . . . . . . . . . . 12/21/04 $ 1.5 1/7/05 1.64 $ 1.5Buy NZD sell Euro. . . . . . . . . . . . . . . . . . . . . . 12/21/04 $ 0.4 1/7/05 1.88 $ 0.4
All our foreign subsidiaries, excluding those operating in hyper-inflationary environments, designate theirlocal currencies as their functional currency. At December 31, 2005, the total amount of our foreign subsidiary cashwas $62.7 million, of which $4.5 million was invested in U.S. dollars.
68
%%TRANSMSG*** Transmitting Job: V16934 PCN: 069000000 ***%%PCMSG|68 |00018|Yes|No|03/16/2006 21:00|0|0|Page is valid, no graphics -- Color: D|

Interest Rate Risk
The table below presents principal cash flows and interest rates by maturity dates and the fair values of ourborrowings as of December 31, 2005. Fair values for fixed rate borrowings have been determined based on recentmarket trade values. The fair values for variable rate borrowings approximate their carrying value. Variable interestrates disclosed represent the rates on the borrowings at December 31, 2005. Interest rate risk related to our capitalleases is not significant.
2006 2007 2008 2009 2010 Thereafter Total Fair ValueExpected Maturity Date
Long-term Debt
113⁄4% Notes (in millions) . . . . $ — $ — $ — $ — $ 0.1 $ — $ 0.1 $ 0.1
Fixed Interest Rate . . . . . . . . . 11.75%
Term Loan (in millions) . . . . . $0.9 $0.9 $0.9 $0.9 $86.2 $ — $ 89.8 $ 89.8
Average Variable InterestRate . . . . . . . . . . . . . . . . . . 6.0%
91⁄2% Notes (in millions) . . . . . $ — $ — $ — $ — $ — $165.0 $165.0 $178.2
Fixed Interest Rate . . . . . . . . . 9.5%
Under the $200 million term loan, the Company is obligated to enter into for a minimum of three years afterDecember 21, 2004 closing date an interest rate hedge for up to 25% of the aggregate principal amount of the termloan. On February 24, 2005 the company entered into a $125 million notional interest rate swap to fulfill thisobligation. In October 2005, the swap notional was partially reduced to $90 million, to match the then current termloan carrying value. In December 2005, the swap notional was further reduced to $20 million. At this time werealized a gain of $0.45 million. Since the principal of the debt still remained at $90 million, we are required, underStatement of Financial Accounting Standards (“SFAS”) No. 133, to defer the gain and amortize it into earnings(using the effective interest method) over the remaining life of the debt. The gain amount recognized in Decemberwas immaterial. Also in December 2005, we entered into a $2.5 million notional interest rate cap to meet our termloan 25% hedge obligation.
Item 8. FINANCIAL STATEMENTS AND SUPPLEMENTARY DATA
Our financial statements and notes thereto and the report of KPMG LLP, independent registered publicaccounting firm, is set forth in the Index to Financial Statements under Item 15 — Exhibits and Financial StatementSchedules, of this Annual Report on Form 10-K, and is incorporated herein by reference.
Item 9. CHANGES IN AND DISAGREEMENTS WITH ACCOUNTANTS ON ACCOUNTING ANDFINANCIAL DISCLOSURE
None.
Item 9A. CONTROLS AND PROCEDURES
Disclosure Controls and Procedures
The Company maintains disclosure controls and procedures as defined in Rule 13a-15(e) under the ExchangeAct. Based on an evaluation of the Company’s disclosure controls and procedures as of the end of the period coveredby this report conducted by the Company’s management, with the participation of the Chief Executive Officer andChief Financial Officer, the Chief Executive Officer and Chief Financial Officer have concluded that theCompany’s disclosure controls and procedures were effective as of December 31, 2005.
Management’s Report on Internal Control over Financial Reporting
The SEC, as directed by Section 404 of the Sarbanes-Oxley Act of 2002, adopted rules which will require us toinclude in our Annual Reports on Form 10-K, an assessment by management of the effectiveness of our internal
69
%%TRANSMSG*** Transmitting Job: V16934 PCN: 070000000 ***%%PCMSG|69 |00016|Yes|No|03/16/2006 21:00|0|0|Page is valid, no graphics -- Color: D|

controls over financial reporting. In addition, our independent auditors must attest to and report on management’sassessment of the effectiveness of such internal controls over financial reporting.
Management of the Company is responsible for establishing and maintaining adequate internal control overfinancial reporting as defined in Rule 13a-15(f) under the Exchange Act. The Company’s internal control overfinancial reporting is designed to provide reasonable assurance to the Company’s management and board ofdirectors regarding the preparation and fair presentation of published financial statements.
Because of its inherent limitations, internal control over financial reporting may not prevent or detectmisstatements. Therefore, even those systems determined to be effective can provide only reasonable assurancewith respect to financial statement preparation and presentation.
The Company’s management carried out an evaluation, under the supervision and with the participation of theCompany’s Chief Executive Officer and Chief Financial Officer, of the effectiveness of the Company’s internalcontrol over financial reporting based on the framework in Internal Control — Integrated Framework issued by theCommittee of Sponsoring Organizations of the Treadway Commission. Based upon this evaluation, under theframework in Internal Control — Integrated Framework, our management concluded that our internal control overfinancial reporting was effective as of December 31, 2005.
The registered public accounting firm that audited the financial statements included in this Annual Report onForm 10-K has issued an attestation report on management’s assessment of the Company’s internal control overfinancial reporting, which is set forth below.
Changes in Internal Control over Financial Reporting
There has been no change in our internal control over financial reporting during the fourth quarter of 2005 thathas materially affected, or is reasonably likely to materially affect, our internal control over financial reporting.
70
%%TRANSMSG*** Transmitting Job: V16934 PCN: 071000000 ***%%PCMSG|70 |00013|Yes|No|03/16/2006 21:00|0|0|Page is valid, no graphics -- Color: D|

REPORT OF INDEPENDENT REGISTERED PUBLIC ACCOUNTING FIRM
The Board of Directors and StockholdersHerbalife Ltd.:
We have audited management’s assessment, included in the accompanying Management’s Report on InternalControl over Financial Reporting, that Herbalife Ltd. (formerly WH Holdings (Cayman Islands) Ltd.) (the“Company”) maintained effective internal control over financial reporting as of December 31, 2005, based oncriteria established in Internal Control — Integrated Framework issued by the Committee of Sponsoring Orga-nizations of the Treadway Commission (COSO). Herbalife Ltd.’s management is responsible for maintainingeffective internal control over financial reporting and for its assessment of the effectiveness of internal control overfinancial reporting. Our responsibility is to express an opinion on management’s assessment and an opinion on theeffectiveness of the Company’s internal control over financial reporting based on our audit.
We conducted our audit in accordance with the standards of the Public Company Accounting Oversight Board(United States). Those standards require that we plan and perform the audit to obtain reasonable assurance aboutwhether effective internal control over financial reporting was maintained in all material respects. Our auditincluded obtaining an understanding of internal control over financial reporting, evaluating management’sassessment, testing and evaluating the design and operating effectiveness of internal control, and performingsuch other procedures as we considered necessary in the circumstances. We believe that our audit provides areasonable basis for our opinion.
A company’s internal control over financial reporting is a process designed to provide reasonable assuranceregarding the reliability of financial reporting and the preparation of financial statements for external purposes inaccordance with generally accepted accounting principles. A company’s internal control over financial reportingincludes those policies and procedures that (1) pertain to the maintenance of records that, in reasonable detail,accurately and fairly reflect the transactions and dispositions of the assets of the company; (2) provide reasonableassurance that transactions are recorded as necessary to permit preparation of financial statements in accordancewith generally accepted accounting principles, and that receipts and expenditures of the company are being madeonly in accordance with authorizations of management and directors of the company; and (3) provide reasonableassurance regarding prevention or timely detection of unauthorized acquisition, use, or disposition of the company’sassets that could have a material effect on the financial statements.
Because of its inherent limitations, internal control over financial reporting may not prevent or detectmisstatements. Also, projections of any evaluation of effectiveness to future periods are subject to the risk thatcontrols may become inadequate because of changes in conditions, or that the degree of compliance with thepolicies or procedures may deteriorate.
In our opinion, management’s assessment that Herbalife Ltd. and subsidiaries maintained effective internalcontrol over financial reporting as of December 31, 2005, is fairly stated, in all material respects, based on criteriaestablished in Internal Control-Integrated Framework issued by the Committee of Sponsoring Organizations of theTreadway Commission (COSO). Also, in our opinion, the Company maintained, in all material respects, effectiveinternal control over financial reporting as of December 31, 2005, based on criteria established in Internal Control-Integrated Framework issued by the Committee of Sponsoring Organizations of the Treadway Commission(COSO).
We also have audited, in accordance with the standards of the Public Company Accounting Oversight Board(United States), the consolidated balance sheets of Herbalife Ltd. and subsidiaries as of December 31, 2005 and2004, and the related consolidated statements of operations, changes in shareholders’ equity and comprehensiveincome (loss), and cash flows for each of the years in the three-year period ended December 31, 2005, and our reportdated February 28, 2006, expressed an unqualified opinion on those consolidated financial statements.
/s/ KPMG LLP
Los Angeles, CaliforniaFebruary 28, 2006
71
%%TRANSMSG*** Transmitting Job: V16934 PCN: 072000000 ***%%PCMSG|71 |00014|Yes|No|03/16/2006 21:00|0|0|Page is valid, no graphics -- Color: D|

Item 9B. OTHER INFORMATION
For shareholder proposals to be included in the Company’s proxy statement and form of proxy for the 2006annual meeting pursuant to Rule 14a-8(e) of the Exchange Act, or to be presented at the meeting but not included inthe proxy statement and form of proxy, proper notice must be received by the Company’s Secretary no later thanMarch 3, 2006. For notice to be proper, it must set forth: (i) the name and address of the shareholder who intends tomake the proposal as it appears in the Company’s records, (ii) the class and number of Common Shares of theCompany that are owned by the shareholder submitting the proposal and (iii) a clear and concise statement of theproposal and the shareholder’s reasons for supporting it. Notices should be addressed to Corporate Secretary,Herbalife Ltd., c/o Herbalife International, Inc., 1800 Century Park East, Los Angeles, CA 90067.
72
%%TRANSMSG*** Transmitting Job: V16934 PCN: 073000000 ***%%PCMSG|72 |00022|Yes|No|03/16/2006 21:00|0|0|Page is valid, no graphics -- Color: D|

PART III.
Item 10. DIRECTORS AND EXECUTIVE OFFICERS OF THE REGISTRANT
The information required under this Item is incorporated herein by reference to our definitive proxy statementto be filed with the Commission no later than 120 days after the close of our fiscal year ended December 31, 2005,except that the information required with respect to the executive officers of the registrant is set forth under Item 1 —Business, of this Annual Report on Form 10-K, and is incorporated herein by reference.
Item 11. EXECUTIVE COMPENSATION
The information required under this Item is incorporated herein by reference to our definitive proxy statementto be filed with the Commission no later than 120 days after the close of our fiscal year ended December 31, 2005.
Item 12. SECURITY OWNERSHIP OF CERTAIN BENEFICIAL OWNERS AND MANAGEMENT
The information required under this Item is incorporated herein by reference to our definitive proxy statementto be filed with the Commission no later than 120 days after the close of our fiscal year ended December 31, 2005,except that the information required with respect to the Company’s equity compensation plans is set forth underItem 5 — Market for Registrant’s Common Equity, Related Stockholder Matters and Issuer Purchases of EquitySecurities of this Annual Report on Form 10-K, and is incorporated herein by reference..
Item 13. CERTAIN RELATIONSHIPS AND RELATED TRANSACTIONS
The information required under this Item is incorporated herein by reference to our definitive proxy statementto be filed with the Commission no later than 120 days after the close of our fiscal year ended December 31, 2005.
Item 14. PRINCIPAL ACCOUNTING FEES AND SERVICES
The information required under this Item is incorporated herein by reference to our definitive proxy statementto be filed with the Commission no later than 120 days after the close of our fiscal year ended December 31, 2005.
PART IV
Item 15. EXHIBITS AND FINANCIAL STATEMENT SCHEDULES
The following documents are filed as part of this Annual Report on Form 10-K, or incorporated herein byreference:
1. Financial Statements. The following financial statements of Herbalife Ltd. are filed as part of thisAnnual Report on Form 10-K on the pages indicated:
Page No.
HERBALIFE LTD. AND SUBSIDIARIESReport of Independent Registered Public Accounting Firm . . . . . . . . . . . . . . . . . . . . . . . . . . . . . . . . 78
Consolidated Balance Sheets as of December 31, 2004 and 2005 . . . . . . . . . . . . . . . . . . . . . . . . . . . 79
Consolidated Statements of Operations for the years ended December 31, 2003, 2004 and 2005 . . . . 80
Consolidated Statements of Changes in Shareholders’ Equity and Comprehensive Income (Loss) forthe years ended December 31, 2003, 2004 and 2005 . . . . . . . . . . . . . . . . . . . . . . . . . . . . . . . . . . . 81
Consolidated Statements of Cash Flows for the years ended December 31, 2003, 2004 and 2005 . . . . 82
Notes to Consolidated Financial Statements . . . . . . . . . . . . . . . . . . . . . . . . . . . . . . . . . . . . . . . . . . . 83
2. Financial Statement Schedules. Schedules are omitted because the required information is inap-plicable or the information is presented in the consolidated financial statements or related notes.
3. Exhibits. The exhibits listed in the Exhibit Index immediately below are filed as part of this AnnualReport on Form 10-K, or are incorporated by reference herein.
73
%%TRANSMSG*** Transmitting Job: V16934 PCN: 074000000 ***%%PCMSG|73 |00019|Yes|No|03/16/2006 21:11|0|0|Page is valid, no graphics -- Color: D|

EXHIBIT INDEX
ExhibitNumber Description Reference
2.1 Agreement and Plan of Merger, dated April 10, 2002, by and among HerbalifeInternational, Inc., WH Holdings (Cayman Islands) Ltd. and WH Acquisition Corp.
(a)
3.1 Form of Amended and Restated Memorandum and Articles of Association of Herbalife Ltd. (d)4.1 Indenture, dated as of June 27, 2002 between WH Acquisition Corp., WH Intermediate
Holdings Ltd., WH Luxembourg Holdings SàRL, WH Luxembourg Intermediate HoldingsSàRL, WH Luxembourg CM SàRL and The Bank of New York as Trustee governing113⁄4% Senior Subordinated Notes due 2010
(a)
4.2 Indenture, dated as of March 8, 2004 between WH Holdings (Cayman Islands) Ltd., WHCapital Corporation and The Bank of New York as trustee governing 91⁄2% Notes due 2011
(a)
4.3 Form of Share Certificate (d)9.1 Shareholders’ Agreement dated as of July 31, 2002, by and among WH Holdings (Cayman
Islands) Ltd., Whitney V, L.P., Whitney Strategic Partners V, L.P., WH Investments Ltd., CCGInvestments (BVI), L.P., CCG Associates-QP, LLC, CCG Associates-AI, LLC, CCGInvestment Fund-AI, L.P., CCG AV, LLC-Series C, CCG AV, LLC-Series E, and certainother persons
(a)
9.2 Voting Agreement, dated as of December 31, 2004 by and among Whitney V, L.P., WhitneyStrategic Partners V, L.P., Whitney Private Debt Fund, L.P. and Green River OffshoreFund, Ltd., on the one hand, and CCG Investments (BVI), L.P., CCG Associates-QP, LLC,CCG Associates-AI, LLC,, CCG Investment Fund-AI, LP, CCG AV, LLC-Series C, CCG AV,LLC-Series E and CCG CI, LLC on the other hand
(f)
10.1 Form of Indemnity Agreement between Herbalife International Inc. and certain officers anddirectors of Herbalife International Inc.
(a)
10.2 Office lease agreement between Herbalife International of America Inc. and State Teacher’sRetirement System, dated July 11, 1995
(a)
10.3# Herbalife International of America, Inc.’s Senior Executive Deferred Compensation Plan,effective January 1, 1996, as amended
(a)
10.4# Herbalife International of America, Inc.’s Management Deferred Compensation Plan, effectiveJanuary 1, 1996, as amended
(a)
10.5 Master Trust Agreement between Herbalife International of America, Inc. and Imperial TrustCompany, Inc., effective January 1, 1996
(a)
10.6# Herbalife International Inc. 401K Profit Sharing Plan and Trust, as amended (a)10.7 Trust Agreement for Herbalife 2001 Executive Retention Plan, effective March 15, 2001 (a)10.8# Herbalife 2001 Executive Retention Plan, effective March 15, 2001 (a)10.9# Separation Agreement and General Release, dated as of May 17, 2002, between Robert
Sandler and Herbalife International, Inc. and Herbalife International of America, Inc. andClarification
(a)
10.10 Agreement for Retention of Legal Services, dated as of May 20, 2002, by and among HerbalifeInternational, Inc., Herbalife International of America, Inc. and Robert A. Sandler
(a)
10.11 Purchase Agreement, dated as of June 21, 2002, by and among WH Acquisition Corp.,Herbalife International, Inc., WH Intermediate Holdings Ltd., WH Luxembourg HoldingsSàRL, WH Luxembourg Intermediate Holdings SàRL, WH Luxembourg CM SàRL and UBSWarburg LLC
(a)
10.12 Registration Rights Agreement, dated as of June 27, 2002, by and among WH AcquisitionCorp., WH Intermediate Holdings Ltd., WH Luxembourg Holdings SàRL, WH LuxembourgIntermediate Holdings SàRL, WH Luxembourg CM SàRL and UBS Warburg LLC
(a)
10.13 Notice to Distributors regarding Amendment to Agreements of Distributorship, dated as ofJuly 18, 2002 between Herbalife International, Inc. and each Herbalife Distributor
(a)
10.14 Indemnity Agreement dated as of July 31, 2002, by and among WH Holdings (CaymanIslands) Ltd., WH Acquisition Corp., Whitney & Co., LLC, Whitney V, L.P., WhitneyStrategic Partners V, L.P., GGC Administration, L.L.C., Golden Gate Private Equity, Inc.,CCG Investments (BVI), L.P., CCG Associates-AI, LLC, CCG Investment Fund-AI, LP, CCGAV, LLC-Series C, CCG AV, LLC-Series C, CCG AV, LLC-Series E, CCG Associates-QP,LLC and WH Investments Ltd.
(a)
74
%%TRANSMSG*** Transmitting Job: V16934 PCN: 075000000 ***%%PCMSG|74 |00016|Yes|No|03/16/2006 21:00|0|0|Page is valid, no graphics -- Color: D|

ExhibitNumber Description Reference
10.15# Independent Director’s Stock Option Plan of WH Holdings (Cayman Islands) Ltd. (a)10.16# Employment Agreement, dated as of March 10, 2003 between Brian Kane and Herbalife
International, Inc. and Herbalife International of America, Inc.(a)
10.17# Employment Agreement dated as of March 10, 2003 between Carol Hannah and HerbalifeInternational, Inc. and Herbalife International of America, Inc.
(a)
10.18# Non-Statutory Stock Option Agreement, dated as of March 10, 2003 between WH Holdings(Cayman Islands) Ltd. and Brian Kane
(a)
10.19# Non-Statutory Stock Option Agreement, dated as of March 10, 2003 between WH Holdings(Cayman Islands) Ltd. and Carol Hannah
(a)
10.20# WH Holdings (Cayman Islands) Ltd. Stock Incentive Plan, as restated, dated as of November 5,2003
(a)
10.21# Side Letter Agreement dated as of March 10, 2003 by and among WH Holdings (CaymanIslands) Ltd., Brian Kane and Carol Hannah and the Shareholders listed therein
(a)
10.22# Employment Agreement dated as of April 3, 2003 between Michael O. Johnson and HerbalifeInternational, Inc. and Herbalife International of America, Inc.
(a)
10.23# Non-Statutory Stock Option Agreement, dated as of April 3, 2003 between WH Holdings(Cayman Islands) Ltd. and Michael O. Johnson
(a)
10.24# Side Letter Agreement dated as of April 3, 2003 by and among WH Holdings (CaymanIslands) Ltd., Michael O. Johnson and the Shareholders listed therein
(a)
10.25# Employment Agreement dated as of July 14, 2003 between Matt Wisk and HerbalifeInternational of America, Inc.
(a)
10.26# Employment Agreement dated as of July 31, 2003 between Gregory L. Probert and HerbalifeInternational of America, Inc.
(a)
10.27# Employment Agreement dated October 6, 2003 between Brett R. Chapman and HerbalifeInternational of America, Inc.
(a)
10.28# Form of Non-Statutory Stock Option Agreement (Non-Executive Agreement) (a)10.29# Form of Non-Statutory Stock Option Agreement (Executive Agreement) (a)10.30 Registration Rights Agreement, dated as of March 8, 2004, by and among WH Holdings
(Cayman Islands) Ltd., WH Capital Corporation and UBS Securities, LLC(a)
10.31 Indemnity Agreement, dated as of February 9, 2004, among WH Capital Corporation andGregory Probert
(a)
10.32 Indemnity Agreement, dated as of February 9, 2004, among WH Capital Corporation and BrettR. Chapman
(a)
10.33 Stock Subscription Agreement of WH Capital Corporation, dated as of February 9, 2004,between WH Capital Corporation and WH Holdings (Cayman Islands) Ltd.
(a)
10.34 First Amendment to Amended and Restated WH Holdings (Cayman Islands) Ltd. StockIncentive Plan, dated November 5, 2003
(a)
10.35# Separation Agreement and General Release dated May 1, 2004, among HerbalifeInternational, Inc., Herbalife International of America, Inc. and Carol Hannah
(a)
10.36# Consulting Agreement dated May 1, 2004 among Herbalife International of America, Inc. andCarol Hannah
(a)
10.37# Employment Agreement dated June 1, 2004 among Herbalife International of America, Inc.and Richard Goudis
(a)
10.38 Purchase Agreement, dated March 3, 2004, by and among WH Holdings (Cayman Islands)Ltd., WH Capital Corporation and UBS Securities LLC
(a)
10.39 Registration Rights Agreement, dated as of July 31, 2002, by and among WH Holdings(Cayman Islands) Ltd., Whitney V, L.P., Whitney Strategic Partners V, L.P., WH InvestmentsLtd., CCG Investments (BVI), L.P., CCG Associates-QP, LLC, CCG Associates-AI, LLC,CCG Investment Fund-AI, L.P., CCG AV, LLC-Series C and CCG AV, LLC-Series E.
(b)
10.40 Share Purchase Agreement, dated as of July 31, 2002, by and among WH Holdings (CaymanIslands) Ltd., Whitney Strategic Partners V, L.P., WH Investments Ltd., Whitney V, L.P., CCGInvestments (BVI), L.P., CCG Associates-QP, LLC, CCG Associates-AI, LLC, CCGInvestment Fund-AI, LP, CCG AV, LLC-Series C and CCG AV, LLC-Series E.
(b)
75
%%TRANSMSG*** Transmitting Job: V16934 PCN: 076000000 ***%%PCMSG|75 |00018|Yes|No|03/16/2006 21:00|0|0|Page is valid, no graphics -- Color: D|

ExhibitNumber Description Reference
10.41 Form of Indemnification Agreement between Herbalife Ltd. and the directors and certainofficers of Herbalife Ltd.
(c)
10.42# Herbalife Ltd. 2004 Stock Incentive Plan, effective December 1, 2004 (c)10.43 Termination Agreement, dated as of December 1, 2004, between Herbalife Ltd., Herbalife
International, Inc. and Whitney & Co., LLC.(d)
10.44 Termination Agreement, dated as of December 1, 2004, between Herbalife Ltd., HerbalifeInternational Inc. and GGC Administration, L.L.C.
(d)
10.45 Termination Agreement, dated as of December 13, 2004, by and among Herbalife Ltd.,Whitney V, L.P., Whitney Strategic Partners V, L.P., CCG Investments (BVI), L.P., CCGAssociates-QP, LLC, CCG Associates-AI, LLC, CCG Investment Fund-AI, LP, CCG AV,LLC-Series C, CCG AV, LLC-Series E and CCG CI, LLC.
(d)
10.46 Indemnification Agreement, dated as of December 13, 2004, by and among Herbalife Ltd.,Herbalife International, Inc., Whitney V, L.P., Whitney Strategic Partners V, L.P., CCGInvestments (BVI), L.P., CCG Associates-QP, LLC, CCG Associates-AI, LLC, CCGInvestment Fund-AI, LP, CCG AV, LLC-Series C, CCG AV, LLC-Series E, CCG CI, LLCand GGC Administration, LLC.
(d)
10.47# Amendment No. 1 to Herbalife Ltd. 2004 Stock Incentive Plan (e)10.48# Form of Stock Bonus Award Agreement (e)10.49# Contract for Services of a Consultant between Herbalife International Luxembourg S.á.R.L.
and Brian Kane dated as of October 18, 2004(f)
10.50# Compromise Agreement between Herbalife International Luxembourg S.á.R.L. and BrianKane dated as of October 18, 2004
(f)
10.51 Credit Agreement, dated as of December 21, 2004, by and among Herbalife International Inc.,Herbalife Ltd., WH Intermediate Holdings Ltd., HBL Ltd., WH Luxembourg HoldingsS.á.R.L., HLF Luxembourg Holdings, S.á.R.L., WH Capital Corporation, WHLuxembourg Intermediate Holdings S.á.R.L. and the Subsidiary Guarantors party hereto,and certain lenders and agents named therein.
(g)
10.52 Security Agreement, dated as of December 21, 2004, by and among Herbalife International,Inc., Herbalife Ltd., WH Intermediate Holdings Ltd., HBL Ltd., WH Luxembourg HoldingsS.á.R.L., HLF Luxembourg Holdings, S.á.R.L., WH Capital Corporation, WH LuxembourgIntermediate Holdings S.á.R.L., and the Subsidiary Guarantors party thereto in favor ofMorgan Stanley & Co. Incorporated, as Collateral Agent.
(g)
10.53 First Amendment to Credit Agreement, dated as of April 12, 2005, by and among HerbalifeInternational Inc., Herbalife Ltd., WH Intermediate Holdings Ltd., HBL Ltd., WHLuxembourg Holdings S.á.R.L., HLF Luxembourg Holdings, S.á.R.L., WH CapitalCorporation, WH Luxembourg Intermediate Holdings S.á.R.L. and the SubsidiaryGuarantors party thereto, and certain lenders and agents named therein.
(g)
10.54# Employment Agreement Effective as of January 1, 2005 between Herbalife Ltd. and HenryBurdick
(h)
10.55# Form of 2004 Herbalife Ltd. 2004 Stock Incentive Plan Stock Option Agreement (i)10.56# Form of 2004 Herbalife Ltd. 2004 Stock Incentive Plan Non-Employee Director Stock Option
Agreement(i)
10.57 Second Amendment to Credit Agreement, dated as of August 19, 2005, by and amongHerbalife International, Inc., Herbalife Ltd., WH Intermediate Holdings Ltd., HBL Ltd., WHLuxembourg Holdings S.á.R.L., HLF Luxembourg Holdings, S.á.R.L., WH CapitalCorporation, WH Luxembourg Intermediate Holdings S.á.R.L. and the SubsidiaryGuarantors party thereto, and certain lenders and agents named therein.
(k)
10.58 Service Agreement by and between Herbalife Europe Limited and Wynne Roberts ESQ, datedas of September 6, 2005.
(l)
10.59# Amendment to employment agreement between Michael O. Johnson and HerbalifeInternational, Inc. and Herbalife International of America, Inc., dated May 15, 2005.
(m)
10.60# Independent Directors Deferred Compensation and Stock Unit Plan *10.61# Independent Directors Stock Unit Award Agreement *21.1 Subsidiaries of the Registrant *
76
%%TRANSMSG*** Transmitting Job: V16934 PCN: 077000000 ***%%PCMSG|76 |00020|Yes|No|03/16/2006 21:00|0|0|Page is valid, no graphics -- Color: D|

ExhibitNumber Description Reference
23.1 Consent of Independent Registered Public Accounting Firm *31.1 Rule 13a-14(a) Certification of Chief Executive Officer *31.2 Rule 13a-14(a) Certification of Chief Financial Officer *32.1 Section 1350 Certification of Chief Executive Officer *32.2 Section 1350 Certification of Chief Financial Officer *99.1 Disposition Agreement dated as of December 13, 2004 is by and among Whitney V, L.P., a
Delaware limited partnership, Whitney Strategic Partners V, L.P., a Delaware limitedpartnership, Whitney Private Debt Fund, L.P., a Delaware limited partnership and GreenRiver Offshore Fund, Ltd., a Cayman Islands company on the one hand, and CCG Investments(BVI), L.P., a British Virgin Islands limited partnership, CCG Associates-QP, LLC, a Delawarelimited liability company, CCG Associates-AI, LLC, a Delaware limited liability company,CCG Investment Fund-AI, LP, a Delaware limited partnership, CCG AV, LLC-Series C, aDelaware limited liability company, CCG AV, LLC-Series E, a Delaware limited liabilitycompany and CCG CI, LLC a Delaware limited liability company on the other hand.
(d)
* Filed herewith.
# Management contract or compensatory plan or arrangement.
(a) Previously filed on October 1, 2004 as an Exhibit to the Company’s registration statement on Form S-1 (FileNo. 333-119485) and is incorporated herein by reference.
(b) Previously filed on November 9, 2004 as an Exhibit to Amendment No. 2 to the Company’s registrationstatement on Form S-1 (File No. 333-119485) and is incorporated herein by reference.
(c) Previously filed on December 2, 2004 as an Exhibit to Amendment No. 4 to the Company’s registrationstatement on Form S-1 (File No. 333-119485) and is incorporated herein by reference.
(d) Previously filed on December 14, 2004 as an Exhibit to Amendment No. 5 to the Company’s registrationstatement on Form S-1 (File No. 333-119485) and is incorporated herein by reference.
(e) Previously filed on February 17, 2005 as an Exhibit to the Company’s registration statement on Form S-8 (FileNo. 333-122871) and is incorporated herein by reference.
(f) Previously filed on March 14, 2005 as an Exhibit to the Company’s Annual Report on Form 10-K for the yearended December 31, 2004 and is incorporated herein by reference.
(g) Previously filed on May 9, 2005 as an Exhibit to the Company’s Quarterly Report on Form 10-Q for the quarterended March 31, 2005 and is incorporated herein by reference.
(h) Previously filed on May 13, 2005 as an Exhibit to the Company’s Current Report on Form 8-K and isincorporated herein by reference.
(i) Previously filed on June 14, 2005 as an Exhibit to the Company’s Current Report on Form 8-K and isincorporated herein by reference.
(k) Previously filed on August 23, 2005 as an Exhibit to the Company’s Current Report on Form 8-K and isincorporated herein by reference.
(l) Previously filed on September 23, 2005 as an Exhibit to the Company’s Current Report on Form 8-K and isincorporated herein by reference.
(m) Previously filed on August 3, 2005 as an Exhibit to the Company’s current Report on Form 10Q for the quarterended June 30, 2005 and is incorporated herein by reference.
77
%%TRANSMSG*** Transmitting Job: V16934 PCN: 078000000 ***%%PCMSG|77 |00019|Yes|No|03/16/2006 21:00|0|0|Page is valid, no graphics -- Color: D|

REPORT OF INDEPENDENT REGISTERED PUBLIC ACCOUNTING FIRM
To the Board of Directors of Herbalife Ltd.:
We have audited the accompanying consolidated balance sheets of Herbalife Ltd. (formerly WH Holdings(Cayman Islands) Ltd.) and subsidiaries as of December 31, 2005 and 2004, and the related consolidated statementsof operations, changes in shareholders’ equity and comprehensive income (loss), and cash flows for each of theyears in the three-year period ended December 31, 2005. These consolidated financial statements are theresponsibility of the Company’s management. Our responsibility is to express an opinion on these consolidatedfinancial statements based on our audit.
We conducted our audits in accordance with the standards of the Public Company Accounting Oversight Board(United States). Those standards require that we plan and perform the audit to obtain reasonable assurance aboutwhether the financial statements are free of material misstatement. An audit includes examining, on a test basis,evidence supporting the amounts and disclosures in the financial statements. An audit also includes assessing theaccounting principles used and significant estimates made by management, as well as evaluating the overallfinancial statement presentation. We believe that our audits provide a reasonable basis for our opinion.
In our opinion, the consolidated financial statements referred to above present fairly, in all material respects,the financial position of Herbalife Ltd. and subsidiaries as of December 31, 2005 and 2004, and the results of theiroperations and their cash flows for each of the years in the three-year period ended December 31, 2005, inconformity with U.S. generally accepted accounting principles.
We also have audited, in accordance with the standards of the Public Company Accounting Oversight Board(United States), the effectiveness of Herbalife Ltd.’s internal control over financial reporting as of December 31,2005, based on criteria established in Internal Control — Integrated Framework issued by the Committee ofSponsoring Organizations of the Treadway Commission (COSO), and our report dated February 28, 2006 expressedan unqualified opinion on management’s assessment of, and the effective operation of, internal control overfinancial reporting.
/s/ KPMG LLP
Los Angeles, CaliforniaFebruary 28, 2006
78
%%TRANSMSG*** Transmitting Job: V16934 PCN: 079000000 ***%%PCMSG|78 |00023|Yes|No|03/16/2006 21:00|0|0|Page is valid, no graphics -- Color: D|

HERBALIFE LTD.(FORMERLY WH HOLDINGS (CAYMAN ISLANDS) LTD.)
CONSOLIDATED BALANCE SHEETS
2004 2005December 31,
(In thousands, exceptshare amounts)
ASSETSCURRENT ASSETS:Cash and cash equivalents . . . . . . . . . . . . . . . . . . . . . . . . . . . . . . . . . . . . . . . . . . . . . . . . $201,577 $ 88,248Receivables, net of allowance for doubtful accounts of $4,815 (2004) and $4,678 (2005) . . . 29,546 37,266Inventories . . . . . . . . . . . . . . . . . . . . . . . . . . . . . . . . . . . . . . . . . . . . . . . . . . . . . . . . . . . 71,092 109,785Prepaid expenses and other current assets . . . . . . . . . . . . . . . . . . . . . . . . . . . . . . . . . . . . . 45,914 40,667Deferred income taxes . . . . . . . . . . . . . . . . . . . . . . . . . . . . . . . . . . . . . . . . . . . . . . . . . . . 21,784 23,585
Total current assets . . . . . . . . . . . . . . . . . . . . . . . . . . . . . . . . . . . . . . . . . . . . . . . . . . . 369,913 299,551Property — at cost:Furniture and fixtures . . . . . . . . . . . . . . . . . . . . . . . . . . . . . . . . . . . . . . . . . . . . . . . . . . . 6,743 5,895Equipment . . . . . . . . . . . . . . . . . . . . . . . . . . . . . . . . . . . . . . . . . . . . . . . . . . . . . . . . . . . 58,726 78,324Leasehold improvements . . . . . . . . . . . . . . . . . . . . . . . . . . . . . . . . . . . . . . . . . . . . . . . . . 10,384 11,546
75,853 95,765Less: accumulated depreciation and amortization . . . . . . . . . . . . . . . . . . . . . . . . . . . . . . . . (20,463) (30,819)Net property . . . . . . . . . . . . . . . . . . . . . . . . . . . . . . . . . . . . . . . . . . . . . . . . . . . . . . . . . . 55,390 64,946Deferred compensation plan assets . . . . . . . . . . . . . . . . . . . . . . . . . . . . . . . . . . . . . . . . . . 12,052 13,149Other assets . . . . . . . . . . . . . . . . . . . . . . . . . . . . . . . . . . . . . . . . . . . . . . . . . . . . . . . . . . 7,957 7,510Deferred financing costs, net of accumulated amortization of $17,081 (2004) and $20,598
(2005) . . . . . . . . . . . . . . . . . . . . . . . . . . . . . . . . . . . . . . . . . . . . . . . . . . . . . . . . . . . . . 6,860 3,531Marketing related intangibles . . . . . . . . . . . . . . . . . . . . . . . . . . . . . . . . . . . . . . . . . . . . . . 310,000 310,000Distributor network, net of accumulated amortization of $45,272 (2004) and $56,200
(2005) . . . . . . . . . . . . . . . . . . . . . . . . . . . . . . . . . . . . . . . . . . . . . . . . . . . . . . . . . . . . . 10,928 —Product certifications, product formulas and other intangible assets, net of accumulated
amortization of $14,692 (2004) and $17,792 (2005) . . . . . . . . . . . . . . . . . . . . . . . . . . . . 8,084 4,908Goodwill . . . . . . . . . . . . . . . . . . . . . . . . . . . . . . . . . . . . . . . . . . . . . . . . . . . . . . . . . . . . 167,517 134,206
$948,701 $837,801
LIABILITIES AND SHAREHOLDERS’ EQUITYCURRENT LIABILITIES:Accounts payable . . . . . . . . . . . . . . . . . . . . . . . . . . . . . . . . . . . . . . . . . . . . . . . . . . . . . . $ 24,457 $ 39,156Royalty overrides . . . . . . . . . . . . . . . . . . . . . . . . . . . . . . . . . . . . . . . . . . . . . . . . . . . . . . 85,304 87,401Accrued compensation . . . . . . . . . . . . . . . . . . . . . . . . . . . . . . . . . . . . . . . . . . . . . . . . . . . 27,016 32,570Accrued expenses . . . . . . . . . . . . . . . . . . . . . . . . . . . . . . . . . . . . . . . . . . . . . . . . . . . . . . 87,227 93,597Current portion of long term debt . . . . . . . . . . . . . . . . . . . . . . . . . . . . . . . . . . . . . . . . . . . 120,291 9,816Advance sales deposits . . . . . . . . . . . . . . . . . . . . . . . . . . . . . . . . . . . . . . . . . . . . . . . . . . 9,490 10,874Income taxes payable. . . . . . . . . . . . . . . . . . . . . . . . . . . . . . . . . . . . . . . . . . . . . . . . . . . . 17,684 12,043
Total current liabilities . . . . . . . . . . . . . . . . . . . . . . . . . . . . . . . . . . . . . . . . . . . . . . . . . 371,469 285,457NON-CURRENT LIABILITIES:Long-term debt, net of current portion . . . . . . . . . . . . . . . . . . . . . . . . . . . . . . . . . . . . . . . 365,926 253,276Deferred compensation liability . . . . . . . . . . . . . . . . . . . . . . . . . . . . . . . . . . . . . . . . . . . . 13,882 15,145Deferred income taxes . . . . . . . . . . . . . . . . . . . . . . . . . . . . . . . . . . . . . . . . . . . . . . . . . . . 130,346 112,714Other non-current liabilities . . . . . . . . . . . . . . . . . . . . . . . . . . . . . . . . . . . . . . . . . . . . . . . 2,736 2,321
Total liabilities . . . . . . . . . . . . . . . . . . . . . . . . . . . . . . . . . . . . . . . . . . . . . . . . . . . . . . . 884,359 668,913CONTINGENCIESSHAREHOLDERS’ EQUITY:Preference shares, $0.002 par value 7.5 million shares authorized and unissued . . . . . . . . . . — —Common shares, $0.002 par value, 175.0 million shares authorized, 68.6 million (2004) and
69.9 million (2005) shares issued and outstanding . . . . . . . . . . . . . . . . . . . . . . . . . . . . . 137 140Treasury shares, at cost . . . . . . . . . . . . . . . . . . . . . . . . . . . . . . . . . . . . . . . . . . . . . . . . . . — (210)Paid-in capital in excess of par value . . . . . . . . . . . . . . . . . . . . . . . . . . . . . . . . . . . . . . . . 74,593 89,524Accumulated other comprehensive income . . . . . . . . . . . . . . . . . . . . . . . . . . . . . . . . . . . . 3,923 605Retained earnings (accumulated deficit) . . . . . . . . . . . . . . . . . . . . . . . . . . . . . . . . . . . . . . (14,311) 78,829
Total shareholders’ equity . . . . . . . . . . . . . . . . . . . . . . . . . . . . . . . . . . . . . . . . . . . . . . . 64,342 168,888$948,701 $837,801
See the accompanying Notes to Consolidated Financial Statements
79
%%TRANSMSG*** Transmitting Job: V16934 PCN: 080000000 ***%%PCMSG|79 |00024|Yes|No|03/16/2006 21:00|0|0|Page is valid, no graphics -- Color: D|

HERBALIFE LTD.(FORMERLY WH HOLDINGS (CAYMAN ISLANDS) LTD.)
CONSOLIDATED STATEMENTS OF OPERATIONS
2003 2004 2005Year Ended December 31,
(In thousands, except per share amounts)
Product sales . . . . . . . . . . . . . . . . . . . . . . . . . . . . . . . . . . . . . . . . . $ 995,120 $1,125,045 $1,350,275
Handling & freight income . . . . . . . . . . . . . . . . . . . . . . . . . . . . . . . 164,313 184,618 216,475
Net sales . . . . . . . . . . . . . . . . . . . . . . . . . . . . . . . . . . . . . . . . . . . . 1,159,433 1,309,663 1,566,750
Cost of sales . . . . . . . . . . . . . . . . . . . . . . . . . . . . . . . . . . . . . . . . . 235,785 269,913 315,746
Gross profit . . . . . . . . . . . . . . . . . . . . . . . . . . . . . . . . . . . . . . . . . . 923,648 1,039,750 1,251,004
Royalty overrides . . . . . . . . . . . . . . . . . . . . . . . . . . . . . . . . . . . . . . 415,351 464,892 555,665
Selling, general & administrative expenses, including, $8.4 million(2003), $9.3 million (2004) and $5.7 million (2005) of relatedparty expenses . . . . . . . . . . . . . . . . . . . . . . . . . . . . . . . . . . . . . . 401,261 436,139 476,268
Operating income . . . . . . . . . . . . . . . . . . . . . . . . . . . . . . . . . . . . . . 107,036 138,719 219,071
Interest expense, net . . . . . . . . . . . . . . . . . . . . . . . . . . . . . . . . . . . . 41,468 123,305 43,924
Income before income taxes . . . . . . . . . . . . . . . . . . . . . . . . . . . . . . 65,568 15,414 175,147
Income taxes . . . . . . . . . . . . . . . . . . . . . . . . . . . . . . . . . . . . . . . . . 28,721 29,725 82,007
NET INCOME (LOSS). . . . . . . . . . . . . . . . . . . . . . . . . . . . . . . . . . $ 36,847 $ (14,311) $ 93,140
Earnings (loss) per share
Basic . . . . . . . . . . . . . . . . . . . . . . . . . . . . . . . . . . . . . . . . . . . . . $ — $ (0.27) $ 1.35
Diluted . . . . . . . . . . . . . . . . . . . . . . . . . . . . . . . . . . . . . . . . . . . . $ 0.69 $ (0.27) $ 1.28
Weighted average shares outstanding
Basic . . . . . . . . . . . . . . . . . . . . . . . . . . . . . . . . . . . . . . . . . . . . . — 52,911 68,972
Diluted . . . . . . . . . . . . . . . . . . . . . . . . . . . . . . . . . . . . . . . . . . . . 53,446 52,911 72,491
See the accompanying Notes to Consolidated Financial Statements.
80
%%TRANSMSG*** Transmitting Job: V16934 PCN: 081000000 ***%%PCMSG|80 |00018|Yes|No|03/16/2006 21:00|0|0|Page is valid, no graphics -- Color: D|

HERBALIFE LTD.(FORMERLY WH HOLDINGS (CAYMAN ISLANDS) LTD.)
CONSOLIDATED STATEMENTS OF CHANGES IN SHAREHOLDERS’ EQUITY ANDCOMPREHENSIVE INCOME (LOSS)
PreferredShares
CommonShares
TreasuryShares
Paid inCapital inExcess ofPar Value
AccumulatedOther
ComprehensiveIncome (Loss)
RetainedEarnings
(AccumulatedDeficit)
TotalShareholders’
EquityComprehensiveIncome (Loss)
(In thousands)
Balance at December 31, 2002 . . . . . . . $ 100 $ 177,308 $ (139) $ 14,005 $ 191,274Issuance of 2.0 million Preferred
Shares . . . . . . . . . . . . . . . . . . . . . 2 4,204 4,206Additional capital from stock options . . . 1,895 1,895Net income . . . . . . . . . . . . . . . . . . . . 36,847 36,847 $ 36,847Foreign currency translation
adjustment . . . . . . . . . . . . . . . . . . 4,517 4,517 4,517Unrealized loss on marketable
securities . . . . . . . . . . . . . . . . . . . (4) (4) (4)Unrealized loss on derivatives. . . . . . . . (464) (464) (464)Reclassification adjustments for loss on
derivative instruments . . . . . . . . . . . (483) (483) (483)
Total comprehensive income . . . . . . . . $ 40,413
Balance at December 31, 2003 . . . . . . . $ 102 $ 183,407 $ 3,427 $ 50,852 $ 237,788Conversion of 102.0 million preferred
shares including cumulative dividends of$38.5 million and issuance of52.0 million common shares . . . . . . . . (102) 104 (170,765) (50,852) (221,615)
Issuance of 0.9 million common sharesfrom the exercise of stock options . . . 2 1,831 1,833
Tax benefit from exercise of stockoptions . . . . . . . . . . . . . . . . . . . . . 1,179 1,179
Additional capital from stock options . . . 2,036 2,036Issuance of 15.7 million common shares
from the IPO . . . . . . . . . . . . . . . . . 31 200,065 200,096Issuance of warrants . . . . . . . . . . . . . . 2,878 2,878Dividends paid . . . . . . . . . . . . . . . . . (146,038) (146,038)Net loss . . . . . . . . . . . . . . . . . . . . . . (14,311) (14,311) $(14,311)Foreign currency translation
adjustment . . . . . . . . . . . . . . . . . . (538) (538) (538)Unrealized gain on derivatives . . . . . . . 2,798 2,798 2,798Reclassification adjustments for loss on
derivative instruments . . . . . . . . . . . (1,764) (1,764) (1,764)
Total comprehensive loss . . . . . . . . . . . $(13,815)
Balance at December 31, 2004 . . . . . . . $ — $137 $ 74,593 $ 3,923 $(14,311) $ 64,342Issuance of 1.2 million common shares
from the exercise of stock options . . . 3 2,128 2,131Tax benefit from exercise of stock
options . . . . . . . . . . . . . . . . . . . . . 9,675 9,675Additional capital from stock options . . . 3,045 3,045Treasury shares purchased . . . . . . . . . . (210) (210)Other . . . . . . . . . . . . . . . . . . . . . . . . 83 42 125Net income . . . . . . . . . . . . . . . . . . . . 93,140 93,140 $ 93,140Foreign currency translation
adjustment . . . . . . . . . . . . . . . . . . (3,699) (3,699) (3,699)Unrealized gain on derivatives . . . . . . . 339 339 339
Total comprehensive income . . . . . . . . $ 89,780
Balance at December 31, 2005 . . . . . . . $ — $140 $(210) $ 89,524 $ 605 $ 78,829 $ 168,888
See the accompanying Notes to Consolidated Financial Statements.
81
%%TRANSMSG*** Transmitting Job: V16934 PCN: 082000000 ***%%PCMSG|81 |00023|Yes|No|03/16/2006 21:00|0|0|Page is valid, no graphics -- Color: D|

HERBALIFE LTD.(FORMERLY WH HOLDINGS (CAYMAN ISLANDS) LTD.)
CONSOLIDATED STATEMENTS OF CASH FLOWS
2003 2004 2005Year Ended December 31,
(In thousands)
CASH FLOWS FROM OPERATING ACTIVITIESNet income (loss) . . . . . . . . . . . . . . . . . . . . . . . . . . . . . . . . . . . . . . . . . . . . . . . . . . . . . . $ 36,847 $ (14,311) $ 93,140Adjustments to reconcile net income (loss) to net cash provided by operating activities:Depreciation and amortization . . . . . . . . . . . . . . . . . . . . . . . . . . . . . . . . . . . . . . . . . . . . . . 55,605 43,896 35,436Amortization of discount and deferred financing costs . . . . . . . . . . . . . . . . . . . . . . . . . . . . . . 7,039 6,856 1,397Deferred income taxes . . . . . . . . . . . . . . . . . . . . . . . . . . . . . . . . . . . . . . . . . . . . . . . . . . . (12,160) 3,618 (12,455)Unrealized foreign exchange transaction loss (gain) . . . . . . . . . . . . . . . . . . . . . . . . . . . . . . . . 4,070 (1,219) (4,633)Write-off of deferred financing costs & unamortized discounts . . . . . . . . . . . . . . . . . . . . . . . . . 1,368 30,830 5,971Other . . . . . . . . . . . . . . . . . . . . . . . . . . . . . . . . . . . . . . . . . . . . . . . . . . . . . . . . . . . . . . 3,072 5,474 4,005Changes in operating assets and liabilities:Receivables . . . . . . . . . . . . . . . . . . . . . . . . . . . . . . . . . . . . . . . . . . . . . . . . . . . . . . . . . . (481) 3,997 (8,155)Inventories . . . . . . . . . . . . . . . . . . . . . . . . . . . . . . . . . . . . . . . . . . . . . . . . . . . . . . . . . . . 592 (7,569) (40,247)Prepaid expenses and other current assets . . . . . . . . . . . . . . . . . . . . . . . . . . . . . . . . . . . . . . . (4,188) (21,149) 2,206Other assets . . . . . . . . . . . . . . . . . . . . . . . . . . . . . . . . . . . . . . . . . . . . . . . . . . . . . . . . . . (298) (1,292) (376)Accounts payable . . . . . . . . . . . . . . . . . . . . . . . . . . . . . . . . . . . . . . . . . . . . . . . . . . . . . . (821) 449 16,647Royalty overrides . . . . . . . . . . . . . . . . . . . . . . . . . . . . . . . . . . . . . . . . . . . . . . . . . . . . . . 1,526 5,323 5,852Accrued expenses and accrued compensation . . . . . . . . . . . . . . . . . . . . . . . . . . . . . . . . . . . . 5,045 32,513 15,040Advance sales deposits . . . . . . . . . . . . . . . . . . . . . . . . . . . . . . . . . . . . . . . . . . . . . . . . . . . (454) 2,440 1,557Income taxes payable . . . . . . . . . . . . . . . . . . . . . . . . . . . . . . . . . . . . . . . . . . . . . . . . . . . . 7,228 (1,186) 26,704Deferred compensation plan liability . . . . . . . . . . . . . . . . . . . . . . . . . . . . . . . . . . . . . . . . . . (9,640) (8,560) 1,263
NET CASH PROVIDED BY OPERATING ACTIVITIES . . . . . . . . . . . . . . . . . . . . . . . . . . . . 94,350 80,110 143,352
CASH FLOWS FROM INVESTING ACTIVITIESPurchases of property . . . . . . . . . . . . . . . . . . . . . . . . . . . . . . . . . . . . . . . . . . . . . . . . . . . . (13,601) (23,081) (31,536)Proceeds from sale of property . . . . . . . . . . . . . . . . . . . . . . . . . . . . . . . . . . . . . . . . . . . . . . 53 6 68Net change in restricted cash . . . . . . . . . . . . . . . . . . . . . . . . . . . . . . . . . . . . . . . . . . . . . . . 4,850 5,701 39Net changes in marketable securities . . . . . . . . . . . . . . . . . . . . . . . . . . . . . . . . . . . . . . . . . . 1,268 — —Deferred compensation plan assets . . . . . . . . . . . . . . . . . . . . . . . . . . . . . . . . . . . . . . . . . . . 10,582 9,288 (1,097)
NET CASH PROVIDED BY (USED IN) INVESTING ACTIVITIES . . . . . . . . . . . . . . . . . . . . 3,152 (8,086) (32,526)
CASH FLOWS FROM FINANCING ACTIVITIESDividends paid . . . . . . . . . . . . . . . . . . . . . . . . . . . . . . . . . . . . . . . . . . . . . . . . . . . . . . . . — (184,538) —Issuance of 9.5% Notes . . . . . . . . . . . . . . . . . . . . . . . . . . . . . . . . . . . . . . . . . . . . . . . . . . — 267,437 —Repurchase of 15.5% Senior Notes and 11.75% Notes . . . . . . . . . . . . . . . . . . . . . . . . . . . . . . (5,681) (199,422) —Borrowings from long-term debt . . . . . . . . . . . . . . . . . . . . . . . . . . . . . . . . . . . . . . . . . . . . 6,508 208,870 5,073Principal payments on long-term debt . . . . . . . . . . . . . . . . . . . . . . . . . . . . . . . . . . . . . . . . . (23,864) (127,230) (232,508)Conversion of preferred shares . . . . . . . . . . . . . . . . . . . . . . . . . . . . . . . . . . . . . . . . . . . . . . — (183,115) —Proceeds from issuance of common shares . . . . . . . . . . . . . . . . . . . . . . . . . . . . . . . . . . . . . . — 200,096 —Increase in deferred financing costs . . . . . . . . . . . . . . . . . . . . . . . . . . . . . . . . . . . . . . . . . . — (7,091)Exercise of stock options . . . . . . . . . . . . . . . . . . . . . . . . . . . . . . . . . . . . . . . . . . . . . . . . . — 1,833 2,131Issuance of preferred stock . . . . . . . . . . . . . . . . . . . . . . . . . . . . . . . . . . . . . . . . . . . . . . . . 4,206 — —Other . . . . . . . . . . . . . . . . . . . . . . . . . . . . . . . . . . . . . . . . . . . . . . . . . . . . . . . . . . . . . . — — (586)
NET CASH USED IN FINANCING ACTIVITIES . . . . . . . . . . . . . . . . . . . . . . . . . . . . . . . . (18,831) (23,160) (225,890)
EFFECT OF EXCHANGE RATE CHANGES ON CASH . . . . . . . . . . . . . . . . . . . . . . . . . . . . 7,807 2,034 1,735
NET CHANGE IN CASH AND CASH EQUIVALENTS . . . . . . . . . . . . . . . . . . . . . . . . . . . . 86,478 50,898 (113,329)CASH AND CASH EQUIVALENTS, BEGINNING OF PERIOD . . . . . . . . . . . . . . . . . . . . . . . 64,201 150,679 201,577
CASH AND CASH EQUIVALENTS, END OF PERIOD . . . . . . . . . . . . . . . . . . . . . . . . . . . . $150,679 $ 201,577 $ 88,248
CASH PAID DURING THE YEARInterest paid . . . . . . . . . . . . . . . . . . . . . . . . . . . . . . . . . . . . . . . . . . . . . . . . . . . . . . . . . . $ 35,866 $ 88,108 $ 38,226
Income taxes paid . . . . . . . . . . . . . . . . . . . . . . . . . . . . . . . . . . . . . . . . . . . . . . . . . . . . . . $ 32,836 $ 20,491 $ 65,408
NON CASH ACTIVITIESCapital leases . . . . . . . . . . . . . . . . . . . . . . . . . . . . . . . . . . . . . . . . . . . . . . . . . . . . . . . . . $ 6,834 $ 7,198 $ 1,068
See the accompanying Notes to Consolidated Financial Statements.
82
%%TRANSMSG*** Transmitting Job: V16934 PCN: 083000000 ***%%PCMSG|82 |00021|Yes|No|03/16/2006 21:00|0|0|Page is valid, no graphics -- Color: D|

HERBALIFE LTD.(FORMERLY WH HOLDINGS (CAYMAN ISLANDS) LTD.)
NOTES TO CONSOLIDATED FINANCIAL STATEMENTS
1. Organization
Herbalife Ltd., a Cayman Islands exempted limited liability company (“Herbalife”), incorporated on April 4,2002, and its direct and indirect wholly-owned subsidiaries, WH Intermediate Holdings Ltd., a Cayman Islandscompany (“WH Intermediate”), WH Luxembourg Holdings S.à.R.L., a Luxembourg unipersonal limited liabilitycompany (“Lux Holdings”), WH Luxembourg CM S.à.R.L., a Luxembourg unipersonal limited liability company,and WH Acquisition Corp., a Nevada corporation (“WH Acquisition”), were formed on behalf of Whitney & Co.,LLC (“Whitney”) and Golden Gate Private Equity, Inc. (“Golden Gate”), in order to acquire Herbalife International,Inc., a Nevada corporation, and its subsidiaries (“Herbalife International”) on July 31, 2002 (the “Acquisition”).Herbalife and its subsidiaries are referred to collectively herein as the Company.
IPO Recapitalization
On December 16, 2004, Herbalife completed an initial public offering of its common shares (the “IPO”), aspart of a series of recapitalization transactions, including:
• a tender offer for $159.8 million of the outstanding 113⁄4% senior subordinated notes due 2010 (the“113⁄4% Notes”), issued by Herbalife International;
• the replacement of Herbalife International’s existing $205.0 million senior credit facility with a new$225.0 million senior credit facility;
• the payment of a $139.8 million special cash dividend to the pre-IPO shareholders of Herbalife; and
• the amendment of Herbalife’s Memorandum and Articles of Association to: (1) effect a 1:2 reverse stocksplit of Herbalife’s common shares; (2) increase Herbalife’s authorized common shares to 500 millionshares; and (3) increase Herbalife’s authorized preference shares to 7.5 million shares, all of which tookeffect on December 1, 2004.
As a planned continuation of the IPO recapitalization, Herbalife exercised a contract provision in December2004 to redeem 40%, or $110.0 million principal value (excluding a premium of $10.5 million), of the 91⁄2% notesdue 2011, (the “91⁄2% Notes”). After the required notice period, this redemption was completed on February 4, 2005.The redemption premium of $10.5 million and the write-off of deferred financing fees of $3.7 million associatedwith this redemption are included in interest expense in the first quarter of 2005.
In connection with the IPO and the recapitalization, a secondary Company incurred $24.7 million in fees andexpenses of which $19.8 million were associated with the IPO (included in equity) and $4.9 million were associatedwith the establishment of the new credit facility (included in deferred financing costs).
Secondary Offering
On December 19, 2005, Herbalife completed a secondary public offering of 13 million common shares held bycertain existing shareholders. The selling shareholders received all net proceeds from the sale of common sharessold in this offering. Accordingly, Herbalife did not receive any proceeds from the sale of common shares.
2. Basis of Presentation
The Company’s consolidated financial statements refer to Herbalife and its subsidiaries. All common sharesand earnings per share data for the successor gives effect to a 1:2 reverse stock split, which took effect December 1,2004. The Company also officially changed its name from WH Holdings (Cayman Islands) Ltd. to Herbalife Ltd.effective December 1, 2004.
83
%%TRANSMSG*** Transmitting Job: V16934 PCN: 084000000 ***%%PCMSG|83 |00025|Yes|No|03/16/2006 21:00|0|0|Page is valid, no graphics -- Color: D|

New Accounting Pronouncements
In December 2004, the Financial Accounting Standards Board (“FASB”) enacted Statement of FinancialAccounting Standards 123 — revised 2004, “Share-Based Payment” (“SFAS No. 123R”) which replaces Statementof Financial Accounting Standards No. 123, Accounting for Stock-Based Compensation” (“SFAS No. 123”) andsupersedes Accounting Principle Board (“APB”) Opinion No. 25, “Accounting for Stock Issued to Employees”(“APB No. 25”). SFAS No. 123R requires the measurement of all employee share-based payments to employees,including grants of employee stock options, using a fair-value-based method and the recording of such expense inour consolidated statements of operations.
The Company is required to adopt SFAS No. 123R in the first quarter of fiscal year 2006. The pro formadisclosures previously permitted under SFAS No. 123 no longer will be an alternative to financial statementrecognition. See Note 2 in the Notes to Consolidated Financial Statements for the pro forma net income (loss) andnet income (loss) per share amounts, for fiscal 2002 through fiscal 2005, presented as if the Company had used afair-value-based method similar to the methods required under SFAS No. 123R to measure compensation expensefor employee stock incentive awards. Although the Company has not yet determined whether the adoption ofSFAS No. 123R will result in amounts that are similar to the current pro forma disclosures under SFAS No. 123, it isevaluating the requirements under SFAS No. 123R. On a preliminary basis the Company expects the adoption willhave a cumulative pre-tax impact of less than $15 million for the period from 2006 to 2010, related to share basedawards issued prior to the year end of 2005, on its consolidated statements of operations. The full impact of adoptingSFAS No. 123R cannot be accurately estimated at this time, as it will depend on the market value and the amount ofshare based awards granted in the future periods.
In December 2004, the FASB issued FASB Staff Position No. FAS 109-2 “Accounting and DisclosureGuidance for the Foreign Earnings Repatriation Provision within the American Jobs Creations Act of 2004” (“SFASNo. 109-2”). The American Jobs Creation Act (“AJCA”) introduces a limited time 85% dividends receiveddeduction on the repatriation of certain foreign earnings to a U.S. taxpayer (repatriation provision), provided certaincriteria are met. SFAS No. 109-2 provides accounting and disclosure guidance for the repatriation provision. Theprovision will not provide a material benefit to the Company.
In December 2004, the FASB issued SFAS No. 151, “Inventory Costs, an amendment of ARB No. 43,Chapter 4” (“SFAS No. 151”) which requires that abnormal amounts of idle facility expense, freight, handling costsand wasted material (spoilage) be recognized as current-period charges. In addition, the statement requires thatallocation of fixed production overheads to the costs of conversion be based on the normal capacity of theproduction facilities. SFAS No. 151 is effective for fiscal years beginning after June 15, 2005. The Company willadopt this statement as required, and management does not believe the adoption will have a material effect on theCompany’s results of operations, financial condition or liquidity.
In May 2005, the FASB issued SFAS No. 154, “Accounting Changes and Error Corrections” (“SFAS No. 154”).SFAS No. 154 requires restatement of prior periods’ financial statements for changes in accounting principle, unlessit is impracticable to determine either the period-specific effects or the cumulative effect of the change. Also,SFAS No. 154 requires that retrospective application of a change in accounting principle be limited to the directeffects of the change. SFAS No. 154 is effective for accounting changes and corrections of errors made in fiscalyears beginning after December 15, 2005. Management does not believe that the adoption of SFAS No. 154 willhave a material impact on the Company’s consolidated financial statements.
Reclassifications
Certain reclassifications were made to the prior period financial statements to conform to current periodpresentation.
84
HERBALIFE LTD.(FORMERLY WH HOLDINGS (CAYMAN ISLANDS) LTD.)
NOTES TO CONSOLIDATED FINANCIAL STATEMENTS — (Continued)
%%TRANSMSG*** Transmitting Job: V16934 PCN: 085000000 ***%%PCMSG|84 |00021|Yes|No|03/16/2006 21:00|0|0|Page is valid, no graphics -- Color: D|

Significant Accounting Policies
Consolidation Policy
The consolidated financial statements include the accounts of the Company and its subsidiaries. All significantinter-company transactions and accounts have been eliminated.
Foreign Currency Translation
In substantially all of the countries that the Company operates, the functional currency is the local currency.Foreign subsidiaries’ asset and liability accounts are translated for consolidated financial reporting purposes intoU.S. dollar amounts at year-end exchange rates. Revenue and expense accounts are translated at the average ratesduring the year. Foreign exchange translation adjustments are included in accumulated other comprehensiveincome (loss) on the accompanying consolidated balance sheets. Transaction gains and losses, which include thecost of forward exchange and option contracts and the related settlement gains and losses, are included in Selling,General & Administrative Expenses in the accompanying consolidated statement of income. The Companyrecorded losses of $6.5 million and $1.9 million for the years ended December 31, 2003 and 2004, respectively, anda gain of $0.7 million for the year ended December 31, 2005.
Forward Exchange Contracts and Option Contracts
The Company enters into forward exchange contracts and option contracts in managing its foreign exchangerisk on sales to distributors, purchase commitments denominated in foreign currencies, intercompany transactionsand bank loans. The Company also enters into interest rate caps and swaps in managing its interest rate risk on itsvariable rate term loan. The Company does not use the contracts for trading purposes.
In accordance with SFAS No. 133, “Accounting for Derivative Instruments and Hedging Activities,” theCompany designates certain of its derivative instruments as cash flow hedges and formally documents its hedgerelationships, including identification of the hedging instruments and the hedged items, as well as its riskmanagement objectives and strategies for undertaking the hedge transaction, at the time the derivative contractis executed. The Company assesses the effectiveness of the hedge both at inception and on an on-going basis anddetermines whether the hedge is highly or perfectly effective in offsetting changes in cash flows of the hedged item.The Company records the effective portion of changes in the estimated fair value in accumulated other compre-hensive income (loss) and subsequently reclassifies the related amount of accumulated other comprehensiveincome (loss) to earnings when the hedging relationship is terminated. If it is determined that a derivative has ceasedto be a highly effective hedge, the Company will discontinue hedge accounting for such transaction. For derivativesthat are not designated as hedges (“free-standing derivatives”), all changes in estimated fair value are recognized inthe consolidated statements of operations.
Cash and Cash Equivalents
The Company considers all highly liquid investments purchased with a maturity of three months or less to becash equivalents. Cash and cash equivalents are comprised primarily of money market accounts and foreign anddomestic bank accounts. To reduce its credit risk, the Company monitors the credit standing of the financialinstitutions that hold the Company’s cash and cash equivalents.
Restricted Cash
There was no restricted cash as of December 31, 2004 and December 31, 2005.
85
HERBALIFE LTD.(FORMERLY WH HOLDINGS (CAYMAN ISLANDS) LTD.)
NOTES TO CONSOLIDATED FINANCIAL STATEMENTS — (Continued)
%%TRANSMSG*** Transmitting Job: V16934 PCN: 086000000 ***%%PCMSG|85 |00018|Yes|No|03/16/2006 21:00|0|0|Page is valid, no graphics -- Color: D|

Accounts Receivable
Accounts receivable consist principally of receivables from credit card companies, arising from the sale ofproduct to the Company’s distributors, and receivables from importers, who are utilized in a limited number ofcountries to sell products to distributors. Due to the geographic dispersion of its credit card receivables, thecollection risk is not considered to be significant. Although receivables from importers can be significant, theCompany performs ongoing credit evaluations of its importers and maintains an allowance for potential creditlosses. The Company believes that it provides adequate allowances for receivables from its distributors.
Fair Value of Financial Instruments
The Company has estimated the fair value of its financial instruments using the following methods andassumptions:
• The carrying amounts of cash and cash equivalents, restricted cash, receivables and accounts payableapproximate fair value due to the short-term maturities of these instruments;
• Marketable securities are based on the quoted market prices for these instruments;
• Foreign exchange contracts are based on exchange rates at period end;
• The fair value of option and forward contracts are based on dealer quotes;
• The book values of the Company’s variable rate debt instruments are considered to approximate their fairvalues because interest rates of those instruments approximate current rates offered to the Company; and
• The fair values for fixed rate borrowings have been determined based on recent market trade values, and aredisclosed in Note 4 in the Notes to Consolidated Financial Statements.
Inventories
Inventories are stated at lower of cost (on the first-in, first-out basis) or market. The Company had reserves forobsolete and slow moving inventory totaling $6.2 million and $8.0 million as of December 31, 2004 and 2005,respectively.
Deferred Financing Costs
Deferred financing costs represent fees and expenses related to the borrowing of the Company’s long-term debtand are amortized over the term of the related debt.
Long-Lived Assets
Depreciation of furniture, fixtures and equipment (including computer hardware and software) is computed ona straight-line basis over the estimated useful lives of the related assets, which range from three to five years.Leasehold improvements are amortized on a straight-line basis over the life of the related asset or the term of thelease, whichever is shorter.
Long-lived assets are reviewed for impairment, based on undiscounted cash flows, whenever events or changesin circumstances indicate that the carrying amount of such assets may not be recoverable. Measurement of animpairment loss is based on the estimated fair market value of the asset.
Goodwill and intangible assets with indefinite lives are evaluated on an annual basis for impairment, or morefrequently if events or changes in circumstances indicate that the asset might be impaired. Intangible assets withfinite lives are amortized over their expected lives, which are three years for the distributor network, five years for
86
HERBALIFE LTD.(FORMERLY WH HOLDINGS (CAYMAN ISLANDS) LTD.)
NOTES TO CONSOLIDATED FINANCIAL STATEMENTS — (Continued)
%%TRANSMSG*** Transmitting Job: V16934 PCN: 087000000 ***%%PCMSG|86 |00025|Yes|No|03/16/2006 21:00|0|0|Page is valid, no graphics -- Color: D|

product formulas and two years for product certifications. The annual amortization expense for intangibles is was$34.5 million (2003), $23.9 million (2004) and $14.0 million (2005), and will be $3.1 million (2006) and$1.8 million (2007) and zero for years thereafter.
As of December 31, 2004 and 2005, the goodwill balance was $167.5 million and $134.2 million, respectively.The $33.3 million decrease was due primarily to a reduction in the valuation allowance established at the time of theAcquisition against pre-Acquisition tax benefits.
Income Taxes
Income tax expense includes income taxes payable for the current year and the change in deferred income taxassets and liabilities for the future tax consequences of events that have been recognized in the Company’s financialstatements or income tax returns. A valuation allowance is recognized to reduce the carrying value of deferredincome tax assets if it is believed to be more likely than not that a component of the deferred income tax assets willnot be realized.
Royalty Overrides
An independent distributor may earn commissions, called royalty overrides or production bonuses, based onretail volume. Such commissions are based on the retail sales volume of certain other members of the independentsales force who are sponsored by the distributor. In addition, such commissions are recorded when the products areshipped. Non-U.S. royalty checks that have aged, for a variety of reasons, beyond a certainty of being paid, are takenback into income. Management has calculated this period of certainty to be three years worldwide, whereaspreviously this period varied by country, ranging from 12 months to 30 years. In order to achieve consistency amongall countries, in the third quarter of 2004, the Company adjusted the period over which such amounts would be takeninto income to three years on a Company-wide basis. The impact of this change for the year ended December 31,2004 was a pretax benefit of approximately $2.4 million.
Research and Development
The Company’s research and development is primarily performed by outside consultants. For all periodspresented, research and development costs were expensed as incurred and were not material.
Earnings Per Share
Basic earnings per share represents net income for the period common shares were outstanding, divided by theweighted average number of shares of common stock outstanding for the period. Diluted earnings per sharerepresents net income divided by the weighted average number of shares outstanding, inclusive of the effect ofdilutive securities.
The Company’s preferred shares were converted into common shares on March 8, 2004. From August 1, 2002,until the date of conversion, the Company did not have any outstanding common shares. Accordingly, no basicearnings per share information has been presented for those periods. Diluted earnings per share for these periodsassumes the conversion of the preferred shares to common shares and includes the dilutive effect, if any, ofoutstanding stock options and warrants.
Periods after March 8, 2004, include basic earnings per share information that reflects common sharesoutstanding subsequent to the conversion. Diluted earnings per share for such periods also reflects the dilutiveeffect, if any, of outstanding stock options and warrants.
87
HERBALIFE LTD.(FORMERLY WH HOLDINGS (CAYMAN ISLANDS) LTD.)
NOTES TO CONSOLIDATED FINANCIAL STATEMENTS — (Continued)
%%TRANSMSG*** Transmitting Job: V16934 PCN: 088000000 ***%%PCMSG|87 |00021|Yes|No|03/16/2006 21:00|0|0|Page is valid, no graphics -- Color: D|

The following are the share amounts used to compute the basic and diluted earnings per share for each period(in thousands):
2003 2004 2005Year Ended December 31,
Weighted average shares used in basic computations . . . . . . . . . . . . . . — 52,911 68,972
Dilutive effect of exercise of options outstanding . . . . . . . . . . . . . . . . . 1,776 — 3,390
Dilutive effect of Preferred shares . . . . . . . . . . . . . . . . . . . . . . . . . . . . 50,649 — —
Dilutive effect of warrants . . . . . . . . . . . . . . . . . . . . . . . . . . . . . . . . . . 1,021 — 129
Weighted average shares used in diluted computations . . . . . . . . . . . . . 53,446 52,911 72,491
Options to purchase 5.9 million, 1.5 million and 1.4 million common shares at prices ranging from $2.50 to$12.32, $12.00 to $25.00 and $23.00 to $29.45 were outstanding during 2003, 2004 and 2005, respectively, but werenot included in the computation of diluted earnings per share because the option exercise prices were greater thanthe average market price of the common shares or the potential issuance of options would decrease loss per share.Therefore such options would be anti-dilutive.
Revenue Recognition
Revenue is recognized when products are shipped and title passes to the independent distributor or importer.Sales are recognized on a net sales basis, which reflects product returns, net of discounts referred to as “DistributorAllowances,” and amounts billed for freight and handling costs. Freight and handling costs paid by the Company areincluded in cost of sales. The Company generally receives the net sales price in cash or through credit card paymentsat the point of sale. Related royalty overrides and allowances for product returns are recorded when the merchandiseis shipped.
Allowances for product returns primarily in connection with our buyback program are provided at the time theproduct is shipped. This accrual is based upon historic return rates for each country, which vary from zero toapproximately 5.0% of net sales, and the relevant return pattern, which reflects anticipated returns to be receivedover a period of up to 12 months following the original sale.
Historically, product returns have not been significant, and the allowances for product returns are consistentwith the actual returns.
Accounting for Stock Options
In December 2002, the FASB issued SFAS No. 148 “Accounting for Stock Based Compensation — Transitionand Disclosure” (“SFAS No. 148”). SFAS No. 148 amends SFAS No. 123 to provide alternative methods oftransition for a voluntary change to the fair value based method of accounting for stock-based employeecompensation. In addition, SFAS No. 148 amends the disclosure requirements of SFAS No. 123 to requireprominent disclosures in both annual and interim financial statements about the method of accounting for stock-based employee compensation and the effect of the method used on reported results.
The Company applies the intrinsic-value-based method of accounting prescribed by APB No. 25 and relatedinterpretations including FASB Interpretation No. 44, “Accounting for Certain Transactions Involving StockCompensation,” an interpretation of APB No. 25, issued March 2000, to account for its stock-based awards foremployees. For options granted to employees, compensation expense is recorded on the date of grant only if thecurrent market price of the underlying common shares exceeds the exercise price. SFAS No. 123 establishedaccounting and disclosure requirements using a fair-value-based method of accounting for stock-based employeecompensation plans. As allowed by SFAS No. 123, the Company has elected to continue to apply the
88
HERBALIFE LTD.(FORMERLY WH HOLDINGS (CAYMAN ISLANDS) LTD.)
NOTES TO CONSOLIDATED FINANCIAL STATEMENTS — (Continued)
%%TRANSMSG*** Transmitting Job: V16934 PCN: 089000000 ***%%PCMSG|88 |00025|Yes|No|03/16/2006 21:00|0|0|Page is valid, no graphics -- Color: D|

intrinsic-value-based method of accounting described above, and has adopted only the disclosure requirements ofSFAS No. 123.
The following tables illustrate the effect on net income (loss) if the fair-value-based method had been appliedto all outstanding and unvested awards in each period (in millions, except per share amounts):
2003 2004 2005Year Ended December 31,
Net income (loss) as reported . . . . . . . . . . . . . . . . . . . . . . . . . . . . . . . . . $36.8 $(14.3) $93.1
Add: Stock-based employee compensation expense included in reportednet income . . . . . . . . . . . . . . . . . . . . . . . . . . . . . . . . . . . . . . . . . . . . . 1.1 1.2 1.8
Deduct: Stock-based employee compensation expense determined underfair value based methods for all awards . . . . . . . . . . . . . . . . . . . . . . . . (1.5) (2.6) (6.8)
Pro forma net income (loss). . . . . . . . . . . . . . . . . . . . . . . . . . . . . . . . . . . $36.4 $(15.7) $88.1
Basic earnings (loss) per share
As reported . . . . . . . . . . . . . . . . . . . . . . . . . . . . . . . . . . . . . . . . . . . . . — $(0.27) $1.35
Pro forma . . . . . . . . . . . . . . . . . . . . . . . . . . . . . . . . . . . . . . . . . . . . . . — $(0.30) $1.28
Diluted earnings (loss) per share
As reported . . . . . . . . . . . . . . . . . . . . . . . . . . . . . . . . . . . . . . . . . . . . . $0.69 $(0.27) $1.28
Pro forma . . . . . . . . . . . . . . . . . . . . . . . . . . . . . . . . . . . . . . . . . . . . . . $0.68 $(0.30) $1.21
The fair value of the stock options granted during the periods presented was determined using the Black-Scholes option pricing model and the following weighted average assumptions:
2003 2004 2005Year Ended December 31,
Risk free interest rate . . . . . . . . . . . . . . . . . . . . . . . . . . . . . . . . 3.0% 3.6% 4.0%
Expected option life . . . . . . . . . . . . . . . . . . . . . . . . . . . . . . . . . 5.0 years 5.0 years 6.3 years
Volatility . . . . . . . . . . . . . . . . . . . . . . . . . . . . . . . . . . . . . . . . . . 0.00% 16.51% 32.75%
Dividend yield . . . . . . . . . . . . . . . . . . . . . . . . . . . . . . . . . . . . . 0.00% 0.00% 0.00%
Use of Estimates
The preparation of financial statements in conformity with accounting principles generally accepted in theUnited States of America requires management to make estimates and assumptions. Such estimates and assump-tions affect the reported amounts of assets and liabilities and the disclosure of contingent assets and liabilities at thedate of the financial statements, and the reported amounts of revenues and expenses during the reporting period.Actual results could differ from those estimates.
89
HERBALIFE LTD.(FORMERLY WH HOLDINGS (CAYMAN ISLANDS) LTD.)
NOTES TO CONSOLIDATED FINANCIAL STATEMENTS — (Continued)
%%TRANSMSG*** Transmitting Job: V16934 PCN: 090000000 ***%%PCMSG|89 |00026|Yes|No|03/16/2006 21:00|0|0|Page is valid, no graphics -- Color: D|

3. Inventories
Inventories consist primarily of finished goods available for resale and can be categorized as follows (inmillions):
2004 2005December 31,
Weight management and inner nutrition . . . . . . . . . . . . . . . . . . . . . . . . . . . . . . . $53.9 $ 86.6
Outer Nutrition» . . . . . . . . . . . . . . . . . . . . . . . . . . . . . . . . . . . . . . . . . . . . . . . . . 10.0 13.9
Literature, promotional and others . . . . . . . . . . . . . . . . . . . . . . . . . . . . . . . . . . . . 7.2 9.3
Total . . . . . . . . . . . . . . . . . . . . . . . . . . . . . . . . . . . . . . . . . . . . . . . . . . . . . . . $71.1 $109.8
4. Long-Term Debt
Long-term debt consists of the following (in millions):
2004 2005December 31,
113⁄4% Notes. . . . . . . . . . . . . . . . . . . . . . . . . . . . . . . . . . . . . . . . . . . . . . . . . . . . $ 0.2 $ 0.1
Borrowing under senior credit facility . . . . . . . . . . . . . . . . . . . . . . . . . . . . . . . . . 200.0 89.8
91⁄2% Notes, net of unamortized discounts $3.7 million (2005) and $6.9 million(2004) . . . . . . . . . . . . . . . . . . . . . . . . . . . . . . . . . . . . . . . . . . . . . . . . . . . . . . 268.1 161.3
Capital leases . . . . . . . . . . . . . . . . . . . . . . . . . . . . . . . . . . . . . . . . . . . . . . . . . . . 9.2 5.4
Other debt . . . . . . . . . . . . . . . . . . . . . . . . . . . . . . . . . . . . . . . . . . . . . . . . . . . . . 8.7 6.5
486.2 263.1
Less: current portion . . . . . . . . . . . . . . . . . . . . . . . . . . . . . . . . . . . . . . . . . . . . . . 120.3 9.8
$365.9 $253.3
Interest expense was $41.5 million, $123.3 million and $43.9 million for the years ended December 31, 2003,2004 and 2005, respectively.
In connection with the Acquisition, the Company consummated certain related financing transactions,including the issuance by WH Acquisition on June 27, 2002, of $165.0 million of the 113⁄4% Notes issued at98.716% of par. Interest on the 113⁄4% Notes is to be paid semi annually on January 15th and July 15th of each year,the first payment of which was made on January 15, 2003. In connection with this financing, the Company incurred$25.1 million of debt issuance costs, which are being amortized over the term of the debt using the effective interestrate method. During the third quarter of 2003, the Company repurchased $5.0 million principal value of the 113⁄4%Notes. The fair value of the 113⁄4% notes was $0.2 million and $0.1 million at December 31, 2004 and 2005,respectively.
Subsequently, in connection with the IPO, the Company made a tender offer for all of the outstanding113⁄4% Notes and received tenders for 99.9% of the outstanding principal amount. The purchase price amounted to$197.2 million, including accrued interest of $8.1 million and a $29.3 million purchase premium. In addition,$20.6 million of interest was recorded related to the write down of deferred financing costs and discount. TheCompany also paid off the entire amount of borrowings under the senior credit facility amounting to $66.9 million,including accrued interest and fees. An additional $6.2 million of interest was also recorded as a result of the writeoff of deferred financing costs.
90
HERBALIFE LTD.(FORMERLY WH HOLDINGS (CAYMAN ISLANDS) LTD.)
NOTES TO CONSOLIDATED FINANCIAL STATEMENTS — (Continued)
%%TRANSMSG*** Transmitting Job: V16934 PCN: 091000000 ***%%PCMSG|90 |00026|Yes|No|03/16/2006 21:00|0|0|Page is valid, no graphics -- Color: D|

In March 2004, Herbalife and its wholly-owned subsidiary WH Capital Corporation completed a $275.0 mil-lion offering of the 91⁄2% Notes. The proceeds of the offering together with available cash were used to pay theoriginal issue price in cash due upon conversion of 104.1 million outstanding preferred shares, including 2.0 millionwarrants exercised as described below, to pay all accrued and unpaid dividends, to redeem Herbalife’s 151⁄2% SeniorNotes due July 15, 2011 (the “151⁄2% Senior Notes”) and to pay related fees and expenses. The total price of$52.1 million to redeem the 151⁄2% Senior Notes consisted of $39.6 million aggregate principal amount (excluding$1.7 million of unamortized discount), an $11.4 million purchase premium and $1.1 million of accrued interestfrom January 1, 2004, up to (but not including) March 8, 2004. At any time after July 31, 2002, and on or beforeJuly 15, 2012, warrants issued with the 151⁄2% Senior Notes could be exercised to purchase an equivalent amount ofpreferred stock at an exercise price of $0.01 per share. The total number of warrants outstanding after July 31, 2002,and exercised on March 8, 2004, to purchase an equivalent amount of preferred shares was 2,040,816. The proceedsof the 91⁄2% Notes were used in part to redeem and convert these preferred shares into common shares. Interest onthe 91⁄2% Notes will be paid in cash semi-annually in arrears on April 1 and October 1 of each year, starting onOctober 1, 2004. The 91⁄2% Notes are Herbalife’s general unsecured obligations, ranking equally with any of theexisting and future senior indebtedness and senior to all of Herbalife’s future subordinated indebtedness. Also, the91⁄2% Notes are effectively subordinated to all existing and future indebtedness and other liabilities of Herbalife’ssubsidiaries. In February 2005, the Company redeemed $110.0 million principal value or 40% of the outstandingprincipal amount of the 91⁄2% Notes for a cash payment of $120.5 million, including a purchase premium of$10.5 million. The fair value of the 91⁄2% Notes was $305.3 million and $178.2 million at December 31, 2004 and2005, respectively.
Concurrently with the closing of the IPO, the Company entered into a $225.0 million senior credit facility witha syndicate of financial institutions, including affiliates of Morgan Stanley & Co. Incorporated and Merril Lynch,Pierce, Fenner & Smith Incorporated as joint lead arrangers and joint book-managers. The senior credit facilityconsists of a senior secured revolving credit facility with total availability of up to $25.0 million and a senior securedterm loan facility in an aggregate principal amount of $200.0 million. The revolver is available until December 21,2009. The revolver bears interest at LIBOR plus 2.0% and the term loan initially bears interest at LIBOR plus 21⁄4%.In April 2005, the senior credit facility was amended whereby the interest rate was reduced from LIBOR plus 21⁄4%to LIBOR plus 13⁄4%. In addition, the amount payable in connection with a partial or full refinancing of the loanwithin the first year of the amendment shall equal 101% of the principal amount. In August 2005, the senior creditfacility was amended again to permit the purchase, repurchase or redemption of up to $50.0 million aggregateprincipal amount of the 91⁄2% Notes. The Company is obligated to pay $0.2 million every quarter until September 30,2010, and the remaining principal on December 21, 2010, for the term loan. As of December 31, 2005, no amountshad been borrowed under the revolver.
Annual scheduled principal payments of long-term debt are: $9.8 million (2006), $3.6 million (2007),$1.1 million (2008), $0.9 million (2009), $86.3 million (2010), and $165.0 million (thereafter).
5. Lease obligations
The Company has warehouse, office, furniture, fixtures and equipment leases, which expire at various datesthrough 2016. Under the lease agreements, the Company is also obligated to pay property taxes, insurance, andmaintenance costs.
91
HERBALIFE LTD.(FORMERLY WH HOLDINGS (CAYMAN ISLANDS) LTD.)
NOTES TO CONSOLIDATED FINANCIAL STATEMENTS — (Continued)
%%TRANSMSG*** Transmitting Job: V16934 PCN: 092000000 ***%%PCMSG|91 |00024|Yes|No|03/16/2006 21:00|0|0|Page is valid, no graphics -- Color: D|
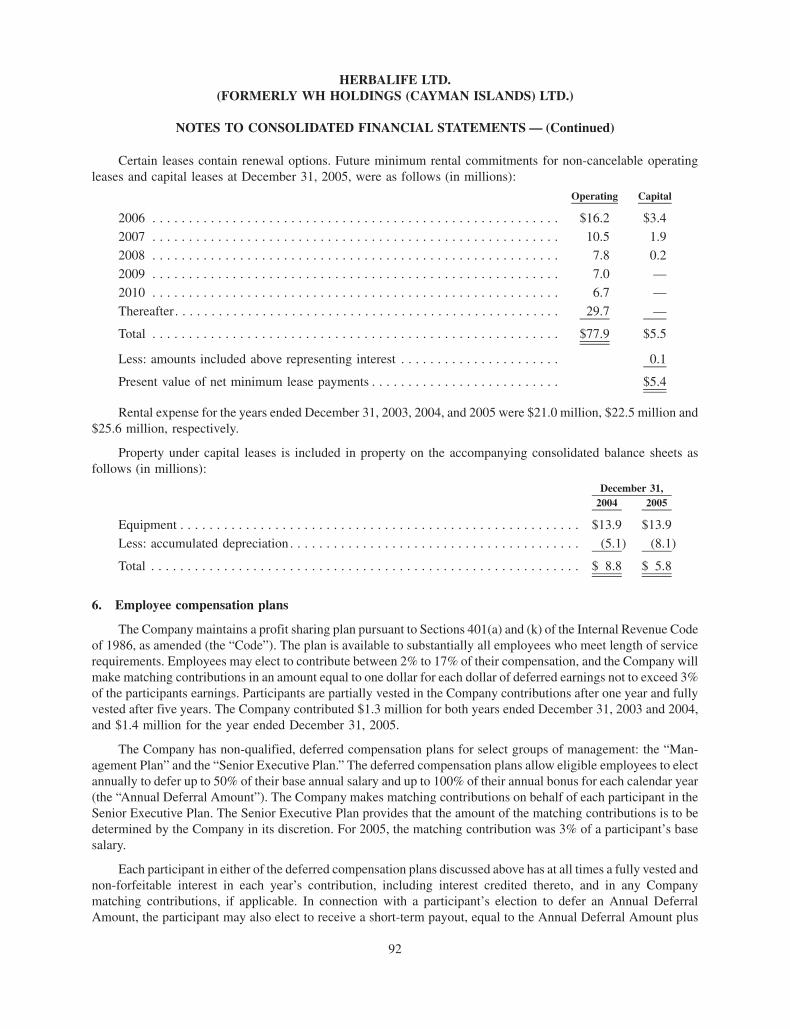
Certain leases contain renewal options. Future minimum rental commitments for non-cancelable operatingleases and capital leases at December 31, 2005, were as follows (in millions):
Operating Capital
2006 . . . . . . . . . . . . . . . . . . . . . . . . . . . . . . . . . . . . . . . . . . . . . . . . . . . . . . . . $16.2 $3.4
2007 . . . . . . . . . . . . . . . . . . . . . . . . . . . . . . . . . . . . . . . . . . . . . . . . . . . . . . . . 10.5 1.9
2008 . . . . . . . . . . . . . . . . . . . . . . . . . . . . . . . . . . . . . . . . . . . . . . . . . . . . . . . . 7.8 0.2
2009 . . . . . . . . . . . . . . . . . . . . . . . . . . . . . . . . . . . . . . . . . . . . . . . . . . . . . . . . 7.0 —
2010 . . . . . . . . . . . . . . . . . . . . . . . . . . . . . . . . . . . . . . . . . . . . . . . . . . . . . . . . 6.7 —
Thereafter. . . . . . . . . . . . . . . . . . . . . . . . . . . . . . . . . . . . . . . . . . . . . . . . . . . . . 29.7 —
Total . . . . . . . . . . . . . . . . . . . . . . . . . . . . . . . . . . . . . . . . . . . . . . . . . . . . . . . . $77.9 $5.5
Less: amounts included above representing interest . . . . . . . . . . . . . . . . . . . . . . 0.1
Present value of net minimum lease payments . . . . . . . . . . . . . . . . . . . . . . . . . . $5.4
Rental expense for the years ended December 31, 2003, 2004, and 2005 were $21.0 million, $22.5 million and$25.6 million, respectively.
Property under capital leases is included in property on the accompanying consolidated balance sheets asfollows (in millions):
2004 2005December 31,
Equipment . . . . . . . . . . . . . . . . . . . . . . . . . . . . . . . . . . . . . . . . . . . . . . . . . . . . . . . $13.9 $13.9
Less: accumulated depreciation . . . . . . . . . . . . . . . . . . . . . . . . . . . . . . . . . . . . . . . . (5.1) (8.1)
Total . . . . . . . . . . . . . . . . . . . . . . . . . . . . . . . . . . . . . . . . . . . . . . . . . . . . . . . . . . . $ 8.8 $ 5.8
6. Employee compensation plans
The Company maintains a profit sharing plan pursuant to Sections 401(a) and (k) of the Internal Revenue Codeof 1986, as amended (the “Code”). The plan is available to substantially all employees who meet length of servicerequirements. Employees may elect to contribute between 2% to 17% of their compensation, and the Company willmake matching contributions in an amount equal to one dollar for each dollar of deferred earnings not to exceed 3%of the participants earnings. Participants are partially vested in the Company contributions after one year and fullyvested after five years. The Company contributed $1.3 million for both years ended December 31, 2003 and 2004,and $1.4 million for the year ended December 31, 2005.
The Company has non-qualified, deferred compensation plans for select groups of management: the “Man-agement Plan” and the “Senior Executive Plan.” The deferred compensation plans allow eligible employees to electannually to defer up to 50% of their base annual salary and up to 100% of their annual bonus for each calendar year(the “Annual Deferral Amount”). The Company makes matching contributions on behalf of each participant in theSenior Executive Plan. The Senior Executive Plan provides that the amount of the matching contributions is to bedetermined by the Company in its discretion. For 2005, the matching contribution was 3% of a participant’s basesalary.
Each participant in either of the deferred compensation plans discussed above has at all times a fully vested andnon-forfeitable interest in each year’s contribution, including interest credited thereto, and in any Companymatching contributions, if applicable. In connection with a participant’s election to defer an Annual DeferralAmount, the participant may also elect to receive a short-term payout, equal to the Annual Deferral Amount plus
92
HERBALIFE LTD.(FORMERLY WH HOLDINGS (CAYMAN ISLANDS) LTD.)
NOTES TO CONSOLIDATED FINANCIAL STATEMENTS — (Continued)
%%TRANSMSG*** Transmitting Job: V16934 PCN: 093000000 ***%%PCMSG|92 |00027|Yes|No|03/16/2006 21:00|0|0|Page is valid, no graphics -- Color: D|

interest. Such amount is payable in two or more years from the first day of the year in which the Annual DeferralAmount is actually deferred.
In July 2002, the Company adopted an additional deferred compensation plan, the (“Supplemental Plan”). TheSupplemental Plan allows employees to participate, who are highly compensated and who are eligible to participatein the Change in Control Plan. The administrative committee that manages and administers the plans (the “DeferredCompensation Committee”) allows eligible employees to defer up to 100% of their Change in Control Payments.
Each participant in the Supplemental Plan will be deemed to have invested in funds that provide a return equalto the short-term AFR, within the meaning of the Code. The entire interest of each participant in the SupplementalPlan is always fully vested and non-forfeitable. In connection with a participant’s election to defer the Change inControl Payment, as defined in the Supplemental Plan, the participant may also elect to receive a short-term payout,equal to the deferral amount plus earnings, which is payable two or more years from the first day of the year in whichthe deferral amount is actually deferred. Subject to the short-term payout provision and specified exceptions forunforeseeable financial emergencies, a participant may not withdraw, without incurring a ten percent (10%)withdrawal penalty, all or any portion of his or her account under the Supplemental Plan prior to the date that suchparticipant either (1) is determined by the Deferred Compensation Committee to have incurred permanent and totaldisability or (2) dies or otherwise terminates employment with the Company.
The total deferred compensation expense of the three deferred compensation plans net of participantcontributions was $1.0 million for the years ended December 31, 2003 and 2004, and $0.9 million for the yearended December 31, 2005. The total long-term deferred compensation liability under the three deferred com-pensation plans was $13.9 million and $15.1 million at December 31, 2004 and 2005, respectively.
The deferred compensation plans are unfunded and their benefits are paid from the general assets of theCompany, except that the Company has contributed to a “rabbi trust” whose assets will be used to pay the benefits ifthe Company remains solvent, but can be reached by the Company’s creditors if the Company becomes insolvent.The value of the assets in the “rabbi trust” was $11.9 million and $13.1 million as of December 31, 2004 and 2005,respectively. The value of the assets in the irrevocable trust was $0.2 million as of December 31, 2004.
The Company has an Executive Retention Plan. The purpose of the Executive Retention Plan is to providefinancial incentives for a select group of management and highly compensated employees of the Company tocontinue to provide services to the Company during the period immediately before and immediately after Change inControl, as defined in the Executive Retention Plan. The Company also established an Executive Retention Trust toprovide benefits under the Executive Retention Plan. The Executive Retention Trust was an irrevocable trustestablished with an institutional trustee. In 2005, the Executive Retention Plan trust was terminated. Consequently,there was no balance in this trust as of December 31, 2005.
As a result of certain actions by Herbalife International’s Board, the Acquisition was not deemed to be aChange in Control under the Executive Retention Plan. Thus, the consummation of the Acquisition did not result inthe payment of any benefit pursuant to the Executive Retention Plan.
7. Transactions with related parties
The Company entered into agreements with Whitney and Golden Gate to pay monitoring fees for their servicesand other fees and expenses. Under the monitoring fee agreements, the Company was obligated to pay an annualamount of up to $5.0 million, but not less than $2.5 million, for an initial period of ten years, subject to theprovisions in Herbalife International’s credit agreement. On December 1, 2004, the Company agreed with Whitneyand Golden Gate to terminate the monitoring fee agreements in consideration for 0.7 million warrants, which werevalued at approximately $2.9 million using the Black-Scholes option pricing model. The entire impact of thetermination of the monitoring fee agreements was included in Selling, General & Administrative expenses in 2004.
93
HERBALIFE LTD.(FORMERLY WH HOLDINGS (CAYMAN ISLANDS) LTD.)
NOTES TO CONSOLIDATED FINANCIAL STATEMENTS — (Continued)
%%TRANSMSG*** Transmitting Job: V16934 PCN: 094000000 ***%%PCMSG|93 |00025|Yes|No|03/16/2006 21:00|0|0|Page is valid, no graphics -- Color: D|

For the years ended December 31, 2003 and 2004, the Company expensed monitoring fees in the amount of$5.0 million and $7.5 million, and other expenses of $3.4 million and $1.8 million, respectively.
In December 2004, the Company entered into a termination agreement with the parties to the Share PurchaseAgreement executed in connection with the Acquisition. Pursuant to the termination agreement, the Share PurchaseAgreement and all obligations and liabilities of the parties under the Share Purchase Agreement were terminated.As consideration for the termination of the Share Purchase Agreement, the Company entered into a TaxIndemnification Agreement with Whitney and Golden Gate, and/or their affiliates, pursuant to which the Companyhas agreed to indemnify each of those parties for the Federal income tax liability and any related losses they incur inrespect of income of Herbalife that is, or would be, includible in the gross income of that party for any taxable periodunder Section 951(a) of the Code. Under the terms of the Tax Indemnification Agreement, the Company assumes,for this purpose, that each indemnified party is a “United States shareholder” as defined in Section 951(b) of theCode. The Company does not, however, have any obligation to provide an indemnity with respect to any taxes orrelated losses incurred that have been reimbursed under the Share Purchase Agreement. The Company’s seniorcredit facility permits the Company to pay these tax indemnity payments, but restricts the aggregate amount that theCompany can pay in any given year to no more than $15 million. The Company currently anticipates that noamounts will be required to be paid under this agreement for 2005. As a result of the secondary offering inDecember 2005 in which Whitney and Golden Gate sold approximately 12.6 million shares, we are no longer acontrolled foreign corporation. Consequently, for 2006 and thereafter, no payments under this agreement will berequired.
In 2004, Whitney acquired a 50 percent indirect ownership interest in Shuster Laboratories, Inc. (“Shuster”), aprovider of product testing and formula development for Herbalife. For the years ended December 31, 2004 and2005, total purchases from Shuster were $56,000 and $32,000, respectively.
In 2004, Whitney acquired a 50 percent indirect ownership interest in TBA Entertainment (“TBA”), a providerof creative services to Herbalife. While there were no services provided by TBA in 2004, for the year endedDecember 31, 2005 a payment of $5.7 million was made to TBA for services relating to the 25th AnniversaryExtravaganza, the majority of which were reimbursements of Extravaganza expenses paid to third parties.
In 2004, Golden Gate acquired a 47 percent ownership interest in Leiner Health Products Inc. (“Leiner”), anutritional manufacturer and supplier of certain Herbalife products. For the years ended December 31, 2004 and2005, total purchases from Leiner were $0.5 million and $0.1 million, respectively.
In January 2005, Whitney, together with its affiliates, acquired a 77 percent ownership interest in StauberPerformance Ingredients (“Stauber”), a value-added distributor of bulk specialty nutraceutical ingredients. For theyear ended December 31, 2005, total purchases from Stauber were $1.8 million.
8. Contingencies
The Company is from time to time engaged in routine litigation. The Company regularly reviews all pendinglitigation matters in which it is involved and establishes reserves deemed appropriate by management for theselitigation matters when a probable loss estimate can be made.
Herbalife International and certain of its independent distributors have been named as defendants in apurported class action lawsuit filed February 17, 2005, in the Superior Court of California, County of San Francisco,and served on Herbalife International on March 14, 2005 (Minton v. Herbalife International, et al). The case hasbeen transferred to the Los Angeles County Superior Court. The plaintiff is challenging the marketing practices ofcertain Herbalife International independent distributors and Herbalife International under various state lawsprohibiting “endless chain schemes,” insufficient disclosure in assisted marketing plans, unfair and deceptivebusiness practices, and fraud and deceit. The plaintiff alleges that the Freedom Group system operated by certainindependent distributors of Herbalife International products places too much emphasis on recruiting and
94
HERBALIFE LTD.(FORMERLY WH HOLDINGS (CAYMAN ISLANDS) LTD.)
NOTES TO CONSOLIDATED FINANCIAL STATEMENTS — (Continued)
%%TRANSMSG*** Transmitting Job: V16934 PCN: 095000000 ***%%PCMSG|94 |00023|Yes|No|03/16/2006 21:00|0|0|Page is valid, no graphics -- Color: D|

encourages excessively large purchases of product and promotional materials by distributors. The plaintiff alsoalleges that Freedom Group pressured distributors to disseminate misleading promotional materials. The plaintiffseeks to hold Herbalife International vicariously liable for the actions of its independent distributors and is seekingdamages and injunctive relief. The Company believes that it has meritorious defenses to the suit.
Herbalife International and certain of its distributors have been named as defendants in a purported class actionlawsuit filed July 16, 2003, in the Circuit Court of Ohio County in the State of West Virginia (Mey v. HerbalifeInternational, Inc., et al). The complaint alleges that certain telemarketing practices of certain Herbalife Inter-national distributors vicariously violate the Telephone Consumer Protection Act, or TCPA, and seeks to holdHerbalife International liable for the practices of its distributors. More specifically, the plaintiffs’ complaint allegesthat several of Herbalife International’s distributors used pre-recorded telephone messages and autodialers tocontact prospective customers in violation of the TCPA’s prohibition of such practices. Herbalife International’sdistributors are independent contractors and if any such distributors in fact violated the TCPA they also violatedHerbalife’s policies, which require its distributors to comply with all applicable federal, state and local laws. TheCompany believes that it has meritorious defenses to the suit.
As a marketer of dietary and nutritional supplements and other products that are ingested by consumers orapplied to their bodies, the Company has been and is currently, subjected to various product liability claims. Theeffects of these claims to date have not been material to the Company, and the reasonably possible range of exposureon currently existing claims is not material. The Company believes that it has meritorious defenses to the allegationscontained in the lawsuits. The Company currently maintains product liability insurance with an annual deductible of$10 million.
Certain of the Company’s subsidiaries have been subject to tax audits by governmental authorities in theirrespective countries. In certain of these tax audits, governmental authorities are proposing that significant amountsof additional taxes and related interest and penalties are due. The Company and its tax advisors believe that there aresubstantial defenses to their allegations that additional taxes are owed, and the Company is vigorously contestingthe additional proposed taxes and related charges.
These matters may take several years to resolve, and the Company cannot be sure of their ultimate resolution.However, it is the opinion of management that adverse outcomes, if any, will not likely result in a material adverseeffect on our financial condition and operating results. This opinion is based on the belief that any losses suffered inexcess of amounts reserved would not be material, and that the Company has meritorious defenses. Although theCompany has reserved an amount that the Company believes represents the most likely outcome of the resolution ofthese disputes, if the Company is incorrect in the assessment the Company may have to record additional expenses.
9. Shareholders’ equity
The total undeclared and unpaid cumulative dividends on preferred shares was $32.8 million on December 31,2003. On March 8, 2004, the preferred shares were redeemed for the original issue price of $183.1 million inaddition to dividends of $38.5 million and converted into common shares on a one-to-one basis.
The declaration of future dividends is subject to the discretion of the Company’s board of directors and willdepend upon various factors, including its earnings, financial condition, restrictions imposed by its creditagreement, cash requirements, future prospects and other factors deemed relevant by its board of directors.The credit agreement permits payments of dividends as long as no default exists and the amount does not exceed$20.0 million per fiscal year provided that the amount of dividends may be increased by 25% of the consolidated netincome for the prior fiscal year if the Leverage Ratio (as defined in its credit agreement) for the four fiscal quartersof such fiscal year is less than or equal to 2.00:1.00.
95
HERBALIFE LTD.(FORMERLY WH HOLDINGS (CAYMAN ISLANDS) LTD.)
NOTES TO CONSOLIDATED FINANCIAL STATEMENTS — (Continued)
%%TRANSMSG*** Transmitting Job: V16934 PCN: 096000000 ***%%PCMSG|95 |00025|Yes|No|03/16/2006 21:00|0|0|Page is valid, no graphics -- Color: D|

In December 2004, the Company authorized 7.5 million preference shares at $0.002 par value and all of theauthorized preference shares were unissued. Preference shares may be issued from time to time in one or moreseries, each of such series to have such voting powers (full or limited or without voting powers), designations,preferences and relative, participating, optional or other special rights and qualifications, limitations or restrictions.
In December 2004, the Company completed an IPO and offered its common shares as part of a series ofrecapitalization transactions in connection with the IPO. See discussion under Note 1 to the Notes to ConsolidatedFinancial Statements for details on the recapitalization.
The Company had 69.9 million and 68.6 million common shares outstanding at December 31, 2005 and 2004,respectively, and did not have any common shares outstanding at December 31, 2003. The Company has five stockbased compensation plans which are the WH Holdings (Cayman Islands) Ltd. Stock Incentive Plan (the “Man-agement Plan”), the WH Holdings (Cayman Islands) Ltd. Independent Directors Stock Incentive Plan (the“Independent Directors Plan”), the Herbalife Ltd. 2004 Incentive Plan (the “2004 Stock Incentive Plan”), the2005 Stock Incentive Plan (the “2005 Stock Incentive Plan”) and the Herbalife Ltd. Executive Incentive Plan (the“Executive Incentive Plan”). The Management Plan provides for the grant of options to purchase common shares ofHerbalife to members of the Company’s management. The Independent Directors Plan provides for the grant ofoptions to purchase common shares of Herbalife to the Company’s independent directors. The 2004 Stock IncentivePlan is intended to replace the Management Plan and the Independent Directors Plan. No additional awards will bemade under either the Management Plan or the Independent Directors Plan. However, the shares remainingavailable for issuance under these plans will be absorbed by and become available for issuance under the 2004 StockIncentive Plan. The 2005 Stock Incentive Plan authorizes the issuance of 4.0 million common shares pursuant toawards, plus any shares that remain available for issuance under the 2004 Stock incentive Plan. The terms of the2005 Stock Incentive Plan are substantially similar to the terms of the 2004 Stock Incentive Plan. The purpose of theExecutive Incentive Plan is to govern the award and payment of annual bonuses to certain Company executives.
Taken together, 6.0 million common shares were available for grant under the five stock based compensationplans. As of December 31, 2005, the Company had granted options net of cancellations to acquire approximately12.3 million common shares under the five stock based compensation plans, which equals 17.7% of its Decem-ber 31, 2005 share capital.
96
HERBALIFE LTD.(FORMERLY WH HOLDINGS (CAYMAN ISLANDS) LTD.)
NOTES TO CONSOLIDATED FINANCIAL STATEMENTS — (Continued)
%%TRANSMSG*** Transmitting Job: V16934 PCN: 097000000 ***%%PCMSG|96 |00022|Yes|No|03/16/2006 21:00|0|0|Page is valid, no graphics -- Color: D|

Options outstanding at December 31, 2005, December 31, 2004 and December 31, 2003 and related optioninformation is as follows:
2005 OptionsWeighted Average
Exercise Price
Herbalife Common Shares
(In millions)
Outstanding at January 1 . . . . . . . . . . . . . . . . . . . . . . . . . . . . . . 9.8 $ 9.22
Granted . . . . . . . . . . . . . . . . . . . . . . . . . . . . . . . . . . . . . . . . . . . 2.1 $18.77
Exercised . . . . . . . . . . . . . . . . . . . . . . . . . . . . . . . . . . . . . . . . . . (1.2) $ 1.78
Canceled . . . . . . . . . . . . . . . . . . . . . . . . . . . . . . . . . . . . . . . . . . (0.5) $ 3.41
Outstanding at December 31 . . . . . . . . . . . . . . . . . . . . . . . . . . . . 10.2 $12.30
Available for grant at December 31 . . . . . . . . . . . . . . . . . . . . . . . 6.0
Total reserved shares . . . . . . . . . . . . . . . . . . . . . . . . . . . . . . . . . 16.2
Exercisable at December 31 . . . . . . . . . . . . . . . . . . . . . . . . . . . . 3.8 $ 9.12
Option prices per share
Granted . . . . . . . . . . . . . . . . . . . . . . . . . . . . . . . . . . . . . . . . . . . $14.85-$29.45
Exercised . . . . . . . . . . . . . . . . . . . . . . . . . . . . . . . . . . . . . . . . . . $ 0.88-$25.00
Weighted average fair value of options granted during the year . . $7.62
2004 OptionsWeighted Average
Exercise Price
Herbalife Common Shares
(In millions)
Outstanding at January 1 . . . . . . . . . . . . . . . . . . . . . . . . . . . . . . . 8.8 $ 6.34
Granted . . . . . . . . . . . . . . . . . . . . . . . . . . . . . . . . . . . . . . . . . . . . 2.8 $14.24
Exercised . . . . . . . . . . . . . . . . . . . . . . . . . . . . . . . . . . . . . . . . . . . (0.9) $ 1.97
Canceled . . . . . . . . . . . . . . . . . . . . . . . . . . . . . . . . . . . . . . . . . . . (0.9) $ 3.79
Outstanding at December 31 . . . . . . . . . . . . . . . . . . . . . . . . . . . . . 9.8 $ 9.22
Available for grant at December 31. . . . . . . . . . . . . . . . . . . . . . . . 3.6
Total reserved shares . . . . . . . . . . . . . . . . . . . . . . . . . . . . . . . . . . 13.4
Exercisable at December 31 . . . . . . . . . . . . . . . . . . . . . . . . . . . . . 2.8 $ 6.25
Option prices per share
Granted . . . . . . . . . . . . . . . . . . . . . . . . . . . . . . . . . . . . . . . . . . . . $8.02-$25.00
Exercised . . . . . . . . . . . . . . . . . . . . . . . . . . . . . . . . . . . . . . . . . . . $ 0.88-$9.00
Weighted average fair value of options granted during the year . . . $3.24
97
HERBALIFE LTD.(FORMERLY WH HOLDINGS (CAYMAN ISLANDS) LTD.)
NOTES TO CONSOLIDATED FINANCIAL STATEMENTS — (Continued)
%%TRANSMSG*** Transmitting Job: V16934 PCN: 098000000 ***%%PCMSG|97 |00021|Yes|No|03/16/2006 21:00|0|0|Page is valid, no graphics -- Color: D|

2003 OptionsWeighted Average
Exercise Price
Herbalife Common Shares
(In millions)
Outstanding at January 1 . . . . . . . . . . . . . . . . . . . . . . . . . . . . . . . 3.3 $2.36
Granted . . . . . . . . . . . . . . . . . . . . . . . . . . . . . . . . . . . . . . . . . . . . 6.1 $8.16
Exercised . . . . . . . . . . . . . . . . . . . . . . . . . . . . . . . . . . . . . . . . . . . — —
Canceled . . . . . . . . . . . . . . . . . . . . . . . . . . . . . . . . . . . . . . . . . . . (0.6) $ 2.3
Outstanding at December 31 . . . . . . . . . . . . . . . . . . . . . . . . . . . . . 8.8 $6.34
Available for grant at December 31. . . . . . . . . . . . . . . . . . . . . . . . 0.5
Total reserved shares . . . . . . . . . . . . . . . . . . . . . . . . . . . . . . . . . . 9.3
Exercisable at December 31 . . . . . . . . . . . . . . . . . . . . . . . . . . . . . 1.3 $2.28
Option prices per share
Granted . . . . . . . . . . . . . . . . . . . . . . . . . . . . . . . . . . . . . . . . . . . . $0.88-$24.64
Exercised . . . . . . . . . . . . . . . . . . . . . . . . . . . . . . . . . . . . . . . . . . . —
Weighted average fair value of options granted during the year . . . $0.48
The following table summarizes information regarding option groups outstanding at December 31, 2005:
Range of Exercise PriceOptions
Outstanding
Weighted AverageRemaining
Contractual LifeWeighted Average
Exercise PriceOptions
ExercisableWeighted Average
Exercise Price(In millions) (In millions)
$ 0.88-$ 3.52 . . . . . . 2.7 6.98 $ 2.57 1.7 $ 2.47
$ 5.00-$14.00 . . . . . . 2.3 7.98 $ 9.35 1.0 $ 8.69
$14.85-$15.50 . . . . . . 2.4 9.11 $15.25 0.2 $14.99
$15.78-$24.64 . . . . . . 2.2 7.88 $20.39 0.8 $20.68
$25.00-$29.45 . . . . . . 0.5 9.60 $28.16 0.1 $26.82
On December 1, 2004, the Company agreed with Whitney and GGC Administration, LLC to terminate themonitoring fees agreements in consideration for 0.7 million warrants. Each warrant gives the holder the ability topurchase one common share at a price of $15.50 per share. All of the 0.7 million warrants were outstanding atDecember 31, 2005. The fair value of the warrants granted was $4.11 per share, or approximately $2.9 million(included in fourth quarter 2004 selling, general and administrative expenses) which was determined using theBlack-Scholes option pricing model. The assumptions used for the valuation include: 30% price volatility; 3.72%risk free rate of return; 0% dividend yield and 5-year expected exercise term.
10. Segment Information
The Company is a network marketing company that sells a wide range of weight management products,nutritional supplements and personal care products within one industry segment as defined under SFAS No. 131,“Disclosures about Segments of an Enterprise and Related Information.” The Company’s products are manufac-tured by third party providers and then sold to independent distributors who sell Herbalife products to retailconsumers or other distributors.
The Company sells products in 60 countries throughout the world and is organized and managed by geographicregion. In the first quarter of 2003, the Company elected to aggregate its operating segments into one reportingsegment, as management believes that the Company’s operating segments have similar operating characteristics
98
HERBALIFE LTD.(FORMERLY WH HOLDINGS (CAYMAN ISLANDS) LTD.)
NOTES TO CONSOLIDATED FINANCIAL STATEMENTS — (Continued)
%%TRANSMSG*** Transmitting Job: V16934 PCN: 099000000 ***%%PCMSG|98 |00021|Yes|No|03/16/2006 21:00|0|0|Page is valid, no graphics -- Color: D|

and similar long term operating performance. In making this determination, management believes that the operatingsegments are similar in the nature of the products sold, the product acquisition process, the types of customersproducts are sold to, the methods used to distribute the products, and the nature of the regulatory environment.
Revenues reflect sales of products to distributors based on the distributors’ geographic location. Salesattributed to the United States is the same as reported in the geographic operating information.
The Company’s geographic operating information and sales by product line are as follows:
2003 2004 2005Year Ended December 31,
(In millions)Net Sales:United States . . . . . . . . . . . . . . . . . . . . . . . . . . . . . . . . . . . . . . . 274.9 $ 252.9 $ 284.7Japan . . . . . . . . . . . . . . . . . . . . . . . . . . . . . . . . . . . . . . . . . . . . . 119.3 98.7 94.7Mexico . . . . . . . . . . . . . . . . . . . . . . . . . . . . . . . . . . . . . . . . . . . . 73.6 102.4 218.9Others . . . . . . . . . . . . . . . . . . . . . . . . . . . . . . . . . . . . . . . . . . . . 691.6 855.7 968.5
Total Net Sales . . . . . . . . . . . . . . . . . . . . . . . . . . . . . . . . . . . . $1,159.4 $1,309.7 $1,566.8
Operating Margin(1):United States . . . . . . . . . . . . . . . . . . . . . . . . . . . . . . . . . . . . . . . 121.6 $ 101.9 $ 120.2Japan . . . . . . . . . . . . . . . . . . . . . . . . . . . . . . . . . . . . . . . . . . . . . 55.8 51.9 48.0Mexico . . . . . . . . . . . . . . . . . . . . . . . . . . . . . . . . . . . . . . . . . . . . 30.8 41.7 96.8Others . . . . . . . . . . . . . . . . . . . . . . . . . . . . . . . . . . . . . . . . . . . . 300.1 379.4 430.3
Total Operating Margin . . . . . . . . . . . . . . . . . . . . . . . . . . . . . . $ 508.3 $ 574.9 $ 695.3Selling, general and administrative expense . . . . . . . . . . . . . . . . . $ 401.3 $ 436.2 $ 476.3Interest expense net . . . . . . . . . . . . . . . . . . . . . . . . . . . . . . . . . . 41.5 123.3 43.9
Income before income taxes . . . . . . . . . . . . . . . . . . . . . . . . . . . . 65.5 15.4 175.1Income taxes . . . . . . . . . . . . . . . . . . . . . . . . . . . . . . . . . . . . . . . 28.7 29.7 82.0
Net Income (loss) . . . . . . . . . . . . . . . . . . . . . . . . . . . . . . . . . . . . $ 36.8 $ (14.3) $ 93.1
Net sales by product line:Weight management . . . . . . . . . . . . . . . . . . . . . . . . . . . . . . . . . . $ 500.1 $ 561.1 $ 680.7Inner nutrition. . . . . . . . . . . . . . . . . . . . . . . . . . . . . . . . . . . . . . . 505.1 562.0 646.8Outer Nutrition» . . . . . . . . . . . . . . . . . . . . . . . . . . . . . . . . . . . . . 105.7 123.1 163.4Literature, promotional and other(2) . . . . . . . . . . . . . . . . . . . . . . 48.5 63.5 75.9
Total Net Sales . . . . . . . . . . . . . . . . . . . . . . . . . . . . . . . . . . . . $1,159.4 $1,309.7 $1,566.8
Net sales by geographic region:Americas . . . . . . . . . . . . . . . . . . . . . . . . . . . . . . . . . . . . . . . . . . $ 424.4 $ 468.2 $ 681.7Europe . . . . . . . . . . . . . . . . . . . . . . . . . . . . . . . . . . . . . . . . . . . . 448.2 536.2 545.3Asia/Pacific Rim (excluding Japan) . . . . . . . . . . . . . . . . . . . . . . . 167.5 206.5 245.1Japan . . . . . . . . . . . . . . . . . . . . . . . . . . . . . . . . . . . . . . . . . . . . . 119.3 98.8 94.7
Total Net Sales . . . . . . . . . . . . . . . . . . . . . . . . . . . . . . . . . . . . $1,159.4 $1,309.7 $1,566.8
(1) Operating margin consists of net sales less cost of sales and royalty overrides.
(2) Product buybacks and returns in all product categories are included in the literature, promotional and othercategory.
99
HERBALIFE LTD.(FORMERLY WH HOLDINGS (CAYMAN ISLANDS) LTD.)
NOTES TO CONSOLIDATED FINANCIAL STATEMENTS — (Continued)
%%TRANSMSG*** Transmitting Job: V16934 PCN: 100000000 ***%%PCMSG|99 |00025|Yes|No|03/16/2006 21:00|0|0|Page is valid, no graphics -- Color: D|

Year EndedDecember 31,
Year EndedDecember 31,
Year EndedDecember 31,
2003 2004 2005
(In millions)
Capital Expenditures:United States . . . . . . . . . . . . . . . . . . . . . . . . . . . . . . . . . $17.3 $25.5 $20.5
Japan . . . . . . . . . . . . . . . . . . . . . . . . . . . . . . . . . . . . . . 0.2 0.1 2.6
Mexico . . . . . . . . . . . . . . . . . . . . . . . . . . . . . . . . . . . . . 0.2 0.5 0.8
Others . . . . . . . . . . . . . . . . . . . . . . . . . . . . . . . . . . . . . . 2.7 4.2 8.7
Total Capital Expenditures . . . . . . . . . . . . . . . . . . . . . $20.4 $30.3 $32.6
2004 2005December 31,
(In millions)
Total Assets:United States . . . . . . . . . . . . . . . . . . . . . . . . . . . . . . . . . . . . . . . . . . . . . . . . . . . $587.8 $520.1
Japan . . . . . . . . . . . . . . . . . . . . . . . . . . . . . . . . . . . . . . . . . . . . . . . . . . . . . . . . . 60.3 50.8
Mexico . . . . . . . . . . . . . . . . . . . . . . . . . . . . . . . . . . . . . . . . . . . . . . . . . . . . . . . 27.5 52.5
Others . . . . . . . . . . . . . . . . . . . . . . . . . . . . . . . . . . . . . . . . . . . . . . . . . . . . . . . . 273.1 214.4
Total Assets . . . . . . . . . . . . . . . . . . . . . . . . . . . . . . . . . . . . . . . . . . . . . . . . . . $948.7 $837.8
Goodwill:United States . . . . . . . . . . . . . . . . . . . . . . . . . . . . . . . . . . . . . . . . . . . . . . . . . . . $ 46.0 $ 36.8
Japan . . . . . . . . . . . . . . . . . . . . . . . . . . . . . . . . . . . . . . . . . . . . . . . . . . . . . . . . . 22.7 18.2
Mexico . . . . . . . . . . . . . . . . . . . . . . . . . . . . . . . . . . . . . . . . . . . . . . . . . . . . . . . 10.2 8.2
Others . . . . . . . . . . . . . . . . . . . . . . . . . . . . . . . . . . . . . . . . . . . . . . . . . . . . . . . . 88.6 71.0
Total Goodwill . . . . . . . . . . . . . . . . . . . . . . . . . . . . . . . . . . . . . . . . . . . . . . . . $167.5 $134.2
As of December 31, 2005, the net property located in the U.S. and in all foreign countries was $47.0 millionand $17.9 million, respectively. As of December 31, 2004, the net property located in the U.S. and in all foreigncountries was $43.2 million and $12.2 million, respectively.
11. Derivative Instruments and Hedging Activities
The Company designates certain derivatives as cash flow hedges. The Company engages in a foreign exchangehedging strategy for which the hedged transactions are forecasted foreign currency denominated intercompanytransactions. The hedged risk is the variability of the forecasted foreign currency cash flows where the hedgingstrategy involves the purchase of average rate options. The Company also engages in an interest rate hedgingstrategy for which the hedged transactions are forecasted interest payments on the Company’s variable rate termloan. The hedged risk is the variability of forecasted interest rate cash flows, where the hedging strategy involves thepurchase of interest rate swaps. As of December 31, 2005, the Company did not have any outstanding cash flowhedges on foreign exchange exposure. For the outstanding cash flow hedges on interest rate exposures atDecember 31, 2004 and December 31, 2005, the maximum length of time over which the Company is hedgingthese exposures is approximately three years. The interest rate swap outstanding as of December 31, 2005 wasaccounted for under the shortcut method, as defined by SFAS No. 133, which assumes the hedge to be perfectivelyeffective. Consequently, all changes in the fair value of the derivative are deferred and recorded in other
100
HERBALIFE LTD.(FORMERLY WH HOLDINGS (CAYMAN ISLANDS) LTD.)
NOTES TO CONSOLIDATED FINANCIAL STATEMENTS — (Continued)
%%TRANSMSG*** Transmitting Job: V16934 PCN: 101000000 ***%%PCMSG|100 |00019|Yes|No|03/16/2006 21:00|0|0|Page is valid, no graphics -- Color: D|

comprehensive income (“OCI”) until the related forecasted transaction is recognized in the consolidated statementsof income. The estimated net amount of existing gains expected to be reclassified into earnings over the next12 months is $0.1 million. At December 31, 2005, the pre-tax OCI balance related to the cash flow hedge was$0.2 million ($0.1 million after-tax).
The Company designates certain derivatives as free standing derivatives for which hedge accounting does notapply. The changes in the fair market value of the derivatives are recorded in the Company’s statements of income.The Company purchases average rate put options, which give the Company the right, but not the obligation, to sellforeign currency at a specified exchange rate (“strike rate”). These contracts provide protection in the event theforeign currency weakens beyond the strike rate. The Company also uses foreign currency forward contracts, whichgive the Company the obligation to buy or sell foreign currency at a specified time and rate. The contracts are usedto protect against changes in the functional currency equivalent value of inter-company or third party nonfunctionalcurrency payables and receivables. In December of 2005, the Company entered into a short term interest rate capagreement, which is not designated under hedge accounting. The cap provides protection in the event thethree month LIBOR rate were to increase beyond 4.75%, and is in place, along with the interest rate swap, tofulfill the Company’s obligation to hedge at least 25% of the term debt notional amount. The fair values of theoption, forward contracts and interest rate cap are based on third-party bank quotes.
The following table provides information about the details of the Company’s option contracts. Certain optioncontracts were designated as cash flow hedges or fair value hedges. Certain option contracts were freestandingderivatives.
Foreign Currency CoverageAverage
Strike Price Fair Value Maturity Date(In millions) (In millions)
At December 31, 2005Purchase Puts (Company may sell
MXP/buy USD)
Mexican Peso. . . . . . . . . . . . . . . . . . . . . $ 6.0 10.53-10.79 $0.1 Jan-Mar 2006
Mexican Peso. . . . . . . . . . . . . . . . . . . . . $ 5.5 10.64-10.82 $0.1 Apr-Jun 2006
Mexican Peso. . . . . . . . . . . . . . . . . . . . . $ 4.5 10.74-10.86 $0.1 Jul-Sep 2006
Mexican Peso. . . . . . . . . . . . . . . . . . . . . $ 4.0 10.78-10.90 $0.1 Oct-Dec 2006
$20.0 $0.4
101
HERBALIFE LTD.(FORMERLY WH HOLDINGS (CAYMAN ISLANDS) LTD.)
NOTES TO CONSOLIDATED FINANCIAL STATEMENTS — (Continued)
%%TRANSMSG*** Transmitting Job: V16934 PCN: 102000000 ***%%PCMSG|101 |00018|Yes|No|03/16/2006 21:00|0|0|Page is valid, no graphics -- Color: D|

Foreign Currency CoverageAverage
Strike Price Fair Value Maturity Date(In millions) (In millions)
At December 31, 2004Purchase Puts (Company may sell
yen/buy USD)
Japanese yen . . . . . . . . . . . . . . . . . . . $ 4.5 102.06-103.43 $0.1 Jan-Mar 2005
Japanese yen . . . . . . . . . . . . . . . . . . . 4.5 101.31-102.63 0.1 Apr-Jun 2005
Japanese yen . . . . . . . . . . . . . . . . . . . 4.5 100.52-101.79 0.1 Jul-Sep 2005
Japanese yen . . . . . . . . . . . . . . . . . . . 4.5 99.70-100.90 0.1 Oct-Dec 2005
$18.0 $0.4
Purchase Puts (Company may selleuro/buy USD)
Euro. . . . . . . . . . . . . . . . . . . . . . . . . . $10.2 1.31-1.35 $ — Jan-Mar 2005
Euro. . . . . . . . . . . . . . . . . . . . . . . . . . 10.2 1.32-1.35 0.1 Apr-Jun 2005
Euro. . . . . . . . . . . . . . . . . . . . . . . . . . 10.2 1.31-1.36 0.2 Jul-Sep 2005
Euro. . . . . . . . . . . . . . . . . . . . . . . . . . 10.2 1.32-1.36 0.3 Oct-Dec 2005
$40.8 $0.6
Foreign exchange forward contracts are also used to hedge advances between subsidiaries. The objective ofthese contracts is to neutralize the impact of foreign currency movements on the subsidiary’s operating results. Thefair value of forward contracts is based on third-party bank quotes.
102
HERBALIFE LTD.(FORMERLY WH HOLDINGS (CAYMAN ISLANDS) LTD.)
NOTES TO CONSOLIDATED FINANCIAL STATEMENTS — (Continued)
%%TRANSMSG*** Transmitting Job: V16934 PCN: 103000000 ***%%PCMSG|102 |00017|Yes|No|03/16/2006 21:00|0|0|Page is valid, no graphics -- Color: D|

The tables below describe the forward contracts that were outstanding as of the dates indicated. All forwardcontracts were freestanding derivatives.
Foreign CurrencyContract
DateForwardPosition
MaturityDate
ContractRate
FairValue
(In millions) (In millions)
At December 31, 2005Buy SEK sell USD. . . . . . . . . . . . . . . 12/28/05 $ 2.3 1/31/06 7.93 $ 2.3
Buy EUR sell USD . . . . . . . . . . . . . . 12/28/05 $ 0.9 1/31/06 1.19 $ 0.9
Buy GBP sell USD . . . . . . . . . . . . . . 12/28/05 $ 3.1 1/31/06 1.72 $ 3.1
Buy KRW sell USD . . . . . . . . . . . . . . 12/28/05 $ 6.0 1/31/06 1,012.05 $ 6.0
Buy JPY sell USD . . . . . . . . . . . . . . . 12/28/05 $ 4.1 1/31/06 117.39 $ 4.1
Buy CNY sell USD . . . . . . . . . . . . . . 12/28/05 $15.0 1/31/06 8.03 $15.0
Buy INR sell USD . . . . . . . . . . . . . . . 12/28/05 $ 5.3 1/31/06 45.34 $ 5.3
Buy CAD sell Euro . . . . . . . . . . . . . . 12/30/05 $ 1.5 1/31/06 1.38 $ 1.5
Buy NZD sell Euro . . . . . . . . . . . . . . 12/30/05 $ 0.7 1/31/06 1.75 $ 0.7
Buy AUD sell Euro . . . . . . . . . . . . . . 12/30/05 $ 0.7 1/31/06 1.63 $ 0.7
Buy TWD sell Euro . . . . . . . . . . . . . . 12/30/05 $ 3.3 1/31/06 39.15 $ 3.4
Buy USD sell Euro . . . . . . . . . . . . . . 12/30/05 $ 0.7 1/31/06 1.19 $ 0.7
Buy NOK sell Euro . . . . . . . . . . . . . . 12/30/05 $ 1.5 1/31/06 8.05 $ 1.5
Buy DKK sell Euro . . . . . . . . . . . . . . 12/30/05 $ 1.3 1/31/06 7.46 $ 1.3Buy PLN sell Euro . . . . . . . . . . . . . . . 12/30/05 $ 0.8 1/31/06 3.84 $ 0.8
Buy Euro sell USD . . . . . . . . . . . . . . 12/30/05 $13.4 1/31/06 1.19 $13.7
Buy HUF sell Euro . . . . . . . . . . . . . . 12/30/05 $ 0.8 1/31/06 252.83 $ 0.8
Buy EUR sell USD . . . . . . . . . . . . . . 12/28/05 $ 9.5 1/31/06 1.19 $ 9.5
Buy Euro sell SEK. . . . . . . . . . . . . . . 12/28/05 $ 0.6 1/31/06 9.42 $ 0.6
Buy YEN sell CHF . . . . . . . . . . . . . . 12/28/05 $22.6 1/31/06 89.40 $22.5
Buy Euro sell GBP . . . . . . . . . . . . . . . 12/28/05 $ 0.8 1/31/06 0.69 $ 0.8
103
HERBALIFE LTD.(FORMERLY WH HOLDINGS (CAYMAN ISLANDS) LTD.)
NOTES TO CONSOLIDATED FINANCIAL STATEMENTS — (Continued)
%%TRANSMSG*** Transmitting Job: V16934 PCN: 104000000 ***%%PCMSG|103 |00015|Yes|No|03/16/2006 21:00|0|0|Page is valid, no graphics -- Color: D|

Foreign CurrencyContract
DateForwardPosition
MaturityDate
ContractRate
FairValue
(In millions) (In millions)
At December 31, 2004Buy EUR sell USD . . . . . . . . . . . . . . . 12/22/04 $ 3.4 1/24/05 1.34 $ 3.5
Buy GBP sell USD . . . . . . . . . . . . . . . 12/22/04 $ 3.4 1/24/05 1.91 $ 3.5
Buy JPY sell USD . . . . . . . . . . . . . . . . 12/22/04 $24.1 1/24/05 104.00 $24.5
Buy SEK sell USD . . . . . . . . . . . . . . . 12/22/04 $ 3.0 1/24/05 6.74 $ 3.0
Buy Euro sell Rouble. . . . . . . . . . . . . . 12/23/04 $ 1.3 1/24/05 37.74 $ 1.3
Buy MXP sell EURO. . . . . . . . . . . . . . 12/06/04 $10.2 1/5/05 15.02 $10.1
Buy DKK sell EURO. . . . . . . . . . . . . . 12/06/04 $ 0.4 1/5/05 7.43 $ 0.4
Buy AUD sell EURO. . . . . . . . . . . . . . 12/06/04 $ 2.7 1/5/05 1.74 $ 2.7
Buy NOK sell EURO. . . . . . . . . . . . . . 12/06/04 $ 1.8 1/5/05 8.15 $ 1.8
Buy TWD sell EURO . . . . . . . . . . . . . 12/06/04 $ 1.1 1/5/05 42.94 $ 1.1
Buy CAD sell EURO. . . . . . . . . . . . . . 12/21/04 $ 1.5 1/7/05 1.64 $ 1.5
Buy NZD sell EURO . . . . . . . . . . . . . . 12/21/04 $ 0.4 1/7/05 1.88 $ 0.4
All foreign subsidiaries excluding those operating in hyper-inflationary environments designate their localcurrencies as their functional currency. At year end, the total amount of cash held by foreign subsidiaries primarilyin Japan, Brazil, Mexico and Korea was $62.7 million, of which $4.5 million was maintained or invested inU.S. dollars.
The interest rate caps and swaps are used to hedge the interest rate exposure on the variable interest rate termloan. The table below describes the interest rate caps and swaps that were outstanding:
Interest RateNotionalAmount
Cap/SwapRate
FairValue
MaturityDate
(In millions) (In millions)
At December 31, 2005Interest Rate Cap . . . . . . . . . . . . . . . . . . . . . . . $ 2.5 4.75% $ — 1/31/2006
Interest Rate Swap . . . . . . . . . . . . . . . . . . . . . . $20.0 4.23% $0.2 1/28/2008
12. Income Taxes
The components of income before income taxes are (in millions):
2003 2004 2005
Year EndedDecember 31,
Domestic . . . . . . . . . . . . . . . . . . . . . . . . . . . . . . . . . . . . . . . . . . . . . . . . $14.9 $ (9.5) $166.0
Foreign . . . . . . . . . . . . . . . . . . . . . . . . . . . . . . . . . . . . . . . . . . . . . . . . . 50.7 24.9 9.1
$65.6 $15.4 $175.1
104
HERBALIFE LTD.(FORMERLY WH HOLDINGS (CAYMAN ISLANDS) LTD.)
NOTES TO CONSOLIDATED FINANCIAL STATEMENTS — (Continued)
%%TRANSMSG*** Transmitting Job: V16934 PCN: 105000000 ***%%PCMSG|104 |00020|Yes|No|03/16/2006 21:00|0|0|Page is valid, no graphics -- Color: D|

Income taxes are as follows (in millions):
2003 2004 2005Year Ended December 31,
Current:Foreign . . . . . . . . . . . . . . . . . . . . . . . . . . . . . . . . . . . . . . . . . . . . . . . . . . $24.7 $22.0 $ 34.1
Federal . . . . . . . . . . . . . . . . . . . . . . . . . . . . . . . . . . . . . . . . . . . . . . . . . . 14.5 2.4 26.2
State . . . . . . . . . . . . . . . . . . . . . . . . . . . . . . . . . . . . . . . . . . . . . . . . . . . . 1.7 1.7 5.3
Deferred:Foreign . . . . . . . . . . . . . . . . . . . . . . . . . . . . . . . . . . . . . . . . . . . . . . . . . . (4.3) 3.6 (14.9)
Federal . . . . . . . . . . . . . . . . . . . . . . . . . . . . . . . . . . . . . . . . . . . . . . . . . . (8.2) 1.1 31.9
State . . . . . . . . . . . . . . . . . . . . . . . . . . . . . . . . . . . . . . . . . . . . . . . . . . . . 0.3 (1.1) (0.6)
$28.7 $29.7 $ 82.0
The tax effects of temporary differences which gave rise to deferred income tax assets and liabilities are asfollows (in millions):
2004 2005
Year EndedDecember 31,
Deferred income tax assets:Accruals not currently deductible . . . . . . . . . . . . . . . . . . . . . . . . . . . . . . . . . . . . $ 23.3 $ 19.8
Foreign tax credits and tax loss carryforwards of certain foreign subsidiaries . . . . 54.2 9.4
Depreciation/amortization . . . . . . . . . . . . . . . . . . . . . . . . . . . . . . . . . . . . . . . . . — 6.2
Deferred compensation plan. . . . . . . . . . . . . . . . . . . . . . . . . . . . . . . . . . . . . . . . 5.4 2.0
Deferred interest expense. . . . . . . . . . . . . . . . . . . . . . . . . . . . . . . . . . . . . . . . . . 5.7 3.2Accrued state income taxes . . . . . . . . . . . . . . . . . . . . . . . . . . . . . . . . . . . . . . . . — 4.7
Accrued vacation. . . . . . . . . . . . . . . . . . . . . . . . . . . . . . . . . . . . . . . . . . . . . . . . 1.6 0.1Other . . . . . . . . . . . . . . . . . . . . . . . . . . . . . . . . . . . . . . . . . . . . . . . . . . . . . . . . — 7.7
Gross deferred income tax assets . . . . . . . . . . . . . . . . . . . . . . . . . . . . . . . . . . . . 90.2 53.1
Less: valuation allowance . . . . . . . . . . . . . . . . . . . . . . . . . . . . . . . . . . . . . . . . . (54.2) (6.7)
Net deferred income tax assets. . . . . . . . . . . . . . . . . . . . . . . . . . . . . . . . . . . . . . $ 36.0 $ 46.4
Deferred income tax liabilities:Intangible assets . . . . . . . . . . . . . . . . . . . . . . . . . . . . . . . . . . . . . . . . . . . . . . . . $ 130.5 $123.8
Inventory deductibles. . . . . . . . . . . . . . . . . . . . . . . . . . . . . . . . . . . . . . . . . . . . . 6.1 2.7
Unrealized foreign exchange . . . . . . . . . . . . . . . . . . . . . . . . . . . . . . . . . . . . . . . 6.1 3.1
Other . . . . . . . . . . . . . . . . . . . . . . . . . . . . . . . . . . . . . . . . . . . . . . . . . . . . . . . . 1.8 5.9
$ 144.5 $135.5
Net . . . . . . . . . . . . . . . . . . . . . . . . . . . . . . . . . . . . . . . . . . . . . . . . . . . . . . . . . . $(108.5) $ (89.1)
At December 31, 2005, the Company’s deferred income tax asset for foreign net operating loss carry-forwardsof certain foreign subsidiaries of $9.4 million was reduced by a valuation allowance of $6.7 million. If tax benefitsare recognized in the future through reduction of the valuation allowance, $0.1 million of such benefits will beallocated to reduce goodwill.
105
HERBALIFE LTD.(FORMERLY WH HOLDINGS (CAYMAN ISLANDS) LTD.)
NOTES TO CONSOLIDATED FINANCIAL STATEMENTS — (Continued)
%%TRANSMSG*** Transmitting Job: V16934 PCN: 106000000 ***%%PCMSG|105 |00017|Yes|No|03/16/2006 21:00|0|0|Page is valid, no graphics -- Color: D|

During 2005, the Company recorded a decrease in the valuation allowance of $47.5 million. Of this decrease,$33.1 million was allocated to reduce goodwill as the valuation allowance related to preacquisition carryoverattributes. The decrease was primarily due to increased actual and forecast foreign source income from operations.
During 2005, the Company recorded a deferred tax liability of $3.0 million in connection with foreigncurrency translation. The total deferred tax liability at December 31, 2005, relating to accumulated comprehensiveincome was $3.1 million.
The net foreign operating loss carry-forwards of $26.5 million expire in varying amounts between 2006 andindefinitely. The foreign tax credit carry-forwards expire in varying amounts between 2010 and 2013. Realization ofthe income tax carry-forwards is dependent on generating sufficient taxable income prior to expiration of the carry-forwards. Although realization is not assured, management believes it is more likely than not that the net carryingvalue of the income tax carry-forwards will be realized. The amount of the income tax carry-forwards that isconsidered realizable, however, could be reduced if estimates of future taxable income during the carry-forwardperiod are reduced.
Deferred income taxes of $1.1 million have been provided on the undistributed earnings of non-U.S. subsid-iaries that are not expected to be permanently reinvested in such subsidiaries.
The applicable statutory rate in the Cayman Islands was zero for Herbalife Ltd. for the years endedDecember 31, 2005, 2004 and 2003. For purposes of the reconciliation between provision for income taxes atthe statutory and the effective tax rate, a national U.S. 35% rate is applied as follows:
2003 2004 2005Year Ended December 31,
(In millions)
Tax expense at United States statutory rate . . . . . . . . . . . . . . . . . . . . . . . $ 22.9 $ 5.4 $ 61.3Increase (decrease) in tax resulting from:
Differences between U.S. and foreign tax rates on foreign income,including withholding taxes . . . . . . . . . . . . . . . . . . . . . . . . . . . . . . . . 3.9 18.5 16.5
U.S. tax on foreign income and foreign tax credits . . . . . . . . . . . . . . . . . 4.3 4.1 3.7
Increase (decrease) in valuation allowances . . . . . . . . . . . . . . . . . . . . . . . 7.7 3.8 (14.5)
State taxes, net of federal benefit . . . . . . . . . . . . . . . . . . . . . . . . . . . . . . 1.3 0.5 3.6
Intercompany sale of branch . . . . . . . . . . . . . . . . . . . . . . . . . . . . . . . . . . — — 5.5
Extraterritorial income exclusion . . . . . . . . . . . . . . . . . . . . . . . . . . . . . . (10.6) (3.2) (5.6)
Non-deductible expenses . . . . . . . . . . . . . . . . . . . . . . . . . . . . . . . . . . . . — — 4.8
Other . . . . . . . . . . . . . . . . . . . . . . . . . . . . . . . . . . . . . . . . . . . . . . . . . . . (0.8) 0.6 6.7
Total . . . . . . . . . . . . . . . . . . . . . . . . . . . . . . . . . . . . . . . . . . . . . . . . . $ 28.7 $29.7 $ 82.0
13. Restructuring Reserve
As of the date of the Acquisition, the Company began to assess and formulate a plan to reduce costs of thebusiness and recorded a severance and restructuring accrual as part of the cost of the Acquisition. The accruedseverance is for employees including executives, corporate functions and administrative support that wereidentified at the time of the Acquisition. Actions required by the plan of termination began immediately afterconsummation of the transaction. The balance of the restructuring reserve at December 31, 2005, was zero.
106
HERBALIFE LTD.(FORMERLY WH HOLDINGS (CAYMAN ISLANDS) LTD.)
NOTES TO CONSOLIDATED FINANCIAL STATEMENTS — (Continued)
%%TRANSMSG*** Transmitting Job: V16934 PCN: 107000000 ***%%PCMSG|106 |00016|Yes|No|03/16/2006 21:00|0|0|Page is valid, no graphics -- Color: D|

The following table summarizes the activity in the Company’s restructuring accrual subsequent to July 31,2002 during each of the years in the three years ended December 31, 2005 (in millions):
January 1,2003 to
December 31,2003
January 1,2004 to
December 31,2004
January 1,2005 to
December 31,2005
Beginning balance . . . . . . . . . . . . . . . . . . . . . . . . . . . . . $ 8.7 $ 2.5 $ 0.7
Reduction of accrual . . . . . . . . . . . . . . . . . . . . . . . . . . . — — (0.4)
Payments made . . . . . . . . . . . . . . . . . . . . . . . . . . . . . . . (6.2) (1.8) (0.3)
$ 2.5 $ 0.7 $ 0.0
14. Quarterly Information (Unaudited)2004 2005
(In millions, exceptper share data)
First Quarter Ended March 31Net sales . . . . . . . . . . . . . . . . . . . . . . . . . . . . . . . . . . . . . . . . . . . . . . . . . . . . . . $324.1 $372.1Gross profit . . . . . . . . . . . . . . . . . . . . . . . . . . . . . . . . . . . . . . . . . . . . . . . . . . . . 260.4 296.3Net income (loss) . . . . . . . . . . . . . . . . . . . . . . . . . . . . . . . . . . . . . . . . . . . . . . . . (0.5) 13.3Earnings (loss) per share
Basic . . . . . . . . . . . . . . . . . . . . . . . . . . . . . . . . . . . . . . . . . . . . . . . . . . . . . . . $ (0.01) $ 0.19Diluted . . . . . . . . . . . . . . . . . . . . . . . . . . . . . . . . . . . . . . . . . . . . . . . . . . . . . . $ (0.01) $ 0.19
Second Quarter Ended June 30Net sales . . . . . . . . . . . . . . . . . . . . . . . . . . . . . . . . . . . . . . . . . . . . . . . . . . . . . . $324.2 $384.7Gross profit . . . . . . . . . . . . . . . . . . . . . . . . . . . . . . . . . . . . . . . . . . . . . . . . . . . . 257.9 307.3Net income . . . . . . . . . . . . . . . . . . . . . . . . . . . . . . . . . . . . . . . . . . . . . . . . . . . . 12.1 22.8Earnings per share
Basic . . . . . . . . . . . . . . . . . . . . . . . . . . . . . . . . . . . . . . . . . . . . . . . . . . . . . . . $ 0.23 $ 0.33Diluted . . . . . . . . . . . . . . . . . . . . . . . . . . . . . . . . . . . . . . . . . . . . . . . . . . . . . . $ 0.22 $ 0.32
Third Quarter Ended September 30Net sales . . . . . . . . . . . . . . . . . . . . . . . . . . . . . . . . . . . . . . . . . . . . . . . . . . . . . . $319.8 $401.0Gross profit . . . . . . . . . . . . . . . . . . . . . . . . . . . . . . . . . . . . . . . . . . . . . . . . . . . . 250.8 321.5Net income . . . . . . . . . . . . . . . . . . . . . . . . . . . . . . . . . . . . . . . . . . . . . . . . . . . . 11.5 27.1Earnings per share
Basic . . . . . . . . . . . . . . . . . . . . . . . . . . . . . . . . . . . . . . . . . . . . . . . . . . . . . . . $ 0.22 $ 0.39Diluted . . . . . . . . . . . . . . . . . . . . . . . . . . . . . . . . . . . . . . . . . . . . . . . . . . . . . . $ 0.21 $ 0.37
Fourth Quarter Ended December 31Net sales . . . . . . . . . . . . . . . . . . . . . . . . . . . . . . . . . . . . . . . . . . . . . . . . . . . . . . $341.6 $409.0Gross profit . . . . . . . . . . . . . . . . . . . . . . . . . . . . . . . . . . . . . . . . . . . . . . . . . . . . 270.7 325.9Net income (loss) . . . . . . . . . . . . . . . . . . . . . . . . . . . . . . . . . . . . . . . . . . . . . . . . (37.4) 30.0Earnings (loss) per share
Basic . . . . . . . . . . . . . . . . . . . . . . . . . . . . . . . . . . . . . . . . . . . . . . . . . . . . . . . $ (0.68) $ 0.43Diluted . . . . . . . . . . . . . . . . . . . . . . . . . . . . . . . . . . . . . . . . . . . . . . . . . . . . . . $ (0.68) $ 0.41
107
HERBALIFE LTD.(FORMERLY WH HOLDINGS (CAYMAN ISLANDS) LTD.)
NOTES TO CONSOLIDATED FINANCIAL STATEMENTS — (Continued)
%%TRANSMSG*** Transmitting Job: V16934 PCN: 108000000 ***%%PCMSG|107 |00019|Yes|No|03/16/2006 21:00|0|0|Page is valid, no graphics -- Color: D|

SIGNATURES
Pursuant to the requirements of Section 13 or 15(d) of the Securities Exchange Act of 1934, the Registrant hasduly caused this report to be signed on its behalf by the undersigned, thereto duly authorized.
HERBALIFE Ltd.
By: /s/ RICHARD GOUDIS
Richard GoudisChief Financial Officer
Dated: February 28, 2006
Pursuant to the requirements of the Securities Exchange Act of 1934, this report has been signed below by thefollowing persons on behalf of the Registrant and in the capacities and on the date indicated.
Signature Title Date
/s/ MICHAEL O. JOHNSON
Michael O. Johnson
Chief Executive Officer, Director(Principal Executive Offices)
February 28, 2006
/s/ RICHARD GOUDISRichard Goudis
Chief Financial Officer (PrincipalFinancial Officer)
February 28, 2006
/s/ DAVID PEZZULLO
David Pezzullo
Chief Accounting Officer (PrincipalAccounting Officer)
February 28, 2006
/s/ PETER CASTLEMAN
Peter Castleman
Director, Chairman of the Board February 28, 2006
/s/ KEN DIEKROEGER
Ken Diekroeger
Director February 28, 2006
/s/ JAMES FORDYCE
James Fordyce
Director February 28, 2006
/s/ JESSE ROGERS
Jesse Rogers
Director February 28, 2006
/s/ CHARLES ORR
Charles Orr
Director February 28, 2006
/s/ PETER MASLEN
Peter Maslen
Director February 28, 2006
/s/ RICHARD BERMINGHAM
Richard Bermingham
Director February 28, 2006
/s/ LEROY BARNES
Leroy Barnes
Director February 28, 2006
/s/ LEON WAISBEIN
Leon Waisbein
Director February 28, 2006
/s/ JOHN TARTOL
John Tartol
Director February 28, 2006
108
%%TRANSMSG*** Transmitting Job: V16934 PCN: 109000000 ***%%PCMSG|108 |00016|Yes|No|03/16/2006 21:00|0|0|Page is valid, no graphics -- Color: D|

Senior Management
MICHAEL O. JOHNSONChief Executive OfficerDirector
GREGORY L. PROBERTPresident, Chief Operating Officer
RICHARD GOUDISChief Financial Officer
BRETT R. CHAPMANGeneral Counsel, Corporate Secretary
PAUL NOACKChief Strategic Officer
STEVE HENIG PH.D.Chief Scientific Officer
Board of Directors
PETER CASTLEMANChairman of the BoardChairman, Corporate Governanceand Nominating Committee
LEROY BARNESMember, Audit CommitteeMember, Corporate Governanceand Nominating Committee
RICHARD BERMINGHAMChairman, Audit CommitteeMember, Compensation Committee
KEN DIEKROEGERMember, Corporate Governanceand Nominating Committee
JAMES FORDYCEMember, Compensation Committee
MICHAEL O. JOHNSONMember, Corporate Governanceand Nominating Committee
PETER MASLENMember, Audit CommitteeMember, Compensation Committee
CHARLES ORR
JESSE ROGERSChairman, Compensation Committee
JOHN TARTOL
LEON WAISBEIN
Corporate Information
CORPORATE OFFICESHerbalife Ltd.1800 Century Park EastLos Angeles, CA 90067
INDEPENDENT ACCOUNTANTSKPMG LLP355 South Grand AvenueLos Angeles, California 90071
SECURITIES COUNSELGibson, Dunn & Crutcher LLP2029 Century Park EastLos Angeles, California 90067
COMMON STOCKNYSE symbol HLF
TRANSFER AGENT (AND REGISTRAR)Mellon Investor Services LLC480 Washington BoulevardJersey City, NJ 07310
NUMBER OF EMPLOYEES2,900
NUMBER OF SHAREHOLDERS1,300
FORM 10-K AND CERTIFICATIONSThe Company filed its Sarbanes-Oxley Act Sec-tion Certifications regarding the quality of the Com-pany’s public disclosure with the Securities andExchange Commission as exhibits to the Company’sAnnual Report on Form 10K for the year endedDecember 31, 2005. The Company submitted to theNew York Stock Exchange the required certification ofthe Company’s CEO that as of November 21, 2005, thedate of the certification, the CEO was not aware of anyviolation by the Company of the New York StockExchange corporate governance listing standards.
A Copy of the Company’s Annual Report onForm 10-K for the year ended December 31, 2005,as filed with the Securities & Exchange Commission,will be sent to shareholders free of charge upon writtenrequest to the Company’s corporate offices, attention:Investor Relations.
%%TRANSMSG*** Transmitting Job: V16934 PCN: 200000000 ***%%PCMSG| |00004|Yes|No|03/17/2006 13:52|0|0|Page is valid, no graphics -- Color: D|

Herbal i fe Ltd.1 8 0 0 C E N T U R Y P A R K E A S T
L O S A N G E L E S , C A L I F O R N I A 9 0 0 6 73 1 0 . 4 1 0 . 9 6 0 0
W W W . H E R B A L I F E . C O M
%%TRANSMSG*** Transmitting Job: V16934 PCN: 201000000 ***%%PCMSG| |00001|Yes|No|03/16/2006 18:23|0|0|Page/graphics valid 03/16/2006 19:13 -- Color: D|