Herbalife Ltd. (HLF) $59.55
10
Herbalife Ltd. (HLF) $59.55 U.S. Dollar | Bmrk/Ind: FactSet Country / Distribution Services SEC As of: 22 Jul '14 Sector Industry Mkt Cap (M) EV (M) Sales (M) Distribution Services Food Distributors $5,847 $6,434 $4,964 Herbalife Ltd. is a global nutrition company. It offers a range of sciencebased weight management products, nutritional supplements and personal care products intended to support a healthy lifestyle. The company's product development is focused on four principal categories: weight management; targeted nutrition, including everyday wellness and healthy aging; energy, sports and fitness and outer nutrition that capitalize on the mega trends of obesity and antiaging. Herbalife was founded by Mark Reynolds Hughes in 1980 and is headquartered in George Town, Cayman Islands. $59.60 YTD 24.3% 3M 4.0% 1Y 6.8% Beta 2.51 FY1 PE 8.6x Profile Trading Information Current Price $59.60 52 Wk Range $49.35 83.51 Avg Daily Vol (3m) 1.59 (M) Short Int (% of Float) 28.2% Key Statistics Mkt Value (M) $5,847 Ent Value (M) $6,434 Shares Out (000) 98,107 Dividend (Ann) $0.00 Div Yld 0.0% Estimates EPS (FY0) $5.37 EPS (FY1) $6.29 EPS (FY2) $7.24 Coverage 4 Analysts Target Price $85.50 LT Growth Rate 19.0% Avg Rating Buy (1.20) Valuation 5Y Trend Current vs. Ind vs. Bmrk P/E (LTM) 13.1 0.6 0.7 P/E (NTM) 8.7 0.5 0.5 P/Sales 1.2 3.5 0.8 P/Bk 143.4 40.4 103.4 P/CF 7.3 0.5 0.7 EV/EBITDA 8.3 0.7 0.8 EV/Sales 1.3 3.2 0.5 Profitability (%) 10Y Trend LTM Ind Bmrk Gross Margin 78.9 9.8 30.4 EBITDA Margin 15.6 3.4 17.2 EBIT Margin 13.9 2.8 12.0 Net Margin 9.7 1.6 8.2 ROE 251.0 16.1 13.5 Growth (%) 10Y Trend LTM Ind Bmrk Sales 17.3 7.6 3.3 EBITDA 1.8 5.2 4.3 EBIT 0.8 3.5 5.8 EPS (Dil) 6.1 5.2 5.2 Key Items Price & Volume 22 JUL '14 9:20 A.M. (ET) Herbalife releases research and analysis regarding Herbalife’s U.S. business operations 22 JUL '14 7:57 A.M. (ET) Clarification: Herbalife Pershing Square presentation of investigation into Herbalife Nutrition Clubs 21 JUL '14 8:44 P.M. (ET) Pershing Square presentation of investigation into Herbalife Nutrition Clubs to begin at 09:15 ET 21 JUL '14 12:58 P.M. (ET) Herbalife traded lower following cautious comments from Pershing Squares' Ackman in CNBC interview 16 JUL '14 10:20 A.M. (ET) Pershing Square to release evidence of Herbalife perpetuating fraud NY Post 24 JUN '14 12:43 P.M. (ET) Business dean of College of New Jersey urges SEC to increase scrutiny of Herbalife NY Post 03 JUN '14 8:42 A.M. (ET) Pershing Square responds to recent ruling in FTC V. BurnLounge, Inc. StreetAccount News ©2014 FactSet Research Systems, Inc. 1 of 9
-
Upload
khangminh22 -
Category
Documents
-
view
0 -
download
0
Transcript of Herbalife Ltd. (HLF) $59.55

Herbalife Ltd. (HLF) $59.55U.S. Dollar | Bmrk/Ind: FactSet Country / Distribution Services SEC As of: 22 Jul '14
Sector Industry Mkt Cap (M) EV (M) Sales (M)
Distribution Services Food Distributors $5,847 $6,434 $4,964
Herbalife Ltd. is a global nutrition company. It offers a range of sciencebased weight management products, nutritional supplements and personal care products intended to support a healthy lifestyle. The company's product development is focused on four principal categories: weight management; targeted nutrition, including everyday wellness and healthy aging; energy, sports and fitness and outer nutrition that capitalize on the mega trends of obesity and antiaging. Herbalife was founded by Mark Reynolds Hughes in 1980 and is headquartered in George Town, Cayman Islands.
$59.60
YTD 24.3%
3M 4.0%
1Y 6.8%
Beta 2.51
FY1 PE 8.6x
Profile
Trading Information
Current Price $59.60
52 Wk Range $49.35 83.51
Avg Daily Vol (3m) 1.59 (M)
Short Int (% of
Float)28.2%
Key Statistics
Mkt Value (M) $5,847
Ent Value (M) $6,434
Shares Out (000) 98,107
Dividend (Ann) $0.00
Div Yld 0.0%
Estimates
EPS (FY0) $5.37
EPS (FY1) $6.29
EPS (FY2) $7.24
Coverage 4 Analysts
Target Price $85.50
LT Growth Rate 19.0%
Avg Rating Buy (1.20)
Valuation 5Y Trend Current vs. Ind vs. Bmrk
P/E (LTM) 13.1 0.6 0.7
P/E (NTM) 8.7 0.5 0.5
P/Sales 1.2 3.5 0.8
P/Bk 143.4 40.4 103.4
P/CF 7.3 0.5 0.7
EV/EBITDA 8.3 0.7 0.8
EV/Sales 1.3 3.2 0.5
Profitability (%) 10Y Trend LTM Ind Bmrk
Gross Margin 78.9 9.8 30.4
EBITDA Margin 15.6 3.4 17.2
EBIT Margin 13.9 2.8 12.0
Net Margin 9.7 1.6 8.2
ROE 251.0 16.1 13.5
Growth (%) 10Y Trend LTM Ind Bmrk
Sales 17.3 7.6 3.3
EBITDA 1.8 5.2 4.3
EBIT 0.8 3.5 5.8
EPS (Dil) 6.1 5.2 5.2
Key Items
Price & Volume
22 JUL '14 9:20 A.M. (ET)
Herbalife releases research and analysis regarding Herbalife’s U.S. business operations
22 JUL '14 7:57 A.M. (ET)
Clarification: Herbalife Pershing Square presentation of investigation into Herbalife Nutrition Clubs
21 JUL '14 8:44 P.M. (ET)
Pershing Square presentation of investigation into Herbalife Nutrition Clubs to begin at 09:15 ET
21 JUL '14 12:58 P.M. (ET)
Herbalife traded lower following cautious comments from Pershing Squares' Ackman in CNBC interview
16 JUL '14 10:20 A.M. (ET)
Pershing Square to release evidence of Herbalife perpetuating fraud NY Post
24 JUN '14 12:43 P.M. (ET)
Business dean of College of New Jersey urges SEC to increase scrutiny of Herbalife NY Post
03 JUN '14 8:42 A.M. (ET)
Pershing Square responds to recent ruling in FTC V. BurnLounge, Inc.
StreetAccount News
©2014 FactSet Research Systems, Inc. 1 of 9

Herbalife Ltd. (HLF) $59.55U.S. Dollar | Bmrk/Ind: FactSet Country / Distribution Services SEC As of: 22 Jul '14
Earnings FY 13 FY 14E FY 15E Q1 14 Q2 14E Q3 14E Q4 14E
EPS GAAP 4.91 5.45 7.06 0.74 1.55 1.61 1.63
Growth (%) 21.2 11.1 29.4 32.7 15.7 21.6 41.3
EPS Non GAAP 5.37 6.29 7.24 1.50 1.57 1.62 1.63
Growth (%) 32.6 17.1 15.1 18.1 11.0 14.5 27.7
Income Statement (M) FY 13 FY 14E FY 15E Q1 14 Q2 14E Q3 14E Q4 14E
Sales 4,825 5,378 5,879 1,263 1,359 1,343 1,383
Growth (%) 18.5 11.5 9.3 12.4 11.5 10.7 9.0
EBITDA 876 955 1,053 205 249 247 246
Growth (%) 19.1 8.9 10.3 4.4 10.4 11.7 16.2
Operating Income 761 792 933 128 222 224 223
Growth (%) 15.1 4.0 17.8 34.1 9.0 16.8 22.8
Net Income 528 517 615 75 149 147 146
Growth (%) 10.5 1.9 18.8 37.2 3.8 3.5 18.1
Per Share FY 13 FY 14E FY 15E Q1 14 Q2 14E Q3 14E Q4 14E
Dividends per Share 1.20 0.30 0.00
Cash Flow per Share
Free Cash Flow per Share
Book Value per Share 5.14
Key Estimates
Management
Michael O. Johnson, 59
Chairman & Chief Executive Officer
Desmond J. Walsh, 57
President
Richard P. Goudis, 52
Chief Operating Officer
John G. DeSimone, 47
Chief Financial Officer
Steve Yair Henig, 70
Chief Scientific Officer
Patrick R. Dailey
Chief Administrative Officer
Board
Michael O. Johnson, 59
Chairman & Chief Executive Officer
Leroy T. Barnes, 62
Independent Director
Richard P. Bermingham, 74
Lead Independent Director
Jeffrey T. Dunn, 56
Independent Director
Richard H. Carmona, 64
Independent Director
María Otero
Independent Director
South Church Street, Ugland House James Paul Berklas Fiscal Year December
George Town, Investor Relations Contact Exchange NYSE
KY11106 herbalife.com ISIN KYG4412G1010
Cayman Islands Employees (2013) 7,000 CUSIP G4412G101
SEDOL B0539H3
Corporate Information
FLOAT 90.4%
Shares Out 98,107,000
Short Interest 25,015,412
INSIDER 9.6%
Inst. Ownership 108.0%
North American 57.7%
NonNorth American 7.8%
Inst Ownership as % of Float 119.4%
Top 10 Inst. Holders 61.6%
NET POSITION CHANGE 4,114,011
Total (414) 105,952,776
New (76) 5,163,055
Increase (128) 18,481,804
Decrease (159) 9,652,267
Soldout (77) 9,878,580
Ownership Summary
Institutions Position (000) % O/S % Port 3M Chg (000) Mkt Value (USD)
Icahn Associates Corp. 17,000 17.3 2.8 34 918,339,968
Fidelity Management & Research Co. 11,356 11.6 0.1 452 613,433,792
Capital Research & Management Co. (Wo... 7,498 7.6 0.1 553 405,042,944
Soros Fund Management LLC 4,901 5.0 2.4 1,696 264,770,224
Perry Corp. (New York) 4,800 4.9 10.5 1,800 259,296,000
The Vanguard Group, Inc. 4,796 4.9 0.0 88 259,092,128
East Side Capital Corp. 3,184 3.2 5.1 165 172,005,088
BlackRock Fund Advisors 3,004 3.1 0.0 323 162,291,472
AJO LP 1,940 2.0 0.4 620 104,779,896
Jennison Associates LLC 1,929 2.0 0.1 902 104,196,696
Morgan Stanley & Co. LLC 1,909 1.9 0.2 1,845 103,107,704
Credit Suisse Securities (USA) LLC (B... 1,859 1.9 0.1 1,684 100,426,368
Insiders Position (000) % O/S % Port 3M Chg (000) Mkt Value (USD)
STIRITZ WILLIAM P 7,485 7.6 91.6 1,021 404,329,120
JOHNSON MICHAEL O 1,091 1.1 100.0 7 58,951,000
TARTOL JOHN M 238 0.2 100.0 50 12,833,693
LEVY ROBERT MUSSER 169 0.2 100.0 0 9,155,364
GOUDIS RICHARD P 150 0.2 100.0 0 8,121,799
Top Holders Institutions and Insiders
©2014 FactSet Research Systems, Inc. 2 of 9

Herbalife Ltd. (HLF) $59.55U.S. Dollar | Bmrk/Ind: FactSet Country / Distribution Services SEC As of: 22 Jul '14
There is no data available for this identifier.
Segments Snapshot
LOW MEAN HIGH
73.00 35.14% 85.50 58.27% 94.00 74.01%
Targets & Ratings
EPS Q2 '13 Q2 '14E Growth (YoY%)
1.41 1.57 11.0%
Sales (M) Q2 '13 Q2 '14E Growth (YoY%)
1,219 1,359 11.5%
Estimate Growth Quarterly
Period After Event Mean Surp Amt Surp (%)
Q2 '14 E 1.57
Q1 '14 1.50 1.30 0.20 15.4
Q4 '13 1.28 1.25 0.03 2.4
Q3 '13 1.41 1.14 0.27 23.5
Q2 '13 1.41 1.18 0.23 19.2
Q1 '13 1.27 1.07 0.20 19.2
Q4 '12 1.05 1.03 0.02 1.9
Q3 '12 1.04 1.01 0.03 3.1
Q2 '12 1.10 0.96 0.14 14.3
Period After Event Mean Surp Amt Surp (%)
Q2 '14 E 1,359
Q1 '14 1,263 1,236 26 2.1
Q4 '13 1,269 1,253 16 1.3
Q3 '13 1,214 1,195 19 1.6
Q2 '13 1,219 1,160 59 5.1
Q1 '13 1,124 1,114 10 0.9
Q4 '12 1,059 1,051 8 0.8
Q3 '12 1,017 997 20 2.0
Q2 '12 1,032 974 58 5.9
Surprise History Quarterly
©2014 FactSet Research Systems, Inc. 3 of 9
Herbalife Ltd. (HLF) $59.55U.S. Dollar | Bmrk/Ind: FactSet Country / Distribution Services SEC As of: 22 Jul '14
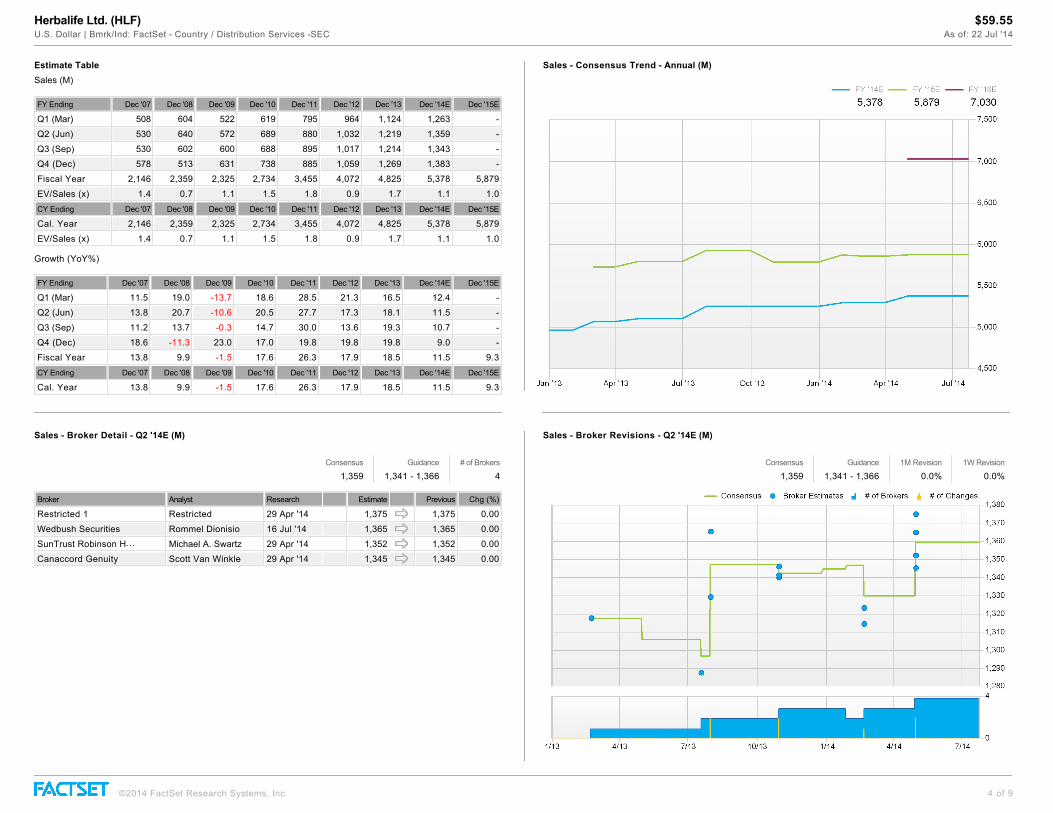
Sales (M)
FY Ending Dec '07 Dec '08 Dec '09 Dec '10 Dec '11 Dec '12 Dec '13 Dec '14E Dec '15E
Q1 (Mar) 508 604 522 619 795 964 1,124 1,263
Q2 (Jun) 530 640 572 689 880 1,032 1,219 1,359
Q3 (Sep) 530 602 600 688 895 1,017 1,214 1,343
Q4 (Dec) 578 513 631 738 885 1,059 1,269 1,383
Fiscal Year 2,146 2,359 2,325 2,734 3,455 4,072 4,825 5,378 5,879
EV/Sales (x) 1.4 0.7 1.1 1.5 1.8 0.9 1.7 1.1 1.0
CY Ending Dec '07 Dec '08 Dec '09 Dec '10 Dec '11 Dec '12 Dec '13 Dec '14E Dec '15E
Cal. Year 2,146 2,359 2,325 2,734 3,455 4,072 4,825 5,378 5,879
EV/Sales (x) 1.4 0.7 1.1 1.5 1.8 0.9 1.7 1.1 1.0
Growth (YoY%)
FY Ending Dec '07 Dec '08 Dec '09 Dec '10 Dec '11 Dec '12 Dec '13 Dec '14E Dec '15E
Q1 (Mar) 11.5 19.0 13.7 18.6 28.5 21.3 16.5 12.4
Q2 (Jun) 13.8 20.7 10.6 20.5 27.7 17.3 18.1 11.5
Q3 (Sep) 11.2 13.7 0.3 14.7 30.0 13.6 19.3 10.7
Q4 (Dec) 18.6 11.3 23.0 17.0 19.8 19.8 19.8 9.0
Fiscal Year 13.8 9.9 1.5 17.6 26.3 17.9 18.5 11.5 9.3
CY Ending Dec '07 Dec '08 Dec '09 Dec '10 Dec '11 Dec '12 Dec '13 Dec '14E Dec '15E
Cal. Year 13.8 9.9 1.5 17.6 26.3 17.9 18.5 11.5 9.3
Estimate Table Sales Consensus Trend Annual (M)
Consensus Guidance # of Brokers
1,359 1,341 1,366 4
Broker Analyst Research Estimate Previous Chg (%)
Restricted 1 Restricted 29 Apr '14 1,375 1,375 0.00
Wedbush Securities Rommel Dionisio 16 Jul '14 1,365 1,365 0.00
SunTrust Robinson H... Michael A. Swartz 29 Apr '14 1,352 1,352 0.00
Canaccord Genuity Scott Van Winkle 29 Apr '14 1,345 1,345 0.00
Sales Broker Detail Q2 '14E (M)
Consensus Guidance 1M Revision 1W Revision
1,359 1,341 1,366 0.0% 0.0%
Sales Broker Revisions Q2 '14E (M)
©2014 FactSet Research Systems, Inc. 4 of 9

Herbalife Ltd. (HLF) $59.55U.S. Dollar | Bmrk/Ind: FactSet Country / Distribution Services SEC As of: 22 Jul '14
EPS
FY Ending Dec '07 Dec '08 Dec '09 Dec '10 Dec '11 Dec '12 Dec '13 Dec '14E Dec '15E
Q1 (Mar) 0.31 0.47 0.34 0.49 0.71 0.88 1.27 1.50
Q2 (Jun) 0.32 0.51 0.39 0.66 0.88 1.10 1.41 1.57
Q3 (Sep) 0.34 0.44 0.43 1.17 0.87 1.04 1.41 1.62
Q4 (Dec) 0.40 0.34 0.49 1.31 0.86 1.05 1.28 1.63
Fiscal Year 1.36 1.76 1.64 4.77 3.31 4.05 5.37 6.29 7.24
P/E (x) 14.9 6.1 12.4 7.2 15.6 8.1 14.7 8.6 7.5
CY Ending Dec '07 Dec '08 Dec '09 Dec '10 Dec '11 Dec '12 Dec '13 Dec '14E Dec '15E
Cal. Year 1.36 1.76 1.64 4.77 3.31 4.05 5.37 6.29 7.24
P/E (x) 14.9 6.1 12.4 7.2 15.6 8.1 14.7 8.6 7.5
Growth (YoY%)
FY Ending Dec '07 Dec '08 Dec '09 Dec '10 Dec '11 Dec '12 Dec '13 Dec '14E Dec '15E
Q1 (Mar) 27.1 52.5 26.9 44.1 45.9 23.1 44.3 18.1
Q2 (Jun) 30.6 60.9 24.3 69.2 33.3 25.0 28.2 11.0
Q3 (Sep) 31.4 32.8 4.5 175.3 25.6 19.5 35.6 14.5
Q4 (Dec) 33.9 12.7 42.0 167.3 34.4 22.1 21.9 27.7
Fiscal Year 31.6 30.3 7.1 190.9 30.6 22.4 32.6 17.1 15.1
CY Ending Dec '07 Dec '08 Dec '09 Dec '10 Dec '11 Dec '12 Dec '13 Dec '14E Dec '15E
Cal. Year 31.6 30.3 7.1 190.9 30.6 22.4 32.6 17.1 15.1
Estimate Table EPS Consensus Trend Annual
Consensus Guidance # of Brokers
1.57 1.51 1.55 4
Broker Analyst Research Estimate Previous Chg (%)
Restricted 1 Restricted 29 Apr '14 1.59 1.59 0.00
Wedbush Securities Rommel Dionisio 16 Jul '14 1.57 1.57 0.00
Canaccord Genuity Scott Van Winkle 29 Apr '14 1.55 1.55 0.00
SunTrust Robinson H... Michael A. Swartz 29 Apr '14 1.55 1.55 0.00
EPS Broker Detail Q2 '14E
Consensus Guidance 1M Revision 1W Revision
1.57 1.51 1.55 0.0% 0.0%
EPS Broker Revisions Q2 '14E
©2014 FactSet Research Systems, Inc. 5 of 9
Herbalife Ltd. (HLF) $59.55U.S. Dollar | Bmrk/Ind: FactSet Country / Distribution Services SEC As of: 22 Jul '14
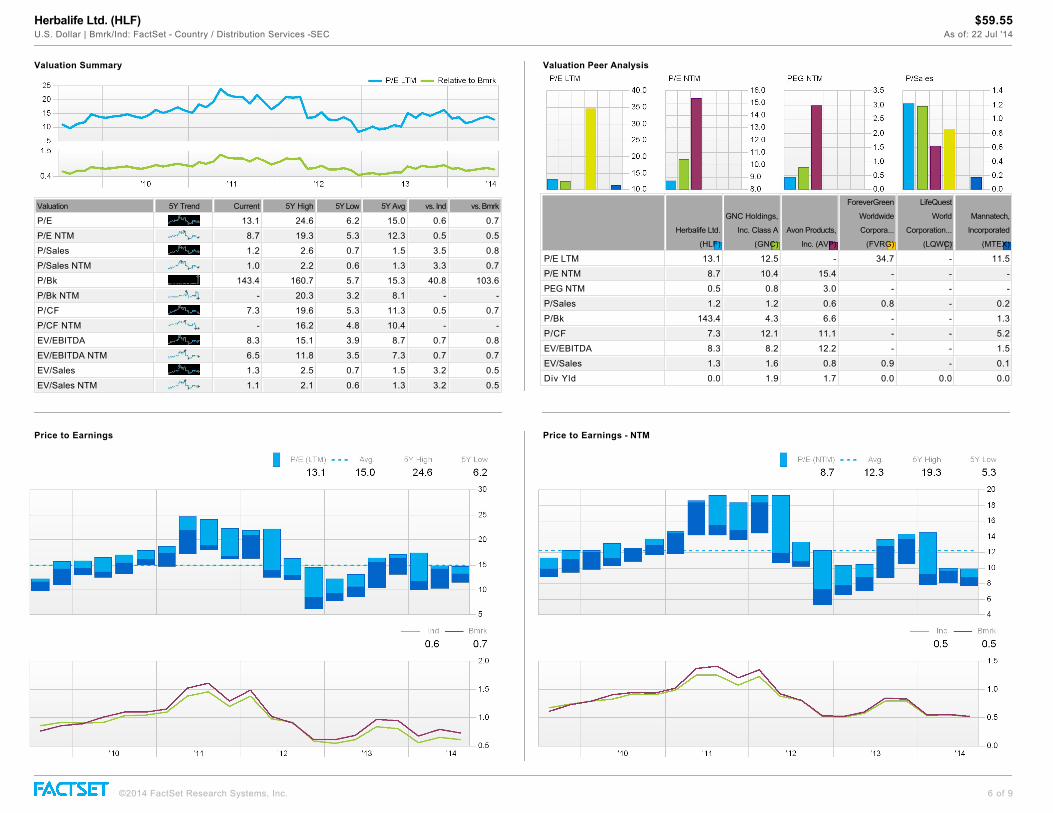
Valuation 5Y Trend Current 5Y High 5Y Low 5Y Avg vs. Ind vs. Bmrk
P/E 13.1 24.6 6.2 15.0 0.6 0.7
P/E NTM 8.7 19.3 5.3 12.3 0.5 0.5
P/Sales 1.2 2.6 0.7 1.5 3.5 0.8
P/Sales NTM 1.0 2.2 0.6 1.3 3.3 0.7
P/Bk 143.4 160.7 5.7 15.3 40.8 103.6
P/Bk NTM 20.3 3.2 8.1
P/CF 7.3 19.6 5.3 11.3 0.5 0.7
P/CF NTM 16.2 4.8 10.4
EV/EBITDA 8.3 15.1 3.9 8.7 0.7 0.8
EV/EBITDA NTM 6.5 11.8 3.5 7.3 0.7 0.7
EV/Sales 1.3 2.5 0.7 1.5 3.2 0.5
EV/Sales NTM 1.1 2.1 0.6 1.3 3.2 0.5
Valuation Summary
Herbalife Ltd.
(HLF)
GNC Holdings,
Inc. Class A
(GNC)
Avon Products,
Inc. (AVP)
ForeverGreen
Worldwide
Corpora...
(FVRG)
LifeQuest
World
Corporation...
(LQWC)
Mannatech,
Incorporated
(MTEX)
P/E LTM 13.1 12.5 34.7 11.5
P/E NTM 8.7 10.4 15.4
PEG NTM 0.5 0.8 3.0
P/Sales 1.2 1.2 0.6 0.8 0.2
P/Bk 143.4 4.3 6.6 1.3
P/CF 7.3 12.1 11.1 5.2
EV/EBITDA 8.3 8.2 12.2 1.5
EV/Sales 1.3 1.6 0.8 0.9 0.1
Div Yld 0.0 1.9 1.7 0.0 0.0 0.0
Valuation Peer Analysis
Price to Earnings Price to Earnings NTM
©2014 FactSet Research Systems, Inc. 6 of 9

Herbalife Ltd. (HLF) $59.55U.S. Dollar | Bmrk/Ind: FactSet Country / Distribution Services SEC As of: 22 Jul '14
Profitability (%) 10Y Trend Dec '08 Dec '09 Dec '10 Dec '11 Dec '12 Dec '13
Gross Margin 80.6 76.1 77.0 78.2 78.3 78.4
Operating Margin 14.6 13.8 14.5 16.6 16.4 16.1
Pretax Margin 13.5 12.5 13.9 16.2 16.0 14.9
Net Margin 9.4 8.7 10.6 11.9 11.7 10.9
ROA 20.2 17.9 24.4 30.8 30.3 25.3
ROE 104.3 67.7 68.6 78.8 97.3 108.5
ROTC 38.8 33.8 45.6 57.7 57.1 44.1
ROIC 39.5 34.6 46.1 57.9 59.1 46.8
Efficiency 10Y Trend Dec '08 Dec '09 Dec '10 Dec '11 Dec '12 Dec '13
Revenue/Employee (000) 589.8 567.0 607.6 677.4 656.8 689.3
Net Income/Employee (000) 55 50 65 81 77 75
Receivables Turnover (x) 36.7 31.6 33.6 39.4 39.6 44.6
Days of Sales Outstanding 10.0 11.5 10.9 9.3 9.2 8.2
Inventory Turnover (x) 3.5 4.0 3.8 3.5 3.0 3.0
Days of Inventory on Hand 104.7 92.0 95.3 104.4 121.3 121.1
Payables Turnover (x) 12.1 14.5 16.4 16.2 14.7 13.3
Days of Payables Outstanding 30.1 25.2 22.2 22.5 24.8 27.4
Total Asset Turnover (x) 2.1 2.0 2.2 2.4 2.4 2.0
Working Capital Turnover (x) 28.5 27.8 21.9 15.7 16.5 6.7
Profitability Ratios Annual
Herbalife Ltd.
(HLF)
GNC Holdings,
Inc. Class A
(GNC)
Avon Products,
Inc. (AVP)
ForeverGreen
Worldwide
Corpora...
(FVRG)
LifeQuest
World
Corporation...
(LQWC)
Mannatech,
Incorporated
(MTEX)
Gross Margin (%) 78.9 25.2 61.9 75.0 57.5
Operating Margin (%) 13.9 17.8 4.5 16.9 141.6 3.2
Net Margin (%) 9.7 9.9 1.6 2.0 158.4 1.5
ROA (%) 19.5 9.9 2.3 14.3 34.6 5.4
ROE (%) 251.0 32.5 15.2 86.0 12.6
Revenue/Employee (000) 709.2 166.2 263.8 371.0 256.5 603.8
Receivables Turnover (x) 43.0 18.3 12.2 30.5 42.9 282.6
Inventory Turnover (x) 3.2 3.7 3.4 0.7 5.5
Payables Turnover (x) 12.5 13.7 3.9 0.6 16.1
Profitability Peer Analysis LTM
Liquidity Analysis 10Y Trend Dec '08 Dec '09 Dec '10 Dec '11 Dec '12 Dec '13
Current Ratio 1.21 1.19 1.27 1.40 1.34 1.78
Quick Ratio 0.87 0.85 0.88 0.95 0.87 1.40
Cash Ratio 0.38 0.35 0.40 0.47 0.47 1.06
Credit Analysis 10Y Trend Dec '08 Dec '09 Dec '10 Dec '11 Dec '12 Dec '13
Interest Coverage (EBITDA) 19.6 44.5 76.6 120.2 44.4 35.1
Interest Coverage (EBIT) 17.1 37.2 65.3 106.8 40.0 31.6
Fixed Chg Coverage 17.1 37.2 65.3 106.8 40.0 31.6
CFO/Int Exp 13.6 33.1 62.7 95.0 33.9 31.5
Total Debt/EBITDA 0.9 0.7 0.4 0.3 0.7 1.1
Net Debt/EBITDA 0.5 0.3 0.0 0.1 0.2 0.0
Net Debt/(EBITDACapEx) 0.7 0.3 0.0 0.1 0.2 0.1
LT Debt/EBITDA 0.9 0.6 0.4 0.3 0.6 1.0
Total Debt/Total Equity 145.5 69.7 36.6 36.3 115.9 168.9
Total Debt/Total Capital 59.3 41.1 26.8 26.7 53.7 62.8
Total Debt/Total Assets 31.4 21.8 14.5 14.1 28.6 37.6
Net Debt/FFO 0.7 0.4 0.0 0.1 0.3 0.1
LT Debt/FFO 1.2 0.9 0.5 0.4 0.8 1.3
FCF/Total Debt 0.5 0.9 1.8 2.1 0.9 0.7
CFO/Total Debt 0.8 1.1 2.1 2.5 1.2 0.8
Credit Ratios Annual
Herbalife Ltd.
(HLF)
GNC Holdings,
Inc. Class A
(GNC)
Avon Products,
Inc. (AVP)
ForeverGreen
Worldwide
Corpora...
(FVRG)
LifeQuest
World
Corporation...
(LQWC)
Mannatech,
Incorporated
(MTEX)
Interest Coverage (EBIT) 19.0 9.8 3.6 10.0 8.4
Fixed Chg Coverage 19.0 9.8 3.6 10.0 8.4
CFO/Int Exp 22.7 5.6 4.6 0.0 1.9
Total Debt/EBITDA 2.4 2.6 4.2 0.2
Net Debt/EBITDA 0.8 2.2 2.9 0.1 1.3 2.7
LT Debt/EBITDA 2.3 2.6 3.9 0.5 0.0 0.0
Total Debt/Total Equity 4,389.6 185.7 295.6 81.0 6.5
Total Debt/Total Capital 97.8 65.0 74.7 334.2 44.8 6.1
Total Debt/Total Assets 64.7 49.9 44.5 37.1 31.9 2.7
Credit Peer Analysis LTM
©2014 FactSet Research Systems, Inc. 7 of 9
Herbalife Ltd. (HLF) $59.55U.S. Dollar | Bmrk/Ind: FactSet Country / Distribution Services SEC As of: 22 Jul '14
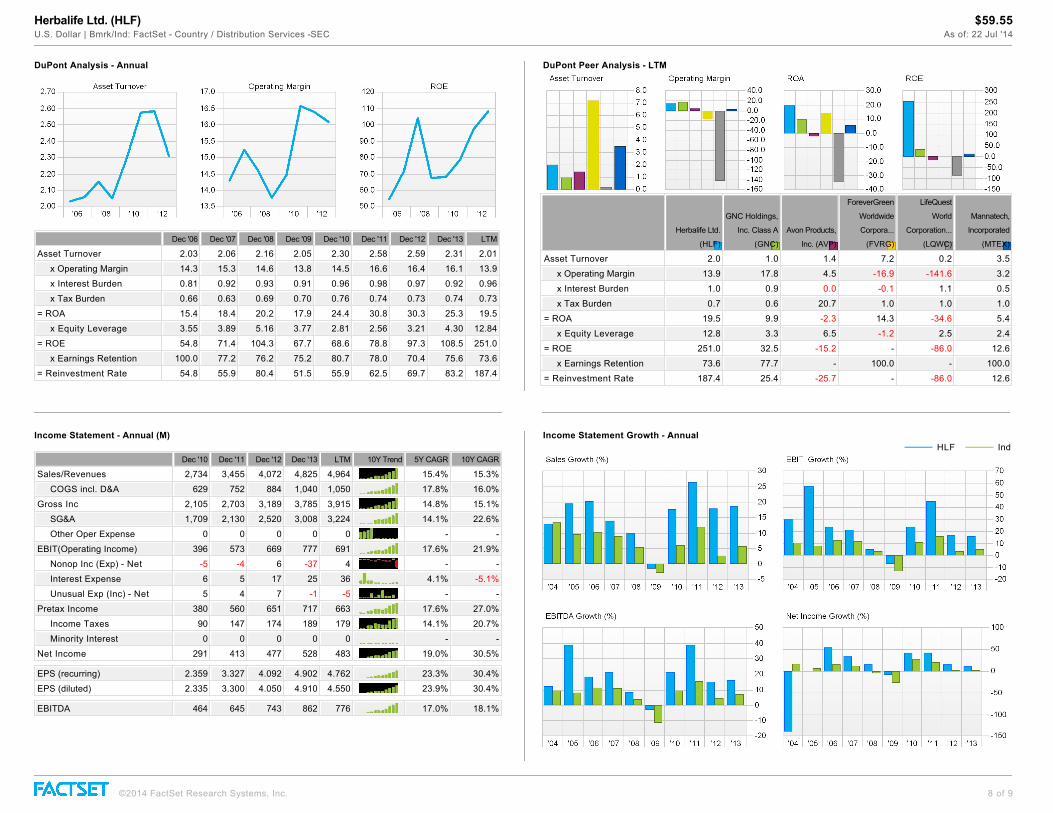
Dec '06 Dec '07 Dec '08 Dec '09 Dec '10 Dec '11 Dec '12 Dec '13 LTM
Asset Turnover 2.03 2.06 2.16 2.05 2.30 2.58 2.59 2.31 2.01
x Operating Margin 14.3 15.3 14.6 13.8 14.5 16.6 16.4 16.1 13.9
x Interest Burden 0.81 0.92 0.93 0.91 0.96 0.98 0.97 0.92 0.96
x Tax Burden 0.66 0.63 0.69 0.70 0.76 0.74 0.73 0.74 0.73
= ROA 15.4 18.4 20.2 17.9 24.4 30.8 30.3 25.3 19.5
x Equity Leverage 3.55 3.89 5.16 3.77 2.81 2.56 3.21 4.30 12.84
= ROE 54.8 71.4 104.3 67.7 68.6 78.8 97.3 108.5 251.0
x Earnings Retention 100.0 77.2 76.2 75.2 80.7 78.0 70.4 75.6 73.6
= Reinvestment Rate 54.8 55.9 80.4 51.5 55.9 62.5 69.7 83.2 187.4
DuPont Analysis Annual
Herbalife Ltd.
(HLF)
GNC Holdings,
Inc. Class A
(GNC)
Avon Products,
Inc. (AVP)
ForeverGreen
Worldwide
Corpora...
(FVRG)
LifeQuest
World
Corporation...
(LQWC)
Mannatech,
Incorporated
(MTEX)
Asset Turnover 2.0 1.0 1.4 7.2 0.2 3.5
x Operating Margin 13.9 17.8 4.5 16.9 141.6 3.2
x Interest Burden 1.0 0.9 0.0 0.1 1.1 0.5
x Tax Burden 0.7 0.6 20.7 1.0 1.0 1.0
= ROA 19.5 9.9 2.3 14.3 34.6 5.4
x Equity Leverage 12.8 3.3 6.5 1.2 2.5 2.4
= ROE 251.0 32.5 15.2 86.0 12.6
x Earnings Retention 73.6 77.7 100.0 100.0
= Reinvestment Rate 187.4 25.4 25.7 86.0 12.6
DuPont Peer Analysis LTM
Dec '10 Dec '11 Dec '12 Dec '13 LTM 10Y Trend 5Y CAGR 10Y CAGR
Sales/Revenues 2,734 3,455 4,072 4,825 4,964 15.4% 15.3%
COGS incl. D&A 629 752 884 1,040 1,050 17.8% 16.0%
Gross Inc 2,105 2,703 3,189 3,785 3,915 14.8% 15.1%
SG&A 1,709 2,130 2,520 3,008 3,224 14.1% 22.6%
Other Oper Expense 0 0 0 0 0
EBIT(Operating Income) 396 573 669 777 691 17.6% 21.9%
Nonop Inc (Exp) Net 5 4 6 37 4
Interest Expense 6 5 17 25 36 4.1% 5.1%
Unusual Exp (Inc) Net 5 4 7 1 5
Pretax Income 380 560 651 717 663 17.6% 27.0%
Income Taxes 90 147 174 189 179 14.1% 20.7%
Minority Interest 0 0 0 0 0
Net Income 291 413 477 528 483 19.0% 30.5%
EPS (recurring) 2.359 3.327 4.092 4.902 4.762 23.3% 30.4%
EPS (diluted) 2.335 3.300 4.050 4.910 4.550 23.9% 30.4%
EBITDA 464 645 743 862 776 17.0% 18.1%
Income Statement Annual (M) Income Statement Growth Annual IndHLF
©2014 FactSet Research Systems, Inc. 8 of 9

Herbalife Ltd. (HLF) $59.55U.S. Dollar | Bmrk/Ind: FactSet Country / Distribution Services SEC As of: 22 Jul '14
Dec '09 Dec '10 Dec '11 Dec '12 Dec '13 10Y Trend 5Y CAGR 10Y CAGR
Curr Assets 514 596 769 964 1,643 27.7% 19.5%
Cash & ST Inv 151 191 259 334 973 45.2% 20.1%
Accounts Receivable 77 86 90 116 100 7.5% 12.1%
Inventories 146 182 248 339 351 21.2% 19.4%
Other Current Assets 140 137 173 175 219 11.0% 22.0%
Curr Liabilities 430 471 549 717 922 18.1% 12.8%
STD & Curr Port LT Debt 12 3 2 56 81 40.0% 1.2%
Accounts Payable 37 44 57 75 83 15.0% 13.9%
Income Tax Payable 40 15 31 16 44 3.3% 8.5%
Other Current Liabilities 340 409 459 570 714 18.3% 16.0%
Total Debt 250 178 204 488 931 21.5% 11.1%
Total Assets 1,146 1,232 1,446 1,704 2,474 17.1% 10.6%
Total Liabilities 787 745 886 1,283 1,922 16.9% 11.2%
Shrhldrs Equity 359 487 560 421 551 17.9% 8.8%
BVPS 2.984 4.136 4.838 3.936 5.454 22.6%
Balance Sheet Annual (M)
Cash and Liabilities Dec '08 Dec '09 Dec '10 Dec '11 Dec '12 Dec '13
Cash and Short Term Investments 150.8 150.8 190.6 258.8 333.5 973.0
Share Repurchase 138.9 74.6 160.0 321.6 556.7 306.4
Dividends 50.7 48.7 53.7 85.5 135.1 123.1
Debt Servicing 187.6 321.7 505.5 894.2 1,163.3 344.0
Net Change in Reporting Period Cash (FX adjusted) 36.6 0.0 39.7 68.2 74.8 639.4
Cash Flow Increases/Decreases 222.7 225.6 333.7 450.1 489.2 662.2
Cash Received (Paid) from Debt Activity 69.7 109.7 78.5 14.3 262.8 419.1
Dividends Paid 50.7 48.7 53.7 85.5 135.1 123.1
Cash Received (Paid) from Change in Equity 119.4 66.8 144.7 299.4 545.4 305.5
Use of Cash Annual (M)
Dec '10 Dec '11 Dec '12 Dec '13 LTM 10Y Trend 5Y CAGR 10Y CAGR
Net Income 290.5 412.6 477.2 527.5 483.3 19.0% 30.5%
Deprec & Amort 68.6 71.9 74.4 84.7 85.1 11.7% 4.3%
Other Funds 17.6 10.2 2.7 52.8 156.3 20.4% 13.0%
Changes in Wk Cap 28.3 27.7 22.6 132.7 124.7
Operating Cash Flow 380.4 509.3 567.8 772.9 825.9 23.1% 23.4%
Cap Ex 68.1 90.4 121.5 147.0 180.6
Other Investing, Total 1.0 1.7 3.5 3.9
Investing Cash Flow 69.1 92.1 125.0 150.8 187.7
Free Cash Flow 312.3 418.9 446.3 625.9 645.3 27.7% 22.7%
FCF/Share 2.508 3.356 3.786 5.825 6.403 33.0% 22.6%
FCF Yield (%) 7.3 6.5 11.5 7.4 10.6%
% of Net Income 107.5 101.5 93.5 118.7 133.5 7.3% 6.0%
Cash Divs Pd 53.7 85.5 135.1 123.1 122.6
Change in Capital Stock 144.7 299.4 545.4 305.5 836.5
Iss/Red Debt 72.5 19.6 279.5 443.7 1,058.4
Financing Cash Flow 254.5 337.8 371.2 30.7 2.1
Net Change in Cash 39.7 68.2 74.8 639.4 539.4 22.1%
Cash Flow Statement Annual (M)
Industry Metrics data is only available for certain companies in the following industries: Airlines, Hotel and Gaming, Metals & Mining, Oil & Gas,
Pharmaceuticals, and Retail.
Industry Metrics
©2014 FactSet Research Systems, Inc. 9 of 9