An Asymptotic Approach to the Torsion Problem in Thin Walled Beams
Biochemistry 1994, 33, 427-438 427
Hepatitis B Virus Direct Repeat Sequence: Imino Proton Exchange Rates and Distance and Torsion Angle Restraints from NMRt
Karl D. Bishop,* Forrest J. H. Blocker,* William Egan,f and Thomas L. James*,$
Department of Pharmaceutical Chemistry, University of California, San Francisco, California 941 43-0446, and Biophysics Laboratory, Center for Biologics Evaluation and Research, Food and Drug Administration, Bethesda, Maryland 20892
Received August 23, 1993; Revised Manuscript Received November 1 , 1993'
ABSTRACT: Structural features of a trisdecamer duplex, [d(GGCAGAGGTGAAA)d(l"ITCACCTCTGCC)], in solution are being investigated by proton one-dimensional (1D) and two-dimensional (2D) N M R spectroscopy. This DNA sequence is comprised of the 1 1-base-pair direct repeat sequence found in the hepatitis B viral genome with an additional base pair from the genome included on each end to minimize end effects on the 1 1-bp sequence of interest. The direct repeat sequence occurs twice in the viral genome; both are essential for initiation of DNA synthesis. The critical nature of this sequence suggests it may be a target to control replication of the virus. Elucidation of the structure of the direct repeat sequence could prove to be beneficial in targeting efforts. Structural determination via restrained molecular dynamics requires experimentally derived distance restraints. The ability to determine solution structures of biomolecules by N M R spectroscopy is limited by the quality and quantity of distance and torsion angle restraints that can be extracted from the N M R data. Techniques used to establish these restraints are constantly evolving and improving. Modifications in procedure are applied to the trisdecamer duplex to yield improvements in the determination of sugar conformations from COSY data and a substantial increase in the number of distance restraints typically garnered from 2D N O E intensity data. This increase in the number of distance restraints normally obtained from 2D NOE intensities was accomplished by utilizing a new version of the iterative complete relaxation matrix program MARDIGRAS with intensities extracted from a 2D N O E data set acquired in 90% HzO. The exchange rate of the imino and amino protons with the solvent water protons can now be included in the relaxation matrix calculations, thereby providing more accurate distances when utilizing the 2D NOE cross-peaks involving at least one exchangeable proton. In this lab, analysis of two-quantum-filtered correlation (2QF-COSY) spectra to determine the conformational states of the sugar moieties typically employs the program package SPHINX/LINSHA to simulate the scalar coupling effects manifest in the cross-peaks. With enough data, we typically find that a single conformer is inadequate to describe sugar pucker, but a rapid two-state equilibrium is consistent with all the data. In the process, a large number of cross-peaks are simulated with a range of possible sugar conformation ratios, amplitudes, and line widths. A limitation of this procedure is the possibility of producing a nonunique solution. These methods rely on the ability to match the appearance of simulated cross-peaks with real data. The method described here utilizes the same program for simulating 2QF-COSY peaks, but uses some measured coupling constants and estimated line widths from E.COSY spectra as input for synthesis of the cross-peaks. The validity of the measurements was checked by comparing the simulated cross-peaks with experimental cross-peaks. Results of the COSY analysis and MARDIGRAS calculations provided 501 interproton distance restraints and deoxyribose torsion angle restraints for 22 of the 26 residues. Some interesting features are apparent in the d(CACC).(GTGG) region of the duplex. Two residues in this region exhibit an unusually small amount of CY-endo sugar conformational characteristics, and the thymidine imino has an exchange rate twice that of the other nonterminal thymidine residues.
The hepatitis B virus (HBV)' as a major cause of liver disease (Sherlock, 1990). An estimated 300 million people in the world are carriers of the virus (Blumberg et al., 1990).
7 This work was supported by National Institutes of Health Grants
* Author to whom correspondence should be addressed. Telephone:
t University of California, San Francisco. 8 Center for Biologics Evaluation and Research, Food and Drug
@ Abstract published in Advance ACS Abstracts, December 15,1993. I Abbreviations: HBV, hepatitis B virus; HCC, hepatocellular car-
cinoma; DR1, direct repeat sequence 1 ; 2D NMR, twedimensional nuclear magnetic resonance; 2QF-COSY, two-quantum-filtered correlation spectroscopy; 2D NOE, two-dimensional nuclear Overhauser effect; E.COSY, exclusive correlation spectroscopy; MARDIGRAS, matrix analysis of relaxation for discerning geometry in solution; EDTA, ethylenediaminetetraacetate; Tm, thermal melting temperature.
GM39247, GM41639, and RR01695.
(415) 476-1569. Fax: (415) 476-0688.
Administration.
0006-2960/94/0433-427!§04.50/0
HBV is a member of the family of mammalian viruses known as the hepadnaviridae and has the smallest known genome of an animal virus of 3.2 kilobases. Integration of the viral genome into hepatocyte DNA has been linked to hepatocellular carcinomas (HCC) (Ganem & Varmus, 1987; Matsubara & Tokino, 1990). The viral genome appears to be inserted randomly and can cause rearrangement events such as translations, deletions, and inversions (Ganem & Varmus, 1987). Amplification of the viral genome occurs during synthesis of pregenomic RNA from DNA (Ganem & Varmus, 1987; Will et al., 1987). Critical to initiation of viral DNA synthesis is an 1 1-nucleotide sequence which occurs twice in the HBV genome. These sequences, denoted DR1 and DR2, are located near the 5' ends of each strand. The DR1 and DR2 repeat sequences present a possible target for rational drug design, since inhibition of these sequences' performance of their function would inhibit initiation of DNA synthesis.
0 1994 American Chemical Society
428 Biochemistry, Vol. 33, No. 2, 1994
In this study, we present a proton NMR analysis of the trisdecanucleotide duplex [d(GGCAGAGGTGAAA). d(TTTCACCTCTGCC)], An additional base pair in the HBV genomic sequence was retained at each end of the 11- base DR1 sequence to minimize the influence of fraying and other end effects on the sequence of interest, DR1. It is also interesting to note that this sequence contains the CACC promoter box which is an essential element for in vivo expression of the e-globin gene (Yu et al., 1991).
Investigation of the DR1 duplex was initiated by analyzing 2D NOE spectra of the DNA in D2O and H2O solutions, 2QF-COSY spectra, E.COSY spectra, and proton exchange rate measurements. Interproton distance restraints between nonexchangeable protons were obtained from three 2D NOE spectra in D2O with mixing times of 80, 140, and 200 ms. Distances involving nonexchangeable protons were calculated from the 2D NOE cross-peak intensities using the iterative complete relaxation matrix program MARDIGRAS (Borgias & James, 1989,1990), which also enables accurate distances to be calculated for fast-rotating methyl protons (Liu et al., 1992). Distance restraints exchangeable protons necessitated acquisition of a 200-ms 2D NOE spectrum in H2O using the NEWSsequence (POhket al., 1991), whichprovidesuniform excitation over most of the spectrum and a notch at the water proton resonance frequency. Imino proton exchange rates were evaluated with the useful one-dimensional NMR method recently described by Adams and Lerner (1992), which is essentially a variant of the saturation-transfer method. Distances were extracted for the exchangeable protons by utilizing a modified version of the MARDIGRAS program (Liu et al., 1993). This version has chemical exchange incorporated into the complete relaxation matrix formalism and enables calculation of accurate distances to protons which are exchanging with solvent by use of the proton exchange rates. This procedure allows a more accurate and logical means for establishing upper and lower bounds to interproton distances involving exchangeable protons.
Torsion angle restraints for subsequent structural analysis can be derived from coupling constants obtained from double- quantum-filtered COSY (2QF-COSY) and exclusive COSY (E.COSY) spectra. Broad lines prevent direct analysis of coupling constants, so we used simulation of 2QF-COSY cross- peaks using the SPHINX/LINSHA program package (Wid- mer & Wuthrich, 1987); this enables us to extract vicinal coupling constants and subsequently torsion angle restraints (Celda et al., 1989; Schmitz et al., Weisz et al., 1992). An improvement in procedure is described here: the 2QF-COSY simulation were augmented by extraction of explicit vicinal coupling constants between the H1’ and H2’/”’’ protons from E.COSY cross-peaks. The pseudorotational phase angles of the major and minor conformers (Ps and PN, respectively) as well as the relative populations and amplitudes of these conformers were obtained from this information. Confor- mational anomalies and features of the HBV repeat sequence obtained from the NMR data are discussed.
Bishop et al.
dimethoxytrityl group was purified by reverse-phase HPLC using a Hamilton PRPhl column, detritylated with acetic acid, dried, rehydrated in water, and extracted 3 times with ethyl acetate. The resulting oligonucleotide was repurified by reverse-phase HPLC.
The lyophilized powders of the two DNA stands d(G- GCAGAGGTGAAA) and d(TTTCACCTCTGCC) were dissolved separately in double distilled H2O. Titration of one strand with the other, monitored by UV spectroscopy at 260 nm, was used to determine the proper stoichiometry for 1:l duplex formation. Equimolar amounts of the two DNA solutions were appropriately combined with phosphate- buffered saline solution containing 10 mM phosphate, 0.2 mM EDTA, 25 mM NaCl, and 0.1 mM sodium cacodylate at pH 7.1 in a final volume of 0.4 mL. Preparation of the DNA sample for nonexchangeable proton NMR analysis required lyophilization of the sample several times from 0.5 mL of 99.9% D20 and finally dissolving in 0.4 mL of 99.996% D2O. The final DNA concentration was 1.8 mM in duplex. The proper stoichiometry of the two strands was confirmed by inspection of the NMR spectra. For analysis of exchange- able protons, the sample was lyophilized and dissolved in 90%
NMR Spectroscopy. Proton NMR spectra were acquired at 500.1 MHz on a GE Omega-500 spectrometer equipped with an Oxford Instruments magnet. The first step was to choose an appropriate temperature for analyzing the DNA duplex by NMR spectroscopy. One-dimensional NMR spectra of the duplex in 90% H20-10% D2O were acquired at temperatures from 20 to 65 OC in 5 OC increments. The temperature selected for subsequent 2D NMR analysis, 30 “C, is at least 20 OC below the melting temperature, Tm. Inspection of the series of 1D spectra permitted selection of a temperature which balanced optimum line width, chemical shift dispersion, and minimal fraying of the ends. The 1D nonexchangeable proton NMR spectra were acquired with a spectral width of 4000 Hz, acquisition time of 0.512 s, time domain data size of 2048 points, recycle time of 10 s, 8 dummy acquisitions, and 32 acquisitions per file. The 1D exchangeable proton spectra were acquired with jumpreturn method (Gueronet al., 1991), 12 000-Hzspectral width,anechodelay of 83 ps, time domain data size of 2048 points, acquisition time of 0.176 s, 8 dummy scans, 32 acquisitions per file, and a relaxation delay of 9 s; the residual HDO resonance was further reduced by the use of a homospoil pulse.
Selective T1 and nonselective T2 measurements were performed in order to estimate the correlation time of the trisdecamer duplex. The selective TI measurements used a Gaussian pulse and were performed on isolated peaks in the aromatic region of the proton spectrum. A 15-s relaxation delay was used to minimize the effects of incomplete recovery of the spins. T2 values were estimated using the nonselective Hahn spin-echo technique. In each set of relaxation data, 16 scans were acquired in an interleaved mode to minimize the effects of spectrometer and sample instability.
Three 2D NOE spectra in 100% D20 were acquired with mixing times of 80, 140, and 200 ms in the hypercomplex mode (States et al., 1982), using spectral widths of 4000 Hz in F1 and F2, data size of 2048 points in F2, acquisition time of 0.512 s, relaxation delay of 8 s, 8 dummy scans, 16 acquisitions per tl value, and a total of 5 12 tl increments. The 2D NOE spectra were processed by multiplying the first slice in each dimension by 0.5 to reduce the contribution of ridge andditchartifactsin thedata (Ottingetal., 1986);anoptimum value for this multipler was not sought, as the value of 0.5
H20-10% DzO.
MATERIALS AND METHODS
Sample Preparation. The deoxynucleotide trisdecamers d(GGCAGAGGTGAAA) and d(CCGTCTCCACCTTT) were obtained via solid-phase oligonucleotide synthesis, carried out on an Applied Biosystems Inc. Model 380B DNA synthesizer using standard j3-cyanoethyl chemistry according to the manufacturer’s protocol (Stolarski et al., 1992). All reagents used in the synthesis were purchased from Applied Biosystems. The base-protected oligonucleotide bearing the
NMR of HBV Gene Direct Repeat Sequence
served to produce spectra with minimal ridge or ditch artifacts. The FIDs in F2 were first apodized with a 90O-shifted sine- cubed window function, zero-filled to 4096 data points, and Fourier-transformed to the frequency domain. The sine-cubed apodization serves to optimize signal-to-noise for resonances with short Tz values, which would suffer toward the end of the 2D NOE experiment. In the F1 dimension, the data were multiplied by a 90O-shifted sine-squared window function and zero-filled to 4096 points. The final data size of 4096 X 4096 yielded a digital resolution of 1 Hz/point.
The two-quantum-filtered COSY (2QF-COSY) spectrum was acquired in the hypercomplex mode (States et al., 1982) with 48 scans per tl increment, a spectral width of 4000 Hz in both F1 and F2, 2048 real points acquired in F2, 512 tl increments, and an acquisition delay of 2.4 s while the sample was spinning at 15 Hz. While sample spinning is unusual, we employed it to optimize the line width and line shape of cross- peaks which were to be subjected to fitting with simulated spectra; minor asymmetries in the line shape can be alleviated by spinning, and the primary detriment of spinning-tl noise-did not affect the quality of the 2QF-COSY cross- peaks. The time domain data were obtained by applying a 40O-shifted sine-squared window function, zero-filled twice in each dimension to 8 192 points in F2 and 2048 points in F1, Fourier-transformed. The resulting digital resolution was 0.5 Hz/pt in F2 and 2.0 Hz/pt in F1. The E.COSY spectrum (Griesinger et al., 1985) was acquired with time-proportional phaseincrementation (Redfield & Kunz, 1985). The acquired data set consisted of 2048 points in F2 and 512 tl increments with 48 acquisitions per tl value which were acquired with a relaxation delay of 2.5 s. Processing of the data involved application of a cosine-squared window function in F1 and F2 and zero-filling to 8192 points in F2 and 2048 points in F1.
Relayed scalar correlations in the sugar residues helped to determine and confirm proton assignments. This was ac- complished via homonuclear Hartmann-Hahn (HOHAHA) spectra (Davis & Bax, 1985). As with all of the 2D NMR experiments, the spectrum was acquired at 30 OC. Each of the 5 12 tl slices was acquired with 4096 points, an acquisition time of 1.02 s, 32 acquisitions, a coherence transfer time of 65 ms (which optimizes for smaller coupling constants or longer range correlations), a relaxation delay of 3 s, and a spectral width of 4000 Hz in both tl and t 2 . The data were processed by application of a cosine-squared window function in each dimension, multiplication of the first point by 0.5, and zero- filling twice in tl to produce a final data size of 4096 points in F2 and 2048 points in F1 upon Fourier transformation.
Measurements of the exchange rates of imino protons with bulk water were accomplished by the one-dimensional tech- nique of Adams and Lerner (1 992), utilizing most of the same experimental parameters as described above for the 1D temperature-dependent imino proton spectra. This method determines the exponential decay of the exchangeable protons while the water resonance is selectively equilibrated, providing a decay time constant which is related to the exchange rate and the spin-lattice relaxation time of the protons.
Distance restraints involving the exchangeable protons were obtained from a single 2D NOE experiment acquired with the NEWS (narrow-gap nonexcitation sequence for water suppression) sequence (hiEeket al., 199 l) , which provides an excitation profile that is nearly uniform over most of the spectrum. This permits reliable 2D NOE cross-peak intensities without the need to adjust intensities for the sinusoidal excitation profile endemic to binomial suppression pulse methods. A nuisance of the NEWS technique is that phase
Biochemistry, Vol. 33, No. 2, 1994 429
distortion prevents the frequency domain data in F2 to be properly phasedon both sides of the HDO resonance. Vitiation of this problem required extracting two regions of the data-half from each side of the HDO resonance in the 02
dimension. Each half of the data were phased independently, and the data were recombined before processing in the tl dimension. This phasing procedure facilitates integrating the cross-peaks. The acquisition parameters for the NEWS 2D NOE data set were 120 048-Hz spectral width in F1 and F2, 2048 acquired points in 22, 512 tl increments, 32 scans per tl increment, and 4.6-s pulse delay. In the middle of the 4.6-s relaxation delay, a selective composite 1 80° pulse centered on the HDO resonance followed by an 8-ms homospoil pulse was used to further reduce residual HDO intensity. Processing the NEWS NOE data set resulted in a 4096 X 4096 frequency domain data set with application of a cosine-squared window function in each dimension, zero-filling once in F2 and 3 times in F1.
Simulation of 2QF-COSY Cross-Peaks. The conforma- tions of the deoxyribose moieties were determined by mea- suring as many of the vicinal proton coupling constants as possible for each of the residues as well as the line widths of the H1’ protons in the F2 dimension. The available coupling constants include J I~z~ , J1’2!’, El’ ( = J ~ ! Z ) + J I~z~~) , Z2’ (=Jltz.
+ J2‘2“ + J2!3!), and c2” (=JI(Y + J z ~ z ~ ~ + JZ”3’). These scalar couplings, though not complete, are sufficient to determine the sugar conformation in DNA (Rinkel & Altona, 1987). In the present study, the deoxyribose conformations have been elucidated via the vicinal coupling constants manifest in fitting simulated with experimental 2QF-COSY cross-peaks, with the simulation being aided considerably by some directly determined coupling constants. The programs SPHINX and LINSHA were used to simulate the 2QF-COSY cross-peaks (Widmer & Wiithrich, 1987). The stick spectra for the spin systems of the individual deoxyriboses, composed of Hl’, H2’, H2”, H3’, H4’, and the 31P spin-coupled to H3’, were calculated by the program SPHINX. Line shapes, based on digital resolution, apodization functions, truncations of FIDs, and natural line widths, were added to the stick spectra using LINSHA. This simulation procedure has been shown to be quite successful in evaluating the sugar conformations of several DNA duplexes (Gochin et al., 1990; Mujeeb et al., 1992; Schmitz et al., 1990,1992b; Stolarski et al., 1992; Weisz et al., 1992).
Measurement of NOE Intensities. The intensities of nonexchangeable proton cross-peaks from the three 2D NOE data sets (mixing times: 80,140, and 200 ms) were integrated with the locally written NMR processing software Sparky using the sum-of-points (boxing or circling) method. This method proved satisfactory when comparing cross-peak intensities with their diagonally symmetric partners. Any pair of peaks whose intensities deviated by more than 50% was discarded. The intensity used was the average of the two peaks intensities. Exchangeable proton cross-peaks from the 200-ms NEWS 2D NOE spectrum were measured using the data processing program NMR2 (NMRi Inc., Syracuse, NY) with the sum-of-points method. No adjustment of the cross- peak intensities according to the excitation profile was needed. However, due to the NEWS excitation profile, a strip approximately 1.0 ppm in width centered about the HDO resonance was not accessible; this includes many H3’, H4’, H5’, and H5” proton resonances. The same criteria for tolerance was used on the nonexchangeable proton cross-peak intensities; any pair of peaks whose intensities deviated by more than 50% was discarded. The nonexchangeable and
430 Biochemistry, Vol. 33, No. 2, 1994 Bishop et al. ~~
Table 1: Chemical Shifts (ppm) of the Exchangeable and Nonexchangeable Protons of [d(GGCAGAGGTGAAA).(TTTCACCTCTGCC)] at 70 O r 3 b
H8/H6 H5/H2 CH3 H 1’ H2’ H2” H3‘ H4’ H1/H3 H4/H2 A/B
G1 G2 c 3 A4 G5 A6 G7 G8 T9 G10 A1 1 A12 A13 T14 T15 T16 C17 A18 C19 c20 T2 1 c22 T23 G24 C25 C26
7.866 7.865 7.367 8.162 7.667 7.965 7.493 7.449 7.106 7.827 8.072 7.978 8,033 7.585 7.663 7.493 7.558 8.274 7.262 7.475 7.473 7.588 7.325 7.910 7.441 7.697
5.397 7.570
7.612
1.264
7.437 7.538 7.413 1.740 1.811 1.717 5.748 7.706 5.270 5.445 1.583 5.630 1.675
5.461 5.819
5.692 5.941 5.568 5.959 5.434 6.062 5.619 5.887 5.770 5.351 5.830 5.890 6.186 6.085 6.230 6.108 5.518 6.215 5.786 5.820 6.072 5.978 5.722 5.892 6.054 6.252
2.522 2.663 1.987 2.7 13 2.547 2.577 2.49 1 2.399 1.896 2.597 2.543 2.498 2.509 2.226 2.311 2.219 2.076 2.742 2.113 2.019 2.239 2.094 2.095 2.675 2.156 2.280
2.681 2.748 2.341 2.873 2.670 2.884 2.532 2.694 2.3 17 2.642 2.736 2.714 2.363 2.594 2.675 2.672 2.391 2.891 2.43 1 2.490 2.567 2.486 2.441 2.712 2.476 2.278
4.826 4.999 4.849 5.045 4.993 5.025 4.935 4.837 4.847 4.964 5.016 4.989 4.656 4.756 4.916 4.911 4.860 5.030 4.741 4.69 1 4.882 4.808 4.878 4.992 4.795 4.556
3.681 4.402 4.175 4.385 4.349 4.416 4.352 4.364 4.143 4.279 4.365 4.355 4.199 4.159 4.281 4.225 4.143 4.324 4.190 4.138 4.228 4.178 4.138 4.381 4.190 4.047
12.990 12.990 -16.370
12.555
12.824 12.663 13.603 12.521
- - -
8.35016.830
-16.570
13.684 8.35016.930
13.820 12.776 -16.570
The hydrogen-bonded and non-hydrogen-bonded amino proton assignments are grouped together and denoted A and B, respectively. Blank spaces denote an assignment that is not applicable, and a *-” denotes an unassigned resonance. The experimental error in these values is k0.002 ppm for .. the nonexchangeable protons and &0.003 ppm for the exchangeable protons.
exchangeable NOE data sets have some pairs of cross-peaks in which one of the two peaks was resolved and the other obscured. The single resolved peak intensity was used in these circumstances.
Model Structures. Use of MARDIGRAS necessitates a starting structure. Distances were calculated with different starting structures and the same 2D NOE intensities. Starting model structures of [d(GGCAGAGGTGAAA).d(TTTCAC- CTCTGCC)] were generated using the NUCGEN and EDIT modules of the modeling package AMBER, Version 4.0 (Pearlman et al., 1991). Molecular structure files for standard A-DNA (Arnott & Hukins, 1972) and standard B-DNA (Arnott & Hukins, 1973) were utilized.
RESULTS AND DISCUSSION
Proton NMR Assignments. The methodology for assigning proton resonances in right-handed DNA duplexes was es- tablished a decade ago (Broido et al., 1984; Feigon et al., 1983; Scheek et al., 1983). The complexity of sequences subject to study has been limited by practical concerns relating to available NMR techniques. Fortunately, NMR techniques have continually improved, allowing more complicated se- quences to be analyzed. A combinationof through-spaceNOE connectivities, vicinal proton-proton connectivities, through- bond relayed HOHAHA connectivities, and other features (TI, coupling pattern, peak intensity) enabled the assignment of all proton resonances except most H5’ and H5” resonances due to their extreme overlap; these assignizents are listed in Table 1.
The nucleotides in the two strands were numbered in ascending order from the 5’-3’ end as shown below:
5’-GI 0 2 C3 A4 0 5 A6 0 7 0 8 T9 GI0 A l l A12 A13-3’ 3’426 C15 G24 T23 C22 T21 C20 C19 A18 C17 TI6 TI5 T146’
Designation of a specific proton utilizes the above numbering scheme and the common notation which denotes the deoxy-
0.0 1 . 0 6 . 0 5.0 4 . 0 3.0 2 . 0
3 1 4 . 0
A
ig 1.0
./I ; A‘- , -
0.0 1.0 6 . 0 5 .0 4 . 0 3.0 2 . 0
y (PPM)
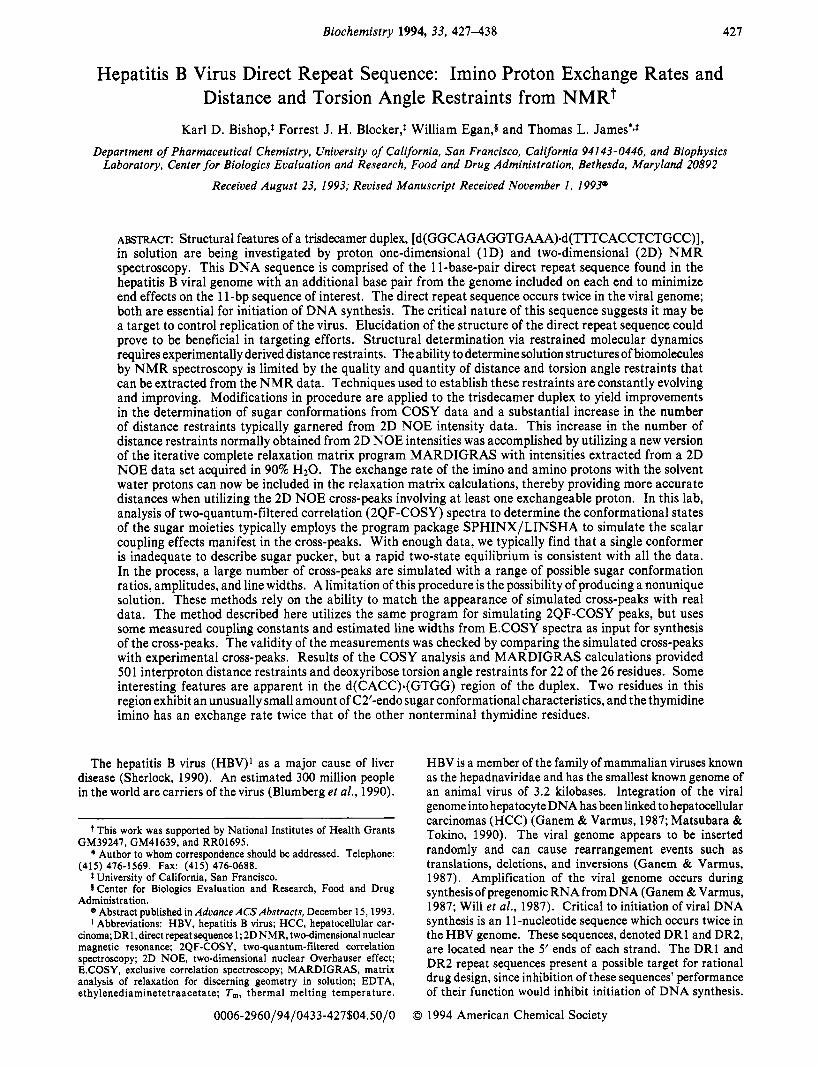
FIGURE 1: 200-ms 2D NOE spectrum of [d(GGCAGAGGT- GAAA).d(TTTCACCTCTGCC)] obtained in DzO at 30 OC.
ribose protons as Hl’, H2’, H2”, H3’, H4’, H5’, and H5’’ and the aromatic protons as H8, H6, H5, H2, CH3, H1, H3, H4- (A,B), and H2(A,B) according to rules recommended by the International Union of Pure and Applied Chemistry (IUPAC) and the International Union of Biochemistry (IUB).
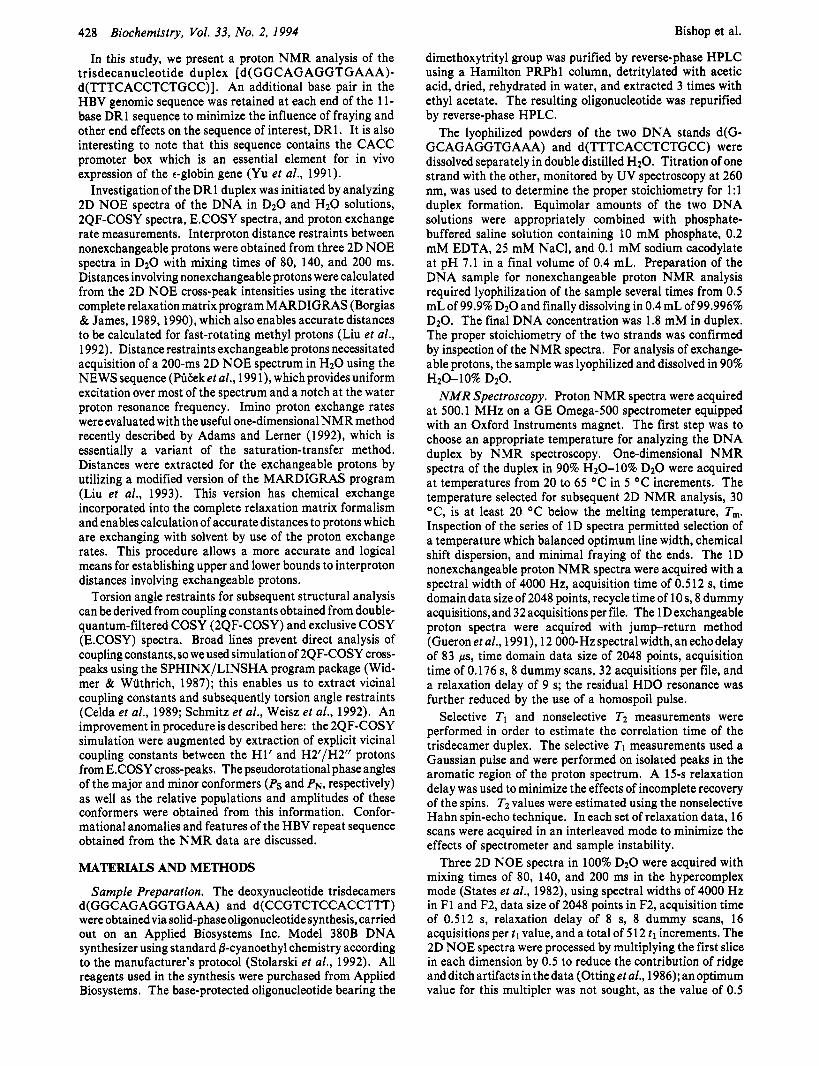
( a ) Nonexchangeable Proton Assignments. The 200-ms 2D NOE spectrum of the trisdecamer in 100% D2O is shown in Figure 1. The sequential assignment method is demon- strated with the HS/H6/H2-to-H1’/H5 region of the 2D NOE spectrum in Figure 2. These patterns of cross-peakintensities are consistent with a right-handed double-helical structure possessing a predominantly S-type sugar pucker and an anti- glycosidic torsion angle. There are two sequential assignment

NMR of HBV Gene Direct Repeat Sequence
8.20 8.00 7.80 7.60 7.40 7.20 7 00 s.@ ‘ , # ‘ , , , I ’ , ’ ’ f5.20
d 5.
5 ] 171 5 1 ............................................................................. @,
5.70
5.80
3.90
-6.00
6.10
8.20 8.00 7.80 7.60 7110 7.20 7.00
q (PPW
FIGURE 2: Sequential connectivities in the base proton-to-H1’ region. The ends of the “NOE walks” are labeled with their respective intranucleotide NOES. Each strand has its own connectivity: G1- A13 is the solid line, and A13 - C26 is the dotted line.
paths-one for each strand. Confirmation of the assignments was made using a combination of 2QF-COSY, HOHAHA, and 2D NOE spectra. The assignment of the H8, H6, H5, and H 1’ protons allowed the application of this information to other regions of the spectrum. Assignment of the H1’ protons was used with the HOHAHA-relayed COSY spectra to identify the network of coupled spins for each of the deoxyribose moieties. In the HOHAHA spectrum, relayed intranucleotide coherences from H l’-to-H3’ and from H 1’- to-H4’ facilitated the assignment procedure. Assignment of the AH2 proton resonances was accomplished by observing intrastrand, interstand, and intranucleotide AH2-to-H1’ and intrastrand AH2-to-AH2 cross-peaks.
( 6 ) Exchangeable Proton Assignments. The NEWS 2D NOE spectrum acquired with a 200-ms mixing time was used in combination with the temperature-dependent 1D imino proton spectra and the assignments obtained from the higher resolution 2D NOE in 100% D2O at 30 “C. The procedure varies little from that in standard use (Chou et al., 1984; Rajagopal e? al., 1988; Zhou e? al., 1988). Imino-to-AH2 and imino-to-H4A (hydrogen-bonded H4 amino) cross-peaks can be seen in Figure 3. These correlations permitted assignment of the imino protons and provided useful infor- mation for assignment of the H4 amino and AH2 protons. Examples of these are the informative cross-peaks observed from the intrastrand TH3-to-H4B (non-hydrogen-bonded H4 amino), intra-base-pair GHl-to-CH4B, and sequentialGH1-
The melting profile of the imino protons is manifest in Figure 4. The temperature-dependent exchange behavior of the imino protons is a result of increased fraying of the ends of the duplex with increase in temperature. Sequential broadening and disappearance of the resonances helped determine the identity of the imino resonances. The thermal melting temperature, T m , was determined from this series of 1 D imino spectra. At 60 “C, the imino resonances are extremely broad and virtually indistinguishable. Complete absence of imino resonances occurs at 65 “C. This implies that at a concen- tration of 1.8 mM and under the solution conditions employed, T, is between 60 and 65 “C. The imino resonances appear
to-AH2.
Biochemistry, Vol. 33, No. 2, 1994 431
14.0 13.5 13.0 12.5
f E 8.0 3
8.2
8.4
8.6
RI.H3-C22,H4B I 08Hl-C19,H4B .
8.0
8.2
8.4
8.6 I
1410 13j5 1 I . O 1215
0, (PPM)
FIGURE 3: Imino-to-imino and imino-to-aromatic regions of the NEWS 2D NOE spectrum acquired in 90% HzO/lO% D20 at 30 “C.
6SC
PPM
FIGURE 4: Melting profile of the imino protons. Imino proton resonance region of the proton NMR spectrum of [d(GGC- AGAGGTGAAA).d(TlTCACCTCTGCC)] acquired as a function of temperature from 20 to 65 OC in 5 OC increments.
in two regions: TH3 imino protons at 13.5-14.0 ppm and GH1 imino protons at 12.5-13.0 ppm.
Extraction of Coupling Constants from E.COSYSpectra. Figure 5 shows the Hl’-to-H2’,H2’’ region of the E.COSY spectrum of the duplex. The structure of the cross-peaks in the E.COSY spectrum allows the extraction of individual

432 Biochemistry, Vol. 33, No. 2, 1994 Bishop et al.
1.9
1 . 0
1.1
1.1
1.3
e 1 .5
1 . 6
1 . 7
1 .8
1 . 9
y (PPW FIGURE 5: E.COSY spectrum of [d(GGCAGAGGTGAAA)-d(TTTCACCTCTGCC)] obtained at 30 O C ; the Hl’-to-H2’,H2” region is shown. Digital resolution is 0.5 Hz/point in w2 and 4 Hz/point in w1.
2 . 9 2 -
2 . 3 1 -
2 . 9 2
2 . 9 4 4 1
6 . 2 1 6 . 2 4 6 . 2 9 6 . 2 2 6 . 2 1 6 . 2 6 . 1 3 6.18 6 . 1 7
% (PPM)
FIGURE 6: Hl’-to-H2” cross-peak of residue A1 8, illustrating measurement of active and passive coupling constants in an E.COSY cross-pea k.
coupling constants as well as sums of coupling constants. The method used to extract coupling constants is illustrated in Figure 6 where the active, J1/,2“, and the passive, J1<,21, couplings are marked. The sums of coupling constants (21’, 82’, and 82”) can also be measured from the E.COSY cross-peaks by determining the differences between the outermost components
of the cross-peaks. The only difficulties experienced in using this method lie in the distortion of the peak separations due to line width and overlap with other resonances. The coupling constants that were measurable from the E. COSY data are listed in Table 2.
Good linewidths estimates could beobtained from E.COSY cross-peaks. The anti-phase doublet character of the com- ponents in the E.COSY Hl’-to-”’’ cross-peak is illustrated in Figure 7 for residue A18. The dotted horizontal line represents the zero base-plane. The solid horizontal line shows the line width at half-height of the positive component. Errors in measuring the line widths in this manner can occur when the line width is larger than the active coupling constant. This induces asymmetry in the natural line shape due to partial cancellation effects of the anti-phasecomponents which makes the line-width measurement biased toward smaller values. The effects of the asymmetry can be minimized by measuring the outer half of the line width and doubling this value. The line widths of the Hl’, H2’ and H2” protons are shown in Table 3. The range of values determined in this study for Hl’, H2’, and H2”line widths is 4.&5.5,6.0-7.2, and 4.5-6.0 Hz, respectively, and is comparable to values previously determined for DNA oligomers in this lab (Gochin et al., 1990; Mujeeb et al., 1992; Schmitz et al., 1990, 1992b; Stolarski et al., 1992; Weisz et al., 1992).
The accuracy in determining the coupling constants is dependent on (among other factors) the relationship between

NMR of HBV Gene Direct Repeat Sequence Biochemistry, Vol. 33, No. 2, 1994 433
Table 2: Vicinal Coupling Constants Measured for the Deoxyribose Protons of the Trisdecamer Duplex‘pb
J z y Jig21 J 1 y El’ z2‘ z2” J2y J y y
G1 14.1 9.1 5.6 14.8 28.5 20.7 5.3 1.0 G2 14.3 10.0 5.3 15.5 28.9 20.0 4.6 0.4 C3 14.2 9.2 5.9 15.1 30.2 23.8 6.8 3.7 A4 14.3 9.4 5.9 15.3 27.1 22.0 3.4 1.8 G5 14.1 10.1 5.2 15.4 30.0 22.0 5.8 2.7 A6 14.1 8.8 6.3 14.9 28.0 23.3 5.1 2.9 G7 14.4 9.8 5.4 15.2 28.9 22.6 4.7 2.8 G8 14.3 7.5 6.4 14.1 28.6 6.8 T9 14.4 8.6 6.4 15.2 29.7 23.1 6.7 2.3 G10 14.2 9.8 5.6 15.3 28.3 21.3 4.3 1.5 A l l 14.2 9.3 6.0 15.3 29.3 22.8 5.8 2.6 A12 14.0 9.3 5.8 15.0 29.6 6.3 A13 14.1 7.8 6.6 14.3 29.0 23.1 7.1 2.4 T14 14.2 9.8 5.2 15.3 T15 14.3 9.0 6.2 15.2 29.3 22.9 6.0 2.4 T16 14.2 9.0 6.2 15.2 29.2 6.0 C17 14.1 8.6 5.8 14.7 28.3 20.9 5.6 1.0 A18 14.2 9.3 5.9 15.2 29.5 21.4 6.0 1.3 C19 14.1 8.1 6.1 14.2 28.5 23.0 6.3 2.8 C20 14.2 7.2 6.7 14.1 28.4 25.2 7.0 4.3 T2 1 C22 14.0 8.0 6.5 14.5 29.6 23.0 7.6 2.5 T23 14.0 9.0 6.2 15.1 29.8 23.0 6.8 2.8 G24 C25 14.1 7.0 6.7 13.5 28.4 24.7 7.3 3.9 C26
The difference between the measured EJlt and J1’2’ + J 2 y or J 1 y + 51’2” was never greater than h0.3 Hz. These values were determined by calculating the differences between the measured values using the equations: = zJ2t - J2’p and J2ft3, = EJz,, - J2,3” - J2~2”; consequently, these values are subject to considerable error. This probably accounts for some values of Jzty < 6 Hz, which is the lower limit of acceptable values.
3040 3030 3020 3010
(02 (HC
FIGURE 7: Slice through the A18,Hlf-to-H2” cross-peak demon- strating how line widths were estimated from E.COSY data. The dotted line denotes the base-plane of the 2D spectrum. The line width at half-height of the positive component is illustrated with the aid of both a horizontal line at half-height and a vertical line. See text for a caveat.
the coupling constant and the line width. If the line width is less than the coupling constant, little distortion of the cross- peak separations will be apparent. However, when the line width is greater than the coupling constant, the anti-phase components cancel in such a way that the peak maxima exhibit a greater separation. Since we are using the E.COSY spectra for determining specific coupling constants and sums of coupling constants, we can expect our measurements to be biased toward larger values when the line width becomes a problem. The error introduced by this cancellation effect is evident from measured values for J2:y. Theoretically, these should all be -14.0 Hz. However, most J2’2” values are somewhat greater than the theoretical value. This difference
Table 3: Measured Hl’, H2’, and H2” Line Widths (Hz)’
H1‘ H2’ H2” G1 G2 c 3 A4 G5 A6 G7 G8 T9 G10 A1 1 A12 A13 T14 T15 T16 C17 A18 C19 c20 T2 1 c22 T23 G24 C25 C26
4.2
4.6 4.5 5.3 4.6 4.8 5.4 4.2 5.2 4.2
6.3
6.5
7.1 6.4 6.4 7.1 6.2
4.4 6.8
5.4 4.8 5.4 5.4
5.2 4.6 5.5
3.4
4.3
4.3 4.9 4.5 4.2
3.8 4.2
3.5
5.7
6.7 7.2 6.3
6.8
5.9 6.9
4.8
5.5
4.6 4.5 4.6 5.3
5.1 5.8
5.7
These values are the results from direct measurement of the line widths from the E.COSY data (see text).
is a combination of the random error from digital resolution and the systematic error caused by line widths.
2QF-COSY Simulation. The coupling constants and the line widths were used as input for the programs SPHINX and LINSHA, respectively, to produce simulated 2QF-COSY peaks. Comparison of the simulated peaks to the real data provided confirmation of the experimental parameters. The range over which the coupling constants and line widths can be varied and still produce spectra which match the exper- imental data was determined, and this was used to estimate the overall error. The methodology used here differs from that of previous applications of SPHINX and LINSHA (Celda et al., 1989; Gochin et al., 1990; Mujeeb et al., 1992; Schmitz et al., 1990, 1992b; Stolarski et al., 1992; Weisz et al., 1992). Instead of using only the sums of couplings among Hl’, H2’, and H2”, and varying the amplitudes and phase angles of the major and minor conformers and testing a range of line widths to produce a set of simulated peaks to find a “best fit” for which there not be a unique solution, a more complete set of measurable quantities is determined (vide supra) and used as initial conditions from which to start the simulation process. These initial conditions prescribe a more limited range of available conformations over which to test, thereby limiting (but not necessarily eliminating) the possibility of producing a nonunique solution. The process of determining sugar conformation by simulating the 2QF-COSY data has some limitations. Due to the large number of variables which characterize the deoxyribose pseudorotation state and the limited number of observables, a description of the pseudor- otation state derived from fitting with the 2QF-COSY simulation is underdetermined. For example, the observables for the Hl’-H2’/H2” cross-peaks are line widths, J1!2!, Jltz.!, Z l’, 22’, and 22”. Unfortunately, most of the H2’-H3’, H2”- H3’, and H3’-H4’2QF-COSY cross-peaks are either too weak or too obscured by overlap to obtain any reliable coupling constants. The morphology of an experimental Hl’-to-H2’,- H2” 2QF-COSY cross-peak is influenced by line width, signal- to-noise, J I T , J1.2.., J2131, and J2”3’. The sugar conformation
434 Biochemistry, Vol. 33, No. 2, 1994 Bishop et al.
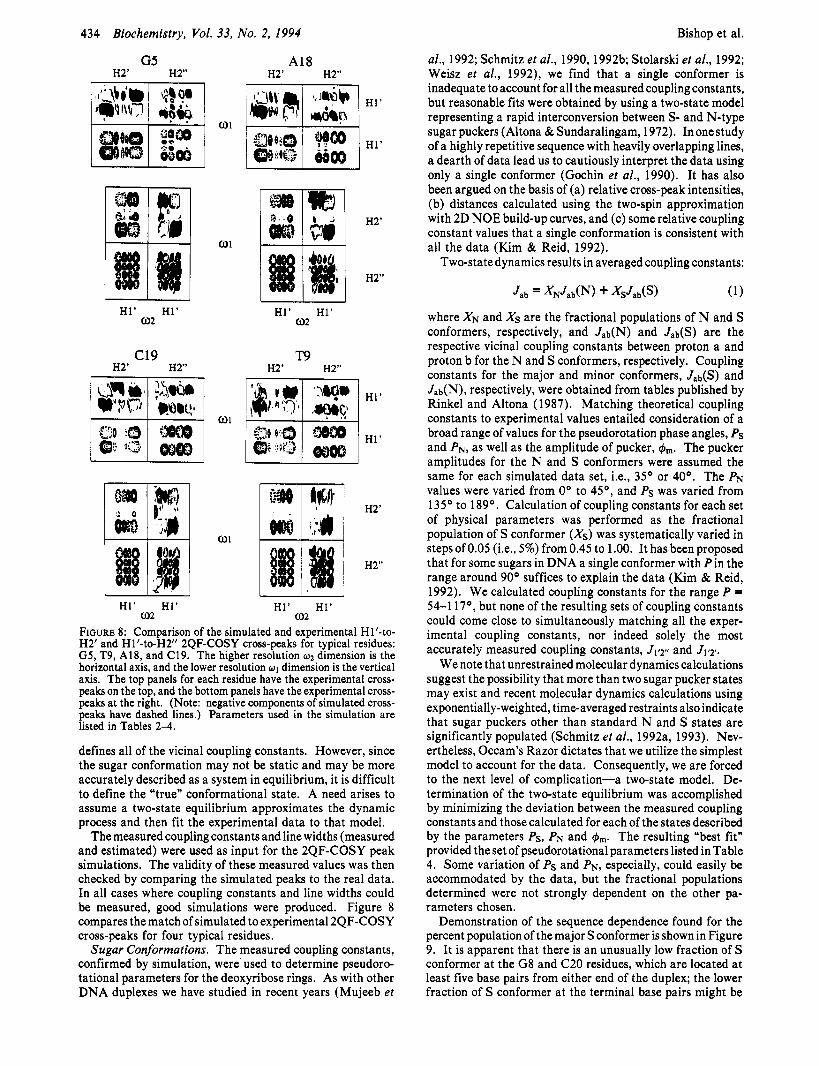
al., 1992; Schmitz et al., 1990, 1992b; Stolarski et al., 1992; Weisz et al., 1992), we find that a single conformer is inadequate to account for all the measured coupling constants, but reasonable fits were obtained by using a two-state model representing a rapid interconversion between S- and N-type sugar puckers (Altona & Sundaralingam, 1972). In one study of a highly repetitive sequence with heavily overlapping lines, a dearth of data lead us to cautiously interpret the data using only a single conformer (Gochin et al., 1990). It has also been argued on the basis of (a) relative cross-peak intensities, (b) distances calculated using the two-spin approximation with 2D NOE build-up curves, and (c) some relative coupling constant values that a single conformation is consistent with all the data (Kim & Reid, 1992).
Two-state dynamics results in averaged coupling constants:
G5 A18 H2’ HZ” H2’ H2”
I I I I
- H1’ HI’
0 2
C19 H2’ H2”
0 1
0 1
0 1
HI’ H1’ 0 2
H2’
HZ”
HI’
H1’
H2’
H2”
H1’ H I ’ 0 2
H1’ HI’ 0 2
FIGURE 8: Comparison of the simulated and experimental H1’-to- H2’ and H 1’40-H”’ 2QF-COSY cross-peaks for typical residues: G5, T9, A18, and C19. The higher resolution w2 dimension is the horizontal axis, and the lower resolution wI dimension is the vertical axis. The top panels for each residue have the experimental cross- peaks on the top, and the bottom panels have the experimental cross- peaks at the right. (Note: negative components of simulated cross- peaks have dashed lines.) Parameters used in the simulation are listed in Tables 2-4.
defines all of the vicinal coupling constants. However, since the sugar conformation may not be static and may be more accurately described as a system in equilibrium, it is difficult to define the “true” conformational state. A need arises to assume a two-state equilibrium approximates the dynamic process and then fit the experimental data to that model.
The measured coupling constants and line widths (measured and estimated) were used as input for the 2QF-COSY peak simulations. The validity of these measured values was then checked by comparing the simulated peaks to the real data. In all cases where coupling constants and line widths could be measured, good simulations were produced. Figure 8 compares the match of simulated to experimental 2QF-COSY cross-peaks for four typical residues.
Sugar Conformations. The measured coupling constants, confirmed by simulation, were used to determine pseudoro- tational parameters for the deoxyribose rings. As with other DNA duplexes we have studied in recent years (Mujeeb et
Jab = XNJab(N) + (1)
where XN and XS are the fractional populations of N and S conformers, respectively, and Jab(N) and Jab(S) are the respective vicinal coupling constants between proton a and proton b for the N and S conformers, respectively. Coupling constants for the major and minor conformers, Jab@) and Jab(N), respectively, were obtained from tables published by Rinkel and Altona (1987). Matching theoretical coupling constants to experimental values entailed consideration of a broad range of values for the pseudorotation phase angles, PS and PN, as well as the amplitude of pucker, &,,. The pucker amplitudes for the N and S conformers were assumed the same for each simulated data set, Le., 35’ or 40’. The PN values were varied from 0’ to 45’, and PS was varied from 135’ to 189’. Calculation of coupling constants for each set of physical parameters was performed as the fractional population of S conformer (XS) was systematically varied in steps of 0.05 (Le., 5%) from 0.45 to 1 .OO. It has been proposed that for some sugars in DNA a single conformer with P in the range around 90’ suffices to explain the data (Kim & Reid, 1992). We calculated coupling constants for the range P = 54-1 17’, but none of the resulting sets of coupling constants could come close to simultaneously matching all the exper- imental coupling constants, nor indeed solely the most accurately measured coupling constants, J l j2~ and Jlr2l .
We note that unrestrained molecular dynamics calculations suggest the possibility that more than two sugar pucker states may exist and recent molecular dynamics calculations using exponentially-weighted, time-averaged restraints also indicate that sugar puckers other than standard N and S states are significantly populated (Schmitz et al., 1992a, 1993). Nev- ertheless, Occam’s Razor dictates that we utilize the simplest model to account for the data. Consequently, we are forced to the next level of complication-a two-state model. De- termination of the two-state equilibrium was accomplished by minimizing the deviation between the measured coupling constants and those calculated for each of the states described by the parameters Ps, PN and I$,,,. The resulting “best fit” provided the set of pseudorotational parameters listed in Table 4. Some variation of PS and PN, especially, could easily be accommodated by the data, but the fractional populations determined were not strongly dependent on the other pa- rameters chosen.
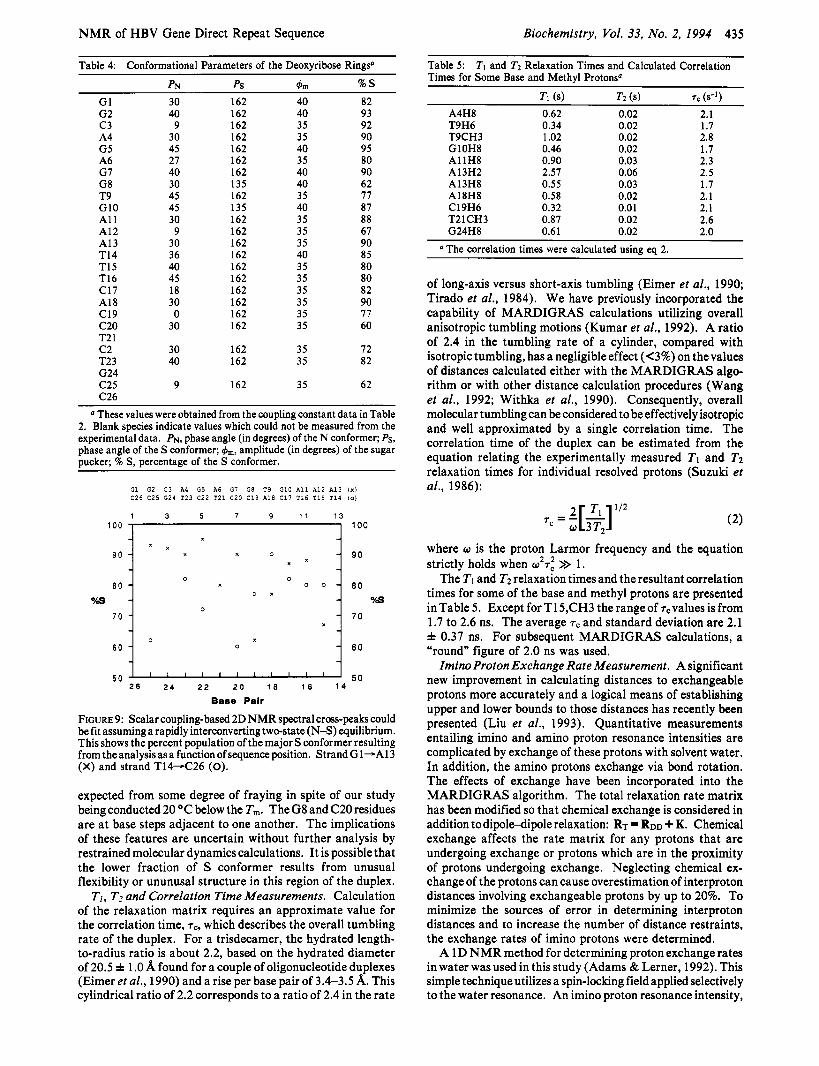
Demonstration of the sequence dependence found for the percent population of the major S conformer is shown in Figure 9. It is apparent that there is an unusually low fraction of S conformer at the G8 and C20 residues, which are located at least five base pairs from either end of the duplex; the lower fraction of S conformer at the terminal base pairs might be
NMR of HBV Gene Direct Repeat Sequence Biochemistry, Vol. 33, No. 2, 1994 435
Table 4: Conformational Parameters of the Deoxyribose Rings'
PN ps bm % S
G1 30 162 40 82 G2 c 3 A4 G5 A6 G7 G8 T9 G10 A1 1 A12 A13 T14 T15 T16 C17 A18 C19 c20 T2 1 c 2 T23 G24 C25 C26
40 9
30 45 27 40 30 45 45 30 9
30 36 40 45 18 30 0
30
30 40
9
162 162 162 162 162 162 135 162 135 162 162 162 162 162 162 162 162 162 162
162 162
162
40 35 35 40 35 40 40 35 40 35 35 35 40 35 35 35 35 35 35
35 35
35
93 92 90 95 80 90 62 77 87 88 67 90 85 80 80 82 90 77 60
72 82
62
These values were obtained from the coupling constant data in Table 2. Blank species indicate values which could not be measured from the experimental data. PN, phase angle (in degrees) of the N conformer; Ps, phase angle of the S conformer; &, amplitude (in degrees) of the sugar Ducker: % S, percentage of the S conformer.
G 1 G2 C 3 A 4 G 5 A 6 G7 G 8 T 9 G 1 0 A l l A 1 2 A 1 3 (XI C 2 6 C 2 5 G 2 4 T 2 3 C 2 2 T 2 1 C 2 0 C 1 9 A I 8 C 1 7 T 1 6 T 1 5 T 1 4 (01
I 3 5 7 9 1 1 13
I "" { x ~
90 x
-I -I
'O -I x i 'O -I -I
60 x
0 i 6 o
5 0 5 0
Base Pair
FIGURE 9: Scalar coupling-based 2D NMR spectral cross-peaks could be fit assuming a rapidly interconverting two-state ( N S ) equilibrium. This shows the percent population of the major S conformer resulting from theanalysisasafunction ofsequenceposition. StrandGl-A13 (X) and strand T14-C26 (0).
2 8 2 4 2 2 2 0 1 8 1 6 1 4
expected from some degree of fraying in spite of our study being conducted 20 OC below the Tm. The G8 and C20 residues are at base steps adjacent to one another. The implications of these features are uncertain without further analysis by restrained molecular dynamics calculations. It is possible that the lower fraction of S conformer results from unusual flexibility or ununusal structure in this region of the duplex.
T I , T2 and Correlation Time Measurements. Calculation of the relaxation matrix requires an approximate value for the correlation time, T ~ , which describes the overall tumbling rate of the duplex. For a trisdecamer, the hydrated length- to-radius ratio is about 2.2, based on the hydrated diameter of 20.5 f 1 .O found for a couple of oligonucleotide duplexes (Eimer et al., 1990) and a rise per base pair of 3.4-3.5 A. This cylindrical ratio of 2.2 corresponds to a ratio of 2.4 in the rate
Table 5 : Times for Some Base and Methyl Protonsu
TI and TZ Relaxation Times and Calculated Correlation
A4H8 T9H6 T9CH3 G 1 OH8 A1 1H8 A13H2 A13H8 A18H8 C 19H6 T21CH3 G24H8
0.62 0.34 1.02 0.46 0.90 2.57 0.55 0.58 0.32 0.87 0.61
0.02 0.02 0.02 0.02 0.03 0.06 0.03 0.02 0.01 0.02 0.02
2.1 1.7 2.8 1.7 2.3 2.5 1.7 2.1 2.1 2.6 2.0
The correlation times were calculated using eq 2.
of long-axis versus short-axis tumbling (Eimer et al., 1990; Tirado et ai., 1984). We have previously incorporated the capability of MARDIGRAS calculations utilizing overall anisotropic tumbling motions (Kumar et ai., 1992). A ratio of 2.4 in the tumbling rate of a cylinder, compared with isotropic tumbling, has a negligible effect (<3%) on thevalues of distances calculated either with the MARDIGRAS algo- rithm or with other distance calculation procedures (Wang et ai., 1992; Withka et ai., 1990). Consequently, overall molecular tumbling can be considered to be effectively isotropic and well approximated by a single correlation time. The correlation time of the duplex can be estimated from the equation relating the experimentally measured T I and T2 relaxation times for individual resolved protons (Suzuki et ai., 1986):
where w is the proton Larmor frequency and the equation strictly holds when W ~ T : >> 1.
The TI and T2 relaxation times and the resultant correlation times for some of the base and methyl protons are presented in Table 5. Except for T15,CH3 the range of T~ values is from 1.7 to 2.6 ns. The average rC and standard deviation are 2.1 f 0.37 ns. For subsequent MARDIGRAS calculations, a "round" figure of 2.0 ns was used.
Imino Proton Exchange Rate Measurement. A significant new improvement in calculating distances to exchangeable protons more accurately and a logical means of establishing upper and lower bounds to those distances has recently been presented (Liu et ai., 1993). Quantitative measurements entailing imino and amino proton resonance intensities are complicated by exchange of these protons with solvent water. In addition, the amino protons exchange via bond rotation. The effects of exchange have been incorporated into the MARDIGRAS algorithm. The total relaxation rate matrix has been modified so that chemical exchange is considered in addition todipoledipole relaxation: RT = RDD + K. Chemical exchange affects the rate matrix for any protons that are undergoing exchange or protons which are in the proximity of protons undergoing exchange. Neglecting chemical ex- change of the protons can cause overestimation of interproton distances involving exchangeable protons by up to 20%. To minimize the sources of error in determining interproton distances and to increase the number of distance restraints, the exchange rates of imino protons were determined.
A 1D NMR method for determining proton exchange rates in water was used in this study (Adams & Lerner, 1992). This simple technique utilizes a spin-locking field applied selectively to the water resonance. An imino proton resonance intensity,

436 Biochemistry, Vol. 33, No. 2, 1994 Bishop et al.
incompatible with all others; closer examination of the original data revealed these to arise from badly overlapped peaks or peaks with quite low signal-to-noise. These few were culled from the list. A few MARDIGRAS distances in these lists were larger than what can be considered to be reliable for this particular sample’s signal-to-noise, so distances 1 5.3 A were also discarded, resulting in a final list of 240, 373 distances obtained for the 80-, 140-, and 200-ms spectra, respectively.
As nucleic acids do not have many nonexchangeable base protons, distances to the exchangeable imino protons should be quite useful for improving structure quality, especially interstrand distances which are quite valuable. In spite of the paucity of base protons to provide structural restraints, studies with double-stranded DNA generally have not utilized distances to imino protons because they exchange with bulk water. Depending on the method of dealing with the comparatively huge water proton signal, possible effects from nonlinear radio-frequency excitation and accuracy of peak integrals are troublesome but tractable, the former by use of the NEWS sequence in the present case. The imino proton exchange rate with water can also affect the signal intensity; that rate depends on identity (Tor G), temperature, pH, buffer type and concentration, inner or terminal base, secondary structural features, and sequence (Bendel, 1985; Kochoyan et al., 1990; Leroy et al., 1988; Mirau & Kearns, 1985). Generally for nonterminal residues, T imino protons exchange about 3-4 times faster than G imino protons. As exchange can affect distances calculated, the rates were measured (vide supra).
MARDIGRAS calculations were performed on the 2D NOE intensities acquired in H2O with the NEWS pulse sequence and a 200-ms mixing time; these calculations incorporated the exchange rates of the imino protons. Upon integration of the NEWS 2D NOE data, 442 intensities were tabulated, yielding 420 distances. Discarding those distances considered to be least reliable (i.e., those >5.3 A) resulted in 400 usable distances.
The combined set of distances from all four NOE data sets provided 501 distance restraints. Clearly, more distance restraints were obtained form the four data sets than from any single one. This primarily results from the additional distances to exchangeable protons obtained via the H20 2D NOE spectrum; the lower signal-to-noise ratio for the H2O 2D NOE spectrum, however, precluded measuring intensities for many smaller peaks which were satisfactory in the D2O 2D NOE spectra. The larger number of restraints compared to most previous NMR studied of DNA duplexes is due to inclusion of many distances entailing exchangeable protons as well as fortuitous peak resolution. The 501 distance restraints correspond to an average of 19 distance restraints for each nucleotide. In all, there were 303 intraresidue, 172 interresidue, and 26 cross-strand restraints. Nonexchangeable cross-strand NOES are limited to the AH2-to-H1’ variety, which are usually weak or unobservable and only occur in the regions of the duplex where there are adenines. For the duplex studied here, only six cross-strand NOES are evident between nonexchangeable protons. With the exception of interresidue restraints between G1 and G2, the restraints are fairly well distributed throughout the duplex as illustrated in Figure 10.
Structural Features of the Duplex. Coupling constants between the deoxyribose protons allowed determination of sugar conformation characteristics. In the context of the two- state N-S equilibrium, some residues exhibited a relatively low fraction of the major S-conformer, which is not typically seen in nonterminal base pairs of a B-DNA duplex. This is
Table 6: with Watef
Imino Proton Relaxation Parameters and Exchange Rates
Gl/G2 G5 G7 G8 T9 G10 T2 1 T23 G24
0.344 1.076 0.976 0.995 0.312 0.597 0.327 0.308 0.645
0.15 0.71 0.66 0.59 0.13 0.29 0.17 0.20 0.41
3.80 0.47 0.48 0.68 4.49 1.76 2.86 1.70 0.88
(I The exchange rates of these protons with water were calculated using e q s 3 and 4.
monitored with a 1-1 pulse sequence following turn-off the spin-locking field, decays exponentially as a function of the spin-locking time with a time constant 71 which is determined by the spin-lattice relaxation time and k, the rate constant for exchange with water:
1 / ~ ~ = l / T l + l / k (3) The exchangeable proton intensities never go to zero regardless of the spin-locking time and reach a steady-state value: M, = Mo(~l/Tl), where MO is the peak intensity in the absence of the spin-locking field. These two equations permitted determination of k and T I . The exchange rates and relaxation parameters of most of the imino protons are listed in Table 6. The exchange rates were used in modifying the relaxation matrix calculations using MARDIGRAS (uide infra). The exchange rate of the C17,H4A proton is approximately 0.5 s-l. More accuratevalues were obtained for the imino protons due to their higher degree of chemical shift dispersion. Thymine imino proton exchange rates were in the range of 1.74.5 s-l. Guanine imino protons tended to exchange more slowly, in the range from 0.4 to 0.7 s-l. As expected, exchange rates for terminal residues were significantly higher.
2D NOE Intensity Analysis. Since the ultimate goal is to obtain an accurate and reliable solution structure, a large number of accurate torsion angle and distant restraints is a necessary means to that end. Interproton distances were obtained from 2D NOE cross-peak intensities using the program MARDIGRAS (Borgias & James, 1989, 1990). Distances to rapidly rotating methyl protons were calculated with a three-site jump model, which was demonstrated to be accurate to within 2% for all six thymine H6-to-methyl proton geometric center distances in an oligomer (Liu et al., 1992). A new feature of MARDIGRAS enables incorporation of exchange rates with bulk water for calculating more accurate distances involving exchangeable protons (Liu et al., 1993). Input to MARDIGRAS, consequently, entails experimental cross-peak intensities, an estimate of the correlation time, exchange rates, and coordinates for an initial structure. We have amply demonstrated that the program is not very dependent on the initial structure chosen (Borgias & James, 1989, 1990; Kerwood et al., 1991).
MARDIGRAS calculations were performed on the three 2D NOE data sets acquired in D20 with mixing times of 80, 140, and 200 ms. A tally of the number of cross-peak intensities is 263,475, and 454 for the 80-, 140-, and 200-ms spectra, respectively. Standard B-DNA and standard A-DNA were utilized as starting structures. The number of distances obtained were 240,382, and 341, respectively, after rejection by MARDIGRAS of very low intensity values in the experimental data set. A few of the distances estimated from preliminary MARDIGRAS calculations yielded distances very

Biochemistry, Vol. 33, No. 2, 1994 431
combined with the torsion angle restraints from the deoxyribose moieties provides an excellent opportunity to obtain a good high-resolution structure of the trisdecamer duplex via restrained molecular dynamics. In particular, it will be interesting to see if the resulting rMD structure confirms the presence of anomalous structural features as noted above. In addition to this putative structural variation, some dynamic features of the duplex were also observed. Whether or not these structural features have any biological relevance is unknown. However, it is interesting to note that region of the molecule is in the CACC box promoter region, and the fact that similar anomalous dynamics have been observed for the GTG/CAC moiety in another duplex is also intriguing. Perhaps a structure for [d(GGCAGAGGTGAAA)-d(”T- CACCTCTGCC)] as well as other similar DNA oligonu- cleotides will provide insight into the relationships between DNA sequence, structure, and biological function.
ACKNOWLEDGMENT
We acknowledge Drs. Anwer Mujeeb, Uli Schmitz, and Klaus Weisz for helpful discussions, Dr. He Liu for assistance. in using the latest version of MARDIGRAS, and Lee Bickerstaff for proofreading the manuscript. We also ac- knowledge use of the University of California, San Francisco, Computer Graphics Laboratory (supported by NIH Grant RROlO8 1).
REFERENCES
Adams, B., & Lerner, L. (1992) J. Magn. Reson. 96,604-607. Altona, C., & Sundaralingam, M. (1972) J. Am. Chem. SOC. 94,
Arnott, S., & Hukins, D. W. L. (1972) Biochem. Biophys. Res.
Arnott, S., & Hukins, D. W. L. (1973) J . Mol. Biol. 81,93-105. Bendel, P. (1985) Biochem. Biophys. Res. Commun. 128,352-
359. Blumberg, B. S., Hepburn, A., & Andre, R. E., Eds. (1990) in
Proceedings of the International Conference on Prospects for Eradication of Hepatitis B Virus, Vol. 8 Suppl., Butterworth Scientific, Guildford, U.K.
Borgias, B. A., & James, T. L. (1989) Methods Enzymol. 176,
Borgias, B. A., & James, T. L. (1990) J. Magn. Reson. 87,475- 487.
Broido, M. S., Zon, G., & James, T. L. (1984) Biochem. Biophys. Res. Commun. 11 9, 663-670.
Celda, B., Widmer, H., Leupin, W., Chazin, W. J., Denny, W. A,, & Wiithrich, K. (1989) Biochemistry 28, 1462-1470.
Chou, S.-H., Wemmer, D. E., Hare, D. R., & Reid, B. R. (1984) Biochemistry 23, 2257-2262.
Davis, D. G., & Bax, A. (1985) J. Am. Chem. SOC. 107,2820- 2821.
Donlan, M. E., & Lu, P. (1992) Nucleic Acids Res. 20,525-532. Eimer, W., Williamson, J. R., Boxer, S. G., & Pecora, R. (1 990)
Feigon, J., Denny, W. A., Leupin, W., & Kearns, D. R. (1983)
Ganem, D., & Varmus, H. E. (1987) Annu. Rev. Biochem. 56,
Gochin, M., ZOn, G., & James, T. L. (1990) Biochemistry 29,
Griesinger, C., Serrensen, 0. W., & Ernst, R. R. (1985) J. Am.
Gueron, M., Plateau, P., & Decorps, M. ( 199 1) Prog. Nucl. Magn.
Kerwood, D. J., Zon, G., & James, T. L. (1991) Eur. J. Biochem.
Kim,S.-G., & Reid, B. R. (1992) Biochemistry31,12103-12116.
8205-82 12.
Commun. 47, 15061509.
169-1 83.
Biochemistry 29, 799-8 1 1.
Biochemistry 22, 5930-5942.
651-693.
11161-11171.
Chem. SOC. 107, 6394-6396.
Reson. Spectrosc. 23, 135-209.
197, 583-595.
3’- C , C T G T T ~ C , T T C , C ~ A , C ~ ~ T , T T T T T - ~ ’ 8 I I 8 I I I2 12 I I I5 I4 11 14 14 I I
FIGURE 10: Distribution of MARDIGRAS-derived interproton distances in the DR 1 duplex. Interresidue and intraresidue restraints are indicated by location. Cross-strand restraints are indicated by lines connecting the two strands; the number 2 appears if more than one cross-strand restraint is associated with those connecting lines.
evident in Figure 9. Centered around the G8-Cl9 and G7- C20 base pairs is an apparently unique region of the duplex where the sugars are in an S conformation only 60-65% of the time. Interestingly, this region of the molecule is in the CACC box promoter region. Another interesting feature of this region is that the T9,H3 imino proton exchange rate is higher than all other nonterminal imino protons in this duplex (see Table 5). The T9,H3 proton exchanges with the solvent at -4.5 s-I. The other thymidine imino protons exchange at a rate approximately half that of T9,H3. We note that the guanine imino in the adjacent base pair, G10, also has a somewhat elevated exchangerate, - 1.8 s-l. A previous study of the GTG/CAC sequence by proton NMR revealed a higher thymine imino proton exchange rate with solvent than other nonterminal thymine imino protons (Donlan & Lu, 1992). A higher exchange rate implies that there must be greater exposure of this proton to the solvent. The imino with a faster proton exchange rate is adjacent to the G8-Cl9 and G7-C20 base pairs. These separately provide evidence that this region of the duplex is in unique dynamic or conformational state.
CONCLUSIONS
The extraction of a large number of distance restraints from 2D NOE intensities and torsion angle restraints from E. COSY and 2QF-COSY spectra was successful. Two improvements in extracting restraints from NMR data are presented. Use of a new version of the iterative complete relaxation matrix algorithm MARDIGRAS to include solvent exchange rates of the exchangeable imino protons permitted the inclusion of cross-peaks involving these protons in the relaxation matrix calculations with a 5-30% improvement in distance accuracy; experimental measurement of the exchange rates, of course, was required. An average of 19 distance restraints per residue was obtained from MARDIGRAS analysis of the 2D NOE data acquired in H20 and D20. This represents the largest number of distance restraints obtained on a DNA duplex in solution at this time.
Deoxyribose conformations were determined by first mea- suring as many experimental parameters as possible in the E.COSY data such as line widths and coupling constants. The validity of these measured values was confirmed by simulation of the H 1’-to-H2’,H2” 2QF-COSY cross-peaks using the programs SPHINX and LINSHA. The sugar conformations were then calculated from the measured coupling constants. This represents a different approach from our previous studies which relied on matching experimental 2QF-COSY cross-peaks with simulated ones created from a range of line widths, rapidly interconverting two-state ( N S ) sugar conformational mixtures, and sugar pucker amplitudes.
The data in totoindicate that [d(GGCAGAGGTGAAA).d- (TTTCACCTCTGCC)] is in the B-DNA family of structures. However, sugar pucker analysis and imino exchange rate measurements indicate an unusual dynamic or conformational state in the region centered around the G8-Cl9 and G7-C20 base pairs. The large number of interproton distance restraints
438 Biochemistry, Vol. 33, No. 2, 1994 Bishop et al.
Schmitz, U., Kumar, A., & James, T. L. (1992a) J. Am. Chem.
Schmitz, U., Sethson, I., Egan, W., & James, T. L. (1992b) J.
Schmitz, U., Ulyanov, N. B., Kumar, A., &James, T. L. (1993)
Sherlock, S. (1990) Vaccine 8 (Suppl.), 6-9. States, D. J., Haberkorn, R. A,, & Ruben, D. J. (1982) J. Magn.
Stolarski, R., Egan, W., & James, T. L. (1992) Biochemistry 31,
Suzuki, E.-I., Pattabiraman, N., Zon, G., & James, T. L. (1986) Biochemistry 25, 6854-6865.
Tirado, M. M., Lopez Martinez, M. C., & Garcia de la Torre, J. (1984) J. Chem. Phys. 81, 2047-2052.
Wang, A. C., Kim, S.-G., Flynn, P. F., Sletten, E., & Reid, B. R. (1992) J. Magn. Reson. 100, 358-366.
Weisz, K., Shafer, R. H., Egan, W., & James, T. L. (1992) Biochemistry 31, 7477-7487.
Widmer, H., & Wiithrich, K. (1987) J. Magn. Reson. 74, 316- 336.
Will, H., Reiser, W., Weimer, T., Pfaff, E., Buscher, M., Sprengel, R., Cattaneo, R., & Schaller, H. (1987) J. Virol. 61,904-91 1 .
Withka, J. M., Swaminathan, S., & Bolton, P. H. (1990) J. Magn. Reson. 89, 386-390.
Yu, C.-Y., Matamed, K., Chen, J., Bailey, A. D., & Shen, C.-K. (1991) J. Bioi. Chem. 266, 8907-8915.
Zhou, N., Manogaran, S., Zon, G., & James, T. L. (1988) Biochemistry 27, 601 3-6020.
SOC. 114, 10654-10656.
Mol. Bioi. 227, 510-531.
J. Mol. Bioi. 233 (in press).
Reson. 48, 286-292.
7027-7042.
Kochoyan, M., Leroy, J. L., & Gueron, M. (1990) Biochemistry
Kumar, A., James, T. L., & Levy, G. C. (1992) Isr. J. Chem.
Leroy, J. L., Kochoyan, M., Huynh-Dinh, T., & Gueron, M.
Liu, H., Thomas, P. D., & James, T. L. (1 992) J . Magn. Reson.
29, 4799-4805.
32,257-261.
(1988) J . Mol. Biol. 200, 223-238.
98, 163-175. Liu, H., Kumar, A., Weisz, K., Schmitz, U., Bishop, K. D., &
James, T. L. (1993) J. Am. Chem. SOC., 1590-1591.
260. Matsubara, K., & Tokino, T. (1990) Mol. Bioi. Med. 7, 243-
Mirau, P. A., & Kearns, D. R. (1 985) Biopolymers 24,7 1 1-724. Mujeeb, A., Kerwin, S. M., Egan, W., Kenyon, G. L., & James,
T. L. (1992) Biochemistry 31, 9325-9338. Otting, G., Widmar, H., Eagner, G., & Wiithrich, K. (1986) J.
Magn. Reson. 66, 187-193. Pearlman, D. A., Case, D. A., Caldwell, J., Seibel, G. L., Singh,
U. C., Weiner, P. K., & Kollman, P. A. (1991) AMBER 4.0 (UCSF), University of California, San Francisco.
PdEek, L., Wang, E., Feigon, J., StarEuk, Z., & SklenPr, V. (1991) J. Magn. Reson. 91, 120-127.
Rajagopal, P., Gilbert, D. E., Marel, G. A., Boom, J. H., & Feigon, J. (1988) J. Magn. Reson. 78, 526-537.
Redfield, A. G., & Kunz, S. D. (1985) J. Magn. Reson. 19, 250-254.
Rinkel, L. J., & Altona, C. (1987) J. Biomol. Struct. Dyn. 4,
Scheek, R. M., Russo, N., Boelens, R., Kaptein, R., & van Boom,
Schmitz, U., Zon, G., & James, T. L. (1 990) Biochemistry 29,
621-649.
J. H. (1983) J. Am. Chem. SOC. 105, 2914-2916.
2357-2368.
Copyright © 2022 FDOKUMEN


![3-[(2-HYDROXYBENZYLIDENE) AMINO]PHENYL}IMINO)](https://static.fdokumen.com/doc/165x107/631c6e3f7051d371800f7901/3-2-hydroxybenzylidene-aminophenylimino.jpg)